UNITED STATES
SECURITIES AND EXCHANGE COMMISSION
Washington, D.C. 20549
FORM N-CSR
CERTIFIED SHAREHOLDER REPORT OF REGISTERED
MANAGEMENT INVESTMENT COMPANIES
Investment Company Act file number 811-02224
MML Series Investment Fund
(Exact name of registrant as specified in charter)
100 Bright Meadow Blvd., Enfield, CT 06082
(Address of principal executive offices) (Zip code)
Jeffrey M. Dube
100 Bright Meadow Blvd., Enfield, CT 06082
(Name and address of agent for service)
Registrant’s telephone number, including area code: (860) 562-1000
Date of fiscal year end: 12/31/2014
Date of reporting period: 12/31/2014
Item 1. Reports to Stockholders.
Table of Contents
This material must be preceded or accompanied by a current prospectus (or summary prospectus, if available) for the MML Series Investment Fund. Investors should consider a Fund’s investment objective, risks, and charges and expenses carefully before investing. This and other information about the investment company is available in the prospectus (or summary prospectus, if available). Read it carefully before investing.
MML Series Investment Fund – President’s Letter to Shareholders (Unaudited)
To Our Shareholders

Jeffrey M. Dube
“At MassMutual, our customers – and their dreams for their future – matter most to us. We strive to help you take the right steps to help yourself prepare for a retirement that grants you the freedom to live the life you imagine – retirement on your terms.”
December 31, 2014
I am pleased to present you with the MML Series Investment Fund Annual Report, covering the year ended December 31, 2014. U.S. stocks and bonds rose in 2014, with stocks reaching new heights and outperforming their foreign counterparts by a considerable margin. The accelerating expansion of the U.S. economy provided an accommodative investing environment that stood in sharp contrast to the challenges faced by some of the world’s other large economies in Europe and the Far East.
The performance of U.S. equity markets during 2014 was encouraging, but the volatility that resurfaced during the fourth quarter and the struggles of some foreign markets serve as ongoing reminders that retirement investors should not focus on short-term performance – but rather on making investment decisions that are based on their long-term goals and objectives. Individuals who are saving for retirement may have the advantage of not needing to access their funds in the short term. Even those who have begun withdrawing their retirement savings may choose to have the majority of their account balance remain invested, since retirement can last for decades. We believe retirement investors give themselves a greater opportunity to reach their retirement income goals when they follow certain investment guidelines, such as the ones below.
Investment concepts to keep in mind
Avoid focusing on daily market performance
Investing for retirement is a long-term proposition. While most retirement investors seem to understand that the financial markets experience volatility from time to time, seasoned investors typically take a long-term approach to investing and avoid focusing on short-term results.
The one thing you can control is your contribution level
Of course, you can’t control the performance of your investments. What you can control, however, is how often and how much you save. Contributing to your retirement account on a regular basis and increasing your contribution level as often as possible can help you boost your retirement savings.*
Take advantage of asset allocation and diversification*
Stocks, bonds, and short-term/money market investments are investment types that generally perform differently at different times, depending on the economic climate. Each of these categories contains an even broader array of sub-categories, such as small-cap stocks, international stocks, and high-yield bonds. Many financial professionals believe investors can help reduce their over-exposure to one or two poorly performing investment types by including a mix of investment types and sub-categories in their retirement strategy.
Who Matters Most
MassMutual believes “Who Matters Most to You Says the Most About You.” At MassMutual, our customers – and their dreams for their future – matter most to us. We strive to help you take the right steps to help yourself prepare for a retirement that grants you the freedom to live the life you imagine – retirement on your terms. To get there, we believe you may benefit most by maintaining a plan that
| | * | Systematic investing and asset allocation do not ensure a profit or protect against loss in a declining market. Systematic investing involves continuous investment in securities regardless of fluctuating price levels. Investors should consider their ability to continue investing through periods of low price levels. |
(Continued)
1
MML Series Investment Fund – President’s Letter to Shareholders (Unaudited) (Continued)
takes into consideration your specific goals, how comfortable you are with the market’s ups and downs, and how long you have to save and invest for your future. If you work with a financial professional, this may be an excellent time to contact him or her for assistance in reviewing your personal retirement investment strategy and making any adjustments that may be appropriate. Thank you for your confidence in MassMutual.
Sincerely,

Jeffrey M. Dube
President
The information provided is the opinion of MassMutual Retirement Services Investments Marketing as of 1/1/15 and is subject to change without notice. It is not to be construed as tax, legal or investment advice. Of course, past performance does not guarantee future results.
2
MML Series Investment Fund – Economic and Market Overview (Unaudited)
December 31, 2014
Investors drive U.S. stocks up, oil down; central bank concludes bond buying in 2014
Major U.S. stock indexes rose in 2014, with the Standard & Poor’s 500 Index (“S&P 500”) and the Dow Jones Industrial Average (the “Dow”), two of the most widely followed U.S. stock market benchmarks, repeatedly reaching new highs and finishing the year near record territory. U.S. bonds also advanced for the year. Foreign markets did not fare as well, as economic growth slowed substantially in Europe, Japan reentered a recession, and China’s economy also stumbled.
Investors navigated periods of volatility and other challenges in an environment that included political action over federal spending and midterm elections that left Republicans with majorities in both houses of the U.S. Congress, geopolitical conflicts in Eastern Europe and the Middle East, the end of government bond purchases through the Federal Reserve’s (the “Fed”) Quantitative Easing program (“QE”), and a precipitous decline in the price of oil. In the U.S., ongoing improvement in employment, corporate profitability, and other key economic measures – including a rebound and acceleration in gross domestic product (“GDP”) – helped bolster stock prices. Housing was a surprisingly notable laggard during much of the year and failed to echo other economic improvements.
The Fed began “tapering” its monthly QE bond purchases to $75 billion in January 2014. The Fed’s monthly reduction proceeded systematically in additional $10 billion increments thereafter during 2014, and the central bank made its last monthly buys in October 2014. There was some first-quarter market movement attributable to the tapering, but investors ultimately seemed to accept the inevitable end of the program and the reductions became less of a factor in market movements as the year progressed. The Fed also helped keep short-term interest rates at historically low levels by continuing the federal funds rate at 0.0% to 0.25% – the level the rate has occupied since December 2008. The federal funds rate is the interest rate that banks and other financial institutions charge each other for borrowing funds overnight. The Fed reassured investors following its September 2014 meeting that short-term interest rates would remain low for a “considerable time” after the end of QE. Fed statements in mid-December indicated the central bank intends to be “patient” in raising short-term interest rates. While not ruling out rate hikes later in 2015, the Fed allayed investors’ fears that better-than-expected economic growth might cause the central bank to accelerate its timetable for normalizing rates from near-zero levels. The statement also noted that the Fed continues to pay close attention to the slow improvement of credit growth in the U.S. and core inflation that is below the central bank’s 2% target.
The price of oil declined steadily over the second half of the year due to investor concerns about slowing economic growth and falling demand in foreign markets colliding with an overabundant supply. West Texas Intermediate (WTI) crude oil started the year at more than $98 per barrel, gushed to nearly $108 in June, then trickled down steadily to finish 2014 at $53.45 – down more than 45% for the full year. U.S. retail gasoline prices accelerated from about $3.41 per gallon at the beginning of January to nearly $3.79 in late April. Gasoline parked in the $3.74 to $3.78 per gallon range until late June before rolling downhill to approximately $2.39 at the end of the year, which gave drivers the lowest gas prices since 2009. Gold prices gyrated but changed little, cresting to $1,385 per ounce in mid-March 2014, falling to $1,142 in early November, and finishing the year at $1,206 – just $1.50 more than the precious metal’s 2014 opening price.
Market performance
U.S. stocks of all sizes outperformed their foreign counterparts during 2014, with stocks of mid-size and large U.S companies outpacing their small-company counterparts. The major technology stock benchmark in the U.S., the NASDAQ Composite® Index, returned 14.75% for the year and led all U.S. broad market indexes. The S&P 500® Index of large-capitalization U.S. stocks posted a 13.69% advance, and the blue-chip Dow Jones Industrial AverageSM rose 10.04%. The Russell 2000® Index of small-capitalization stocks underperformed other key stock benchmarks, but still advanced 4.89%. The MSCI Emerging Markets Index, a measure of the performance of emerging stock markets throughout the world, declined 2.19% for the year and outperformed the MSCI EAFE Index, a barometer for foreign stocks in developed markets, which fell 4.90%.
Bonds rewarded investors, but underperformed most U.S. stock indexes during the year, with the Barclays U.S. Aggregate Bond Index, a broad measure of the U.S. investment-grade bond markets, rising 5.97%. Unrelenting low interest rates continued to take their toll, and shorter-term debt investments barely managed to stay in positive territory. In this environment, the Barclays U.S. 1-3 Year Government Bond Index, which measures the performance of short-term U.S. government bonds, returned just 0.64%; and Treasury bills, as measured by the Citigroup 3-Month Treasury Bill Index, gained only 0.03%. The impact of lower oil prices
3
MML Series Investment Fund – Economic and Market Overview (Unaudited) (Continued)
on energy companies in the second half of the year worked against high-yield bonds, as many issuers of such bonds are energy companies. Despite losing ground in the third and fourth quarters, the Barclays U.S. Corporate High-Yield Index, a measure of the performance of fixed-rate, non-investment-grade debt from corporate sectors, still managed to advance 2.45% for the year.*
Q1 2014: Stocks suffer early losses, then recover
U.S. stocks ended the first quarter of 2014 with only minimal changes, as a sell-off early in the quarter gave way to a recovery that more than offset previous losses in most cases. The decline was relatively brief and confined to a two-week stretch in late January and the beginning of February. A weak December 2013 employment report, concerns about emerging markets, and the Fed’s ongoing downsizing of QE were all factors weighing on share prices. Worries about emerging markets eased later in the quarter, however, and enabled stocks to embark on a recovery.
Resurgent concerns over some aspects of U.S. economic growth and a flight to quality due to emerging-market volatility helped drive up prices of U.S. Treasury securities. Reassuring comments from new U.S. Federal Reserve Chair Janet Yellen helped bolster the market. Yellen replaced Ben Bernanke at the end of January and is the first woman to lead the Fed. Fiscal woes afflicting the federal government eased a bit in the first quarter. On February 15, President Obama signed legislation extending the federal debt ceiling through March 2015.
One factor keeping investors on edge during the quarter was turmoil in Ukraine, specifically the country’s Crimea region, which has been governed as an independent republic since 1992 and is home to many pro-Russian sympathizers. On March 16, a referendum in Crimea yielded the decision to become part of Russia, a move not recognized by the West. Russia’s support of this referendum, together with the build-up of Russian troops along the Russia/Ukraine border, triggered economic sanctions against Russia by Western nations, including the United States. The political upheaval did not significantly damage stock prices, so most broad equity benchmarks ended the quarter only modestly below their all-time highs.
Q2 2014: Stocks continue their record-setting pace
Stocks of U.S. and foreign companies overcame a brief and relatively mild sell-off during the first half of April to surge into fresh high ground in the second quarter of 2014, as an ongoing global economic recovery, receding concerns about Ukraine, and stimulative monetary policy from central banks provided a supportive backdrop for equity prices. Stocks’ solid second quarter followed a shaky first quarter in which performance was much more muted. In the fixed-income market, yields of longer-term U.S. Treasury securities declined during April and May before recovering somewhat in June. Weak U.S. economic growth in the first quarter, which was initially estimated at just 0.1% and was subsequently revised much lower – making it the first negative reading in three years – helped drive the April drop.
The European Central Bank (“ECB”) provided a boost for the markets in early June, when ECB President Mario Draghi announced reductions in the central bank’s key interest rates. Notably, the ECB’s deposit rate turned negative for the first time, in essence charging euro zone banks for parking funds with the central bank. The ECB also introduced a fresh series of low-cost loans to banks in an effort to jump-start lending. These moves helped lift the performance of stocks in the United States, Europe, and Japan, as well as in emerging markets.
Global stock prices also reacted favorably to remarks coming out of the Fed meeting on June 18, which stated the central bank would continue to reduce the amount of monthly bond purchases and reaffirmed its intention to keep short-term interest rates near zero in an ongoing effort to incentivize job creation and economic growth.
Energy stocks rose during the quarter, spurred by concerns about potential disruptions in Iraq’s oil production amid widespread terrorist activity by the Islamic State in Iraq and Syria (“ISIS”), a radical Sunni group.
| * | Indexes are unmanaged, do not incur fees or expenses and cannot be purchased directly for investment. |
4
MML Series Investment Fund – Economic and Market Overview (Unaudited) (Continued)
Q3 2014: Gains narrow as concerns increase about global growth
Large-capitalization U.S. stocks overcame negative markets in July and September to finish the third quarter of 2014 with modest upside progress. However, shares of small and mid-size U.S. companies, foreign stocks from developed and emerging markets, and high-yield bonds struggled, as investors took a more risk-averse approach. Bonds were basically flat for the quarter.
Trouble overseas was one reason for increased investor caution. At the end of July, U.S. stocks suffered a sharp one-day decline after Argentina effectively defaulted on its bonds for the second time in 13 years. Around the same time, the share price of Banco Espirito Santo, Portugal’s largest bank, plunged after it reported a huge $4.8 billion first-half loss that wiped out the bank’s capital cushion and forced it to seek new funding.
In Eastern Europe, the standoff between Ukraine and Russia intensified. In the Middle East, there was a resurgence of the conflict between Israel and Hamas, and the threat of ISIS continued to grow.
Despite these developments, the negative impact on U.S. markets was relatively fleeting, as investor sentiment was buoyed by encouraging news about the U.S. economy. Data reported at the end of July showed that GDP, a broad measure of economic activity, advanced a robust 4.0% in the second quarter after contracting 2.1% in a first quarter hampered by severe winter weather. At the end of September, the second-quarter figure was revised upward to 4.6%.
Healthy U.S. economic growth stood in stark contrast to the euro zone, where economic activity was stagnant – and Japan, whose economy contracted sharply in the second quarter, according to data that became available in the third quarter. This discrepancy among developed nations helped trigger a significant rally in the U.S. dollar, which depressed the dollar-denominated returns of foreign markets.
Q4 2014: Volatility increases, but U.S. stocks hit new all-time highs
Investors shook off numerous concerns to drive U.S. stocks to healthy gains in the fourth quarter and to new highs for the year. Plunging crude oil prices, the spread of the Ebola virus in West Africa and beyond, and disappointing economic data from Europe and China were some of the factors keeping investors on edge and contributing to two noteworthy – but relatively short – sell-offs during the quarter. In November, the market reacted positively to the results of the U.S. midterm elections, but the impact was muted, as investors had anticipated Republicans would take control of the U.S. Senate weeks prior to the elections.
Oil’s decline – partly a result of increasing supply from North American shale beds – accelerated in late November after the Organization of Petroleum Exporting Countries (“OPEC”) announced its decision not to cut production. Good news on the U.S. economy was a major factor lifting share prices. GDP expanded by an upwardly revised 5.0% in the third quarter, its fastest pace since the third quarter of 2003. This strong performance stood in stark contrast to near-recessionary conditions afflicting most other key developed nations. Notably, the 18-member euro zone barely managed positive economic growth during the third quarter and rose just 0.2%. Foreign markets underperformed, as the U.S. dollar rose against other major currencies driven by U.S. economic strength and declining oil prices.
As 2014 drew to a close, the low price of oil, the weakness of overseas economies, and possible actions by the Fed and other central banks around the world were on the minds of many investors as they focused on the factors likely to impact the markets in the year ahead. Investors will also likely keep an eye out for continued economic growth here at home and improvement abroad, which may help create a favorable environment for stocks and bonds in 2015.
The information provided is the opinion of MassMutual Retirement Services Investment Services as of 1/1/15 and is subject to change without notice. It is not to be construed as tax, legal, or investment advice. Of course, past performance does not guarantee future results.
5
MML Allocation Fund Series – Portfolio Manager Report (Unaudited)
What are the investment approaches of the Funds that constitute the MML Allocation Series (the “Series”), and who is the Series’ investment adviser?
The MML Allocation Series comprises five Funds – each of which has a “fund of funds” structure. The five Funds in the Series are MML Conservative Allocation Fund, MML Balanced Allocation Fund, MML Moderate Allocation Fund, MML Growth Allocation Fund, and MML Aggressive Allocation Fund.
Each Fund seeks to achieve as high a total return over time as is considered consistent with prudent investment risk, preservation of capital, and recognition of the Fund’s stated asset allocation. Each Fund invests in a combination of domestic and international mutual funds (“Underlying Funds”) using an asset allocation strategy. Underlying Funds can include series of the MML Series Investment Fund and MML Series Investment Fund II (which are advised by MML Investment Advisers, LLC (MML Advisers), Oppenheimer Funds (which are advised by OFI Global Asset Management, Inc. (OFI Global Asset Management), a majority owned, indirect subsidiary of MassMutual), and non-affiliated funds. The Series’ investment adviser is MML Advisers.
Through their investment in Underlying Funds, the Funds may be exposed to a wide range of securities and other instruments with differing characteristics (such as credit quality, duration, geography, industry, and market capitalization), including, but not limited to, equity securities of small-, mid-, or large-capitalization U.S. or non-U.S. issuers, fixed income securities of U.S. or non-U.S. private or governmental issuers (including “junk” or “high-yield” bonds, including securities in default), inflation-protected securities, bank loans, commodities, real estate, and short-term investments of any kind.
Each Fund’s assets are allocated to its Underlying Funds according to an asset allocation strategy, as follows:
| • | | MML Conservative Allocation Fund: Approximately 40% in equity and similar funds and 60% in fixed income and similar funds, including money market funds. |
| • | | MML Balanced Allocation Fund: Approximately 50% in equity and similar funds and 50% in fixed income and similar funds, including money market funds. |
| • | | MML Moderate Allocation Fund: Approximately 60% in equity and similar funds and 40% in fixed income and similar funds, including money market funds. |
| • | | MML Growth Allocation Fund: Approximately 75% in equity and similar funds and 25% in fixed income and similar funds, including money market funds. |
| • | | MML Aggressive Allocation Fund: Approximately 90% in equity and similar funds and 10% in fixed income and similar funds, including money market funds. |
How did each Fund perform during the 12 months ended December 31, 2014?
The return of each Fund’s Initial Class shares is shown below. Also shown are the returns of each Fund’s Custom Index (defined below); the Russell 3000® Index, a widely recognized, unmanaged index that measures the performance of the 3,000 largest U.S. companies based on market capitalization; the MSCI All Country World Index (ACWI) ex USA, an unmanaged index representative of stocks domiciled in global developed and emerging markets, excluding the United States; and the Barclays U.S. Aggregate Bond Index, an unmanaged index of fixed-rate investment-grade securities with at least one year to maturity, combining the Barclays U.S. Treasury Bond Index, the Barclays U.S. Government-Related Bond Index, the Barclays U.S. Corporate Bond Index, and the Barclays U.S. Securitized Bond Index.
| | | | | | | | | | |
| | | Fund’s Initial
Class Return | | Custom
Index Return | | Russell 3000
Index Return | | MSCI ACWI
ex USA Return | | Barclays U.S.
Aggregate Bond
Index Return |
| MML Conservative Allocation Fund | | 5.13% | | 6.90% | | 12.56% | | -3.87% | | 5.97%* |
| | | | | |
| MML Balanced Allocation Fund | | 5.35% | | 7.14% | | 12.56%* | | -3.87% | | 5.97% |
6
MML Allocation Fund Series – Portfolio Manager Report (Unaudited) (Continued)
| | | | | | | | | | |
| | | Fund’s Initial
Class Return | | Custom
Index Return | | Russell 3000
Index Return | | MSCI ACWI
ex USA Return | | Barclays U.S.
Aggregate Bond
Index Return |
| MML Moderate Allocation Fund | | 5.61% | | 7.37% | | 12.56%* | | -3.87% | | 5.97% |
| | | | | |
| MML Growth Allocation Fund | | 5.77% | | 7.72% | | 12.56%* | | -3.87% | | 5.97% |
| | | | | |
| MML Aggressive Allocation Fund | | 5.85% | | 8.07% | | 12.56%* | | -3.87% | | 5.97% |
* Benchmark return
Each of the MML Allocation Series Funds underperformed its respective Custom Index, the Russell 3000 Index, and the Barclays U.S. Aggregate Bond Index for the full year. Conversely, all five Funds outperformed the MSCI ACWI ex USA.
MML Allocation Fund Series Custom Indexes
| • | | The Custom MML Conservative Allocation Index comprises the Barclays U.S. Aggregate Bond Index, the Russell 3000 Index, and the MSCI ACWI ex USA. The weightings of each index are 60%, 30%, and 10%, respectively. |
| • | | The Custom MML Balanced Allocation Index comprises the Barclays U.S. Aggregate Bond Index, the Russell 3000 Index, and the MSCI ACWI ex USA. The weightings of each index are 50%, 37.5%, and 12.5%, respectively. |
| • | | The Custom MML Moderate Allocation Index comprises the Barclays U.S. Aggregate Bond Index, the Russell 3000 Index, and the MSCI ACWI ex USA. The weightings of each index are 40%, 45%, and 15%, respectively. |
| • | | The Custom MML Growth Allocation Index comprises the Barclays U.S. Aggregate Bond Index, the Russell 3000 Index, and the MSCI ACWI ex USA. The weightings of each index are 25%, 56.25%, and 18.75%, respectively. |
| • | | The Custom MML Aggressive Allocation Index comprises the Barclays U.S. Aggregate Bond Index, the Russell 3000 Index, and the MSCI ACWI ex USA. The weightings of each index are 10%, 67.5%, and 22.5%, respectively. |
For a discussion on the economic and market environment during the 12-month period ended December 31, 2014, please see the Economic and Market Overview, beginning on page 3.
Investment adviser discussion of factors that contributed to the Funds’ performance
The Series Funds delivered positive returns in 2014, but struggled somewhat in an environment that proved a challenge for certain investment categories.
In the equity (stock) components of the Series, the relative underperformance of some of the Underlying Funds that make up the Series Funds was a key factor, particularly in U.S. large-company stocks. In 2014, U.S. equities experienced strong performance relative to many other investment categories, and U.S. large-company stock Underlying Funds benefited the Series Funds on an absolute basis; however, the disappointing performance of the Underlying Funds in the large-company category more than offset their favorable positioning on a relative basis. U.S. small-company stocks underperformed large-company counterparts, and foreign stocks underperformed U.S. stocks overall, with Underlying Funds in these categories following the basic trend.
In the fixed-income (bond) components of the Series, beneficial allocations to the U.S. high-yield bonds sector were offset by underperformance in higher-quality bond investments, which detracted from the Underlying Funds’ performance relative to the overall U.S. bond market. Throughout the year, the Series increased the quality of fixed-income holdings in an attempt to reduce certain market risks. The Series’ reduction in its exposure to international and emerging-market bonds and U.S. high-yield bonds was offset by an increase in its exposure to U.S. Treasury inflation-protected securities (“TIPS”) and investment-grade bonds. At the Underlying Funds level, fixed-income managers generally performed well, with the exception of MML Total Return Fund, which underwent a subadviser change late in the year.
7
MML Allocation Fund Series – Portfolio Manager Report (Unaudited) (Continued)
Reviewing the Underlying Fund positions in the Series, 2014 included the first-quarter addition of a new Underlying Fund in the international equity segment, MML International Equity Fund, which benefited Series performance. Also in the first quarter, the Series added a new position in alternative investments through Oppenheimer Diversified Alternatives Fund, which invests across a number of alternative categories – including real estate investment trusts (“REITs”), commodities, gold, currencies, and master limited partnerships (“MLPs”) – and has the potential to benefit the Series by offering exposure to different investment types. Lastly, within equities, the second-quarter addition of MML Managed Volatility Fund is intended to help limit the impact of equity risks and any expected increase in market volatility due to Federal Reserve action or other factors.
Investment adviser outlook
We expect 2015 may be a more difficult year for the markets. While we anticipate that the economy has the potential to continue to improve in 2015, we believe that the market gains from the last two years in an improving economic climate have been reflected in equity prices and returns may be more modest in the coming year. From an allocation perspective, we will seek to opportunistically gain greater exposure for the Underlying Funds to international equities in 2015, given the growing differential in past returns and share prices that may favor foreign stocks due to possible central bank activity in Europe. With respect to the Series Funds’ fixed-income investments, we remain diligent and continue to position the Underlying Funds’ exposure to reduce the potential impacts of an unexpected rise in interest rates and the potential downside of overpriced riskier bonds. Lastly, in the coming year we plan to maintain a position for the Series Funds in real assets (investments in physical or tangible assets, such as gold, land, and oil) to help provide an inflation hedge, income, and additional diversification.
8
MML Allocation Fund Series – Portfolio Manager Report (Unaudited) (Continued)
| | | | |
MML Conservative Allocation Fund
Asset Allocation
(% of Net Assets) on 12/31/14 | |
| | |
Fixed Income Funds | | | 57.3 | % |
Equity Funds | | | 42.8 | % |
| | | | | |
Total Long-Term Investments | | | 100.1 | % |
Other Assets & Liabilities | | | (0.1 | )% |
| | | | | |
Net Assets | | | 100.0 | % |
| | | | | |
| | | | |
MML Balanced Allocation Fund
Asset Allocation
(% of Net Assets) on 12/31/14 | |
| | |
Equity Funds | | | 52.3 | % |
Fixed Income Funds | | | 47.8 | % |
| | | | | |
Total Long-Term Investments | | | 100.1 | % |
Other Assets & Liabilities | | | (0.1 | )% |
| | | | | |
Net Assets | | | 100.0 | % |
| | | | | |
| | | | |
MML Moderate Allocation Fund
Asset Allocation
(% of Net Assets) on 12/31/14 | |
| | |
Equity Funds | | | 61.9 | % |
Fixed Income Funds | | | 38.2 | % |
| | | | | |
Total Long-Term Investments | | | 100.1 | % |
Other Assets & Liabilities | | | (0.1 | )% |
| | | | | |
Net Assets | | | 100.0 | % |
| | | | | |
| | | | |
MML Growth Allocation Fund
Asset Allocation
(% of Net Assets) on 12/31/14 | |
| | |
Equity Funds | | | 76.2 | % |
Fixed Income Funds | | | 23.9 | % |
| | | | | |
Total Long-Term Investments | | | 100.1 | % |
Other Assets & Liabilities | | | (0.1 | )% |
| | | | | |
Net Assets | | | 100.0 | % |
| | | | | |
| | | | |
MML Aggressive Allocation Fund
Asset Allocation
(% of Net Assets) on 12/31/14 | |
| | |
Equity Funds | | | 90.5 | % |
Fixed Income Funds | | | 9.6 | % |
| | | | | |
Total Long-Term Investments | | | 100.1 | % |
Other Assets & Liabilities | | | (0.1 | )% |
| | | | | |
Net Assets | | | 100.0 | % |
| | | | | |
9
MML Conservative Allocation Fund – Portfolio Manager Report (Unaudited) (Continued)
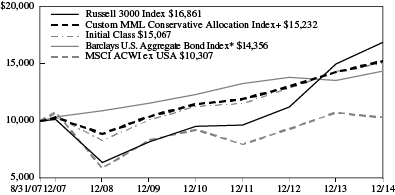
Growth of a $10,000 Investment
Hypothetical Investments in MML Conservative Allocation Fund Initial Class, the Barclays U.S. Aggregate Bond Index, the Russell 3000 Index, the MSCI ACWI ex USA, and the Custom MML Conservative Allocation Index.
| | | | | | | | | | | | |
| | | | |
TOTAL RETURN | | One Year
1/1/14 -
12/31/14 | | | Five Year
Average
Annual
1/1/10 -
12/31/14 | | | Since
Inception
Average
Annual
8/31/07 -
12/31/14 | |
Initial Class | | | 5.13% | | | | 8.40% | | | | 5.75% | |
Barclays U.S Aggregate Bond Index* | | | 5.97% | | | | 4.45% | | | | 5.05% | |
Russell 3000 Index | | | 12.56% | | | | 15.63% | | | | 7.38% | |
MSCI ACWI ex USA | | | -3.87% | | | | 4.43% | | | | 0.41% | |
Custom MML Conservative Allocation Index | | | 6.90% | | | | 7.96% | | | | 5.91%+ | |
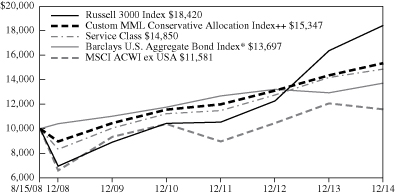
Hypothetical Investments in MML Conservative Allocation Fund Service Class, the Barclays U.S. Aggregate Bond Index, the Russell 3000 Index, the MSCI ACWI ex USA, and the Custom MML Conservative Allocation Index.
| | | | | | | | | | | | |
| | | | |
TOTAL RETURN | | One Year
1/1/14 -
12/31/14 | | | Five Year
Average
Annual
1/1/10 -
12/31/14 | | | Since
Inception
Average
Annual
8/15/08 -
12/31/14 | |
Service Class | | | 4.83% | | | | 8.11% | | | | 6.39% | |
Barclays U.S Aggregate Bond Index* | | | 5.97% | | | | 4.45% | | | | 5.06% | |
Russell 3000 Index | | | 12.56% | | | | 15.63% | | | | 10.05% | |
MSCI ACWI ex USA | | | -3.87% | | | | 4.43% | | | | 2.33% | |
Custom MML Conservative Allocation Index | | | 6.90% | | | | 7.96% | | | | 7.00%++ | |
GROWTH OF $10,000 INVESTMENT SINCE INCEPTION
* Benchmark
+ From 9/4/07.
++ From 9/2/08.
Performance data quoted represents past performance; past performance is not predictive of future results. The investment return and principal value of shares of the Fund will fluctuate with market conditions so that shares of the Fund, when redeemed, may be worth more or less than their original cost. Current performance of the Fund may be lower or higher than the performance quoted. Performance data current to the most recent month end may be obtained by accessing the website www.massmutual.com.
Investors should note that the Fund is a professionally managed mutual fund, while the Barclays U.S. Aggregate Bond Index, the Russell 3000 Index, the MSCI ACWI ex USA, and the Custom MML Conservative Allocation Index are unmanaged, do not incur expenses, and cannot be purchased directly by investors. Investors should read the Fund’s prospectus with regard to the Fund’s investment objective, risks, and charges and expenses in conjunction with these financial statements. The Fund’s return reflects changes in the net asset value per share without the deduction of any product charges (e.g., cost of insurance, mortality and expense risk charges, administrative fees, and CDSL). The inclusion of these charges would have reduced the performance shown here.
10
MML Balanced Allocation Fund – Portfolio Manager Report (Unaudited) (Continued)
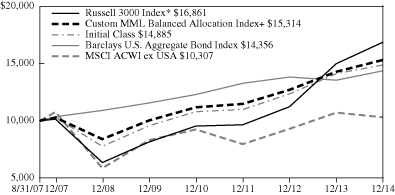
Growth of a $10,000 Investment
Hypothetical Investments in MML Balanced Allocation Fund Initial Class, the Russell 3000 Index, the Barclays U.S. Aggregate Bond Index, the MSCI ACWI ex USA, and the Custom MML Balanced Allocation Index.
| | | | | | | | | | | | |
| | | | |
TOTAL RETURN | | One Year
1/1/14 -
12/31/14 | | | Five Year
Average
Annual
1/1/10 -
12/31/14 | | | Since
Inception
Average
Annual
8/31/07 -
12/31/14 | |
Initial Class | | | 5.35% | | | | 9.23% | | | | 5.57% | |
Russell 3000 Index* | | | 12.56% | | | | 15.63% | | | | 7.38% | |
Barclays U.S. Aggregate Bond Index | | | 5.97% | | | | 4.45% | | | | 5.05% | |
MSCI ACWI ex USA | | | -3.87% | | | | 4.43% | | | | 0.41% | |
Custom MML Balanced Allocation Index | | | 7.14% | | | | 8.81% | | | | 5.98%+ | |
Hypothetical Investments in MML Balanced Allocation Fund Service Class, the Russell 3000 Index, the Barclays U.S. Aggregate Bond Index, the MSCI ACWI ex USA, and the Custom MML Balanced Allocation Index.
| | | | | | | | | | | | |
| | | | |
TOTAL RETURN | | One Year
1/1/14 -
12/31/14 | | | Five Year
Average
Annual
1/1/10 -
12/31/14 | | | Since
Inception
Average
Annual
8/15/08 -
12/31/14 | |
Service Class | | | 5.07% | | | | 8.98% | | | | 6.51% | |
Russell 3000 Index* | | | 12.56% | | | | 15.63% | | | | 10.05% | |
Barclays U.S. Aggregate Bond Index | | | 5.97% | | | | 4.45% | | | | 5.06% | |
MSCI ACWI ex USA | | | -3.87% | | | | 4.43% | | | | 2.33% | |
Custom MML Balanced Allocation Index | | | 7.14% | | | | 8.81% | | | | 7.37%++ | |
GROWTH OF $10,000 INVESTMENT SINCE INCEPTION

* Benchmark
+ From 9/4/07.
++ From 9/2/08.
Performance data quoted represents past performance; past performance is not predictive of future results. The investment return and principal value of shares of the Fund will fluctuate with market conditions so that shares of the Fund, when redeemed, may be worth more or less than their original cost. Current performance of the Fund may be lower or higher than the performance quoted. Performance data current to the most recent month end may be obtained by accessing the website www.massmutual.com.
Investors should note that the Fund is a professionally managed mutual fund, while the Russell 3000 Index, the Barclays U.S. Aggregate Bond Index, the MSCI ACWI ex USA, and the Custom MML Balanced Allocation Index are unmanaged, do not incur expenses, and cannot be purchased directly by investors. Investors should read the Fund’s prospectus with regard to the Fund’s investment objective, risks, and charges and expenses in conjunction with these financial statements. The Fund’s return reflects changes in the net asset value per share without the deduction of any product charges (e.g., cost of insurance, mortality and expense risk charges, administrative fees, and CDSL). The inclusion of these charges would have reduced the performance shown here.
11
MML Moderate Allocation Fund – Portfolio Manager Report (Unaudited) (Continued)
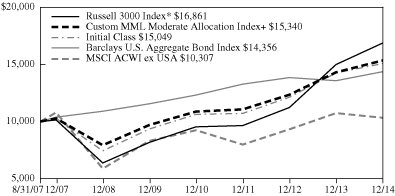
Growth of a $10,000 Investment
Hypothetical Investments in MML Moderate Allocation Fund Initial Class, the Russell 3000 Index, the Barclays U.S. Aggregate Bond Index, the MSCI ACWI ex USA, and the Custom MML Moderate Allocation Index.
| | | | | | | | | | | | |
| | | | |
TOTAL RETURN | | One Year
1/1/14 -
12/31/14 | | | Five Year
Average
Annual
1/1/10 -
12/31/14 | | | Since
Inception
Average
Annual
8/31/07 -
12/31/14 | |
Initial Class | | | 5.61% | | | | 10.00% | | | | 5.73% | |
Russell 3000 Index* | | | 12.56% | | | | 15.63% | | | | 7.38% | |
Barclays U.S. Aggregate Bond Index | | | 5.97% | | | | 4.45% | | | | 5.05% | |
MSCI ACWI ex USA | | | -3.87% | | | | 4.43% | | | | 0.41% | |
Custom MML Moderate Allocation Index | | | 7.37% | | | | 9.64% | | | | 6.01%+ | |
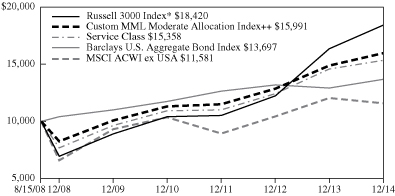
Hypothetical Investments in MML Moderate Allocation Fund Service Class, the Russell 3000 Index, the Barclays U.S. Aggregate Bond Index, the MSCI ACWI ex USA, and the Custom MML Moderate Allocation Index.
| | | | | | | | | | | | |
| | | | |
TOTAL RETURN | | One Year
1/1/14 -
12/31/14 | | | Five Year
Average
Annual
1/1/10 -
12/31/14 | | | Since
Inception
Average
Annual
8/15/08 -
12/31/14 | |
Service Class | | | 5.37% | | | | 9.74% | | | | 6.96% | |
Russell 3000 Index* | | | 12.56% | | | | 15.63% | | | | 10.05% | |
Barclays U.S. Aggregate Bond Index | | | 5.97% | | | | 4.45% | | | | 5.06% | |
MSCI ACWI ex USA | | | -3.87% | | | | 4.43% | | | | 2.33% | |
Custom MML Moderate Allocation Index | | | 7.37% | | | | 9.64% | | | | 7.69%++ | |
GROWTH OF $10,000 INVESTMENT SINCE INCEPTION
* Benchmark
+ From 9/4/07.
++ From 9/2/08.
Performance data quoted represents past performance; past performance is not predictive of future results. The investment return and principal value of shares of the Fund will fluctuate with market conditions so that shares of the Fund, when redeemed, may be worth more or less than their original cost. Current performance of the Fund may be lower or higher than the performance quoted. Performance data current to the most recent month end may be obtained by accessing the website www.massmutual.com.
Investors should note that the Fund is a professionally managed mutual fund, while the Russell 3000 Index, the Barclays U.S. Aggregate Bond Index, the MSCI ACWI ex USA, and the Custom MML Moderate Allocation Index are unmanaged, do not incur expenses, and cannot be purchased directly by investors. Investors should read the Fund’s prospectus with regard to the Fund’s investment objective, risks, and charges and expenses in conjunction with these financial statements. The Fund’s return reflects changes in the net asset value per share without the deduction of any product charges (e.g., cost of insurance, mortality and expense risk charges, administrative fees, and CDSL). The inclusion of these charges would have reduced the performance shown here.
12
MML Growth Allocation Fund – Portfolio Manager Report (Unaudited) (Continued)
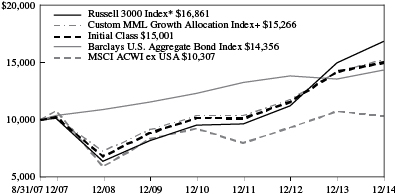
Growth of a $10,000 Investment
Hypothetical Investments in MML Growth Allocation Fund Initial Class, the Russell 3000 Index, the Barclays U.S. Aggregate Bond Index, the MSCI ACWI ex USA, and the Custom MML Growth Allocation Index.
| | | | | | | | | | | | |
| | | | |
TOTAL RETURN | | One Year
1/1/14 -
12/31/14 | | | Five Year
Average
Annual
1/1/10 -
12/31/14 | | | Since
Inception
Average
Annual
8/31/07 -
12/31/14 | |
Initial Class | | | 5.77% | | | | 11.19% | | | | 5.68% | |
Russell 3000 Index* | | | 12.56% | | | | 15.63% | | | | 7.38% | |
Barclays U.S. Aggregate Bond Index | | | 5.97% | | | | 4.45% | | | | 5.05% | |
MSCI ACWI ex USA | | | -3.87% | | | | 4.43% | | | | 0.41% | |
Custom MML Growth Allocation Index | | | 7.72% | | | | 10.87% | | | | 5.94%+ | |
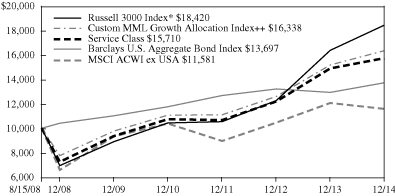
Hypothetical Investments in MML Growth Allocation Fund Service Class, the Russell 3000 Index, the Barclays U.S. Aggregate Bond Index, the MSCI ACWI ex USA, and the Custom MML Growth Allocation Index.
| | | | | | | | | | | | |
| | | | |
TOTAL RETURN | | One Year
1/1/14 -
12/31/14 | | | Five Year
Average Annual
1/1/10 -
12/31/14 | | | Since
Inception
Average
Annual
8/15/08 -
12/31/14 | |
Service Class | | | 5.56% | | | | 10.91% | | | | 7.34% | |
Russell 3000 Index* | | | 12.56% | | | | 15.63% | | | | 10.05% | |
Barclays U.S. Aggregate Bond Index | | | 5.97% | | | | 4.45% | | | | 5.06% | |
MSCI ACWI ex USA | | | -3.87% | | | | 4.43% | | | | 2.33% | |
Custom MML Growth Allocation Index | | | 7.72% | | | | 10.87% | | | | 8.06%++ | |
GROWTH OF $10,000 INVESTMENT SINCE INCEPTION
* Benchmark
+ From 9/4/07.
++ From 9/2/08.
Performance data quoted represents past performance; past performance is not predictive of future results. The investment return and principal value of shares of the Fund will fluctuate with market conditions so that shares of the Fund, when redeemed, may be worth more or less than their original cost. Current performance of the Fund may be lower or higher than the performance quoted. Performance data current to the most recent month end may be obtained by accessing the website www.massmutual.com.
Investors should note that the Fund is a professionally managed mutual fund, while the Russell 3000 Index, the Barclays U.S. Aggregate Bond Index, the MSCI ACWI ex USA, and the Custom MML Growth Allocation Index are unmanaged, do not incur expenses, and cannot be purchased directly by investors. Investors should read the Fund’s prospectus with regard to the Fund’s investment objective, risks, and charges and expenses in conjunction with these financial statements. The Fund’s return reflects changes in the net asset value per share without the deduction of any product charges (e.g., cost of insurance, mortality and expense risk charges, administrative fees, and CDSL). The inclusion of these charges would have reduced the performance shown here.
13
MML Aggressive Allocation Fund – Portfolio Manager Report (Unaudited) (Continued)
Growth of a $10,000 Investment
Hypothetical Investments in MML Aggressive Allocation Fund Initial Class, the Russell 3000 Index, the Barclays U.S. Aggregate Bond Index, the MSCI ACWI ex USA, and the Custom MML Aggressive Allocation Index.
| | | | | | | | | | | | |
| | | | |
TOTAL RETURN | | One Year
1/1/14 -
12/31/14 | | | Five Year
Average
Annual
1/1/10 -
12/31/14 | | | Since
Inception
Average
Annual
8/31/07 -
12/31/14 | |
Initial Class | | | 5.85% | | | | 12.19% | | | | 5.67% | |
Russell 3000 Index* | | | 12.56% | | | | 15.63% | | | | 7.38% | |
Barclays U.S. Aggregate Bond Index | | | 5.97% | | | | 4.45% | | | | 5.05% | |
MSCI ACWI ex USA | | | -3.87% | | | | 4.43% | | | | 0.41% | |
Custom MML Aggressive Allocation Index | | | 8.07% | | | | 12.06% | | | | 5.74%+ | |
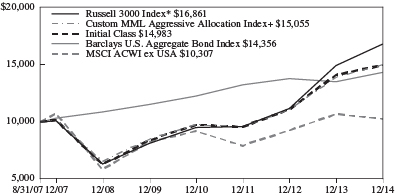
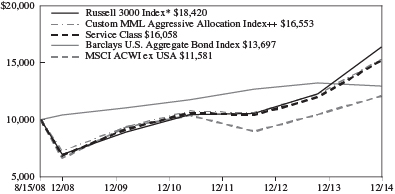
Hypothetical Investments in MML Aggressive Allocation Fund Service Class, the Russell 3000 Index, the Barclays U.S. Aggregate Bond Index, the MSCI ACWI ex USA, and the Custom MML Aggressive Allocation Index.
| | | | | | | | | | | | |
| | | | |
TOTAL RETURN | | One Year
1/1/14 -
12/31/14 | | | Five Year
Average
Annual
1/1/10 -
12/31/14 | | | Since
Inception
Average
Annual
8/15/08 -
12/31/14 | |
Service Class | | | 5.61% | | | | 11.94% | | | | 7.71% | |
Russell 3000 Index* | | | 12.56% | | | | 15.63% | | | | 10.05% | |
Barclays U.S. Aggregate Bond Index | | | 5.97% | | | | 4.45% | | | | 5.06% | |
MSCI ACWI ex USA | | | -3.87% | | | | 4.43% | | | | 2.33% | |
Custom MML Aggressive Allocation Index | | | 8.07% | | | | 12.06% | | | | 8.28%++ | |
GROWTH OF $10,000 INVESTMENT SINCE INCEPTION
* Benchmark
+ From 9/4/07.
++ From 9/2/08.
Performance data quoted represents past performance; past performance is not predictive of future results. The investment return and principal value of shares of the Fund will fluctuate with market conditions so that shares of the Fund, when redeemed, may be worth more or less than their original cost. Current performance of the Fund may be lower or higher than the performance quoted. Performance data current to the most recent month end may be obtained by accessing the website www.massmutual.com.
Investors should note that the Fund is a professionally managed mutual fund, while the Russell 3000 Index, the Barclays U.S. Aggregate Bond Index, the MSCI ACWI ex USA, and the Custom MML Aggressive Allocation Index are unmanaged, do not incur expenses, and cannot be purchased directly by investors. Investors should read the Fund’s prospectus with regard to the Fund’s investment objective, risks, and charges and expenses in conjunction with these financial statements. The Fund’s return reflects changes in the net asset value per share without the deduction of any product charges (e.g., cost of insurance, mortality and expense risk charges, administrative fees, and CDSL). The inclusion of these charges would have reduced the performance shown here.
14
MML American Funds Growth Fund – Portfolio Manager Report (Unaudited)
What is the investment approach of MML American Funds® Growth Fund, and who is the Fund’s investment adviser?
The Fund seeks to provide investors with long-term capital growth through a “master feeder” relationship. (See page 52 of this report for information about the “master feeder” relationship.) The Fund invests all of its assets in Class 1 shares of the American Funds Insurance Series – Growth Fund (the “Master Growth Fund”), a series of the American Funds Insurance Series®, a registered open-end investment company, managed by Capital Research and Management Company (Capital Research), which has substantially the same investment objective as the Master Growth Fund. The Master Growth Fund invests primarily in common stocks and seeks to invest in companies that appear to offer superior opportunities for growth of capital. The Master Growth Fund may invest a portion of its assets in common stocks and other securities of issuers domiciled outside the United States. Although the Master Growth Fund focuses on investments in medium- to large-capitalization companies, the Master Growth Fund’s investments are not limited to a particular capitalization size. The Fund’s investment adviser is MML Investment Advisers, LLC (MML Advisers).
How did the Fund perform during the 12 months ended December 31, 2014?
The Fund returned 7.99%, significantly trailing the 13.69% return of the S&P 500® Index (the “benchmark”), a widely recognized, unmanaged index representative of common stocks of larger capitalized U.S. companies. The Fund also substantially underperformed the 13.05% return of the Russell 1000® Growth Index, an unmanaged index consisting of those Russell 1000 securities (representing the 1,000 largest U.S. companies based on market capitalization) with greater than average growth orientation that tend to exhibit higher price-to-book ratios and higher forecasted growth rates than securities in the value universe.
For a discussion on the economic and market environment during the 12-month period ended December 31, 2014, please see the Economic and Market Overview, beginning on page 3.
Capital Research’s discussion of factors that contributed to the Fund’s performance
The Fund was challenged during 2014. The Fund’s slightly overweight position, relative to the benchmark, in energy – which was the worst-performing sector in the S&P 500 Index – detracted from the Fund’s performance. A slightly overweight allocation to exploration and production-oriented stocks in the energy sector also exacerbated this underperformance, as Fund holdings such as Noble Energy, an oil and natural gas exploration and production company, suffered on investor concerns over the company’s ability to continue its exploration activities in a low-price environment. (The price of oil declined steadily throughout the last half of 2014.) In the consumer discretionary sector, an overweight position in Internet retailer Amazon.com, which was the Fund’s largest holding, also worked against the Fund’s results. Amazon posted a lackluster year, as investor concerns grew over company management’s lack of transparency and continued heightened spending. Nevertheless, the Fund continued to hold this stock on the belief that Amazon will continue to be a market leader in both e-commerce and cloud-related services. In consumer staples, the Fund held an underweight position in this strong-performing sector, and direct marketers Herbalife and Nu Skin Enterprises, two stocks within this market segment, created a drag on results. Herbalife was down due to continued investor activism. Nu Skin Enterprises was hurt by a slowdown in China. An underweight position in consumer electronics giant Apple, which performed well in 2014, also hampered the Fund’s full-year performance. Overseas, Fund holding Airbus (a French industrials, aerospace, and defense giant) hindered returns, as the company suffered from unfavorable year-over-year comparisons after an extremely strong 2013.
Turning to the positive side, the Fund’s significantly overweight allocation to the strong-performing health care sector helped drive returns, as this sector was the second-best performer in the benchmark for the year. The Fund’s slightly overweight stake in biotechnology stocks also contributed, specifically in biotechnology company Gilead Sciences, whose strong sales of Sovaldi, its hepatitis C drug, continued to drive its growth. In the industrials sector, airline stocks United Continental and American Airlines were two Fund holdings that benefited from continued robust ticket pricing, strong demand trends, and lower fuel costs. Underweight positioning in the poorly performing telecommunications sector also contributed to relative performance, as did standouts such as Home Depot, one of the Fund’s top ten holdings throughout the year, which advanced more than 30% due to efficiency improvements and a strengthening U.S. market.
Capital Research’s outlook
As active managers, we invest in companies rather than markets. Our expectation is global economic growth may remain modest in 2015 – but that there is the potential for this to be a period of continued growth in the U.S. We also believe corporate balance
15
MML American Funds Growth Fund – Portfolio Manager Report (Unaudited) (Continued)
sheets will remain healthy this year. We continue to seek attractive investment opportunities in companies across all sectors for the Fund, including firms that offer products and services designed to satisfy consumer demand in rapidly growing developing countries. Finally, we believe companies that pay and increase dividends are likely to continue to remain attractive as investors seek alternatives to traditional fixed-income investments.
| | | | |
MML American Funds Growth Fund
Asset Allocation (% of Net Assets) on 12/31/14 | |
| | |
Equity Funds | | | 100.1 | % |
| | | | | |
Total Long-Term Investments | | | 100.1 | % |
Other Assets & Liabilities | | | (0.1 | )% |
| | | | | |
Net Assets | | | 100.0 | % |
| | | | | |
16
MML American Funds Growth Fund – Portfolio Manager Report (Unaudited) (Continued)
Growth of a $10,000 Investment
Hypothetical Investments in MML American Funds Growth Fund Service Class I, the S&P 500 Index, and the Russell 1000 Growth Index.
| | | | | | | | | | | | |
| | | | |
TOTAL
RETURN | | One Year
1/1/14 -
12/31/14 | | | Five Year
Average
Annual
1/1/10 -
12/31/14 | | | Since
Inception
Average
Annual
8/15/08 -
12/31/14 | |
Service Class I | | | 7.99% | | | | 13.08% | | | | 7.99% | |
S&P 500 Index* | | | 13.69% | | | | 15.45% | | | | 9.95% | |
Russell 1000 Growth Index | | | 13.05% | | | | 15.81% | | | | 10.82% | |
GROWTH OF $10,000 INVESTMENT SINCE INCEPTION
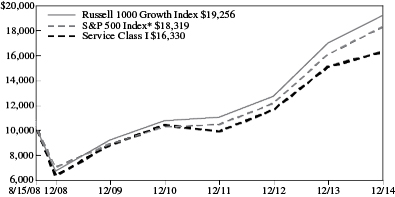
* Benchmark
Performance data quoted represents past performance; past performance is not predictive of future results. The investment return and principal value of shares of the Fund will fluctuate with market conditions so that shares of the Fund, when redeemed, may be worth more or less than their original cost. Current performance of the Fund may be lower or higher than the performance quoted. Performance data current to the most recent month end may be obtained by accessing the website www.massmutual.com.
Investors should note that the Fund is a professionally managed mutual fund, while the S&P 500 Index and the Russell 1000 Growth Index are unmanaged, do not incur expenses, and cannot be purchased directly by investors. Investors should read the Fund’s prospectus with regard to the Fund’s investment objective, risks, and charges and expenses in conjunction with these financial statements. The Fund’s return reflects changes in the net asset value per share without the deduction of any product charges (e.g., cost of insurance, mortality and expense risk charges, administrative fees, and CDSL). The inclusion of these charges would have reduced the performance shown here.
17
MML American Funds International Fund – Portfolio Manager Report (Unaudited)
What is the investment approach of MML American Funds® International Fund, and who is the Fund’s investment adviser?
The Fund seeks long-term capital growth of assets through a “master-feeder” relationship. (See page 52 of this report for information about the “master feeder” relationship.) The Fund invests all of its assets in Class 1 shares of the American Funds Insurance Series – International Fund (the “Master International Fund”), a series of the American Funds Insurance Series®, a registered open-end investment company managed by Capital Research and Management Company (Capital Research), which has substantially the same investment objective as the Master International Fund. The Master International Fund invests primarily in common stocks of companies domiciled outside the United States, including companies domiciled in developing countries, that Capital Research believes have the potential for growth. Although the Master International Fund focuses on investments in medium- to large-capitalization companies, the Master International Fund’s investments are not limited to a particular capitalization size. The Fund’s investment adviser is MML Investment Advisers, LLC (MML Advisers).
How did the Fund perform during the 12 months ended December 31, 2014?
The Fund returned -3.09%, outperforming the -3.87% return of the MSCI All Country World Index (ACWI) ex USA (the “benchmark”), an unmanaged index representative of stocks domiciled in global developed and emerging markets, excluding the United States. The Fund also outpaced the -4.90% return of the MSCI EAFE Index, a widely recognized, unmanaged index representative of equity securities in developed markets, excluding the U.S. and Canada.
For a discussion on the economic and market environment during the 12-month period ended December 31, 2014, please see the Economic and Market Overview, beginning on page 3.
Capital Research’s discussion of factors that contributed to the Fund’s performance
The Fund stayed ahead of its benchmark in 2014, as the financials, energy, and health care sectors were strong contributors. In the financials sector, Fund holdings that were top performers included Axis Bank Ltd. and Housing Development Finance Corporation, two Indian Banks that did well in 2014, given the positive investor sentiment over the newly elected Prime Minister. The election of Narendra Modi, who is now at the helm of the second-most populous country in the world, has ignited hopes of a re-acceleration of growth in that emerging-market country. In the energy sector, the Fund benefited from an underweight position, relative to the benchmark, in this poorly performing sector, which suffered significantly in 2014’s environment of falling oil prices. Overweight positioning in the strong-performing health care sector also contributed. A standout performer in that sector was Fund holding Novartis, a Swiss pharmaceutical company that benefited from solid performance across its three core divisions. Fund holding Novo Nordisk, a pharmaceutical firm that is the dominant global diabetes insulin provider, also advanced due to its potentially robust pipeline that includes an obesity drug currently under development. Another Fund holding that was a particular standout in the industrials sector was Ryanair, an Irish airline that operated at full capacity in the European market. It advanced approximately 50%.
Fund holdings in the consumer discretionary, telecommunications, and information technology sectors worked against the Fund’s returns during the year. In consumer discretionary, the Fund held a slightly overweight position, but most of the underperformance was attributable to three Fund holdings, as lackluster returns from Chinese gaming stocks Sands China, Melco Crown Entertainment, and Galaxy Entertainment Group hurt results due to the anti-corruption campaign that drew concerns from VIP and mass-market consumers in Macau. In telecommunications, Fund holding SoftBank, a Japanese telecommunications company that acquired a majority share of wireless phone services provider Sprint, underperformed due to the lackluster performance of that acquisition. In information technology, Fund holding Samsung Electronics, a South Korean high-tech manufacturer and digital media provider, underperformed due to a loss of market share. Other detractors included two Russian Fund holdings – Sberbank, the country’s largest bank, and Yandex, an Internet company that operates Russia’s largest search engine – both of which were victims of the country’s economic malaise, which has been largely driven by the collapse of oil prices. From a currency standpoint, the Russian ruble, which was devalued significantly due to the faltering economy, also hampered Fund performance.
18
MML American Funds International Fund – Portfolio Manager Report (Unaudited) (Continued)
Capital Research’s outlook
As active managers, we invest in companies rather than markets. Our expectation is that global economic growth may remain modest in 2015 – but there is the potential for this to be a period of continued growth in the U.S. We also believe corporate balance sheets will remain healthy this year. We continue to seek attractive investment opportunities in companies across all sectors for the Fund, including firms that offer products and services designed to satisfy consumer demand in rapidly growing developing countries. Finally, we believe companies that pay and increase dividends are likely to continue to remain attractive as investors seek alternatives to traditional fixed-income investments.
| | | | |
MML American Funds International Fund Asset Allocation (% of Net Assets) on 12/31/14 | |
| | |
Equity Funds | | | 100.2 | % |
| | | | | |
Total Long-Term Investments | | | 100.2 | % |
Other Assets and Liabilities | | | (0.2 | )% |
| | | | | |
Net Assets | | | 100.0 | % |
| | | | | |
19
MML American Funds International Fund – Portfolio Manager Report (Unaudited) (Continued)
Growth of a $10,000 Investment
Hypothetical Investments in MML American Funds International Fund Service Class I, the MSCI ACWI ex USA, and the MSCI EAFE Index.
| | | | | | | | | | | | |
| | | | |
TOTAL RETURN | | One Year
1/1/14 -
12/31/14 | | | Five Year
Average
Annual
1/1/10 -
12/31/14 | | | Since
Inception
Average
Annual
8/15/08 -
12/31/14 | |
Service Class I | | | -3.09% | | | | 4.73% | | | | 3.48% | |
MSCI ACWI
ex USA* | | | -3.87% | | | | 4.43% | | | | 2.33% | |
MSCI EAFE Index | | | -4.90% | | | | 5.33% | | | | 2.53% | |
GROWTH OF $10,000 INVESTMENT SINCE INCEPTION
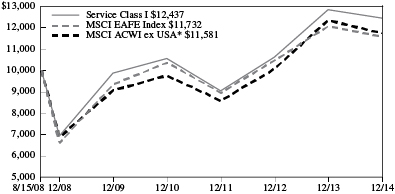
* Benchmark
Performance data quoted represents past performance; past performance is not predictive of future results. The investment return and principal value of shares of the Fund will fluctuate with market conditions so that shares of the Fund, when redeemed, may be worth more or less than their original cost. Current performance of the Fund may be lower or higher than the performance quoted. Performance data current to the most recent month end may be obtained by accessing the website www.massmutual.com.
Investors should note that the Fund is a professionally managed mutual fund, while the MSCI ACWI ex USA and the MSCI EAFE Index are unmanaged, do not incur expenses, and cannot be purchased directly by investors. Investors should read the Fund’s prospectus with regard to the Fund’s investment objective, risks, and charges and expenses in conjunction with these financial statements. The Fund’s return reflects changes in the net asset value per share without the deduction of any product charges (e.g., cost of insurance, mortality and expense risk charges, administrative fees, and CDSL). The inclusion of these charges would have reduced the performance shown here.
20
MML American Funds Core Allocation Fund – Portfolio Manager Report (Unaudited)
What is the investment approach of MML American Funds® Core Allocation Fund, and who is the Fund’s investment adviser?
The Fund seeks to achieve as high a total return over time as is considered consistent with prudent investment risk, preservation of capital, and recognition of the Fund’s stated asset allocation. The Fund is a “fund of funds” and seeks to achieve its investment objective by principally investing in a combination of series of the American Funds Insurance Series® (the “Underlying Funds”), managed by Capital Research and Management Company (Capital Research), using a flexible asset allocation approach. The Fund’s investment adviser invests the Fund’s assets in a combination of domestic and international Underlying Funds. As of the date of this report, it is expected that the Underlying Funds will include Class 1 shares of the American Funds Insurance Series – Bond Fund, the American Funds Insurance Series – Blue Chip Income and Growth Fund, the American Funds Insurance Series – Growth-Income Fund, and the American Funds Insurance Series – International Fund. The Fund’s investment adviser allocates the Fund’s assets among a variety of different asset classes through investing in Underlying Funds in response to changing market, economic, and investment conditions. The Fund’s investment adviser is MML Investment Advisers, LLC (MML Advisers).
How did the Fund perform during the 12 months ended December 31, 2014?
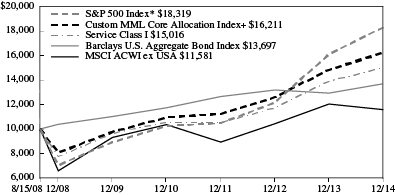
The Fund returned 8.05%, trailing the 13.69% return of the S&P 500® Index (the “benchmark”), a widely recognized, unmanaged index representative of common stocks of larger capitalized U.S. companies. The Fund outperformed the -3.87% return of the MSCI All Country World Index (ACWI) ex USA, an unmanaged index representative of stocks domiciled in global developed and emerging markets, excluding the United States. The Fund outperformed the 5.97% return of the Barclays U.S. Aggregate Bond Index, an unmanaged index of fixed-rate investment-grade securities with at least one year to maturity, combining the Barclays U.S. Treasury Bond Index, the Barclays U.S. Government-Related Bond Index, the Barclays U.S. Corporate Bond Index, and the Barclays U.S. Securitized Bond Index. Finally, the Fund’s 8.05% return trailed the 9.18% return of the Custom MML Core Allocation Index, which comprises the benchmark (55%), the Barclays U.S. Aggregate Bond Index (35%), and the MSCI ACWI ex USA (10%).
For a discussion on the economic and market environment during the 12-month period ended December 31, 2014, please see the Economic and Market Overview, beginning on page 3.
Capital Research’s discussion of factors that contributed to the Fund’s performance
The following paragraphs discuss the results of each of the Fund’s underlying portfolio components. Because the Fund invests in both stock- and bond-based portfolios, its overall performance may vary considerably from the broad market indexes listed above, which each measure the performance of a specific group of securities. These component-specific discussions focus on results and positioning versus each component’s main comparative index, not how the Fund as a whole performed or was positioned versus those indexes.
With respect to the American Funds Insurance Series – Bond Fund (the “Bond Fund”), the Bond Fund underperformed the Barclays U.S. Aggregate Bond Index (the “Index”) for the year. During 2014, debt-servicing costs continued to be low, which allowed companies to refinance their debt more cheaply, and mergers and acquisitions activity was robust. The Bond Fund’s exposure to corporate bonds remained low because valuations were expensive, as investors sought yield in a low-interest environment. The Bond Fund’s high-yield bond allocation was smaller than historical averages, but the positioning helped dampen the negative impact when high-yield bonds had a challenging fourth quarter – most of it related to energy holdings, which fell as the price of oil experienced a downward spiral in the second half of the year. High-quality corporate bonds and longer-term securities benefited in this environment. During 2014, the Bond Fund held an underweight position, relative to the benchmark, in mortgage-backed securities, which weakened as the Federal Reserve bought fewer issues and took some demand out of the market.
The American Funds Insurance Series – Blue Chip Income and Growth Fund (the “Income and Growth Fund”) outperformed the benchmark in 2014. Sector allocations played an important role in the Fund’s success, as overweight allocations to the strong-performing health care and utilities sectors, and an underweight position in the lagging energy sector, were strong contributors. With respect to specific Income and Growth Fund holdings, biotechnology firm Amgen, the largest holding in the Income and Growth Fund, experienced a turnaround in 2014, as investors began to take note of its underappreciated pipeline of drugs. Another
21
MML American Funds Core Allocation Fund – Portfolio Manager Report (Unaudited) (Continued)
biotechnology company, Gilead Sciences, experienced strong sales of Sovaldi, its hepatitis C drug, which continued to drive company growth during the year. In the utilities sector, Exelon Corporation, a Chicago-based energy producer, trader, and distributor, performed well, and the stock’s 4% dividend yield was a bonus for investors in 2014’s low interest rate environment. In the industrials sector, aerospace and defense contractor General Dynamics rose as the company’s fortunes turned around in 2014. Although the Income and Growth Fund had a normal allocation to cash, the position hampered returns, as stocks continued their upward trajectory throughout the year. A substantially underweight position and weak stock selection in the financials sector also hampered the performance of Income and Growth Fund. The Income and Growth Fund’s decision to not own specific companies during the year also negatively impacted returns, including the strong-performing Berkshire Hathaway and Wells Fargo.
The American Funds Insurance Series – Growth-Income Fund (the “Growth-Income Fund”) underperformed the benchmark for the year, as the Growth-Income Fund’s cash position, which averaged around 8% in 2014, was one of the greatest detractors (despite being a “low” cash position for the Growth-Income Fund, whose 10-year average cash allocation is around 9.7%). Sector allocations also played a role in the Growth-Income Fund’s underperformance, as overweight positions in consumer discretionary and materials stocks hampered returns. Growth-Income Fund holdings that held down results from the consumer discretionary sector included online retail giant Amazon.com and automobile maker General Motors. Two metals and mining companies from the materials sector that impaired performance were Vale (Brazil) and U.S.-based Freeport-McMoran, both of which suffered due to falling commodity prices. An underweight stake in the strong-performing consumer technology behemoth Apple also held back the Growth-Income Fund’s returns for the year. Overweight positioning and strong stock selection, including positions in biotechnology firms Amgen and Gilead Sciences, drove performance in the strong-performing health care sector. The Growth-Income Fund’s decision to not own certain stocks also boosted relative performance, including ExxonMobil and General Electric. Finally, rail companies in the industrials sector boosted performance, with Growth-Income Fund holdings CSX Corporation, Union Pacific, and Norfolk Southern all strongly advancing.
The American Funds Insurance Series – International Fund (the “International Fund”) outperformed the MSCI ACWI ex USA (the “Index”) for the year, with the financials, energy, and health care sectors making strong contributions. In the financials sector, International Fund holdings that were top performers included Axis Bank Ltd. and Housing Development Finance Corporation, two Indian Banks that did well in 2014, given the positive investor sentiment over newly elected Prime Minister Narendra Modi. In the poorly performing energy sector, which suffered significantly in 2014’s environment of falling oil prices, the International Fund benefited from an underweight position, relative to the benchmark. Overweight positioning in the strong-performing health care sector also contributed. A standout in that sector was International Fund holding Novartis, a Swiss pharmaceutical company that benefited from solid performance across its three core divisions. International Fund holding Novo Nordisk, a pharmaceutical firm that is the dominant global diabetes insulin provider, also advanced due to its potentially robust pipeline that includes an obesity drug currently under development. Conversely, International Fund holdings in the consumer discretionary, telecommunications, and information technology sectors worked against the International Fund during the year. In consumer discretionary, the International Fund held a slightly overweight position, but most of the underperformance was attributable to three International Fund holdings, as lackluster returns from Chinese gaming stocks Sands China, Melco Crown Entertainment, and Galaxy Entertainment Group hurt results due to the anti-corruption campaign that drew concerns from VIP and mass-market consumers in Macau. In telecommunications, International Fund holding SoftBank, a Japanese telecommunications company that acquired a majority share of wireless phone services provider Sprint, underperformed due to the lackluster performance of that acquisition. In information technology, International Fund holding Samsung Electronics, a South Korean high-tech manufacturer and digital media provider, underperformed due to a loss of market share.
Capital Research’s outlook
As active managers, we invest in companies rather than markets. Our expectation is that global economic growth may remain modest in 2015 – but there is the potential for this to be a period of continued growth in the U.S. We also believe corporate balance sheets will remain healthy this year. We continue to seek attractive investment opportunities in companies across all sectors for the Fund, including firms that offer products and services designed to satisfy consumer demand in rapidly growing developing countries. Finally, we believe companies that pay and increase dividends are likely to continue to remain attractive as investors seek alternatives to traditional fixed-income investments.
22
MML American Funds Core Allocation Fund – Portfolio Manager Report (Unaudited) (Continued)
| | | | |
MML American Funds Core Allocation Fund Asset Allocation (% of Net Assets) on 12/31/14 | |
| | |
Equity Funds | | | 65.6 | % |
Fixed Income Funds | | | 34.5 | % |
| | | | | |
Total Long-Term Investments | | | 100.1 | % |
Other Assets & Liabilities | | | (0.1 | )% |
| | | | | |
Net Assets | | | 100.0 | % |
| | | | | |
23
MML American Funds Core Allocation Fund – Portfolio Manager Report (Unaudited) (Continued)
Growth of a $10,000 Investment
Hypothetical Investments in MML American Funds Core Allocation Fund Service Class I, the S&P 500 Index, the Barclays U.S. Aggregate Bond Index, the MSCI ACWI ex USA, and the Custom MML Core Allocation Index.
| | | | | | | | | | | | |
| | | | |
TOTAL RETURN | | One Year
1/1/14 -
12/31/14 | | | Five Year
Average
Annual 1/1/10 -
12/31/14 | | | Since Inception
Average
Annual
8/15/08 -
12/31/14 | |
Service Class I | | | 8.05% | | | | 9.25% | | | | 6.58% | |
S&P 500 Index* | | | 13.69% | | | | 15.45% | | | | 9.95% | |
Barclays U.S. Aggregate Bond Index | | | 5.97% | | | | 4.45% | | | | 5.06% | |
MSCI ACWI ex USA | | | -3.87% | | | | 4.43% | | | | 2.33% | |
Custom MML Core Allocation Index | | | 9.18% | | | | 10.65% | | | | 7.93%+ | |
GROWTH OF $10,000 INVESTMENT SINCE INCEPTION
* Benchmark
+ From 9/2/08.
Performance data quoted represents past performance; past performance is not predictive of future results. The investment return and principal value of shares of the Fund will fluctuate with market conditions so that shares of the Fund, when redeemed, may be worth more or less than their original cost. Current performance of the Fund may be lower or higher than the performance quoted. Performance data current to the most recent month end may be obtained by accessing the website www.massmutual.com.
Investors should note that the Fund is a professionally managed mutual fund, while the S&P 500 Index, the Barclays U.S. Aggregate Bond Index, the MSCI ACWI ex USA, and the Custom MML Core Allocation Index are unmanaged, do not incur expenses, and cannot be purchased directly by investors. Investors should read the Fund’s prospectus with regard to the Fund’s investment objective, risks, and charges and expenses in conjunction with these financial statements. The Fund’s return reflects changes in the net asset value per share without the deduction of any product charges (e.g., cost of insurance, mortality and expense risk charges, administrative fees, and CDSL). The inclusion of these charges would have reduced the performance shown here.
24
MML Conservative Allocation Fund – Portfolio of Investments
December 31, 2014
| | | | | | | | |
| | | Number of
Shares | | | Value | |
| MUTUAL FUNDS — 100.1% | |
| Equity Funds — 42.8% | | | | | | | | |
MML Blue Chip Growth Fund, Initial Class (a) | | | 1,108,468 | | | $ | 18,943,716 | |
MML Equity Income Fund, Initial Class (a) | | | 1,305,812 | | | | 18,189,966 | |
MML Focused Equity Fund, Class II (a) | | | 426,033 | | | | 6,803,740 | |
MML Foreign Fund, Initial Class (a) | | | 680,114 | | | | 6,943,962 | |
MML Fundamental Growth Fund, Class II (a) | | | 862,515 | | | | 12,842,846 | |
MML Fundamental Value Fund, Class II (a) | | | 1,051,603 | | | | 17,035,968 | |
MML Global Fund, Class I (a) | | | 753,705 | | | | 9,504,222 | |
MML Income & Growth Fund, Initial Class (a) | | | 849,973 | | | | 10,573,659 | |
MML International Equity Fund, Class II (a) | | | 781,144 | | | | 7,241,205 | |
MML Large Cap Growth Fund, Initial Class (a) | | | 910,651 | | | | 12,803,753 | |
MML Managed Volatility Fund, Initial Class (a) | | | 647,599 | | | | 9,139,198 | |
MML Mid Cap Growth Fund, Initial Class (a) | | | 489,785 | | | | 8,037,373 | |
MML Mid Cap Value Fund, Initial Class (a) | | | 799,616 | | | | 10,490,956 | |
MML Small Cap Growth Equity Fund, Initial Class (a) | | | 238,652 | | | | 4,258,764 | |
MML Small Company Value Fund, Class II (a) | | | 317,539 | | | | 5,585,509 | |
MML Small/Mid Cap Value Fund, Initial Class (a) | | | 234,751 | | | | 3,448,496 | |
Oppenheimer Discovery Mid Cap Growth Fund/VA, Non-Service Shares (a) (b) | | | 35,830 | | | | 2,824,096 | |
Oppenheimer Diversified Alternatives Fund/VA, Non-Service Shares (a) | | | 2,359,705 | | | | 23,691,434 | |
Oppenheimer Global Fund/VA, Non-Service Shares (a) | | | 180,730 | | | | 7,138,827 | |
Oppenheimer International Growth Fund/VA, Non-Service Shares (a) | | | 3,030,603 | | | | 7,000,692 | |
| | | | | | | | |
| | | | | | | 202,498,382 | |
| | | | | | | | |
| Fixed Income Funds — 57.3% | |
MML High Yield Fund, Class II (a) | | | 1,856,018 | | | | 18,523,062 | |
MML Inflation-Protected and Income Fund, Initial Class (a) | | | 1,833,931 | | | | 18,669,413 | |
MML Managed Bond Fund, Initial Class (a) | | | 10,091,028 | | | | 129,352,967 | |
MML Short-Duration Bond Fund, Class II (a) | | | 2,318,005 | | | | 22,809,169 | |
| | | | | | | | |
| | | Number of
Shares | | | Value | |
MML Total Return Bond Fund, Class II (a) | | | 5,752,757 | | | $ | 61,209,333 | |
Oppenheimer Global Strategic Income Fund/VA, Non-Service Shares (a) | | | 3,912,966 | | | | 20,738,721 | |
| | | | | | | | |
| | | | | | | 271,302,665 | |
| | | | | | | | |
| | |
TOTAL MUTUAL FUNDS
(Cost $457,592,374) | | | | | | | 473,801,047 | |
| | | | | | | | |
| | |
TOTAL LONG-TERM INVESTMENTS
(Cost $457,592,374) | | | | | | | 473,801,047 | |
| | | | | | | | |
| | |
| TOTAL INVESTMENTS — 100.1% (Cost $457,592,374) (c) | | | | | | | 473,801,047 | |
| | |
| Other Assets/(Liabilities) — (0.1)% | | | | | | | (353,896 | ) |
| | | | | | | | |
| | |
| NET ASSETS — 100.0% | | | | | | $ | 473,447,151 | |
| | | | | | | | |
Notes to Portfolio of Investments
Percentages are stated as a percent of net assets.
| (a) | Affiliated issuer. See Note 7 for a summary of transactions in the investments of affiliated issuers. |
| (b) | Non-income producing security. |
| (c) | See Note 6 for aggregate cost for federal tax purposes. |
The accompanying notes are an integral part of the financial statements.
25
MML Balanced Allocation Fund – Portfolio of Investments
December 31, 2014
| | | | | | | | |
| | | Number of
Shares | | | Value | |
| MUTUAL FUNDS — 100.1% | | | | | | | | |
| Equity Funds — 52.3% | | | | | | | | |
MML Blue Chip Growth Fund, Initial Class (a) | | | 1,672,364 | | | $ | 28,580,702 | |
MML Equity Income Fund, Initial Class (a) | | | 1,761,921 | | | | 24,543,554 | |
MML Focused Equity Fund, Class II (a) | | | 779,283 | | | | 12,445,146 | |
MML Foreign Fund, Initial Class (a) | | | 1,184,484 | | | | 12,093,578 | |
MML Fundamental Growth Fund, Class II (a) | | | 1,285,251 | | | | 19,137,382 | |
MML Fundamental Value Fund, Class II (a) | | | 1,455,693 | | | | 23,582,231 | |
MML Global Fund, Class I (a) | | | 1,119,769 | | | | 14,120,291 | |
MML Income & Growth Fund, Initial Class (a) | | | 1,466,044 | | | | 18,237,588 | |
MML International Equity Fund, Class II (a) | | | 1,365,174 | | | | 12,655,163 | |
MML Large Cap Growth Fund, Initial Class (a) | | | 1,350,440 | | | | 18,987,191 | |
MML Managed Volatility Fund, Initial Class (a) | | | 1,000,281 | | | | 14,116,406 | |
MML Mid Cap Growth Fund, Initial Class (a) | | | 989,339 | | | | 16,235,051 | |
MML Mid Cap Value Fund, Initial Class (a) | | | 1,325,557 | | | | 17,391,308 | |
MML Small Cap Growth Equity Fund, Initial Class (a) | | | 408,657 | | | | 7,292,521 | |
MML Small Company Value Fund, Class II (a) | | | 462,499 | | | | 8,135,359 | |
MML Small/Mid Cap Value Fund, Initial Class (a) | | | 410,739 | | | | 6,033,755 | |
Oppenheimer Discovery Mid Cap Growth Fund/VA, Non-Service Shares (a) (b) | | | 70,294 | | | | 5,540,576 | |
Oppenheimer Diversified Alternatives Fund/VA, Non-Service Shares (a) | | | 2,919,619 | | | | 29,312,979 | |
Oppenheimer Global Fund/VA, Non-Service Shares (a) | | | 307,582 | | | | 12,149,471 | |
Oppenheimer International Growth Fund/VA, Non-Service Shares (a) | | | 5,346,658 | | | | 12,350,781 | |
| | | | | | | | |
| | | | | | | 312,941,033 | |
| | | | | | | | |
| Fixed Income Funds — 47.8% | | | | | | | | |
MML High Yield Fund, Class II (a) | | | 2,009,508 | | | | 20,054,889 | |
MML Inflation-Protected and Income Fund, Initial Class (a) | | | 2,027,046 | | | | 20,635,323 | |
MML Managed Bond Fund, Initial Class (a) | | | 10,638,276 | | | | 136,367,920 | |
MML Short-Duration Bond Fund, Class II (a) | | | 2,514,332 | | | | 24,741,022 | |
| | | | | | | | |
| | | Number of
Shares | | | Value | |
MML Total Return Bond Fund, Class II (a) | | | 5,910,819 | | | $ | 62,891,117 | |
Oppenheimer Global Strategic Income Fund/VA, Non-Service Shares (a) | | | 3,999,649 | | | | 21,198,140 | |
| | | | | | | | |
| | | | | | | 285,888,411 | |
| | | | | | | | |
| | |
TOTAL MUTUAL FUNDS
(Cost $560,887,997) | | | | | | | 598,829,444 | |
| | | | | | | | |
| | |
TOTAL LONG-TERM
INVESTMENTS
(Cost $560,887,997) | | | | | | | 598,829,444 | |
| | | | | | | | |
| | |
TOTAL INVESTMENTS — 100.1%
(Cost $560,887,997) (c) | | | | | | | 598,829,444 | |
| | |
| Other Assets/(Liabilities) — (0.1)% | | | | | | | (426,899 | ) |
| | | | | | | | |
| | |
| NET ASSETS — 100.0% | | | | | | $ | 598,402,545 | |
| | | | | | | | |
Notes to Portfolio of Investments
Percentages are stated as a percent of net assets.
| (a) | Affiliated issuer. See Note 7 for a summary of transactions in the investments of affiliated issuers. |
| (b) | Non-income producing security. |
| (c) | See Note 6 for aggregate cost for federal tax purposes. |
The accompanying notes are an integral part of the financial statements.
26
MML Moderate Allocation Fund – Portfolio of Investments
December 31, 2014
| | | | | | | | |
| | | Number of
Shares | | | Value | |
| MUTUAL FUNDS — 100.1% | |
| Equity Funds — 61.9% | |
MML Blue Chip Growth Fund, Initial Class (a) | | | 7,469,514 | | | $ | 127,653,987 | |
MML Equity Income Fund, Initial Class (a) | | | 6,690,847 | | | | 93,203,501 | |
MML Focused Equity Fund, Class II (a) | | | 4,049,828 | | | | 64,675,751 | |
MML Foreign Fund, Initial Class (a) | | | 4,619,959 | | | | 47,169,786 | |
MML Fundamental Growth Fund, Class II (a) | | | 5,840,289 | | | | 86,961,897 | |
MML Fundamental Value Fund, Class II (a) | | | 5,753,191 | | | | 93,201,695 | |
MML Global Fund, Class I (a) | | | 7,253,182 | | | | 91,462,624 | |
MML Income & Growth Fund, Initial Class (a) | | | 6,201,946 | | | | 77,152,210 | |
MML International Equity Fund, Class II (a) | | | 5,300,929 | | | | 49,139,616 | |
MML Large Cap Growth Fund, Initial Class (a) | | | 6,137,665 | | | | 86,295,575 | |
MML Managed Volatility Fund, Initial Class (a) | | | 4,503,232 | | | | 63,551,599 | |
MML Mid Cap Growth Fund, Initial Class (a) | | | 4,635,039 | | | | 76,060,991 | |
MML Mid Cap Value Fund, Initial Class (a) | | | 6,305,478 | | | | 82,727,872 | |
MML Small Cap Growth Equity Fund, Initial Class (a) | | | 1,870,987 | | | | 33,387,901 | |
MML Small Company Value Fund, Class II (a) | | | 2,331,749 | | | | 41,015,467 | |
MML Small/Mid Cap Value Fund, Initial Class (a) | | | 1,864,400 | | | | 27,388,043 | |
MML Strategic Emerging Markets Fund, Class II (a) | | | 4,014,300 | | | | 38,657,713 | |
Oppenheimer Discovery Mid Cap Growth Fund/VA, Non-Service Shares (a) (b) | | | 319,778 | | | | 25,204,881 | |
Oppenheimer Diversified Alternatives Fund/VA, Non-Service Shares (a) | | | 10,946,823 | | | | 109,906,099 | |
Oppenheimer Global Fund/VA, Non-Service Shares (a) | | | 1,037,262 | | | | 40,971,851 | |
Oppenheimer International Growth Fund/VA, Non-Service Shares (a) | | | 17,855,247 | | | | 41,245,620 | |
| | | | | | | | |
| | | | | | | 1,397,034,679 | |
| | | | | | | | |
| Fixed Income Funds — 38.2% | |
MML High Yield Fund, Class II (a) | | | 6,081,792 | | | | 60,696,286 | |
MML Inflation-Protected and Income Fund, Initial Class (a) | | | 6,555,075 | | | | 66,730,667 | |
| | | | | | | | |
| | | Number of
Shares | | | Value | |
MML Managed Bond Fund, Initial Class (a) | | | 32,590,196 | | | $ | 417,761,045 | |
MML Short-Duration Bond Fund, Class II (a) | | | 7,627,141 | | | | 75,051,065 | |
MML Total Return Bond Fund, Class II (a) | | | 17,821,385 | | | | 189,619,536 | |
Oppenheimer Global Strategic Income Fund/VA, Non-Service Shares (a) | | | 9,723,403 | | | | 51,534,038 | |
| | | | | | | | |
| | | | | | | 861,392,637 | |
| | | | | | | | |
| | |
TOTAL MUTUAL FUNDS
(Cost $2,089,401,296) | | | | | | | 2,258,427,316 | |
| | | | | | | | |
| | |
TOTAL LONG-TERM
INVESTMENTS
(Cost $2,089,401,296) | | | | | | | 2,258,427,316 | |
| | | | | | | | |
| | |
TOTAL INVESTMENTS — 100.1%
(Cost $2,089,401,296) (c) | | | | | | | 2,258,427,316 | |
| | |
| Other Assets/(Liabilities) — (0.1)% | | | | | | | (1,580,450 | ) |
| | | | | | | | |
| | |
| NET ASSETS — 100.0% | | | | | | $ | 2,256,846,866 | |
| | | | | | | | |
Notes to Portfolio of Investments
Percentages are stated as a percent of net assets.
| (a) | Affiliated issuer. See Note 7 for a summary of transactions in the investments of affiliated issuers. |
| (b) | Non-income producing security. |
| (c) | See Note 6 for aggregate cost for federal tax purposes. |
The accompanying notes are an integral part of the financial statements.
27
MML Growth Allocation Fund – Portfolio of Investments
December 31, 2014
| | | | | | | | |
| | | Number of
Shares | | | Value | |
| MUTUAL FUNDS — 100.1% | |
| Equity Funds — 76.2% | |
MML Blue Chip Growth Fund, Initial Class (a) | | | 6,943,503 | | | $ | 118,664,463 | |
MML Equity Income Fund, Initial Class (a) | | | 5,747,051 | | | | 80,056,417 | |
MML Focused Equity Fund, Class II (a) | | | 4,410,908 | | | | 70,442,195 | |
MML Foreign Fund, Initial Class (a) | | | 4,702,623 | | | | 48,013,777 | |
MML Fundamental Growth Fund, Class II (a) | | | 5,462,334 | | | | 81,334,158 | |
MML Fundamental Value Fund, Class II (a) | | | 4,909,630 | | | | 79,536,008 | |
MML Global Fund, Class I (a) | | | 6,544,819 | | | | 82,530,164 | |
MML Income & Growth Fund, Initial Class (a) | | | 4,593,643 | | | | 57,144,916 | |
MML International Equity Fund, Class II (a) | | | 5,397,692 | | | | 50,036,603 | |
MML Large Cap Growth Fund, Initial Class (a) | | | 5,731,581 | | | | 80,586,022 | |
MML Managed Volatility Fund, Initial Class (a) | | | 4,282,220 | | | | 60,432,581 | |
MML Mid Cap Growth Fund, Initial Class (a) | | | 4,778,861 | | | | 78,421,112 | |
MML Mid Cap Value Fund, Initial Class (a) | | | 6,102,725 | | | | 80,067,756 | |
MML Small Cap Growth Equity Fund, Initial Class (a) | | | 1,897,224 | | | | 33,856,107 | |
MML Small Company Value Fund, Class II (a) | | | 2,137,814 | | | | 37,604,150 | |
MML Small/Mid Cap Value Fund, Initial Class (a) | | | 1,838,275 | | | | 27,004,254 | |
MML Strategic Emerging Markets Fund, Class II (a) | | | 4,473,421 | | | | 43,079,048 | |
Oppenheimer Discovery Mid Cap Growth Fund/VA, Non-Service Shares (a) (b) | | | 324,794 | | | | 25,600,287 | |
Oppenheimer Diversified Alternatives Fund/VA, Non-Service Shares (a) | | | 8,331,471 | | | | 83,647,965 | |
Oppenheimer Global Fund/VA, Non-Service Shares (a) | | | 796,419 | | | | 31,458,538 | |
Oppenheimer International Growth Fund/VA, Non-Service Shares (a) | | | 18,560,470 | | | | 42,874,686 | |
| | | | | | | | |
| | | | | | | 1,292,391,207 | |
| | | | | | | | |
| Fixed Income Funds — 23.9% | |
MML High Yield Fund, Class II (a) | | | 1,699,715 | | | | 16,963,153 | |
MML Inflation-Protected and Income Fund, Initial Class (a) | | | 6,199,487 | | | | 63,110,773 | |
| | | | | | | | |
| | | Number of
Shares | | | Value | |
MML Managed Bond Fund, Initial Class (a) | | | 15,187,866 | | | $ | 194,687,348 | |
MML Short-Duration Bond Fund, Class II (a) | | | 4,208,966 | | | | 41,416,229 | |
MML Total Return Bond Fund, Class II (a) | | | 8,276,281 | | | | 88,059,633 | |
Oppenheimer Global Strategic Income Fund/VA, Non-Service Shares (a) | | | 3,289 | | | | 17,434 | |
| | | | | | | | |
| | | | | | | 404,254,570 | |
| | | | | | | | |
| | |
TOTAL MUTUAL FUNDS
(Cost $1,471,252,208) | | | | | | | 1,696,645,777 | |
| | | | | | | | |
| | |
TOTAL LONG-TERM
INVESTMENTS
(Cost $1,471,252,208) | | | | | | | 1,696,645,777 | |
| | | | | | | | |
| | |
TOTAL INVESTMENTS — 100.1%
(Cost $1,471,252,208) (c) | | | | | | | 1,696,645,777 | |
| | |
| Other Assets/(Liabilities) — (0.1)% | | | | | | | (1,080,003 | ) |
| | | | | | | | |
| | |
| NET ASSETS — 100.0% | | | | | | $ | 1,695,565,774 | |
| | | | | | | | |
Notes to Portfolio of Investments
Percentages are stated as a percent of net assets.
| (a) | Affiliated issuer. See Note 7 for a summary of transactions in the investments of affiliated issuers. |
| (b) | Non-income producing security. |
| (c) | See Note 6 for aggregate cost for federal tax purposes. |
The accompanying notes are an integral part of the financial statements.
28
MML Aggressive Allocation Fund – Portfolio of Investments
December 31, 2014
| | | | | | | | |
| | | Number of
Shares | | | Value | |
| MUTUAL FUNDS — 100.1% | |
| Equity Funds — 90.5% | |
MML Blue Chip Growth Fund, Initial Class (a) | | | 564,279 | | | $ | 9,643,533 | |
MML Equity Income Fund, Initial Class (a) | | | 458,450 | | | | 6,386,203 | |
MML Focused Equity Fund, Class II (a) | | | 366,280 | | | | 5,849,485 | |
MML Foreign Fund, Initial Class (a) | | | 453,685 | | | | 4,632,123 | |
MML Fundamental Growth Fund, Class II (a) | | | 453,726 | | | | 6,755,984 | |
MML Fundamental Value Fund, Class II (a) | | | 390,143 | | | | 6,320,318 | |
MML Global Fund, Class I (a) | | | 499,894 | | | | 6,303,665 | |
MML Income & Growth Fund, Initial Class (a) | | | 381,619 | | | | 4,747,337 | |
MML International Equity Fund, Class II (a) | | | 520,644 | | | | 4,826,368 | |
MML Large Cap Growth Fund, Initial Class (a) | | | 475,358 | | | | 6,683,540 | |
MML Managed Volatility Fund, Initial Class (a) | | | 363,799 | | | | 5,134,097 | |
MML Mid Cap Growth Fund, Initial Class (a) | | | 429,121 | | | | 7,041,872 | |
MML Mid Cap Value Fund, Initial Class (a) | | | 557,787 | | | | 7,318,165 | |
MML Small Cap Growth Equity Fund, Initial Class (a) | | | 176,916 | | | | 3,157,086 | |
MML Small Company Value Fund, Class II (a) | | | 195,361 | | | | 3,436,397 | |
MML Small/Mid Cap Value Fund, Initial Class (a) | | | 163,877 | | | | 2,407,358 | |
MML Strategic Emerging Markets Fund, Class II (a) | | | 419,279 | | | | 4,037,653 | |
Oppenheimer Discovery Mid Cap Growth Fund/VA, Non-Service Shares (a) (b) | | | 30,702 | | | | 2,419,934 | |
Oppenheimer Diversified Alternatives Fund/VA, Non-Service Shares (a) | | | 590,256 | | | | 5,926,172 | |
Oppenheimer Global Fund/VA, Non-Service Shares (a) | | | 64,709 | | | | 2,556,020 | |
Oppenheimer International Growth Fund/VA, Non-Service Shares (a) | | | 1,559,480 | | | | 3,602,398 | |
| | | | | | | | |
| | | | | | | 109,185,708 | |
| | | | | | | | |
| Fixed Income Funds — 9.6% | |
MML High Yield Fund, Class II (a) | | | 5,880 | | | | 58,680 | |
MML Inflation-Protected and Income Fund, Initial Class (a) | | | 291,882 | | | | 2,971,361 | |
MML Managed Bond Fund, Initial Class (a) | | | 333,211 | | | | 4,271,298 | |
| | | | | | | | |
| | | Number of
Shares | | | Value | |
MML Short-Duration Bond Fund, Class II (a) | | | 242,510 | | | $ | 2,386,294 | |
MML Total Return Bond Fund, Class II (a) | | | 173,768 | | | | 1,848,890 | |
Oppenheimer Global Strategic Income Fund/VA, Non-Service Shares (a) | | | 14,638 | | | | 77,581 | |
| | | | | | | | |
| | | | | | | 11,614,104 | |
| | | | | | | | |
| | |
TOTAL MUTUAL FUNDS
(Cost $110,079,860) | | | | | | | 120,799,812 | |
| | | | | | | | |
| | |
TOTAL LONG-TERM
INVESTMENTS
(Cost $110,079,860) | | | | | | | 120,799,812 | |
| | | | | | | | |
| | |
TOTAL INVESTMENTS — 100.1%
(Cost $110,079,860) (c) | | | | | | | 120,799,812 | |
| | |
| Other Assets/(Liabilities) — (0.1)% | | | | | | | (92,723 | ) |
| | | | | | | | |
| | |
| NET ASSETS — 100.0% | | | | | | $ | 120,707,089 | |
| | | | | | | | |
Notes to Portfolio of Investments
Percentages are stated as a percent of net assets.
| (a) | Affiliated issuer. See Note 7 for a summary of transactions in the investments of affiliated issuers. |
| (b) | Non-income producing security. |
| (c) | See Note 6 for aggregate cost for federal tax purposes. |
The accompanying notes are an integral part of the financial statements.
29
MML American Funds Growth Fund – Portfolio of Investments
December 31, 2014
| | | | | | | | |
| | | Number of
Shares | | | Value | |
| MUTUAL FUNDS — 100.1% | | | | | | | | |
| Equity Funds — 100.1% | | | | | | | | |
American Funds Growth Fund, Class 1 | | | 1,398,257 | | | $ | 112,070,326 | |
| | | | | | | | |
| | |
TOTAL MUTUAL FUNDS
(Cost $81,784,363) | | | | | | | 112,070,326 | |
| | | | | | | | |
| | |
TOTAL LONG-TERM INVESTMENTS (Cost $81,784,363) | | | | | | | 112,070,326 | |
| | | | | | | | |
| | |
TOTAL INVESTMENTS — 100.1%
(Cost $81,784,363) (a) | | | | | | | 112,070,326 | |
| | |
| Other Assets/(Liabilities) — (0.1)% | | | | | | | (143,801 | ) |
| | | | | | | | |
| | |
| NET ASSETS — 100.0% | | | | | | $ | 111,926,525 | |
| | | | | | | | |
Notes to Portfolio of Investments
Percentages are stated as a percent of net assets.
| (a) | See Note 6 for aggregate cost for federal tax purposes. |
The accompanying notes are an integral part of the financial statements.
30
MML American Funds International Fund – Portfolio of Investments
December 31, 2014
| | | | | | | | |
| | | Number of
Shares | | | Value | |
| MUTUAL FUNDS — 100.2% | | | | | | | | |
| Equity Funds — 100.2% | | | | | | | | |
American Funds International Fund, Class 1 | | | 2,526,749 | | | $ | 51,419,342 | |
| | | | | | | | |
| | |
TOTAL MUTUAL FUNDS
(Cost $43,644,369) | | | | | | | 51,419,342 | |
| | | | | | | | |
| | |
TOTAL LONG-TERM INVESTMENTS (Cost $43,644,369) | | | | | | | 51,419,342 | |
| | | | | | | | |
| | |
TOTAL INVESTMENTS — 100.2%
(Cost $43,644,369) (a) | | | | | | | 51,419,342 | |
| | |
| Other Assets/(Liabilities) — (0.2)% | | | | | | | (77,945 | ) |
| | | | | | | | |
| | |
| NET ASSETS — 100.0% | | | | | | $ | 51,341,397 | |
| | | | | | | | |
Notes to Portfolio of Investments
Percentages are stated as a percent of net assets.
| (a) | See Note 6 for aggregate cost for federal tax purposes. |
The accompanying notes are an integral part of the financial statements.
31
MML American Funds Core Allocation Fund – Portfolio of Investments
December 31, 2014
| | | | | | | | |
| | | Number of
Shares | | | Value | |
| MUTUAL FUNDS — 100.1% | | | | | | | | |
| Equity Funds — 65.6% | | | | | | | | |
American Funds Blue Chip Income and Growth Fund, Class 1 | | | 12,277,176 | | | $ | 180,351,722 | |
American Funds Growth-Income Fund, Class 1 | | | 3,996,404 | | | | 210,850,298 | |
American Funds International Fund, Class 1 | | | 3,240,592 | | | | 65,946,054 | |
| | | | | | | | |
| | | | | | | 457,148,074 | |
| | | | | | | | |
| Fixed Income Funds — 34.5% | | | | | | | | |
American Funds Bond Fund, Class 1 | | | 21,684,153 | | | | 240,260,415 | |
| | | | | | | | |
| | |
TOTAL MUTUAL FUNDS
(Cost $558,693,771) | | | | | | | 697,408,489 | |
| | | | | | | | |
| | |
TOTAL LONG-TERM
INVESTMENTS
(Cost $558,693,771) | | | | | | | 697,408,489 | |
| | | | | | | | |
| | |
TOTAL INVESTMENTS — 100.1%
(Cost $558,693,771) (a) | | | | | | | 697,408,489 | |
| | |
| Other Assets/(Liabilities) — (0.1)% | | | | | | | (800,726 | ) |
| | | | | | | | |
| | |
| NET ASSETS — 100.0% | | | | | | $ | 696,607,763 | |
| | | | | | | | |
Notes to Portfolio of Investments
Percentages are stated as a percent of net assets.
| (a) | See Note 6 for aggregate cost for federal tax purposes. |
The accompanying notes are an integral part of the financial statements.
32
THIS PAGE INTENTIONALLY LEFT BLANK
MML Series Investment Fund – Financial Statements
Statements of Assets and Liabilities
December 31, 2014
| | | | | | | | |
| | | MML
Conservative
Allocation
Fund | | | MML
Balanced
Allocation
Fund | |
| Assets: | | | | | | | | |
Investments, at value — unaffiliated issuers (Note 2) (a) | | $ | - | | | $ | - | |
Investments, at value — affiliated issuers (Note 2 & 7) (b) | | | 473,801,047 | | | | 598,829,444 | |
| | | | | | | | |
Total investments | | | 473,801,047 | | | | 598,829,444 | |
| | | | | | | | |
Receivables from: | | | | | | | | |
Investments sold | | | 655 | | | | 755 | |
Investment adviser (Note 3) | | | - | | | | - | |
Fund shares sold | | | 15,066 | | | | 154,492 | |
| | | | | | | | |
Total assets | | | 473,816,768 | | | | 598,984,691 | |
| | | | | | | | |
| Liabilities: | | | | | | | | |
Payables for: | | | | | | | | |
Investments purchased | | | 6,369 | | | | 144,465 | |
Fund shares repurchased | | | 7,974 | | | | 9,086 | |
Trustees’ fees and expenses (Note 3) | | | 63,775 | | | | 75,757 | |
Affiliates (Note 3): | | | | | | | | |
Investment advisory fees | | | 42,980 | | | | 53,908 | |
Administration fees | | | - | | | | - | |
Service fees | | | 215,890 | | | | 265,535 | |
Accrued expense and other liabilities | | | 32,629 | | | | 33,395 | |
| | | | | | | | |
Total liabilities | | | 369,617 | | | | 582,146 | |
| | | | | | | | |
Net assets | | $ | 473,447,151 | | | $ | 598,402,545 | |
| | | | | | | | |
| Net assets consist of: | | | | | | | | |
Paid-in capital | | $ | 412,462,033 | | | $ | 502,569,195 | |
Undistributed (accumulated) net investment income (loss) | | | 12,743,544 | | | | 15,218,288 | |
Accumulated net realized gain (loss) on investments and foreign currency transactions | | | 32,032,901 | | | | 42,673,615 | |
Net unrealized appreciation (depreciation) on investments and foreign currency translations | | | 16,208,673 | | | | 37,941,447 | |
| | | | | | | | |
Net assets | | $ | 473,447,151 | | | $ | 598,402,545 | |
| | | | | | | | |
| | | | | | | | |
(a) Cost of investments — unaffiliated issuers: | | $ | - | | | $ | - | |
(b) Cost of investments — affiliated issuers: | | $ | 457,592,374 | | | $ | 560,887,997 | |
The accompanying notes are an integral part of the financial statements.
34
| | | | | | | | | | | | | | | | | | | | | | |
MML
Moderate
Allocation
Fund | | | MML
Growth
Allocation
Fund | | | MML
Aggressive
Allocation
Fund | | | MML
American
Funds Growth
Fund | | | MML
American
Funds
International
Fund | | | MML
American
Funds Core
Allocation
Fund | |
| | | | | | | | | | | | | | | | | | | | | | |
| $ | - | | | $ | - | | | $ | - | | | $ | 112,070,326 | | | $ | 51,419,342 | | | $ | 697,408,489 | |
| | 2,258,427,316 | | | | 1,696,645,777 | | | | 120,799,812 | | | | - | | | | - | | | | - | |
| | | | | | | | | | | | | | | | | | | | | | |
| | 2,258,427,316 | | | | 1,696,645,777 | | | | 120,799,812 | | | | 112,070,326 | | | | 51,419,342 | | | | 697,408,489 | |
| | | | | | | | | | | | | | | | | | | | | | |
| | | | | | | | | | | | | | | | | | | | | | |
| | 51,260 | | | | 323,795 | | | | 9,637 | | | | 855,269 | | | | - | | | | - | |
| | - | | | | - | | | | - | | | | - | | | | 2,202 | | | | - | |
| | 1,696,389 | | | | 9,850 | | | | 78,472 | | | | 7,424 | | | | 1,451,285 | | | | 159,736 | |
| | | | | | | | | | | | | | | | | | | | | | |
| | 2,260,174,965 | | | | 1,696,979,422 | | | | 120,887,921 | | | | 112,933,019 | | | | 52,872,829 | | | | 697,568,225 | |
| | | | | | | | | | | | | | | | | | | | | | |
| | | | | | | | | | | | | | | | | | | | | | |
| | | | | | | | | | | | | | | | | | | | | | |
| | 1,015,366 | | | | - | | | | - | | | | - | | | | 1,451,127 | | | | 142,352 | |
| | 725,948 | | | | 328,817 | | | | 87,769 | | | | 862,382 | | | | 15 | | | | 15,468 | |
| | 241,688 | | | | 245,302 | | | | 14,266 | | | | 10,352 | | | | 6,247 | | | | 70,311 | |
| | | | | | | | | | | | | | | | | | | | | | |
| | 202,886 | | | | 153,313 | | | | 10,893 | | | | 15,157 | | | | 6,815 | | | | 125,063 | |
| | - | | | | - | | | | - | | | | 25,262 | | | | 11,359 | | | | 156,330 | |
| | 1,096,236 | | | | 642,268 | | | | 38,576 | | | | 68,305 | | | | 31,222 | | | | 421,010 | |
| | 45,975 | | | | 43,948 | | | | 29,328 | | | | 25,036 | | | | 24,647 | | | | 29,928 | |
| | | | | | | | | | | | | | | | | | | | | | |
| | 3,328,099 | | | | 1,413,648 | | | | 180,832 | | | | 1,006,494 | | | | 1,531,432 | | | | 960,462 | |
| | | | | | | | | | | | | | | | | | | | | | |
| $ | 2,256,846,866 | | | $ | 1,695,565,774 | | | $ | 120,707,089 | | | $ | 111,926,525 | | | $ | 51,341,397 | | | $ | 696,607,763 | |
| | | | | | | | | | | | | | | | | | | | | | |
| | | | | | | | | | | | | | | | | | | | | | |
| $ | 1,875,957,057 | | | $ | 1,252,493,777 | | | $ | 93,064,704 | | | $ | 73,471,600 | | | $ | 41,806,883 | | | $ | 528,397,600 | |
| | 33,284,754 | | | | 37,836,803 | | | | 2,408,677 | | | | 835,284 | | | | 500,927 | | | | 10,386,072 | |
| | 178,579,035 | | | | 179,841,625 | | | | 14,513,756 | | | | 7,333,678 | | | | 1,258,614 | | | | 19,109,373 | |
| | 169,026,020 | | | | 225,393,569 | | | | 10,719,952 | | | | 30,285,963 | | | | 7,774,973 | | | | 138,714,718 | |
| | | | | | | | | | | | | | | | | | | | | | |
| $ | 2,256,846,866 | | | $ | 1,695,565,774 | | | $ | 120,707,089 | | | $ | 111,926,525 | | | $ | 51,341,397 | | | $ | 696,607,763 | |
| | | | | | | | | | | | | | | | | | | | | | |
| | | | | | | | | | | | | | | | | | | | | | |
| $ | - | | | $ | - | | | $ | - | | | $ | 81,784,363 | | | $ | 43,644,369 | | | $ | 558,693,771 | |
| $ | 2,089,401,296 | | | $ | 1,471,252,208 | | | $ | 110,079,860 | | | $ | - | | | $ | - | | | $ | - | |
35
MML Series Investment Fund – Financial Statements (Continued)
Statements of Assets and Liabilities
December 31, 2014
| | | | | | | | |
| | | MML
Conservative
Allocation
Fund | | | MML
Balanced
Allocation
Fund | |
| Initial Class shares: | | | | | | | | |
Net assets | | $ | 131,213,565 | | | $ | 167,530,454 | |
| | | | | | | | |
Shares outstanding (a) | | | 11,992,896 | | | | 14,914,706 | |
| | | | | | | | |
Net asset value, offering price and redemption price per share | | $ | 10.94 | | | $ | 11.23 | |
| | | | | | | | |
| Service Class shares: | | | | | | | | |
Net assets | | $ | 342,233,586 | | | $ | 430,872,091 | |
| | | | | | | | |
Shares outstanding (a) | | | 31,530,585 | | | | 38,618,325 | |
| | | | | | | | |
Net asset value, offering price and redemption price per share | | $ | 10.85 | | | $ | 11.16 | |
| | | | | | | | |
| Service Class I shares: | | | | | | | | |
Net assets | | $ | - | | | $ | - | |
| | | | | | | | |
Shares outstanding (a) | | | - | | | | - | |
| | | | | | | | |
Net asset value, offering price and redemption price per share | | $ | - | | | $ | - | |
| | | | | | | | |
| (a) | Authorized unlimited number of shares with no par value. |
The accompanying notes are an integral part of the financial statements.
36
| | | | | | | | | | | | | | | | | | | | | | |
MML
Moderate
Allocation
Fund | | | MML
Growth
Allocation
Fund | | | MML
Aggressive
Allocation
Fund | | | MML
American
Funds Growth
Fund | | | MML
American
Funds
International
Fund | | | MML
American
Funds Core
Allocation
Fund | |
| | | | | | | | | | | | | | | | | | | | | | |
| $ | 465,943,466 | | | $ | 660,985,814 | | | $ | 57,995,712 | | | $ | - | | | $ | - | | | $ | - | |
| | | | | | | | | | | | | | | | | | | | | | |
| | 39,372,104 | | | | 58,592,837 | | | | 4,888,578 | | | | - | | | | - | | | | - | |
| | | | | | | | | | | | | | | | | | | | | | |
| $ | 11.83 | | | $ | 11.28 | | | $ | 11.86 | | | $ | - | | | $ | - | | | $ | - | |
| | | | | | | | | | | | | | | | | | | | | | |
| | | | | | | | | | | | | | | | | | | | | | |
| $ | 1,790,903,400 | | | $ | 1,034,579,960 | | | $ | 62,711,377 | | | $ | - | | | $ | - | | | $ | - | |
| | | | | | | | | | | | | | | | | | | | | | |
| | 152,538,138 | | | | 92,236,755 | | | | 5,333,215 | | | | - | | | | - | | | | - | |
| | | | | | | | | | | | | | | | | | | | | | |
| $ | 11.74 | | | $ | 11.22 | | | $ | 11.76 | | | $ | - | | | $ | - | | | $ | - | |
| | | | | | | | | | | | | | | | | | | | | | |
| | | | | | | | | | | | | | | | | | | | | | |
| $ | - | | | $ | - | | | $ | - | | | $ | 111,926,525 | | | $ | 51,341,397 | | | $ | 696,607,763 | |
| | | | | | | | | | | | | | | | | | | | | | |
| | - | | | | - | | | | - | | | | 7,627,835 | | | | 4,900,921 | | | | 54,747,833 | |
| | | | | | | | | | | | | | | | | | | | | | |
| $ | - | | | $ | - | | | $ | - | | | $ | 14.67 | | | $ | 10.48 | | | $ | 12.72 | |
| | | | | | | | | | | | | | | | | | | | | | |
37
MML Series Investment Fund – Financial Statements (Continued)
Statements of Operations
For the Year Ended December 31, 2014
| | | | | | | | |
| | | MML
Conservative
Allocation
Fund | | | MML
Balanced
Allocation
Fund | |
| Investment income (Note 2): | | | | | | | | |
Dividends — unaffiliated issuers | | $ | - | | | $ | - | |
Dividends — affiliated issuers (Note 7) | | | 11,179,242 | | | | 12,597,865 | |
| | | | | | | | |
Total investment income | | | 11,179,242 | | | | 12,597,865 | |
| | | | | | | | |
| Expenses (Note 3): | | | | | | | | |
Investment advisory fees | | | 471,815 | | | | 577,741 | |
Custody fees | | | 36,203 | | | | 36,200 | |
Audit fees | | | 29,029 | | | | 29,099 | |
Legal fees | | | 5,927 | | | | 7,232 | |
Proxy fees | | | 1,028 | | | | 1,028 | |
Shareholder reporting fees | | | 14,440 | | | | 16,779 | |
Trustees’ fees | | | 33,383 | | | | 40,874 | |
| | | | | | | | |
| | | 591,825 | | | | 708,953 | |
Administration fees: | | | | | | | | |
Service Class I | | | - | | | | - | |
Service fees: | | | | | | | | |
Service Class | | | 839,388 | | | | 1,026,054 | |
Service Class I | | | - | | | | - | |
| | | | | | | | |
Total expenses | | | 1,431,213 | | | | 1,735,007 | |
Expenses waived (Note 3): | | | | | | | | |
Service Class I fees reimbursed by adviser | | | - | | | | - | |
| | | | | | | | |
Net expenses | | | 1,431,213 | | | | 1,735,007 | |
| | | | | | | | |
Net investment income (loss) | | | 9,748,029 | | | | 10,862,858 | |
| | | | | | | | |
| Realized and unrealized gain (loss): | | | | | | | | |
Net realized gain (loss) on: | | | | | | | | |
Investment transactions — unaffiliated issuers | | | - | | | | - | |
Investment transactions — affiliated issuers (Note 7) | | | 20,718,637 | | | | 25,479,086 | |
Realized gain distributions — unaffiliated issuers | | | - | | | | - | |
Realized gain distributions — affiliated issuers (Note 7) | | | 14,757,824 | | | | 22,183,909 | |
| | | | | | | | |
Net realized gain (loss) | | | 35,476,461 | | | | 47,662,995 | |
| | | | | | | | |
Net change in unrealized appreciation (depreciation) on: | | | | | | | | |
Investment transactions — unaffiliated issuers | | | - | | | | - | |
Investment transactions — affiliated issuers | | | (22,033,023 | ) | | | (29,577,365 | ) |
| | | | | | | | |
Net change in unrealized appreciation (depreciation) | | | (22,033,023 | ) | | | (29,577,365 | ) |
| | | | | | | | |
Net realized gain (loss) and change in unrealized appreciation (depreciation) | | | 13,443,438 | | | | 18,085,630 | |
| | | | | | | | |
Net increase (decrease) in net assets resulting from operations | | $ | 23,191,467 | | | $ | 28,948,488 | |
| | | | | | | | |
The accompanying notes are an integral part of the financial statements.
38
| | | | | | | | | | | | | | | | | | | | | | |
MML
Moderate
Allocation
Fund | | | MML
Growth
Allocation
Fund | | | MML
Aggressive
Allocation
Fund | | | MML
American
Funds Growth
Fund | | | MML
American
Funds
International
Fund | | | MML
American
Funds Core
Allocation
Fund | |
| | | | | | | | | | | | | | | | | | | | | | |
| $ | - | | | $ | - | | | $ | - | | | $ | 1,555,589 | | | $ | 851,884 | | | $ | 14,840,953 | |
| | 39,923,932 | | | | 25,143,066 | | | | 1,342,988 | | | | - | | | | - | | | | - | |
| | | | | | | | | | | | | | | | | | | | | | |
| | 39,923,932 | | | | 25,143,066 | | | | 1,342,988 | | | | 1,555,589 | | | | 851,884 | | | | 14,840,953 | |
| | | | | | | | | | | | | | | | | | | | | | |
| | | | | | | | | | | | | | | | | | | | | | |
| | 2,094,718 | | | | 1,672,109 | | | | 114,610 | | | | 153,126 | | | | 74,162 | | | | 1,221,555 | |
| | 37,687 | | | | 37,474 | | | | 36,676 | | | | 1,009 | | | | 1,005 | | | | 5,523 | |
| | 30,071 | | | | 29,802 | | | | 28,802 | | | | 28,794 | | | | 28,760 | | | | 29,118 | |
| | 26,079 | | | | 20,611 | | | | 1,415 | | | | 4,873 | | | | 1,797 | | | | 24,740 | |
| | 1,028 | | | | 1,028 | | | | 1,028 | | | | 1,028 | | | | 1,028 | | | | 1,028 | |
| | 47,158 | | | | 39,596 | | | | 6,236 | | | | 6,553 | | | | 4,784 | | | | 23,414 | |
| | 147,576 | | | | 118,542 | | | | 8,111 | | | | 7,191 | | | | 3,524 | | | | 42,732 | |
| | | | | | | | | | | | | | | | | | | | | | |
| | 2,384,317 | | | | 1,919,162 | | | | 196,878 | | | | 202,574 | | | | 115,060 | | | | 1,348,110 | |
| | | | | | | | | | | | | | | | | | | | | | |
| | - | | | | - | | | | - | | | | 255,209 | | | | 123,604 | | | | 1,526,944 | |
| | | | | | | | | | | | | | | | | | | | | | |
| | 4,071,265 | | | | 2,527,003 | | | | 143,649 | | | | - | | | | - | | | | - | |
| | - | | | | - | | | | - | | | | 255,209 | | | | 123,604 | | | | 1,526,944 | |
| | | | | | | | | | | | | | | | | | | | | | |
| | 6,455,582 | | | | 4,446,165 | | | | 340,527 | | | | 712,992 | | | | 362,268 | | | | 4,401,998 | |
| | | | | | | | | | | | | | | | | | | | | | |
| | - | | | | - | | | | - | | | | - | | | | (16,178 | ) | | | - | |
| | | | | | | | | | | | | | | | | | | | | | |
| | 6,455,582 | | | | 4,446,165 | | | | 340,527 | | | | 712,992 | | | | 346,090 | | | | 4,401,998 | |
| | | | | | | | | | | | | | | | | | | | | | |
| | 33,468,350 | | | | 20,696,901 | | | | 1,002,461 | | | | 842,597 | | | | 505,794 | | | | 10,438,955 | |
| | | | | | | | | | | | | | | | | | | | | | |
| | | | | | | | | | | | | | | | | | | | | | |
| | | | | | | | | | | | | | | | | | | | | | |
| | - | | | | - | | | | - | | | | 2,457,364 | | | | 1,279,794 | | | | 10,562,532 | |
| | 86,208,629 | | | | 111,116,763 | | | | 8,660,840 | | | | - | | | | - | | | | - | |
| | - | | | | - | | | | - | | | | 4,915,270 | | | | - | | | | 8,841,475 | |
| | 94,308,291 | | | | 91,749,801 | | | | 7,514,378 | | | | - | | | | - | | | | - | |
| | | | | | | | | | | | | | | | | | | | | | |
| | 180,516,920 | | | | 202,866,564 | | | | 16,175,218 | | | | 7,372,634 | | | | 1,279,794 | | | | 19,404,007 | |
| | | | | | | | | | | | | | | | | | | | | | |
| | | | | | | | | | | | | | | | | | | | | | |
| | - | | | | - | | | | - | | | | (124,585 | ) | | | (3,343,434 | ) | | | 17,450,415 | |
| | (103,221,483 | ) | | | (131,625,524 | ) | | | (10,698,722 | ) | | | - | | | | - | | | | - | |
| | | | | | | | | | | | | | | | | | | | | | |
| | (103,221,483 | ) | | | (131,625,524 | ) | | | (10,698,722 | ) | | | (124,585 | ) | | | (3,343,434 | ) | | | 17,450,415 | |
| | | | | | | | | | | | | | | | | | | | | | |
| | 77,295,437 | | | | 71,241,040 | | | | 5,476,496 | | | | 7,248,049 | | | | (2,063,640 | ) | | | 36,854,422 | |
| | | | | | | | | | | | | | | | | | | | | | |
| $ | 110,763,787 | | | $ | 91,937,941 | | | $ | 6,478,957 | | | $ | 8,090,646 | | | $ | (1,557,846 | ) | | $ | 47,293,377 | |
| | | | | | | | | | | | | | | | | | | | | | |
39
MML Series Investment Fund – Financial Statements (Continued)
Statements of Changes in Net Assets
| | | | | | | | |
| | | MML Conservative
Allocation Fund | |
| | | Year
Ended
December 31, 2014 | | | Year
Ended
December 31, 2013 | |
| Increase (Decrease) in Net Assets: | | | | | | | | |
| Operations: | | | | | | | | |
Net investment income (loss) | | $ | 9,748,029 | | | $ | 9,226,933 | |
Net realized gain (loss) on investment transactions | | | 35,476,461 | | | | 32,161,116 | |
Net change in unrealized appreciation (depreciation) on investments | | | (22,033,023 | ) | | | 6,509,311 | |
| | | | | | | | |
Net increase (decrease) in net assets resulting from operations | | | 23,191,467 | | | | 47,897,360 | |
| | | | | | | | |
| Distributions to shareholders (Note 2): | | | | | | | | |
From net investment income: | | | | | | | | |
Initial Class | | | (3,316,678 | ) | | | (3,213,034 | ) |
Service Class | | | (7,634,184 | ) | | | (6,655,607 | ) |
| | | | | | | | |
Total distributions from net investment income | | | (10,950,862 | ) | | | (9,868,641 | ) |
| | | | | | | | |
From net realized gains: | | | | | | | | |
Initial Class | | | (8,558,756 | ) | | | (4,041,372 | ) |
Service Class | | | (21,713,529 | ) | | | (9,182,941 | ) |
| | | | | | | | |
Total distributions from net realized gains | | | (30,272,285 | ) | | | (13,224,313 | ) |
| | | | | | | | |
| Net fund share transactions (Note 5): | | | | | | | | |
Initial Class | | | (4,941,717 | ) | | | (7,746,222 | ) |
Service Class | | | 28,425,895 | | | | 14,477,597 | |
| | | | | | | | |
Increase (decrease) in net assets from fund share transactions | | | 23,484,178 | | | | 6,731,375 | |
| | | | | | | | |
Total increase (decrease) in net assets | | | 5,452,498 | | | | 31,535,781 | |
| Net assets | | | | | | | | |
Beginning of year | | | 467,994,653 | | | | 436,458,872 | |
| | | | | | | | |
End of year | | $ | 473,447,151 | | | $ | 467,994,653 | |
| | | | | | | | |
Undistributed (accumulated) net investment income (loss) included in net assets at end of year | | $ | 12,743,544 | | | $ | 10,899,637 | |
| | | | | | | | |
The accompanying notes are an integral part of the financial statements.
40
| | | | | | | | | | | | | | | | | | | | | | |
MML Balanced
Allocation Fund | | | MML Moderate
Allocation Fund | | | MML Growth
Allocation Fund | |
Year
Ended
December 31, 2014 | | | Year
Ended
December 31, 2013 | | | Year
Ended
December 31, 2014 | | | Year
Ended
December 31, 2013 | | | Year
Ended
December 31, 2014 | | | Year
Ended
December 31, 2013 | |
| | | | | | | | | | | | | | | | | | | | | | |
| | | | | | | | | | | | | | | | | | | | | | |
| $ | 10,862,858 | | | $ | 9,338,831 | | | $ | 33,468,350 | | | $ | 26,677,462 | | | $ | 20,696,901 | | | $ | 18,385,279 | |
| | 47,662,995 | | | | 38,878,556 | | | | 180,516,920 | | | | 136,236,464 | | | | 202,866,564 | | | | 147,613,606 | |
| | (29,577,365 | ) | | | 19,837,944 | | | | (103,221,483 | ) | | | 108,604,854 | | | | (131,625,524 | ) | | | 139,369,197 | |
| | | | | | | | | | | | | | | | | | | | | | |
| | 28,948,488 | | | | 68,055,331 | | | | 110,763,787 | | | | 271,518,780 | | | | 91,937,941 | | | | 305,368,082 | |
| | | | | | | | | | | | | | | | | | | | | | |
| | | | | | | | | | | | | | | | | | | | | | |
| | | | | | | | | | | | | | | | | | | | | | |
| | (3,493,205 | ) | | | (3,766,986 | ) | | | (7,789,127 | ) | | | (7,875,011 | ) | | | (10,171,624 | ) | | | (10,639,230 | ) |
| | (7,749,627 | ) | | | (7,836,450 | ) | | | (25,050,379 | ) | | | (20,807,092 | ) | | | (13,443,525 | ) | | | (13,912,409 | ) |
| | | | | | | | | | | | | | | | | | | | | | |
| | (11,242,832 | ) | | | (11,603,436 | ) | | | (32,839,506 | ) | | | (28,682,103 | ) | | | (23,615,149 | ) | | | (24,551,639 | ) |
| | | | | | | | | | | | | | | | | | | | | | |
| | | | | | | | | | | | | | | | | | | | | | |
| | (10,148,367 | ) | | | (6,913,234 | ) | | | (27,413,258 | ) | | | (18,768,313 | ) | | | (54,601,309 | ) | | | (47,916,721 | ) |
| | (25,073,115 | ) | | | (15,677,018 | ) | | | (99,204,242 | ) | | | (55,055,174 | ) | | | (84,318,527 | ) | | | (71,669,369 | ) |
| | | | | | | | | | | | | | | | | | | | | | |
| | (35,221,482 | ) | | | (22,590,252 | ) | | | (126,617,500 | ) | | | (73,823,487 | ) | | | (138,919,836 | ) | | | (119,586,090 | ) |
| | | | | | | | | | | | | | | | | | | | | | |
| | | | | | | | | | | | | | | | | | | | | | |
| | 7,872,198 | | | | 4,997,204 | | | | 9,978,414 | | | | 10,884,692 | | | | 28,647,305 | | | | 35,587,720 | |
| | 49,812,634 | | | | 58,234,913 | | | | 349,026,913 | | | | 295,859,044 | | | | 82,255,959 | | | | 72,437,592 | |
| | | | | | | | | | | | | | | | | | | | | | |
| | 57,684,832 | | | | 63,232,117 | | | | 359,005,327 | | | | 306,743,736 | | | | 110,903,264 | | | | 108,025,312 | |
| | | | | | | | | | | | | | | | | | | | | | |
| | 40,169,006 | | | | 97,093,760 | | | | 310,312,108 | | | | 475,756,926 | | | | 40,306,220 | | | | 269,255,665 | |
| | | | | | | | | | | | | | | | | | | | | | |
| | 558,233,539 | | | | 461,139,779 | | | | 1,946,534,758 | | | | 1,470,777,832 | | | | 1,655,259,554 | | | | 1,386,003,889 | |
| | | | | | | | | | | | | | | | | | | | | | |
| $ | 598,402,545 | | | $ | 558,233,539 | | | $ | 2,256,846,866 | | | $ | 1,946,534,758 | | | $ | 1,695,565,774 | | | $ | 1,655,259,554 | |
| | | | | | | | | | | | | | | | | | | | | | |
$ | 15,218,288 | | | $ | 11,182,601 | | | $ | 33,284,754 | | | $ | 32,656,853 | | | $ | 37,836,803 | | | $ | 23,412,665 | |
| | | | | | | | | | | | | | | | | | | | | | |
41
MML Series Investment Fund – Financial Statements (Continued)
Statements of Changes in Net Assets
| | | | | | | | |
| | | MML Aggressive
Allocation Fund | |
| | | Year
Ended
December 31, 2014 | | | Year
Ended
December 31, 2013 | |
| Increase (Decrease) in Net Assets: | | | | | | | | |
| Operations: | | | | | | | | |
Net investment income (loss) | | $ | 1,002,461 | | | $ | 795,032 | |
Net realized gain (loss) on investment transactions | | | 16,175,218 | | | | 10,514,177 | |
Net change in unrealized appreciation (depreciation) on investments | | | (10,698,722 | ) | | | 11,179,370 | |
| | | | | | | | |
Net increase (decrease) in net assets resulting from operations | | | 6,478,957 | | | | 22,488,579 | |
| | | | | | | | |
| Distributions to shareholders (Note 2): | | | | | | | | |
From net investment income: | | | | | | | | |
Initial Class | | | (602,090 | ) | | | (602,148 | ) |
Service Class | | | (524,093 | ) | | | (459,342 | ) |
Service Class I | | | - | | | | - | |
| | | | | | | | |
Total distributions from net investment income | | | (1,126,183 | ) | | | (1,061,490 | ) |
| | | | | | | | |
From net realized gains: | | | | | | | | |
Initial Class | | | (4,842,596 | ) | | | (2,976,552 | ) |
Service Class | | | (5,079,903 | ) | | | (2,660,137 | ) |
Service Class I | | | - | | | | - | |
| | | | | | | | |
Total distributions from net realized gains | | | (9,922,499 | ) | | | (5,636,689 | ) |
| | | | | | | | |
| Net fund share transactions (Note 5): | | | | | | | | |
Initial Class | | | 3,432,821 | | | | 2,622,873 | |
Service Class | | | 13,802,672 | | | | 9,757,387 | |
Service Class I | | | - | | | | - | |
| | | | | | | | |
Increase (decrease) in net assets from fund share transactions | | | 17,235,493 | | | | 12,380,260 | |
| | | | | | | | |
Total increase (decrease) in net assets | | | 12,665,768 | | | | 28,170,660 | |
| Net assets | | | | | | | | |
Beginning of year | | | 108,041,321 | | | | 79,870,661 | |
| | | | | | | | |
End of year | | $ | 120,707,089 | | | $ | 108,041,321 | |
| | | | | | | | |
Undistributed (accumulated) net investment income (loss) included in net assets at end of year | | $ | 2,408,677 | | | $ | 1,115,062 | |
| | | | | | | | |
The accompanying notes are an integral part of the financial statements.
42
| | | | | | | | | | | | | | | | | | | | | | |
MML American
Funds Growth Fund | | | MML American
Funds International Fund | | | MML American
Funds Core Allocation Fund | |
Year
Ended
December 31, 2014 | | | Year
Ended
December 31, 2013 | | | Year
Ended
December 31, 2014 | | | Year
Ended
December 31, 2013 | | | Year
Ended
December 31, 2014 | | | Year
Ended
December 31, 2013 | |
| | | | | | | | | | | | | | | | | | | | | | |
| | | | | | | | | | | | | | | | | | | | | | |
| $ | 842,597 | | | $ | 443,465 | | | $ | 505,794 | | | $ | 419,315 | | | $ | 10,438,955 | | | $ | 8,009,009 | |
| | 7,372,634 | | | | 3,811,961 | | | | 1,279,794 | | | | 1,621,129 | | | | 19,404,007 | | | | 18,471,200 | |
| | (124,585 | ) | | | 16,661,648 | | | | (3,343,434 | ) | | | 6,347,235 | | | | 17,450,415 | | | | 53,538,913 | |
| | | | | | | | | | | | | | | | | | | | | | |
| | 8,090,646 | | | | 20,917,074 | | | | (1,557,846 | ) | | | 8,387,679 | | | | 47,293,377 | | | | 80,019,122 | |
| | | | | | | | | | | | | | | | | | | | | | |
| | | | | | | | | | | | | | | | | | | | | | |
| | | | | | | | | | | | | | | | | | | | | | |
| | - | | | | - | | | | - | | | | - | | | | - | | | | - | |
| | - | | | | - | | | | - | | | | - | | | | - | | | | - | |
| | (446,049 | ) | | | (256,783 | ) | | | (420,622 | ) | | | (398,567 | ) | | | (6,184,753 | ) | | | (6,409,712 | ) |
| | | | | | | | | | | | | | | | | | | | | | |
| | (446,049 | ) | | | (256,783 | ) | | | (420,622 | ) | | | (398,567 | ) | | | (6,184,753 | ) | | | (6,409,712 | ) |
| | | | | | | | | | | | | | | | | | | | | | |
| | | | | | | | | | | | | | | | | | | | | | |
| | - | | | | - | | | | - | | | | - | | | | - | | | | - | |
| | - | | | | - | | | | - | | | | - | | | | - | | | | - | |
| | (3,755,899 | ) | | | (1,524,266 | ) | | | (1,619,296 | ) | | | (976,734 | ) | | | (20,183,153 | ) | | | (8,766,423 | ) |
| | | | | | | | | | | | | | | | | | | | | | |
| | (3,755,899 | ) | | | (1,524,266 | ) | | | (1,619,296 | ) | | | (976,734 | ) | | | (20,183,153 | ) | | | (8,766,423 | ) |
| | | | | | | | | | | | | | | | | | | | | | |
| | | | | | | | | | | | | | | | | | | | | | |
| | - | | | | - | | | | - | | | | - | | | | - | | | | - | |
| | - | | | | - | | | | - | | | | - | | | | - | | | | - | |
| | 13,870,736 | | | | 8,962,236 | | | | 6,484,094 | | | | 2,818,964 | | | | 125,165,626 | | | | 62,676,475 | |
| | | | | | | | | | | | | | | | | | | | | | |
| | 13,870,736 | | | | 8,962,236 | | | | 6,484,094 | | | | 2,818,964 | | | | 125,165,626 | | | | 62,676,475 | |
| | | | | | | | | | | | | | | | | | | | | | |
| | 17,759,434 | | | | 28,098,261 | | | | 2,886,330 | | | | 9,831,342 | | | | 146,091,097 | | | | 127,519,462 | |
| | | | | | | | | | | | | | | | | | | | | | |
| | 94,167,091 | | | | 66,068,830 | | | | 48,455,067 | | | | 38,623,725 | | | | 550,516,666 | | | | 422,997,204 | |
| | | | | | | | | | | | | | | | | | | | | | |
| $ | 111,926,525 | | | $ | 94,167,091 | | | $ | 51,341,397 | | | $ | 48,455,067 | | | $ | 696,607,763 | | | $ | 550,516,666 | |
| | | | | | | | | | | | | | | | | | | | | | |
$ | 835,284 | | | $ | 438,777 | | | $ | 500,927 | | | $ | 415,780 | | | $ | 10,386,072 | | | $ | 7,971,008 | |
| | | | | | | | | | | | | | | | | | | | | | |
43
MML Series Investment Fund – Financial Statements (Continued)
Financial Highlights (For a share outstanding throughout each period)
MML Conservative Allocation Fund
| | | | | | | | | | | | | | | | | | | | | | | | | | | | | | | | | | | | | | | | | | | | | | | | |
| | | | | | Income (loss) from investment
operations | | | Less distributions to shareholders | | | | | | | | | Ratios / Supplemental Data | |
| | | Net
asset
value,
beginning
of period | | | Net
investment
income
(loss)c | | | Net
realized
and
unrealized
gain (loss)
on
investments | | | Total
income
(loss) from
investment
operations | | | From net
investment
income | | | From net
realized
gains | | | Total
distributions | | | Net
asset
value,
end of
the
period | | | Total
returnm | | | Net
assets,
end of
the
period
(000’s) | | | Ratio of
expenses
to average
daily net
assetsw | | | Net
investment
income
(loss) to
average
daily net
assets | |
Initial Class | | | | | | | | | | | | | | | | | | | | | | | | | | | | | | | | | | | | | | | | | |
| 12/31/14 | | $ | 11.40 | | | $ | 0.25 | | | $ | 0.33 | | | $ | 0.58 | | | $ | (0.29 | ) | | $ | (0.75 | ) | | $ | (1.04 | ) | | $ | 10.94 | | | | 5.13% | | | $ | 131,214 | | | | 0.13% | | | | 2.22% | |
| 12/31/13 | | | 10.81 | | | | 0.25 | | | | 0.93 | | | | 1.18 | | | | (0.26 | ) | | | (0.33 | ) | | | (0.59 | ) | | | 11.40 | | | | 11.32% | | | | 141,078 | | | | 0.13% | | | | 2.19% | |
| 12/31/12 | | | 10.24 | | | | 0.25 | | | | 0.90 | | | | 1.15 | | | | (0.21 | ) | | | (0.37 | ) | | | (0.58 | ) | | | 10.81 | | | | 11.40% | | | | 140,899 | | | | 0.13% | | | | 2.29% | |
| 12/31/11 | | | 10.82 | | | | 0.21 | | | | 0.06 | | | | 0.27 | | | | (0.31 | ) | | | (0.54 | ) | | | (0.85 | ) | | | 10.24 | | | | 2.57% | | | | 113,666 | | | | 0.13% | | | | 2.00% | |
| 12/31/10 | | | 9.81 | | | | 0.32 | | | | 0.84 | | | | 1.16 | | | | (0.15 | ) | | | - | | | | (0.15 | ) | | | 10.82 | | | | 11.91% | | | | 101,461 | | | | 0.13% | | | | 3.12% | |
| Service Class | | | | | | | | | | | | | | | | | | | | | | | | | | | | | | | | | | | | | | | | | | | | | |
| 12/31/14 | | $ | 11.32 | | | $ | 0.23 | | | $ | 0.31 | | | $ | 0.54 | | | $ | (0.26 | ) | | $ | (0.75 | ) | | $ | (1.01 | ) | | $ | 10.85 | | | | 4.83% | | | $ | 342,234 | | | | 0.38% | | | | 2.01% | |
| 12/31/13 | | | 10.74 | | | | 0.22 | | | | 0.93 | | | | 1.15 | | | | (0.24 | ) | | | (0.33 | ) | | | (0.57 | ) | | | 11.32 | | | | 11.07% | | | | 326,916 | | | | 0.38% | | | | 1.96% | |
| 12/31/12 | | | 10.18 | | | | 0.22 | | | | 0.90 | | | | 1.12 | | | | (0.19 | ) | | | (0.37 | ) | | | (0.56 | ) | | | 10.74 | | | | 11.15% | | | | 295,560 | | | | 0.38% | | | | 2.05% | |
| 12/31/11 | | | 10.77 | | | | 0.19 | | | | 0.04 | | | | 0.23 | | | | (0.28 | ) | | | (0.54 | ) | | | (0.82 | ) | | | 10.18 | | | | 2.28% | | | | 231,334 | | | | 0.38% | | | | 1.75% | |
| 12/31/10 | | | 9.78 | | | | 0.29 | | | | 0.83 | | | | 1.12 | | | | (0.13 | ) | | | - | | | | (0.13 | ) | | | 10.77 | | | | 11.59% | | | | 196,487 | | | | 0.38% | | | | 2.87% | |
| | | | | | | | | | | | | | | | | | | | |
| | | Year ended December 31 | |
| | | 2014 | | | 2013 | | | 2012 | | | 2011 | | | 2010 | |
Portfolio turnover ratex | | | 33 | % | | | 33 | % | | | 18 | % | | | 20 | % | | | 44 | % |
| c | Per share amount calculated on the average shares method. |
| m | Total return does not reflect expenses that apply at the separate account level or to related insurance products. Inclusion of these charges would reduce the total return figures for all periods shown. |
| w | Expenses of the underlying funds are not included in the Fund’s expense ratio. The Fund indirectly bears its proportionate share of the expenses of any underlying fund. |
| x | Amount does not include the portfolio activity of any underlying fund. |
The accompanying notes are an integral part of the financial statements.
44
MML Series Investment Fund – Financial Statements (Continued)
Financial Highlights (For a share outstanding throughout each period)
MML Balanced Allocation Fund
| | | | | | | | | | | | | | | | | | | | | | | | | | | | | | | | | | | | | | | | | | | | | | | | |
| | | | | | Income (loss) from investment
operations | | | Less distributions to shareholders | | | | | | | | | Ratios / Supplemental Data | |
| | | Net
asset
value,
beginning
of period | | | Net
investment
income
(loss)c | | | Net
realized
and
unrealized
gain (loss)
on
investments | | | Total
income
(loss) from
investment
operations | | | From net
investment
income | | | From net
realized
gains | | | Total
distributions | | | Net
asset
value,
end of
the
period | | | Total
returnm | | | Net
assets,
end of
the
period
(000’s) | | | Ratio of
expenses
to average
daily net
assetsw | | | Net
investment
income
(loss) to
average
daily net
assets | |
Initial Class | | | | | | | | | | | | | | | | | | | | | | | | | | | | | | | | | | | | | | | | | | | | | |
12/31/14 | | $ | 11.58 | | | $ | 0.24 | | | $ | 0.38 | | | $ | 0.62 | | | $ | (0.25 | ) | | $ | (0.72 | ) | | $ | (0.97 | ) | | $ | 11.23 | | | | 5.35% | | | $ | 167,530 | | | | 0.12% | | | | 2.05% | |
| 12/31/13 | | | 10.85 | | | | 0.23 | | | | 1.29 | | | | 1.52 | | | | (0.28 | ) | | | (0.51 | ) | | | (0.79 | ) | | | 11.58 | | | | 14.49% | | | | 164,583 | | | | 0.13% | | | | 1.99% | |
| 12/31/12 | | | 10.06 | | | | 0.22 | | | | 1.01 | | | | 1.23 | | | | (0.19 | ) | | | (0.25 | ) | | | (0.44 | ) | | | 10.85 | | | | 12.40% | | | | 148,872 | | | | 0.13% | | | | 2.08% | |
| 12/31/11 | | | 10.34 | | | | 0.18 | | | | (0.00 | )d | | | 0.18 | | | | (0.27 | ) | | | (0.19 | ) | | | (0.46 | ) | | | 10.06 | | | | 1.73% | | | | 126,438 | | | | 0.13% | | | | 1.76% | |
| 12/31/10 | | | 9.31 | | | | 0.26 | | | | 0.91 | | | | 1.17 | | | | (0.14 | ) | | | - | | | | (0.14 | ) | | | 10.34 | | | | 12.73% | | | | 130,142 | | | | 0.13% | | | | 2.71% | |
Service Class | | | | | | | | | | | | | | | | | | | | | | | | | | | | | | | | | | | | | | | | | | | | | |
12/31/14 | | $ | 11.52 | | | $ | 0.21 | | | $ | 0.37 | | | $ | 0.58 | | | $ | (0.22 | ) | | $ | (0.72 | ) | | $ | (0.94 | ) | | $ | 11.16 | | | | 5.07% | | | $ | 430,872 | | | | 0.37% | | | | 1.81% | |
| 12/31/13 | | | 10.80 | | | | 0.20 | | | | 1.28 | | | | 1.48 | | | | (0.25 | ) | | | (0.51 | ) | | | (0.76 | ) | | | 11.52 | | | | 14.23% | | | | 393,650 | | | | 0.38% | | | | 1.75% | |
| 12/31/12 | | | 10.02 | | | | 0.19 | | | | 1.01 | | | | 1.20 | | | | (0.17 | ) | | | (0.25 | ) | | | (0.42 | ) | | | 10.80 | | | | 12.12% | | | | 312,268 | | | | 0.38% | | | | 1.83% | |
| 12/31/11 | | | 10.30 | | | | 0.16 | | | | 0.00 | d | | | 0.16 | | | | (0.25 | ) | | | (0.19 | ) | | | (0.44 | ) | | | 10.02 | | | | 1.54% | | | | 249,453 | | | | 0.38% | | | | 1.51% | |
| 12/31/10 | | | 9.28 | | | | 0.24 | | | | 0.91 | | | | 1.15 | | | | (0.13 | ) | | | - | | | | (0.13 | ) | | | 10.30 | | | | 12.49% | | | | 219,161 | | | | 0.38% | | | | 2.46% | |
| | | | | | | | | | | | | | | | | | | | |
| | | Year ended December 31 | |
| | | 2014 | | | 2013 | | | 2012 | | | 2011 | | | 2010 | |
Portfolio turnover ratex | | | 23 | % | | | 22 | % | | | 21 | % | | | 12 | % | | | 39 | % |
| c | Per share amount calculated on the average shares method. |
| d | Amount is less than $0.005 per share. |
| m | Total return does not reflect expenses that apply at the separate account level or to related insurance products. Inclusion of these charges would reduce the total return figures for all periods shown. |
| w | Expenses of the underlying funds are not included in the Fund’s expense ratio. The Fund indirectly bears its proportionate share of the expenses of any underlying fund. |
| x | Amount does not include the portfolio activity of any underlying fund. |
The accompanying notes are an integral part of the financial statements.
45
MML Series Investment Fund – Financial Statements (Continued)
Financial Highlights (For a share outstanding throughout each period)
MML Moderate Allocation Fund
| | | | | | | | | | | | | | | | | | | | | | | | | | | | | | | | | | | | | | | | | | | | | | | | |
| | | | | | Income (loss) from investment
operations | | | Less distributions to shareholders | | | | | | | | | Ratios / Supplemental Data | |
| | | Net
asset
value,
beginning
of period | | | Net
investment
income
(loss)c | | | Net
realized
and
unrealized
gain (loss)
on
investments | | | Total
income
(loss) from
investment
operations | | | From net
investment
income | | | From net
realized
gains | | | Total
distributions | | | Net
asset
value,
end of
the
period | | | Total
returnm | | | Net
assets,
end of
the
period
(000’s) | | | Ratio of
expenses
to average
daily net
assetsw | | | Net
investment
income
(loss) to
average
daily net
assets | |
| Initial Class | | | | | | | | | | | | | | | | | | | | | | | | | | | | | | | | | | | | | | | | | |
12/31/14 | | $ | 12.10 | | | $ | 0.21 | | | $ | 0.47 | | | $ | 0.68 | | | $ | (0.21 | ) | | $ | (0.74 | ) | | $ | (0.95 | ) | | $ | 11.83 | | | | 5.61% | | | $ | 465,943 | | | | 0.11% | | | | 1.76% | |
| 12/31/13 | | | 10.96 | | | | 0.20 | | | | 1.66 | | | | 1.86 | | | | (0.21 | ) | | | (0.51 | ) | | | (0.72 | ) | | | 12.10 | | | | 17.57% | | | | 465,692 | | | | 0.12% | | | | 1.74% | |
| 12/31/12 | | | 10.04 | | | | 0.20 | | | | 1.11 | | | | 1.31 | | | | (0.16 | ) | | | (0.23 | ) | | | (0.39 | ) | | | 10.96 | | | | 13.17% | | | | 410,035 | | | | 0.12% | | | | 1.82% | |
| 12/31/11 | | | 10.16 | | | | 0.16 | | | | (0.06 | ) | | | 0.10 | | | | (0.21 | ) | | | (0.01 | ) | | | (0.22 | ) | | | 10.04 | | | | 1.00% | | | | 365,793 | | | | 0.12% | | | | 1.55% | |
| 12/31/10 | | | 9.08 | | | | 0.22 | | | | 0.99 | | | | 1.21 | | | | (0.13 | ) | | | - | | | | (0.13 | ) | | | 10.16 | | | | 13.48% | | | | 382,041 | | | | 0.12% | | | | 2.30% | |
| Service Class | | | | | | | | | | | | | | | | | | | | | | | | | | | | | | | | | | | | | | | | | |
12/31/14 | | $ | 12.02 | | | $ | 0.19 | | | $ | 0.46 | | | $ | 0.65 | | | $ | (0.19 | ) | | $ | (0.74 | ) | | $ | (0.93 | ) | | $ | 11.74 | | | | 5.37% | | | $ | 1,790,903 | | | | 0.36% | | | | 1.55% | |
| 12/31/13 | | | 10.89 | | | | 0.18 | | | | 1.65 | | | | 1.83 | | | | (0.19 | ) | | | (0.51 | ) | | | (0.70 | ) | | | 12.02 | | | | 17.37% | | | | 1,480,843 | | | | 0.37% | | | | 1.51% | |
| 12/31/12 | | | 9.99 | | | | 0.17 | | | | 1.10 | | | | 1.27 | | | | (0.14 | ) | | | (0.23 | ) | | | (0.37 | ) | | | 10.89 | | | | 12.82% | | | | 1,060,743 | | | | 0.37% | | | | 1.60% | |
| 12/31/11 | | | 10.12 | | | | 0.13 | | | | (0.06 | ) | | | 0.07 | | | | (0.19 | ) | | | (0.01 | ) | | | (0.20 | ) | | | 9.99 | | | | 0.73% | | | | 780,302 | | | | 0.37% | | | | 1.31% | |
| 12/31/10 | | | 9.05 | | | | 0.19 | | | | 0.99 | | | | 1.18 | | | | (0.11 | ) | | | - | | | | (0.11 | ) | | | 10.12 | | | | 13.24% | | | | 622,603 | | | | 0.37% | | | | 2.07% | |
| | | | | | | | | | | | | | | | | | | | |
| | | Year ended December 31 | |
| | | 2014 | | | 2013 | | | 2012 | | | 2011 | | | 2010 | |
Portfolio turnover ratex | | | 19 | % | | | 19 | % | | | 18 | % | | | 12 | % | | | 31 | % |
| c | Per share amount calculated on the average shares method. |
| m | Total return does not reflect expenses that apply at the separate account level or to related insurance products. Inclusion of these charges would reduce the total return figures for all periods shown. |
| w | Expenses of the underlying funds are not included in the Fund’s expense ratio. The Fund indirectly bears its proportionate share of the expenses of any underlying fund. |
| x | Amount does not include the portfolio activity of any underlying fund. |
The accompanying notes are an integral part of the financial statements.
46
MML Series Investment Fund – Financial Statements (Continued)
Financial Highlights (For a share outstanding throughout each period)
MML Growth Allocation Fund
| | | | | | | | | | | | | | | | | | | | | | | | | | | | | | | | | | | | | | | | | | | | | | | | |
| | | | | | Income (loss) from investment
operations | | | Less distributions to shareholders | | | | | | | | | Ratios / Supplemental Data | |
| | | Net
asset
value,
beginning
of period | | | Net
investment
income
(loss)c | | | Net
realized
and
unrealized
gain (loss)
on
investments | | | Total
income
(loss) from
investment
operations | | | From net
investment
income | | | From net
realized
gains | | | Total
distributions | | | Net
asset
value,
end of
the
period | | | Total
returnm | | | Net assets,
end of the
period
(000’s) | | | Ratio of
expenses
to average
daily net
assetsw | | | Net
investment
income
(loss) to
average
daily net
assets | |
Initial Class | | | | | | | | | | | | | | | | | | | | | | | | | | | | | | | | | | | | | | | | | |
12/31/14 | | $ | 11.80 | | | $ | 0.16 | | | $ | 0.52 | | | $ | 0.68 | | | $ | (0.19 | ) | | $ | (1.01 | ) | | $ | (1.20 | ) | | $ | 11.28 | | | | 5.77% | | | $ | 660,986 | | | | 0.11% | | | | 1.39% | |
| 12/31/13 | | | 10.66 | | | | 0.16 | | | | 2.13 | | | | 2.29 | | | | (0.21 | ) | | | (0.94 | ) | | | (1.15 | ) | | | 11.80 | | | | 22.64% | | | | 659,823 | | | | 0.12% | | | | 1.36% | |
| 12/31/12 | | | 9.53 | | | | 0.15 | | | | 1.22 | | | | 1.37 | | | | (0.14 | ) | | | (0.10 | ) | | | (0.24 | ) | | | 10.66 | | | | 14.49% | | | | 559,044 | | | | 0.12% | | | | 1.43% | |
| 12/31/11 | | | 9.75 | | | | 0.12 | | | | (0.16 | ) | | | (0.04 | ) | | | (0.18 | ) | | | - | | | | (0.18 | ) | | | 9.53 | | | | (0.41% | ) | | | 518,216 | | | | 0.12% | | | | 1.23% | |
| 12/31/10 | | | 8.59 | | | | 0.15 | | | | 1.11 | | | | 1.26 | | | | (0.10 | ) | | | - | | | | (0.10 | ) | | | 9.75 | | | | 14.92% | | | | 538,363 | | | | 0.12% | | | | 1.68% | |
Service Class | | | | | | | | | | | | | | | | | | | | | | | | | | | | | | | | | | | | | | | | | |
12/31/14 | | $ | 11.74 | | | $ | 0.13 | | | $ | 0.52 | | | $ | 0.65 | | | $ | (0.16 | ) | | $ | (1.01 | ) | | $ | (1.17 | ) | | $ | 11.22 | | | | 5.56% | | | $ | 1,034,580 | | | | 0.36% | | | | 1.14% | |
| 12/31/13 | | | 10.62 | | | | 0.13 | | | | 2.11 | | | | 2.24 | | | | (0.18 | ) | | | (0.94 | ) | | | (1.12 | ) | | | 11.74 | | | | 22.25% | | | | 995,436 | | | | 0.37% | | | | 1.11% | |
| 12/31/12 | | | 9.49 | | | | 0.12 | | | | 1.23 | | | | 1.35 | | | | (0.12 | ) | | | (0.10 | ) | | | (0.22 | ) | | | 10.62 | | | | 14.28% | | | | 826,960 | | | | 0.37% | | | | 1.18% | |
| 12/31/11 | | | 9.71 | | | | 0.10 | | | | (0.16 | ) | | | (0.06 | ) | | | (0.16 | ) | | | - | | | | (0.16 | ) | | | 9.49 | | | | (0.63% | ) | | | 745,526 | | | | 0.37% | | | | 0.98% | |
| 12/31/10 | | | 8.57 | | | | 0.13 | | | | 1.10 | | | | 1.23 | | | | (0.09 | ) | | | - | | | | (0.09 | ) | | | 9.71 | | | | 14.54% | | | | 755,101 | | | | 0.37% | | | | 1.45% | |
| | | | | | | | | | | | | | | | | | | | |
| | | Year ended December 31 | |
| | | 2014 | | | 2013 | | | 2012 | | | 2011 | | | 2010 | |
Portfolio turnover ratex | | | 25 | % | | | 22 | % | | | 27 | % | | | 12 | % | | | 32 | % |
| c | Per share amount calculated on the average shares method. |
| m | Total return does not reflect expenses that apply at the separate account level or to related insurance products. Inclusion of these charges would reduce the total return figures for all periods shown. |
| w | Expenses of the underlying funds are not included in the Fund’s expense ratio. The Fund indirectly bears its proportionate share of the expenses of any underlying fund. |
| x | Amount does not include the portfolio activity of any underlying fund. |
The accompanying notes are an integral part of the financial statements.
47
MML Series Investment Fund – Financial Statements (Continued)
Financial Highlights (For a share outstanding throughout each period)
MML Aggressive Allocation Fund
| | | | | | | | | | | | | | | | | | | | | | | | | | | | | | | | | | | | | | | | | | | | | | | | | | | | |
| | | | | | Income (loss) from investment
operations | | | Less distributions to shareholders | | | | | | | | | Ratios / Supplemental Data | |
| | | Net
asset
value,
beginning
of period | | | Net
investment
income
(loss)c,j | | | Net
realized
and
unrealized
gain (loss)
on
investments | | | Total
income
(loss) from
investment
operations | | | From net
investment
income | | | From net
realized
gains | | | Total
distributions | | | Net
asset
value,
end of
the
period | | | Total
returnm | | | Net
assets,
end of
the
period
(000’s) | | | Ratio of
expenses
to average
daily net
assets
before
expense
waiversw | | | Ratio of
expenses
to average
daily net
assets
after
expense
waiversw,j | | | Net
investment
income
(loss) to
average
daily net
assets | |
Initial Class | | | | | | | | | | | | | | | | | | | | | | | | | | | | | | | | | | | | | | | | | | | | | | | | | | | | |
12/31/14 | | $ | 12.38 | | | $ | 0.12 | | | $ | 0.60 | | | $ | 0.72 | | | $ | (0.14 | ) | | $ | (1.10 | ) | | $ | (1.24 | ) | | $ | 11.86 | | | | 5.85% | | | $ | 57,996 | | | | 0.17% | | | | N/A | | | | 0.98% | |
| 12/31/13 | | | 10.47 | | | | 0.11 | | | | 2.65 | | | | 2.76 | | | | (0.14 | ) | | | (0.71 | ) | | | (0.85 | ) | | | 12.38 | | | | 27.39% | | | | 56,721 | | | | 0.19% | | | | 0.19% | l | | | 0.94% | |
| 12/31/12 | | | 9.12 | | | | 0.10 | | | | 1.33 | | | | 1.43 | | | | (0.08 | ) | | | - | | | | (0.08 | ) | | | 10.47 | | | | 15.73% | | | | 45,399 | | | | 0.20% | | | | 0.20% | k | | | 0.98% | |
| 12/31/11 | | | 9.40 | | | | 0.08 | | | | (0.26 | ) | | | (0.18 | ) | | | (0.10 | ) | | | - | | | | (0.10 | ) | | | 9.12 | | | | (1.86% | ) | | | 40,085 | | | | 0.19% | | | | N/A | | | | 0.81% | |
| 12/31/10 | | | 8.20 | | | | 0.09 | | | | 1.21 | | | | 1.30 | | | | (0.10 | ) | | | - | | | | (0.10 | ) | | | 9.40 | | | | 16.05% | | | | 41,787 | | | | 0.21% | | | | 0.20% | | | | 1.08% | |
Service Class | | | | | | | | | | | | | | | | | | | | | | | | | | | | | | | | | | | | | | | | | | | | | | | | | | | | |
12/31/14 | | $ | 12.29 | | | $ | 0.09 | | | $ | 0.59 | | | $ | 0.68 | | | $ | (0.11 | ) | | $ | (1.10 | ) | | $ | (1.21 | ) | | $ | 11.76 | | | | 5.61% | | | $ | 62,711 | | | | 0.42% | | | | N/A | | | | 0.77% | |
| 12/31/13 | | | 10.40 | | | | 0.08 | | | | 2.64 | | | | 2.72 | | | | (0.12 | ) | | | (0.71 | ) | | | (0.83 | ) | | | 12.29 | | | | 27.15% | | | | 51,320 | | | | 0.44% | | | | 0.44% | l | | | 0.74% | |
| 12/31/12 | | | 9.07 | | | | 0.07 | | | | 1.32 | | | | 1.39 | | | | (0.06 | ) | | | - | | | | (0.06 | ) | | | 10.40 | | | | 15.35% | | | | 34,472 | | | | 0.45% | | | | 0.45% | k | | | 0.72% | |
| 12/31/11 | | | 9.35 | | | | 0.05 | | | | (0.24 | ) | | | (0.19 | ) | | | (0.09 | ) | | | - | | | | (0.09 | ) | | | 9.07 | | | | (2.03% | ) | | | 28,803 | | | | 0.44% | | | | N/A | | | | 0.59% | |
| 12/31/10 | | | 8.16 | | | | 0.07 | | | | 1.20 | | | | 1.27 | | | | (0.08 | ) | | | - | | | | (0.08 | ) | | | 9.35 | | | | 15.83% | | | | 22,669 | | | | 0.46% | | | | 0.45% | | | | 0.86% | |
| | | | | | | | | | | | | | | | | | | | |
| | | Year ended December 31 | |
| | | 2014 | | | 2013 | | | 2012 | | | 2011 | | | 2010 | |
Portfolio turnover ratex | | | 31 | % | | | 27 | % | | | 35 | % | | | 20 | % | | | 42 | % |
| c | Per share amount calculated on the average shares method. |
| j | Computed after giving effect to an agreement by MML Advisers and/or MassMutual to waive certain fees and expenses of the Fund. |
| k | Amount waived had no impact on the ratio of expenses to average daily net assets. |
| l | Expenses incurred during the period fell under the expense cap. |
| m | Total return does not reflect expenses that apply at the separate account level or to related insurance products. Inclusion of these charges would reduce the total return figures for all periods shown. |
| w | Expenses of the underlying funds are not included in the Fund’s expense ratio. The Fund indirectly bears its proportionate share of the expenses of any underlying fund. |
| x | Amount does not include the portfolio activity of any underlying fund. |
The accompanying notes are an integral part of the financial statements.
48
MML Series Investment Fund – Financial Statements (Continued)
Financial Highlights (For a share outstanding throughout each period)
MML American Funds Growth Fund
| | | | | | | | | | | | | | | | | | | | | | | | | | | | | | | | | | | | | | | | | | | | | | | | | | | | |
| | | | | | Income (loss) from investment
operations | | | Less distributions to shareholders | | | | | | | | | Ratios / Supplemental Data | |
| | | Net
asset
value,
beginning
of period | | | Net
investment
income
(loss)c,j | | | Net
realized
and
unrealized
gain (loss)
on
investments | | | Total
income
(loss) from
investment
operations | | | From net
investment
income | | | From net
realized
gains | | | Total
distributions | | | Net
asset
value,
end of
the
period | | | Total
returnm | | | Net
assets,
end of
the
period
(000’s) | | | Ratio of
expenses
to average
daily net
assets
before
expense
waiversu | | | Ratio of
expenses
to average
daily net
assets
after
expense
waiversu,j | | | Net
investment
income
(loss) to
average
daily net
assets | |
| Service Class I | | | | | | | | | | | | | | | | | | | | | | | | | | | | | | | | | | | | | | | | | | | | | |
12/31/14 | | $ | 14.14 | | | $ | 0.12 | | | $ | 1.00 | | | $ | 1.12 | | | $ | (0.06 | ) | | $ | (0.53 | ) | | $ | (0.59 | ) | | $ | 14.67 | | | | 7.99% | | | $ | 111,927 | | | | 0.70% | | | | 0.70% | l | | | 0.83% | |
| 12/31/13 | | | 11.16 | | | | 0.07 | | | | 3.19 | | | | 3.26 | | | | (0.04 | ) | | | (0.24 | ) | | | (0.28 | ) | | | 14.14 | | | | 29.56% | | | | 94,167 | | | | 0.70% | | | | 0.70% | k | | | 0.55% | |
| 12/31/12 | | | 9.61 | | | | 0.05 | | | | 1.62 | | | | 1.67 | | | | (0.02 | ) | | | (0.10 | ) | | | (0.12 | ) | | | 11.16 | | | | 17.41% | | | | 66,069 | | | | 0.74% | | | | 0.70% | | | | 0.44% | |
| 12/31/11 | | | 10.32 | | | | 0.03 | | | | (0.51 | ) | | | (0.48 | ) | | | (0.03 | ) | | | (0.20 | ) | | | (0.23 | ) | | | 9.61 | | | | (4.74% | ) | | | 49,279 | | | | 0.77% | | | | 0.70% | | | | 0.26% | |
| 12/31/10 | | | 8.80 | | | | 0.04 | | | | 1.55 | | | | 1.59 | | | | (0.02 | ) | | | (0.05 | ) | | | (0.07 | ) | | | 10.32 | | | | 18.16% | | | | 37,761 | | | | 0.81% | | | | 0.70% | | | | 0.43% | |
| | | | | | | | | | | | | | | | | | | | |
| | | Year ended December 31 | |
| | | 2014 | | | 2013 | | | 2012 | | | 2011 | | | 2010 | |
Portfolio turnover ratex | | | 4 | % | | | 8 | % | | | 6 | % | | | 3 | % | | | 10 | % |
| c | Per share amount calculated on the average shares method. |
| j | Computed after giving effect to an agreement by MML Advisers and/or MassMutual to waive certain fees and expenses of the Fund. |
| k | Amount waived had no impact on the ratio of expenses to average daily net assets. |
| l | Expenses incurred during the period fell under the expense cap. |
| m | Total return does not reflect expenses that apply at the separate account level or to related insurance products. Inclusion of these charges would reduce the total return figures for all periods shown. |
| u | Expenses of the Master Fund are not included in the Fund’s expense ratio. The Fund indirectly bears its proportionate share of the expenses of the Master Fund. |
| x | Amount does not include the portfolio activity of the Master Fund. |
The accompanying notes are an integral part of the financial statements.
49
MML Series Investment Fund – Financial Statements (Continued)
Financial Highlights (For a share outstanding throughout each period)
MML American Funds International Fund
| | | | | | | | | | | | | | | | | | | | | | | | | | | | | | | | | | | | | | | | | | | | | | | | | | | | |
| | | | | | Income (loss) from investment
operations | | | Less distributions to shareholders | | | | | | | | | Ratios / Supplemental Data | |
| | | Net
asset
value,
beginning
of period | | | Net
investment
income
(loss)c,j | | | Net
realized
and
unrealized
gain (loss)
on
investments | | | Total
income
(loss) from
investment
operations | | | From net
investment
income | | | From net
realized
gains | | | Total
distributions | | | Net
asset
value,
end of
the
period | | | Total
returnm | | | Net
assets,
end of
the
period
(000’s) | | | Ratio of
expenses
to average
daily net
assets
before
expense
waiversu | | | Ratio of
expenses
to average
daily net
assets
after
expense
waiversu,j | | | Net
investment
income
(loss) to
average
daily net
assets | |
Service Class I | | | | | | | | | | | | | | | | | | | | | | | | | | | | | | | | | | | | | | | | | | | | | | | | | |
12/31/14 | | $ | 11.27 | | | $ | 0.11 | | | $ | (0.43 | ) | | $ | (0.32 | ) | | $ | (0.10 | ) | | $ | (0.37 | ) | | $ | (0.47 | ) | | $ | 10.48 | | | | (3.09% | ) | | $ | 51,341 | | | | 0.73% | | | | 0.70% | | | | 1.02% | |
| 12/31/13 | | | 9.62 | | | | 0.10 | | | | 1.88 | | | | 1.98 | | | | (0.10 | ) | | | (0.23 | ) | | | (0.33 | ) | | | 11.27 | | | | 21.09% | | | | 48,455 | | | | 0.74% | | | | 0.70% | | | | 0.98% | |
| 12/31/12 | | | 8.44 | | | | 0.10 | | | | 1.34 | | | | 1.44 | | | | (0.12 | ) | | | (0.14 | ) | | | (0.26 | ) | | | 9.62 | | | | 17.38% | | | | 38,624 | | | | 0.79% | | | | 0.70% | | | | 1.11% | |
| 12/31/11 | | | 10.22 | | | | 0.14 | | | | (1.60 | ) | | | (1.46 | ) | | | (0.13 | ) | | | (0.19 | ) | | | (0.32 | ) | | | 8.44 | | | | (14.36% | ) | | | 31,801 | | | | 0.81% | | | | 0.70% | | | | 1.49% | |
| 12/31/10 | | | 9.79 | | | | 0.17 | | | | 0.47 | | | | 0.64 | | | | (0.08 | ) | | | (0.13 | ) | | | (0.21 | ) | | | 10.22 | | | | 6.82% | | | | 31,337 | | | | 0.83% | | | | 0.70% | | | | 1.78% | |
| | | | | | | | | | | | | | | | | | | | |
| | | Year ended December 31 | |
| | | 2014 | | | 2013 | | | 2012 | | | 2011 | | | 2010 | |
Portfolio turnover ratex | | | 6 | % | | | 8 | % | | | 10 | % | | | 6 | % | | | 9 | % |
| c | Per share amount calculated on the average shares method. |
| j | Computed after giving effect to an agreement by MML Advisers and/or MassMutual to waive certain fees and expenses of the Fund. |
| m | Total return does not reflect expenses that apply at the separate account level or to related insurance products. Inclusion of these charges would reduce the total return figures for all periods shown. |
| u | Expenses of the Master Fund are not included in the Fund’s expense ratio. The Fund indirectly bears its proportionate share of the expenses of the Master Fund. |
| x | Amount does not include the portfolio activity of the Master Fund. |
The accompanying notes are an integral part of the financial statements.
50
MML Series Investment Fund – Financial Statements (Continued)
Financial Highlights (For a share outstanding throughout each period)
MML American Funds Core Allocation Fund
| | | | | | | | | | | | | | | | | | | | | | | | | | | | | | | | | | | | | | | | | | | | | | | | | | | | |
| | | | | | Income (loss) from investment
operations | | | Less distributions to shareholders | | | | | | | | | Ratios / Supplemental Data | |
| | | Net
asset
value,
beginning
of period | | | Net
investment
income
(loss)c,j | | | Net
realized
and
unrealized
gain (loss)
on
investments | | | Total
income
(loss) from
investment
operations | | | From net
investment
income | | | From net
realized
gains | | | Total
distributions | | | Net
asset
value,
end of
the
period | | | Total
returnm | | | Net
assets,
end of
the
period
(000’s) | | | Ratio of
expenses
to average
daily net
assets
before
expense
waiversw | | | Ratio of
expenses
to average
daily net
assets
after
expense
waiversw,j | | | Net
investment
income
(loss) to
average
daily net
assets | |
| Service Class I | | | | | | | | | | | | | | | | | | | | | | | | | | | | | | | | | | | | | | | | | | | | | |
12/31/14 | | $ | 12.28 | | | $ | 0.21 | | | $ | 0.78 | | | $ | 0.99 | | | $ | (0.13 | ) | | $ | (0.42 | ) | | $ | (0.55 | ) | | $ | 12.72 | | | | 8.05% | | | $ | 696,608 | | | | 0.72% | | | | N/A | | | | 1.71% | |
| 12/31/13 | | | 10.72 | | | | 0.19 | | | | 1.73 | | | | 1.92 | | | | (0.15 | ) | | | (0.21 | ) | | | (0.36 | ) | | | 12.28 | | | | 18.30% | | | | 550,517 | | | | 0.72% | | | | 0.72% | l | | | 1.68% | |
| 12/31/12 | | | 10.00 | | | | 0.17 | | | | 0.99 | | | | 1.16 | | | | (0.16 | ) | | | (0.28 | ) | | | (0.44 | ) | | | 10.72 | | | | 11.70% | | | | 422,997 | | | | 0.73% | | | | 0.73% | l | | | 1.63% | |
| 12/31/11 | | | 10.21 | | | | 0.18 | | | | (0.20 | ) | | | (0.02 | ) | | | (0.15 | ) | | | (0.04 | ) | | | (0.19 | ) | | | 10.00 | | | | (0.16% | ) | | | 356,240 | | | | 0.75% | | | | N/A | | | | 1.77% | |
| 12/31/10 | | | 9.56 | | | | 0.18 | | | | 0.67 | | | | 0.85 | | | | (0.13 | ) | | | (0.07 | ) | | | (0.20 | ) | | | 10.21 | | | | 9.17% | | | | 325,337 | | | | 0.76% | | | | 0.75% | | | | 1.89% | |
| | | | | | | | | | | | | | | | | | | | |
| | | Year ended December 31 | |
| | | 2014 | | | 2013 | | | 2012 | | | 2011 | | | 2010 | |
Portfolio turnover ratex | | | 3 | % | | | 8 | % | | | 8 | % | | | 13 | % | | | 3 | % |
| c | Per share amount calculated on the average shares method. |
| j | Computed after giving effect to an agreement by MML Advisers and/or MassMutual to waive certain fees and expenses of the Fund. |
| l | Expenses incurred during the period fell under the expense cap. |
| m | Total return does not reflect expenses that apply at the separate account level or to related insurance products. Inclusion of these charges would reduce the total return figures for all periods shown. |
| w | Expenses of the underlying funds are not included in the Fund’s expense ratio. The Fund indirectly bears its proportionate share of the expenses of any underlying fund. |
| x | Amount does not include the portfolio activity of any underlying fund. |
The accompanying notes are an integral part of the financial statements.
51
Notes to Financial Statements
MML Series Investment Fund (the “Trust”) is registered under the Investment Company Act of 1940, as amended (the “1940 Act”), as a no-load, open-end, management investment company. The Trust is organized under the laws of the Commonwealth of Massachusetts as a Massachusetts business trust pursuant to an Agreement and Declaration of Trust dated December 19, 1984, as restated May 14, 1993, and further amended and restated as of December 15, 2011, as it may be further amended from time to time. The following are eight series of the Trust (each individually referred to as a “Fund” or collectively as the “Funds”):
MML Conservative Allocation Fund (“Conservative Allocation Fund”)
MML Balanced Allocation Fund (“Balanced Allocation Fund”)
MML Moderate Allocation Fund (“Moderate Allocation Fund”)
MML Growth Allocation Fund (“Growth Allocation Fund”)
MML Aggressive Allocation Fund (“Aggressive Allocation Fund”)
MML American Funds® Growth Fund (“American Funds Growth Fund”)
MML American Funds® International Fund (“American Funds International Fund”)
MML American Funds® Core Allocation Fund (“American Funds Core Allocation Fund”)
The Trust makes shares of the Funds available for the investment of assets of various separate investment accounts established by Massachusetts Mutual Life Insurance Company (“MassMutual”) and by life insurance companies which are subsidiaries of MassMutual. Shares of the Trust are not offered to the general public. MassMutual, MML Bay State Life Insurance Company, and C.M. Life Insurance Company are the record owners of all of the outstanding shares of the Funds.
The Conservative Allocation Fund, Balanced Allocation Fund, Moderate Allocation Fund, Growth Allocation Fund, and Aggressive Allocation Fund (the “Allocation Funds”) invest their investable assets primarily in shares of various funds advised by MML Investment Advisers, LLC (“MML Advisers”) or its affiliate. The Allocation Funds may also invest in non-affiliated funds. The financial statements of other series of the Trust, the applicable series of the MML Series Investment Fund II (which are advised by MML Advisers), Oppenheimer Funds (which are advised by OFI Global Asset Management, Inc., a majority-owned, indirect subsidiary of Mass Mutual), and non-affiliated funds are presented separately and can be obtained from the Securities and Exchange Commission’s (“SEC”) EDGAR database on its Internet site at www.sec.gov or by calling MassMutual at 1-888-309-3539. The assets of each of the five Allocation Funds listed above are diversified and a shareholder’s interest is limited to the series of the Trust, MML Series Investment Fund II, Oppenheimer Funds, or any non-affiliated funds in which the shares are invested.
American Funds Growth Fund and American Funds International Fund (each a “Feeder Fund,” collectively the “Feeder Funds”) invest all of their assets in Class 1 shares of the Growth and International Funds, respectively, each a series of the American Funds Insurance Series (each a “Master Fund,” collectively the “Master Funds”). Each Master Fund is an open-end investment company and organized as a Massachusetts business trust. Each Feeder Fund has an investment objective that is consistent with its corresponding Master Fund. Each Master Fund intends to comply with the requirements under Subchapter M of the Internal Revenue Code applicable to mutual funds and intends to distribute substantially all of its taxable income and capital gains to shareholders, which includes the applicable Feeder Fund, to qualify as a regulated investment company. The performance of the Feeder Funds is directly affected by the performance of the Master Funds. The financial statements of the Master Funds, including the Summary Investment Portfolios, are provided separately and should be read in conjunction with the Feeder Funds’ financial statements. As of December 31, 2014, the American Funds Growth Fund and American Funds International Fund owned 0.49% and 0.67% of the Growth and International Master Funds, respectively. The American Funds Core Allocation Fund invests all of its investable assets in shares of various series of American Funds Insurance Series, which are managed by Capital Research and Management Company.
Each share class of a Fund represents an interest in the same portfolio of assets. The principal difference among the classes is the level of service and administration fees, and shareholder and distribution service expenses borne by the classes. Because each class will have different fees and expenses, performance and share prices will vary between the classes. The classes of shares are offered to different types of investors, as outlined in the Funds’ Prospectus.
52
Notes to Financial Statements (Continued)
| 2. | | Significant Accounting Policies |
The following is a summary of significant accounting policies followed consistently by each Fund in the preparation of the financial statements in conformity with accounting principles generally accepted in the United States of America (“generally accepted accounting principles”). The preparation of the financial statements in accordance with generally accepted accounting principles requires management to make estimates and assumptions that affect the reported amounts and disclosures in the financial statements. Actual results could differ from those estimates.
Investment Valuation
The net asset value of each Fund’s shares is determined once daily as of the close of regular trading on the New York Stock Exchange (“NYSE”), on each day the NYSE is open for trading (a “business day”). The NYSE normally closes at 4:00 p.m. Eastern Time, but may close earlier on some days.
The net asset value of each Fund is based upon the net asset value(s) of its corresponding Master Fund or underlying funds. Shares of the Master Fund and underlying funds are valued at their closing net asset values as reported on each business day.
Certain underlying funds or Master Funds may invest in securities that are traded principally in foreign markets and that trade on weekends and other days when the Funds do not price their shares. As a result, the value of the Funds’ portfolio securities may change on days when the prices of the Funds’ shares are not calculated. The prices of the Funds’ shares will reflect any such changes when the prices of the Funds’ shares are next calculated, which is the next business day.
The Prospectuses and Statements of Additional Information (“SAIs”) for the underlying funds or Master Funds, as applicable, explain the valuation methods for the underlying funds or Master Funds, including the circumstances under which the underlying funds or Master Funds, may use fair value pricing and the effects of doing so. Such Prospectuses and SAIs are available on the SEC EDGAR database on its Internet site at www.sec.gov.
Various inputs may be used to determine the value of the Funds’ investments. The Funds categorize the inputs to valuation techniques used to value their investments into a disclosure hierarchy consisting of three levels as summarized below. The inputs or methodology used for valuing investments are not necessarily an indication of the risk associated with investing in those investments.
Level 1 – quoted prices (unadjusted) in active markets for identical investments that the Funds can access at the measurement date
Level 2 – other significant observable inputs (including quoted prices for similar investments, interest rates, prepayment speeds, credit risk, etc.)
Level 3 – significant unobservable inputs (including the Funds’ own assumptions in determining the fair value of investments)
The Conservative Allocation Fund, Balanced Allocation Fund, Moderate Allocation Fund, Growth Allocation Fund, Aggressive Allocation Fund, American Funds Growth Fund, American Funds International Fund, and American Funds Core Allocation Fund characterized all investments at Level 1, as of December 31, 2014. For each Fund noted in the preceding sentence, the level classification by major category of investments is the same as the category presentation in the Portfolio of Investments.
The Funds had no transfers between Level 1, Level 2, and Level 3 of the fair value hierarchy during the year ended December 31, 2014. The Funds recognize transfers between the Levels as of the beginning of the year.
Accounting for Investment Transactions
Investment transactions are accounted for on the trade date. Realized gains and losses on sales of investments and unrealized appreciation and depreciation of investments are computed by the specific identification cost method. Proceeds received from litigation, if any, are included in realized gains on investment transactions for any investments that are no longer held in the portfolio and as a reduction in cost for investments that continue to be held in the portfolio. Interest income, adjusted for amortization of discounts and premiums on debt securities, is earned from the settlement date and is recorded on the accrual basis.
53
Notes to Financial Statements (Continued)
Dividend income and distributions including realized gain distributions are recorded on the ex-dividend date. Withholding taxes on foreign interest, dividends, and capital gains have been provided for in accordance with the applicable country’s tax rules and rates. Foreign dividend income is recorded on the ex-dividend date or as soon as practicable after the Fund determines the existence of a dividend declaration after exercising reasonable due diligence. Distributions received on securities that represent a return of capital or capital gain are recorded as a reduction of cost of investments and/or as a realized gain. The Funds estimate the components of distributions received that may be considered return of capital distributions or capital gain distributions.
Allocation of Operating Activity
In maintaining the records for the Funds, the income and expense accounts are allocated daily to each class of shares. Investment income and loss, and unrealized and realized gains or losses are prorated among the classes of shares based on the relative net assets of each. Expenses are allocated to each class of shares depending on the nature of the expenditures. Administration and service fees, if any, which are directly attributable to a class of shares, are charged to that class’s operations. Expenses of a Fund not directly attributable to the operations of any specific class of shares of the Fund are prorated among the classes to which the expense relates based on relative net assets.
In addition, each Fund will also incur certain fees and expenses indirectly as a shareholder in the underlying funds. Because the underlying funds have varied expense and fee levels and each Fund, except American Funds Growth Fund and American Funds International Fund, may own different proportions of underlying funds at different times, the amount of fees and expenses indirectly incurred by each Fund will vary.
Foreign Securities
Certain underlying funds or Master Funds may invest in foreign securities. Foreign securities, including American Depositary Receipts, are subject to additional risks compared to securities of U.S. issuers, including international trade, currency, political, regulatory, and diplomatic risks. In addition, fluctuations in currency exchange rates may adversely affect the values of foreign securities and the price of a Fund’s shares. Emerging markets securities are subject to greater risks than securities issued in developed foreign markets, including less liquidity, greater price volatility, higher relative rates of inflation, greater political, economic, and social instability, greater custody and operational risks, and greater volatility in currency exchange rates.
Federal Income Tax
It is each Fund’s intent to continue to comply with the provisions of subchapter M of the Internal Revenue Code of 1986, as amended (the “Code”), applicable to a regulated investment company. Under such provisions, the Funds would not be subject to federal income taxes on their ordinary income and net realized capital gains to the extent they are distributed or deemed to have been distributed to their shareholders. Therefore, the Funds have not made any provision for federal income tax.
Dividends and Distributions to Shareholders
Dividends from net investment income and distributions of any net realized capital gains of each Fund are declared and paid annually and at other times as may be required to satisfy tax or regulatory requirements.
Distributions to shareholders are recorded on the ex-dividend date. Income and capital gain distributions are determined in accordance with income tax regulations, which may differ from generally accepted accounting principles. As a result, net investment income and net realized capital gains on investment transactions for a reporting period may differ significantly from distributions during such period.
54
Notes to Financial Statements (Continued)
| 3. | | Advisory Fees and Other Transactions |
Investment Advisory Fees
MML Advisers, a wholly-owned subsidiary of MassMutual, serves as investment adviser to each Fund. Under the investment advisory agreements between MML Advisers and the Trust on behalf of each Fund, MML Advisers is responsible for providing investment management services for each Fund. In return for these services, MML Advisers receives advisory fees, based upon each Fund’s average daily net assets, at the following annual rates:
| | | | | | |
Conservative Allocation Fund | | 0.10% | | Aggressive Allocation Fund | | 0.10% |
Balanced Allocation Fund | | 0.10% | | American Funds Growth Fund | | 0.15% |
Moderate Allocation Fund | | 0.10% | | American Funds International Fund | | 0.15% |
Growth Allocation Fund | | 0.10% | | American Funds Core Allocation Fund | | 0.20% |
MassMutual served as the Funds’ investment adviser, at the same annual rates as noted above, pursuant to the investment advisory agreements through March 31, 2014.
Administration Fees
For the American Funds Growth Fund, American Funds International Fund, and American Funds Core Allocation Fund, under separate administrative and shareholder services agreements between the Funds and MML Advisers, MML Advisers is obligated to provide all necessary administrative and shareholder services and bear some of the class specific administrative expenses. In return for these services, MML Advisers receives an administrative services fee based upon the average daily net assets of the applicable class of shares of the Funds, at the following annual rates:
| | | | |
| | | Service Class I | |
American Funds Growth Fund | | | 0.25% | |
American Funds International Fund | | | 0.25% | |
American Funds Core Allocation Fund | | | 0.25% | |
MassMutual served as the Funds’ administrator, at the same annual rates as noted above, pursuant to the administrative and shareholder services agreements through March 31, 2014.
Distribution and Service Fees
MML Distributors, LLC (the “Distributor”) acts as distributor to the Funds. Pursuant to a Distribution and Services Plan adopted by the Funds pursuant to Rule 12b-1 under the 1940 Act, Service Class shares and Service Class I shares of the Funds pay an annual fee of 0.25% of the average daily net asset value of Service Class shares and Service Class I shares. This fee, or a portion thereof, is paid to: (i) the Distributor for services provided and expenses incurred by it in connection with the distribution of Service Class shares or Service Class I shares, as applicable, of each Fund; and/or (ii) MassMutual for services provided and expenses incurred by it for purposes of maintaining or providing personal services to Service Class and Service Class I shareholders. The Distributor is a wholly-owned subsidiary of MassMutual.
Expense Caps and Waivers
MML Advisers agreed to cap the fees and expenses of the Funds noted below (other than extraordinary litigation and legal expenses, Master Fund fees and expenses#, interest expense, short sale dividend and loan expense, or other non-recurring or
55
Notes to Financial Statements (Continued)
unusual expenses such as organizational expenses and shareholder meeting expenses) based upon the average daily net assets of the applicable class of shares of the Funds, as follows:
| | | | |
| | | Service Class I | |
American Funds Growth Fund* | | | 0.70% | |
American Funds International Fund* | | | 0.70% | |
| # | Master Fund fees and expenses are expenses borne indirectly by a Fund through investments in other pooled investment vehicles. |
| * | Expense caps in effect through April 30, 2015. |
Prior to April 1, 2014, expense caps were with MassMutual.
Expense caps and waiver amounts are reflected as a reduction of expenses on the Statements of Operations.
Deferred Compensation
Trustees of the Funds who are not officers or employees of MassMutual may elect to defer receipt of their annual fees in accordance with terms of a Non-Qualified Deferred Compensation Plan. Amounts deferred shall accrue interest or earnings and shall be recorded on the Funds’ books as other liabilities. Deferred compensation is included within Trustees’ fees and expenses in the Statements of Assets and Liabilities.
Other
Certain officers and trustees of the Funds are also employees of MassMutual. The compensation of each trustee who is not an employee of MassMutual is borne by the Funds.
| 4. | | Purchases and Sales of Investments |
Cost of purchases and proceeds from sales of investment securities or investments in Master Funds (excluding short-term investments) for the year ended December 31, 2014, were as follows:
| | | | | | | | | | | | | | | | |
| | | Purchases | | | Sales | |
| | | Long-Term U.S.
Government
Securities | | | Other
Long-Term
Securities | | | Long-Term U.S.
Government
Securities | | | Other
Long-Term
Securities | |
Conservative Allocation Fund | | $ | - | | | $ | 162,203,369 | | | $ | - | | | $ | 155,415,441 | |
Balanced Allocation Fund | | | - | | | | 180,321,175 | | | | - | | | | 136,012,816 | |
Moderate Allocation Fund | | | - | | | | 727,363,832 | | | | - | | | | 399,744,256 | |
Growth Allocation Fund | | | - | | | | 482,781,286 | | | | - | | | | 421,887,357 | |
Aggressive Allocation Fund | | | - | | | | 50,307,985 | | | | - | | | | 35,595,401 | |
American Funds Growth Fund | | | - | | | | 19,698,803 | | | | - | | | | 4,253,137 | |
American Funds International Fund | | | - | | | | 7,791,073 | | | | - | | | | 2,839,000 | |
American Funds Core Allocation Fund | | | - | | | | 138,971,787 | | | | - | | | | 20,734,142 | |
56
Notes to Financial Statements (Continued)
| 5. | | Capital Share Transactions |
Changes in shares outstanding for each Fund were as follows:
| | | | | | | | | | | | | | | | |
| | | Year Ended December 31, 2014 | | | Year Ended December 31, 2013 | |
| | | | |
| | | Shares | | | Amount | | | Shares | | | Amount | |
| | | | | | | | | | | | | | | | |
Conservative Allocation Fund Initial Class | | | | | | | | | | | | | | | | |
Sold | | | 2,112,131 | | | $ | 23,846,397 | | | | 1,877,823 | | | $ | 21,025,436 | |
Issued as reinvestment of dividends | | | 1,088,491 | | | | 11,875,434 | | | | 677,349 | | | | 7,254,406 | |
Redeemed | | | (3,587,170 | ) | | | (40,663,548 | ) | | | (3,212,722 | ) | | | (36,026,064 | ) |
| | | | | | | | | | | | | | | | |
Net increase (decrease) | | | (386,548 | ) | | $ | (4,941,717 | ) | | | (657,550 | ) | | $ | (7,746,222 | ) |
| | | | | | | | | | | | | | | | |
Conservative Allocation Fund Service Class | | | | | | | | | | | | | | | | |
Sold | | | 4,651,064 | | | $ | 51,932,797 | | | | 4,864,126 | | | $ | 54,092,874 | |
Issued as reinvestment of dividends | | | 2,709,853 | | | | 29,347,713 | | | | 1,488,585 | | | | 15,838,548 | |
Redeemed | | | (4,720,909 | ) | | | (52,854,615 | ) | | | (4,982,866 | ) | | | (55,453,825 | ) |
| | | | | | | | | | | | | | | | |
Net increase (decrease) | | | 2,640,008 | | | $ | 28,425,895 | | | | 1,369,845 | | | $ | 14,477,597 | |
| | | | | | | | | | | | | | | | |
Balanced Allocation Fund Initial Class | | | | | | | | | | | | | | | | |
Sold | | | 1,232,264 | | | $ | 14,334,033 | | | | 1,423,956 | | | $ | 16,210,783 | |
Issued as reinvestment of dividends | | | 1,219,086 | | | | 13,641,572 | | | | 992,586 | | | | 10,680,220 | |
Redeemed | | | (1,744,750 | ) | | | (20,103,407 | ) | | | (1,925,556 | ) | | | (21,893,799 | ) |
| | | | | | | | | | | | | | | | |
Net increase (decrease) | | | 706,600 | | | $ | 7,872,198 | | | | 490,986 | | | $ | 4,997,204 | |
| | | | | | | | | | | | | | | | |
Balanced Allocation Fund Service Class | | | | | | | | | | | | | | | | |
Sold | | | 3,947,500 | | | $ | 45,132,445 | | | | 4,950,833 | | | $ | 55,901,363 | |
Issued as reinvestment of dividends | | | 2,951,685 | | | | 32,822,742 | | | | 2,195,468 | | | | 23,513,468 | |
Redeemed | | | (2,462,441 | ) | | | (28,142,553 | ) | | | (1,881,103 | ) | | | (21,179,918 | ) |
| | | | | | | | | | | | | | | | |
Net increase (decrease) | | | 4,436,744 | | | $ | 49,812,634 | | | | 5,265,198 | | | $ | 58,234,913 | |
| | | | | | | | | | | | | | | | |
Moderate Allocation Fund Initial Class | | | | | | | | | | | | | | | | |
Sold | | | 2,320,547 | | | $ | 27,998,154 | | | | 2,873,269 | | | $ | 33,309,584 | |
Issued as reinvestment of dividends | | | 2,985,783 | | | | 35,202,385 | | | | 2,398,139 | | | | 26,643,324 | |
Redeemed | | | (4,409,998 | ) | | | (53,222,125 | ) | | | (4,218,325 | ) | | | (49,068,216 | ) |
| | | | | | | | | | | | | | | | |
Net increase (decrease) | | | 896,332 | | | $ | 9,978,414 | | | | 1,053,083 | | | $ | 10,884,692 | |
| | | | | | | | | | | | | | | | |
Moderate Allocation Fund Service Class | | | | | | | | | | | | | | | | |
Sold | | | 21,621,081 | | | $ | 259,141,484 | | | | 21,048,925 | | | $ | 244,351,216 | |
Issued as reinvestment of dividends | | | 10,610,984 | | | | 124,254,621 | | | | 6,865,364 | | | | 75,862,266 | |
Redeemed | | | (2,874,675 | ) | | | (34,369,192 | ) | | | (2,102,713 | ) | | | (24,354,438 | ) |
| | | | | | | | | | | | | | | | |
Net increase (decrease) | | | 29,357,390 | | | $ | 349,026,913 | | | | 25,811,576 | | | $ | 295,859,044 | |
| | | | | | | | | | | | | | | | |
Growth Allocation Fund Initial Class | | | | | | | | | | | | | | | | |
Sold | | | 2,037,865 | | | $ | 23,891,204 | | | | 2,205,422 | | | $ | 25,220,688 | |
Issued as reinvestment of dividends | | | 5,767,848 | | | | 64,772,933 | | | | 5,503,379 | | | | 58,555,951 | |
Redeemed | | | (5,151,777 | ) | | | (60,016,832 | ) | | | (4,194,509 | ) | | | (48,188,919 | ) |
| | | | | | | | | | | | | | | | |
Net increase (decrease) | | | 2,653,936 | | | $ | 28,647,305 | | | | 3,514,292 | | | $ | 35,587,720 | |
| | | | | | | | | | | | | | | | |
Growth Allocation Fund Service Class | | | | | | | | | | | | | | | | |
Sold | | | 3,641,064 | | | $ | 41,825,560 | | | | 3,508,324 | | | $ | 39,764,971 | |
Issued as reinvestment of dividends | | | 8,744,370 | | | | 97,762,052 | | | | 8,073,752 | | | | 85,581,778 | |
Redeemed | | | (4,961,969 | ) | | | (57,331,653 | ) | | | (4,655,264 | ) | | | (52,909,157 | ) |
| | | | | | | | | | | | | | | | |
Net increase (decrease) | | | 7,423,465 | | | $ | 82,255,959 | | | | 6,926,812 | | | $ | 72,437,592 | |
| | | | | | | | | | | | | | | | |
57
Notes to Financial Statements (Continued)
| | | | | | | | | | | | | | | | |
| | | Year Ended December 31, 2014 | | | Year Ended December 31, 2013 | |
| | | | |
| | | Shares | | | Amount | | | Shares | | | Amount | |
| | | | | | | | | | | | | | | | |
Aggressive Allocation Fund Initial Class | | | | | | | | | | | | | | | | |
Sold | | | 523,477 | | | $ | 6,383,805 | | | | 483,643 | | | $ | 5,615,320 | |
Issued as reinvestment of dividends | | | 461,023 | | | | 5,444,686 | | | | 325,632 | | | | 3,578,700 | |
Redeemed | | | (676,706 | ) | | | (8,395,670 | ) | | | (564,756 | ) | | | (6,571,147 | ) |
| | | | | | | | | | | | | | | | |
Net increase (decrease) | | | 307,794 | | | $ | 3,432,821 | | | | 244,519 | | | $ | 2,622,873 | |
| | | | | | | | | | | | | | | | |
Aggressive Allocation Fund Service Class | | | | | | | | | | | | | | | | |
Sold | | | 1,045,467 | | | $ | 12,696,529 | | | | 1,000,300 | | | $ | 11,507,602 | |
Issued as reinvestment of dividends | | | 478,157 | | | | 5,603,996 | | | | 285,667 | | | | 3,119,478 | |
Redeemed | | | (366,062 | ) | | | (4,497,853 | ) | | | (423,630 | ) | | | (4,869,693 | ) |
| | | | | | | | | | | | | | | | |
Net increase (decrease) | | | 1,157,562 | | | $ | 13,802,672 | | | | 862,337 | | | $ | 9,757,387 | |
| | | | | | | | | | | | | | | | |
American Funds Growth Fund Service Class I | | | | | | | | | | | | | | | | |
Sold | | | 1,182,031 | | | $ | 16,969,319 | | | | 1,330,363 | | | $ | 16,761,260 | |
Issued as reinvestment of dividends | | | 289,390 | | | | 4,201,948 | | | | 144,448 | | | | 1,781,049 | |
Redeemed | | | (504,045 | ) | | | (7,300,531 | ) | | | (735,381 | ) | | | (9,580,073 | ) |
| | | | | | | | | | | | | | | | |
Net increase (decrease) | | | 967,376 | | | $ | 13,870,736 | | | | 739,430 | | | $ | 8,962,236 | |
| | | | | | | | | | | | | | | | |
American Funds International Fund Service Class I | | | | | | | | | | | | | | | | |
Sold | | | 766,614 | | | $ | 8,359,495 | | | | 591,916 | | | $ | 6,139,893 | |
Issued as reinvestment of dividends | | | 184,274 | | | | 2,039,918 | | | | 140,051 | | | | 1,375,301 | |
Redeemed | | | (351,053 | ) | | | (3,915,319 | ) | | | (447,249 | ) | | | (4,696,230 | ) |
| | | | | | | | | | | | | | | | |
Net increase (decrease) | | | 599,835 | | | $ | 6,484,094 | | | | 284,718 | | | $ | 2,818,964 | |
| | | | | | | | | | | | | | | | |
American Funds Core Allocation Fund Service Class I | | | | | | | | | | | | | | | | |
Sold | | | 9,571,220 | | | $ | 120,895,852 | | | | 5,785,592 | | | $ | 67,466,530 | |
Issued as reinvestment of dividends | | | 2,087,720 | | | | 26,367,906 | | | | 1,353,803 | | | | 15,176,135 | |
Redeemed | | | (1,751,227 | ) | | | (22,098,132 | ) | | | (1,740,422 | ) | | | (19,966,190 | ) |
| | | | | | | | | | | | | | | | |
Net increase (decrease) | | | 9,907,713 | | | $ | 125,165,626 | | | | 5,398,973 | | | $ | 62,676,475 | |
| | | | | | | | | | | | | | | | |
| 6. | | Federal Income Tax Information |
At December 31, 2014, the cost of securities and the unrealized appreciation (depreciation) in the value of investments owned by the Funds, as computed on a federal income tax basis, were as follows:
| | | | | | | | | | | | | | | | |
| | | Federal Income
Tax Cost | | | Tax Basis
Unrealized
Appreciation | | | Tax Basis
Unrealized
(Depreciation) | | | Net Unrealized
Appreciation
(Depreciation) | |
Conservative Allocation Fund | | $ | 458,179,664 | | | $ | 22,642,172 | | | $ | (7,020,789 | ) | | $ | 15,621,383 | |
Balanced Allocation Fund | | | 561,075,839 | | | | 45,182,150 | | | | (7,428,545 | ) | | | 37,753,605 | |
Moderate Allocation Fund | | | 2,090,060,382 | | | | 191,975,740 | | | | (23,608,806 | ) | | | 168,366,934 | |
Growth Allocation Fund | | | 1,472,114,937 | | | | 238,807,147 | | | | (14,276,307 | ) | | | 224,530,840 | |
Aggressive Allocation Fund | | | 110,267,283 | | | | 11,903,859 | | | | (1,371,330 | ) | | | 10,532,529 | |
American Funds Growth Fund | | | 81,813,140 | | | | 30,257,186 | | | | - | | | | 30,257,186 | |
American Funds International Fund | | | 43,655,420 | | | | 7,763,922 | | | | - | | | | 7,763,922 | |
American Funds Core Allocation Fund | | | 558,988,397 | | | | 138,420,092 | | | | - | | | | 138,420,092 | |
Net capital loss carryforwards may be applied against any net realized taxable gains in succeeding years, subject to the carryforward period limitations, where applicable. On December 22, 2010, the Regulated Investment Company Modernization Act of 2010 (the “Modernization Act”) was signed by the President. The Modernization Act changed the capital loss carryforward rules
58
Notes to Financial Statements (Continued)
as they relate to regulated investment companies. Capital losses generated in tax years beginning after the date of enactment may now be carried forward indefinitely, and retain the character of the original loss. Under pre-enactment law, capital losses could be carried forward for up to eight tax years as short-term capital losses. The provisions affecting the utilization of capital loss carryforwards under the Modernization Act also require the utilization of post-enactment losses prior to the utilization of pre-enactment losses.
At December 31, 2014, for federal income tax purposes, there were no unused capital losses.
Generally accepted accounting principles in the United States of America require that only distributions in excess of tax basis earnings and profits be reported in the financial statements as a return of capital.
The tax character of distributions (including capital gain dividends, if any, designated pursuant to Section 852 of the Code) paid during the year December 31, 2014, was as follows:
| | | | | | | | | | | | |
| | | Ordinary
Income | | | Long Term
Capital Gain | | | Return of
Capital | |
Conservative Allocation Fund | | $ | 11,109,037 | | | $ | 30,114,110 | | | $ | - | |
Balanced Allocation Fund | | | 11,336,038 | | | | 35,128,276 | | | | - | |
Moderate Allocation Fund | | | 33,338,544 | | | | 126,118,462 | | | | - | |
Growth Allocation Fund | | | 23,848,590 | | | | 138,686,395 | | | | - | |
Aggressive Allocation Fund | | | 1,151,808 | | | | 9,896,874 | | | | - | |
American Funds Growth Fund | | | 446,049 | | | | 3,755,899 | | | | - | |
American Funds International Fund | | | 420,622 | | | | 1,619,296 | | | | - | |
American Funds Core Allocation Fund | | | 6,184,753 | | | | 20,183,153 | | | | - | |
The tax character of distributions (including capital gain dividends, if any, designated pursuant to Section 852 of the Code) paid during the year ended December 31, 2013, was as follows:
| | | | | | | | | | | | |
| | | Ordinary
Income | | | Long Term
Capital Gain | | | Return of
Capital | |
Conservative Allocation Fund | | $ | 9,991,892 | | | $ | 13,101,062 | | | $ | - | |
Balanced Allocation Fund | | | 11,799,523 | | | | 22,394,165 | | | | - | |
Moderate Allocation Fund | | | 29,064,823 | | | | 73,440,767 | | | | - | |
Growth Allocation Fund | | | 25,806,493 | | | | 118,331,236 | | | | - | |
Aggressive Allocation Fund | | | 1,061,490 | | | | 5,636,689 | | | | - | |
American Funds Growth Fund | | | 256,783 | | | | 1,524,266 | | | | - | |
American Funds International Fund | | | 398,567 | | | | 976,734 | | | | - | |
American Funds Core Allocation Fund | | | 6,409,712 | | | | 8,766,423 | | | | - | |
The following Fund(s) have elected to pass through the foreign tax credit for the year ended December 31, 2014, in the amount of:
| | | | |
| | | Amount | |
Conservative Allocation Fund | | $ | 216,670 | |
Balanced Allocation Fund | | | 316,430 | |
Moderate Allocation Fund | | | 1,114,739 | |
Growth Allocation Fund | | | 1,225,319 | |
Aggressive Allocation Fund | | | 87,117 | |
American Funds International Fund | | | 101,698 | |
American Funds Core Allocation Fund | | | 112,802 | |
59
Notes to Financial Statements (Continued)
Capital accounts within the financial statements are periodically adjusted for permanent differences between book and tax accounting. These adjustments have no impact on net assets or the results of operations. Temporary book and tax accounting differences will reverse in subsequent periods. At December 31, 2014, temporary book and tax accounting differences were primarily attributable to the deferral of wash sale losses and deferred Trustee compensation.
At December 31, 2014, the components of distributable earnings on a tax basis were as follows:
| | | | | | | | | | | | | | | | |
| | | Undistributed
Ordinary
Income | | | Undistributed
Long Term
Capital Gain
(Capital Loss
Carryover) | | | Other
Temporary
Differences | | | Unrealized
Appreciation
(Depreciation) | |
Conservative Allocation Fund | | $ | 13,013,617 | | | $ | 32,412,325 | | | $ | (62,207 | ) | | $ | 15,621,383 | |
Balanced Allocation Fund | | | 15,528,079 | | | | 42,625,504 | | | | (73,838 | ) | | | 37,753,605 | |
Moderate Allocation Fund | | | 52,555,824 | | | | 160,201,692 | | | | (234,641 | ) | | | 168,366,934 | |
Growth Allocation Fund | | | 38,564,596 | | | | 180,216,328 | | | | (239,767 | ) | | | 224,530,840 | |
Aggressive Allocation Fund | | | 2,510,506 | | | | 14,613,232 | | | | (13,882 | ) | | | 10,532,529 | |
American Funds Growth Fund | | | 845,291 | | | | 7,362,455 | | | | (10,007 | ) | | | 30,257,186 | |
American Funds International Fund | | | 507,010 | | | | 1,269,666 | | | | (6,084 | ) | | | 7,763,922 | |
American Funds Core Allocation Fund | | | 10,454,324 | | | | 19,403,998 | | | | (68,251 | ) | | | 138,420,092 | |
During the year ended December 31, 2014, the following amounts were reclassified due to permanent differences between book and tax accounting:
| | | | | | | | | | | | |
| | | Paid-in
Capital | | | Accumulated
Net Realized
Gain (Loss) on
Investments | | | Undistributed
Net Investment
Income (Loss) | |
Conservative Allocation Fund | | $ | 258 | | | $ | (3,046,998 | ) | | $ | 3,046,740 | |
Balanced Allocation Fund | | | 298 | | | | (4,415,959 | ) | | | 4,415,661 | |
Moderate Allocation Fund | | | 943 | | | | - | | | | (943 | ) |
Growth Allocation Fund | | | 955 | | | | (17,343,341 | ) | | | 17,342,386 | |
Aggressive Allocation Fund | | | 55 | | | | (1,417,392 | ) | | | 1,417,337 | |
American Funds Growth Fund | | | 41 | | | | - | | | | (41 | ) |
American Funds International Fund | | | 25 | | | | - | | | | (25 | ) |
American Funds Core Allocation Fund | | | 272 | | | | 1,838,866 | | | | (1,839,138 | ) |
The Funds did not have any unrecognized tax benefits at December 31, 2014, nor were there any increases or decreases in unrecognized tax benefits for the year then ended. The Funds recognize interest and penalties, if any, related to unrecognized tax benefits as an income tax expense in the Statements of Operations. During the year ended December 31, 2014, the Funds did not incur any such interest or penalties. The Funds are subject to examination by U.S. federal and state tax authorities for returns filed for the prior three fiscal years. Foreign taxes are provided for based on the Funds’ understanding of the tax rules and rates that exist in the foreign markets in which they invest.
60
Notes to Financial Statements (Continued)
| 7. | | Investment in Affiliated Issuers |
A summary of the Funds’ transactions in the securities of affiliated issuers during the year ended December 31, 2014, was as follows:
| | | | | | | | | | | | | | | | | | | | | | | | | | | | | | | | |
| | | Number of
Shares Held
as of
12/31/13 | | | Purchases | | | Sales | | | Number of
Shares Held
as of
12/31/14 | | | Value as of
12/31/14 | | | Dividend
Income | | | Realized
Gains
Distributions | | | Net
Realized
Gain (Loss) | |
Conservative Allocation Fund | | | | | | | | | | | | | | | | | | | | | | | | | | | | | |
MML Blue Chip Growth Fund, Initial Class | | | 1,200,068 | | | | 311,027 | | | | 402,627 | | | | 1,108,468 | | | $ | 18,943,716 | | | $ | - | | | $ | 2,010,343 | | | $ | 2,937,228 | |
MML Equity Income Fund, Initial Class | | | 1,761,884 | | | | 259,137 | | | | 715,209 | | | | 1,305,812 | | | | 18,189,966 | | | | 317,668 | | | | 422,162 | | | | 3,588,597 | |
MML Focused Equity Fund, Class II | | | 465,717 | | | | 126,494 | | | | 166,178 | | | | 426,033 | | | | 6,803,740 | | | | 25,888 | | | | 629,033 | | | | 736,189 | |
MML Foreign Fund, Initial Class | | | 1,232,334 | | | | 129,390 | | | | 681,610 | | | | 680,114 | | | | 6,943,962 | | | | 167,991 | | | | - | | | | 1,686,609 | |
MML Fundamental Growth Fund, Class II | | | 1,005,911 | | | | 203,363 | | | | 346,759 | | | | 862,515 | | | | 12,842,846 | | | | 94,693 | | | | 896,033 | | | | 1,182,927 | |
MML Fundamental Value Fund, Class II | | | 1,234,468 | | | | 238,025 | | | | 420,890 | | | | 1,051,603 | | | | 17,035,968 | | | | 272,337 | | | | 783,754 | | | | 1,806,259 | |
MML Global Fund, Class I | | | 770,262 | | | | 212,517 | | | | 229,074 | | | | 753,705 | | | | 9,504,222 | | | | 83,683 | | | | 165,407 | | | | 967,017 | |
MML High Yield Fund, Class II | | | 2,015,699 | | | | 597,816 | | | | 757,497 | | | | 1,856,018 | | | | 18,523,062 | | | | 1,401,264 | | | | 893,681 | | | | 437,367 | |
MML Income & Growth Fund, Initial Class | | | 1,124,632 | | | | 161,059 | | | | 435,718 | | | | 849,973 | | | | 10,573,659 | | | | 200,708 | | | | - | | | | 1,232,131 | |
MML Inflation-Protected and Income Fund, Initial Class | | | 647,031 | | | | 1,347,736 | | | | 160,836 | | | | 1,833,931 | | | | 18,669,413 | | | | 248,362 | | | | 154,085 | | | | (118,051 | ) |
MML International Equity Fund, Class II | | | - | | | | 865,433 | | | | 84,289 | | | | 781,144 | | | | 7,241,205 | | | | 155,832 | | | | 42,730 | | | | (17,510 | ) |
MML Large Cap Growth Fund, Initial Class | | | 929,110 | | | | 284,860 | | | | 303,319 | | | | 910,651 | | | | 12,803,753 | | | | - | | | | 1,707,505 | | | | 1,325,709 | |
MML Managed Bond Fund, Initial Class | | | 9,679,060 | | | | 2,566,482 | | | | 2,154,514 | | | | 10,091,028 | | | | 129,352,967 | | | | 4,001,670 | | | | - | | | | 108,052 | |
MML Managed Volatility Fund, Initial Class | | | - | | | | 680,349 | | | | 32,750 | | | | 647,599 | | | | 9,139,198 | | | | 66,323 | | | | 470,636 | | | | (546 | ) |
MML Mid Cap Growth Fund, Initial Class | | | 520,735 | | | | 124,098 | | | | 155,048 | | | | 489,785 | | | | 8,037,373 | | | | - | | | | 1,059,611 | | | | 626,014 | |
MML Mid Cap Value Fund, Initial Class | | | 807,112 | | | | 281,494 | | | | 288,990 | | | | 799,616 | | | | 10,490,956 | | | | 171,650 | | | | 1,785,204 | | | | 1,065,783 | |
MML Short-Duration Bond Fund, Class II | | | 3,242,222 | | | | 448,265 | | | | 1,372,482 | | | | 2,318,005 | | | | 22,809,169 | | | | 683,269 | | | | 4,157 | | | | (344,854 | ) |
MML Small Cap Growth Equity Fund, Initial Class | | | 216,757 | | | | 96,311 | | | | 74,416 | | | | 238,652 | | | | 4,258,764 | | | | - | | | | 1,154,605 | | | | 400,569 | |
MML Small Company Value Fund, Class II | | | 262,293 | | | | 127,073 | | | | 71,827 | | | | 317,539 | | | | 5,585,509 | | | | - | | | | 1,519,904 | | | | 381,837 | |
MML Small/Mid Cap Value Fund, Initial Class | | | 309,760 | | | | 73,038 | | | | 148,047 | | | | 234,751 | | | | 3,448,496 | | | | 22,220 | | | | 77,655 | | | | 121,657 | |
MML Total Return Bond Fund, Class II | | | 6,089,758 | | | | 1,183,811 | | | | 1,520,812 | | | | 5,752,757 | | | | 61,209,333 | | | | 1,104,371 | | | | - | | | | 844,648 | |
Oppenheimer Discovery Mid Cap Growth Fund/VA, Non-Service Shares* | | | 46,584 | | | | 9,706 | | | | 20,460 | | | | 35,830 | | | | 2,824,096 | | | | - | | | | - | | | | 87,666 | |
Oppenheimer Diversified Alternatives Fund/VA, Non-Service Shares* | | | - | | | | 2,359,705 | | | | - | | | | 2,359,705 | | | | 23,691,434 | | | | 598,639 | | | | 476,960 | | | | - | |
Oppenheimer Global Fund/VA, Non-Service Shares* | | | 166,364 | | | | 71,685 | | | | 57,319 | | | | 180,730 | | | | 7,138,827 | | | | 85,805 | | | | 350,061 | | | | 680,637 | |
Oppenheimer Global Strategic Income Fund/VA, Non-Service Shares* | | | 6,028,823 | | | | 987,682 | | | | 3,103,539 | | | | 3,912,966 | | | | 20,738,721 | | | | 1,389,201 | | | | - | | | | (90,574 | ) |
Oppenheimer International Growth Fund/VA, Non-Service Shares* | | | 4,065,690 | | | | 600,568 | | | | 1,635,655 | | | | 3,030,603 | | | | 7,000,692 | | | | 87,668 | | | | 154,298 | | | | 1,073,276 | |
| | | | | | | | | | | | | | | | | | | | | | | | | | | | | | | | |
| | | | | | | | | | | | | | | | | | $ | 473,801,047 | | | $ | 11,179,242 | | | $ | 14,757,824 | | | $ | 20,718,637 | |
| | | | | | | | | | | | | | | | | | | | | | | | | | | | | | | | |
Balanced Allocation Fund | | | | | | | | | | | | | | | | | | | | | | | | | | | | | |
MML Blue Chip Growth Fund, Initial Class | | | 1,764,175 | | | | 334,405 | | | | 426,216 | | | | 1,672,364 | | | $ | 28,580,702 | | | $ | - | | | $ | 2,937,839 | | | $ | 3,162,278 | |
MML Equity Income Fund, Initial Class | | | 2,300,487 | | | | 246,050 | | | | 784,616 | | | | 1,761,921 | | | | 24,543,554 | | | | 416,093 | | | | 552,958 | | | | 3,717,515 | |
MML Focused Equity Fund, Class II | | | 829,418 | | | | 162,268 | | | | 212,403 | | | | 779,283 | | | | 12,445,146 | | | | 46,977 | | | | 1,141,439 | | | | 972,516 | |
MML Foreign Fund, Initial Class | | | 1,687,201 | | | | 156,875 | | | | 659,592 | | | | 1,184,484 | | | | 12,093,578 | | | | 286,392 | | | | - | | | | 1,777,892 | |
MML Fundamental Growth Fund, Class II | | | 1,492,258 | | | | 224,398 | | | | 431,405 | | | | 1,285,251 | | | | 19,137,382 | | | | 137,268 | | | | 1,298,910 | | | | 1,469,301 | |
MML Fundamental Value Fund, Class II | | | 1,633,306 | | | | 229,465 | | | | 407,078 | | | | 1,455,693 | | | | 23,582,231 | | | | 362,465 | | | | 1,043,132 | | | | 2,024,662 | |
MML Global Fund, Class I | | | 1,106,976 | | | | 254,908 | | | | 242,115 | | | | 1,119,769 | | | | 14,120,291 | | | | 123,387 | | | | 243,886 | | | | 1,240,739 | |
MML High Yield Fund, Class II | | | 2,013,574 | | | | 544,488 | | | | 548,554 | | | | 2,009,508 | | | | 20,054,889 | | | | 1,474,090 | | | | 913,326 | | | | 454,701 | |
MML Income & Growth Fund, Initial Class | | | 1,495,942 | | | | 337,468 | | | | 367,366 | | | | 1,466,044 | | | | 18,237,588 | | | | 338,778 | | | | - | | | | 1,165,824 | |
MML Inflation-Protected and Income Fund, Initial Class | | | 766,407 | | | | 1,327,152 | | | | 66,513 | | | | 2,027,046 | | | | 20,635,323 | | | | 291,263 | | | | 188,232 | | | | (31,347 | ) |
MML International Equity Fund, Class II | | | - | | | | 1,429,226 | | | | 64,052 | | | | 1,365,174 | | | | 12,655,163 | | | | 271,146 | | | | 74,352 | | | | (11,932 | ) |
MML Large Cap Growth Fund, Initial Class | | | 1,413,738 | | | | 301,000 | | | | 364,298 | | | | 1,350,440 | | | | 18,987,191 | | | | - | | | | 2,448,327 | | | | 2,057,088 | |
61
Notes to Financial Statements (Continued)
| | | | | | | | | | | | | | | | | | | | | | | | | | | | | | | | |
| | | Number of
Shares Held
as of
12/31/13 | | | Purchases | | | Sales | | | Number of
Shares Held
as of
12/31/14 | | | Value as of
12/31/14 | | | Dividend
Income | | | Realized
Gains
Distributions | | | Net
Realized
Gain (Loss) | |
Balanced Allocation Fund (Continued) | | | | | | | | | | | | | | | | | | | | | | | | | | | | | |
MML Managed Bond Fund, Initial Class | | | 9,657,265 | | | | 2,267,491 | | | | 1,286,480 | | | | 10,638,276 | | | $ | 136,367,920 | | | $ | 4,122,185 | | | $ | - | | | $ | 448,341 | |
MML Managed Volatility Fund, Initial Class | | | - | | | | 1,037,801 | | | | 37,520 | | | | 1,000,281 | | | | 14,116,406 | | | | 101,372 | | | | 719,351 | | | | 769 | |
MML Mid Cap Growth Fund, Initial Class | | | 981,679 | | | | 197,679 | | | | 190,019 | | | | 989,339 | | | | 16,235,051 | | | | - | | | | 2,062,956 | | | | 1,421,927 | |
MML Mid Cap Value Fund, Initial Class | | | 1,271,836 | | | | 380,287 | | | | 326,566 | | | | 1,325,557 | | | | 17,391,308 | | | | 278,045 | | | | 2,891,741 | | | | 1,538,857 | |
MML Short-Duration Bond Fund, Class II | | | 2,850,835 | | | | 530,237 | | | | 866,740 | | | | 2,514,332 | | | | 24,741,022 | | | | 668,227 | | | | 3,780 | | | | (129,155 | ) |
MML Small Cap Growth Equity Fund, Initial Class | | | 344,730 | | | | 144,014 | | | | 80,087 | | | | 408,657 | | | | 7,292,521 | | | | - | | | | 1,930,123 | | | | 348,388 | |
MML Small Company Value Fund, Class II | | | 359,725 | | | | 163,760 | | | | 60,986 | | | | 462,499 | | | | 8,135,359 | | | | - | | | | 2,159,173 | | | | 310,975 | |
MML Small/Mid Cap Value Fund, Initial Class | | | 488,772 | | | | 78,747 | | | | 156,780 | | | | 410,739 | | | | 6,033,755 | | | | 38,003 | | | | 132,812 | | | | 129,307 | |
MML Total Return Bond Fund, Class II | | | 6,089,257 | | | | 870,620 | | | | 1,049,058 | | | | 5,910,819 | | | | 62,891,117 | | | | 1,152,165 | | | | - | | | | 425,064 | |
Oppenheimer Discovery Mid Cap Growth Fund/VA, Non-Service Shares* | | | 81,709 | | | | 10,983 | | | | 22,398 | | | | 70,294 | | | | 5,540,576 | | | | - | | | | - | | | | 93,804 | |
Oppenheimer Diversified Alternatives Fund/VA, Non-Service Shares* | | | - | | | | 2,919,619 | | | | - | | | | 2,919,619 | | | | 29,312,979 | | | | 740,685 | | | | 590,133 | | | | - | |
Oppenheimer Global Fund/VA, Non-Service Shares* | | | 294,771 | | | | 83,081 | | | | 70,270 | | | | 307,582 | | | | 12,149,471 | | | | 144,697 | | | | 590,330 | | | | 1,012,354 | |
Oppenheimer Global Strategic Income Fund/VA, Non-Service Shares* | | | 6,130,687 | | | | 813,542 | | | | 2,944,580 | | | | 3,999,649 | | | | 21,198,140 | | | | 1,456,272 | | | | - | | | | 161,710 | |
Oppenheimer International Growth Fund/VA, Non-Service Shares* | | | 6,598,581 | | | | 814,059 | | | | 2,065,982 | | | | 5,346,658 | | | | 12,350,781 | | | | 148,355 | | | | 261,109 | | | | 1,717,508 | |
| | | | | | | | | | | | | | | | | | | | | | | | | | | | | | | | |
| | | | | | | | | | | | | | | | | | $ | 598,829,444 | | | $ | 12,597,865 | | | $ | 22,183,909 | | | $ | 25,479,086 | |
| | | | | | | | | | | | | | | | | | | | | | | | | | | | | | | | |
Moderate Allocation Fund | | | | | | | | | | | | | | | | | | | | | | | | | | | | | | | | |
MML Blue Chip Growth Fund, Initial Class | | | 7,864,096 | | | | 1,608,642 | | | | 2,003,224 | | | | 7,469,514 | | | $ | 127,653,987 | | | $ | - | | | $ | 12,478,895 | | | $ | 14,926,157 | |
MML Equity Income Fund, Initial Class | | | 8,232,222 | | | | 1,117,618 | | | | 2,658,993 | | | | 6,690,847 | | | | 93,203,501 | | | | 1,504,619 | | | | 1,999,533 | | | | 12,686,991 | |
MML Focused Equity Fund, Class II | | | 3,965,145 | | | | 928,851 | | | | 844,168 | | | | 4,049,828 | | | | 64,675,751 | | | | 232,411 | | | | 5,647,146 | | | | 3,917,382 | |
MML Foreign Fund, Initial Class | | | 6,211,723 | | | | 692,073 | | | | 2,283,837 | | | | 4,619,959 | | | | 47,169,786 | | | | 1,082,347 | | | | - | | | | 5,557,323 | |
MML Fundamental Growth Fund, Class II | | | 6,410,859 | | | | 1,163,467 | | | | 1,734,037 | | | | 5,840,289 | | | | 86,961,897 | | | | 593,822 | | | | 5,619,073 | | | | 6,054,076 | |
MML Fundamental Value Fund, Class II | | | 5,962,751 | | | | 1,144,548 | | | | 1,354,108 | | | | 5,753,191 | | | | 93,201,695 | | | | 1,360,228 | | | | 3,914,578 | | | | 7,856,002 | |
MML Global Fund, Class I | | | 4,561,714 | | | | 3,097,838 | | | | 406,370 | | | | 7,253,182 | | | | 91,462,624 | | | | 738,934 | | | | 1,460,575 | | | | 2,452,693 | |
MML High Yield Fund, Class II | | | 5,119,036 | | | | 1,761,583 | | | | 798,827 | | | | 6,081,792 | | | | 60,696,286 | | | | 4,272,131 | | | | 2,370,065 | | | | 380,533 | |
MML Income & Growth Fund, Initial Class | | | 6,145,840 | | | | 1,022,750 | | | | 966,644 | | | | 6,201,946 | | | | 77,152,210 | | | | 1,360,037 | | | | - | | | | 3,302,724 | |
MML Inflation-Protected and Income Fund, Initial Class | | | 2,176,272 | | | | 4,478,165 | | | | 99,362 | | | | 6,555,075 | | | | 66,730,667 | | | | 793,320 | | | | 543,555 | | | | (44,192 | ) |
MML International Equity Fund, Class II | | | - | | | | 5,379,958 | | | | 79,029 | | | | 5,300,929 | | | | 49,139,616 | | | | 1,051,656 | | | | 288,373 | | | | (2,326 | ) |
MML Large Cap Growth Fund, Initial Class | | | 5,894,225 | | | | 1,483,354 | | | | 1,239,914 | | | | 6,137,665 | | | | 86,295,575 | | | | - | | | | 10,588,763 | | | | 6,635,852 | |
MML Managed Bond Fund, Initial Class | | | 26,775,331 | | | | 7,360,737 | | | | 1,545,872 | | | | 32,590,196 | | | | 417,761,045 | | | | 11,946,836 | | | | - | | | | 745,078 | |
MML Managed Volatility Fund, Initial Class | | | - | | | | 4,503,232 | | | | - | | | | 4,503,232 | | | | 63,551,599 | | | | 428,790 | | | | 3,042,754 | | | | - | |
MML Mid Cap Growth Fund, Initial Class | | | 4,128,578 | | | | 991,723 | | | | 485,262 | | | | 4,635,039 | | | | 76,060,991 | | | | - | | | | 9,184,380 | | | | 4,279,191 | |
MML Mid Cap Value Fund, Initial Class | | | 5,340,970 | | | | 1,928,612 | | | | 964,104 | | | | 6,305,478 | | | | 82,727,872 | | | | 1,254,497 | | | | 13,047,114 | | | | 4,720,710 | |
MML Short-Duration Bond Fund, Class II | | | 8,828,468 | | | | 1,131,856 | | | | 2,333,183 | | | | 7,627,141 | | | | 75,051,065 | | | | 1,941,925 | | | | 11,051 | | | | (195,858 | ) |
MML Small Cap Growth Equity Fund, Initial Class | | | 1,431,401 | | | | 717,005 | | | | 277,419 | | | | 1,870,987 | | | | 33,387,901 | | | | - | | | | 8,455,030 | | | | 1,547,451 | |
MML Small Company Value Fund, Class II | | | 1,637,535 | | | | 939,528 | | | | 245,314 | | | | 2,331,749 | | | | 41,015,467 | | | | - | | | | 10,320,842 | | | | 1,641,455 | |
MML Small/Mid Cap Value Fund, Initial Class | | | 2,028,805 | | | | 466,386 | | | | 630,791 | | | | 1,864,400 | | | | 27,388,043 | | | | 165,149 | | | | 577,161 | | | | 428,758 | |
MML Strategic Emerging Markets Fund, Class II | | | 3,833,690 | | | | 920,500 | | | | 739,890 | | | | 4,014,300 | | | | 38,657,713 | | | | 126,525 | | | | - | | | | 60,590 | |
MML Total Return Bond Fund, Class II | | | 17,335,633 | | | | 2,852,162 | | | | 2,366,410 | | | | 17,821,385 | | | | 189,619,536 | | | | 3,335,495 | | | | - | | | | 1,005,797 | |
Oppenheimer Discovery Mid Cap Growth Fund/VA, Non-Service Shares* | | | 341,296 | | | | 66,282 | | | | 87,800 | | | | 319,778 | | | | 25,204,881 | | | | - | | | | - | | | | 226,946 | |
Oppenheimer Diversified Alternatives Fund/VA, Non-Service Shares* | | | - | | | | 10,946,823 | | | | - | | | | 10,946,823 | | | | 109,906,099 | | | | 2,784,038 | | | | 2,212,648 | | | | - | |
Oppenheimer Global Fund/VA, Non-Service Shares* | | | 913,555 | | | | 208,934 | | | | 85,227 | | | | 1,037,262 | | | | 40,971,851 | | | | 419,191 | | | | 1,710,191 | | | | 1,181,603 | |
62
Notes to Financial Statements (Continued)
| | | | | | | | | | | | | | | | | | | | | | | | | | | | | | | | |
| | | Number of
Shares Held
as of
12/31/13 | | | Purchases | | | Sales | | | Number of
Shares Held
as of
12/31/14 | | | Value as of
12/31/14 | | | Dividend
Income | | | Realized
Gains
Distributions | | | Net
Realized
Gain (Loss) | |
Moderate Allocation Fund (Continued) | | | | | | | | | | | | | | | | | | | | | |
Oppenheimer Global Strategic Income Fund/VA, Non-Service Shares* | | | 16,398,569 | | | | 2,800,834 | | | | 9,476,000 | | | | 9,723,403 | | | $ | 51,534,038 | | | $ | 4,056,667 | | | $ | - | | | $ | 29,275 | |
Oppenheimer International Growth Fund/VA, Non-Service Shares* | | | 23,076,913 | | | | 3,430,688 | | | | 8,652,354 | | | | 17,855,247 | | | | 41,245,620 | | | | 475,314 | | | | 836,564 | | | | 6,814,418 | |
| | | | | | | | | | | | | | | | | | | | | | | | | | | | | | | | |
| | | | | | | | | | | | | | | | | | $ | 2,258,427,316 | | | $ | 39,923,932 | | | $ | 94,308,291 | | | $ | 86,208,629 | |
| | | | | | | | | | | | | | | | | | | | | | | | | | | | | | | | |
Growth Allocation Fund | | | | | | | | | | | | | | | | | | | | | | | | | | | | | | | | |
MML Blue Chip Growth Fund, Initial Class | | | 8,448,654 | | | | 935,620 | | | | 2,440,771 | | | | 6,943,503 | | | $ | 118,664,463 | | | $ | - | | | $ | 11,978,641 | | | $ | 19,820,201 | |
MML Equity Income Fund, Initial Class | | | 8,005,407 | | | | 425,420 | | | | 2,683,776 | | | | 5,747,051 | | | | 80,056,417 | | | | 1,345,658 | | | | 1,788,288 | | | | 13,947,833 | |
MML Focused Equity Fund, Class II | | | 4,995,149 | | | | 612,911 | | | | 1,197,152 | | | | 4,410,908 | | | | 70,442,195 | | | | 263,127 | | | | 6,393,501 | | | | 5,568,440 | |
MML Foreign Fund, Initial Class | | | 6,116,223 | | | | 414,817 | | | | 1,828,417 | | | | 4,702,623 | | | | 48,013,777 | | | | 1,139,028 | | | | - | | | | 3,901,024 | |
MML Fundamental Growth Fund, Class II | | | 6,934,028 | | | | 599,630 | | | | 2,071,324 | | | | 5,462,334 | | | | 81,334,158 | | | | 573,153 | | | | 5,423,490 | | | | 7,135,223 | |
MML Fundamental Value Fund, Class II | | | 5,840,249 | | | | 484,279 | | | | 1,414,898 | | | | 4,909,630 | | | | 79,536,008 | | | | 1,203,364 | | | | 3,463,139 | | | | 8,671,762 | |
MML Global Fund, Class I | | | 4,702,538 | | | | 2,756,492 | | | | 914,211 | | | | 6,544,819 | | | | 82,530,164 | | | | 702,997 | | | | 1,389,541 | | | | 5,768,968 | |
MML High Yield Fund, Class II | | | 2,503,342 | | | | 335,286 | | | | 1,138,913 | | | | 1,699,715 | | | | 16,963,153 | | | | 1,542,748 | | | | 1,131,330 | | | | 805,087 | |
MML Income & Growth Fund, Initial Class | | | 4,812,655 | | | | 710,180 | | | | 929,192 | | | | 4,593,643 | | | | 57,144,916 | | | | 1,051,076 | | | | - | | | | 2,767,595 | |
MML Inflation-Protected and Income Fund, Initial Class | | | 1,457,511 | | | | 4,913,350 | | | | 171,374 | | | | 6,199,487 | | | | 63,110,773 | | | | 557,252 | | | | 355,493 | | | | (6,819 | ) |
MML International Equity Fund, Class II | | | - | | | | 5,641,207 | | | | 243,515 | | | | 5,397,692 | | | | 50,036,603 | | | | 1,075,142 | | | | 294,813 | | | | (52,241 | ) |
MML Large Cap Growth Fund, Initial Class | | | 6,923,639 | | | | 922,006 | | | | 2,114,064 | | | | 5,731,581 | | | | 80,586,022 | | | | - | | | | 10,225,818 | | | | 10,901,722 | |
MML Managed Bond Fund, Initial Class | | | 14,510,535 | | | | 1,799,352 | | | | 1,122,021 | | | | 15,187,866 | | | | 194,687,348 | | | | 5,991,488 | | | | - | | | | 110,284 | |
MML Managed Volatility Fund, Initial Class | | | - | | | | 4,411,941 | | | | 129,721 | | | | 4,282,220 | | | | 60,432,581 | | | | 432,949 | | | | 3,072,267 | | | | (4,229 | ) |
MML Mid Cap Growth Fund, Initial Class | | | 4,816,274 | | | | 719,844 | | | | 757,257 | | | | 4,778,861 | | | | 78,421,112 | | | | - | | | | 9,773,974 | | | | 7,680,616 | |
MML Mid Cap Value Fund, Initial Class | | | 5,876,041 | | | | 1,378,012 | | | | 1,151,328 | | | | 6,102,725 | | | | 80,067,756 | | | | 1,249,753 | | | | 12,997,772 | | | | 8,373,929 | |
MML Short-Duration Bond Fund, Class II | | | 4,644,030 | | | | 999,805 | | | | 1,434,869 | | | | 4,208,966 | | | | 41,416,229 | | | | 1,011,210 | | | | 5,552 | | | | (67,736 | ) |
MML Small Cap Growth Equity Fund, Initial Class | | | 1,620,968 | | | | 614,089 | | | | 337,833 | | | | 1,897,224 | | | | 33,856,107 | | | | - | | | | 8,859,205 | | | | 1,880,086 | |
MML Small Company Value Fund, Class II | | | 1,698,945 | | | | 741,187 | | | | 302,318 | | | | 2,137,814 | | | | 37,604,150 | | | | - | | | | 9,934,028 | | | | 2,449,835 | |
MML Small/Mid Cap Value Fund, Initial Class | | | 2,127,480 | | | | 164,770 | | | | 453,975 | | | | 1,838,275 | | | | 27,004,254 | | | | 168,716 | | | | 589,627 | | | | 361,910 | |
MML Strategic Emerging Markets Fund, Class II | | | 4,734,091 | | | | 675,127 | | | | 935,797 | | | | 4,473,421 | | | | 43,079,048 | | | | 146,746 | | | | - | | | | (57,782 | ) |
MML Total Return Bond Fund, Class II | | | 8,963,265 | | | | 594,303 | | | | 1,281,287 | | | | 8,276,281 | | | | 88,059,633 | | | | 1,642,428 | | | | - | | | | 489,179 | |
Oppenheimer Discovery Mid Cap Growth Fund/VA, Non-Service Shares* | | | 365,914 | | | | 22,153 | | | | 63,273 | | | | 324,794 | | | | 25,600,287 | | | | - | | | | - | | | | 192,935 | |
Oppenheimer Diversified Alternatives Fund/VA, Non-Service Shares* | | | - | | | | 8,331,471 | | | | - | | | | 8,331,471 | | | | 83,647,965 | | | | 2,120,098 | | | | 1,684,015 | | | | - | |
Oppenheimer Global Fund/VA, Non-Service Shares* | | | 933,211 | | | | 71,873 | | | | 208,665 | | | | 796,419 | | | | 31,458,538 | | | | 361,698 | | | | 1,475,638 | | | | 3,960,277 | |
Oppenheimer Global Strategic Income Fund/VA, Non-Service Shares* | | | 8,727,255 | | | | 824,442 | | | | 9,548,408 | | | | 3,289 | | | | 17,434 | | | | 2,045,313 | | | | - | | | | 226,823 | |
Oppenheimer International Growth Fund/VA, Non-Service Shares* | | | 23,033,002 | | | | 2,116,715 | | | | 6,589,247 | | | | 18,560,470 | | | | 42,874,686 | | | | 519,122 | | | | 913,669 | | | | 6,291,841 | |
| | | | | | | | | | | | | | | | | | | | | | | | | | | | | | | | |
| | | | | | | | | | | | | | | | | | $ | 1,696,645,777 | | | $ | 25,143,066 | | | $ | 91,749,801 | | | $ | 111,116,763 | |
| | | | | | | | | | | | | | | | | | | | | | | | | | | | | | | | |
Aggressive Allocation Fund | | | | | | | | | | | | | | | | | | | | | | | | | | | | | | | | |
MML Blue Chip Growth Fund, Initial Class | | | 641,611 | | | | 148,830 | | | | 226,162 | | | | 564,279 | | | $ | 9,643,533 | | | $ | - | | | $ | 934,160 | | | $ | 1,741,795 | |
MML Equity Income Fund, Initial Class | | | 607,460 | | | | 99,479 | | | | 248,489 | | | | 458,450 | | | | 6,386,203 | | | | 102,758 | | | | 136,559 | | | | 1,241,636 | |
MML Focused Equity Fund, Class II | | | 402,403 | | | | 94,295 | | | | 130,418 | | | | 366,280 | | | | 5,849,485 | | | | 21,089 | | | | 512,422 | | | | 591,715 | |
MML Foreign Fund, Initial Class | | | 458,161 | | | | 99,104 | | | | 103,580 | | | | 453,685 | | | | 4,632,123 | | | | 105,399 | | | | - | | | | 244,535 | |
MML Fundamental Growth Fund, Class II | | | 534,455 | | | | 108,106 | | | | 188,835 | | | | 453,726 | | | | 6,755,984 | | | | 45,285 | | | | 428,514 | | | | 634,489 | |
MML Fundamental Value Fund, Class II | | | 450,107 | | | | 91,873 | | | | 151,837 | | | | 390,143 | | | | 6,320,318 | | | | 91,304 | | | | 262,762 | | | | 635,908 | |
MML Global Fund, Class I | | | 351,662 | | | | 223,391 | | | | 75,159 | | | | 499,894 | | | | 6,303,665 | | | | 50,939 | | | | 100,686 | | | | 457,190 | |
MML High Yield Fund, Class II | | | 64,519 | | | | 12,276 | | | | 70,915 | | | | 5,880 | | | | 58,680 | | | | 23,770 | | | | 30,154 | | | | 14,070 | |
MML Income & Growth Fund, Initial Class | | | 340,250 | | | | 119,839 | | | | 78,470 | | | | 381,619 | | | | 4,747,337 | | | | 82,343 | | | | - | | | | 237,068 | |
63
Notes to Financial Statements (Continued)
| | | | | | | | | | | | | | | | | | | | | | | | | | | | | | | | |
| | | Number of
Shares Held
as of
12/31/13 | | | Purchases | | | Sales | | | Number of
Shares Held
as of
12/31/14 | | | Value as of
12/31/14 | | | Dividend
Income | | | Realized
Gains
Distributions | | | Net
Realized
Gain (Loss) | |
Aggressive Allocation Fund (Continued) | | | | | | | | | | | | | | | | | | | | | | | | | | | | | | | | |
MML Inflation-Protected and Income Fund, Initial Class | | | 47,134 | | | | 252,237 | | | | 7,489 | | | | 291,882 | | | $ | 2,971,361 | | | $ | 26,035 | | | $ | 12,220 | | | $ | (3,875 | ) |
MML International Equity Fund, Class II | | | - | | | | 559,900 | | | | 39,256 | | | | 520,644 | | | | 4,826,368 | | | | 103,554 | | | | 28,395 | | | | 876 | |
MML Large Cap Growth Fund, Initial Class | | | 522,403 | | | | 132,660 | | | | 179,705 | | | | 475,358 | | | | 6,683,540 | | | | - | | | | 816,637 | | | | 1,055,776 | |
MML Managed Bond Fund, Initial Class | | | 410,164 | | | | 75,982 | | | | 152,935 | | | | 333,211 | | | | 4,271,298 | | | | 156,068 | | | | - | | | | (36,317 | ) |
MML Managed Volatility Fund, Initial Class | | | - | | | | 366,300 | | | | 2,501 | | | | 363,799 | | | | 5,134,097 | | | | 35,252 | | | | 250,151 | | | | 1,383 | |
MML Mid Cap Growth Fund, Initial Class | | | 383,107 | | | | 104,209 | | | | 58,195 | | | | 429,121 | | | | 7,041,872 | | | | - | | | | 842,165 | | | | 479,999 | |
MML Mid Cap Value Fund, Initial Class | | | 479,210 | | | | 188,050 | | | | 109,473 | | | | 557,787 | | | | 7,318,165 | | | | 109,814 | | | | 1,142,099 | | | | 422,631 | |
MML Short-Duration Bond Fund, Class II | | | 73,509 | | | | 198,801 | | | | 29,800 | | | | 242,510 | | | | 2,386,294 | | | | 38,972 | | | | 108 | | | | (6,073 | ) |
MML Small Cap Growth Equity Fund, Initial Class | | | 137,468 | | | | 75,911 | | | | 36,463 | | | | 176,916 | | | | 3,157,086 | | | | - | | | | 792,757 | | | | 197,282 | |
MML Small Company Value Fund, Class II | | | 139,262 | | | | 86,269 | | | | 30,170 | | | | 195,361 | | | | 3,436,397 | | | | - | | | | 869,096 | | | | 146,762 | |
MML Small/Mid Cap Value Fund, Initial Class | | | 180,002 | | | | 53,347 | | | | 69,472 | | | | 163,877 | | | | 2,407,358 | | | | 14,325 | | | | 50,062 | | | | 57,018 | |
MML Strategic Emerging Markets Fund, Class II | | | 404,471 | | | | 111,433 | | | | 96,625 | | | | 419,279 | | | | 4,037,653 | | | | 13,202 | | | | - | | | | (17,679 | ) |
MML Total Return Bond Fund, Class II | | | 307,600 | | | | 44,607 | | | | 178,439 | | | | 173,768 | | | | 1,848,890 | | | | 45,078 | | | | - | | | | 48,271 | |
Oppenheimer Discovery Mid Cap Growth Fund/VA, Non-Service Shares* | | | 33,228 | | | | 9,140 | | | | 11,666 | | | | 30,702 | | | | 2,419,934 | | | | - | | | | - | | | | 24,111 | |
Oppenheimer Diversified Alternatives Fund/VA, Non-Service Shares* | | | - | | | | 590,256 | | | | - | | | | 590,256 | | | | 5,926,172 | | | | 150,203 | | | | 119,307 | | | | - | |
Oppenheimer Global Fund/VA, Non-Service Shares* | | | 58,142 | | | | 18,028 | | | | 11,461 | | | | 64,709 | | | | 2,556,020 | | | | 27,363 | | | | 111,636 | | | | 128,254 | |
Oppenheimer Global Strategic Income Fund/VA, Non-Service Shares* | | | 227,088 | | | | 56,202 | | | | 268,652 | | | | 14,638 | | | | 77,581 | | | | 57,913 | | | | - | | | | (37,948 | ) |
Oppenheimer International Growth Fund/VA, Non-Service Shares* | | | 1,738,483 | | | | 384,499 | | | | 563,502 | | | | 1,559,480 | | | | 3,602,398 | | | | 42,322 | | | | 74,488 | | | | 401,963 | |
| | | | | | | | | | | | | | | | | | | | | | | | | | | | | | | | |
| | | | | | | | | | | | | | | | | | $ | 120,799,812 | | | $ | 1,342,988 | | | $ | 7,514,378 | | | $ | 8,660,840 | |
| | | | | | | | | | | | | | | | | | | | | | | | | | | | | | | | |
| * | Fund advised by OFI Global Asset Management, Inc. |
Under the Funds’ organizational documents, current and former Trustees and Officers are provided with specified rights to indemnification against liabilities arising in connection with the performance of their duties to the Funds, and shareholders are indemnified against personal liability for obligations of the Funds. In the normal course of business, the Funds may also enter into contracts that provide general indemnifications. The Funds’ maximum exposure under these arrangements is unknown as this would be dependent on future claims that may be made against the Funds. The risk of material loss from such claims is considered remote.
| 9. | | New Accounting Pronouncements |
In June 2014, The Financial Accounting Standards Board (“FASB”) issued Accounting Standards Update No. 2014-11, Transfers & Servicing (Topic 860): “Repurchase-to-Maturity Transactions, Repurchase Financings, and Disclosures” (“ASU 2014-11”) to improve the financial reporting of repurchase agreements and other similar transactions. ASU 2014-11 includes expanded disclosure requirements for entities that enter into reverse repurchase agreements and similar transactions accounted for as secured borrowings. ASU 2014-11 is effective for annual reporting periods beginning after December 15, 2014 and interim periods beginning after December 15, 2015. Management is currently evaluating the implications of these changes and their impact on the financial statements.
In preparation of these financial statements, management has evaluated the events and transactions subsequent to December 31, 2014, through the date when the financial statements were issued, and determined that there are no subsequent events or transactions that would require adjustments to or disclosures in the Funds’ financial statements.
64
Report of Independent Registered Public Accounting Firm
To the Board of Trustees of MML Series Investment Fund and Shareholders of MML
Conservative Allocation Fund, MML Balanced Allocation Fund, MML Moderate Allocation
Fund, MML Growth Allocation Fund, MML Aggressive Allocation Fund, MML American Funds
Growth Fund, MML American Funds International Fund, and MML American Funds Core
Allocation Fund (collectively, the “Funds”):
We have audited the accompanying statements of assets and liabilities, including the portfolios of investments, of the Funds as of December 31, 2014, and the related statements of operations for the year then ended, the statements of changes in net assets for each of the two years in the period then ended, and the financial highlights for each of the periods presented. These financial statements and financial highlights are the responsibility of the Funds’ management. Our responsibility is to express an opinion on these financial statements and financial highlights based on our audits.
We conducted our audits in accordance with the standards of the Public Company Accounting Oversight Board (United States). Those standards require that we plan and perform the audit to obtain reasonable assurance about whether the financial statements and financial highlights are free of material misstatement. The Funds are not required to have, nor were we engaged to perform, an audit of their internal control over financial reporting. Our audits included consideration of internal control over financial reporting as a basis for designing audit procedures that are appropriate in the circumstances, but not for the purpose of expressing an opinion on the effectiveness of the Funds’ internal control over financial reporting. Accordingly, we express no such opinion. An audit also includes examining, on a test basis, evidence supporting the amounts and disclosures in the financial statements, assessing the accounting principles used and significant estimates made by management, as well as evaluating the overall financial statement presentation. Our procedures included confirmation of securities owned as of December 31, 2014, by correspondence with the transfer agents; where replies were not received from transfer agents, we performed other auditing procedures. We believe that our audits provide a reasonable basis for our opinion.
In our opinion, the financial statements and financial highlights referred to above present fairly, in all material respects, the financial position of each of the Funds as of December 31, 2014, the results of their operations for the year ended, the changes in their net assets for each of the two years in the period then ended, and the financial highlights for each of the periods presented, in conformity with accounting principles generally accepted in the United States of America.
Deloitte & Touche LLP
Boston, Massachusetts
February 23, 2015
65
Trustees and Officers (Unaudited)
The following table lists the Trust’s Trustees and Officers as of December 31, 2014; their address and age; their position with the Trust; the length of time holding that position with the Trust; their principal occupation(s) during the past five years; the number of portfolios in the fund complex they oversee; and other directorships they hold in companies subject to registration or reporting requirements of the Securities Exchange Act of 1934 (generally called “public companies”) or in registered investment companies. The Trust’s Statement of Additional Information includes additional information about the Trust’s Trustees and is available, without charge, upon request by calling 1-888-309-3539 or by writing MML Series Investment Fund, c/o Massachusetts Mutual Life Insurance Company, 100 Bright Meadow Blvd., Enfield, Connecticut 06082, Attention: Retirement Services Marketing.
Disinterested Trustees
| | | | | | | | | | |
Name, Address*, and Age | | Position(s)
Held with
Trust | | Term of
Office** and
Length of
Time Served | | Principal Occupation(s)
During Past 5 Years | | Number of
Portfolios in
Fund Complex
Overseen by Trustee | | Other Directorships
Held by Trustee |
Richard H. Ayers
Age: 72 | | Chairman Trustee | | Since 2010 Since 1999 | | Retired. | | 89 | | Director (2008-2011), Celera Corporation; Director (1996-2008), Applera Corporation; Chairman (since 2010), Trustee (since 1996), MassMutual Select Funds (open-end investment company); Chairman and Trustee (since 2012), MML Series Investment Fund II (open-end investment company); Chairman and Trustee (since 2012), MassMutual Premier Funds (open-end investment company). |
| | | | | |
Allan W. Blair
Age: 66 | | Trustee | | Since 2003 | | Retired; President and Chief Executive Officer (1996-2014), Economic Development Council of Western Massachusetts; President and Chief Executive Officer (1984-2014), Westover Metropolitan Development Corporation. | | 89 | | Trustee (since 2003), MassMutual Select Funds (open-end investment company); Trustee (since 2012), MML Series Investment Fund II (open-end investment company); Trustee (since 2012), MassMutual Premier Funds (open-end investment company). |
| | | | | |
Nabil N. El-Hage
Age: 56 | | Trustee Chairman | | Since 2012 (2006-
2012) | | Chairman (since 2011), Academy of Executive Education, LLC; Consultant (2010-2011); Senior Associate Dean for External Relations (2009-2010), Thomas Henry Carroll Ford Foundation Adjunct Professor of Business Administration (2009-2010), Professor of Management Practice (2005-2009), Harvard Business School. | | 89 | | Director (since 2011), Argo Group International Holdings, Ltd.; Director (2007-2010), Virtual Radiologic Corporation; Trustee (since 2012), MassMutual Select Funds (open-end investment company); Trustee (since 2005), Chairman (2006-2012), MML Series Investment Fund II (open-end investment company); Trustee (since 2003), Chairman (2006-2012), MassMutual Premier Funds (open-end investment company). |
| | | | | |
Maria D. Furman
Age: 60 | | Trustee | | Since 2012 | | Retired. | | 89 | | Trustee (since 2011), GMO Series Trust (open-end investment company); Trustee (since 2012), MassMutual Select Funds (open-end investment company); Trustee (since 2005), MML Series Investment Fund II (open-end investment company); Trustee (since 2004), MassMutual Premier Funds (open-end investment company). |
66
Trustees and Officers (Unaudited) (Continued)
| | | | | | | | | | |
Name, Address*, and Age | | Position(s)
Held with
Trust | | Term of
Office** and
Length of
Time Served | | Principal Occupation(s)
During Past 5 Years | | Number of
Portfolios in
Fund Complex
Overseen by Trustee | | Other Directorships
Held by Trustee |
R. Alan Hunter, Jr.
Age: 68 | | Trustee | | Since 2003 | | Retired. | | 89 | | Director (since 2007), Actuant Corporation; Trustee (since 2003), MassMutual Select Funds (open-end investment company); Trustee (since 2012), MML Series Investment Fund II (open-end investment company); Trustee (since 2012), MassMutual Premier Funds (open-end investment company). |
| | | | | |
F. William Marshall, Jr.
Age: 72 | | Trustee | | Since 1996 | | Retired; Consultant (1999-2009). | | 127*** | | Trustee (since 2000), Denver Board – Oppenheimer Funds; Trustee (since 1996), MassMutual Select Funds (open-end investment company); Trustee (since 2012), MML Series Investment Fund II (open-end investment company); Trustee (since 2012), MassMutual Premier Funds (open-end investment company). |
| | | | | |
C. Ann Merrifield
Age: 63 | | Trustee | | Since
2012 | | Retired; President and Chief Executive Officer (2012-2014), PathoGenetix; Senior Vice President, Genzyme Business Excellence Initiative (2009-2011), President, Biosurgery (2003-2009), Genzyme Corporation. | | 89 | | Director (since 2014), Flexion Therapeutics; Director (since 2014), InVivo Therapeutics; Trustee (since 2012), MassMutual Select Funds (open-end investment company); Trustee (since 2005), MML Series Investment Fund II (open-end investment company); Trustee (since 2004), MassMutual Premier Funds (open-end investment company). |
| | | | | |
Susan B. Sweeney
Age: 62 | | Trustee | | Since 2009 | | Retired; Senior Vice President and Chief Investment Officer (2010-2014), Selective Insurance Group (property and casualty company); Senior Managing Director (2008-2010), Ironwood Capital (private equity firm). | | 91^ | | Trustee (since 2012), Babson Capital Corporate Investors (closed-end investment company); Trustee (since 2012), Babson Capital Participation Investors (closed-end investment company); Trustee (since 2009), MassMutual Select Funds (open-end investment company); Trustee (since 2012), MML Series Investment Fund II (open-end investment company); Trustee (since 2012), MassMutual Premier Funds (open-end investment company). |
67
Trustees and Officers (Unaudited) (Continued)
Interested Trustees
| | | | | | | | | | |
Name, Address*, and Age | | Position(s)
Held with
Trust | | Term of
Office** and
Length of
Time Served | | Principal Occupation(s)
During Past 5 Years | | Number of
Portfolios in
Fund Complex
Overseen by Trustee | | Other Directorships Held by Trustee |
Robert E. Joyal^^
Age: 69 | | Trustee | | Since 2003 | | Retired. | | 91^ | | Director (since 2013), Leucadia National Corporation (holding company); Director (since 2012), Ormat Technologies, Inc.; Director (2006-2014), Jefferies Group LLC (investment bank); Director (2007-2011), Scottish Re Group Ltd.; Director (2003-2010), Alabama Aircraft Industries, Inc.; Trustee (since 2003), Babson Capital Corporate Investors (closed-end investment company); Trustee (since 2003), Babson Capital Participation Investors (closed-end investment company); Trustee (since 2003), MassMutual Select Funds (open-end investment company); Trustee (since 2012), MML Series Investment Fund II (open-end investment company); Trustee (since 2012), MassMutual Premier Funds (open-end investment company). |
| | | | | |
Elaine A. Sarsynski^^^
Age: 59 | | Trustee Vice Chairperson | | Since
2008 (2011-
2012) | | Executive Vice President (since 2008), MassMutual Retirement Services Division, MassMutual; Chairman (since 2013), President, Chairman & CEO (2012-2013), Chairman & CEO (2008-2012), President & CEO (2006-2008), MassMutual International LLC. | | 89 | | Director (since 2012), Horizon Technology Finance Management LLC; Director (since 2013), MML Advisers; Trustee (since 2008), MassMutual Select Funds (open-end investment company); Vice Chairperson (2011-2012), Trustee (since 2011), MML Series Investment Fund II (open-end investment company); Vice Chairperson (2011-2012), Trustee (since 2011), MassMutual Premier Funds (open-end investment company). |
Principal Officers who are Not Trustees
| | | | | | | | |
Name, Address*, and Age | | Position(s) Held with Trust | | Term of
Office# and
Length of
Time Served | | Principal Occupation(s) During Past 5 Years | | Number of
Portfolios in
Fund Complex
Overseen by Officer |
Jeffrey M. Dube
Age: 46 | | President | | Since
2014 | | Vice President (since 2012), Assistant Vice President (2011-2012), Managing Director (2009-2011), MassMutual; President (since 2014), MML Series Investment Fund II (open-end investment company). | | 36 |
| | | | |
Michael C. Eldredge
Age: 50 | | Vice President | | Since
2009 | | Head of Investments and portfolio manager (since 2014), MML Advisers; Vice President (since 2008), MassMutual; Vice President (2005-2008), ING; Vice President (since 2009), MassMutual Select Funds (open-end investment company); Vice President (since 2009), MML Series Investment Fund II (open-end investment company); Vice President (since 2009), MassMutual Premier Funds (open-end investment company). | | 89 |
68
Trustees and Officers (Unaudited) (Continued)
| | | | | | | | |
Name, Address*, and Age | | Position(s) Held
with Trust | | Term of
Office# and
Length of
Time Served | | Principal Occupation(s) During Past 5 Years | | Number of
Portfolios in
Fund Complex
Overseen by Officer |
Andrew M. Goldberg
Age: 48 | | Vice President, Secretary, and
Chief Legal
Officer Assistant Secretary | | Since
2008 (2001-
2008) | | Assistant Vice President and Counsel (since 2004), MassMutual; Assistant Secretary (since 2013), MML Advisers; Vice President, Secretary, and Chief Legal Officer (since 2008), Assistant Secretary (2001-2008), MassMutual Select Funds (open-end investment company); Vice President, Secretary, (formerly known as “Clerk”), and Chief Legal Officer (since 2008), Assistant Clerk (2005-2008), MML Series Investment Fund II (open-end investment company); Vice President, Secretary, (formerly known as “Clerk”), and Chief Legal Officer (since 2008), Assistant Clerk (2004-2008), MassMutual Premier Funds (open-end investment company). | | 89 |
| | | | |
Brian K. Haendiges
Age: 54 | | Vice President | | Since
2014 | | Vice President (since 2014), MML Advisers; Senior Vice President (since 2014), Vice President (2010-2014), MassMutual; Vice President (since 2014), MassMutual Select Funds (open-end investment company); Vice President (since 2014), MML Series Investment Fund II (open-end investment company); Vice President (since 2014), MassMutual Premier Funds (open-end investment company). | | 89 |
| | | | |
Nicholas H. Palmerino
Age: 49 | | Chief Financial Officer and Treasurer | | Since
2006 | | Vice President (since 2014), Assistant Vice President (2006-2014), MassMutual; Chief Financial Officer and Treasurer (since 2006), MassMutual Select Funds (open-end investment company); Chief Financial Officer and Treasurer (since 2006), MML Series Investment Fund II (open-end investment company); Chief Financial Officer and Treasurer (since 2006), MassMutual Premier Funds (open-end investment company). | | 89 |
| | | | |
Philip S. Wellman
Age: 50 | | Vice President and Chief Compliance Officer | | Since
2007 | | Vice President and Chief Compliance Officer (since 2013), MML Advisers; Vice President and Associate General Counsel (since 2014), Vice President, Associate General Counsel, and Chief Compliance Officer (Mutual Funds and Investment Advisory) (2008-2014), Vice President, Associate General Counsel, and Chief Compliance Officer (Mutual Funds) (2007-2008), MassMutual; Vice President and Chief Compliance Officer (since 2007), MassMutual Select Funds (open-end investment company); Vice President and Chief Compliance Officer (since 2007), MML Series Investment Fund II (open-end investment company); Vice President and Chief Compliance Officer (since 2007), MassMutual Premier Funds (open-end investment company). | | 89 |
| | | | |
Eric H. Wietsma
Age: 48 | | Vice President | | Since
2006 | | Director and President (since 2013), MML Advisers; Senior Vice President (since 2010), Corporate Vice President (2007-2010), MassMutual; President (since 2008), Vice President (2006-2008), MassMutual Select Funds (open-end investment company); Vice President (since 2006), MML Series Investment Fund II (open-end investment company); President (since 2008) Vice President (2006-2008), MassMutual Premier Funds (open-end investment company). | | 89 |
| * | The address of each Trustee and Principal Officer is the same as that for the Trust; 100 Bright Meadow Blvd., Enfield, CT 06082. |
| ** | Each Trustee of the Trust serves until the next meeting of shareholders called for the purpose of electing Trustees and until the election and qualification of his or her successor or until he or she dies, resigns, or is removed. Notwithstanding the foregoing, unless the Trustees determine that it is desirable and in the best interest of the Trust that an exception to the retirement policy of the Trust be made, a Trustee shall retire and cease to serve as a Trustee upon the conclusion of the calendar year in which such Trustee attains the age of seventy-two years. Such an exception was made for any Trustee who attained the age of seventy-two years during 2014. Such Trustees shall retire and cease to serve as a Trustee on or before December 31, 2015. |
| | The Chairperson is elected to hold such office for a term of three years or until their successor is elected and qualified to carry out the duties and responsibilities of their office, or until he or she retires, dies, resigns, is removed, or becomes disqualified. |
| *** | Denver Board – Oppenheimer Funds is deemed to be part of the Fund Complex because it is managed by OFI Global Asset Management, Inc., an affiliate of MML Advisers. |
| ^ | Babson Capital Participation Investors and Babson Capital Corporate Investors are deemed to be a part of the Fund Complex because they are managed by Babson Capital Management LLC, an affiliate of MML Advisers. |
| ^^ | Mr. Joyal is an “Interested Person,” as that term is defined in the 1940 Act, through his position as a director of Leucadia National Corporation, which controls Jefferies Group LLC, a broker-dealer that may execute portfolio transactions and/or engage in principal transactions with the Funds, other investment companies advised by MML Advisers or holding themselves out to investors as related companies for purposes of investment or investor services, or any other advisory accounts over which MML Advisers has brokerage placement discretion. |
| ^^^ | Ms. Sarsynski is an Interested Person as a director of MML Advisers. |
| # | The President, Treasurer, and Secretary are elected to hold such office until their successor is elected and qualified to carry out the duties and responsibilities of their office, or until he or she dies, resigns, is removed, or becomes disqualified. Each other officer shall hold office at the pleasure of the Trustees. |
69
Federal Tax Information (Unaudited)
For corporate shareholders, a portion of the ordinary dividends paid during the Fund(s)’ year ended December 31, 2014, qualified for the dividends received deduction, as follows:
| | | | |
| |
| | | Dividends Received
Deductions | |
Conservative Allocation Fund | | | 48.53 | % |
Balanced Allocation Fund | | | 68.30 | % |
Moderate Allocation Fund | | | 91.90 | % |
Growth Allocation Fund | | | 100.00 | % |
Aggressive Allocation Fund | | | 100.00 | % |
American Funds Growth Fund | | | 100.00 | % |
American Funds Core Allocation Fund | | | 80.71 | % |
For the year ended December 31, 2014, the following Fund(s) earned the following foreign sources of income:
| | | | |
| |
| | | Foreign Sources
of Income | |
Conservative Allocation Fund | | $ | 1,830,414 | |
Balanced Allocation Fund | | | 2,774,433 | |
Moderate Allocation Fund | | | 9,804,851 | |
Growth Allocation Fund | | | 10,671,207 | |
Aggressive Allocation Fund | | | 783,216 | |
American Funds International Fund | | | 821,986 | |
American Funds Core Allocation Fund | | | 920,532 | |
70
Other Information (Unaudited)
Proxy Voting
A description of the policies and procedures that each Fund’s investment adviser uses to vote proxies relating to the Fund’s portfolio securities is available, without charge, upon request, by calling 1-888-309-3539, and on the SEC’s website at http://www.sec.gov.
Information regarding how the Funds voted proxies relating to portfolio securities during the most recent 12-month period ended June 30 is available, without charge, upon request, on the MassMutual website at http://www.massmutual.com/funds and on the SEC’s website at http://www.sec.gov.
Quarterly Reporting
The Funds file their complete schedule of portfolio holdings with the SEC for the first and third quarters of each fiscal year on Form N-Q. The Funds’ Forms N-Q are available on the SEC’s website at http://www.sec.gov and may be reviewed and copied at the SEC’s Public Reference Room in Washington D.C. Information on the operation of the SEC’s Public Reference Room may be obtained by calling 1-800-SEC-0330.
71
Other Information (Unaudited) (Continued)
Fund Expenses December 31, 2014
Expense Examples:
The following information is in regards to expenses for the six months ended December 31, 2014:
As a shareholder of the Funds, you incur ongoing costs, including advisory fees, distribution and/or service (12b-1) fees, and other Fund expenses. These examples are intended to help you understand your ongoing costs (in dollars) of investing in the Funds and to compare these costs with the ongoing costs of investing in other mutual funds. These examples are based on an investment of $1,000 invested for the six months ended December 31, 2014.
Actual Expenses:
The first four columns of the table below provide information about actual account values and actual expenses. You may use this information, together with the amount you invested, to estimate the expenses that you paid over the period. Simply divide your account value by $1,000 (for example, an $8,600 account value divided by $1,000 = 8.6), then multiply the result by the number under the heading entitled “Operating Expenses Incurred” to estimate the expenses you paid on your account during this period.
Hypothetical Example for Comparison Purposes:
The last two columns of the table below provide information about hypothetical account values and hypothetical expenses based on the Fund’s actual expense ratio and an assumed rate of return of 5% per year before expenses, which is not the Fund’s actual return. The hypothetical account values and expenses may not be used to estimate the actual ending account balance or expenses you paid for the period. You may use this information to compare the ongoing costs of investing in the Fund and other funds. To do so, compare this 5% hypothetical example with the 5% hypothetical examples that appear in the shareholder reports of the other funds.
Please note that the expenses shown in the table are meant to highlight your ongoing costs only and do not reflect any transactional costs. Therefore, the last two columns of the table are useful in comparing ongoing costs only, and will not help you determine the relative total costs of owning different funds. In addition, if these transactional costs were included, your costs would have been higher.
| | | | | | | | | | | | | | | | | | | | | | | | |
| | | Beginning
Value | | | Annualized
Expense
Ratio | | | Ending
Value (Based
on Actual
Returns and
Expenses) | | | Operating
Expenses
Incurred* | | | Ending
Value (Based on
Hypothetical
Returns and
Expenses) | | | Operating
Expenses
Incurred* | |
| Conservative Allocation Fund | | | | | | | | | | | | | | | | | | | | | | | | |
Initial Class | | $ | 1,000 | | | | 0.12 | % | | $ | 1,009.60 | | | $ | 0.61 | | | $ | 1,024.60 | | | $ | 0.61 | |
Service Class | | | 1,000 | | | | 0.37 | % | | | 1,008.20 | | | | 1.87 | | | | 1,023.30 | | | | 1.89 | |
| Balanced Allocation Fund | | | | | | | | | | | | | | | | | | | | | | | | |
Initial Class | | | 1,000 | | | | 0.12 | % | | | 1,009.90 | | | | 0.61 | | | | 1,024.60 | | | | 0.61 | |
Service Class | | | 1,000 | | | | 0.37 | % | | | 1,009.50 | | | | 1.87 | | | | 1,023.30 | | | | 1.89 | |
| Moderate Allocation Fund | | | | | | | | | | | | | | | | | | | | | | | | |
Initial Class | | | 1,000 | | | | 0.11 | % | | | 1,010.20 | | | | 0.56 | | | | 1,024.70 | | | | 0.56 | |
Service Class | | | 1,000 | | | | 0.36 | % | | | 1,009.20 | | | | 1.82 | | | | 1,023.40 | | | | 1.84 | |
| Growth Allocation Fund | | | | | | | | | | | | | | | | | | | | | | | | |
Initial Class | | | 1,000 | | | | 0.12 | % | | | 1,011.40 | | | | 0.61 | | | | 1,024.60 | | | | 0.61 | |
Service Class | | | 1,000 | | | | 0.37 | % | | | 1,010.80 | | | | 1.88 | | | | 1,023.30 | | | | 1.89 | |
72
Other Information (Unaudited) (Continued)
| | | | | | | | | | | | | | | | | | | | | | | | |
| | | Beginning
Value | | | Annualized
Expense
Ratio | | | Ending
Value (Based
on Actual
Returns and
Expenses) | | | Operating
Expenses
Incurred* | | | Ending
Value (Based on
Hypothetical
Returns and
Expenses) | | | Operating
Expenses
Incurred* | |
| Aggressive Allocation Fund | | | | | | | | | | | | | | | | | | | | | | | | |
Initial Class | | $ | 1,000 | | | | 0.17 | % | | $ | 1,011.10 | | | $ | 0.86 | | | $ | 1,024.30 | | | $ | 0.87 | |
Service Class | | | 1,000 | | | | 0.42 | % | | | 1,010.10 | | | | 2.13 | | | | 1,023.10 | | | | 2.14 | |
| American Funds Growth Fund | | | | | | | | | | | | | | | | | | | | | | | | |
Service Class I** | | | 1,000 | | | | 1.05 | % | | | 1,025.50 | | | | 5.36 | | | | 1,019.90 | | | | 5.35 | |
| American Funds International Fund | | | | | | | | | | | | | | | | | | | | | | | | |
Service Class I** | | | 1,000 | | | | 1.24 | % | | | 935.80 | | | | 6.05 | | | | 1,018.90 | | | | 6.31 | |
| American Funds Core Allocation Fund | | | | | | | | | | | | | | | | | | | | | | | | |
Service Class I | | | 1,000 | | | | 0.72 | % | | | 1,023.00 | | | | 3.67 | | | | 1,021.60 | | | | 3.67 | |
| * | Expenses are calculated using the annualized expense ratio for the six months ended December 31, 2014, multiplied by the average account value over the period, multiplied by the number of days in the period, divided by the number of days in the year, unless stated otherwise. |
| ** | The annualized expense ratio reflects the expenses of both the Feeder Fund and the Master Fund in which it invests. |
73
Underwriter:
MML Distributors, LLC
100 Bright Meadow Blvd.
Enfield, CT 06082

| | |
| © 2015 Massachusetts Mutual Life Insurance Company, Springfield, MA 01111-0001. All rights reserved. www.massmutual.com. MassMutual Financial Group is a marketing name for Massachusetts Mutual Life Insurance Company (MassMutual) and its affiliated companies and sales representatives. Investment Adviser: MML Investment Advisers, LLC | | CRN201603-190350 |
Table of Contents
This material must be preceded or accompanied by a current prospectus (or summary prospectus, if available) for the MML Series Investment Fund. Investors should consider a Fund’s investment objective, risks, and charges and expenses carefully before investing. This and other information about the investment company is available in the prospectus (or summary prospectus, if available). Read it carefully before investing.
MML Series Investment Fund – President’s Letter to Shareholders (Unaudited)
To Our Shareholders

Jeffrey M. Dube
“At MassMutual, our customers – and their dreams for their future – matter most to us. We strive to help you take the right steps to help yourself prepare for a retirement that grants you the freedom to live the life you imagine – retirement on your terms.”
December 31, 2014
I am pleased to present you with the MML Series Investment Fund Annual Report, covering the year ended December 31, 2014. U.S. stocks and bonds rose in 2014, with stocks reaching new heights and outperforming their foreign counterparts by a considerable margin. The accelerating expansion of the U.S. economy provided an accommodative investing environment that stood in sharp contrast to the challenges faced by some of the world’s other large economies in Europe and the Far East.
The performance of U.S. equity markets during 2014 was encouraging, but the volatility that resurfaced during the fourth quarter and the struggles of some foreign markets serve as ongoing reminders that retirement investors should not focus on short-term performance – but rather on making investment decisions that are based on their long-term goals and objectives. Individuals who are saving for retirement may have the advantage of not needing to access their funds in the short term. Even those who have begun withdrawing their retirement savings may choose to have the majority of their account balance remain invested, since retirement can last for decades. We believe retirement investors give themselves a greater opportunity to reach their retirement income goals when they follow certain investment guidelines, such as the ones below.
Investment concepts to keep in mind
Avoid focusing on daily market performance
Investing for retirement is a long-term proposition. While most retirement investors seem to understand that the financial markets experience volatility from time to time, seasoned investors typically take a long-term approach to investing and avoid focusing on short-term results.
The one thing you can control is your contribution level
Of course, you can’t control the performance of your investments. What you can control, however, is how often and how much you save. Contributing to your retirement account on a regular basis and increasing your contribution level as often as possible can help you boost your retirement savings.*
Take advantage of asset allocation and diversification*
Stocks, bonds, and short-term/money market investments are investment types that generally perform differently at different times, depending on the economic climate. Each of these categories contains an even broader array of sub-categories, such as small-cap stocks, international stocks, and high-yield bonds. Many financial professionals believe investors can help reduce their over-exposure to one or two poorly performing investment types by including a mix of investment types and sub-categories in their retirement strategy.
Who Matters Most
MassMutual believes “Who Matters Most to You Says the Most About You.” At MassMutual, our customers – and their dreams for their future – matter most to us. We strive to help you take the right steps to help yourself prepare for a retirement that grants you the freedom to live the life you imagine – retirement on your terms. To get there, we believe you may benefit most by maintaining a plan that
| * | Systematic investing and asset allocation do not ensure a profit or protect against loss in a declining market. Systematic investing involves continuous investment in securities regardless of fluctuating price levels. Investors should consider their ability to continue investing through periods of low price levels. |
(Continued)
1
MML Series Investment Fund – President’s Letter to Shareholders (Unaudited) (Continued)
takes into consideration your specific goals, how comfortable you are with the market’s ups and downs, and how long you have to save and invest for your future. If you work with a financial professional, this may be an excellent time to contact him or her for assistance in reviewing your personal retirement investment strategy and making any adjustments that may be appropriate. Thank you for your confidence in MassMutual.
Sincerely,

Jeffrey M. Dube
President
The information provided is the opinion of MassMutual Retirement Services Investments Marketing as of 1/1/15 and is subject to change without notice. It is not to be construed as tax, legal or investment advice. Of course, past performance does not guarantee future results.
2
MML Series Investment Fund – Economic and Market Overview (Unaudited)
December 31, 2014
Investors drive U.S. stocks up, oil down; central bank concludes bond buying in 2014
Major U.S. stock indexes rose in 2014, with the Standard & Poor’s 500 Index (“S&P 500”) and the Dow Jones Industrial Average (the “Dow”), two of the most widely followed U.S. stock market benchmarks, repeatedly reaching new highs and finishing the year near record territory. U.S. bonds also advanced for the year. Foreign markets did not fare as well, as economic growth slowed substantially in Europe, Japan reentered a recession, and China’s economy also stumbled.
Investors navigated periods of volatility and other challenges in an environment that included political action over federal spending and midterm elections that left Republicans with majorities in both houses of the U.S. Congress, geopolitical conflicts in Eastern Europe and the Middle East, the end of government bond purchases through the Federal Reserve’s (the “Fed”) Quantitative Easing program (“QE”), and a precipitous decline in the price of oil. In the U.S., ongoing improvement in employment, corporate profitability, and other key economic measures – including a rebound and acceleration in gross domestic product (“GDP”) – helped bolster stock prices. Housing was a surprisingly notable laggard during much of the year and failed to echo other economic improvements.
The Fed began “tapering” its monthly QE bond purchases to $75 billion in January 2014. The Fed’s monthly reduction proceeded systematically in additional $10 billion increments thereafter during 2014, and the central bank made its last monthly buys in October 2014. There was some first-quarter market movement attributable to the tapering, but investors ultimately seemed to accept the inevitable end of the program and the reductions became less of a factor in market movements as the year progressed. The Fed also helped keep short-term interest rates at historically low levels by continuing the federal funds rate at 0.0% to 0.25% – the level the rate has occupied since December 2008. The federal funds rate is the interest rate that banks and other financial institutions charge each other for borrowing funds overnight. The Fed reassured investors following its September 2014 meeting that short-term interest rates would remain low for a “considerable time” after the end of QE. Fed statements in mid-December indicated the central bank intends to be “patient” in raising short-term interest rates. While not ruling out rate hikes later in 2015, the Fed allayed investors’ fears that better-than-expected economic growth might cause the central bank to accelerate its timetable for normalizing rates from near-zero levels. The statement also noted that the Fed continues to pay close attention to the slow improvement of credit growth in the U.S. and core inflation that is below the central bank’s 2% target.
The price of oil declined steadily over the second half of the year due to investor concerns about slowing economic growth and falling demand in foreign markets colliding with an overabundant supply. West Texas Intermediate (WTI) crude oil started the year at more than $98 per barrel, gushed to nearly $108 in June, then trickled down steadily to finish 2014 at $53.45 – down more than 45% for the full year. U.S. retail gasoline prices accelerated from about $3.41 per gallon at the beginning of January to nearly $3.79 in late April. Gasoline parked in the $3.74 to $3.78 per gallon range until late June before rolling downhill to approximately $2.39 at the end of the year, which gave drivers the lowest gas prices since 2009. Gold prices gyrated but changed little, cresting to $1,385 per ounce in mid-March 2014, falling to $1,142 in early November, and finishing the year at $1,206 – just $1.50 more than the precious metal’s 2014 opening price.
Market performance
U.S. stocks of all sizes outperformed their foreign counterparts during 2014, with stocks of mid-size and large U.S companies outpacing their small-company counterparts. The major technology stock benchmark in the U.S., the NASDAQ Composite® Index, returned 14.75% for the year and led all U.S. broad market indexes. The S&P 500® Index of large-capitalization U.S. stocks posted a 13.69% advance, and the blue-chip Dow Jones Industrial AverageSM rose 10.04%. The Russell 2000® Index of small-capitalization stocks underperformed other key stock benchmarks, but still advanced 4.89%. The MSCI Emerging Markets Index, a measure of the performance of emerging stock markets throughout the world, declined 2.19% for the year and outperformed the MSCI EAFE Index, a barometer for foreign stocks in developed markets, which fell 4.90%.
Bonds rewarded investors, but underperformed most U.S. stock indexes during the year, with the Barclays U.S. Aggregate Bond Index, a broad measure of the U.S. investment-grade bond markets, rising 5.97%. Unrelenting low interest rates continued to take their toll, and shorter-term debt investments barely managed to stay in positive territory. In this environment, the Barclays U.S. 1-3 Year Government Bond Index, which measures the performance of short-term U.S. government bonds, returned just 0.64%;
3
MML Series Investment Fund – Economic and Market Overview (Unaudited) (Continued)
and Treasury bills, as measured by the Citigroup 3-Month Treasury Bill Index, gained only 0.03%. The impact of lower oil prices on energy companies in the second half of the year worked against high-yield bonds, as many issuers of such bonds are energy companies. Despite losing ground in the third and fourth quarters, the Barclays U.S. Corporate High-Yield Index, a measure of the performance of fixed-rate, non-investment-grade debt from corporate sectors, still managed to advance 2.45% for the year.*
Q1 2014: Stocks suffer early losses, then recover
U.S. stocks ended the first quarter of 2014 with only minimal changes, as a sell-off early in the quarter gave way to a recovery that more than offset previous losses in most cases. The decline was relatively brief and confined to a two-week stretch in late January and the beginning of February. A weak December 2013 employment report, concerns about emerging markets, and the Fed’s ongoing downsizing of QE were all factors weighing on share prices. Worries about emerging markets eased later in the quarter, however, and enabled stocks to embark on a recovery.
Resurgent concerns over some aspects of U.S. economic growth and a flight to quality due to emerging-market volatility helped drive up prices of U.S. Treasury securities. Reassuring comments from new U.S. Federal Reserve Chair Janet Yellen helped bolster the market. Yellen replaced Ben Bernanke at the end of January and is the first woman to lead the Fed. Fiscal woes afflicting the federal government eased a bit in the first quarter. On February 15, President Obama signed legislation extending the federal debt ceiling through March 2015.
One factor keeping investors on edge during the quarter was turmoil in Ukraine, specifically the country’s Crimea region, which has been governed as an independent republic since 1992 and is home to many pro-Russian sympathizers. On March 16, a referendum in Crimea yielded the decision to become part of Russia, a move not recognized by the West. Russia’s support of this referendum, together with the build-up of Russian troops along the Russia/Ukraine border, triggered economic sanctions against Russia by Western nations, including the United States. The political upheaval did not significantly damage stock prices, so most broad equity benchmarks ended the quarter only modestly below their all-time highs.
Q2 2014: Stocks continue their record-setting pace
Stocks of U.S. and foreign companies overcame a brief and relatively mild sell-off during the first half of April to surge into fresh high ground in the second quarter of 2014, as an ongoing global economic recovery, receding concerns about Ukraine, and stimulative monetary policy from central banks provided a supportive backdrop for equity prices. Stocks’ solid second quarter followed a shaky first quarter in which performance was much more muted. In the fixed-income market, yields of longer-term U.S. Treasury securities declined during April and May before recovering somewhat in June. Weak U.S. economic growth in the first quarter, which was initially estimated at just 0.1% and was subsequently revised much lower – making it the first negative reading in three years – helped drive the April drop.
The European Central Bank (“ECB”) provided a boost for the markets in early June, when ECB President Mario Draghi announced reductions in the central bank’s key interest rates. Notably, the ECB’s deposit rate turned negative for the first time, in essence charging euro zone banks for parking funds with the central bank. The ECB also introduced a fresh series of low-cost loans to banks in an effort to jump-start lending. These moves helped lift the performance of stocks in the United States, Europe, and Japan, as well as in emerging markets.
Global stock prices also reacted favorably to remarks coming out of the Fed meeting on June 18, which stated the central bank would continue to reduce the amount of monthly bond purchases and reaffirmed its intention to keep short-term interest rates near zero in an ongoing effort to incentivize job creation and economic growth.
Energy stocks rose during the quarter, spurred by concerns about potential disruptions in Iraq’s oil production amid widespread terrorist activity by the Islamic State in Iraq and Syria (“ISIS”), a radical Sunni group.
| * | Indexes are unmanaged, do not incur fees or expenses and cannot be purchased directly for investment. |
4
MML Series Investment Fund – Economic and Market Overview (Unaudited) (Continued)
Q3 2014: Gains narrow as concerns increase about global growth
Large-capitalization U.S. stocks overcame negative markets in July and September to finish the third quarter of 2014 with modest upside progress. However, shares of small and mid-size U.S. companies, foreign stocks from developed and emerging markets, and high-yield bonds struggled, as investors took a more risk-averse approach. Bonds were basically flat for the quarter.
Trouble overseas was one reason for increased investor caution. At the end of July, U.S. stocks suffered a sharp one-day decline after Argentina effectively defaulted on its bonds for the second time in 13 years. Around the same time, the share price of Banco Espirito Santo, Portugal’s largest bank, plunged after it reported a huge $4.8 billion first-half loss that wiped out the bank’s capital cushion and forced it to seek new funding.
In Eastern Europe, the standoff between Ukraine and Russia intensified. In the Middle East, there was a resurgence of the conflict between Israel and Hamas, and the threat of ISIS continued to grow.
Despite these developments, the negative impact on U.S. markets was relatively fleeting, as investor sentiment was buoyed by encouraging news about the U.S. economy. Data reported at the end of July showed that GDP, a broad measure of economic activity, advanced a robust 4.0% in the second quarter after contracting 2.1% in a first quarter hampered by severe winter weather. At the end of September, the second-quarter figure was revised upward to 4.6%.
Healthy U.S. economic growth stood in stark contrast to the euro zone, where economic activity was stagnant – and Japan, whose economy contracted sharply in the second quarter, according to data that became available in the third quarter. This discrepancy among developed nations helped trigger a significant rally in the U.S. dollar, which depressed the dollar-denominated returns of foreign markets.
Q4 2014: Volatility increases, but U.S. stocks hit new all-time highs
Investors shook off numerous concerns to drive U.S. stocks to healthy gains in the fourth quarter and to new highs for the year. Plunging crude oil prices, the spread of the Ebola virus in West Africa and beyond, and disappointing economic data from Europe and China were some of the factors keeping investors on edge and contributing to two noteworthy – but relatively short – sell-offs during the quarter. In November, the market reacted positively to the results of the U.S. midterm elections, but the impact was muted, as investors had anticipated Republicans would take control of the U.S. Senate weeks prior to the elections.
Oil’s decline – partly a result of increasing supply from North American shale beds – accelerated in late November after the Organization of Petroleum Exporting Countries (“OPEC”) announced its decision not to cut production. Good news on the U.S. economy was a major factor lifting share prices. GDP expanded by an upwardly revised 5.0% in the third quarter, its fastest pace since the third quarter of 2003. This strong performance stood in stark contrast to near-recessionary conditions afflicting most other key developed nations. Notably, the 18-member euro zone barely managed positive economic growth during the third quarter and rose just 0.2%. Foreign markets underperformed, as the U.S. dollar rose against other major currencies driven by U.S. economic strength and declining oil prices.
As 2014 drew to a close, the low price of oil, the weakness of overseas economies, and possible actions by the Fed and other central banks around the world were on the minds of many investors as they focused on the factors likely to impact the markets in the year ahead. Investors will also likely keep an eye out for continued economic growth here at home and improvement abroad, which may help create a favorable environment for stocks and bonds in 2015.
The information provided is the opinion of MassMutual Retirement Services Investment Services as of 1/1/15 and is subject to change without notice. It is not to be construed as tax, legal, or investment advice. Of course, past performance does not guarantee future results.
5
MML Blue Chip Growth Fund – Portfolio Manager Report (Unaudited)
What is the investment approach of MML Blue Chip Growth Fund, and who is the Fund’s subadviser?
The Fund seeks long-term capital growth. Income is a secondary objective. Under normal circumstances, the Fund invests at least 80% of net assets in the common stocks of large- and medium-sized blue chip growth companies. The Fund’s subadviser currently defines blue chip growth companies to mean firms that, in its view, are well-established in their industries and have the potential for above-average earnings growth. The Fund’s subadviser is T. Rowe Price Associates, Inc. (T. Rowe Price).
How did the Fund perform during the 12 months ended December 31, 2014?
The Fund’s Initial Class shares returned 9.13%, lagging the 13.05% return of the Russell 1000® Growth Index (the “benchmark”), an unmanaged index consisting of those Russell 1000 securities (representing the 1,000 largest U.S. companies based on market capitalization) with greater than average growth orientation that tend to exhibit higher price-to-book ratios and higher forecasted growth rates than securities in the value universe. The Fund also underperformed the 13.69% return of the S&P 500® Index, a widely recognized, unmanaged index representative of common stocks of larger capitalized U.S. companies.
For a discussion on the economic and market environment during the 12-month period ended December 31, 2014, please see the Economic and Market Overview, beginning on page 3.
Subadviser discussion of factors that contributed to the Fund’s performance
Less-than-favorable overall stock selection was the reason for the Fund’s relative underperformance in 2014; however, the Fund’s sector allocations were notably positive. Fund holdings in the consumer discretionary, information technology, and energy sectors were the largest relative detractors; health care, materials, and financials were the leading outperformers.
Consumer discretionary was by far the Fund’s largest relative detractor, primarily due to stock selection, although the Fund’s overweight allocation to the sector was also detrimental. Fund holdings in the hotels, restaurants, and leisure industry underperformed. The Fund’s overweight position in Wynn Resorts, relative to the benchmark, hurt performance, as concerns of decelerating VIP gambling traffic in Macau weighed on the gaming giant.
Stock selection also led to underperformance in information technology, and the Fund’s underweight positioning in the sector detracted slightly as well. The Fund’s underweight allocation to Apple hurt performance, as the company’s shares were up sharply due to investor optimism about the iPhone 6. Despite strong revenue growth, Fund holding Google disappointed in 2014, as the Internet behemoth invested heavily in additional data center capacity and acquisitions.
The energy sector detracted due to stock selection, more than offsetting beneficial underweight positioning in the underperforming market segment. Shares of Fund holding Range Resources, an oil and gas exploration and production company, declined over the past year, lagging the broader energy sector, as mild summer weather in the U.S. and robust supply drove down natural gas prices in 2014.
Health care was the Fund’s leading relative outperformer for the year, driven by the significantly overweight positioning in this top-performing sector. Fund holding Gilead Sciences, a biotechnology company, was among the top positive contributors to overall Fund performance for the year on strong sales of Sovaldi, its hepatitis C drug, and the Stribild HIV pill, which continued to drive company growth.
The Fund’s materials sector outperformed, relative to the benchmark, mainly due to stock selection. Paint manufacturer and retailer Sherwin-Williams is a Fund holding experiencing strong growth from higher overall demand. The paint company’s recent acquisition of paint industry competitor Comex Group’s U.S. and Canadian businesses is performing ahead of expectations. Sherwin-Williams is well positioned as the leading U.S. paint producer and generates most of its sales through its own stores.
Subadviser outlook
We expect the stock environment may remain favorable in 2015, barring an extraordinary event. China still poses some risk, in our view, and it is possible that the euro zone’s sluggish economy and struggle with deflation will linger for longer than expected.
6
MML Blue Chip Growth Fund – Portfolio Manager Report (Unaudited) (Continued)
On a positive note, we believe that commodities prices and inflation are likely to remain contained and interest rates are likely to stay low, even if the Federal Reserve takes action. The earnings outlook for various sectors appears promising. We are focusing on what we call “all-season” growth companies – those with the ability to grow earnings regardless of macro-economic conditions for the Fund.
| | | | |
MML Blue Chip Growth Fund
Largest Holdings
(% of Net Assets) on 12/31/14 | |
| | |
Amazon.com, Inc. | | | 3.9 | % |
The Priceline Group, Inc. | | | 3.0 | % |
Gilead Sciences, Inc. | | | 2.9 | % |
McKesson Corp. | | | 2.8 | % |
Visa, Inc. Class A | | | 2.6 | % |
Biogen Idec, Inc. | | | 2.6 | % |
Danaher Corp. | | | 2.6 | % |
MasterCard, Inc. Class A | | | 2.6 | % |
Facebook, Inc. Class A | | | 2.5 | % |
Baidu, Inc. Sponsored ADR (Cayman Islands) | | | 2.5 | % |
| | | | | |
| | | | 28.0 | % |
| | | | | |
| | | | |
MML Blue Chip Growth Fund
Sector Table
(% of Net Assets) on 12/31/14 | |
| | |
Consumer, Non-cyclical | | | 28.6 | % |
Communications | | | 22.1 | % |
Consumer, Cyclical | | | 18.0 | % |
Industrial | | | 12.0 | % |
Financial | | | 7.7 | % |
Technology | | | 4.8 | % |
Basic Materials | | | 3.9 | % |
Energy | | | 2.5 | % |
Mutual Funds | | | 0.0 | % |
| | | | | |
Total Long-Term Investments | | | 99.6 | % |
Short-Term Investments and Other Assets and Liabilities | | | 0.4 | % |
| | | | | |
Net Assets | | | 100.0 | % |
| | | | | |
7
MML Blue Chip Growth Fund – Portfolio Manager Report (Unaudited) (Continued)
Growth of a $10,000 Investment
Hypothetical Investments in MML Blue Chip Growth Fund Initial Class, the Russell 1000 Growth Index, and the S&P 500 Index.
| | | | | | | | | | | | |
| | | | |
| TOTAL RETURN | | One Year
1/1/14 -
12/31/14 | | | Five Year
Average
Annual
1/1/10 -
12/31/14 | | | Since
Inception
Average
Annual
5/1/06 -
12/31/14 | |
Initial Class | | | 9.13% | | | | 16.53% | | | | 8.95% | |
Russell 1000 Growth Index* | | | 13.05% | | | | 15.81% | | | | 8.84% | |
S&P 500 Index | | | 13.69% | | | | 15.45% | | | | 7.62% | |
Hypothetical Investments in MML Blue Chip Growth Fund Service Class, the Russell 1000 Growth Index, and the S&P 500 Index.
| | | | | | | | | | | | |
| | | | |
| TOTAL RETURN | | One Year
1/1/14 -
12/31/14 | | | Five Year
Average
Annual
1/1/10 -
12/31/14 | | | Since
Inception
Average
Annual
8/15/08 -
12/31/14 | |
Service Class | | | 8.87% | | | | 16.24% | | | | 10.78% | |
Russell 1000 Growth Index* | | | 13.05% | | | | 15.81% | | | | 10.82% | |
S&P 500 Index | | | 13.69% | | | | 15.45% | | | | 9.95% | |
GROWTH OF $10,000 INVESTMENT SINCE INCEPTION
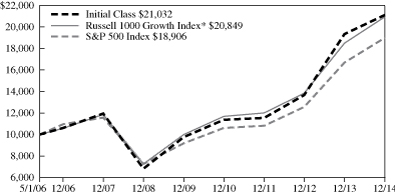
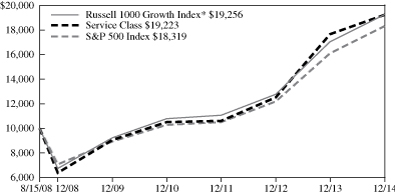
* Benchmark
Performance data quoted represents past performance; past performance is not predictive of future results. The investment return and principal value of shares of the Fund will fluctuate with market conditions so that shares of the Fund, when redeemed, may be worth more or less than their original cost. Current performance of the Fund may be lower or higher than the performance quoted. Performance data current to the most recent month end may be obtained by accessing the website www.massmutual.com.
Investors should note that the Fund is a professionally managed mutual fund, while the Russell 1000 Growth Index and the S&P 500 Index are unmanaged, do not incur expenses, and cannot be purchased directly by investors. Investors should read the Fund’s prospectus with regard to the Fund’s investment objective, risks, and charges and expenses in conjunction with these financial statements. The Fund’s return reflects changes in the net asset value per share without the deduction of any product charges (e.g., cost of insurance, mortality and expense risk charges, administrative fees, and CDSL). The inclusion of these charges would have reduced the performance shown here.
8
MML Equity Income Fund – Portfolio Manager Report (Unaudited)
What is the investment approach of MML Equity Income Fund, and who is the Fund’s subadviser?
The Fund seeks dividend income and long-term capital growth by investing primarily in the common stocks of established companies. Under normal circumstances, the Fund invests at least 80% of its net assets in common stocks, with 65% in the common stocks of well-established companies paying above-average dividends. The Fund’s subadviser currently considers well-established companies to mean companies that it considers to be seasoned companies with relatively long operating histories. The Fund’s subadviser is T. Rowe Price Associates, Inc. (T. Rowe Price).
How did the Fund perform during the 12 months ended December 31, 2014?
The Fund’s Initial Class shares returned 7.54%, significantly trailing the 13.69% return of the S&P 500® Index (the “benchmark”), a widely recognized, unmanaged index representative of common stocks of larger capitalized U.S. companies. Similarly, the Fund substantially underperformed the 13.45% return of the Russell 1000® Value Index, an unmanaged index consisting of those Russell 1000 securities (representing the 1,000 largest U.S. companies, based on market capitalization) with greater than average value orientation that tend to exhibit lower price-to-book ratios and lower forecasted growth rates than securities in the growth universe.
For a discussion on the economic and market environment during the 12-month period ended December 31, 2014, please see the Economic and Market Overview, beginning on page 3.
Subadviser discussion of factors that contributed to the Fund’s performance
Stock selection and sector allocation both detracted from the Fund’s relative performance during 2014. On a sector-specific basis, health care and energy stocks hampered relative results, while utilities and materials stocks contributed positively.
The Fund’s health care positioning was the most notable detractor from performance during the year, as a result of stock choices and a detrimental underweight position in the sector, relative to the benchmark. Fund holding GlaxoSmithKline hurt returns in this market segment, as the U.K.-based pharmaceutical company experienced ongoing difficulty getting its respiratory treatments reimbursed by insurance plans, although the company expects to resolve the problem.
In energy, the Fund’s overweight position and stock selection both proved detrimental. Among the underperforming Fund holdings was Apache, an oil and gas exploration and production company. Despite continuing to sell off its weaker non-core assets, Apache declined sharply amid falling commodity prices. We maintained the Fund’s position because we expect the company may improve performance by focusing on U.S. onshore oil and natural gas production.
On the positive side, the Fund’s utilities sector stock holdings outperformed relative to the benchmark. A top performer for the Fund was Entergy, an integrated energy company engaged primarily in electric power production and retail distribution operations, which surged due to colder weather earlier in the year and stricter Environmental Protection Agency guidelines that reinforce the need for the company’s nuclear power plants.
Stock selection in materials was another area of relative strength for the Fund in 2014, most notably, International Paper, which benefited from strong operational performance in a highly consolidated market led by a skilled new chief executive officer. We selectively trimmed the Fund’s position following periods of advancement for the stock during the year, but we see further upside potential due to the company’s strong balance sheet and management’s ability to raise dividends or buy back shares.
Subadviser outlook
We remain cautiously optimistic after another strong year for U.S. equities. Our view is that equity returns have been driven by rising expectations more than earnings growth, creating an environment where positive sentiment is outpacing the improvement in fundamentals. Despite our cautious stance in the current environment, we remain positive on the equity market over the long term.
9
MML Equity Income Fund – Portfolio Manager Report (Unaudited) (Continued)
Given current valuations, we are finding opportunities for the Fund in specific companies rather than in larger themes. In the current environment, we plan to trim the Fund’s holdings to what we see as our best ideas and maintain a somewhat higher cash position until we find companies for the Fund that we believe have reasonable valuations.
| | | | |
MML Equity Income Fund
Largest Holdings
(% of Net Assets) on 12/31/14 | |
| | |
JP Morgan Chase & Co. | | | 2.7 | % |
General Electric Co. | | | 2.7 | % |
T. Rowe Price Reserve Investment Fund 0.010% 9/19/34 | | | 2.3 | % |
Wells Fargo & Co. | | | 2.2 | % |
Chevron Corp. | | | 1.9 | % |
U.S. Bancorp | | | 1.9 | % |
Bank of America Corp. | | | 1.8 | % |
Exxon Mobil Corp. | | | 1.8 | % |
Johnson & Johnson | | | 1.6 | % |
Illinois Tool Works, Inc. | | | 1.6 | % |
| | | | | |
| | | | 20.5 | % |
| | | | | |
| | | | |
MML Equity Income Fund
Sector Table
(% of Net Assets) on 12/31/14 | |
| | |
Financial | | | 19.0 | % |
Industrial | | | 13.2 | % |
Energy | | | 12.2 | % |
Communications | | | 11.4 | % |
Consumer, Non-cyclical | | | 11.3 | % |
Consumer, Cyclical | | | 8.1 | % |
Utilities | | | 6.5 | % |
Technology | | | 5.8 | % |
Basic Materials | | | 5.4 | % |
Mutual Funds | | | 2.3 | % |
| | | | | |
Total Long-Term Investments | | | 95.2 | % |
Short-Term Investments and Other Assets and Liabilities | | | 4.8 | % |
| | | | | |
Net Assets | | | 100.0 | % |
| | | | | |
10
MML Equity Income Fund – Portfolio Manager Report (Unaudited) (Continued)
Growth of a $10,000 Investment
Hypothetical Investments in MML Equity Income Fund Initial Class, the S&P 500 Index, and the Russell 1000 Value Index.
| | | | | | | | | | | | |
| | | | |
| TOTAL RETURN | | One Year
1/1/14 -
12/31/14 | | | Five Year
Average
Annual
1/1/10 -
12/31/14 | | | Since
Inception
Average
Annual
5/1/06 -
12/31/14 | |
Initial Class | | | 7.54% | | | | 13.33% | | | | 6.45% | |
S&P 500 Index* | | | 13.69% | | | | 15.45% | | | | 7.62% | |
Russell 1000 Value Index | | | 13.45% | | | | 15.42% | | | | 6.59% | |
Hypothetical Investments in MML Equity Income Fund Service Class, the S&P 500 Index, and the Russell 1000 Value Index.
| | | | | | | | | | | | |
| | | | |
| TOTAL RETURN | | One Year
1/1/14 -
12/31/14 | | | Five Year
Average
Annual
1/1/10 -
12/31/14 | | | Since
Inception
Average
Annual
8/15/08 -
12/31/14 | |
Service Class | | | 7.23% | | | | 13.06% | | | | 8.26% | |
S&P 500 Index* | | | 13.69% | | | | 15.45% | | | | 9.95% | |
Russell 1000 Value Index | | | 13.45% | | | | 15.42% | | | | 9.36% | |
GROWTH OF $10,000 INVESTMENT SINCE INCEPTION
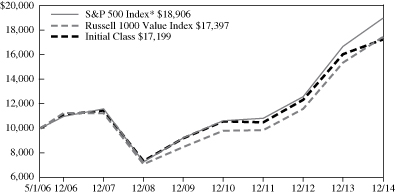
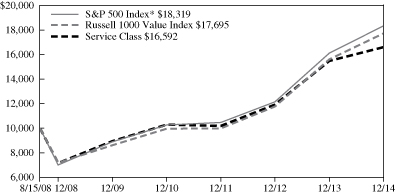
* Benchmark
Performance data quoted represents past performance; past performance is not predictive of future results. The investment return and principal value of shares of the Fund will fluctuate with market conditions so that shares of the Fund, when redeemed, may be worth more or less than their original cost. Current performance of the Fund may be lower or higher than the performance quoted. Performance data current to the most recent month end may be obtained by accessing the website www.massmutual.com.
Investors should note that the Fund is a professionally managed mutual fund, while the S&P 500 Index and the Russell 1000 Value Index are unmanaged, do not incur expenses, and cannot be purchased directly by investors. Investors should read the Fund’s prospectus with regard to the Fund’s investment objective, risks, and charges and expenses in conjunction with these financial statements. The Fund’s return reflects changes in the net asset value per share without the deduction of any product charges (e.g., cost of insurance, mortality and expense risk charges, administrative fees, and CDSL). The inclusion of these charges would have reduced the performance shown here.
11
MML Equity Index Fund – Portfolio Manager Report (Unaudited)
What is the investment approach of MML Equity Index Fund, and who is the Fund’s subadviser?
The Fund’s investment objective is to provide investment results that correspond to the price and yield performance of publicly traded common stocks in the aggregate as represented by the S&P 500® Index* (the “Index”). Under normal circumstances, the Fund invests at least 80% (and, typically, substantially all) of its net assets in the equity securities of companies included within the Index. The Fund’s subadviser is Northern Trust Investments, Inc. (NTI).
How did the Fund perform during the 12 months ended December 31, 2014?
The Fund’s Class I shares returned 13.17%, slightly lagging the 13.69% return of the Index, a widely recognized, unmanaged index representative of common stocks of larger capitalized U.S. companies.
For a discussion on the economic and market environment during the 12-month period ended December 31, 2014, please see the Economic and Market Overview, beginning on page 3.
Subadviser discussion of factors that contributed to the Fund’s performance
The Fund’s underperformance versus the Index is mainly attributable to the impact of fees and expenses necessary for the management and operation of the Fund. The Index is not subject to fees or expenses, and it is not possible to invest directly in the Index.
During 2014, utilities and health care were the strongest-performing sectors within the Index; conversely, the energy and telecommunication services sectors turned in the worst performances.
The U.S. outperformed international markets in 2014, as the domestic economy exhibited signs of sustained improvement. Weak economic data from international developed markets, strong economic data, and corporate earnings in the U.S. continued to support growth expectations and drove investors to seek the relative safety of U.S. assets.
Although the October Federal Open Market Committee (FOMC) marked the end of the Quantitative Easing (“QE”) program – which consisted of ongoing government bond purchases designed to drive down interest rates and stimulate economic growth – Federal Reserve (the “Fed”) Chairman Janet Yellen continued to support low interest rates for an extended period of time. The December 2014 minutes showed initial rate hikes would be unlikely until at least mid-2015, as strong economic data in the U.S. supported the end of QE. The market reacted positively, as investors widely anticipated the news and were encouraged by the Fed’s pledge to keep rates low into 2015.
U.S. equities experienced a year of modest gains, as strong corporate earnings and economic data bolstered confidence in the U.S. economy. While the year started slowly, partly due to weak consumer spending related to an unusually harsh winter, U.S. equities shrugged it off as improved corporate earnings and economic data led to increased confidence in the U.S. economy. In 2014, there was also a flurry of corporate actions with the largest wave of issuances of bonds and acquisitions in recent years, as companies sought to take advantage of low rates and tax advantages from re-domiciling, though recent government action led to the disintegration of some deals. Elsewhere, global central banks – including the European Central Bank and the People’s Bank of China, China’s central bank – became increasingly accommodative, which helped propel global stocks higher.
Subadviser outlook
Our view is that various factors, such as Fed policy, oil prices, housing, and unemployment, among others, will continue to play an influential role in the direction the equity markets will take in 2015. We do not manage the Fund according to a given outlook
| * | The S&P 500 Index is a product of S&P Dow Jones Indices LLC (“SPDJI”), and has been licensed for use by MML Advisers. Standard & Poor’s®, S&P® and S&P 500® are registered trademarks of Standard & Poor’s Financial Services LLC (“S&P”); Dow Jones® is a registered trademark of Dow Jones Trademark Holdings LLC (“Dow Jones”); and these trademarks have been licensed for use by SPDJI and sublicensed for certain purposes by MML Advisers. The Fund is not sponsored, endorsed, sold or promoted by SPDJI, Dow Jones, S&P, their respective affiliates, and none of such parties make any representation regarding the advisability of investing in such product(s) nor do they have any liability for any errors, omissions, or interruptions of the S&P 500 Index. |
12
MML Equity Index Fund – Portfolio Manager Report (Unaudited) (Continued)
for the equity markets or the economy in general, because we are managing an index fund that seeks to replicate as closely as possible (before deduction of expenses) the broad diversification and returns of the Index. Nevertheless, we will monitor economic conditions and their effect on the financial markets as we seek to track the Index’s performance closely.
| | | | |
MML Equity Index Fund
Largest Holdings
(% of Net Assets) on 12/31/14 | |
| | |
Apple, Inc. | | | 3.5 | % |
Exxon Mobil Corp. | | | 2.1 | % |
Microsoft Corp. | | | 2.1 | % |
Johnson & Johnson | | | 1.6 | % |
Berkshire Hathaway, Inc. Class B | | | 1.5 | % |
Wells Fargo & Co. | | | 1.4 | % |
General Electric Co. | | | 1.4 | % |
The Procter & Gamble Co. | | | 1.3 | % |
JP Morgan Chase & Co. | | | 1.3 | % |
Chevron Corp. | | | 1.1 | % |
| | | | | |
| | | | 17.3 | % |
| | | | | |
| | | | |
MML Equity Index Fund
Sector Table
(% of Net Assets) on 12/31/14 | |
| | |
Consumer, Non-cyclical | | | 23.4 | % |
Financial | | | 16.1 | % |
Technology | | | 12.5 | % |
Communications | | | 12.2 | % |
Consumer, Cyclical | | | 9.9 | % |
Industrial | | | 9.8 | % |
Energy | | | 8.3 | % |
Utilities | | | 3.2 | % |
Basic Materials | | | 2.9 | % |
Diversified | | | 0.1 | % |
| | | | | |
Total Long-Term Investments | | | 98.4 | % |
Short-Term Investments and Other Assets and Liabilities | | | 1.6 | % |
| | | | | |
Net Assets | | | 100.0 | % |
| | | | | |
13
MML Equity Index Fund – Portfolio Manager Report (Unaudited) (Continued)
Growth of a $10,000 Investment
Hypothetical Investments in MML Equity Index Fund Class I, Class II, Class III, and the S&P 500 Index.
| | | | | | | | | | | | |
| | | | |
| TOTAL RETURN | | One Year
1/1/14 -
12/31/14 | | | Five Year
Average
Annual
1/1/10 -
12/31/14 | | | Ten Year
Average
Annual
1/1/05 -
12/31/14 | |
Class I | | | 13.17% | | | | 14.95% | | | | 7.24% | |
Class II | | | 13.35% | | | | 15.14% | | | | 7.42% | |
Class III | | | 13.54% | | | | 15.30% | | | | 7.57% | |
S&P 500 Index | | | 13.69% | | | | 15.45% | | | | 7.67% | |
Hypothetical Investments in MML Equity Index Fund Service Class I and the S&P 500 Index.
| | | | | | | | | | | | |
| | | | |
| TOTAL RETURN | | One Year
1/1/14 -
12/31/14 | | | Five Year
Average
Annual
1/1/10 -
12/31/14 | | | Since
Inception
Average
Annual
8/15/08 -
12/31/14 | |
Service Class I | | | 12.92% | | | | 14.67% | | | | 9.24% | |
S&P 500 Index | | | 13.69% | | | | 15.45% | | | | 9.95% | |
GROWTH OF $10,000 INVESTMENT FOR THE PAST 10 YEARS
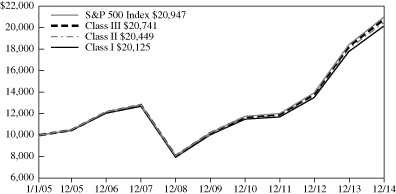
GROWTH OF $10,000 INVESTMENT SINCE INCEPTION
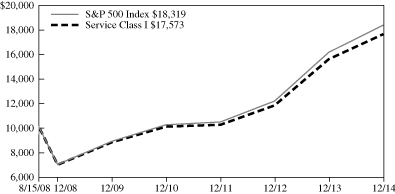
Performance data quoted represents past performance; past performance is not predictive of future results. The investment return and principal value of shares of the Fund will fluctuate with market conditions so that shares of the Fund, when redeemed, may be worth more or less than their original cost. Current performance of the Fund may be lower or higher than the performance quoted. Performance data current to the most recent month end may be obtained by accessing the website www.massmutual.com.
Investors should note that the Fund is a professionally managed mutual fund, while the S&P 500 Index is unmanaged, does not incur expenses, and cannot be purchased directly by investors. Investors should read the Fund’s prospectus with regard to the Fund’s investment objective, risks, and charges and expenses in conjunction with these financial statements. The Fund’s return reflects changes in the net asset value per share without the deduction of any product charges (e.g., cost of insurance, mortality and expense risk charges, administrative fees, and CDSL). The inclusion of these charges would have reduced the performance shown here.
14
MML Focused Equity Fund – Portfolio Manager Report (Unaudited)
What is the investment approach of MML Focused Equity Fund, and who is the Fund’s subadviser?
The Fund seeks growth of capital over the long-term by investing primarily in equity securities of U.S. companies that the Fund’s subadviser believes are undervalued. Under normal circumstances, the Fund invests at least 80% of its net assets in equity securities. The Fund’s subadviser is Harris Associates L.P. (Harris).
How did the Fund perform during the 12 months ended December 31, 2014?
The Fund’s Class II shares returned 12.24%, underperforming the 13.24% return of the Russell 1000® Index (the “benchmark”), a widely recognized, unmanaged index representing the performance of common stocks of larger capitalized U.S. companies.
For a discussion on the economic and market environment during the 12-month period ended December 31, 2014, please see the Economic and Market Overview, beginning on page 3.
Subadviser discussion of factors that contributed to the Fund’s performance
The consumer discretionary sector supplied the smallest collective absolute return in 2014. A lack of exposure to the health care sector and Fund positioning in the materials and financials sectors were the largest detractors from performance, relative to the benchmark, for the year.
With respect to specific Fund holdings, commodity trader and mining company Glencore, in the materials sector, hampered overall Fund performance when the company’s share price declined in tandem with commodity prices. Automobile maker General Motors, in the consumer discretionary sector, was the next largest detractor from the Fund’s overall 2014 return. Additionally, Penn National Gaming and Delphi Automotive, also in consumer discretionary, had negative returns; the Fund subsequently sold Delphi Automotive in the first quarter of 2014.
On the upside, seven of 10 underlying consumer discretionary holdings gained value – with the largest returns coming from retailers CarMax and Family Dollar Stores. The technology sector produced the largest return and also contributed most to the Fund’s overall performance for the year, as all technology Fund holdings delivered positive returns, with most rising 20% or more. The top-performing technology companies were semiconductor maker Intel, consumer technology giant Apple, and semiconductor production equipment maker Applied Materials.
The best-performing Fund holding overall was Intel, followed by Apple and Applied Materials. Intel experienced a pattern of increases in revenues and gross margins and the beginnings of stabilizing sales of PCs that house the company’s chips. Intel continued to return profits to shareholders and announced an increase of its annual dividend by 6.7% in its fiscal-year 2015 outlook.
Subadviser outlook
We believe carefully assessing company valuations and corporate fundamentals offers the greatest opportunity for long-term investment success. This outlook, however, is balanced by our view that recent equity performance likely already reflects many of the positive factors that have been working for companies.
With stock valuations resting above long-term averages, we believe the ability to generate investment returns is attributable primarily to earnings and sensible stock selection. In the past, commodity price declines have helped support improved earnings and gross domestic product growth. Our view is that a similar result may occur in 2015 as well. Our challenge, as always, is to identify the strongest, most attractively priced businesses for the Fund.
15
MML Focused Equity Fund – Portfolio Manager Report (Unaudited) (Continued)
| | | | |
MML Focused Equity Fund
Largest Holdings
(% of Net Assets) on 12/31/14 | |
| | |
Intel Corp. | | | 7.0 | % |
Wells Fargo & Co. | | | 6.6 | % |
Apple, Inc. | | | 6.2 | % |
General Motors Co. | | | 6.1 | % |
American International Group, Inc. | | | 5.6 | % |
Ralph Lauren Corp. | | | 5.0 | % |
JP Morgan Chase & Co. | | | 4.9 | % |
Glencore PLC ADR (United Kingdom) | | | 4.7 | % |
Franklin Resources, Inc. | | | 4.7 | % |
Aon PLC | | | 4.5 | % |
| | | | | |
| | | | 55.3 | % |
| | | | | |
| | | | |
MML Focused Equity Fund
Sector Table
(% of Net Assets) on 12/31/14 | |
| | |
Financial | | | 34.7 | % |
Consumer, Cyclical | | | 22.9 | % |
Technology | | | 16.7 | % |
Basic Materials | | | 4.7 | % |
Communications | | | 4.4 | % |
Consumer, Non-cyclical | | | 4.0 | % |
Energy | | | 3.7 | % |
| | | | | |
Total Long-Term Investments | | | 91.1 | % |
Short-Term Investments and Other Assets and Liabilities | | | 8.9 | % |
| | | | | |
Net Assets | | | 100.0 | % |
| | | | | |
16
MML Focused Equity Fund – Portfolio Manager Report (Unaudited) (Continued)
Growth of a $10,000 Investment
Hypothetical Investments in MML Focused Equity Fund Class II and the Russell 1000 Index.
| | | | | | | | |
| | | |
| TOTAL RETURN | | One Year
1/1/14 -
12/31/14 | | | Since
Inception
Average
Annual
12/8/11 -
12/31/14 | |
Class II | | | 12.24% | | | | 22.81% | |
Russell 1000 Index | | | 13.24% | | | | 20.03% | |
Hypothetical Investments in MML Focused Equity Fund Service Class I and the Russell 1000 Index.
| | | | | | | | |
| | | |
| TOTAL RETURN | | One Year
1/1/14 -
12/31/14 | | | Since
Inception
Average
Annual
5/1/12 -
12/31/14 | |
Service Class I | | | 11.97% | | | | 19.61% | |
Russell 1000 Index | | | 13.24% | | | | 18.22% | |
GROWTH OF $10,000 INVESTMENT SINCE INCEPTION
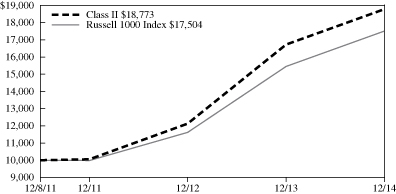
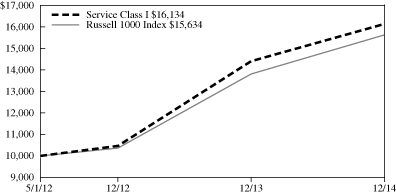
Performance data quoted represents past performance; past performance is not predictive of future results. The investment return and principal value of shares of the Fund will fluctuate with market conditions so that shares of the Fund, when redeemed, may be worth more or less than their original cost. Current performance of the Fund may be lower or higher than the performance quoted. Performance data current to the most recent month end may be obtained by accessing the website www.massmutual.com
Investors should note that the Fund is a professionally managed mutual fund, while the Russell 1000 Index is unmanaged, does not incur expenses, and cannot be purchased directly by investors. Investors should read the Fund's prospectus with regard to the Fund's investment objective, risks, and charges and expenses in conjunction with these financial statements. The Fund's return reflects changes in the net asset value per share without the deduction of any product charges (e.g., cost of insurance, mortality and expense risk charges, administrative fees, and CDSL). The inclusion of these charges would have reduced the performance shown here.
17
MML Foreign Fund – Portfolio Manager Report (Unaudited)
What is the investment approach of MML Foreign Fund, and who is the Fund’s subadviser?
The Fund seeks long-term capital growth by investing, under normal circumstances, at least 80% of its net assets in investments of issuers located outside of the U.S., including those in emerging markets. Under normal market conditions, the Fund invests predominantly in equity securities, consisting primarily to predominantly of common stocks, and, while there are no set percentage targets, the Fund invests predominantly in large- to medium-capitalization companies with market capitalization values greater than $2 billion and may invest a portion in smaller companies. The Fund’s subadviser is Templeton Investment Counsel, LLC (Templeton).
How did the Fund perform during the 12 months ended December 31, 2014?
The Fund’s Initial Class shares returned -6.97%, trailing the -4.90% return of the MSCI EAFE Index (the “benchmark”), a widely recognized, unmanaged index representative of equity securities in developed markets, excluding the U.S. and Canada.
For a discussion on the economic and market environment during the 12-month period ended December 31, 2014, please see the Economic and Market Overview, beginning on page 3.
Subadviser discussion of factors that contributed to the Fund’s performance
Stock selection in Europe, particularly in the Netherlands, France, and the U.K., detracted from the Fund’s relative performance during 2014. Overweight positioning in Portugal and exposure to Canada, a country not included in the benchmark, also weighed on the Fund’s relative results. Conversely, stock selection in Asia, notably in Japan and in China and India, two countries not included in the benchmark, and an overweight position in Singapore, relative to the benchmark, benefited the Fund’s performance. Overweight positioning in Israel and stock selection in Australia and Germany also contributed to the Fund’s relative results.
In the energy sector, declining oil prices during the second half of the year amplified weak stock selection and an overweight position in this underperforming market segment, all of which hindered relative performance. Fund holdings that were major detractors within energy included four oil and natural gas companies – Galp Energia (Portugal), along with three holdings that were not included in the benchmark: KunLun Energy (China), Petroleo Brasileiro (Brazil), and Talisman Energy (Canada) – as well as Netherlands-based energy equipment and services company SBM Offshore, which is also not included in the benchmark. Stock selection in the consumer staples sector, including conglomerate Tesco (U.K.), also weighed on the Fund’s relative performance. Other notable detractors included Fund holdings in mail and parcel carrier TNT Express (Netherlands) and Swedish medical technology company Getinge.
From a sector perspective, the Fund’s relative performance benefited from stock selection in financials, with major contributors including commercial banks ICICI Bank (India), which is not in the benchmark; DBS Group Holdings (Singapore); and insurer China Life Insurance (China), another stock not included in the benchmark. Stock selection in industrials and telecommunication services also aided performance, including Fund holdings such as Australian airline operator Qantas Airways and Chinese diversified telecommunication provider China Telecom, which is another non-benchmark stock. Other notable contributors included drug companies Teva Pharmaceutical Industries (Israel) and Shire (U.K.), off-benchmark transportation vehicle manufacturer CSR (China), Japanese auto manufacturer Toyota Motor, and Australia-based metals and energy mining company BHP Billiton.
The U.S. dollar appreciated against most foreign currencies, which also hurt the Fund’s performance because investments in securities with non-U.S. currency exposure lost value as the dollar rose.
Subadviser outlook
During the year, we believe Europe’s weakness was exacerbated by ongoing geopolitical tensions in Russia and Ukraine. Russia’s economic clout in Europe is modest, however, accounting for a small percentage of European exports. We continue to believe stocks in Europe generally have been inexpensive, corporate earnings have recovery potential, and support possibly remains from structural reforms, monetary easing, a weaker euro, and falling oil prices. We also believe the Fund’s energy holdings are well
18
MML Foreign Fund – Portfolio Manager Report (Unaudited) (Continued)
supported by economic fundamentals, and that value may be beginning to emerge in the sector as pessimism intensifies. In general, we will seek to use intermittent price weakness for opportunistic bargain hunting across diverse markets in our search for stocks for the Fund. Ultimately, the process of value recognition can take time when stocks trade on negative sentiment or near-term prospects. As equity correlations decline and investors focus more on fundamentals, we believe the environment is likely to be favorable for bottom-up, value-oriented stock pickers, which represents our approach.
| | | | |
MML Foreign Fund
Largest Holdings
(% of Net Assets) on 12/31/14 | |
| | |
Sanofi | | | 2.6 | % |
Samsung Electronics Co., Ltd. | | | 2.2 | % |
Roche Holding AG | | | 2.2 | % |
Toyota Motor Corp. Sponsored ADR (Japan) | | | 1.9 | % |
Bayer AG | | | 1.9 | % |
BNP Paribas | | | 1.8 | % |
HSBC Holdings PLC | | | 1.8 | % |
Akzo Nobel NV | | | 1.7 | % |
GlaxoSmithKline PLC | | | 1.7 | % |
Teva Pharmaceutical Industries Ltd. Sponsored ADR (Israel) | | | 1.6 | % |
| | | | | |
| | | | 19.4 | % |
| | | | | |
| | | | |
MML Foreign Fund
Sector Table
(% of Net Assets) on 12/31/14 | |
| | |
Financial | | | 24.2 | % |
Consumer, Non-cyclical | | | 17.0 | % |
Industrial | | | 11.1 | % |
Consumer, Cyclical | | | 10.7 | % |
Communications | | | 10.5 | % |
Energy | | | 9.2 | % |
Mutual Funds | | | 4.4 | % |
Technology | | | 4.2 | % |
Basic Materials | | | 3.5 | % |
Diversified | | | 1.8 | % |
| | | | | |
Total Long-Term Investments | | | 96.6 | % |
Short-Term Investments and Other Assets and Liabilities | | | 3.4 | % |
| | | | | |
Net Assets | | | 100.0 | % |
| | | | | |
19
MML Foreign Fund – Portfolio Manager Report (Unaudited) (Continued)
Growth of a $10,000 Investment
Hypothetical Investments in MML Foreign Fund Initial Class and the MSCI EAFE Index.
| | | | | | | | | | | | |
| | | | |
| TOTAL RETURN | | One Year
1/1/14 -
12/31/14 | | | Five Year
Average
Annual
1/1/10 -
12/31/14 | | | Since
Inception
Average
Annual
5/1/06 -
12/31/14 | |
Initial Class | | | -6.97% | | | | 4.77% | | | | 2.26% | |
MSCI EAFE Index | | | -4.90% | | | | 5.33% | | | | 1.98% | |
Hypothetical Investments in MML Foreign Fund Service Class and the MSCI EAFE Index.
| | | | | | | | | | | | |
| | | | |
| TOTAL RETURN | | One Year
1/1/14 -
12/31/14 | | | Five Year
Average
Annual
1/1/10 -
12/31/14 | | | Since
Inception
Average
Annual
8/15/08 -
12/31/14 | |
Service Class | | | -7.07% | | | | 4.54% | | | | 2.13% | |
MSCI EAFE Index | | | -4.90% | | | | 5.33% | | | | 2.53% | |
GROWTH OF $10,000 INVESTMENT SINCE INCEPTION
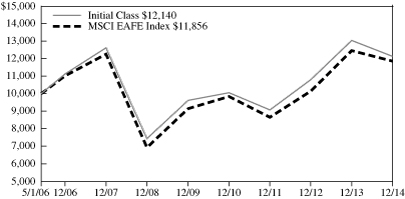
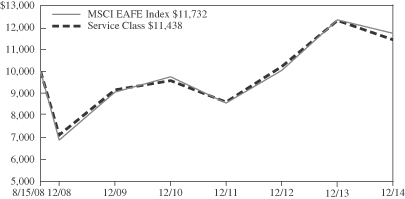
Performance data quoted represents past performance; past performance is not predictive of future results. The investment return and principal value of shares of the Fund will fluctuate with market conditions so that shares of the Fund, when redeemed, may be worth more or less than their original cost. Current performance of the Fund may be lower or higher than the performance quoted. Performance data current to the most recent month end may be obtained by accessing the website www.massmutual.com.
Investors should note that the Fund is a professionally managed mutual fund, while the MSCI EAFE Index is unmanaged, does not incur expenses, and cannot be purchased directly by investors. Investors should read the Fund’s prospectus with regard to the Fund’s investment objective, risks, and charges and expenses in conjunction with these financial statements. The Fund’s return reflects changes in the net asset value per share without the deduction of any product charges (e.g., cost of insurance, mortality and expense risk charges, administrative fees, and CDSL). The inclusion of these charges would have reduced the performance shown here.
20
MML Fundamental Growth Fund – Portfolio Manager Report (Unaudited)
What is the investment approach of MML Fundamental Growth Fund, and who is the Fund’s subadviser?
The Fund seeks long-term growth of capital by investing primarily in domestic equity securities that the Fund’s subadviser believes offer the potential for long-term growth. The Fund’s subadviser is Wellington Management Company LLP (Wellington Management).
How did the Fund perform during the 12 months ended December 31, 2014?
The Fund’s Class II shares returned 11.06%, underperforming the 13.05% return of the Russell 1000® Growth Index (the “benchmark”), an unmanaged index consisting of those Russell 1000 securities (representing the 1,000 largest U.S. companies based on market capitalization) with greater than average growth orientation that tend to exhibit higher price-to-book ratios and higher forecasted growth rates than securities in the value universe.
For a discussion on the economic and market environment during the 12-month period ended December 31, 2014, please see the Economic and Market Overview, beginning on page 3.
Subadviser discussion of factors that contributed to the Fund’s performance
The Fund’s less-than-favorable choices within industrials, financials, and energy stocks worked against favorable stock selection within the information technology, consumer staples, and materials sectors during 2014. A minor cash position in a rising market also weighed on the Fund’s relative results. Sector positioning, a residual of our bottom-up stock selection process, contributed modestly, as the Fund’s overweight allocation, relative to the benchmark, to the health care sector and underweight position in the lagging energy sector aided relative results.
Top detractors from relative performance during the year included Apache (energy) and Baker Hughes (energy). An underweight allocation to strong performer Apple (information technology) also weighed on relative results. Shares of Apache, an American independent oil and gas corporation, declined in the second half of the year due to the declining price of oil. We trimmed the Fund’s position in the company during the fourth quarter, but continued to hold the stock at year end. Shares of Baker Hughes, a U.S.-based oilfield services company, were also weak as a result of lower oil prices.
Top contributors to the Fund’s benchmark-relative returns included positions in semiconductor firm Skyworks Solutions (information technology) and biopharmaceutical company Vertex Pharmaceuticals (health care). Shares of Skyworks Solutions, which was exposed to favorable trends in mobile devices and wireless infrastructure, soared more than 150% during the period. Vertex Pharmaceuticals, which focuses on cancer and neurodegenerative diseases, launched its product to treat cystic fibrosis patients, which helped drive up the stock. An underweight allocation to Amazon.com (consumer discretionary) benefited relative Fund performance. The Fund did not own underperforming IBM (information technology), a stock represented in the benchmark, which also aided relative results. We increased the Fund’s exposure to information technology during the period. The sector remained the Fund’s largest overweight position at year end. The Fund also held an overweight stake in the health care sector as 2014 came to a close. Finally, we decreased the Fund’s exposure to the consumer discretionary and industrials sectors, the Fund’s largest underweights as of year-end, at which time the Fund also held an underweight position in the consumer staples and materials sectors.
Subadviser outlook
We continue to seek to maintain a balanced portfolio for the Fund – one that provides shareholders with exposure to what we consider an attractive combination of growth, quality, and valuation characteristics based on our proprietary forecasts. While the risk/reward of the investment universe is less attractive today than it was several years ago (as equity markets have continued their upward trajectory since then), we continue to find compelling areas of opportunity for the Fund.
Broadly speaking, we believe information technology has good organic growth prospects, attractive quality characteristics (high returns on capital and strong balance sheets), and remains one of the most attractive sectors based on our multiple scenario analysis valuation model.
21
MML Fundamental Growth Fund – Portfolio Manager Report (Unaudited) (Continued)
| | | | |
MML Fundamental Growth Fund
Largest Holdings
(% of Net Assets) on 12/31/14 | |
| | |
Apple, Inc. | | | 6.9 | % |
Microsoft Corp. | | | 4.8 | % |
Oracle Corp. | | | 3.8 | % |
Verizon Communications, Inc. | | | 2.7 | % |
Google, Inc. Class C | | | 2.4 | % |
The Home Depot, Inc. | | | 2.3 | % |
QUALCOMM, Inc. | | | 2.2 | % |
Cisco Systems, Inc. | | | 2.1 | % |
Gilead Sciences, Inc. | | | 2.0 | % |
Facebook, Inc. Class A | | | 1.9 | % |
| | | | | |
| | | | 31.1 | % |
| | | | | |
| | | | |
MML Fundamental Growth Fund
Sector Table
(% of Net Assets) on 12/31/14 | |
| | |
Technology | | | 29.7 | % |
Consumer, Non-cyclical | | | 25.3 | % |
Communications | | | 19.0 | % |
Consumer, Cyclical | | | 10.9 | % |
Industrial | | | 6.6 | % |
Financial | | | 4.6 | % |
Energy | | | 2.6 | % |
Basic Materials | | | 1.1 | % |
| | | | | |
Total Long-Term Investments | | | 99.8 | % |
Short-Term Investments and Other Assets and Liabilities | | | 0.2 | % |
| | | | | |
Net Assets | | | 100.0 | % |
| | | | | |
22
MML Fundamental Growth Fund – Portfolio Manager Report (Unaudited) (Continued)
Growth of a $10,000 Investment
Hypothetical Investments in MML Fundamental Growth Fund Class II and the Russell 1000 Growth Index.
| | | | | | | | |
| | | |
| TOTAL RETURN | | One Year
1/1/14 - 12/31/14 | | | Since Inception
Average Annual 12/8/11 - 12/31/14 | |
Class II | | | 11.06% | | | | 17.83% | |
Russell 1000 Growth Index | | | 13.05% | | | | 19.44% | |
Hypothetical Investments in MML Fundamental Growth Fund Service Class I and the Russell 1000 Growth Index.
| | | | | | | | |
| | | |
| TOTAL RETURN | | One Year
1/1/14 - 12/31/14 | | | Since Inception
Average Annual 5/1/12 - 12/31/14 | |
Service Class I | | | 10.81% | | | | 14.29% | |
Russell 1000 Growth Index | | | 13.05% | | | | 16.95% | |
GROWTH OF $10,000 INVESTMENT SINCE INCEPTION
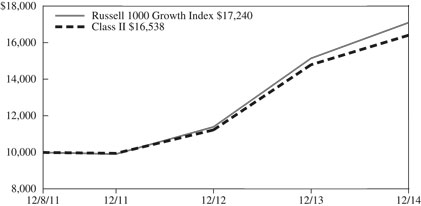
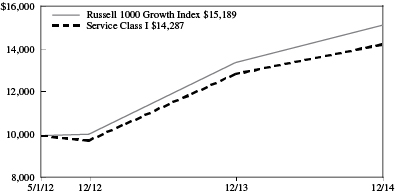
Performance data quoted represents past performance; past performance is not predictive of future results. The investment return and principal value of shares of the Fund will fluctuate with market conditions so that shares of the Fund, when redeemed, may be worth more or less than their original cost. Current performance of the Fund may be lower or higher than the performance quoted. Performance data current to the most recent month end may be obtained by accessing the website www.massmutual.com
Investors should note that the Fund is a professionally managed mutual fund, while the Russell 1000 Growth Index is unmanaged, does not incur expenses, and cannot be purchased directly by investors. Investors should read the Fund's prospectus with regard to the Fund's investment objective, risks, and charges and expenses in conjunction with these financial statements. The Fund's return reflects changes in the net asset value per share without the deduction of any product charges (e.g., cost of insurance, mortality and expense risk charges, administrative fees, and CDSL). The inclusion of these charges would have reduced the performance shown here.
23
MML Fundamental Value Fund – Portfolio Manager Report (Unaudited)
What is the investment approach of MML Fundamental Value Fund, and who is the Fund’s subadviser?
The Fund seeks long-term total return by investing primarily in equity securities of issuers that the Fund’s subadviser believes are undervalued. Under normal circumstances, the Fund invests at least 80% of its net assets in equity securities, with a focus on companies with large market capitalizations (which the subadviser believes are generally above $2 billion). The Fund’s subadviser is Wellington Management Company LLP (Wellington Management).
How did the Fund perform during the 12 months ended December 31, 2014?
The Fund’s Class II shares returned 11.19%, underperforming the 13.45% return of the Russell 1000® Value Index (the “benchmark”), an unmanaged index consisting of those Russell 1000 securities (representing the 1,000 largest U.S. companies, based on market capitalization) with greater than average value orientation that tend to exhibit lower price-to-book ratios and lower forecasted growth rates than securities in the growth universe.
For a discussion on the economic and market environment during the 12-month period ended December 31, 2014, please see the Economic and Market Overview, beginning on page 3.
Subadviser discussion of factors that contributed to the Fund’s performance
The Fund underperformed in 2014, as security selection within the financials, information technology, and consumer staples sectors detracted from relative results. An underweight allocation to a strong utilities sector worked against the Fund’s returns, relative to the benchmark. The Fund’s cash position also detracted amid a broad-based rally in equities. Stronger stock selection within the materials and consumer discretionary sectors and an overweight allocation to the information technology sector helped partially offset weakness elsewhere.
During 2014, top detractors from benchmark-relative performance included energy companies Southwestern Energy, Halliburton, and Marathon Oil. The oil sector saw its sharpest sell-off in three years following OPEC’s decision not to cut production amid declining oil prices, which weighed on each of the Fund’s top detractors. Southwestern Energy, a natural gas-focused exploration and production company, saw share price declines due to disappointing third-quarter earnings, which came in below estimates, and a negative view of the company’s recent acquisition of acreage in the Marcellus and Utica basins. Shares of Halliburton, an energy services provider, underperformed, as investors seemed to question the value of the stock in light of poor price trends and the company’s proposed acquisition of drilling services provider Baker Hughes. Marathon Oil, a U.S. exploration and production company, also underperformed, as the company reported disappointing third-quarter earnings as a result of plummeting crude oil prices.
Conversely, among the top contributors to benchmark-relative results were Covidien (health care) and Lowe’s (consumer discretionary). Shares of Covidien, a medical-products manufacturing and distribution company, soared after medical device giant Medtronic entered into a definitive agreement to acquire Covidien. Lowe’s, a leading home improvement retailer, reported better-than-expected third-quarter earnings results and revised its full-year outlook, sending the stock price higher. An underweight allocation to ExxonMobil (energy), a stock represented in the benchmark, also aided relative performance. At year end, the Fund held the largest overweight stakes in the consumer discretionary and information technology sectors – and the largest underweight allocations to the utilities and consumer staples sectors.
Subadviser outlook
Our outlook for 2015 is mixed. The oil price decline has been a major focus for investors and a key contributor to equity market volatility in recent months. Oil companies have started to reduce their capital expenditure budgets and our view is that this may lead to reduced supply growth in 2015. If supply is cut materially, we anticipate support for the commodity price, but demand trends will play a key role. We also continue to monitor Federal Reserve (the “Fed”) policy following the end of Quantitative Easing (“QE”), the Fed’s monthly bond-buying campaign intended to stimulate economic growth in the U.S., as we acknowledge QE supported economic growth and equity markets while in effect. Investors appeared encouraged by the Fed’s addition of the terms “patient” and “data-driven” to language describing its approach to raising interest rates in the wake of the end of QE. We believe the Fed may likely be most focused on core inflation in this environment, and may wait until wages pick up before acting to raise interest rates.
24
MML Fundamental Value Fund – Portfolio Manager Report (Unaudited) (Continued)
| | | | |
MML Fundamental Value Fund
Largest Holdings
(% of Net Assets) on 12/31/14 | |
| | |
Wells Fargo & Co. | | | 3.9 | % |
JP Morgan Chase & Co. | | | 3.7 | % |
Cisco Systems, Inc. | | | 2.9 | % |
Merck & Co., Inc. | | | 2.6 | % |
Citigroup, Inc. | | | 2.5 | % |
PNC Financial Services Group, Inc. | | | 2.4 | % |
Intel Corp. | | | 2.2 | % |
Chevron Corp. | | | 2.2 | % |
EMC Corp. | | | 1.8 | % |
Covidien PLC | | | 1.8 | % |
| | | | | |
| | | | 26.0 | % |
| | | | | |
| | | | |
MML Fundamental Value Fund
Sector Table
(% of Net Assets) on 12/31/14 | |
| | |
Financial | | | 26.4 | % |
Consumer, Non-cyclical | | | 16.3 | % |
Industrial | | | 10.0 | % |
Energy | | | 9.8 | % |
Communications | | | 9.8 | % |
Consumer, Cyclical | | | 9.3 | % |
Technology | | | 9.0 | % |
Basic Materials | | | 4.6 | % |
Utilities | | | 2.7 | % |
| | | | | |
Total Long-Term Investments | | | 97.9 | % |
Short-Term Investments and Other Assets and Liabilities | | | 2.1 | % |
| | | | | |
Net Assets | | | 100.0 | % |
| | | | | |
25
MML Fundamental Value Fund – Portfolio Manager Report (Unaudited) (Continued)
Growth of a $10,000 Investment
Hypothetical Investments in MML Fundamental Value Fund Class II and the Russell 1000 Value Index.
| | | | | | | | |
| | | |
| TOTAL RETURN | | One Year
1/1/14 - 12/31/14 | | | Since Inception
Average Annual 8/10/10 - 12/31/14 | |
Class II | | | 11.19% | | | | 15.13% | |
Russell 1000 Value Index | | | 13.45% | | | | 16.79% | |
Hypothetical Investments in MML Fundamental Value Fund Service Class I and the Russell 1000 Value Index.
| | | | | | | | |
| | | |
| TOTAL RETURN | | One Year
1/1/14 - 12/31/14 | | | Since Inception
Average Annual 5/1/12 - 12/31/14 | |
Service Class I | | | 10.98% | | | | 16.55% | |
Russell 1000 Value Index | | | 13.45% | | | | 19.43% | |
GROWTH OF $10,000 INVESTMENT SINCE INCEPTION
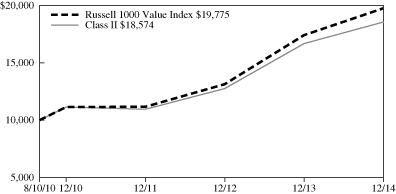
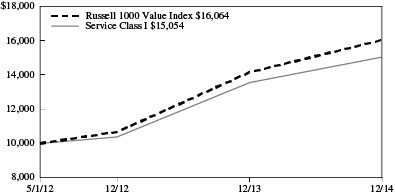
Performance data quoted represents past performance; past performance is not predictive of future results. The investment return and principal value of shares of the Fund will fluctuate with market conditions so that shares of the Fund, when redeemed, may be worth more or less than their original cost. Current performance of the Fund may be lower or higher than the performance quoted. Performance data current to the most recent month end may be obtained by accessing the website www.massmutual.com.
Investors should note that the Fund is a professionally managed mutual fund, while the Russell 1000 Value Index is unmanaged, does not incur expenses, and cannot be purchased directly by investors. Investors should read the Fund’s prospectus with regard to the Fund’s investment objective, risks, and charges and expenses in conjunction with these financial statements. The Fund’s return reflects changes in the net asset value per share without the deduction of any product charges (e.g., cost of insurance, mortality and expense risk charges, administrative fees, and CDSL). The inclusion of these charges would have reduced the performance shown here.
26
MML Global Fund – Portfolio Manager Report (Unaudited)
What is the investment approach of MML Global Fund, and who is the Fund’s subadviser?
The Fund seeks long-term capital appreciation by investing primarily in the equity securities of U.S. and foreign companies, including companies in developed and emerging markets. The Fund may invest a large percentage of its assets in issuers in a single country, a small number of countries, or a particular geographic region. The Fund’s subadviser is Massachusetts Financial Services Company (MFS).
How did the Fund perform during the 12 months ended December 31, 2014?
The Fund’s Class I shares returned 3.95%, behind the 4.94% return of the MSCI World Index (the “benchmark”), an unmanaged index of issuers listed on the stock exchanges of 20 foreign countries and the U.S.
For a discussion on the economic and market environment during the 12-month period ended December 31, 2014, please see the Economic and Market Overview, beginning on page 3.
Subadviser discussion of factors that contributed to the Fund’s performance
The Fund underperformed relative to the benchmark in 2014 for a variety of reasons. Stock selection in the consumer staples sector detracted from relative returns. Within that sector, overweight positions, relative to the benchmark, in pulp and paper manufacturer and consumer goods company Svenska Cellulosa (Sweden), global spirits company Diageo (United Kingdom), and alcoholic and non-alcoholic beverages producer Carlsberg (Denmark) held back relative results, as all three Fund holdings lagged the benchmark during the period. Stock selection in the health care sector also weighed on relative performance, although there were no individual Fund holdings within this sector that were among the largest relative detractors during the period. Underweight positioning in the technology sector further hampered the Fund’s relative performance. Additionally, the Fund did not own strong-performing computer and personal electronics maker Apple and software giant Microsoft in technology, which weighed on the Fund’s returns. Elsewhere, industrial gas supplier Linde (Germany), banking firm Standard Chartered (United Kingdom), electrical distribution equipment manufacturer Schneider Electric (France), oil and gas turnkey contractor Saipem (Italy), and Russian bank Sberbank (which is a stock not included in the benchmark) also hurt the Fund’s relative full-year performance.
Underweight positioning in the energy sector contributed to Fund results for the year, and none of the Fund holdings within this sector were notable contributors. Stock selection in the leisure sector also aided relative performance. Within this sector, the Fund’s overweight positions in strong-performing media companies Walt Disney and Time Warner boosted relative returns. Fund holdings in other sectors that bolstered relative results included overweight stakes in railroad company Canadian National Railway (Canada), medical device maker Medtronic, global payments technology company Visa, diversified technology company 3M, automotive replacement parts distributor AutoZone, global financial services firm Bank of New York Mellon, enterprise software products maker Oracle, and medical equipment manufacturer Stryker.
Subadviser outlook
We believe that, aside from the United States, the major regions of the world may be marginally positive or flirting with contraction. Conversely, the outlook for U.S. consumers appears to be brightening, especially as falling gasoline prices have put more money into their pockets, while businesses are finally beginning to reinvest after years of limiting their spending. Many companies have continued to do extremely well in terms of earnings growth and net margin expansion. We believe one risk to our positive outlook is wage increases may force the U.S. Federal Reserve to increase interest rates more quickly, which could potentially hamper economic growth and may trigger corporate profit margin deterioration.
Our view is that near-term valuations generally appear fair in developed markets and inexpensive in emerging markets, though we caution against using such a broad brush to paint a picture of these markets. Both equity performance and risk can come from a number of factors that vary over time, so as active investors, we try to stay vigilant in our risk management practices for the Fund.
27
MML Global Fund – Portfolio Manager Report (Unaudited) (Continued)
| | | | |
MML Global Fund
Largest Holdings
(% of Net Assets) on 12/31/14 | |
| | |
The Walt Disney Co. | | | 3.2 | % |
Time Warner, Inc. | | | 2.6 | % |
Honeywell International, Inc. | | | 2.6 | % |
Nestle SA | | | 2.5 | % |
Linde AG | | | 2.4 | % |
Reckitt Benckiser Group PLC | | | 2.4 | % |
Thermo Fisher Scientific, Inc. | | | 2.4 | % |
State Street Corp. | | | 2.3 | % |
Accenture PLC Class A | | | 2.3 | % |
Visa, Inc. Class A | | | 2.2 | % |
| | | | | |
| | | | 24.9 | % |
| | | | | |
| | | | |
MML Global Fund
Sector Table
(% of Net Assets) on 12/31/14 | |
| | |
Consumer, Non-cyclical | | | 30.4 | % |
Industrial | | | 16.1 | % |
Financial | | | 13.4 | % |
Communications | | | 11.3 | % |
Consumer, Cyclical | | | 8.8 | % |
Basic Materials | | | 7.4 | % |
Technology | | | 6.7 | % |
Diversified | | | 1.7 | % |
Energy | | | 2.6 | % |
Mutual Funds | | | 1.1 | % |
| | | | | |
Total Long-Term Investments | | | 99.5 | % |
Short-Term Investments and Other Assets and Liabilities | | | 0.5 | % |
| | | | | |
Net Assets | | | 100.0 | % |
| | | | | |
28
MML Global Fund – Portfolio Manager Report (Unaudited) (Continued)
Growth of a $10,000 Investment
Hypothetical Investments in MML Global Fund Class I, Class II, and the MSCI World Index.
| | | | | | | | | | | | |
| | | | |
| TOTAL RETURN | | One Year
1/1/14 - 12/31/14 | | | Five Year
Average Annual 1/1/10 - 12/31/14 | | | Since Inception
Average Annual 5/1/06 - 12/31/14 | |
Class I | | | 3.95% | | | | 12.19% | | | | 4.41% | |
Class II | | | 4.00% | | | | 12.31% | | | | 4.58% | |
MSCI World Index | | | 4.94% | | | | 10.20% | | | | 4.73% | |
Hypothetical Investments in MML Global Fund Service Class I and the MSCI World Index.
| | | | | | | | | | | | |
| | | | |
| TOTAL RETURN | | One Year
1/1/14 - 12/31/14 | | | Five Year
Average Annual 1/1/10 - 12/31/14 | | | Since Inception
Average Annual 8/15/08 - 12/31/14 | |
Service Class I | | | 3.57% | | | | 11.89% | | | | 7.04% | |
MSCI World Index | | | 4.94% | | | | 10.20% | | | | 6.05% | |
GROWTH OF $10,000 INVESTMENT SINCE INCEPTION
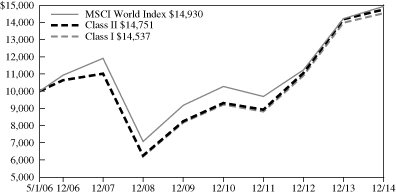
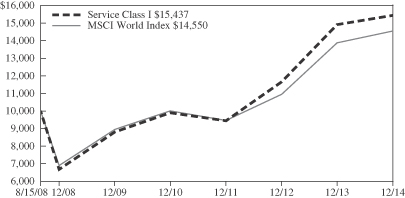
Performance data quoted represents past performance; past performance is not predictive of future results. The investment return and principal value of shares of the Fund will fluctuate with market conditions so that shares of the Fund, when redeemed, may be worth more or less than their original cost. Current performance of the Fund may be lower or higher than the performance quoted. Performance data current to the most recent month end may be obtained by accessing the website www.massmutual.com.
Investors should note that the Fund is a professionally managed mutual fund, while the MSCI World Index is unmanaged, does not incur expenses, and cannot be purchased directly by investors. Investors should read the Fund’s prospectus with regard to the Fund’s investment objective, risks, and charges and expenses in conjunction with these financial statements. The Fund’s return reflects changes in the net asset value per share without the deduction of any product charges (e.g., cost of insurance, mortality and expense risk charges, administrative fees, and CDSL). The inclusion of these charges would have reduced the performance shown here.
29
MML Growth & Income Fund – Portfolio Manager Report (Unaudited)
What is the investment approach of MML Growth & Income Fund, and who is the Fund’s subadviser?
The Fund seeks capital appreciation and income by investing, under normal circumstances, at least 80% of its net assets in equity securities and equity-related securities, including convertible securities, preferred stocks, options, and warrants, of U.S. companies with market capitalizations at the time of purchase greater than $1 billion. The Fund’s subadviser is Massachusetts Financial Services Company (MFS).
How did the Fund perform during the 12 months ended December 31, 2014?
The Fund’s Initial Class shares returned 11.19%, underperforming the 13.69% return of the S&P 500® Index (the “benchmark”), a widely recognized, unmanaged index representative of common stocks of larger capitalized U.S. companies.
For a discussion on the economic and market environment during the 12-month period ended December 31, 2014, please see the Economic and Market Overview, beginning on page 3.
Subadviser discussion of factors that contributed to the Fund’s performance
Less-than-favorable stock selection and an underweight position in the technology sector, relative to the benchmark, detracted from the Fund’s performance in 2014. Additionally, an underweight position in consumer electronics maker Apple weighed on relative results, as the company delivered strong performance during the period. An overweight position in Internet search giant Google also dampened the Fund’s relative performance, as the stock underperformed the benchmark. The Fund did not hold strong-performing semiconductor manufacturer Intel and software giant Microsoft, which also held back the Fund’s relative returns. Stock selection in both the health care and basic materials sectors also detracted from relative performance, although there were no Fund holdings within these sectors that were among the Fund’s largest relative detractors. Weak stock selection in the consumer staples sector was another negative factor for relative returns. Within consumer staples, the Fund’s investments in poor-performing international food producer Danone (France) and alcoholic beverage producer Diageo (United Kingdom) lowered relative results – although neither stock is included in the benchmark. Elsewhere, the Fund’s overweight positions in independent energy company Noble Energy, aerospace and defense equipment manufacturer Precision Castparts, engineering firm Fluor Corp., and oil and gas equipment company Cameron International hampered relative performance. The Fund’s currency exposure, resulting primarily from differences between the Fund’s and the benchmark’s exposure to holdings of securities denominated in foreign currencies, detracted from relative performance.
On the upside, strong stock selection in both the leisure and autos and housing sectors contributed to the Fund’s full-year performance. Within the leisure sector, an overweight position in media company Time Warner supported relative results, as the stock delivered solid performance during the period. In the autos and housing sector, the Fund’s overweight position in strong-performing paint company Sherwin-Williams boosted relative returns. In other sectors, overweight positions in medical equipment and supplies company Covidien, computer and personal electronics maker Hewlett-Packard, and women’s apparel company Limited Brands aided relative performance, as all three Fund holdings outpaced the benchmark. The Fund exited positions in energy companies ExxonMobil and Chevron, which supported relative results, as both companies underperformed when energy prices took a nosedive near year end. The Fund’s avoidance of poor-performing electrical equipment company General Electric, Internet retail giant Amazon.com, and diversified technology products and services company IBM, all of which hindered the performance of the benchmark, also helped relative returns for 2014.
Subadviser outlook
In our view, the outlook for U.S. consumers appears to be brightening, especially as falling gasoline prices have put more money into their pockets, while businesses are finally beginning to reinvest after years of underspending. Many companies have continued to do extremely well in terms of earnings growth and net margin expansion. We believe one risk to our positive outlook is wage increases may motivate the U.S. Federal Reserve to increase interest rates more quickly, which may potentially hamper economic growth and trigger corporate profit margin deterioration.
Our view is that near-term valuations generally appear fair in developed markets and inexpensive in emerging markets, though we caution against using such a broad brush to paint a picture of these markets. Both equity performance and risk can come from a number of factors that vary over time, so as active investors, we try to stay vigilant in our risk management practices for the Fund.
30
MML Growth & Income Fund – Portfolio Manager Report (Unaudited) (Continued)
| | | | |
MML Growth & Income Fund
Largest Holdings
(% of Net Assets) on 12/31/14 | |
| | |
JP Morgan Chase & Co. | | | 3.0 | % |
Danaher Corp. | | | 2.8 | % |
Visa, Inc. Class A | | | 2.6 | % |
EMC Corp. | | | 2.2 | % |
Johnson & Johnson | | | 2.1 | % |
The Procter & Gamble Co. | | | 2.1 | % |
Wells Fargo & Co. | | | 2.1 | % |
The Walt Disney Co. | | | 2.0 | % |
United Technologies Corp. | | | 2.0 | % |
American Express Co. | | | 1.9 | % |
| | | | | |
| | | | 22.8 | % |
| | | | | |
| | | | |
MML Growth & Income Fund
Sector Table
(% of Net Assets) on 12/31/14 | |
| | |
Consumer, Non-cyclical | | | 25.6 | % |
Financial | | | 17.2 | % |
Technology | | | 12.2 | % |
Industrial | | | 11.8 | % |
Consumer, Cyclical | | | 10.4 | % |
Communications | | | 9.8 | % |
Energy | | | 5.9 | % |
Basic Materials | | | 3.7 | % |
Utilities | | | 1.9 | % |
Diversified | | | 0.8 | % |
| | | | | |
Total Long-Term Investments | | | 99.3 | % |
Short-Term Investments and Other Assets and Liabilities | | | 0.7 | % |
| | | | | |
Net Assets | | | 100.0 | % |
| | | | | |
31
MML Growth & Income Fund – Portfolio Manager Report (Unaudited) (Continued)
Growth of a $10,000 Investment
Hypothetical Investments in MML Growth & Income Fund Initial Class and the S&P 500 Index.
| | | | | | | | | | | | |
| | | | |
| TOTAL RETURN | | One Year
1/1/14 - 12/31/14 | | | Five Year
Average Annual 1/1/10 - 12/31/14 | | | Since Inception
Average Annual 5/1/06 - 12/31/14 | |
Initial Class | | | 11.19% | | | | 14.02% | | | | 5.05% | |
S&P 500 Index | | | 13.69% | | | | 15.45% | | | | 7.62% | |
Hypothetical Investments in MML Growth & Income Fund Service Class and the S&P 500 Index.
| | | | | | | | | | | | |
| | | | |
| TOTAL RETURN | | One Year
1/1/14 - 12/31/14 | | | Five Year
Average Annual 1/1/10 - 12/31/14 | | | Since Inception
Average Annual 8/15/08 - 12/31/14 | |
Service Class | | | 10.94% | | | | 13.75% | | | | 8.21% | |
S&P 500 Index | | | 13.69% | | | | 15.45% | | | | 9.95% | |
GROWTH OF $10,000 INVESTMENT SINCE INCEPTION
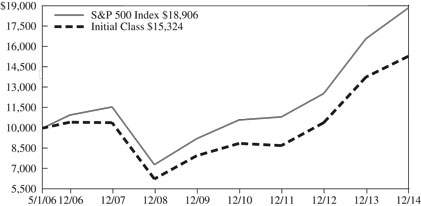
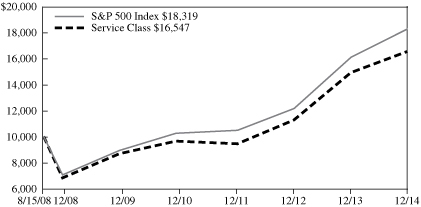
Performance data quoted represents past performance; past performance is not predictive of future results. The investment return and principal value of shares of the Fund will fluctuate with market conditions so that shares of the Fund, when redeemed, may be worth more or less than their original cost. Current performance of the Fund may be lower or higher than the performance quoted. Performance data current to the most recent month end may be obtained by accessing the website www.massmutual.com.
Investors should note that the Fund is a professionally managed mutual fund, while the S&P 500 Index is unmanaged, does not incur expenses, and cannot be purchased directly by investors. Investors should read the Fund’s prospectus with regard to the Fund’s investment objective, risks, and charges and expenses in conjunction with these financial statements. The Fund’s return reflects changes in the net asset value per share without the deduction of any product charges (e.g., cost of insurance, mortality and expense risk charges, administrative fees, and CDSL). The inclusion of these charges would have reduced the performance shown here.
32
MML Income & Growth Fund – Portfolio Manager Report (Unaudited)
What is the investment approach of MML Income & Growth Fund, and who is the Fund’s subadviser?
The Fund seeks long-term total return and current income by investing primarily in equity securities of dividend paying companies that the Fund’s subadviser believes will both increase in value over the long term and provide current income. The Fund will focus on issuers that have good prospects for capital appreciation. The Fund’s subadviser is BlackRock Investment Management, LLC (BlackRock).
How did the Fund perform during the 12 months ended December 31, 2014?
The Fund’s Initial Class shares returned 9.22%, underperforming the 13.69% return of the S&P 500® Index (the “benchmark”), a widely recognized, unmanaged index representative of common stocks of larger capitalized U.S. companies. The Fund also trailed the 13.45% return of the Russell 1000® Value Index, an unmanaged index consisting of those Russell 1000 securities (representing the 1,000 largest U.S. companies based on market capitalization) with greater than average value orientation that tend to exhibit lower price-to-book ratios and lower forecasted growth rates than securities in the growth universe.
For a discussion on the economic and market environment during the 12-month period ended December 31, 2014, please see the Economic and Market Overview, beginning on page 3.
Subadviser discussion of factors that contributed to the Fund’s performance
Sector allocation and security selection accounted for the majority of the Fund’s underperformance in 2014. In particular, the Fund’s underweight position, relative to the benchmark, and stock selection in the information technology and health care sectors weighed on relative returns. Stock selection in financials also proved to be costly during the year. In information technology, the Fund owned non-benchmark holding IBM, which was the largest single detractor in the sector for the Fund during the year. Other notable laggards in the information technology sector included the Fund’s underweight stake in the communications equipment and technology hardware and storage industries. In health care, the Fund’s underweight stake in the managed care industry hurt relative performance, as providers benefited from an improving outlook, continued below-normal utilization, and rising enrollments under the Affordable Care Act. In financials, the Fund’s underweight positions in real estate investment trusts (“REITs”) weighed on relative performance as that industry outperformed. Lastly, the Fund did not own Berkshire Hathaway, a strong-performing stock in the benchmark, which detracted from relative returns for the period. The Fund does not own Berkshire Hathaway because the company does not pay a dividend.
Turning to the positive side, a combination of stock selection and an underweight allocation to the poorly performing energy sector contributed to the Fund’s relative performance in 2014. The Fund’s preference for owning large-cap integrated oil and gas companies and underweighting the exploration and production and equipment and services industries proved beneficial, as crude oil prices declined nearly 50% during the last six months of the year. Stock selection in industrials also contributed to relative returns, as the Fund’s overweight positions in Raytheon, Lockheed Martin, and Northrup Grumman benefited from rising geopolitical tensions. Additionally, the Fund’s position in non-benchmark holdings Union Pacific and Home Depot added to relative performance for the year, as both companies benefited from a recovering domestic economy.
Subadviser outlook
U.S. equities benefited from a strengthening economy in the fourth quarter of 2014, although market volatility increased as investors considered slowing growth in other parts of the world, the impending tightening of U.S. monetary conditions, and rising political turmoil overseas. We remain positive on the U.S. economy, given broad-based improvement in the U.S. employment picture and benign levels of inflation. Improving employment prospects and lower energy prices have contributed to a rise in consumer confidence. In addition, U.S. consumer balance sheets are stronger, with debt relative to disposable income at its lowest level in 30 years. On the corporate side, U.S. manufacturing data remain steady and many corporations are flush with cash. We see the potential for acceleration in spending, given the favorable credit environment and increasing business confidence, and believe these factors point toward improving growth ahead for the U.S. economy.
We have positioned the Fund to benefit from this improving economy and the higher interest rate environment we anticipate is likely to unfold over time. Toward that end, we have increased the Fund’s exposure to industrials, financials, and technology – areas where we see the strongest fundamentals, the greatest potential for dividend growth, and relatively attractive valuations. At
33
MML Income & Growth Fund – Portfolio Manager Report (Unaudited) (Continued)
the same time, we have reduced the Fund’s exposure to more defensive sectors like consumer staples, telecommunications, and utilities. In our view, companies within these sectors are less compelling due to current valuations and/or limited dividend growth potential in the future.
| | | | |
MML Income & Growth Fund
Largest Holdings
(% of Net Assets) on 12/31/14 | |
| | |
Wells Fargo & Co. | | | 3.7 | % |
JP Morgan Chase & Co. | | | 3.3 | % |
The Home Depot, Inc. | | | 3.0 | % |
Comcast Corp. Special Class A | | | 2.6 | % |
General Electric Co. | | | 2.5 | % |
Pfizer, Inc. | | | 2.3 | % |
Chevron Corp. | | | 2.2 | % |
Raytheon Co. | | | 2.1 | % |
Merck & Co., Inc. | | | 2.1 | % |
The Procter & Gamble Co. | | | 2.1 | % |
| | | | | |
| | | | 25.9 | % |
| | | | | |
| | | | |
MML Income & Growth Fund
Sector Table
(% of Net Assets) on 12/31/14 | |
| | |
Financial | | | 25.6 | % |
Consumer, Non-cyclical | | | 17.4 | % |
Industrial | | | 14.5 | % |
Energy | | | 9.7 | % |
Communications | | | 6.7 | % |
Consumer, Cyclical | | | 6.2 | % |
Technology | | | 5.8 | % |
Utilities | | | 5.4 | % |
Basic Materials | | | 4.7 | % |
| | | | | |
Total Long-Term Investments | | | 96.0 | % |
Short-Term Investments and Other Assets and Liabilities | | | 4.0 | % |
| | | | | |
Net Assets | | | 100.0 | % |
| | | | | |
34
MML Income & Growth Fund – Portfolio Manager Report (Unaudited) (Continued)
Growth of a $10,000 Investment
Hypothetical Investments in MML Income & Growth Fund Initial Class, the S&P 500 Index, and the Russell 1000 Value Index.
| | | | | | | | | | | | |
| | | | |
| TOTAL RETURN | | One Year
1/1/14 -
12/31/14 | | | Five Year
Average Annual 1/1/10 - 12/31/14 | | | Since Inception
Average Annual 5/1/06 - 12/31/14 | |
Initial Class | | | 9.22% | | | | 12.44% | | | | 5.06% | |
S&P 500 Index* | | | 13.69% | | | | 15.45% | | | | 7.62% | |
Russell 1000 Value Index | | | 13.45% | | | | 15.42% | | | | 6.59% | |
Hypothetical Investments in MML Income & Growth Fund Service Class, the S&P 500 Index, and the Russell 1000 Value Index.
| | | | | | | | | | | | |
| | | | |
| TOTAL RETURN | | One Year
1/1/14 - 12/31/14 | | | Five Year
Average Annual 1/1/10 - 12/31/14 | | | Since Inception
Average Annual 8/15/08 - 12/31/14 | |
Service Class | | | 8.96% | | | | 12.18% | | | | 6.95% | |
S&P 500 Index* | | | 13.69% | | | | 15.45% | | | | 9.95% | |
Russell 1000 Value Index | | | 13.45% | | | | 15.42% | | | | 9.36% | |
GROWTH OF $10,000 INVESTMENT SINCE INCEPTION
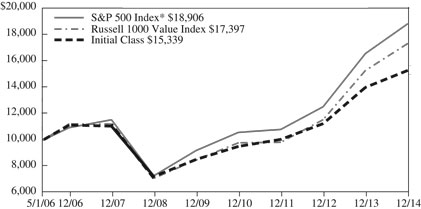
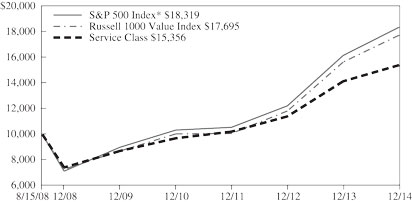
* Benchmark
Performance data quoted represents past performance; past performance is not predictive of future results. The investment return and principal value of shares of the Fund will fluctuate with market conditions so that shares of the Fund, when redeemed, may be worth more or less than their original cost. Current performance of the Fund may be lower or higher than the performance quoted. Performance data current to the most recent month end may be obtained by accessing the website www.massmutual.com.
Investors should note that the Fund is a professionally managed mutual fund, while the S&P 500 Index and the Russell 1000 Value Index are unmanaged, do not incur expenses, and cannot be purchased directly by investors. Investors should read the Fund’s prospectus with regard to the Fund’s investment objective, risks, and charges and expenses in conjunction with these financial statements. The Fund’s return reflects changes in the net asset value per share without the deduction of any product charges (e.g., cost of insurance, mortality and expense risk charges, administrative fees, and CDSL). The inclusion of these charges would have reduced the performance shown here.
35
MML International Equity Fund – Portfolio Manager Report (Unaudited)
What is the investment approach of MML International Equity Fund, and who is the Fund’s subadviser?
The Fund seeks long-term capital growth by investing, under normal circumstances, at least 80% of its net assets in equity securities of non-U.S. companies located in non-U.S. markets throughout the world, including emerging markets. The Fund may invest a substantial portion of its assets in just one region or country and may, but does not currently intend to, invest in U.S. companies. Ordinarily, the Fund’s portfolio typically holds thirty to sixty stocks and the Fund invests in the securities of at least five countries outside the U.S. The Fund’s subadviser is Harris Associates L.P. (Harris).
How did the Fund perform since its inception on January 7, 2014?
The Fund’s Class II shares returned -4.67%, underperforming the -3.16% return* of the MSCI World Index ex USA (the “benchmark”), an unmanaged index representative of stocks domiciled in 22 global developed markets, excluding the United States.
* For the reporting period 1/7/2014-12/31/2014.
For a discussion on the economic and market environment during the 12-month period ended December 31, 2014, please see the Economic and Market Overview, beginning on page 3.
Subadviser discussion of factors that contributed to the Fund’s performance
The Fund struggled in 2014, with holdings in U.K. companies detracting the most from performance, relative to the benchmark, followed by holdings in stocks from Canada and the Netherlands. From a sector perspective, Fund holdings in the health care sector detracted the most from its relative performance during the year, followed by holdings in consumer staples.
Conversely, while the Fund holdings in the U.K. and the Netherlands produced the largest negative absolute returns for the period, certain Fund holdings in Canada produced the largest collective positive return. In addition, Fund holdings in Germany and Italy drove the Fund’s performance for the year, as six of eight underlying holdings in these countries produced positive relative performance. For example, Fund holdings German tire manufacturer Continental and Italian retail and commercial bank Intesa Sanpaolo outperformed all other German and Italian Fund holdings, respectively. The Fund’s strongest absolute returns came from Givaudan, a Swiss fragrance and flavor business.
From a sector perspective, the Fund’s relative performance benefited from the lack of exposure to the energy sector, which underperformed, and Fund holdings in materials, which advanced ahead of other sectors on the strength of Givaudan and others. Technology was the next best relative performer, led by Fund positioning in Check Point Software Technologies, a security provider, and electronics company OMRON.
With regard to the Fund’s use of derivatives, the Fund was holding hedges on the Australian dollar, Swedish krona, and Swiss franc at the end of 2014. We believe these currencies may have appreciated beyond their intrinsic values, as measured by purchasing power parity and other economic fundamentals. Since the inception of the Fund, such hedges have contributed 0.75% to its cumulative performance. (Derivatives are securities that derive their value from the performance of one or more other investments and take the form of a contract between two or more parties. Most derivatives are used for hedging, speculation, or both.)
Subadviser outlook
Over the course of 2014, major global markets and the Fund’s holdings were affected by a variety of circumstances, including currency movements. The U.S. dollar appreciated versus the Australian dollar, the euro, and the yen for the year. The immediate impact of this appreciation caused lower U.S. dollar returns of those non-U.S. based assets, but helped performance of U.S.-based companies. The investing world has a history of restoring equilibrium to such imbalances, however, so we continue to seek value wherever we may find it, and our view is that global company valuations are still mainly compelling. Our opinion is that the stronger U.S. dollar could begin to positively impact the earnings of many foreign companies, and economic reform in two of the largest emerging markets, China and India, could help rekindle the global economy.
36
MML International Equity Fund – Portfolio Manager Report (Unaudited) (Continued)
| | | | |
MML International Equity Fund
Largest Holdings
(% of Net Assets) on 12/31/14 | |
| | |
Credit Suisse Group | | | 4.9 | % |
BNP Paribas | | | 3.7 | % |
Daimler AG | | | 3.2 | % |
Cie Financiere Richemont SA | | | 3.2 | % |
Honda Motor Co. Ltd. | | | 3.2 | % |
Allianz SE | | | 3.1 | % |
Intesa Sanpaolo SpA | | | 3.0 | % |
Bayerische Motoren Werke AG | | | 3.0 | % |
Daiwa Securities Group, Inc. | | | 2.8 | % |
Experian PLC | | | 2.8 | % |
| | | | | |
| | | | 32.9 | % |
| | | | | |
| | | | |
MML International Equity Fund
Sector Table
(% of Net Assets) on 12/31/14 | |
| | |
Financial | | | 25.7 | % |
Consumer, Cyclical | | | 23.4 | % |
Industrial | | | 18.2 | % |
Consumer, Non-cyclical | | | 16.1 | % |
Technology | | | 4.6 | % |
Communications | | | 2.6 | % |
Basic Materials | | | 2.4 | % |
Diversified | | | 2.0 | % |
Mutual Funds | | | 1.3 | % |
| | | | | |
Total Long-Term Investments | | | 96.3 | % |
Other Assets and Liabilities | | | 3.7 | % |
| | | | | |
Net Assets | | | 100.0 | % |
| | | | | |
37
MML International Equity Fund – Portfolio Manager Report (Unaudited) (Continued)
Growth of a $10,000 Investment
Hypothetical Investments in MML International Equity Fund Class II and the MSCI World Index ex USA.
| | | | |
| | |
| TOTAL RETURN | | Since
Inception
1/7/14 -
12/31/14 | |
| Class II | | | -4.67% | |
| MSCI World Index ex USA | | | -3.16% | |
Hypothetical Investments in MML International Equity Fund Service Class I and the MSCI World Index ex USA.
| | | | |
| | |
| TOTAL RETURN | | Since
Inception
5/1/14 -
12/31/14 | |
| Service Class I | | | -7.44% | |
| MSCI World Index ex USA | | | -6.51% | |
GROWTH OF $10,000 INVESTMENT SINCE INCEPTION
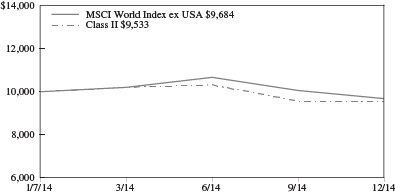
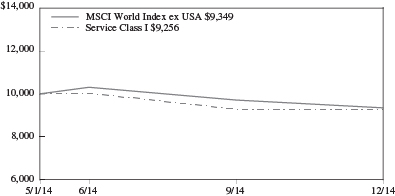
Performance data quoted represents past performance; past performance is not predictive of future results. The investment return and principal value of shares of the Fund will fluctuate with market conditions so that shares of the Fund, when redeemed, may be worth more or less than their original cost. Current performance of the Fund may be lower or higher than the performance quoted. Performance data current to the most recent month end may be obtained by accessing the website www.massmutual.com.
Investors should note that the Fund is a professionally managed mutual fund, while the MSCI World Index ex USA is unmanaged, does not incur expenses, and cannot be purchased directly by investors. Investors should read the Fund’s prospectus with regard to the Fund’s investment objective, risks, and charges and expenses in conjunction with these financial statements. The Fund’s return reflects changes in the net asset value per share without the deduction of any product charges (e.g., cost of insurance, mortality and expense risk charges, administrative fees, and CDSL). The inclusion of these charges would have reduced the performance shown here.
38
MML Large Cap Growth Fund – Portfolio Manager Report (Unaudited)
What is the investment approach of MML Large Cap Growth Fund, and who is the Fund’s subadviser?
The Fund seeks long-term capital appreciation by investing primarily in large-capitalization companies that the Fund’s subadviser believes offer the potential for long-term growth. Under normal circumstances, the Fund invests at least 80% of its net assets in the common stocks of companies whose market capitalizations at the time of purchase are within the market capitalization range of companies included in the Russell 1000® Growth Index. The Fund’s subadviser is Rainier Investment Management, LLC (Rainier).
How did the Fund perform during the 12 months ended December 31, 2014?
The Fund’s Initial Class shares returned 9.51%, underperforming the 13.05% return of the Russell 1000 Growth Index (the “benchmark”), an unmanaged index consisting of those Russell 1000 securities (representing the 1,000 largest U.S. companies based on market capitalization) with greater than average growth orientation that tend to exhibit higher price-to-book ratios and higher forecasted growth rates than securities in the value universe.
For a discussion on the economic and market environment during the 12-month period ended December 31, 2014, please see the Economic and Market Overview, beginning on page 3.
Subadviser discussion of factors that contributed to the Fund’s performance
During the year, primary detractors from Fund performance on a sector basis were Fund holdings in the consumer discretionary and industrials sectors. In consumer discretionary, Internet retail powerhouse Amazon.com posted a lackluster year, as investors reacted to company management’s lack of transparency and continued heightened spending. In industrials, B/E Aerospace, which manufactures aircraft passenger cabin interior products, underperformed after management announced the company would split into two separate parts, in lieu of selling the company outright. Other underperforming Fund holdings included energy services provider Halliburton and Salix Pharmaceuticals in the health care sector. Halliburton announced a takeover of rival Baker Hughes in a deal with what we believe to be unattractive terms. This announcement, combined with concerns about the impact on Halliburton’s business from lower oil prices, led the Fund to exit the position. Salix Pharmaceuticals declined after announcing issues with wholesaler inventory levels. The Fund held the stock through the initial drop in price, and eventually sold the position as Salix recovered from what we considered to be excessively low levels.
Conversely, health care was the top-performing sector for the year, with relative returns bolstered by both an overweight position in the sector, relative to the benchmark, and favorable stock selection. Pharmaceutical company Allergan was the top contributor to performance, gaining more than 90% for the year following an initial hostile takeover attempt by Valeant Pharmaceuticals and, ultimately, a friendly acquisition agreement with pharmaceutical company Actavis, another Fund holding. Actavis was the Fund’s second-best performer in health care for the year, as investors supported the company’s strategy of making several acquisitions, including Forest Laboratories and Allergan.
Technology was another area of positive relative results for the year. The top performer was technology leader Apple, which benefited significantly from sales of the new iPhone 6. Social networking site Facebook was another Fund holding that outperformed, as the company demonstrated success in monetizing mobile advertising. Other Fund holdings that were notable performers during 2014 included energy drink company Monster Beverage and Delta Airlines. Monster Beverage, which continued to be a strong player in the growing category of energy drinks, recently announced its partnership with Coca-Cola. Delta Airlines is poised to grow earnings significantly in 2015 as a result of continued robust ticket pricing, strong demand trends, and lower fuel costs resulting from the decline in oil prices.
Subadviser outlook
We believe domestic economic strength has firm underpinnings and may extend into 2015, with potentially positive implications for the Fund. In our view, recent trends seem to affirm that the relative strength and stability of the U.S. economy and markets, together with upward momentum in the U.S. dollar and the absence of clearly attractive alternative investments, make U.S. equities an appealing opportunity on a risk-adjusted basis to both U.S. and international investors.
39
MML Large Cap Growth Fund – Portfolio Manager Report (Unaudited) (Continued)
Our view is that weakness in foreign economies, while adding allure to U.S. capital markets, could hinder U.S. economic growth at least somewhat, particularly those companies that are dependent on exports. In light of this scenario, we remain committed to companies with earnings growth – particularly those with dominant competitive positions – where we believe current valuations provide upside potential. From a tactical standpoint, we have focused more on companies tied to the U.S. economy, and less on those firms with strong affiliations to foreign economies.
| | | | |
MML Large Cap Growth Fund
Largest Holdings
(% of Net Assets) on 12/31/14 | |
| | |
Apple, Inc. | | | 5.2 | % |
Visa, Inc. Class A | | | 3.6 | % |
Google, Inc. Class A | | | 3.4 | % |
The Walt Disney Co. | | | 3.0 | % |
The Home Depot, Inc. | | | 3.0 | % |
Facebook, Inc. Class A | | | 3.0 | % |
AbbVie, Inc. | | | 3.0 | % |
Actavis PLC | | | 2.8 | % |
The Sherwin-Williams Co. | | | 2.7 | % |
Celgene Corp. | | | 2.5 | % |
| | | | | |
| | | | 32.2 | % |
| | | | | |
| | | | |
MML Large Cap Growth Fund
Sector Table
(% of Net Assets) on 12/31/14 | |
| | |
Consumer, Non-cyclical | | | 29.1 | % |
Communications | | | 17.9 | % |
Consumer, Cyclical | | | 16.4 | % |
Technology | | | 13.8 | % |
Industrial | | | 7.7 | % |
Financial | | | 5.6 | % |
Energy | | | 4.3 | % |
Basic Materials | | | 4.0 | % |
| | | | | |
Total Long-Term Investments | | | 98.8 | % |
Short-Term Investments and Other Assets and Liabilities | | | 1.2 | % |
| | | | | |
Net Assets | | | 100.0 | % |
| | | | | |
40
MML Large Cap Growth Fund – Portfolio Manager Report (Unaudited) (Continued)
Growth of a $10,000 Investment
Hypothetical Investments in MML Large Cap Growth Fund Initial Class and the Russell 1000 Growth Index.
| | | | | | | | | | | | |
| | | | |
| TOTAL RETURN | | One Year
1/1/14 - 12/31/14 | | | Five Year
Average Annual 1/1/10 - 12/31/14 | | | Since Inception
Average Annual 5/1/06 - 12/31/14 | |
Initial Class | | | 9.51% | | | | 14.16% | | | | 6.44% | |
Russell 1000 Growth Index | | | 13.05% | | | | 15.81% | | | | 8.84% | |
Hypothetical Investments in MML Large Cap Growth Fund Service Class and the Russell 1000 Growth Index.
| | | | | | | | | | | | |
| | | | |
| TOTAL RETURN | | One Year
1/1/14 - 12/31/14 | | | Five Year
Average Annual 1/1/10 - 12/31/14 | | | Since Inception
Average Annual 8/15/08 - 12/31/14 | |
Service Class | | | 9.23% | | | | 13.86% | | | | 8.77% | |
Russell 1000 Growth Index | | | 13.05% | | | | 15.81% | | | | 10.82% | |
GROWTH OF $10,000 INVESTMENT SINCE INCEPTION
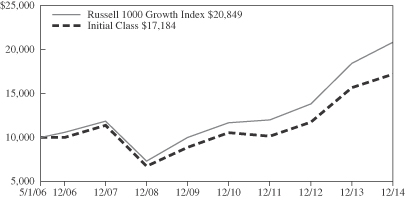
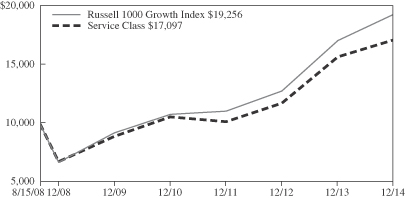
Performance data quoted represents past performance; past performance is not predictive of future results. The investment return and principal value of shares of the Fund will fluctuate with market conditions so that shares of the Fund, when redeemed, may be worth more or less than their original cost. Current performance of the Fund may be lower or higher than the performance quoted. Performance data current to the most recent month end may be obtained by accessing the website www.massmutual.com.
Investors should note that the Fund is a professionally managed mutual fund, while the Russell 1000 Growth Index is unmanaged, does not incur expenses, and cannot be purchased directly by investors. Investors should read the Fund’s prospectus with regard to the Fund’s investment objective, risks, and charges and expenses in conjunction with these financial statements. The Fund’s return reflects changes in the net asset value per share without the deduction of any product charges (e.g., cost of insurance, mortality and expense risk charges, administrative fees, and CDSL). The inclusion of these charges would have reduced the performance shown here.
41
MML Managed Volatility Fund – Portfolio Manager Report (Unaudited)
What is the investment approach of MML Managed Volatility Fund and who is the Fund’s subadviser?
The Fund seeks to capture the majority of the returns associated with equity market investments, while exposing investors to less risk than other equity investments. Under normal circumstances, the Fund invests in a broadly diversified portfolio of common stocks, while also selling index call options and purchasing index put options. The Fund’s stock portfolio will have approximately 500 stocks, and seeks to duplicate the investment composition and return of the S&P 500® Index* (the “Index”) by holding each stock included in the Index in approximately the same proportion as each stock’s relative weighting in the Index. The Fund’s subadviser is Gateway Investment Advisers, LLC (Gateway).
How did the Fund perform during the 12 months ended December 31, 2014?
The Fund’s Initial Class shares returned 4.41%, significantly underperforming the 13.69% return of the Index, a widely recognized, unmanaged index representative of common stocks of larger capitalized U.S. companies. The Index is the Fund’s benchmark. The Fund also trailed the 5.97% return of the Barclays U.S. Aggregate Bond Index, an unmanaged index of fixed-rate investment-grade securities with at least one year to maturity, combining the Barclays U.S. Treasury Bond Index, the Barclays U.S. Government-Related Bond Index, the Barclays U.S. Corporate Bond Index, and the Barclays U.S. Securitized Bond Index.
For a discussion on the economic and market environment during the 12-month period ended December 31, 2014, please see the Economic and Market Overview, beginning on page 3.
Subadviser discussion of factors that contributed to the Fund’s performance
During 2014, the Fund used derivatives to implement hedging strategies that were intended to help moderate the impact of market volatility, which dampened overall Fund returns. (Derivatives are securities that derive their value from the performance of one or more other investments and take the form of a contract between two or more parties. Most derivatives are used for hedging, speculation, or both.) The Fund’s relatively modest return during this time period was attributable to the generally moderate stock market volatility environment throughout much of 2014, which limited the potential benefit of the derivatives in use. Indeed, market volatility, as measured by The Chicago Board Options Exchange Volatility Index (the “VIX”), averaged 14.18 for 2014, while falling as low as 10.32 in early July – and spent little time above its historical long-term average of 20. Only in the fourth quarter of 2014 was the VIX relatively elevated, with two spikes over 20, while averaging 16.07 for the quarter. The Fund’s stock component, which seeks to duplicate the investment composition and return of the Index, contributed to overall performance in the advancing equity environment in 2014.
Subadviser outlook
As a hedged equity manager, Gateway is more focused on market volatility and its outlook, rather than the equity markets in isolation. At the end of 2014, the market was showing concern over the impact that the sharp drop in oil prices could have on the high-yield credit markets. Although the S&P 500 Index closed the year just 1.5% below its all-time closing high, our view is that the underlying environment for the equity market may signal potential spikes in volatility. The Federal Reserve, the recent sharp drop in oil prices, slowing economies around the world, and geopolitical concerns could potentially roil markets in 2015. While our investment management team does not try to forecast these types of events, we remain vigilant to their possibility and will continue to manage the Fund’s index option positions to take advantage of any spikes in volatility that may appear in 2015.
| * | The S&P 500 Index is a product of S&P Dow Jones Indices LLC (“SPDJI”), and has been licensed for use by MML Advisers. Standard & Poor’s®, S&P® and S&P 500® are registered trademarks of Standard & Poor’s Financial Services LLC (“S&P”); Dow Jones® is a registered trademark of Dow Jones Trademark Holdings LLC (“Dow Jones”); and these trademarks have been licensed for use by SPDJI and sublicensed for certain purposes by MML Advisers. The Fund is not sponsored, endorsed, sold or promoted by SPDJI, Dow Jones, S&P, or their respective affiliates, and none of the parties make any representation regarding the advisability of investing in such product(s) nor do they have any liability for any errors, omissions, or interruptions of the S&P 500 Index. |
42
MML Managed Volatility Fund – Portfolio Manager Report (Unaudited) (Continued)
| | | | |
MML Managed Volatility Fund
Largest Holdings
(% of Net Assets) on 12/31/14 | |
| | |
Apple, Inc. | | | 3.6 | % |
Exxon Mobil Corp. | | | 2.1 | % |
Microsoft Corp. | | | 2.1 | % |
Johnson & Johnson | | | 1.6 | % |
Berkshire Hathaway, Inc. Class B | | | 1.5 | % |
Wells Fargo & Co. | | | 1.4 | % |
General Electric Co. | | | 1.4 | % |
The Procter & Gamble Co. | | | 1.3 | % |
JP Morgan Chase & Co. | | | 1.3 | % |
Chevron Corp. | | | 1.2 | % |
| | | | | |
| | | | 17.5 | % |
| | | | | |
| | | | |
MML Managed Volatility Fund
Sector Table
(% of Net Assets) on 12/31/14 | |
| | |
Consumer, Non-cyclical | | | 23.7 | % |
Financial | | | 16.7 | % |
Technology | | | 12.8 | % |
Communications | | | 12.3 | % |
Consumer, Cyclical | | | 10.1 | % |
Industrial | | | 10.0 | % |
Energy | | | 8.4 | % |
Utilities | | | 3.2 | % |
Basic Materials | | | 3.0 | % |
Diversified | | | 0.0 | % |
| | | | | |
Total Long-Term Investments | | | 100.2 | % |
Short-Term Investments and Other Assets and Liabilities | | | (0.2 | )% |
| | | | | |
Net Assets | | | 100.0 | % |
| | | | | |
43
MML Managed Volatility Fund – Portfolio Manager Report (Unaudited) (Continued)
Growth of a $10,000 Investment
Hypothetical Investments in MML Managed Volatility Fund Initial Class, the S&P 500 Index, and the Barclays U.S. Aggregate Bond Index.
| | | | | | | | | | | | |
| | | | |
| TOTAL RETURN | | One Year
1/1/14 - 12/31/14 | | | Five Year
Average Annual 1/1/10 - 12/31/14 | | | Ten Year
Average Annual 1/1/05 - 12/31/14 | |
Initial Class | | | 4.41% | | | | 8.48% | | | | 4.49% | |
S&P 500 Index* | | | 13.69% | | | | 15.45% | | | | 7.67% | |
Barclays U.S. Aggregate Bond Index | | | 5.97% | | | | 4.45% | | | | 4.71% | |
Hypothetical Investments in MML Managed Volatility Fund Service Class, the S&P 500 Index, and the Barclays U.S. Aggregate Bond Index.
| | | | | | | | | | | | |
| | | | |
| TOTAL RETURN | | One Year
1/1/14 - 12/31/14 | | | Five Year
Average Annual 1/1/10 - 12/31/14 | | | Since Inception
Average Annual 8/15/08 - 12/31/14 | |
Service Class | | | 4.14% | | | | 8.21% | | | | 4.69% | |
S&P 500 Index* | | | 13.69% | | | | 15.45% | | | | 9.95% | |
Barclays U.S. Aggregate Bond Index | | | 5.97% | | | | 4.45% | | | | 5.06% | |
GROWTH OF $10,000 INVESTMENT FOR THE PAST 10 YEARS
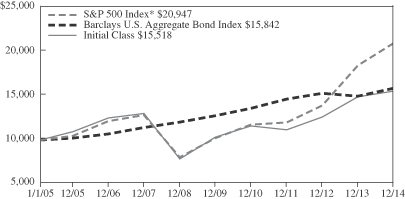
GROWTH OF $10,000 INVESTMENT SINCE INCEPTION
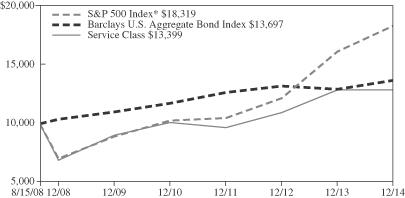
* Benchmark
Performance data quoted represents past performance; past performance is not predictive of future results. The investment return and principal value of shares of the Fund will fluctuate with market conditions so that shares of the Fund, when redeemed, may be worth more or less than their original cost. Current performance of the Fund may be lower or higher than the performance quoted. Performance data current to the most recent month end may be obtained by accessing the website www.massmutual.com.
Investors should note that the Fund is a professionally managed mutual fund, while the S&P 500 Index and the Barclays U.S. Aggregate Bond Index are unmanaged, do not incur expenses, and cannot be purchased directly by investors. Investors should read the Fund’s prospectus with regard to the Fund’s investment objective, risks, and charges and expenses in conjunction with these financial statements. The Fund’s return reflects changes in the net asset value per share without the deduction of any product charges (e.g., cost of insurance, mortality and expense risk charges, administrative fees, and CDSL). The inclusion of these charges would have reduced the performance shown here.
44
MML Mid Cap Growth Fund – Portfolio Manager Report (Unaudited)
What is the investment approach of MML Mid Cap Growth Fund, and who is the Fund’s subadviser?
The Fund seeks long-term capital appreciation by investing primarily in equity securities of mid-capitalization companies that the Fund’s subadviser believes offer the potential for above-average earnings growth. Under normal circumstances, the Fund invests at least 80% of its net assets in a broadly diversified portfolio of common stocks of mid-cap companies whose earnings the subadviser expects to grow at a faster rate than the average company. The Fund’s subadviser is T. Rowe Price Associates, Inc. (T. Rowe Price).
How did the Fund perform during the 12 months ended December 31, 2014?
The Fund’s Initial Class shares returned 13.27%, outpacing the 11.90% return of the Russell Midcap® Growth Index (the “benchmark”), a widely recognized, unmanaged index that measures the performance of those Russell Midcap companies (representing mid-capitalization U.S. common stocks) with higher price-to-book ratios and higher forecasted growth rates than securities in the value universe. Similarly, the Fund’s 13.27% return outpaced the 9.77% return of the S&P MidCap 400® Index, a widely recognized, unmanaged index representative of common stocks of mid-capitalized U.S. companies.
For a discussion on the economic and market environment during the 12-month period ended December 31, 2014, please see the Economic and Market Overview, beginning on page 3.
Subadviser discussion of factors that contributed to the Fund’s performance
Broadly speaking, stock selection accounted for the Fund’s outperformance during the year, and sector allocation was a secondary contributor. On the sector level, Fund holdings in consumer discretionary and health care stocks helped relative results, while industrials and business services holdings detracted.
Consumer discretionary proved to be the greatest contributor to relative performance, due to favorable stock selection. Among the outperforming Fund holdings were CarMax, Norwegian Cruise Line, and Marriott. CarMax, one of the largest U.S. car retailers, benefited as many more leased cars came on to the used vehicle market, increasing traffic and sales at the company’s stores. Norwegian Cruise Line’s shares rose as oil prices fell and the company revised its outlook upward for the Caribbean market. Hotel operator Marriott posted solid results and repurchased shares.
A strategic overweight position, relative to the benchmark, and beneficial stock choices made health care another area of relative strength in 2014. Fund holdings CareFusion and Puma Biotechnology were two key contributors. A leader in medication dispensing systems and infusion pumps, CareFusion benefited from the announcement that it would be acquired by the medical technology company Becton, Dickinson & Company. Puma Biotechnology, a developer and acquirer of innovative cancer therapies, received favorable trial results for a breast cancer drug that may also have future applications in the treatment of other forms of cancer. The stock rose, and the Fund exited the position after earning solid gains.
Fund holdings in industrials and business services underperformed their benchmark peers. A notable detractor here was DigitalGlobe, which provides geographic imagery collected by its network of proprietary satellites. Over the past year, delays in the launch of a new satellite led to a more muted outlook for the company.
Subadviser outlook
Our belief is that the U.S. economy could gain momentum in 2015. Monetary policy remains supportive even as the Federal Reserve has ended its monthly bond purchases; while fiscal policy, consumer spending, housing construction, business investment, and the labor market all seem poised to advance in coming months. Overall, we remain optimistic about the environment for equities, as we believe valuations still look attractive despite 2014’s strong performance. While unforeseen geopolitical events could destabilize markets, we do not expect a significant sell-off in the near term.
45
MML Mid Cap Growth Fund – Portfolio Manager Report (Unaudited) (Continued)
| | | | |
MML Mid Cap Growth Fund
Largest Holdings
(% of Net Assets) on 12/31/14 | |
| | |
CarMax, Inc. | | | 2.0 | % |
Fiserv, Inc. | | | 2.0 | % |
Pall Corp. | | | 1.7 | % |
Textron, Inc. | | | 1.7 | % |
CareFusion Corp. | | | 1.6 | % |
DENTSPLY International, Inc. | | | 1.5 | % |
Altera Corp. | | | 1.5 | % |
IHS, Inc. Class A | | | 1.5 | % |
Red Hat, Inc. | | | 1.5 | % |
Intuitive Surgical, Inc. | | | 1.5 | % |
| | | | | |
| | | | 16.5 | % |
| | | | | |
| | | | |
MML Mid Cap Growth Fund
Sector Table
(% of Net Assets) on 12/31/14 | |
| | |
Consumer, Non-cyclical | | | 27.7 | % |
Industrial | | | 19.8 | % |
Consumer, Cyclical | | | 14.8 | % |
Technology | | | 10.4 | % |
Financial | | | 8.8 | % |
Communications | | | 8.7 | % |
Mutual Funds | | | 4.1 | % |
Energy | | | 3.6 | % |
Basic Materials | | | 2.1 | % |
Utilities | | | 0.1 | % |
| | | | | |
Total Long-Term Investments | | | 100.1 | % |
Short-Term Investments and Other Assets and Liabilities | | | (0.1 | )% |
| | | | | |
Net Assets | | | 100.0 | % |
| | | | | |
46
MML Mid Cap Growth Fund – Portfolio Manager Report (Unaudited) (Continued)
Growth of a $10,000 Investment
Hypothetical Investments in MML Mid Cap Growth Fund Initial Class, the Russell Midcap Growth Index, and the S&P MidCap 400 Index.
| | | | | | | | | | | | |
| | | | |
| TOTAL RETURN | | One Year
1/1/14 - 12/31/14 | | | Five Year
Average Annual 1/1/10 - 12/31/14 | | | Since Inception
Average Annual 5/1/06 - 12/31/14 | |
| Initial Class | | | 13.27% | | | | 17.38% | | | | 9.94% | |
| Russell Midcap Growth Index* | | | 11.90% | | | | 16.94% | | | | 8.52% | |
| S&P MidCap 400 Index | | | 9.77% | | | | 16.54% | | | | 8.66% | |
Hypothetical Investments in MML Mid Cap Growth Fund Service Class, the Russell Midcap Growth Index, and the S&P MidCap 400 Index.
| | | | | | | | | | | | |
| | | | |
| TOTAL RETURN | | One Year
1/1/14 - 12/31/14 | | | Five Year
Average Annual 1/1/10 - 12/31/14 | | | Since Inception
Average Annual 8/15/08 - 12/31/14 | |
| Service Class | | | 12.93% | | | | 17.08% | | | | 11.80% | |
| Russell Midcap Growth Index* | | | 11.90% | | | | 16.94% | | | | 11.01% | |
| S&P MidCap 400 Index | | | 9.77% | | | | 16.54% | | | | 11.02% | |
GROWTH OF $10,000 INVESTMENT SINCE INCEPTION
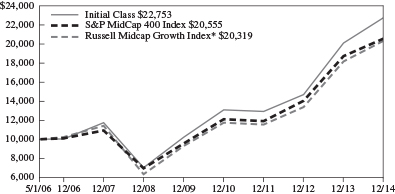
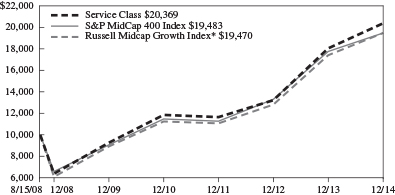
* Benchmark
Performance data quoted represents past performance; past performance is not predictive of future results. The investment return and principal value of shares of the Fund will fluctuate with market conditions so that shares of the Fund, when redeemed, may be worth more or less than their original cost. Current performance of the Fund may be lower or higher than the performance quoted. Performance data current to the most recent month end may be obtained by accessing the website www.massmutual.com.
Investors should note that the Fund is a professionally managed mutual fund, while the Russell Midcap Growth Index and the S&P MidCap 400 Index are unmanaged, do not incur expenses, and cannot be purchased directly by investors. Investors should read the Fund’s prospectus with regard to the Fund’s investment objective, risks, and charges and expenses in conjunction with these financial statements. The Fund’s return reflects changes in the net asset value per share without the deduction of any product charges (e.g., cost of insurance, mortality and expense risk charges, administrative fees, and CDSL). The inclusion of these charges would have reduced the performance shown here.
47
MML Mid Cap Value Fund – Portfolio Manager Report (Unaudited)
What is the investment approach of MML Mid Cap Value Fund, and who is the Fund’s subadviser?
The Fund seeks long-term capital growth. Income is a secondary objective. The Fund invests primarily in equity securities of mid-capitalization companies that the Fund’s subadviser believes offer prospects for long-term capital growth. Under normal circumstances, the Fund invests at least 80% of its net assets in equity securities of medium-size companies. The Fund’s subadviser is American Century Investment Management, Inc. (American Century).
How did the Fund perform during the 12 months ended December 31, 2014?
The Fund’s Initial Class shares returned 16.66%, exceeding the 14.75% return of Russell Midcap® Value Index (the “benchmark”), a widely recognized, unmanaged index that measures the performance of those Russell Midcap companies (representing mid-capitalization U.S. common stocks) with lower price-to-book ratios and lower forecasted growth rates than securities in the growth universe.
For a discussion on the economic and market environment during the 12-month period ended December 31, 2014, please see the Economic and Market Overview, beginning on page 3.
Subadviser discussion of factors that contributed to the Fund’s performance
The Fund outperformed the benchmark in 2014, primarily due to security selection. In particular, selection among information technology, industrials, and energy companies contributed the most to relative results. On the other hand, the Fund’s security selection in the financials and materials sectors detracted from relative performance.
Merger and acquisition activity helped drive performance for several Fund holdings. In the consumer staples sector, holding Hillshire Brands’ share price appreciated when the company announced it was being acquired by Tyson Foods. Health care company CareFusion was another Fund holding that appreciated after accepting a buyout offer from Becton, Dickinson and Company at a nearly 30% premium to the price at which the stock was trading at the time of the offer. Lowe’s was also a top holding for the Fund amid strong home remodeling demand and better-than-expected margin improvement and long-term outlook.
In the energy sector, the Fund’s position in Apache Corporation, an oil and gas exploration and production company, declined as the price of crude oil plunged during the fourth quarter. Weaker-than-expected demand from overseas markets, higher-than-anticipated supply from North American shale formations, and the Organization of the Petroleum Exporting Countries’ (OPEC) unwillingness to curtail production in the wake of falling prices all drove weakness in the price of crude oil. Fund holding Constellium detracted, as an acquisition increased the debt burden of the global aluminum fabricator. Additionally, the company announced its intent to increase capacity over the next three years, which could limit the cash it may have available for capital improvements.
Derivatives do not play a substantial role in the investment process. Derivatives are securities that derive their value from the performance of one or more other investments and take the form of a contract between two or more parties. Most derivatives are used for hedging, speculation, or both. The total impact of derivatives on the Fund in 2014 was positive and contributed to the Fund’s return.
Subadviser outlook
Moving forward, we are cognizant of the sustainability of profit margins, emerging-market demand, and asset inflation driven by Federal Reserve policies. Interest rate changes continue to have significant impact within utilities, REITs, and other financials. In the energy sector, the Fund held an overweight position at year-end, as the risk/reward profiles of the Fund’s holdings there have improved during the commodity price sell-off. In the health care sector, we anticipate the potential for further benefits from the continued implementation of the Affordable Care Act.
As 2014 ended, we saw attractive opportunities in industrials, consumer staples, and energy, with other potential portfolio candidates in financials, consumer discretionary, and materials stocks.
48
MML Mid Cap Value Fund – Portfolio Manager Report (Unaudited) (Continued)
| | | | |
MML Mid Cap Value Fund
Largest Holdings
(% of Net Assets) on 12/31/14 | |
| | |
Republic Services, Inc. | | | 2.9 | % |
Northern Trust Corp. | | | 2.9 | % |
iShares Russell Midcap Value Index Fund | | | 2.7 | % |
Sysco Corp. | | | 1.6 | % |
Koninklijke Philips Electronics NV | | | 1.6 | % |
LifePoint Hospitals, Inc. | | | 1.5 | % |
Imperial Oil Ltd. | | | 1.5 | % |
The Laclede Group, Inc. | | | 1.5 | % |
Westar Energy, Inc. | | | 1.5 | % |
Edison International | | | 1.5 | % |
| | | | | |
| | | | 19.2 | % |
| | | | | |
| | | | |
MML Mid Cap Value Fund
Sector Table
(% of Net Assets) on 12/31/14 | |
| | |
Financial | | | 25.2 | % |
Consumer, Non-cyclical | | | 19.8 | % |
Industrial | | | 14.3 | % |
Utilities | | | 11.5 | % |
Technology | | | 8.3 | % |
Consumer, Cyclical | | | 7.0 | % |
Energy | | | 6.2 | % |
Mutual Funds | | | 2.7 | % |
Communications | | | 2.4 | % |
Basic Materials | | | 1.9 | % |
| | | | | |
Total Long-Term Investments | | | 99.3 | % |
Short-Term Investments and Other Assets and Liabilities | | | 0.7 | % |
| | | | | |
Net Assets | | | 100.0 | % |
| | | | | |
49
MML Mid Cap Value Fund – Portfolio Manager Report (Unaudited) (Continued)
Growth of a $10,000 Investment
Hypothetical Investments in MML Mid Cap Value Fund Initial Class and the Russell Midcap Value Index.
| | | | | | | | | | | | |
| | | | |
| TOTAL RETURN | | One Year
1/1/14 -
12/31/14 | | | Five Year
Average
Annual
1/1/10 -
12/31/14 | | | Since
Inception
Average
Annual
5/1/06 -
12/31/14 | |
| Initial Class | | | 16.66% | | | | 16.21% | | | | 9.89% | |
| Russell Midcap Value Index | | | 14.75% | | | | 17.43% | | | | 8.40% | |
Hypothetical Investments in MML Mid Cap Value Fund Service Class and the Russell Midcap Value Index.
| | | | | | | | | | | | |
| | | | |
| TOTAL RETURN | | One Year
1/1/14 -
12/31/14 | | | Five Year
Average
Annual
1/1/10 -
12/31/14 | | | Since
Inception
Average
Annual
8/15/08 -
12/31/14 | |
| Service Class | | | 16.33% | | | | 15.88% | | | | 12.15% | |
| Russell Midcap Value Index | | | 14.75% | | | | 17.43% | | | | 11.29% | |
GROWTH OF $10,000 INVESTMENT SINCE INCEPTION
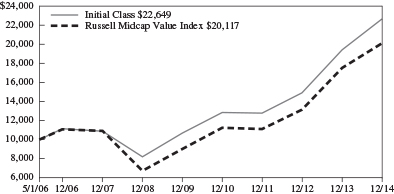
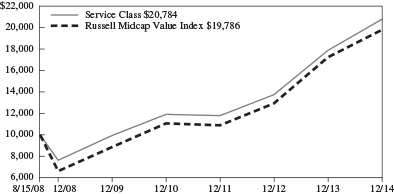
Performance data quoted represents past performance; past performance is not predictive of future results. The investment return and principal value of shares of the Fund will fluctuate with market conditions so that shares of the Fund, when redeemed, may be worth more or less than their original cost. Current performance of the Fund may be lower or higher than the performance quoted. Performance data current to the most recent month end may be obtained by accessing the website www.massmutual.com.
Investors should note that the Fund is a professionally managed mutual fund, while the Russell Midcap Value Index is unmanaged, does not incur expenses, and cannot be purchased directly by investors. Investors should read the Fund’s prospectus with regard to the Fund’s investment objective, risks, and charges and expenses in conjunction with these financial statements. The Fund’s return reflects changes in the net asset value per share without the deduction of any product charges (e.g., cost of insurance, mortality and expense risk charges, administrative fees, and CDSL). The inclusion of these charges would have reduced the performance shown here.
50
MML Small Cap Growth Equity Fund – Portfolio Manager Report (Unaudited)
What is the investment approach of MML Small Cap Growth Equity Fund, and who are the Fund’s subadvisers?
The Fund seeks long-term capital appreciation by investing primarily in equity securities of smaller companies that the Fund’s subadvisers believe offer potential for long-term growth. Under normal circumstances, the Fund invests at least 80% of its net assets in the securities of companies whose market capitalizations at the time of purchase are within the market capitalization range of companies included in the Russell 2000® Index or the S&P SmallCap 600 Index. The Fund’s subadvisers are Wellington Management Company LLP (Wellington Management), which managed approximately 70% of the Fund’s portfolio; and Waddell & Reed Investment Management Company (Waddell & Reed), which was responsible for approximately 30% of the Fund’s portfolio, as of December 31, 2014.
How did the Fund perform during the 12 months ended December 31, 2014?
The Fund’s Initial Class shares returned 5.92%, outperforming the 5.60% return of the Russell 2000 Growth Index (the “benchmark”), a widely recognized, unmanaged index that measures the performance of those Russell 2000 Index companies (representing small-capitalization U.S. common stocks) with higher price-to-book ratios and higher forecasted growth rates than securities in the value universe. Similarly, the Fund’s 5.92% return exceeded the 4.89% return of the Russell 2000 Index, a widely recognized, unmanaged index representative of common stocks of smaller capitalized U.S. companies.
For a discussion on the economic and market environment during the 12-month period ended December 31, 2014, please see the Economic and Market Overview, beginning on page 3.
Subadviser discussion of factors that contributed to the Fund’s performance
The Fund’s Wellington Management component outperformed the benchmark for the period, as strong stock selection was the primary driver of full-year results. Selection was strongest in the consumer discretionary, energy, and materials sectors. This favorable security selection within these sectors was partially offset by weaker selection in the information technology and financials sectors. Underweight positioning in energy (relative to the benchmark), the weakest-performing sector in the benchmark, was a performance driver. Conversely, an underweight allocation to health care, the strongest-performing sector, detracted, as did an overweight stake in the underperforming materials sector. Top contributors to relative performance during the period included Athlon Energy, an exploration and production company in the energy sector focused on the Permian Basin. Athlon’s shares climbed after the company was acquired by natural gas producer Encana. Wellington Management sold the Fund component’s position during the period. Additionally, the share price of JetBlue Airways rose, as the U.S.-based airline carrier reported the hiring of a new CEO, positive company guidance throughout the year, and a reduction in fuel prices. Conversely, stocks that detracted most from the Fund’s relative returns included Web.com, which is an Internet service provider that declined due to increased competition in the company’s “do-it-for-me” web design and services business. The Fund component ultimately exited the position. In addition, shares of eHealth, an Internet-based health insurance agency in the financials sector, traded lower on concerns about the pace of growth in new subscribers to health plans under the Affordable Care Act.
Although the Fund’s Waddell & Reed component did not outperform the benchmark, numerous factors helped drive its positive absolute returns for the year. Relative underperformance was a result of stock selection and a few areas where sector weights, relative to the benchmark, worked against Fund returns. Specifically, two industries in the benchmark, semiconductors and biotechnology, experienced strong gains throughout the year, and the Fund component had minimal exposure to these sectors. Much of the relative underperformance occurred during the second quarter of 2014, and was attributed to the Fund component’s health care and energy holdings. In health care, an underweight position also hindered results, as this was a strong-performing sector during the year. One underperforming health care holding was Cyberonics, which develops, markets, and sells implantable medical devices. In energy, Dril-Quip, which designs, manufactures, sells, and services engineered offshore drilling and production equipment; and Carbo Ceramics, an oilfield services technology company the Fund eventually sold, both underperformed. Conversely, consumer-related securities generally fared well during the year and outperformed the benchmark. Examples of these holdings include Harman International – which develops, manufactures, and markets audio products, lighting solutions, electronic systems, and digitally integrated audio and infotainment systems for the automotive industry; and Hain Celestial Group, which markets, distributes, and sells organic and natural products. Both posted strong results for the year.
51
MML Small Cap Growth Equity Fund – Portfolio Manager Report (Unaudited) (Continued)
Subadviser outlook
Looking ahead to the new year, Wellington Management has neither an overly positive nor an overly negative view of global growth. We cannot predict market outcomes, but we believe the news of low oil prices may do more to improve the market environment outlook than the actual economic impact of low oil prices. Additionally, the interconnected nature of global business means that although we concentrate on U.S. companies, we have to consider the global growth outlook to the extent that many domestic companies have a global footprint. We are working to “peel back the layers” and understand the true risk/reward prospects for each stock in this highly complex market environment, which is subject to policy uncertainty, social issues, and macro-economic dynamics.
According to Waddell & Reed, markets over the last six months of 2014 became more volatile, even as the domestic economy improved. OPEC’s decision to maintain oil production levels despite declining prices created turmoil in the energy markets and accelerated the downward price movement of the commodity. The impacts of this move are not yet fully realized, but we believe that producing nations will potentially see a dramatic decline in income, while consuming nations could experience meaningful savings. The stronger U.S. dollar has also created stress on emerging markets. Thus, we enter the new year with oil down 50% and low global interest rates accompanied by anemic growth outlooks for much of the world. We expect 2015 is likely to be more volatile, as some of these issues play out against a backdrop of anticipated Federal Reserve monetary tightening. Given this uncertainty, we feel confident in investing in higher-quality securities for the Fund, while providing strong diversification across different growth profiles.
| | | | |
MML Small Cap Growth Equity Fund
Largest Holdings
(% of Net Assets) on 12/31/14 | |
| | |
Dexcom, Inc. | | | 1.9 | % |
Tyler Technologies, Inc. | | | 1.7 | % |
Panera Bread Co. Class A | | | 1.6 | % |
Virtusa Corp. | | | 1.5 | % |
Acadia Healthcare Co., Inc. | | | 1.4 | % |
PRA Group, Inc. | | | 1.4 | % |
Graphic Packaging Holding Co. | | | 1.3 | % |
Acuity Brands, Inc. | | | 1.2 | % |
ExamWorks Group, Inc. | | | 1.2 | % |
Cognex Corp. | | | 1.1 | % |
| | | | | |
| | | | 14.3 | % |
| | | | | |
| | | | |
MML Small Cap Growth Equity Fund
Sector Table
(% of Net Assets) on 12/31/14 | |
| | |
Consumer, Non-cyclical | | | 23.4 | % |
Industrial | | | 20.0 | % |
Consumer, Cyclical | | | 14.7 | % |
Technology | | | 14.6 | % |
Financial | | | 14.1 | % |
Mutual Funds | | | 11.9 | % |
Communications | | | 5.7 | % |
Energy | | | 3.9 | % |
Basic Materials | | | 2.9 | % |
Utilities | | | 0.4 | % |
Diversified | | | 0.1 | % |
| | | | | |
Total Long-Term Investments | | | 111.7 | % |
Short-Term Investments and Other Assets and Liabilities | | | (11.7 | )% |
| | | | | |
Net Assets | | | 100.0 | % |
| | | | | |
52
MML Small Cap Growth Equity Fund – Portfolio Manager Report (Unaudited) (Continued)
Growth of a $10,000 Investment
Hypothetical Investments in MML Small Cap Growth Equity Fund Initial Class, the Russell 2000 Growth Index, and the Russell 2000 Index.
| | | | | | | | | | | | |
| | | | |
| TOTAL RETURN | | One Year
1/1/14 - 12/31/14 | | | Five Year
Average Annual 1/1/10 - 12/31/14 | | | Ten Year
Average Annual 1/1/05 - 12/31/14 | |
Initial Class | | | 5.92% | | | | 15.63% | | | | 8.90% | |
Russell 2000 Growth Index* | | | 5.60% | | | | 16.80% | | | | 8.54% | |
Russell 2000 Index | | | 4.89% | | | | 15.55% | | | | 7.77% | |
Hypothetical Investments in MML Small Cap Growth Equity Fund Service Class, the Russell 2000 Growth Index, and the Russell 2000 Index.
| | | | | | | | | | | | |
| | | | |
| TOTAL RETURN | | One Year
1/1/14 - 12/31/14 | | | Five Year
Average Annual 1/1/10 - 12/31/14 | | | Since Inception
Average Annual 8/15/08 - 12/31/14 | |
Service Class | | | 5.62% | | | | 15.32% | | | | 10.25% | |
Russell 2000 Growth Index* | | | 5.60% | | | | 16.80% | | | | 10.03% | |
Russell 2000 Index | | | 4.89% | | | | 15.55% | | | | 9.14% | |
GROWTH OF $10,000 INVESTMENT FOR THE PAST 10 YEARS
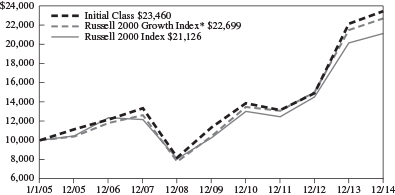
GROWTH OF $10,000 INVESTMENT SINCE INCEPTION
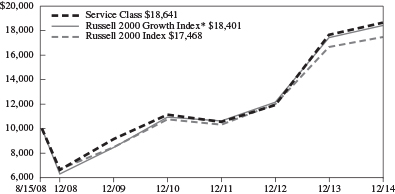
* Benchmark
Performance data quoted represents past performance; past performance is not predictive of future results. The investment return and principal value of shares of the Fund will fluctuate with market conditions so that shares of the Fund, when redeemed, may be worth more or less than their original cost. Current performance of the Fund may be lower or higher than the performance quoted. Performance data current to the most recent month end may be obtained by accessing the website www.massmutual.com.
Investors should note that the Fund is a professionally managed mutual fund, while the Russell 2000 Growth Index and the Russell 2000 Index are unmanaged, do not incur expenses, and cannot be purchased directly by investors. Investors should read the Fund’s prospectus with regard to the Fund’s investment objective, risks, and charges and expenses in conjunction with these financial statements. The Fund’s return reflects changes in the net asset value per share without the deduction of any product charges (e.g., cost of insurance, mortality and expense risk charges, administrative fees, and CDSL). The inclusion of these charges would have reduced the performance shown here.
53
MML Small Company Value Fund – Portfolio Manager Report (Unaudited)
What is the investment approach of MML Small Company Value Fund, and who is the Fund’s subadviser?
The Fund seeks long-term capital appreciation by investing primarily in equity securities that the Fund’s subadviser believes are undervalued. Under normal circumstances, the Fund invests at least 80% of its net assets in the securities of companies whose market capitalizations at the time of purchase are within the market capitalization range of companies included in the Russell 2000® Index. The Fund’s subadviser is T. Rowe Price Associates, Inc. (T. Rowe Price).
How did the Fund perform during the 12 months ended December 31, 2014?
The Fund’s Class II shares returned 0.47%, underperforming the 4.22% return of the Russell 2000 Value Index (the “benchmark”), a widely recognized, unmanaged index that measures the performance of those Russell 2000 Index companies (representing small-capitalization U.S. common stocks) with lower price-to-book ratios and lower forecasted growth rates than securities in the growth universe. The Fund also lagged the 4.89% return of the Russell 2000 Index, a widely recognized, unmanaged index representative of common stocks of smaller capitalized U.S. companies.
For a discussion on the economic and market environment during the 12-month period ended December 31, 2014, please see the Economic and Market Overview, beginning on page 3.
Subadviser discussion of factors that contributed to the Fund’s performance
Sector weightings and, to a lesser extent, stock selection, challenged the Fund in 2014, as a substantially underweight position in financials, relative to the benchmark, and a substantially overweight position in industrials and business services detracted from Fund performance. In industrials and business services, stock selection more than offset the detrimental effect of the overweight position. The opposite was true in the energy sector. While our energy stock choices for the Fund worked against returns, the Fund’s underweight position in this weakest-performing sector helped mitigate the damage.
The Fund’s consumer discretionary holdings significantly lagged their benchmark counterparts. Meritage and Ascent Capital Group were Fund holdings that were notable detractors. Meritage is the ninth-largest U.S. homebuilder and has a large presence in Florida, Texas, California, and Arizona. Despite measured growth in new home sales, months with anemic growth weighed heavily on homebuilders, and housing volumes remained at low levels. Ascent Capital Group provides security alarm monitoring to residential and business subscribers. Management reported underwhelming earnings in the firm’s most recent releases, pointing to an uptick in subscriber turnover, in part driven by integration issues with some of its security networks.
Stock selection in health care also detracted from the Fund’s relative performance, especially Momenta Pharmaceuticals, a biotechnology company with a diversified pipeline of complex generic, follow-on biologic, and novel drugs. Early in the period, the firm’s share price tumbled after rival Teva Pharmaceutical Industries benefited from the Supreme Court’s decision to review an appeal that indefinitely delayed the sale of Momenta’s generic version of Copaxone, a multiple sclerosis drug. A more recent court decision appears more favorable for Momenta to release its generic drug, but the launch date remained uncertain at year-end.
The industrials and business services sector proved to be a bright spot for the Fund, where Fund holding Alaska Air Group lifted performance. The Seattle-based airline primarily serves the West Coast region, Alaska, Hawaii, and Mexico. The company’s management has followed a carefully articulated strategy with good capital discipline, including cautious expansion, while ensuring that demand is in place. Despite recent focus on increased competition in the northwestern U.S., particularly from Delta, the firm continues to show strong revenues and has benefited from a more rationalized environment in the airline industry. In addition, the recent decline in oil prices may indicate a more favorable cost structure for the industry in the future.
Subadviser outlook
Although energy stocks are a small part of the small-cap value universe, the recent decline in oil prices has weighed particularly heavily on smaller oil producers and punished stocks in related industries – such as rail and barge transportation – that rely on energy industry spending. In our view, upcoming earnings reports may provide greater clarity on the broader effects of falling oil prices on smaller companies. We believe that energy-using firms and companies poised to benefit from healthier household budgets – resulting from lower prices at the pump – stand to benefit. In addition, the equally surprising decline in long-term
54
MML Small Company Value Fund – Portfolio Manager Report (Unaudited) (Continued)
interest rates has had a large, positive effect on small-company value stocks, especially financials. As always, our focus remains on long-term performance.
| | | | |
MML Small Company Value Fund
Largest Holdings
(% of Net Assets) on 12/31/14 | |
| | |
Landstar System, Inc. | | | 2.0 | % |
Alaska Air Group, Inc. | | | 1.9 | % |
Home Bancshares, Inc. | | | 1.8 | % |
East West Bancorp, Inc. | | | 1.8 | % |
Aaron’s, Inc. | | | 1.7 | % |
ProAssurance Corp. | | | 1.7 | % |
Genesee & Wyoming, Inc. Class A | | | 1.6 | % |
West Pharmaceutical Services, Inc. | | | 1.5 | % |
SVB Financial Group | | | 1.4 | % |
AptarGroup, Inc. | | | 1.3 | % |
| | | | | |
| | | | 16.7 | % |
| | | | | |
| | | | |
MML Small Company Value Fund
Sector Table
(% of Net Assets) on 12/31/14 | |
| | |
Industrial | | | 25.5 | % |
Financial | | | 24.3 | % |
Consumer, Cyclical | | | 12.1 | % |
Consumer, Non-cyclical | | | 11.5 | % |
Basic Materials | | | 7.6 | % |
Utilities | | | 4.6 | % |
Technology | | | 4.2 | % |
Mutual Funds | | | 3.3 | % |
Communications | | | 3.0 | % |
Energy | | | 2.8 | % |
Diversified | | | 0.4 | % |
| | | | | |
Total Long-Term Investments | | | 99.3 | % |
Short-Term Investments and Other Assets and Liabilities | | | 0.7 | % |
| | | | | |
Net Assets | | | 100.0 | % |
| | | | | |
55
MML Small Company Value Fund – Portfolio Manager Report (Unaudited) (Continued)
Growth of a $10,000 Investment
Hypothetical Investments in MML Small Company Value Fund Class II, Service Class I, the Russell 2000 Value Index, and the Russell 2000 Index.
| | | | | | | | | | | | |
| | | | |
| TOTAL RETURN | | One Year
1/1/14 - 12/31/14 | | | Five Year
Average Annual 1/1/10 - 12/31/14 | | | Since
Inception
Average
Annual
2/27/09 -
12/31/14 | |
Class II | | | 0.47% | | | | 12.71% | | | | 20.22% | |
Service Class I | | | 0.24% | | | | 12.44% | | | | 19.92% | |
Russell 2000 Value Index* | | | 4.22% | | | | 14.26% | | | | 21.70% | |
Russell 2000 Index | | | 4.89% | | | | 15.55% | | | | 22.81% | |
GROWTH OF $10,000 INVESTMENT SINCE INCEPTION
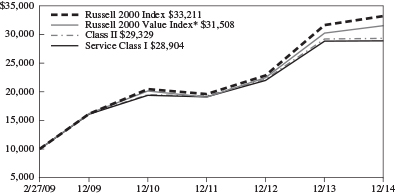
* Benchmark
Performance data quoted represents past performance; past performance is not predictive of future results. The investment return and principal value of shares of the Fund will fluctuate with market conditions so that shares of the Fund, when redeemed, may be worth more or less than their original cost. Current performance of the Fund may be lower or higher than the performance quoted. Performance data current to the most recent month end may be obtained by accessing the website www.massmutual.com.
Investors should note that the Fund is a professionally managed mutual fund, while the Russell 2000 Value Index and the Russell 2000 Index are unmanaged, do not incur expenses, and cannot be purchased directly by investors. Investors should read the Fund’s prospectus with regard to the Fund’s investment objective, risks, and charges and expenses in conjunction with these financial statements. The Fund’s return reflects changes in the net asset value per share without the deduction of any product charges (e.g., cost of insurance, mortality and expense risk charges, administrative fees, and CDSL). The inclusion of these charges would have reduced the performance shown here.
56
MML Small/Mid Cap Value Fund – Portfolio Manager Report (Unaudited)
What is the investment approach of MML Small/Mid Cap Value Fund, and who is the Fund’s subadviser?
The Fund seeks long-term total return by investing primarily in securities that the Fund’s subadviser believes to be undervalued. Under normal circumstances, the Fund invests at least 80% of its net assets in securities of small- and mid-cap companies. The Fund’s subadviser is AllianceBernstein L.P. (AllianceBernstein).
How did the Fund perform during the 12 months ended December 31, 2014?
The Fund’s Initial Class Shares returned 9.45%, outperforming the 7.07% return of the Russell 2500TM Index (the “benchmark”), an unmanaged index that measures the performance of the 2,500 smallest companies in the Russell 3000® Index, which measures the performance of the 3,000 largest U.S. companies based on market capitalization. The Fund also outpaced the 7.11% return of the Russell 2500 Value Index, an unmanaged index representative of common stocks of small- and mid-capitalization U.S. companies with lower price-to-book ratios and lower forecasted growth rates than securities in the growth universe.
For a discussion on the economic and market environment during the 12-month period ended December 31, 2014, please see the Economic and Market Overview, beginning on page 3.
Subadviser discussion of factors that contributed to the Fund’s performance
Equity markets in the United States experienced strong gains in 2014, as a resilient economic recovery fueled earnings growth. Small-cap stocks saw strong gains in the fourth quarter, but underperformed their large-cap counterparts for the year, as a spike in volatility in September and October drove a sell-off in assets with perceived higher levels of risk.
Strong overall stock selection across most sectors contributed to Fund performance in 2014. An underweight position in the energy sector, relative to the benchmark, and an overweight position in consumer cyclicals also boosted the Fund’s returns. Conversely, stock selection in the energy sector was the leading detractor from relative performance for the year. Underweight positions in the financials, consumer growth, and utilities sectors also detracted.
During the year, a number of the Fund’s consumer-cyclical holdings rose, driven by company-level catalysts and a solid backdrop of consumer spending. Office stationery supplier Office Depot added to relative outperformance after reporting strong earnings for the third quarter of 2014, as the company continued to benefit from cost synergies following its merger with OfficeMax. Further, the company’s preliminary 2015 operating income outlook exceeded analysts’ expectations. Electronic Arts was another top performer. The video-game publisher improved profitability and beat earnings expectations amid continued cost controls and better-than-expected digital sales and overcame a slump caused by an industry transition toward a new generation of gaming platforms.
On the downside, continued weakness in the energy sector worked against shares of exploration and production companies. A number of the Fund’s energy holdings were affected, including Bill Barrett, Rosetta Resources, and SM Energy. All three companies were caught up in investor anxiety over how small energy companies, which are more dependent than their larger peers on current cash flow to increase production, would fare in an environment of lower oil prices.
Subadviser outlook
We believe that the sharp increase in investor anxiety seen in 2014, and the underperformance of smaller-capitalization stocks that resulted from it, have helped create a favorable climate for our deeper value style of investing for the Fund. We see the potential for significant opportunities in the smaller-cap market in the near term. Our research continues to identify a number of stocks that were dramatically oversold in spite of good company-level fundamentals
Looking ahead to 2015, we will continue to seek companies to add to the Fund that have the same combination of compelling valuation, strong free cash flows, and significant company-level catalysts as our current holdings. While the opportunities may range across a variety of sectors, areas with greater exposure to the economic cycle have, in our view, the most potential to offer promising prospects.
57
MML Small/Mid Cap Value Fund – Portfolio Manager Report (Unaudited) (Continued)
| | | | |
MML Small/Mid Cap Value Fund
Largest Holdings
(% of Net Assets) on 12/31/14 | |
| | |
Office Depot, Inc. | | | 1.9 | % |
Bloomin’ Brands, Inc. | | | 1.8 | % |
Dean Foods Co. | | | 1.7 | % |
Electronic Arts, Inc. | | | 1.5 | % |
AECOM Technology Corp. | | | 1.5 | % |
Spirit AeroSystems Holdings, Inc. Class A | | | 1.5 | % |
American Financial Group, Inc. | | | 1.5 | % |
PNM Resources, Inc. | | | 1.5 | % |
Southwest Gas Corp. | | | 1.5 | % |
Westar Energy, Inc. | | | 1.4 | % |
| | | | | |
| | | | 15.8 | % |
| | | | | |
| | | | |
MML Small/Mid Cap Value Fund
Sector Table
(% of Net Assets) on 12/31/14 | |
| | |
Financial | | | 29.1 | % |
Consumer, Cyclical | | | 20.1 | % |
Industrial | | | 17.1 | % |
Consumer, Non-cyclical | | | 10.6 | % |
Technology | | | 8.0 | % |
Utilities | | | 6.8 | % |
Communications | | | 5.0 | % |
Basic Materials | | | 2.3 | % |
Energy | | | 2.0 | % |
| | | | | |
Total Long-Term Investments | | | 101.0 | % |
Short-Term Investments and Other Assets and Liabilities | | | (1.0 | )% |
| | | | | |
Net Assets | | | 100.0 | % |
| | | | | |
58
MML Small/Mid Cap Value Fund – Portfolio Manager Report (Unaudited) (Continued)
Growth of a $10,000 Investment
Hypothetical Investments in MML Small/Mid Cap Value Fund Initial Class, the Russell 2500 Index, and the Russell 2500 Value Index.
| | | | | | | | | | | | |
| | | | |
| TOTAL RETURN | | One Year
1/1/14 -
12/31/14 | | | Five Year
Average
Annual
1/1/10 -
12/31/14 | | | Since
Inception
Average
Annual
5/1/06 -
12/31/14 | |
| Initial Class | | | 9.45% | | | | 16.14% | | | | 5.55% | |
| Russell 2500 Index* | | | 7.07% | | | | 16.36% | | | | 7.77% | |
| Russell 2500 Value Index | | | 7.11% | | | | 15.48% | | | | 6.96% | |
Hypothetical Investments in MML Small/Mid Cap Value Fund Service Class, the Russell 2500 Index, and the Russell 2500 Value Index.
| | | | | | | | | | | | |
| | | | |
| TOTAL RETURN | | One Year
1/1/14 -
12/31/14 | | | Five Year
Average
Annual
1/1/10 -
12/31/14 | | | Since
Inception
Average
Annual
8/15/08 -
12/31/14 | |
| Service Class | | | 9.16% | | | | 15.83% | | | | 10.64% | |
| Russell 2500 Index* | | | 7.07% | | | | 16.36% | | | | 10.43% | |
| Russell 2500 Value Index | | | 7.11% | | | | 15.48% | | | | 9.91% | |
GROWTH OF $10,000 INVESTMENT SINCE INCEPTION
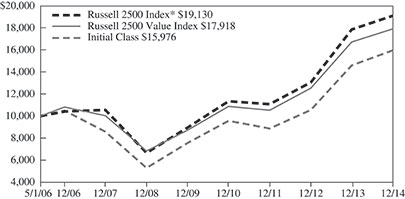
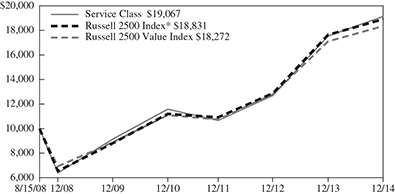
* Benchmark
Performance data quoted represents past performance; past performance is not predictive of future results. The investment return and principal value of shares of the Fund will fluctuate with market conditions so that shares of the Fund, when redeemed, may be worth more or less than their original cost. Current performance of the Fund may be lower or higher than the performance quoted. Performance data current to the most recent month end may be obtained by accessing the website www.massmutual.com.
Investors should note that the Fund is a professionally managed mutual fund, while the Russell 2500 Index and the Russell 2500 Value Index are unmanaged, do not incur expenses, and cannot be purchased directly by investors. Investors should read the Fund’s prospectus with regard to the Fund’s investment objective, risks, and charges and expenses in conjunction with these financial statements. The Fund’s return reflects changes in the net asset value per share without the deduction of any product charges (e.g., cost of insurance, mortality and expense risk charges, administrative fees, and CDSL). The inclusion of these charges would have reduced the performance shown here.
59
MML Total Return Bond Fund – Portfolio Manager Report (Unaudited)
What is the investment approach of MML Total Return Bond Fund (formerly known as MML PIMCO Total Return Fund), and who is the Fund’s subadviser?
The Fund seeks maximum total return, consistent with preservation of capital and prudent investment management, by investing, under normal circumstances, at least 80% of its total assets in a diversified portfolio of investment grade fixed income securities. Effective December 16, 2014, the name of this Fund changed from MML PIMCO Total Return Fund to MML Total Return Bond Fund, Metropolitan West Asset Management, LLC (MetWest) replaced Pacific Investment Management Company LLC (PIMCO) as the Fund’s subadviser, and the Fund’s investment strategy changed from investing, under normal circumstances, at least 65% of its total assets in a diversified portfolio of fixed income securities of varying maturities to the current investment approach described above.
How did the Fund perform during the 12 months ended December 31, 2014?
The Fund’s Class II shares returned 4.75%, underperforming the 5.97% return of the Barclays U.S. Aggregate Bond Index (the “benchmark”), an unmanaged index of fixed-rate investment-grade securities with at least one year to maturity, combining the Barclays U.S. Treasury Bond Index, the Barclays U.S. Government-Related Bond Index, the Barclays U.S. Corporate Bond Index, and the Barclays U.S. Securitized Bond Index.
For a discussion on the economic and market environment during the 12-month period ended December 31, 2014, please see the Economic and Market Overview, beginning on page 3.
Subadviser discussion of factors that contributed to the Fund’s performance
From January 1 through December 15, 2014, when PIMCO served as the Fund’s subadviser, tactical management of the Fund’s interest rate exposure detracted from Fund returns. In particular, an underweight position in longer-maturity U.S. bonds, relative to the benchmark, was negative for returns, as interest rates fell significantly in 2014. Conversely, the Fund’s non-U.S. interest-rate exposure, with tactical positioning in Spanish and Italian sovereign debt, helped support performance, as their yields continued to fall due to accommodative monetary policies and implicit support from the European Central Bank. (Bond prices move in the opposite direction of interest rates (or yields); when yields rise, the prices of existing bonds fall – and vice versa.) In emerging markets, tactical exposure to Mexican local debt contributed to Fund returns as rates declined.
The Fund’s position in Treasury Inflation-Protected Securities (TIPS) underperformed non-inflation-indexed Treasuries. Currency positioning, specifically U.S. dollar positions versus the euro and yen, contributed strongly to performance, as both currencies weakened relative to the U.S. dollar.
The Fund’s non-agency mortgage-backed securities (MBS) holdings benefited from the ongoing housing recovery and positive demand, which contributed to Fund performance. (Non-agency MBS are issued by private institutions that are not backed by government-sponsored entities.) An underweight position in investment-grade corporate bonds during the year was positive for returns, particularly in the fourth quarter. Additionally, an overweight stake in emerging-market bonds contributed, as their prices rose.
With respect to the Fund’s use of derivatives, holdings of pay fixed interest rate swaps on the long end of the U.S. nominal yield curve detracted from performance. (Pay fixed interest rate swaps are derivatives that allow counterparties to exchange streams of fixed interest rate payments for streams of floating interest rate payments.) Futures and options were also used to manage U.S. interest rate exposure. Exposure to Mexican debt was partially implemented through the use of interest rate swaps. Exposure to investment-grade corporate bonds included the use of basket credit default swaps. Additionally, the use of currency forwards to help obtain currency exposure added to the Fund’s full-year performance.
Between December 16, when MetWest became subadviser for the Fund, and the end of 2014, the Fund underperformed the benchmark due to many of the same factors that affected the previous subadviser late in the period.
60
MML Total Return Bond Fund – Portfolio Manager Report (Unaudited) (Continued)
Subadviser outlook
MetWest believes that economic growth in the U.S. is picking up, and although not yet consistently robust, recent strength has the potential to continue. During 2014, the Federal Reserve (the “Fed”) began to normalize monetary policy with the conclusion of its asset purchase program. While our view is that there are potential challenges related to domestic growth, including continued weakness overseas, we believe the impact will be minimal and the Fed may begin increasing interest rates. Once the increases begin, we believe there could be upward pressure on rates, particularly if inflation appears. As a result, the Fund’s strategy continues to be largely influenced by our belief that interest rate pressures will heighten over time and that late-stage credit cycle dynamics, such as increased leverage and looser underwriting standards, warrant a cautious and selective investment strategy for the Fund.
| | | | |
MML Total Return Bond Fund
Portfolio Characteristics
(% of Net Assets) on 12/31/14 | |
| | |
U.S. Treasury Obligations | | | 34.1 | % |
U.S. Government Agency Obligations and Instrumentalities | | | 25.1 | % |
Non-U.S. Government Agency Obligations | | | 17.9 | % |
Corporate Debt | | | 17.4 | % |
Municipal Obligations | | | 0.8 | % |
Preferred Stock | | | 0.3 | % |
| | | | | |
Total Long-Term Investments | | | 95.6 | % |
Short-Term Investments and Other Assets and Liabilities | | | 4.4 | % |
| | | | | |
Net Assets | | | 100.0 | % |
| | | | | |
61
MML Total Return Bond Fund – Portfolio Manager Report (Unaudited) (Continued)
Growth of a $10,000 Investment
Hypothetical Investments in MML Total Return Bond Fund Class II and the Barclays U.S. Aggregate Bond Index.
| | | | | | | | |
| | | |
| TOTAL RETURN | | One Year
1/1/14 -
12/31/14 | | | Since
Inception Average Annual
8/10/10 -
12/31/14 | |
| Class II | | | 4.75% | | | | 3.27% | |
| Barclays U.S. Aggregate Bond Index | | | 5.97% | | | | 3.53% | |
Hypothetical Investments in MML Total Return Bond Fund Service Class I and the Barclays U.S. Aggregate Bond Index.
| | | | | | | | |
| | | |
| TOTAL RETURN | | One Year
1/1/14 -
12/31/14 | | | Since
Inception
Average
Annual
5/1/12 -
12/31/14 | |
| Service Class I | | | 4.43% | | | | 2.77% | |
| Barclays U.S. Aggregate Bond Index | | | 5.97% | | | | 2.45% | |
GROWTH OF $10,000 INVESTMENT SINCE INCEPTION
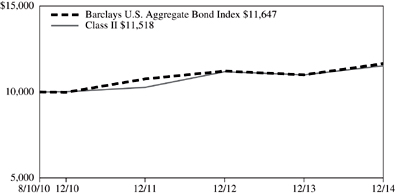
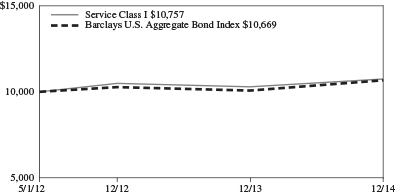
Performance data quoted represents past performance; past performance is not predictive of future results. The investment return and principal value of shares of the Fund will fluctuate with market conditions so that shares of the Fund, when redeemed, may be worth more or less than their original cost. Current performance of the Fund may be lower or higher than the performance quoted. Performance data current to the most recent month end may be obtained by accessing the website www.massmutual.com.
Investors should note that the Fund is a professionally managed mutual fund, while the Barclays U.S. Aggregate Bond Index is unmanaged, does not incur expenses, and cannot be purchased directly by investors. Investors should read the Fund’s prospectus with regard to the Fund’s investment objective, risks, and charges and expenses in conjunction with these financial statements. The Fund’s return reflects changes in the net asset value per share without the deduction of any product charges (e.g., cost of insurance, mortality and expense risk charges, administrative fees, and CDSL). The inclusion of these charges would have reduced the performance shown here.
62
MML Blue Chip Growth Fund – Portfolio of Investments
December 31, 2014
| | | | | | | | |
| | | Number of
Shares | | | Value | |
| EQUITIES — 99.6% | | | | | |
| |
| COMMON STOCK — 99.6% | | | | | |
| Basic Materials — 3.9% | | | | | | | | |
| Chemicals — 3.9% | | | | | | | | |
Ashland, Inc. | | | 5,200 | | | $ | 622,752 | |
Ecolab, Inc. | | | 45,300 | | | | 4,734,756 | |
PPG Industries, Inc. | | | 5,100 | | | | 1,178,865 | |
Praxair, Inc. | | | 11,430 | | | | 1,480,871 | |
The Sherwin-Williams Co. | | | 32,700 | | | | 8,601,408 | |
| | | | | | | | |
| | | | | | | 16,618,652 | |
| | | | | | | | |
| Communications — 22.1% | | | | | | | | |
| Internet — 21.2% | |
Akamai Technologies, Inc. (a) | | | 8,600 | | | | 541,456 | |
Alibaba Group Holding Ltd. Sponsored ADR (Cayman Islands) (a) | | | 46,046 | | | | 4,786,021 | |
Amazon.com, Inc. (a) | | | 52,950 | | | | 16,433,033 | |
Baidu, Inc. Sponsored ADR (Cayman Islands) (a) | | | 45,500 | | | | 10,372,635 | |
Ctrip.com International Ltd. ADR (Cayman Islands) (a) | | | 22,800 | | | | 1,037,400 | |
Facebook, Inc. Class A (a) | | | 133,176 | | | | 10,390,392 | |
Google, Inc. Class A (a) | | | 18,200 | | | | 9,658,012 | |
Google, Inc. Class C (a) | | | 19,700 | | | | 10,370,080 | |
LinkedIn Corp. Class A (a) | | | 13,000 | | | | 2,986,230 | |
NAVER Corp. | | | 1,127 | | | | 728,065 | |
Netflix, Inc. (a) | | | 9,000 | | | | 3,074,490 | |
The Priceline Group, Inc. (a) | | | 11,000 | | | | 12,542,310 | |
Tencent Holdings Ltd. | | | 257,000 | | | | 3,687,522 | |
Twitter, Inc. (a) | | | 12,200 | | | | 437,614 | |
Vipshop Holdings Ltd. (a) | | | 128,900 | | | | 2,518,706 | |
| | | | | | | | |
| | | | | | | 89,563,966 | |
| | | | | | | | |
| Media — 0.6% | |
Discovery Communications, Inc. Series C (a) | | | 5,750 | | | | 193,890 | |
Time Warner, Inc. | | | 3,500 | | | | 298,970 | |
Twenty-First Century Fox Class A | | | 2,900 | | | | 111,374 | |
The Walt Disney Co. | | | 22,200 | | | | 2,091,018 | |
| | | | | | | | |
| | | | | | | 2,695,252 | |
| | | | | | | | |
| Telecommunications — 0.3% | |
Softbank Corp. | | | 17,200 | | | | 1,023,610 | |
| | | | | | | | |
| | | | | | | 93,282,828 | |
| | | | | | | | |
| Consumer, Cyclical — 18.0% | |
| Airlines — 1.8% | |
American Airlines Group, Inc. | | | 135,600 | | | | 7,272,228 | |
Delta Air Lines, Inc. | | | 2,800 | | | | 137,732 | |
| | | | | | | | |
| | | | | | | 7,409,960 | |
| | | | | | | | |
| Apparel — 0.5% | |
Nike, Inc. Class B | | | 18,940 | | | | 1,821,081 | |
Ralph Lauren Corp. | | | 200 | | | | 37,032 | |
| | | | | | | | |
| | | Number of
Shares | | | Value | |
VF Corp. | | | 5,800 | | | $ | 434,420 | |
| | | | | | | | |
| | | | | | | 2,292,533 | |
| | | | | | | | |
| Auto Manufacturers — 0.4% | |
Tesla Motors, Inc. (a) | | | 8,000 | | | | 1,779,280 | |
| | | | | | | | |
| Automotive & Parts — 0.1% | |
Delphi Automotive PLC | | | 7,900 | | | | 574,488 | |
| | | | | | | | |
| Distribution & Wholesale — 0.0% | |
Fossil Group, Inc. (a) | | | 1,200 | | | | 132,888 | |
| | | | | | | | |
| Leisure Time — 0.4% | |
Carnival Corp. | | | 10,100 | | | | 457,833 | |
Harley-Davidson, Inc. | | | 2,000 | | | | 131,820 | |
Norwegian Cruise Line Holdings Ltd. (a) | | | 11,200 | | | | 523,712 | |
Polaris Industries, Inc. | | | 1,100 | | | | 166,364 | |
Royal Caribbean Cruises Ltd. | | | 3,600 | | | | 296,748 | |
| | | | | | | | |
| | | | | | | 1,576,477 | |
| | | | | | | | |
| Lodging — 3.2% | |
Hilton Worldwide Holdings, Inc. (a) | | | 65,528 | | | | 1,709,626 | |
Las Vegas Sands Corp. | | | 34,400 | | | | 2,000,704 | |
Marriott International, Inc. Class A | | | 7,487 | | | | 584,211 | |
MGM Resorts International (a) | | | 95,600 | | | | 2,043,928 | |
Starwood Hotels & Resorts Worldwide, Inc. | | | 3,600 | | | | 291,852 | |
Wynn Macau Ltd. | | | 330,000 | | | | 922,101 | |
Wynn Resorts Ltd. | | | 39,400 | | | | 5,861,144 | |
| | | | | | | | |
| | | | | | | 13,413,566 | |
| | | | | | | | |
| Retail — 11.6% | |
AutoZone, Inc. (a) | | | 1,500 | | | | 928,665 | |
CarMax, Inc. (a) | | | 14,500 | | | | 965,410 | |
Chipotle Mexican Grill, Inc. (a) | | | 7,500 | | | | 5,133,825 | |
Costco Wholesale Corp. | | | 19,400 | | | | 2,749,950 | |
CVS Health Corp. | | | 37,100 | | | | 3,573,101 | |
Hanesbrands, Inc. | | | 24,500 | | | | 2,734,690 | |
The Home Depot, Inc. | | | 43,600 | | | | 4,576,692 | |
L Brands, Inc. | | | 24,400 | | | | 2,111,820 | |
Lowe’s Cos., Inc. | | | 97,100 | | | | 6,680,480 | |
Michael Kors Holdings Ltd. (a) | | | 7,300 | | | | 548,230 | |
O’Reilly Automotive, Inc. (a) | | | 25,300 | | | | 4,873,286 | |
PVH Corp. | | | 900 | | | | 115,353 | |
Ross Stores, Inc. | | | 26,700 | | | | 2,516,742 | |
Starbucks Corp. | | | 78,800 | | | | 6,465,540 | |
Tiffany & Co. | | | 5,000 | | | | 534,300 | |
Tractor Supply Co. | | | 33,400 | | | | 2,632,588 | |
Walgreens Boots Alliance, Inc. | | | 23,300 | | | | 1,775,460 | |
| | | | | | | | |
| | | | | | | 48,916,132 | |
| | | | | | | | |
| | | | | | | 76,095,324 | |
| | | | | | | | |
| Consumer, Non-cyclical — 28.6% | |
| Beverages — 0.2% | |
Constellation Brands, Inc. Class A (a) | | | 5,200 | | | | 510,484 | |
The accompanying notes are an integral part of the financial statements.
63
MML Blue Chip Growth Fund – Portfolio of Investments (Continued)
| | | | | | | | |
| | | Number of
Shares | | | Value | |
Keurig Green Mountain, Inc. | | | 600 | | | $ | 79,437 | |
Monster Beverage Corp. (a) | | | 2,200 | | | | 238,370 | |
PepsiCo, Inc. | | | 500 | | | | 47,280 | |
| | | | | | | | |
| | | | | | | 875,571 | |
| | | | | | | | |
| Biotechnology — 7.8% | | | | | | | | |
Alexion Pharmaceuticals, Inc. (a) | | | 46,400 | | | | 8,585,392 | |
Biogen Idec, Inc. (a) | | | 32,400 | | | | 10,998,180 | |
Celgene Corp. (a) | | | 80,700 | | | | 9,027,102 | |
Regeneron Pharmaceuticals, Inc. (a) | | | 6,500 | | | | 2,666,625 | |
Vertex Pharmaceuticals, Inc. (a) | | | 14,900 | | | | 1,770,120 | |
| | | | | | | | |
| | | | | | | 33,047,419 | |
| | | | | | | | |
| Commercial Services — 8.0% | | | | | | | | |
MasterCard, Inc. Class A | | | 125,400 | | | | 10,804,464 | |
McKesson Corp. | | | 57,300 | | | | 11,894,334 | |
Visa, Inc. Class A | | | 42,480 | | | | 11,138,256 | |
| | | | | | | | |
| | | | | | | 33,837,054 | |
| | | | | | | | |
| Cosmetics & Personal Care — 0.4% | |
The Estee Lauder Cos., Inc. Class A | | | 21,100 | | | | 1,607,820 | |
| | | | | | | | |
| Health Care – Products — 2.0% | | | | | | | | |
Becton, Dickinson & Co. | | | 15,300 | | | | 2,129,148 | |
The Cooper Cos., Inc. | | | 1,700 | | | | 275,553 | |
Covidien PLC | | | 16,100 | | | | 1,646,708 | |
Intuitive Surgical, Inc. (a) | | | 5,500 | | | | 2,909,170 | |
Stryker Corp. | | | 14,930 | | | | 1,408,347 | |
| | | | | | | | |
| | | | | | | 8,368,926 | |
| | | | | | | | |
| Health Care – Services — 1.8% | | | | | | | | |
Anthem, Inc. | | | 1,000 | | | | 125,670 | |
Thermo Fisher Scientific, Inc. | | | 45,600 | | | | 5,713,224 | |
UnitedHealth Group, Inc. | | | 15,400 | | | | 1,556,786 | |
| | | | | | | | |
| | | | | | | 7,395,680 | |
| | | | | | | | |
| Pharmaceuticals — 8.4% | | | | | | | | |
AbbVie, Inc. | | | 1,200 | | | | 78,528 | |
Actavis PLC (a) | | | 15,200 | | | | 3,912,632 | |
Allergan, Inc. | | | 37,260 | | | | 7,921,103 | |
AmerisourceBergen Corp. | | | 18,000 | | | | 1,622,880 | |
Cardinal Health, Inc. | | | 28,100 | | | | 2,268,513 | |
Eli Lilly & Co. | | | 11,600 | | | | 800,284 | |
Gilead Sciences, Inc. (a) | | | 130,300 | | | | 12,282,078 | |
Perrigo Co. PLC | | | 2,100 | | | | 351,036 | |
Pharmacyclics, Inc. (a) | | | 19,000 | | | | 2,322,940 | |
Shire PLC Sponsored ADR (United Kingdom) | | | 200 | | | | 42,508 | |
Valeant Pharmaceuticals International, Inc. (a) | | | 26,900 | | | | 3,849,659 | |
| | | | | | | | |
| | | | | | | 35,452,161 | |
| | | | | | | | |
| | | | | | | 120,584,631 | |
| | | | | | | | |
| Energy — 2.5% | |
| Oil & Gas — 2.5% | |
Cimarex Energy Co. | | | 3,300 | | | | 349,800 | |
| | | | | | | | |
| | | Number of
Shares | | | Value | |
Concho Resources, Inc. (a) | | | 17,400 | | | $ | 1,735,650 | |
Continental Resources, Inc. (a) | | | 7,400 | | | | 283,864 | |
EOG Resources, Inc. | | | 280 | | | | 25,779 | |
EQT Corp. | | | 36,700 | | | | 2,778,190 | |
Pioneer Natural Resources Co. | | | 25,900 | | | | 3,855,215 | |
Range Resources Corp. | | | 28,986 | | | | 1,549,302 | |
| | | | | | | | |
| | | | | | | 10,577,800 | |
| | | | | | | | |
| Oil & Gas Services — 0.0% | |
Schlumberger Ltd. | | | 600 | | | | 51,246 | |
| | | | | | | | |
| | | | | | | 10,629,046 | |
| | | | | | | | |
| Financial — 7.7% | |
| Banks — 0.9% | |
Northern Trust Corp. | | | 6,700 | | | | 451,580 | |
State Street Corp. | | | 40,000 | | | | 3,140,000 | |
| | | | | | | | |
| | | | | | | 3,591,580 | |
| | | | | | | | |
| Diversified Financial — 4.6% | |
American Express Co. | | | 25,650 | | | | 2,386,476 | |
Ameriprise Financial, Inc. | | | 21,200 | | | | 2,803,700 | |
Citigroup, Inc. | | | 2,300 | | | | 124,453 | |
IntercontinentalExchange, Inc. | | | 10,350 | | | | 2,269,651 | |
Invesco Ltd. | | | 76,700 | | | | 3,031,184 | |
Morgan Stanley | | | 120,700 | | | | 4,683,160 | |
TD Ameritrade Holding Corp. | | | 109,000 | | | | 3,900,020 | |
| | | | | | | | |
| | | | | | | 19,198,644 | |
| | | | | | | | |
| Insurance — 0.3% | |
Marsh & McLennan Cos., Inc. | | | 23,000 | | | | 1,316,520 | |
| | | | | | | | |
| Real Estate Investment Trusts (REITS) — 1.9% | |
American Tower Corp. | | | 82,370 | | | | 8,142,275 | |
| | | | | | | | |
| | | | | | | 32,249,019 | |
| | | | | | | | |
| Industrial — 12.0% | |
| Aerospace & Defense — 1.4% | |
The Boeing Co. | | | 45,600 | | | | 5,927,088 | |
| | | | | | | | |
| Machinery – Diversified — 1.4% | |
Flowserve Corp. | | | 9,000 | | | | 538,470 | |
Roper Industries, Inc. | | | 18,000 | | | | 2,814,300 | |
Wabtec Corp. | | | 31,000 | | | | 2,693,590 | |
| | | | | | | | |
| | | | | | | 6,046,360 | |
| | | | | | | | |
| Manufacturing — 3.3% | |
3M Co. | | | 4,400 | | | | 723,008 | |
Danaher Corp. | | | 127,660 | | | | 10,941,739 | |
Honeywell International, Inc. | | | 11,800 | | | | 1,179,056 | |
Pall Corp. | | | 8,000 | | | | 809,680 | |
| | | | | | | | |
| | | | | | | 13,653,483 | |
| | | | | | | | |
| Metal Fabricate & Hardware — 1.7% | | | | | |
Precision Castparts Corp. | | | 29,800 | | | | 7,178,224 | |
| | | | | | | | |
| Transportation — 4.2% | | | | | |
Canadian Pacific Railway Ltd. | | | 8,100 | | | | 1,560,789 | |
FedEx Corp. | | | 21,400 | | | | 3,716,324 | |
The accompanying notes are an integral part of the financial statements.
64
MML Blue Chip Growth Fund – Portfolio of Investments (Continued)
| | | | | | | | |
| | | Number of
Shares | | | Value | |
J.B. Hunt Transport Services, Inc. | | | 13,300 | | | $ | 1,120,525 | |
Kansas City Southern | | | 27,300 | | | | 3,331,419 | |
Union Pacific Corp. | | | 33,100 | | | | 3,943,203 | |
United Continental Holdings, Inc. (a) | | | 61,800 | | | | 4,133,802 | |
| | | | | | | | |
| | | | | | | 17,806,062 | |
| | | | | | | | |
| | | | | | | 50,611,217 | |
| | | | | | | | |
| Technology — 4.8% | | | | | |
| Computers — 1.8% | | | | | |
Apple, Inc. | | | 55,540 | | | | 6,130,505 | |
Cognizant Technology Solutions Corp. Class A (a) | | | 7,200 | | | | 379,152 | |
IHS, Inc. Class A (a) | | | 8,200 | | | | 933,816 | |
| | | | | | | | |
| | | | | | | 7,443,473 | |
| | | | | | | | |
| Software — 3.0% | | | | | |
Autodesk, Inc. (a) | | | 4,700 | | | | 282,282 | |
Electronic Arts, Inc. (a) | | | 23,500 | | | | 1,104,852 | |
Fiserv, Inc. (a) | | | 36,440 | | | | 2,586,147 | |
Intuit, Inc. | | | 400 | | | | 36,876 | |
Microsoft Corp. | | | 16,700 | | | | 775,715 | |
Red Hat, Inc. (a) | | | 37,448 | | | | 2,589,155 | |
Salesforce.com, Inc. (a) | | | 85,600 | | | | 5,076,936 | |
VMware, Inc. Class A (a) | | | 3,800 | | | | 313,576 | |
| | | | | | | | |
| | | | | | | 12,765,539 | |
| | | | | | | | |
| | | | | | | 20,209,012 | |
| | | | | | | | |
| | |
TOTAL COMMON STOCK
(Cost $270,594,666) | | | | | | | 420,279,729 | |
| | | | | | | | |
| | |
TOTAL EQUITIES
(Cost $270,594,666) | | | | | | | 420,279,729 | |
| | | | | | | | |
|
| MUTUAL FUNDS — 0.0% | |
| Diversified Financial — 0.0% | | | | | | | | |
T. Rowe Price Reserve Investment Fund | | | 1,001 | | | | 1,001 | |
| | | | | | | | |
| | |
TOTAL MUTUAL FUNDS
(Cost $1,001) | | | | | | | 1,001 | |
| | | | | | | | |
| | |
TOTAL LONG-TERM INVESTMENTS
(Cost $270,595,667) | | | | | | | 420,280,730 | |
| | | | | | | | |
| | | | | | | | |
| | | Principal
Amount | | | Value | |
| SHORT-TERM INVESTMENTS — 0.5% | |
| Repurchase Agreement — 0.5% | | | | | |
State Street Bank & Trust Co. Repurchase Agreement, dated 12/31/14, 0.010%, due 1/02/15 (b) | | $ | 2,336,081 | | | $ | 2,336,081 | |
| | | | | | | | |
| | |
TOTAL SHORT-TERM INVESTMENTS
(Cost $2,336,081) | | | | | | | 2,336,081 | |
| | | | | | | | |
| | |
| TOTAL INVESTMENTS — 100.1% (Cost $272,931,748) (c) | | | | | | | 422,616,811 | |
| | |
| Other Assets/(Liabilities) — (0.1)% | | | | | | | (574,678 | ) |
| | | | | | | | |
| | |
| NET ASSETS — 100.0% | | | | | | $ | 422,042,133 | |
| | | | | | | | |
Notes to Portfolio of Investments
Percentages are stated as a percent of net assets.
| ADR | American Depositary Receipt |
| (a) | Non-income producing security. |
| (b) | Maturity value of $2,336,082. Collateralized by U.S. Government Agency obligations with a rate of 2.500%, maturity date of 3/20/28, and an aggregate market value, including accrued interest, of $2,383,500. |
| (c) | See Note 6 for aggregate cost for federal tax purposes. |
Country weightings, as a percentage of net assets, is as follows:
| | | | |
United States | | | 89.7 | % |
Cayman Islands | | | 5.6 | % |
Ireland | | | 1.4 | % |
Canada | | | 1.3 | % |
Bermuda | | | 0.8 | % |
Japan | | | 0.2 | % |
Republic of Korea | | | 0.2 | % |
United Kingdom | | | 0.1 | % |
British Virgin Islands | | | 0.1 | % |
Panama | | | 0.1 | % |
Liberia | | | 0.1 | % |
Netherlands Antilles | | | 0.0 | % |
| | | | |
Total Long-Term Investments | | | 99.6 | % |
Short-Term Investments and Other Assets and Liabilities | | | 0.4 | % |
| | | | |
Net Assets | | | 100.0 | % |
| | | | |
The accompanying notes are an integral part of the financial statements.
65
MML Equity Income Fund – Portfolio of Investments
December 31, 2014
| | | | | | | | |
| | | Number of
Shares | | | Value | |
| EQUITIES — 92.9% | | | | | |
| |
| COMMON STOCK — 92.9% | | | | | |
| Basic Materials — 5.4% | | | | | | | | |
| Chemicals — 1.1% | | | | | |
E.I. du Pont de Nemours & Co. | | | 48,300 | | | $ | 3,571,302 | |
Potash Corp. of Saskatchewan, Inc. | | | 68,900 | | | | 2,433,548 | |
| | | | | | | | |
| | | | | | | 6,004,850 | |
| | | | | | | | |
| Forest Products & Paper — 2.3% | |
International Paper Co. | | | 133,800 | | | | 7,169,004 | |
MeadWestvaco Corp. | | | 73,100 | | | | 3,244,909 | |
Rayonier, Inc. | | | 72,400 | | | | 2,022,856 | |
| | | | | | | | |
| | | | | | | 12,436,769 | |
| | | | | | | | |
| Iron & Steel — 0.9% | |
Nucor Corp. | | | 91,900 | | | | 4,507,695 | |
| | | | | | | | |
| Mining — 1.1% | |
Newmont Mining Corp. | | | 106,000 | | | | 2,003,400 | |
Vulcan Materials Co. | | | 62,300 | | | | 4,094,979 | |
| | | | | | | | |
| | | | | | | 6,098,379 | |
| | | | | | | | |
| | | | | | | 29,047,693 | |
| | | | | | | | |
| Communications — 11.4% | |
| Media — 3.7% | |
Cablevision Systems Corp. Class A | | | 136,100 | | | | 2,809,104 | |
Comcast Corp. Class A | | | 45,400 | | | | 2,633,654 | |
The New York Times Co. Class A | | | 122,800 | | | | 1,623,416 | |
News Corp. Class A (a) | | | 104,000 | | | | 1,631,760 | |
Pearson PLC | | | 85,585 | | | | 1,574,355 | |
Time Warner, Inc. | | | 81,433 | | | | 6,956,007 | |
The Walt Disney Co. | | | 30,800 | | | | 2,901,052 | |
| | | | | | | | |
| | | | | | | 20,129,348 | |
| | | | | | | | |
| Telecommunications — 7.7% | |
AT&T, Inc. | | | 221,800 | | | | 7,450,262 | |
CenturyLink, Inc. | | | 78,705 | | | | 3,115,144 | |
Cisco Systems, Inc. | | | 193,900 | | | | 5,393,329 | |
Corning, Inc. | | | 221,500 | | | | 5,078,995 | |
Harris Corp. | | | 73,900 | | | | 5,307,498 | |
Motorola Solutions, Inc. | | | 13,600 | | | | 912,288 | |
QUALCOMM, Inc. | | | 74,500 | | | | 5,537,585 | |
Telefonica SA | | | 155,467 | | | | 2,223,795 | |
Verizon Communications, Inc. | | | 109,935 | | | | 5,142,759 | |
Vodafone Group PLC | | | 332,563 | | | | 1,139,514 | |
| | | | | | | | |
| | | | | | | 41,301,169 | |
| | | | | | | | |
| | | | | | | 61,430,517 | |
| | | | | | | | |
| Consumer, Cyclical — 8.1% | | | | | | | | |
| Auto Manufacturers — 1.1% | | | | | | | | |
Ford Motor Co. | | | 176,300 | | | | 2,732,650 | |
General Motors Co. | | | 85,549 | | | | 2,986,516 | |
| | | | | | | | |
| | | | | | | 5,719,166 | |
| | | | | | | | |
| | | | | | | | |
| | | Number of
Shares | | | Value | |
| Automotive & Parts — 0.7% | | | | | | | | |
Johnson Controls, Inc. | | | 73,500 | | | $ | 3,552,990 | |
| | | | | | | | |
| Distribution & Wholesale — 0.7% | | | | | | | | |
Genuine Parts Co. | | | 35,900 | | | | 3,825,863 | |
| | | | | | | | |
| Entertainment — 0.1% | | | | | | | | |
The Madison Square Garden Co. Class A (a) | | | 9,025 | | | | 679,221 | |
| | | | | | | | |
| Home Furnishing — 0.1% | | | | | | | | |
Whirlpool Corp. | | | 3,700 | | | | 716,838 | |
| | | | | | | | |
| Leisure Time — 1.0% | | | | | | | | |
Carnival Corp. | | | 119,300 | | | | 5,407,869 | |
| | | | | | | | |
| Retail — 3.4% | | | | | | | | |
Coach, Inc. | | | 32,100 | | | | 1,205,676 | |
Kohl’s Corp. | | | 99,400 | | | | 6,067,376 | |
Macy’s, Inc. | | | 68,400 | | | | 4,497,300 | |
McDonald’s Corp. | | | 14,600 | | | | 1,368,020 | |
Staples, Inc. | | | 256,700 | | | | 4,651,404 | |
Tiffany & Co. | | | 3,900 | | | | 416,754 | |
| | | | | | | | |
| | | | | | | 18,206,530 | |
| | | | | | | | |
| Toys, Games & Hobbies — 1.0% | | | | | | | | |
Mattel, Inc. | | | 179,900 | | | | 5,567,005 | |
| | | | | | | | |
| | | | | | | 43,675,482 | |
| | | | | | | | |
| Consumer, Non-cyclical — 11.3% | | | | | | | | |
| Agriculture — 1.1% | | | | | | | | |
Archer-Daniels-Midland Co. | | | 115,900 | | | | 6,026,800 | |
| | | | | | | | |
| Beverages — 0.8% | | | | | | | | |
PepsiCo, Inc. | | | 45,700 | | | | 4,321,392 | |
| | | | | | | | |
| Commercial Services — 0.4% | | | | | | | | |
Western Union Co. | | | 119,700 | | | | 2,143,827 | |
| | | | | | | | |
| Cosmetics & Personal Care — 0.3% | | | | | | | | |
Avon Products, Inc. | | | 188,700 | | | | 1,771,893 | |
| | | | | | | | |
| Foods — 1.2% | | | | | | | | |
Campbell Soup Co. | | | 58,500 | | | | 2,574,000 | |
ConAgra Foods, Inc. | | | 16,600 | | | | 602,248 | |
Kellogg Co. | | | 12,200 | | | | 798,368 | |
McCormick & Co., Inc. | | | 30,300 | | | | 2,251,290 | |
| | | | | | | | |
| | | | | | | 6,225,906 | |
| | | | | | | | |
| Health Care – Products — 1.7% | |
Johnson & Johnson | | | 83,800 | | | | 8,762,966 | |
| | | | | | | | |
| Health Care – Services — 0.7% | |
Quest Diagnostics, Inc. | | | 55,100 | | | | 3,695,006 | |
| | | | | | | | |
| Household Products — 0.8% | |
The Clorox Co. | | | 42,400 | | | | 4,418,504 | |
| | | | | | | | |
| Pharmaceuticals — 4.3% | |
Bristol-Myers Squibb Co. | | | 113,000 | | | | 6,670,390 | |
GlaxoSmithKline PLC | | | 111,995 | | | | 2,396,139 | |
Merck & Co., Inc. | | | 119,800 | | | | 6,803,442 | |
The accompanying notes are an integral part of the financial statements.
66
MML Equity Income Fund – Portfolio of Investments (Continued)
| | | | | | | | |
| | | Number of
Shares | | | Value | |
Pfizer, Inc. | | | 231,454 | | | $ | 7,209,792 | |
| | | | | | | | |
| | | | | | | 23,079,763 | |
| | | | | | | | |
| | | | | | | 60,446,057 | |
| | | | | | | | |
| Energy — 12.2% | |
| Coal — 0.7% | |
CONSOL Energy, Inc. | | | 111,000 | | | | 3,752,910 | |
| | | | | | | | |
| Oil & Gas — 10.8% | |
Anadarko Petroleum Corp. | | | 39,500 | | | | 3,258,750 | |
Apache Corp. | | | 126,700 | | | | 7,940,289 | |
BP PLC Sponsored ADR (United Kingdom) | | | 62,900 | | | | 2,397,748 | |
Chevron Corp. | | | 90,400 | | | | 10,141,072 | |
ConocoPhillips | | | 30,500 | | | | 2,106,330 | |
Diamond Offshore Drilling, Inc. | | | 66,500 | | | | 2,441,215 | |
Exxon Mobil Corp. | | | 102,000 | | | | 9,429,900 | |
Hess Corp. | | | 95,000 | | | | 7,012,900 | |
Murphy Oil Corp. | | | 90,100 | | | | 4,551,852 | |
Royal Dutch Shell PLC A Shares Sponsored ADR (United Kingdom) | | | 105,200 | | | | 7,043,140 | |
Talisman Energy, Inc. | | | 258,300 | | | | 2,022,489 | |
| | | | | | | | |
| | | | | | | 58,345,685 | |
| | | | | | | | |
| Oil & Gas Services — 0.7% | |
Schlumberger Ltd. | | | 42,600 | | | | 3,638,466 | |
| | | | | | | | |
| | | | | | | 65,737,061 | |
| | | | | | | | |
| Financial — 19.0% | |
| Banks — 9.9% | |
Bank of America Corp. | | | 527,877 | | | | 9,443,720 | |
Bank of New York Mellon Corp. | | | 3,600 | | | | 146,052 | |
Northern Trust Corp. | | | 81,400 | | | | 5,486,360 | |
PNC Financial Services Group, Inc. | | | 90,400 | | | | 8,247,192 | |
Regions Financial Corp. | | | 192,900 | | | | 2,037,024 | |
SunTrust Banks, Inc. | | | 139,800 | | | | 5,857,620 | |
U.S. Bancorp | | | 221,300 | | | | 9,947,435 | |
Wells Fargo & Co. | | | 218,300 | | | | 11,967,206 | |
| | | | | | | | |
| | | | | | | 53,132,609 | |
| | | | | | | | |
| Diversified Financial — 3.7% | | | | | | | | |
American Express Co. | | | 61,300 | | | | 5,703,352 | |
JP Morgan Chase & Co. | | | 231,100 | | | | 14,462,238 | |
| | | | | | | | |
| | | | | | | 20,165,590 | |
| | | | | | | | |
| Insurance — 4.1% | | | | | | | | |
The Chubb Corp. | | | 26,900 | | | | 2,783,343 | |
Loews Corp. | | | 86,000 | | | | 3,613,720 | |
Marsh & McLennan Cos., Inc. | | | 137,800 | | | | 7,887,672 | |
MetLife, Inc. | | | 67,900 | | | | 3,672,711 | |
Sun Life Financial, Inc. | | | 61,700 | | | | 2,224,902 | |
Willis Group Holdings PLC | | | 36,200 | | | | 1,622,122 | |
| | | | | | | | |
| | | | | | | 21,804,470 | |
| | | | | | | | |
| | | | | | | | |
| | | Number of
Shares | | | Value | |
| Real Estate Investment Trusts (REITS) — 1.3% | |
Digital Realty Trust, Inc. | | | 39,400 | | | $ | 2,612,220 | |
Weyerhaeuser Co. | | | 125,242 | | | | 4,494,935 | |
| | | | | | | | |
| | | | | | | 7,107,155 | |
| | | | | | | | |
| | | | | | | 102,209,824 | |
| | | | | | | | |
| Industrial — 13.2% | | | | | | | | |
| Aerospace & Defense — 1.1% | | | | | | | | |
The Boeing Co. | | | 45,700 | | | | 5,940,086 | |
| | | | | | | | |
| Building Materials — 1.0% | | | | | | | | |
Masco Corp. | | | 132,500 | | | | 3,339,000 | |
USG Corp. (a) | | | 72,200 | | | | 2,020,878 | |
| | | | | | | | |
| | | | | | | 5,359,878 | |
| | | | | | | | |
| Electrical Components & Equipment — 1.1% | | | | | |
Emerson Electric Co. | | | 92,000 | | | | 5,679,160 | |
| | | | | | | | |
| Hand & Machine Tools — 0.9% | | | | | | | | |
Stanley Black & Decker, Inc. | | | 48,800 | | | | 4,688,704 | |
| | | | | | | | |
| Machinery – Construction & Mining — 0.5% | | | | | |
Joy Global, Inc. | | | 59,100 | | | | 2,749,332 | |
| | | | | | | | |
| Machinery – Diversified — 1.4% | | | | | |
Deere & Co. | | | 43,900 | | | | 3,883,833 | |
Flowserve Corp. | | | 4,500 | | | | 269,235 | |
Xylem, Inc. | | | 95,200 | | | | 3,624,264 | |
| | | | | | | | |
| | | | | | | 7,777,332 | |
| | | | | | | | |
| Manufacturing — 6.0% | | | | | |
Eaton Corp. PLC | | | 40,384 | | | | 2,744,497 | |
General Electric Co. | | | 570,100 | | | | 14,406,427 | |
Honeywell International, Inc. | | | 64,400 | | | | 6,434,848 | |
Illinois Tool Works, Inc. | | | 90,200 | | | | 8,541,940 | |
| | | | | | | | |
| | | | | | | 32,127,712 | |
| | | | | | | | |
| Transportation — 1.2% | | | | | |
United Parcel Service, Inc. Class B | | | 56,600 | | | | 6,292,222 | |
| | | | | | | | |
| | | | | | | 70,614,426 | |
| | | | | | | | |
| Technology — 5.8% | | | | | | | | |
| Computers — 1.9% | | | | | | | | |
Apple, Inc. | | | 31,700 | | | | 3,499,046 | |
Computer Sciences Corp. | | | 42,700 | | | | 2,692,235 | |
International Business Machines Corp. | | | 25,800 | | | | 4,139,352 | |
| | | | | | | | |
| | | | | | | 10,330,633 | |
| | | | | | | | |
| Semiconductors — 2.6% | | | | | | | | |
Analog Devices, Inc. | | | 65,800 | | | | 3,653,216 | |
Applied Materials, Inc. | | | 231,200 | | | | 5,761,504 | |
Texas Instruments, Inc. | | | 84,000 | | | | 4,491,060 | |
| | | | | | | | |
| | | | | | | 13,905,780 | |
| | | | | | | | |
| Software — 1.3% | | | | | | | | |
CA, Inc. | | | 46,600 | | | | 1,418,970 | |
The accompanying notes are an integral part of the financial statements.
67
MML Equity Income Fund – Portfolio of Investments (Continued)
| | | | | | | | |
| | | Number of
Shares | | | Value | |
Microsoft Corp. | | | 112,400 | | | $ | 5,220,980 | |
| | | | | | | | |
| | | | | | | 6,639,950 | |
| | | | | | | | |
| | | | | | | 30,876,363 | |
| | | | | | | | |
| Utilities — 6.5% | | | | | | | | |
| Electric — 5.2% | | | | | | | | |
The AES Corp. | | | 142,200 | | | | 1,958,094 | |
Duke Energy Corp. | | | 84,633 | | | | 7,070,241 | |
Entergy Corp. | | | 71,500 | | | | 6,254,820 | |
Exelon Corp. | | | 128,700 | | | | 4,772,196 | |
FirstEnergy Corp. | | | 95,200 | | | | 3,711,848 | |
Xcel Energy, Inc. | | | 107,700 | | | | 3,868,584 | |
| | | | | | | | |
| | | | | | | 27,635,783 | |
| | | | | | | | |
| Gas — 1.3% | | | | | | | | |
NiSource, Inc. | | | 167,800 | | | | 7,118,076 | |
| | | | | | | | |
| | | | | | | 34,753,859 | |
| | | | | | | | |
| | |
TOTAL COMMON STOCK
(Cost $333,465,111) | | | | | | | 498,791,282 | |
| | | | | | | | |
| | |
TOTAL EQUITIES
(Cost $333,465,111) | | | | | | | 498,791,282 | |
| | | | | | | | |
| | |
| MUTUAL FUNDS — 2.3% | | | | | | | | |
| Diversified Financial — 2.3% | | | | | | | | |
T. Rowe Price Reserve Investment Fund | | | 12,272,716 | | | | 12,272,716 | |
| | | | | | | | |
| | |
TOTAL MUTUAL FUNDS
(Cost $12,272,716) | | | | | | | 12,272,716 | |
| | | | | | | | |
| | |
TOTAL LONG-TERM INVESTMENTS
(Cost $345,737,827) | | | | | | | 511,063,998 | |
| | | | | | | | |
| | |
| | | Principal
Amount | | | | |
| SHORT-TERM INVESTMENTS — 4.9% | |
| Repurchase Agreement — 4.9% | | | | | | | | |
State Street Bank & Trust Co. Repurchase Agreement, dated 12/31/14, 0.010%, due 1/02/15 (b) | | $ | 26,234,024 | | | | 26,234,024 | |
| | | | | | | | |
| | |
TOTAL SHORT-TERM INVESTMENTS
(Cost $26,234,024) | | | | | | | 26,234,024 | |
| | | | | | | | |
| | |
TOTAL INVESTMENTS — 100.1%
(Cost $371,971,851) (c) | | | | | | | 537,298,022 | |
| | |
| Other Assets/(Liabilities) — (0.1)% | | | | | | | (558,616 | ) |
| | | | | | | | |
| | |
| NET ASSETS — 100.0% | | | | | | $ | 536,739,406 | |
| | | | | | | | |
Notes to Portfolio of Investments
Percentages are stated as a percent of net assets.
| ADR | American Depositary Receipt |
| (a) | Non-income producing security. |
| (b) | Maturity value of $26,234,039. Collateralized by U.S. Government Agency obligations with a rate of 2.500%, maturity date of 3/20/28, and an aggregate market value, including accrued interest, of $26,760,981. |
| (c) | See Note 6 for aggregate cost for federal tax purposes. |
The accompanying notes are an integral part of the financial statements.
68
MML Equity Index Fund – Portfolio of Investments
December 31, 2014
| | | | | | | | |
| | | Number of
Shares | | | Value | |
| EQUITIES — 98.4% | |
|
| COMMON STOCK — 98.4% | |
| Basic Materials — 2.9% | |
| Chemicals — 2.3% | |
Air Products & Chemicals, Inc. | | | 4,646 | | | $ | 670,092 | |
Airgas, Inc. | | | 1,597 | | | | 183,942 | |
CF Industries Holdings, Inc. | | | 1,173 | | | | 319,689 | |
The Dow Chemical Co. | | | 26,542 | | | | 1,210,581 | |
E.I. du Pont de Nemours & Co. | | | 21,683 | | | | 1,603,241 | |
Eastman Chemical Co. | | | 3,611 | | | | 273,930 | |
Ecolab, Inc. | | | 6,435 | | | | 672,586 | |
FMC Corp. | | | 3,191 | | | | 181,983 | |
International Flavors & Fragrances, Inc. | | | 1,894 | | | | 191,976 | |
LyondellBasell Industries NV Class A | | | 9,969 | | | | 791,439 | |
Monsanto Co. | | | 11,633 | | | | 1,389,795 | |
The Mosaic Co. | | | 7,497 | | | | 342,238 | |
PPG Industries, Inc. | | | 3,290 | | | | 760,483 | |
Praxair, Inc. | | | 6,972 | | | | 903,292 | |
The Sherwin-Williams Co. | | | 1,946 | | | | 511,876 | |
Sigma-Aldrich Corp. | | | 2,839 | | | | 389,710 | |
| | | | | | | | |
| | | | | | | 10,396,853 | |
| | | | | | | | |
| Forest Products & Paper — 0.2% | |
International Paper Co. | | | 10,163 | | | | 544,534 | |
MeadWestvaco Corp. | | | 3,890 | | | | 172,677 | |
| | | | | | | | |
| | | | | | | 717,211 | |
| | | | | | | | |
| Iron & Steel — 0.1% | |
Allegheny Technologies, Inc. | | | 2,599 | | | | 90,367 | |
Nucor Corp. | | | 7,621 | | | | 373,810 | |
| | | | | | | | |
| | | | | | | 464,177 | |
| | | | | | | | |
| Mining — 0.3% | |
Alcoa, Inc. | | | 28,086 | | | | 443,478 | |
Freeport-McMoRan, Inc. | | | 24,790 | | | | 579,094 | |
Newmont Mining Corp. | | | 11,681 | | | | 220,771 | |
Vulcan Materials Co. | | | 3,211 | | | | 211,059 | |
| | | | | | | | |
| | | | | | | 1,454,402 | |
| | | | | | | | |
| | | | | | | 13,032,643 | |
| | | | | | | | |
| Communications — 12.2% | |
| Advertising — 0.1% | |
The Interpublic Group of Companies, Inc. | | | 10,204 | | | | 211,937 | |
Omnicom Group, Inc. | | | 5,970 | | | | 462,496 | |
| | | | | | | | |
| | | | | | | 674,433 | |
| | | | | | | | |
| Internet — 4.5% | |
Akamai Technologies, Inc. (a) | | | 4,296 | | | | 270,476 | |
Amazon.com, Inc. (a) | | | 9,101 | | | | 2,824,495 | |
eBay, Inc. (a) | | | 27,104 | | | | 1,521,077 | |
| | | | | | | | |
| | | Number of
Shares | | | Value | |
Expedia, Inc. | | | 2,372 | | | $ | 202,474 | |
F5 Networks, Inc. (a) | | | 1,754 | | | | 228,836 | |
Facebook, Inc. Class A (a) | | | 50,105 | | | | 3,909,192 | |
Google, Inc. Class A (a) | | | 6,834 | | | | 3,626,530 | |
Google, Inc. Class C (a) | | | 6,827 | | | | 3,593,733 | |
Netflix, Inc. (a) | | | 1,430 | | | | 488,502 | |
The Priceline Group, Inc. (a) | | | 1,251 | | | | 1,426,403 | |
Symantec Corp. | | | 16,466 | | | | 422,435 | |
TripAdvisor, Inc. (a) | | | 2,611 | | | | 194,937 | |
VeriSign, Inc. (a) | | | 2,559 | | | | 145,863 | |
Yahoo!, Inc. (a) | | | 21,115 | | | | 1,066,519 | |
| | | | | | | | |
| | | | | | | 19,921,472 | |
| | | | | | | | |
| Media — 3.6% | |
Cablevision Systems Corp. Class A | | | 5,210 | | | | 107,534 | |
CBS Corp. Class B | | | 11,357 | | | | 628,496 | |
Comcast Corp. Class A | | | 61,705 | | | | 3,579,507 | |
DIRECTV (a) | | | 11,965 | | | | 1,037,366 | |
Discovery Communications, Inc. Series A (a) | | | 3,603 | | | | 124,123 | |
Discovery Communications, Inc. Series C (a) | | | 6,652 | | | | 224,305 | |
Gannett Co., Inc. | | | 5,453 | | | | 174,114 | |
The McGraw Hill Financial, Inc. | | | 6,461 | | | | 574,900 | |
News Corp. Class A (a) | | | 12,131 | | | | 190,335 | |
Nielsen NV | | | 7,786 | | | | 348,268 | |
Scripps Networks Interactive Class A | | | 2,422 | | | | 182,304 | |
Time Warner Cable, Inc. | | | 6,724 | | | | 1,022,452 | |
Time Warner, Inc. | | | 20,094 | | | | 1,716,430 | |
Twenty-First Century Fox Class A | | | 44,441 | | | | 1,706,757 | |
Viacom, Inc. Class B | | | 8,869 | | | | 667,392 | |
The Walt Disney Co. | | | 37,383 | | | | 3,521,105 | |
| | | | | | | | |
| | | | | | | 15,805,388 | |
| | | | | | | | |
| Telecommunications — 4.0% | |
AT&T, Inc. | | | 124,360 | | | | 4,177,253 | |
CenturyLink, Inc. | | | 13,597 | | | | 538,169 | |
Cisco Systems, Inc. | | | 122,485 | | | | 3,406,920 | |
Corning, Inc. | | | 30,775 | | | | 705,671 | |
Frontier Communications Corp. | | | 23,509 | | | | 156,805 | |
Harris Corp. | | | 2,518 | | | | 180,843 | |
Juniper Networks, Inc. | | | 9,228 | | | | 205,969 | |
Level 3 Communications, Inc. (a) | | | 6,777 | | | | 334,648 | |
Motorola Solutions, Inc. | | | 5,086 | | | | 341,169 | |
QUALCOMM, Inc. | | | 39,822 | | | | 2,959,969 | |
Verizon Communications, Inc. | | | 99,477 | | | | 4,653,534 | |
Windstream Corp. | | | 14,725 | | | | 121,334 | |
| | | | | | | | |
| | | | | | | 17,782,284 | |
| | | | | | | | |
| | | | | | | 54,183,577 | |
| | | | | | | | |
| Consumer, Cyclical — 9.9% | |
| Airlines — 0.4% | |
Delta Air Lines, Inc. | | | 20,105 | | | | 988,965 | |
The accompanying notes are an integral part of the financial statements.
69
MML Equity Index Fund – Portfolio of Investments (Continued)
| | | | | | | | |
| | | Number of
Shares | | | Value | |
Southwest Airlines Co. | | | 16,344 | | | $ | 691,678 | |
| | | | | | | | |
| | | | | | | 1,680,643 | |
| | | | | | | | |
| Apparel — 0.6% | |
Nike, Inc. Class B | | | 16,677 | | | | 1,603,494 | |
Ralph Lauren Corp. | | | 1,429 | | | | 264,594 | |
Under Armour, Inc. Class A (a) | | | 4,057 | | | | 275,470 | |
VF Corp. | | | 8,345 | | | | 625,040 | |
| | | | | | | | |
| | | | | | | 2,768,598 | |
| | | | | | | | |
| Auto Manufacturers — 0.7% | |
Ford Motor Co. | | | 92,508 | | | | 1,433,874 | |
General Motors Co. | | | 32,477 | | | | 1,133,772 | |
Paccar, Inc. | | | 8,451 | | | | 574,753 | |
| | | | | | | | |
| | | | | | | 3,142,399 | |
| | | | | | | | |
| Automotive & Parts — 0.4% | |
BorgWarner, Inc. | | | 5,374 | | | | 295,301 | |
Delphi Automotive PLC | | | 7,153 | | | | 520,166 | |
The Goodyear Tire & Rubber Co. | | | 6,669 | | | | 190,533 | |
Johnson Controls, Inc. | | | 15,887 | | | | 767,978 | |
| | | | | | | | |
| | | | | | | 1,773,978 | |
| | | | | | | | |
| Distribution & Wholesale — 0.3% | |
Fastenal Co. | | | 6,486 | | | | 308,474 | |
Fossil Group, Inc. (a) | | | 1,050 | | | | 116,277 | |
Genuine Parts Co. | | | 3,659 | | | | 389,939 | |
W.W. Grainger, Inc. | | | 1,467 | | | | 373,924 | |
| | | | | | | | |
| | | | | | | 1,188,614 | |
| | | | | | | | |
| Home Builders — 0.1% | |
D.R. Horton, Inc. | | | 7,764 | | | | 196,352 | |
Lennar Corp. Class A | | | 4,155 | | | | 186,185 | |
PulteGroup, Inc. | | | 8,172 | | | | 175,371 | |
| | | | | | | | |
| | | | | | | 557,908 | |
| | | | | | | | |
| Home Furnishing — 0.1% | |
Harman International Industries, Inc. | | | 1,673 | | | | 178,526 | |
Whirlpool Corp. | | | 1,856 | | | | 359,581 | |
| | | | | | | | |
| | | | | | | 538,107 | |
| | | | | | | | |
| Housewares — 0.1% | |
Newell Rubbermaid, Inc. | | | 6,550 | | | | 249,490 | |
| | | | | | | | |
| Leisure Time — 0.2% | |
Carnival Corp. | | | 10,727 | | | | 486,255 | |
Harley-Davidson, Inc. | | | 5,127 | | | | 337,920 | |
Royal Caribbean Cruises Ltd. | | | 3,976 | | | | 327,742 | |
| | | | | | | | |
| | | | | | | 1,151,917 | |
| | | | | | | | |
| Lodging — 0.3% | |
Marriott International, Inc. Class A | | | 5,163 | | | | 402,869 | |
Starwood Hotels & Resorts Worldwide, Inc. | | | 4,217 | | | | 341,872 | |
Wyndham Worldwide Corp. | | | 2,919 | | | | 250,333 | |
Wynn Resorts Ltd. | | | 1,934 | | | | 287,702 | |
| | | | | | | | |
| | | | | | | 1,282,776 | |
| | | | | | | | |
| | | | | | | | |
| | | Number of
Shares | | | Value | |
| Retail — 6.5% | |
AutoNation, Inc. (a) | | | 1,734 | | | $ | 104,751 | |
AutoZone, Inc. (a) | | | 777 | | | | 481,048 | |
Bed Bath & Beyond, Inc. (a) | | | 4,506 | | | | 343,222 | |
Best Buy Co., Inc. | | | 7,084 | | | | 276,134 | |
CarMax, Inc. (a) | | | 5,107 | | | | 340,024 | |
Chipotle Mexican Grill, Inc. (a) | | | 740 | | | | 506,537 | |
Coach, Inc. | | | 6,494 | | | | 243,915 | |
Costco Wholesale Corp. | | | 10,525 | | | | 1,491,919 | |
CVS Health Corp. | | | 27,471 | | | | 2,645,732 | |
Darden Restaurants, Inc. | | | 3,192 | | | | 187,147 | |
Dollar General Corp. (a) | | | 7,214 | | | | 510,030 | |
Dollar Tree, Inc. (a) | | | 4,935 | | | | 347,325 | |
Family Dollar Stores, Inc. | | | 2,300 | | | | 182,183 | |
GameStop Corp. Class A | | | 2,677 | | | | 90,483 | |
The Gap, Inc. | | | 6,420 | | | | 270,346 | |
The Home Depot, Inc. | | | 31,593 | | | | 3,316,317 | |
Kohl’s Corp. | | | 4,845 | | | | 295,739 | |
L Brands, Inc. | | | 5,956 | | | | 515,492 | |
Lowe’s Cos., Inc. | | | 23,329 | | | | 1,605,035 | |
Macy’s, Inc. | | | 8,271 | | | | 543,818 | |
McDonald’s Corp. | | | 23,321 | | | | 2,185,178 | |
Michael Kors Holdings Ltd. (a) | | | 4,963 | | | | 372,721 | |
Nordstrom, Inc. | | | 3,328 | | | | 264,210 | |
O’Reilly Automotive, Inc. (a) | | | 2,421 | | | | 466,333 | |
PetSmart, Inc. | | | 2,339 | | | | 190,149 | |
PVH Corp. | | | 1,988 | | | | 254,802 | |
Ross Stores, Inc. | | | 4,972 | | | | 468,661 | |
Staples, Inc. | | | 15,451 | | | | 279,972 | |
Starbucks Corp. | | | 17,935 | | | | 1,471,567 | |
Target Corp. | | | 15,278 | | | | 1,159,753 | |
Tiffany & Co. | | | 2,651 | | | | 283,286 | |
The TJX Cos., Inc. | | | 16,544 | | | | 1,134,587 | |
Tractor Supply Co. | | | 3,265 | | | | 257,347 | |
Urban Outfitters, Inc. (a) | | | 2,445 | | | | 85,893 | |
Wal-Mart Stores, Inc. | | | 37,853 | | | | 3,250,816 | |
Walgreens Boots Alliance, Inc. | | | 20,843 | | | | 1,588,237 | |
Yum! Brands, Inc. | | | 10,496 | | | | 764,634 | |
| | | | | | | | |
| | | | | | | 28,775,343 | |
| | | | | | | | |
| Textiles — 0.1% | |
Cintas Corp. | | | 2,340 | | | | 183,550 | |
Mohawk Industries, Inc. (a) | | | 1,492 | | | | 231,797 | |
| | | | | | | | |
| | | | | | | 415,347 | |
| | | | | | | | |
| Toys, Games & Hobbies — 0.1% | |
Hasbro, Inc. | | | 2,757 | | | | 151,608 | |
Mattel, Inc. | | | 8,140 | | | | 251,892 | |
| | | | | | | | |
| | | | | | | 403,500 | |
| | | | | | | | |
| | | | | | | 43,928,620 | |
| | | | | | | | |
| Consumer, Non-cyclical — 23.4% | |
| Agriculture — 1.6% | |
Altria Group, Inc. | | | 47,359 | | | | 2,333,378 | |
The accompanying notes are an integral part of the financial statements.
70
MML Equity Index Fund – Portfolio of Investments (Continued)
| | | | | | | | |
| | | Number of
Shares | | | Value | |
Archer-Daniels-Midland Co. | | | 15,401 | | | $ | 800,852 | |
Lorillard, Inc. | | | 8,591 | | | | 540,718 | |
Philip Morris International, Inc. | | | 37,251 | | | | 3,034,094 | |
Reynolds American, Inc. | | | 7,319 | | | | 470,392 | |
| | | | | | | | |
| | | | | | | 7,179,434 | |
| | | | | | | | |
| Beverages — 2.2% | |
Brown-Forman Corp. Class B | | | 3,738 | | | | 328,346 | |
The Coca-Cola Co. | | | 94,470 | | | | 3,988,523 | |
Coca-Cola Enterprises, Inc. | | | 5,274 | | | | 233,216 | |
Constellation Brands, Inc. Class A (a) | | | 4,057 | | | | 398,276 | |
Dr. Pepper Snapple Group, Inc. | | | 4,701 | | | | 336,968 | |
Keurig Green Mountain, Inc. | | | 2,894 | | | | 383,151 | |
Molson Coors Brewing Co. Class B | | | 3,778 | | | | 281,536 | |
Monster Beverage Corp. (a) | | | 3,502 | | | | 379,442 | |
PepsiCo, Inc. | | | 35,864 | | | | 3,391,300 | |
| | | | | | | | |
| | | | | | | 9,720,758 | |
| | | | | | | | |
| Biotechnology — 2.1% | |
Alexion Pharmaceuticals, Inc. (a) | | | 4,773 | | | | 883,148 | |
Amgen, Inc. | | | 18,215 | | | | 2,901,467 | |
Biogen Idec, Inc. (a) | | | 5,662 | | | | 1,921,966 | |
Celgene Corp. (a) | | | 19,159 | | | | 2,143,126 | |
Regeneron Pharmaceuticals, Inc. (a) | | | 1,784 | | | | 731,886 | |
Vertex Pharmaceuticals, Inc. (a) | | | 5,766 | | | | 685,001 | |
| | | | | | | | |
| | | | | | | 9,266,594 | |
| | | | | | | | |
| Commercial Services — 2.3% | |
The ADT Corp. | | | 4,143 | | | | 150,101 | |
Alliance Data Systems Corp. (a) | | | 1,524 | | | | 435,940 | |
Automatic Data Processing, Inc. | | | 11,581 | | | | 965,508 | |
Equifax, Inc. | | | 2,874 | | | | 232,420 | |
H&R Block, Inc. | | | 6,513 | | | | 219,358 | |
Iron Mountain, Inc. | | | 4,451 | | | | 172,076 | |
MasterCard, Inc. Class A | | | 23,469 | | | | 2,022,089 | |
McKesson Corp. | | | 5,576 | | | | 1,157,466 | |
Moody’s Corp. | | | 4,439 | | | | 425,301 | |
Paychex, Inc. | | | 7,784 | | | | 359,387 | |
Quanta Services, Inc. (a) | | | 5,069 | | | | 143,909 | |
Robert Half International, Inc. | | | 3,333 | | | | 194,581 | |
Total System Services, Inc. | | | 3,920 | | | | 133,123 | |
United Rentals, Inc. (a) | | | 2,431 | | | | 247,986 | |
Visa, Inc. Class A | | | 11,699 | | | | 3,067,478 | |
Western Union Co. | | | 12,350 | | | | 221,188 | |
| | | | | | | | |
| | | | | | | 10,147,911 | |
| | | | | | | | |
| Cosmetics & Personal Care — 1.8% | |
Avon Products, Inc. | | | 10,651 | | | | 100,013 | |
Colgate-Palmolive Co. | | | 20,505 | | | | 1,418,741 | |
The Estee Lauder Cos., Inc. Class A | | | 5,339 | | | | 406,832 | |
The Procter & Gamble Co. | | | 64,776 | | | | 5,900,446 | |
| | | | | | | | |
| | | | | | | 7,826,032 | |
| | | | | | | | |
| Foods — 1.6% | |
Campbell Soup Co. | | | 4,303 | | | | 189,332 | |
| | | | | | | | |
| | | Number of
Shares | | | Value | |
ConAgra Foods, Inc. | | | 10,271 | | | $ | 372,632 | |
General Mills, Inc. | | | 14,439 | | | | 770,032 | |
The Hershey Co. | | | 3,592 | | | | 373,317 | |
Hormel Foods Corp. | | | 3,209 | | | | 167,189 | |
The J.M. Smucker Co. | | | 2,399 | | | | 242,251 | |
Kellogg Co. | | | 6,027 | | | | 394,407 | |
Kraft Foods Group, Inc. | | | 14,205 | | | | 890,085 | |
The Kroger Co. | | | 11,833 | | | | 759,797 | |
McCormick & Co., Inc. | | | 3,064 | | | | 227,655 | |
Mondelez International, Inc. Class A | | | 40,224 | | | | 1,461,137 | |
Safeway, Inc. | | | 5,585 | | | | 196,145 | |
Sysco Corp. | | | 13,990 | | | | 555,263 | |
Tyson Foods, Inc. Class A | | | 6,911 | | | | 277,062 | |
Whole Foods Market, Inc. | | | 8,612 | | | | 434,217 | |
| | | | | | | | |
| | | | | | | 7,310,521 | |
| | | | | | | | |
| Health Care – Products — 3.4% | |
Baxter International, Inc. | | | 13,061 | | | | 957,241 | |
Becton, Dickinson & Co. | | | 4,576 | | | | 636,796 | |
Boston Scientific Corp. (a) | | | 32,043 | | | | 424,570 | |
C.R. Bard, Inc. | | | 1,806 | | | | 300,916 | |
CareFusion Corp. (a) | | | 4,924 | | | | 292,190 | |
Covidien PLC | | | 10,872 | | | | 1,111,988 | |
Edwards Lifesciences Corp. (a) | | | 2,542 | | | | 323,800 | |
Intuitive Surgical, Inc. (a) | | | 875 | | | | 462,822 | |
Johnson & Johnson | | | 67,094 | | | | 7,016,020 | |
Medtronic, Inc. | | | 23,577 | | | | 1,702,259 | |
St. Jude Medical, Inc. | | | 6,790 | | | | 441,554 | |
Stryker Corp. | | | 7,135 | | | | 673,044 | |
Varian Medical Systems, Inc. (a) | | | 2,393 | | | | 207,018 | |
Zimmer Holdings, Inc. | | | 4,030 | | | | 457,083 | |
| | | | | | | | |
| | | | | | | 15,007,301 | |
| | | | | | | | |
| Health Care – Services — 1.7% | |
Aetna, Inc. | | | 8,460 | | | | 751,502 | |
Anthem, Inc. | | | 6,462 | | | | 812,079 | |
Cigna Corp. | | | 6,294 | | | | 647,716 | |
DaVita HealthCare Partners, Inc. (a) | | | 4,057 | | | | 307,277 | |
Humana, Inc. | | | 3,655 | | | | 524,968 | |
Laboratory Corporation of America Holdings (a) | | | 1,974 | | | | 212,995 | |
Quest Diagnostics, Inc. | | | 3,461 | | | | 232,095 | |
Tenet Healthcare Corp. (a) | | | 2,326 | | | | 117,858 | |
Thermo Fisher Scientific, Inc. | | | 9,603 | | | | 1,203,160 | |
UnitedHealth Group, Inc. | | | 22,992 | | | | 2,324,261 | |
Universal Health Services, Inc. Class B | | | 2,221 | | | | 247,108 | |
| | | | | | | | |
| | | | | | | 7,381,019 | |
| | | | | | | | |
| Household Products — 0.3% | |
Avery Dennison Corp. | | | 2,190 | | | | 113,617 | |
The Clorox Co. | | | 3,134 | | | | 326,594 | |
Kimberly-Clark Corp. | | | 8,929 | | | | 1,031,657 | |
| | | | | | | | |
| | | | | | | 1,471,868 | |
| | | | | | | | |
The accompanying notes are an integral part of the financial statements.
71
MML Equity Index Fund – Portfolio of Investments (Continued)
| | | | | | | | |
| | | Number of
Shares | | | Value | |
| Pharmaceuticals — 6.4% | |
Abbott Laboratories | | | 36,093 | | | $ | 1,624,907 | |
AbbVie, Inc. | | | 38,186 | | | | 2,498,892 | |
Actavis PLC (a) | | | 6,351 | | | | 1,634,811 | |
Allergan, Inc. | | | 7,138 | | | | 1,517,467 | |
AmerisourceBergen Corp. | | | 4,970 | | | | 448,095 | |
Bristol-Myers Squibb Co. | | | 39,762 | | | | 2,347,151 | |
Cardinal Health, Inc. | | | 7,913 | | | | 638,816 | |
DENTSPLY International, Inc. | | | 3,342 | | | | 178,028 | |
Eli Lilly & Co. | | | 23,452 | | | | 1,617,953 | |
Express Scripts Holding Co. (a) | | | 17,585 | | | | 1,488,922 | |
Gilead Sciences, Inc. (a) | | | 36,150 | | | | 3,407,499 | |
Hospira, Inc. (a) | | | 3,976 | | | | 243,530 | |
Mallinckrodt PLC (a) | | | 2,751 | | | | 272,432 | |
Mead Johnson Nutrition Co. | | | 4,813 | | | | 483,899 | |
Merck & Co., Inc. | | | 68,332 | | | | 3,880,574 | |
Mylan, Inc. (a) | | | 8,919 | | | | 502,764 | |
Patterson Cos., Inc. | | | 2,137 | | | | 102,790 | |
Perrigo Co. PLC | | | 3,377 | | | | 564,499 | |
Pfizer, Inc. | | | 150,850 | | | | 4,698,978 | |
Zoetis, Inc. | | | 11,956 | | | | 514,467 | |
| | | | | | | | |
| | | | | | | 28,666,474 | |
| | | | | | | | |
| | | | | | | 103,977,912 | |
| | | | | | | | |
| Diversified — 0.1% | |
| Holding Company – Diversified — 0.1% | |
Leucadia National Corp. | | | 7,682 | | | | 172,230 | |
| | | | | | | | |
| Energy — 8.3% | |
| Coal — 0.1% | |
CONSOL Energy, Inc. | | | 5,456 | | | | 184,467 | |
| | | | | | | | |
| Energy – Alternate Sources — 0.0% | |
First Solar, Inc. (a) | | | 1,828 | | | | 81,520 | |
| | | | | | | | |
| Oil & Gas — 6.3% | |
Anadarko Petroleum Corp. | | | 12,193 | | | | 1,005,923 | |
Apache Corp. | | | 9,111 | | | | 570,986 | |
Cabot Oil & Gas Corp. | | | 9,942 | | | | 294,383 | |
Chesapeake Energy Corp. | | | 12,218 | | | | 239,106 | |
Chevron Corp. | | | 45,274 | | | | 5,078,837 | |
Cimarex Energy Co. | | | 2,112 | | | | 223,872 | |
ConocoPhillips | | | 29,519 | | | | 2,038,582 | |
Denbury Resources, Inc. | | | 8,580 | | | | 69,755 | |
Devon Energy Corp. | | | 9,162 | | | | 560,806 | |
Diamond Offshore Drilling, Inc. | | | 1,713 | | | | 62,884 | |
Ensco PLC Class A | | | 5,621 | | | | 168,349 | |
EOG Resources, Inc. | | | 13,169 | | | | 1,212,470 | |
EQT Corp. | | | 3,611 | | | | 273,353 | |
Exxon Mobil Corp. | | | 101,487 | | | | 9,382,473 | |
Helmerich & Payne, Inc. | | | 2,515 | | | | 169,561 | |
Hess Corp. | | | 6,058 | | | | 447,202 | |
Marathon Oil Corp. | | | 16,058 | | | | 454,281 | |
Marathon Petroleum Corp. | | | 6,755 | | | | 609,706 | |
Murphy Oil Corp. | | | 4,062 | | | | 205,212 | |
| | | | | | | | |
| | | Number of
Shares | | | Value | |
Nabors Industries Ltd. | | | 6,899 | | | $ | 89,549 | |
Newfield Exploration Co. (a) | | | 3,376 | | | | 91,557 | |
Noble Corp. PLC | | | 6,201 | | | | 102,751 | |
Noble Energy, Inc. | | | 8,551 | | | | 405,574 | |
Occidental Petroleum Corp. | | | 18,585 | | | | 1,498,137 | |
Phillips 66 | | | 13,325 | | | | 955,403 | |
Pioneer Natural Resources Co. | | | 3,575 | | | | 532,139 | |
QEP Resources, Inc. | | | 4,024 | | | | 81,365 | |
Range Resources Corp. | | | 3,959 | | | | 211,609 | |
Southwestern Energy Co. (a) | | | 8,503 | | | | 232,047 | |
Tesoro Corp. | | | 2,964 | | | | 220,373 | |
Valero Energy Corp. | | | 12,588 | | | | 623,106 | |
| | | | | | | | |
| | | | | | | 28,111,351 | |
| | | | | | | | |
| Oil & Gas Services — 1.2% | |
Baker Hughes, Inc. | | | 10,371 | | | | 581,502 | |
Cameron International Corp. (a) | | | 4,775 | | | | 238,511 | |
FMC Technologies, Inc. (a) | | | 5,592 | | | | 261,929 | |
Halliburton Co. | | | 20,278 | | | | 797,534 | |
National Oilwell Varco, Inc. | | | 10,245 | | | | 671,355 | |
Schlumberger Ltd. | | | 30,907 | | | | 2,639,767 | |
Transocean Ltd. | | | 8,277 | | | | 151,717 | |
| | | | | | | | |
| | | | | | | 5,342,315 | |
| | | | | | | | |
| Pipelines — 0.7% | |
Kinder Morgan, Inc. | | | 40,776 | | | | 1,725,233 | |
ONEOK, Inc. | | | 4,936 | | | | 245,763 | |
Spectra Energy Corp. | | | 15,987 | | | | 580,328 | |
The Williams Cos., Inc. | | | 16,038 | | | | 720,748 | |
| | | | | | | | |
| | | | | | | 3,272,072 | |
| | | | | | | | |
| | | | | | | 36,991,725 | |
| | | | | | | | |
| Financial — 16.1% | |
| Banks — 4.5% | |
Bank of America Corp. | | | 252,017 | | | | 4,508,584 | |
Bank of New York Mellon Corp. | | | 26,975 | | | | 1,094,376 | |
BB&T Corp. | | | 17,152 | | | | 667,041 | |
Capital One Financial Corp. | | | 13,259 | | | | 1,094,530 | |
Comerica, Inc. | | | 4,363 | | | | 204,363 | |
Fifth Third Bancorp | | | 19,749 | | | | 402,386 | |
Huntington Bancshares, Inc. | | | 19,628 | | | | 206,487 | |
KeyCorp | | | 20,322 | | | | 282,476 | |
M&T Bank Corp. | | | 3,141 | | | | 394,572 | |
Northern Trust Corp. | | | 5,477 | | | | 369,150 | |
PNC Financial Services Group, Inc. | | | 12,643 | | | | 1,153,421 | |
Regions Financial Corp. | | | 32,417 | | | | 342,323 | |
State Street Corp. | | | 9,958 | | | | 781,703 | |
SunTrust Banks, Inc. | | | 12,346 | | | | 517,297 | |
U.S. Bancorp | | | 42,969 | | | | 1,931,457 | |
Wells Fargo & Co. | | | 113,095 | | | | 6,199,868 | |
Zions Bancorp | | | 4,952 | | | | 141,182 | |
| | | | | | | | |
| | | | | | | 20,291,216 | |
| | | | | | | | |
The accompanying notes are an integral part of the financial statements.
72
MML Equity Index Fund – Portfolio of Investments (Continued)
| | | | | | | | |
| | | Number of
Shares | | | Value | |
| Diversified Financial — 4.9% | |
Affiliated Managers Group, Inc. (a) | | | 1,344 | | | $ | 285,251 | |
American Express Co. | | | 21,358 | | | | 1,987,148 | |
Ameriprise Financial, Inc. | | | 4,382 | | | | 579,519 | |
BlackRock, Inc. | | | 3,058 | | | | 1,093,418 | |
The Charles Schwab Corp. | | | 27,699 | | | | 836,233 | |
Citigroup, Inc. | | | 72,610 | | | | 3,928,927 | |
CME Group, Inc. | | | 7,631 | | | | 676,488 | |
Discover Financial Services | | | 10,859 | | | | 711,156 | |
E*TRADE Financial Corp. (a) | | | 6,736 | | | | 163,382 | |
Franklin Resources, Inc. | | | 9,383 | | | | 519,537 | |
The Goldman Sachs Group, Inc. | | | 9,710 | | | | 1,882,089 | |
IntercontinentalExchange, Inc. | | | 2,702 | | | | 592,522 | |
Invesco Ltd. | | | 10,238 | | | | 404,606 | |
JP Morgan Chase & Co. | | | 89,674 | | | | 5,611,799 | |
Legg Mason, Inc. | | | 2,339 | | | | 124,832 | |
Morgan Stanley | | | 36,499 | | | | 1,416,161 | |
The NASDAQ OMX Group, Inc. | | | 2,919 | | | | 139,995 | |
Navient Corp. | | | 9,814 | | | | 212,081 | |
T. Rowe Price Group, Inc. | | | 6,152 | | | | 528,211 | |
| | | | | | | | |
| | | | | | | 21,693,355 | |
| | | | | | | | |
| Insurance — 4.2% | |
ACE Ltd. | | | 7,933 | | | | 911,343 | |
Aflac, Inc. | | | 10,814 | | | | 660,627 | |
The Allstate Corp. | | | 10,077 | | | | 707,909 | |
American International Group, Inc. | | | 33,588 | | | | 1,881,264 | |
Aon PLC | | | 6,824 | | | | 647,120 | |
Assurant, Inc. | | | 1,723 | | | | 117,905 | |
Berkshire Hathaway, Inc. Class B (a) | | | 43,694 | | | | 6,560,654 | |
The Chubb Corp. | | | 5,645 | | | | 584,088 | |
Cincinnati Financial Corp. | | | 3,504 | | | | 181,612 | |
Genworth Financial, Inc. Class A (a) | | | 12,309 | | | | 104,627 | |
The Hartford Financial Services Group, Inc. | | | 10,338 | | | | 430,991 | |
Lincoln National Corp. | | | 6,175 | | | | 356,112 | |
Loews Corp. | | | 7,232 | | | | 303,889 | |
Marsh & McLennan Cos., Inc. | | | 12,999 | | | | 744,063 | |
MetLife, Inc. | | | 27,257 | | | | 1,474,331 | |
Principal Financial Group, Inc. | | | 6,450 | | | | 335,013 | |
The Progressive Corp. | | | 12,663 | | | | 341,775 | |
Prudential Financial, Inc. | | | 10,968 | | | | 992,165 | |
Torchmark Corp. | | | 3,174 | | | | 171,936 | |
The Travelers Cos., Inc. | | | 7,961 | | | | 842,672 | |
Unum Group | | | 5,972 | | | | 208,303 | |
XL Group PLC | | | 6,208 | | | | 213,369 | |
| | | | | | | | |
| | | | | | | 18,771,768 | |
| | | | | | | | |
| Real Estate — 0.1% | |
CBRE Group, Inc. (a) | | | 6,702 | | | | 229,543 | |
| | | | | | | | |
| Real Estate Investment Trusts (REITS) — 2.3% | |
American Tower Corp. | | | 9,560 | | | | 945,006 | |
Apartment Investment & Management Co. Class A | | | 3,453 | | | | 128,279 | |
| | | | | | | | |
| | | Number of
Shares | | | Value | |
AvalonBay Communities, Inc. | | | 3,133 | | | $ | 511,901 | |
Boston Properties, Inc. | | | 3,712 | | | | 477,697 | |
Crown Castle International Corp. | | | 7,967 | | | | 627,003 | |
Equity Residential | | | 8,646 | | | | 621,129 | |
Essex Property Trust, Inc. | | | 1,566 | | | | 323,536 | |
General Growth Properties, Inc. | | | 14,915 | | | | 419,559 | |
HCP, Inc. | | | 11,090 | | | | 488,293 | |
Health Care REIT, Inc. | | | 7,889 | | | | 596,961 | |
Host Hotels & Resorts, Inc. | | | 18,045 | | | | 428,930 | |
Kimco Realty Corp. | | | 9,702 | | | | 243,908 | |
The Macerich Co. | | | 3,376 | | | | 281,592 | |
Plum Creek Timber Co., Inc. | | | 4,317 | | | | 184,724 | |
Prologis, Inc. | | | 11,872 | | | | 510,852 | |
Public Storage | | | 3,476 | | | | 642,538 | |
Simon Property Group, Inc. | | | 7,434 | | | | 1,353,806 | |
Ventas, Inc. | | | 7,112 | | | | 509,930 | |
Vornado Realty Trust | | | 4,163 | | | | 490,027 | |
Weyerhaeuser Co. | | | 12,509 | | | | 448,948 | |
| | | | | | | | |
| | | | | | | 10,234,619 | |
| | | | | | | | |
| Savings & Loans — 0.1% | |
Hudson City Bancorp, Inc. | | | 12,030 | | | | 121,744 | |
People’s United Financial, Inc. | | | 7,564 | | | | 114,821 | |
| | | | | | | | |
| | | | | | | 236,565 | |
| | | | | | | | |
| | | | | | | 71,457,066 | |
| | | | | | | | |
| Industrial — 9.8% | |
| Aerospace & Defense — 2.0% | |
The Boeing Co. | | | 15,887 | | | | 2,064,992 | |
General Dynamics Corp. | | | 7,577 | | | | 1,042,747 | |
L-3 Communications Holdings, Inc. | | | 2,064 | | | | 260,497 | |
Lockheed Martin Corp. | | | 6,437 | | | | 1,239,573 | |
Northrop Grumman Corp. | | | 4,831 | | | | 712,041 | |
Raytheon Co. | | | 7,403 | | | | 800,783 | |
Rockwell Collins, Inc. | | | 3,197 | | | | 270,083 | |
United Technologies Corp. | | | 20,278 | | | | 2,331,970 | |
| | | | | | | | |
| | | | | | | 8,722,686 | |
| | | | | | | | |
| Building Materials — 0.1% | |
Martin Marietta Materials, Inc. | | | 1,477 | | | | 162,943 | |
Masco Corp. | | | 8,355 | | | | 210,546 | |
| | | | | | | | |
| | | | | | | 373,489 | |
| | | | | | | | |
| Electrical Components & Equipment — 0.3% | |
AMETEK, Inc. | | | 5,942 | | | | 312,727 | |
Emerson Electric Co. | | | 16,626 | | | | 1,026,323 | |
| | | | | | | | |
| | | | | | | 1,339,050 | |
| | | | | | | | |
| Electronics — 0.6% | |
Agilent Technologies, Inc. | | | 8,099 | | | | 331,573 | |
Allegion PLC | | | 2,349 | | | | 130,276 | |
Amphenol Corp. Class A | | | 7,358 | | | | 395,934 | |
FLIR Systems, Inc. | | | 3,474 | | | | 112,245 | |
Garmin Ltd. | | | 2,954 | | | | 156,060 | |
PerkinElmer, Inc. | | | 2,826 | | | | 123,581 | |
The accompanying notes are an integral part of the financial statements.
73
MML Equity Index Fund – Portfolio of Investments (Continued)
| | | | | | | | |
| | | Number of
Shares | | | Value | |
TE Connectivity Ltd. | | | 9,753 | | | $ | 616,877 | |
Tyco International PLC | | | 9,978 | | | | 437,635 | |
Waters Corp. (a) | | | 2,031 | | | | 228,934 | |
| | | | | | | | |
| | | | | | | 2,533,115 | |
| | | | | | | | |
| Engineering & Construction — 0.1% | |
Fluor Corp. | | | 3,802 | | | | 230,515 | |
Jacobs Engineering Group, Inc. (a) | | | 3,185 | | | | 142,338 | |
| | | | | | | | |
| | | | | | | 372,853 | |
| | | | | | | | |
| Environmental Controls — 0.2% | |
Republic Services, Inc. | | | 6,169 | | | | 248,302 | |
Stericycle, Inc. (a) | | | 2,043 | | | | 267,797 | |
Waste Management, Inc. | | | 10,128 | | | | 519,769 | |
| | | | | | | | |
| | | | | | | 1,035,868 | |
| | | | | | | | |
| Hand & Machine Tools — 0.1% | |
Snap-on, Inc. | | | 1,416 | | | | 193,624 | |
Stanley Black & Decker, Inc. | | | 3,777 | | | | 362,894 | |
| | | | | | | | |
| | | | | | | 556,518 | |
| | | | | | | | |
| Machinery – Construction & Mining — 0.4% | |
Caterpillar, Inc. | | | 14,537 | | | | 1,330,572 | |
Ingersoll-Rand PLC | | | 6,345 | | | | 402,209 | |
Joy Global, Inc. | | | 2,356 | | | | 109,601 | |
| | | | | | | | |
| | | | | | | 1,842,382 | |
| | | | | | | | |
| Machinery – Diversified — 0.5% | |
Cummins, Inc. | | | 4,077 | | | | 587,781 | |
Deere & Co. | | | 8,544 | | | | 755,888 | |
Flowserve Corp. | | | 3,209 | | | | 191,994 | |
Rockwell Automation, Inc. | | | 3,247 | | | | 361,066 | |
Roper Industries, Inc. | | | 2,379 | | | | 371,957 | |
Xylem, Inc. | | | 4,284 | | | | 163,092 | |
| | | | | | | | |
| | | | | | | 2,431,778 | |
| | | | | | | | |
| Manufacturing — 3.4% | |
3M Co. | | | 15,369 | | | | 2,525,434 | |
Danaher Corp. | | | 14,686 | | | | 1,258,737 | |
Dover Corp. | | | 3,935 | | | | 282,218 | |
Eaton Corp. PLC | | | 11,340 | | | | 770,666 | |
General Electric Co. | | | 240,780 | | | | 6,084,511 | |
Honeywell International, Inc. | | | 18,758 | | | | 1,874,299 | |
Illinois Tool Works, Inc. | | | 8,585 | | | | 813,000 | |
Leggett & Platt, Inc. | | | 3,276 | | | | 139,590 | |
Pall Corp. | | | 2,523 | | | | 255,353 | |
Parker Hannifin Corp. | | | 3,546 | | | | 457,257 | |
Pentair PLC | | | 4,497 | | | | 298,691 | |
Textron, Inc. | | | 6,730 | | | | 283,400 | |
| | | | | | | | |
| | | | | | | 15,043,156 | |
| | | | | | | | |
| Metal Fabricate & Hardware — 0.2% | |
Precision Castparts Corp. | | | 3,419 | | | | 823,569 | |
| | | | | | | | |
| Packaging & Containers — 0.1% | |
Ball Corp. | | | 3,270 | | | | 222,916 | |
Owens-Illinois, Inc. (a) | | | 4,008 | | | | 108,176 | |
| | | | | | | | |
| | | Number of
Shares | | | Value | |
Sealed Air Corp. | | | 5,155 | | | $ | 218,726 | |
| | | | | | | | |
| | | | | | | 549,818 | |
| | | | | | | | |
| Transportation — 1.8% | |
American ExpressNorfolk Southern Corp. | | | 7,376 | | | | 808,483 | |
C.H. Robinson Worldwide, Inc. | | | 3,529 | | | | 264,287 | |
CSX Corp. | | | 23,830 | | | | 863,361 | |
Expeditors International of Washington, Inc. | | | 4,555 | | | | 203,199 | |
FedEx Corp. | | | 6,326 | | | | 1,098,573 | |
Kansas City Southern | | | 2,623 | | | | 320,085 | |
Ryder System, Inc. | | | 1,306 | | | | 121,262 | |
Union Pacific Corp. | | | 21,310 | | | | 2,538,660 | |
United Parcel Service, Inc. Class B | | | 16,680 | | | | 1,854,316 | |
| | | | | | | | |
| | | | | | | 8,072,226 | |
| | | | | | | | |
| | | | | | | 43,696,508 | |
| | | | | | | | |
| Technology — 12.5% | |
| Computers — 6.0% | |
Accenture PLC Class A | | | 15,054 | | | | 1,344,473 | |
Apple, Inc. | | | 140,531 | | | | 15,511,812 | |
Cognizant Technology Solutions Corp. Class A (a) | | | 14,689 | | | | 773,523 | |
Computer Sciences Corp. | | | 3,357 | | | | 211,659 | |
EMC Corp. | | | 48,768 | | | | 1,450,360 | |
Hewlett-Packard Co. | | | 44,784 | | | | 1,797,182 | |
International Business Machines Corp. | | | 22,056 | | | | 3,538,665 | |
NetApp, Inc. | | | 7,535 | | | | 312,326 | |
SanDisk Corp. | | | 5,333 | | | | 522,527 | |
Seagate Technology PLC | | | 7,912 | | | | 526,148 | |
Teradata Corp. (a) | | | 3,764 | | | | 164,411 | |
Western Digital Corp. | | | 5,252 | | | | 581,396 | |
| | | | | | | | |
| | | | | | | 26,734,482 | |
| | | | | | | | |
| Office Equipment/Supplies — 0.1% | | | | | | | | |
Pitney Bowes, Inc. | | | 4,673 | | | | 113,881 | |
Xerox Corp. | | | 25,595 | | | | 354,747 | |
| | | | | | | | |
| | | | | | | 468,628 | |
| | | | | | | | |
| Semiconductors — 2.4% | | | | | | | | |
Altera Corp. | | | 7,209 | | | | 266,300 | |
Analog Devices, Inc. | | | 7,489 | | | | 415,789 | |
Applied Materials, Inc. | | | 29,085 | | | | 724,798 | |
Avago Technologies Ltd. | | | 6,081 | | | | 611,688 | |
Broadcom Corp. Class A | | | 12,840 | | | | 556,357 | |
Intel Corp. | | | 115,827 | | | | 4,203,362 | |
KLA-Tencor Corp. | | | 4,004 | | | | 281,561 | |
Lam Research Corp. | | | 3,836 | | | | 304,348 | |
Linear Technology Corp. | | | 5,806 | | | | 264,754 | |
Microchip Technology, Inc. | | | 4,693 | | | | 211,701 | |
Micron Technology, Inc. (a) | | | 25,852 | | | | 905,079 | |
NVIDIA Corp. | | | 12,551 | | | | 251,648 | |
The accompanying notes are an integral part of the financial statements.
74
MML Equity Index Fund – Portfolio of Investments (Continued)
| | | | | | | | |
| | | Number of
Shares | | | Value | |
Texas Instruments, Inc. | | | 25,220 | | | $ | 1,348,387 | |
Xilinx, Inc. | | | 6,316 | | | | 273,420 | |
| | | | | | | | |
| | | | | | | 10,619,192 | |
| | | | | | | | |
| Software — 4.0% | | | | | | | | |
Adobe Systems, Inc. (a) | | | 11,403 | | | | 828,998 | |
Autodesk, Inc. (a) | | | 5,420 | | | | 325,525 | |
CA, Inc. | | | 7,766 | | | | 236,475 | |
Cerner Corp. (a) | | | 7,225 | | | | 467,169 | |
Citrix Systems, Inc. (a) | | | 3,798 | | | | 242,312 | |
The Dun & Bradstreet Corp. | | | 817 | | | | 98,824 | |
Electronic Arts, Inc. (a) | | | 7,380 | | | | 346,971 | |
Fidelity National Information Services, Inc. | | | 6,784 | | | | 421,965 | |
Fiserv, Inc. (a) | | | 5,859 | | | | 415,813 | |
Intuit, Inc. | | | 6,882 | | | | 634,452 | |
Microsoft Corp. | | | 197,530 | | | | 9,175,268 | |
Oracle Corp. | | | 77,545 | | | | 3,487,199 | |
Red Hat, Inc. (a) | | | 4,472 | | | | 309,194 | |
Salesforce.com, Inc. (a) | | | 14,069 | | | | 834,432 | |
| | | | | | | | |
| | | | | | | 17,824,597 | |
| | | | | | | | |
| | | | | | | 55,646,899 | |
| | | | | | | | |
| Utilities — 3.2% | |
| Electric — 2.9% | |
The AES Corp. | | | 16,050 | | | | 221,009 | |
Ameren Corp. | | | 5,851 | | | | 269,907 | |
American Electric Power Co., Inc. | | | 11,645 | | | | 707,084 | |
CenterPoint Energy, Inc. | | | 10,138 | | | | 237,533 | |
CMS Energy Corp. | | | 6,604 | | | | 229,489 | |
Consolidated Edison, Inc. | | | 6,970 | | | | 460,090 | |
Dominion Resources, Inc. | | | 14,039 | | | | 1,079,599 | |
DTE Energy Co. | | | 4,273 | | | | 369,059 | |
Duke Energy Corp. | | | 17,012 | | | | 1,421,182 | |
Edison International | | | 7,777 | | | | 509,238 | |
Entergy Corp. | | | 4,282 | | | | 374,589 | |
Exelon Corp. | | | 20,487 | | | | 759,658 | |
FirstEnergy Corp. | | | 9,962 | | | | 388,418 | |
Integrys Energy Group, Inc. | | | 1,850 | | | | 144,023 | |
NextEra Energy, Inc. | | | 10,503 | | | | 1,116,364 | |
Northeast Utilities | | | 7,751 | | | | 414,834 | |
NRG Energy, Inc. | | | 8,262 | | | | 222,661 | |
Pepco Holdings, Inc. | | | 6,057 | | | | 163,115 | |
PG&E Corp. | | | 11,430 | | | | 608,533 | |
Pinnacle West Capital Corp. | | | 2,700 | | | | 184,437 | |
PPL Corp. | | | 15,833 | | | | 575,213 | |
Public Service Enterprise Group, Inc. | | | 12,058 | | | | 499,322 | |
SCANA Corp. | | | 3,400 | | | | 205,360 | |
The Southern Co. | | | 21,686 | | | | 1,064,999 | |
TECO Energy, Inc. | | | 5,672 | | | | 116,219 | |
Wisconsin Energy Corp. | | | 5,358 | | | | 282,581 | |
Xcel Energy, Inc. | | | 12,023 | | | | 431,866 | |
| | | | | | | | |
| | | | | | | 13,056,382 | |
| | | | | | | | |
| | | | | | | | |
| | | Number of
Shares | | | Value | |
| Gas — 0.3% | |
AGL Resources, Inc. | | | 2,834 | | | $ | 154,482 | |
NiSource, Inc. | | | 7,615 | | | | 323,028 | |
Sempra Energy | | | 5,509 | | | | 613,482 | |
| | | | | | | | |
| | | | | | | 1,090,992 | |
| | | | | | | | |
| | | | | | | 14,147,374 | |
| | | | | | | | |
| | |
TOTAL COMMON STOCK
(Cost $234,931,886) | | | | | | | 437,234,554 | |
| | | | | | | | |
| | |
TOTAL EQUITIES
(Cost $234,931,886) | | | | | | | 437,234,554 | |
| | | | | | | | |
| | |
TOTAL LONG-TERM INVESTMENTS
(Cost $234,931,886) | | | | | | | 437,234,554 | |
| | | | | | | | |
| | |
| | | Principal
Amount | | | | |
| SHORT-TERM INVESTMENTS — 1.7% | |
| Repurchase Agreement — 1.4% | | | | | |
State Street Bank & Trust Co. Repurchase Agreement, dated 12/31/14, 0.010%, due 1/02/15 (b) | | $ | 6,242,699 | | | | 6,242,699 | |
| | | | | | | | |
| Time Deposits — 0.1% | |
Euro Time Deposit
0.010% 1/02/15 | | | 344,097 | | | | 344,097 | |
| | | | | | | | |
| U.S. Treasury Bills — 0.2% | |
U.S. Treasury Bill (c)
0.000% 4/30/15 | | | 605,000 | | | | 604,911 | |
| | | | | | | | |
| | |
TOTAL SHORT-TERM INVESTMENTS
(Cost $7,191,717) | | | | | | | 7,191,707 | |
| | | | | | | | |
| | |
TOTAL INVESTMENTS — 100.1%
(Cost $242,123,603) (d) | | | | | | | 444,426,261 | |
| | |
| Other Assets/(Liabilities) — (0.1)% | | | | | | | (237,148 | ) |
| | | | | | | | |
| | |
| NET ASSETS — 100.0% | | | | | | $ | 444,189,113 | |
| | | | | | | | |
Notes to Portfolio of Investments
Percentages are stated as a percent of net assets.
| (a) | Non-income producing security. |
| (b) | Maturity value of $6,242,703. Collateralized by U.S. Government Agency obligations with a rate of 3.500%, maturity date of 1/01/32, and an aggregate market value, including accrued interest, of $6,369,483. |
| (c) | A portion of this security is held as collateral for open futures contracts. (Note 2). |
| (d) | See Note 6 for aggregate cost for federal tax purposes. |
The accompanying notes are an integral part of the financial statements.
75
MML Focused Equity Fund – Portfolio of Investments
December 31, 2014
| | | | | | | | |
| | | Number of
Shares | | | Value | |
| EQUITIES — 91.1% | | | | | | | | |
| | |
| COMMON STOCK — 91.1% | | | | | | | | |
| Basic Materials — 4.7% | | | | | | | | |
| Mining — 4.7% | | | | | | | | |
Glencore PLC ADR (United Kingdom) | | | 852,000 | | | $ | 7,863,960 | |
| | | | | | | | |
| Communications — 4.4% | | | | | | | | |
| Internet — 4.4% | | | | | | | | |
Amazon.com, Inc. (a) | | | 23,700 | | | | 7,355,295 | |
| | | | | | | | |
| Consumer, Cyclical — 22.9% | | | | | | | | |
| Apparel — 5.0% | | | | | | | | |
Ralph Lauren Corp. | | | 45,500 | | | | 8,424,780 | |
| | | | | | | | |
| Auto Manufacturers — 6.1% | | | | | | | | |
General Motors Co. | | | 291,000 | | | | 10,158,810 | |
| | | | | | | | |
| Entertainment — 0.2% | | | | | | | | |
Penn National Gaming, Inc. (a) | | | 25,500 | | | | 350,115 | |
| | | | | | | | |
| Lodging — 2.6% | | | | | | | | |
Starwood Hotels & Resorts Worldwide, Inc. | | | 54,000 | | | | 4,377,780 | |
| | | | | | | | |
| Retail — 9.0% | | | | | | | | |
CarMax, Inc. (a) | | | 73,000 | | | | 4,860,340 | |
Family Dollar Stores, Inc. | | | 48,500 | | | | 3,841,685 | |
Tiffany & Co. | | | 59,000 | | | | 6,304,740 | |
| | | | | | | | |
| | | | | | | 15,006,765 | |
| | | | | | | | |
| | | | | | | 38,318,250 | |
| | | | | | | | |
| Consumer, Non-cyclical — 4.0% | | | | | | | | |
| Commercial Services — 4.0% | | | | | | | | |
Visa, Inc. Class A | | | 26,000 | | | | 6,817,200 | |
| | | | | | | | |
| Energy — 3.7% | | | | | | | | |
| Oil & Gas Services — 3.7% | | | | | | | | |
National Oilwell Varco, Inc. | | | 94,000 | | | | 6,159,820 | |
| | | | | | | | |
| | |
| Financial — 34.7% | | | | | | | | |
| Banks — 6.6% | | | | | | | | |
Wells Fargo & Co. | | | 201,000 | | | | 11,018,820 | |
| | | | | | | | |
| Diversified Financial — 14.1% | | | | | | | | |
BlackRock, Inc. | | | 21,000 | | | | 7,508,760 | |
Franklin Resources, Inc. | | | 142,000 | | | | 7,862,540 | |
JP Morgan Chase & Co. | | | 131,000 | | | | 8,197,980 | |
| | | | | | | | |
| | | | | | | 23,569,280 | |
| | | | | | | | |
| Insurance — 10.1% | |
American International Group, Inc. | | | 168,000 | | | | 9,409,680 | |
Aon PLC | | | 79,500 | | | | 7,538,985 | |
| | | | | | | | |
| | | | | | | 16,948,665 | |
| | | | | | | | |
| Real Estate — 3.9% | |
CBRE Group, Inc. (a) | | | 192,000 | | | | 6,576,000 | |
| | | | | | | | |
| | | | | | | 58,112,765 | |
| | | | | | | | |
| | | | | | | | |
| | | Number of
Shares | | | Value | |
| Technology — 16.7% | |
| Computers — 6.2% | |
Apple, Inc. | | | 94,500 | | | $ | 10,430,910 | |
| | | | | | | | |
| Semiconductors — 10.5% | |
Applied Materials, Inc. | | | 237,500 | | | | 5,918,500 | |
Intel Corp. | | | 322,000 | | | | 11,685,380 | |
| | | | | | | | |
| | | | | | | 17,603,880 | |
| | | | | | | | |
| | | | | | | 28,034,790 | |
| | | | | | | | |
| | |
TOTAL COMMON STOCK
(Cost $109,594,456) | | | | | | | 152,662,080 | |
| | | | | | | | |
| | |
TOTAL EQUITIES
(Cost $109,594,456) | | | | | | | 152,662,080 | |
| | | | | | | | |
| | |
TOTAL LONG-TERM INVESTMENTS
(Cost $109,594,456) | | | | | | | 152,662,080 | |
| | | | | | | | |
| | |
| | | Principal
Amount | | | | |
| SHORT-TERM INVESTMENTS — 8.9% | |
| Repurchase Agreement — 8.9% | | | | | |
State Street Bank & Trust Co. Repurchase Agreement, dated 12/31/14, 0.010%, due 1/02/15 (b) | | $ | 14,833,373 | | | | 14,833,373 | |
| | | | | | | | |
| | |
TOTAL SHORT-TERM INVESTMENTS
(Cost $14,833,373) | | | | | | | 14,833,373 | |
| | | | | | | | |
| | |
TOTAL INVESTMENTS — 100.0%
(Cost $124,427,829) (c) | | | | | | | 167,495,453 | |
| | |
| Other Assets/(Liabilities) — (0.0)% | | | | | | | (657 | ) |
| | | | | | | | |
| | |
| NET ASSETS — 100.0% | | | | | | $ | 167,494,796 | |
| | | | | | | | |
Notes to Portfolio of Investments
Percentages are stated as a percent of net assets.
| ADR | American Depositary Receipt |
| (a) | Non-income producing security. |
| (b) | Maturity value of $14,833,381. Collateralized by U.S. Government Agency obligations with a rate of 2.500%, maturity date of 4/01/28, and an aggregate market value, including accrued interest, of $15,132,287. |
| (c) | See Note 6 for aggregate cost for federal tax purposes. |
Country weightings, as a percentage of net assets, is as follows:
| | | | |
United States | | | 81.9 | % |
United Kingdom | | | 9.2 | % |
| | | | |
Total Long-Term Investments | | | 91.1 | % |
Short-Term Investments and Other Assets and Liabilities | | | 8.9 | % |
| | | | |
Net Assets | | | 100.0 | % |
| | | | |
The accompanying notes are an integral part of the financial statements.
76
MML Foreign Fund – Portfolio of Investments
December 31, 2014
| | | | | | | | |
| | | Number of
Shares | | | Value | |
| EQUITIES — 92.2% | |
|
| COMMON STOCK — 92.2% | |
| Basic Materials — 3.5% | |
| Chemicals — 1.7% | |
Akzo Nobel NV | | | 85,140 | | | $ | 5,904,005 | |
| | | | | | | | |
| Iron & Steel — 1.2% | |
POSCO ADR (Republic of Korea) | | | 62,311 | | | | 3,976,065 | |
| | | | | | | | |
| Mining — 0.6% | |
Mining and Metallurgical Company Norilsk Nickel OJSC ADR (Russia) | | | 145,469 | | | | 2,057,902 | |
| | | | | | | | |
| | | | | | | 11,937,972 | |
| | | | | | | | |
| Communications — 10.5% | |
| Internet — 0.5% | |
Trend Micro, Inc. (a) (b) | | | 57,300 | | | | 1,567,719 | |
| | | | | | | | |
| Media — 1.7% | |
Sky PLC | | | 236,950 | | | | 3,297,923 | |
Vivendi SA | | | 102,472 | | | | 2,556,180 | |
| | | | | | | | |
| | | | | | | 5,854,103 | |
| | | | | | | | |
| Telecommunications — 8.3% | | | | | | | | |
China Mobile Ltd. | | | 278,500 | | | | 3,278,945 | |
China Telecom Corp. Ltd. Class H | | | 9,487,643 | | | | 5,526,445 | |
Singapore Telecommunications Ltd. | | | 1,468,000 | | | | 4,309,120 | |
Singapore Telecommunications Ltd. | | | 9,000 | | | | 26,399 | |
Telefonaktiebolaget LM Ericsson Sponsored ADR (Sweden) | | | 133,854 | | | | 1,619,633 | |
Telefonica SA Sponsored ADR (Spain) (a) | | | 342,946 | | | | 4,873,263 | |
Telenor ASA | | | 219,076 | | | | 4,417,309 | |
Vodafone Group PLC Sponsored ADR (United Kingdom) | | | 117,731 | | | | 4,022,868 | |
| | | | | | | | |
| | | | | | | 28,073,982 | |
| | | | | | | | |
| | | | | | | 35,495,804 | |
| | | | | | | | |
| Consumer, Cyclical — 10.7% | | | | | | | | |
| Airlines — 1.3% | | | | | | | | |
Deutsche Lufthansa AG | | | 109,680 | | | | 1,836,786 | |
Qantas Airways Ltd. (b) | | | 1,338,026 | | | | 2,594,437 | |
| | | | | | | | |
| | | | | | | 4,431,223 | |
| | | | | | | | |
| Auto Manufacturers — 3.2% | | | | | | | | |
Nissan Motor Co. Ltd. | | | 484,670 | | | | 4,221,593 | |
Toyota Motor Corp. Sponsored ADR (Japan) (a) | | | 52,174 | | | | 6,546,794 | |
| | | | | | | | |
| | | | | | | 10,768,387 | |
| | | | | | | | |
| Automotive & Parts — 2.6% | |
Cie Generale des Etablissements Michelin Class B | | | 57,150 | | | | 5,181,357 | |
Hyundai Mobis | | | 8,167 | | | | 1,738,234 | |
| | | | | | | | |
| | | Number of
Shares | | | Value | |
Weichai Power Co. Ltd. Class H | | | 445,000 | | | $ | 1,861,977 | |
| | | | | | | | |
| | | | | | | 8,781,568 | |
| | | | | | | | |
| Distribution & Wholesale — 0.7% | |
ITOCHU Corp. (a) | | | 226,800 | | | | 2,424,869 | |
| | | | | | | | |
| Retail — 2.9% | |
Kingfisher PLC | | | 849,174 | | | | 4,474,816 | |
Marks & Spencer Group PLC | | | 713,110 | | | | 5,265,066 | |
| | | | | | | | |
| | | | | | | 9,739,882 | |
| | | | | | | | |
| | | | | | | 36,145,929 | |
| | | | | | | | |
| Consumer, Non-cyclical — 17.0% | |
| Beverages — 1.0% | |
Suntory Beverage & Food Ltd. | | | 92,300 | | | | 3,186,915 | |
| | | | | | | | |
| Foods — 2.0% | |
Metro AG (b) | | | 83,660 | | | | 2,561,370 | |
Tesco PLC | | | 921,960 | | | | 2,682,833 | |
Unilever PLC | | | 40,607 | | | | 1,649,487 | |
| | | | | | | | |
| | | | | | | 6,893,690 | |
| | | | | | | | |
| Health Care – Products — 1.1% | |
Getinge AB Class B | | | 104,690 | | | | 2,377,913 | |
QIAGEN NV (b) | | | 56,400 | | | | 1,320,783 | |
| | | | | | | | |
| | | | | | | 3,698,696 | |
| | | | | | | | |
| Pharmaceuticals — 12.9% | |
Bayer AG | | | 46,460 | | | | 6,351,519 | |
GlaxoSmithKline PLC | | | 262,834 | | | | 5,623,347 | |
Merck KGaA | | | 52,820 | | | | 5,010,799 | |
Novartis AG | | | 53,730 | | | | 4,941,413 | |
Roche Holding AG | | | 27,490 | | | | 7,450,902 | |
Sanofi | | | 96,808 | | | | 8,822,687 | |
Teva Pharmaceutical Industries Ltd. Sponsored ADR (Israel) | | | 96,515 | | | | 5,550,578 | |
| | | | | | | | |
| | | | | | | 43,751,245 | |
| | | | | | | | |
| | | | | | | 57,530,546 | |
| | | | | | | | |
| Diversified — 1.8% | |
| Holding Company – Diversified — 1.8% | |
Hutchison Whampoa Ltd. | | | 214,291 | | | | 2,456,082 | |
Noble Group Ltd. | | | 4,245,000 | | | | 3,644,278 | |
| | | | | | | | |
| | | | | | | 6,100,360 | |
| | | | | | | | |
| Energy — 9.2% | |
| Coal — 0.5% | |
China Shenhua Energy Co. Ltd. Class H | | | 589,000 | | | | 1,730,806 | |
| | | | | | | | |
| Oil & Gas — 7.5% | |
BP PLC | | | 447,764 | | | | 2,843,185 | |
ENI SpA | | | 226,188 | | | | 3,950,421 | |
Galp Energia SGPS SA | | | 228,470 | | | | 2,311,417 | |
Kunlun Energy Co. Ltd | | | 1,582,000 | | | | 1,504,166 | |
The accompanying notes are an integral part of the financial statements.
77
MML Foreign Fund – Portfolio of Investments (Continued)
| | | | | | | | |
| | | Number of
Shares | | | Value | |
Petroleo Brasileiro SA Sponsored ADR (Brazil) | | | 149,705 | | | $ | 1,134,764 | |
Repsol YPF SA (a) | | | 66,292 | | | | 1,232,246 | |
Royal Dutch Shell PLC Class A | | | 2,327 | | | | 77,132 | |
Royal Dutch Shell PLC Class B | | | 115,344 | | | | 3,962,520 | |
StatoilHydro ASA | | | 90,840 | | | | 1,591,920 | |
Talisman Energy, Inc. | | | 329,600 | | | | 2,581,649 | |
Total SA | | | 81,812 | | | | 4,218,163 | |
| | | | | | | | |
| | | | | | | 25,407,583 | |
| | | | | | | | |
| Oil & Gas Services — 1.2% | |
Petrofac Ltd. | | | 145,480 | | | | 1,577,826 | |
SBM Offshore NV (a) (b) | | | 113,458 | | | | 1,345,456 | |
Technip SA | | | 21,630 | | | | 1,291,607 | |
| | | | | | | | |
| | | | | | | 4,214,889 | |
| | | | | | | | |
| | | | | | | 31,353,278 | |
| | | | | | | | |
| Financial — 24.2% | |
| Banks — 11.6% | |
Barclays PLC | | | 718,340 | | | | 2,700,601 | |
BNP Paribas | | | 104,870 | | | | 6,162,611 | |
Credit Agricole SA | | | 182,370 | | | | 2,344,493 | |
DBS Group Holdings, Ltd. | | | 336,479 | | | | 5,196,055 | |
HSBC Holdings PLC | | | 638,400 | | | | 6,069,491 | |
ICICI Bank Ltd. Sponsored ADR (India) | | | 295,980 | | | | 3,418,569 | |
Intesa Sanpaolo SpA | | | 616,558 | | | | 1,783,604 | |
KB Financial Group, Inc. Sponsored ADR (Republic of Korea) (b) | | | 77,128 | | | | 2,515,915 | |
Lloyds Banking Group PLC (b) | | | 3,388,610 | | | | 4,001,495 | |
Standard Chartered PLC | | | 115,880 | | | | 1,737,853 | |
UniCredit SpA | | | 529,182 | | | | 3,372,746 | |
| | | | | | | | |
| | | | | | | 39,303,433 | |
| | | | | | | | |
| Diversified Financial — 3.0% | |
Credit Suisse Group | | | 187,101 | | | | 4,690,402 | |
Deutsche Boerse AG | | | 48,890 | | | | 3,503,655 | |
Hana Financial Group, Inc. | | | 64,829 | | | | 1,872,809 | |
| | | | | | | | |
| | | | | | | 10,066,866 | |
| | | | | | | | |
| Insurance — 8.9% | |
AIA Group Ltd. | | | 485,200 | | | | 2,662,447 | |
Aviva PLC | | | 640,135 | | | | 4,796,640 | |
AXA SA | | | 218,877 | | | | 5,055,300 | |
China Life Insurance Co. Ltd. | | | 1,170,000 | | | | 4,566,862 | |
ING Groep NV (b) | | | 379,570 | | | | 4,914,525 | |
Muenchener Rueckversicherungs AG | | | 13,330 | | | | 2,670,556 | |
NN Group NV (b) | | | 60,400 | | | | 1,799,770 | |
Swiss Re AG | | | 43,490 | | | | 3,638,952 | |
| | | | | | | | |
| | | | | | | 30,105,052 | |
| | | | | | | | |
| Real Estate — 0.7% | |
Cheung Kong Holdings | | | 155,215 | | | | 2,593,926 | |
| | | | | | | | |
| | | | | | | 82,069,277 | |
| | | | | | | | |
| | | | | | | | |
| | | Number of
Shares | | | Value | |
| Industrial — 11.1% | |
| Aerospace & Defense — 1.8% | |
BAE Systems PLC | | | 478,060 | | | $ | 3,489,853 | |
Embraer SA Sponsored ADR (Brazil) | | | 69,148 | | | | 2,548,795 | |
| | | | | | | | |
| | | | | | | 6,038,648 | |
| | | | | | | | |
| Building Materials — 3.5% | |
Compagnie de Saint-Gobain | | | 79,190 | | | | 3,333,842 | |
CRH PLC | | | 175,942 | | | | 4,233,039 | |
HeidelbergCement AG | | | 59,410 | | | | 4,226,326 | |
| | | | | | | | |
| | | | | | | 11,793,207 | |
| | | | | | | | |
| Electronics — 0.7% | |
Koninklijke Philips Electronics NV | | | 81,700 | | | | 2,372,172 | |
| | | | | | | | |
| Manufacturing — 2.4% | |
Konica Minolta Holdings, Inc. | | | 198,300 | | | | 2,138,977 | |
Nikon Corp. (a) | | | 149,600 | | | | 1,986,392 | |
Siemens AG | | | 35,836 | | | | 4,064,168 | |
| | | | | | | | |
| | | | | | | 8,189,537 | |
| | | | | | | | |
| Packaging & Containers — 0.7% | |
Rexam PLC | | | 328,794 | | | | 2,311,519 | |
| | | | | | | | |
| Transportation — 2.0% | |
China South Locomotive and Rolling Stock Corp. Ltd. Class H | | | 1,616,100 | | | | 2,175,738 | |
Deutsche Post AG | | | 54,651 | | | | 1,788,106 | |
TNT Express NV | | | 461,170 | | | | 3,063,946 | |
| | | | | | | | |
| | | | | | | 7,027,790 | |
| | | | | | | | |
| | | | | | | 37,732,873 | |
| | | | | | | | |
| Technology — 4.2% | |
| Semiconductors — 3.8% | |
Infineon Technologies AG | | | 294,047 | | | | 3,152,491 | |
Samsung Electronics Co., Ltd. | | | 6,211 | | | | 7,465,945 | |
Taiwan Semiconductor Manufacturing Co. Ltd. | | | 516,275 | | | | 2,278,183 | |
| | | | | | | | |
| | | | | | | 12,896,619 | |
| | | | | | | | |
| Software — 0.4% | |
SAP AG Sponsored ADR (Germany) (a) | | | 18,239 | | | | 1,270,346 | |
Software AG (a) | | | 8,423 | | | | 205,802 | |
| | | | | | | | |
| | | | | | | 1,476,148 | |
| | | | | | | | |
| | | | | | | 14,372,767 | |
| | | | | | | | |
| | |
TOTAL COMMON STOCK
(Cost $287,795,058) | | | | | | | 312,738,806 | |
| | | | | | | | |
| | |
TOTAL EQUITIES
(Cost $287,795,058) | | | | | | | 312,738,806 | |
| | | | | | | | |
The accompanying notes are an integral part of the financial statements.
78
MML Foreign Fund – Portfolio of Investments (Continued)
| | | | | | | | |
| | | Number of
Shares | | | Value | |
| RIGHTS — 0.0% | |
| Energy — 0.0% | |
| Oil & Gas — 0.0% | |
Repsol SA, Expires 1/08/15 (a) (b) | | | 66,292 | | | $ | 36,659 | |
| | | | | | | | |
| | |
TOTAL RIGHTS
(Cost $38,259) | | | | | | | 36,659 | |
| | | | | | | | |
|
| MUTUAL FUNDS — 4.4% | |
| Diversified Financial — 4.4% | |
State Street Navigator Securities Lending Prime Portfolio (c) | | | 15,029,374 | | | | 15,029,374 | |
| | | | | | | | |
| | |
TOTAL MUTUAL FUNDS
(Cost $15,029,374) | | | | | | | 15,029,374 | |
| | | | | | | | |
| | |
TOTAL LONG-TERM INVESTMENTS
(Cost $302,862,691) | | | | | | | 327,804,839 | |
| | | | | | | | |
| | |
| | | Principal
Amount | | | | |
| SHORT-TERM INVESTMENTS — 3.7% | |
| Repurchase Agreement — 3.7% | |
State Street Bank & Trust Co. Repurchase Agreement, dated 12/31/14, 0.010%, due 1/02/15 (d) | | $ | 12,369,870 | | | | 12,369,870 | |
| | | | | | | | |
| Time Deposits — 0.0% | | | | | | | | |
Euro Time Deposit
0.010% 1/02/15 | | | 91,418 | | | | 91,418 | |
| | | | | | | | |
| | |
TOTAL SHORT-TERM INVESTMENTS
(Cost $12,461,288) | | | | | | | 12,461,288 | |
| | | | | | | | |
| | |
TOTAL INVESTMENTS — 100.3%
(Cost $315,323,979) (e) | | | | | | | 340,266,127 | |
| | |
| Other Assets/(Liabilities) — (0.3)% | | | | | | | (1,132,320 | ) |
| | | | | | | | |
| | |
| NET ASSETS — 100.0% | | | | | | $ | 339,133,807 | |
| | | | | | | | |
Notes to Portfolio of Investments
Percentages are stated as a percent of net assets.
| ADR | American Depositary Receipt |
| (a) | Denotes all or a portion of security on loan. The total value of securities on loan as of December 31, 2014, was $14,529,340 or 4.28% of net assets. Total securities on loan may not correspond with the amounts identified in the Portfolio of Investments because pending sales may be in the process of recall from the brokers. (Note 2). |
| (b) | Non-income producing security. |
| (c) | Represents investment of security lending collateral. (Note 2). |
| (d) | Maturity value of $12,369,877. Collateralized by U.S. Government Agency obligations with a rate of 2.500%, maturity date of 4/01/28, and an aggregate market value, including accrued interest, of $12,617,331. |
| (e) | See Note 6 for aggregate cost for federal tax purposes. |
Country weightings, as a percentage of net assets, is as follows:
| | | | |
United Kingdom | | | 17.4 | % |
France | | | 11.5 | % |
Germany | | | 10.8 | % |
Japan | | | 6.5 | % |
Switzerland | | | 6.1 | % |
Netherlands | | | 6.1 | % |
Republic of Korea | | | 5.2 | % |
China | | | 4.7 | % |
United States | | | 4.4 | % |
Hong Kong | | | 3.1 | % |
Singapore | | | 2.8 | % |
Italy | | | 2.7 | % |
Spain | | | 1.8 | % |
Norway | | | 1.8 | % |
Israel | | | 1.6 | % |
Bermuda | | | 1.5 | % |
Ireland | | | 1.2 | % |
Sweden | | | 1.2 | % |
Brazil | | | 1.1 | % |
India | | | 1.0 | % |
Australia | | | 0.8 | % |
Canada | | | 0.8 | % |
Portugal | | | 0.7 | % |
Taiwan | | | 0.7 | % |
Russia | | | 0.6 | % |
Channel Islands | | | 0.5 | % |
| | | | |
Total Long-Term Investments | | | 96.6 | % |
Short-Term Investments and Other Assets and Liabilities | | | 3.4 | % |
| | | | |
Net Assets | | | 100.0 | % |
| | | | |
The accompanying notes are an integral part of the financial statements.
79
MML Fundamental Growth Fund – Portfolio of Investments
December 31, 2014
| | | | | | | | |
| | | Number of
Shares | | | Value | |
| EQUITIES — 99.8% | | | | | | | | |
| |
| COMMON STOCK — 99.8% | | | | | |
| Basic Materials — 1.1% | | | | | |
| Chemicals — 1.1% | | | | | |
The Sherwin-Williams Co. | | | 9,000 | | | $ | 2,367,360 | |
| | | | | | | | |
| Communications — 19.0% | |
| Internet — 9.0% | |
Alibaba Group Holding Ltd. Sponsored ADR (Cayman Islands) (a) | | | 15,099 | | | | 1,569,390 | |
Expedia, Inc. | | | 12,809 | | | | 1,093,376 | |
F5 Networks, Inc. (a) | | | 23,717 | | | | 3,094,239 | |
Facebook, Inc. Class A (a) | | | 51,300 | | | | 4,002,426 | |
Google, Inc. Class A (a) | | | 1,414 | | | | 750,353 | |
Google, Inc. Class C (a) | | | 9,731 | | | | 5,122,399 | |
IAC/InterActiveCorp | | | 7,080 | | | | 430,393 | |
The Priceline Group, Inc. (a) | | | 1,573 | | | | 1,793,550 | |
Yahoo!, Inc. (a) | | | 20,875 | | | | 1,054,396 | |
| | | | | | | | |
| | | | | | | 18,910,522 | |
| | | | | | | | |
| Media — 3.1% | | | | | | | | |
Comcast Corp. Class A | | | 55,966 | | | | 3,246,588 | |
DIRECTV (a) | | | 16,338 | | | | 1,416,505 | |
Discovery Communications, Inc. Series A (a) | | | 15,657 | | | | 539,384 | |
Discovery Communications, Inc. Series C (a) | | | 6,017 | | | | 202,893 | |
Scripps Networks Interactive Class A | | | 13,053 | | | | 982,499 | |
| | | | | | | | |
| | | | | | | 6,387,869 | |
| | | | | | | | |
| Telecommunications — 6.9% | | | | | | | | |
Cisco Systems, Inc. | | | 156,493 | | | | 4,352,853 | |
QUALCOMM, Inc. | | | 60,979 | | | | 4,532,569 | |
Verizon Communications, Inc. | | | 120,668 | | | | 5,644,849 | |
| | | | | | | | |
| | | | | | | 14,530,271 | |
| | | | | | | | |
| | | | | | | 39,828,662 | |
| | | | | | | | |
| Consumer, Cyclical — 10.9% | |
| Home Builders — 0.8% | |
PulteGroup, Inc. | | | 79,277 | | | | 1,701,284 | |
| | | | | | | | |
| Lodging — 1.4% | |
Wyndham Worldwide Corp. | | | 25,026 | | | | 2,146,230 | |
Wynn Resorts Ltd. | | | 5,695 | | | | 847,188 | |
| | | | | | | | |
| | | | | | | 2,993,418 | |
| | | | | | | | |
| Retail — 8.7% | |
Advance Auto Parts, Inc. | | | 5,270 | | | | 839,406 | |
Chipotle Mexican Grill, Inc. (a) | | | 1,280 | | | | 876,173 | |
Costco Wholesale Corp. | | | 14,373 | | | | 2,037,373 | |
CVS Health Corp. | | | 28,948 | | | | 2,787,982 | |
The Home Depot, Inc. | | | 45,935 | | | | 4,821,797 | |
Lowe’s Cos., Inc. | | | 33,977 | | | | 2,337,617 | |
O’Reilly Automotive, Inc. (a) | | | 12,554 | | | | 2,418,151 | |
| | | | | | | | |
| | | Number of
Shares | | | Value | |
The TJX Cos., Inc. | | | 29,484 | | | $ | 2,022,013 | |
| | | | | | | | |
| | | | | | | 18,140,512 | |
| | | | | | | | |
| | | | | | | 22,835,214 | |
| | | | | | | | |
| Consumer, Non-cyclical — 25.3% | |
| Agriculture — 0.9% | |
Philip Morris International, Inc. | | | 23,552 | | | | 1,918,310 | |
| | | | | | | | |
| Beverages — 2.0% | |
Anheuser-Busch InBev NV Sponsored ADR (Belgium) | | | 19,152 | | | | 2,151,153 | |
Keurig Green Mountain, Inc. | | | 4,282 | | | | 566,915 | |
Monster Beverage Corp. (a) | | | 13,075 | | | | 1,416,676 | |
| | | | | | | | |
| | | | | | | 4,134,744 | |
| | | | | | | | |
| Biotechnology — 5.1% | |
Amgen, Inc. | | | 23,053 | | | | 3,672,112 | |
Biogen Idec, Inc. (a) | | | 4,666 | | | | 1,583,874 | |
Celgene Corp. (a) | | | 28,118 | | | | 3,145,279 | |
Vertex Pharmaceuticals, Inc. (a) | | | 19,916 | | | | 2,366,021 | |
| | | | | | | | |
| | | | | | | 10,767,286 | |
| | | | | | | | |
| Commercial Services — 2.8% | |
Alliance Data Systems Corp. (a) | | | 3,602 | | | | 1,030,352 | |
Paychex, Inc. | | | 34,550 | | | | 1,595,173 | |
Visa, Inc. Class A | | | 12,253 | | | | 3,212,737 | |
| | | | | | | | |
| | | | | | | 5,838,262 | |
| | | | | | | | |
| Foods — 1.0% | |
Mondelez International, Inc. Class A | | | 54,546 | | | | 1,981,384 | |
| | | | | | | | |
| Health Care – Products — 5.4% | |
Becton, Dickinson & Co. | | | 12,828 | | | | 1,785,145 | |
C.R. Bard, Inc. | | | 14,158 | | | | 2,359,006 | |
Johnson & Johnson | | | 25,678 | | | | 2,685,149 | |
Medtronic, Inc. | | | 35,842 | | | | 2,587,792 | |
Zimmer Holdings, Inc. | | | 16,065 | | | | 1,822,092 | |
| | | | | | | | |
| | | | | | | 11,239,184 | |
| | | | | | | | |
| Health Care – Services — 1.7% | |
Aetna, Inc. | | | 30,551 | | | | 2,713,845 | |
HCA Holdings, Inc. (a) | | | 12,469 | | | | 915,100 | |
| | | | | | | | |
| | | | | | | 3,628,945 | |
| | | | | | | | |
| Pharmaceuticals — 6.4% | |
AstraZeneca PLC Sponsored ADR (United Kingdom) | | | 17,504 | | | | 1,231,932 | |
Bristol-Myers Squibb Co. | | | 33,897 | | | | 2,000,940 | |
Eli Lilly & Co. | | | 44,674 | | | | 3,082,059 | |
Gilead Sciences, Inc. (a) | | | 44,494 | | | | 4,194,005 | |
Merck & Co., Inc. | | | 41,132 | | | | 2,335,886 | |
Salix Pharmaceuticals Ltd. (a) | | | 4,276 | | | | 491,483 | |
| | | | | | | | |
| | | | | | | 13,336,305 | |
| | | | | | | | |
| | | | | | | 52,844,420 | |
| | | | | | | | |
The accompanying notes are an integral part of the financial statements.
80
MML Fundamental Growth Fund – Portfolio of Investments (Continued)
| | | | | | | | |
| | | Number of
Shares | | | Value | |
| Energy — 2.6% | | | | | | | | |
| Oil & Gas — 1.6% | | | | | | | | |
Apache Corp. | | | 12,035 | | | $ | 754,233 | |
Cabot Oil & Gas Corp. | | | 38,198 | | | | 1,131,043 | |
Devon Energy Corp. | | | 22,471 | | | | 1,375,450 | |
| | | | | | | | |
| | | | | | | 3,260,726 | |
| | | | | | | | |
| Oil & Gas Services — 1.0% | | | | | | | | |
Baker Hughes, Inc. | | | 19,516 | | | | 1,094,262 | |
National Oilwell Varco, Inc. | | | 16,796 | | | | 1,100,642 | |
| | | | | | | | |
| | | | | | | 2,194,904 | |
| | | | | | | | |
| | | | | | | 5,455,630 | |
| | | | | | | | |
| Financial — 4.6% | | | | | | | | |
| Banks — 1.4% | | | | | | | | |
Bank of America Corp. | | | 115,671 | | | | 2,069,354 | |
Itau Unibanco Holding SA Sponsored ADR (Brazil) | | | 57,197 | | | | 744,133 | |
| | | | | | | | |
| | | | | | | 2,813,487 | |
| | | | | | | | |
| Diversified Financial — 2.7% | |
American Express Co. | | | 33,333 | | | | 3,101,302 | |
IntercontinentalExchange, Inc. | | | 5,018 | | | | 1,100,397 | |
JP Morgan Chase & Co. | | | 8,224 | | | | 514,658 | |
Waddell & Reed Financial, Inc. Class A | | | 20,078 | | | | 1,000,286 | |
| | | | | | | | |
| | | | | | | 5,716,643 | |
| | | | | | | | |
| Real Estate Investment Trusts (REITS) — 0.5% | | | | | |
Public Storage | | | 5,677 | | | | 1,049,394 | |
| | | | | | | | |
| | | | | | | 9,579,524 | |
| | | | | | | | |
| | |
| Industrial — 6.6% | | | | | | | | |
| Aerospace & Defense — 1.1% | | | | | | | | |
The Boeing Co. | | | 17,118 | | | | 2,224,998 | |
| | | | | | | | |
| Electronics — 0.3% | | | | | | | | |
Agilent Technologies, Inc. | | | 16,630 | | | | 680,832 | |
| | | | | | | | |
| Machinery – Diversified — 0.5% | | | | | | | | |
Rockwell Automation, Inc. | | | 9,821 | | | | 1,092,095 | |
| | | | | | | | |
| Manufacturing — 3.3% | | | | | | | | |
3M Co. | | | 7,410 | | | | 1,217,611 | |
Danaher Corp. | | | 20,682 | | | | 1,772,654 | |
Honeywell International, Inc. | | | 25,528 | | | | 2,550,758 | |
Illinois Tool Works, Inc. | | | 14,080 | | | | 1,333,376 | |
| | | | | | | | |
| | | | | | | 6,874,399 | |
| | | | | | | | |
| Transportation — 1.4% | | | | | | | | |
United Parcel Service, Inc. Class B | | | 26,301 | | | | 2,923,882 | |
| | | | | | | | |
| | | | | | | 13,796,206 | |
| | | | | | | | |
| Technology — 29.7% | |
| Computers — 10.6% | |
Apple, Inc. | | | 130,716 | | | | 14,428,432 | |
Brocade Communications Systems, Inc. | | | 62,435 | | | | 739,230 | |
NetApp, Inc. | | | 63,715 | | | | 2,640,987 | |
| | | | | | | | |
| | | Number of
Shares | | | Value | |
SanDisk Corp. | | | 22,569 | | | $ | 2,211,311 | |
Western Digital Corp. | | | 20,250 | | | | 2,241,675 | |
| | | | | | | | |
| | | | | | | 22,261,635 | |
| | | | | | | | |
| Internet — 1.1% | |
Check Point Software Technologies Ltd. (a) | | | 29,097 | | | | 2,286,151 | |
| | | | | | | | |
| Semiconductors — 7.6% | | | | | | | | |
Altera Corp. | | | 97,674 | | | | 3,608,078 | |
Broadcom Corp. Class A | | | 45,322 | | | | 1,963,802 | |
Intel Corp. | | | 39,426 | | | | 1,430,770 | |
KLA-Tencor Corp. | | | 16,616 | | | | 1,168,437 | |
Linear Technology Corp. | | | 30,255 | | | | 1,379,628 | |
Marvell Technology Group Ltd. | | | 35,928 | | | | 520,956 | |
Maxim Integrated Products, Inc. | | | 63,774 | | | | 2,032,477 | |
Microchip Technology, Inc. | | | 31,632 | | | | 1,426,920 | |
Skyworks Solutions, Inc. | | | 15,381 | | | | 1,118,352 | |
Xilinx, Inc. | | | 29,788 | | | | 1,289,523 | |
| | | | | | | | |
| | | | | | | 15,938,943 | |
| | | | | | | | |
| Software — 10.4% | | | | | | | | |
Activision Blizzard, Inc. | | | 58,497 | | | | 1,178,715 | |
Intuit, Inc. | | | 26,002 | | | | 2,397,124 | |
Microsoft Corp. | | | 218,480 | | | | 10,148,396 | |
Oracle Corp. | | | 178,062 | | | | 8,007,448 | |
| | | | | | | | |
| | | | | | | 21,731,683 | |
| | | | | | | | |
| | | | | | | 62,218,412 | |
| | | | | | | | |
| | |
TOTAL COMMON STOCK
(Cost $167,285,655) | | | | | | | 208,925,428 | |
| | | | | | | | |
| | |
TOTAL EQUITIES
(Cost $167,285,655) | | | | | | | 208,925,428 | |
| | | | | | | | |
| | |
TOTAL LONG-TERM INVESTMENTS
(Cost $167,285,655) | | | | | | | 208,925,428 | |
| | | | | | | | |
| | |
| | | Principal
Amount | | | | |
| SHORT-TERM INVESTMENTS — 0.2% | |
| Repurchase Agreement — 0.2% | | | | | |
State Street Bank & Trust Co. Repurchase Agreement, dated 12/31/14, 0.010%, due 1/02/15 (b) | | $ | 455,517 | | | | 455,517 | |
| | | | | | | | |
| | |
TOTAL SHORT-TERM INVESTMENTS
(Cost $455,517) | | | | | | | 455,517 | |
| | | | | | | | |
| | |
TOTAL INVESTMENTS — 100.0%
(Cost $167,741,172) (c) | | | | | | | 209,380,945 | |
| | |
| Other Assets/(Liabilities) — (0.0)% | | | | | | | (81,019 | ) |
| | | | | | | | |
| | |
| NET ASSETS — 100.0% | | | | | | $ | 209,299,926 | |
| | | | | | | | |
The accompanying notes are an integral part of the financial statements.
81
MML Fundamental Growth Fund – Portfolio of Investments (Continued)
Notes to Portfolio of Investments
Percentages are stated as a percent of net assets.
| ADR | American Depositary Receipt |
| (a) | Non-income producing security. |
| (b) | Maturity value of $455,518. Collateralized by U.S. Government Agency obligations with a rate of 2.500%, maturity date of 4/01/28, and an aggregate market value, including accrued interest, of $468,097. |
| (c) | See Note 6 for aggregate cost for federal tax purposes. |
The accompanying notes are an integral part of the financial statements.
82
MML Fundamental Value Fund – Portfolio of Investments
December 31, 2014
| | | | | | | | |
| | | Number of
Shares | | | Value | |
| EQUITIES — 97.9% | |
|
| COMMON STOCK — 97.9% | |
| Basic Materials — 4.6% | |
| Chemicals — 2.4% | |
Axalta Coating Systems Ltd. (a) | | | 55,400 | | | $ | 1,441,508 | |
The Dow Chemical Co. | | | 54,950 | | | | 2,506,270 | |
E.I. du Pont de Nemours & Co. | | | 20,130 | | | | 1,488,412 | |
| | | | | | | | |
| | | | | | | 5,436,190 | |
| | | | | | | | |
| Forest Products & Paper — 1.0% | |
International Paper Co. | | | 39,600 | | | | 2,121,768 | |
| | | | | | | | |
| Iron & Steel — 1.2% | | | | | | | | |
Nucor Corp. | | | 23,020 | | | | 1,129,131 | |
Steel Dynamics, Inc. | | | 81,250 | | | | 1,603,875 | |
| | | | | | | | |
| | | | | | | 2,733,006 | |
| | | | | | | | |
| | | | | | | 10,290,964 | |
| | | | | | | | |
| Communications — 9.8% | |
| Advertising — 0.8% | |
The Interpublic Group of Companies, Inc. | | | 84,200 | | | | 1,748,834 | |
| | | | | | | | |
| Internet — 1.3% | |
Symantec Corp. | | | 118,490 | | | | 3,039,861 | |
| | | | | | | | |
| Media — 3.3% | |
CBS Corp. Class B | | | 39,530 | | | | 2,187,590 | |
Comcast Corp. Class A | | | 53,640 | | | | 3,111,656 | |
Thomson Reuters Corp. | | | 53,500 | | | | 2,158,190 | |
| | | | | | | | |
| | | | | | | 7,457,436 | |
| | | | | | | | |
| Telecommunications — 4.4% | |
Cisco Systems, Inc. | | | 237,530 | | | | 6,606,897 | |
Verizon Communications, Inc. | | | 70,100 | | | | 3,279,278 | |
| | | | | | | | |
| | | | | | | 9,886,175 | |
| | | | | | | | |
| | | | | | | 22,132,306 | |
| | | | | | | | |
| Consumer, Cyclical — 9.3% | |
| Home Builders — 1.0% | |
PulteGroup, Inc. | | | 103,500 | | | | 2,221,110 | |
| | | | | | | | |
| Housewares — 1.1% | |
Newell Rubbermaid, Inc. | | | 64,100 | | | | 2,441,569 | |
| | | | | | | | |
| Leisure Time — 0.4% | |
Norwegian Cruise Line Holdings Ltd. (a) | | | 21,600 | | | | 1,010,016 | |
| | | | | | | | |
| Retail — 6.8% | |
AutoZone, Inc. (a) | | | 2,700 | | | | 1,671,597 | |
CVS Health Corp. | | | 33,320 | | | | 3,209,049 | |
The Home Depot, Inc. | | | 24,700 | | | | 2,592,759 | |
Lowe’s Cos., Inc. | | | 47,900 | | | | 3,295,520 | |
Nordstrom, Inc. | | | 25,070 | | | | 1,990,307 | |
PVH Corp. | | | 19,500 | | | | 2,499,315 | |
| | | | | | | | |
| | | | | | | 15,258,547 | |
| | | | | | | | |
| | | | | | | 20,931,242 | |
| | | | | | | | |
| | | | | | | | |
| | | Number of
Shares | | | Value | |
| Consumer, Non-cyclical — 16.3% | |
| Beverages — 2.0% | |
Anheuser-Busch InBev NV Sponsored ADR (Belgium) | | | 23,250 | | | $ | 2,611,440 | |
Diageo PLC Sponsored ADR (United Kingdom) | | | 17,000 | | | | 1,939,530 | |
| | | | | | | | |
| | | | | | | 4,550,970 | |
| | | | | | | | |
| Biotechnology — 1.2% | |
Amgen, Inc. | | | 17,430 | | | | 2,776,425 | |
| | | | | | | | |
| Foods — 1.1% | |
Kraft Foods Group, Inc. | | | 40,576 | | | | 2,542,492 | |
| | | | | | | | |
| Health Care – Products — 3.6% | |
Baxter International, Inc. | | | 27,960 | | | | 2,049,188 | |
Covidien PLC | | | 40,620 | | | | 4,154,614 | |
Johnson & Johnson | | | 17,430 | | | | 1,822,655 | |
| | | | | | | | |
| | | | | | | 8,026,457 | |
| | | | | | | | |
| Health Care – Services — 1.8% | |
UnitedHealth Group, Inc. | | | 40,110 | | | | 4,054,720 | |
| | | | | | | | |
| Pharmaceuticals — 6.6% | |
AstraZeneca PLC Sponsored ADR (United Kingdom) | | | 35,300 | | | | 2,484,414 | |
Bristol-Myers Squibb Co. | | | 18,920 | | | | 1,116,848 | |
Merck & Co., Inc. | | | 101,290 | | | | 5,752,259 | |
Pfizer, Inc. | | | 55,359 | | | | 1,724,433 | |
Roche Holding AG | | | 10,283 | | | | 2,787,109 | |
Zoetis, Inc. | | | 21,438 | | | | 922,477 | |
| | | | | | | | |
| | | | | | | 14,787,540 | |
| | | | | | | | |
| | | | | | | 36,738,604 | |
| | | | | | | | |
| Energy — 9.8% | |
| Oil & Gas — 8.9% | |
Anadarko Petroleum Corp. | | | 21,300 | | | | 1,757,250 | |
Chevron Corp. | | | 43,850 | | | | 4,919,093 | |
EOG Resources, Inc. | | | 26,820 | | | | 2,469,317 | |
Exxon Mobil Corp. | | | 40,500 | | | | 3,744,225 | |
Marathon Oil Corp. | | | 75,940 | | | | 2,148,343 | |
Occidental Petroleum Corp. | | | 21,970 | | | | 1,771,002 | |
Pioneer Natural Resources Co. | | | 9,200 | | | | 1,369,420 | |
Southwestern Energy Co. (a) | | | 70,250 | | | | 1,917,122 | |
| | | | | | | | |
| | | | | | | 20,095,772 | |
| | | | | | | | |
|
| Oil & Gas Services — 0.9% | |
Halliburton Co. | | | 52,700 | | | | 2,072,691 | |
| | | | | | | | |
| | | | | | | 22,168,463 | |
| | | | | | | | |
| Financial — 26.4% | |
| Banks — 7.6% | |
BB&T Corp. | | | 70,800 | | | | 2,753,412 | |
PNC Financial Services Group, Inc. | | | 58,790 | | | | 5,363,411 | |
Wells Fargo & Co. | | | 162,090 | | | | 8,885,774 | |
| | | | | | | | |
| | | | | | | 17,002,597 | |
| | | | | | | | |
The accompanying notes are an integral part of the financial statements.
83
MML Fundamental Value Fund – Portfolio of Investments (Continued)
| | | | | | | | |
| | | Number of
Shares | | | Value | |
| Diversified Financial — 10.8% | |
Ameriprise Financial, Inc. | | | 5,600 | | | $ | 740,600 | |
BlackRock, Inc. | | | 10,270 | | | | 3,672,141 | |
Citigroup, Inc. | | | 104,400 | | | | 5,649,084 | |
The Goldman Sachs Group, Inc. | | | 16,970 | | | | 3,289,295 | |
IntercontinentalExchange, Inc. | | | 12,900 | | | | 2,828,841 | |
JP Morgan Chase & Co. | | | 131,480 | | | | 8,228,019 | |
| | | | | | | | |
| | | | | | | 24,407,980 | |
| | | | | | | | |
| Insurance — 6.6% | |
ACE Ltd. | | | 35,940 | | | | 4,128,787 | |
American International Group, Inc. | | | 39,000 | | | | 2,184,390 | |
Marsh & McLennan Cos., Inc. | | | 53,590 | | | | 3,067,492 | |
MetLife, Inc. | | | 54,700 | | | | 2,958,723 | |
Principal Financial Group, Inc. | | | 33,740 | | | | 1,752,456 | |
Unum Group | | | 24,740 | | | | 862,931 | |
| | | | | | | | |
| | | | | | | 14,954,779 | |
| | | | | | | | |
| Real Estate Investment Trusts (REITS) — 1.4% | |
Host Hotels & Resorts, Inc. | | | 106,700 | | | | 2,536,259 | |
Paramount Group, Inc. (a) | | | 32,800 | | | | 609,752 | |
| | | | | | | | |
| | | | | | | 3,146,011 | |
| | | | | | | | |
| | | | | | | 59,511,367 | |
| | | | | | | | |
| Industrial — 10.0% | |
| Aerospace & Defense — 2.5% | |
Spirit AeroSystems Holdings, Inc. Class A (a) | | | 50,300 | | | | 2,164,912 | |
United Technologies Corp. | | | 31,300 | | | | 3,599,500 | |
| | | | | | | | |
| | | | | | | 5,764,412 | |
| | | | | | | | |
| Building Materials — 1.3% | |
Fortune Brands Home & Security, Inc. | | | 62,900 | | | | 2,847,483 | |
| | | | | | | | |
| Machinery – Construction & Mining — 0.9% | |
Ingersoll-Rand PLC | | | 31,970 | | | | 2,026,578 | |
| | | | | | | | |
| Manufacturing — 5.3% | |
3M Co. | | | 15,150 | | | | 2,489,448 | |
Eaton Corp. PLC | | | 47,600 | | | | 3,234,896 | |
General Electric Co. | | | 162,980 | | | | 4,118,505 | |
Illinois Tool Works, Inc. | | | 21,280 | | | | 2,015,216 | |
| | | | | | | | |
| | | | | | | 11,858,065 | |
| | | | | | | | |
| | | | | | | 22,496,538 | |
| | | | | | | | |
| Technology — 9.0% | | | | | | | | |
| Computers — 1.8% | | | | | | | | |
EMC Corp. | | | 139,800 | | | | 4,157,652 | |
| | | | | | | | |
| Semiconductors — 5.7% | | | | | | | | |
Analog Devices, Inc. | | | 39,240 | | | | 2,178,605 | |
Intel Corp. | | | 137,270 | | | | 4,981,528 | |
Marvell Technology Group Ltd. | | | 173,200 | | | | 2,511,400 | |
Maxim Integrated Products, Inc. | | | 98,850 | | | | 3,150,350 | |
| | | | | | | | |
| | | | | | | 12,821,883 | |
| | | | | | | | |
| | | | | | | | |
| | | Number of
Shares | | | Value | |
| Software — 1.5% | | | | | | | | |
Microsoft Corp. | | | 72,060 | | | $ | 3,347,187 | |
| | | | | | | | |
| | | | | | | 20,326,722 | |
| | | | | | | | |
| Utilities — 2.7% | | | | | | | | |
| Electric — 2.7% | | | | | | | | |
Edison International | | | 30,490 | | | | 1,996,485 | |
NextEra Energy, Inc. | | | 12,240 | | | | 1,300,990 | |
Northeast Utilities | | | 51,660 | | | | 2,764,843 | |
| | | | | | | | |
| | | | | | | 6,062,318 | |
| | | | | | | | |
| | |
TOTAL COMMON STOCK
(Cost $152,637,592) | | | | | | | 220,658,524 | |
| | | | | | | | |
| | |
TOTAL EQUITIES
(Cost $152,637,592) | | | | | | | 220,658,524 | |
| | | | | | | | |
| | |
TOTAL LONG-TERM
INVESTMENTS
(Cost $152,637,592) | | | | | | | 220,658,524 | |
| | | | | | | | |
| | |
| | | Principal
Amount | | | | |
| SHORT-TERM INVESTMENTS — 2.0% | |
| Repurchase Agreement — 2.0% | | | | | | | | |
State Street Bank & Trust Co. Repurchase Agreement, dated 12/31/14, 0.010%, due 1/02/15 (b) | | $ | 4,467,670 | | | | 4,467,670 | |
| | | | | | | | |
| Time Deposits — 0.0% | | | | | | | | |
Euro Time Deposit
0.010% 1/02/15 | | | 7,992 | | | | 7,992 | |
| | | | | | | | |
| | |
TOTAL SHORT-TERM INVESTMENTS
(Cost $4,475,662) | | | | | | | 4,475,662 | |
| | | | | | | | |
| | |
TOTAL INVESTMENTS — 99.9%
(Cost $157,113,254) (c) | | | | | | | 225,134,186 | |
| | |
| Other Assets/(Liabilities) — 0.1% | | | | | | | 155,596 | |
| | | | | | | | |
| | |
| NET ASSETS — 100.0% | | | | | | $ | 225,289,782 | |
| | | | | | | | |
Notes to Portfolio of Investments
Percentages are stated as a percent of net assets.
| ADR | American Depositary Receipt |
| (a) | Non-income producing security. |
| (b) | Maturity value of $4,467,672. Collateralized by U.S. Government Agency obligations with a rate of 2.500%, maturity date of 4/01/28, and an aggregate market value, including accrued interest, of $4,557,559. |
| (c) | See Note 6 for aggregate cost for federal tax purposes. |
The accompanying notes are an integral part of the financial statements.
84
MML Global Fund – Portfolio of Investments
December 31, 2014
| | | | | | | | |
| | | Number of
Shares | | | Value | |
| EQUITIES — 98.4% | | | | | | | | |
| | |
| COMMON STOCK — 98.4% | | | | | | | | |
| Basic Materials — 7.4% | | | | | | | | |
| Chemicals — 6.3% | | | | | | | | |
Air Liquide | | | 10,175 | | | $ | 1,255,479 | |
Akzo Nobel NV | | | 39,989 | | | | 2,773,024 | |
Brenntag AG | | | 18,084 | | | | 1,017,575 | |
International Flavors & Fragrances, Inc. | | | 17,106 | | | | 1,733,864 | |
Linde AG | | | 30,711 | | | | 5,728,209 | |
Praxair, Inc. | | | 18,991 | | | | 2,460,474 | |
| | | | | | | | |
| | | | | | | 14,968,625 | |
| | | | | | | | |
| Forest Products & Paper — 1.1% | | | | | | | | |
Svenska Cellulosa AB Class B | | | 123,737 | | | | 2,672,228 | |
| | | | | | | | |
| | | | | | | 17,640,853 | |
| | | | | | | | |
| Communications — 11.3% | | | | | | | | |
| Advertising — 2.4% | | | | | | | | |
Omnicom Group, Inc. | | | 31,069 | | | | 2,406,915 | |
WPP PLC | | | 157,354 | | | | 3,264,497 | |
| | | | | | | | |
| | | | | | | 5,671,412 | |
| | | | | | | | |
| Internet — 0.6% | | | | | | | | |
eBay, Inc. (a) | | | 25,669 | | | | 1,440,544 | |
| | | | | | | | |
| Media — 7.6% | | | | | | | | |
Sky PLC | | | 114,411 | | | | 1,592,398 | |
Time Warner Cable, Inc. | | | 13,037 | | | | 1,982,406 | |
Time Warner, Inc. | | | 71,986 | | | | 6,149,044 | |
Viacom, Inc. Class B | | | 10,445 | | | | 785,986 | |
The Walt Disney Co. | | | 80,199 | | | | 7,553,944 | |
| | | | | | | | |
| | | | | | | 18,063,778 | |
| | | | | | | | |
| Telecommunications — 0.7% | | | | | | | | |
Cisco Systems, Inc. | | | 59,408 | | | | 1,652,434 | |
| | | | | | | | |
| | | | | | | 26,828,168 | |
| | | | | | | | |
| Consumer, Cyclical — 8.8% | | | | | | | | |
| Apparel — 1.0% | | | | | | | | |
Burberry Group PLC | | | 58,109 | | | | 1,472,403 | |
Hermes International (b) | | | 1,207 | | | | 430,219 | |
Nike, Inc. Class B | | | 3,624 | | | | 348,448 | |
| | | | | | | | |
| | | | | | | 2,251,070 | |
| | | | | | | | |
| Automotive & Parts — 0.9% | | | | | | | | |
Delphi Automotive PLC | | | 29,457 | | | | 2,142,113 | |
| | | | | | | | |
| Entertainment — 0.3% | | | | | | | | |
William Hill PLC | | | 129,005 | | | | 725,470 | |
| | | | | | | | |
| Food Services — 1.2% | | | | | | | | |
Compass Group PLC | | | 168,810 | | | | 2,877,254 | |
| | | | | | | | |
| Leisure Time — 0.2% | | | | | | | | |
Harley-Davidson, Inc. | | | 7,191 | | | | 473,959 | |
| | | | | | | | |
| | | | | | | | |
| | | Number of
Shares | | | Value | |
| Lodging — 0.5% | | | | | | | | |
Sands China Ltd. | | | 93,200 | | | $ | 453,900 | |
Whitbread PLC | | | 4,627 | | | | 341,459 | |
Wynn Resorts Ltd. | | | 3,215 | | | | 478,263 | |
| | | | | | | | |
| | | | | | | 1,273,622 | |
| | | | | | | | |
| Retail — 4.7% | | | | | | | | |
AutoZone, Inc. (a) | | | 4,089 | | | | 2,531,541 | |
Cie Financiere Richemont SA | | | 28,102 | | | | 2,489,200 | |
Lawson, Inc. (b) | | | 7,900 | | | | 477,700 | |
McDonald’s Corp. | | | 26,331 | | | | 2,467,214 | |
Sally Beauty Holdings, Inc. (a) | | | 58,815 | | | | 1,807,973 | |
Urban Outfitters, Inc. (a) | | | 35,798 | | | | 1,257,584 | |
| | | | | | | | |
| | | | | | | 11,031,212 | |
| | | | | | | | |
| | | | | | | 20,774,700 | |
| | | | | | | | |
| Consumer, Non-cyclical — 30.4% | | | | | | | | |
| Beverages — 5.7% | | | | | | | | |
AMBEV SA | | | 214,831 | | | | 1,335,386 | |
Carlsberg A/S Class B | | | 19,261 | | | | 1,495,725 | |
Diageo PLC | | | 169,282 | | | | 4,855,202 | |
Heineken NV | | | 36,918 | | | | 2,622,628 | |
Pernod-Ricard SA | | | 28,540 | | | | 3,164,429 | |
| | | | | | | | |
| | | | | | | 13,473,370 | |
| | | | | | | | |
| Commercial Services — 3.1% | | | | | | | | |
Adecco SA | | | 28,913 | | | | 1,980,655 | |
Visa, Inc. Class A | | | 20,282 | | | | 5,317,940 | |
| | | | | | | | |
| | | | | | | 7,298,595 | |
| | | | | | | | |
| Cosmetics & Personal Care — 1.8% | | | | | |
Colgate-Palmolive Co. | | | 48,410 | | | | 3,349,488 | |
The Procter & Gamble Co. | | | 9,605 | | | | 874,919 | |
| | | | | | | | |
| | | | | | | 4,224,407 | |
| | | | | | | | |
| Foods — 5.1% | | | | | | | | |
Danone SA | | | 57,551 | | | | 3,786,078 | |
Kellogg Co. | | | 36,277 | | | | 2,373,967 | |
Nestle SA | | | 82,368 | | | | 6,037,702 | |
| | | | | | | | |
| | | | | | | 12,197,747 | |
| | | | | | | | |
| Health Care – Products — 5.4% | | | | | | | | |
Johnson & Johnson | | | 15,787 | | | | 1,650,847 | |
Medtronic, Inc. | | | 47,083 | | | | 3,399,393 | |
Sonova Holding AG | | | 10,219 | | | | 1,498,035 | |
St. Jude Medical, Inc. | | | 47,279 | | | | 3,074,553 | |
Stryker Corp. | | | 33,038 | | | | 3,116,474 | |
| | | | | | | | |
| | | | | | | 12,739,302 | |
| | | | | | | | |
| Health Care – Services — 2.3% | | | | | | | | |
Thermo Fisher Scientific, Inc. | | | 44,502 | | | | 5,575,656 | |
| | | | | | | | |
| Household Products — 2.4% | | | | | | | | |
Reckitt Benckiser Group PLC | | | 70,449 | | | | 5,683,219 | |
| | | | | | | | |
The accompanying notes are an integral part of the financial statements.
85
MML Global Fund – Portfolio of Investments (Continued)
| | | | | | | | |
| | | Number of
Shares | | | Value | |
| Pharmaceuticals — 4.6% | | | | | | | | |
Bayer AG | | | 38,479 | | | $ | 5,260,442 | |
DENTSPLY International, Inc. | | | 37,004 | | | | 1,971,203 | |
Indivior PLC (a) | | | 65,292 | | | | 152,035 | |
Merck KGaA | | | 20,627 | | | | 1,956,792 | |
Roche Holding AG | | | 5,878 | | | | 1,593,176 | |
| | | | | | | | |
| | | | | | | 10,933,648 | |
| | | | | | | | |
| | | | | | | 72,125,944 | |
| | | | | | | | |
| Diversified — 1.7% | | | | | | | | |
| Holding Company – Diversified — 1.7% | |
LVMH Moet Hennessy Louis Vuitton SA | | | 24,734 | | | | 3,911,288 | |
| | | | | | | | |
| Energy — 2.6% | |
| Oil & Gas — 0.4% | |
Inpex Corp. | | | 83,400 | | | | 925,352 | |
| | | | | | | | |
| Oil & Gas Services — 2.2% | |
National Oilwell Varco, Inc. | | | 19,420 | | | | 1,272,593 | |
NOW, Inc. (a) (b) | | | 13,405 | | | | 344,911 | |
Saipem SpA (a) (b) | | | 33,068 | | | | 347,290 | |
Schlumberger Ltd. | | | 38,577 | | | | 3,294,861 | |
| | | | | | | | |
| | | | | | | 5,259,655 | |
| | | | | | | | |
| | | | | | | 6,185,007 | |
| | | | | | | | |
| Financial — 13.4% | |
| Banks — 6.9% | |
Bank of New York Mellon Corp. | | | 96,741 | | | | 3,924,783 | |
Credicorp Ltd. | | | 3,646 | | | | 584,016 | |
Erste Group Bank AG | | | 35,307 | | | | 809,463 | |
Itau Unibanco Holding SA Sponsored ADR (Brazil) | | | 83,517 | | | | 1,086,556 | |
Julius Baer Group Ltd. | | | 25,406 | | | | 1,159,404 | |
Kasikornbank PCL | | | 128,200 | | | | 890,794 | |
Komercni Banka AS | | | 1,834 | | | | 377,830 | |
Sberbank of Russia Sponsored ADR (Russia) | | | 55,132 | | | | 213,526 | |
Standard Chartered PLC | | | 115,048 | | | | 1,725,375 | |
State Street Corp. | | | 70,187 | | | | 5,509,680 | |
| | | | | | | | |
| | | | | | | 16,281,427 | |
| | | | | | | | |
| Diversified Financial — 6.2% | |
American Express Co. | | | 40,386 | | | | 3,757,513 | |
Deutsche Boerse AG | | | 17,348 | | | | 1,243,228 | |
Franklin Resources, Inc. | | | 59,619 | | | | 3,301,104 | |
The Goldman Sachs Group, Inc. | | | 15,172 | | | | 2,940,789 | |
Grupo Financiero Banorte SAB de CV Class O | | | 157,840 | | | | 872,125 | |
UBS Group AG | | | 156,327 | | | | 2,687,214 | |
| | | | | | | | |
| | | | | | | 14,801,973 | |
| | | | | | | | |
| Insurance — 0.3% | |
Swiss Re AG | | | 8,160 | | | | 682,774 | |
| | | | | | | | |
| | | | | | | 31,766,174 | |
| | | | | | | | |
| | | | | | | | |
| | | Number of
Shares | | | Value | |
| Industrial — 16.1% | |
| Aerospace & Defense — 2.8% | |
MTU Aero Engines AG | | | 16,954 | | | $ | 1,480,316 | |
United Technologies Corp. | | | 44,553 | | | | 5,123,595 | |
| | | | | | | | |
| | | | | | | 6,603,911 | |
| | | | | | | | |
| Electrical Components & Equipment — 2.3% | |
Legrand SA | | | 48,557 | | | | 2,541,904 | |
Schneider Electric SE | | | 38,996 | | | | 2,833,522 | |
| | | | | | | | |
| | | | | | | 5,375,426 | |
| | | | | | | | |
| Electronics — 2.5% | |
Amphenol Corp. Class A | | | 30,684 | | | | 1,651,106 | |
Hoya Corp. | | | 64,600 | | | | 2,162,871 | |
Waters Corp. (a) | | | 19,931 | | | | 2,246,622 | |
| | | | | | | | |
| | | | | | | 6,060,599 | |
| | | | | | | | |
| Machinery – Diversified — 0.2% | |
Rockwell Automation, Inc. | | | 5,124 | | | | 569,789 | |
| | | | | | | | |
| Manufacturing — 4.4% | |
3M Co. | | | 26,090 | | | | 4,287,109 | |
Honeywell International, Inc. | | | 60,674 | | | | 6,062,546 | |
| | | | | | | | |
| | | | | | | 10,349,655 | |
| | | | | | | | |
| Transportation — 3.9% | |
Canadian National Railway Co. | | | 69,189 | | | | 4,767,814 | |
Kuehne & Nagel International AG | | | 3,393 | | | | 461,215 | |
United Parcel Service, Inc. Class B | | | 36,401 | | | | 4,046,699 | |
| | | | | | | | |
| | | | | | | 9,275,728 | |
| | | | | | | | |
| | | | | | | 38,235,108 | |
| | | | | | | | |
| Technology — 6.7% | |
| Computers — 2.3% | |
Accenture PLC Class A | | | 61,612 | | | | 5,502,568 | |
| | | | | | | | |
| Internet — 0.5% | |
Check Point Software Technologies Ltd. (a) | | | 14,214 | | | | 1,116,794 | |
| | | | | | | | |
| Semiconductors — 1.7% | |
Altera Corp. | | | 25,408 | | | | 938,572 | |
Microchip Technology, Inc. (b) | | | 34,383 | | | | 1,551,017 | |
Samsung Electronics Co., Ltd. | | | 1,278 | | | | 1,536,222 | |
| | | | | | | | |
| | | | | | | 4,025,811 | |
| | | | | | | | |
| Software — 2.2% | |
Dassault Systemes SA | | | 7,743 | | | | 471,226 | |
Oracle Corp. | | | 106,270 | | | | 4,778,962 | |
| | | | | | | | |
| | | | | | | 5,250,188 | |
| | | | | | | | |
| | | | | | | 15,895,361 | |
| | | | | | | | |
| | |
TOTAL COMMON STOCK
(Cost $173,599,810) | | | | | | | 233,362,603 | |
| | | | | | | | |
| | |
TOTAL EQUITIES
(Cost $173,599,810) | | | | | | | 233,362,603 | |
| | | | | | | | |
The accompanying notes are an integral part of the financial statements.
86
MML Global Fund – Portfolio of Investments (Continued)
| | | | | | | | |
| | | Number of
Shares | | | Value | |
| MUTUAL FUNDS — 1.1% | | | | | | | | |
| Diversified Financial — 1.1% | | | | | | | | |
State Street Navigator Securities Lending Prime Portfolio (c) | | | 2,480,911 | | | $ | 2,480,911 | |
| | | | | | | | |
| | |
TOTAL MUTUAL FUNDS
(Cost $2,480,911) | | | | | | | 2,480,911 | |
| | | | | | | | |
| | |
TOTAL LONG-TERM INVESTMENTS
(Cost $176,080,721) | | | | | | | 235,843,514 | |
| | | | | | | | |
| | |
| | | Principal
Amount | | | | |
| SHORT-TERM INVESTMENTS — 1.4% | | | | | |
| Repurchase Agreement — 1.4% | | | | | | | | |
State Street Bank & Trust Co. Repurchase Agreement, dated 12/31/14, 0.010%, due 1/02/15 (d) | | $ | 3,401,568 | | | | 3,401,568 | |
| | | | | | | | |
| Time Deposits — 0.0% | | | | | | | | |
Euro Time Deposit
0.010% 1/02/15 | | | 14,893 | | | | 14,893 | |
| | | | | | | | |
| | |
TOTAL SHORT-TERM INVESTMENTS
(Cost $3,416,461) | | | | | | | 3,416,461 | |
| | | | | | | | |
| | |
TOTAL INVESTMENTS — 100.9%
(Cost $179,497,182) (e) | | | | | | | 239,259,975 | |
| | |
| Other Assets/(Liabilities) — (0.9)% | | | | | | | (2,164,105 | ) |
| | | | | | | | |
| | |
| NET ASSETS — 100.0% | | | | | | $ | 237,095,870 | |
| | | | | | | | |
Notes to Portfolio of Investments
Percentages are stated as a percent of net assets.
| ADR | American Depositary Receipt |
| (a) | Non-income producing security. |
| (b) | Denotes all or a portion of security on loan. The total value of securities on loan as of December 31, 2014, was $2,391,810 or 1.01% of net assets. Total securities on loan may not correspond with the amounts identified in the Portfolio of Investments because pending sales may be in the process of recall from the brokers. (Note 2). |
| (c) | Represents investment of security lending collateral. (Note 2). |
| (d) | Maturity value of $3,401,570. Collateralized by U.S. Government Agency obligations with a rate of 2.750%, maturity date of 11/15/28, and an aggregate market value, including accrued interest, of $3,470,440. |
| (e) | See Note 6 for aggregate cost for federal tax purposes. |
Country weightings, as a percentage of net assets, is as follows:
| | | | |
United States | | | 51.1 | % |
United Kingdom | | | 10.6 | % |
Switzerland | | | 7.8 | % |
France | | | 7.8 | % |
Germany | | | 7.0 | % |
Ireland | | | 2.3 | % |
Netherlands | | | 2.3 | % |
Canada | | | 2.0 | % |
Japan | | | 1.5 | % |
Netherlands Antilles | | | 1.4 | % |
Sweden | | | 1.1 | % |
Brazil | | | 1.0 | % |
Republic of Korea | | | 0.6 | % |
Denmark | | | 0.6 | % |
Israel | | | 0.5 | % |
Thailand | | | 0.4 | % |
Mexico | | | 0.4 | % |
Austria | | | 0.3 | % |
Bermuda | | | 0.2 | % |
Cayman Islands | | | 0.2 | % |
Czech Republic | | | 0.2 | % |
Italy | | | 0.1 | % |
Russia | | | 0.1 | % |
| | | | |
Total Long-Term Investments | | | 99.5 | % |
Short-Term Investments and Other Assets and Liabilities | | | 0.5 | % |
| | | | |
Net Assets | | | 100.0 | % |
| | | | |
The accompanying notes are an integral part of the financial statements.
87
MML Growth & Income Fund – Portfolio of Investments
December 31, 2014
| | | | | | | | |
| | | Number of
Shares | | | Value | |
| EQUITIES — 99.3% | | | | | | | | |
| |
| COMMON STOCK — 99.0% | | | | | |
| Basic Materials — 3.7% | | | | | |
| Chemicals — 3.7% | | | | | |
FMC Corp. | | | 2,905 | | | $ | 165,672 | |
Linde AG | | | 5,461 | | | | 1,018,585 | |
Praxair, Inc. | | | 8,736 | | | | 1,131,836 | |
The Sherwin-Williams Co. | | | 6,008 | | | | 1,580,344 | |
W.R. Grace & Co. (a) | | | 14,192 | | | | 1,353,775 | |
| | | | | | | | |
| | | | | | | 5,250,212 | |
| | | | | | | | |
| Communications — 9.8% | |
| Internet — 2.8% | |
Google, Inc. Class A (a) | | | 4,186 | | | | 2,221,343 | |
Google, Inc. Class C (a) | | | 3,351 | | | | 1,763,966 | |
| | | | | | | | |
| | | | | | | 3,985,309 | |
| | | | | | | | |
| Media — 7.0% | |
Comcast Corp. Class A | | | 44,583 | | | | 2,586,260 | |
Time Warner, Inc. | | | 29,484 | | | | 2,518,523 | |
Twenty-First Century Fox Class A | | | 46,321 | | | | 1,778,958 | |
The Walt Disney Co. | | | 30,443 | | | | 2,867,426 | |
| | | | | | | | |
| | | | | | | 9,751,167 | |
| | | | | | | | |
| | | | | | | 13,736,476 | |
| | | | | | | | |
| Consumer, Cyclical — 10.4% | |
| Apparel — 1.6% | |
Hermes International | | | 58 | | | | 20,855 | |
Nike, Inc. Class B | | | 9,057 | | | | 870,830 | |
VF Corp. | | | 18,082 | | | | 1,354,342 | |
| | | | | | | | |
| | | | | | | 2,246,027 | |
| | | | | | | | |
| Automotive & Parts — 0.5% | |
Delphi Automotive PLC | | | 9,173 | | | | 667,061 | |
| | | | | | | | |
| Distribution & Wholesale — 1.1% | |
W.W. Grainger, Inc. | | | 5,929 | | | | 1,511,243 | |
| | | | | | | | |
| Housewares — 0.8% | |
Newell Rubbermaid, Inc. | | | 32,039 | | | | 1,220,365 | |
| | | | | | | | |
| Retail — 6.4% | |
Bed Bath & Beyond, Inc. (a) | | | 24,153 | | | | 1,839,734 | |
Kohl’s Corp. | | | 22,747 | | | | 1,388,477 | |
L Brands, Inc. | | | 14,282 | | | | 1,236,107 | |
McDonald’s Corp. | | | 16,322 | | | | 1,529,371 | |
Ross Stores, Inc. | | | 15,066 | | | | 1,420,121 | |
Target Corp. | | | 20,948 | | | | 1,590,163 | |
| | | | | | | | |
| | | | | | | 9,003,973 | |
| | | | | | | | |
| | | | | | | 14,648,669 | |
| | | | | | | | |
| Consumer, Non-cyclical — 25.6% | |
| Beverages — 1.7% | |
Diageo PLC | | | 34,317 | | | | 984,251 | |
| | | | | | | | |
| | | Number of
Shares | | | Value | |
Pernod-Ricard SA | | | 13,026 | | | $ | 1,444,283 | |
| | | | | | | | |
| | | | | | | 2,428,534 | |
| | | | | | | | |
| Commercial Services — 5.0% | |
MasterCard, Inc. Class A | | | 24,878 | | | | 2,143,489 | |
McKesson Corp. | | | 6,347 | | | | 1,317,510 | |
Visa, Inc. Class A | | | 13,736 | | | | 3,601,579 | |
| | | | | | | | |
| | | | | | | 7,062,578 | |
| | | | | | | | |
| Cosmetics & Personal Care — 2.9% | |
Colgate-Palmolive Co. | | | 16,794 | | | | 1,161,977 | |
The Procter & Gamble Co. | | | 32,336 | | | | 2,945,486 | |
| | | | | | | | |
| | | | | | | 4,107,463 | |
| | | | | | | | |
| Foods — 2.6% | |
Danone SA | | | 21,527 | | | | 1,416,186 | |
General Mills, Inc. | | | 10,355 | | | | 552,232 | |
Mondelez International, Inc. Class A | | | 43,705 | | | | 1,587,584 | |
| | | | | | | | |
| | | | | | | 3,556,002 | |
| | | | | | | | |
| Health Care – Products — 4.8% | |
Covidien PLC | | | 13,934 | | | | 1,425,169 | |
Johnson & Johnson | | | 28,227 | | | | 2,951,697 | |
St. Jude Medical, Inc. | | | 15,325 | | | | 996,585 | |
Stryker Corp. | | | 13,735 | | | | 1,295,623 | |
| | | | | | | | |
| | | | | | | 6,669,074 | |
| | | | | | | | |
| Health Care – Services — 1.7% | |
Thermo Fisher Scientific, Inc. | | | 18,999 | | | | 2,380,385 | |
| | | | | | | | |
| Pharmaceuticals — 6.9% | |
Abbott Laboratories | | | 28,679 | | | | 1,291,129 | |
AbbVie, Inc. | | | 20,697 | | | | 1,354,412 | |
Actavis PLC (a) | | | 3,221 | | | | 829,118 | |
Bristol-Myers Squibb Co. | | | 21,898 | | | | 1,292,639 | |
Eli Lilly & Co. | | | 9,807 | | | | 676,585 | |
Endo International PLC (a) | | | 18,820 | | | | 1,357,298 | |
Pfizer, Inc. | | | 25,060 | | | | 780,619 | |
Valeant Pharmaceuticals International, Inc. (a) | | | 15,040 | | | | 2,152,374 | |
| | | | | | | | |
| | | | | | | 9,734,174 | |
| | | | | | | | |
| | | | | | | 35,938,210 | |
| | | | | | | | |
| Diversified — 0.8% | |
| Holding Company – Diversified — 0.8% | |
LVMH Moet Hennessy Louis Vuitton SA | | | 6,980 | | | | 1,103,776 | |
| | | | | | | | |
| Energy — 5.9% | |
| Oil & Gas — 3.1% | |
EOG Resources, Inc. | | | 22,021 | | | | 2,027,474 | |
Noble Energy, Inc. | | | 27,787 | | | | 1,317,937 | |
Occidental Petroleum Corp. | | | 13,526 | | | | 1,090,331 | |
| | | | | | | | |
| | | | | | | 4,435,742 | |
| | | | | | | | |
The accompanying notes are an integral part of the financial statements.
88
MML Growth & Income Fund – Portfolio of Investments (Continued)
| | | | | | | | |
| | | Number of
Shares | | | Value | |
| Oil & Gas Services — 2.8% | |
Cameron International Corp. (a) | | | 22,301 | | | $ | 1,113,935 | |
National Oilwell Varco, Inc. | | | 14,693 | | | | 962,832 | |
Schlumberger Ltd. | | | 21,328 | | | | 1,821,625 | |
| | | | | | | | |
| | | | | | | 3,898,392 | |
| | | | | | | | |
| | | | | | | 8,334,134 | |
| | | | | | | | |
| Financial — 17.2% | |
| Banks — 4.0% | |
Bank of America Corp. | | | 105,268 | | | | 1,883,245 | |
State Street Corp. | | | 11,103 | | | | 871,585 | |
Wells Fargo & Co. | | | 53,360 | | | | 2,925,195 | |
| | | | | | | | |
| | | | | | | 5,680,025 | |
| | | | | | | | |
| Diversified Financial — 10.5% | |
American Express Co. | | | 28,249 | | | | 2,628,287 | |
BlackRock, Inc. | | | 6,286 | | | | 2,247,622 | |
Franklin Resources, Inc. | | | 8,918 | | | | 493,790 | |
The Goldman Sachs Group, Inc. | | | 13,436 | | | | 2,604,300 | |
JP Morgan Chase & Co. | | | 67,109 | | | | 4,199,681 | |
Morgan Stanley | | | 33,760 | | | | 1,309,888 | |
The NASDAQ OMX Group, Inc. | | | 28,357 | | | | 1,360,002 | |
| | | | | | | | |
| | | | | | | 14,843,570 | |
| | | | | | | | |
| Insurance — 0.9% | |
ACE Ltd. | | | 10,520 | | | | 1,208,538 | |
| | | | | | | | |
| Real Estate Investment Trusts (REITS) — 1.8% | |
American Tower Corp. | | | 25,279 | | | | 2,498,829 | |
| | | | | | | | |
| | | | | | | 24,230,962 | |
| | | | | | | | |
| Industrial — 11.8% | |
| Aerospace & Defense — 2.0% | |
United Technologies Corp. | | | 24,302 | | | | 2,794,730 | |
| | | | | | | | |
| Engineering & Construction — 0.6% | |
Fluor Corp. | | | 14,296 | | | | 866,766 | |
| | | | | | | | |
| Manufacturing — 4.5% | |
Danaher Corp. | | | 46,248 | | | | 3,963,916 | |
Honeywell International, Inc. | | | 23,385 | | | | 2,336,629 | |
| | | | | | | | |
| | | | | | | 6,300,545 | |
| | | | | | | | |
| Metal Fabricate & Hardware — 1.3% | |
Precision Castparts Corp. | | | 7,895 | | | | 1,901,748 | |
| | | | | | | | |
| Packaging & Containers — 1.2% | |
Crown Holdings, Inc. (a) | | | 31,855 | | | | 1,621,420 | |
| | | | | | | | |
| Transportation — 2.2% | |
Canadian National Railway Co. | | | 27,101 | | | | 1,867,530 | |
United Parcel Service, Inc. Class B | | | 10,677 | | | | 1,186,962 | |
| | | | | | | | |
| | | | | | | 3,054,492 | |
| | | | | | | | |
| | | | | | | 16,539,701 | |
| | | | | | | | |
| Technology — 12.2% | | | | | | | | |
| Computers — 7.3% | | | | | | | | |
Accenture PLC Class A | | | 24,314 | | | | 2,171,483 | |
Apple, Inc. | | | 13,522 | | | | 1,492,559 | |
| | | | | | | | |
| | | Number of
Shares | | | Value | |
Cognizant Technology Solutions Corp. Class A (a) | | | 40,573 | | | $ | 2,136,574 | |
EMC Corp. | | | 102,573 | | | | 3,050,521 | |
Hewlett-Packard Co. | | | 35,284 | | | | 1,415,947 | |
| | | | | | | | |
| | | | | | | 10,267,084 | |
| | | | | | | | |
| Semiconductors — 2.4% | | | | | | | | |
Altera Corp. | | | 41,620 | | | | 1,537,443 | |
Microchip Technology, Inc. | | | 41,256 | | | | 1,861,058 | |
| | | | | | | | |
| | | | | | | 3,398,501 | |
| | | | | | | | |
| Software — 2.5% | | | | | | | | |
Citrix Systems, Inc. (a) | | | 15,112 | | | | 964,145 | |
Fidelity National Information Services, Inc. | | | 31,159 | | | | 1,938,090 | |
Oracle Corp. | | | 13,893 | | | | 624,768 | |
| | | | | | | | |
| | | | | | | 3,527,003 | |
| | | | | | | | |
| | | | | | | 17,192,588 | |
| | | | | | | | |
| Utilities — 1.6% | | | | | | | | |
| Electric — 1.6% | | | | | | | | |
American Electric Power Co., Inc. | | | 16,093 | | | | 977,167 | |
CMS Energy Corp. | | | 34,923 | | | | 1,213,574 | |
| | | | | | | | |
| | | | | | | 2,190,741 | |
| | | | | | | | |
| | |
TOTAL COMMON STOCK
(Cost $95,582,136) | | | | | | | 139,165,469 | |
| | | | | | | | |
| | |
| PREFERRED STOCK — 0.3% | | | | | | | | |
| Electric — 0.3% | | | | | | | | |
Exelon Corp. 6.500% | | | 7,560 | | | | 396,900 | |
| | | | | | | | |
| | |
TOTAL PREFERRED STOCK
(Cost $382,468) | | | | | | | 396,900 | |
| | | | | | | | |
| | |
TOTAL EQUITIES
(Cost $95,964,604) | | | | | | | 139,562,369 | |
| | | | | | | | |
| | |
TOTAL LONG-TERM INVESTMENTS
(Cost $95,964,604) | | | | | | | 139,562,369 | |
| | | | | | | | |
| | |
| | | Principal
Amount | | | | |
| SHORT-TERM INVESTMENTS — 1.0% | | | | | |
| Repurchase Agreement — 1.0% | | | | | | | | |
State Street Bank & Trust Co. Repurchase Agreement, dated 12/31/14, 0.010%, due 1/02/15 (b) | | $ | 1,426,103 | | | | 1,426,103 | |
| | | | | | | | |
The accompanying notes are an integral part of the financial statements.
89
MML Growth & Income Fund – Portfolio of Investments (Continued)
| | | | | | | | |
| | | Principal
Amount | | | Value | |
| Time Deposits — 0.0% | | | | | | | | |
Euro Time Deposit
0.010% 1/02/15 | | $ | 5,015 | | | $ | 5,015 | |
| | | | | | | | |
| | |
TOTAL SHORT-TERM INVESTMENTS
(Cost $1,431,118) | | | | | | | 1,431,118 | |
| | | | | | | | |
| | |
TOTAL INVESTMENTS — 100.3%
(Cost $97,395,722) (c) | | | | | | | 140,993,487 | |
| | |
| Other Assets/(Liabilities) — (0.3)% | | | | | | | (397,985 | ) |
| | | | | | | | |
| | |
| NET ASSETS — 100.0% | | | | | | $ | 140,595,502 | |
| | | | | | | | |
Notes to Portfolio of Investments
Percentages are stated as a percent of net assets.
| (a) | Non-income producing security. |
| (b) | Maturity value of $1,426,104. Collateralized by U.S. Government Agency obligations with a rate of 3.500%, maturity date of 1/01/32, and an aggregate market value, including accrued interest, of $1,454,812. |
| (c) | See Note 6 for aggregate cost for federal tax purposes. |
The accompanying notes are an integral part of the financial statements.
90
MML Income & Growth Fund – Portfolio of Investments
December 31, 2014
| | | | | | | | |
| | | Number of
Shares | | | Value | |
| EQUITIES — 96.0% | | | | | | | | |
| |
| COMMON STOCK — 96.0% | | | | | |
| Basic Materials — 4.7% | | | | | |
| Chemicals — 3.1% | | | | | |
The Dow Chemical Co. | | | 35,730 | | | $ | 1,629,644 | |
E.I. du Pont de Nemours & Co. | | | 59,740 | | | | 4,417,176 | |
Praxair, Inc. | | | 13,180 | | | | 1,707,601 | |
| | | | | | | | |
| | | | | | | 7,754,421 | |
| | | | | | | | |
| Forest Products & Paper — 1.1% | |
International Paper Co. | | | 50,380 | | | | 2,699,360 | |
| | | | | | | | |
| Mining — 0.5% | |
BHP Billiton Ltd. | | | 47,190 | | | | 1,119,751 | |
| | | | | | | | |
| | | | | | | 11,573,532 | |
| | | | | | | | |
| Communications — 6.7% | |
| Media — 2.9% | |
Comcast Corp. Special Class A | | | 111,060 | | | | 6,393,169 | |
Nielsen NV | | | 20,970 | | | | 937,988 | |
| | | | | | | | |
| | | | | | | 7,331,157 | |
| | | | | | | | |
| Telecommunications — 3.8% | |
BCE, Inc. | | | 16,480 | | | | 755,773 | |
Motorola Solutions, Inc. | | | 28,850 | | | | 1,935,258 | |
QUALCOMM, Inc. | | | 35,050 | | | | 2,605,266 | |
Verizon Communications, Inc. | | | 87,300 | | | | 4,083,894 | |
| | | | | | | | |
| | | | | | | 9,380,191 | |
| | | | | | | | |
| | | | | | | 16,711,348 | |
| | | | | | | | |
| Consumer, Cyclical — 6.2% | |
| Apparel — 1.0% | |
VF Corp. | | | 33,750 | | | | 2,527,875 | |
| | | | | | | | |
| Automotive & Parts — 0.6% | |
Johnson Controls, Inc. | | | 28,200 | | | | 1,363,188 | |
| | | | | | | | |
| Retail — 4.6% | |
The Home Depot, Inc. | | | 69,950 | | | | 7,342,652 | |
McDonald’s Corp. | | | 34,400 | | | | 3,223,280 | |
Wal-Mart Stores, Inc. | | | 9,690 | | | | 832,177 | |
| | | | | | | | |
| | | | | | | 11,398,109 | |
| | | | | | | | |
| | | | | | | 15,289,172 | |
| | | | | | | | |
| Consumer, Non-cyclical — 17.4% | | | | | | | | |
| Agriculture — 1.5% | | | | | | | | |
Altria Group, Inc. | | | 29,170 | | | | 1,437,206 | |
Lorillard, Inc. | | | 19,600 | | | | 1,233,624 | |
Philip Morris International, Inc. | | | 13,830 | | | | 1,126,453 | |
| | | | | | | | |
| | | | | | | 3,797,283 | |
| | | | | | | | |
| Beverages — 1.4% | | | | | | | | |
The Coca-Cola Co. | | | 28,720 | | | | 1,212,558 | |
Diageo PLC | | | 81,170 | | | | 2,328,049 | |
| | | | | | | | |
| | | | | | | 3,540,607 | |
| | | | | | | | |
| | | | | | | | |
| | | Number of
Shares | | | Value | |
| Commercial Services — 0.3% | | | | | | | | |
Automatic Data Processing, Inc. | | | 9,410 | | | $ | 784,512 | |
| | | | | | | | |
| Cosmetics & Personal Care — 2.1% | |
The Procter & Gamble Co. | | | 57,160 | | | | 5,206,704 | |
| | | | | | | | |
| Foods — 2.0% | | | | | | | | |
General Mills, Inc. | | | 10,700 | | | | 570,631 | |
Kraft Foods Group, Inc. | | | 10,846 | | | | 679,610 | |
The Kroger Co. | | | 33,500 | | | | 2,151,035 | |
Mondelez International, Inc. Class A | | | 31,660 | | | | 1,150,050 | |
Unilever NV NY Shares | | | 11,990 | | | | 468,090 | |
| | | | | | | | |
| | | | | | | 5,019,416 | |
| | | | | | | | |
| Health Care – Products — 2.3% | | | | | | | | |
Becton, Dickinson & Co. | | | 10,600 | | | | 1,475,096 | |
Johnson & Johnson | | | 41,400 | | | | 4,329,198 | |
| | | | | | | | |
| | | | | | | 5,804,294 | |
| | | | | | | | |
| Health Care – Services — 0.5% | | | | | | | | |
Quest Diagnostics, Inc. | | | 17,860 | | | | 1,197,692 | |
| | | | | | | | |
| Pharmaceuticals — 7.3% | | | | | | | | |
Abbott Laboratories | | | 21,430 | | | | 964,779 | |
AbbVie, Inc. | | | 21,430 | | | | 1,402,379 | |
Bristol-Myers Squibb Co. | | | 80,260 | | | | 4,737,748 | |
Merck & Co., Inc. | | | 91,990 | | | | 5,224,112 | |
Pfizer, Inc. | | | 181,700 | | | | 5,659,955 | |
| | | | | | | | |
| | | | | | | 17,988,973 | |
| | | | | | | | |
| | | | | | | 43,339,481 | |
| | | | | | | | |
| Energy — 9.7% | |
| Oil & Gas — 8.8% | |
California Resources Corp. (a) | | | 10,220 | | | | 56,312 | |
Chevron Corp. | | | 49,460 | | | | 5,548,423 | |
ConocoPhillips | | | 18,410 | | | | 1,271,395 | |
Exxon Mobil Corp. | | | 51,420 | | | | 4,753,779 | |
Marathon Oil Corp. | | | 54,130 | | | | 1,531,338 | |
Marathon Petroleum Corp. | | | 25,400 | | | | 2,292,604 | |
Occidental Petroleum Corp. | | | 33,850 | | | | 2,728,648 | |
Phillips 66 | | | 11,880 | | | | 851,796 | |
Total SA Sponsored ADR (France) | | | 52,670 | | | | 2,696,704 | |
| | | | | | | | |
| | | | | | | 21,730,999 | |
| | | | | | | | |
| Oil & Gas Services — 0.5% | |
Schlumberger Ltd. | | | 14,770 | | | | 1,261,505 | |
| | | | | | | | |
| Pipelines — 0.4% | |
Spectra Energy Corp. | | | 30,630 | | | | 1,111,869 | |
| | | | | | | | |
| | | | | | | 24,104,373 | |
| | | | | | | | |
| Financial — 25.6% | |
| Banks — 10.1% | |
Bank of America Corp. | | | 216,470 | | | | 3,872,648 | |
Fifth Third Bancorp | | | 101,050 | | | | 2,058,894 | |
SunTrust Banks, Inc. | | | 99,360 | | | | 4,163,184 | |
The Toronto-Dominion Bank | | | 37,270 | | | | 1,780,735 | |
The accompanying notes are an integral part of the financial statements.
91
MML Income & Growth Fund – Portfolio of Investments (Continued)
| | | | | | | | |
| | | Number of
Shares | | | Value | |
U.S. Bancorp | | | 92,790 | | | $ | 4,170,911 | |
Wells Fargo & Co. | | | 165,910 | | | | 9,095,186 | |
| | | | | | | | |
| | | | | | | 25,141,558 | |
| | | | | | | | |
| Diversified Financial — 9.1% | |
American Express Co. | | | 39,620 | | | | 3,686,245 | |
Citigroup, Inc. | | | 71,700 | | | | 3,879,687 | |
CME Group, Inc. | | | 23,520 | | | | 2,085,048 | |
The Goldman Sachs Group, Inc. | | | 9,700 | | | | 1,880,151 | |
JP Morgan Chase & Co. | | | 131,890 | | | | 8,253,676 | |
Morgan Stanley | | | 73,340 | | | | 2,845,592 | |
| | | | | | | | |
| | | | | | | 22,630,399 | |
| | | | | | | | |
| Insurance — 6.3% | |
ACE Ltd. | | | 23,150 | | | | 2,659,472 | |
American International Group, Inc. | | | 22,430 | | | | 1,256,304 | |
The Chubb Corp. | | | 17,000 | | | | 1,758,990 | |
MetLife, Inc. | | | 60,480 | | | | 3,271,363 | |
Prudential Financial, Inc. | | | 36,660 | | | | 3,316,264 | |
The Travelers Cos., Inc. | | | 30,600 | | | | 3,239,010 | |
| | | | | | | | |
| | | | | | | 15,501,403 | |
| | | | | | | | |
| Real Estate Investment Trusts (REITS) — 0.1% | |
Weyerhaeuser Co. | | | 8,300 | | | | 297,887 | |
| | | | | | | | |
| | | | | | | 63,571,247 | |
| | | | | | | | |
| Industrial — 14.5% | |
| Aerospace & Defense — 5.8% | |
Lockheed Martin Corp. | | | 11,720 | | | | 2,256,920 | |
Northrop Grumman Corp. | | | 27,180 | | | | 4,006,060 | |
Raytheon Co. | | | 49,180 | | | | 5,319,801 | |
United Technologies Corp. | | | 24,950 | | | | 2,869,250 | |
| | | | | | | | |
| | | | | | | 14,452,031 | |
| | | | | | | | |
| Electronics — 0.5% | |
Tyco International PLC | | | 27,700 | | | | 1,214,922 | |
| | | | | | | | |
| Machinery – Diversified — 0.4% | |
Rockwell Automation, Inc. | | | 8,360 | | | | 929,632 | |
| | | | | | | | |
| Manufacturing — 5.0% | |
3M Co. | | | 18,870 | | | | 3,100,718 | |
General Electric Co. | | | 241,110 | | | | 6,092,850 | |
Honeywell International, Inc. | | | 32,110 | | | | 3,208,431 | |
| | | | | | | | |
| | | | | | | 12,401,999 | |
| | | | | | | | |
| Transportation — 2.8% | |
CSX Corp. | | | 28,720 | | | | 1,040,526 | |
Union Pacific Corp. | | | 25,770 | | | | 3,069,980 | |
United Parcel Service, Inc. Class B | | | 26,560 | | | | 2,952,675 | |
| | | | | | | | |
| | | | | | | 7,063,181 | |
| | | | | | | | |
| | | | | | | 36,061,765 | |
| | | | | | | | |
| Technology — 5.8% | |
| Computers — 0.9% | |
International Business Machines Corp. | | | 13,190 | | | | 2,116,204 | |
| | | | | | | | |
| | | | | | | | |
| | | Number of
Shares | | | Value | |
| Semiconductors — 2.8% | |
Intel Corp. | | | 140,120 | | | $ | 5,084,955 | |
Samsung Electronics Co., Ltd. (b) | | | 3,250 | | | | 1,953,269 | |
| | | | | | | | |
| | | | | | | 7,038,224 | |
| | | | | | | | |
| Software — 2.1% | |
Microsoft Corp. | | | 110,570 | | | | 5,135,976 | |
| | | | | | | | |
| | | | | | | 14,290,404 | |
| | | | | | | | |
| Utilities — 5.4% | |
| Electric — 4.0% | |
Dominion Resources, Inc. | | | 37,190 | | | | 2,859,911 | |
Duke Energy Corp. | | | 14,030 | | | | 1,172,066 | |
ITC Holdings Corp. | | | 18,920 | | | | 764,936 | |
NextEra Energy, Inc. | | | 27,820 | | | | 2,956,988 | |
Northeast Utilities | | | 21,840 | | | | 1,168,877 | |
Wisconsin Energy Corp. | | | 22,560 | | | | 1,189,814 | |
| | | | | | | | |
| | | | | | | 10,112,592 | |
| | | | | | | | |
| Gas — 0.6% | |
Sempra Energy | | | 13,250 | | | | 1,475,520 | |
| | | | | | | | |
| Water — 0.8% | |
American Water Works Co., Inc. | | | 36,270 | | | | 1,933,191 | |
| | | | | | | | |
| | | | | | | 13,521,303 | |
| | | | | | | | |
| | |
TOTAL COMMON STOCK
(Cost $174,107,960) | | | | | | | 238,462,625 | |
| | | | | | | | |
| | |
TOTAL EQUITIES
(Cost $174,107,960) | | | | | | | 238,462,625 | |
| | | | | | | | |
| | |
TOTAL LONG-TERM INVESTMENTS
(Cost $174,107,960) | | | | | | | 238,462,625 | |
| | | | | | | | |
| | |
| | | Principal
Amount | | | | |
| SHORT-TERM INVESTMENTS — 4.0% | |
| Repurchase Agreement — 4.0% | | | | | | | | |
State Street Bank & Trust Co. Repurchase Agreement, dated 12/31/14, 0.010%, due 1/02/15 (c) | | $ | 9,791,868 | | | | 9,791,868 | |
| | | | | | | | |
| | |
TOTAL SHORT-TERM INVESTMENTS
(Cost $9,791,868) | | | | | | | 9,791,868 | |
| | | | | | | | |
| | |
TOTAL INVESTMENTS — 100.0%
(Cost $183,899,828) (d) | | | | | | | 248,254,493 | |
| | |
| Other Assets/(Liabilities) — 0.0% | | | | | | | 63,903 | |
| | | | | | | | |
| | |
| NET ASSETS — 100.0% | | | | | | $ | 248,318,396 | |
| | | | | | | | |
The accompanying notes are an integral part of the financial statements.
92
MML Income & Growth Fund – Portfolio of Investments (Continued)
Notes to Portfolio of Investments
Percentages are stated as a percent of net assets.
| ADR | American Depositary Receipt |
| (a) | Non-income producing security. |
| (b) | Security exempt from registration under Regulation S of the Securities Act of 1933, which exempts from registration securities offered and sold outside the United States. Security may not be offered or sold in the United States except pursuant to an exemption from, or in a transaction not subject to, the registration requirements of the Securities Act of 1933. At December 31, 2014, these securities amounted to a value of $1,953,269 or 0.79% of net assets. |
| (c) | Maturity value of $9,791,874. Collateralized by U.S. Government Agency obligations with a rate of 2.500%, maturity date of 3/20/28, and an aggregate market value, including accrued interest, of $9,991,051. |
| (d) | See Note 6 for aggregate cost for federal tax purposes. |
The accompanying notes are an integral part of the financial statements.
93
MML International Equity Fund – Portfolio of Investments
December 31, 2014
| | | | | | | | |
| | | Number of
Shares | | | Value | |
| EQUITIES — 95.0% | | | | | | | | |
| | |
| COMMON STOCK — 95.0% | | | | | | | | |
| Basic Materials — 2.4% | | | | | | | | |
| Chemicals — 0.5% | | | | | | | | |
Akzo Nobel NV | | | 8,361 | | | $ | 579,792 | |
| | | | | | | | |
| Mining — 1.9% | | | | | | | | |
Orica Ltd. | | | 153,879 | | | | 2,358,311 | |
| | | | | | | | |
| | | | | | | 2,938,103 | |
| | | | | | | | |
| Communications — 2.6% | | | | | | | | |
| Advertising — 2.4% | | | | | | | | |
Publicis Groupe | | | 16,980 | | | | 1,216,162 | |
WPP PLC | | | 87,000 | | | | 1,804,919 | |
| | | | | | | | |
| | | | | | | 3,021,081 | |
| | | | | | | | |
| Media — 0.2% | | | | | | | | |
Thomson Reuters Corp. (a) | | | 6,300 | | | | 254,158 | |
| | | | | | | | |
| | | | | | | 3,275,239 | |
| | | | | | | | |
| Consumer, Cyclical — 23.4% | | | | | | | | |
| Apparel — 2.6% | | | | | | | | |
Christian Dior SA | | | 4,600 | | | | 785,942 | |
Hermes International | | | - | | | | 139 | |
Prada SpA | | | 436,700 | | | | 2,462,332 | |
| | | | | | | | |
| | | | | | | 3,248,413 | |
| | | | | | | | |
| Auto Manufacturers — 12.2% | | | | | | | | |
Bayerische Motoren Werke AG | | | 34,300 | | | | 3,725,111 | |
Daimler AG | | | 48,300 | | | | 4,029,699 | |
Honda Motor Co. Ltd. (a) | | | 135,600 | | | | 3,943,207 | |
Toyota Motor Corp. | | | 54,200 | | | | 3,379,943 | |
| | | | | | | | |
| | | | | | | 15,077,960 | |
| | | | | | | | |
| Automotive & Parts — 0.1% | | | | | | | | |
Continental AG | | | 330 | | | | 70,076 | |
| | | | | | | | |
| Distribution & Wholesale — 0.8% | | | | | | | | |
Wolseley PLC | | | 18,100 | | | | 1,030,404 | |
| | | | | | | | |
| Lodging — 1.4% | | | | | | | | |
Melco Crown Entertainment Ltd. ADR (Cayman Islands) | | | 70,200 | | | | 1,783,080 | |
| | | | | | | | |
| Retail — 6.3% | | | | | | | | |
Cie Financiere Richemont SA | | | 44,600 | | | | 3,950,549 | |
Hennes & Mauritz AB Class B | | | 26,600 | | | | 1,103,416 | |
Kering | | | 14,620 | | | | 2,810,807 | |
| | | | | | | | |
| | | | | | | 7,864,772 | |
| | | | | | | | |
| | | | | | | 29,074,705 | |
| | | | | | | | |
| Consumer, Non-cyclical — 16.1% | |
| Agriculture — 0.3% | |
Swedish Match AB | | | 12,200 | | | | 380,531 | |
| | | | | | | | |
| Beverages — 4.8% | |
Diageo PLC | | | 117,600 | | | | 3,372,903 | |
| | | | | | | | |
| | | Number of
Shares | | | Value | |
Heineken Holding NV Class A | | | 12,200 | | | $ | 764,727 | |
Pernod-Ricard SA | | | 16,100 | | | | 1,785,119 | |
| | | | | | | | |
| | | | | | | 5,922,749 | |
| | | | | | | | |
| Commercial Services — 5.7% | |
Adecco SA | | | 36,900 | | | | 2,527,796 | |
Experian PLC | | | 202,900 | | | | 3,422,460 | |
G4S PLC | | | 70,900 | | | | 305,123 | |
Meitec Corp. | | | 8,900 | | | | 262,701 | |
Secom Co. Ltd. | | | 8,900 | | | | 511,324 | |
| | | | | | | | |
| | | | | | | 7,029,404 | |
| | | | | | | | |
| Foods — 3.8% | |
Danone SA | | | 39,161 | | | | 2,576,265 | |
Koninklijke Ahold NV | | | 19,000 | | | | 337,745 | |
Nestle SA | | | 25,400 | | | | 1,861,859 | |
| | | | | | | | |
| | | | | | | 4,775,869 | |
| | | | | | | | |
| Pharmaceuticals — 1.5% | |
GlaxoSmithKline PLC | | | 87,500 | | | | 1,872,067 | |
| | | | | | | | |
| | | | | | | 19,980,620 | |
| | | | | | | | |
| Diversified — 2.0% | |
| Holding Company – Diversified — 2.0% | |
Exor SpA | | | 11,600 | | | | 473,249 | |
LVMH Moet Hennessy Louis Vuitton SA | | | 12,800 | | | | 2,024,116 | |
| | | | | | | | |
| | | | | | | 2,497,365 | |
| | | | | | | | |
| Financial — 25.7% | |
| Banks — 9.1% | |
BNP Paribas | | | 78,900 | | | | 4,636,502 | |
Intesa Sanpaolo SpA | | | 1,288,400 | | | | 3,727,135 | |
Lloyds Banking Group PLC (b) | | | 2,486,100 | | | | 2,935,752 | |
| | | | | | | | |
| | | | | | | 11,299,389 | |
| | | | | | | | |
| Diversified Financial — 9.6% | |
Credit Suisse Group | | | 243,100 | | | | 6,094,231 | |
Daiwa Securities Group, Inc. | | | 451,000 | | | | 3,512,214 | |
Schroders PLC | | | 57,200 | | | | 2,370,681 | |
| | | | | | | | |
| | | | | | | 11,977,126 | |
| | | | | | | | |
| Insurance — 7.0% | |
Allianz SE | | | 22,900 | | | | 3,804,920 | |
AMP Ltd. | | | 440,600 | | | | 1,960,669 | |
Willis Group Holdings PLC | | | 65,200 | | | | 2,921,612 | |
| | | | | | | | |
| | | | | | | 8,687,201 | |
| | | | | | | | |
| | | | | | | 31,963,716 | |
| | | | | | | | |
| Industrial — 18.2% | |
| Aerospace & Defense — 2.7% | |
Meggitt PLC | | | 187,738 | | | | 1,500,656 | |
Safran SA | | | 29,400 | | | | 1,809,540 | |
| | | | | | | | |
| | | | | | | 3,310,196 | |
| | | | | | | | |
The accompanying notes are an integral part of the financial statements.
94
MML International Equity Fund – Portfolio of Investments (Continued)
| | | | | | | | |
| | | Number of
Shares | | | Value | |
| Building Materials — 2.5% | |
Holcim Ltd. | | | 44,100 | | | $ | 3,131,546 | |
| | | | | | | | |
| Electronics — 2.2% | |
Koninklijke Philips Electronics NV | | | 93,291 | | | | 2,708,719 | |
| | | | | | | | |
| Hand & Machine Tools — 1.2% | |
Schindler Holding AG | | | 10,700 | | | | 1,543,934 | |
| | | | | | | | |
| Machinery – Construction & Mining — 1.1% | |
Atlas Copco AB Class B | | | 50,600 | | | | 1,296,567 | |
| | | | | | | | |
| Machinery – Diversified — 2.7% | |
CNH Industrial NV | | | 419,100 | | | | 3,378,536 | |
| | | | | | | | |
| Manufacturing — 1.8% | |
Olympus Corp. (b) | | | 22,700 | | | | 799,855 | |
Smiths Group PLC | | | 82,300 | | | | 1,392,937 | |
| | | | | | | | |
| | | | | | | 2,192,792 | |
| | | | | | | | |
| Metal Fabricate & Hardware — 1.8% | |
SKF AB Class B | | | 108,200 | | | | 2,276,199 | |
| | | | | | | | |
| Transportation — 2.2% | |
Kuehne & Nagel International AG | | | 20,000 | | | | 2,718,626 | |
| | | | | | | | |
| | | | | | | 22,557,115 | |
| | | | | | | | |
| Technology — 4.6% | |
| Internet — 0.2% | |
Check Point Software Technologies Ltd. (b) | | | 3,500 | | | | 274,995 | |
| | | | | | | | |
| Office Equipment/Supplies — 0.7% | |
Canon, Inc. | | | 28,000 | | | | 889,333 | |
| | | | | | | | |
| Semiconductors — 2.6% | |
Samsung Electronics Co., Ltd. | | | 2,695 | | | | 3,239,530 | |
| | | | | | | | |
| Software — 1.1% | |
SAP SE | | | 19,500 | | | | 1,378,757 | |
| | | | | | | | |
| | | | | | | 5,782,615 | |
| | | | | | | | |
| | |
TOTAL COMMON STOCK
(Cost $127,744,010) | | | | | | | 118,069,478 | |
| | | | | | | | |
| | |
TOTAL EQUITIES
(Cost $127,744,010) | | | | | | | 118,069,478 | |
| | | | | | | | |
|
| MUTUAL FUNDS — 1.3% | |
| Diversified Financial — 1.3% | |
State Street Navigator Securities Lending Prime Portfolio (c) | | | 1,592,220 | | | | 1,592,220 | |
| | | | | | | | |
| | |
TOTAL MUTUAL FUNDS
(Cost $1,592,220) | | | | | | | 1,592,220 | |
| | | | | | | | |
| | | | |
| | |
Value | |
TOTAL LONG-TERM
INVESTMENTS
(Cost $129,336,230) | | $ | 119,661,698 | |
| | | | |
| |
TOTAL INVESTMENTS — 96.3%
(Cost $129,336,230) (d) | | | 119,661,698 | |
| |
| Other Assets/(Liabilities) — 3.7% | | | 4,552,006 | |
| | | | |
| |
| NET ASSETS — 100.0% | | $ | 124,213,704 | |
| | | | |
Notes to Portfolio of Investments
Percentages are stated as a percent of net assets.
| ADR | American Depositary Receipt |
| (a) | Denotes all or a portion of security on loan. The total value of securities on loan as of December 31, 2014, was $1,515,707 or 1.22% of net assets. Total securities on loan may not correspond with the amounts identified in the Portfolio of Investments because pending sales may be in the process of recall from the brokers. (Note 2). |
| (b) | Non-income producing security. |
| (c) | Represents investment of security lending collateral. (Note 2). |
| (d) | See Note 6 for aggregate cost for federal tax purposes. |
Country weightings, as a percentage of net assets, is as follows:
| | | | |
Switzerland | | | 17.5 | % |
United Kingdom | | | 16.0 | % |
France | | | 14.2 | % |
Japan | | | 10.7 | % |
Germany | | | 10.5 | % |
Netherlands | | | 6.3 | % |
Italy | | | 5.4 | % |
Sweden | | | 4.1 | % |
Australia | | | 3.5 | % |
Republic of Korea | | | 2.6 | % |
Ireland | | | 2.4 | % |
Cayman Islands | | | 1.4 | % |
United States | | | 1.3 | % |
Israel | | | 0.2 | % |
Canada | | | 0.2 | % |
| | | | |
Total Long-Term Investments | | | 96.3 | % |
Other Assets and Liabilities | | | 3.7 | % |
| | | | |
Net Assets | | | 100.0 | % |
| | | | |
The accompanying notes are an integral part of the financial statements.
95
MML Large Cap Growth Fund – Portfolio of Investments
December 31, 2014
| | | | | | | | |
| | | Number of
Shares | | | Value | |
| EQUITIES — 98.8% | |
|
| COMMON STOCK — 98.8% | |
| Basic Materials — 4.0% | |
| Chemicals — 4.0% | |
LyondellBasell Industries NV Class A | | | 40,760 | | | $ | 3,235,936 | |
The Sherwin-Williams Co. | | | 25,070 | | | | 6,594,413 | |
| | | | | | | | |
| | | | | | | 9,830,349 | |
| | | | | | | | |
| Communications — 17.9% | |
| Internet — 14.3% | |
Alibaba Group Holding Ltd. Sponsored ADR (Cayman Islands) (a) | | | 34,090 | | | | 3,543,315 | |
Equinix, Inc. | | | 15,198 | | | | 3,445,842 | |
Facebook, Inc. Class A (a) | | | 93,390 | | | | 7,286,288 | |
Google, Inc. Class A (a) | | | 15,630 | | | | 8,294,216 | |
LinkedIn Corp. Class A (a) | | | 11,170 | | | | 2,565,861 | |
The Priceline Group, Inc. (a) | | | 4,770 | | | | 5,438,802 | |
TripAdvisor, Inc. (a) | | | 32,670 | | | | 2,439,142 | |
Yelp, Inc. (a) | | | 36,880 | | | | 2,018,442 | |
| | | | | | | | |
| | | | | | | 35,031,908 | |
| | | | | | | | |
| Media — 3.0% | |
The Walt Disney Co. | | | 79,290 | | | | 7,468,325 | |
| | | | | | | | |
| Telecommunications — 0.6% | |
Palo Alto Networks, Inc. (a) | | | 11,080 | | | | 1,358,076 | |
| | | | | | | | |
| | | | | | | 43,858,309 | |
| | | | | | | | |
| Consumer, Cyclical — 16.4% | |
| Airlines — 1.5% | |
Delta Air Lines, Inc. | | | 76,110 | | | | 3,743,851 | |
| | | | | | | | |
| Apparel — 3.3% | | | | | | | | |
Nike, Inc. Class B | | | 40,360 | | | | 3,880,614 | |
VF Corp. | | | 54,820 | | | | 4,106,018 | |
| | | | | | | | |
| | | | | | | 7,986,632 | |
| | | | | | | | |
| Lodging — 2.5% | |
Las Vegas Sands Corp. | | | 39,200 | | | | 2,279,872 | |
Marriott International, Inc. Class A | | | 51,090 | | | | 3,986,553 | |
| | | | | | | | |
| | | | | | | 6,266,425 | |
| | | | | | | | |
| Retail — 9.1% | | | | | | | | |
Costco Wholesale Corp. | | | 27,670 | | | | 3,922,222 | |
Dollar General Corp. (a) | | | 54,500 | | | | 3,853,150 | |
The Home Depot, Inc. | | | 70,480 | | | | 7,398,285 | |
Ulta Salon Cosmetics & Fragrance, Inc. (a) | | | 25,390 | | | | 3,245,858 | |
Yum! Brands, Inc. | | | 52,780 | | | | 3,845,023 | |
| | | | | | | | |
| | | | | | | 22,264,538 | |
| | | | | | | | |
| | | | | | | 40,261,446 | |
| | | | | | | | |
| Consumer, Non-cyclical — 29.1% | |
| Beverages — 1.6% | |
Monster Beverage Corp. (a) | | | 35,770 | | | | 3,875,680 | |
| | | | | | | | |
| | | | | | | | |
| | | Number of
Shares | | | Value | |
| Biotechnology — 6.9% | |
Alexion Pharmaceuticals, Inc. (a) | | | 13,030 | | | $ | 2,410,941 | |
Biogen Idec, Inc. (a) | | | 14,880 | | | | 5,051,016 | |
Celgene Corp. (a) | | | 54,260 | | | | 6,069,523 | |
Regeneron Pharmaceuticals, Inc. (a) | | | 8,160 | | | | 3,347,640 | |
| | | | | | | | |
| | | | | | | 16,879,120 | |
| | | | | | | | |
| Commercial Services — 10.1% | |
FleetCor Technologies, Inc. (a) | | | 23,500 | | | | 3,494,685 | |
MasterCard, Inc. Class A | | | 50,380 | | | | 4,340,741 | |
McKesson Corp. | | | 24,820 | | | | 5,152,136 | |
Verisk Analytics, Inc. Class A (a) | | | 44,630 | | | | 2,858,551 | |
Visa, Inc. Class A | | | 33,800 | | | | 8,862,360 | |
| | | | | | | | |
| | | | | | | 24,708,473 | |
| | | | | | | | |
| Cosmetics & Personal Care — 2.0% | |
The Estee Lauder Cos., Inc. Class A | | | 64,520 | | | | 4,916,424 | |
| | | | | | | | |
| Pharmaceuticals — 8.5% | |
AbbVie, Inc. | | | 111,330 | | | | 7,285,435 | |
Actavis PLC (a) | | | 26,190 | | | | 6,741,568 | |
Allergan, Inc. | | | 4,060 | | | | 863,115 | |
Shire PLC Sponsored ADR (United Kingdom) | | | 28,470 | | | | 6,051,014 | |
| | | | | | | | |
| | | | | | | 20,941,132 | |
| | | | | | | | |
| | | | | | | 71,320,829 | |
| | | | | | | | |
| Energy — 4.3% | |
| Oil & Gas — 4.3% | |
Anadarko Petroleum Corp. | | | 55,790 | | | | 4,602,675 | |
EOG Resources, Inc. | | | 63,370 | | | | 5,834,476 | |
| | | | | | | | |
| | | | | | | 10,437,151 | |
| | | | | | | | |
| Financial — 5.6% | |
| Diversified Financial — 5.6% | |
Affiliated Managers Group, Inc. (a) | | | 25,240 | | | | 5,356,938 | |
Discover Financial Services | | | 38,070 | | | | 2,493,204 | |
Morgan Stanley | | | 150,990 | | | | 5,858,412 | |
| | | | | | | | |
| | | | | | | 13,708,554 | |
| | | | | | | | |
| Industrial — 7.7% | |
| Building Materials — 1.7% | |
Fortune Brands Home & Security, Inc. | | | 91,850 | | | | 4,158,049 | |
| | | | | | | | |
| Machinery – Diversified — 1.3% | |
Cummins, Inc. | | | 21,350 | | | | 3,078,030 | |
| | | | | | | | |
| Transportation — 4.7% | |
FedEx Corp. | | | 13,860 | | | | 2,406,928 | |
Kansas City Southern | | | 36,940 | | | | 4,507,788 | |
Union Pacific Corp. | | | 39,000 | | | | 4,646,070 | |
| | | | | | | | |
| | | | | | | 11,560,786 | |
| | | | | | | | |
| | | | | | | 18,796,865 | |
| | | | | | | | |
The accompanying notes are an integral part of the financial statements.
96
MML Large Cap Growth Fund – Portfolio of Investments (Continued)
| | | | | | | | |
| | | Number of
Shares | | | Value | |
| Technology — 13.8% | |
| Computers — 5.2% | |
Apple, Inc. | | | 116,100 | | | $ | 12,815,118 | |
| | | | | | | | |
| Semiconductors — 0.8% | |
NXP Semiconductor NV (a) | | | 24,790 | | | | 1,893,956 | |
| | | | | | | | |
| Software — 7.8% | |
Activision Blizzard, Inc. | | | 156,100 | | | | 3,145,415 | |
Salesforce.com, Inc. (a) | | | 81,600 | | | | 4,839,696 | |
Servicenow, Inc. (a) | | | 51,170 | | | | 3,471,884 | |
VMware, Inc. Class A (a) | | | 53,080 | | | | 4,380,162 | |
Workday, Inc. Class A (a) | | | 40,270 | | | | 3,286,435 | |
| | | | | | | | |
| | | | | | | 19,123,592 | |
| | | | | | | | |
| | | | | | | 33,832,666 | |
| | | | | | | | |
| | |
TOTAL COMMON STOCK
(Cost $200,471,270) | | | | | | | 242,046,169 | |
| | | | | | | | |
| | |
TOTAL EQUITIES
(Cost $200,471,270) | | | | | | | 242,046,169 | |
| | | | | | | | |
| | |
TOTAL LONG-TERM INVESTMENTS
(Cost $200,471,270) | | | | | | | 242,046,169 | |
| | | | | | | | |
| | |
| | | Principal
Amount | | | | |
| SHORT-TERM INVESTMENTS — 2.8% | |
| Repurchase Agreement — 2.8% | | | | | |
State Street Bank & Trust Co. Repurchase Agreement, dated 12/31/14, 0.010%, due 1/02/15 (b) | | $ | 6,949,171 | | | | 6,949,171 | |
| | | | | | | | |
| | |
TOTAL SHORT-TERM INVESTMENTS
(Cost $6,949,171) | | | | | | | 6,949,171 | |
| | | | | | | | |
| | |
TOTAL INVESTMENTS — 101.6%
(Cost $207,420,441) (c) | | | | | | | 248,995,340 | |
| | |
| Other Assets/(Liabilities) — (1.6)% | | | | | | | (4,040,556 | ) |
| | | | | | | | |
| | |
| NET ASSETS — 100.0% | | | | | | $ | 244,954,784 | |
| | | | | | | | |
Notes to Portfolio of Investments
Percentages are stated as a percent of net assets.
| ADR | American Depositary Receipt |
| (a) | Non-income producing security. |
| (b) | Maturity value of $6,949,175. Collateralized by U.S. Government Agency obligations with a rate of 3.500%, maturity date of 1/01/32, and an aggregate market value, including accrued interest, of $7,089,687. |
| (c) | See Note 6 for aggregate cost for federal tax purposes. |
The accompanying notes are an integral part of the financial statements.
97
MML Managed Volatility Fund – Portfolio of Investments
December 31, 2014
| | | | | | | | |
| | | Number of
Shares | | | Value | |
| EQUITIES — 99.8% | | | | | | | | |
| | |
| COMMON STOCK — 99.8% | | | | | | | | |
| Basic Materials — 3.0% | | | | | | | | |
| Chemicals — 2.4% | | | | | | | | |
Air Products & Chemicals, Inc. (a) | | | 3,864 | | | $ | 557,306 | |
Airgas, Inc. (a) | | | 1,319 | | | | 151,922 | |
CF Industries Holdings, Inc. (a) | | | 1,005 | | | | 273,903 | |
The Dow Chemical Co. (a) | | | 22,532 | | | | 1,027,684 | |
E.I. du Pont de Nemours & Co. (a) | | | 18,364 | | | | 1,357,834 | |
Eastman Chemical Co. (a) | | | 3,038 | | | | 230,463 | |
Ecolab, Inc. (a) | | | 5,444 | | | | 569,007 | |
FMC Corp. (a) | | | 2,675 | | | | 152,555 | |
International Flavors & Fragrances, Inc. (a) | | | 1,626 | | | | 164,811 | |
LyondellBasell Industries NV Class A (a) | | | 8,553 | | | | 679,023 | |
Monsanto Co. (a) | | | 9,682 | | | | 1,156,709 | |
The Mosaic Co. (a) | | | 6,368 | | | | 290,699 | |
PPG Industries, Inc. (a) | | | 2,785 | | | | 643,753 | |
Praxair, Inc. (a) | | | 5,822 | | | | 754,298 | |
The Sherwin-Williams Co. (a) | | | 1,700 | | | | 447,168 | |
Sigma-Aldrich Corp. (a) | | | 2,379 | | | | 326,565 | |
| | | | | | | | |
| | | | | | | 8,783,700 | |
| | | | | | | | |
| Forest Products & Paper — 0.2% | |
International Paper Co. (a) | | | 8,556 | | | | 458,431 | |
MeadWestvaco Corp. (a) | | | 3,516 | | | | 156,075 | |
| | | | | | | | |
| | | | | | | 614,506 | |
| | | | | | | | |
| Iron & Steel — 0.1% | |
Allegheny Technologies, Inc. | | | 2,159 | | | | 75,069 | |
Nucor Corp. (a) | | | 6,368 | | | | 312,350 | |
| | | | | | | | |
| | | | | | | 387,419 | |
| | | | | | | | |
| Mining — 0.3% | |
Alcoa, Inc. (a) | | | 23,560 | | | | 372,013 | |
Freeport-McMoRan, Inc. (a) | | | 20,869 | | | | 487,500 | |
Newmont Mining Corp. (a) | | | 9,939 | | | | 187,847 | |
Vulcan Materials Co. (a) | | | 2,580 | | | | 169,583 | |
| | | | | | | | |
| | | | | | | 1,216,943 | |
| | | | | | | | |
| | | | | | | 11,002,568 | |
| | | | | | | | |
| Communications — 12.3% | |
| Advertising — 0.2% | |
The Interpublic Group of Companies, Inc. (a) | | | 8,501 | | | | 176,566 | |
Omnicom Group, Inc. (a) | | | 4,995 | | | | 386,962 | |
| | | | | | | | |
| | | | | | | 563,528 | |
| | | | | | | | |
| Internet — 4.5% | |
Akamai Technologies, Inc. (a) (b) | | | 3,531 | | | | 222,312 | |
Amazon.com, Inc. (a) (b) | | | 7,618 | | | | 2,364,246 | |
eBay, Inc. (a) (b) | | | 22,688 | | | | 1,273,250 | |
| | | | | | | | |
| | | Number of
Shares | | | Value | |
Expedia, Inc. (a) | | | 2,030 | | | $ | 173,281 | |
F5 Networks, Inc. (a) (b) | | | 1,463 | | | | 190,870 | |
Facebook, Inc. Class A (a) (b) | | | 41,837 | | | | 3,264,123 | |
Google, Inc. Class A (a) (b) | | | 5,714 | | | | 3,032,191 | |
Google, Inc. Class C (a) (b) | | | 5,714 | | | | 3,007,850 | |
Netflix, Inc. (a) (b) | | | 1,172 | | | | 400,367 | |
The Priceline Group, Inc. (a) (b) | | | 1,014 | | | | 1,156,173 | |
Symantec Corp. (a) | | | 13,893 | | | | 356,425 | |
TripAdvisor, Inc. (a) (b) | | | 2,268 | | | | 169,329 | |
VeriSign, Inc. (a) (b) | | | 2,324 | | | | 132,468 | |
Yahoo!, Inc. (a) (b) | | | 18,542 | | | | 936,556 | |
| | | | | | | | |
| | | | | | | 16,679,441 | |
| | | | | | | | |
| Media — 3.6% | |
Cablevision Systems Corp. Class A (a) | | | 4,352 | | | | 89,825 | |
CBS Corp. Class B (a) | | | 9,734 | | | | 538,680 | |
Comcast Corp. Class A (a) | | | 51,882 | | | | 3,009,675 | |
DIRECTV (b) (a) | | | 10,103 | | | | 875,930 | |
Discovery Communications, Inc. Series A (a) (b) | | | 2,981 | | | | 102,696 | |
Discovery Communications, Inc. Series C (a) (b) | | | 5,481 | | | | 184,819 | |
Gannett Co., Inc. (a) | | | 4,571 | | | | 145,952 | |
The McGraw Hill Financial, Inc. (a) | | | 5,429 | | | | 483,073 | |
News Corp. Class A (b) (a) | | | 9,928 | | | | 155,770 | |
Nielsen NV (a) | | | 6,136 | | | | 274,463 | |
Scripps Networks Interactive Class A (a) | | | 2,031 | | | | 152,874 | |
Time Warner Cable, Inc. (a) | | | 5,621 | | | | 854,729 | |
Time Warner, Inc. (a) | | | 17,191 | | | | 1,468,455 | |
Twenty-First Century Fox Class A (a) | | | 37,827 | | | | 1,452,746 | |
Viacom, Inc. Class B (a) | | | 7,609 | | | | 572,577 | |
The Walt Disney Co. (a) | | | 31,674 | | | | 2,983,374 | |
| | | | | | | | |
| | | | | | | 13,345,638 | |
| | | | | | | | |
| Telecommunications — 4.0% | |
AT&T, Inc. (a) | | | 104,072 | | | | 3,495,779 | |
CenturyLink, Inc. (a) | | | 11,416 | | | | 451,845 | |
Cisco Systems, Inc. (a) | | | 102,339 | | | | 2,846,559 | |
Corning, Inc. (a) | | | 25,901 | | | | 593,910 | |
Frontier Communications Corp. (a) | | | 20,090 | | | | 134,000 | |
Harris Corp. (a) | | | 2,214 | | | | 159,010 | |
Juniper Networks, Inc. (a) | | | 8,017 | | | | 178,939 | |
Level 3 Communications, Inc. (b) (a) | | | 5,600 | | | | 276,528 | |
Motorola Solutions, Inc. (a) | | | 4,454 | | | | 298,774 | |
QUALCOMM, Inc. (a) | | | 33,659 | | | | 2,501,874 | |
Verizon Communications, Inc. (a) | | | 83,188 | | | | 3,891,535 | |
Windstream Corp. (a) | | | 12,054 | | | | 99,325 | |
| | | | | | | | |
| | | | | | | 14,928,078 | |
| | | | | | | | |
| | | | | | | 45,516,685 | |
| | | | | | | | |
The accompanying notes are an integral part of the financial statements.
98
MML Managed Volatility Fund – Portfolio of Investments (Continued)
| | | | | | | | |
| | | Number of
Shares | | | Value | |
| Consumer, Cyclical — 10.1% | |
| Airlines — 0.4% | |
Delta Air Lines, Inc. (a) | | | 16,868 | | | $ | 829,737 | |
Southwest Airlines Co. (a) | | | 13,703 | | | | 579,911 | |
| | | | | | | | |
| | | | | | | 1,409,648 | |
| | | | | | | | |
| Apparel — 0.6% | |
Nike, Inc. Class B (a) | | | 14,074 | | | | 1,353,215 | |
Ralph Lauren Corp. (a) | | | 1,247 | | | | 230,894 | |
Under Armour, Inc. Class A (a) (b) | | | 3,440 | | | | 233,576 | |
VF Corp. (a) | | | 6,914 | | | | 517,859 | |
| | | | | | | | |
| | | | | | | 2,335,544 | |
| | | | | | | | |
| Auto Manufacturers — 0.7% | |
Ford Motor Co. (a) | | | 77,764 | | | | 1,205,342 | |
General Motors Co. (a) | | | 27,035 | | | | 943,792 | |
Paccar, Inc. (a) | | | 7,140 | | | | 485,591 | |
| | | | | | | | |
| | | | | | | 2,634,725 | |
| | | | | | | | |
| Automotive & Parts — 0.4% | |
BorgWarner, Inc. (a) | | | 4,607 | | | | 253,155 | |
Delphi Automotive PLC (a) | | | 5,975 | | | | 434,502 | |
The Goodyear Tire & Rubber Co. (a) | | | 5,562 | | | | 158,906 | |
Johnson Controls, Inc. (a) | | | 13,412 | | | | 648,336 | |
| | | | | | | | |
| | | | | | | 1,494,899 | |
| | | | | | | | |
| Distribution & Wholesale — 0.3% | |
Fastenal Co. (a) | | | 5,499 | | | | 261,532 | |
Fossil Group, Inc. (a) (b) | | | 913 | | | | 101,106 | |
Genuine Parts Co. (a) | | | 3,114 | | | | 331,859 | |
W.W. Grainger, Inc. (a) | | | 1,196 | | | | 304,848 | |
| | | | | | | | |
| | | | | | | 999,345 | |
| | | | | | | | |
| Home Builders — 0.1% | |
D.R. Horton, Inc. (a) | | | 6,632 | | | | 167,723 | |
Lennar Corp. Class A (a) | | | 3,688 | | | | 165,259 | |
PulteGroup, Inc. (a) | | | 6,742 | | | | 144,684 | |
| | | | | | | | |
| | | | | | | 477,666 | |
| | | | | | | | |
| Home Furnishing — 0.1% | |
Harman International Industries, Inc. (a) | | | 1,445 | | | | 154,196 | |
Whirlpool Corp. (a) | | | 1,555 | | | | 301,266 | |
| | | | | | | | |
| | | | | | | 455,462 | |
| | | | | | | | |
| Housewares — 0.1% | |
Newell Rubbermaid, Inc. (a) | | | 5,474 | | | | 208,505 | |
| | | | | | | | |
| Leisure Time — 0.3% | |
Carnival Corp. (a) | | | 9,069 | | | | 411,097 | |
Harley-Davidson, Inc. (a) | | | 4,488 | | | | 295,804 | |
Royal Caribbean Cruises Ltd. (a) | | | 3,260 | | | | 268,722 | |
| | | | | | | | |
| | | | | | | 975,623 | |
| | | | | | | | |
| Lodging — 0.3% | |
Marriott International, Inc. Class A (a) | | | 4,517 | | | | 352,461 | |
Starwood Hotels & Resorts Worldwide, Inc. (a) | | | 3,583 | | | | 290,474 | |
| | | | | | | | |
| | | Number of
Shares | | | Value | |
Wyndham Worldwide Corp. (a) | | | 2,505 | | | $ | 214,829 | |
Wynn Resorts Ltd. (a) | | | 1,626 | | | | 241,884 | |
| | | | | | | | |
| | | | | | | 1,099,648 | |
| | | | | | | | |
| Retail — 6.6% | |
AutoNation, Inc. (b) | | | 1,544 | | | | 93,273 | |
AutoZone, Inc. (a) (b) | | | 606 | | | | 375,181 | |
Bed Bath & Beyond, Inc. (a) (b) | | | 3,681 | | | | 280,382 | |
Best Buy Co., Inc. (a) | | | 5,854 | | | | 228,189 | |
CarMax, Inc. (a) (b) | | | 4,429 | | | | 294,883 | |
Chipotle Mexican Grill, Inc. (a) (b) | | | 664 | | | | 454,515 | |
Coach, Inc. (a) | | | 5,521 | | | | 207,369 | |
Costco Wholesale Corp. (a) | | | 8,764 | | | | 1,242,297 | |
CVS Health Corp. (a) | | | 23,192 | | | | 2,233,621 | |
Darden Restaurants, Inc. (a) | | | 2,658 | | | | 155,838 | |
Dollar General Corp. (a) (b) | | | 6,045 | | | | 427,381 | |
Dollar Tree, Inc. (a) (b) | | | 4,140 | | | | 291,373 | |
Family Dollar Stores, Inc. (a) | | | 1,884 | | | | 149,232 | |
GameStop Corp. Class A | | | 2,281 | | | | 77,098 | |
The Gap, Inc. (a) | | | 5,528 | | | | 232,784 | |
The Home Depot, Inc. (a) | | | 26,968 | | | | 2,830,831 | |
Kohl’s Corp. (a) | | | 4,087 | | | | 249,470 | |
L Brands, Inc. (a) | | | 4,960 | | | | 429,288 | |
Lowe’s Cos., Inc. (a) | | | 19,794 | | | | 1,361,827 | |
Macy’s, Inc. (a) | | | 7,057 | | | | 463,998 | |
McDonald’s Corp. (a) | | | 19,698 | | | | 1,845,702 | |
Michael Kors Holdings Ltd. (a) (b) | | | 4,267 | | | | 320,452 | |
Nordstrom, Inc. (a) | | | 2,940 | | | | 233,407 | |
O’Reilly Automotive, Inc. (a) (b) | | | 2,100 | | | | 404,502 | |
PetSmart, Inc. (a) | | | 1,961 | | | | 159,419 | |
PVH Corp. (a) | | | 1,647 | | | | 211,096 | |
Ross Stores, Inc. (a) | | | 4,168 | | | | 392,876 | |
Staples, Inc. (a) | | | 12,936 | | | | 234,400 | |
Starbucks Corp. (a) | | | 15,092 | | | | 1,238,299 | |
Target Corp. (a) | | | 12,757 | | | | 968,384 | |
Tiffany & Co. (a) | | | 2,258 | | | | 241,290 | |
The TJX Cos., Inc. (a) | | | 13,881 | | | | 951,959 | |
Tractor Supply Co. (a) | | | 2,742 | | | | 216,124 | |
Urban Outfitters, Inc. (b) | | | 2,064 | | | | 72,508 | |
Wal-Mart Stores, Inc. (a) | | | 31,699 | | | | 2,722,310 | |
Walgreens Boots Alliance, Inc. (a) | | | 17,608 | | | | 1,341,730 | |
Yum! Brands, Inc. (a) | | | 8,829 | | | | 643,193 | |
| | | | | | | | |
| | | | | | | 24,276,481 | |
| | | | | | | | |
| Textiles — 0.1% | |
Cintas Corp. (a) | | | 1,899 | | | | 148,958 | |
Mohawk Industries, Inc. (a) (b) | | | 1,196 | | | | 185,810 | |
| | | | | | | | |
| | | | | | | 334,768 | |
| | | | | | | | |
| Toys, Games & Hobbies — 0.1% | |
Hasbro, Inc. (a) | | | 2,402 | | | | 132,086 | |
Mattel, Inc. (a) | | | 6,805 | | | | 210,581 | |
| | | | | | | | |
| | | | | | | 342,667 | |
| | | | | | | | |
| | | | | | | 37,044,981 | |
| | | | | | | | |
The accompanying notes are an integral part of the financial statements.
99
MML Managed Volatility Fund – Portfolio of Investments (Continued)
| | | | | | | | |
| | | Number of
Shares | | | Value | |
| Consumer, Non-cyclical — 23.7% | |
| Agriculture — 1.7% | |
Altria Group, Inc. (a) | | | 39,753 | | | $ | 1,958,630 | |
Archer-Daniels-Midland Co. (a) | | | 12,902 | | | | 670,904 | |
Lorillard, Inc. (a) | | | 7,205 | | | | 453,483 | |
Philip Morris International, Inc. (a) | | | 31,364 | | | | 2,554,598 | |
Reynolds American, Inc. (a) | | | 6,213 | | | | 399,309 | |
| | | | | | | | |
| | | | | | | 6,036,924 | |
| | | | | | | | |
| Beverages — 2.2% | |
Brown-Forman Corp. Class B (a) | | | 3,189 | | | | 280,122 | |
The Coca-Cola Co. (a) | | | 79,204 | | | | 3,343,993 | |
Coca-Cola Enterprises, Inc. (a) | | | 4,517 | | | | 199,742 | |
Constellation Brands, Inc. Class A (a) (b) | | | 3,332 | | | | 327,102 | |
Dr. Pepper Snapple Group, Inc. (a) | | | 3,918 | | | | 280,842 | |
Keurig Green Mountain, Inc. (a) | | | 2,543 | | | | 336,680 | |
Molson Coors Brewing Co. Class B (a) | | | 3,226 | | | | 240,402 | |
Monster Beverage Corp. (a) (b) | | | 2,930 | | | | 317,466 | |
PepsiCo, Inc. (a) | | | 30,265 | | | | 2,861,858 | |
| | | | | | | | |
| | | | | | | 8,188,207 | |
| | | | | | | | |
| Biotechnology — 2.1% | |
Alexion Pharmaceuticals, Inc. (a) (b) | | | 3,955 | | | | 731,794 | |
Amgen, Inc. (a) | | | 15,279 | | | | 2,433,792 | |
Biogen Idec, Inc. (a) (b) | | | 4,785 | | | | 1,624,268 | |
Celgene Corp. (a) (b) | | | 16,058 | | | | 1,796,248 | |
Regeneron Pharmaceuticals, Inc. (a) (b) | | | 1,446 | | | | 593,221 | |
Vertex Pharmaceuticals, Inc. (a) (b) | | | 4,822 | | | | 572,854 | |
| | | | | | | | |
| | | | | | | 7,752,177 | |
| | | | | | | | |
| Commercial Services — 2.3% | |
The ADT Corp. (a) | | | 3,451 | | | | 125,030 | |
Alliance Data Systems Corp. (a) (b) | | | 1,147 | | | | 328,099 | |
Automatic Data Processing, Inc. (a) | | | 9,694 | | | | 808,189 | |
Equifax, Inc. (a) | | | 2,447 | | | | 197,889 | |
H&R Block, Inc. (a) | | | 5,523 | | | | 186,014 | |
Iron Mountain, Inc. (a) | | | 3,945 | | | | 152,514 | |
MasterCard, Inc. Class A (a) | | | 19,749 | | | | 1,701,574 | |
McKesson Corp. (a) | | | 4,646 | | | | 964,417 | |
Moody’s Corp. (a) | | | 3,743 | | | | 358,617 | |
Paychex, Inc. (a) | | | 6,582 | | | | 303,891 | |
Quanta Services, Inc. (a) (b) | | | 4,376 | | | | 124,235 | |
Robert Half International, Inc. (a) | | | 2,768 | | | | 161,596 | |
Total System Services, Inc. (a) | | | 3,327 | | | | 112,985 | |
United Rentals, Inc. (a) (b) | | | 1,900 | | | | 193,819 | |
Visa, Inc. Class A (a) | | | 9,835 | | | | 2,578,737 | |
Western Union Co. (a) | | | 10,604 | | | | 189,917 | |
| | | | | | | | |
| | | | | | | 8,487,523 | |
| | | | | | | | |
| Cosmetics & Personal Care — 1.8% | |
Avon Products, Inc. (a) | | | 8,681 | | | | 81,515 | |
Colgate-Palmolive Co. (a) | | | 17,228 | | | | 1,192,005 | |
| | | | | | | | |
| | | Number of
Shares | | | Value | |
The Estee Lauder Cos., Inc. Class A (a) | | | 4,517 | | | $ | 344,195 | |
The Procter & Gamble Co. (a) | | | 54,290 | | | | 4,945,276 | |
| | | | | | | | |
| | | | | | | 6,562,991 | |
| | | | | | | | |
| Foods — 1.7% | |
Campbell Soup Co. (a) | | | 3,549 | | | | 156,156 | |
ConAgra Foods, Inc. (a) | | | 8,448 | | | | 306,493 | |
General Mills, Inc. (a) | | | 12,257 | | | | 653,666 | |
The Hershey Co. (a) | | | 3,122 | | | | 324,469 | |
Hormel Foods Corp. (a) | | | 2,814 | | | | 146,609 | |
The J.M. Smucker Co. (a) | | | 2,150 | | | | 217,107 | |
Kellogg Co. (a) | | | 5,162 | | | | 337,801 | |
Kraft Foods Group, Inc. (a) | | | 11,951 | | | | 748,850 | |
The Kroger Co. (a) | | | 9,778 | | | | 627,845 | |
McCormick & Co., Inc. (a) | | | 2,719 | | | | 202,022 | |
Mondelez International, Inc. Class A (a) | | | 33,840 | | | | 1,229,238 | |
Safeway, Inc. (a) | | | 4,640 | | | | 162,957 | |
Sysco Corp. (a) | | | 11,765 | | | | 466,953 | |
Tyson Foods, Inc. Class A (a) | | | 5,850 | | | | 234,527 | |
Whole Foods Market, Inc. (a) | | | 7,207 | | | | 363,377 | |
| | | | | | | | |
| | | | | | | 6,178,070 | |
| | | | | | | | |
| Health Care – Products — 3.4% | |
Baxter International, Inc. (a) | | | 10,883 | | | | 797,615 | |
Becton, Dickinson & Co. (a) | | | 3,858 | | | | 536,879 | |
Boston Scientific Corp. (b) (a) | | | 26,598 | | | | 352,424 | |
C.R. Bard, Inc. (a) | | | 1,517 | | | | 252,763 | |
CareFusion Corp. (b) (a) | | | 4,055 | | | | 240,624 | |
Covidien PLC (a) | | | 9,030 | | | | 923,588 | |
Edwards Lifesciences Corp. (a) (b) | | | 2,088 | | | | 265,969 | |
Intuitive Surgical, Inc. (a) (b) | | | 761 | | | | 402,523 | |
Johnson & Johnson (a) | | | 56,563 | | | | 5,914,793 | |
Medtronic, Inc. (a) | | | 19,624 | | | | 1,416,853 | |
St. Jude Medical, Inc. (a) | | | 5,737 | | | | 373,077 | |
Stryker Corp. (a) | | | 5,983 | | | | 564,376 | |
Varian Medical Systems, Inc. (a) (b) | | | 2,058 | | | | 178,038 | |
Zimmer Holdings, Inc. (a) | | | 3,412 | | | | 386,989 | |
| | | | | | | | |
| | | | | | | 12,606,511 | |
| | | | | | | | |
| Health Care – Services — 1.7% | |
Aetna, Inc. (a) | | | 7,093 | | | | 630,071 | |
Anthem, Inc. (a) | | | 5,546 | | | | 696,966 | |
Cigna Corp. (a) | | | 5,306 | | | | 546,040 | |
DaVita HealthCare Partners, Inc. (b) (a) | | | 3,428 | | | | 259,637 | |
Humana, Inc. (a) | | | 3,235 | | | | 464,643 | |
Laboratory Corporation of America Holdings (a) (b) | | | 1,797 | | | | 193,896 | |
Quest Diagnostics, Inc. (a) | | | 2,922 | | | | 195,949 | |
Tenet Healthcare Corp. (a) (b) | | | 1,979 | | | | 100,276 | |
Thermo Fisher Scientific, Inc. (a) | | | 7,957 | | | | 996,933 | |
UnitedHealth Group, Inc. (a) | | | 19,519 | | | | 1,973,176 | |
The accompanying notes are an integral part of the financial statements.
100
MML Managed Volatility Fund – Portfolio of Investments (Continued)
| | | | | | | | |
| | | Number of
Shares | | | Value | |
Universal Health Services, Inc. Class B (a) | | | 1,800 | | | $ | 200,268 | |
| | | | | | | | |
| | | | | | | 6,257,855 | |
| | | | | | | | |
| Household Products — 0.3% | |
Avery Dennison Corp. (a) | | | 1,873 | | | | 97,171 | |
The Clorox Co. (a) | | | 2,587 | | | | 269,591 | |
Kimberly-Clark Corp. (a) | | | 7,507 | | | | 867,359 | |
| | | | | | | | |
| | | | | | | 1,234,121 | |
| | | | | | | | |
| Pharmaceuticals — 6.5% | |
Abbott Laboratories (a) | | | 30,157 | | | | 1,357,668 | |
AbbVie, Inc. (a) | | | 31,929 | | | | 2,089,434 | |
Actavis PLC (a) (b) | | | 5,269 | | | | 1,356,293 | |
Allergan, Inc. (a) | | | 5,920 | | | | 1,258,533 | |
AmerisourceBergen Corp. (a) | | | 4,251 | | | | 383,270 | |
Bristol-Myers Squibb Co. (a) | | | 33,212 | | | | 1,960,504 | |
Cardinal Health, Inc. (a) | | | 6,727 | | | | 543,071 | |
DENTSPLY International, Inc. (a) | | | 2,864 | | | | 152,565 | |
Eli Lilly & Co. (a) | | | 19,729 | | | | 1,361,104 | |
Express Scripts Holding Co. (a) (b) | | | 14,977 | | | | 1,268,103 | |
Gilead Sciences, Inc. (a) (b) | | | 30,281 | | | | 2,854,287 | |
Hospira, Inc. (a) (b) | | | 3,502 | | | | 214,497 | |
Mallinckrodt PLC (a) (b) | | | 2,275 | | | | 225,293 | |
Mead Johnson Nutrition Co. (a) | | | 4,046 | | | | 406,785 | |
Merck & Co., Inc. (a) | | | 57,840 | | | | 3,284,734 | |
Mylan, Inc. (a) (b) | | | 7,544 | | | | 425,255 | |
Patterson Cos., Inc. (a) | | | 1,742 | | | | 83,790 | |
Perrigo Co. PLC (a) | | | 2,692 | | | | 449,995 | |
Pfizer, Inc. (a) | | | 127,177 | | | | 3,961,564 | |
Zoetis, Inc. (a) | | | 10,098 | | | | 434,517 | |
| | | | | | | | |
| | | | | | | 24,071,262 | |
| | | | | | | | |
| | | | | | | 87,375,641 | |
| | | | | | | | |
| Diversified — 0.0% | |
| Holding Company – Diversified — 0.0% | |
Leucadia National Corp. (a) | | | 6,334 | | | | 142,008 | |
| | | | | | | | |
| Energy — 8.4% | |
| Coal — 0.0% | |
CONSOL Energy, Inc. (a) | | | 4,636 | | | | 156,743 | |
| | | | | | | | |
| Energy – Alternate Sources — 0.0% | |
First Solar, Inc. (b) | | | 1,507 | | | | 67,205 | |
| | | | | | | | |
| Oil & Gas — 6.4% | |
Anadarko Petroleum Corp. (a) | | | 10,183 | | | | 840,097 | |
Apache Corp. (a) | | | 7,698 | | | | 482,434 | |
Cabot Oil & Gas Corp. (a) | | | 8,368 | | | | 247,776 | |
California Resources Corp. (b) | | | 6,256 | | | | 34,471 | |
Chesapeake Energy Corp. (a) | | | 10,403 | | | | 203,587 | |
Chevron Corp. (a) | | | 38,100 | | | | 4,274,058 | |
Cimarex Energy Co. (a) | | | 1,700 | | | | 180,200 | |
ConocoPhillips (a) | | | 24,639 | | | | 1,701,569 | |
Denbury Resources, Inc. | | | 7,072 | | | | 57,495 | |
Devon Energy Corp. (a) | | | 7,747 | | | | 474,194 | |
| | | | | | | | |
| | | Number of
Shares | | | Value | |
Diamond Offshore Drilling, Inc. | | | 1,352 | | | $ | 49,632 | |
Ensco PLC Class A (a) | | | 4,719 | | | | 141,334 | |
EOG Resources, Inc. (a) | | | 10,958 | | | | 1,008,903 | |
EQT Corp. (a) | | | 3,074 | | | | 232,702 | |
Exxon Mobil Corp. (a) | | | 85,593 | | | | 7,913,073 | |
Helmerich & Payne, Inc. (a) | | | 2,247 | | | | 151,493 | |
Hess Corp. (a) | | | 5,256 | | | | 387,998 | |
Marathon Oil Corp. (a) | | | 13,561 | | | | 383,641 | |
Marathon Petroleum Corp. (a) | | | 5,733 | | | | 517,461 | |
Murphy Oil Corp. (a) | | | 3,337 | | | | 168,585 | |
Nabors Industries Ltd. (a) | | | 5,808 | | | | 75,388 | |
Newfield Exploration Co. (b) | | | 2,844 | | | | 77,129 | |
Noble Corp. PLC (a) | | | 5,051 | | | | 83,695 | |
Noble Energy, Inc. (a) | | | 7,231 | | | | 342,966 | |
Occidental Petroleum Corp. (a) | | | 15,640 | | | | 1,260,740 | |
Phillips 66 (a) | | | 11,171 | | | | 800,961 | |
Pioneer Natural Resources Co. (a) | | | 2,893 | | | | 430,623 | |
QEP Resources, Inc. (a) | | | 3,275 | | | | 66,221 | |
Range Resources Corp. (a) | | | 3,338 | | | | 178,416 | |
Southwestern Energy Co. (a) (b) | | | 7,103 | | | | 193,841 | |
Tesoro Corp. (a) | | | 2,549 | | | | 189,518 | |
Valero Energy Corp. (a) | | | 10,590 | | | | 524,205 | |
| | | | | | | | |
| | | | | | | 23,674,406 | |
| | | | | | | | |
| Oil & Gas Services — 1.2% | |
Baker Hughes, Inc. (a) | | | 8,761 | | | | 491,229 | |
Cameron International Corp. (a) (b) | | | 4,088 | | | | 204,196 | |
FMC Technologies, Inc. (a) (b) | | | 4,750 | | | | 222,490 | |
Halliburton Co. (a) | | | 17,088 | | | | 672,071 | |
National Oilwell Varco, Inc. (a) | | | 8,513 | | | | 557,857 | |
Schlumberger Ltd. (a) | | | 25,967 | | | | 2,217,841 | |
Transocean Ltd. (a) | | | 6,832 | | | | 125,231 | |
| | | | | | | | |
| | | | | | | 4,490,915 | |
| | | | | | | | |
| Pipelines — 0.8% | |
Kinder Morgan, Inc. (a) | | | 34,182 | | | | 1,446,240 | |
ONEOK, Inc. (a) | | | 4,165 | | | | 207,375 | |
Spectra Energy Corp. (a) | | | 13,447 | | | | 488,126 | |
The Williams Cos., Inc. (a) | | | 13,490 | | | | 606,241 | |
| | | | | | | | |
| | | | | | | 2,747,982 | |
| | | | | | | | |
| | | | | | | 31,137,251 | |
| | | | | | | | |
| Financial — 16.3% | |
| Banks — 4.6% | |
Bank of America Corp. (a) | | | 210,967 | | | | 3,774,200 | |
Bank of New York Mellon Corp. (a) | | | 22,681 | | | | 920,168 | |
BB&T Corp. (a) | | | 14,465 | | | | 562,544 | |
Capital One Financial Corp. (a) | | | 11,297 | | | | 932,567 | |
Comerica, Inc. (a) | | | 3,605 | | | | 168,858 | |
Fifth Third Bancorp (a) | | | 16,722 | | | | 340,711 | |
Huntington Bancshares, Inc. (a) | | | 16,535 | | | | 173,948 | |
KeyCorp (a) | | | 17,621 | | | | 244,932 | |
M&T Bank Corp. (a) | | | 2,744 | | | | 344,701 | |
Northern Trust Corp. (a) | | | 4,577 | | | | 308,490 | |
The accompanying notes are an integral part of the financial statements.
101
MML Managed Volatility Fund – Portfolio of Investments (Continued)
| | | | | | | | |
| | | Number of
Shares | | | Value | |
PNC Financial Services Group, Inc. (a) | | | 10,798 | | | $ | 985,102 | |
Regions Financial Corp. (a) | | | 27,697 | | | | 292,480 | |
State Street Corp. (a) | | | 8,503 | | | | 667,485 | |
SunTrust Banks, Inc. (a) | | | 10,671 | | | | 447,115 | |
U.S. Bancorp (a) | | | 36,114 | | | | 1,623,324 | |
Wells Fargo & Co. (a) | | | 95,334 | | | | 5,226,210 | |
Zions Bancorp (a) | | | 4,029 | | | | 114,867 | |
| | | | | | | | |
| | | | | | | 17,127,702 | |
| | | | | | | | |
| Diversified Financial — 4.9% | |
Affiliated Managers Group, Inc. (a) (b) | | | 1,080 | | | | 229,219 | |
American Express Co. (a) | | | 18,088 | | | | 1,682,908 | |
Ameriprise Financial, Inc. (a) | | | 3,784 | | | | 500,434 | |
BlackRock, Inc. (a) | | | 2,510 | | | | 897,476 | |
The Charles Schwab Corp. (a) | | | 23,032 | | | | 695,336 | |
Citigroup, Inc. (a) | | | 60,841 | | | | 3,292,107 | |
CME Group, Inc. (a) | | | 6,308 | | | | 559,204 | |
Discover Financial Services (a) | | | 9,261 | | | | 606,503 | |
E*TRADE Financial Corp. (a) (b) | | | 5,824 | | | | 141,261 | |
Franklin Resources, Inc. (a) | | | 7,940 | | | | 439,638 | |
The Goldman Sachs Group, Inc. (a) | | | 8,233 | | | | 1,595,802 | |
IntercontinentalExchange, Inc. (a) | | | 2,396 | | | | 525,419 | |
Invesco Ltd. (a) | | | 8,691 | | | | 343,468 | |
JP Morgan Chase & Co. (a) | | | 75,507 | | | | 4,725,228 | |
Legg Mason, Inc. (a) | | | 2,134 | | | | 113,892 | |
Morgan Stanley (a) | | | 30,736 | | | | 1,192,557 | |
The NASDAQ OMX Group, Inc. (a) | | | 2,454 | | | | 117,694 | |
Navient Corp. (a) | | | 8,435 | | | | 182,280 | |
T. Rowe Price Group, Inc. (a) | | | 5,283 | | | | 453,598 | |
| | | | | | | | |
| | | | | | | 18,294,024 | |
| | | | | | | | |
| Insurance — 4.3% | |
ACE Ltd. (a) | | | 6,778 | | | | 778,657 | |
Aflac, Inc. (a) | | | 9,094 | | | | 555,552 | |
The Allstate Corp. (a) | | | 8,670 | | | | 609,068 | |
American International Group, Inc. (a) | | | 28,636 | | | | 1,603,902 | |
Aon PLC (a) | | | 5,803 | | | | 550,298 | |
Assurant, Inc. (a) | | | 1,426 | | | | 97,581 | |
Berkshire Hathaway, Inc. Class B (a) (b) | | | 36,554 | | | | 5,488,583 | |
The Chubb Corp. (a) | | | 4,848 | | | | 501,623 | |
Cincinnati Financial Corp. (a) | | | 2,979 | | | | 154,402 | |
Genworth Financial, Inc. Class A (a) (b) | | | 9,990 | | | | 84,915 | |
The Hartford Financial Services Group, Inc. (a) | | | 9,003 | | | | 375,335 | |
Lincoln National Corp. (a) | | | 5,203 | | | | 300,057 | |
Loews Corp. (a) | | | 6,089 | | | | 255,860 | |
Marsh & McLennan Cos., Inc. (a) | | | 10,826 | | | | 619,680 | |
MetLife, Inc. (a) | | | 22,564 | | | | 1,220,487 | |
Principal Financial Group, Inc. (a) | | | 5,510 | | | | 286,189 | |
| | | | | | | | |
| | | Number of
Shares | | | Value | |
The Progressive Corp. (a) | | | 10,820 | | | $ | 292,032 | |
Prudential Financial, Inc. (a) | | | 9,261 | | | | 837,750 | |
Torchmark Corp. (a) | | | 2,602 | | | | 140,950 | |
The Travelers Cos., Inc. (a) | | | 6,786 | | | | 718,298 | |
Unum Group (a) | | | 5,067 | | | | 176,737 | |
XL Group PLC (a) | | | 5,373 | | | | 184,670 | |
| | | | | | | | |
| | | | | | | 15,832,626 | |
| | | | | | | | |
| Real Estate — 0.1% | |
CBRE Group, Inc. (b) (a) | | | 5,623 | | | | 192,588 | |
| | | | | | | | |
| Real Estate Investment Trusts (REITS) — 2.3% | |
American Tower Corp. (a) | | | 7,905 | | | | 781,409 | |
Apartment Investment & Management Co. Class A (a) | | | 2,959 | | | | 109,927 | |
AvalonBay Communities, Inc. (a) | | | 2,636 | | | | 430,696 | |
Boston Properties, Inc. (a) | | | 3,104 | | | | 399,454 | |
Crown Castle International Corp. (a) | | | 6,696 | | | | 526,975 | |
Equity Residential (a) | | | 7,231 | | | | 519,475 | |
Essex Property Trust, Inc. (a) | | | 1,230 | | | | 254,118 | |
General Growth Properties, Inc. (a) | | | 12,623 | | | | 355,085 | |
HCP, Inc. (a) | | | 9,189 | | | | 404,592 | |
Health Care REIT, Inc. (a) | | | 6,494 | | | | 491,401 | |
Host Hotels & Resorts, Inc. (a) | | | 15,278 | | | | 363,158 | |
Kimco Realty Corp. (a) | | | 8,221 | | | | 206,676 | |
The Macerich Co. (a) | | | 2,935 | | | | 244,808 | |
Plum Creek Timber Co., Inc. (a) | | | 3,513 | | | | 150,321 | |
Prologis, Inc. (a) | | | 10,071 | | | | 433,355 | |
Public Storage (a) | | | 2,930 | | | | 541,611 | |
Simon Property Group, Inc. (a) | | | 6,200 | | | | 1,129,082 | |
Ventas, Inc. (a) | | | 5,858 | | | | 420,019 | |
Vornado Realty Trust (a) | | | 3,503 | | | | 412,338 | |
Weyerhaeuser Co. (a) | | | 10,632 | | | | 381,582 | |
| | | | | | | | |
| | | | | | | 8,556,082 | |
| | | | | | | | |
| Savings & Loans — 0.1% | |
Hudson City Bancorp, Inc. (a) | | | 9,664 | | | | 97,800 | |
People’s United Financial, Inc. | | | 6,193 | | | | 94,010 | |
| | | | | | | | |
| | | | | | | 191,810 | |
| | | | | | | | |
| | | | | | | 60,194,832 | |
| | | | | | | | |
| Industrial — 10.0% | |
| Aerospace & Defense — 2.0% | |
The Boeing Co. (a) | | | 13,449 | | | | 1,748,101 | |
General Dynamics Corp. (a) | | | 6,323 | | | | 870,171 | |
L-3 Communications Holdings, Inc. (a) | | | 1,784 | | | | 225,159 | |
Lockheed Martin Corp. (a) | | | 5,365 | | | | 1,033,138 | |
Northrop Grumman Corp. (a) | | | 4,300 | | | | 633,777 | |
Raytheon Co. (a) | | | 6,246 | | | | 675,630 | |
Rockwell Collins, Inc. (a) | | | 2,731 | | | | 230,715 | |
United Technologies Corp. (a) | | | 17,072 | | | | 1,963,280 | |
| | | | | | | | |
| | | | | | | 7,379,971 | |
| | | | | | | | |
The accompanying notes are an integral part of the financial statements.
102
MML Managed Volatility Fund – Portfolio of Investments (Continued)
| | | | | | | | |
| | | Number of
Shares | | | Value | |
| Building Materials — 0.1% | |
Martin Marietta Materials, Inc. (a) | | | 1,190 | | | $ | 131,281 | |
Masco Corp. (a) | | | 7,179 | | | | 180,911 | |
| | | | | | | | |
| | | | | | | 312,192 | |
| | | | | | | | |
| Electrical Components & Equipment — 0.3% | |
AMETEK, Inc. (a) | | | 4,962 | | | | 261,150 | |
Emerson Electric Co. (a) | | | 14,012 | | | | 864,961 | |
| | | | | | | | |
| | | | | | | 1,126,111 | |
| | | | | | | | |
| Electronics — 0.6% | |
Agilent Technologies, Inc. (a) | | | 6,681 | | | | 273,520 | |
Allegion PLC (a) | | | 1,903 | | | | 105,540 | |
Amphenol Corp. Class A (a) | | | 6,276 | | | | 337,711 | |
FLIR Systems, Inc. | | | 2,860 | | | | 92,407 | |
Garmin Ltd. (a) | | | 2,455 | | | | 129,698 | |
PerkinElmer, Inc. (a) | | | 2,259 | | | | 98,786 | |
TE Connectivity Ltd. (a) | | | 8,181 | | | | 517,448 | |
Tyco International PLC (a) | | | 8,853 | | | | 388,293 | |
Waters Corp. (a) (b) | | | 1,706 | | | | 192,300 | |
| | | | | | | | |
| | | | | | | 2,135,703 | |
| | | | | | | | |
| Engineering & Construction — 0.1% | |
Fluor Corp. (a) | | | 3,127 | | | | 189,590 | |
Jacobs Engineering Group, Inc. (a) (b) | | | 2,664 | | | | 119,054 | |
| | | | | | | | |
| | | | | | | 308,644 | |
| | | | | | | | |
| Environmental Controls — 0.2% | |
Republic Services, Inc. (a) | | | 5,079 | | | | 204,430 | |
Stericycle, Inc. (a) (b) | | | 1,704 | | | | 223,360 | |
Waste Management, Inc. (a) | | | 8,746 | | | | 448,845 | |
| | | | | | | | |
| | | | | | | 876,635 | |
| | | | | | | | |
| Hand & Machine Tools — 0.1% | |
Snap-on, Inc. (a) | | | 1,136 | | | | 155,337 | |
Stanley Black & Decker, Inc. (a) | | | 3,166 | | | | 304,189 | |
| | | | | | | | |
| | | | | | | 459,526 | |
| | | | | | | | |
| Machinery – Construction & Mining — 0.4% | |
Caterpillar, Inc. (a) | | | 12,566 | | | | 1,150,166 | |
Ingersoll-Rand PLC (a) | | | 5,380 | | | | 341,038 | |
Joy Global, Inc. (a) | | | 2,076 | | | | 96,576 | |
| | | | | | | | |
| | | | | | | 1,587,780 | |
| | | | | | | | |
| Machinery – Diversified — 0.6% | |
Cummins, Inc. (a) | | | 3,387 | | | | 488,304 | |
Deere & Co. (a) | | | 7,234 | | | | 639,992 | |
Flowserve Corp. (a) | | | 2,770 | | | | 165,729 | |
Rockwell Automation, Inc. (a) | | | 2,789 | | | | 310,137 | |
Roper Industries, Inc. (a) | | | 1,970 | | | | 308,010 | |
Xylem, Inc. (a) | | | 3,707 | | | | 141,125 | |
| | | | | | | | |
| | | | | | | 2,053,297 | |
| | | | | | | | |
| Manufacturing — 3.4% | |
3M Co. (a) | | | 13,010 | | | | 2,137,803 | |
Danaher Corp. (a) | | | 12,232 | | | | 1,048,405 | |
| | | | | | | | |
| | | Number of
Shares | | | Value | |
Dover Corp. (a) | | | 3,383 | | | $ | 242,629 | |
Eaton Corp. PLC (a) | | | 9,579 | | | | 650,989 | |
General Electric Co. (a) | | | 201,251 | | | | 5,085,613 | |
Honeywell International, Inc. (a) | | | 15,787 | | | | 1,577,437 | |
Illinois Tool Works, Inc. (a) | | | 7,363 | | | | 697,276 | |
Leggett & Platt, Inc. (a) | | | 2,894 | | | | 123,313 | |
Pall Corp. (a) | | | 2,177 | | | | 220,334 | |
Parker Hannifin Corp. (a) | | | 3,014 | | | | 388,655 | |
Pentair PLC (a) | | | 3,890 | | | | 258,374 | |
Textron, Inc. (a) | | | 5,631 | | | | 237,121 | |
| | | | | | | | |
| | | | | | | 12,667,949 | |
| | | | | | | | |
| Metal Fabricate & Hardware — 0.2% | |
Precision Castparts Corp. (a) | | | 2,829 | | | | 681,449 | |
| | | | | | | | |
| Packaging & Containers — 0.1% | |
Ball Corp. (a) | | | 2,811 | | | | 191,626 | |
Owens-Illinois, Inc. (a) (b) | | | 3,260 | | | | 87,987 | |
Sealed Air Corp. (a) | | | 4,277 | | | | 181,473 | |
| | | | | | | | |
| | | | | | | 461,086 | |
| | | | | | | | |
| Transportation — 1.9% | |
American ExpressNorfolk Southern Corp. (a) | | | 6,181 | | | | 677,499 | |
C.H. Robinson Worldwide, Inc. (a) | | | 2,907 | | | | 217,705 | |
CSX Corp. (a) | | | 20,044 | | | | 726,194 | |
Expeditors International of Washington, Inc. (a) | | | 3,946 | | | | 176,031 | |
FedEx Corp. (a) | | | 5,297 | | | | 919,877 | |
Kansas City Southern (a) | | | 2,299 | | | | 280,547 | |
Ryder System, Inc. | | | 1,030 | | | | 95,636 | |
Union Pacific Corp. (a) | | | 17,996 | | | | 2,143,864 | |
United Parcel Service, Inc. Class B (a) | | | 14,071 | | | | 1,564,273 | |
| | | | | | | | |
| | | | | | | 6,801,626 | |
| | | | | | | | |
| | | | | | | 36,851,969 | |
| | | | | | | | |
| Technology — 12.8% | |
| Computers — 6.2% | |
Accenture PLC Class A (a) | | | 12,647 | | | | 1,129,504 | |
Apple, Inc. (a) | | | 120,158 | | | | 13,263,040 | |
Cognizant Technology Solutions Corp. Class A (a) (b) | | | 12,226 | | | | 643,821 | |
Computer Sciences Corp. (a) | | | 2,926 | | | | 184,484 | |
EMC Corp. (a) | | | 40,695 | | | | 1,210,269 | |
Hewlett-Packard Co. (a) | | | 37,412 | | | | 1,501,344 | |
International Business Machines Corp. (a) | | | 18,660 | | | | 2,993,810 | |
NetApp, Inc. (a) | | | 6,438 | | | | 266,855 | |
SanDisk Corp. (a) | | | 4,454 | | | | 436,403 | |
Seagate Technology PLC (a) | | | 6,537 | | | | 434,711 | |
Teradata Corp. (a) (b) | | | 3,148 | | | | 137,505 | |
Western Digital Corp. (a) | | | 4,443 | | | | 491,840 | |
| | | | | | | | |
| | | | | | | 22,693,586 | |
| | | | | | | | |
The accompanying notes are an integral part of the financial statements.
103
MML Managed Volatility Fund – Portfolio of Investments (Continued)
| | | | | | | | |
| | | Number of
Shares | | | Value | |
| Office Equipment/Supplies — 0.1% | |
Pitney Bowes, Inc. (a) | | | 4,057 | | | $ | 98,869 | |
Xerox Corp. (a) | | | 21,710 | | | | 300,901 | |
| | | | | | | | |
| | | | | | | 399,770 | |
| | | | | | | | |
| Semiconductors — 2.4% | |
Altera Corp. (a) | | | 6,158 | | | | 227,477 | |
Analog Devices, Inc. (a) | | | 6,270 | | | | 348,110 | |
Applied Materials, Inc. (a) | | | 24,413 | | | | 608,372 | |
Avago Technologies Ltd. (a) | | | 5,000 | | | | 502,950 | |
Broadcom Corp. Class A (a) | | | 10,761 | | | | 466,274 | |
Intel Corp. (a) | | | 99,314 | | | | 3,604,105 | |
KLA-Tencor Corp. (a) | | | 3,272 | | | | 230,087 | |
Lam Research Corp. (a) | | | 3,394 | | | | 269,280 | |
Linear Technology Corp. (a) | | | 4,777 | | | | 217,831 | |
Microchip Technology, Inc. (a) | | | 4,007 | | | | 180,756 | |
Micron Technology, Inc. (a) (b) | | | 21,437 | | | | 750,509 | |
NVIDIA Corp. (a) | | | 10,305 | | | | 206,615 | |
Texas Instruments, Inc. (a) | | | 21,431 | | | | 1,145,809 | |
Xilinx, Inc. (a) | | | 5,415 | | | | 234,415 | |
| | | | | | | | |
| | | | | | | 8,992,590 | |
| | | | | | | | |
| Software — 4.1% | |
Adobe Systems, Inc. (a) (b) | | | 9,487 | | | | 689,705 | |
Autodesk, Inc. (a) (b) | | | 4,590 | | | | 275,675 | |
CA, Inc. (a) | | | 6,380 | | | | 194,271 | |
Cerner Corp. (a) (b) | | | 6,073 | | | | 392,680 | |
Citrix Systems, Inc. (a) (b) | | | 3,333 | | | | 212,645 | |
The Dun & Bradstreet Corp. | | | 683 | | | | 82,616 | |
Electronic Arts, Inc. (a) (b) | | | 6,284 | | | | 295,442 | |
Fidelity National Information Services, Inc. (a) | | | 5,717 | | | | 355,597 | |
Fiserv, Inc. (a) (b) | | | 5,043 | | | | 357,902 | |
Intuit, Inc. (a) | | | 5,731 | | | | 528,341 | |
Microsoft Corp. (a) | | | 165,306 | | | | 7,678,464 | |
Oracle Corp. (a) | | | 65,244 | | | | 2,934,023 | |
Red Hat, Inc. (a) (b) | | | 3,775 | | | | 261,003 | |
Salesforce.com, Inc. (a) (b) | | | 11,548 | | | | 684,912 | |
| | | | | | | | |
| | | | | | | 14,943,276 | |
| | | | | | | | |
| | | | | | | 47,029,222 | |
| | | | | | | | |
| Utilities — 3.2% | |
| Electric — 3.0% | |
The AES Corp. (a) | | | 13,324 | | | | 183,472 | |
Ameren Corp. (a) | | | 4,903 | | | | 226,175 | |
American Electric Power Co., Inc. (a) | | | 9,824 | | | | 596,513 | |
CenterPoint Energy, Inc. (a) | | | 8,581 | | | | 201,053 | |
CMS Energy Corp. (a) | | | 5,523 | | | | 191,924 | |
Consolidated Edison, Inc. (a) | | | 5,921 | | | | 390,845 | |
Dominion Resources, Inc. (a) | | | 11,710 | | | | 900,499 | |
DTE Energy Co. (a) | | | 3,511 | | | | 303,245 | |
Duke Energy Corp. (a) | | | 14,230 | | | | 1,188,774 | |
Edison International (a) | | | 6,522 | | | | 427,061 | |
Entergy Corp. (a) | | | 3,562 | | | | 311,604 | |
| | | | | | | | |
| | | Number of
Shares | | | Value | |
Exelon Corp. (a) | | | 17,196 | | | $ | 637,628 | |
FirstEnergy Corp. (a) | | | 8,418 | | | | 328,218 | |
Integrys Energy Group, Inc. (a) | | | 1,653 | | | | 128,686 | |
NextEra Energy, Inc. (a) | | | 8,619 | | | | 916,114 | |
Northeast Utilities (a) | | | 6,316 | | | | 338,032 | |
NRG Energy, Inc. (a) | | | 6,770 | | | | 182,452 | |
Pepco Holdings, Inc. (a) | | | 5,081 | | | | 136,831 | |
PG&E Corp. (a) | | | 9,424 | | | | 501,734 | |
Pinnacle West Capital Corp. (a) | | | 2,197 | | | | 150,077 | |
PPL Corp. (a) | | | 13,322 | | | | 483,988 | |
Public Service Enterprise Group, Inc. (a) | | | 10,198 | | | | 422,299 | |
SCANA Corp. (a) | | | 2,855 | | | | 172,442 | |
The Southern Co. (a) | | | 17,977 | | | | 882,850 | |
TECO Energy, Inc. | | | 4,698 | | | | 96,262 | |
Wisconsin Energy Corp. (a) | | | 4,492 | | | | 236,908 | |
Xcel Energy, Inc. (a) | | | 10,116 | | | | 363,367 | |
| | | | | | | | |
| | | | | | | 10,899,053 | |
| | | | | | | | |
| Gas — 0.2% | | | | | | | | |
AGL Resources, Inc. (a) | | | 2,387 | | | | 130,115 | |
NiSource, Inc. (a) | | | 6,291 | | | | 266,864 | |
Sempra Energy (a) | | | 4,593 | | | | 511,477 | |
| | | | | | | | |
| | | | | | | 908,456 | |
| | | | | | | | |
| | | | | | | 11,807,509 | |
| | | | | | | | |
| | |
TOTAL COMMON STOCK
(Cost $300,008,069) | | | | | | | 368,102,666 | |
| | | | | | | | |
| | |
TOTAL EQUITIES
(Cost $300,008,069) | | | | | | | 368,102,666 | |
| | | | | | | | |
| | |
| | | Principal
Amount | | | | |
| BONDS & NOTES — 0.0% | | | | | | | | |
| | |
| CORPORATE DEBT — 0.0% | | | | | | | | |
| Forest Products & Paper — 0.0% | |
Sino Forest Corp. (c)
5.000% 8/01/49 | | $ | 359,000 | | | | - | |
| | | | | | | | |
| | |
TOTAL CORPORATE DEBT
(Cost $0) | | | | | | | - | |
| | | | | | | | |
| | |
TOTAL BONDS & NOTES
(Cost $0) | | | | | | | - | |
| | | | | | | | |
| | |
| | | Units | | | | |
| PURCHASED OPTIONS — 0.4% | | | | | | | | |
| | |
| Financial — 0.4% | | | | | | | | |
| Diversified Financial — 0.4% | | | | | | | | |
S&P 500 Index, Put, Expires 1/17/15, Strike 1,800.00 | | | 309 | | | | 61,491 | |
The accompanying notes are an integral part of the financial statements.
104
MML Managed Volatility Fund – Portfolio of Investments (Continued)
| | | | | | | | |
| | | Units | | | Value | |
S&P 500 Index, Put, Expires 1/17/15, Strike 1,875.00 | | | 288 | | | $ | 93,600 | |
S&P 500 Index, Put, Expires 1/17/15, Strike 1,950.00 | | | 169 | | | | 101,400 | |
S&P 500 Index, Put, Expires 2/20/15, Strike 1,825.00 | | | 421 | | | | 399,950 | |
S&P 500 Index, Put, Expires 2/20/15, Strike 1,850.00 | | | 297 | | | | 313,335 | |
S&P 500 Index, Put, Expires 3/20/15, Strike 1,825.00 | | | 295 | | | | 477,900 | |
| | | | | | | | |
| | | | | | | 1,447,676 | |
| | | | | | | | |
| | |
| TOTAL PURCHASED OPTIONS (Cost $2,365,301) | | | | | | | 1,447,676 | |
| | | | | | | | |
| | |
TOTAL LONG-TERM INVESTMENTS
(Cost $302,373,370) | | | | | | | 369,550,342 | |
| | | | | | | | |
| | |
| | | Principal
Amount | | | | |
| SHORT-TERM INVESTMENTS — 1.2% | |
| Repurchase Agreement — 1.2% | | | | | | | | |
State Street Bank & Trust Co. Repurchase Agreement, dated 12/31/14, 0.010%, due 1/02/15 (d) | | $ | 4,451,588 | | | | 4,451,588 | |
| | | | | | | | |
| Time Deposits — 0.0% | | | | | | | | |
Euro Time Deposit
0.010% 1/02/15 | | | 2,205 | | | | 2,205 | |
| | | | | | | | |
| | |
TOTAL SHORT-TERM
INVESTMENTS
(Cost $4,453,793) | | | | | | | 4,453,793 | |
| | | | | | | | |
| | |
TOTAL INVESTMENTS — 101.4%
(Cost $306,827,163) (e) | | | | | | | 374,004,135 | |
| | |
| Other Assets/(Liabilities) — (1.4)% | | | | | | | (5,261,584 | ) |
| | | | | | | | |
| | |
| NET ASSETS — 100.0% | | | | | | $ | 368,742,551 | |
| | | | | | | | |
Notes to Portfolio of Investments
Percentages are stated as a percent of net assets.
| (a) | All or a portion of these securities are held as collateral for written options. (Note 2). |
| (b) | Non-income producing security. |
| (c) | This security is fair valued in good faith in accordance with procedures approved by the Board of Trustees. At December 31, 2014, these securities amounted to a value of $0 or 0.00% of net assets. |
| (d) | Maturity value of $4,451,590. Collateralized by U.S. Government Agency obligations with a rate of 2.500%, maturity date of 3/20/28, and an aggregate market value, including accrued interest, of $4,544,882. |
| (e) | See Note 6 for aggregate cost for federal tax purposes. |
The accompanying notes are an integral part of the financial statements.
105
MML Mid Cap Growth Fund – Portfolio of Investments
December 31, 2014
| | | | | | | | |
| | | Number of
Shares | | | Value | |
| EQUITIES — 96.0% | | | | | | | | |
| | |
| COMMON STOCK — 95.6% | | | | | | | | |
| Basic Materials — 2.1% | | | | | | | | |
| Chemicals — 1.0% | | | | | | | | |
Celanese Corp. Series A | | | 35,000 | | | $ | 2,098,601 | |
RPM International, Inc. | | | 50,000 | | | | 2,535,500 | |
| | | | | | | | |
| | | | | | | 4,634,101 | |
| | | | | | | | |
| Mining — 1.1% | | | | | | | | |
Franco-Nevada Corp. (a) | | | 80,000 | | | | 3,939,404 | |
Silver Wheaton Corp. | | | 36,000 | | | | 731,880 | |
| | | | | | | | |
| | | | | | | 4,671,284 | |
| | | | | | | | |
| | | | | | | 9,305,385 | |
| | | | | | | | |
| Communications — 8.4% | | | | | | | | |
| Internet — 3.5% | | | | | | | | |
Akamai Technologies, Inc. (b) | | | 27,000 | | | | 1,699,920 | |
Coupons.com, Inc. (a) (b) | | | 59,000 | | | | 1,047,250 | |
Dropbox, Inc. (b) (c) | | | 9,011 | | | | 172,121 | |
GrubHub, Inc. (b) | | | 21,000 | | | | 762,720 | |
LinkedIn Corp. Class A (b) | | | 4,000 | | | | 918,840 | |
Netflix, Inc. (b) | | | 4,000 | | | | 1,366,440 | |
Rackspace Hosting, Inc. (b) | | | 57,000 | | | | 2,668,170 | |
TripAdvisor, Inc. (b) | | | 16,000 | | | | 1,194,560 | |
VeriSign, Inc. (b) | | | 89,000 | | | | 5,073,000 | |
| | | | | | | | |
| | | | | | | 14,903,021 | |
| | | | | | | | |
| Media — 1.2% | | | | | | | | |
Charter Communications, Inc. Class A (b) | | | 6,000 | | | | 999,720 | |
FactSet Research Systems, Inc. (a) | | | 31,000 | | | | 4,363,250 | |
| | | | | | | | |
| | | | | | | 5,362,970 | |
| | | | | | | | |
| Telecommunications — 3.7% | | | | | | | | |
DigitalGlobe, Inc. (b) | | | 97,000 | | | | 3,004,090 | |
JDS Uniphase Corp. (b) | | | 247,000 | | | | 3,388,840 | |
Motorola Solutions, Inc. | | | 85,000 | | | | 5,701,800 | |
Palo Alto Networks, Inc. (b) | | | 6,000 | | | | 735,420 | |
T-Mobile US, Inc. (b) | | | 124,000 | | | | 3,340,560 | |
| | | | | | | | |
| | | | | | | 16,170,710 | |
| | | | | | | | |
| | | | | | | 36,436,701 | |
| | | | | | | | |
| Consumer, Cyclical — 14.8% | | | | | | | | |
| Apparel — 0.4% | | | | | | | | |
Wolverine World Wide, Inc. | | | 62,000 | | | | 1,827,140 | |
| | | | | | | | |
| Auto Manufacturers — 0.4% | | | | | | | | |
Tesla Motors, Inc. (a) (b) | | | 7,000 | | | | 1,556,870 | |
| | | | | | | | |
| Automotive & Parts — 0.5% | | | | | | | | |
WABCO Holdings, Inc. (b) | | | 22,000 | | | | 2,305,160 | |
| | | | | | | | |
| Distribution & Wholesale — 0.9% | | | | | | | | |
Fastenal Co. (a) | | | 80,000 | | | | 3,804,800 | |
| | | | | | | | |
| | | | | | | | |
| | | Number of
Shares | | | Value | |
| Home Furnishing — 0.4% | | | | | | | | |
Harman International Industries, Inc. | | | 18,000 | | | $ | 1,920,780 | |
| | | | | | | | |
| Leisure Time — 2.2% | | | | | | | | |
Harley-Davidson, Inc. | | | 48,000 | | | | 3,163,680 | |
Norwegian Cruise Line Holdings Ltd. (b) | | | 135,000 | | | | 6,312,600 | |
| | | | | | | | |
| | | | | | | 9,476,280 | |
| | | | | | | | |
| Lodging — 1.6% | | | | | | | | |
Choice Hotels International, Inc. | | | 53,000 | | | | 2,969,060 | |
Marriott International, Inc. Class A | | | 48,000 | | | | 3,745,440 | |
| | | | | | | | |
| | | | | | | 6,714,500 | |
| | | | | | | | |
| Retail — 8.4% | | | | | | | | |
AutoZone, Inc. (b) | | | 9,000 | | | | 5,571,990 | |
CarMax, Inc. (b) | | | 133,000 | | | | 8,855,140 | |
Chipotle Mexican Grill, Inc. (b) | | | 2,000 | | | | 1,369,020 | |
Dollar General Corp. (b) | | | 40,000 | | | | 2,828,000 | |
Five Below, Inc. (b) | | | 13,000 | | | | 530,790 | |
Hanesbrands, Inc. | | | 27,000 | | | | 3,013,740 | |
L Brands, Inc. | | | 40,000 | | | | 3,462,000 | |
The Michaels Cos., Inc. (b) | | | 48,000 | | | | 1,187,040 | |
O’Reilly Automotive, Inc. (b) | | | 31,000 | | | | 5,971,220 | |
Rite Aid Corp. (b) | | | 496,000 | | | | 3,729,920 | |
| | | | | | | | |
| | | | | | | 36,518,860 | |
| | | | | | | | |
| | | | | | | 64,124,390 | |
| | | | | | | | |
| Consumer, Non-cyclical — 27.6% | | | | | | | | |
| Biotechnology — 2.8% | | | | | | | | |
Alkermes PLC (b) | | | 93,000 | | | | 5,446,080 | |
Illumina, Inc. (b) | | | 11,000 | | | | 2,030,380 | |
Incyte Corp. (b) | | | 35,000 | | | | 2,558,850 | |
Vertex Pharmaceuticals, Inc. (b) | | | 18,000 | | | | 2,138,400 | |
| | | | | | | | |
| | | | | | | 12,173,710 | |
| | | | | | | | |
| Commercial Services — 7.5% | | | | | | | | |
Aramark | | | 56,000 | | | | 1,744,400 | |
CoreLogic, Inc. (b) | | | 106,000 | | | | 3,348,540 | |
Equifax, Inc. | | | 53,000 | | | | 4,286,110 | |
Gartner, Inc. (b) | | | 57,000 | | | | 4,799,970 | |
Global Payments, Inc. | | | 53,000 | | | | 4,278,690 | |
Hertz Global Holdings, Inc. (b) | | | 35,000 | | | | 872,900 | |
Manpower, Inc. | | | 42,000 | | | | 2,863,140 | |
Quanta Services, Inc. (b) | | | 27,000 | | | | 766,530 | |
Towers Watson & Co. Class A | | | 17,000 | | | | 1,923,890 | |
Vantiv, Inc. Class A (b) | | | 108,000 | | | | 3,663,360 | |
Verisk Analytics, Inc. Class A (b) | | | 62,000 | | | | 3,971,100 | |
Wework Cos., Inc. Class A (b) (c) | | | 4,466 | | | | 74,364 | |
| | | | | | | | |
| | | | | | | 32,592,994 | |
| | | | | | | | |
| Foods — 2.7% | |
Sprouts Farmers Market, Inc. (b) | | | 88,000 | | | | 2,990,240 | |
TreeHouse Foods, Inc. (b) | | | 27,000 | | | | 2,309,310 | |
The accompanying notes are an integral part of the financial statements.
106
MML Mid Cap Growth Fund – Portfolio of Investments (Continued)
| | | | | | | | |
| | | Number of
Shares | | | Value | |
WhiteWave Foods Co. (b) | | | 124,000 | | | $ | 4,338,760 | |
Whole Foods Market, Inc. | | | 44,000 | | | | 2,218,480 | |
| | | | | | | | |
| | | | | | | 11,856,790 | |
| | | | | | | | |
| Health Care – Products — 7.0% | |
Bruker Corp. (b) | | | 159,000 | | | | 3,119,580 | |
CareFusion Corp. (b) | | | 115,000 | | | | 6,824,100 | |
The Cooper Cos., Inc. | | | 33,000 | | | | 5,348,970 | |
Henry Schein, Inc. (b) | | | 35,000 | | | | 4,765,250 | |
IDEXX Laboratories, Inc. (b) | | | 26,000 | | | | 3,855,020 | |
Intuitive Surgical, Inc. (b) | | | 12,000 | | | | 6,347,280 | |
| | | | | | | | |
| | | | | | | 30,260,200 | |
| | | | | | | | |
| Health Care – Services — 3.5% | |
Catalent, Inc. (b) | | | 90,000 | | | | 2,509,200 | |
Covance, Inc. (b) | | | 35,000 | | | | 3,634,400 | |
Envision Healthcare Holdings, Inc. (b) | | | 60,000 | | | | 2,081,400 | |
MEDNAX, Inc. (b) | | | 44,000 | | | | 2,908,840 | |
Universal Health Services, Inc. Class B | | | 35,000 | | | | 3,894,100 | |
| | | | | | | | |
| | | | | | | 15,027,940 | |
| | | | | | | | |
| Pharmaceuticals — 4.1% | |
Align Technology, Inc. (b) | | | 19,000 | | | | 1,062,290 | |
Alnylam Pharmaceuticals, Inc. (b) | | | 9,000 | | | | 873,000 | |
Cubist Pharmaceuticals, Inc. (a) (b) | | | 5,000 | | | | 503,250 | |
DENTSPLY International, Inc. | | | 123,000 | | | | 6,552,210 | |
Hospira, Inc. (b) | | | 89,000 | | | | 5,451,250 | |
Pharmacyclics, Inc. (b) | | | 13,000 | | | | 1,589,380 | |
Sirona Dental Systems, Inc. (b) | | | 18,000 | | | | 1,572,660 | |
| | | | | | | | |
| | | | | | | 17,604,040 | |
| | | | | | | | |
| | | | | | | 119,515,674 | |
| | | | | | | | |
| Energy — 3.6% | |
| Coal — 0.5% | |
CONSOL Energy, Inc. | | | 66,000 | | | | 2,231,460 | |
| | | | | | | | |
| Oil & Gas — 3.1% | |
Concho Resources, Inc. (b) | | | 27,000 | | | | 2,693,250 | |
EQT Corp. | | | 62,000 | | | | 4,693,400 | |
Pioneer Natural Resources Co. | | | 14,000 | | | | 2,083,900 | |
Range Resources Corp. | | | 71,000 | | | | 3,794,950 | |
| | | | | | | | |
| | | | | | | 15,496,960 | |
| | | | | | | | |
| Financial — 8.8% | |
| Diversified Financial — 5.2% | |
CBOE Holdings, Inc. | | | 71,000 | | | | 4,502,820 | |
FNF Group | | | 177,000 | | | | 6,097,650 | |
IntercontinentalExchange, Inc. | | | 19,000 | | | | 4,166,510 | |
LendingClub Corp. (b) | | | 18,000 | | | | 455,400 | |
LPL Financial Holdings, Inc. | | | 62,000 | | | | 2,762,100 | |
TD Ameritrade Holding Corp. | | | 124,000 | | | | 4,436,720 | |
| | | | | | | | |
| | | | | | | 22,421,200 | |
| | | | | | | | |
| | | | | | | | |
| | | Number of
Shares | | | Value | |
| Insurance — 2.3% | |
HCC Insurance Holdings, Inc. | | | 71,000 | | | $ | 3,799,920 | |
The Progressive Corp. | | | 133,000 | | | | 3,589,670 | |
Willis Group Holdings PLC | | | 62,000 | | | | 2,778,220 | |
| | | | | | | | |
| | | | | | | 10,167,810 | |
| | | | | | | | |
| Real Estate — 1.1% | |
Jones Lang LaSalle, Inc. | | | 31,000 | | | | 4,647,830 | |
| | | | | | | | |
| Real Estate Investment Trusts (REITS) — 0.2% | |
Zillow, Inc. Class A (a) (b) | | | 8,000 | | | | 847,120 | |
| | | | | | | | |
| | | | | | | 38,083,960 | |
| | | | | | | | |
| Industrial — 19.8% | |
| Building Materials — 0.6% | |
Martin Marietta Materials, Inc. | | | 23,000 | | | | 2,537,360 | |
| | | | | | | | |
| Electrical Components & Equipment — 2.3% | |
AMETEK, Inc. | | | 89,000 | | | | 4,684,070 | |
The Babcock & Wilcox Co. | | | 138,000 | | | | 4,181,400 | |
Mobileye NV (a) (b) | | | 27,000 | | | | 1,095,120 | |
| | | | | | | | |
| | | | | | | 9,960,590 | |
| | | | | | | | |
| Electronics — 4.3% | |
Agilent Technologies, Inc. | | | 124,000 | | | | 5,076,560 | |
FEI Co. | | | 31,000 | | | | 2,800,850 | |
Keysight Technologies, Inc. (b) | | | 88,000 | | | | 2,971,760 | |
Mettler-Toledo International, Inc. (b) | | | 4,000 | | | | 1,209,840 | |
Sensata Technologies Holding NV (b) | | | 97,000 | | | | 5,083,770 | |
Trimble Navigation Ltd. (b) | | | 61,000 | | | | 1,618,940 | |
| | | | | | | | |
| | | | | | | 18,761,720 | |
| | | | | | | | |
| Machinery – Diversified — 3.7% | |
Cognex Corp. (b) | | | 9,000 | | | | 371,970 | |
IDEX Corp. | | | 80,000 | | | | 6,227,200 | |
Nordson Corp. | | | 17,000 | | | | 1,325,320 | |
Roper Industries, Inc. | | | 35,000 | | | | 5,472,250 | |
Xylem, Inc. | | | 66,000 | | | | 2,512,620 | |
| | | | | | | | |
| | | | | | | 15,909,360 | |
| | | | | | | | |
| Manufacturing — 6.1% | |
Acuity Brands, Inc. | | | 27,000 | | | | 3,781,890 | |
Colfax Corp. (b) | | | 58,000 | | | | 2,991,060 | |
Pall Corp. | | | 74,000 | | | | 7,489,540 | |
Teleflex, Inc. | | | 43,000 | | | | 4,937,260 | |
Textron, Inc. | | | 177,000 | | | | 7,453,470 | |
| | | | | | | | |
| | | | | | | 26,653,220 | |
| | | | | | | | |
| Metal Fabricate & Hardware — 0.6% | |
Rexnord Corp. (b) | | | 97,000 | | | | 2,736,370 | |
| | | | | | | | |
| Packaging & Containers — 0.6% | |
Ball Corp. | | | 35,000 | | | | 2,385,950 | |
| | | | | | | | |
The accompanying notes are an integral part of the financial statements.
107
MML Mid Cap Growth Fund – Portfolio of Investments (Continued)
| | | | | | | | |
| | | Number of
Shares | | | Value | |
| Transportation — 1.6% | |
J.B. Hunt Transport Services, Inc. | | | 44,000 | | | $ | 3,707,000 | |
Kansas City Southern | | | 28,000 | | | | 3,416,840 | |
| | | | | | | | |
| | | | | | | 7,123,840 | |
| | | | | | | | |
| | | | | | | 86,068,410 | |
| | | | | | | | |
| Technology — 10.4% | |
| Computers — 1.6% | |
IHS, Inc. Class A (b) | | | 57,000 | | | | 6,491,160 | |
Stratasys Ltd. (a) (b) | | | 4,000 | | | | 332,440 | |
| | | | | | | | |
| | | | | | | 6,823,600 | |
| | | | | | | | |
| Semiconductors — 2.9% | |
Altera Corp. | | | 177,000 | | | | 6,538,380 | |
Atmel Corp. (b) | | | 265,000 | | | | 2,224,675 | |
Microchip Technology, Inc. | | | 35,000 | | | | 1,578,850 | |
Xilinx, Inc. | | | 49,000 | | | | 2,121,210 | |
| | | | | | | | |
| | | | | | | 12,463,115 | |
| | | | | | | | |
| Software — 5.9% | |
Atlassian Corp. Depository Receipt (c) | | | 15,775 | | | | 299,725 | |
Atlassian Corp. PLC A Depository Receipt (c) | | | 5,668 | | | | 107,692 | |
Atlassian Corp. PLC Series 1 Depository Receipt (c) | | | 12,075 | | | | 229,425 | |
Atlassian Ser 1 Restricted Depository Receipt (c) | | | 5,892 | | | | 111,948 | |
Atlassian Series A Preference Depository Receipt (c) | | | 11,666 | | | | 221,654 | |
Fidelity National Information Services, Inc. | | | 44,000 | | | | 2,736,800 | |
Fiserv, Inc. (b) | | | 124,000 | | | | 8,800,280 | |
Guidewire Software, Inc. (b) | | | 6,000 | | | | 303,780 | |
IMS Health Holdings, Inc. (b) | | | 25,000 | | | | 641,000 | |
MSCI, Inc. | | | 75,000 | | | | 3,558,000 | |
Red Hat, Inc. (b) | | | 93,000 | | | | 6,430,020 | |
Servicenow, Inc. (b) | | | 18,000 | | | | 1,221,300 | |
Veeva Systems, Inc. Class A (a) (b) | | | 18,000 | | | | 475,380 | |
Workday, Inc. Class A (b) | | | 6,000 | | | | 489,660 | |
| | | | | | | | |
| | | | | | | 25,626,664 | |
| | | | | | | | |
| | | | | | | 44,913,379 | |
| | | | | | | | |
| Utilities — 0.1% | | | | | | | | |
| Electric — 0.1% | | | | | | | | |
Calpine Corp. (b) | | | 18,000 | | | | 398,340 | |
| | | | | | | | |
| | |
TOTAL COMMON STOCK
(Cost $263,159,620) | | | | | | | 414,343,199 | |
| | | | | | | | |
| | |
| PREFERRED STOCK — 0.4% | | | | | | | | |
| Communications — 0.3% | | | | | | | | |
| Internet — 0.3% | | | | | |
Dropbox, Inc. Series A (b) (c) | | | 11,190 | | | | 213,742 | |
| | | | | | | | |
| | | Number of
Shares | | | Value | |
Dropbox, Inc. Series A 1 (b) (c) | | | 54,965 | | | $ | 1,049,897 | |
Living Social (b) (c) | | | 158,890 | | | | 38,134 | |
| | | | | | | | |
| | | | | | | 1,301,773 | |
| | | | | | | | |
| Consumer, Non-cyclical — 0.1% | | | | | | | | |
| Commercial Services — 0.1% | | | | | | | | |
Wework, Inc. Series D 2 (b) (c) | | | 17,440 | | | | 290,396 | |
Wework, Inc. Series D 1 (b) (c) | | | 22,197 | | | | 369,606 | |
| | | | | | | | |
| | | | | | | 660,002 | |
| | | | | | | | |
| | |
TOTAL PREFERRED STOCK
(Cost $2,156,533) | | | | | | | 1,961,775 | |
| | | | | | | | |
| | |
TOTAL EQUITIES
(Cost $265,316,153) | | | | | | | 416,304,974 | |
| | | | | | | | |
| | |
| MUTUAL FUNDS — 4.1% | | | | | | | | |
| Diversified Financial — 4.1% | | | | | | | | |
State Street Navigator Securities Lending Prime Portfolio (d) | | | 17,417,369 | | | | 17,417,369 | |
T. Rowe Price Government Reserve Investment Fund | | | 199,037 | | | | 199,037 | |
| | | | | | | | |
| | | | | | | 17,616,406 | |
| | | | | | | | |
| | |
TOTAL MUTUAL FUNDS
(Cost $17,616,406) | | | | | | | 17,616,406 | |
| | | | | | | | |
| | |
TOTAL LONG-TERM INVESTMENTS
(Cost $282,932,559) | | | | | | | 433,921,380 | |
| | | | | | | | |
| | |
| | | Principal
Amount | | | | |
| SHORT-TERM INVESTMENTS — 4.4% | | | | | |
| Repurchase Agreement — 4.4% | | | | | | | | |
State Street Bank & Trust Co. Repurchase Agreement, dated 12/31/14, 0.010%, due 1/02/15 (e) | | $ | 19,183,584 | | | | 19,183,584 | |
| | | | | | | | |
| Time Deposits — 0.0% | | | | | | | | |
Euro Time Deposit
0.010% 1/02/15 | | | 2,116 | | | | 2,116 | |
| | | | | | | | |
| | |
TOTAL SHORT-TERM INVESTMENTS
(Cost $19,185,700) | | | | | | | 19,185,700 | |
| | | | | | | | |
| | |
TOTAL INVESTMENTS — 104.5%
(Cost $302,118,259) (f) | | | | | | | 453,107,080 | |
| | |
| Other Assets/(Liabilities) — (4.5)% | | | | | | | (19,622,100 | ) |
| | | | | | | | |
| | |
| NET ASSETS — 100.0% | | | | | | $ | 433,484,980 | |
| | | | | | | | |
The accompanying notes are an integral part of the financial statements.
108
MML Mid Cap Growth Fund – Portfolio of Investments (Continued)
Notes to Portfolio of Investments
Percentages are stated as a percent of net assets.
| (a) | Denotes all or a portion of security on loan. The total value of securities on loan as of December 31, 2014, was $16,932,217 or 3.91% of net assets. Total securities on loan may not correspond with the amounts identified in the Portfolio of Investments because pending sales may be in the process of recall from the brokers. (Note 2). |
| (b) | Non-income producing security. |
| (c) | This security is fair valued in good faith in accordance with procedures approved by the Board of Trustees. At December 31, 2014, these securities amounted to a value of $3,178,704 or 0.73% of net assets. |
| (d) | Represents investment of security lending collateral. (Note 2). |
| (e) | Maturity value of $19,183,595. Collateralized by U.S. Government Agency obligations with a rate of 2.500%, maturity dates ranging from 3/20/28 – 4/01/28, and an aggregate market value, including accrued interest, of $19,568,435. |
| (f) | See Note 6 for aggregate cost for federal tax purposes. |
The accompanying notes are an integral part of the financial statements.
109
MML Mid Cap Value Fund – Portfolio of Investments
December 31, 2014
| | | | | | | | |
| | | Number of
Shares | | | Value | |
| EQUITIES — 96.6% | | | | | | | | |
| | |
| COMMON STOCK — 96.6% | | | | | | | | |
| Basic Materials — 1.9% | | | | | | | | |
| Chemicals — 0.8% | | | | | | | | |
The Mosaic Co. | | | 86,657 | | | $ | 3,955,892 | |
| | | | | | | | |
| Iron & Steel — 0.7% | | | | | | | | |
Nucor Corp. | | | 72,721 | | | | 3,566,965 | |
| | | | | | | | |
| Mining — 0.4% | | | | | | | | |
Newmont Mining Corp. | | | 113,585 | | | | 2,146,756 | |
| | | | | | | | |
| | | | | | | 9,669,613 | |
| | | | | | | | |
| Communications — 2.4% | | | | | | | | |
| Media — 0.5% | | | | | | | | |
Markit, Ltd. (a) | | | 96,734 | | | | 2,556,680 | |
| | | | | | | | |
| Telecommunications — 1.9% | | | | | | | | |
CenturyLink, Inc. | | | 106,638 | | | | 4,220,732 | |
Harris Corp. | | | 35,050 | | | | 2,517,291 | |
Rogers Communications, Inc. Class B | | | 69,284 | | | | 2,693,715 | |
| | | | | | | | |
| | | | | | | 9,431,738 | |
| | | | | | | | |
| | | | | | | 11,988,418 | |
| | | | | | | | |
| Consumer, Cyclical — 7.0% | | | | | | | | |
| Apparel — 0.5% | | | | | | | | |
Ralph Lauren Corp. | | | 15,058 | | | | 2,788,139 | |
| | | | | | | | |
| Auto Manufacturers — 1.2% | | | | | | | | |
Oshkosh Corp. | | | 121,863 | | | | 5,928,635 | |
| | | | | | | | |
| Automotive & Parts — 0.4% | | | | | | | | |
Autoliv, Inc. | | | 18,386 | | | | 1,951,122 | |
| | | | | | | | |
| Entertainment — 0.5% | | | | | | | | |
International Game Technology | | | 134,730 | | | | 2,324,093 | |
| | | | | | | | |
| Home Builders — 0.5% | | | | | | | | |
Toll Brothers, Inc. (a) | | | 71,595 | | | | 2,453,561 | |
| | | | | | | | |
| Leisure Time — 0.6% | | | | | | | | |
Carnival Corp. | | | 66,760 | | | | 3,026,231 | |
| | | | | | | | |
| Retail — 2.6% | | | | | | | | |
Bed Bath & Beyond, Inc. (a) | | | 39,190 | | | | 2,985,102 | |
Coach, Inc. | | | 33,932 | | | | 1,274,486 | |
Lowe’s Cos., Inc. | | | 71,872 | | | | 4,944,794 | |
Target Corp. | | | 48,727 | | | | 3,698,866 | |
| | | | | | | | |
| | | | | | | 12,903,248 | |
| | | | | | | | |
| Toys, Games & Hobbies — 0.7% | |
Mattel, Inc. | | | 108,488 | | | | 3,357,161 | |
| | | | | | | | |
| | | | | | | 34,732,190 | |
| | | | | | | | |
| Consumer, Non-cyclical — 19.8% | |
| Biotechnology — 0.4% | |
Bio-Rad Laboratories, Inc. Class A (a) | | | 17,821 | | | | 2,148,500 | |
| | | | | | | | |
| | | | | | | | |
| | | Number of
Shares | | | Value | |
| Commercial Services — 2.4% | |
The ADT Corp. | | | 166,322 | | | $ | 6,025,846 | |
Corrections Corporation of America | | | 157,665 | | | | 5,729,546 | |
| | | | | | | | |
| | | | | | | 11,755,392 | |
| | | | | | | | |
| Foods — 7.3% | |
Campbell Soup Co. | | | 62,670 | | | | 2,757,480 | |
ConAgra Foods, Inc. | | | 180,842 | | | | 6,560,948 | |
Danone SA | | | 19,571 | | | | 1,287,507 | |
General Mills, Inc. | | | 81,145 | | | | 4,327,463 | |
The J.M. Smucker Co. | | | 46,525 | | | | 4,698,094 | |
Kellogg Co. | | | 43,827 | | | | 2,868,039 | |
Kraft Foods Group, Inc. | | | 40,248 | | | | 2,521,940 | |
Mondelez International, Inc. Class A | | | 89,855 | | | | 3,263,983 | |
Sysco Corp. | | | 200,098 | | | | 7,941,890 | |
| | | | | | | | |
| | | | | | | 36,227,344 | |
| | | | | | | | |
| Health Care – Products — 3.7% | |
Boston Scientific Corp. (a) | | | 198,383 | | | | 2,628,575 | |
CareFusion Corp. (a) | | | 99,002 | | | | 5,874,779 | |
Medtronic, Inc. | | | 56,012 | | | | 4,044,066 | |
Stryker Corp. | | | 35,221 | | | | 3,322,397 | |
Zimmer Holdings, Inc. | | | 24,727 | | | | 2,804,536 | |
| | | | | | | | |
| | | | | | | 18,674,353 | |
| | | | | | | | |
| Health Care – Services — 4.2% | |
Cigna Corp. | | | 26,646 | | | | 2,742,140 | |
Humana, Inc. | | | 26,036 | | | | 3,739,550 | |
LifePoint Hospitals, Inc. (a) | | | 105,536 | | | | 7,589,094 | |
Quest Diagnostics, Inc. | | | 98,318 | | | | 6,593,205 | |
| | | | | | | | |
| | | | | | | 20,663,989 | |
| | | | | | | | |
| Pharmaceuticals — 1.8% | |
Cardinal Health, Inc. | | | 53,250 | | | | 4,298,873 | |
Hospira, Inc. (a) | | | 27,848 | | | | 1,705,690 | |
Patterson Cos., Inc. | | | 58,263 | | | | 2,802,450 | |
| | | | | | | | |
| | | | | | | 8,807,013 | |
| | | | | | | | |
| | | | | | | 98,276,591 | |
| | | | | | | | |
| Energy — 6.2% | |
| Oil & Gas — 5.1% | |
Antero Midstream Partners LP (a) | | | 39,887 | | | | 1,096,892 | |
Apache Corp. | | | 80,637 | | | | 5,053,521 | |
Devon Energy Corp. | | | 75,130 | | | | 4,598,707 | |
Imperial Oil Ltd. | | | 173,915 | | | | 7,492,207 | |
Noble Energy, Inc. | | | 45,420 | | | | 2,154,271 | |
Occidental Petroleum Corp. | | | 43,923 | | | | 3,540,633 | |
Southwestern Energy Co. (a) | | | 39,695 | | | | 1,083,276 | |
| | | | | | | | |
| | | | | | | 25,019,507 | |
| | | | | | | | |
| Oil & Gas Services — 0.7% | |
Cameron International Corp. (a) | | | 69,987 | | | | 3,495,851 | |
| | | | | | | | |
| Pipelines — 0.4% | |
Williams Partners LP | | | 46,422 | | | | 2,077,385 | |
| | | | | | | | |
| | | | | | | 30,592,743 | |
| | | | | | | | |
The accompanying notes are an integral part of the financial statements.
110
MML Mid Cap Value Fund – Portfolio of Investments (Continued)
| | | | | | | | |
| | | Number of
Shares | | | Value | |
| Financial — 25.2% | |
| Banks — 11.7% | |
Bank of Hawaii Corp. | | | 52,568 | | | $ | 3,117,808 | |
BB&T Corp. | | | 64,323 | | | | 2,501,522 | |
BOK Financial Corp. | | | 44,021 | | | | 2,643,021 | |
Comerica, Inc. | | | 58,864 | | | | 2,757,190 | |
Commerce Bancshares, Inc. | | | 145,713 | | | | 6,337,058 | |
Cullen/Frost Bankers, Inc. | | | 39,688 | | | | 2,803,560 | |
M&T Bank Corp. | | | 50,849 | | | | 6,387,651 | |
Northern Trust Corp. | | | 211,520 | | | | 14,256,448 | |
PNC Financial Services Group, Inc. | | | 68,039 | | | | 6,207,198 | |
State Street Corp. | | | 44,180 | | | | 3,468,130 | |
SunTrust Banks, Inc. | | | 76,139 | | | | 3,190,224 | |
Westamerica Bancorp. | | | 86,286 | | | | 4,229,740 | |
| | | | | | | | |
| | | | | | | 57,899,550 | |
| | | | | | | | |
| Diversified Financial — 1.9% | |
Franklin Resources, Inc. | | | 48,782 | | | | 2,701,059 | |
LPL Financial Holdings, Inc. | | | 98,639 | | | | 4,394,368 | |
T. Rowe Price Group, Inc. | | | 29,652 | | | | 2,545,921 | |
| | | | | | | | |
| | | | | | | 9,641,348 | |
| | | | | | | | |
| Insurance — 7.2% | |
ACE Ltd. | | | 37,419 | | | | 4,298,695 | |
Aflac, Inc. | | | 36,667 | | | | 2,239,987 | |
The Allstate Corp. | | | 24,115 | | | | 1,694,079 | |
Arthur J. Gallagher & Co. | | | 32,727 | | | | 1,540,787 | |
Brown & Brown, Inc. | | | 82,631 | | | | 2,719,386 | |
The Chubb Corp. | | | 28,775 | | | | 2,977,349 | |
HCC Insurance Holdings, Inc. | | | 94,222 | | | | 5,042,761 | |
MetLife, Inc. | | | 40,104 | | | | 2,169,225 | |
Reinsurance Group of America, Inc. | | | 54,950 | | | | 4,814,719 | |
Torchmark Corp. | | | 33,416 | | | | 1,810,145 | |
The Travelers Cos., Inc. | | | 24,702 | | | | 2,614,707 | |
Unum Group | | | 109,478 | | | | 3,818,593 | |
| | | | | | | | |
| | | | | | | 35,740,433 | |
| | | | | | | | |
| Real Estate Investment Trusts (REITS) — 3.3% | |
Annaly Capital Management, Inc. | | | 123,455 | | | | 1,334,548 | |
Empire State Realty Trust, Inc. Class A | | | 146,996 | | | | 2,584,190 | |
Piedmont Office Realty Trust, Inc. Class A | | | 297,142 | | | | 5,598,155 | |
Weyerhaeuser Co. | | | 185,358 | | | | 6,652,499 | |
| | | | | | | | |
| | | | | | | 16,169,392 | |
| | | | | | | | |
| Savings & Loans — 1.1% | |
Capitol Federal Financial, Inc. | | | 69,783 | | | | 891,827 | |
People’s United Financial, Inc. | | | 285,837 | | | | 4,339,005 | |
| | | | | | | | |
| | | | | | | 5,230,832 | |
| | | | | | | | |
| | | | | | | 124,681,555 | |
| �� | | | | | | | |
| Industrial — 14.3% | |
| Aerospace & Defense — 1.3% | |
BAE Systems PLC | | | 263,849 | | | | 1,926,106 | |
| | | | | | | | |
| | | Number of
Shares | | | Value | |
Exelis, Inc. | | | 260,295 | | | $ | 4,562,971 | |
| | | | | | | | |
| | | | | | | 6,489,077 | |
| | | | | | | | |
| Electrical Components & Equipment — 1.0% | |
Emerson Electric Co. | | | 81,474 | | | | 5,029,390 | |
| | | | | | | | |
| Electronics — 4.4% | |
Agilent Technologies, Inc. | | | 41,413 | | | | 1,695,448 | |
Keysight Technologies, Inc. (a) | | | 43,631 | | | | 1,473,419 | |
Koninklijke Philips Electronics NV | | | 270,623 | | | | 7,857,582 | |
TE Connectivity Ltd. | | | 66,354 | | | | 4,196,891 | |
Tyco International PLC | | | 100,327 | | | | 4,400,342 | |
Waters Corp. (a) | | | 16,403 | | | | 1,848,946 | |
| | | | | | | | |
| | | | | | | 21,472,628 | |
| | | | | | | | |
| Environmental Controls — 4.0% | |
Clean Harbors, Inc. (a) | | | 83,945 | | | | 4,033,557 | |
Republic Services, Inc. | | | 362,525 | | | | 14,591,632 | |
Waste Management, Inc. | | | 24,938 | | | | 1,279,818 | |
| | | | | | | | |
| | | | | | | 19,905,007 | |
| | | | | | | | |
| Manufacturing — 0.9% | |
Pentair PLC | | | 28,871 | | | | 1,917,612 | |
Textron, Inc. | | | 55,870 | | | | 2,352,686 | |
| | | | | | | | |
| | | | | | | 4,270,298 | |
| | | | | | | | |
| Packaging & Containers — 1.5% | |
Bemis Co., Inc. | | | 110,972 | | | | 5,017,044 | |
Sonoco Products Co. | | | 57,074 | | | | 2,494,134 | |
| | | | | | | | |
| | | | | | | 7,511,178 | |
| | | | | | | | |
| Transportation — 1.2% | |
Heartland Express, Inc. | | | 101,106 | | | | 2,730,873 | |
Werner Enterprises, Inc. | | | 106,701 | | | | 3,323,736 | |
| | | | | | | | |
| | | | | | | 6,054,609 | |
| | | | | | | | |
| | | | | | | 70,732,187 | |
| | | | | | | | |
| Technology — 8.3% | |
| Computers — 2.1% | |
SanDisk Corp. | | | 40,412 | | | | 3,959,568 | |
Western Digital Corp. | | | 61,352 | | | | 6,791,666 | |
| | | | | | | | |
| | | | | | | 10,751,234 | |
| | | | | | | | |
| Semiconductors — 5.5% | |
Applied Materials, Inc. | | | 174,971 | | | | 4,360,277 | |
Broadcom Corp. Class A | | | 110,556 | | | | 4,790,392 | |
Lam Research Corp. | | | 58,439 | | | | 4,636,550 | |
Maxim Integrated Products, Inc. | | | 105,077 | | | | 3,348,804 | |
Microchip Technology, Inc. | | | 96,821 | | | | 4,367,595 | |
Teradyne, Inc. | | | 283,596 | | | | 5,612,365 | |
| | | | | | | | |
| | | | | | | 27,115,983 | |
| | | | | | | | |
| Software — 0.7% | |
Fidelity National Information Services, Inc. | | | 54,462 | | | | 3,387,537 | |
| | | | | | | | |
| | | | | | | 41,254,754 | |
| | | | | | | | |
The accompanying notes are an integral part of the financial statements.
111
MML Mid Cap Value Fund – Portfolio of Investments (Continued)
| | | | | | | | |
| | | Number of
Shares | | | Value | |
| Utilities — 11.5% | |
| Electric — 9.0% | |
Ameren Corp. | | | 52,531 | | | $ | 2,423,255 | |
Consolidated Edison, Inc. | | | 36,763 | | | | 2,426,726 | |
Edison International | | | 110,063 | | | | 7,206,925 | |
Great Plains Energy, Inc. | | | 180,393 | | | | 5,124,965 | |
Northeast Utilities | | | 40,148 | | | | 2,148,721 | |
NorthWestern Corp. | | | 41,090 | | | | 2,324,872 | |
OGE Energy Corp. | | | 32,513 | | | | 1,153,561 | |
PG&E Corp. | | | 86,768 | | | | 4,619,529 | |
The Southern Co. | | | 49,201 | | | | 2,416,261 | |
Westar Energy, Inc. | | | 181,259 | | | | 7,475,121 | |
Xcel Energy, Inc. | | | 198,310 | | | | 7,123,295 | |
| | | | | | | | |
| | | | | | | 44,443,231 | |
| | | | | | | | |
| Gas — 2.5% | |
Atmos Energy Corp. | | | 90,198 | | | | 5,027,636 | |
The Laclede Group, Inc. | | | 140,588 | | | | 7,479,282 | |
| | | | | | | | |
| | | | | | | 12,506,918 | |
| | | | | | | | |
| | | | | | | 56,950,149 | |
| | | | | | | | |
| | |
TOTAL COMMON STOCK
(Cost $415,407,983) | | | | | | | 478,878,200 | |
| | | | | | | | |
| | |
TOTAL EQUITIES
(Cost $415,407,983) | | | | | | | 478,878,200 | |
| | | | | | | | |
| | |
| MUTUAL FUNDS — 2.7% | | | | | | | | |
| Diversified Financial — 2.7% | | | | | | | | |
iShares Russell Midcap Value Index Fund | | | 180,142 | | | | 13,289,075 | |
| | | | | | | | |
| | |
TOTAL MUTUAL FUNDS
(Cost $12,716,424) | | | | | | | 13,289,075 | |
| | | | | | | | |
| | |
TOTAL LONG-TERM INVESTMENTS
(Cost $428,124,407) | | | | | | | 492,167,275 | |
| | | | | | | | |
| | |
| | | Principal
Amount | | | | |
| SHORT-TERM INVESTMENTS — 1.9% | |
| Repurchase Agreement — 1.9% | | | | | |
State Street Bank & Trust Co. Repurchase Agreement, dated 12/31/14, 0.010%, due 1/02/15 (b) | | $ | 9,314,127 | | | | 9,314,127 | |
| | | | | | | | |
| | |
TOTAL SHORT-TERM INVESTMENTS
(Cost $9,314,127) | | | | | | | 9,314,127 | |
| | | | | | | | |
| | | | |
| | |
Value | |
TOTAL INVESTMENTS — 101.2%
(Cost $437,438,534) (c) | | $ | 501,481,402 | |
| |
| Other Assets/(Liabilities) — (1.2)% | | | (5,931,607 | ) |
| | | | |
| |
| NET ASSETS — 100.0% | | $ | 495,549,795 | |
| | | | |
Notes to Portfolio of Investments
Percentages are stated as a percent of net assets.
| (a) | Non-income producing security. |
| (b) | Maturity value of $9,314,132. Collateralized by U.S. Government Agency obligations with a rate of 2.500%, maturity date of 3/20/28, and an aggregate market value, including accrued interest, of $9,504,099. |
| (c) | See Note 6 for aggregate cost for federal tax purposes. |
The accompanying notes are an integral part of the financial statements.
112
MML Small Cap Growth Equity Fund – Portfolio of Investments
December 31, 2014
| | | | | | | | |
| | | Number of
Shares | | | Value | |
| EQUITIES — 99.8% | | | | | | | | |
| | |
| COMMON STOCK — 98.4% | | | | | | | | |
| Basic Materials — 2.9% | | | | | | | | |
| Chemicals — 1.4% | | | | | | | | |
Minerals Technologies, Inc. | | | 22,265 | | | $ | 1,546,304 | |
Platform Specialty Products Corp. (a) | | | 51,198 | | | | 1,188,818 | |
Sensient Technologies Corp. | | | 18,000 | | | | 1,086,120 | |
| | | | | | | | |
| | | | | | | 3,821,242 | |
| | | | | | | | |
| Forest Products & Paper — 0.6% | | | | | | | | |
KapStone Paper and Packaging Corp. | | | 51,891 | | | | 1,520,925 | |
| | | | | | | | |
| Iron & Steel — 0.6% | | | | | | | | |
AK Steel Holding Corp. (a) (b) | | | 111,220 | | | | 660,647 | |
Allegheny Technologies, Inc. | | | 24,585 | | | | 854,820 | |
| | | | | | | | |
| | | | | | | 1,515,467 | |
| | | | | | | | |
| Mining — 0.3% | | | | | | | | |
Constellium NV (a) | | | 51,855 | | | | 851,978 | |
| | | | | | | | |
| | | | | | | 7,709,612 | |
| | | | | | | | |
| Communications — 5.6% | | | | | | | | |
| Internet — 2.9% | | | | | | | | |
Bankrate, Inc. (a) | | | 67,740 | | | | 842,008 | |
Constant Contact, Inc. (a) | | | 29,088 | | | | 1,067,530 | |
Dealertrack Technologies, Inc. (a) | | | 13,789 | | | | 610,990 | |
Dropbox, Inc. (c) | | | 10,469 | | | | 199,970 | |
IAC/InterActiveCorp | | | 15,015 | | | | 912,762 | |
Marketo, Inc. (a) (b) | | | 25,849 | | | | 845,779 | |
Shutterstock, Inc. (a) (b) | | | 13,059 | | | | 902,377 | |
TrueCar, Inc. (a) | | | 40,441 | | | | 926,099 | |
Yelp, Inc. (a) | | | 12,294 | | | | 672,851 | |
zulily, Inc. Class A (a) (b) | | | 26,939 | | | | 630,373 | |
| | | | | | | | |
| | | | | | | 7,610,739 | |
| | | | | | | | |
| Media — 1.2% | | | | | | | | |
FactSet Research Systems, Inc. | | | 10,262 | | | | 1,444,377 | |
Markit, Ltd. (a) | | | 20,059 | | | | 530,159 | |
The New York Times Co. Class A | | | 79,910 | | | | 1,056,410 | |
| | | | | | | | |
| | | | | | | 3,030,946 | |
| | | | | | | | |
| Telecommunications — 1.5% | | | | | | | | |
Arista Networks, Inc. (a) (b) | | | 7,248 | | | | 440,388 | |
Ciena Corp. (a) | | | 47,175 | | | | 915,667 | |
DigitalGlobe, Inc. (a) | | | 35,335 | | | | 1,094,325 | |
Ubiquiti Networks, Inc. (b) | | | 13,836 | | | | 410,099 | |
Vonage Holdings Corp. (a) | | | 313,380 | | | | 1,193,978 | |
| | | | | | | | |
| | | | | | | 4,054,457 | |
| | | | | | | | |
| | | | | | | 14,696,142 | |
| | | | | | | | |
| Consumer, Cyclical — 13.8% | | | | | | | | |
| Airlines — 0.7% | | | | | | | | |
JetBlue Airways Corp. (a) (b) | | | 70,610 | | | | 1,119,874 | |
Spirit Airlines, Inc. (a) | | | 10,279 | | | | 776,887 | |
| | | | | | | | |
| | | | | | | 1,896,761 | |
| | | | | | | | |
| | | | | | | | |
| | | Number of
Shares | | | Value | |
| Apparel — 0.4% | | | | | | | | |
Skechers U.S.A., Inc. Class A (a) | | | 7,453 | | | $ | 411,778 | |
Vince Holding Corp. (a) | | | 23,348 | | | | 610,317 | |
| | | | | | | | |
| | | | | | | 1,022,095 | |
| | | | | | | | |
| Automotive & Parts — 0.2% | | | | | | | | |
Gentherm, Inc. (a) | | | 11,270 | | | | 412,707 | |
| | | | | | | | |
| Distribution & Wholesale — 0.9% | | | | | | | | |
HD Supply Holdings, Inc. (a) | | | 42,188 | | | | 1,244,124 | |
Watsco, Inc. | | | 10,500 | | | | 1,123,500 | |
| | | | | | | | |
| | | | | | | 2,367,624 | |
| | | | | | | | |
| Entertainment — 1.1% | | | | | | | | |
Churchill Downs, Inc. | | | 10,520 | | | | 1,002,556 | |
DreamWorks Animation SKG, Inc. Class A (a) (b) | | | 37,460 | | | | 836,482 | |
National CineMedia, Inc. | | | 66,500 | | | | 955,605 | |
| | | | | | | | |
| | | | | | | 2,794,643 | |
| | | | | | | | |
| Home Builders — 0.5% | | | | | | | | |
Standard Pacific Corp. (a) | | | 192,552 | | | | 1,403,704 | |
| | | | | | | | |
| Home Furnishing — 0.3% | | | | | | | | |
Harman International Industries, Inc. | | | 7,400 | | | | 789,654 | |
| | | | | | | | |
| Housewares — 0.9% | | | | | | | | |
The Toro Co. | | | 37,100 | | | | 2,367,351 | |
| | | | | | | | |
| Leisure Time — 0.6% | | | | | | | | |
Diamond Resorts International, Inc. (a) | | | 50,882 | | | | 1,419,608 | |
| | | | | | | | |
| Retail — 7.7% | | | | | | | | |
Bloomin’ Brands, Inc. (a) | | | 17,858 | | | | 442,164 | |
Buffalo Wild Wings, Inc. (a) | | | 3,786 | | | | 682,919 | |
The Cheesecake Factory, Inc. | | | 26,505 | | | | 1,333,466 | |
CST Brands, Inc. | | | 17,552 | | | | 765,443 | |
Destination Maternity Corp. | | | 30,000 | | | | 478,500 | |
Five Below, Inc. (a) | | | 55,700 | | | | 2,274,231 | |
Haverty Furniture Cos., Inc. | | | 40,600 | | | | 893,606 | |
HSN, Inc. | | | 22,643 | | | | 1,720,868 | |
Kate Spade & Co. (a) | | | 27,265 | | | | 872,753 | |
Krispy Kreme Doughnuts, Inc. (a) | | | 116,800 | | | | 2,305,632 | |
Panera Bread Co. Class A (a) | | | 24,455 | | | | 4,274,734 | |
Papa John’s International, Inc. | | | 18,500 | | | | 1,032,300 | |
Red Robin Gourmet Burgers, Inc. (a) | | | 9,354 | | | | 720,024 | |
Rush Enterprises, Inc. Class A (a) | | | 34,600 | | | | 1,108,930 | |
Tuesday Morning Corp. (a) | | | 29,491 | | | | 639,955 | |
Zumiez, Inc. (a) | | | 21,000 | | | | 811,230 | |
| | | | | | | | |
| | | | | | | 20,356,755 | |
| | | | | | | | |
| Textiles — 0.5% | | | | | | | | |
Tumi Holdings, Inc. (a) | | | 56,155 | | | | 1,332,558 | |
| | | | | | | | |
| | | | | | | 36,163,460 | |
| | | | | | | | |
The accompanying notes are an integral part of the financial statements.
113
MML Small Cap Growth Equity Fund – Portfolio of Investments (Continued)
| | | | | | | | |
| | | Number of
Shares | | | Value | |
| Consumer, Non-cyclical — 23.4% | | | | | | | | |
| Biotechnology — 1.8% | | | | | | | | |
BioCryst Pharmaceuticals,
Inc. (a) (b) | | | 46,906 | | | $ | 570,377 | |
Charles River Laboratories International, Inc. (a) | | | 22,765 | | | | 1,448,765 | |
Foundation Medicine, Inc. (a) (b) | | | 30,400 | | | | 675,488 | |
Ironwood Pharmaceuticals, Inc. (a) | | | 24,376 | | | | 373,440 | |
NPS Pharmaceuticals, Inc. (a) | | | 27,760 | | | | 992,975 | |
PTC Therapeutics, Inc. (a) (b) | | | 14,012 | | | | 725,401 | |
| | | | | | | | |
| | | | | | | 4,786,446 | |
| | | | | | | | |
| Commercial Services — 6.5% | | | | | | | | |
Cardtronics, Inc. (a) | | | 21,900 | | | | 844,902 | |
Convergys Corp. | | | 45,925 | | | | 935,492 | |
CoStar Group, Inc. (a) | | | 4,953 | | | | 909,520 | |
EVERTEC, Inc. | | | 35,700 | | | | 790,041 | |
ExamWorks Group, Inc. (a) (b) | | | 73,622 | | | | 3,061,939 | |
Healthcare Services Group, Inc. | | | 40,200 | | | | 1,243,386 | |
Heartland Payment Systems, Inc. | | | 16,645 | | | | 897,998 | |
Huron Consulting Group, Inc. (a) | | | 7,490 | | | | 512,241 | |
MAXIMUS, Inc. | | | 13,948 | | | | 764,908 | |
TriNet Group, Inc. (a) | | | 36,282 | | | | 1,134,901 | |
TrueBlue, Inc. (a) | | | 53,273 | | | | 1,185,324 | |
WEX, Inc. (a) | | | 17,619 | | | | 1,742,872 | |
WNS Holdings Ltd. Sponsored ADR (India) (a) | | | 45,497 | | | | 939,968 | |
Xoom Corp. (a) (b) | | | 114,700 | | | | 2,008,397 | |
| | | | | | | | |
| | | | | | | 16,971,889 | |
| | | | | | | | |
| Foods — 1.9% | | | | | | | | |
Greencore Group PLC | | | 264,836 | | | | 1,172,130 | |
SunOpta, Inc. (a) | | | 119,794 | | | | 1,419,559 | |
The Hain Celestial Group, Inc. (a) (b) | | | 41,200 | | | | 2,401,548 | |
| | | | | | | | |
| | | | | | | 4,993,237 | |
| | | | | | | | |
| Health Care – Products — 7.9% | | | | | | | | |
ABIOMED, Inc. (a) | | | 30,185 | | | | 1,148,841 | |
AtriCure, Inc. (a) | | | 53,160 | | | | 1,061,074 | |
Cepheid, Inc. (a) | | | 7,916 | | | | 428,572 | |
Cyberonics, Inc. (a) | | | 48,200 | | | | 2,683,776 | |
Dexcom, Inc. (a) | | | 89,145 | | | | 4,907,432 | |
Endologix, Inc. (a) | | | 29,260 | | | | 447,385 | |
Globus Medical, Inc. Class A (a) | | | 40,335 | | | | 958,763 | |
HeartWare International, Inc. (a) (b) | | | 12,434 | | | | 913,029 | |
Insulet Corp. (a) | | | 49,542 | | | | 2,281,905 | |
Intersect ENT, Inc. (a) | | | 11,811 | | | | 219,094 | |
LDR Holding Corp. (a) | | | 48,300 | | | | 1,583,274 | |
MiMedx Group, Inc. (a) (b) | | | 76,825 | | | | 885,792 | |
Novadaq Technologies, Inc. (a) | | | 55,000 | | | | 914,100 | |
Quidel Corp. (a) (b) | | | 42,100 | | | | 1,217,532 | |
Spectranetics Corp. (a) | | | 35,600 | | | | 1,231,048 | |
| | | | | | | | |
| | | | | | | 20,881,617 | |
| | | | | | | | |
| Health Care – Services — 3.4% | | | | | | | | |
Acadia Healthcare Co., Inc. (a) | | | 59,405 | | | | 3,636,180 | |
Envision Healthcare Holdings, Inc. (a) | | | 32,886 | | | | 1,140,815 | |
| | | | | | | | |
| | | Number of
Shares | | | Value | |
Kindred Healthcare, Inc. | | | 64,570 | | | $ | 1,173,883 | |
LifePoint Hospitals, Inc. (a) | | | 12,150 | | | | 873,707 | |
Molina Healthcare, Inc. (a) | | | 14,545 | | | | 778,594 | |
WellCare Health Plans, Inc. (a) | | | 14,840 | | | | 1,217,770 | |
| | | | | | | | |
| | | | | | | 8,820,949 | |
| | | | | | | | |
| Household Products — 0.2% | | | | | | | | |
Spectrum Brands Holdings, Inc. | | | 5,507 | | | | 526,910 | |
| | | | | | | | |
| Pharmaceuticals — 1.5% | | | | | | | | |
Aerie Pharmaceuticals, Inc. (a) | | | 11,925 | | | | 348,091 | |
Agios Pharmaceuticals, Inc. (a) (b) | | | 4,327 | | | | 484,797 | |
Alnylam Pharmaceuticals, Inc. (a) | | | 6,154 | | | | 596,938 | |
Anacor Pharmaceuticals, Inc. (a) | | | 21,166 | | | | 682,603 | |
Portola Pharmaceuticals, Inc. (a) | | | 23,716 | | | | 671,637 | |
TESARO, Inc. (a) (b) | | | 30,989 | | | | 1,152,481 | |
| | | | | | | | |
| | | | | | | 3,936,547 | |
| | | | | | | | |
| Textiles — 0.2% | | | | | | | | |
Samsonite International SA | | | 169,670 | | | | 502,269 | |
| | | | | | | | |
| | | | | | | 61,419,864 | |
| | | | | | | | |
| Diversified — 0.1% | | | | | | | | |
| Holding Company – Diversified — 0.1% | | | | | |
WL Ross Holding Corp. (a) | | | 24,100 | | | | 276,427 | |
| | | | | | | | |
| Energy — 3.9% | | | | | | | | |
| Energy – Alternate Sources — 1.0% | | | | | | | | |
First Solar, Inc. (a) | | | 14,160 | | | | 631,465 | |
Headwaters, Inc. (a) | | | 72,229 | | | | 1,082,713 | |
Pattern Energy Group, Inc. | | | 33,890 | | | | 835,727 | |
| | | | | | | | |
| | | | | | | 2,549,905 | |
| | | | | | | | |
| Oil & Gas — 2.0% | | | | | | | | |
Delek US Holdings, Inc. | | | 16,740 | | | | 456,667 | |
Diamondback Energy, Inc. (a) | | | 29,554 | | | | 1,766,738 | |
Patterson-UTI Energy, Inc. | | | 44,600 | | | | 739,914 | |
RSP Permian, Inc. (a) | | | 71,484 | | | | 1,797,108 | |
Western Refining, Inc. | | | 12,505 | | | | 472,439 | |
| | | | | | | | |
| | | | | | | 5,232,866 | |
| | | | | | | | |
| Oil & Gas Services — 0.9% | | | | | | | | |
Dril-Quip, Inc. (a) | | | 18,500 | | | | 1,419,505 | |
Helix Energy Solutions Group, Inc. (a) | | | 41,000 | | | | 889,700 | |
RPC, Inc. | | | 13,200 | | | | 172,128 | |
| | | | | | | | |
| | | | | | | 2,481,333 | |
| | | | | | | | |
| | | | | | | 10,264,104 | |
| | | | | | | | |
| Financial — 14.1% | | | | | | | | |
| Banks — 2.5% | | | | | | | | |
Associated Banc-Corp. | | | 57,895 | | | | 1,078,584 | |
International Bancshares Corp. | | | 44,080 | | | | 1,169,883 | |
PacWest Bancorp | | | 45,735 | | | | 2,079,113 | |
South State Corp. | | | 16,800 | | | | 1,126,944 | |
Texas Capital Bancshares, Inc. (a) | | | 19,200 | | | | 1,043,136 | |
| | | | | | | | |
| | | | | | | 6,497,660 | |
| | | | | | | | |
The accompanying notes are an integral part of the financial statements.
114
MML Small Cap Growth Equity Fund – Portfolio of Investments (Continued)
| | | | | | | | |
| | | Number of
Shares | | | Value | |
| Diversified Financial — 4.2% | | | | | | | | |
Financial Engines, Inc. (b) | | | 74,581 | | | $ | 2,725,935 | |
Investment Technology Group, Inc. (a) | | | 56,930 | | | | 1,185,283 | |
PRA Group, Inc. (a) | | | 62,400 | | | | 3,614,832 | |
WageWorks, Inc. (a) | | | 33,098 | | | | 2,137,138 | |
WisdomTree Investments, Inc. (b) | | | 89,363 | | | | 1,400,765 | |
| | | | | | | | |
| | | | | | | 11,063,953 | |
| | | | | | | | |
| Insurance — 2.6% | | | | | | | | |
Argo Group International Holdings Ltd. | | | 25,775 | | | | 1,429,739 | |
Assured Guaranty Ltd. | | | 25,049 | | | | 651,024 | |
eHealth, Inc. (a) | | | 39,720 | | | | 989,822 | |
Horace Mann Educators Corp. | | | 11,472 | | | | 380,641 | |
MGIC Investment Corp. (a) | | | 56,300 | | | | 524,716 | |
OneBeacon Insurance Group Ltd. Class A | | | 57,500 | | | | 931,500 | |
Primerica, Inc. | | | 20,820 | | | | 1,129,693 | |
Stewart Information Services Corp. | | | 20,300 | | | | 751,912 | |
| | | | | | | | |
| | | | | | | 6,789,047 | |
| | | | | | | | |
| Investment Companies — 0.3% | | | | | | | | |
Solar Capital Ltd. | | | 45,215 | | | | 814,322 | |
| | | | | | | | |
Real Estate — 1.7% | | | | | | | | |
Alexander & Baldwin, Inc. | | | 27,610 | | | | 1,083,969 | |
HFF, Inc. | | | 68,765 | | | | 2,470,039 | |
Kennedy-Wilson Holdings, Inc. | | | 41,004 | | | | 1,037,401 | |
| | | | | | | | |
| | | | | | | 4,591,409 | |
| | | | | | | | |
| Real Estate Investment Trusts (REITS) — 2.8% | |
First Industrial Realty Trust, Inc. | | | 57,780 | | | | 1,187,957 | |
MFA Financial, Inc. | | | 118,265 | | | | 944,937 | |
Paramount Group, Inc. (a) | | | 106,265 | | | | 1,975,466 | |
Pebblebrook Hotel Trust | | | 36,999 | | | | 1,688,265 | |
Redwood Trust, Inc. | | | 50,875 | | | | 1,002,238 | |
Zillow, Inc. Class A (a) (b) | | | 6,117 | | | | 647,729 | |
| | | | | | | | |
| | | | | | | 7,446,592 | |
| | | | | | | | |
| | | | | | | 37,202,983 | |
| | | | | | | | |
| Industrial — 20.0% | |
| Aerospace & Defense — 2.6% | |
Astronics Corp. (a) | | | 13,661 | | | | 755,590 | |
Esterline Technologies Corp. (a) | | | 7,085 | | | | 777,082 | |
HEICO Corp. Class A | | | 18,700 | | | | 885,632 | |
Moog, Inc. Class A (a) | | | 8,360 | | | | 618,891 | |
Orbital Sciences Corp. (a) | | | 78,819 | | | | 2,119,443 | |
Teledyne Technologies, Inc. (a) | | | 17,231 | | | | 1,770,313 | |
| | | | | | | | |
| | | | | | | 6,926,951 | |
| | | | | | | | |
| Building Materials — 2.5% | |
Apogee Enterprises, Inc. | | | 19,300 | | | | 817,741 | |
Armstrong World Industries, Inc. (a) | | | 25,800 | | | | 1,318,896 | |
Boise Cascade Co. (a) | | | 29,400 | | | | 1,092,210 | |
Eagle Materials, Inc. | | | 5,578 | | | | 424,095 | |
Lennox International, Inc. | | | 8,425 | | | | 800,965 | |
| | | | | | | | |
| | | Number of
Shares | | | Value | |
Masonite International Corp. (a) | | | 16,500 | | | $ | 1,014,090 | |
Trex Co., Inc. (a) | | | 28,163 | | | | 1,199,181 | |
| | | | | | | | |
| | | | | | | 6,667,178 | |
| | | | | | | | |
| Electrical Components & Equipment — 0.9% | |
Generac Holdings, Inc. (a) (b) | | | 22,494 | | | | 1,051,820 | |
SunPower Corp. (a) (b) | | | 52,145 | | | | 1,346,905 | |
| | | | | | | | |
| | | | | | | 2,398,725 | |
| | | | | | | | |
| Electronics — 2.9% | |
FEI Co. | | | 25,400 | | | | 2,294,890 | |
Imax Corp. (a) (b) | | | 72,958 | | | | 2,254,402 | |
Rogers Corp. (a) | | | 16,775 | | | | 1,366,156 | |
Watts Water Technologies, Inc. Class A | | | 29,127 | | | | 1,847,817 | |
| | | | | | | | |
| | | | | | | 7,763,265 | |
| | | | | | | | |
| Engineering & Construction — 0.4% | |
AECOM Technology Corp. (a) | | | 31,061 | | | | 943,323 | |
| | | | | | | | |
| Environmental Controls — 0.4% | |
Clean Harbors, Inc. (a) (b) | | | 20,150 | | | | 968,207 | |
| | | | | | | | |
| Machinery – Diversified — 3.2% | |
Altra Industrial Motion Corp. | | | 33,788 | | | | 959,241 | |
Applied Industrial Technologies, Inc. | | | 20,805 | | | | 948,500 | |
Cognex Corp. (a) | | | 67,865 | | | | 2,804,861 | |
The Middleby Corp. (a) | | | 21,700 | | | | 2,150,470 | |
Tennant Co. | | | 22,100 | | | | 1,594,957 | |
| | | | | | | | |
| | | | | | | 8,458,029 | |
| | | | | | | | |
| Manufacturing — 2.4% | |
Acuity Brands, Inc. | | | 22,799 | | | | 3,193,456 | |
Hexcel Corp. (a) | | | 48,100 | | | | 1,995,669 | |
John Bean Technologies Corp. | | | 32,485 | | | | 1,067,457 | |
| | | | | | | | |
| | | | | | | 6,256,582 | |
| | | | | | | | |
| Metal Fabricate & Hardware — 0.5% | |
RBC Bearings, Inc. | | | 19,869 | | | | 1,282,146 | |
| | | | | | | | |
| Packaging & Containers — 1.3% | |
Graphic Packaging Holding Co. (a) | | | 247,495 | | | | 3,370,882 | |
| | | | | | | | |
| Transportation — 2.0% | |
Landstar System, Inc. | | | 15,250 | | | | 1,106,083 | |
Old Dominion Freight Line, Inc. (a) | | | 13,827 | | | | 1,073,528 | |
Swift Transportation Co. (a) | | | 84,800 | | | | 2,427,824 | |
UTI Worldwide, Inc. (a) | | | 65,700 | | | | 792,999 | |
| | | | | | | | |
| | | | | | | 5,400,434 | |
| | | | | | | | |
| Trucking & Leasing — 0.9% | |
Aircastle Ltd. | | | 60,500 | | | | 1,292,885 | |
GATX Corp. | | | 17,200 | | | | 989,688 | |
| | | | | | | | |
| | | | | | | 2,282,573 | |
| | | | | | | | |
| | | | | | | 52,718,295 | |
| | | | | | | | |
| Technology — 14.2% | |
| Computers — 2.8% | |
Cadence Design Systems, Inc. (a) | | | 60,000 | | | | 1,138,200 | |
The accompanying notes are an integral part of the financial statements.
115
MML Small Cap Growth Equity Fund – Portfolio of Investments (Continued)
| | | | | | | | |
| | | Number of
Shares | | | Value | |
FleetMatics Group PLC (a) (b) | | | 18,445 | | | $ | 654,613 | |
Manhattan Associates, Inc. (a) | | | 24,000 | | | | 977,280 | |
Nimble Storage, Inc. (a) (b) | | | 22,400 | | | | 616,000 | |
Virtusa Corp. (a) | | | 93,578 | | | | 3,899,395 | |
| | | | | | | | |
| | | | | | | 7,285,488 | |
| | | | | | | | |
| Semiconductors — 2.3% | |
Freescale Semiconductor
Ltd. (a) (b) | | | 19,562 | | | | 493,549 | |
Microsemi Corp. (a) | | | 40,835 | | | | 1,158,897 | |
Monolithic Power Systems, Inc. | | | 10,760 | | | | 535,202 | |
Nanometrics, Inc. (a) | | | 27,645 | | | | 464,989 | |
ON Semiconductor Corp. (a) | | | 111,505 | | | | 1,129,546 | |
Power Integrations, Inc. | | | 14,666 | | | | 758,819 | |
Silicon Laboratories, Inc. (a) | | | 20,340 | | | | 968,591 | |
SunEdison, Inc. (a) (b) | | | 33,511 | | | | 653,800 | |
| | | | | | | | |
| | | | | | | 6,163,393 | |
| | | | | | | | |
| Software — 9.1% | |
Allscripts Healthcare Solutions, Inc. (a) | | | 62,700 | | | | 800,679 | |
Amber Road, Inc. (a) | | | 49,700 | | | | 507,934 | |
Cornerstone OnDemand, Inc. (a) | | | 32,400 | | | | 1,140,480 | |
Demandware, Inc. (a) | | | 28,494 | | | | 1,639,545 | |
Envestnet, Inc. (a) | | | 22,401 | | | | 1,100,785 | |
Guidewire Software, Inc. (a) | | | 35,000 | | | | 1,772,050 | |
HubSpot, Inc. (a) (b) | | | 24,900 | | | | 836,889 | |
Imperva, Inc. (a) | | | 13,900 | | | | 687,077 | |
Medidata Solutions, Inc. (a) | | | 28,500 | | | | 1,360,875 | |
Monotype Imaging Holdings, Inc. | | | 31,200 | | | | 899,496 | |
New Relic, Inc. (a) | | | 2,300 | | | | 80,132 | |
Proofpoint, Inc. (a) | | | 20,700 | | | | 998,361 | |
Telogis (c) | | | 80,369 | | | | 40,185 | |
TiVo, Inc. (a) | | | 90,340 | | | | 1,069,625 | |
Tyler Technologies, Inc. (a) | | | 39,813 | | | | 4,357,135 | |
The Ultimate Software Group, Inc. (a) | | | 15,500 | | | | 2,275,632 | |
Veeva Systems, Inc. Class A (a) | | | 93,421 | | | | 2,467,249 | |
Verint Systems, Inc. (a) | | | 33,519 | | | | 1,953,487 | |
| | | | | | | | |
| | | | | | | 23,987,616 | |
| | | | | | | | |
| | | | | | | 37,436,497 | |
| | | | | | | | |
| Utilities — 0.4% | |
| Gas — 0.4% | |
Southwest Gas Corp. | | | 17,280 | | | | 1,068,076 | |
| | | | | | | | |
| | |
TOTAL COMMON STOCK
(Cost $216,092,938) | | | | | | | 258,955,460 | |
| | | | | | | | |
| | |
PREFERRED STOCK — 1.4% | | | | | | | | |
| Communications — 0.1% | | | | | | | | |
| Internet — 0.1% | | | | | | | | |
Veracode, Inc. (a) (c) | | | 10,688 | | | | 228,937 | |
| | | | | | | | |
| Consumer, Cyclical — 0.9% | |
| Automotive & Parts — 0.9% | |
Mobileye NV (a) (c) | | | 58,290 | | | | 2,246,030 | |
| | | | | | | | |
| | | | | | | | |
| | | Number of
Shares | | | Value | |
| Technology — 0.4% | |
| Software — 0.4% | |
Cloudera, Inc. Series F (a) (c) | | | 12,068 | | | $ | 398,244 | |
Docusign, Inc. Series B (a) (c) | | | 456 | | | | 7,415 | |
Docusign, Inc. Series B 1 (a) (c) | | | 136 | | | | 2,211 | |
Docusign, Inc. Series D (a) (c) | | | 327 | | | | 5,317 | |
Docusign, Inc. Series E (a) (c) | | | 8,460 | | | | 137,560 | |
NUTANIX, Inc. Series E (a) (c) | | | 14,135 | | | | 189,360 | |
Telogis (a) (c) | | | 109,450 | | | | 438,895 | |
| | | | | | | | |
| | | | | | | 1,179,002 | |
| | | | | | | | |
| | |
TOTAL PREFERRED STOCK
(Cost $1,333,387) | | | | | | | 3,653,969 | |
| | | | | | | | |
| | |
TOTAL EQUITIES
(Cost $217,426,325) | | | | | | | 262,609,429 | |
| | | | | | | | |
| | |
MUTUAL FUNDS — 11.9% | | | | | | | | |
| Diversified Financial — 11.9% | | | | | | | | |
iShares Russell 2000 Index Fund (b) | | | 9,226 | | | | 1,104,075 | |
State Street Navigator Securities Lending Prime Portfolio (d) | | | 30,078,665 | | | | 30,078,665 | |
| | | | | | | | |
| | | | | | | 31,182,740 | |
| | | | | | | | |
| | |
TOTAL MUTUAL FUNDS
(Cost $31,175,961) | | | | | | | 31,182,740 | |
| | | | | | | | |
| | |
TOTAL LONG-TERM INVESTMENTS
(Cost $248,602,286) | | | | | | | 293,792,169 | |
| | | | | | | | |
| | |
| | | Principal
Amount | | | | |
| SHORT-TERM INVESTMENTS — 2.1% | |
| Repurchase Agreement — 2.1% | | | | | | | | |
State Street Bank & Trust Co. Repurchase Agreement, dated 12/31/14, 0.010%, due 1/02/15 (e) | | $ | 5,458,126 | | | | 5,458,126 | |
| | | | | | | | |
| Time Deposits — 0.0% | |
Euro Time Deposit
0.010% 1/02/15 | | | 16 | | | | 16 | |
| | | | | | | | |
| | |
TOTAL SHORT-TERM INVESTMENTS
(Cost $5,458,142) | | | | | | | 5,458,142 | |
| | | | | | | | |
| | |
TOTAL INVESTMENTS — 113.8%
(Cost $254,060,428) (f) | | | | | | | 299,250,311 | |
| | |
| Other Assets/(Liabilities) — (13.8)% | | | | | | | (36,177,162 | ) |
| | | | | | | | |
| | |
| NET ASSETS — 100.0% | | | | | | $ | 263,073,149 | |
| | | | | | | | |
The accompanying notes are an integral part of the financial statements.
116
MML Small Cap Growth Equity Fund – Portfolio of Investments (Continued)
Notes to Portfolio of Investments
Percentages are stated as a percent of net assets.
| ADR | American Depositary Receipt |
| (a) | Non-income producing security. |
| (b) | Denotes all or a portion of security on loan. The total value of securities on loan as of December 31, 2014, was $29,345,230 or 11.15% of net assets. Total securities on loan may not correspond with the amounts identified in the Portfolio of Investments because pending sales may be in the process of recall from the brokers. (Note 2). |
| (c) | This security is fair valued in good faith in accordance with procedures approved by the Board of Trustees. At December 31, 2014, these securities amounted to a value of $3,894,124 or 1.48% of net assets. |
| (d) | Represents investment of security lending collateral. (Note 2). |
| (e) | Maturity value of $5,458,129. Collateralized by U.S. Government Agency obligations with rates ranging from 2.750% – 3.500%, maturity dates ranging from 11/15/28 – 1/01/32, and an aggregate market value, including accrued interest, of $5,568,560. |
| (f) | See Note 6 for aggregate cost for federal tax purposes. |
The accompanying notes are an integral part of the financial statements.
117
MML Small Company Value Fund – Portfolio of Investments
December 31, 2014
| | | | | | | | |
| | | Number of
Shares | | | Value | |
| EQUITIES — 96.0% | |
|
| COMMON STOCK — 96.0% | |
| Basic Materials — 7.6% | |
| Chemicals — 2.6% | |
American Vanguard Corp. (a) | | | 24,900 | | | $ | 289,338 | |
Innospec, Inc. | | | 31,900 | | | | 1,362,130 | |
Minerals Technologies, Inc. | | | 15,300 | | | | 1,062,585 | |
| | | | | | | | |
| | | | | | | 2,714,053 | |
| | | | | | | | |
| Forest Products & Paper — 3.1% | |
Clearwater Paper Corp. (b) | | | 14,000 | | | | 959,700 | |
Deltic Timber Corp. | | | 11,200 | | | | 766,080 | |
Potlatch Corp. | | | 22,700 | | | | 950,449 | |
Wausau Paper Corp. | | | 59,100 | | | | 671,967 | |
| | | | | | | | |
| | | | | | | 3,348,196 | |
| | | | | | | | |
| Iron & Steel — 0.9% | |
Carpenter Technology Corp. | | | 12,100 | | | | 595,925 | |
Ryerson Holding Corp. (b) | | | 12,300 | | | | 122,139 | |
Schnitzer Steel Industries, Inc. Class A | | | 12,500 | | | | 282,000 | |
| | | | | | | | |
| | | | | | | 1,000,064 | |
| | | | | | | | |
| Mining — 1.0% | |
Luxfer Holdings PLC | | | 13,500 | | | | 201,555 | |
Royal Gold, Inc. | | | 6,600 | | | | 413,820 | |
Stillwater Mining Co. (b) | | | 30,000 | | | | 442,200 | |
| | | | | | | | |
| | | | | | | 1,057,575 | |
| | | | | | | | |
| | | | | | | 8,119,888 | |
| | | | | | | | |
| Communications — 3.0% | |
| Internet — 1.6% | |
New Media Investment Group, Inc. | | | 24,200 | | | | 571,846 | |
Safeguard Scientifics, Inc. (b) | | | 53,900 | | | | 1,068,298 | |
| | | | | | | | |
| | | | | | | 1,640,144 | |
| | | | | | | | |
| Media — 0.5% | |
Saga Communications, Inc. Class A | | | 12,700 | | | | 552,196 | |
| | | | | | | | |
| Telecommunications — 0.9% | |
Ixia (b) | | | 47,400 | | | | 533,250 | |
Premiere Global Services, Inc. (b) | | | 7,310 | | | | 77,632 | |
Sonus Networks, Inc. (b) | | | 91,900 | | | | 364,843 | |
| | | | | | | | |
| | | | | | | 975,725 | |
| | | | | | | | |
| | | | | | | 3,168,065 | |
| | | | | | | | |
| Consumer, Cyclical — 12.1% | |
| Airlines — 1.9% | |
Alaska Air Group, Inc. | | | 33,900 | | | | 2,025,864 | |
| | | | | | | | |
| Apparel — 0.2% | |
Crocs, Inc. (b) | | | 18,500 | | | | 231,065 | |
| | | | | | | | |
| Automotive & Parts — 0.7% | |
Dorman Products, Inc. (b) | | | 3,900 | | | | 188,253 | |
Modine Manufacturing Co. (b) | | | 39,300 | | | | 534,480 | |
| | | | | | | | |
| | | | | | | 722,733 | |
| | | | | | | | |
| | | | | | | | |
| | | Number of
Shares | | | Value | |
| Distribution & Wholesale — 2.1% | |
Beacon Roofing Supply, Inc. (b) | | | 43,800 | | | $ | 1,217,640 | |
Pool Corp. | | | 16,500 | | | | 1,046,760 | |
| | | | | | | | |
| | | | | | | 2,264,400 | |
| | | | | | | | |
| Entertainment — 0.4% | |
Ascent Media Corp. Series A (b) | | | 6,700 | | | | 354,631 | |
National CineMedia, Inc. | | | 4,700 | | | | 67,539 | |
| | | | | | | | |
| | | | | | | 422,170 | |
| | | | | | | | |
| Home Builders — 1.1% | |
M/I Homes, Inc. (b) | | | 14,500 | | | | 332,920 | |
Meritage Home Corp. (b) | | | 22,900 | | | | 824,171 | |
| | | | | | | | |
| | | | | | | 1,157,091 | |
| | | | | | | | |
| Home Furnishing — 0.5% | |
Ethan Allen Interiors, Inc. | | | 16,500 | | | | 511,005 | |
| | | | | | | | |
| Leisure Time — 0.6% | |
Brunswick Corp. | | | 12,300 | | | | 630,498 | |
Interval Leisure Group, Inc. | | | 2,500 | | | | 52,225 | |
| | | | | | | | |
| | | | | | | 682,723 | |
| | | | | | | | |
| Lodging — 0.2% | |
Belmond Ltd. (b) | | | 15,500 | | | | 191,735 | |
| | | | | | | | |
| Retail — 2.9% | |
Fred’s, Inc. Class A | | | 23,800 | | | | 414,358 | |
Haverty Furniture Cos., Inc. | | | 28,000 | | | | 616,280 | |
Pier 1 Imports, Inc. | | | 44,600 | | | | 686,840 | |
Red Robin Gourmet Burgers, Inc. (b) | | | 5,000 | | | | 384,875 | |
Sportsman’s Warehouse Holdings, Inc. (b) | | | 36,200 | | | | 264,984 | |
Stein Mart, Inc. | | | 45,900 | | | | 671,058 | |
| | | | | | | | |
| | | | | | | 3,038,395 | |
| | | | | | | | |
| Textiles — 1.5% | |
Culp, Inc. | | | 19,100 | | | | 414,088 | |
G&K Services, Inc. Class A | | | 16,700 | | | | 1,183,195 | |
| | | | | | | | |
| | | | | | | 1,597,283 | |
| | | | | | | | |
| | | | | | | 12,844,464 | |
| | | | | | | | |
| Consumer, Non-cyclical — 11.5% | |
| Agriculture — 0.1% | |
Alliance One International, Inc. (b) | | | 54,900 | | | | 86,742 | |
| | | | | | | | |
| Biotechnology — 0.3% | |
Momenta Pharmaceuticals, Inc. (b) | | | 23,700 | | | | 285,348 | |
| | | | | | | | |
| Commercial Services — 5.6% | |
Aaron’s, Inc. | | | 60,300 | | | | 1,843,371 | |
American Public Education, Inc. (b) | | | 10,900 | | | | 401,883 | |
Electro Rent Corp. | | | 39,000 | | | | 547,560 | |
FTI Consulting, Inc. (b) | | | 13,700 | | | | 529,231 | |
Hillenbrand, Inc. | | | 6,330 | | | | 218,385 | |
Landauer, Inc. | | | 6,100 | | | | 208,254 | |
McGrath RentCorp | | | 34,100 | | | | 1,222,826 | |
The accompanying notes are an integral part of the financial statements.
118
MML Small Company Value Fund – Portfolio of Investments (Continued)
| | | | | | | | |
| | | Number of
Shares | | | Value | |
Navigant Consulting, Inc. (b) | | | 36,200 | | | $ | 556,394 | |
On Assignment, Inc. (b) | | | 12,100 | | | | 401,599 | |
| | | | | | | | |
| | | | | | | 5,929,503 | |
| | | | | | | | |
| Foods — 0.9% | |
Pinnacle Foods, Inc. | | | 8,100 | | | | 285,930 | |
SpartanNash Co. | | | 26,500 | | | | 692,710 | |
| | | | | | | | |
| | | | | | | 978,640 | |
| | | | | | | | |
| Health Care – Products — 3.0% | |
Atrion Corp. | | | 600 | | | | 204,006 | |
Halyard Health, Inc. (a) (b) | | | 19,600 | | | | 891,212 | |
Quidel Corp. (a) (b) | | | 19,200 | | | | 555,264 | |
West Pharmaceutical Services, Inc. | | | 29,500 | | | | 1,570,580 | |
| | | | | | | | |
| | | | | | | 3,221,062 | |
| | | | | | | | |
| Health Care – Services — 1.2% | |
National Healthcare Corp. | | | 12,100 | | | | 760,364 | |
Triple-S Management Corp.
Class B (b) | | | 17,300 | | | | 413,643 | |
WellCare Health Plans, Inc. (b) | | | 800 | | | | 65,648 | |
| | | | | | | | |
| | | | | | | 1,239,655 | |
| | | | | | | | |
| Household Products — 0.4% | |
CSS Industries, Inc. | | | 16,700 | | | | 461,588 | |
| | | | | | | | |
| | | | | | | 12,202,538 | |
| | | | | | | | |
| Diversified — 0.4% | |
| Holding Company – Diversified — 0.4% | |
National Bank Holdings Corp. Class A | | | 21,700 | | | | 421,197 | |
| | | | | | | | |
| Energy — 2.8% | |
| Coal — 0.3% | |
Cloud Peak Energy, Inc. (b) | | | 32,900 | | | | 302,022 | |
| | | | | | | | |
| Oil & Gas — 1.7% | |
Atwood Oceanics, Inc. (b) | | | 10,400 | | | | 295,048 | |
Clayton Williams Energy, Inc. (b) | | | 4,300 | | | | 274,340 | |
Matador Resources Co. (b) | | | 19,500 | | | | 394,485 | |
Northern Oil and Gas, Inc. (a) (b) | | | 37,400 | | | | 211,310 | |
Oasis Petroleum, Inc. (b) | | | 20,100 | | | | 332,454 | |
PDC Energy, Inc. (b) | | | 8,300 | | | | 342,541 | |
| | | | | | | | |
| | | | | | | 1,850,178 | |
| | | | | | | | |
| Oil & Gas Services — 0.8% | |
CARBO Ceramics, Inc. (a) | | | 6,700 | | | | 268,335 | |
Tesco Corp. | | | 25,500 | | | | 326,910 | |
TETRA Technologies, Inc. (b) | | | 39,200 | | | | 261,856 | |
| | | | | | | | |
| | | | | | | 857,101 | |
| | | | | | | | |
| | | | | | | 3,009,301 | |
| | | | | | | | |
| Financial — 24.3% | |
| Banks — 9.5% | |
BBCN Bancorp, Inc. | | | 29,800 | | | | 428,524 | |
Columbia Banking System, Inc. | | | 24,400 | | | | 673,684 | |
East West Bancorp, Inc. | | | 48,226 | | | | 1,866,828 | |
| | | | | | | | |
| | | Number of
Shares | | | Value | |
Glacier Bancorp, Inc. | | | 37,700 | | | $ | 1,046,929 | |
Home Bancshares, Inc. | | | 58,425 | | | | 1,878,948 | |
Sandy Spring Bancorp, Inc. | | | 26,850 | | | | 700,248 | |
Signature Bank (b) | | | 7,500 | | | | 944,700 | |
SVB Financial Group (b) | | | 13,000 | | | | 1,508,910 | |
Wintrust Financial Corp. | | | 23,400 | | | | 1,094,184 | |
| | | | | | | | |
| | | | | | | 10,142,955 | |
| | | | | | | | |
| Diversified Financial — 1.0% | |
Janus Capital Group, Inc. (a) | | | 24,700 | | | | 398,411 | |
JMP Group, Inc. | | | 19,000 | | | | 144,780 | |
Piper Jaffray Cos., Inc. (b) | | | 8,800 | | | | 511,192 | |
| | | | | | | | |
| | | | | | | 1,054,383 | |
| | | | | | | | |
| Insurance — 4.5% | |
Assured Guaranty Ltd. | | | 17,182 | | | | 446,560 | |
Employers Holdings, Inc. | | | 26,900 | | | | 632,419 | |
Enstar Group Ltd. (b) | | | 1,000 | | | | 152,890 | |
Meadowbrook Insurance Group, Inc. | | | 58,000 | | | | 490,680 | |
National Interstate Corp. | | | 19,700 | | | | 587,060 | |
ProAssurance Corp. | | | 39,900 | | | | 1,801,485 | |
Radian Group, Inc. | | | 37,600 | | | | 628,672 | |
Safety Insurance Group, Inc. | | | 1,700 | | | | 108,817 | |
| | | | | | | | |
| | | | | | | 4,848,583 | |
| | | | | | | | |
| Real Estate — 0.5% | |
Forestar Real Esate Group, Inc. (b) | | | 6,700 | | | | 103,180 | |
Terreno Realty Corp. | | | 21,000 | | | | 433,230 | |
| | | | | | | | |
| | | | | | | 536,410 | |
| | | | | | | | |
| Real Estate Investment Trusts (REITS) — 8.8% | |
Acadia Realty Trust | | | 31,200 | | | | 999,336 | |
Associated Estates Realty Corp. | | | 20,600 | | | | 478,126 | |
Catchmark Timber Trust, Inc. Class A | | | 17,610 | | | | 199,345 | |
CBL & Associates Properties, Inc. | | | 37,700 | | | | 732,134 | |
Cedar Realty Trust, Inc. | | | 58,600 | | | | 430,124 | |
First Potomac Realty Trust | | | 48,600 | | | | 600,696 | |
Home Properties, Inc. | | | 7,200 | | | | 472,320 | |
Kilroy Realty Corp. | | | 13,500 | | | | 932,445 | |
LaSalle Hotel Properties | | | 25,850 | | | | 1,046,150 | |
Pebblebrook Hotel Trust | | | 27,400 | | | | 1,250,262 | |
PS Business Parks, Inc. | | | 3,900 | | | | 310,206 | |
Saul Centers, Inc. | | | 15,200 | | | | 869,288 | |
Strategic Hotels & Resorts, Inc. (b) | | | 35,400 | | | | 468,342 | |
Washington Real Estate Investment Trust | | | 19,600 | | | | 542,136 | |
| | | | | | | | |
| | | | | | | 9,330,910 | |
| | | | | | | | |
| | | | | | | 25,913,241 | |
| | | | | | | | |
| Industrial — 25.5% | | | | | |
| Aerospace & Defense — 0.7% | | | | | |
Kaman Corp. | | | 17,200 | | | | 689,548 | |
Kratos Defense & Security Solutions, Inc. (b) | | | 3,800 | | | | 19,076 | |
| | | | | | | | |
| | | | | | | 708,624 | |
| | | | | | | | |
The accompanying notes are an integral part of the financial statements.
119
MML Small Company Value Fund – Portfolio of Investments (Continued)
| | | | | | | | |
| | | Number of
Shares | | | Value | |
| Building Materials — 2.9% | | | | | | | | |
Comfort Systems USA, Inc. | | | 29,400 | | | $ | 503,328 | |
Drew Industries, Inc. (b) | | | 23,000 | | | | 1,174,610 | |
Gibraltar Industries, Inc. (b) | | | 33,100 | | | | 538,206 | |
Quanex Building Products Corp. | | | 7,600 | | | | 142,728 | |
Universal Forest Products, Inc. | | | 13,700 | | | | 728,840 | |
| | | | | | | | |
| | | | | | | 3,087,712 | |
| | | | | | | | |
| Electrical Components & Equipment — 3.1% | |
Advanced Energy Industries, Inc. (b) | | | 31,000 | | | | 734,700 | |
Belden, Inc. | | | 17,000 | | | | 1,339,770 | |
Littelfuse, Inc. | | | 12,800 | | | | 1,237,376 | |
| | | | | | | | |
| | | | | | | 3,311,846 | |
| | | | | | | | |
| Electronics — 2.7% | |
Analogic Corp. | | | 6,400 | | | | 541,504 | |
Badger Meter, Inc. | | | 2,700 | | | | 160,245 | |
Electro Scientific Industries, Inc. | | | 36,000 | | | | 279,360 | |
Fabrinet (b) | | | 27,900 | | | | 494,946 | |
Methode Electronics, Inc. | | | 12,000 | | | | 438,120 | |
Newport Corp. (b) | | | 17,900 | | | | 342,069 | |
Woodward, Inc. | | | 12,830 | | | | 631,621 | |
| | | | | | | | |
| | | | | | | 2,887,865 | |
| | | | | | | | |
| Engineering & Construction — 0.5% | |
Aegion Corp. (b) | | | 27,900 | | | | 519,219 | |
| | | | | | | | |
| Environmental Controls — 1.4% | |
MSA Safety, Inc. | | | 16,600 | | | | 881,294 | |
US Ecology, Inc. | | | 15,200 | | | | 609,824 | |
| | | | | | | | |
| | | | | | | 1,491,118 | |
| | | | | | | | |
| Hand & Machine Tools — 0.6% | |
Franklin Electric Co., Inc. | | | 16,200 | | | | 607,986 | |
| | | | | | | | |
| Machinery – Construction & Mining — 0.5% | |
Astec Industries, Inc. | | | 13,400 | | | | 526,754 | |
| | | | | | | | |
| Machinery – Diversified — 1.3% | |
Cognex Corp. (b) | | | 6,000 | | | | 247,980 | |
Nordson Corp. | | | 15,000 | | | | 1,169,400 | |
| | | | | | | | |
| | | | | | | 1,417,380 | |
| | | | | | | | |
| Manufacturing — 3.6% | |
AptarGroup, Inc. | | | 21,300 | | | | 1,423,692 | |
ESCO Technologies, Inc. | | | 21,600 | | | | 797,040 | |
Matthews International Corp. Class A | | | 21,500 | | | | 1,046,405 | |
Myers Industries, Inc. | | | 35,800 | | | | 630,080 | |
| | | | | | | | |
| | | | | | | 3,897,217 | |
| | | | | | | | |
| Metal Fabricate & Hardware — 1.4% | |
Circor International, Inc. | | | 11,800 | | | | 711,304 | |
RBC Bearings, Inc. | | | 4,900 | | | | 316,197 | |
Sun Hydraulics Corp. | | | 10,900 | | | | 429,242 | |
| | | | | | | | |
| | | | | | | 1,456,743 | |
| | | | | | | | |
| | | | | | | | |
| | | Number of
Shares | | | Value | |
| Transportation — 6.8% | |
Bristow Group, Inc. | | | 2,700 | | | $ | 177,633 | |
GasLog Ltd. | | | 30,700 | | | | 624,745 | |
Genesee & Wyoming, Inc. Class A (b) | | | 19,250 | | | | 1,730,960 | |
Hub Group, Inc. Class A (b) | | | 15,200 | | | | 578,816 | |
Kirby Corp. (b) | | | 10,250 | | | | 827,585 | |
Landstar System, Inc. | | | 29,000 | | | | 2,103,370 | |
Teekay Tankers Ltd. Class A (a) | | | 67,400 | | | | 341,044 | |
Universal Truckload Services, Inc. | | | 17,700 | | | | 504,627 | |
UTI Worldwide, Inc. (b) | | | 30,200 | | | | 364,514 | |
| | | | | | | | |
| | | | | | | 7,253,294 | |
| | | | | | | | |
| | | | | | | 27,165,758 | |
| | | | | | | | |
| Technology — 4.2% | |
| Semiconductors — 2.4% | |
Brooks Automation, Inc. | | | 27,600 | | | | 351,900 | |
Cabot Microelectronics Corp. (b) | | | 19,200 | | | | 908,544 | |
Entegris, Inc. (b) | | | 31,100 | | | | 410,831 | |
Intersil Corp. Class A | | | 11,300 | | | | 163,511 | |
Teradyne, Inc. | | | 34,400 | | | | 680,776 | |
| | | | | | | | |
| | | | | | | 2,515,562 | |
| | | | | | | | |
| Software — 1.8% | |
Progress Software Corp. (b) | | | 22,200 | | | | 599,844 | |
SYNNEX Corp. | | | 17,100 | | | | 1,336,536 | |
| | | | | | | | |
| | | | | | | 1,936,380 | |
| | | | | | | | |
| | | | 4,451,942 | |
| | | | | | | | |
| Utilities — 4.6% | |
| Electric — 3.2% | |
Black Hills Corp. | | | 10,000 | | | | 530,400 | |
Cleco Corp. | | | 21,050 | | | | 1,148,067 | |
El Paso Electric Co. | | | 19,200 | | | | 769,152 | |
NorthWestern Corp. | | | 16,300 | | | | 922,254 | |
| | | | | | | | |
| | | | | | | 3,369,873 | |
| | | | | | | | |
| Gas — 1.4% | |
PNM Resources, Inc. | | | 21,400 | | | | 634,082 | |
Southwest Gas Corp. | | | 14,600 | | | | 902,426 | |
| | | | | | | | |
| | | | | | | 1,536,508 | |
| | | | | | | | |
| | | | 4,906,381 | |
| | | | | | | | |
| | |
TOTAL COMMON STOCK
(Cost $70,419,849) | | | | | | | 102,202,775 | |
| | | | | | | | |
| | |
TOTAL EQUITIES
(Cost $70,419,849) | | | | | | | 102,202,775 | |
| | | | | | | | |
|
| MUTUAL FUNDS — 3.3% | |
| Diversified Financial — 3.3% | |
iShares Russell 2000 Value Index Fund (a) | | | 5,700 | | | | 579,576 | |
The accompanying notes are an integral part of the financial statements.
120
MML Small Company Value Fund – Portfolio of Investments (Continued)
| | | | | | | | |
| | | Number of
Shares | | | Value | |
State Street Navigator Securities Lending Prime Portfolio (c) | | | 2,988,517 | | | $ | 2,988,517 | |
T. Rowe Price Reserve Investment Fund | | | 1,001 | | | | 1,001 | |
| | | | | | | | |
| | | | | | | 3,569,094 | |
| | | | | | | | |
| | |
TOTAL MUTUAL FUNDS
(Cost $3,465,825) | | | | | | | 3,569,094 | |
| | | | | | | | |
| | |
TOTAL LONG-TERM INVESTMENTS
(Cost $73,885,674) | | | | | | | 105,771,869 | |
| | | | | | | | |
| | |
| | | Principal
Amount | | | | |
| SHORT-TERM INVESTMENTS — 4.6% | |
| Repurchase Agreement — 4.6% | |
State Street Bank & Trust Co. Repurchase Agreement, dated 12/31/14, 0.010%, due 1/02/15 (d) | | $ | 4,915,649 | | | | 4,915,649 | |
| | | | | | | | |
| Time Deposits — 0.0% | |
Euro Time Deposit
0.010% 1/02/15 | | | 57 | | | | 57 | |
| | | | | | | | |
| | |
TOTAL SHORT-TERM INVESTMENTS
(Cost $4,915,706) | | | | | | | 4,915,706 | |
| | | | | | | | |
| | |
TOTAL INVESTMENTS — 103.9%
(Cost $78,801,380) (e) | | | | | | | 110,687,575 | |
| | |
| Other Assets/(Liabilities) — (3.9)% | | | | | | | (4,173,644 | ) |
| | | | | | | | |
| | |
| NET ASSETS — 100.0% | | | | | | $ | 106,513,931 | |
| | | | | | | | |
Notes to Portfolio of Investments
Percentages are stated as a percent of net assets.
| (a) | Denotes all or a portion of security on loan. The total value of securities on loan as of December 31, 2014, was $2,910,195 or 2.73% of net assets. Total securities on loan may not correspond with the amounts identified in the Portfolio of Investments because pending sales may be in the process of recall from the brokers. (Note 2). |
| (b) | Non-income producing security. |
| (c) | Represents investment of security lending collateral. (Note 2). |
| (d) | Maturity value of $4,915,652. Collateralized by U.S. Government Agency obligations with a rate of 2.750%, maturity date of 11/15/28, and an aggregate market value, including accrued interest, of $5,014,352. |
| (e) | See Note 6 for aggregate cost for federal tax purposes. |
The accompanying notes are an integral part of the financial statements.
121
MML Small/Mid Cap Value Fund – Portfolio of Investments
December 31, 2014
| | | | | | | | |
| | | Number of
Shares | | | Value | |
| EQUITIES — 101.0% | |
|
| COMMON STOCK — 101.0% | |
| Basic Materials — 2.3% | |
| Chemicals — 1.5% | |
A. Schulman, Inc. | | | 53,090 | | | $ | 2,151,738 | |
Huntsman Corp. | | | 64,980 | | | | 1,480,244 | |
| | | | | | | | |
| | | | | | | 3,631,982 | |
| | | | | | | | |
| Iron & Steel — 0.8% | |
Steel Dynamics, Inc. | | | 104,239 | | | | 2,057,678 | |
| | | | | | | | |
| | | | | | | 5,689,660 | |
| | | | | | | | |
| Communications — 5.0% | |
| Internet — 1.2% | |
CDW Corp. | | | 83,010 | | | | 2,919,461 | |
| | | | | | | | |
| Telecommunications — 3.8% | |
Amdocs Ltd. | | | 62,698 | | | | 2,925,175 | |
Anixter International, Inc. (a) | | | 21,960 | | | | 1,942,582 | |
Finisar Corp. (a) | | | 95,540 | | | | 1,854,431 | |
Harris Corp. | | | 40,280 | | | | 2,892,910 | |
| | | | | | | | |
| | | | | | | 9,615,098 | |
| | | | | | | | |
| | | | | | | 12,534,559 | |
| | | | | | | | |
| Consumer, Cyclical — 20.1% | |
| Apparel — 0.8% | |
Crocs, Inc. (a) | | | 168,220 | | | | 2,101,068 | |
| | | | | | | | |
| Automotive & Parts — 3.7% | |
Dana Holding Corp. | | | 126,043 | | | | 2,740,175 | |
Lear Corp. | | | 33,326 | | | | 3,268,614 | |
Tenneco, Inc. (a) | | | 61,011 | | | | 3,453,833 | |
| | | | | | | | |
| | | | | | | 9,462,622 | |
| | | | | | | | |
| Distribution & Wholesale — 1.3% | |
WESCO International, Inc. (a) | | | 41,840 | | | | 3,188,626 | |
| | | | | | | | |
| Home Builders — 3.2% | |
Meritage Home Corp. (a) | | | 83,414 | | | | 3,002,070 | |
PulteGroup, Inc. | | | 121,550 | | | | 2,608,463 | |
Thor Industries, Inc. | | | 44,000 | | | | 2,458,280 | |
| | | | | | | | |
| | | | | | | 8,068,813 | |
| | | | | | | | |
| Retail — 11.1% | |
Big Lots, Inc. | | | 73,460 | | | | 2,939,869 | |
Bloomin’ Brands, Inc. (a) | | | 178,520 | | | | 4,420,155 | |
Brown Shoe Co., Inc. | | | 81,750 | | | | 2,628,263 | |
The Children’s Place Retail Store, Inc. | | | 55,894 | | | | 3,185,958 | |
Dillard’s, Inc. Class A | | | 22,610 | | | | 2,830,320 | |
GameStop Corp. Class A | | | 64,223 | | | | 2,170,737 | |
Insight Enterprises, Inc. (a) | | | 103,630 | | | | 2,682,981 | |
Office Depot, Inc. (a) | | | 558,687 | | | | 4,790,741 | |
Pier 1 Imports, Inc. | | | 145,370 | | | | 2,238,698 | |
| | | | | | | | |
| | | | | | | 27,887,722 | |
| | | | | | | | |
| | | | | | | 50,708,851 | |
| | | | | | | | |
| | | | | | | | |
| | | Number of
Shares | | | Value | |
| Consumer, Non-cyclical — 10.6% | |
| Commercial Services — 2.6% | |
Booz Allen Hamilton Holding Corp. | | | 124,600 | | | $ | 3,305,638 | |
Convergys Corp. | | | 28,066 | | | | 571,705 | |
Genpact Ltd. (a) | | | 137,567 | | | | 2,604,143 | |
| | | | | | | | |
| | | | | | | 6,481,486 | |
| | | | | | | | |
| Foods — 2.6% | |
Dean Foods Co. | | | 225,634 | | | | 4,372,787 | |
Ingredion, Inc. | | | 26,660 | | | | 2,261,834 | |
| | | | | | | | |
| | | | | | | 6,634,621 | |
| | | | | | | | |
| Health Care – Services — 3.3% | |
LifePoint Hospitals, Inc. (a) | | | 43,320 | | | | 3,115,141 | |
Molina Healthcare, Inc. (a) | | | 34,910 | | | | 1,868,732 | |
WellCare Health Plans, Inc. (a) | | | 41,340 | | | | 3,392,361 | |
| | | | | | | | |
| | | | | | | 8,376,234 | |
| | | | | | | | |
| Household Products — 2.1% | |
Avery Dennison Corp. | | | 50,625 | | | | 2,626,425 | |
Helen of Troy Ltd. (a) | | | 38,670 | | | | 2,515,870 | |
| | | | | | | | |
| | | | | | | 5,142,295 | |
| | | | | | | | |
| | | | | | | 26,634,636 | |
| | | | | | | | |
| Energy — 2.0% | |
| Oil & Gas — 2.0% | |
Bill Barrett Corp. (a) | | | 147,986 | | | | 1,685,561 | |
Rosetta Resources, Inc. (a) | | | 86,300 | | | | 1,925,353 | |
SM Energy Co. | | | 39,440 | | | | 1,521,595 | |
| | | | | | | | |
| | | | | | | 5,132,509 | |
| | | | | | | | |
| | | | | | | 5,132,509 | |
| | | | | | | | |
| Financial — 29.1% | |
| Banks — 8.6% | |
Associated Banc-Corp. | | | 101,887 | | | | 1,898,155 | |
Comerica, Inc. | | | 54,995 | | | | 2,575,966 | |
Huntington Bancshares, Inc. | | | 325,515 | | | | 3,424,418 | |
Popular, Inc. (a) | | | 97,959 | | | | 3,335,504 | |
Susquehanna Bancshares, Inc. | | | 239,048 | | | | 3,210,414 | |
Synovus Financial Corp. | | | 77,110 | | | | 2,088,910 | |
Webster Financial Corp. | | | 64,080 | | | | 2,084,522 | |
Zions Bancorp | | | 101,875 | | | | 2,904,456 | |
| | | | | | | | |
| | | | | | | 21,522,345 | |
| | | | | | | | |
| Diversified Financial — 2.3% | |
E*TRADE Financial Corp. (a) | | | 108,184 | | | | 2,624,003 | |
SLM Corp. | | | 319,721 | | | | 3,257,957 | |
| | | | | | | | |
| | | | | | | 5,881,960 | |
| | | | | | | | |
| Insurance — 10.0% | |
American Financial Group, Inc. | | | 61,640 | | | | 3,742,781 | |
Aspen Insurance Holdings Ltd. | | | 79,170 | | | | 3,465,271 | |
Assurant, Inc. | | | 28,100 | | | | 1,922,883 | |
CNO Financial Group, Inc. | | | 194,120 | | | | 3,342,746 | |
The accompanying notes are an integral part of the financial statements.
122
MML Small/Mid Cap Value Fund – Portfolio of Investments (Continued)
| | | | | | | | |
| | | Number of
Shares | | | Value | |
Essent Group Ltd. (a) | | | 93,830 | | | $ | 2,412,369 | |
The Hanover Insurance Group, Inc. | | | 48,890 | | | | 3,486,835 | |
PartnerRe Ltd. | | | 29,170 | | | | 3,329,172 | |
StanCorp Financial Group, Inc. | | | 7,793 | | | | 544,419 | |
Validus Holdings Ltd. | | | 72,510 | | | | 3,013,516 | |
| | | | | | | | |
| | | | | | | 25,259,992 | |
| | | | | | | | |
| Real Estate Investment Trusts (REITS) — 7.5% | |
DDR Corp. | | | 136,320 | | | | 2,502,835 | |
DiamondRock Hospitality Co. | | | 230,318 | | | | 3,424,829 | |
LTC Properties, Inc. | | | 76,060 | | | | 3,283,510 | |
Medical Properties Trust, Inc. | | | 206,030 | | | | 2,839,093 | |
Mid-America Apartment Communities, Inc. | | | 29,810 | | | | 2,226,211 | |
Parkway Properties, Inc. | | | 123,636 | | | | 2,273,666 | |
STAG Industrial, Inc. | | | 92,810 | | | | 2,273,845 | |
| | | | | | | | |
| | | | | | | 18,823,989 | |
| | | | | | | | |
| Savings & Loans — 0.7% | |
First Niagara Financial Group, Inc. | | | 216,888 | | | | 1,828,366 | |
| | | | | | | | |
| | | | | | | 73,316,652 | |
| | | | | | | | |
| Industrial — 17.1% | |
| Aerospace & Defense — 1.5% | |
Spirit AeroSystems Holdings, Inc. Class A (a) | | | 89,120 | | | | 3,835,725 | |
| | | | | | | | |
| Electrical Components & Equipment — 0.6% | |
General Cable Corp. | | | 97,051 | | | | 1,446,060 | |
| | | | | | | | |
| Electronics — 5.6% | |
Arrow Electronics, Inc. (a) | | | 60,913 | | | | 3,526,253 | |
Avnet, Inc. | | | 79,090 | | | | 3,402,452 | |
Jabil Circuit, Inc. | | | 95,077 | | | | 2,075,531 | |
TTM Technologies, Inc. (a) | | | 216,007 | | | | 1,626,533 | |
Vishay Intertechnology, Inc. | | | 245,916 | | | | 3,479,711 | |
| | | | | | | | |
| | | | | | | 14,110,480 | |
| | | | | | | | |
| Engineering & Construction — 3.8% | |
AECOM Technology Corp. (a) | | | 126,433 | | | | 3,839,770 | |
Granite Construction, Inc. | | | 69,795 | | | | 2,653,606 | |
Tutor Perini Corp. (a) | | | 125,847 | | | | 3,029,138 | |
| | | | | | | | |
| | | | | | | 9,522,514 | |
| | | | | | | | |
| Hand & Machine Tools — 1.1% | |
Regal-Beloit Corp. | | | 37,530 | | | | 2,822,256 | |
| | | | | | | | |
| Machinery – Construction & Mining — 0.7% | |
Terex Corp. | | | 65,430 | | | | 1,824,188 | |
| | | | | | | | |
| Manufacturing — 1.1% | |
ITT Corp. | | | 66,610 | | | | 2,695,041 | |
| | | | | | | | |
| Packaging & Containers — 0.8% | |
Graphic Packaging Holding Co. (a) | | | 153,670 | | | | 2,092,985 | |
| | | | | | | | |
| Transportation — 1.9% | |
Con-way, Inc. | | | 34,910 | | | | 1,716,874 | |
| | | | | | | | |
| | | Number of
Shares | | | Value | |
Ryder System, Inc. | | | 32,340 | | | $ | 3,002,769 | |
| | | | | | | | |
| | | | | | | 4,719,643 | |
| | | | | | | | |
| | | | | | | 43,068,892 | |
| | | | | | | | |
| Technology — 8.0% | |
| Computers — 2.3% | |
Brocade Communications Systems, Inc. | | | 216,120 | | | | 2,558,861 | |
NCR Corp. (a) | | | 112,200 | | | | 3,269,508 | |
| | | | | | | | |
| | | | | | | 5,828,369 | |
| | | | | | | | |
| Semiconductors — 4.2% | |
Advanced Micro Devices, Inc. (a) | | | 360,550 | | | | 962,669 | |
Entegris, Inc. (a) | | | 107,878 | | | | 1,425,068 | |
Fairchild Semiconductor International, Inc. (a) | | | 119,690 | | | | 2,020,367 | |
Lam Research Corp. | | | 44,215 | | | | 3,508,018 | |
Teradyne, Inc. | | | 132,230 | | | | 2,616,832 | |
| | | | | | | | |
| | | | | | | 10,532,954 | |
| | | | | | | | |
| Software — 1.5% | |
Electronic Arts, Inc. (a) | | | 82,150 | | | | 3,862,282 | |
| | | | | | | | |
| | | | | | | 20,223,605 | |
| | | | | | | | |
| Utilities — 6.8% | |
| Electric — 1.4% | |
Westar Energy, Inc. | | | 85,720 | | | | 3,535,093 | |
| | | | | | | | |
| Gas — 5.4% | |
Atmos Energy Corp. | | | 54,171 | | | | 3,019,492 | |
PNM Resources, Inc. | | | 125,543 | | | | 3,719,839 | |
Southwest Gas Corp. | | | 59,140 | | | | 3,655,443 | |
UGI Corp. | | | 82,205 | | | | 3,122,146 | |
| | | | | | | | |
| | | | | | | 13,516,920 | |
| | | | | | | | |
| | | | | | | 17,052,013 | |
| | | | | | | | |
| | |
TOTAL COMMON STOCK
(Cost $222,218,393) | | | | | | | 254,361,377 | |
| | | | | | | | |
| | |
TOTAL EQUITIES
(Cost $222,218,393) | | | | | | | 254,361,377 | |
| | | | | | | | |
| | |
TOTAL LONG-TERM INVESTMENTS
(Cost $222,218,393) | | | | | | | 254,361,377 | |
| | | | | | | | |
The accompanying notes are an integral part of the financial statements.
123
MML Small/Mid Cap Value Fund – Portfolio of Investments (Continued)
| | | | | | | | |
| | | Principal
Amount | | | Value | |
| SHORT-TERM INVESTMENTS — 1.4% | |
| Repurchase Agreement — 1.4% | |
State Street Bank & Trust Co. Repurchase Agreement, dated 12/31/14, 0.010%, due 1/02/15 (b) | | $ | 3,444,657 | | | $ | 3,444,657 | |
| | | | | | | | |
| | |
TOTAL SHORT-TERM INVESTMENTS
(Cost $3,444,657) | | | | | | | 3,444,657 | |
| | | | | | | | |
| | |
TOTAL INVESTMENTS — 102.4%
(Cost $225,663,050) (c) | | | | | | | 257,806,034 | |
| | |
| Other Assets/(Liabilities) — (2.4)% | | | | | | | (5,922,928 | ) |
| | | | | | | | |
| | |
| NET ASSETS — 100.0% | | | | | | $ | 251,883,106 | |
| | | | | | | | |
Notes to Portfolio of Investments
Percentages are stated as a percent of net assets.
| (a) | Non-income producing security. |
| (b) | Maturity value of $3,444,659. Collateralized by U.S. Government Agency obligations with a rate of 2.500%, maturity date of 3/20/28, and an aggregate market value, including accrued interest, of $3,515,449. |
| (c) | See Note 6 for aggregate cost for federal tax purposes. |
Country weightings, as a percentage of net assets, is as follows:
| | | | |
United States | | | 91.6 | % |
Bermuda | | | 6.9 | % |
Puerto Rico | | | 1.3 | % |
United Kingdom | | | 1.2 | % |
| | | | |
Total Long-Term Investments | | | 101.0 | % |
Short-Term Investments and Other Assets and Liabilities | | | (1.0 | )% |
| | | | |
Net Assets | | | 100.0 | % |
| | | | |
The accompanying notes are an integral part of the financial statements.
124
MML Total Return Bond Fund – Portfolio of Investments
December 31, 2014
| | | | | | | | |
| | | Number of
Shares | | | Value | |
| EQUITIES — 0.3% | |
|
| PREFERRED STOCK — 0.3% | |
| Financial — 0.3% | |
| Savings & Loans — 0.3% | |
GMAC Capital Trust I VRN
8.125% | | | 44,000 | | | $ | 1,160,720 | |
| | | | | | | | |
| | |
TOTAL PREFERRED STOCK
(Cost $1,100,000) | | | | | | | 1,160,720 | |
| | | | | | | | |
| | |
TOTAL EQUITIES
(Cost $1,100,000) | | | | | | | 1,160,720 | |
| | | | | | | | |
| | |
| | | Principal
Amount | | | | |
| BONDS & NOTES — 95.3% | |
|
| CORPORATE DEBT — 17.4% | |
| Auto Manufacturers — 0.3% | |
Daimler Finance NA LLC FRN (a)
0.831% 1/09/15 | | $ | 1,300,000 | | | | 1,300,065 | |
| | | | | | | | |
| Banks — 3.3% | |
Bank of America Corp. FRN
0.521% 6/15/16 | | | 2,500,000 | | | | 2,483,110 | |
Citigroup, Inc. FRN
1.194% 7/25/16 | | | 2,800,000 | | | | 2,817,735 | |
HBOS PLC (a)
6.750% 5/21/18 | | | 100,000 | | | | 111,450 | |
JPMorgan Chase & Co. FRN
0.784% 4/25/18 | | | 700,000 | | | | 698,395 | |
Morgan Stanley FRN
1.514% 4/25/18 | | | 1,000,000 | | | | 1,015,913 | |
Royal Bank of Scotland Group PLC
2.550% 9/18/15 | | | 1,000,000 | | | | 1,010,012 | |
Wells Fargo & Co. FRN
0.534% 6/02/17 | | | 5,500,000 | | | | 5,476,168 | |
| | | | | | | | |
| | | | | | | 13,612,783 | |
| | | | | | | | |
| Commercial Services — 0.2% | |
Catholic Health Initiatives
4.350% 11/01/42 | | | 750,000 | | | | 744,609 | |
| | | | | | | | |
| Diversified Financial — 8.0% | | | | | | | | |
American Honda Finance Corp. FRN
0.235% 6/04/15 | | | 2,400,000 | | | | 2,399,892 | |
Capital One Bank USA NA
2.250% 2/13/19 | | | 1,000,000 | | | | 992,758 | |
Federal Home Loan Mortgage Corp.
0.875% 3/07/18 | | | 100,000 | | | | 98,861 | |
Federal Home Loan Mortgage Corp.
1.000% 9/29/17 | | | 1,200,000 | | | | 1,198,363 | |
Federal Home Loan Mortgage Corp.
1.250% 8/01/19 | | | 1,200,000 | | | | 1,176,533 | |
Federal Home Loan Mortgage Corp.
1.250% 10/02/19 | | | 700,000 | | | | 685,875 | |
| | | | | | | | |
| | | Principal
Amount | | | Value | |
Federal Home Loan Mortgage Corp.
3.750% 3/27/19 | | $ | 400,000 | | | $ | 434,455 | |
Federal National Mortgage Association
0.875% 12/20/17 | | | 100,000 | | | | 99,119 | |
Federal National Mortgage Association
0.875% 2/08/18 | | | 800,000 | | | | 791,670 | |
Federal National Mortgage Association
0.875% 5/21/18 | | | 100,000 | | | | 98,437 | |
Federal National Mortgage Association
1.125% 4/27/17 | | | 600,000 | | | | 602,582 | |
Federal National Mortgage Association
1.250% 1/30/17 | | | 800,000 | | | | 807,157 | |
Federal National Mortgage Association
1.875% 9/18/18 | | | 200,000 | | | | 203,165 | |
Federal National Mortgage Association
5.000% 5/11/17 | | | 2,300,000 | | | | 2,515,671 | |
Federal National Mortgage Association
5.375% 6/12/17 | | | 100,000 | | | | 110,513 | |
Ford Motor Credit Co. LLC FRN
0.682% 11/08/16 | | | 1,400,000 | | | | 1,393,832 | |
Ford Motor Credit Co. LLC
3.875% 1/15/15 | | | 2,300,000 | | | | 2,301,741 | |
Ford Motor Credit Co. LLC
5.625% 9/15/15 | | | 1,000,000 | | | | 1,031,843 | |
Ford Motor Credit Co. LLC
7.000% 4/15/15 | | | 200,000 | | | | 203,441 | |
The Goldman Sachs Group, Inc.
5.950% 1/18/18 | | | 1,750,000 | | | | 1,944,194 | |
JP Morgan Chase & Co. FRN
0.752% 2/15/17 | | | 2,700,000 | | | | 2,693,182 | |
JP Morgan Chase & Co.
5.875% 6/13/16 | | | 3,100,000 | | | | 3,304,535 | |
Macquarie Bank Ltd. (a)
6.625% 4/07/21 | | | 1,600,000 | | | | 1,847,045 | |
Merrill Lynch & Co., Inc.
6.875% 4/25/18 | | | 4,400,000 | | | | 5,053,752 | |
Navient LLC
8.450% 6/15/18 | | | 1,500,000 | | | | 1,672,500 | |
| | | | | | | | |
| | | | | | | 33,661,116 | |
| | | | | | | | |
| Electric — 1.4% | |
Duquesne Light Holdings, Inc. (a)
6.400% 9/15/20 | | | 1,500,000 | | | | 1,751,711 | |
Entergy Corp.
3.625% 9/15/15 | | | 100,000 | | | | 101,424 | |
Florida Power & Light Co.
3.800% 12/15/42 | | | 1,200,000 | | | | 1,211,238 | |
MidAmerican Energy Co.
4.800% 9/15/43 | | | 1,400,000 | | | | 1,625,534 | |
Southwestern Electric Power Co.
6.200% 3/15/40 | | | 800,000 | | | | 1,037,457 | |
| | | | | | | | |
| | | | | | | 5,727,364 | |
| | | | | | | | |
The accompanying notes are an integral part of the financial statements.
125
MML Total Return Bond Fund – Portfolio of Investments (Continued)
| | | | | | | | |
| | | Principal
Amount | | | Value | |
| Gas — 0.5% | |
Florida Gas Transmission Co. LLC (a)
7.900% 5/15/19 | | $ | 1,000,000 | | | $ | 1,201,750 | |
Southern California Gas Co.
3.750% 9/15/42 | | | 1,000,000 | | | | 992,195 | |
| | | | | | | | |
| | | | | | | 2,193,945 | |
| | | | | | | | |
| Machinery – Diversified — 0.8% | |
John Deere Capital Corp. FRN
0.330% 4/12/16 | | | 3,400,000 | | | | 3,397,691 | |
| | | | | | | | |
| Pipelines — 0.3% | |
Energy Transfer Partners LP
3.600% 2/01/23 | | | 1,250,000 | | | | 1,209,585 | |
| | | | | | | | |
| Retail — 0.1% | |
Wal-Mart Stores, Inc.
4.000% 4/11/43 | | | 400,000 | | | | 414,992 | |
| | | | | | | | |
| Telecommunications — 2.5% | |
BellSouth Corp. (a)
4.182% 4/26/21 | | | 3,900,000 | | | | 3,938,384 | |
Verizon Communications, Inc.
0.700% 11/02/15 | | | 3,800,000 | | | | 3,798,302 | |
Verizon Communications, Inc. FRN
1.771% 9/15/16 | | | 1,000,000 | | | | 1,018,130 | |
Verizon Communications, Inc. FRN
1.991% 9/14/18 | | | 200,000 | | | | 208,051 | |
Verizon Communications, Inc.
2.500% 9/15/16 | | | 1,509,000 | | | | 1,542,462 | |
| | | | | | | | |
| | | | | | | 10,505,329 | |
| | | | | | | | |
| | |
TOTAL CORPORATE DEBT
(Cost $72,216,415) | | | | | | | 72,767,479 | |
| | | | | | | | |
|
| MUNICIPAL OBLIGATIONS — 0.8% | |
Los Angeles Community College District BAB
6.600% 8/01/42 | | | 1,000,000 | | | | 1,439,840 | |
Los Angeles Community College District BAB
6.750% 8/01/49 | | | 900,000 | | | | 1,341,324 | |
State of California BAB
5.700% 11/01/21 | | | 500,000 | | | | 592,335 | |
| | | | | | | | |
| | | | | | | 3,373,499 | |
| | | | | | | | |
| | |
TOTAL MUNICIPAL OBLIGATIONS
(Cost $2,548,776) | | | | | | | 3,373,499 | |
| | | | | | | | |
| | | | | | | | |
| | | Principal
Amount | | | Value | |
NON-U.S. GOVERNMENT AGENCY
OBLIGATIONS — 17.9% | |
| Automobile ABS — 2.1% | |
Ally Auto Receivables Trust,
Series 2014-1, Class A2
0.480% 2/15/17 | | $ | 3,600,000 | | | $ | 3,598,933 | |
Nissan Auto Lease Trust, Series 2014-A, Class A2B FRN
0.321% 9/15/16 | | | 1,600,000 | | | | 1,600,003 | |
Santander Drive Auto Receivables Trust,
Series 2014-3, Class A2B FRN
0.441% 8/15/17 | | | 3,734,641 | | | | 3,734,649 | |
| | | | | | | | |
| | | | | | | 8,933,585 | |
| | | | | | | | |
| Commercial MBS — 4.7% | | | | | | | | |
Banc of America Large Loan, Inc.,
Series 2009-UB2, Class A4AA VRN (a)
5.670% 2/24/51 | | | 862,424 | | | | 939,870 | |
Bear Stearns Commercial Mortgage Securities, Series 2007-PW16, Class A2 VRN
5.655% 6/11/40 | | | 147,928 | | | | 149,362 | |
Credit Suisse Commercial Mortgage Trust Series, Series 2006-C5, Class A1A
5.297% 12/15/39 | | | 2,351,479 | | | | 2,494,613 | |
Credit Suisse Commercial Mortgage Trust Series, Series 2006-C4, Class A1A
5.460% 9/15/39 | | | 1,372,623 | | | | 1,443,528 | |
DBRR Trust, Series 2013-EZ3, Class A VRN (a)
1.636% 12/18/49 | | | 2,048,310 | | | | 2,058,871 | |
JP Morgan Chase Commercial Mortgage Securities Corp., Series 2011-C4, Class A2 (a)
3.341% 7/15/46 | | | 1,514,639 | | | | 1,554,584 | |
JP Morgan Chase Commercial Mortgage Securities Corp., Series 2010-C2, Class A2 (a)
3.616% 11/15/43 | | | 1,200,000 | | | | 1,256,295 | |
JP Morgan Chase Commercial Mortgage Securities Corp., Series 2011-C4, Class ASB (a)
3.734% 7/15/46 | | | 1,275,000 | | | | 1,343,635 | |
JP Morgan Chase Commercial Mortgage Securities Corp., Series 2011-C4, Class A3 (a)
4.106% 7/15/46 | | | 1,945,000 | | | | 2,076,921 | |
LB-UBS Commercial Mortgage Trust,
Series 2006-C1, Class A4
5.156% 2/15/31 | | | 1,953,442 | | | | 2,000,146 | |
The accompanying notes are an integral part of the financial statements.
126
MML Total Return Bond Fund – Portfolio of Investments (Continued)
| | | | | | | | |
| | | Principal
Amount | | | Value | |
Merrill Lynch Mortgage Trust,
Series 2005-CIP1, Class AM VRN
5.107% 7/12/38 | | $ | 1,110,000 | | | $ | 1,128,326 | |
Morgan Stanley Reremic Trust,
Series 2010-GG10, Class A4A VRN (a)
5.796% 8/15/45 | | | 1,295,945 | | | | 1,389,017 | |
Wachovia Bank Commercial Mortgage Trust, Series 2006-C23, Class A4 VRN
5.418% 1/15/45 | | | 313,224 | | | | 321,590 | |
Wells Fargo Commercial Mortgage Trust, Series 2010-C1, Class A2 (a)
4.393% 11/15/43 | | | 500,000 | | | | 544,921 | |
WF-RBS Commercial Mortgage Trust,
Series 2011-C4, Class A4 VRN (a)
4.902% 6/15/44 | | | 800,000 | | | | 900,281 | |
| | | | | | | | |
| | | | | | | 19,601,960 | |
| | | | | | | | |
| Home Equity ABS — 2.5% | | | | | | | | |
Bear Stearns I Trust, Series 2006-HE1, Class 1M1 FRN
0.579% 12/25/35 | | | 2,000,000 | | | | 1,892,286 | |
Countrywide Asset-Backed Certificates,
Series 2006-15, Class A3 VRN
5.689% 10/25/46 | | | 2,625,071 | | | | 2,265,671 | |
GSAA Home Equity Trust,
Series 2006-20, Class 1A2 FRN
0.350% 12/25/46 | | | 1,319,059 | | | | 733,631 | |
New Century Home Equity Loan Trust,
Series 2005-2, Class M1 FRN
0.600% 6/25/35 | | | 2,092,132 | | | | 2,041,166 | |
Soundview Home Loan Trust,
Series 2006-3, Class A3 FRN
0.330% 11/25/36 | | | 1,456,657 | | | | 1,226,789 | |
Wells Fargo Home Equity Trust,
Series 2004-2, Class M3 FRN
0.870% 10/25/34 | | | 2,311,204 | | | | 2,141,715 | |
| | | | | | | | |
| | | | | | | 10,301,258 | |
| | | | | | | | |
| Other ABS — 1.9% | | | | | | | | |
A Voce CLO Ltd., Series 2014-1A, Class A1B FRN (a)
1.693% 7/15/26 | | | 1,180,000 | | | | 1,167,211 | |
Blue Hill CLO Ltd., Series 2013-1A, Class A FRN (a)
1.711% 1/15/26 | | | 950,000 | | | | 943,148 | |
Cedar Funding CLO Ltd., Series 2014-3A, Class A1 (a)
1.762% 5/20/26 | | | 1,175,000 | | | | 1,168,520 | |
Flagship CLO Ltd., Series 2013-7A, Class A1 FRN (a)
1.701% 1/20/26 | | | 1,000,000 | | | | 992,267 | |
| | | | | | | | |
| | | Principal
Amount | | | Value | |
Hillmark Funding, Series 2006-1A, Class A1 FRN (a)
0.481% 5/21/21 | | $ | 386,273 | | | $ | 381,953 | |
Magnetite CLO Ltd., Series 2014-8A, Class A FRN (a)
1.711% 4/15/26 | | | 995,000 | | | | 988,338 | |
RAMP Trust, Series 2005-RS2, Class M2 FRN
0.650% 2/25/35 | | | 2,401,785 | | | | 2,357,836 | |
| | | | | | | | |
| | | | | | | 7,999,273 | |
| | | | | | | | |
| Student Loans ABS — 2.9% | | | | | | | | |
SLC Student Loan Trust, Series 2005-2, Class B FRN
0.521% 3/15/40 | | | 473,886 | | | | 424,276 | |
SLM Student Loan Trust, Series 2007-1, Class A5 FRN
0.324% 1/26/26 | | | 2,140,000 | | | | 2,089,617 | |
SLM Student Loan Trust, Series 2005-4, Class B FRN
0.414% 7/25/40 | | | 247,951 | | | | 223,781 | |
SLM Student Loan Trust,
2005-9 B FRN
0.534% 1/25/41 | | | 240,479 | | | | 217,460 | |
SLM Student Loan Trust,
Series 2011-1, Class A1 FRN
0.690% 3/25/26 | | | 2,036,745 | | | | 2,039,365 | |
SLM Student Loan Trust,
Series 2012-2, Class A FRN
0.870% 1/25/29 | | | 2,043,878 | | | | 2,049,966 | |
SLM Student Loan Trust,
Series 2008-6, Class A3 FRN
0.984% 1/25/19 | | | 2,060,000 | | | | 2,069,284 | |
SLM Student Loan Trust,
Series 2007-6, Class B FRN
1.084% 4/27/43 | | | 680,947 | | | | 622,672 | |
SLM Student Loan Trust,
Series 2007-8, Class B FRN
1.234% 4/27/43 | | | 234,127 | | | | 221,522 | |
SLM Student Loan Trust,
Series 2008-9, Class A FRN
1.734% 4/25/23 | | | 2,016,622 | | | | 2,075,301 | |
| | | | | | | | |
| | | | | | | 12,033,244 | |
| | | | | | | | |
| WL Collateral CMO — 3.8% | | | | | | | | |
Banc of America Funding Ltd.,
Series 2012-R5, Class A FRN (a)
0.414% 10/03/39 | | | 1,058,736 | | | | 1,058,590 | |
Chase Mortgage Finance Corp.,
Series 2006-A1, Class 4A1 FRN
5.628% 9/25/36 | | | 71,102 | | | | 65,257 | |
Chase Mortgage Finance Trust,
Series 2007-A1, Class 11A4 FRN
2.479% 3/25/37 | | | 1,196,803 | | | | 1,068,252 | |
The accompanying notes are an integral part of the financial statements.
127
MML Total Return Bond Fund – Portfolio of Investments (Continued)
| | | | | | | | |
| | | Principal
Amount | | | Value | |
Citigroup Mortgage Loan Trust,
Series 2005-11, Class A2A FRN
2.540% 10/25/35 | | $ | 485,005 | | | $ | 475,467 | |
First Horizon Mortgage Pass-Through Trust, Series 2005-AR5, Class 2A1 FRN
2.613% 11/25/35 | | | 2,240,872 | | | | 2,077,743 | |
GSR Mortgage Loan Trust,
Series 2005-AR6, Class 1A1 FRN
2.655% 9/25/35 | | | 460,691 | | | | 459,033 | |
IndyMac Index Mortgage Loan Trust,
Series 2005-AR19, Class A1 FRN
4.654% 10/25/35 | | | 2,266,850 | | | | 1,909,823 | |
JP Morgan Alternative Loan Trust,
Series 2005-A2, Class 1A1 FRN
0.690% 1/25/36 | | | 410,549 | | | | 362,480 | |
Nomura Asset Acceptance Corp. Alternative Loan Trust,
Series 2005-AR1, Class M1 FRN
0.740% 2/25/35 | | | 3,200,000 | | | | 2,813,751 | |
Opteum Mortgage Acceptance Corp.,
Series 2005-5, Class 1APT FRN
0.450% 12/25/35 | | | 393,735 | | | | 341,525 | |
Washington Mutual Mortgage Pass-Through Certificates,, Series 2007-OA6, Class 1A FRN
0.923% 7/25/47 | | | 2,366,366 | | | | 1,993,663 | |
Washington Mutual Mortgage Pass-Through Certificates,
Series 2006-1 Trust, Class 3A2
5.750% 2/25/36 | | | 2,389,997 | | | | 2,141,241 | |
Wells Fargo Mortgage Backed Securities Trust, Series 2006-AR10, Class 1A1 FRN
2.610% 7/25/36 | | | 500,137 | | | | 477,616 | |
Wells Fargo Mortgage Backed Securities Trust, Series 2004-DD, Class 2A6 FRN
2.615% 1/25/35 | | | 815,167 | | | | 812,600 | |
| | | | | | | | |
| | | | | | | 16,057,041 | |
| | | | | | | | |
| | |
TOTAL NON-U.S. GOVERNMENT AGENCY OBLIGATIONS
(Cost $74,497,183) | | | | | | | 74,926,361 | |
| | | | | | | | |
|
U.S. GOVERNMENT AGENCY OBLIGATIONS AND
INSTRUMENTALITIES — 25.1% | |
| Collateralized Mortgage Obligations — 1.0% | |
Federal Home Loan Mortgage Corp., Multifamily Structured Pass Through Certificates,
Series KF03, Class A FRN
0.510% 1/25/21 | | | 2,111,245 | | | | 2,110,127 | |
| | | | | | | | |
| | | Principal
Amount | | | Value | |
Federal National Mortgage Association,
Series 2011-M4, Class A2
3.726% 6/25/21 | | $ | 1,795,000 | | | $ | 1,942,416 | |
| | | | | | | | |
| | | | | | | 4,052,543 | |
| | | | | | | | |
| Pass-Through Securities — 24.1% | | | | | | | | |
Federal National Mortgage Association
Pool #AM0359 2.310%
8/01/22 | | | 500,000 | | | | 494,437 | |
Pool #AM0992 2.340%
11/01/22 | | | 820,000 | | | | 808,524 | |
Pool #AM1402 2.420%
11/01/22 | | | 945,000 | | | | 937,206 | |
Pool #AM0827 2.600%
11/01/22 | | | 1,040,509 | | | | 1,051,844 | |
Pool #AM2808 2.700%
3/01/23 | | | 375,000 | | | | 379,113 | |
Pool #AM7009 2.950%
11/01/24 | | | 1,025,000 | | | | 1,050,184 | |
Pool #MA1512 3.500%
7/01/33 | | | 610,910 | | | | 644,534 | |
Pool #468551 3.980%
7/01/21 | | | 1,230,000 | | | | 1,347,167 | |
Pool #723750 4.000%
8/01/18 | | | 17,956 | | | | 19,040 | |
Pool #MA0357 4.000%
3/01/20 | | | 22,741 | | | | 24,115 | |
Pool #MA1002 4.000%
2/01/22 | | | 80,824 | | | | 86,033 | |
Pool #AA4229 4.000%
4/01/24 | | | 588,872 | | | | 630,323 | |
Pool #AA2937 4.000%
4/01/24 | | | 2,920,132 | | | | 3,125,681 | |
Pool #993382 4.000%
6/01/24 | | | 367,819 | | | | 393,710 | |
Pool #AD7760 4.000%
7/01/25 | | | 673,408 | | | | 720,809 | |
Pool #AH6067 4.000%
3/01/26 | | | 8,624 | | | | 9,241 | |
Pool #727384 4.500%
9/01/18 | | | 64,840 | | | | 68,203 | |
Pool #MA0175 4.500%
9/01/19 | | | 87,239 | | | | 91,741 | |
Pool #735646 4.500%
7/01/20 | | | 69,033 | | | | 73,398 | |
Pool #MA0531 4.500%
8/01/20 | | | 31,428 | | | | 33,155 | |
Pool #852931 4.500%
4/01/21 | | | 62,897 | | | | 67,479 | |
Pool #931412 4.500%
6/01/24 | | | 183,936 | | | | 198,141 | |
Pool #932561 4.500%
2/01/25 | | | 41,687 | | | | 44,880 | |
The accompanying notes are an integral part of the financial statements.
128
MML Total Return Bond Fund – Portfolio of Investments (Continued)
| | | | | | | | |
| | | Principal
Amount | | | Value | |
Pool #AD3832 4.500%
4/01/25 | | $ | 380,132 | | | $ | 409,251 | |
Pool #256085 4.500%
12/01/25 | | | 189,207 | | | | 206,383 | |
Pool #AL3470 4.500%
1/01/27 | | | 956,989 | | | | 1,013,247 | |
Pool #931504 4.500%
7/01/39 | | | 195,831 | | | | 214,955 | |
Pool #AC1095 4.500%
7/01/39 | | | 433,213 | | | | 472,270 | |
Pool #255271 5.000%
6/01/24 | | | 10,403 | | | | 11,486 | |
Pool #255582 5.000%
1/01/25 | | | 36,121 | | | | 39,882 | |
Pool #888227 5.000%
11/01/25 | | | 26,878 | | | | 29,677 | |
Pool #257163 5.000%
4/01/28 | | | 64,397 | | | | 71,103 | |
Pool #MA0130 5.000%
7/01/29 | | | 24,179 | | | | 26,697 | |
Pool #986268 5.000%
7/01/38 | | | 2,206 | | | | 2,439 | |
Pool #AB0057 5.000%
4/01/39 | | | 2,192,137 | | | | 2,424,880 | |
Pool #AD6374 5.000%
5/01/40 | | | 81,654 | | | | 90,285 | |
Pool #AE6338 5.000%
11/01/40 | | | 89,001 | | | | 98,408 | |
Pool #AI2733 5.000%
5/01/41 | | | 618,542 | | | | 684,117 | |
Pool #190354 5.500%
12/01/34 | | | 490,683 | | | | 552,153 | |
Pool #808048 5.500%
2/01/35 | | | 602,371 | | | | 677,080 | |
Pool #814079 5.500%
2/01/35 | | | 22,129 | | | | 24,874 | |
Pool #819566 5.500%
4/01/35 | | | 641,873 | | | | 721,481 | |
Pool #843055 5.500%
9/01/35 | | | 130,641 | | | | 146,680 | |
Pool #829125 5.500%
10/01/35 | | | 56,044 | | | | 63,065 | |
Pool #846520 5.500%
12/01/35 | | | 79,880 | | | | 89,612 | |
Pool #888822 5.500%
3/01/36 | | | 137,589 | | | | 154,352 | |
Pool #884863 5.500%
4/01/36 | | | 525,445 | | | | 588,806 | |
Pool #891588 5.500%
5/01/36 | | | 203,197 | | | | 227,699 | |
Pool #888173 5.500%
11/01/36 | | | 659,854 | | | | 740,868 | |
Pool #871117 5.500%
12/01/36 | | | 26,507 | | | | 29,621 | |
| | | | | | | | |
| | | Principal
Amount | | | Value | |
Pool #889584 5.500%
1/01/37 | | $ | 27,810 | | | $ | 31,224 | |
Pool #912544 5.500%
2/01/37 | | | 77,425 | | | | 86,592 | |
Pool #888129 5.500%
2/01/37 | | | 1,286,413 | | | | 1,439,929 | |
Pool #889633 5.500%
8/01/37 | | | 608,603 | | | | 683,324 | |
Pool #929451 5.500%
5/01/38 | | | 29,688 | | | | 33,193 | |
Pool #977014 5.500%
5/01/38 | | | 89,867 | | | | 101,139 | |
Pool #985524 5.500%
6/01/38 | | | 84,457 | | | | 94,377 | |
Pool #988578 5.500%
8/01/38 | | | 644,280 | | | | 723,784 | |
Pool #889982 5.500%
11/01/38 | | | 26,586 | | | | 29,726 | |
Pool #995482 5.500%
1/01/39 | | | 416,042 | | | | 468,292 | |
Pool #AL4296 5.500%
7/01/41 | | | 197,524 | | | | 221,096 | |
Pool #878478 6.000%
2/01/36 | | | 181,509 | | | | 205,707 | |
Pool #866958 6.000%
2/01/36 | | | 342,132 | | | | 387,748 | |
Pool #937875 6.000%
7/01/37 | | | 126,938 | | | | 143,112 | |
Pool #956029 6.000%
12/01/37 | | | 125,838 | | | | 141,932 | |
Pool #889706 6.000%
6/01/38 | | | 145,947 | | | | 164,580 | |
Pool #AE0825 6.000%
10/01/39 | | | 646,210 | | | | 728,778 | |
Pool #AE0061 6.000%
2/01/40 | | | 1,551,953 | | | | 1,756,193 | |
Pool #AL0152 6.000%
6/01/40 | | | 159,577 | | | | 179,990 | |
Federal National Mortgage Association TBA
Pool #3348 2.500%
9/01/27 (b) | | | 2,000,000 | | | | 2,037,812 | |
Pool #1312 3.000%
9/01/27 (b) | | | 1,000,000 | | | | 1,039,688 | |
Pool #4241 3.000%
8/01/42 (b) | | | 23,100,000 | | | | 23,379,727 | |
Pool #1438 3.500%
10/01/26 (b) | | | 1,000,000 | | | | 1,056,797 | |
Pool #1963 3.500%
8/01/42 (b) | | | 11,955,000 | | | | 12,468,692 | |
Pool #9174 4.000%
4/01/42 (b) | | | 10,000,000 | | | | 10,676,562 | |
Pool #18718 4.500%
3/01/40 (b) | | | 6,075,000 | | | | 6,596,596 | |
The accompanying notes are an integral part of the financial statements.
129
MML Total Return Bond Fund – Portfolio of Investments (Continued)
| | | | | | | | |
| | | Principal
Amount | | | Value | |
Government National Mortgage Association
Pool #688041 5.000%
11/15/38 | | $ | 183,939 | | | $ | 202,772 | |
Pool #487816 5.000%
3/15/39 | | | 207,993 | | | | 229,223 | |
Pool #716783 5.000%
4/15/39 | | | 2,221,890 | | | | 2,448,681 | |
Pool #723541 5.000%
12/15/39 | | | 303,585 | | | | 338,237 | |
Government National Mortgage Association TBA
Pool #188 3.000%
11/01/42 (b) | | | 1,000,000 | | | | 1,022,578 | |
Pool #207 3.500%
1/01/43 (b) | | | 3,000,000 | | | | 3,150,234 | |
Pool #232 4.000%
12/01/42 (b) | | | 5,000,000 | | | | 5,359,766 | |
Pool #872 4.500%
1/01/41 (b) | | | 1,000,000 | | | | 1,092,891 | |
| | | | | | | | |
| | | | | | | 100,831,301 | |
| | | | | | | | |
| | |
TOTAL U.S. GOVERNMENT AGENCY OBLIGATIONS AND INSTRUMENTALITIES
(Cost $104,088,689) | | | | | | | 104,883,844 | |
| | | | | | | | |
|
| U.S. TREASURY OBLIGATIONS — 34.1% | |
| U.S. Treasury Bonds & Notes — 34.1% | |
U.S. Treasury Bond
3.000% 11/15/44 | | | 8,600,000 | | | | 9,038,734 | |
U.S. Treasury Bond
3.125% 8/15/44 | | | 980,000 | | | | 1,054,942 | |
U.S. Treasury Bond
6.250% 5/15/30 | | | 15,345,000 | | | | 22,940,293 | |
U.S. Treasury Inflation Index
0.125% 7/15/22 | | | 2,581,425 | | | | 2,515,075 | |
U.S. Treasury Inflation Index
0.125% 7/15/24 | | | 3,260,098 | | | | 3,139,627 | |
U.S. Treasury Inflation Index
0.625% 7/15/21 | | | 1,158,905 | | | | 1,173,482 | |
U.S. Treasury Inflation Index
1.125% 1/15/21 | | | 108,548 | | | | 112,763 | |
U.S. Treasury Inflation Index
1.250% 7/15/20 | | | 762,160 | | | | 799,911 | |
U.S. Treasury Inflation Index
1.375% 2/15/44 | | | 4,793,689 | | | | 5,425,483 | |
U.S. Treasury Inflation Index
1.750% 1/15/28 | | | 4,193,728 | | | | 4,747,757 | |
U.S. Treasury Inflation Index
2.000% 1/15/26 | | | 837,459 | | | | 959,676 | |
U.S. Treasury Inflation Index
2.375% 1/15/25 | | | 5,920,684 | | | | 6,951,250 | |
| | | | | | | | |
| | | Principal
Amount | | | Value | |
U.S. Treasury Inflation Index
2.375% 1/15/27 | | $ | 8,595,458 | | | $ | 10,287,018 | |
U.S. Treasury Inflation Index
2.500% 1/15/29 | | | 2,764,925 | | | | 3,430,882 | |
U.S. Treasury Inflation Index
3.875% 4/15/29 | | | 288,884 | | | | 413,465 | |
U.S. Treasury Note
0.500% 9/30/16 | | | 18,710,000 | | | | 18,682,959 | |
U.S. Treasury Note
0.750% 12/31/17 | | | 100,000 | | | | 98,908 | |
U.S. Treasury Note
0.875% 11/15/17 | | | 19,500,000 | | | | 19,398,692 | |
U.S. Treasury Note
2.125% 9/30/21 | | | 26,045,000 | | | | 26,328,596 | |
U.S. Treasury Note
2.250% 11/15/24 | | | 5,130,000 | | | | 5,164,768 | |
| | | | | | | | |
| | | | | | | 142,664,281 | |
| | | | | | | | |
| | |
TOTAL U.S. TREASURY OBLIGATIONS
(Cost $143,372,942) | | | | | | | 142,664,281 | |
| | | | | | | | |
| | |
TOTAL BONDS & NOTES
(Cost $396,724,005) | | | | | | | 398,615,464 | |
| | | | | | | | |
| | |
TOTAL LONG-TERM INVESTMENTS
(Cost $397,824,005) | | | | | | | 399,776,184 | |
| | | | | | | | |
|
| SHORT-TERM INVESTMENTS — 20.6% | |
| Discount Notes — 12.0% | |
Federal Home Loan Bank
0.060% 2/09/15 | | | 11,335,000 | | | | 11,334,263 | |
Federal Home Loan Bank
0.080% 1/23/15 | | | 19,000,000 | | | | 18,999,071 | |
Federal Home Loan Bank
0.100% 2/23/15 | | | 10,000,000 | | | | 9,998,970 | |
Federal National Mortgage Association
0.010% 3/25/15 | | | 10,000,000 | | | | 9,997,003 | |
| | | | | | | | |
| | | | | | | 50,329,307 | |
| | | | | | | | |
| Repurchase Agreement — 4.4% | |
State Street Bank & Trust Co. Repurchase Agreement, dated 12/31/14, 0.010%, due 1/02/15 (c) | | | 18,516,833 | | | | 18,516,833 | |
| | | | | | | | |
| Time Deposits — 0.1% | |
Euro Time Deposit
0.010% 1/02/15 | | | 361,889 | | | | 361,889 | |
| | | | | | | | |
| U.S. Treasury Bills — 4.1% | |
U.S. Treasury Bill
0.000% 1/29/15 | | | 17,000,000 | | | | 16,999,788 | |
| | | | | | | | |
The accompanying notes are an integral part of the financial statements.
130
MML Total Return Bond Fund – Portfolio of Investments (Continued)
| | | | | | |
| | | | | Value | |
| | |
TOTAL SHORT-TERM
INVESTMENTS
(Cost $86,207,817) | | | | $ | 86,207,817 | |
| | | | | | |
| | |
TOTAL INVESTMENTS — 116.2%
(Cost $484,031,822) (d) | | | | | 485,984,001 | |
| | |
| Other Assets/(Liabilities) — (16.2)% | | | | | (67,816,224 | ) |
| | | | | | |
| | |
| NET ASSETS — 100.0% | | | | $ | 418,167,777 | |
| | | | | | |
Notes to Portfolio of Investments
Percentages are stated as a percent of net assets.
| CLO | Collateralized Loan Obligation |
| CMO | Collateralized Mortgage Obligation |
| MBS | Mortgage-Backed Security |
| (a) | Securities exempt from registration under rule 144A of the Securities Act of 1933. These securities may be resold in transactions exempt from registration, normally to qualified institutional buyers. At December 31, 2014, these securities amounted to a value of $28,914,827 or 6.91% of net assets. |
| (b) | A portion of this security is purchased on a when-issued, delayed-delivery or forward commitment basis. (Note 2). |
| (c) | Maturity value of $18,516,843. Collateralized by U.S. Government Agency obligations with a rate of 2.500%, maturity date of 3/20/28, and an aggregate market value, including accrued interest, of $18,888,596. |
| (d) | See Note 6 for aggregate cost for federal tax purposes. |
The accompanying notes are an integral part of the financial statements.
131
MML Series Investment Fund – Financial Statements
Statements of Assets and Liabilities
December 31, 2014
| | | | | | | | |
| | | MML
Blue Chip
Growth Fund | | | MML
Equity
Income Fund | |
| Assets: | | | | | | | | |
Investments, at value (Note 2) (a) | | $ | 420,280,730 | | | $ | 511,063,998 | |
Short-term investments, at value (Note 2) (b) | | | 2,336,081 | | | | 26,234,024 | |
| | | | | | | | |
Total investments (c) | | | 422,616,811 | | | | 537,298,022 | |
| | | | | | | | |
Foreign currency, at value (d) | | | 3,441 | | | | - | |
Receivables from: | | | | | | | | |
Investments sold | | | 144,873 | | | | 318,369 | |
Investment adviser (Note 3) | | | - | | | | - | |
Fund shares sold | | | 270,228 | | | | 102,000 | |
Interest and dividends | | | 181,018 | | | | 767,835 | |
Foreign taxes withheld | | | 4,981 | | | | - | |
| | | | | | | | |
Total assets | | | 423,221,352 | | | | 538,486,226 | |
| | | | | | | | |
| Liabilities: | | | | | | | | |
Payables for: | | | | | | | | |
Investments purchased | | | 407,783 | | | | - | |
Fund shares repurchased | | | 336,228 | | | | 1,157,986 | |
Securities on loan (Note 2) | | | - | | | | - | |
Investment advisory fees | | | - | | | | - | |
Trustees’ fees and expenses (Note 3) | | | 70,687 | | | | 118,242 | |
Variation margin on open derivative instruments (Note 2) | | | - | | | | - | |
Affiliates (Note 3): | | | | | | | | |
Investment advisory fees | | | 284,950 | | | | 363,119 | |
Administration fees | | | - | | | | - | |
Service fees | | | 19,048 | | | | 38,813 | |
Due to custodian | | | - | | | | 2,600 | |
Accrued expense and other liabilities | | | 60,523 | | | | 66,060 | |
| | | | | | | | |
Total liabilities | | | 1,179,219 | | | | 1,746,820 | |
| | | | | | | | |
Net assets | | $ | 422,042,133 | | | $ | 536,739,406 | |
| | | | | | | | |
| Net assets consist of: | | | | | | | | |
Paid-in capital | | $ | 205,479,370 | | | $ | 316,505,432 | |
Undistributed (accumulated) net investment income (loss) | | | (69,328 | ) | | | 9,750,164 | |
Accumulated net realized gain (loss) on investments and foreign currency transactions | | | 66,946,538 | | | | 45,158,340 | |
Net unrealized appreciation (depreciation) on investments and foreign currency translations | | | 149,685,553 | | | | 165,325,470 | |
| | | | | | | | |
Net assets | | $ | 422,042,133 | | | $ | 536,739,406 | |
| | | | | | | | |
| | | | | | | | |
(a) Cost of investments: | | $ | 270,595,667 | | | $ | 345,737,827 | |
(b) Cost of short-term investments: | | $ | 2,336,081 | | | $ | 26,234,024 | |
(c) Securities on loan with market value of: | | $ | - | | | $ | - | |
(d) Cost of foreign currency: | | $ | 3,422 | | | $ | - | |
The accompanying notes are an integral part of the financial statements.
132
| | | | | | | | | | | | | | | | | | |
MML
Equity
Index Fund | | | MML
Focused
Equity Fund | | | MML
Foreign
Fund | | | MML
Fundamental
Growth Fund | | | MML
Fundamental
Value Fund | |
| | | | | | | | | | | | | | | | | | |
| $ | 437,234,554 | | | $ | 152,662,080 | | | $ | 327,804,839 | | | $ | 208,925,428 | | | $ | 220,658,524 | |
| | 7,191,707 | | | | 14,833,373 | | | | 12,461,288 | | | | 455,517 | | | | 4,475,662 | |
| | | | | | | | | | | | | | | | | | |
| | 444,426,261 | | | | 167,495,453 | | | | 340,266,127 | | | | 209,380,945 | | | | 225,134,186 | |
| | | | | | | | | | | | | | | | | | |
| | - | | | | - | | | | 20,822 | | | | - | | | | - | |
| | | | | | | | | | | | | | | | | | |
| | - | | | | 27,317 | | | | 1,035,219 | | | | 211,089 | | | | - | |
| | 14,841 | | | | - | | | | - | | | | - | | | | - | |
| | 41,643 | | | | 72,781 | | | | 12,375,047 | | | | 92,336 | | | | 97,953 | |
| | 585,455 | | | | 135,199 | | | | 580,611 | | | | 103,037 | | | | 302,802 | |
| | - | | | | - | | | | 352,822 | | | | 4,045 | | | | 38,990 | |
| | | | | | | | | | | | | | | | | | |
| | 445,068,200 | | | | 167,730,750 | | | | 354,630,648 | | | | 209,791,452 | | | | 225,573,931 | |
| | | | | | | | | | | | | | | | | | |
| | | | | | | | | | | | | | | | | | |
| | | | | | | | | | | | | | | | | | |
| | - | | | | - | | | | - | | | | 211,442 | | | | - | |
| | 446,899 | | | | 50,134 | | | | 34,178 | | | | 60,610 | | | | 61,380 | |
| | - | | | | - | | | | 15,029,374 | | | | - | | | | - | |
| | - | | | | - | | | | - | | | | 1,177 | | | | - | |
| | 157,980 | | | | 15,472 | | | | 83,317 | | | | 20,730 | | | | 24,824 | |
| | 89,631 | | | | - | | | | - | | | | - | | | | - | |
| | | | | | | | | | | | | | | | | | |
| | 40,268 | | | | 112,627 | | | | 267,745 | | | | 132,664 | | | | 131,843 | |
| | 66,225 | | | | 15,017 | | | | - | | | | 18,952 | | | | 20,284 | |
| | 18,789 | | | | 4,387 | | | | 6,782 | | | | 1,291 | | | | 3,275 | |
| | - | | | | - | | | | - | | | | - | | | | - | |
| | 59,295 | | | | 38,317 | | | | 75,445 | | | | 44,660 | | | | 42,543 | |
| | | | | | | | | | | | | | | | | | |
| | 879,087 | | | | 235,954 | | | | 15,496,841 | | | | 491,526 | | | | 284,149 | |
| | | | | | | | | | | | | | | | | | |
| $ | 444,189,113 | | | $ | 167,494,796 | | | $ | 339,133,807 | | | $ | 209,299,926 | | | $ | 225,289,782 | |
| | | | | | | | | | | | | | | | | | |
| | | | | | | | | | | | | | | | | | |
| $ | 232,643,417 | | | $ | 99,843,900 | | | $ | 319,985,545 | | | $ | 130,135,945 | | | $ | 136,328,364 | |
| | 7,226,791 | | | | 3,000,315 | | | | 10,833,558 | | | | 1,651,596 | | | | 3,219,670 | |
| | 1,874,173 | | | | 21,582,957 | | | | (16,613,073 | ) | | | 35,872,612 | | | | 17,724,011 | |
| | 202,444,732 | | | | 43,067,624 | | | | 24,927,777 | | | | 41,639,773 | | | | 68,017,737 | |
| | | | | | | | | | | | | | | | | | |
| $ | 444,189,113 | | | $ | 167,494,796 | | | $ | 339,133,807 | | | $ | 209,299,926 | | | $ | 225,289,782 | |
| | | | | | | | | | | | | | | | | | |
| | | | | | | | | | | | | | | | | | |
| $ | 234,931,886 | | | $ | 109,594,456 | | | $ | 302,862,691 | | | $ | 167,285,655 | | | $ | 152,637,592 | |
| $ | 7,191,717 | | | $ | 14,833,373 | | | $ | 12,461,288 | | | $ | 455,517 | | | $ | 4,475,662 | |
| $ | - | | | $ | - | | | $ | 14,529,340 | | | $ | - | | | $ | - | |
| $ | - | | | $ | - | | | $ | 20,885 | | | $ | - | | | $ | - | |
133
MML Series Investment Fund – Financial Statements (Continued)
Statements of Assets and Liabilities
December 31, 2014
| | | | | | | | |
| | | MML
Blue Chip
Growth Fund | | | MML
Equity
Income Fund | |
| Initial Class shares: | | | | | | | | |
Net assets | | $ | 390,321,552 | | | $ | 472,988,581 | |
| | | | | | | | |
Shares outstanding (a) | | | 22,841,614 | | | | 33,964,275 | |
| | | | | | | | |
Net asset value, offering price and redemption price per share | | $ | 17.09 | | | $ | 13.93 | |
| | | | | | | | |
| Class I shares: | | | | | | | | |
Net assets | | $ | - | | | $ | - | |
| | | | | | | | |
Shares outstanding (a) | | | - | | | | - | |
| | | | | | | | |
Net asset value, offering price and redemption price per share | | $ | - | | | $ | - | |
| | | | | | | | |
| Class II shares: | | | | | | | | |
Net assets | | $ | - | | | $ | - | |
| | | | | | | | |
Shares outstanding (a) | | | - | | | | - | |
| | | | | | | | |
Net asset value, offering price and redemption price per share | | $ | - | | | $ | - | |
| | | | | | | | |
| Class III shares: | | | | | | | | |
Net assets | | $ | - | | | $ | - | |
| | | | | | | | |
Shares outstanding (a) | | | - | | | | - | |
| | | | | | | | |
Net asset value, offering price and redemption price per share | | $ | - | | | $ | - | |
| | | | | | | | |
| Service Class shares: | | | | | | | | |
Net assets | | $ | 31,720,581 | | | $ | 63,750,825 | |
| | | | | | | | |
Shares outstanding (a) | | | 1,882,945 | | | | 4,610,205 | |
| | | | | | | | |
Net asset value, offering price and redemption price per share | | $ | 16.85 | | | $ | 13.83 | |
| | | | | | | | |
| Service Class I shares: | | | | | | | | |
Net assets | | $ | - | | | $ | - | |
| | | | | | | | |
Shares outstanding (a) | | | - | | | | - | |
| | | | | | | | |
Net asset value, offering price and redemption price per share | | $ | - | | | $ | - | |
| | | | | | | | |
| (a) | Authorized unlimited number of shares with no par value. |
The accompanying notes are an integral part of the financial statements.
134
| | | | | | | | | | | | | | | | | | |
MML
Equity
Index Fund | | | MML
Focused
Equity Fund | | | MML
Foreign
Fund | | | MML
Fundamental
Growth Fund | | | MML
Fundamental
Value Fund | |
| | | | | | | | | | | | | | | | | | |
| $ | - | | | $ | - | | | $ | 328,044,762 | | | $ | - | | | $ | - | |
| | | | | | | | | | | | | | | | | | |
| | - | | | | - | | | | 32,113,255 | | | | - | | | | - | |
| | | | | | | | | | | | | | | | | | |
| $ | - | | | $ | - | | | $ | 10.22 | | | $ | - | | | $ | - | |
| | | | | | | | | | | | | | | | | | |
| | | | | | | | | | | | | | | | | | |
| $ | 84,445,374 | | | $ | - | | | $ | - | | | $ | - | | | $ | - | |
| | | | | | | | | | | | | | | | | | |
| | 3,309,563 | | | | - | | | | - | | | | - | | | | - | |
| | | | | | | | | | | | | | | | | | |
| $ | 25.52 | | | $ | - | | | $ | - | | | $ | - | | | $ | - | |
| | | | | | | | | | | | | | | | | | |
| | | | | | | | | | | | | | | | | | |
| $ | 154,209,744 | | | $ | 160,205,813 | | | $ | - | | | $ | 207,085,697 | | | $ | 219,678,982 | |
| | | | | | | | | | | | | | | | | | |
| | 6,032,338 | | | | 10,032,330 | | | | - | | | | 13,904,115 | | | | 13,560,260 | |
| | | | | | | | | | | | | | | | | | |
| $ | 25.56 | | | $ | 15.97 | | | $ | - | | | $ | 14.89 | | | $ | 16.20 | |
| | | | | | | | | | | | | | | | | | |
| | | | | | | | | | | | | | | | | | |
| $ | 173,459,091 | | | $ | - | | | $ | - | | | $ | - | | | $ | - | |
| | | | | | | | | | | | | | | | | | |
| | 6,790,360 | | | | - | | | | - | | | | - | | | | - | |
| | | | | | | | | | | | | | | | | | |
| $ | 25.54 | | | $ | - | | | $ | - | | | $ | - | | | $ | - | |
| | | | | | | | | | | | | | | | | | |
| | | | | | | | | | | | | | | | | | |
| $ | - | | | $ | - | | | $ | 11,089,045 | | | $ | - | | | $ | - | |
| | | | | | | | | | | | | | | | | | |
| | - | | | | - | | | | 1,091,787 | | | | - | | | | - | |
| | | | | | | | | | | | | | | | | | |
| $ | - | | | $ | - | | | $ | 10.16 | | | $ | - | | | $ | - | |
| | | | | | | | | | | | | | | | | | |
| | | | | | | | | | | | | | | | | | |
| $ | 32,074,904 | | | $ | 7,288,983 | | | $ | - | | | $ | 2,214,229 | | | $ | 5,610,800 | |
| | | | | | | | | | | | | | | | | | |
| | 1,284,132 | | | | 459,272 | | | | - | | | | 149,591 | | | | 349,191 | |
| | | | | | | | | | | | | | | | | | |
| $ | 24.98 | | | $ | 15.87 | | | $ | - | | | $ | 14.80 | | | $ | 16.07 | |
| | | | | | | | | | | | | | | | | | |
135
MML Series Investment Fund – Financial Statements (Continued)
Statements of Assets and Liabilities
December 31, 2014
| | | | | | | | |
| | | MML
Global Fund | | | MML
Growth &
Income Fund | |
| Assets: | | | | | | | | |
Investments, at value (Note 2) (a) | | $ | 235,843,514 | | | $ | 139,562,369 | |
Short-term investments, at value (Note 2) (b) | | | 3,416,461 | | | | 1,431,118 | |
| | | | | | | | |
Total investments (c) | | | 239,259,975 | | | | 140,993,487 | |
| | | | | | | | |
Cash | | | - | | | | - | |
Foreign currency, at value (d) | | | - | | | | - | |
Receivables from: | | | | | | | | |
Investments sold | | | - | | | | - | |
Open forward foreign currency contracts (Note 2) | | | - | | | | - | |
Investment adviser (Note 3) | | | 13,567 | | | | - | |
Fund shares sold | | | 341,882 | | | | 819 | |
Interest and dividends | | | 262,449 | | | | 140,655 | |
Foreign taxes withheld | | | 119,273 | | | | 3,958 | |
| | | | | | | | |
Total assets | | | 239,997,146 | | | | 141,138,919 | |
| | | | | | | | |
| Liabilities: | | | | | | | | |
Payables for: | | | | | | | | |
Investments purchased | | | - | | | | - | |
Written options outstanding, at value (Note 2) (e) | | | - | | | | - | |
Open forward foreign currency contracts (Note 2) | | | - | | | | - | |
Foreign currency overdraft (d) | | | 54,298 | | | | 15,130 | |
Fund shares repurchased | | | 57,163 | | | | 369,020 | |
Securities on loan (Note 2) | | | 2,480,911 | | | | - | |
Trustees’ fees and expenses (Note 3) | | | 27,711 | | | | 44,707 | |
Affiliates (Note 3): | | | | | | | | |
Investment advisory fees | | | 128,906 | | | | 63,802 | |
Administration fees | | | 58,563 | | | | - | |
Service fees | | | 5,451 | | | | 11,679 | |
Accrued expense and other liabilities | | | 88,273 | | | | 39,079 | |
| | | | | | | | |
Total liabilities | | | 2,901,276 | | | | 543,417 | |
| | | | | | | | |
Net assets | | $ | 237,095,870 | | | $ | 140,595,502 | |
| | | | | | | | |
| Net assets consist of: | | | | | | | | |
Paid-in capital | | $ | 163,622,481 | | | $ | 126,609,869 | |
Undistributed (accumulated) net investment income (loss) | | | 2,848,820 | | | | 1,540,527 | |
Distributions in excess of net investment income | | | - | | | | - | |
Accumulated net realized gain (loss) on investments and foreign currency transactions | | | 10,907,755 | | | | (31,152,223 | ) |
Net unrealized appreciation (depreciation) on investments and foreign currency translations | | | 59,716,814 | | | | 43,597,329 | |
| | | | | | | | |
Net assets | | $ | 237,095,870 | | | $ | 140,595,502 | |
| | | | | | | | |
| | | | | | | | |
(a) Cost of investments: | | $ | 176,080,721 | | | $ | 95,964,604 | |
(b) Cost of short-term investments: | | $ | 3,416,461 | | | $ | 1,431,118 | |
(c) Securities on loan with market value of: | | $ | 2,391,810 | | | $ | - | |
(d) Cost of foreign currency: | | $ | (54,589 | ) | | $ | (15,210 | ) |
(e) Premiums on written options: | | $ | - | | | $ | - | |
The accompanying notes are an integral part of the financial statements.
136
| | | | | | | | | | | | | | | | | | |
MML
Income &
Growth Fund | | | MML
International
Equity Fund | | | MML
Large Cap
Growth Fund | | | MML
Managed
Volatility Fund | | | MML
Mid Cap
Growth Fund | |
| | | | | | | | | | | | | | | | | | |
| $ | 238,462,625 | | | $ | 119,661,698 | | | $ | 242,046,169 | | | $ | 369,550,342 | | | $ | 433,921,380 | |
| | 9,791,868 | | | | - | | | | 6,949,171 | | | | 4,453,793 | | | | 19,185,700 | |
| | | | | | | | | | | | | | | | | | |
| | 248,254,493 | | | | 119,661,698 | | | | 248,995,340 | | | | 374,004,135 | | | | 453,107,080 | |
| | | | | | | | | | | | | | | | | | |
| | - | | | | 5,419,466 | | | | - | | | | - | | | | - | |
| | - | | | | 118,455 | | | | - | | | | - | | | | - | |
| | | | | | | | | | | | | | | | | | |
| | - | | | | 183,236 | | | | 6,624,364 | | | | - | | | | 294,156 | |
| | - | | | | 573,315 | | | | - | | | | - | | | | - | |
| | - | | | | 13,291 | | | | - | | | | - | | | | - | |
| | 84,523 | | | | 46,143 | | | | 92,546 | | | | 2,908,420 | | | | 85,787 | |
| | 404,173 | | | | 104,984 | | | | 118,786 | | | | 491,974 | | | | 141,939 | |
| | - | | | | 177,613 | | | | 12,695 | | | | 44,111 | | | | - | |
| | | | | | | | | | | | | | | | | | |
| | 248,743,189 | | | | 126,298,201 | | | | 255,843,731 | | | | 377,448,640 | | | | 453,628,962 | |
| | | | | | | | | | | | | | | | | | |
| | | | | | | | | | | | | | | | | | |
| | | | | | | | | | | | | | | | | | |
| | - | | | | 226,365 | | | | 10,568,691 | | | | - | | | | 334,945 | |
| | - | | | | - | | | | - | | | | 8,238,080 | | | | - | |
| | - | | | | 65,005 | | | | - | | | | - | | | | - | |
| | - | | | | - | | | | - | | | | - | | | | - | |
| | 180,671 | | | | 30,251 | | | | 95,312 | | | | 1,275 | | | | 1,915,721 | |
| | - | | | | 1,592,220 | | | | - | | | | - | | | | 17,417,369 | |
| | 43,157 | | | | 4,123 | | | | 35,491 | | | | 79,763 | | | | 82,719 | |
| | | | | | | | | | | | | | | | | | |
| | 145,274 | | | | 96,496 | | | | 143,432 | | | | 248,616 | | | | 300,528 | |
| | - | | | | 11,352 | | | | - | | | | - | | | | - | |
| | 9,868 | | | | 149 | | | | 1,696 | | | | 19,272 | | | | 34,235 | |
| | 45,823 | | | | 58,536 | | | | 44,325 | | | | 119,083 | | | | 58,465 | |
| | | | | | | | | | | | | | | | | | |
| | 424,793 | | | | 2,084,497 | | | | 10,888,947 | | | | 8,706,089 | | | | 20,143,982 | |
| | | | | | | | | | | | | | | | | | |
| $ | 248,318,396 | | | $ | 124,213,704 | | | $ | 244,954,784 | | | $ | 368,742,551 | | | $ | 433,484,980 | |
| | | | | | | | | | | | | | | | | | |
| | | | | | | | | | | | | | | | | | |
| $ | 164,525,722 | | | $ | 133,980,497 | | | $ | 159,420,989 | | | $ | 314,996,940 | | | $ | 233,979,238 | |
| | 4,588,599 | | | | - | | | | (34,704 | ) | | | 3,596,420 | | | | (1,075,530 | ) |
| | - | | | | (200,398 | ) | | | - | | | | - | | | | - | |
| | 14,849,464 | | | | (376,903 | ) | | | 43,993,600 | | | | (16,621,043 | ) | | | 49,592,724 | |
| | 64,354,611 | | | | (9,189,492 | ) | | | 41,574,899 | | | | 66,770,234 | | | | 150,988,548 | |
| | | | | | | | | | | | | | | | | | |
| $ | 248,318,396 | | | $ | 124,213,704 | | | $ | 244,954,784 | | | $ | 368,742,551 | | | $ | 433,484,980 | |
| | | | | | | | | | | | | | | | | | |
| | | | | | | | | | | | | | | | | | |
| $ | 174,107,960 | | | $ | 129,336,230 | | | $ | 200,471,270 | | | $ | 302,373,370 | | | $ | 282,932,559 | |
| $ | 9,791,868 | | | $ | - | | | $ | 6,949,171 | | | $ | 4,453,793 | | | $ | 19,185,700 | |
| $ | - | | | $ | 1,515,707 | | | $ | - | | | $ | - | | | $ | 16,932,217 | |
| $ | - | | | $ | 119,609 | | | $ | - | | | $ | - | | | $ | - | |
| $ | - | | | $ | - | | | $ | - | | | $ | 7,831,873 | | | $ | - | |
137
MML Series Investment Fund – Financial Statements (Continued)
Statements of Assets and Liabilities
December 31, 2014
| | | | | | | | |
| | | MML
Global Fund | | | MML
Growth &
Income Fund | |
| Initial Class shares: | | | | | | | | |
Net assets | | $ | - | | | $ | 121,666,852 | |
| | | | | | | | |
Shares outstanding (a) | | | - | | | | 9,160,094 | |
| | | | | | | | |
Net asset value, offering price and redemption price per share | | $ | - | | | $ | 13.28 | |
| | | | | | | | |
| Class I shares: | | | | | | | | |
Net assets | | $ | 210,395,406 | | | $ | - | |
| | | | | | | | |
Shares outstanding (a) | | | 16,690,565 | | | | - | |
| | | | | | | | |
Net asset value, offering price and redemption price per share | | $ | 12.61 | | | $ | - | |
| | | | | | | | |
| Class II shares: | | | | | | | | |
Net assets | | $ | 17,480,583 | | | $ | - | |
| | | | | | | | |
Shares outstanding (a) | | | 1,364,972 | | | | - | |
| | | | | | | | |
Net asset value, offering price and redemption price per share | | $ | 12.81 | | | $ | - | |
| | | | | | | | |
| Service Class shares: | | | | | | | | |
Net assets | | $ | - | | | $ | 18,928,650 | |
| | | | | | | | |
Shares outstanding (a) | | | - | | | | 1,433,238 | |
| | | | | | | | |
Net asset value, offering price and redemption price per share | | $ | - | | | $ | 13.21 | |
| | | | | | | | |
| Service Class I shares: | | | | | | | | |
Net assets | | $ | 9,219,881 | | | $ | - | |
| | | | | | | | |
Shares outstanding (a) | | | 736,216 | | | | - | |
| | | | | | | | |
Net asset value, offering price and redemption price per share | | $ | 12.52 | | | $ | - | |
| | | | | | | | |
| (a) | Authorized unlimited number of shares with no par value. |
The accompanying notes are an integral part of the financial statements.
138
| | | | | | | | | | | | | | | | | | |
MML
Income &
Growth Fund | | | MML
International
Equity Fund | | | MML
Large Cap
Growth Fund | | | MML
Managed
Volatility Fund | | | MML
Mid Cap
Growth Fund | |
| | | | | | | | | | | | | | | | | | |
| $ | 232,187,249 | | | $ | - | | | $ | 242,228,600 | | | $ | 336,930,808 | | | $ | 377,027,740 | |
| | | | | | | | | | | | | | | | | | |
| | 18,665,363 | | | | - | | | | 17,227,237 | | | | 23,874,726 | | | | 22,980,762 | |
| | | | | | | | | | | | | | | | | | |
| $ | 12.44 | | | $ | - | | | $ | 14.06 | | | $ | 14.11 | | | $ | 16.41 | |
| | | | | | | | | | | | | | | | | | |
| | | | | | | | | | | | | | | | | | |
| $ | - | | | $ | - | | | $ | - | | | $ | - | | | $ | - | |
| | | | | | | | | | | | | | | | | | |
| | - | | | | - | | | | - | | | | - | | | | - | |
| | | | | | | | | | | | | | | | | | |
| $ | - | | | $ | - | | | $ | - | | | $ | - | | | $ | - | |
| | | | | | | | | | | | | | | | | | |
| | | | | | | | | | | | | | | | | | |
| $ | - | | | $ | 123,915,348 | | | $ | - | | | $ | - | | | $ | - | |
| | | | | | | | | | | | | | | | | | |
| | - | | | | 13,365,583 | | | | - | | | | - | | | | - | |
| | | | | | | | | | | | | | | | | | |
| $ | - | | | $ | 9.27 | | | $ | - | | | $ | - | | | $ | - | |
| | | | | | | | | | | | | | | | | | |
| | | | | | | | | | | | | | | | | | |
| $ | 16,131,147 | | | $ | - | | | $ | 2,726,184 | | | $ | 31,811,743 | | | $ | 56,457,240 | |
| | | | | | | | | | | | | | | | | | |
| | 1,307,131 | | | | - | | | | 196,261 | | | | 2,268,645 | | | | 3,501,332 | |
| | | | | | | | | | | | | | | | | | |
| $ | 12.34 | | | $ | - | | | $ | 13.89 | | | $ | 14.02 | | | $ | 16.12 | |
| | | | | | | | | | | | | | | | | | |
| | | | | | | | | | | | | | | | | | |
| $ | - | | | $ | 298,356 | | | $ | - | | | $ | - | | | $ | - | |
| | | | | | | | | | | | | | | | | | |
| | - | | | | 32,202 | | | | - | | | | - | | | | - | |
| | | | | | | | | | | | | | | | | | |
| $ | - | | | $ | 9.27 | | | $ | - | | | $ | - | | | $ | - | |
| | | | | | | | | | | | | | | | | | |
139
MML Series Investment Fund – Financial Statements (Continued)
Statements of Assets and Liabilities
December 31, 2014
| | | | | | | | |
| | | MML
Mid Cap
Value Fund | | | MML
Small Cap
Growth
Equity Fund | |
| Assets: | | | | | | | | |
Investments, at value (Note 2) (a) | | $ | 492,167,275 | | | $ | 293,792,169 | |
Short-term investments, at value (Note 2) (b) | | | 9,314,127 | | | | 5,458,142 | |
| | | | | | | | |
Total investments (c) | | | 501,481,402 | | | | 299,250,311 | |
| | | | | | | | |
Cash | | | - | | | | - | |
Foreign currency, at value (d) | | | 11 | | | | 1 | |
Receivables from: | | | | | | | | |
Investments sold | | | 1,551,978 | | | | 1,411,821 | |
Investments sold on a when-issued basis (Note 2) | | | - | | | | - | |
Open forward foreign currency contracts (Note 2) | | | 85,196 | | | | - | |
Investment adviser (Note 3) | | | - | | | | - | |
Fund shares sold | | | 112,451 | | | | 60,848 | |
Interest and dividends | | | 1,037,751 | | | | 149,143 | |
| | | | | | | | |
Total assets | | | 504,268,789 | | | | 300,872,124 | |
| | | | | | | | |
| Liabilities: | | | | | | | | |
Payables for: | | | | | | | | |
Investments purchased | | | 1,647,349 | | | | 985,683 | |
Open forward foreign currency contracts (Note 2) | | | 4,455 | | | | - | |
Fund shares repurchased | | | 6,497,212 | | | | 6,352,825 | |
Investments purchased on a when-issued basis (Note 2) | | | - | | | | - | |
Securities on loan (Note 2) | | | - | | | | 30,078,665 | |
Trustees’ fees and expenses (Note 3) | | | 104,903 | | | | 75,953 | |
Collateral pledged for open swap agreements (Note 2) | | | - | | | | - | |
Affiliates (Note 3): | | | | | | | | |
Investment advisory fees | | | 378,515 | | | | 248,240 | |
Administration fees | | | - | | | | - | |
Service fees | | | 18,272 | | | | 6,080 | |
Due to custodian | | | - | | | | 17 | |
Accrued expense and other liabilities | | | 68,288 | | | | 51,512 | |
| | | | | | | | |
Total liabilities | | | 8,718,994 | | | | 37,798,975 | |
| | | | | | | | |
Net assets | | $ | 495,549,795 | | | $ | 263,073,149 | |
| | | | | | | | |
| Net assets consist of: | | | | | | | | |
Paid-in capital | | $ | 358,645,566 | | | $ | 175,990,432 | |
Undistributed (accumulated) net investment income (loss) | | | 8,821,677 | | | | (75,079 | ) |
Accumulated net realized gain (loss) on investments and foreign currency transactions | | | 63,959,806 | | | | 41,968,016 | |
Net unrealized appreciation (depreciation) on investments and foreign currency translations | | | 64,122,746 | | | | 45,189,780 | |
| | | | | | | | |
Net assets | | $ | 495,549,795 | | | $ | 263,073,149 | |
| | | | | | | | |
| | | | | | | | |
(a) Cost of investments: | | $ | 428,124,407 | | | $ | 248,602,286 | |
(b) Cost of short-term investments: | | $ | 9,314,127 | | | $ | 5,458,142 | |
(c) Securities on loan with market value of: | | $ | - | | | $ | 29,345,230 | |
(d) Cost of foreign currency: | | $ | 11 | | | $ | 1 | |
The accompanying notes are an integral part of the financial statements.
140
| | | | | | | | | | |
MML
Small
Company
Value Fund | | | MML
Small/Mid
Cap Value
Fund | | | MML
Total Return
Bond Fund | |
| | | | | | | | | | |
| $ | 105,771,869 | | | $ | 254,361,377 | | | $ | 399,776,184 | |
| | 4,915,706 | | | | 3,444,657 | | | | 86,207,817 | |
| | | | | | | | | | |
| | 110,687,575 | | | | 257,806,034 | | | | 485,984,001 | |
| | | | | | | | | | |
| | - | | | | - | | | | 531 | |
| | - | | | | - | | | | 1,729 | |
| | | | | | | | | | |
| | 317,962 | | | | - | | | | 8,529,609 | |
| | - | | | | - | | | | 9,263,603 | |
| | - | | | | - | | | | 2,811,637 | |
| | 2,766 | | | | - | | | | 33,976 | |
| | 35,770 | | | | 24,495 | | | | 159,593 | |
| | 215,399 | | | | 305,615 | | | | 1,593,468 | |
| | | | | | | | | | |
| | 111,259,472 | | | | 258,136,144 | | | | 508,378,147 | |
| | | | | | | | | | |
| | | | | | | | | | |
| | | | | | | | | | |
| | 1,537,497 | | | | - | | | | 9,450,925 | |
| | - | | | | - | | | | 2,301,512 | |
| | 54,395 | | | | 5,974,715 | | | | 94,328 | |
| | - | | | | - | | | | 77,073,692 | |
| | 2,988,517 | | | | - | | | | - | |
| | 18,214 | | | | 50,888 | | | | 41,918 | |
| | - | | | | - | | | | 880,000 | |
| | | | | | | | | | |
| | 79,853 | | | | 172,354 | | | | 188,490 | |
| | 23,486 | | | | - | | | | 37,698 | |
| | 6,334 | | | | 9,579 | | | | 9,007 | |
| | 57 | | | | - | | | | - | |
| | 37,188 | | | | 45,502 | | | | 132,800 | |
| | | | | | | | | | |
| | 4,745,541 | | | | 6,253,038 | | | | 90,210,370 | |
| | | | | | | | | | |
| $ | 106,513,931 | | | $ | 251,883,106 | | | $ | 418,167,777 | |
| | | | | | | | | | |
| | | | | | | | | | |
| $ | 64,478,628 | | | $ | 180,731,055 | | | $ | 402,741,627 | |
| | 301,570 | | | | 1,894,691 | | | | 10,725,232 | |
| | 9,847,538 | | | | 37,114,376 | | | | 2,236,646 | |
| | 31,886,195 | | | | 32,142,984 | | | | 2,464,272 | |
| | | | | | | | | | |
| $ | 106,513,931 | | | $ | 251,883,106 | | | $ | 418,167,777 | |
| | | | | | | | | | |
| | | | | | | | | | |
| $ | 73,885,674 | | | $ | 222,218,393 | | | $ | 397,824,005 | |
| $ | 4,915,706 | | | $ | 3,444,657 | | | $ | 86,207,817 | |
| $ | 2,910,195 | | | $ | - | | | $ | - | |
| $ | - | | | $ | - | | | $ | 1,749 | |
141
MML Series Investment Fund – Financial Statements (Continued)
Statements of Assets and Liabilities
December 31, 2014
| | | | | | | | |
| | | MML
Mid Cap
Value Fund | | | MML
Small Cap
Growth
Equity Fund | |
| Initial Class shares: | | | | | | | | |
Net assets | | $ | 465,533,095 | | | $ | 253,096,340 | |
| | | | | | | | |
Shares outstanding (a) | | | 35,488,834 | | | | 14,182,846 | |
| | | | | | | | |
Net asset value, offering price and redemption price per share | | $ | 13.12 | | | $ | 17.85 | |
| | | | | | | | |
| Class II shares: | | | | | | | | |
Net assets | | $ | - | | | $ | - | |
| | | | | | | | |
Shares outstanding (a) | | | - | | | | - | |
| | | | | | | | |
Net asset value, offering price and redemption price per share | | $ | - | | | $ | - | |
| | | | | | | | |
| Service Class shares: | | | | | | | | |
Net assets | | $ | 30,016,700 | | | $ | 9,976,809 | |
| | | | | | | | |
Shares outstanding (a) | | | 2,310,521 | | | | 573,220 | |
| | | | | | | | |
Net asset value, offering price and redemption price per share | | $ | 12.99 | | | $ | 17.40 | |
| | | | | | | | |
| Service Class I shares: | | | | | | | | |
Net assets | | $ | - | | | $ | - | |
| | | | | | | | |
Shares outstanding (a) | | | - | | | | - | |
| | | | | | | | |
Net asset value, offering price and redemption price per share | | $ | - | | | $ | - | |
| | | | | | | | |
| (a) | Authorized unlimited number of shares with no par value. |
The accompanying notes are an integral part of the financial statements.
142
| | | | | | | | | | |
MML Small
Company
Value
Fund | | | MML
Small/Mid
Cap Value
Fund | | | MML
Total Return
Bond Fund | |
| | | | | | | | | | |
| $ | - | | | $ | 236,398,822 | | | $ | - | |
| | | | | | | | | | |
| | - | | | | 16,094,891 | | | | - | |
| | | | | | | | | | |
| $ | - | | | $ | 14.69 | | | $ | - | |
| | | | | | | | | | |
| | | | | | | | | | |
| $ | 95,787,587 | | | $ | - | | | $ | 403,732,499 | |
| | | | | | | | | | |
| | 5,444,962 | | | | - | | | | 37,935,010 | |
| | | | | | | | | | |
| $ | 17.59 | | | $ | - | | | $ | 10.64 | |
| | | | | | | | | | |
| | | | | | | | | | |
| $ | - | | | $ | 15,484,284 | | | $ | - | |
| | | | | | | | | | |
| | - | | | | 1,061,108 | | | | - | |
| | | | | | | | | | |
| $ | - | | | $ | 14.59 | | | $ | - | |
| | | | | | | | | | |
| | | | | | | | | | |
| $ | 10,726,344 | | | $ | - | | | $ | 14,435,278 | |
| | | | | | | | | | |
| | 620,397 | | | | - | | | | 1,365,258 | |
| | | | | | | | | | |
| $ | 17.29 | | | $ | - | | | $ | 10.57 | |
| | | | | | | | | | |
143
MML Series Investment Fund – Financial Statements (Continued)
Statements of Operations
For the Year Ended December 31, 2014
| | | | | | | | |
| | | MML
Blue Chip
Growth Fund | | | MML
Equity
Income Fund | |
| Investment income (Note 2): | | | | | | | | |
Dividends (a) | | $ | 2,911,575 | | | $ | 14,297,492 | |
Interest | | | 213 | | | | 10,578 | |
Securities lending net income | | | - | | | | - | |
| | | | | | | | |
Total investment income | | | 2,911,788 | | | | 14,308,070 | |
| | | | | | | | |
| Expenses (Note 3): | | | | | | | | |
Investment advisory fees | | | 3,106,235 | | | | 4,090,592 | |
Custody fees | | | 53,695 | | | | 50,889 | |
Audit fees | | | 33,998 | | | | 33,482 | |
Legal fees | | | 4,359 | | | | 5,760 | |
Proxy fees | | | 1,028 | | | | 1,028 | |
Shareholder reporting fees | | | 43,157 | | | | 56,517 | |
Trustees’ fees | | | 29,361 | | | | 38,843 | |
| | | | | | | | |
| | | 3,271,833 | | | | 4,277,111 | |
Administration fees: | | | | | | | | |
Class I | | | - | | | | - | |
Class II | | | - | | | | - | |
Class III | | | - | | | | - | |
Service Class I | | | - | | | | - | |
Service fees: | | | | | | | | |
Service Class | | | 67,847 | | | | 146,903 | |
Service Class I | | | - | | | | - | |
| | | | | | | | |
Total expenses | | | 3,339,680 | | | | 4,424,014 | |
Expenses waived (Note 3): | | | | | | | | |
Class II administrative fees waived | | | - | | | | - | |
Class III administrative fees waived | | | - | | | | - | |
Class II fees reimbursed by adviser | | | - | | | | - | |
Service Class I fees reimbursed by adviser | | | - | | | | - | |
| | | | | | | | |
Net expenses | | | 3,339,680 | | | | 4,424,014 | |
| | | | | | | | |
Net investment income (loss) | | | (427,892 | ) | | | 9,884,056 | |
| | | | | | | | |
| Realized and unrealized gain (loss): | | | | | | | | |
Net realized gain (loss) on: | | | | | | | | |
Investment transactions | | | 69,549,445 | | | | 49,901,081 | |
Futures contracts | | | - | | | | - | |
Foreign currency transactions | | | (1,645 | ) | | | (2,452 | ) |
| | | | | | | | |
Net realized gain (loss) | | | 69,547,800 | | | | 49,898,629 | |
| | | | | | | | |
Net change in unrealized appreciation (depreciation) on: | | | | | | | | |
Investment transactions | | | (32,685,851 | ) | | | (21,567,867 | ) |
Futures contracts | | | - | | | | - | |
Translation of assets and liabilities in foreign currencies | | | (629 | ) | | | (3,915 | ) |
| | | | | | | | |
Net change in unrealized appreciation (depreciation) | | | (32,686,480 | ) | | | (21,571,782 | ) |
| | | | | | | | |
Net realized gain (loss) and change in unrealized appreciation (depreciation) | | | 36,861,320 | | | | 28,326,847 | |
| | | | | | | | |
Net increase (decrease) in net assets resulting from operations | | $ | 36,433,428 | | | $ | 38,210,903 | |
| | | | | | | | |
| | | | | | | | |
(a) Net of withholding tax of: | | $ | 2,600 | | | $ | 124,269 | |
The accompanying notes are an integral part of the financial statements.
144
| | | | | | | | | | | | | | | | | | |
MML
Equity
Index Fund | | | MML
Focused
Equity Fund | | | MML
Foreign
Fund | | | MML
Fundamental
Growth Fund | | | MML
Fundamental
Value Fund | |
| | | | | | | | | | | | | | | | | | |
| $ | 8,559,261 | | | $ | 4,494,538 | | | $ | 14,337,273 | | | $ | 3,430,341 | | | $ | 5,001,492 | |
| | 824 | | | | 1,106 | | | | 3,710 | | | | 137 | | | | 410 | |
| | - | | | | - | | | | 315,433 | | | | - | | | | - | |
| | | | | | | | | | | | | | | | | | |
| | 8,560,085 | | | | 4,495,644 | | | | 14,656,416 | | | | 3,430,478 | | | | 5,001,902 | |
| | | | | | | | | | | | | | | | | | |
| | | | | | | | | | | | | | | | | | |
| | 423,814 | | | | 1,227,010 | | | | 3,214,025 | | | | 1,449,380 | | | | 1,436,622 | |
| | 40,698 | | | | 12,407 | | | | 175,518 | | | | 45,623 | | | | 20,647 | |
| | 34,001 | | | | 33,236 | | | | 39,845 | | | | 33,264 | | | | 33,271 | |
| | 4,345 | | | | 1,586 | | | | 4,158 | | | | 2,001 | | | | 2,341 | |
| | 1,028 | | | | 1,028 | | | | 1,028 | | | | 1,028 | | | | 1,028 | |
| | 43,863 | | | | 18,722 | | | | 38,504 | | | | 22,915 | | | | 24,302 | |
| | 29,983 | | | | 11,602 | | | | 26,056 | | | | 14,675 | | | | 15,654 | |
| | | | | | | | | | | | | | | | | | |
| | 577,732 | | | | 1,305,591 | | | | 3,499,134 | | | | 1,568,886 | | | | 1,533,865 | |
| | | | | | | | | | | | | | | | | | |
| | 266,978 | | | | - | | | | - | | | | - | | | | - | |
| | 279,965 | | | | 157,344 | | | | - | | | | 205,297 | | | | 217,063 | |
| | 81,066 | | | | - | | | | - | | | | - | | | | - | |
| | 76,016 | | | | 6,257 | | | | - | | | | 1,757 | | | | 3,956 | |
| | | | | | | | | | | | | | | | | | |
| | - | | | | - | | | | 25,751 | | | | - | | | | - | |
| | 63,347 | | | | 15,643 | | | | - | | | | 4,393 | | | | 9,890 | |
| | | | | | | | | | | | | | | | | | |
| | 1,345,104 | | | | 1,484,835 | | | | 3,524,885 | | | | 1,780,333 | | | | 1,764,774 | |
| | | | | | | | | | | | | | | | | | |
| | (73,675 | ) | | | - | | | | - | | | | - | | | | - | |
| | (81,066 | ) | | | - | | | | - | | | | - | | | | - | |
| | - | | | | - | | | | - | | | | (15,847 | ) | | | - | |
| | - | | | | - | | | | - | | | | (133 | ) | | | - | |
| | | | | | | | | | | | | | | | | | |
| | 1,190,363 | | | | 1,484,835 | | | | 3,524,885 | | | | 1,764,353 | | | | 1,764,774 | |
| | | | | | | | | | | | | | | | | | |
| | 7,369,722 | | | | 3,010,809 | | | | 11,131,531 | | | | 1,666,125 | | | | 3,237,128 | |
| | | | | | | | | | | | | | | | | | |
| | | | | | | | | | | | | | | | | | |
| | | | | | | | | | | | | | | | | | |
| | 8,927,495 | | | | 21,601,865 | | | | 9,819,298 | | | | 35,932,608 | | | | 17,797,353 | |
| | 884,765 | | | | - | | | | - | | | | - | | | | - | |
| | - | | | | - | | | | (148,450 | ) | | | - | | | | 660 | |
| | | | | | | | | | | | | | | | | | |
| | 9,812,260 | | | | 21,601,865 | | | | 9,670,848 | | | | 35,932,608 | | | | 17,798,013 | |
| | | | | | | | | | | | | | | | | | |
| | | | | | | | | | | | | | | | | | |
| | 36,624,730 | | | | (5,518,774 | ) | | | (45,459,284 | ) | | | (16,193,852 | ) | | | 2,469,700 | |
| | (195,993 | ) | | | - | | | | - | | | | - | | | | - | |
| | - | | | | - | | | | (54,108 | ) | | | - | | | | (4,257 | ) |
| | | | | | | | | | | | | | | | | | |
| | 36,428,737 | | | | (5,518,774 | ) | | | (45,513,392 | ) | | | (16,193,852 | ) | | | 2,465,443 | |
| | | | | | | | | | | | | | | | | | |
| | 46,240,997 | | | | 16,083,091 | | | | (35,842,544 | ) | | | 19,738,756 | | | | 20,263,456 | |
| | | | | | | | | | | | | | | | | | |
| $ | 53,610,719 | | | $ | 19,093,900 | | | $ | (24,711,013 | ) | | $ | 21,404,881 | | | $ | 23,500,584 | |
| | | | | | | | | | | | | | | | | | |
| | | | | | | | | | | | | | | | | | |
| $ | 994 | | | $ | - | | | $ | 1,091,900 | | | $ | 13,404 | | | $ | 37,241 | |
145
MML Series Investment Fund – Financial Statements (Continued)
Statements of Operations
For the Year Ended December 31, 2014
| | | | | | | | |
| | | MML
Global Fund | | | MML
Growth &
Income Fund | |
| Investment income (Note 2): | | | | | | | | |
Dividends (a) | | $ | 4,910,281 | | | $ | 2,424,088 | |
Interest | | | 332 | | | | 81 | |
Securities lending net income | | | 69,638 | | | | - | |
| | | | | | | | |
Total investment income | | | 4,980,251 | | | | 2,424,169 | |
| | | | | | | | |
| Expenses (Note 3): | | | | | | | | |
Investment advisory fees | | | 1,366,079 | | | | 705,055 | |
Custody fees | | | 84,773 | | | | 25,723 | |
Audit fees | | | 41,435 | | | | 33,220 | |
Legal fees | | | 2,414 | | | | 1,393 | |
Proxy fees | | | 1,028 | | | | 1,028 | |
Shareholder reporting fees | | | 24,938 | | | | 16,719 | |
Trustees’ fees | | | 16,124 | | | | 10,019 | |
| | | | | | | | |
| | | 1,536,791 | | | | 793,157 | |
Administration fees: | | | | | | | | |
Class I | | | 565,512 | | | | - | |
Class II | | | 32,267 | | | | - | |
Service Class I | | | 21,797 | | | | - | |
Service fees: | | | | | | | | |
Service Class | | | - | | | | 44,860 | |
Service Class I | | | 19,462 | | | | - | |
| | | | | | | | |
Total expenses | | | 2,175,829 | | | | 838,017 | |
Expenses waived (Note 3): | | | | | | | | |
Class I fees reimbursed by adviser | | | (111,039 | ) | | | - | |
Class II fees reimbursed by adviser | | | (9,856 | ) | | | - | |
Service Class I fees reimbursed by adviser | | | (4,280 | ) | | | - | |
| | | | | | | | |
Net expenses | | | 2,050,654 | | | | 838,017 | |
| | | | | | | | |
Net investment income (loss) | | | 2,929,597 | | | | 1,586,152 | |
| | | | | | | | |
| Realized and unrealized gain (loss): | | | | | | | | |
Net realized gain (loss) on: | | | | | | | | |
Investment transactions | | | 11,009,412 | | | | 17,451,605 | |
Written options | | | - | | | | - | |
Foreign currency transactions | | | (59,430 | ) | | | (2,273 | ) |
| | | | | | | | |
Net realized gain (loss) | | | 10,949,982 | | | | 17,449,332 | |
| | | | | | | | |
Net change in unrealized appreciation (depreciation) on: | | | | | | | | |
Investment transactions | | | (3,768,825 | ) | | | (4,156,107 | ) |
Written options | | | - | | | | - | |
Translation of assets and liabilities in foreign currencies | | | (27,461 | ) | | | (754 | ) |
| | | | | | | | |
Net change in unrealized appreciation (depreciation) | | | (3,796,286 | ) | | | (4,156,861 | ) |
| | | | | | | | |
Net realized gain (loss) and change in unrealized appreciation (depreciation) | | | 7,153,696 | | | | 13,292,471 | |
| | | | | | | | |
Net increase (decrease) in net assets resulting from operations | | $ | 10,083,293 | | | $ | 14,878,623 | |
| | | | | | | | |
| | | | | | | | |
Net of withholding tax of: | | $ | 302,325 | | | $ | 41,081 | |
| + | Fund and Class II shares commenced operations on January 7, 2014. |
| * | Service Class I shares commenced operations on May 1, 2014. |
The accompanying notes are an integral part of the financial statements.
146
| | | | | | | | | | | | | | | | | | |
MML
Income &
Growth Fund | | | MML
International
Equity Fund+ | | | MML
Large Cap
Growth Fund | | | MML
Managed
Volatility Fund | | | MML
Mid Cap
Growth Fund | |
| | | | | | | | | | | | | | | | | | |
| $ | 6,385,164 | | | $ | 3,207,968 | | | $ | 1,520,391 | | | $ | 6,697,865 | | | $ | 2,539,605 | |
| | 632 | | | | 187 | | | | 489 | | | | 1,833 | | | | 3,922 | |
| | - | | | | 4,756 | | | | - | | | | - | | | | 122,215 | |
| | | | | | | | | | | | | | | | | | |
| | 6,385,796 | | | | 3,212,911 | | | | 1,520,880 | | | | 6,699,698 | | | | 2,665,742 | |
| | | | | | | | | | | | | | | | | | |
| | | | | | | | | | | | | | | | | | |
| | 1,590,759 | | | | 977,376 | | | | 1,578,931 | | | | 2,456,976 | | | | 3,205,297 | |
| | 30,107 | | | | 140,267 | | | | 21,512 | | | | 413,027 | | | | 47,527 | |
| | 33,886 | | | | 34,965 | | | | 33,287 | | | | 33,335 | | | | 33,995 | |
| | 2,697 | | | | 3,889 | | | | 2,518 | | | | 3,137 | | | | 4,801 | |
| | 1,028 | | | | 1,028 | | | | 1,028 | | | | 1,028 | | | | 1,028 | |
| | 26,817 | | | | 38,090 | | | | 26,489 | | | | 33,571 | | | | 42,885 | |
| | 17,316 | | | | 8,335 | | | | 17,153 | | | | 23,549 | | | | 29,289 | |
| | | | | | | | | | | | | | | | | | |
| | 1,702,610 | | | | 1,203,950 | | | | 1,680,918 | | | | 2,964,623 | | | | 3,364,822 | |
| | | | | | | | | | | | | | | | | | |
| | - | | | | - | | | | - | | | | - | | | | - | |
| | - | | | | 114,867 | | | | - | | | | - | | | | - | |
| | - | | | | 118 | * | | | - | | | | - | | | | - | |
| | | | | | | | | | | | | | | | | | |
| | 38,075 | | | | - | | | | 5,642 | | | | 73,461 | | | | 124,830 | |
| | - | | | | 295 | * | | | - | | | | - | | | | - | |
| | | | | | | | | | | | | | | | | | |
| | 1,740,685 | | | | 1,319,230 | | | | 1,686,560 | | | | 3,038,084 | | | | 3,489,652 | |
| | | | | | | | | | | | | | | | | | |
| | - | | | | - | | | | - | | | | - | | | | - | |
| | - | | | | (168,952 | ) | | | - | | | | - | | | | - | |
| | - | | | | (129 | )* | | | - | | | | - | | | | - | |
| | | | | | | | | | | | | | | | | | |
| | 1,740,685 | | | | 1,150,149 | | | | 1,686,560 | | | | 3,038,084 | | | | 3,489,652 | |
| | | | | | | | | | | | | | | | | | |
| | 4,645,111 | | | | 2,062,762 | | | | (165,680 | ) | | | 3,661,614 | | | | (823,910 | ) |
| | | | | | | | | | | | | | | | | | |
| | | | | | | | | | | | | | | | | | |
| | | | | | | | | | | | | | | | | | |
| | 16,826,310 | | | | 330,483 | | | | 44,101,255 | | | | 3,453,674 | | | | 50,185,643 | |
| | - | | | | - | | | | - | | | | (23,964,700 | ) | | | - | |
| | (18,835 | ) | | | 422,864 | | | | - | | | | 3,023 | | | | (382 | ) |
| | | | | | | | | | | | | | | | | | |
| | 16,807,475 | | | | 753,347 | | | | 44,101,255 | | | | (20,508,003 | ) | | | 50,185,261 | |
| | | | | | | | | | | | | | | | | | |
| | | | | | | | | | | | | | | | | | |
| | 376,708 | | | | (9,674,532 | ) | | | (21,583,797 | ) | | | 29,019,965 | | | | 2,639,627 | |
| | - | | | | - | | | | - | | | | 2,899,063 | | | | - | |
| | (67 | ) | | | 485,040 | | | | - | | | | (7,845 | ) | | | (236 | ) |
| | | | | | | | | | | | | | | | | | |
| | 376,641 | | | | (9,189,492 | ) | | | (21,583,797 | ) | | | 31,911,183 | | | | 2,639,391 | |
| | | | | | | | | | | | | | | | | | |
| | 17,184,116 | | | | (8,436,145 | ) | | | 22,517,458 | | | | 11,403,180 | | | | 52,824,652 | |
| | | | | | | | | | | | | | | | | | |
| $ | 21,829,227 | | | $ | (6,373,383 | ) | | $ | 22,351,778 | | | $ | 15,064,794 | | | $ | 52,000,742 | |
| | | | | | | | | | | | | | | | | | |
| | | | | | | | | | | | | | | | | | |
| $ | 67,683 | | | $ | 302,018 | | | $ | - | | | $ | 806 | | | $ | 18,369 | |
147
MML Series Investment Fund – Financial Statements (Continued)
Statements of Operations
For the Year Ended December 31, 2014
| | | | | | | | |
| | |
MML
Mid Cap
Value Fund | | | MML
Small Cap
Growth
Equity Fund | |
| Investment income (Note 2): | | | | | | | | |
Dividends (a) | | $ | 11,168,092 | | | $ | 1,589,251 | |
Interest (b) | | | 29,617 | | | | 430 | |
Securities lending net income | | | - | | | | 143,148 | |
| | | | | | | | |
Total investment income | | | 11,197,709 | | | | 1,732,829 | |
| | | | | | | | |
| Expenses (Note 3): | | | | | | | | |
Investment advisory fees | | | 4,135,014 | | | | 2,740,291 | |
Custody fees | | | 75,448 | | | | 48,667 | |
Interest expense | | | - | | | | - | |
Audit fees | | | 34,044 | | | | 35,899 | |
Legal fees | | | 5,071 | | | | 2,732 | |
Proxy fees | | | 1,028 | | | | 1,028 | |
Shareholder reporting fees | | | 50,540 | | | | 28,555 | |
Trustees’ fees | | | 34,851 | | | | 18,673 | |
| | | | | | | | |
| | | 4,335,996 | | | | 2,875,845 | |
Administration fees: | | | | | | | | |
Class II | | | - | | | | - | |
Service Class I | | | - | | | | - | |
Service fees: | | | | | | | | |
Service Class | | | 66,119 | | | | 21,940 | |
Service Class I | | | - | | | | - | |
| | | | | | | | |
Total expenses | | | 4,402,115 | | | | 2,897,785 | |
Expenses waived (Note 3): | | | | | | | | |
Class II fees reimbursed by adviser | | | - | | | | - | |
Service Class I fees reimbursed by adviser | | | - | | | | - | |
Class II advisory fees waived | | | - | | | | - | |
Service Class I advisory fees waived | | | - | | | | - | |
| | | | | | | | |
Net expenses | | | 4,402,115 | | | | 2,897,785 | |
| | | | | | | | |
Net investment income (loss) | | | 6,795,594 | | | | (1,164,956 | ) |
| | | | | | | | |
| Realized and unrealized gain (loss): | | | | | | | | |
Net realized gain (loss) on: | | | | | | | | |
Investment transactions | | | 70,810,684 | | | | 44,707,683 | |
Futures contracts | | | - | | | | - | |
Written options | | | - | | | | - | |
Swap agreements | | | - | | | | - | |
Foreign currency transactions | | | 1,887,982 | | | | (189 | ) |
| | | | | | | | |
Net realized gain (loss) | | | 72,698,666 | | | | 44,707,494 | |
| | | | | | | | |
Net change in unrealized appreciation (depreciation) on: | | | | | | | | |
Investment transactions | | | (3,749,777 | ) | | | (28,465,908 | ) |
Futures contracts | | | - | | | | - | |
Written options | | | - | | | | - | |
Forward sale commitments | | | - | | | | - | |
Swap agreements | | | - | | | | - | |
Translation of assets and liabilities in foreign currencies | | | 205,124 | | | | (103 | ) |
| | | | | | | | |
Net change in unrealized appreciation (depreciation) | | | (3,544,653 | ) | | | (28,466,011 | ) |
| | | | | | | | |
Net realized gain (loss) and change in unrealized appreciation (depreciation) | | | 69,154,013 | | | | 16,241,483 | |
| | | | | | | | |
Net increase (decrease) in net assets resulting from operations | | $ | 75,949,607 | | | $ | 15,076,527 | |
| | | | | | | | |
| | | | | | | | |
(a) Net of withholding tax of: | | $ | 77,069 | | | $ | 1,422 | |
(b) Net of withholding tax of: | | $ | - | | | $ | - | |
The accompanying notes are an integral part of the financial statements.
148
| | | | | | | | | | |
MML
Small
Company
Value Fund | | | MML
Small/Mid
Cap Value
Fund | | | MML
Total
Return
Bond Fund | |
| | | | | | | | | | |
| $ | 1,433,332 | | | $ | 4,096,814 | | | $ | 89,375 | |
| | 282 | | | | 276 | | | | 8,037,272 | |
| | 21,089 | | | | - | | | | - | |
| | | | | | | | | | |
| | 1,454,703 | | | | 4,097,090 | | | | 8,126,647 | |
| | | | | | | | | | |
| | | | | | | | | | |
| | 876,921 | | | | 1,932,001 | | | | 2,115,178 | |
| | 17,841 | | | | 28,533 | | | | 231,555 | |
| | - | | | | - | | | | 25 | |
| | 33,791 | | | | 33,297 | | | | 89,401 | |
| | 1,129 | | | | 2,616 | | | | 5,340 | |
| | 1,028 | | | | 1,028 | | | | 1,028 | |
| | 12,582 | | | | 28,916 | | | | 46,270 | |
| | 7,238 | | | | 18,413 | | | | 30,238 | |
| | | | | | | | | | |
| | 950,530 | | | | 2,044,804 | | | | 2,519,035 | |
| | | | | | | | | | |
| | 233,307 | | | | - | | | | 409,728 | |
| | 24,611 | | | | - | | | | 13,308 | |
| | | | | | | | | | |
| | - | | | | 35,950 | | | | - | |
| | 24,611 | | | | - | | | | 33,270 | |
| | | | | | | | | | |
| | 1,233,059 | | | | 2,080,754 | | | | 2,975,341 | |
| | | | | | | | | | |
| | (19,923 | ) | | | - | | | | (186,216 | ) |
| | (2,103 | ) | | | - | | | | (6,099 | ) |
| | - | | | | - | | | | (8,832 | ) |
| | - | | | | - | | | | (316 | ) |
| | | | | | | | | | |
| | 1,211,033 | | | | 2,080,754 | | | | 2,773,878 | |
| | | | | | | | | | |
| | 243,670 | | | | 2,016,336 | | | | 5,352,769 | |
| | | | | | | | | | |
| | | | | | | | | | |
| | | | | | | | | | |
| | 10,228,974 | | | | 37,841,770 | | | | (1,919,695 | ) |
| | - | | | | - | | | | 5,713,755 | |
| | - | | | | - | | | | 691,333 | |
| | - | | | | - | | | | (993,351 | ) |
| | (1,174 | ) | | | - | | | | 9,100,314 | |
| | | | | | | | | | |
| | 10,227,800 | | | | 37,841,770 | | | | 12,592,356 | |
| | | | | | | | | | |
| | | | | | | | | | |
| | (9,900,681 | ) | | | (16,434,754 | ) | | | 2,196,399 | |
| | - | | | | - | | | | 453,439 | |
| | - | | | | - | | | | (48,307 | ) |
| | - | | | | - | | | | (6,918 | ) |
| | - | | | | - | | | | (2,313,836 | ) |
| | 7 | | | | - | | | | 1,392,569 | |
| | | | | | | | | | |
| | (9,900,674 | ) | | | (16,434,754 | ) | | | 1,673,346 | |
| | | | | | | | | | |
| | 327,126 | | | | 21,407,016 | | | | 14,265,702 | |
| | | | | | | | | | |
| $ | 570,796 | | | $ | 23,423,352 | | | $ | 19,618,471 | |
| | | | | | | | | | |
| | | | | | | | | | |
| $ | 451 | | | $ | - | | | $ | - | |
| $ | - | | | $ | - | | | $ | 1,111 | |
149
MML Series Investment Fund – Financial Statements (Continued)
Statements of Changes in Net Assets
| | | | | | | | |
| | | MML
Blue Chip Growth Fund | |
| | | Year
Ended
December 31, 2014 | | | Year
Ended
December 31, 2013 | |
| Increase (Decrease) in Net Assets: | | | | | | | | |
| Operations: | | | | | | | | |
Net investment income (loss) | | $ | (427,892 | ) | | $ | (95,067 | ) |
Net realized gain (loss) on investment transactions | | | 69,547,800 | | | | 42,521,155 | |
Net change in unrealized appreciation (depreciation) on investments | | | (32,686,480 | ) | | | 94,434,187 | |
| | | | | | | | |
Net increase (decrease) in net assets resulting from operations | | | 36,433,428 | | | | 136,860,275 | |
| | | | | | | | |
| Distributions to shareholders (Note 2): | | | | | | | | |
From net investment income: | | | | | | | | |
Initial Class | | | - | | | | (821,345 | ) |
Class I | | | - | | | | - | |
Class II | | | - | | | | - | |
Class III | | | - | | | | - | |
Service Class | | | - | | | | (9,913 | ) |
Service Class I | | | - | | | | - | |
| | | | | | | | |
Total distributions from net investment income | | | - | | | | (831,258 | ) |
| | | | | | | | |
From net realized gains: | | | | | | | | |
Initial Class | | | (38,644,089 | ) | | | (32,280,599 | ) |
Class I | | | - | | | | - | |
Class II | | | - | | | | - | |
Class III | | | - | | | | - | |
Service Class | | | (2,902,689 | ) | | | (1,635,935 | ) |
Service Class I | | | - | | | | - | |
| | | | | | | | |
Total distributions from net realized gains | | | (41,546,778 | ) | | | (33,916,534 | ) |
| | | | | | | | |
| Net fund share transactions (Note 5): | | | | | | | | |
Initial Class | | | (34,706,171 | ) | | | 11,149,065 | |
Class I | | | - | | | | - | |
Class II | | | - | | | | - | |
Class III | | | - | | | | - | |
Service Class | | | 8,899,336 | | | | 3,560,334 | |
Service Class I | | | - | | | | - | |
| | | | | | | | |
Increase (decrease) in net assets from fund share transactions | | | (25,806,835 | ) | | | 14,709,399 | |
| | | | | | | | |
Total increase (decrease) in net assets | | | (30,920,185 | ) | | | 116,821,882 | |
| Net assets | | | | | | | | |
Beginning of year | | | 452,962,318 | | | | 336,140,436 | |
| | | | | | | | |
End of year | | $ | 422,042,133 | | | $ | 452,962,318 | |
| | | | | | | | |
Undistributed (accumulated) net investment income (loss) included in net assets at end of year | | $ | (69,328 | ) | | $ | (60,923 | ) |
| | | | | | | | |
The accompanying notes are an integral part of the financial statements.
150
| | | | | | | | | | | | | | |
MML
Equity Income Fund | | | MML
Equity Index Fund | |
Year
Ended
December 31, 2014 | | | Year
Ended
December 31, 2013 | | | Year
Ended
December 31, 2014 | | | Year
Ended
December 31, 2013 | |
| | | | | | | | | | | | | | |
| | | | | | | | | | | | | | |
| $ | 9,884,056 | | | $ | 9,217,446 | | | $ | 7,369,722 | | | $ | 6,586,658 | |
| | 49,898,629 | | | | 37,762,416 | | | | 9,812,260 | | | | 5,394,902 | |
| | (21,571,782 | ) | | | 100,712,505 | | | | 36,428,737 | | | | 88,789,128 | |
| | | | | | | | | | | | | | |
| | 38,210,903 | | | | 147,692,367 | | | | 53,610,719 | | | | 100,770,688 | |
| | | | | | | | | | | | | | |
| | | | | | | | | | | | | | |
| | | | | | | | | | | | | | |
| | (8,018,961 | ) | | | (9,755,151 | ) | | | - | | | | - | |
| | - | | | | - | | | | (1,175,835 | ) | | | (1,370,225 | ) |
| | - | | | | - | | | | (2,276,426 | ) | | | (2,060,170 | ) |
| | - | | | | - | | | | (2,698,994 | ) | | | (2,527,726 | ) |
| | (901,506 | ) | | | (824,404 | ) | | | - | | | | - | |
| | - | | | | - | | | | (353,133 | ) | | | (268,166 | ) |
| | | | | | | | | | | | | | |
| | (8,920,467 | ) | | | (10,579,555 | ) | | | (6,504,388 | ) | | | (6,226,287 | ) |
| | | | | | | | | | | | | | |
| | | | | | | | | | | | | | |
| | (10,656,649 | ) | | | - | | | | - | | | | - | |
| | - | | | | - | | | | (1,137,718 | ) | | | (271,764 | ) |
| | - | | | | - | | | | (1,938,297 | ) | | | (374,362 | ) |
| | - | | | | - | | | | (2,135,011 | ) | | | (427,558 | ) |
| | (1,355,561 | ) | | | - | | | | - | | | | - | |
| | - | | | | - | | | | (345,612 | ) | | | (52,886 | ) |
| | | | | | | | | | | | | | |
| | (12,012,210 | ) | | | - | | | | (5,556,638 | ) | | | (1,126,570 | ) |
| | | | | | | | | | | | | | |
| | | | | | | | | | | | | | |
| | (99,003,700 | ) | | | (47,334,603 | ) | | | - | | | | - | |
| | - | | | | - | | | | (17,034,367 | ) | | | (8,536,399 | ) |
| | - | | | | - | | | | (1,698,383 | ) | | | (353,791 | ) |
| | - | | | | - | | | | 2,153,206 | | | | 1,203,505 | |
| | 7,240,263 | | | | 3,952,705 | | | | - | | | | - | |
| | - | | | | - | | | | 8,099,942 | | | | 7,408,938 | |
| | | | | | | | | | | | | | |
| | (91,763,437 | ) | | | (43,381,898 | ) | | | (8,479,602 | ) | | | (277,747 | ) |
| | | | | | | | | | | | | | |
| | (74,485,211 | ) | | | 93,730,914 | | | | 33,070,091 | | | | 93,140,084 | |
| | | | | | | | | | | | | | |
| | 611,224,617 | | | | 517,493,703 | | | | 411,119,022 | | | | 317,978,938 | |
| | | | | | | | | | | | | | |
| $ | 536,739,406 | | | $ | 611,224,617 | | | $ | 444,189,113 | | | $ | 411,119,022 | |
| | | | | | | | | | | | | | |
$ |
9,750,164 |
| | $ | 9,122,284 | | | $ | 7,226,791 | | | $ | 6,419,905 | |
| | | | | | | | | | | | | | |
151
MML Series Investment Fund – Financial Statements (Continued)
Statements of Changes in Net Assets
| | | | | | | | |
| | | MML
Focused Equity Fund | |
| | | Year
Ended
December 31, 2014 | | | Year
Ended
December 31, 2013 | |
| Increase (Decrease) in Net Assets: | | | | | | | | |
| Operations: | | | | | | | | |
Net investment income (loss) | | $ | 3,010,809 | | | $ | 605,783 | |
Net realized gain (loss) on investment transactions | | | 21,601,865 | | | | 14,894,498 | |
Net change in unrealized appreciation (depreciation) on investments | | | (5,518,774 | ) | | | 33,974,350 | |
| | | | | | | | |
Net increase (decrease) in net assets resulting from operations | | | 19,093,900 | | | | 49,474,631 | |
| | | | | | | | |
| Distributions to shareholders (Note 2): | | | | | | | | |
From net investment income: | | | | | | | | |
Initial Class | | | - | | | | - | |
Class II | | | (589,491 | ) | | | - | |
Service Class | | | - | | | | - | |
Service Class I | | | (21,642 | ) | | | - | |
| | | | | | | | |
Total distributions from net investment income | | | (611,133 | ) | | | - | |
| | | | | | | | |
From net realized gains: | | | | | | | | |
Class II | | | (14,323,542 | ) | | | (2,056,722 | ) |
Service Class I | | | (589,870 | ) | | | (40,162 | ) |
| | | | | | | | |
Total distributions from net realized gains | | | (14,913,412 | ) | | | (2,096,884 | ) |
| | | | | | | | |
| Net fund share transactions (Note 5): | | | | | | | | |
Initial Class | | | - | | | | - | |
Class II | | | (9,844,613 | ) | | | (16,334,701 | ) |
Service Class | | | - | | | | - | |
Service Class I | | | 2,155,549 | | | | 3,448,372 | |
| | | | | | | | |
Increase (decrease) in net assets from fund share transactions | | | (7,689,064 | ) | | | (12,886,329 | ) |
| | | | | | | | |
Total increase (decrease) in net assets | | | (4,119,709 | ) | | | 34,491,418 | |
| Net assets | | | | | | | | |
Beginning of year | | | 171,614,505 | | | | 137,123,087 | |
| | | | | | | | |
End of year | | $ | 167,494,796 | | | $ | 171,614,505 | |
| | | | | | | | |
Undistributed (accumulated) net investment income (loss) included in net assets at end of year | | $ | 3,000,315 | | | $ | 600,718 | |
| | | | | | | | |
The accompanying notes are an integral part of the financial statements.
152
| | | | | | | | | | | | | | |
MML
Foreign Fund | | | MML
Fundamental Growth Fund | |
Year
Ended
December 31, 2014 | | | Year
Ended
December 31, 2013 | | | Year
Ended
December 31, 2014 | | | Year
Ended
December 31, 2013 | |
| | | | | | | | | | | | | | |
| | | | | | | | | | | | | | |
| $ | 11,131,531 | | | $ | 7,986,225 | | | $ | 1,666,125 | | | $ | 1,522,401 | |
| | 9,670,848 | | | | 4,771,849 | | | | 35,932,608 | | | | 13,875,240 | |
| | (45,513,392 | ) | | | 64,905,933 | | | | (16,193,852 | ) | | | 44,061,762 | |
| | | | | | | | | | | | | | |
| | (24,711,013 | ) | | | 77,664,007 | | | | 21,404,881 | | | | 59,459,403 | |
| | | | | | | | | | | | | | |
| | | | | | | | | | | | | | |
| | | | | | | | | | | | | | |
| | (7,579,051 | ) | | | (7,749,572 | ) | | | - | | | | - | |
| | - | | | | - | | | | (1,444,222 | ) | | | - | |
| | (234,680 | ) | | | (126,024 | ) | | | - | | | | - | |
| | - | | | | - | | | | (11,734 | ) | | | - | |
| | | | | | | | | | | | | | |
| | (7,813,731 | ) | | | (7,875,596 | ) | | | (1,455,956 | ) | | | - | |
| | | | | | | | | | | | | | |
| | | | | | | | | | | | | | |
| | - | | | | - | | | | (13,666,020 | ) | | | (176,790 | ) |
| | - | | | | - | | | | (121,957 | ) | | | (766 | ) |
| | | | | | | | | | | | | | |
| | - | | | | - | | | | (13,787,977 | ) | | | (177,556 | ) |
| | | | | | | | | | | | | | |
| | | | | | | | | | | | | | |
| | (52,893,639 | ) | | | (11,335,137 | ) | | | - | | | | - | |
| | - | | | | - | | | | (35,841,777 | ) | | | (2,043,186 | ) |
| | 3,838,810 | | | | 330,781 | | | | - | | | | - | |
| | - | | | | - | | | | 791,045 | | | | 598,930 | |
| | | | | | | | | | | | | | |
| | (49,054,829 | ) | | | (11,004,356 | ) | | | (35,050,732 | ) | | | (1,444,256 | ) |
| | | | | | | | | | | | | | |
| | (81,579,573 | ) | | | 58,784,055 | | | | (28,889,784 | ) | | | 57,837,591 | |
| | | | | | | | | | | | | | |
| | 420,713,380 | | | | 361,929,325 | | | | 238,189,710 | | | | 180,352,119 | |
| | | | | | | | | | | | | | |
| $ | 339,133,807 | | | $ | 420,713,380 | | | $ | 209,299,926 | | | $ | 238,189,710 | |
| | | | | | | | | | | | | | |
$ |
10,833,558 |
| | $ | 7,631,318 | | | $ | 1,651,596 | | | $ | 1,515,348 | |
| | | | | | | | | | | | | | |
153
MML Series Investment Fund – Financial Statements (Continued)
Statements of Changes in Net Assets
| | | | | | | | |
| | | MML
Fundamental Value Fund | |
| | | Year
Ended
December 31, 2014 | | | Year
Ended
December 31, 2013 | |
| Increase (Decrease) in Net Assets: | | | | | | | | |
| Operations: | | | | | | | | |
Net investment income (loss) | | $ | 3,237,128 | | | $ | 3,376,405 | |
Net realized gain (loss) on investment transactions | | | 17,798,013 | | | | 9,620,457 | |
Net change in unrealized appreciation (depreciation) on investments | | | 2,465,443 | | | | 43,174,767 | |
| | | | | | | | |
Net increase (decrease) in net assets resulting from operations | | | 23,500,584 | | | | 56,171,629 | |
| | | | | | | | |
| Distributions to shareholders (Note 2): | | | | | | | | |
From net investment income: | | | | | | | | |
Initial Class | | | - | | | | - | |
Class I | | | - | | | | - | |
Class II | | | (3,289,698 | ) | | | (3,428,702 | ) |
Service Class | | | - | | | | - | |
Service Class I | | | (64,331 | ) | | | (21,843 | ) |
| | | | | | | | |
Total distributions from net investment income | | | (3,354,029 | ) | | | (3,450,545 | ) |
| | | | | | | | |
From net realized gains: | | | | | | | | |
Class I | | | - | | | | - | |
Class II | | | (9,467,364 | ) | | | (7,095,794 | ) |
Service Class I | | | (185,991 | ) | | | (43,969 | ) |
| | | | | | | | |
Total distributions from net realized gains | | | (9,653,355 | ) | | | (7,139,763 | ) |
| | | | | | | | |
| Net fund share transactions (Note 5): | | | | | | | | |
Initial Class | | | - | | | | - | |
Class I | | | - | | | | - | |
Class II | | | (24,332,536 | ) | | | 2,908,411 | |
Service Class | | | - | | | | - | |
Service Class I | | | 2,755,530 | | | | 2,029,846 | |
| | | | | | | | |
Increase (decrease) in net assets from fund share transactions | | | (21,577,006 | ) | | | 4,938,257 | |
| | | | | | | | |
Total increase (decrease) in net assets | | | (11,083,806 | ) | | | 50,519,578 | |
| Net assets | | | | | | | | |
Beginning of year | | | 236,373,588 | | | | 185,854,010 | |
| | | | | | | | |
End of year | | $ | 225,289,782 | | | $ | 236,373,588 | |
| | | | | | | | |
Undistributed (accumulated) net investment income (loss) included in net assets at end of year | | $ | 3,219,670 | | | $ | 3,364,084 | |
| | | | | | | | |
The accompanying notes are an integral part of the financial statements.
154
| | | | | | | | | | | | | | |
MML
Global Fund | | | MML
Growth & Income Fund | |
Year
Ended
December 31, 2014 | | | Year
Ended
December 31, 2013 | | | Year
Ended
December 31, 2014 | | | Year
Ended
December 31, 2013 | |
| | | | | | | | | | | | | | |
| | | | | | | | | | | | | | |
| $ | 2,929,597 | | | $ | 1,780,870 | | | $ | 1,586,152 | | | $ | 1,650,601 | |
| | 10,949,982 | | | | 11,249,758 | | | | 17,449,332 | | | | 13,637,046 | |
| | (3,796,286 | ) | | | 27,068,087 | | | | (4,156,861 | ) | | | 23,484,350 | |
| | | | | | | | | | | | | | |
| | 10,083,293 | | | | 40,098,715 | | | | 14,878,623 | | | | 38,771,997 | |
| | | | | | | | | | | | | | |
| | | | | | | | | | | | | | |
| | | | | | | | | | | | | | |
| | - | | | | - | | | | (1,393,594 | ) | | | (1,618,014 | ) |
| | (1,754,223 | ) | | | (1,585,115 | ) | | | - | | | | - | |
| | (152,774 | ) | | | (204,676 | ) | | | - | | | | - | |
| | - | | | | - | | | | (172,322 | ) | | | (173,449 | ) |
| | (57,994 | ) | | | (57,420 | ) | | | - | | | | - | |
| | | | | | | | | | | | | | |
| | (1,964,991 | ) | | | (1,847,211 | ) | | | (1,565,916 | ) | | | (1,791,463 | ) |
| | | | | | | | | | | | | | |
| | | | | | | | | | | | | | |
| | (3,467,392 | ) | | | - | | | | - | | | | - | |
| | (292,710 | ) | | | - | | | | - | | | | - | |
| | (138,436 | ) | | | - | | | | - | | | | - | |
| | | | | | | | | | | | | | |
| | (3,898,538 | ) | | | - | | | | - | | | | - | |
| | | | | | | | | | | | | | |
| | | | | | | | | | | | | | |
| | - | | | | - | | | | (19,004,784 | ) | | | (20,020,941 | ) |
| | 56,727,406 | | | | (14,742,778 | ) | | | - | | | | - | |
| | (1,446,027 | ) | | | (1,816,143 | ) | | | - | | | | - | |
| | - | | | | - | | | | 38,388 | | | | 789,448 | |
| | 2,461,129 | | | | 1,745,820 | | | | - | | | | - | |
| | | | | | | | | | | | | | |
| | 57,742,508 | | | | (14,813,101 | ) | | | (18,966,396 | ) | | | (19,231,493 | ) |
| | | | | | | | | | | | | | |
| | 61,962,272 | | | | 23,438,403 | | | | (5,653,689 | ) | | | 17,749,041 | |
| | | | | | | | | | | | | | |
| | 175,133,598 | | | | 151,695,195 | | | | 146,249,191 | | | | 128,500,150 | |
| | | | | | | | | | | | | | |
| $ | 237,095,870 | | | $ | 175,133,598 | | | $ | 140,595,502 | | | $ | 146,249,191 | |
| | | | | | | | | | | | | | |
$ |
2,848,820 |
| | $ | 1,953,706 | | | $ | 1,540,527 | | | $ | 1,602,963 | |
| | | | | | | | | | | | | | |
155
MML Series Investment Fund – Financial Statements (Continued)
Statements of Changes in Net Assets
| | | | | | | | |
| | | MML
Income & Growth Fund | |
| | | Year
Ended
December 31, 2014 | | | Year
Ended
December 31, 2013 | |
| Increase (Decrease) in Net Assets: | | | | | | | | |
| Operations: | | | | | | | | |
Net investment income (loss) | | $ | 4,645,111 | | | $ | 4,494,416 | |
Net realized gain (loss) on investment transactions | | | 16,807,475 | | | | 3,429,699 | |
Net change in unrealized appreciation (depreciation) on investments | | | 376,641 | | | | 39,637,860 | |
| | | | | | | | |
Net increase (decrease) in net assets resulting from operations | | | 21,829,227 | | | | 47,561,975 | |
| | | | | | | | |
| Distributions to shareholders (Note 2): | | | | | | | | |
From net investment income: | | | | | | | | |
Initial Class | | | (4,208,862 | ) | | | (3,744,150 | ) |
Class II | | | - | | | | - | |
Service Class | | | (246,039 | ) | | | (220,892 | ) |
Service Class I | | | - | | | | - | |
| | | | | | | | |
Total distributions from net investment income | | | (4,454,901 | ) | | | (3,965,042 | ) |
| | | | | | | | |
From net realized gains: | | | | | | | | |
Initial Class | | | - | | | | - | |
Class II | | | - | | | | - | |
Service Class | | | - | | | | - | |
Service Class I | | | - | | | | - | |
| | | | | | | | |
Total distributions from net realized gains | | | - | | | | - | |
| | | | | | | | |
| Net fund share transactions (Note 5): | | | | | | | | |
Initial Class | | | (12,189,357 | ) | | | 15,920,205 | |
Class II | | | - | | | | - | |
Service Class | | | 263,856 | | | | 863,277 | |
Service Class I | | | - | | | | - | |
| | | | | | | | |
Increase (decrease) in net assets from fund share transactions | | | (11,925,501 | ) | | | 16,783,482 | |
| | | | | | | | |
Total increase (decrease) in net assets | | | 5,448,825 | | | | 60,380,415 | |
| Net assets | | | | | | | | |
Beginning of year | | | 242,869,571 | | | | 182,489,156 | |
| | | | | | | | |
End of year | | $ | 248,318,396 | | | $ | 242,869,571 | |
| | | | | | | | |
Undistributed (accumulated) net investment income (loss) included in net assets at end of year | | $ | 4,588,599 | | | $ | 4,463,436 | |
| | | | | | | | |
Distributions in excess of net investment income included in net assets at end of year | | $ | - | | | $ | - | |
| | | | | | | | |
| + | Fund commenced operations on January 7, 2014. |
| * | Service Class I shares commenced operations on May 1, 2014. |
The accompanying notes are an integral part of the financial statements.
156
| | | | | | | | | | |
MML
International Equity Fund | | | MML
Large Cap Growth Fund | |
Period
Ended
December 31, 2014+ | | | Year
Ended
December 31, 2014 | | | Year
Ended
December 31, 2013 | |
| | | | | | | | | | |
| | | | | | | | | | |
| $ | 2,062,762 | | | $ | (165,680 | ) | | $ | 6,136 | |
| | 753,347 | | | | 44,101,255 | | | | 30,863,487 | |
| | (9,189,492 | ) | | | (21,583,797 | ) | | | 38,368,865 | |
| | | | | | | | | | |
| | (6,373,383 | ) | | | 22,351,778 | | | | 69,238,488 | |
| | | | | | | | | | |
| | | | | | | | | | |
| | | | | | | | | | |
| | - | | | | - | | | | (904,755 | ) |
| | (2,657,331 | ) | | | - | | | | - | |
| | - | | | | - | | | | (2,705 | ) |
| | (5,758 | )* | | | - | | | | - | |
| | | | | | | | | | |
| | (2,663,089 | ) | | | - | | | | (907,460 | ) |
| | | | | | | | | | |
| | | | | | | | | | |
| | - | | | | (30,391,668 | ) | | | (12,258,471 | ) |
| | (728,662 | ) | | | - | | | | - | |
| | - | | | | (304,214 | ) | | | (82,988 | ) |
| | (1,648 | )* | | | - | | | | - | |
| | | | | | | | | | |
| | (730,310 | ) | | | (30,695,882 | ) | | | (12,341,459 | ) |
| | | | | | | | | | |
| | | | | | | | | | |
| | - | | | | (17,830,893 | ) | | | 6,892,088 | |
| | 133,659,993 | | | | - | | | | - | |
| | - | | | | 950,193 | | | | 25,881 | |
| | 320,493 | * | | | - | | | | - | |
| | | | | | | | | | |
| | 133,980,486 | | | | (16,880,700 | ) | | | 6,917,969 | |
| | | | | | | | | | |
| | 124,213,704 | | | | (25,224,804 | ) | | | 62,907,538 | |
| | | | | | | | | | |
| | - | | | | 270,179,588 | | | | 207,272,050 | |
| | | | | | | | | | |
| $ | 124,213,704 | | | $ | 244,954,784 | | | $ | 270,179,588 | |
| | | | | | | | | | |
$ |
- |
| | $ | (34,704 | ) | | $ | - | |
| | | | | | | | | | |
| $ | (200,398 | ) | | $ | - | | | $ | (16,236 | ) |
| | | | | | | | | | |
157
MML Series Investment Fund – Financial Statements (Continued)
Statements of Changes in Net Assets
| | | | | | | | |
| | | MML
Managed Volatility Fund | |
| | | Year
Ended
December 31, 2014 | | | Year
Ended
December 31, 2013 | |
| Increase (Decrease) in Net Assets: | | | | | | | | |
| Operations: | | | | | | | | |
Net investment income (loss) | | $ | 3,661,614 | | | $ | 2,639,085 | |
Net realized gain (loss) on investment transactions | | | (20,508,003 | ) | | | 36,394,354 | |
Net change in unrealized appreciation (depreciation) on investments | | | 31,911,183 | | | | (2,073,041 | ) |
| | | | | | | | |
Net increase (decrease) in net assets resulting from operations | | | 15,064,794 | | | | 36,960,398 | |
| | | | | | | | |
| Distributions to shareholders (Note 2): | | | | | | | | |
From net investment income: | | | | | | | | |
Initial Class | | | (2,425,071 | ) | | | (2,720,569 | ) |
Service Class | | | (148,137 | ) | | | (320,704 | ) |
| | | | | | | | |
Total distributions from net investment income | | | (2,573,208 | ) | | | (3,041,273 | ) |
| | | | | | | | |
From net realized gains: | | | | | | | | |
Initial Class | | | (17,208,642 | ) | | | - | |
Service Class | | | (1,517,818 | ) | | | - | |
| | | | | | | | |
Total distributions from net realized gains | | | (18,726,460 | ) | | | - | |
| | | | | | | | |
| Net fund share transactions (Note 5): | | | | | | | | |
Initial Class | | | 139,360,818 | | | | (20,095,019 | ) |
Service Class | | | 3,863,259 | | | | 1,998,470 | |
| | | | | | | | |
Increase (decrease) in net assets from fund share transactions | | | 143,224,077 | | | | (18,096,549 | ) |
| | | | | | | | |
Total increase (decrease) in net assets | | | 136,989,203 | | | | 15,822,576 | |
| Net assets | | | | | | | | |
Beginning of year | | | 231,753,348 | | | | 215,930,772 | |
| | | | | | | | |
End of year | | $ | 368,742,551 | | | $ | 231,753,348 | |
| | | | | | | | |
Undistributed (accumulated) net investment income (loss) included in net assets at end of year | | $ | 3,596,420 | | | $ | 2,532,387 | |
| | | | | | | | |
The accompanying notes are an integral part of the financial statements.
158
| | | | | | | | | | | | | | |
MML
Mid Cap Growth Fund | | | MML
Mid Cap Value Fund | |
Year
Ended
December 31, 2014 | | | Year
Ended
December 31, 2013 | | | Year
Ended
December 31, 2014 | | | Year
Ended
December 31, 2013 | |
| | | | | | | | | | | | | | |
| | | | | | | | | | | | | | |
| $ | (823,910 | ) | | $ | (920,841 | ) | | $ | 6,795,594 | | | $ | 7,580,827 | |
| | 50,185,261 | | | | 55,972,735 | | | | 72,698,666 | | | | 82,015,977 | |
| | 2,639,391 | | | | 70,010,672 | | | | (3,544,653 | ) | | | 39,157,919 | |
| | | | | | | | | | | | | | |
| | 52,000,742 | | | | 125,062,566 | | | | 75,949,607 | | | | 128,754,723 | |
| | | | | | | | | | | | | | |
| | | | | | | | | | | | | | |
| | | | | | | | | | | | | | |
| | - | | | | (1,033,071 | ) | | | (7,330,241 | ) | | | (8,519,710 | ) |
| | - | | | | (40,345 | ) | | | (386,907 | ) | | | (345,178 | ) |
| | | | | | | | | | | | | | |
| | - | | | | (1,073,416 | ) | | | (7,717,148 | ) | | | (8,864,888 | ) |
| | | | | | | | | | | | | | |
| | | | | | | | | | | | | | |
| | (47,080,105 | ) | | | (22,514,574 | ) | | | (76,236,493 | ) | | | (18,096,855 | ) |
| | (6,703,945 | ) | | | (2,301,829 | ) | | | (4,547,879 | ) | | | (810,534 | ) |
| | | | | | | | | | | | | | |
| | (53,784,050 | ) | | | (24,816,403 | ) | | | (80,784,372 | ) | | | (18,907,389 | ) |
| | | | | | | | | | | | | | |
| | | | | | | | | | | | | | |
| | 6,567,387 | | | | (49,219,871 | ) | | | 9,854,080 | | | | (67,310,235 | ) |
| | 13,025,653 | | | | 5,837,267 | | | | 7,513,491 | | | | 3,095,519 | |
| | | | | | | | | | | | | | |
| | 19,593,040 | | | | (43,382,604 | ) | | | 17,367,571 | | | | (64,214,716 | ) |
| | | | | | | | | | | | | | |
| | 17,809,732 | | | | 55,790,143 | | | | 4,815,658 | | | | 36,767,730 | |
| | | | | | | | | | | | | | |
| | 415,675,248 | | | | 359,885,105 | | | | 490,734,137 | | | | 453,966,407 | |
| | | | | | | | | | | | | | |
| $ | 433,484,980 | | | $ | 415,675,248 | | | $ | 495,549,795 | | | $ | 490,734,137 | |
| | | | | | | | | | | | | | |
$ | (1,075,530 | ) | | $ | (748,376 | ) | | $ | 8,821,677 | | | $ | 8,057,114 | |
| | | | | | | | | | | | | | |
159
MML Series Investment Fund – Financial Statements (Continued)
Statements of Changes in Net Assets
| | | | | | | | |
| | | MML
Small Cap Growth Equity Fund | |
| | | Year
Ended
December 31, 2014 | | | Year
Ended
December 31, 2013 | |
| Increase (Decrease) in Net Assets: | | | | | | | | |
| Operations: | | | | | | | | |
Net investment income (loss) | | $ | (1,164,956 | ) | | $ | (1,247,580 | ) |
Net realized gain (loss) on investment transactions | | | 44,707,494 | | | | 70,874,164 | |
Net change in unrealized appreciation (depreciation) on investments | | | (28,466,011 | ) | | | 43,258,294 | |
| | | | | | | | |
Net increase (decrease) in net assets resulting from operations | | | 15,076,527 | | | | 112,884,878 | |
| | | | | | | | |
| Distributions to shareholders (Note 2): | | | | | | | | |
From net investment income: | | | | | | | | |
Initial Class | | | - | | | | - | |
Class II | | | - | | | | - | |
Service Class | | | - | | | | - | |
Service Class I | | | - | | | | - | |
| | | | | | | | |
Total distributions from net investment income | | | - | | | | - | |
| | | | | | | | |
From net realized gains: | | | | | | | | |
Initial Class | | | (66,804,629 | ) | | | (16,238,406 | ) |
Class II | | | - | | | | - | |
Service Class | | | (2,431,449 | ) | | | (409,665 | ) |
Service Class I | | | - | | | | - | |
| | | | | | | | |
Total distributions from net realized gains | | | (69,236,078 | ) | | | (16,648,071 | ) |
| | | | | | | | |
| Net fund share transactions (Note 5): | | | | | | | | |
Initial Class | | | 32,326,503 | | | | (77,865,410 | ) |
Class II | | | - | | | | - | |
Service Class | | | 3,994,325 | | | | (257,543 | ) |
Service Class I | | | - | | | | - | |
| | | | | | | | |
Increase (decrease) in net assets from fund share transactions | | | 36,320,828 | | | | (78,122,953 | ) |
| | | | | | | | |
Total increase (decrease) in net assets | | | (17,838,723 | ) | | | 18,113,854 | |
| Net assets | | | | | | | | |
Beginning of year | | | 280,911,872 | | | | 262,798,018 | |
| | | | | | | | |
End of year | | $ | 263,073,149 | | | $ | 280,911,872 | |
| | | | | | | | |
Undistributed (accumulated) net investment income (loss) included in net assets at end of year | | $ | (75,079 | ) | | $ | (68,065 | ) |
| | | | | | | | |
The accompanying notes are an integral part of the financial statements.
160
| | | | | | | | | | | | | | |
MML
Small Company Value Fund | | | MML
Small/Mid Cap Value Fund | |
Year
Ended
December 31, 2014 | | | Year
Ended
December 31, 2013 | | | Year
Ended
December 31, 2014 | | | Year
Ended
December 31, 2013 | |
| | | | | | | | | | | | | | |
| | | | | | | | | | | | | | |
| $ | 243,670 | | | $ | (64,861 | ) | | $ | 2,016,336 | | | $ | 1,460,447 | |
| | 10,227,800 | | | | 28,004,058 | | | | 37,841,770 | | | | 29,633,752 | |
| | (9,900,674 | ) | | | 7,190,219 | | | | (16,434,754 | ) | | | 33,377,829 | |
| | | | | | | | | | | | | | |
| | 570,796 | | | | 35,129,416 | | | | 23,423,352 | | | | 64,472,028 | |
| | | | | | | | | | | | | | |
| | | | | | | | | | | | | | |
| | | | | | | | | | | | | | |
| | - | | | | - | | | | (1,482,993 | ) | | | (1,269,216 | ) |
| | - | | | | (1,471,311 | ) | | | - | | | | - | |
| | - | | | | - | | | | (68,366 | ) | | | (59,171 | ) |
| | - | | | | (88,293 | ) | | | - | | | | - | |
| | | | | | | | | | | | | | |
| | - | | | | (1,559,604 | ) | | | (1,551,359 | ) | | | (1,328,387 | ) |
| | | | | | | | | | | | | | |
| | | | | | | | | | | | | | |
| | - | | | | - | | | | (5,182,761 | ) | | | - | |
| | (24,803,043 | ) | | | (3,313,973 | ) | | | - | | | | - | |
| | - | | | | - | | | | (332,856 | ) | | | - | |
| | (2,698,082 | ) | | | (220,013 | ) | | | - | | | | - | |
| | | | | | | | | | | | | | |
| | (27,501,125 | ) | | | (3,533,986 | ) | | | (5,515,617 | ) | | | - | |
| | | | | | | | | | | | | | |
| | | | | | | | | | | | | | |
| | - | | | | - | | | | (36,300,349 | ) | | | 29,127,124 | |
| | 22,237,102 | | | | (44,595,781 | ) | | | - | | | | - | |
| | - | | | | - | | | | 1,888,505 | | | | 703,016 | |
| | 3,422,840 | | | | 1,716,386 | | | | - | | | | - | |
| | | | | | | | | | | | | | |
| | 25,659,942 | | | | (42,879,395 | ) | | | (34,411,844 | ) | | | 29,830,140 | |
| | | | | | | | | | | | | | |
| | (1,270,387 | ) | | | (12,843,569 | ) | | | (18,055,468 | ) | | | 92,973,781 | |
| | | | | | | | | | | | | | |
| | 107,784,318 | | | | 120,627,887 | | | | 269,938,574 | | | | 176,964,793 | |
| | | | | | | | | | | | | | |
| $ | 106,513,931 | | | $ | 107,784,318 | | | $ | 251,883,106 | | | $ | 269,938,574 | |
| | | | | | | | | | | | | | |
$ |
301,570 |
| | $ | (116,050 | ) | | $ | 1,894,691 | | | $ | 1,402,931 | |
| | | | | | | | | | | | | | |
161
MML Series Investment Fund – Financial Statements (Continued)
Statements of Changes in Net Assets
| | | | | | | | |
| | | MML
Total Return Bond Fund | |
| | | Year
Ended
December 31, 2014 | | | Year
Ended
December 31, 2013 | |
| Increase (Decrease) in Net Assets: | | | | | | | | |
| Operations: | | | | | | | | |
Net investment income (loss) | | $ | 5,352,769 | | | $ | 4,641,326 | |
Net realized gain (loss) on investment transactions | | | 12,592,356 | | | | (1,700,990 | ) |
Net change in unrealized appreciation (depreciation) on investments | | | 1,673,346 | | | | (8,927,166 | ) |
| | | | | | | | |
Net increase (decrease) in net assets resulting from operations | | | 19,618,471 | | | | (5,986,830 | ) |
| | | | | | | | |
| Distributions to shareholders (Note 2): | | | | | | | | |
From net investment income: | | | | | | | | |
Class II | | | (7,279,537 | ) | | | (7,389,774 | ) |
Service Class I | | | (235,738 | ) | | | (186,554 | ) |
| | | | | | | | |
Total distributions from net investment income | | | (7,515,275 | ) | | | (7,576,328 | ) |
| | | | | | | | |
From net realized gains: | | | | | | | | |
Class II | | | - | | | | (3,234,875 | ) |
Service Class I | | | - | | | | (82,699 | ) |
| | | | | | | | |
Total distributions from net realized gains | | | - | | | | (3,317,574 | ) |
| | | | | | | | |
| Net fund share transactions (Note 5): | | | | | | | | |
Class II | | | (9,158,988 | ) | | | 110,811,238 | |
Service Class I | | | 2,692,310 | | | | 6,124,863 | |
| | | | | | | | |
Increase (decrease) in net assets from fund share transactions | | | (6,466,678 | ) | | | 116,936,101 | |
| | | | | | | | |
Total increase (decrease) in net assets | | | 5,636,518 | | | | 100,055,369 | |
| Net assets | | | | | | | | |
Beginning of year | | | 412,531,259 | | | | 312,475,890 | |
| | | | | | | | |
End of year | | $ | 418,167,777 | | | $ | 412,531,259 | |
| | | | | | | | |
Undistributed (accumulated) net investment income (loss) included in net assets at end of year | | $ | 10,725,232 | | | $ | 8,028,534 | |
| | | | | | | | |
The accompanying notes are an integral part of the financial statements.
162
THIS PAGE INTENTIONALLY LEFT BLANK
MML Series Investment Fund – Financial Statements (Continued)
Financial Highlights (For a share outstanding throughout each period)
MML Blue Chip Growth Fund
| | | | | | | | | | | | | | | | | | | | | | | | | | | | | | | | | | | | | | | | | | | | | | | | |
| | | | | | Income (loss) from investment
operations | | | Less distributions to shareholders | | | | | | | | | Ratios / Supplemental Data | |
| | | Net
asset
value,
beginning
of the
period | | | Net
investment
income
(loss)c | | | Net
realized
and
unrealized
gain (loss)
on
investments | | | Total
income
(loss) from
investment
operations | | | From net
investment
income | | | From net
realized
gains | | | Total
distributions | | | Net
asset
value,
end of
the
period | | | Total
returnm | | | Net
assets,
end of
the
period
(000’s) | | | Ratio of
expenses
to average
daily net
assets | | | Net
investment
income
(loss) to
average
daily net
assets | |
Initial Class | | | | | | | | | | | | | | | | | | | | | | | | | | | | | | | | | | | | | | | | | | | | | |
| 12/31/14 | | $ | 17.35 | | | $ | (0.01 | ) | | $ | 1.55 | | | $ | 1.54 | | | $ | - | | | $ | (1.80 | ) | | $ | (1.80 | ) | | $ | 17.09 | | | | 9.13% | | | $ | 390,322 | | | | 0.79% | | | | (0.09% | ) |
| 12/31/13 | | | 13.50 | | | | (0.00 | )d | | | 5.28 | | | | 5.28 | | | | (0.04 | ) | | | (1.39 | ) | | | (1.43 | ) | | | 17.35 | | | | 41.33% | | | | 429,689 | | | | 0.79% | | | | (0.01% | ) |
| 12/31/12 | | | 11.42 | | | | 0.03 | | | | 2.06 | | | | 2.09 | | | | (0.01 | ) | | | - | | | | (0.01 | ) | | | 13.50 | | | | 18.31% | | | | 321,245 | | | | 0.80% | | | | 0.26% | |
| 12/31/11 | | | 11.27 | | | | 0.01 | | | | 0.14 | | | | 0.15 | | | | (0.00 | )d | | | - | | | | (0.00 | )d | | | 11.42 | | | | 1.37% | | | | 323,779 | | | | 0.80% | | | | 0.09% | |
| 12/31/10 | | | 9.71 | | | | 0.01 | | | | 1.56 | | | | 1.57 | | | | (0.01 | ) | | | - | | | | (0.01 | ) | | | 11.27 | | | | 16.17% | | | | 336,211 | | | | 0.80% | | | | 0.06% | |
Service Class | | | | | | | | | | | | | | | | | | | | | | | | | | | | | | | | | | | | | | | | | | | | | |
| 12/31/14 | | $ | 17.17 | | | $ | (0.06 | ) | | $ | 1.54 | | | $ | 1.48 | | | $ | - | | | $ | (1.80 | ) | | $ | (1.80 | ) | | $ | 16.85 | | | | 8.87% | | | $ | 31,721 | | | | 1.04% | | | | (0.34% | ) |
| 12/31/13 | | | 13.38 | | | | (0.04 | ) | | | 5.23 | | | | 5.19 | | | | (0.01 | ) | | | (1.39 | ) | | | (1.40 | ) | | | 17.17 | | | | 41.00% | | | | 23,273 | | | | 1.04% | | | | (0.26% | ) |
| 12/31/12 | | | 11.34 | | | | 0.01 | | | | 2.03 | | | | 2.04 | | | | - | | | | - | | | | - | | | | 13.38 | | | | 17.99% | | | | 14,895 | | | | 1.05% | | | | 0.06% | |
| 12/31/11 | | | 11.22 | | | | (0.02 | ) | | | 0.14 | | | | 0.12 | | | | - | | | | - | | | | - | | | | 11.34 | | | | 1.07% | | | | 9,476 | | | | 1.05% | | | | (0.15% | ) |
| 12/31/10 | | | 9.68 | | | | (0.02 | ) | | | 1.56 | | | | 1.54 | | | | - | | | | - | | | | - | | | | 11.22 | | | | 15.91% | | | | 7,837 | | | | 1.05% | | | | (0.20% | ) |
| | | | | | | | | | | | | | | | | | | | |
| | | Year ended December 31 | |
| | | 2014 | | | 2013 | | | 2012 | | | 2011 | | | 2010 | |
Portfolio turnover rate | | | 30 | % | | | 35 | % | | | 25 | % | | | 37 | % | | | 37 | % |
| c | Per share amount calculated on the average shares method. |
| d | Amount is less than $0.005 per share. |
| m | Total return does not reflect expenses that apply at the separate account level or to related insurance products. Inclusion of these charges would reduce the total return figures for all periods shown. |
The accompanying notes are an integral part of the financial statements.
164
MML Series Investment Fund – Financial Statements (Continued)
Financial Highlights (For a share outstanding throughout each period)
MML Equity Income Fund
| | | | | | | | | | | | | | | | | | | | | | | | | | | | | | | | | | | | | | | | | | | | | | | | |
| | | | | | Income (loss) from investment
operations | | | Less distributions to shareholders | | | | | | | | | Ratios / Supplemental Data | |
| | | Net
asset
value,
beginning
of the
period | | | Net
investment
income
(loss)c | | | Net
realized
and
unrealized
gain (loss)
on
investments | | | Total
income
(loss) from
investment
operations | | | From net
investment
income | | | From net
realized
gains | | | Total
distributions | | | Net
asset
value,
end of
the
period | | | Total
returnm | | | Net
assets,
end of
the
period
(000’s) | | | Ratio of
expenses
to average
daily net
assets | | | Net
investment
income
(loss) to
average
daily net
assets | |
Initial Class | | | | | | | | | | | | | | | | | | | | | | | | | | | | | | | | | | | | | | | | | |
| 12/31/14 | | $ | 13.47 | | | $ | 0.25 | | | $ | 0.76 | | | $ | 1.01 | | | $ | (0.24 | ) | | $ | (0.31 | ) | | $ | (0.55 | ) | | $ | 13.93 | | | | 7.54% | | | $ | 472,989 | | | | 0.78% | | | | 1.84% | |
| 12/31/13 | | | 10.57 | | | | 0.20 | | | | 2.93 | | | | 3.13 | | | | (0.23 | ) | | | - | | | | (0.23 | ) | | | 13.47 | | | | 29.93% | | | | 556,649 | | | | 0.78% | | | | 1.64% | |
| 12/31/12 | | | 9.20 | | | | 0.21 | | | | 1.37 | | | | 1.58 | | | | (0.21 | ) | | | - | | | | (0.21 | ) | | | 10.57 | | | | 17.32% | | | | 478,096 | | | | 0.79% | | | | 2.12% | |
| 12/31/11 | | | 9.44 | | | | 0.18 | | | | (0.26 | ) | | | (0.08 | ) | | | (0.16 | ) | | | - | | | | (0.16 | ) | | | 9.20 | | | | (0.79% | ) | | | 511,951 | | | | 0.79% | | | | 1.92% | |
| 12/31/10 | | | 8.35 | | | | 0.16 | | | | 1.06 | | | | 1.22 | | | | (0.13 | ) | | | - | | | | (0.13 | ) | | | 9.44 | | | | 14.95% | | | | 550,834 | | | | 0.79% | | | | 1.87% | |
Service Class | | | | | | | | | | | | | | | | | | | | | | | | | | | | | | | | | | | | | | | | | |
| 12/31/14 | | $ | 13.39 | | | $ | 0.22 | | | $ | 0.74 | | | $ | 0.96 | | | $ | (0.21 | ) | | $ | (0.31 | ) | | $ | (0.52 | ) | | $ | 13.83 | | | | 7.23% | | | $ | 63,751 | | | | 1.03% | | | | 1.58% | |
| 12/31/13 | | | 10.52 | | | | 0.17 | | | | 2.91 | | | | 3.08 | | | | (0.21 | ) | | | - | | | | (0.21 | ) | | | 13.39 | | | | 29.55% | | | | 54,576 | | | | 1.03% | | | | 1.39% | |
| 12/31/12 | | | 9.16 | | | | 0.19 | | | | 1.36 | | | | 1.55 | | | | (0.19 | ) | | | - | | | | (0.19 | ) | | | 10.52 | | | | 17.06% | | | | 39,397 | | | | 1.04% | | | | 1.88% | |
| 12/31/11 | | | 9.40 | | | | 0.16 | | | | (0.26 | ) | | | (0.10 | ) | | | (0.14 | ) | | | - | | | | (0.14 | ) | | | 9.16 | | | | (0.97% | ) | | | 30,889 | | | | 1.04% | | | | 1.69% | |
| 12/31/10 | | | 8.32 | | | | 0.14 | | | | 1.06 | | | | 1.20 | | | | (0.12 | ) | | | - | | | | (0.12 | ) | | | 9.40 | | | | 14.70% | | | | 24,921 | | | | 1.04% | | | | 1.62% | |
| | | | | | | | | | | | | | | | | | | | |
| | | Year ended December 31 | |
| | | 2014 | | | 2013 | | | 2012 | | | 2011 | | | 2010 | |
Portfolio turnover rate | | | 9 | % | | | 15 | % | | | 15 | % | | | 22 | % | | | 16 | % |
| c | Per share amount calculated on the average shares method. |
| m | Total return does not reflect expenses that apply at the separate account level or to related insurance products. Inclusion of these charges would reduce the total return figures for all periods shown. |
The accompanying notes are an integral part of the financial statements.
165
MML Series Investment Fund – Financial Statements (Continued)
Financial Highlights (For a share outstanding throughout each period)
MML Equity Index Fund
| | | | | | | | | | | | | | | | | | | | | | | | | | | | | | | | | | | | | | | | | | | | | | | | | | | | |
| | | | | | Income (loss) from investment
operations | | | Less distributions to shareholders | | | | | | | | | Ratios / Supplemental Data | |
| | | Net
asset
value,
beginning
of the
period | | | Net
investment
income
(loss)c,j | | | Net
realized
and
unrealized
gain (loss)
on
investments | | | Total
income
(loss) from
investment
operations | | | From net
investment
income | | | From net
realized
gains | | | Total
distributions | | | Net
asset
value,
end of
the
period | | | Total
returnm | | | Net
assets,
end of
the
period
(000's) | | | Ratio of
expenses
to average
daily net
assets
before
expense
waivers | | | Ratio of
expenses
to average
daily net
assets
after
expense
waiversj | | | Net
investment
income
(loss) to
average
daily net
assets | |
Class I | | | | | | | | | | | | | | | | | | | | | | | | | | | | | | | | | | | | | | | | | | | | | | | | | |
| 12/31/14 | | $ | 23.14 | | | $ | 0.38 | | | $ | 2.65 | | | $ | 3.03 | | | $ | (0.33 | ) | | $ | (0.32 | ) | | $ | (0.65 | ) | | $ | 25.52 | | | | 13.17% | | | $ | 84,445 | | | | 0.44% | | | | N/A | | | | 1.58% | |
| 12/31/13 | | | 17.89 | | | | 0.34 | | | | 5.30 | | | | 5.64 | | | | (0.33 | ) | | | (0.06 | ) | | | (0.39 | ) | | | 23.14 | | | | 31.84% | | | | 92,853 | | | | 0.44% | | | | 0.44% | l | | | 1.65% | |
| 12/31/12 | | | 15.73 | | | | 0.32 | | | | 2.11 | | | | 2.43 | | | | (0.27 | ) | | | - | | | | (0.27 | ) | | | 17.89 | | | | 15.47% | | | | 79,070 | | | | 0.45% | | | | 0.45% | l | | | 1.84% | |
| 12/31/11 | | | 15.73 | | | | 0.26 | | | | 0.00 | d | | | 0.26 | | | | (0.26 | ) | | | - | | | | (0.26 | ) | | | 15.73 | | | | 1.71% | | | | 74,927 | | | | 0.44% | | | | N/A | | | | 1.62% | |
| 12/31/10 | | | 13.97 | | | | 0.23 | | | | 1.76 | | | | 1.99 | | | | (0.23 | ) | | | - | | | | (0.23 | ) | | | 15.73 | | | | 14.51% | | | | 81,199 | | | | 0.45% | | | | N/A | | | | 1.60% | |
Class II | | | | | | | | | | | | | | | | | | | | | | | | | | | | | | | | | | | | | | | | | | | | | | | | | |
| 12/31/14 | | $ | 23.19 | | | $ | 0.42 | | | $ | 2.65 | | | $ | 3.07 | | | $ | (0.38 | ) | | $ | (0.32 | ) | | $ | (0.70 | ) | | $ | 25.56 | | | | 13.35% | | | $ | 154,210 | | | | 0.33% | | | | 0.28% | | | | 1.74% | |
| 12/31/13 | | | 17.93 | | | | 0.37 | | | | 5.31 | | | | 5.68 | | | | (0.36 | ) | | | (0.06 | ) | | | (0.42 | ) | | | 23.19 | | | | 32.02% | | | | 141,468 | | | | 0.33% | | | | 0.28% | | | | 1.81% | |
| 12/31/12 | | | 15.76 | | | | 0.35 | | | | 2.12 | | | | 2.47 | | | | (0.30 | ) | | | - | | | | (0.30 | ) | | | 17.93 | | | | 15.69% | | | | 109,646 | | | | 0.34% | | | | 0.29% | | | | 2.00% | |
| 12/31/11 | | | 15.76 | | | | 0.28 | | | | (0.00 | )d | | | 0.28 | | | | (0.28 | ) | | | - | | | | (0.28 | ) | | | 15.76 | | | | 1.84% | | | | 106,050 | | | | 0.33% | | | | 0.28% | | | | 1.78% | |
| 12/31/10 | | | 13.98 | | | | 0.25 | | | | 1.77 | | | | 2.02 | | | | (0.24 | ) | | | - | | | | (0.24 | ) | | | 15.76 | | | | 14.76% | | | | 115,521 | | | | 0.34% | | | | 0.29% | | | | 1.76% | |
Class III | | | | | | | | | | | | | | | | | | | | | | | | | | | | | | | | | | | | | | | | | | | | | | | | | |
| 12/31/14 | | $ | 23.16 | | | $ | 0.46 | | | $ | 2.65 | | | $ | 3.11 | | | $ | (0.41 | ) | | $ | (0.32 | ) | | $ | (0.73 | ) | | $ | 25.54 | | | | 13.54% | | | $ | 173,459 | | | | 0.19% | | | | 0.14% | | | | 1.88% | |
| 12/31/13 | | | 17.91 | | | | 0.40 | | | | 5.29 | | | | 5.69 | | | | (0.38 | ) | | | (0.06 | ) | | | (0.44 | ) | | | 23.16 | | | | 32.17% | | | | 155,356 | | | | 0.19% | | | | 0.14% | | | | 1.95% | |
| 12/31/12 | | | 15.74 | | | | 0.37 | | | | 2.12 | | | | 2.49 | | | | (0.32 | ) | | | - | | | | (0.32 | ) | | | 17.91 | | | | 15.87% | | | | 119,034 | | | | 0.20% | | | | 0.15% | | | | 2.14% | |
| 12/31/11 | | | 15.75 | | | | 0.31 | | | | (0.02 | ) | | | 0.29 | | | | (0.30 | ) | | | - | | | | (0.30 | ) | | | 15.74 | | | | 1.96% | | | | 106,669 | | | | 0.19% | | | | 0.14% | | | | 1.92% | |
| 12/31/10 | | | 13.97 | | | | 0.27 | | | | 1.77 | | | | 2.04 | | | | (0.26 | ) | | | - | | | | (0.26 | ) | | | 15.75 | | | | 14.93% | | | | 106,015 | | | | 0.20% | | | | 0.15% | | | | 1.90% | |
Service Class I | | | | | | | | | | | | | | | | | | | | | | | | | | | | | | | | | | | | | | | | | | | | | | | | | |
| 12/31/14 | | $ | 22.72 | | | $ | 0.32 | | | $ | 2.59 | | | $ | 2.91 | | | $ | (0.33 | ) | | $ | (0.32 | ) | | $ | (0.65 | ) | | $ | 24.98 | | | | 12.92% | | | $ | 32,075 | | | | 0.69% | | | | N/A | | | | 1.34% | |
| 12/31/13 | | | 17.62 | | | | 0.29 | | | | 5.20 | | | | 5.49 | | | | (0.33 | ) | | | (0.06 | ) | | | (0.39 | ) | | | 22.72 | | | | 31.49% | | | | 21,443 | | | | 0.69% | | | | 0.69% | l | | | 1.40% | |
| 12/31/12 | | | 15.53 | | | | 0.28 | | | | 2.08 | | | | 2.36 | | | | (0.27 | ) | | | - | | | | (0.27 | ) | | | 17.62 | | | | 15.21% | | | | 10,229 | | | | 0.70% | | | | 0.70% | l | | | 1.63% | |
| 12/31/11 | | | 15.59 | | | | 0.22 | | | | 0.00 | d | | | 0.22 | | | | (0.28 | ) | | | - | | | | (0.28 | ) | | | 15.53 | | | | 1.47% | | | | 6,231 | | | | 0.69% | | | | N/A | | | | 1.40% | |
| 12/31/10 | | | 13.88 | | | | 0.20 | | | | 1.73 | | | | 1.93 | | | | (0.22 | ) | | | - | | | | (0.22 | ) | | | 15.59 | | | | 14.22% | | | | 3,284 | | | | 0.70% | | | | N/A | | | | 1.39% | |
| | | | | | | | | | | | | | | | | | | | |
| | | Year ended December 31 | |
| | | 2014 | | | 2013 | | | 2012 | | | 2011 | | | 2010 | |
Portfolio turnover rate | | | 3 | % | | | 4 | % | | | 3 | % | | | 4 | % | | | 5 | % |
| c | Per share amount calculated on the average shares method. |
| d | Amount is less than $0.005 per share. |
| j | Computed after giving effect to an agreement by MML Advisers and/or MassMutual to waive certain fees and expenses of the Fund. |
| l | Expenses incurred during the period fell under the expense cap. |
| m | Total return does not reflect expenses that apply at the separate account level or to related insurance products. Inclusion of these charges would reduce the total return figures for all periods shown. |
The accompanying notes are an integral part of the financial statements.
166
MML Series Investment Fund – Financial Statements (Continued)
Financial Highlights (For a share outstanding throughout each period)
MML Focused Equity Fund
| | | | | | | | | | | | | | | | | | | | | | | | | | | | | | | | | | | | | | | | | | | | | | | | | | | | | | | | |
| | | | | | Income (loss) from investment
operations | | | Less distributions to shareholders | | | | | | | | | Ratios / Supplemental Data | |
| | | Net
asset
value,
beginning
of the
period | | | Net
investment
income
(loss)c,j | | | Net
realized
and
unrealized
gain
(loss) on
investments | | | Total
income
(loss) from
investment
operations | | | From net
investment
income | | | From net
realized
gain | | | Tax
return of
capital | | | Total
distributions | | | Net
asset
value,
end of
the
period | | | Total
returnm | | | Net
assets,
end of
the
period
(000’s) | | | Ratio of
expenses
to average
daily net
assets
before
expense
waivers | | | Ratio of
expenses
to average
daily net
assets
after
expense
waiversj | | | Net
investment
income
(loss) to
average
daily net
assets | |
Class II | | | | | | | | | | | | | | | | | | | | | | | | | | | | | | | | | | | | | | | | | | | | | | | | | | | | | |
| 12/31/14 | | $ | 15.64 | | | $ | 0.29 | | | $ | 1.59 | | | $ | 1.88 | | | $ | (0.06 | ) | | $ | (1.49 | ) | | $ | - | | | $ | (1.55 | ) | | $ | 15.97 | | | | 12.24% | | | $ | 160,206 | | | | 0.90% | | | | N/A | | | | 1.86% | |
| 12/31/13 | | | 11.49 | | | | 0.05 | | | | 4.29 | | | | 4.34 | | | | - | | | | (0.19 | ) | | | - | | | | (0.19 | ) | | | 15.64 | | | | 38.05% | | | | 166,655 | | | | 0.90% | | | | 0.90% | l | | | 0.40% | |
| 12/31/12 | | | 10.03 | | | | 0.09 | | | | 1.98 | | | | 2.07 | | | | (0.09 | ) | | | (0.52 | ) | | | - | | | | (0.61 | ) | | | 11.49 | | | | 20.61% | | | | 136,305 | | | | 0.90% | | | | 0.90% | k | | | 0.76% | |
| 12/31/11i | | | 10.00 | | | | 0.01 | | | | 0.04 | | | | 0.05 | | | | (0.02 | ) | | | - | | | | (0.00 | )d | | | (0.02 | ) | | | 10.03 | | | | 0.46% | b | | | 110,550 | | | | 1.58% | a | | | 0.90% | a | | | 1.94% | a |
Service Class I | | | | | | | | | | | | | | | | | | | | | | | | | | | | | | | | | | | | | | | | | | | | | | | | | | | | | |
| 12/31/14 | | $ | 15.58 | | | $ | 0.22 | | | $ | 1.61 | | | $ | 1.83 | | | $ | (0.05 | ) | | $ | (1.49 | ) | | $ | - | | | $ | (1.54 | ) | | $ | 15.87 | | | | 11.97% | | | $ | 7,289 | | | | 1.15% | | | | N/A | | | | 1.39% | |
| 12/31/13 | | | 11.48 | | | | 0.02 | | | | 4.27 | | | | 4.29 | | | | - | | | | (0.19 | ) | | | - | | | | (0.19 | ) | | | 15.58 | | | | 37.64% | | | | 4,960 | | | | 1.15% | | | | 1.15% | k | | | 0.18% | |
| 12/31/12h | | | 11.54 | | | | 0.07 | | | | 0.47 | | | | 0.54 | | | | (0.08 | ) | | | (0.52 | ) | | | - | | | | (0.60 | ) | | | 11.48 | | | | 4.68% | b | | | 818 | | | | 1.15% | a | | | 1.15% | a,l | | | 0.91% | a |
| | | | | | | | | | | | | | | | |
| | | Year ended December 31 | |
| | | 2014 | | | 2013 | | | 2012 | | | 2011 | |
Portfolio turnover rate | | | 35 | % | | | 28 | % | | | 34 | % | | | 13 | %b |
| b | Percentage represents the results for the period and is not annualized. |
| c | Per share amount calculated on the average shares method. |
| d | Amount is less than $0.005 per share. |
| h | For the period May 1, 2012 (commencement of operations) through December 31, 2012. |
| i | For the period December 8, 2011 (commencement of operations) through December 31, 2011. |
| j | Computed after giving effect to an agreement by MML Advisers and/or MassMutual to waive certain fees and expenses of the Fund. |
| k | Amount waived had no impact on the ratio of expenses to average daily net assets. |
| l | Expenses incurred during the period fell under the expense cap. |
| m | Total return does not reflect expenses that apply at the separate account level or to related insurance products. Inclusion of these charges would reduce the total return figures for all periods shown. |
The accompanying notes are an integral part of the financial statements.
167
MML Series Investment Fund – Financial Statements (Continued)
Financial Highlights (For a share outstanding throughout each period)
MML Foreign Fund
| | | | | | | | | | | | | | | | | | | | | | | | | | | | | | | | | | | | | | | | | | | | |
| | | | | | Income (loss) from investment
operations | | | Less distributions to
shareholders | | | | | | | | | Ratios / Supplemental Data | |
| | | Net
asset
value,
beginning
of the
period | | | Net
investment
income
(loss)c | | | Net
realized
and
unrealized
gain (loss)
on
investments | | | Total
income
(loss) from
investment
operations | | | From net
investment
income | | | Total
distributions | | | Net
asset
value,
end of
the
period | | | Total
returnm | | | Net
assets,
end of
the
period
(000’s) | | | Ratio of
expenses
to average
daily net
assets | | | Net
investment
income
(loss) to
average
daily net
assets | |
Initial Class | | | | | | | | | | | | | | | | | | | | | | | | | | | | | | | | | |
| 12/31/14 | | $ | 11.22 | | | $ | 0.34 | | | $ | (1.09 | ) | | $ | (0.75 | ) | | $ | (0.25 | ) | | $ | (0.25 | ) | | $ | 10.22 | | | | (6.97% | ) | | $ | 328,045 | | | | 0.97% | | | | 3.09% | |
| 12/31/13 | | | 9.47 | | | | 0.20 | | | | 1.75 | | | | 1.95 | | | | (0.20 | ) | | | (0.20 | ) | | | 11.22 | | | | 20.80% | | | | 412,363 | | | | 0.97% | | | | 2.00% | |
| 12/31/12 | | | 8.13 | | | | 0.21 | | | | 1.32 | | | | 1.53 | | | | (0.19 | ) | | | (0.19 | ) | | | 9.47 | | | | 19.06% | | | | 355,174 | | | | 0.97% | | | | 2.38% | |
| 12/31/11 | | | 9.21 | | | | 0.23 | | | | (1.14 | ) | | | (0.91 | ) | | | (0.17 | ) | | | (0.17 | ) | | | 8.13 | | | | (9.90% | ) | | | 303,229 | | | | 0.98% | | | | 2.50% | |
| 12/31/10 | | | 8.95 | | | | 0.16 | | | | 0.24 | | | | 0.40 | | | | (0.14 | ) | | | (0.14 | ) | | | 9.21 | | | | 4.70% | | | | 338,495 | | | | 0.99% | | | | 1.85% | |
Service Class | | | | | | | | | | | | | | | | | | | | | | | | | | | | | | | | | |
| 12/31/14 | | $ | 11.16 | | | $ | 0.30 | | | $ | (1.07 | ) | | $ | (0.77 | ) | | $ | (0.23 | ) | | $ | (0.23 | ) | | $ | 10.16 | | | | (7.07% | ) | | $ | 11,089 | | | | 1.22% | | | | 2.72% | |
| 12/31/13 | | | 9.43 | | | | 0.17 | | | | 1.74 | | | | 1.91 | | | | (0.18 | ) | | | (0.18 | ) | | | 11.16 | | | | 20.42% | | | | 8,350 | | | | 1.22% | | | | 1.71% | |
| 12/31/12 | | | 8.10 | | | | 0.18 | | | | 1.32 | | | | 1.50 | | | | (0.17 | ) | | | (0.17 | ) | | | 9.43 | | | | 18.74% | | | | 6,756 | | | | 1.22% | | | | 2.13% | |
| 12/31/11 | | | 9.18 | | | | 0.20 | | | | (1.12 | ) | | | (0.92 | ) | | | (0.16 | ) | | | (0.16 | ) | | | 8.10 | | | | (10.13% | ) | | | 5,615 | | | | 1.23% | | | | 2.23% | |
| 12/31/10 | | | 8.92 | | | | 0.13 | | | | 0.26 | | | | 0.39 | | | | (0.13 | ) | | | (0.13 | ) | | | 9.18 | | | | 4.54% | | | | 5,857 | | | | 1.24% | | | | 1.56% | |
| | | | | | | | | | | | | | | | | | | | |
| | | Year ended December 31 | |
| | | 2014 | | | 2013 | | | 2012 | | | 2011 | | | 2010 | |
Portfolio turnover rate | | | 13 | %t | | | 20 | % | | | 15 | % | | | 9 | % | | | 8 | % |
| c | Per share amount calculated on the average shares method. |
| m | Total return does not reflect expenses that apply at the separate account level or to related insurance products. Inclusion of these charges would reduce the total return figures for all periods shown. |
| t | The portfolio turnover rate was not impacted as a result of the cash merger. |
The accompanying notes are an integral part of the financial statements.
168
MML Series Investment Fund – Financial Statements (Continued)
Financial Highlights (For a share outstanding throughout each period)
MML Fundamental Growth Fund
| | | | | | | | | | | | | | | | | | | | | | | | | | | | | | | | | | | | | | | | | | | | | | | | | | | | |
| | | | | | Income (loss) from investment
operations | | | Less distributions to shareholders | | | | | | | | | Ratios / Supplemental Data | |
| | | Net
asset
value,
beginning
of the
period | | | Net
investment
income
(loss)c,j | | | Net
realized
and
unrealized
gain (loss)
on
investments | | | Total
income
(loss) from
investment
operations | | | From net
investment
income | | | From net
realized
gains | | | Total
distributions | | | Net
asset
value,
end of
the
period | | | Total
returnm | | | Net
assets,
end of
the
period
(000’s) | | | Ratio of
expenses
to average
daily net
assets
before
expense
waivers | | | Ratio of
expenses
to average
daily net
assets
after
expense
waiversj | | | Net
investment
income
(loss) to
average
daily net
assets | |
Class II | | | | | | | | | | | | | | | | | | | | | | | | | | | | | | | | | | | | | | | | | | | | | | | | | | | | |
| 12/31/14 | | $ | 14.46 | | | $ | 0.12 | | | $ | 1.44 | | | $ | 1.56 | | | $ | (0.11 | ) | | $ | (1.02 | ) | | $ | (1.13 | ) | | $ | 14.89 | | | | 11.06% | | | $ | 207,086 | | | | 0.86% | | | | 0.85% | | | | 0.81% | |
| 12/31/13 | | | 10.94 | | | | 0.09 | | | | 3.44 | | | | 3.53 | | | | - | | | | (0.01 | ) | | | (0.01 | ) | | | 14.46 | | | | 32.29% | | | | 236,837 | | | | 0.86% | | | | 0.85% | | | | 0.72% | |
| 12/31/12 | | | 9.95 | | | | 0.09 | | | | 1.23 | | | | 1.32 | | | | (0.09 | ) | | | (0.24 | ) | | | (0.33 | ) | | | 10.94 | | | | 13.14% | | | | 179,834 | | | | 0.87% | | | | 0.85% | | | | 0.79% | |
| 12/31/11i | | | 10.00 | | | | (0.00 | )d | | | (0.05 | ) | | | (0.05 | ) | | | - | | | | - | | | | - | | | | 9.95 | | | | (0.50% | )b | | | 149,274 | | | | 1.41% | a | | | 0.85% | a | | | (0.05% | )a |
Service Class I | | | | | | | | | | | | | | | | | | | | | | | | | | | | | | | | | | | | | | | | | | | | | | | | | |
| 12/31/14 | | $ | 14.40 | | | $ | 0.09 | | | $ | 1.43 | | | $ | 1.52 | | | $ | (0.10 | ) | | $ | (1.02 | ) | | $ | (1.12 | ) | | $ | 14.80 | | | | 10.81% | | | $ | 2,214 | | | | 1.11% | | | | 1.10% | | | | 0.59% | |
| 12/31/13 | | | 10.92 | | | | 0.06 | | | | 3.43 | | | | 3.49 | | | | - | | | | (0.01 | ) | | | (0.01 | ) | | | 14.40 | | | | 31.98% | | | | 1,353 | | | | 1.11% | | | | 1.10% | | | | 0.45% | |
| 12/31/12h | | | 11.50 | | | | 0.07 | | | | (0.33 | ) | | | (0.26 | ) | | | (0.08 | ) | | | (0.24 | ) | | | (0.32 | ) | | | 10.92 | | | | (2.32% | )b | | | 518 | | | | 1.12% | a | | | 1.10% | a | | | 0.94% | a |
| | | | | | | | | | | | | | | | |
| | | Year ended December 31 | |
| | | 2014 | | | 2013 | | | 2012 | | | 2011 | |
Portfolio turnover rate | | | 51 | % | | | 61 | % | | | 66 | % | | | 0 | %b |
| b | Percentage represents the results for the period and is not annualized. |
| c | Per share amount calculated on the average shares method. |
| d | Amount is less than $0.005 per share. |
| h | For the period May 1, 2012 (commencement of operations) through December 31, 2012. |
| i | For the period December 8, 2011 (commencement of operations) through December 31, 2011. |
| j | Computed after giving effect to an agreement by MML Advisers and/or MassMutual to waive certain fees and expenses of the Fund. |
| m | Total return does not reflect expenses that apply at the separate account level or to related insurance products. Inclusion of these charges would reduce the total return figures for all periods shown. |
The accompanying notes are an integral part of the financial statements.
169
MML Series Investment Fund – Financial Statements (Continued)
Financial Highlights (For a share outstanding throughout each period)
MML Fundamental Value Fund
| | | | | | | | | | | | | | | | | | | | | | | | | | | | | | | | | | | | | | | | | | | | | | | | | | | | |
| | | | | | Income (loss) from investment
operations | | | Less distributions to shareholders | | | | | | | | | Ratios / Supplemental Data | |
| | | Net
asset
value,
beginning
of the
period | | | Net
investment
income
(loss)c,j | | | Net
realized
and
unrealized
gain (loss)
on
investments | | | Total
income
(loss) from
investment
operations | | | From net
investment
income | | | From net
realized
gains | | | Total
distributions | | | Net
asset
value,
end of
the
period | | | Total
returnm | | | Net
assets,
end of
the
period
(000’s) | | | Ratio of
expenses
to average
daily net
assets
before
expense
waivers | | | Ratio of
expenses
to average
daily net
assets
after
expense
waiversj | | | Net
investment
income
(loss) to
average
daily net
assets | |
Class II | | | | | | | | | | | | | | | | | | | | | | | | | | | | | | | | | | | | | | | | | | | | | |
| 12/31/14 | | $ | 15.46 | | | $ | 0.23 | | | $ | 1.47 | | | $ | 1.70 | | | $ | (0.25 | ) | | $ | (0.71 | ) | | $ | (0.96 | ) | | $ | 16.20 | | | | 11.19% | | | $ | 219,679 | | | | 0.79% | | | | N/A | | | | 1.47% | |
| 12/31/13 | | | 12.45 | | | | 0.23 | | | | 3.54 | | | | 3.77 | | | | (0.25 | ) | | | (0.51 | ) | | | (0.76 | ) | | | 15.46 | | | | 30.91% | | | | 233,724 | | | | 0.79% | | | | 0.79% | l | | | 1.61% | |
| 12/31/12 | | | 10.88 | | | | 0.24 | | | | 1.53 | | | | 1.77 | | | | (0.17 | ) | | | (0.03 | ) | | | (0.20 | ) | | | 12.45 | | | | 16.31% | | | | 185,473 | | | | 0.80% | | | | 0.80% | l | | | 1.98% | |
| 12/31/11 | | | 11.08 | | | | 0.18 | | | | (0.37 | ) | | | (0.19 | ) | | | - | | | | (0.01 | ) | | | (0.01 | ) | | | 10.88 | | | | (1.68% | ) | | | 172,645 | | | | 0.81% | | | | 0.80% | | | | 1.65% | |
| 12/31/10g | | | 10.00 | | | | 0.06 | | | | 1.10 | | | | 1.16 | | | | (0.05 | ) | | | (0.03 | ) | | | (0.08 | ) | | | 11.08 | | | | 11.59% | b | | | 126,691 | | | | 0.90% | a | | | 0.80% | a | | | 1.51% | a |
Service Class I | | | | | | | | | | | | | | | | | | | | | | | | | | | | | | | | | | | | | | | | | | | | | | | | | |
| 12/31/14 | | $ | 15.37 | | | $ | 0.19 | | | $ | 1.47 | | | $ | 1.66 | | | $ | (0.25 | ) | | $ | (0.71 | ) | | $ | (0.96 | ) | | $ | 16.07 | | | | 10.98% | | | $ | 5,611 | | | | 1.04% | | | | N/A | | | | 1.21% | |
| 12/31/13 | | | 12.42 | | | | 0.19 | | | | 3.52 | | | | 3.71 | | | | (0.25 | ) | | | (0.51 | ) | | | (0.76 | ) | | | 15.37 | | | | 30.55% | | | | 2,650 | | | | 1.04% | | | | 1.04% | l | | | 1.28% | |
| 12/31/12h | | | 12.16 | | | | 0.14 | | | | 0.33 | | | | 0.47 | | | | (0.18 | ) | | | (0.03 | ) | | | (0.21 | ) | | | 12.42 | | | | 3.90% | b | | | 381 | | | | 1.05% | a | | | 1.05% | a,l | | | 1.78% | a |
| | | | | | | | | | | | | | | | | | | | |
| | | Year ended December 31 | |
| | | 2014 | | | 2013 | | | 2012 | | | 2011 | | | 2010 | |
Portfolio turnover rate | | | 14 | % | | | 22 | % | | | 24 | % | | | 14 | % | | | 10 | %b |
| b | Percentage represents the results for the period and is not annualized. |
| c | Per share amount calculated on the average shares method. |
| g | For the period August 10, 2010 (commencement of operations) through December 31, 2010. |
| h | For the period May 1, 2012 (commencement of operations) through December 31, 2012. |
| j | Computed after giving effect to an agreement by MML Advisers and/or MassMutual to waive certain fees and expenses of the Fund. |
| l | Expenses incurred during the period fell under the expense cap. |
| m | Total return does not reflect expenses that apply at the separate account level or to related insurance products. Inclusion of these charges would reduce the total return figures for all periods shown. |
The accompanying notes are an integral part of the financial statements.
170
MML Series Investment Fund – Financial Statements (Continued)
Financial Highlights (For a share outstanding throughout each period)
MML Global Fund
| | | | | | | | | | | | | | | | | | | | | | | | | | | | | | | | | | | | | | | | | | | | | | | | | | | | |
| | | | | | Income (loss) from investment
operations | | | Less distributions to shareholders | | | | | | | | | Ratios / Supplemental Data | |
| | | Net
asset
value,
beginning
of the
period | | | Net
investment
income
(loss)c,j | | | Net
realized
and
unrealized
gain (loss)
on
investments | | | Total
income
(loss) from
investment
operations | | | From net
investment
income | | | From net
realized
gains | | | Total
distributions | | | Net
asset
value,
end of
the
period | | | Total
returnm | | | Net
assets,
end of
the
period
(000’s) | | | Ratio of
expenses
to average
daily net
assets
before
expense
waivers | | | Ratio of
expenses
to average
daily net
assets
after
expense
waiversj | | | Net
investment
income
(loss) to
average
daily net
assets | |
Class I | | | | | | | | | | | | | | | | | | | | | | | | | | | | | | | | | | | | | | | | | | | | | |
| 12/31/14 | | $ | 12.44 | | | $ | 0.16 | | | $ | 0.33 | | | $ | 0.49 | | | $ | (0.11 | ) | | $ | (0.21 | ) | | $ | (0.32 | ) | | $ | 12.61 | | | | 3.95% | | | $ | 210,395 | | | | 0.95% | | | | 0.90% | | | | 1.29% | |
| 12/31/13 | | | 9.82 | | | | 0.12 | | | | 2.63 | | | | 2.75 | | | | (0.13 | ) | | | - | | | | (0.13 | ) | | | 12.44 | | | | 28.13% | | | | 149,796 | | | | 0.96% | | | | 0.90% | | | | 1.10% | |
| 12/31/12 | | | 8.02 | | | | 0.12 | | | | 1.77 | | | | 1.89 | | | | (0.09 | ) | | | - | | | | (0.09 | ) | | | 9.82 | | | | 23.69% | | | | 131,665 | | | | 0.98% | | | | 0.90% | | | | 1.33% | |
| 12/31/11 | | | 8.46 | | | | 0.11 | | | | (0.47 | ) | | | (0.36 | ) | | | (0.08 | ) | | | - | | | | (0.08 | ) | | | 8.02 | | | | (4.24% | ) | | | 92,595 | | | | 1.00% | | | | 0.90% | | | | 1.28% | |
| 12/31/10 | | | 7.56 | | | | 0.08 | | | | 0.87 | | | | 0.95 | | | | (0.05 | ) | | | - | | | | (0.05 | ) | | | 8.46 | | | | 12.64% | | | | 83,762 | | | | 1.01% | | | | 0.90% | | | | 1.05% | |
Class II | | | | | | | | | | | | | | | | | | | | | | | | | | | | | | | | | | | | | | | | | | | | | |
| 12/31/14 | | $ | 12.63 | | | $ | 0.17 | | | $ | 0.33 | | | $ | 0.50 | | | $ | (0.11 | ) | | $ | (0.21 | ) | | $ | (0.32 | ) | | $ | 12.81 | | | | 4.00% | | | $ | 17,481 | | | | 0.85% | | | | 0.80% | | | | 1.35% | |
| 12/31/13 | | | 9.96 | | | | 0.14 | | | | 2.66 | | | | 2.80 | | | | (0.13 | ) | | | - | | | | (0.13 | ) | | | 12.63 | | | | 28.34% | | | | 18,681 | | | | 0.86% | | | | 0.80% | | | | 1.21% | |
| 12/31/12 | | | 8.13 | | | | 0.13 | | | | 1.80 | | | | 1.93 | | | | (0.10 | ) | | | - | | | | (0.10 | ) | | | 9.96 | | | | 23.79% | | | | 16,324 | | | | 0.88% | | | | 0.80% | | | | 1.45% | |
| 12/31/11 | | | 8.57 | | | | 0.12 | | | | (0.48 | ) | | | (0.36 | ) | | | (0.08 | ) | | | - | | | | (0.08 | ) | | | 8.13 | | | | (4.15% | ) | | | 15,218 | | | | 0.90% | | | | 0.80% | | | | 1.42% | |
| 12/31/10 | | | 7.64 | | | | 0.09 | | | | 0.88 | | | | 0.97 | | | | (0.04 | ) | | | - | | | | (0.04 | ) | | | 8.57 | | | | 12.83% | | | | 19,095 | | | | 0.91% | | | | 0.80% | | | | 1.19% | |
Service Class I | | | | | | | | | | | | | | | | | | | | | | | | | | | | | | | | | | | | | | | | | | | | | |
| 12/31/14 | | $ | 12.38 | | | $ | 0.12 | | | $ | 0.32 | | | $ | 0.44 | | | $ | (0.09 | ) | | $ | (0.21 | ) | | $ | (0.30 | ) | | $ | 12.52 | | | | 3.57% | | | $ | 9,220 | | | | 1.20% | | | | 1.15% | | | | 1.00% | |
| 12/31/13 | | | 9.78 | | | | 0.09 | | | | 2.63 | | | | 2.72 | | | | (0.12 | ) | | | - | | | | (0.12 | ) | | | 12.38 | | | | 27.94% | | | | 6,657 | | | | 1.21% | | | | 1.15% | | | | 0.82% | |
| 12/31/12 | | | 8.00 | | | | 0.09 | | | | 1.77 | | | | 1.86 | | | | (0.08 | ) | | | - | | | | (0.08 | ) | | | 9.78 | | | | 23.35% | | | | 3,707 | | | | 1.23% | | | | 1.15% | | | | 1.03% | |
| 12/31/11 | | | 8.47 | | | | 0.08 | | | | (0.47 | ) | | | (0.39 | ) | | | (0.08 | ) | | | - | | | | (0.08 | ) | | | 8.00 | | | | (4.58% | ) | | | 2,330 | | | | 1.25% | | | | 1.15% | | | | 0.98% | |
| 12/31/10 | | | 7.57 | | | | 0.05 | | | | 0.89 | | | | 0.94 | | | | (0.04 | ) | | | - | | | | (0.04 | ) | | | 8.47 | | | | 12.46% | | | | 1,424 | | | | 1.26% | | | | 1.15% | | | | 0.71% | |
| | | | | | | | | | | | | | | | | | | | |
| | | Year ended December 31 | |
| | | 2014 | | | 2013 | | | 2012 | | | 2011 | | | 2010 | |
Portfolio turnover rate | | | 12 | % | | | 11 | % | | | 11 | % | | | 16 | % | | | 18 | % |
| c | Per share amount calculated on the average shares method. |
| j | Computed after giving effect to an agreement by MML Advisers and/or MassMutual to waive certain fees and expenses of the Fund. |
| m | Total return does not reflect expenses that apply at the separate account level or to related insurance products. Inclusion of these charges would reduce the total return figures for all periods shown. |
The accompanying notes are an integral part of the financial statements.
171
MML Series Investment Fund – Financial Statements (Continued)
Financial Highlights (For a share outstanding throughout each period)
MML Growth & Income Fund
| | | | | | | | | | | | | | | | | | | | | | | | | | | | | | | | | | | | | | | | | | | | |
| | | | | | Income (loss) from investment
operations | | | Less distributions to
shareholders | | | | | | | | | Ratios / Supplemental Data | |
| | | Net
asset
value,
beginning
of the
period | | | Net
investment
income
(loss)c | | | Net
realized
and
unrealized
gain (loss)
on
investments | | | Total
income
(loss) from
investment
operations | | | From net
investment
income | | | Total
distributions | | | Net
asset
value,
end of
the
period | | | Total
returnm | | | Net
assets,
end of
the
period
(000’s) | | | Ratio of
expenses
to average
daily net
assets | | | Net
investment
income
(loss) to
average
daily net
assets | |
Initial Class | | | | | | | | | | | | | | | | | | | | | | | | | | | | | | | | | | | | | |
| 12/31/14 | | $ | 12.08 | | | $ | 0.14 | | | $ | 1.20 | | | $ | 1.34 | | | $ | (0.14 | ) | | $ | (0.14 | ) | | $ | 13.28 | | | | 11.19% | | | $ | 121,667 | | | | 0.56% | | | | 1.16% | |
| 12/31/13 | | | 9.24 | | | | 0.13 | | | | 2.85 | | | | 2.98 | | | | (0.14 | ) | | | (0.14 | ) | | | 12.08 | | | | 32.53% | | | | 129,107 | | | | 0.57% | | | | 1.22% | |
| 12/31/12 | | | 7.83 | | | | 0.13 | | | | 1.39 | | | | 1.52 | | | | (0.11 | ) | | | (0.11 | ) | | | 9.24 | | | | 19.49% | | | | 116,115 | | | | 0.58% | | | | 1.46% | |
| 12/31/11 | | | 8.07 | | | | 0.10 | | | | (0.25 | ) | | | (0.15 | ) | | | (0.09 | ) | | | (0.09 | ) | | | 7.83 | | | | (1.83% | ) | | | 116,867 | | | | 0.58% | | | | 1.23% | |
| 12/31/10 | | | 7.35 | | | | 0.08 | | | | 0.74 | | | | 0.82 | | | | (0.10 | ) | | | (0.10 | ) | | | 8.07 | | | | 11.47% | | | | 143,556 | | | | 0.56% | | | | 1.06% | |
Service Class | | | | | | | | | | | | | | | | | | | | | | | | | | | | | | | | | | | | | |
| 12/31/14 | | $ | 12.02 | | | $ | 0.11 | | | $ | 1.20 | | | $ | 1.31 | | | $ | (0.12 | ) | | $ | (0.12 | ) | | $ | 13.21 | | | | 10.94% | | | $ | 18,929 | | | | 0.81% | | | | 0.91% | |
| 12/31/13 | | | 9.20 | | | | 0.10 | | | | 2.84 | | | | 2.94 | | | | (0.12 | ) | | | (0.12 | ) | | | 12.02 | | | | 32.20% | | | | 17,142 | | | | 0.82% | | | | 0.97% | |
| 12/31/12 | | | 7.79 | | | | 0.11 | | | | 1.39 | | | | 1.50 | | | | (0.09 | ) | | | (0.09 | ) | | | 9.20 | | | | 19.32% | | | | 12,385 | | | | 0.83% | | | | 1.21% | |
| 12/31/11 | | | 8.03 | | | | 0.08 | | | | (0.25 | ) | | | (0.17 | ) | | | (0.07 | ) | | | (0.07 | ) | | | 7.79 | | | | (2.13% | ) | | | 10,090 | | | | 0.83% | | | | 0.97% | |
| 12/31/10 | | | 7.32 | | | | 0.06 | | | | 0.74 | | | | 0.80 | | | | (0.09 | ) | | | (0.09 | ) | | | 8.03 | | | | 11.21% | | | | 13,294 | | | | 0.81% | | | | 0.82% | |
| | | | | | | | | | | | | | | | | | | | |
| | | Year ended December 31 | |
| | | 2014 | | | 2013 | | | 2012 | | | 2011 | | | 2010 | |
Portfolio turnover rate | | | 20 | % | | | 19 | % | | | 26 | % | | | 22 | % | | | 95 | % |
| c | Per share amount calculated on the average shares method. |
| m | Total return does not reflect expenses that apply at the separate account level or to related insurance products. Inclusion of these charges would reduce the total return figures for all periods shown. |
The accompanying notes are an integral part of the financial statements.
172
MML Series Investment Fund – Financial Statements (Continued)
Financial Highlights (For a share outstanding throughout each period)
MML Income & Growth Fund
| | | | | | | | | | | | | | | | | | | | | | | | | | | | | | | | | | | | | | | | | | | | |
| | | | | | Income (loss) from investment
operations | | | Less distributions to
shareholders | | | | | | | | | Ratios / Supplemental Data | |
| | | Net
asset
value,
beginning
of the
period | | | Net
investment
income
(loss)c | | | Net
realized
and
unrealized
gain (loss)
on
investments | | | Total
income
(loss) from
investment
operations | | | From net
investment
income | | | Total
distributions | | | Net
asset
value,
end of
the
period | | | Total
returnm | | | Net
assets,
end of
the
period
(000’s) | | | Ratio of
expenses
to average
daily net
assets | | | Net
investment
income
(loss) to
average
daily net
assets | |
Initial Class | | | | | | | | | | | | | | | | | | | | | | | | | | | | | | | | | | | | | |
| 12/31/14 | | $ | 11.60 | | | $ | 0.23 | | | $ | 0.83 | | | $ | 1.06 | | | $ | (0.22 | ) | | $ | (0.22 | ) | | $ | 12.44 | | | | 9.22% | | | $ | 232,187 | | | | 0.70% | | | | 1.91% | |
| 12/31/13 | | | 9.48 | | | | 0.22 | | | | 2.09 | | | | 2.31 | | | | (0.19 | ) | | | (0.19 | ) | | | 11.60 | | | | 24.62% | | | | 228,095 | | | | 0.70% | | | | 2.07% | |
| 12/31/12 | | | 8.56 | | | | 0.23 | | | | 0.79 | | | | 1.02 | | | | (0.10 | ) | | | (0.10 | ) | | | 9.48 | | | | 11.96% | | | | 171,207 | | | | 0.72% | | | | 2.51% | |
| 12/31/11 | | | 8.37 | | | | 0.20 | | | | 0.25 | | | | 0.45 | | | | (0.26 | ) | | | (0.26 | ) | | | 8.56 | | | | 5.60% | | | | 88,465 | | | | 0.74% | | | | 2.37% | |
| 12/31/10 | | | 7.82 | | | | 0.13 | | | | 0.73 | | | | 0.86 | | | | (0.31 | ) | | | (0.31 | ) | | | 8.37 | | | | 11.70% | | | | 72,789 | | | | 0.73% | | | | 1.62% | |
Service Class | | | | | | | | | | | | | | | | | | | | | | | | | | | | | | | | | | | | | |
| 12/31/14 | | $ | 11.51 | | | $ | 0.20 | | | $ | 0.83 | | | $ | 1.03 | | | $ | (0.20 | ) | | $ | (0.20 | ) | | $ | 12.34 | | | | 8.96% | | | $ | 16,131 | | | | 0.95% | | | | 1.66% | |
| 12/31/13 | | | 9.42 | | | | 0.20 | | | | 2.06 | | | | 2.26 | | | | (0.17 | ) | | | (0.17 | ) | | | 11.51 | | | | 24.22% | | | | 14,775 | | | | 0.95% | | | | 1.82% | |
| 12/31/12 | | | 8.51 | | | | 0.20 | | | | 0.80 | | | | 1.00 | | | | (0.09 | ) | | | (0.09 | ) | | | 9.42 | | | | 11.73% | | | | 11,282 | | | | 0.97% | | | | 2.23% | |
| 12/31/11 | | | 8.33 | | | | 0.18 | | | | 0.26 | | | | 0.44 | | | | (0.26 | ) | | | (0.26 | ) | | | 8.51 | | | | 5.40% | | | | 8,466 | | | | 0.99% | | | | 2.18% | |
| 12/31/10 | | | 7.79 | | | | 0.13 | | | | 0.71 | | | | 0.84 | | | | (0.30 | ) | | | (0.30 | ) | | | 8.33 | | | | 11.47% | | | | 3,953 | | | | 0.98% | | | | 1.64% | |
| | | | | | | | | | | | | | | | | | | | |
| | | Year ended December 31 | |
| | | 2014 | | | 2013 | | | 2012 | | | 2011 | | | 2010 | |
Portfolio turnover rate | | | 19 | % | | | 15 | % | | | 3 | % | | | 12 | % | | | 64 | % |
| c | Per share amount calculated on the average shares method. |
| m | Total return does not reflect expenses that apply at the separate account level or to related insurance products. Inclusion of these charges would reduce the total return figures for all periods shown. |
The accompanying notes are an integral part of the financial statements.
173
MML Series Investment Fund – Financial Statements (Continued)
Financial Highlights (For a share outstanding throughout each period)
MML International Equity Fund
| | | | | | | | | | | | | | | | | | | | | | | | | | | | | | | | | | | | | | | | | | | | | | | | | | | | |
| | | | | | Income (loss) from investment
operations | | | Less distributions to shareholders | | | | | | | | | Ratios / Supplemental Data | |
| | | Net
asset
value,
beginning
of the
period | | | Net
investment
income
(loss)c,j | | | Net
realized
and
unrealized
gain (loss)
on
investments | | | Total
income
(loss) from
investment
operations | | | From net
investment
income | | | From net
realized
gains | | | Total
distributions | | | Net
asset
value,
end of
the
period | | | Total
returnm | | | Net
assets,
end of
the
period
(000’s) | | | Ratio of
expenses
to average
daily net
assets
before
expense
waivers | | | Ratio of
expenses
to average
daily net
assets
after
expense
waiversj | | | Net
investment
income
(loss) to
average
daily net
assets | |
Class II | | | | | | | | | | | | | | | | | | | | | | | | | | | | | | | | | | | | | | | | | | | | | | | | | | | | |
| 12/31/14g | | $ | 10.00 | | | $ | 0.18 | | | $ | (0.65 | ) | | $ | (0.47 | ) | | $ | (0.20 | ) | | $ | (0.06 | ) | | $ | (0.26 | ) | | $ | 9.27 | | | | (4.67% | )b | | $ | 123,915 | | | | 1.15% | a | | | 1.00% | a | | | 1.79% | a |
Service Class I | | | | | | | | | | | | | | | | | | | | | | | | | | | | | | | | | | | | | | | | | | | | | |
| 12/31/14h | | $ | 10.29 | | | $ | 0.07 | | | $ | (0.83 | ) | | $ | (0.76 | ) | | $ | (0.20 | ) | | $ | (0.06 | ) | | $ | (0.26 | ) | | $ | 9.27 | | | | (7.44% | )b | | $ | 298 | | | | 1.36% | a | | | 1.25% | a | | | 1.08% | a |
| | | | |
| | | Period ended
December 31, 2014b,g | | |
| | | | |
Portfolio turnover rate | | 39% | | |
| b | Percentage represents the results for the period and is not annualized. |
| c | Per share amount calculated on the average shares method. |
| g | For the period January 7, 2014 (commencement of operations) through December 31, 2014. |
| h | For the period May 1, 2014 (commencement of operations) through December 31, 2014. |
| j | Computed after giving effect to an agreement by MML Advisers and/or MassMutual to waive certain fees and expenses of the Fund. |
| m | Total return does not reflect expenses that apply at the separate account level or to related insurance products. Inclusion of these charges would reduce the total return figures for all periods shown. |
The accompanying notes are an integral part of the financial statements.
174
MML Series Investment Fund – Financial Statements (Continued)
Financial Highlights (For a share outstanding throughout each period)
MML Large Cap Growth Fund
| | | | | | | | | | | | | | | | | | | | | | | | | | | | | | | | | | | | | | | | | | | | | | | | |
| | | | | | Income (loss) from investment
operations | | | Less distributions to shareholders | | | | | | | | | Ratios / Supplemental Data | |
| | | Net
asset
value,
beginning
of the
period | | | Net
investment
income
(loss)c | | | Net
realized
and
unrealized
gain (loss)
on
investments | | | Total
income
(loss) from
investment
operations | | | From net
investment
income | | | From net
realized
gains | | | Total
distributions | | | Net
asset
value,
end of
the
period | | | Total
returnm | | | Net
assets,
end of
the
period
(000’s) | | | Ratio of
expenses
to average
daily net
assets | | | Net
investment
income
(loss) to
average
daily net
assets | |
Initial Class | | | | | | | | | | | | | | | | | | | | | | | | | | | | | | | | | | | | | | | | | |
| 12/31/14 | | $ | 14.63 | | | $ | (0.01 | ) | | $ | 1.36 | | | $ | 1.35 | | | $ | - | | | $ | (1.92 | ) | | $ | (1.92 | ) | | $ | 14.06 | | | | 9.51% | | | $ | 242,229 | | | | 0.69% | | | | (0.07% | ) |
| 12/31/13 | | | 11.62 | | | | 0.00 | d | | | 3.76 | | | | 3.76 | | | | (0.05 | ) | | | (0.70 | ) | | | (0.75 | ) | | | 14.63 | | | | 33.54% | | | | 268,330 | | | | 0.70% | | | | 0.00% | e |
| 12/31/12 | | | 10.04 | | | | 0.05 | | | | 1.54 | | | | 1.59 | | | | (0.01 | ) | | | - | | | | (0.01 | ) | | | 11.62 | | | | 15.81% | | | | 205,833 | | | | 0.70% | | | | 0.49% | |
| 12/31/11 | | | 10.45 | | | | 0.01 | | | | (0.40 | ) | | | (0.39 | ) | | | (0.02 | ) | | | - | | | | (0.02 | ) | | | 10.04 | | | | (3.69% | ) | | | 188,235 | | | | 0.71% | | | | 0.08% | |
| 12/31/10 | | | 8.80 | | | | 0.03 | | | | 1.63 | | | | 1.66 | | | | (0.01 | ) | | | - | | | | (0.01 | ) | | | 10.45 | | | | 18.87% | | | | 166,552 | | | | 0.72% | | | | 0.36% | |
Service Class | | | | | | | | | | | | | | | | | | | | | | | | | | | | | | | | | | | | | | | | | |
| 12/31/14 | | $ | 14.51 | | | $ | (0.04 | ) | | $ | 1.34 | | | $ | 1.30 | | | $ | - | | | $ | (1.92 | ) | | $ | (1.92 | ) | | $ | 13.89 | | | | 9.23% | | | $ | 2,726 | | | | 0.94% | | | | (0.29% | ) |
| 12/31/13 | | | 11.53 | | | | (0.03 | ) | | | 3.73 | | | | 3.70 | | | | (0.02 | ) | | | (0.70 | ) | | | (0.72 | ) | | | 14.51 | | | | 33.24% | | | | 1,849 | | | | 0.95% | | | | (0.25% | ) |
| 12/31/12 | | | 9.99 | | | | 0.03 | | | | 1.51 | | | | 1.54 | | | | - | | | | - | | | | - | | | | 11.53 | | | | 15.42% | | | | 1,439 | | | | 0.95% | | | | 0.25% | |
| 12/31/11 | | | 10.40 | | | | (0.02 | ) | | | (0.38 | ) | | | (0.40 | ) | | | (0.01 | ) | | | - | | | | (0.01 | ) | | | 9.99 | | | | (3.82% | ) | | | 1,176 | | | | 0.96% | | | | (0.17% | ) |
| 12/31/10 | | | 8.78 | | | | 0.01 | | | | 1.61 | | | | 1.62 | | | | - | | | | - | | | | - | | | | 10.40 | | | | 18.45% | | | | 763 | | | | 0.97% | | | | 0.11% | |
| | | | | | | | | | | | | | | | | | | | |
| | | Year ended December 31 | |
| | | 2014 | | | 2013 | | | 2012 | | | 2011 | | | 2010 | |
Portfolio turnover rate | | | 77 | % | | | 89 | % | | | 91 | % | | | 90 | % | | | 88 | % |
| c | Per share amount calculated on the average shares method. |
| d | Amount is less than $0.005 per share. |
| e | Amount is less than 0.005%. |
| m | Total return does not reflect expenses that apply at the separate account level or to related insurance products. Inclusion of these charges would reduce the total return figures for all periods shown. |
The accompanying notes are an integral part of the financial statements.
175
MML Series Investment Fund – Financial Statements (Continued)
Financial Highlights (For a share outstanding throughout each period)
MML Managed Volatility Fund
| | | | | | | | | | | | | | | | | | | | | | | | | | | | | | | | | | | | | | | | | | | | | | | | |
| | | | | | Income (loss) from investment
operations | | | Less distributions to shareholders | | | | | | | | | Ratios / Supplemental Data | |
| | | Net
asset
value,
beginning
of the
period | | | Net
investment
income
(loss)c | | | Net
realized
and
unrealized
gain (loss)
on
investments | | | Total
income
(loss) from
investment
operations | | | From net
investment
income | | | From net
realized
gains | | | Total
distributions | | | Net
asset
value,
end of
the
period | | | Total
returnm | | | Net
assets,
end of
the
period
(000’s) | | | Ratio of
expenses
to average
daily net
assets | | | Net
investment
income
(loss) to
average
daily net
assets | |
Initial Class | | | | | | | | | | | | | | | | | | | | | | | | | | | | | | | | | | | | | | | | | | | | | |
| 12/31/14 | | $ | 14.33 | | | $ | 0.16 | | | $ | 0.46 | | | $ | 0.62 | | | $ | (0.10 | ) | | $ | (0.74 | ) | | $ | (0.84 | ) | | $ | 14.11 | | | | 4.41% | | | $ | 336,931 | | | | 0.90% | | | | 1.14% | |
| 12/31/13 | | | 12.34 | | | | 0.16 | | | | 2.02 | | | | 2.18 | | | | (0.19 | ) | | | - | | | | (0.19 | ) | | | 14.33 | | | | 17.78% | | | | 203,330 | | | | 0.88% | | | | 1.19% | |
| 12/31/12 | | | 10.98 | | | | 0.17 | | | | 1.27 | | | | 1.44 | | | | (0.08 | ) | | | - | | | | (0.08 | ) | | | 12.34 | | | | 13.19% | | | | 193,271 | | | | 0.83% | | | | 1.43% | |
| 12/31/11 | | | 11.54 | | | | 0.10 | | | | (0.56 | ) | | | (0.46 | ) | | | (0.10 | ) | | | - | | | | (0.10 | ) | | | 10.98 | | | | (3.94% | ) | | | 193,403 | | | | 0.82% | | | | 0.89% | |
| 12/31/10 | | | 10.36 | | | | 0.08 | | | | 1.19 | | | | 1.27 | | | | (0.09 | ) | | | - | | | | (0.09 | ) | | | 11.54 | | | | 12.38% | | | | 218,666 | | | | 0.83% | | | | 0.79% | |
Service Class | | | | | | | | | | | | | | | | | | | | | | | | | | | | | | | | | | | | | | | | | | | | | |
| 12/31/14 | | $ | 14.25 | | | $ | 0.13 | | | $ | 0.45 | | | $ | 0.58 | | | $ | (0.07 | ) | | $ | (0.74 | ) | | $ | (0.81 | ) | | $ | 14.02 | | | | 4.14% | | | $ | 31,812 | | | | 1.15% | | | | 0.88% | |
| 12/31/13 | | | 12.27 | | | | 0.13 | | | | 2.02 | | | | 2.15 | | | | (0.17 | ) | | | - | | | | (0.17 | ) | | | 14.25 | | | | 17.56% | | | | 28,423 | | | | 1.13% | | | | 0.95% | |
| 12/31/12 | | | 10.93 | | | | 0.14 | | | | 1.26 | | | | 1.40 | | | | (0.06 | ) | | | - | | | | (0.06 | ) | | | 12.27 | | | | 12.83% | | | | 22,660 | | | | 1.08% | | | | 1.21% | |
| 12/31/11 | | | 11.49 | | | | 0.07 | | | | (0.55 | ) | | | (0.48 | ) | | | (0.08 | ) | | | - | | | | (0.08 | ) | | | 10.93 | | | | (4.14% | ) | | | 18,508 | | | | 1.07% | | | | 0.64% | |
| 12/31/10 | | | 10.33 | | | | 0.06 | | | | 1.17 | | | | 1.23 | | | | (0.07 | ) | | | - | | | | (0.07 | ) | | | 11.49 | | | | 12.04% | | | | 16,519 | | | | 1.08% | | | | 0.56% | |
| | | | | | | | | | | | | | | | | | | | |
| | | Year ended December 31 | |
| | | 2014 | | | 2013 | | | 2012 | | | 2011 | | | 2010 | |
Portfolio turnover rate | | | 14 | % | | | 94 | % | | | 11 | % | | | 15 | % | | | 17 | % |
| c | Per share amount calculated on the average shares method. |
| m | Total return does not reflect expenses that apply at the separate account level or to related insurance products. Inclusion of these charges would reduce the total return figures for all periods shown. |
The accompanying notes are an integral part of the financial statements.
176
MML Series Investment Fund – Financial Statements (Continued)
Financial Highlights (For a share outstanding throughout each period)
MML Mid Cap Growth Fund
| | | | | | | | | | | | | | | | | | | | | | | | | | | | | | | | | | | | | | | | | | | | | | | | |
| | | | | | Income (loss) from investment
operations | | | Less distributions to shareholders | | | | | | | | | Ratios / Supplemental Data | |
| | | Net
asset
value,
beginning
of the
period | | | Net
investment
income
(loss)c | | | Net
realized
and
unrealized
gain (loss)
on
investments | | | Total
income
(loss) from
investment
operations | | | From net
investment
income | | | From net
realized
gains | | | Total
distributions | | | Net
asset
value,
end of
the
period | | | Total
returnm | | | Net
assets,
end of
the
period
(000’s) | | | Ratio of
expenses
to average
daily net
assets | | | Net
investment
income
(loss)
to average
daily net
assets | |
Initial Class | | | | | | | | | | | | | | | | | | | | | | | | | | | | | | | | | | | | | | | | | |
| 12/31/14 | | $ | 16.59 | | | $ | (0.03 | ) | | $ | 2.11 | | | $ | 2.08 | | | $ | - | | | $ | (2.26 | ) | | $ | (2.26 | ) | | $ | 16.41 | | | | 13.27% | | | $ | 377,028 | | | | 0.81% | | | | (0.17% | ) |
| 12/31/13 | | | 12.96 | | | | (0.03 | ) | | | 4.65 | | | | 4.62 | | | | (0.04 | ) | | | (0.95 | ) | | | (0.99 | ) | | | 16.59 | | | | 36.69% | | | | 371,803 | | | | 0.81% | | | | (0.21% | ) |
| 12/31/12 | | | 12.08 | | | | 0.01 | | | | 1.63 | | | | 1.64 | | | | - | | | | (0.76 | ) | | | (0.76 | ) | | | 12.96 | | | | 13.78% | | | | 330,731 | | | | 0.82% | | | | 0.04% | |
| 12/31/11 | | | 12.23 | | | | (0.04 | ) | | | (0.11 | ) | | | (0.15 | ) | | | - | | | | - | | | | - | | | | 12.08 | | | | (1.23% | ) | | | 305,757 | | | | 0.82% | | | | (0.33% | ) |
| 12/31/10 | | | 9.55 | | | | (0.02 | ) | | | 2.70 | | | | 2.68 | | | | - | | | | - | | | | - | | | | 12.23 | | | | 28.06% | | | | 330,711 | | | | 0.82% | | | | (0.20% | ) |
Service Class | | | | | | | | | | | | | | | | | | | | | | | | | | | | | | | | | | | | | | | | | |
| 12/31/14 | | $ | 16.38 | | | $ | (0.07 | ) | | $ | 2.07 | | | $ | 2.00 | | | $ | - | | | $ | (2.26 | ) | | $ | (2.26 | ) | | $ | 16.12 | | | | 12.93% | | | $ | 56,457 | | | | 1.06% | | | | (0.42% | ) |
| 12/31/13 | | | 12.81 | | | | (0.07 | ) | | | 4.61 | | | | 4.54 | | | | (0.02 | ) | | | (0.95 | ) | | | (0.97 | ) | | | 16.38 | | | | 36.40% | | | | 43,873 | | | | 1.06% | | | | (0.45% | ) |
| 12/31/12 | | | 11.98 | | | | (0.02 | ) | | | 1.61 | | | | 1.59 | | | | - | | | | (0.76 | ) | | | (0.76 | ) | | | 12.81 | | | | 13.47% | | | | 29,154 | | | | 1.07% | | | | (0.19% | ) |
| 12/31/11 | | | 12.17 | | | | (0.07 | ) | | | (0.12 | ) | | | (0.19 | ) | | | - | | | | - | | | | - | | | | 11.98 | | | | (1.56% | ) | | | 22,796 | | | | 1.07% | | | | (0.57% | ) |
| 12/31/10 | | | 9.52 | | | | (0.04 | ) | | | 2.69 | | | | 2.65 | | | | - | | | | - | | | | - | | | | 12.17 | | | | 27.84% | | | | 17,236 | | | | 1.07% | | | | (0.42% | ) |
| | | | | | | | | | | | | | | | | | | | |
| | | Year ended December 31 | |
| | | 2014 | | | 2013 | | | 2012 | | | 2011 | | | 2010 | |
Portfolio turnover rate | | | 25 | % | | | 26 | % | | | 31 | % | | | 33 | % | | | 29 | % |
| c | Per share amount calculated on the average shares method. |
| m | Total return does not reflect expenses that apply at the separate account level or to related insurance products. Inclusion of these charges would reduce the total return figures for all periods shown. |
The accompanying notes are an integral part of the financial statements.
177
MML Series Investment Fund – Financial Statements (Continued)
Financial Highlights (For a share outstanding throughout each period)
MML Mid Cap Value Fund
| | | | | | | | | | | | | | | | | | | | | | | | | | | | | | | | | | | | | | | | | | | | | | | | |
| | | | | | Income (loss) from investment
operations | | | Less distributions to shareholders | | | | | | | | | Ratios / Supplemental Data | |
| | | Net
asset
value,
beginning
of the
period | | | Net
investment
income
(loss)c | | | Net
realized
and
unrealized
gain (loss)
on
investments | | | Total
income
(loss) from
investment
operations | | | From net
investment
income | | | From net
realized
gains | | | Total
distributions | | | Net asset
value,
end of
the
period | | | Total
returnm | | | Net
assets,
end of
the
period
(000’s) | | | Ratio of
expenses
to average
daily net
assets | | | Net
investment
income
(loss) to
average
daily net
assets | |
Initial Class | | | | | | | | | | | | | | | | | | | | | | | | | | | | | | | | | | | | | | | | | |
| 12/31/14 | | $ | 13.65 | | | $ | 0.19 | | | $ | 1.97 | | | $ | 2.16 | | | $ | (0.24 | ) | | $ | (2.45 | ) | | $ | (2.69 | ) | | $ | 13.12 | | | | 16.66% | | | $ | 465,533 | | | | 0.88% | | | | 1.39% | |
| 12/31/13 | | | 11.11 | | | | 0.20 | | | | 3.09 | | | | 3.29 | | | | (0.24 | ) | | | (0.51 | ) | | | (0.75 | ) | | | 13.65 | | | | 30.43% | | | | 467,386 | | | | 0.88% | | | | 1.57% | |
| 12/31/12 | | | 10.17 | | | | 0.23 | | | | 1.42 | | | | 1.65 | | | | (0.18 | ) | | | (0.53 | ) | | | (0.71 | ) | | | 11.11 | | | | 16.70% | | | | 437,725 | | | | 0.89% | | | | 2.12% | |
| 12/31/11 | | | 10.46 | | | | 0.17 | | | | (0.25 | ) | | | (0.08 | ) | | | (0.21 | ) | | | - | | | | (0.21 | ) | | | 10.17 | | | | (0.64% | ) | | | 407,615 | | | | 0.90% | | | | 1.62% | |
| 12/31/10 | | | 8.85 | | | | 0.22 | | | | 1.53 | | | | 1.75 | | | | (0.14 | ) | | | - | | | | (0.14 | ) | | | 10.46 | | | | 20.09% | | | | 419,863 | | | | 0.89% | | | | 2.36% | |
Service Class | | | | | | | | | | | | | | | | | | | | | | | | | | | | | | | | | | | | | | | | | |
| 12/31/14 | | $ | 13.55 | | | $ | 0.16 | | | $ | 1.94 | | | $ | 2.10 | | | $ | (0.21 | ) | | $ | (2.45 | ) | | $ | (2.66 | ) | | $ | 12.99 | | | | 16.33% | | | $ | 30,017 | | | | 1.13% | | | | 1.16% | |
| 12/31/13 | | | 11.04 | | | | 0.17 | | | | 3.07 | | | | 3.24 | | | | (0.22 | ) | | | (0.51 | ) | | | (0.73 | ) | | | 13.55 | | | | 30.11% | | | | 23,348 | | | | 1.13% | | | | 1.33% | |
| 12/31/12 | | | 10.12 | | | | 0.20 | | | | 1.41 | | | | 1.61 | | | | (0.16 | ) | | | (0.53 | ) | | | (0.69 | ) | | | 11.04 | | | | 16.37% | | | | 16,241 | | | | 1.14% | | | | 1.89% | |
| 12/31/11 | | | 10.41 | | | | 0.14 | | | | (0.23 | ) | | | (0.09 | ) | | | (0.20 | ) | | | - | | | | (0.20 | ) | | | 10.12 | | | | (0.81% | ) | | | 12,970 | | | | 1.15% | | | | 1.38% | |
| 12/31/10 | | | 8.83 | | | | 0.20 | | | | 1.51 | | | | 1.71 | | | | (0.13 | ) | | | - | | | | (0.13 | ) | | | 10.41 | | | | 19.62% | | | | 9,686 | | | | 1.14% | | | | 2.14% | |
| | | | | | | | | | | | | | | | | | | | |
| | | Year ended December 31 | |
| | | 2014 | | | 2013 | | | 2012 | | | 2011 | | | 2010 | |
Portfolio turnover rate | | | 66 | % | | | 71 | % | | | 81 | % | | | 106 | % | | | 125 | % |
| c | Per share amount calculated on the average shares method. |
| m | Total return does not reflect expenses that apply at the separate account level or to related insurance products. Inclusion of these charges would reduce the total return figures for all periods shown. |
The accompanying notes are an integral part of the financial statements.
178
MML Series Investment Fund – Financial Statements (Continued)
Financial Highlights (For a share outstanding throughout each period)
MML Small Cap Growth Equity Fund
| | | | | | | | | | | | | | | | | | | | | | | | | | | | | | | | | | | | | | | | | | | | | | | | |
| | | | | | Income (loss) from investment
operations | | | Less distributions to
shareholders | | | | | | | | | Ratios / Supplemental Data | |
| | | Net
asset
value,
beginning
of the
period | | | Net
investment
income
(loss)c,j | | | Net
realized
and
unrealized
gain (loss)
on
investments | | | Total
income
(loss) from
investment
operations | | | From net
realized
gains | | | Total
distributions | | | Net
asset
value,
end of
the
period | | | Total
returnm | | | Net
assets,
end of
the
period
(000's) | | | Ratio of
expenses
to average
daily net
assets
before
expense
waivers | | | Ratio of
expenses
to average
daily net
assets
after
expense
waiversj | | | Net
investment
income
(loss) to
average
daily net
assets | |
Initial Class | | | | | | | | | | | | | | | | | | | | | | | | | | | | | | | | | | | | | | | | | | | | | |
| 12/31/14 | | $ | 22.81 | | | $ | (0.09 | ) | | $ | 1.21 | | | $ | 1.12 | | | $ | (6.08 | ) | | $ | (6.08 | ) | | $ | 17.85 | | | | 5.92 | % | | $ | 253,096 | | | | 1.08 | % | | | N/A | | | | (0.43 | %) |
| 12/31/13 | | | 16.30 | | | | (0.08 | ) | | | 7.79 | | | | 7.71 | | | | (1.20 | ) | | | (1.20 | ) | | | 22.81 | | | | 48.54 | % | | | 273,041 | | | | 1.10 | % | | | 1.08 | % | | | (0.43 | %) |
| 12/31/12 | | | 16.05 | | | | (0.06 | ) | | | 2.17 | | | | 2.11 | | | | (1.86 | ) | | | (1.86 | ) | | | 16.30 | | | | 13.41 | % | | | 256,961 | | | | 1.13 | % | | | 1.12 | % | | | (0.38 | %) |
| 12/31/11 | | | 17.70 | | | | (0.12 | ) | | | (0.82 | ) | | | (0.94 | ) | | | (0.71 | ) | | | (0.71 | ) | | | 16.05 | | | | (5.23 | %) | | | 250,279 | | | | 1.13 | % | | | N/A | | | | (0.68 | %) |
| 12/31/10 | | | 14.48 | | | | (0.10 | ) | | | 3.32 | | | | 3.22 | | | | - | | | | - | | | | 17.70 | | | | 22.24 | % | | | 258,833 | | | | 1.14 | % | | | N/A | | | | (0.64 | %) |
Service Class | | | | | | | | | | | | | | | | | | | | | | | | | | | | | | | | | | | | | | | | | | | | | |
| 12/31/14 | | $ | 22.44 | | | $ | (0.13 | ) | | $ | 1.17 | | | $ | 1.04 | | | $ | (6.08 | ) | | $ | (6.08 | ) | | $ | 17.40 | | | | 5.62 | % | | $ | 9,977 | | | | 1.33 | % | | | N/A | | | | (0.67 | %) |
| 12/31/13 | | | 16.09 | | | | (0.13 | ) | | | 7.68 | | | | 7.55 | | | | (1.20 | ) | | | (1.20 | ) | | | 22.44 | | | | 48.17 | % | | | 7,871 | | | | 1.35 | % | | | 1.34 | % | | | (0.69 | %) |
| 12/31/12 | | | 15.91 | | | | (0.10 | ) | | | 2.14 | | | | 2.04 | | | | (1.86 | ) | | | (1.86 | ) | | | 16.09 | | | | 13.07 | % | | | 5,837 | | | | 1.38 | % | | | 1.37 | % | | | (0.63 | %) |
| 12/31/11 | | | 17.59 | | | | (0.16 | ) | | | (0.81 | ) | | | (0.97 | ) | | | (0.71 | ) | | | (0.71 | ) | | | 15.91 | | | | (5.43 | %) | | | 5,120 | | | | 1.38 | % | | | N/A | | | | (0.92 | %) |
| 12/31/10 | | | 14.42 | | | | (0.14 | ) | | | 3.31 | | | | 3.17 | | | | - | | | | - | | | | 17.59 | | | | 21.90 | % | | | 4,440 | | | | 1.39 | % | | | N/A | | | | (0.87 | %) |
| | | | | | | | | | | | | | | | | | | | |
| | | Year ended December 31 | |
| | | 2014 | | | 2013 | | | 2012 | | | 2011 | | | 2010 | |
Portfolio turnover rate | | | 78 | % | | | 86 | % | | | 90 | % | | | 91 | % | | | 95 | % |
| c | Per share amount calculated on the average shares method. |
| j | Computed after giving effect to an agreement by MML Advisers and/or MassMutual to waive certain fees and expenses of the Fund. |
| m | Total return does not reflect expenses that apply at the separate account level or to related insurance products. Inclusion of these charges would reduce the total return figures for all periods shown. |
The accompanying notes are an integral part of the financial statements.
179
MML Series Investment Fund – Financial Statements (Continued)
Financial Highlights (For a share outstanding throughout each period)
MML Small Company Value Fund
| | | | | | | | | | | | | | | | | | | | | | | | | | | | | | | | | | | | | | | | | | | | | | | | | | | | |
| | | | | | Income (loss) from investment
operations | | | Less distributions to shareholders | | | | | | | | | Ratios / Supplemental Data | |
| | | Net
asset
value,
beginning
of the
period | | | Net
investment
income
(loss)c,j | | | Net
realized
and
unrealized
gain (loss)
on
investments | | | Total
income
(loss) from
investment
operations | | | From net
investment
income | | | From net
realized
gains | | | Total
distributions | | | Net
asset
value,
end of
the
period | | | Total
returnm | | | Net
assets,
end of
the
period
(000’s) | | | Ratio of
expenses
to average
daily net
assets
before
expense
waivers | | | Ratio of
expenses
to average
daily net
assets
after
expense
waiversj | | | Net
investment
income
(loss) to
average
daily net
assets | |
Class II | | | | | | | | | | | | | | | | | | | | | | | | | | | | | | | | | | | | | | | | | |
| 12/31/14 | | $ | 23.88 | | | $ | 0.05 | | | $ | (0.01 | ) | | $ | 0.04 | | | $ | - | | | $ | (6.33 | ) | | $ | (6.33 | ) | | $ | 17.59 | | | | 0.47% | | | $ | 95,788 | | | | 1.17% | | | | 1.15% | | | | 0.26% | |
| 12/31/13 | | | 18.86 | | | | (0.01 | ) | | | 5.87 | | | | 5.86 | | | | (0.26 | ) | | | (0.58 | ) | | | (0.84 | ) | | | 23.88 | | | | 31.71% | | | | 97,840 | | | | 1.16% | | | | 1.15% | | | | (0.04% | ) |
| 12/31/12 | | | 16.83 | | | | 0.19 | | | | 2.34 | | | | 2.53 | | | | (0.00 | )d | | | (0.50 | ) | | | (0.50 | ) | | | 18.86 | | | | 15.20% | | | | 114,274 | | | | 1.17% | | | | 1.15% | | | | 1.05% | |
| 12/31/11 | | | 17.30 | | | | (0.01 | ) | | | (0.23 | ) | | | (0.24 | ) | | | - | | | | (0.23 | ) | | | (0.23 | ) | | | 16.83 | | | | (1.26% | ) | | | 102,633 | | | | 1.17% | | | | 1.15% | | | | (0.06% | ) |
| 12/31/10 | | | 15.70 | | | | 0.06 | | | | 3.19 | | | | 3.25 | | | | (0.14 | ) | | | (1.51 | ) | | | (1.65 | ) | | | 17.30 | | | | 20.83% | | | | 105,829 | | | | 1.18% | | | | 1.15% | | | | 0.34% | |
Service Class I | | | | | | | | | | | | | | | | | | | | | | | | | | | | | | | | | | | | | | | | | |
| 12/31/14 | | $ | 23.63 | | | $ | 0.00 | d | | $ | (0.01 | ) | | $ | (0.01 | ) | | $ | - | | | $ | (6.33 | ) | | $ | (6.33 | ) | | $ | 17.29 | | | | 0.24% | | | $ | 10,726 | | | | 1.42% | | | | 1.40% | | | | 0.02% | |
| 12/31/13 | | | 18.70 | | | | (0.05 | ) | | | 5.79 | | | | 5.74 | | | | (0.23 | ) | | | (0.58 | ) | | | (0.81 | ) | | | 23.63 | | | | 31.34% | | | | 9,944 | | | | 1.41% | | | | 1.40% | | | | (0.23% | ) |
| 12/31/12 | | | 16.73 | | | | 0.15 | | | | 2.32 | | | | 2.47 | | | | - | | | | (0.50 | ) | | | (0.50 | ) | | | 18.70 | | | | 14.99% | | | | 6,354 | | | | 1.42% | | | | 1.40% | | | | 0.86% | |
| 12/31/11 | | | 17.24 | | | | (0.05 | ) | | | (0.23 | ) | | | (0.28 | ) | | | - | | | | (0.23 | ) | | | (0.23 | ) | | | 16.73 | | | | (1.56% | ) | | | 3,951 | | | | 1.42% | | | | 1.40% | | | | (0.28% | ) |
| 12/31/10 | | | 15.67 | | | | 0.03 | | | | 3.18 | | | | 3.21 | | | | (0.13 | ) | | | (1.51 | ) | | | (1.64 | ) | | | 17.24 | | | | 20.59% | | | | 2,581 | | | | 1.43% | | | | 1.40% | | | | 0.20% | |
| | | | | | | | | | | | | | | | | | | | |
| | | Year ended December 31 | |
| | | 2014 | | | 2013 | | | 2012 | | | 2011 | | | 2010 | |
Portfolio turnover rate | | | 22 | % | | | 12 | % | | | 14 | % | | | 13 | % | | | 29 | % |
| c | Per share amount calculated on the average shares method. |
| d | Amount is less than $0.005 per share. |
| j | Computed after giving effect to an agreement by MML Advisers and/or MassMutual to waive certain fees and expenses of the Fund. |
| m | Total return does not reflect expenses that apply at the separate account level or to related insurance products. Inclusion of these charges would reduce the total return figures for all periods shown. |
The accompanying notes are an integral part of the financial statements.
180
MML Series Investment Fund – Financial Statements (Continued)
Financial Highlights (For a share outstanding throughout each period)
MML Small/Mid Cap Value Fund
| | | | | | | | | | | | | | | | | | | | | | | | | | | | | | | | | | | | | | | | | | | | | | | | |
| | | | | | Income (loss) from investment
operations | | | Less distributions to shareholders | | | | | | | | | Ratios / Supplemental Data | |
| | | Net
asset
value,
beginning
of the
period | | | Net
investment
income
(loss)c | | | Net
realized
and
unrealized
gain (loss)
on
investments | | | Total
income
(loss) from
investment
operations | | | From net
investment
income | | | From net
realized
gains | | | Total
distributions | | | Net
asset
value,
end of
the
period | | | Total
returnm | | | Net
assets,
end of
the
period
(000’s) | | | Ratio of
expenses
to average
daily net
assets | | | Net
investment
income
(loss) to
average
daily net
assets | |
Initial Class | | | | | | | | | | | | | | | | | | | | | | | | | | | | | | | | | | | | | | | | | | | | | |
| 12/31/14 | | $ | 13.80 | | | $ | 0.11 | | | $ | 1.19 | | | $ | 1.30 | | | $ | (0.09 | ) | | $ | (0.32 | ) | | $ | (0.41 | ) | | $ | 14.69 | | | | 9.45% | | | $ | 236,399 | | | | 0.79% | | | | 0.80% | |
| 12/31/13 | | | 10.06 | | | | 0.09 | | | | 3.74 | | | | 3.83 | | | | (0.09 | ) | | | - | | | | (0.09 | ) | | | 13.80 | | | | 38.18% | | | | 257,210 | | | | 0.80% | | | | 0.74% | |
| 12/31/12 | | | 8.51 | | | | 0.08 | | | | 1.54 | | | | 1.62 | | | | (0.07 | ) | | | - | | | | (0.07 | ) | | | 10.06 | | | | 19.06% | | | | 168,248 | | | | 0.81% | | | | 0.82% | |
| 12/31/11 | | | 9.26 | | | | 0.05 | | | | (0.75 | ) | | | (0.70 | ) | | | (0.05 | ) | | | - | | | | (0.05 | ) | | | 8.51 | | | | (7.50% | ) | | | 170,925 | | | | 0.81% | | | | 0.53% | |
| 12/31/10 | | | 7.35 | | | | 0.05 | | | | 1.91 | | | | 1.96 | | | | (0.05 | ) | | | - | | | | (0.05 | ) | | | 9.26 | | | | 26.84% | | | | 191,141 | | | | 0.81% | | | | 0.62% | |
Service Class | | | | | | | | | | | | | | | | | | | | | | | | | | | | | | | | | | | | | | | | | | | | | |
| 12/31/14 | | $ | 13.72 | | | $ | 0.08 | | | $ | 1.18 | | | $ | 1.26 | | | $ | (0.07 | ) | | $ | (0.32 | ) | | $ | (0.39 | ) | | $ | 14.59 | | | | 9.16% | | | $ | 15,484 | | | | 1.04% | | | | 0.56% | |
| 12/31/13 | | | 10.01 | | | | 0.06 | | | | 3.72 | | | | 3.78 | | | | (0.07 | ) | | | - | | | | (0.07 | ) | | | 13.72 | | | | 37.82% | | | | 12,729 | | | | 1.05% | | | | 0.47% | |
| 12/31/12 | | | 8.47 | | | | 0.06 | | | | 1.53 | | | | 1.59 | | | | (0.05 | ) | | | - | | | | (0.05 | ) | | | 10.01 | | | | 18.78% | | | | 8,717 | | | | 1.06% | | | | 0.60% | |
| 12/31/11 | | | 9.22 | | | | 0.03 | | | | (0.74 | ) | | | (0.71 | ) | | | (0.04 | ) | | | - | | | | (0.04 | ) | | | 8.47 | | | | (7.70% | ) | | | 7,067 | | | | 1.06% | | | | 0.30% | |
| 12/31/10 | | | 7.33 | | | | 0.03 | | | | 1.90 | | | | 1.93 | | | | (0.04 | ) | | | - | | | | (0.04 | ) | | | 9.22 | | | | 26.44% | | | | 6,388 | | | | 1.06% | | | | 0.40% | |
| | | | | | | | | | | | | | | | | | | | |
| | | Year ended December 31 | |
| | | 2014 | | | 2013 | | | 2012 | | | 2011 | | | 2010 | |
Portfolio turnover rate | | | 46 | % | | | 67 | % | | | 49 | % | | | 72 | % | | | 52 | % |
| c | Per share amount calculated on the average shares method. |
| m | Total return does not reflect expenses that apply at the separate account level or to related insurance products. Inclusion of these charges would reduce the total return figures for all periods shown. |
The accompanying notes are an integral part of the financial statements.
181
MML Series Investment Fund – Financial Statements (Continued)
Financial Highlights (For a share outstanding throughout each period)
MML Total Return Bond Fund
| | | | | | | | | | | | | | | | | | | | | | | | | | | | | | | | | | | | |
| | | | | | Income (loss) from investment
operations | | | Less distributions to shareholders | | | | | | | |
| | | Net asset
value,
beginning
of the
period | | | Net
investment
income
(loss)c,j | | | Net realized
and
unrealized
gain
(loss) on
investments | | | Total
income
(loss) from
investment
operations | | | From net
investment
income | | | From net
realized gains | | | Total
distributions | | | Net asset
value,
end of
the period | | | Total
returnm | |
Class II | | | | | | | | | | | | | | | | | | | | | | | | | | | | | |
| 12/31/14 | | $ | 10.34 | | | $ | 0.13 | | | $ | 0.36 | | | $ | 0.49 | | | $ | (0.19 | ) | | $ | - | | | $ | (0.19 | ) | | $ | 10.64 | | | | 4.75% | |
| 12/31/13 | | | 10.82 | | | | 0.13 | | | | (0.31 | ) | | | (0.18 | ) | | | (0.21 | ) | | | (0.09 | ) | | | (0.30 | ) | | | 10.34 | | | | (1.63% | ) |
| 12/31/12 | | | 10.13 | | | | 0.20 | | | | 0.70 | | | | 0.90 | | | | (0.21 | ) | | | - | | | | (0.21 | ) | | | 10.82 | | | | 8.93% | |
| 12/31/11 | | | 9.90 | | | | 0.22 | | | | 0.02 | | | | 0.24 | | | | (0.01 | ) | | | - | | | | (0.01 | ) | | | 10.13 | | | | 2.45% | |
| 12/31/10g | | | 10.00 | | | | 0.06 | | | | (0.05 | ) | | | 0.01 | | | | (0.04 | ) | | | (0.07 | ) | | | (0.11 | ) | | | 9.90 | | | | 0.17% | b |
Service Class I | | | | | | | | | | | | | | | | | | | | | | | | | | | | | | | | | |
| 12/31/14 | | $ | 10.29 | | | $ | 0.10 | | | $ | 0.35 | | | $ | 0.45 | | | $ | (0.17 | ) | | $ | - | | | $ | (0.17 | ) | | $ | 10.57 | | | | 4.43% | |
| 12/31/13 | | | 10.79 | | | | 0.10 | | | | (0.30 | ) | | | (0.20 | ) | | | (0.21 | ) | | | (0.09 | ) | | | (0.30 | ) | | | 10.29 | | | | (1.85% | ) |
| 12/31/12h | | | 10.49 | | | | 0.10 | | | | 0.41 | | | | 0.51 | | | | (0.21 | ) | | | - | | | | (0.21 | ) | | | 10.79 | | | | 4.94% | b |
| | | | | | | | | | | | | | | | | | | | |
| | | Year ended December 31 | |
| | | 2014 | | | 2013 | | | 2012 | | | 2011 | | | 2010 | |
Portfolio turnover rate | | | 447 | %u | | | 550 | %u | | | 583 | %u | | | 417 | % | | | 221 | %b |
| b | Percentage represents the results for the period and is not annualized. |
| c | Per share amount calculated on the average shares method. |
| e | Amount is less than 0.005%. |
| g | For the period August 10, 2010 (commencement of operations) through December 31, 2010. |
| h | For the period May 1, 2012 (commencement of operations) through December 31, 2012. |
| j | Computed after giving effect to an agreement by MML Advisers and/or MassMutual to waive certain fees and expenses of the Fund. |
| m | Total return does not reflect expenses that apply at the separate account level or to related insurance products. Inclusion of these charges would reduce the total return figures for all periods shown. |
| n | Includes interest expense. |
| p | Interest expense incurred as a result of entering into reverse repurchase agreements is included in the Fund’s net expenses in the Statements of Operations. Income earned on investing proceeds from reverse repurchase agreements is included in interest income in the Statements of Operations. |
| u | Excludes Treasury roll transactions. Including these transactions, the portfolio turnover would have been 479%, 574% and 618%, respectively, for the years ended December 31, 2014, December 31, 2013 and December 31, 2012. |
The accompanying notes are an integral part of the financial statements.
182
| | | | | | | | | | | | | | | | | | |
Ratios / Supplemental Data | |
Net assets,
end of
the period
(000’s) | | | Ratio of
expenses
to average
daily net
assets before
expense waiversn | | | Ratio of
expenses
to average
daily net
assets after
expense waiversj,n | | | Interest
expense to
average daily
net assetsp | | | Net investment
income (loss)
to average
daily net assetsn | |
| | | | | | | | | | | | | | | | | | |
| $ | 403,732 | | | | 0.70 | % | | | 0.65 | % | | | 0.00 | %e | | | 1.27 | % |
| | 401,127 | | | | 0.69 | % | | | 0.65 | % | | | 0.00 | %e | | | 1.23 | % |
| | 306,746 | | | | 0.72 | % | | | 0.65 | % | | | 0.00 | %e | | | 1.84 | % |
| | 226,663 | | | | 0.70 | % | | | 0.65 | % | | | N/A | | | | 2.21 | % |
| | 132,798 | | | | 0.91 | %a | | | 0.65 | %a | | | 0.00 | %a,e | | | 1.40 | %a |
| | | | | | | | | | | | | | | | | | |
| $ | 14,435 | | | | 0.95 | % | | | 0.90 | % | | | 0.00 | %e | | | 1.00 | % |
| | 11,404 | | | | 0.94 | % | | | 0.90 | % | | | 0.00 | %e | | | 1.00 | % |
| | 5,730 | | | | 0.97 | %a | | | 0.90 | %a | | | 0.00 | %a,e | | | 1.45 | %a |
183
Notes to Financial Statements
MML Series Investment Fund (the “Trust”) is registered under the Investment Company Act of 1940, as amended (the “1940 Act”), as a no-load, open-end, management investment company. The Trust is organized under the laws of the Commonwealth of Massachusetts as a Massachusetts business trust pursuant to an Agreement and Declaration of Trust dated December 19, 1984, as restated May 14, 1993, and further amended and restated as of December 15, 2011, as it may be further amended from time to time. The following are 19 series of the Trust (each individually referred to as a “Fund” or collectively as the “Funds”):
MML Blue Chip Growth Fund (“Blue Chip Growth Fund”)
MML Equity Income Fund (“Equity Income Fund”)
MML Equity Index Fund (“Equity Index Fund”)
MML Focused Equity Fund (“Focused Equity Fund”)
MML Foreign Fund (“Foreign Fund”)
MML Fundamental Growth Fund (“Fundamental Growth Fund”)
MML Fundamental Value Fund (“Fundamental Value Fund”)
MML Global Fund (“Global Fund”)
MML Growth & Income Fund (“Growth & Income Fund”)
MML Income & Growth Fund (“Income & Growth Fund”)
MML International Equity Fund (“International Equity Fund”)
MML Large Cap Growth Fund (“Large Cap Growth Fund”)
MML Managed Volatility Fund (“Managed Volatility Fund”)
MML Mid Cap Growth Fund (“Mid Cap Growth Fund”)
MML Mid Cap Value Fund (“Mid Cap Value Fund”)
MML Small Cap Growth Equity Fund (“Small Cap Growth Equity Fund”)
MML Small Company Value Fund (“Small Company Value Fund”)
MML Small/Mid Cap Value Fund (“Small/Mid Cap Value Fund”)
MML Total Return Bond Fund (formerly known as MML PIMCO Total Return Fund) (“Total Return Bond Fund”)
The Trust makes shares of the Funds available for the investment of assets of various separate investment accounts established by Massachusetts Mutual Life Insurance Company (“MassMutual”) and by life insurance companies which are subsidiaries of MassMutual. Shares of the Trust are not offered to the general public. MassMutual, MML Bay State Life Insurance Company, and C.M. Life Insurance Company are the record owners of all of the outstanding shares of the Funds.
Each share class of a Fund represents an interest in the same portfolio of assets. The principal difference among the classes is the level of service and administration fees, and shareholder and distribution service expenses borne by the classes. Because each class will have different fees and expenses, performance and share prices will vary between the classes. The classes of shares are offered to different types of investors, as outlined in the Funds’ Prospectus.
| 2. | | Significant Accounting Policies |
The following is a summary of significant accounting policies followed consistently by each Fund in the preparation of the financial statements in conformity with accounting principles generally accepted in the United States of America (“generally accepted accounting principles”). The preparation of the financial statements in accordance with generally accepted accounting principles requires management to make estimates and assumptions that affect the reported amounts and disclosures in the financial statements. Actual results could differ from those estimates.
Investment Valuation
The net asset value of each Fund’s shares is determined once daily as of the close of regular trading on the New York Stock Exchange (“NYSE”), on each day the NYSE is open for trading (a “business day”). The NYSE normally closes at 4:00 p.m. Eastern Time, but may close earlier on some days.
184
Notes to Financial Statements (Continued)
Equity securities and derivative contracts that are actively traded on a national securities exchange or contract market are valued on the basis of information furnished by a pricing service, which provides the last reported sale price, or, in the case of futures contracts, the settlement price, for securities or derivatives listed on the exchange or contract market or the official closing price on the NASDAQ National Market System, or in the case of over-the-counter (“OTC”) securities for which an official closing price is unavailable or not reported on the NASDAQ System, the last reported bid price. Portfolio securities traded on more than one national securities exchange are valued at the last price at the close of the exchange representing the principal market for such securities. Debt securities (other than short-term obligations) are valued on the basis of valuations furnished by a pricing service, which generally determines valuations taking into account factors such as institutional-size trading in similar securities, yield, quality, coupon rate, maturity, type of issue, trading characteristics, and other market data. Short-term debt securities with remaining maturities of 60 days or less are valued at either amortized cost or at original cost plus accrued interest, whichever the Funds’ investment adviser determines more closely approximates current market value. Shares of other open-end mutual funds are valued at their closing net asset values as reported on each business day.
Investments for which market quotations are readily available are marked to market daily based on those quotations. Market quotations may be provided by third-party vendors or market makers, and may be determined on the basis of a variety of factors, such as broker quotations, financial modeling, and other market data, such as market indexes and yield curves, counterparty information, and foreign exchange rates. U.S. Government and agency securities may be valued on the basis of market quotations or using a model that may incorporate market observable data such as reported sales of similar securities, broker quotes, yields, bids, offers, quoted market prices, and reference data. The fair values of OTC derivative contracts, including forward, swap, and option contracts related to interest rates, foreign currencies, credit standing of reference entities, equity prices, or commodity prices, may be based on market quotations or may be modeled using a series of techniques, including simulation models, depending on the contract and the terms of the transaction. The fair values of asset-backed securities and mortgage-backed securities are estimated based on models that consider the estimated cash flows of each debt tranche of the issuer, establish a benchmark yield, and develop an estimated tranche-specific spread to the benchmark yield based on the unique attributes of the tranche including, but not limited to, prepayment speed assumptions and attributes of the collateral. Restricted securities are generally valued at a discount to similar publicly traded securities.
Investments for which market quotations are not available or for which a pricing service or vendor does not provide a value, or for which such market quotations or values are considered by the investment adviser or subadviser to be unreliable (including, for example, certain foreign securities, thinly-traded securities, certain restricted securities, certain initial public offerings, or securities whose values may have been affected by a significant event) are stated at fair valuations determined in good faith by the Funds’ Valuation Committee1 in accordance with procedures approved annually by the Board of Trustees (“Trustees”), and under the general oversight of the Trustees. The Funds’ Valuation Committee employs various methods to determine fair valuations including a regular review of key inputs and assumptions and review of any related market activity. The Funds’ Valuation Committee reports to the Trustees at their regularly scheduled meetings. It is possible that fair value prices will be used by the Funds to a significant extent. The value determined for an investment using the Funds’ fair value procedures may differ from recent market prices for the investment and may be significantly different from the value realized upon the sale of such investment.
The Funds may invest in securities that are traded principally in foreign markets and that trade on weekends and other days when the Funds do not price their shares. As a result, the values of the Funds’ portfolio securities may change on days when the prices of the Funds’ shares are not calculated. The prices of the Funds’ shares will reflect any such changes when the prices of the Funds’ shares are next calculated, which is the next business day. The Funds may use fair value pricing more frequently for securities primarily traded in foreign markets because, among other things, most foreign markets close well before the Funds value their securities. The earlier close of these foreign markets gives rise to the possibility that significant events, including broad market moves, may have occurred in the interim. The Funds’ investments may be priced based on fair values provided by a third-party vendor, based on certain factors and methodologies applied by such vendor, in the event that there is movement in the U.S. market, between the close of the foreign market and the time the Funds calculate their net asset values. All assets and liabilities expressed in foreign currencies are converted into U.S. dollars at the mean between the buying and selling rates of such currencies against the U.S. dollar at the end of each business day.
| 1 | The Valuation Committee consists of the President, Treasurer, Assistant Treasurers, Vice Presidents (except for the CCO), Secretary, and Assistant Secretaries of the Trust, as well as such alternate members as the Trustees may from time to time designate. The Valuation Committee reviews and determines the fair valuation of portfolio securities and the Funds’ pricing procedures in general. |
185
Notes to Financial Statements (Continued)
Fair value is defined as the price that would be received to sell an asset or paid to transfer a liability in an orderly transaction between market participants at the measurement date. A three-tier hierarchy is utilized to maximize the use of observable market data inputs and minimize the use of unobservable inputs and to establish classification of fair value measurements for disclosure purposes. Inputs refer broadly to the assumptions that market participants would use in pricing the asset or liability, including assumptions about risk, for example, the risk inherent in a particular valuation technique used to measure fair value (such as a pricing model) and/or the risk inherent in the inputs to the valuation technique. Inputs may be observable or unobservable. Observable inputs are inputs that reflect the assumptions market participants would use in pricing the asset or liability and are developed based on market data obtained from sources independent of the reporting entity. Unobservable inputs are inputs that reflect the reporting entity’s own assumptions about the assumptions market participants would use in pricing the asset or liability and are developed based on the best information available in the circumstances. The three-tier hierarchy of inputs is summarized in the three broad Levels listed below. The inputs or methodology used for valuing investments are not necessarily an indication of the risk associated with investing in those investments and the determination of the significance of a particular input to the fair value measurement in its entirety requires judgment and consideration of factors specific to each security.
Level 1 – quoted prices (unadjusted) in active markets for identical investments that the Funds can access at the measurement date
The types of assets and liabilities categorized in Level 1 generally include actively traded domestic and certain foreign equity securities, derivatives actively traded on a national securities exchange (such as some warrants, rights, futures, and options), and shares of open-end mutual funds.
Level 2 – other significant observable inputs (including quoted prices for similar investments, interest rates, prepayment speeds, credit risk, etc.)
The types of assets and liabilities categorized in Level 2 generally include debt securities such as U.S. government and agency securities, mortgage-backed securities, asset-backed securities, municipal obligations, sovereign debt obligations, bank loans, corporate bonds, and those securities valued at amortized cost; OTC derivatives such as swaps, options, swaptions, and forward foreign currency exchange contracts; certain restricted securities; and non-exchange traded equity securities and certain foreign equity securities traded on particular foreign exchanges that close before the Funds determine their net asset values.
Level 3 – significant unobservable inputs (including the Funds’ own assumptions in determining the fair value of investments)
The types of assets and liabilities categorized in Level 3 generally include securities for which prices, spreads, or any of the other aforementioned key inputs are unobservable. Generally, securities whose trading has been suspended or that have been de-listed from their current primary trading exchange; securities in default or bankruptcy proceedings for which there is no current market quotation; securities and certain derivatives valued by broker quotes which may include brokers’ assumptions; and any illiquid Rule 144A securities or restricted securities issued by non-public entities are categorized in Level 3.
The availability of observable inputs can vary from security to security and is affected by a wide variety of factors, including, for example, the type of security, whether the security is new and not yet established in the marketplace, the liquidity of markets, and other characteristics particular to the security. To the extent that valuation is based on models or inputs that are less observable or unobservable in the market, the determination of fair value requires more judgment. Accordingly, the degree of judgment exercised in determining fair value is greatest for instruments categorized in Level 3.
Changes in valuation techniques may result in transfers in or out of an investment’s assigned Level within the hierarchy. In addition, in periods of market dislocation, the observability of prices and inputs may be reduced for many instruments. This condition, as well as changes related to liquidity of investments, could cause a security to be reclassified between Level 1, Level 2, or Level 3.
In certain cases, the inputs used to measure fair value may fall into different levels of the fair value hierarchy. In such cases, for disclosure purposes the level in the fair value hierarchy within which the fair value measurement falls is determined based on the lowest level input that is significant to the overall fair value measurement.
The Fundamental Growth Fund, Large Cap Growth Fund, Small Company Value Fund, and Small/Mid Cap Value Fund characterized all long-term investments at Level 1, and all short-term investments at Level 2, as of December 31, 2014. For each
186
Notes to Financial Statements (Continued)
Fund noted in the preceding sentence, the level classification by major category of investments is the same as the category presentation in the Portfolio of Investments.
The following is the aggregate value by input level, as of December 31, 2014, for the remaining Funds’ investments:
| | | | | | | | | | | | | | | | |
| | | Level 1 | | | Level 2 | | | Level 3 | | | Total | |
Blue Chip Growth Fund | | | | | | | | | | | | | | | | |
Asset Investments | | | | | | | | | | | | | | | | |
Common Stock | | $ | 413,918,431 | | | $ | 6,361,298 | * | | $ | - | | | $ | 420,279,729 | |
Mutual Funds | | | 1,001 | | | | - | | | | - | | | | 1,001 | |
Short-Term Investments | | | - | | | | 2,336,081 | | | | - | | | | 2,336,081 | |
| | | | | | | | | | | | | | | | |
| Total Investments | | $ | 413,919,432 | | | $ | 8,697,379 | | | $ | - | | | $ | 422,616,811 | |
| | | | | | | | | | | | | | | | |
| | | | |
Equity Income Fund | | | | | | | | | | | | | | | | |
Asset Investments | | | | | | | | | | | | | | | | |
Common Stock | | $ | 491,457,479 | | | $ | 7,333,803 | * | | $ | - | | | $ | 498,791,282 | |
Mutual Funds | | | 12,272,716 | | | | - | | | | - | | | | 12,272,716 | |
Short-Term Investments | | | - | | | | 26,234,024 | | | | - | | | | 26,234,024 | |
| | | | | | | | | | | | | | | | |
| Total Investments | | $ | 503,730,195 | | | $ | 33,567,827 | | | $ | - | | | $ | 537,298,022 | |
| | | | | | | | | | | | | | | | |
| | | | |
Equity Index Fund | | | | | | | | | | | | | | | | |
Asset Investments | | | | | | | | | | | | | | | | |
Common Stock | | $ | 437,234,554 | | | $ | - | | | $ | - | | | $ | 437,234,554 | |
Short-Term Investments | | | - | | | | 7,191,707 | | | | - | | | | 7,191,707 | |
| | | | | | | | | | | | | | | | |
| Total Investments | | $ | 437,234,554 | | | $ | 7,191,707 | | | $ | - | | | $ | 444,426,261 | |
| | | | | | | | | | | | | | | | |
| Asset Derivatives | | | | | | | | | | | | | | | | |
Futures Contracts | | $ | 142,074 | | | $ | - | | | $ | - | | | $ | 142,074 | |
| | | | | | | | | | | | | | | | |
| | | | |
Focused Equity Fund | | | | | | | | | | | | | | | | |
Asset Investments | | | | | | | | | | | | | | | | |
Common Stock | | $ | 144,798,120 | | | $ | 7,863,960 | | | $ | - | | | $ | 152,662,080 | |
Short-Term Investments | | | - | | | | 14,833,373 | | | | - | | | | 14,833,373 | |
| | | | | | | | | | | | | | | | |
| Total Investments | | $ | 144,798,120 | | | $ | 22,697,333 | | | $ | - | | | $ | 167,495,453 | |
| | | | | | | | | | | | | | | | |
| | | | |
Foreign Fund | | | | | | | | | | | | | | | | |
Asset Investments | | | | | | | | | | | | | | | | |
Common Stock | | $ | 40,059,239 | | | $ | 272,679,567 | * | | $ | - | | | $ | 312,738,806 | |
Rights | | | - | | | | 36,659 | | | | - | | | | 36,659 | |
Mutual Funds | | | 15,029,374 | | | | - | | | | - | | | | 15,029,374 | |
Short-Term Investments | | | - | | | | 12,461,288 | | | | - | | | | 12,461,288 | |
| | | | | | | | | | | | | | | | |
| Total Investments | | $ | 55,088,613 | | | $ | 285,177,514 | | | $ | - | | | $ | 340,266,127 | |
| | | | | | | | | | | | | | | | |
| | | | |
Fundamental Value Fund | | | | | | | | | | | | | | | | |
Asset Investments | | | | | | | | | | | | | | | | |
Common Stock | | $ | 217,871,415 | | | $ | 2,787,109 | * | | $ | - | | | $ | 220,658,524 | |
Short-Term Investments | | | - | | | | 4,475,662 | | | | - | | | | 4,475,662 | |
| | | | | | | | | | | | | | | | |
| Total Investments | | $ | 217,871,415 | | | $ | 7,262,771 | | | $ | - | | | $ | 225,134,186 | |
| | | | | | | | | | | | | | | | |
187
Notes to Financial Statements (Continued)
| | | | | | | | | | | | | | | | |
| | | Level 1 | | | Level 2 | | | Level 3 | | | Total | |
Global Fund | | | | | | | | | | | | | | | | |
Asset Investments | | | | | | | | | | | | | | | | |
Common Stock | | $ | 137,909,270 | | | $ | 95,453,333 | * | | $ | - | | | $ | 233,362,603 | |
Mutual Funds | | | 2,480,911 | | | | - | | | | - | | | | 2,480,911 | |
Short-Term Investments | | | - | | | | 3,416,461 | | | | - | | | | 3,416,461 | |
| | | | | | | | | | | | | | | | |
| Total Investments | | $ | 140,390,181 | | | $ | 98,869,794 | | | $ | - | | | $ | 239,259,975 | |
| | | | | | | | | | | | | | | | |
| | | | |
Growth & Income Fund | | | | | | | | | | | | | | | | |
Asset Investments | | | | | | | | | | | | | | | | |
Common Stock | | $ | 133,177,533 | | | $ | 5,987,936 | * | | $ | - | | | $ | 139,165,469 | |
Preferred Stock | | | 396,900 | | | | - | | | | - | | | | 396,900 | |
Short-Term Investments | | | - | | | | 1,431,118 | | | | - | | | | 1,431,118 | |
| | | | | | | | | | | | | | | | |
| Total Investments | | $ | 133,574,433 | | | $ | 7,419,054 | | | $ | - | | | $ | 140,993,487 | |
| | | | | | | | | | | | | | | | |
| | | | |
Income & Growth Fund | | | | | | | | | | | | | | | | |
Asset Investments | | | | | | | | | | | | | | | | |
Common Stock | | $ | 233,061,556 | | | $ | 5,401,069 | * | | $ | - | | | $ | 238,462,625 | |
Short-Term Investments | | | - | | | | 9,791,868 | | | | - | | | | 9,791,868 | |
| | | | | | | | | | | | | | | | |
| Total Investments | | $ | 233,061,556 | | | $ | 15,192,937 | | | $ | - | | | $ | 248,254,493 | |
| | | | | | | | | | | | | | | | |
| | | | |
International Equity Fund | | | | | | | | | | | | | | | | |
Asset Investments | | | | | | | | | | | | | | | | |
Common Stock | | $ | 5,233,845 | | | $ | 112,835,633 | * | | $ | - | | | $ | 118,069,478 | |
Mutual Funds | | | 1,592,220 | | | | - | | | | - | | | | 1,592,220 | |
| | | | | | | | | | | | | | | | |
| Total Investments | | $ | 6,826,065 | | | $ | 112,835,633 | | | $ | - | | | $ | 119,661,698 | |
| | | | | | | | | | | | | | | | |
Asset Derivatives | | | | | | | | | | | | | | | | |
Forward Contracts | | $ | - | | | $ | 573,315 | | | $ | - | | | $ | 573,315 | |
| | | | | | | | | | | | | | | | |
Liability Derivatives | | | | | | | | | | | | | | | | |
Forward Contracts | | $ | - | | | $ | (65,005 | ) | | $ | - | | | $ | (65,005 | ) |
| | | | | | | | | | | | | | | | |
| | | | |
Managed Volatility Fund | | | | | | | | | | | | | | | | |
Asset Investments | | | | | | | | | | | | | | | | |
Common Stock | | $ | 368,102,666 | | | $ | - | | | $ | - | | | $ | 368,102,666 | |
Corporate Debt | | | - | | | | - | | | | 0 | + | | | - | |
Purchased Options | | | 1,447,676 | | | | - | | | | - | | | | 1,447,676 | |
Short-Term Investments | | | - | | | | 4,453,793 | | | | - | | | | 4,453,793 | |
| | | | | | | | | | | | | | | | |
| Total Investments | | $ | 369,550,342 | | | $ | 4,453,793 | | | $ | - | | | $ | 374,004,135 | |
| | | | | | | | | | | | | | | | |
Liability Derivatives | | | | | | | | | | | | | | | | |
Written Options | | $ | (8,238,080 | ) | | $ | - | | | $ | - | | | $ | (8,238,080 | ) |
| | | | | | | | | | | | | | | | |
| | | | |
Mid Cap Growth Fund | | | | | | | | | | | | | | | | |
Asset Investments | | | | | | | | | | | | | | | | |
Common Stock | | $ | 413,126,270 | | | $ | - | | | $ | 1,216,929 | | | $ | 414,343,199 | |
Preferred Stock | | | - | | | | - | | | | 1,961,775 | | | | 1,961,775 | |
Mutual Funds | | | 17,616,406 | | | | - | | | | - | | | | 17,616,406 | |
Short-Term Investments | | | - | | | | 19,185,700 | | | | - | | | | 19,185,700 | |
| | | | | | | | | | | | | | | | |
| Total Investments | | $ | 430,742,676 | | | $ | 19,185,700 | | | $ | 3,178,704 | | | $ | 453,107,080 | |
| | | | | | | | | | | | | | | | |
188
Notes to Financial Statements (Continued)
| | | | | | | | | | | | | | | | |
| | | Level 1 | | | Level 2 | | | Level 3 | | | Total | |
Mid Cap Value Fund | | | | | | | | | | | | | | | | |
Asset Investments | | | | | | | | | | | | | | | | |
Common Stock | | $ | 467,807,005 | | | $ | 11,071,195 | * | | $ | - | | | $ | 478,878,200 | |
Mutual Funds | | | 13,289,075 | | | | - | | | | - | | | | 13,289,075 | |
Short-Term Investments | | | - | | | | 9,314,127 | | | | - | | | | 9,314,127 | |
| | | | | | | | | | | | | | | | |
| Total Investments | | $ | 481,096,080 | | | $ | 20,385,322 | | | $ | - | | | $ | 501,481,402 | |
| | | | | | | | | | | | | | | | |
Asset Derivatives | | | | | | | | | | | | | | | | |
Forwards Contracts | | $ | - | | | $ | 85,196 | | | $ | - | | | $ | 85,196 | |
| | | | | | | | | | | | | | | | |
Liability Derivatives | | | | | | | | | | | | | | | | |
Forwards Contracts | | $ | - | | | $ | (4,455 | ) | | $ | - | | | $ | (4,455 | ) |
| | | | | | | | | | | | | | | | |
| | | | |
Small Cap Growth Equity Fund | | | | | | | | | | | | | | | | |
Asset Investments | | | | | | | | | | | | | | | | |
Common Stock | | $ | 257,040,906 | | | $ | 1,674,399 | * | | $ | 240,155 | | | $ | 258,955,460 | |
Preferred Stock | | | - | | | | - | | | | 3,653,969 | | | | 3,653,969 | |
Mutual Funds | | | 31,182,740 | | | | - | | | | - | | | | 31,182,740 | |
Short-Term Investments | | | - | | | | 5,458,142 | | | | - | | | | 5,458,142 | |
| | | | | | | | | | | | | | | | |
| Total Investments | | $ | 288,223,646 | | | $ | 7,132,541 | | | $ | 3,894,124 | | | $ | 299,250,311 | |
| | | | | | | | | | | | | | | | |
| | | | |
Total Return Bond Fund | | | | | | | | | | | | | | | | |
Asset Investments | | | | | | | | | | | | | | | | |
Preferred Stock | | $ | 1,160,720 | | | $ | - | | | $ | - | | | $ | 1,160,720 | |
Corporate Debt | | | - | | | | 72,767,479 | | | | - | | | | 72,767,479 | |
Municipal Obligations | | | - | | | | 3,373,499 | | | | - | | | | 3,373,499 | |
Non-U.S. Government Agency Obligations | | | - | | | | 74,926,361 | | | | - | | | | 74,926,361 | |
U.S. Government Agency Obligations and Instrumentalities | | | - | | | | 104,883,844 | | | | - | | | | 104,883,844 | |
U.S. Treasury Obligations | | | - | | | | 142,664,281 | | | | - | | | | 142,664,281 | |
Short-Term Investments | | | - | | | | 86,207,817 | | | | - | | | | 86,207,817 | |
| | | | | | | | | | | | | | | | |
| Total Investments | | $ | 1,160,720 | | | $ | 484,823,281 | | | $ | - | | | $ | 485,984,001 | |
| | | | | | | | | | | | | | | | |
Asset Derivatives | | | | | | | | | | | | | | | | |
Forward Contracts | | $ | - | | | $ | 2,811,637 | | | $ | - | | | $ | 2,811,637 | |
| | | | | | | | | | | | | | | | |
Liability Derivatives | | | | | | | | | | | | | | | | |
Forward Contracts | | $ | - | | | $ | (2,301,512 | ) | | $ | - | | | $ | (2,301,512 | ) |
| | | | | | | | | | | | | | | | |
| * | Includes foreign equity securities whose values were adjusted to reflect market trading of comparable securities or other correlated instruments after the close of trading in their applicable foreign markets. |
| + | Represents security at $0 value as of December 31, 2014. |
189
Notes to Financial Statements (Continued)
The following tables show Funds with certain assets and liabilities, which approximate fair value and would be categorized at Level 2 as of December 31, 2014.
| | | | | | | | |
Statements of Assets and Liabilities location: | | Equity
Income
Fund | | Small Cap
Growth
Equity
Fund | | Small
Company
Value
Fund | | Total
Return
Bond
Fund |
Receivables from: | | | | | | | | |
Investments sold on a when-issued basis | | | | | | | | X |
Payables for: | | | | | | | | |
Investments purchased on a when-issued basis | | | | | | | | X |
Collateral pledged for open swap agreements | | | | | | | | X |
Due to custodian | | X | | X | | X | | |
| | | | | | | | | | | | |
Statements of Assets and Liabilities location: | | Foreign
Fund | | Global
Fund | | International
Equity Fund | | Mid Cap
Growth Fund | | Small Cap Growth
Equity Fund | | Small Company
Value Fund |
Payables for: | | | | | | | | | | | | |
Securities on loan | | X | | X | | X | | X | | X | | X |
The following table shows transfers between Level 1 and Level 2 of the fair value hierarchy:
| | | | | | | | | | | | | | | | |
| | | Transfers In* | | | Transfers Out* | |
| | | Level 1 —
Quoted Prices | | | Level 2 —
Other
Significant
Observable
Inputs | | | Level 1 —
Quoted Prices | | | Level 2 —
Other
Significant
Observable
Inputs | |
Growth & Income Fund | | $ | 382,468 | | | $ | - | | | $ | - | | | $ | (382,468 | ) |
| * | The Fund(s) recognize transfers between the Levels as of the beginning of the year. Transfers occurred between Level 2 and Level 1 as inputs were more observable. |
Following is a reconciliation of investments for which significant unobservable inputs (Level 3) were used in determining value:
Asset Valuation Inputs
| | | | | | | | | | | | | | | | | | | | | | | | | | | | | | | | | | | | | | | | |
| | | Investments in Securities | |
| | | Balance
as of
12/31/13 | | | Accrued
Discounts
(Premiums) | | | Realized
Gain
(Loss) | | | Change in
Unrealized
Appreciation
(Depreciation) | | | Purchases | | | (Sales) | | | Transfers
into
Level 3* | | | Transfers
(out) of
Level 3* | | | Balance
as of
12/31/14 | | | Net Change
in Unrealized
Appreciation
(Depreciation)
from
Investments
Still Held
as of
12/31/14 | |
Managed Volatility Fund | |
Corporate Debt | | $ | - | ** | | $ | - | | | $ | - | | | $ | - | | | $ | - | | | $ | - | | | $ | - | | | $ | - | | | $ | - | †† | | $ | - | |
| | | | | | | | | | | | | | | | | | | | | | | | | | | | | | | | | | | | | | | | |
|
Mid Cap Growth Fund | |
Common Stock | | $ | 81,541 | | | $ | - | | | $ | (11 | ) | | $ | 243,808 | | | $ | 1,711,801 | | | $ | (820,210 | ) | | $ | - | | | $ | - | | | $ | 1,216,929 | | | $ | 243,808 | |
Preferred Stock | | | 1,473,891 | | | | - | | | | - | | | | 566,562 | | | | 660,002 | | | | (738,680 | ) | | | - | | | | - | | | | 1,961,775 | | | | 607,796 | |
| | | | | | | | | | | | | | | | | | | | | | | | | | | | | | | | | | | | | | | | |
| | $ | 1,555,432 | | | $ | - | | | $ | (11 | ) | | $ | 810,370 | | | $ | 2,371,803 | | | $ | (1,558,890 | ) | | $ | - | | | $ | - | | | $ | 3,178,704 | | | $ | 851,604 | |
| | | | | | | | | | | | | | | | | | | | | | | | | | | | | | | | | | | | | | | | |
|
Small Cap Growth Equity Fund | |
Common Stock | | $ | 265,899 | | | $ | - | | | $ | 13,199 | | | $ | (13,796 | ) | | $ | 106,712 | | | $ | (131,859 | ) | | $ | - | | | $ | - | | | $ | 240,155 | | | $ | (13,828 | ) |
Preferred Stock | | | 694,301 | | | | - | | | | - | | | | 2,274,066 | | | | 685,602 | | | | - | | | | - | | | | - | | | | 3,653,969 | | | | 2,274,066 | |
| | | | | | | | | | | | | | | | | | | | | | | | | | | | | | | | | | | | | | | | |
| | $ | 960,200 | | | $ | - | | | $ | 13,199 | | | $ | 2,260,270 | | | $ | 792,314 | | | $ | (131,859 | ) | | $ | - | | | $ | - | | | $ | 3,894,124 | | | $ | 2,260,238 | |
| | | | | | | | | | | | | | | | | | | | | | | | | | | | | | | | | | | | | | | | |
190
Notes to Financial Statements (Continued)
| | | | | | | | | | | | | | | | | | | | | | | | | | | | | | | | | | | | | | | | |
| | | Investments in Securities | |
| | | Balance
as of
12/31/13 | | | Accrued
Discounts
(Premiums) | | | Realized
Gain
(Loss) | | | Change in
Unrealized
Appreciation
(Depreciation) | | | Purchases | | | (Sales) | | | Transfers
into
Level 3* | | | Transfers
(out) of
Level 3* | | | Balance
as of
12/31/14 | | | Net Change
in Unrealized
Appreciation
(Depreciation)
from
Investments
Still Held
as of
12/31/14 | |
|
Total Return Bond Fund | |
Corporate Debt† | | $ | 299,520 | | | $ | - | | | $ | - | | | $ | 480 | | | $ | 4,040,751 | | | $ | (300,000 | ) | | $ | - | | | $ | (4,040,751 | )*** | | $ | - | | | $ | - | |
Non U.S. Government | | | | | | | | | | | | | | | | | | | | | | | | | | | | | | | | | | | | | | | | |
Obligations† | | | - | | | | - | | | | 2,252 | | | | - | | | | 1,457,675 | | | | (225,185 | ) | | | - | | | | (1,234,742 | )*** | | | - | | | | - | |
| | | | | | | | | | | | | | | | | | | | | | | | | | | | | | | | | | | | | | | | |
| | $ | 299,520 | | | $ | - | | | $ | 2,252 | | | $ | 480 | | | $ | 5,498,426 | | | $ | (525,185 | ) | | $ | - | | | $ | (5,275,493 | ) | | $ | - | | | $ | - | |
| | | | | | | | | | | | | | | | | | | | | | | | | | | | | | | | | | | | | | | | |
| * | The Fund(s) recognize transfers between the Levels as of the beginning of the year. |
| ** | Represents security at $0 value as of December 31, 2013. |
| *** | Transfers occurred between Level 3 and Level 2 as inputs were less observable. |
| † | Represents (i) an illiquid 144A security valued by a broker quote or vendor price or (ii) a restricted security issued by a non-public entity valued by a broker quote or vendor price. |
| †† | Represents security at $0 value as of December 31, 2014. |
None of the unobservable inputs, individually or collectively, had a material impact on the Fund(s), other than those disclosed below.
The Small Cap Growth Equity Fund fair values certain of its Level 3 investments using market approach such as Comparable Company valuation, acquisition cost, and any observed secondary transactions. These investments are generally privately held investments, but may include defaulted securities and new debt issuances. There may not be a secondary market, and/or there are a limited number of investors. The determination to fair value such investments at any of the above methodologies is based upon factors consistent with the principles of fair value measurement that are reasonably available to the Valuation Committee. Valuations are reviewed utilizing available market information to determine if the carrying value should be adjusted. Such market data may include, but is not limited to, observations of the trading multiples of public companies considered comparable to the private companies being valued, financial or operational information released by the company, and/or news or corporate events that affect the investment, also referred to as enterprise value (EV) to earnings before interest, taxes, depreciation and amortization (EBITDA) ratios. Valuations may be adjusted to account for company-specific issues, the lack of liquidity inherent in a nonpublic investment and the fact that comparable public companies are not identical to the investments being fair valued by the Fund. All market variables are assessed on a regular frequency and calibrated as necessary.
| | | | | | | | | | | | |
| Small Cap Growth Equity Fund | | Fair Value
Amount | | | Valuation Technique | | Unobservable Input Description | | Value/
Weighted
Average
Range | |
| Common stock — $240,155 | | | | | | | | | | | | |
Dropbox Inc. | | $ | 199,970 | | | Market Approach | | Secondary Market Transaction | | $ | 19.10 | |
Telogis | | | 40,185 | | | Market Approach | | EV/Multiple | | | 2.86 | |
| | | | | | | | Discount for Lack of Marketability | | | 10% | |
| Preferred stock — $3,653,969 | | | | | | | | | | | | |
Veracode, Inc | | | 228,937 | | | Market Approach | | EV/Multiple | | | 7.58 | |
| | | | | | | | Discount for Lack of Marketability | | | 10% | |
Mobileye NV | | | 2,246,030 | | | Market Approach | | Discount for Lack of Marketability | | | 5% | |
Cloudera Inc. | | | 398,244 | | | Market Approach | | Secondary Market Transaction | | $ | 33.00 | |
Docusign Series E | | | 137,560 | | | Market Approach | | EV/Multiple | | | 8.21 | |
| | | | | | | | Discount for Lack of Marketability | | | 10% | |
Docusign Series D | | | 5,317 | | | Market Approach | | EV/Multiple | | | 8.21 | |
| | | | | | | | Discount for Lack of Marketability | | | 10% | |
Docusign Series B | | | 7,415 | | | Market Approach | | EV/Multiple | | | 8.21 | |
| | | | | | | | Discount for Lack of Marketability | | | 10% | |
Docusign Series B1 | | | 2,211 | | | Market Approach | | EV/Multiple | | | 8.21 | |
| | | | | | | | Discount for Lack of Marketability | | | 10% | |
191
Notes to Financial Statements (Continued)
| | | | | | | | | | | | |
| Small Cap Growth Equity Fund | | Fair Value
Amount | | | Valuation Technique | | Unobservable Input Description | | Value/
Weighted
Average
Range | |
| Preferred stock (Continued) | | | | | | | | | | | | |
Telogis | | $ | 438,895 | | | Market Approach | | EV/Multiple | | | 2.86 | |
| | | | | | | | Discount for Lack of Marketability | | | 10% | |
NUTANIX, Inc. | | | 189,360 | | | Cost | | Acquisition Cost | | $ | 13.40 | |
| | | | | | | | | | | | |
| | $ | 3,894,124 | | | | | | | | | |
| | | | | | | | | | | | |
Derivative Instruments
Derivatives are financial instruments whose values are based on the values of one or more indicators, such as a security, asset, currency, interest rate, or index. Derivative transactions can create investment leverage and may be highly volatile. Gains or losses from derivatives can be substantially greater than the derivatives original cost and can sometimes be unlimited. A Fund may not be able to close out a derivative transaction at a favorable time or price. For those Funds that held derivatives during the year ended December 31, 2014, the following table shows how the Fund used these types of derivatives during the period (marked with an “A”), as well as additional uses, if any, it may have for them in the future (marked with an “M”).
| | | | | | | | | | | | | | | | | | |
Type of Derivative and Objective for Use | | Equity
Income
Fund | | Equity
Index
Fund | | Foreign
Fund | | Global
Fund | | Growth &
Income
Fund | | International
Equity
Fund | | Managed
Volatility
Fund | | Mid Cap
Value
Fund | | Total
Return
Bond
Fund |
Foreign Currency Exchange Transactions* | | | | | | | | | | | | | | | | | | |
Hedging/Risk Management | | | | | | | | | | | | A | | | | A | | A |
Directional Exposures to Currencies | | | | | | | | | | | | | | | | | | A |
| | | | | | | | | | |
Futures Contracts** | | | | | | | | | | | | | | | | | | |
Hedging/Risk Management | | | | | | | | | | | | | | | | | | A |
Duration/Credit Quality Management | | | | | | | | | | | | | | | | | | A |
Substitution for Direct Investment | | | | A | | | | | | | | | | | | | | A |
| | | | | | | | | | |
Interest Rate Swaps*** | | | | | | | | | | | | | | | | | | |
Hedging/Risk Management | | | | | | | | | | | | | | | | | | A |
Duration Management | | | | | | | | | | | | | | | | | | A |
Substitution for Direct Investment | | | | | | | | | | | | | | | | | | A |
| | | | | | | | | | |
Credit Default Swaps (Protection Seller) | | | | | | | | | | | | | | | | | | |
Hedging/Risk Management | | | | | | | | | | | | | | | | | | A |
Duration/Credit Quality Management | | | | | | | | | | | | | | | | | | A |
Income | | | | | | | | | | | | | | | | | | A |
Substitution for Direct Investment | | | | | | | | | | | | | | | | | | A |
| | | | | | | | | | |
Options (Purchased) | | | | | | | | | | | | | | | | | | |
Hedging/Risk Management | | | | | | | | | | | | | | A | | | | |
| | | | | | | | | | |
Options (Written) | | | | | | | | | | | | | | | | | | |
Hedging/Risk Management | | | | | | | | | | | | | | A | | | | A |
Duration/Credit Quality Management | | | | | | | | | | | | | | | | | | A |
Income | | | | | | | | | | | | | | A | | | | A |
| | | | | | | | | | |
Rights and Warrants | | | | | | | | | | | | | | | | | | |
Result of a Corporate Action | | A | | | | A | | A | | A | | A | | | | A | | |
| * | Includes any options purchased or written, futures contracts, forward contracts, and swap agreements, if applicable. |
| ** | Includes any options purchased or written on futures contracts, if applicable. |
| *** | Includes any caps, floors, and collars, and related purchased or written options, if applicable. |
192
Notes to Financial Statements (Continued)
At December 31, 2014, and during the year then ended, the Fund(s) had the following derivatives and transactions in derivatives, grouped into the indicated risk categories:
| | | | | | | | | | | | | | | | | | | | |
| | | Credit
Risk | | | Equity
Risk | | | Foreign
Exchange
Risk | | | Interest
Rate
Risk | | | Total | |
| Equity Income Fund | | | | | | | | | | | | | | | | | | | | |
| Realized Gain (Loss)# | | | | | | | | | | | | | | | | | | | | |
Rights | | $ | - | | | $ | 2,219 | | | $ | - | | | $ | - | | | $ | 2,219 | |
| | | | | | | | | | | | | | | | | | | | |
Number of Contracts, Notional Amounts or
Shares/Units† | | | | | | | | | | | | | | | | | | | | |
Rights | | | - | | | | 155,467 | | | | - | | | | - | | | | 155,467 | |
| | | | | |
| Equity Index Fund | | | | | | | | | | | | | | | | | | | | |
| Asset Derivatives | | | | | | | | | | | | | | | | | | | | |
Futures Contracts^^ | | $ | - | | | $ | 142,074 | | | $ | - | | | $ | - | | | $ | 142,074 | |
| | | | | | | | | | | | | | | | | | | | |
| Realized Gain (Loss)# | | | | | | | | | | | | | | | | | | | | |
Futures Contracts | | $ | - | | | $ | 884,765 | | | $ | - | | | $ | - | | | $ | 884,765 | |
| | | | | | | | | | | | | | | | | | | | |
| Change in Appreciation (Depreciation)## | | | | | | | | | | | | | | | | | | | | |
Futures Contracts | | $ | - | | | $ | (195,993 | ) | | $ | - | | | $ | - | | | $ | (195,993 | ) |
| | | | | | | | | | | | | | | | | | | | |
Number of Contracts, Notional Amounts or
Shares/Units† | | | | | | | | | | | | | | | | | | | | |
Futures Contracts | | | - | | | | 77 | | | | - | | | | - | | | | 77 | |
| | | | | |
| Foreign Fund | | | | | | | | | | | | | | | | | | | | |
| Asset Derivatives | | | | | | | | | | | | | | | | | | | | |
Rights* | | $ | - | | | $ | 36,659 | | | $ | - | | | $ | - | | | $ | 36,659 | |
| | | | | | | | | | | | | | | | | | | | |
| Realized Gain (Loss)# | | | | | | | | | | | | | | | | | | | | |
Rights | | $ | - | | | $ | 4,085 | | | $ | - | | | $ | - | | | $ | 4,085 | |
| | | | | | | | | | | | | | | | | | | | |
| Change in Appreciation (Depreciation)## | | | | | | | | | | | | | | | | | | | | |
Rights | | $ | - | | | $ | (6,216 | ) | | $ | - | | | $ | - | | | $ | (6,216 | ) |
| | | | | | | | | | | | | | | | | | | | |
Number of Contracts, Notional Amounts or
Shares/Units† | | | | | | | | | | | | | | | | | | | | |
Rights | | | - | | | | 95,037 | | | | - | | | | - | | | | 95,037 | |
| | | | | |
| Global Fund | | | | | | | | | | | | | | | | | | | | |
| Realized Gain (Loss)# | | | | | | | | | | | | | | | | | | | | |
Rights | | $ | - | | | $ | 244 | | | $ | - | | | $ | - | | | $ | 244 | |
| | | | | | | | | | | | | | | | | | | | |
Number of Contracts, Notional Amounts or
Shares/Units† | | | | | | | | | | | | | | | | | | | | |
Rights | | | - | | | | 0 | ** | | | - | | | | - | | | | 0 | |
| | | | | |
| Growth & Income Fund | | | | | | | | | | | | | | | | | | | | |
| Realized Gain (Loss)# | | | | | | | | | | | | | | | | | | | | |
Rights | | $ | - | | | $ | 174 | | | $ | - | | | $ | - | | | $ | 174 | |
| | | | | | | | | | | | | | | | | | | | |
Number of Contracts, Notional Amounts or
Shares/Units† | | | | | | | | | | | | | | | | | | | | |
Rights | | | - | | | | 0 | ** | | | - | | | | - | | | | 0 | |
193
Notes to Financial Statements (Continued)
| | | | | | | | | | | | | | | | | | | | |
| | | Credit
Risk | | | Equity
Risk | | | Foreign
Exchange
Risk | | | Interest
Rate
Risk | | | Total | |
| International Equity Fund | | | | | | | | | | | | | | | | | | | | |
| Asset Derivatives | | | | | | | | | | | | | | | | | | | | |
Forward Contracts* | | $ | - | | | $ | - | | | $ | 573,315 | | | $ | - | | | $ | 573,315 | |
| | | | | | | | | | | | | | | | | | | | |
| Liability Derivatives | | | | | | | | | | | | | | | | | | | | |
Forward Contracts^ | | $ | - | | | $ | - | | | $ | (65,005 | ) | | $ | - | | | $ | (65,005 | ) |
| | | | | | | | | | | | | | | | | | | | |
| Realized Gain (Loss)# | | | | | | | | | | | | | | | | | | | | |
Forward Contracts | | $ | - | | | $ | - | | | $ | 375,575 | | | $ | - | | | $ | 375,575 | |
Rights | | | - | | | | 419 | | | | - | | | | - | | | | 419 | |
| | | | | | | | | | | | | | | | | | | | |
Total Realized Gain (Loss) | | $ | - | | | $ | 419 | | | $ | 375,575 | | | $ | - | | | $ | 375,994 | |
| | | | | | | | | | | | | | | | | | | | |
| Change in Appreciation (Depreciation)## | | | | | | | | | | | | | | | | | | | | |
Forward Contracts | | $ | - | | | $ | - | | | $ | 508,310 | | | $ | - | | | $ | 508,310 | |
| | | | | | | | | | | | | | | | | | | | |
Number of Contracts Notional Amounts or
Shares/Units† | | | | | | | | | | | | | | | | | | | | |
Forward Contracts | | $ | - | | | $ | - | | | $ | 11,246,208 | | | $ | - | | | $ | 11,246,208 | |
Rights | | | - | | | | 0 | ** | | | - | | | | - | | | | 0 | |
| | | | | |
| Managed Volatility Fund | | | | | | | | | | | | | | | | | | | | |
| Asset Derivatives | | | | | | | | | | | | | | | | | | | | |
Purchased Options* | | $ | - | | | $ | 1,447,676 | | | $ | - | | | $ | - | | | $ | 1,447,676 | |
| | | | | | | | | | | | | | | | | | | | |
| Liability Derivatives | | | | | | | | | | | | | | | | | | | | |
Written Options^ | | $ | - | | | $ | (8,238,080 | ) | | $ | - | | | $ | - | | | $ | (8,238,080 | ) |
| | | | | | | | | | | | | | | | | | | | |
| Realized Gain (Loss)# | | | | | | | | | | | | | | | | | | | | |
Purchased Options | | $ | - | | | $ | (6,646,664 | ) | | $ | - | | | $ | - | | | $ | (6,646,664 | ) |
Written Options | | | - | | | | (23,964,700 | ) | | | - | | | | - | | | | (23,964,700 | ) |
| | | | | | | | | | | | | | | | | | | | |
Total Realized Gain (Loss) | | $ | - | | | $ | (30,611,364 | ) | | $ | - | | | $ | - | | | $ | (30,611,364 | ) |
| | | | | | | | | | | | | | | | | | | | |
| Change in Appreciation (Depreciation)## | | | | | | | | | | | | | | | | | | | | |
Purchased Options | | $ | - | | | $ | (220,420 | ) | | $ | - | | | $ | - | | | $ | (220,420 | ) |
Written Options | | | - | | | | 2,899,063 | | | | - | | | | - | | | | 2,899,063 | |
| | | | | | | | | | | | | | | | | | | | |
Total Change in Appreciation (Depreciation) | | $ | - | | | $ | 2,678,643 | | | $ | - | | | $ | - | | | $ | 2,678,643 | |
| | | | | | | | | | | | | | | | | | | | |
| Number of Contracts, Notional Amounts or Shares/Units† | | | | | | | | | | | | | | | | | | | | |
Purchased Options | | | - | | | | 1,693 | | | | - | | | | - | | | | 1,693 | |
Written Options | | | - | | | | 1,700 | | | | - | | | | - | | | | 1,700 | |
| | | | | |
| Mid Cap Value Fund | | | | | | | | | | | | | | | | | | | | |
| Asset Derivatives | | | | | | | | | | | | | | | | | | | | |
Forward Contracts* | | $ | - | | | $ | - | | | $ | 85,196 | | | $ | - | | | $ | 85,196 | |
| | | | | | | | | | | | | | | | | | | | |
| Liability Derivatives | | | | | | | | | | | | | | | | | | | | |
Forward Contracts^ | | $ | - | | | $ | - | | | $ | (4,455 | ) | | $ | - | | | $ | (4,455 | ) |
| | | | | | | | | | | | | | | | | | | | |
| Realized Gain (Loss)# | | | | | | | | | | | | | | | | | | | | |
Forward Contracts | | $ | - | | | $ | - | | | $ | 1,883,273 | | | $ | - | | | $ | 1,883,273 | |
Rights | | | - | | | | 12 | | | | - | | | | - | | | | 12 | |
| | | | | | | | | | | | | | | | | | | | |
Total Realized Gain (Loss) | | $ | - | | | $ | 12 | | | $ | 1,883,273 | | | $ | - | | | $ | 1,883,285 | |
| | | | | | | | | | | | | | | | | | | | |
194
Notes to Financial Statements (Continued)
| | | | | | | | | | | | | | | | | | | | |
| | | Credit
Risk | | | Equity
Risk | | | Foreign
Exchange
Risk | | | Interest Rate
Risk | | | Total | |
| Mid Cap Value Fund (Continued) | | | | | | | | | | | | | | | | | | | | |
| Change in Appreciation (Depreciation)## | | | | | | | | | | | | | | | | | | | | |
Forward Contracts | | $ | - | | | $ | - | | | $ | 205,898 | | | $ | - | | | $ | 205,898 | |
| | | | | | | | | | | | | | | | | | | | |
Number of Contracts Notional Amounts or
Shares/Units† | | | | | | | | | | | | | | | | | | | | |
Forward Contracts | | $ | - | | | $ | - | | | $ | 22,980,428 | | | $ | - | | | $ | 22,980,428 | |
Rights | | | - | | | | 0 | ** | | | - | | | | - | | | | 0 | |
| | | | | |
| Total Return Bond Fund | | | | | | | | | | | | | | | | | | | | |
| Asset Derivatives | | | | | | | | | | | | | | | | | | | | |
Forward Contracts* | | $ | - | | | $ | - | | | $ | 2,811,637 | | | $ | - | | | $ | 2,811,637 | |
| | | | | | | | | | | | | | | | | | | | |
| Liability Derivatives | | | | | | | | | | | | | | | | | | | | |
Forward Contracts^ | | $ | - | | | $ | - | | | $ | (2,301,512 | ) | | $ | - | | | $ | (2,301,512 | ) |
| | | | | | | | | | | | | | | | | | | | |
| Realized Gain (Loss)# | | | | | | | | | | | | | | | | | | | | |
Forward Contracts | | $ | - | | | $ | - | | | $ | 9,915,687 | | | $ | - | | | $ | 9,915,687 | |
Futures Contracts | | | - | | | | - | | | | - | | | | 5,713,755 | | | | 5,713,755 | |
Swap Agreements | | | 984,889 | | | | - | | | | - | | | | (1,978,240 | ) | | | (993,351 | ) |
Written Options | | | - | | | | - | | | | 31,108 | | | | 660,225 | | | | 691,333 | |
| | | | | | | | | | | | | | | | | | | | |
Total Realized Gain (Loss) | | $ | 984,889 | | | $ | - | | | $ | 9,946,795 | | | $ | 4,395,740 | | | $ | 15,327,424 | |
| | | | | | | | | | | | | | | | | | | | |
| Change in Appreciation (Depreciation)## | | | | | | | | | | | | | | | | | | | | |
Forward Contracts | | $ | - | | | $ | - | | | $ | 1,400,703 | | | $ | - | | | $ | 1,400,703 | |
Futures Contracts | | | - | | | | - | | | | - | | | | 453,439 | | | | 453,439 | |
Swap Agreements | | | (230,127 | ) | | | - | | | | - | | | | (2,083,709 | ) | | | (2,313,836 | ) |
Written Options | | | (396 | ) | | | - | | | | - | | | | (47,911 | ) | | | (48,307 | ) |
| | | | | | | | | | | | | | | | | | | | |
Total Change in Appreciation (Depreciation) | | $ | (230,523 | ) | | $ | - | | | $ | 1,400,703 | | | $ | (1,678,181 | ) | | $ | (508,001 | ) |
| | | | | | | | | | | | | | | | | | | | |
Number of Contracts Notional Amounts or Shares/Units† | | | | | | | | | | | | | | | | | | | | |
Forward Contracts | | $ | - | | | $ | - | | | $ | 229,180,141 | | | $ | - | | | $ | 229,180,141 | |
Futures Contracts | | | - | | | | - | | | | - | | | | 2,769 | | | | 2,769 | |
Swap Agreements | | $ | 37,046,182 | | | $ | - | | | $ | - | | | $ | 279,527,273 | | | $ | 316,573,455 | |
Written Options | | | - | | | | - | | | | 3,275,000 | | | | 49,400,014 | | | | 52,675,014 | |
| * | Statements of Assets and Liabilities location: Investments, at value, Receivables from: open forward foreign currency contracts. |
| ^ | Statements of Assets and Liabilities location: Payables for: open forward foreign currency contracts or written options outstanding, at value, as applicable. |
| ^^ | Cumulative appreciation (depreciation) on futures contracts is reported in “Futures Contracts” below. Only current day’s variation margin, if any, is reported within the Statements of Assets and Liabilities. |
| # | Statements of Operations location: Amounts are included in net realized gain (loss) on: investment transactions, futures contracts, written options, swap agreements, or foreign currency transactions, as applicable. |
| ## | Statements of Operations location: Amounts are included in net change in unrealized appreciation (depreciation) on: investment transactions, futures contracts, written options, swap agreements, or translation of assets and liabilities in foreign currencies, as applicable. |
| † | Amount(s) disclosed represent average number of contracts for futures contracts, notional amounts for forward contracts and swap agreements, or shares/units outstanding for written options, purchased options, and rights, which is indicative of volume of this derivative type, for the months that the Fund held such derivatives during the year ended December 31, 2014. |
| ** | Shares are less than 0.05. |
195
Notes to Financial Statements (Continued)
The following table presents the Funds’ derivative assets by counterparty net of amounts available for offset under a master netting agreement (“MNA”), or similar agreement, and net of the related collateral received by the Fund(s) as of December 31, 2014.
| | | | | | | | | | | | | | | | | | |
| | | Counterparty | | Derivative
Assets Subject
to a MNA by
Counterparty† | | | Financial
Instruments
Available for Offset | | | Collateral
Received*** | | | Net
Amount* | |
| International Equity Fund | | | | | | | | | | | | | | | | |
| | State Street Bank and Trust | | $ | 573,315 | | | $ | (65,005 | ) | | $ | - | | | $ | 508,310 | |
| | | | | | | | | | | | | | | | | | |
| | | | |
| Total Return Bond Fund | | | | | | | | | | | | | | | | |
| | Barclays Bank PLC | | $ | 79,520 | | | $ | (60,920 | ) | | $ | - | | | $ | 18,600 | |
| | Credit Suisse International | | | 317,628 | | | | (207,123 | ) | | | - | | | | 110,505 | |
| | Goldman Sachs Capital | | | 40,417 | | | | (33,372 | ) | | | - | | | | 7,045 | |
| | JP Morgan Chase Bank | | | 2,019,159 | | | | (1,488,199 | ) | | | - | | | | 530,960 | |
| | UBS AG | | | 354,913 | | | | (354,913 | ) | | | - | | | | - | |
| | | | | | | | | | | | | | | | | | |
| | | | $ | 2,811,637 | | | $ | (2,144,527 | ) | | $ | - | | | $ | 667,110 | |
| | | | | | | | | | | | | | | | | | |
The following table presents the Funds’ derivative liabilities by counterparty net of amounts available for offset under a MNA, or similar agreement, and net of the related collateral pledged by the Fund(s) as of December 31, 2014.
| | | | | | | | | | | | | | | | | | |
| | | Counterparty | | Derivative
Liabilities
Subject to a
MNA by
Counterparty† | | | Financial
Instruments
Available for Offset | | | Collateral
Pledged*** | | | Net
Amount** | |
| International Equity Fund | | | | | | | | | | | | | | | | |
| | State Street Bank and Trust | | $ | (65,005 | ) | | $ | 65,005 | | | $ | - | | | $ | - | |
| | | | | | | | | | | | | | | | | | |
| | | | |
| Total Return Bond Fund | | | | | | | | | | | | | | | | |
| | Barclays Bank PLC | | $ | (60,920 | ) | | $ | 60,920 | | | $ | - | | | $ | - | |
| | Credit Suisse International | | | (207,123 | ) | | | 207,123 | | | | - | | | | - | |
| | Goldman Sachs Capital | | | (33,372 | ) | | | 33,372 | | | | - | | | | - | |
| | JP Morgan Chase Bank | | | (1,488,199 | ) | | | 1,488,199 | | | | - | | | | - | |
| | UBS AG | | | (511,898 | ) | | | 354,913 | | | | - | | | | (156,985 | ) |
| | | | | | | | | | | | | | | | | | |
| | | | $ | (2,301,512 | ) | | $ | 2,144,527 | | | $ | - | | | $ | (156,985 | ) |
| | | | | | | | | | | | | | | | | | |
| * | Represents the net amount receivable from the counterparty in the event of default. |
| ** | Represents the net amount payable to the counterparty in the event of default. |
| *** | The amount presented here may be less than the total amount of collateral received/pledged as the net amount of derivative assets and liabilities for a counterparty cannot be less than $0. |
| † | The amount presented here may be less than the total amount shown in the Statement of Assets and Liabilities as some derivatives held by the counterparty are not covered within the master netting agreements. |
Such agreements typically permit a single net payment in the event of default, including the bankruptcy or insolvency of the counterparty. Typically, the Fund(s) and counterparties are not permitted to sell, re-pledge, or use the collateral they receive.
Further details regarding the derivatives and other investments held by the Fund(s) during the year ended December 31, 2014, are discussed below.
196
Notes to Financial Statements (Continued)
Foreign Currency Exchange Transactions
A Fund may engage in foreign currency exchange transactions for hedging purposes in order to protect against uncertainty in the level of future foreign currency exchange rates, or for other, non-hedging purposes.
A Fund may enter into foreign currency exchange transactions, including foreign currency forward contracts. These contracts call for the Fund to deliver in the future an amount of one currency in return for an amount of another currency, at an exchange rate determined at the time the contract is entered into. Forward contracts are private contractual arrangements and a Fund is subject to the risk that its counterparty will not, or will not be able to, perform its obligations. This type of arrangement may require the Fund to post margin. A Fund may enter into foreign currency exchange transactions in order to hedge against changes in the values of the assets or liabilities denominated in one or more foreign currencies, or otherwise to increase or reduce a Fund’s exposure to various foreign currencies. The use of foreign currency exchange transactions may create investment leverage.
Whenever a Fund enters into a foreign currency exchange transaction, it is subject to the risk that the value of the transaction will move in a direction unfavorable to it. When the Fund uses the transactions for hedging purposes, it is likely that the Fund will have an asset or liability that will offset any loss (or gain) on the transactions, at least in part. If a Fund enters into foreign currency exchange transactions other than for hedging purposes (for example, seeking to profit from an anticipated change in the values of currencies by creating directional exposures in the portfolio with respect to one or more currencies), it will generally be subject to the same risks, but is less likely to have assets or liabilities that will offset any losses on the transactions. There can be no assurance that a Fund will be able to terminate any foreign currency exchange transaction prior to its maturity in order to limit its loss on the transaction.
Forward foreign currency contracts are marked to market daily and the change in their value is recorded by the Funds as an unrealized gain or loss. Forward foreign currency contracts are valued at the settlement price established through dealers or other market sources on the day which they are traded. When a forward foreign currency contract is extinguished, through delivery or offset by entering into another forward foreign currency contract, the Funds record a realized gain or loss equal to the difference between the value of the contract at the time it was opened and the value of the contract at the time it was extinguished or offset. The notional or contractual amounts of these instruments do not necessarily represent the amounts potentially subject to risk. The measurement of the risk associated with these instruments is meaningful only when all related and offsetting transactions and counterparty risks are considered.
The Fund(s) listed in the following table had open forward foreign currency contracts at December 31, 2014. A Fund’s current exposure to a counterparty is the unrealized appreciation on the contract.
| | | | | | | | | | | | | | | | |
| | | | | | Counterparty | | Settlement
Date | | In
Exchange
for | | | Unrealized
Appreciation/
(Depreciation) | |
| International Equity Fund | | | | | | | | | | |
| Contracts to Deliver | | | | | | | | | | | | | |
| AUD | | | 2,205,000 | | | State Street Bank and Trust | | 06/17/15 | | $ | 1,970,961 | | | $ | 191,163 | |
| CHF | | | 5,442,000 | | | State Street Bank and Trust | | 09/16/15 | | | 5,641,717 | | | | 135,185 | |
| SEK | | | 11,969,000 | | | State Street Bank and Trust | | 03/18/15 | | | 1,782,735 | | | | 246,967 | |
| | | | | | | | | | | | | | | | |
| | | | | | | | | | $ | 9,395,413 | | | $ | 573,315 | |
| | | | | | | | | | | | | | | | |
| Contracts to Buy | | | | | | | | | | | | | |
| SEK | | | 6,293,000 | | | State Street Bank and Trust | | 03/18/15 | | $ | 853,258 | | | $ | (45,789 | ) |
| AUD | | | 976,000 | | | State Street Bank and Trust | | 06/17/15 | | | 807,009 | | | | (19,216 | ) |
| | | | | | | | | | | | | | | | |
| | | | | | | | | | $ | 1,660,267 | | | $ | (65,005 | ) |
| | | | | | | | | | | | | | | | |
197
Notes to Financial Statements (Continued)
| | | | | | | | | | | | | | | | |
| | | | | | Counterparty | | Settlement
Date | | In Exchange
for | | | Unrealized
Appreciation/
(Depreciation) | |
| Mid Cap Value Fund | | | | | | | | | | | | | |
| Contracts to Deliver | | | | | | | | | | | | | |
| GBP | | | 1,061,478 | | | Credit Suisse International | | 01/30/15 | | $ | 1,655,974 | | | $ | 1,880 | |
| | | | | | | | | | | | | | | | |
| | | | | |
| CAD | | | 10,286,246 | | | JP Morgan Chase Bank | | 01/30/15 | | | 8,843,963 | | | | (4,455 | ) |
| | | | | | | | | | | | | | | | |
| | | | | |
| EUR | | | 6,517,452 | | | UBS AG | | 01/30/15 | | | 7,971,862 | | | | 83,316 | |
| | | | | | | | | | | | | | | | |
| | | | | | | | | | $ | 18,471,799 | | | $ | 80,741 | |
| | | | | | | | | | | | | | | | |
| | | |
| Total Return Bond Fund | | | | | | | | | | |
| Contracts to Buy | | | | | | | | | | | | | |
| AUD | | | 2,330,000 | | | Barclays Bank PLC | | 01/05/15 | | $ | 1,963,132 | | | $ | (60,920 | ) |
| | | | | | | | | | | | | | | | |
| | | | | |
| EUR | | | 3,531,000 | | | Credit Suisse International | | 01/05/15 | | | 4,386,624 | | | | (113,937 | ) |
| JPY | | | 2,152,200,000 | | | Credit Suisse International | | 01/05/15 | | | 18,061,127 | | | | (93,186 | ) |
| | | | | | | | | | | | | | | | |
| | | | | | | | | | | 22,447,751 | | | | (207,123 | ) |
| | | | | | | | | | | | | | | | |
| | | | | |
| EUR | | | 1,196,000 | | | Goldman Sachs Capital | | 01/05/15 | | | 1,480,592 | | | | (33,372 | ) |
| | | | | | | | | | | | | | | | |
| | | | | |
| BRL | | | 11,000,000 | | | JP Morgan Chase Bank | | 01/05/15 | | | 4,185,772 | | | | (47,633 | ) |
| EUR | | | 47,294,000 | | | JP Morgan Chase Bank | | 01/05/15 | | | 58,668,680 | | | | (1,440,566 | ) |
| | | | | | | | | | | | | | | | |
| | | | | | | | | | | 62,854,452 | | | | (1,488,199 | ) |
| | | | | | | | | | | | | | | | |
| | | | | |
| BRL | | | 11,000,000 | | | UBS AG | | 01/05/15 | | | 4,591,943 | | | | (453,805 | ) |
| MXN | | | 37,177,723 | | | UBS AG | | 01/08/15 | | | 2,577,517 | | | | (58,093 | ) |
| | | | | | | | | | | | | | | | |
| | | | | | | | | | | 7,169,460 | | | | (511,898 | ) |
| | | | | | | | | | | | | | | | |
| | | | | | | | | | $ | 95,915,387 | | | $ | (2,301,512 | ) |
| | | | | | | | | | | | | | | | |
| Contracts to Deliver | | | | | | | | | | | | | |
| AUD | | | 2,330,000 | | | Barclays Bank PLC | | 01/05/15 | | $ | 1,981,732 | | | $ | 79,520 | |
| | | | | | | | | | | | | | | | |
| | | | | |
| EUR | | | 3,531,000 | | | Credit Suisse International | | 01/05/15 | | | 4,371,060 | | | | 98,373 | |
| JPY | | | 2,152,200,000 | | | Credit Suisse International | | 01/05/15 | | | 18,187,197 | | | | 219,255 | |
| | | | | | | | | | | | | | | | |
| | | | | | | | | | | 22,558,257 | | | | 317,628 | |
| | | | | | | | | | | | | | | | |
| | | | | |
| EUR | | | 1,196,000 | | | Goldman Sachs Capital | | 01/05/15 | | | 1,487,638 | | | | 40,417 | |
| | | | | | | | | | | | | | | | |
| | | | | |
| BRL | | | 11,000,000 | | | JP Morgan Chase Bank | | 01/05/15 | | | 4,732,811 | | | | 594,673 | |
| EUR | | | 47,294,000 | | | JP Morgan Chase Bank | | 01/05/15 | | | 58,652,600 | | | | 1,424,486 | |
| | | | | | | | | | | | | | | | |
| | | | | | | | | | | 63,385,411 | | | | 2,019,159 | |
| | | | | | | | | | | | | | | | |
| | | | | |
| BRL | | | 11,000,000 | | | UBS AG | | 01/05/15 | | | 4,188,880 | | | | 50,741 | |
| MXN | | | 37,177,723 | | | UBS AG | | 01/08/15 | | | 2,823,596 | | | | 304,172 | |
| | | | | | | | | | | | | | | | |
| | | | | | | | | | | 7,012,476 | | | | 354,913 | |
| | | | | | | | | | | | | | | | |
| | | | | | | | | | $ | 96,425,514 | | | $ | 2,811,637 | |
| | | | | | | | | | | | | | | | |
198
Notes to Financial Statements (Continued)
| | | | | | |
AUD Australian Dollar | | CHF Swiss Franc | | JPY Japanese Yen | | |
BRL Brazilian Real | | EUR Euro | | MXN Mexican Peso | | |
CAD Canadian Dollar | | GBP British Pound | | SEK Swedish Krona | | |
Futures Contracts
A Fund may seek to manage a variety of different risks, such as interest rate risk, equity price risk, and currency risk, through the use of futures contracts. A Fund may use interest rate futures contracts to adjust the interest rate sensitivity (duration) of its portfolio or the credit exposure of the portfolio. Interest rate futures contracts obligate the long or short holder to take or make delivery of a specified quantity of a financial instrument, such as a specific fixed-income security, during a specified future period at a specified price. A Fund may use index futures to hedge against broad market risks to its portfolio or to gain broad market exposure when it holds uninvested cash or as an inexpensive substitute for cash investments directly in securities or other assets. Securities index futures contracts are contracts to buy or sell units of a securities index at a specified future date at a price agreed upon when the contract is made and are settled in cash. Positions in futures may be closed out only on an exchange or board of trade which provides a secondary market for such futures. Because futures contracts are exchange-traded, they typically have minimal exposure to counterparty risk.
Parties to a futures contract are not required to post the entire notional amount of the contract, but rather a small percentage of that amount (by way of margin), both at the time they enter into futures transactions, and then on a daily basis if their positions decline in value; as a result, futures contracts are highly leveraged. Such payments are known as variation margin and are recorded by the Funds as unrealized gains or losses. Because futures markets are highly leveraged, they can be extremely volatile, and there can be no assurance that the pricing of a futures contract will correlate precisely with the pricing of the asset or index underlying it or the asset or liability of the Fund that is the subject of the hedge. It may not always be possible for a Fund to enter into a closing transaction with respect to a futures contract it has entered into, at a favorable time or price. When a Fund enters into a futures transaction, it is subject to the risk that the value of the futures contract will move in a direction unfavorable to it. When the Fund uses futures contracts for hedging purposes, it is likely that the Fund will have an asset or liability that will offset any loss (or gain) on the transactions, at least in part.
When a futures contract is closed, the Fund records a realized gain or loss equal to the difference between the value of the contract at the time it was opened and the value at the time it was closed. Futures contracts are valued at the settlement price established each day by the board of trade or exchange on which they are traded.
The Fund(s) listed in the following table had open futures contracts at December 31, 2014:
| | | | | | | | | | | | | | | | |
| | | Expiration
Date | | | Number of
Contracts | | | Notional
Amount | | | Net Unrealized
Appreciation/
(Depreciation) | |
| Equity Index Fund | | | | | | | | | | | | | | | | |
| Futures Contracts — Long | | | | | | | | | |
S&P 500 E Mini Index | | | 03/20/15 | | | | 74 | | | $ | 7,593,880 | | | $ | 142,074 | |
| | | | | | | | | | | | | | | | |
Swap Agreements
Swap agreements are typically two-party contracts entered into primarily by institutional investors. In a standard “swap” transaction, two parties agree to exchange the returns (or differentials in rates of return) earned or realized on particular predetermined investments or instruments, which may be adjusted for an interest factor. The gross returns to be exchanged or “swapped” between the parties are generally calculated with respect to a “notional amount,” (i.e., the return on or increase in value of a particular dollar amount invested at a particular interest rate or in a “basket” of securities representing a particular index).
199
Notes to Financial Statements (Continued)
Interest Rate Swaps. When a Fund enters into an interest rate swap, it typically agrees to make payments to its counterparty based on a specified long- or short-term interest rate, and will receive payments from its counterparty based on another interest rate. Other forms of interest rate swap agreements include interest rate caps, under which, in return for a specified payment stream, one party agrees to make payments to the other to the extent that interest rates exceed a specified rate, or “cap”; interest rate floors, under which, in return for a specified payment stream, one party agrees to make payments to the other to the extent that interest rates fall below a specified rate, or “floor”; and interest rate collars, under which a party sells a cap and purchases a floor or vice versa in an attempt to protect itself against interest rate movements exceeding given minimum or maximum levels. A Fund may enter into an interest rate swap in order, for example, to hedge against the effect of interest rate changes on the value of specific securities in its portfolio, or to adjust the interest rate sensitivity (duration) or the credit exposure of its portfolio overall, or otherwise as a substitute for a direct investment in debt securities.
Credit Default Swaps. A Fund also may enter into credit default swap transactions, as a “buyer” or “seller” of credit protection. In a credit default swap, one party provides what is in effect insurance against a default or other adverse credit event affecting an issuer of debt securities (typically referred to as a “reference entity”). In general, the buyer of credit protection is obligated to pay the protection seller an upfront amount or a periodic stream of payments over the term of the swap. If a “credit event” occurs, the buyer has the right to deliver to the seller bonds or other obligations of the reference entity (with a value up to the full notional value of the swap), and to receive a payment equal to the par value of the bonds or other obligations. Credit events that would trigger a request that the seller make payment are specific to each credit default swap agreement, but generally include bankruptcy, failure to pay, restructuring, obligation acceleration, obligation default, or repudiation/moratorium. When a Fund buys protection, it may or may not own securities of the reference entity. If it does own securities of the reference entity, the swap serves as a hedge against a decline in the value of the securities due to the occurrence of a credit event involving the issuer of the securities. If the Fund does not own securities of the reference entity, the credit default swap may be seen to create a short position in the reference entity. If a Fund is a buyer and no credit event occurs, the Fund will typically recover nothing under the swap, but will have had to pay the required upfront payment or stream of continuing payments under the swap. When a Fund sells protection under a credit default swap, the position may have the effect of creating leverage in the Fund’s portfolio through the Fund’s indirect long exposure to the issuer or securities on which the swap is written. When a Fund sells protection, it may do so either to earn additional income or to create such a “synthetic” long position.
Whenever a Fund enters into a swap agreement, it takes on counterparty risk — the risk that its counterparty will be unable or unwilling to meet its obligations under the swap agreement. The Fund also takes the risk that the market will move against its position in the swap agreement. In the case of an interest rate swap, the value of the swap may increase or decrease depending on changes in interest rates. In the case of a credit default swap, the swap will become more or less valuable depending on the credit of the issuer of the underlying security, and, if a credit event occurs under a swap where the Fund is the seller of credit protection, the Fund could be required to purchase the security at par value, resulting in a significant loss to the Fund. When the Fund enters into any type of swap for hedging purposes, it is likely that the Fund will have an asset or liability that will offset any loss (or gain) on the swap, at least in part. Swap agreements may be non-transferable or otherwise highly illiquid, and a Fund may not be able to terminate or transfer a swap agreement at any particular time or at an acceptable price.
Swaptions. A Fund may also enter into options on swap agreements (“swaptions”). A swaption is a contract that gives a counterparty the right (but not the obligation) to enter into a new swap agreement or to shorten, extend, cancel, or otherwise modify an existing swap agreement, at some designated future time on specified terms. A Fund may write (sell) and purchase put and call swaptions. Depending on the terms of the particular option agreement, a Fund will generally incur a greater degree of risk when it writes a swaption than it will incur when it purchases a swaption. When a Fund purchases a swaption, it risks losing only the amount of the premium it has paid should it decide to let the option expire unexercised. However, when a Fund writes a swaption, upon exercise of the option the Fund will become obligated according to the terms of the underlying agreement. A Fund may enter into swaptions for the same purposes as swaps. For information regarding the accounting treatment of options, see “Options, Rights, and Warrants” below.
Centrally Cleared Swaps. Certain clearinghouses currently offer clearing for limited types of derivatives transactions, principally certain interest rate swaps, certain index swaps, and credit derivatives. In a cleared derivative transaction, a Fund typically enters into the transaction with a financial institution counterparty, and performance of the transaction is effectively guaranteed by a central clearinghouse, thereby reducing or eliminating the Fund’s exposure to the credit risk of its original counterparty. The Fund will be required to post amounts (“initial margin”) with the clearinghouse or at the instruction of the clearinghouse; the initial
200
Notes to Financial Statements (Continued)
margin required by a clearinghouse may be greater than the initial margin the Fund would be required to post in an uncleared transaction. If cash is deposited as the initial margin, it is shown as collateral on a Fund’s Statement of Assets and Liabilities. Swap agreements are marked-to-market daily and subsequent payments (“variation margin”) are made or received by a Fund depending on whether unrealized gains or losses are incurred. These amounts are reflected as receivables or payables on a Fund’s Statement of Assets and Liabilities (“Variation margin on open derivative instruments”) and as a component of net change in unrealized appreciation/depreciation on a Fund’s Statement of Operations. Only a limited number of transaction types are currently eligible for clearing.
During the term of a swap transaction, changes in the value of the swap are recognized as unrealized gains or losses by marking to market to reflect the market value of the swap. When the swap is terminated, a Fund will record a realized gain or loss equal to the difference, if any, between the proceeds from (or cost of) the closing transaction and a Fund’s basis in the agreement. Upfront swap premium payments paid or received by a Fund, if any, are recorded within the value of the open swap agreement on the Fund’s Statement of Assets and Liabilities and represent payments paid or received upon entering into the swap agreement to compensate for differences between stated terms of the swap agreement and prevailing market conditions (credit spreads, currency exchange rates, and other relevant factors). These upfront payments are recorded as realized gain or loss on the Fund’s Statement of Operations upon termination or maturity of the swap agreement.
During the term of a swap transaction, the periodic net payments can be made for a set period of time or may be triggered by a predetermined credit event. The net periodic payments may be based on a fixed or variable interest rate, the change in market value of a specified security, basket of securities or index, or the return generated by a security. These periodic payments received or made by the Funds are recorded in the accompanying Statements of Operations as realized gains and losses, respectively.
Options, Rights, and Warrants
A Fund may purchase and sell put and call options on securities or an index of securities to enhance investment performance or to protect against changes in market prices. A Fund that invests in debt securities may also purchase and sell put and call options to adjust the interest rate sensitivity of its portfolio or the credit exposure of the portfolio.
Call Options. A call option gives the holder the right to purchase, and obligates the writer to sell, a security at the strike price at any time before the expiration date.
Put Options. A put option gives the holder the right to sell, and obligates the writer to buy, a security at the exercise price at any time before the expiration date.
Writing put and call options. A Fund may write call options on a security it owns, in a “directional” strategy hoping to realize a greater current return through the receipt of premiums. In return for the option premium, the Fund takes the risk that it will have to forego any increase in the value of the security over the strike price. When a Fund has written a call option on a security it does not own, its exposure on such an option is theoretically unlimited. A Fund may enter into closing purchase transactions in order to realize a profit or limit a loss on a previously written call option or, in the case of a call option on a security it owns, to free itself to sell the underlying security or to write another call on the security, or protect a security from being called in an unexpected market rise. Any profits from a closing purchase transaction in the case of a call option on a security a Fund owns may be offset by a decline in the value of the underlying security. Conversely, because increases in the market price of a call option will generally reflect increases in the market price of the underlying security, any loss resulting from a closing purchase transaction relating to a call option on a security a Fund owns is likely to be offset in whole or in part by unrealized appreciation of the underlying security owned by the Fund. A Fund may not be able to close out a call option that it has previously written.
A Fund may write put options in order to enhance its current return by taking a long directional position as to a security or index of securities. By writing a put option, the Fund assumes the risk that it may be required to purchase the underlying security for an exercise price higher than its then current market value, resulting in a potential capital loss unless the security later appreciates in value. A Fund may terminate a put option that it has written before it expires by entering into a closing purchase transaction. Any loss from this transaction may be partially or entirely offset by the premium received on the terminated option. A Fund may not be able to close out a put option that it has previously written.
201
Notes to Financial Statements (Continued)
When a Fund writes a call or put option, an amount equal to the premium received is recorded as a liability. Premiums received from writing options which expire are treated as realized gains. Premiums received from writing options which are exercised or closed are added to the proceeds or offset against the amount paid on the underlying investment to determine the realized gain or loss.
Purchasing put options. A Fund may purchase put options to protect portfolio holdings against a decline in market value of a security or securities held by it. A Fund may also purchase a put option hoping to profit from an anticipated decline in the value of the underlying security. If the Fund holds the security underlying the option, the option premium and any transaction costs will reduce any profit the Fund might have realized had it sold the underlying security instead of buying the put option.
When a Fund purchases an option, it runs the risk that it will lose its entire investment in the option in a relatively short period of time, unless the Fund exercises the option or enters into a closing sale transaction before the option’s expiration. If the price of the underlying security does not fall (in the case of a put) to an extent sufficient to cover the option premium and transaction costs, the Fund will lose part or all of its investment in the option. This contrasts with an investment by a Fund in the underlying security, since the Fund will not realize a loss if the security’s price does not change. Premiums paid for purchasing options that expire are treated as realized losses.
Exchange Traded Options. Exchange traded options purchased or sold by a Fund may be traded on a securities or options exchange or market. Such options typically have minimal exposure to counterparty risk. However, an exchange or market may at times find it necessary to impose restrictions on particular types of options transactions, such as opening transactions. If an underlying security ceases to meet qualifications imposed by the market or the Options Clearing Corporation, new series of options on that security will no longer be opened to replace expiring series, and opening transactions in existing series may be prohibited. Exchange traded options are valued at the last sale price, or if no sales are reported, the last bid price.
OTC Options. OTC options purchased or sold by a Fund are not traded on securities or options exchanges or backed by clearinghouses. Rather, they are entered into directly between a Fund and the counterparty to the option. In the case of an OTC option purchased by the Fund, the value of the option to the Fund will depend on the willingness and ability of the option writer to perform its obligations to the Fund. In addition, OTC options may not be transferable and there may be little or no secondary market for them, so they may be considered illiquid. It may not be possible to enter into closing transactions with respect to OTC options or otherwise to terminate such options, and as a result a Fund may be required to remain obligated on an unfavorable OTC option until its expiration. OTC options are valued using prices supplied by a primary pricing source, selected pursuant to procedures approved by the Trustees.
Rights and Warrants. A Fund may purchase or hold warrants or rights in order to gain exposure to the underlying security without owning the security, including, for example, cases where the Fund hopes to lock in the price today of a security it may wish to purchase in the future. Warrants generally give the holder the right, but not the obligation, to buy a security at a stated price. In order for a warrant to be profitable, the market price of the underlying security must rise sufficiently above the exercise price to cover any premium and transaction costs. Rights may similarly confer on the holder the right to purchase or acquire securities, including through participation in a so-called rights offering. Bonds may be issued with warrants or other rights attached to purchase or acquire equity or other debt securities, typically of the bond issuer. The market prices of bonds with warrants or rights attached to purchase equity securities or bonds may, to some degree, reflect changes in the values of the underlying securities.
When a Fund purchases or otherwise acquires warrants or other rights, it runs the risk that it will lose its entire investment in the warrants or rights, unless the Fund exercises the warrant or right, acquires the underlying securities, or enters into a closing transaction before expiration. If the price of the underlying security does not rise to an extent sufficient to cover any premium and transaction costs, the Fund will lose part or all of its investment. Any premiums or purchase price paid for warrants or other rights that expire are treated as realized losses. Warrants and similar rights differ from options in that they are typically written by the issuer of the security underlying the warrant or right. Although some warrants and rights may be non-transferable, others may be traded over-the-counter or on an exchange.
202
Notes to Financial Statements (Continued)
The Fund(s) listed in the following table had open written option contracts at December 31, 2014:
| | | | | | | | | | | | | | | | |
| | | Units | | | Expiration
Date | | Description | | Premiums
Received | | | Value | |
| Managed Volatility Fund | | | | | | | | | | | | | |
| | | 213 | | | 1/02/15 | | S&P 500 Index Call, Strike 2,060.00 | | $ | 402,037 | | | $ | 170,400 | |
| | | 168 | | | 1/09/15 | | S&P 500 Index Call, Strike 2,090.00 | | | 216,930 | | | | 83,160 | |
| | | 216 | | | 1/17/15 | | S&P 500 Index Call, Strike 2,000.00 | | | 1,197,760 | | | | 1,709,640 | |
| | | 209 | | | 1/17/15 | | S&P 500 Index Call, Strike 2,025.00 | | | 856,377 | | | | 1,109,790 | |
| | | 163 | | | 1/17/15 | | S&P 500 Index Call, Strike 2,050.00 | | | 570,093 | | | | 521,600 | |
| | | 395 | | | 2/20/15 | | S&P 500 Index Call, Strike 2,025.00 | | | 2,592,413 | | | | 2,919,050 | |
| | | 213 | | | 2/20/15 | | S&P 500 Index Call, Strike 2,050.00 | | | 1,000,568 | | | | 1,043,700 | |
| | | 202 | | | 2/20/15 | | S&P 500 Index Call, Strike 2,075.00 | | | 995,695 | | | | 680,740 | |
| | | | | | | | | | | | | | | | |
| | | | | | | | | | $ | 7,831,873 | | | $ | 8,238,080 | |
| | | | | | | | | | | | | | | | |
Transactions in written option contracts during the year ended December 31, 2014, were as follows:
| | | | | | | | |
| | | Number of
Contracts | | | Premiums
Received | |
| Managed Volatility Fund | | | | | | | | |
Options outstanding at December 31, 2013 | | | 1,240 | | | $ | 3,438,700 | |
Options written | | | 20,599 | | | | 59,355,752 | |
Options terminated in closing purchase transactions | | | (19,472 | ) | | | (54,263,909 | ) |
Options expired | | | (588 | ) | | | (698,670 | ) |
| | | | | | | | |
Options outstanding at December 31, 2014 | | | 1,779 | | | $ | 7,831,873 | |
| | | | | | | | |
| Total Return Bond Fund | | | | | | | | |
Options outstanding at December 31, 2013 | | | 85,700,034 | | | $ | 287,308 | |
Options written | | | 166,100,022 | | | | 929,229 | |
Options terminated in closing purchase transactions | | | (71,800,000 | ) | | | (399,535 | ) |
Options expired | | | (153,200,045 | ) | | | (679,560 | ) |
Options exercised | | | (26,800,011 | ) | | | (137,442 | ) |
| | | | | | | | |
Options outstanding at December 31, 2014 | | | - | | | $ | - | |
| | | | | | | | |
Inflation-Indexed Bonds
The Funds may invest in inflation-indexed bonds, which are fixed income securities whose principal value or coupon is periodically adjusted according to the rate of inflation, as measured by the Consumer Price Index for All Urban Consumers (“CPI-U”) (for U.S. Treasury inflation-indexed bonds) or, generally, by a comparable inflation index calculated by the foreign government issuing the inflation-indexed bonds.
If the periodic adjustment rate measuring inflation falls, the principal value of inflation-indexed bonds will be adjusted downward, and consequently the interest payable on these securities (calculated with respect to a smaller principal amount) will be reduced. Repayment of the original bond principal upon maturity (as adjusted for inflation) is guaranteed in the case of U.S. Treasury inflation-indexed bonds, even during a period of deflation. However, the current market value of the bonds is not guaranteed, and will fluctuate. The Funds may also invest in other inflation related bonds which may or may not provide a similar guarantee. If a guarantee of principal is not provided, the adjusted principal value of the bond repaid at maturity may be less than the original principal. Any adjustments to the principal amount of an inflation-indexed bond due to inflation will be reflected as increases or decreases to interest income. Such adjustments may have a significant impact on the Fund’s distributions.
203
Notes to Financial Statements (Continued)
The value of inflation-indexed bonds is generally based on changes in real interest rates, which in turn are tied to the relationship between nominal interest rates and the rate of inflation. Therefore, if nominal interest rates increased at a faster rate than inflation, real interest rates might rise, leading to a decrease in value of inflation-indexed bonds. While the values of these securities are expected to be protected from long-term inflationary trends, short-term increases in inflation may lead to a decline in value. There can be no assurance that the CPI-U or any foreign inflation index will accurately measure the real rate of inflation, or that the rate of inflation in a foreign country will correlate to the rate of inflation in the United States. Additionally, if interest rates rise due to reasons other than inflation, investors in these securities may not be protected to the extent that the increase is not reflected in the bond’s inflation measure.
Bank Loans
Certain of the Funds may invest in bank loans including, for example, corporate loans, loan participations, direct debt, bank debt, and bridge debt. A Fund may invest in a loan by lending money to a borrower directly as part of a syndicate of lenders. In a syndicated loan, the agent that originated and structured the loan typically administers and enforces the loan on behalf of the syndicate. Failure by the agent to fulfill its obligations may delay or adversely affect receipt of payment by a Fund. A Fund may also invest in loans through novations, assignments, and participation interests. In a novation, a Fund typically assumes all of the rights of a lending institution in a loan, including the right to receive payments of principal and interest and other amounts directly from the borrower and to enforce its rights as a lender directly against the borrower. When a Fund takes an assignment of a loan, the Fund acquires some or all of the interest of another lender (or assignee) in the loan. In such cases, the Fund may be required generally to rely upon the assignor to demand payment and enforce rights under the loan. If a Fund acquires a participation in the loan, the Fund purchases an indirect interest in a loan held by a third party and the Fund typically will have a contractual relationship only with the third party loan investor, not with the borrower. As a result, a Fund may have the right to receive payments of principal, interest, and any fees to which it is entitled only from the loan investor selling the participation and only upon receipt by such loan investor of such payments from the borrower. In such cases, a Fund assumes the credit risk of both the borrower and the loan investor selling the participation, and the Fund may be unable to realize some or all of the value of its interest in the loan in the event of the insolvency of the third party.
Changes in the financial condition of the borrower or economic conditions or other circumstances may reduce the capacity of the borrower to make principal and interest payments on such instruments and may lead to defaults. The value of any collateral securing a bank loan may decline after the Fund invests, and there is a risk that the value of the collateral may not be sufficient to cover the amount owed to the Fund.
At December 31, 2014, the Funds had no unfunded loan commitments.
Repurchase Agreements
Each Fund may enter into repurchase agreements with certain banks and broker-dealers whereby a Fund acquires a security for cash and obtains a simultaneous commitment from the seller to repurchase the security at an agreed upon price and date. A Fund, through its custodian, takes possession of the securities collateralizing the repurchase agreement in a segregated account. Repurchase agreements must be fully collateralized at all times, but involve some risk to a Fund if the other party should default on its obligation and the Fund is delayed or prevented from recovering the collateral, or if the Fund is required to return collateral to a borrower at a time when it may realize a loss on the investment of that collateral.
Reverse Repurchase Agreements and Treasury Rolls
Each Fund may enter into reverse repurchase agreements or Treasury rolls with banks and broker-dealers to enhance return. Reverse repurchase agreements involve sales by a Fund of portfolio securities concurrently with an agreement by the Fund to repurchase the same securities at a later date at a fixed price (typically equal to the original sale price plus interest). During the reverse repurchase agreement period, the Fund continues to receive principal and interest payments on the securities and also has the opportunity to earn a return on the purchase price received by it from the counterparty. Similarly, in a Treasury roll transaction, a Fund sells a Treasury security and simultaneously enters into an agreement to repurchase the security from the buyer at a later
204
Notes to Financial Statements (Continued)
date, at the original sale price plus interest. The repurchase price is typically adjusted to provide the Fund the economic benefit of any interest that accrued on the Treasury security during the term of the transaction. The Fund may use the purchase price received by it to earn additional return during the term of the Treasury roll transaction.
Certain agreements have no stated maturity and can be terminated by either party at any time. Interest on the value of the reverse repurchase agreements issued and outstanding is based upon competitive market rates determined at the time of issuance. A Fund may utilize reverse repurchase agreements when it is anticipated that the interest income to be earned from the investment of the proceeds of the transaction is greater than the interest expense of the transaction. Reverse repurchase agreements generally create investment leverage and involve the risk that the market value of the security that a Fund is obligated to repurchase under the agreement may decline below the repurchase price. For financial reporting purposes, cash received in exchange for securities delivered plus accrued interest payments to be made to the counterparty is recorded as a liability in the Statements of Assets and Liabilities at face value including accrued interest. Due to the short term nature of reverse repurchase agreements, face value approximates fair value. Interest payments made by a Fund to the counterparties are recorded as a component of interest expense in the Statements of Operations. In periods of increased demand for a security, a Fund may receive a fee for use of the security by the counterparty, which may result in interest income to the Fund.
Reverse repurchase transactions are entered into by a Fund under a Master Repurchase Agreement (“MRA”), which permits the Fund, under certain circumstances, including an event of default (such as bankruptcy or insolvency), to offset payables and/or receivables under the MRA with collateral held and/or posted to the counterparty and creates one single net payment due to or from the Fund. With reverse repurchase transactions, typically a Fund and the counterparties are permitted to sell, re-pledge, or use the collateral associated with the transaction. However, bankruptcy or insolvency laws of a particular jurisdiction may impose restrictions on or prohibitions against such a right of offset in the event of an MRA counterparty’s bankruptcy or insolvency. Pursuant to the terms of the MRA, a Fund receives or posts securities as collateral with a market value in excess of the repurchase price to be paid or received by the Fund upon the maturity of the transaction. Upon a bankruptcy or insolvency of the MRA counterparty, the Fund is considered an unsecured creditor with respect to excess collateral and, as such, the return of excess collateral may be delayed.
In the event the buyer of securities under an MRA files for bankruptcy or becomes insolvent, a Fund’s use of the proceeds from the sale of its securities may be restricted or forfeited, and the counterparty may fail to return/resell the securities in question to the Fund.
Treasury roll transactions also generally create investment leverage. If the counterparty in such a transaction files for bankruptcy or becomes insolvent, a Fund’s use of the proceeds from the sale of its securities may be restricted or forfeited, and the counterparty may fail to return/resell the securities in question to the Fund.
A Fund accounts for a Treasury roll transaction as a purchase and sale whereby the difference in the sales price and purchase price of the security sold is recorded as a realized gain (loss). If certain criteria are met, these Treasury roll transactions may be considered financing transactions, whereby the difference in the sales price and the future price is recorded as an adjustment to interest income.
The Fund(s) listed in the following table had reverse repurchase transactions during the year ended December 31, 2014:
| | | | |
Total Return Bond Fund | | | | |
Average balance outstanding | | $ | 530,274 | |
Maximum balance outstanding | | $ | 12,015,000 | |
Average interest rate | | | (0.40)% | |
Weighted average maturity | | | 1 day | |
Average balance outstanding was calculated based on daily balances outstanding during the period that the Fund had entered into reverse repurchase transactions.
205
Notes to Financial Statements (Continued)
The Fund(s) listed in the following table had Treasury roll transactions during the year ended December 31, 2014, which were accounted for as financing transactions:
| | | | |
Total Return Bond Fund | | | | |
Average balance outstanding | | $ | 604,238 | |
Weighted average interest rate | | | (0.11)% | |
Average balance outstanding was calculated based on daily balances outstanding during the period that the Fund had entered into Treasury roll transactions.
When-Issued, Delayed-Delivery, Forward Commitment, and To-Be-Announced Transactions
A Fund may enter into when-issued, delayed-delivery, forward commitment, or to-be-announced (“TBA”) transactions (collectively, the “Forward Transactions”) in order to lock in the purchase price of the underlying security, or in order to adjust the interest rate exposure of the Fund’s existing portfolio. In Forward Transactions, a Fund commits to purchase or sell particular securities, with payment and delivery to take place at a future date. In the case of TBA purchase commitments, the unit price and the estimated principal amount are established when the Fund enters into a commitment, with the actual principal amount being within a specified range of the estimate. Although a Fund does not typically pay for the securities in these types of transactions until they are delivered, it immediately assumes the risks of ownership, including the risk of price fluctuation. As a result, each of these types of transactions may create investment leverage in the Fund’s portfolio and increase the volatility of the Fund. If a Fund’s counterparty fails to deliver a security purchased in a Forward Transaction, there may be a loss, and the Fund may have missed an opportunity to make an alternative investment.
These securities are valued on the basis of valuations furnished by a pricing service, selected pursuant to procedures approved by the Trustees, which determines valuations taking into account appropriate factors such as institutional-size trading in similar groups of securities, yield, quality, coupon rate, maturity, type of issue, trading characteristics, and other market data. Securities for which no market quotation is available are valued at fair value in accordance with procedures approved by the Trustees. The Funds record on a daily basis the unrealized appreciation (depreciation) based upon changes in the values of these securities. When a Forward Transaction is closed, the Funds record a realized gain or loss equal to the difference between the value of the transaction at the time it was opened and the value of the transaction at the time it was closed.
Securities Lending
Each Fund may lend its securities; however, lending cannot exceed 33% of the total assets of the Fund taken at current value. The Funds’ securities lending activities are governed by a Securities Lending Agency Agreement (“Lending Agreement”) between each Fund and the lending agent (“agent”). The Lending Agreement authorizes the agent to lend qualifying U.S. and foreign securities held by a Fund to approved borrowers (each a “Borrower”).
Each Fund expects that in connection with any securities on loan, the loan will be secured continuously by collateral consisting of cash or securities adjusted daily to have market value at least equal to the current market value of the securities loaned. The market value of the loaned securities is determined at the close of business of a Fund and any additional collateral is delivered to the Fund the next business day. As with other extensions of credit, the Funds may bear the risk of delay in recovery or even loss of rights in the collateral should the Borrower of the securities fail financially. The Funds receive compensation for lending their securities in the form of a securities loan fee paid by the Borrower, as well as a share of the income earned on investment of the cash collateral received for the loan of securities. At December 31, 2014, Funds’ collateral was equal to or greater than 100% of the market value of securities on loan.
206
Notes to Financial Statements (Continued)
The Funds employ the agent to implement their securities lending program and the agent receives a fee from the Funds for its services. In addition, the Funds may be required to pay a rebate to the Borrower. Accordingly, a Fund’s compensation for lending its securities is reduced by any such fees or rebate paid to the securities lending agent or Borrower, respectively. For the year ended December 31, 2014, the Fund(s) earned securities lending net income as follows:
| | | | | | | | | | | | |
| | | Securities
Lending Gross
Income | | | Securities
Lending Fees
and Expenses | | | Securities
Lending Net
Income | |
Foreign Fund | | $ | 394,444 | | | $ | 79,011 | | | $ | 315,433 | |
Global Fund | | | 95,109 | | | | 25,471 | | | | 69,638 | |
International Equity Fund | | | 10,116 | | | | 5,360 | | | | 4,756 | |
Mid Cap Growth Fund | | | 152,768 | | | | 30,553 | | | | 122,215 | |
Small Cap Growth Equity Fund | | | 178,898 | | | | 35,750 | | | | 143,148 | |
Small Company Value Fund | | | 26,361 | | | | 5,272 | | | | 21,089 | |
Accounting for Investment Transactions
Investment transactions are accounted for on the trade date. Realized gains and losses on sales of investments and unrealized appreciation and depreciation of investments are computed by the specific identification cost method. Proceeds received from litigation, if any, are included in realized gains on investment transactions for any investments that are no longer held in the portfolio and as a reduction in cost for investments that continue to be held in the portfolio. Interest income, adjusted for amortization of discounts and premiums on debt securities, is earned from the settlement date and is recorded on the accrual basis. Dividend income is recorded on the ex-dividend date. Withholding taxes on foreign interest, dividends, and capital gains have been provided for in accordance with the applicable country’s tax rules and rates. Foreign dividend income is recorded on the ex-dividend date or as soon as practicable after the Fund determines the existence of a dividend declaration after exercising reasonable due diligence. Distributions received on securities that represent a return of capital or capital gain are recorded as a reduction of cost of investments and/or as a realized gain. The Funds estimate the components of distributions received that may be considered return of capital distributions or capital gain distributions.
Foreign Currency Translation
The books and records of the Funds are maintained in U.S. dollars. The market values of foreign currencies, foreign securities, and other assets and liabilities denominated in foreign currencies are translated into U.S. dollars at the mean of the buying and selling rates of such currencies against the U.S. dollar at the end of each business day. Purchases and sales of foreign securities and income and expense items are translated at the rates of exchange prevailing on the respective dates of such transactions. The Funds do not isolate that portion of the results of operations arising from changes in the exchange rates from that portion arising from changes in the market prices of securities. Net realized foreign currency gains and losses resulting from changes in exchange rates include foreign currency gains and losses between trade date and settlement date on investment securities transactions, foreign currency transactions, and the difference between the amounts of dividends or interest recorded on the books of the Funds and the amount actually received.
Allocation of Operating Activity
In maintaining the records for the Funds, the income and expense accounts are allocated daily to each class of shares. Investment income and loss, and unrealized and realized gains or losses are prorated among the classes of shares based on the relative net assets of each. Expenses are allocated to each class of shares depending on the nature of the expenditures. Administration and service fees, if any, which are directly attributable to a class of shares, are charged to that class’s operations. Expenses of a Fund not directly attributable to the operations of any specific class of shares of the Fund are prorated among the classes to which the expense relates based on relative net assets.
207
Notes to Financial Statements (Continued)
Foreign Securities
Each of the Foreign Fund and the International Equity Fund invests substantially all of its assets and the Global Fund invests a significant amount of its assets in foreign securities. The other Funds may also invest in foreign securities. Foreign securities, including American Depositary Receipts, are subject to additional risks compared to securities of U.S. issuers, including international trade, currency, political, regulatory, and diplomatic risks. In addition, fluctuations in currency exchange rates may adversely affect the values of foreign securities and the price of a Fund’s shares. Emerging markets securities are subject to greater risks than securities issued in developed foreign markets, including less liquidity, greater price volatility, higher relative rates of inflation, greater political, economic, and social instability, greater custody and operational risks, and greater volatility in currency exchange rates.
Federal Income Tax
It is each Fund’s intent to continue to comply with the provisions of subchapter M of the Internal Revenue Code of 1986, as amended (the “Code”), applicable to a regulated investment company. Under such provisions, the Funds would not be subject to federal income taxes on their ordinary income and net realized capital gains to the extent they are distributed or deemed to have been distributed to their shareholders. Therefore, the Funds have not made any provision for federal income tax.
Dividends and Distributions to Shareholders
Dividends from net investment income and distributions of any net realized capital gains of each Fund are declared and paid annually and at other times as may be required to satisfy tax or regulatory requirements.
Distributions to shareholders are recorded on the ex-dividend date. Income and capital gain distributions are determined in accordance with income tax regulations, which may differ from generally accepted accounting principles. As a result, net investment income and net realized capital gains on investment transactions for a reporting period may differ significantly from distributions during such period.
| 3. | | Advisory Fees and Other Transactions |
Investment Advisory Fees and Investment Subadvisers
MML Investment Advisers, LLC (“MML Advisers”), a wholly-owned subsidiary of MassMutual, serves as investment adviser to each Fund. Under the investment advisory agreements between MML Advisers and the Trust on behalf of each Fund, MML Advisers is responsible for providing investment management services for each Fund. In return for these services, MML Advisers receives advisory fees, based upon each Fund’s average daily net assets, at the annual rates shown in the following table.
MML Advisers has also entered into investment subadvisory agreements for each Fund with the unaffiliated investment subadviser(s) shown in the following table. MML Advisers pays a subadvisory fee to each of these subadvisers based upon the aggregate net assets under management which include (1) the average daily net assets of the specified Fund which it manages, and, if applicable, (2) the average daily net assets of all other Funds or accounts of MML Advisers or its affiliates for which the subadviser provides subadvisory services and which have substantially the same investment objective, policies, and investment strategies.
The Funds’ subadvisory fees are paid by MML Advisers out of the advisory fees.
| | | | |
Fund | | Investment Advisory Fee | | Investment Subadviser(s) |
Blue Chip Growth Fund | | 0.75% on the first $400 million; and | | T. Rowe Price Associates, Inc. |
| | 0.70% on any excess over $400 million | | |
Equity Income Fund | | 0.75% on the first $600 million; and | | T. Rowe Price Associates, Inc. |
| | 0.70% on any excess over $600 million | | |
Equity Index Fund | | 0.10% on the first $750 million; and | | Northern Trust Investments, Inc. |
| | 0.08% on any excess over $750 million | | |
208
Notes to Financial Statements (Continued)
| | | | |
Fund | | Investment Advisory Fee | | Investment Subadviser(s) |
Focused Equity Fund | | 0.75% on the first $250 million; and | | Harris Associates L.P. |
| | 0.65% on any excess over $250 million | | |
Foreign Fund | | 0.89% on the first $500 million; and | | Templeton Investment Counsel, LLC |
| | 0.85% on any excess over $500 million | | |
Fundamental Growth Fund | | 0.70% on the first $250 million; and | | Wellington Management Company LLP |
| | 0.68% on any excess over $250 million | | |
Fundamental Value Fund | | 0.65% on the first $500 million; and | | Wellington Management Company LLP |
| | 0.625% on any excess over $500 million | | |
Global Fund | | 0.60% on the first $600 million; and | | Massachusetts Financial Services Company |
| | 0.55% on any excess over $600 million | | |
Growth & Income Fund | | 0.50% | | Massachusetts Financial Services Company |
Income & Growth Fund | | 0.65% on the first $600 million; and | | BlackRock Investment Management, LLC |
| | 0.60% on any excess over $600 million | | |
International Equity Fund | | 0.85% | | Harris Associates L.P. |
Large Cap Growth Fund | | 0.65% on the first $600 million; and | | Rainier Investment Management, LLC |
| | 0.60% on any excess over $600 million | | |
Managed Volatility Fund | | 0.75% on the first $500 million; and | | Gateway Investment Advisers, LLC |
| | 0.70% on any excess over $500 million | | |
Mid Cap Growth Fund | | 0.77% on the first $600 million; and | | T. Rowe Price Associates, Inc. |
| | 0.75% on any excess over $600 million | | |
Mid Cap Value Fund | | 0.84% on the first $600 million; and 0.80% on any excess over $600 million | | American Century Investment Management, Inc. |
Small Cap Growth Equity Fund | | 1.04% on the first $200 million; and 1.00% on any excess over $200 million | | Waddell & Reed Investment Management Company; and Wellington Management Company LLP |
Small Company Value Fund | | 0.85% on the first $150 million; and | | T. Rowe Price Associates, Inc. |
| | 0.75% on any excess over $150 million | | |
Small/Mid Cap Value Fund | | 0.75% | | AllianceBernstein L.P. |
Total Return Bond Fund* | | 0.50% on the first $500 million; and | | Metropolitan West Asset Management, LLC |
| | 0.48% on any excess over $500 million | | |
| * | Effective December 16, 2014, Metropolitan West Asset Management, LLC replaced Pacific Investment Management Company LLC as subadviser to the Fund. |
MassMutual served as the Funds’ investment adviser, at the same annual rate as noted above, pursuant to the investment advisory agreements through March 31, 2014.
Administration Fees
For the Equity Index Fund, Focused Equity Fund, Fundamental Growth Fund, Fundamental Value Fund, Global Fund, International Equity Fund, Small Company Value Fund, and Total Return Bond Fund, under separate administrative and shareholder services agreements between the Funds and MML Advisers, MML Advisers is obligated to provide all necessary administrative and shareholder services and bear some of the class specific administrative expenses. In return for these services, MML Advisers receives an administrative services fee based upon the average daily net assets of the applicable class of shares of the Funds, at the following annual rates:
| | | | | | | | | | | | | | |
| | | Class I | | Class II | | | Class III | | | Service Class I | |
Equity Index Fund | | 0.30% on the first $100 million;
0.28% on the next $150 million; and 0.26% on any excess over $250 million | | | 0.19% | | | | 0.05% | | |
| 0.30% on the first $100 million;
0.28% on the next $150 million; and 0.26% on any excess over $250 million |
|
| | | | | | | | | | |
| | | | | | | | | | |
Focused Equity Fund | | None | | | 0.10% | | | | None | | | | 0.10% | |
Fundamental Growth Fund | | None | | | 0.10% | | | | None | | | | 0.10% | |
209
Notes to Financial Statements (Continued)
| | | | | | | | | | | | |
| | | Class I | | Class II | | | Class III | | | Service Class I |
Fundamental Value Fund | | None | | | 0.10% | | | | None | | | 0.10% |
Global Fund | | 0.28% | | | 0.18% | | | | None | | | 0.28% |
International Equity Fund | | None | | | 0.10% | | | | None | | | 0.10% |
Small Company Value Fund | | None | | | 0.25% | | | | None | | | 0.25% |
Total Return Bond Fund | | None | | | 0.10% | | | | None | | | 0.10% |
MassMutual served as the Funds’ administrator pursuant to the administrative and shareholder services agreements through March 31, 2014.
Distribution and Service Fees
MML Distributors, LLC (the “Distributor”) acts as distributor to the Funds. Pursuant to a Distribution and Services Plan adopted by the Funds pursuant to Rule 12b-1 under the 1940 Act, Service Class shares and Service Class I shares of the Funds pay an annual fee of 0.25% of the average daily net asset value of Service Class shares and Service Class I shares. This fee, or a portion thereof, is paid to: (i) the Distributor for services provided and expenses incurred by it in connection with the distribution of Service Class shares or Service Class I shares, as applicable, of each Fund; and/or (ii) MassMutual for services provided and expenses incurred by it for purposes of maintaining or providing personal services to Service Class and Service Class I shareholders. The Distributor is a wholly-owned subsidiary of MassMutual.
Expense Caps and Waivers
MML Advisers agreed to cap the fees and expenses of the Funds noted below (other than extraordinary litigation and legal expenses, Acquired Fund fees and expenses#, interest expense, short sale dividend and loan expense, or other non-recurring or unusual expenses such as organizational expenses and shareholder meeting expenses) based upon the average daily net assets of the applicable class of shares of the Funds, as follows:
| | | | | | | | | | | | |
| | | Class I | | | Class II | | | Service Class I | |
Fundamental Growth Fund* | | | None | | | | 0.85% | | | | 1.10% | |
Global Fund* | | | 0.90% | | | | 0.80% | | | | 1.15% | |
International Equity Fund* | | | None | | | | 1.00% | | | | 1.25% | |
Small Company Value Fund* | | | None | | | | 1.15% | | | | 1.40% | |
Total Return Bond Fund** | | | None | | | | 0.65% | | | | 0.90% | |
| # | Acquired Fund fees and expenses are expenses borne indirectly by a Fund through investments in other pooled investment vehicles. |
| * | Expense caps in effect through April 30, 2015. |
| ** | Expense caps in effect through April 30, 2016. |
Effective December 16, 2014, MML Advisers has contractually agreed to waive, through April 30, 2016, 0.05% of the advisory fee for each class of the Total Return Bond Fund.
MML Advisers has agreed to waive, through April 30, 2015, 0.05% of the administrative and shareholder service fee for Class II and Class III shares of the Equity Index Fund.
Prior to April 1, 2014, expense caps were with MassMutual.
Expense caps and waiver amounts are reflected as a reduction of expenses on the Statements of Operations.
Rebated Brokerage Commissions
The Funds listed below have entered into agreements with certain brokers whereby the brokers will rebate to the Funds, in cash, a portion of brokerage commissions. Rebated brokerage commissions are amounts earned by the Funds and are included with
210
Notes to Financial Statements (Continued)
realized gain or loss on investment transactions presented in the Statements of Operations. For the year ended December 31, 2014, brokerage commissions rebated under these agreements were as follows:
| | | | |
| | | Rebated
Commissions | |
Foreign Fund | | $ | 1,932 | |
Fundamental Growth Fund | | | 12 | |
Fundamental Value Fund | | | 474 | |
Growth & Income Fund | | | 2,742 | |
Income & Growth Fund | | | 746 | |
Large Cap Growth Fund | | | 899 | |
Managed Volatility Fund | | | 20,356 | |
Small Cap Growth Equity Fund | | | 45,705 | |
Small/Mid Cap Value Fund | | | 40,144 | |
Deferred Compensation
Trustees of the Funds who are not officers or employees of MassMutual may elect to defer receipt of their annual fees in accordance with terms of a Non-Qualified Deferred Compensation Plan. Amounts deferred shall accrue interest or earnings and shall be recorded on the Funds’ books as other liabilities. Deferred compensation is included within Trustees’ fees and expenses in the Statements of Assets and Liabilities.
Other
Certain officers and trustees of the Funds are also employees of MassMutual. The compensation of each trustee who is not an employee of MassMutual is borne by the Funds.
| 4. | | Purchases and Sales of Investments |
Cost of purchases and proceeds from sales of investment securities (excluding short-term investments) for the year ended December��31, 2014, were as follows:
| | | | | | | | | | | | | | | | |
| | | Purchases | | | Sales | |
| | | Long-Term U.S.
Government
Securities | | | Other
Long-Term
Securities | | | Long-Term U.S.
Government
Securities | | | Other
Long-Term
Securities | |
Blue Chip Growth Fund | | $ | - | | | $ | 126,607,376 | | | $ | - | | | $ | 194,731,392 | |
Equity Income Fund | | | - | | | | 45,089,935 | | | | - | | | | 147,704,437 | |
Equity Index Fund | | | - | | | | 13,204,036 | | | | - | | | | 22,696,214 | |
Focused Equity Fund | | | - | | | | 53,733,256 | | | | - | | | | 74,433,738 | |
Foreign Fund | | | - | | | | 43,939,679 | | | | - | | | | 103,096,223 | |
Fundamental Growth Fund | | | - | | | | 106,678,561 | | | | - | | | | 154,915,250 | |
Fundamental Value Fund | | | - | | | | 29,884,720 | | | | - | | | | 58,591,889 | |
Global Fund | | | - | | | | 80,777,053 | | | | - | | | | 27,488,700 | |
Growth & Income Fund | | | - | | | | 27,756,604 | | | | - | | | | 47,341,965 | |
Income & Growth Fund | | | - | | | | 45,182,412 | | | | - | | | | 62,930,030 | |
International Equity Fund | | | - | | | | 170,490,677 | | | | - | | | | 43,077,147 | |
Large Cap Growth Fund | | | - | | | | 186,198,146 | | | | - | | | | 235,078,473 | |
Managed Volatility Fund | | | - | | | | 143,219,733 | | | | - | | | | 44,043,107 | |
Mid Cap Growth Fund | | | - | | | | 97,907,589 | | | | - | | | | 133,388,529 | |
Mid Cap Value Fund | | | - | | | | 319,617,374 | | | | - | | | | 376,934,856 | |
211
Notes to Financial Statements (Continued)
| | | | | | | | | | | | | | | | |
| | | Purchases | | | Sales | |
| | | Long-Term U.S.
Government
Securities | | | Other
Long-Term
Securities | | | Long-Term U.S.
Government
Securities | | | Other
Long-Term
Securities | |
Small Cap Growth Equity Fund | | $ | - | | | $ | 205,411,636 | | | $ | - | | | $ | 238,163,707 | |
Small Company Value Fund | | | - | | | | 21,780,802 | | | | - | | | | 23,864,065 | |
Small/Mid Cap Value Fund | | | - | | | | 117,736,365 | | | | - | | | | 153,740,614 | |
Total Return Bond Fund | | | 1,538,201,462 | | | | 252,840,836 | | | | 1,676,489,343 | | | | 212,551,137 | |
| 5. | | Capital Share Transactions |
Changes in shares outstanding for each Fund were as follows:
| | | | | | | | | | | | | | | | |
| | | Year Ended December 31, 2014 | | | Year Ended December 31, 2013 | |
| | | | |
| | | Shares | | | Amount | | | Shares | | | Amount | |
| | | | | | | | | | | | | | | | |
Blue Chip Growth Fund Initial Class | | | | | | | | | | | | | | | | |
Sold | | | 2,432,310 | | | $ | 41,415,411 | | | | 2,979,857 | | | $ | 45,030,707 | |
Issued as reinvestment of dividends | | | 2,309,868 | | | | 38,644,089 | | | | 2,308,364 | | | | 33,101,944 | |
Redeemed | | | (6,665,224 | ) | | | (114,765,671 | ) | | | (4,322,346 | ) | | | (66,983,586 | ) |
| | | | | | | | | | | | | | | | |
Net increase (decrease) | | | (1,923,046 | ) | | $ | (34,706,171 | ) | | | 965,875 | | | $ | 11,149,065 | |
| | | | | | | | | | | | | | | | |
Blue Chip Growth Fund Service Class | | | | | | | | | | | | | | | | |
Sold | | | 485,695 | | | $ | 8,240,685 | | | | 329,288 | | | $ | 5,070,926 | |
Issued as reinvestment of dividends | | | 175,921 | | | | 2,902,689 | | | | 115,905 | | | | 1,645,848 | |
Redeemed | | | (134,052 | ) | | | (2,244,038 | ) | | | (202,983 | ) | | | (3,156,440 | ) |
| | | | | | | | | | | | | | | | |
Net increase (decrease) | | | 527,564 | | | $ | 8,899,336 | | | | 242,210 | | | $ | 3,560,334 | |
| | | | | | | | | | | | | | | | |
Equity Income Fund Initial Class | | | | | | | | | | | | | | | | |
Sold | | | 2,190,166 | | | $ | 29,879,917 | | | | 2,973,549 | | | $ | 36,220,517 | |
Issued as reinvestment of dividends | | | 1,355,269 | | | | 18,675,610 | | | | 812,929 | | | | 9,755,151 | |
Redeemed | | | (10,908,154 | ) | | | (147,559,227 | ) | | | (7,676,697 | ) | | | (93,310,271 | ) |
| | | | | | | | | | | | | | | | |
Net increase (decrease) | | | (7,362,719 | ) | | $ | (99,003,700 | ) | | | (3,890,219 | ) | | $ | (47,334,603 | ) |
| | | | | | | | | | | | | | | | |
Equity Income Fund Service Class | | | | | | | | | | | | | | | | |
Sold | | | 670,085 | | | $ | 9,079,857 | | | | 749,752 | | | $ | 9,175,332 | |
Issued as reinvestment of dividends | | | 164,870 | | | | 2,257,067 | | | | 69,104 | | | | 824,404 | |
Redeemed | | | (301,982 | ) | | | (4,096,661 | ) | | | (488,268 | ) | | | (6,047,031 | ) |
| | | | | | | | | | | | | | | | |
Net increase (decrease) | | | 532,973 | | | $ | 7,240,263 | | | | 330,588 | | | $ | 3,952,705 | |
| | | | | | | | | | | | | | | | |
Equity Index Fund Class I | | | | | | | | | | | | | | | | |
Sold | | | 191,367 | | | $ | 4,599,754 | | | | 249,675 | | | $ | 5,212,089 | |
Issued as reinvestment of dividends | | | 93,856 | | | | 2,313,553 | | | | 80,886 | | | | 1,641,989 | |
Redeemed | | | (988,488 | ) | | | (23,947,674 | ) | | | (736,317 | ) | | | (15,390,477 | ) |
| | | | | | | | | | | | | | | | |
Net increase (decrease) | | | (703,265 | ) | | $ | (17,034,367 | ) | | | (405,756 | ) | | $ | (8,536,399 | ) |
| | | | | | | | | | | | | | | | |
Equity Index Fund Class II | | | | | | | | | | | | | | | | |
Sold | | | 389,841 | | | $ | 9,411,432 | | | | 608,724 | | | $ | 12,546,414 | |
Issued as reinvestment of dividends | | | 170,775 | | | | 4,214,723 | | | | 119,751 | | | | 2,434,532 | |
Redeemed | | | (629,543 | ) | | | (15,324,538 | ) | | | (742,961 | ) | | | (15,334,737 | ) |
| | | | | | | | | | | | | | | | |
Net increase (decrease) | | | (68,927 | ) | | $ | (1,698,383 | ) | | | (14,486 | ) | | $ | (353,791 | ) |
| | | | | | | | | | | | | | | | |
212
Notes to Financial Statements (Continued)
| | | | | | | | | | | | | | | | |
| | | Year Ended December 31, 2014 | | | Year Ended December 31, 2013 | |
| | | | |
| | | Shares | | | Amount | | | Shares | | | Amount | |
| | | | | | | | | | | | | | | | |
Equity Index Fund Class III | | | | | | | | | | | | | | | | |
Sold | | | 915 | | | $ | 21,042 | | | | 689 | | | $ | 12,995 | |
Issued as reinvestment of dividends | | | 196,106 | | | | 4,834,005 | | | | 145,580 | | | | 2,955,284 | |
Redeemed | | | (113,391 | ) | | | (2,701,841 | ) | | | (85,934 | ) | | | (1,764,774 | ) |
| | | | | | | | | | | | | | | | |
Net increase (decrease) | | | 83,630 | | | $ | 2,153,206 | | | | 60,335 | | | $ | 1,203,505 | |
| | | | | | | | | | | | | | | | |
Equity Index Fund Service Class I | | | | | | | | | | | | | | | | |
Sold | | | 449,061 | | | $ | 10,641,924 | | | | 445,313 | | | $ | 9,134,510 | |
Issued as reinvestment of dividends | | | 28,933 | | | | 698,745 | | | | 16,101 | | | | 321,052 | |
Redeemed | | | (137,780 | ) | | | (3,240,727 | ) | | | (98,045 | ) | | | (2,046,624 | ) |
| | | | | | | | | | | | | | | | |
Net increase (decrease) | | | 340,214 | | | $ | 8,099,942 | | | | 363,369 | | | $ | 7,408,938 | |
| | | | | | | | | | | | | | | | |
Focused Equity Fund Class II | | | | | | | | | | | | | | | | |
Sold | | | 1,160,066 | | | $ | 17,935,868 | | | | 1,001,699 | | | $ | 13,848,143 | |
Issued as reinvestment of dividends | | | 955,351 | | | | 14,913,033 | | | | 149,907 | | | | 2,056,722 | |
Redeemed | | | (2,740,919 | ) | | | (42,693,514 | ) | | | (2,355,714 | ) | | | (32,239,566 | ) |
| | | | | | | | | | | | | | | | |
Net increase (decrease) | | | (625,502 | ) | | $ | (9,844,613 | ) | | | (1,204,108 | ) | | $ | (16,334,701 | ) |
| | | | | | | | | | | | | | | | |
Focused Equity Fund Service Class I | | | | | | | | | | | | | | | | |
Sold | | | 183,039 | | | $ | 2,799,861 | | | | 285,477 | | | $ | 3,996,240 | |
Issued as reinvestment of dividends | | | 39,376 | | | | 611,512 | | | | 2,936 | | | | 40,162 | |
Redeemed | | | (81,455 | ) | | | (1,255,824 | ) | | | (41,345 | ) | | | (588,030 | ) |
| | | | | | | | | | | | | | | | |
Net increase (decrease) | | | 140,960 | | | $ | 2,155,549 | | | | 247,068 | | | $ | 3,448,372 | |
| | | | | | | | | | | | | | | | |
Foreign Fund Initial Class | | | | | | | | | | | | | | | | |
Sold | | | 3,871,730 | | | $ | 41,684,165 | | | | 7,645,020 | | | $ | 75,728,569 | |
Issued — merger | | | 1,701,290 | | | | 19,292,633 | | | | - | | | | - | |
Issued as reinvestment of dividends | | | 676,097 | | | | 7,579,051 | | | | 771,102 | | | | 7,749,572 | |
Redeemed | | | (10,892,002 | ) | | | (121,449,488 | ) | | | (9,168,968 | ) | | | (94,813,278 | ) |
| | | | | | | | | | | | | | | | |
Net increase (decrease) | | | (4,642,885 | ) | | $ | (52,893,639 | ) | | | (752,846 | ) | | $ | (11,335,137 | ) |
| | | | | | | | | | | | | | | | |
Foreign Fund Service Class | | | | | | | | | | | | | | | | |
Sold | | | 122,641 | | | $ | 1,295,588 | | | | 141,859 | | | $ | 1,458,470 | |
Issued — merger | | | 305,170 | | | | 3,442,313 | | | | - | | | | - | |
Issued as reinvestment of dividends | | | 21,048 | | | | 234,680 | | | | 12,590 | | | | 126,024 | |
Redeemed | | | (104,987 | ) | | | (1,133,771 | ) | | | (123,150 | ) | | | (1,253,713 | ) |
| | | | | | | | | | | | | | | | |
Net increase (decrease) | | | 343,872 | | | $ | 3,838,810 | | | | 31,299 | | | $ | 330,781 | |
| | | | | | | | | | | | | | | | |
Fundamental Growth Fund Class II | | | | | | | | | | | | | | | | |
Sold | | | 1,515,895 | | | $ | 22,042,851 | | | | 2,304,314 | | | $ | 28,004,999 | |
Issued as reinvestment of dividends | | | 1,056,660 | | | | 15,110,242 | | | | 14,076 | | | | 176,790 | |
Redeemed | | | (5,045,952 | ) | | | (72,994,870 | ) | | | (2,378,323 | ) | | | (30,224,975 | ) |
| | | | | | | | | | | | | | | | |
Net increase (decrease) | | | (2,473,397 | ) | | $ | (35,841,777 | ) | | | (59,933 | ) | | $ | (2,043,186 | ) |
| | | | | | | | | | | | | | | | |
Fundamental Growth Fund Service Class I | | | | | | | | | | | | | | | | |
Sold | | | 85,311 | | | $ | 1,230,250 | | | | 56,655 | | | $ | 727,997 | |
Issued as reinvestment of dividends | | | 9,395 | | | | 133,691 | | | | 61 | | | | 766 | |
Redeemed | | | (39,049 | ) | | | (572,896 | ) | | | (10,165 | ) | | | (129,833 | ) |
| | | | | | | | | | | | | | | | |
Net increase (decrease) | | | 55,657 | | | $ | 791,045 | | | | 46,551 | | | $ | 598,930 | |
| | | | | | | | | | | | | | | | |
213
Notes to Financial Statements (Continued)
| | | | | | | | | | | | | | | | |
| | | Year Ended December 31, 2014 | | | Year Ended December 31, 2013 | |
| | | | |
| | | Shares | | | Amount | | | Shares | | | Amount | |
| | | | | | | | | | | | | | | | |
Fundamental Value Fund Class II | | | | | | | | | | | | | | | | |
Sold | | | 1,647,967 | | | $ | 25,792,859 | | | | 1,855,648 | | | $ | 26,469,510 | |
Issued as reinvestment of dividends | | | 811,002 | | | | 12,757,062 | | | | 757,703 | | | | 10,524,496 | |
Redeemed | | | (4,019,590 | ) | | | (62,882,457 | ) | | | (2,390,350 | ) | | | (34,085,595 | ) |
| | | | | | | | | | | | | | | | |
Net increase (decrease) | | | (1,560,621 | ) | | $ | (24,332,536 | ) | | | 223,001 | | | $ | 2,908,411 | |
| | | | | | | | | | | | | | | | |
Fundamental Value Fund Service Class I | | | | | | | | | | | | | | | | |
Sold | | | 204,745 | | | $ | 3,184,188 | | | | 154,904 | | | $ | 2,224,375 | |
Issued as reinvestment of dividends | | | 16,026 | | | | 250,322 | | | | 4,759 | | | | 65,812 | |
Redeemed | | | (43,917 | ) | | | (678,980 | ) | | | (17,996 | ) | | | (260,341 | ) |
| | | | | | | | | | | | | | | | |
Net increase (decrease) | | | 176,854 | | | $ | 2,755,530 | | | | 141,667 | | | $ | 2,029,846 | |
| | | | | | | | | | | | | | | | |
Global Fund Class I | | | | | | | | | | | | | | | | |
Sold | | | 6,485,317 | | | $ | 79,570,972 | | | | 1,512,491 | | | $ | 16,923,784 | |
Issued as reinvestment of dividends | | | 415,403 | | | | 5,221,615 | | | | 144,101 | | | | 1,585,115 | |
Redeemed | | | (2,247,657 | ) | | | (28,065,181 | ) | | | (3,026,135 | ) | | | (33,251,677 | ) |
| | | | | | | | | | | | | | | | |
Net increase (decrease) | | | 4,653,063 | | | $ | 56,727,406 | | | | (1,369,543 | ) | | $ | (14,742,778 | ) |
| | | | | | | | | | | | | | | | |
Global Fund Class II | | | | | | | | | | | | | | | | |
Sold | | | 31,033 | | | $ | 393,624 | | | | 63,809 | | | $ | 705,506 | |
Issued as reinvestment of dividends | | | 34,912 | | | | 445,484 | | | | 18,340 | | | | 204,676 | |
Redeemed | | | (180,216 | ) | | | (2,285,135 | ) | | | (241,585 | ) | | | (2,726,325 | ) |
| | | | | | | | | | | | | | | | |
Net increase (decrease) | | | (114,271 | ) | | $ | (1,446,027 | ) | | | (159,436 | ) | | $ | (1,816,143 | ) |
| | | | | | | | | | | | | | | | |
Global Fund Service Class I | | | | | | | | | | | | | | | | |
Sold | | | 212,279 | | | $ | 2,631,226 | | | | 211,987 | | | $ | 2,349,871 | |
Issued as reinvestment of dividends | | | 15,727 | | | | 196,430 | | | | 5,244 | | | | 57,420 | |
Redeemed | | | (29,560 | ) | | | (366,527 | ) | | | (58,268 | ) | | | (661,471 | ) |
| | | | | | | | | | | | | | | | |
Net increase (decrease) | | | 198,446 | | | $ | 2,461,129 | | | | 158,963 | | | $ | 1,745,820 | |
| | | | | | | | | | | | | | | | |
Growth & Income Fund Initial Class | | | | | | | | | | | | | | | | |
Sold | | | 152,081 | | | $ | 1,911,429 | | | | 211,388 | | | $ | 2,236,793 | |
Issued as reinvestment of dividends | | | 109,646 | | | | 1,393,594 | | | | 153,804 | | | | 1,618,014 | |
Redeemed | | | (1,790,439 | ) | | | (22,309,807 | ) | | | (2,245,704 | ) | | | (23,875,748 | ) |
| | | | | | | | | | | | | | | | |
Net increase (decrease) | | | (1,528,712 | ) | | $ | (19,004,784 | ) | | | (1,880,512 | ) | | $ | (20,020,941 | ) |
| | | | | | | | | | | | | | | | |
Growth & Income Fund Service Class | | | | | | | | | | | | | | | | |
Sold | | | 293,790 | | | $ | 3,607,961 | | | | 263,986 | | | $ | 2,811,623 | |
Issued as reinvestment of dividends | | | 13,622 | | | | 172,322 | | | | 16,566 | | | | 173,449 | |
Redeemed | | | (300,673 | ) | | | (3,741,895 | ) | | | (200,800 | ) | | | (2,195,624 | ) |
| | | | | | | | | | | | | | | | |
Net increase (decrease) | | | 6,739 | | | $ | 38,388 | | | | 79,752 | | | $ | 789,448 | |
| | | | | | | | | | | | | | | | |
Income & Growth Fund Initial Class | | | | | | | | | | | | | | | | |
Sold | | | 2,524,602 | | | $ | 29,488,802 | | | | 3,855,991 | | | $ | 40,095,618 | |
Issued as reinvestment of dividends | | | 349,573 | | | | 4,208,862 | | | | 362,805 | | | | 3,744,150 | |
Redeemed | | | (3,873,523 | ) | | | (45,887,021 | ) | | | (2,614,169 | ) | | | (27,919,563 | ) |
| | | | | | | | | | | | | | | | |
Net increase (decrease) | | | (999,348 | ) | | $ | (12,189,357 | ) | | | 1,604,627 | | | $ | 15,920,205 | |
| | | | | | | | | | | | | | | | |
Income & Growth Fund Service Class | | | | | | | | | | | | | | | | |
Sold | | | 213,242 | | | $ | 2,510,636 | | | | 230,965 | | | $ | 2,429,862 | |
Issued as reinvestment of dividends | | | 20,572 | | | | 246,039 | | | | 21,551 | | | | 220,892 | |
Redeemed | | | (210,004 | ) | | | (2,492,819 | ) | | | (167,322 | ) | | | (1,787,477 | ) |
| | | | | | | | | | | | | | | | |
Net increase (decrease) | | | 23,810 | | | $ | 263,856 | | | | 85,194 | | | $ | 863,277 | |
| | | | | | | | | | | | | | | | |
214
Notes to Financial Statements (Continued)
| | | | | | | | | | | | | | | | |
| | | Year Ended December 31, 2014 | | | Year Ended December 31, 2013 | |
| | | | |
| | | Shares | | | Amount | | | Shares | | | Amount | |
| | | | | | | | | | | | | | | | |
International Equity Fund Class II* | | | | | | | | | | | | | | | | |
Sold | | | 23,728,769 | | | $ | 237,787,100 | | | | | | | | | |
Issued as reinvestment of dividends | | | 368,443 | | | | 3,385,993 | | | | | | | | | |
Redeemed | | | (10,731,629 | ) | | | (107,513,100 | ) | | | | | | | | |
| | | | | | | | | | | | | | | | |
Net increase (decrease) | | | 13,365,583 | | | $ | 133,659,993 | | | | | | | | | |
| | | | | | | | | | | | | | | | |
International Equity Fund Service Class I** | | | | | | | | | | | | | | | | |
Sold | | | 36,222 | | | $ | 357,907 | | | | | | | | | |
Issued as reinvestment of dividends | | | 807 | | | | 7,406 | | | | | | | | | |
Redeemed | | | (4,827 | ) | | | (44,820 | ) | | | | | | | | |
| | | | | | | | | | | | | | | | |
Net increase (decrease) | | | 32,202 | | | $ | 320,493 | | | | | | | | | |
| | | | | | | | | | | | | | | | |
Large Cap Growth Fund Initial Class | | | | | | | | | | | | | | | | |
Sold | | | 1,634,154 | | | $ | 23,278,500 | | | | 1,922,393 | | | $ | 24,625,529 | |
Issued as reinvestment of dividends | | | 2,203,892 | | | | 30,391,668 | | | | 1,069,312 | | | | 13,163,226 | |
Redeemed | | | (4,945,901 | ) | | | (71,501,061 | ) | | | (2,369,969 | ) | | | (30,896,667 | ) |
| | | | | | | | | | | | | | | | |
Net increase (decrease) | | | (1,107,855 | ) | | $ | (17,830,893 | ) | | | 621,736 | | | $ | 6,892,088 | |
| | | | | | | | | | | | | | | | |
Large Cap Growth Fund Service Class | | | | | | | | | | | | | | | | |
Sold | | | 83,413 | | | $ | 1,164,721 | | | | 24,497 | | | $ | 313,611 | |
Issued as reinvestment of dividends | | | 22,303 | | | | 304,214 | | | | 7,013 | | | | 85,693 | |
Redeemed | | | (36,887 | ) | | | (518,742 | ) | | | (28,906 | ) | | | (373,423 | ) |
| | | | | | | | | | | | | | | | |
Net increase (decrease) | | | 68,829 | | | $ | 950,193 | | | | 2,604 | | | $ | 25,881 | |
| | | | | | | | | | | | | | | | |
Managed Volatility Fund Initial Class | | | | | | | | | | | | | | | | |
Sold | | | 11,028,176 | | | $ | 158,958,673 | | | | 904,381 | | | $ | 12,605,824 | |
Issued as reinvestment of dividends | | | 1,396,227 | | | | 19,633,713 | | | | 199,355 | | | | 2,720,569 | |
Redeemed | | | (2,734,564 | ) | | | (39,231,568 | ) | | | (2,583,773 | ) | | | (35,421,412 | ) |
| | | | | | | | | | | | | | | | |
Net increase (decrease) | | | 9,689,839 | | | $ | 139,360,818 | | | | (1,480,037 | ) | | $ | (20,095,019 | ) |
| | | | | | | | | | | | | | | | |
Managed Volatility Fund Service Class | | | | | | | | | | | | | | | | |
Sold | | | 397,254 | | | $ | 5,625,059 | | | | 364,132 | | | $ | 4,966,598 | |
Issued as reinvestment of dividends | | | 119,130 | | | | 1,665,955 | | | | 23,615 | | | | 320,704 | |
Redeemed | | | (242,040 | ) | | | (3,427,755 | ) | | | (239,620 | ) | | | (3,288,832 | ) |
| | | | | | | | | | | | | | | | |
Net increase (decrease) | | | 274,344 | | | $ | 3,863,259 | | | | 148,127 | | | $ | 1,998,470 | |
| | | | | | | | | | | | | | | | |
Mid Cap Growth Fund Initial Class | | | | | | | | | | | | | | | | |
Sold | | | 1,092,094 | | | $ | 17,956,822 | | | | 1,615,347 | | | $ | 23,563,381 | |
Issued as reinvestment of dividends | | | 3,019,891 | | | | 47,080,105 | | | | 1,609,545 | | | | 23,547,645 | |
Redeemed | | | (3,541,263 | ) | | | (58,469,540 | ) | | | (6,338,515 | ) | | | (96,330,897 | ) |
| | | | | | | | | | | | | | | | |
Net increase (decrease) | | | 570,722 | | | $ | 6,567,387 | | | | (3,113,623 | ) | | $ | (49,219,871 | ) |
| | | | | | | | | | | | | | | | |
Mid Cap Growth Fund Service Class | | | | | | | | | | | | | | | | |
Sold | | | 609,521 | | | $ | 9,922,863 | | | | 546,508 | | | $ | 8,145,873 | |
Issued as reinvestment of dividends | | | 437,024 | | | | 6,703,945 | | | | 161,976 | | | | 2,342,174 | |
Redeemed | | | (223,557 | ) | | | (3,601,155 | ) | | | (305,523 | ) | | | (4,650,780 | ) |
| | | | | | | | | | | | | | | | |
Net increase (decrease) | | | 822,988 | | | $ | 13,025,653 | | | | 402,961 | | | $ | 5,837,267 | |
| | | | | | | | | | | | | | | | |
Mid Cap Value Fund Initial Class | | | | | | | | | | | | | | | | |
Sold | | | 1,953,776 | | | $ | 26,504,287 | | | | 1,765,860 | | | $ | 22,113,742 | |
Issued as reinvestment of dividends | | | 6,642,825 | | | | 83,566,734 | | | | 2,176,334 | | | | 26,616,565 | |
Redeemed | | | (7,338,549 | ) | | | (100,216,941 | ) | | | (9,104,383 | ) | | | (116,040,542 | ) |
| | | | | | | | | | | | | | | | |
Net increase (decrease) | | | 1,258,052 | | | $ | 9,854,080 | | | | (5,162,189 | ) | | $ | (67,310,235 | ) |
| | | | | | | | | | | | | | | | |
215
Notes to Financial Statements (Continued)
| | | | | | | | | | | | | | | | |
| | | Year Ended December 31, 2014 | | | Year Ended December 31, 2013 | |
| | | | |
| | | Shares | | | Amount | | | Shares | | | Amount | |
| | | | | | | | | | | | | | | | |
Mid Cap Value Fund Service Class | | | | | | | | | | | | | | | | |
Sold | | | 389,404 | | | $ | 5,220,634 | | | | 348,175 | | | $ | 4,398,857 | |
Issued as reinvestment of dividends | | | 395,733 | | | | 4,934,786 | | | | 95,120 | | | | 1,155,712 | |
Redeemed | | | (197,323 | ) | | | (2,641,929 | ) | | | (191,491 | ) | | | (2,459,050 | ) |
| | | | | | | | | | | | | | | | |
Net increase (decrease) | | | 587,814 | | | $ | 7,513,491 | | | | 251,804 | | | $ | 3,095,519 | |
| | | | | | | | | | | | | | | | |
Small Cap Growth Equity Fund Initial Class | | | | | | | | | | | | | | | | |
Sold | | | 1,047,511 | | | $ | 20,678,582 | | | | 922,288 | | | $ | 17,708,296 | |
Issued as reinvestment of dividends | | | 3,883,872 | | | | 66,804,629 | | | | 834,338 | | | | 16,238,406 | |
Redeemed | | | (2,720,244 | ) | | | (55,156,708 | ) | | | (5,548,545 | ) | | | (111,812,112 | ) |
| | | | | | | | | | | | | | | | |
Net increase (decrease) | | | 2,211,139 | | | $ | 32,326,503 | | | | (3,791,919 | ) | | $ | (77,865,410 | ) |
| | | | | | | | | | | | | | | | |
Small Cap Growth Equity Fund Service Class | | | | | | | | | | | | | | | | |
Sold | | | 130,448 | | | $ | 2,562,512 | | | | 55,221 | | | $ | 1,103,212 | |
Issued as reinvestment of dividends | | | 144,811 | | | | 2,431,449 | | | | 21,373 | | | | 409,665 | |
Redeemed | | | (52,757 | ) | | | (999,636 | ) | | | (88,545 | ) | | | (1,770,420 | ) |
| | | | | | | | | | | | | | | | |
Net increase (decrease) | | | 222,502 | | | $ | 3,994,325 | | | | (11,951 | ) | | $ | (257,543 | ) |
| | | | | | | | | | | | | | | | |
Small Company Value Fund Class II | | | | | | | | | | | | | | | | |
Sold | | | 719,701 | | | $ | 14,977,142 | | | | 665,816 | | | $ | 14,342,007 | |
Issued as reinvestment of dividends | | | 1,427,103 | | | | 24,803,043 | | | | 229,951 | | | | 4,785,284 | |
Redeemed | | | (799,602 | ) | | | (17,543,083 | ) | | | (2,856,390 | ) | | | (63,723,072 | ) |
| | | | | | | | | | | | | | | | |
Net increase (decrease) | | | 1,347,202 | | | $ | 22,237,102 | | | | (1,960,623 | ) | | $ | (44,595,781 | ) |
| | | | | | | | | | | | | | | | |
Small Company Value Fund Service Class I | | | | | | | | | | | | | | | | |
Sold | | | 125,419 | | | $ | 2,473,795 | | | | 115,783 | | | $ | 2,478,790 | |
Issued as reinvestment of dividends | | | 157,782 | | | | 2,698,082 | | | | 14,959 | | | | 308,306 | |
Redeemed | | | (83,672 | ) | | | (1,749,037 | ) | | | (49,742 | ) | | | (1,070,710 | ) |
| | | | | | | | | | | | | | | | |
Net increase (decrease) | | | 199,529 | | | $ | 3,422,840 | | | | 81,000 | | | $ | 1,716,386 | |
| | | | | | | | | | | | | | | | |
Small/Mid Cap Value Fund Initial Class | | | | | | | | | | | | | | | | |
Sold | | | 1,400,271 | | | $ | 19,425,968 | | | | 5,365,757 | | | $ | 70,569,273 | |
Issued as reinvestment of dividends | | | 460,660 | | | | 6,665,754 | | | | 105,068 | | | | 1,269,216 | |
Redeemed | | | (4,402,555 | ) | | | (62,392,071 | ) | | | (3,552,655 | ) | | | (42,711,365 | ) |
| | | | | | | | | | | | | | | | |
Net increase (decrease) | | | (2,541,624 | ) | | $ | (36,300,349 | ) | | | 1,918,170 | | | $ | 29,127,124 | |
| | | | | | | | | | | | | | | | |
Small/Mid Cap Value Fund Service Class | | | | | | | | | | | | | | | | |
Sold | | | 255,516 | | | $ | 3,597,046 | | | | 172,248 | | | $ | 2,127,068 | |
Issued as reinvestment of dividends | | | 27,882 | | | | 401,222 | | | | 4,918 | | | | 59,171 | |
Redeemed | | | (149,720 | ) | | | (2,109,763 | ) | | | (120,212 | ) | | | (1,483,223 | ) |
| | | | | | | | | | | | | | | | |
Net increase (decrease) | | | 133,678 | | | $ | 1,888,505 | | | | 56,954 | | | $ | 703,016 | |
| | | | | | | | | | | | | | | | |
Total Return Bond Fund Class II | | | | | | | | | | | | | | | | |
Sold | | | 5,607,993 | | | $ | 59,028,518 | | | | 12,126,211 | | | $ | 129,091,697 | |
Issued as reinvestment of dividends | | | 692,630 | | | | 7,279,537 | | | | 1,042,654 | | | | 10,624,649 | |
Redeemed | | | (7,151,125 | ) | | | (75,467,043 | ) | | | (2,731,246 | ) | | | (28,905,108 | ) |
| | | | | | | | | | | | | | | | |
Net increase (decrease) | | | (850,502 | ) | | $ | (9,158,988 | ) | | | 10,437,619 | | | $ | 110,811,238 | |
| | | | | | | | | | | | | | | | |
Total Return Bond Fund Service Class I | | | | | | | | | | | | | | | | |
Sold | | | 513,127 | | | $ | 5,379,972 | | | | 800,946 | | | $ | 8,491,372 | |
Issued as reinvestment of dividends | | | 22,559 | | | | 235,738 | | | | 26,527 | | | | 269,253 | |
Redeemed | | | (278,958 | ) | | | (2,923,400 | ) | | | (250,051 | ) | | | (2,635,762 | ) |
| | | | | | | | | | | | | | | | |
Net increase (decrease) | | | 256,728 | | | $ | 2,692,310 | | | | 577,422 | | | $ | 6,124,863 | |
| | | | | | | | | | | | | | | | |
| * | Fund and Class II shares commenced operations on January 7, 2014. |
| ** | Service Class I commenced operations on May 1, 2014. |
216
Notes to Financial Statements (Continued)
| 6. | | Federal Income Tax Information |
At December 31, 2014, the cost of securities and the unrealized appreciation (depreciation) in the value of investments owned by the Funds, as computed on a federal income tax basis, were as follows:
| | | | | | | | | | | | | | | | |
| | | Federal Income
Tax Cost | | | Tax Basis
Unrealized
Appreciation | | | Tax Basis
Unrealized
(Depreciation) | | | Net Unrealized
Appreciation
(Depreciation) | |
Blue Chip Growth Fund | | $ | 273,215,021 | | | $ | 153,727,431 | | | $ | (4,325,641 | ) | | $ | 149,401,790 | |
Equity Income Fund | | | 376,897,738 | | | | 173,515,049 | | | | (13,114,765 | ) | | | 160,400,284 | |
Equity Index Fund | | | 249,704,207 | | | | 201,618,960 | | | | (6,896,906 | ) | | | 194,722,054 | |
Focused Equity Fund | | | 124,479,184 | | | | 45,088,124 | | | | (2,071,855 | ) | | | 43,016,269 | |
Foreign Fund | | | 315,517,931 | | | | 56,958,418 | | | | (32,210,222 | ) | | | 24,748,196 | |
Fundamental Growth Fund | | | 167,850,625 | | | | 44,198,378 | | | | (2,668,058 | ) | | | 41,530,320 | |
Fundamental Value Fund | | | 157,202,086 | | | | 69,566,729 | | | | (1,634,629 | ) | | | 67,932,100 | |
Global Fund | | | 179,588,495 | | | | 63,202,432 | | | | (3,530,952 | ) | | | 59,671,480 | |
Growth & Income Fund | | | 97,439,724 | | | | 44,581,235 | | | | (1,027,472 | ) | | | 43,553,763 | |
Income & Growth Fund | | | 184,161,926 | | | | 65,417,848 | | | | (1,325,281 | ) | | | 64,092,567 | |
International Equity Fund | | | 129,736,113 | | | | 1,146,676 | | | | (11,221,091 | ) | | | (10,074,415 | ) |
Large Cap Growth Fund | | | 207,520,814 | | | | 45,405,316 | | | | (3,930,790 | ) | | | 41,474,526 | |
Managed Volatility Fund | | | 306,944,346 | | | | 72,861,503 | | | | (5,801,714 | ) | | | 67,059,789 | |
Mid Cap Growth Fund | | | 303,321,077 | | | | 151,932,971 | | | | (2,146,968 | ) | | | 149,786,003 | |
Mid Cap Value Fund | | | 441,977,604 | | | | 65,050,129 | | | | (5,546,331 | ) | | | 59,503,798 | |
Small Cap Growth Equity Fund | | | 254,885,574 | | | | 49,975,489 | | | | (5,610,752 | ) | | | 44,364,737 | |
Small Company Value Fund | | | 79,034,154 | | | | 34,318,378 | | | | (2,664,957 | ) | | | 31,653,421 | |
Small/Mid Cap Value Fund | | | 225,962,005 | | | | 41,868,072 | | | | (10,024,043 | ) | | | 31,844,029 | |
Total Return Bond Fund | | | 485,838,508 | | | | 3,215,300 | | | | (3,069,807 | ) | | | 145,493 | |
Net capital loss carryforwards may be applied against any net realized taxable gains in succeeding years, subject to the carryforward period limitations, where applicable. On December 22, 2010, the Regulated Investment Company Modernization Act of 2010 (the “Modernization Act”) was signed by the President. The Modernization Act changed the capital loss carryforward rules as they relate to regulated investment companies. Capital losses generated in tax years beginning after the date of enactment may now be carried forward indefinitely, and retain the character of the original loss. Under pre-enactment law, capital losses could be carried forward for up to eight tax years as short-term capital losses. The provisions affecting the utilization of capital loss carryforwards under the Modernization Act also require the utilization of post-enactment losses prior to the utilization of pre-enactment losses.
At December 31, 2014, the following Fund(s) had available, for federal income tax purposes, pre-enactment unused capital losses:
| | | | | | | | | | | | |
| | | Expiring
2016 | | | Expiring
2017 | | | Expiring
2018 | |
Blue Chip Growth Fund | | $ | 1,230,702 | | | $ | - | | | $ | - | |
Foreign Fund | | | - | | | | 12,009,150 | | | | 4,482,917 | |
Growth & Income Fund | | | - | | | | 31,108,218 | | | | - | |
At December 31, 2014, the following Fund(s) had post-enactment accumulated capital loss carryforwards:
| | | | | | | | |
| | | Short Term
Capital Loss
Carryforward | | | Long term
Capital Loss
Carryforward | |
Managed Volatility Fund | | $ | 9,928,651 | | | $ | 7,899,039 | |
217
Notes to Financial Statements (Continued)
Net capital loss carryforwards for the Fund(s) shown in the above table are from post-enactment years and are, therefore, not subject to the eight-year carryforward period and possible expiration.
Generally accepted accounting principles in the United States of America require that only distributions in excess of tax basis earnings and profits be reported in the financial statements as a return of capital.
The tax character of distributions (including capital gain dividends, if any, designated pursuant to Section 852 of the Code) paid during the year ended December 31, 2014, was as follows:
| | | | | | | | | | | | |
| | | Ordinary
Income | | | Long Term
Capital Gain | | | Return of
Capital | |
Blue Chip Growth Fund | | $ | 1,386,920 | | | $ | 40,159,858 | | | $ | - | |
Equity Income Fund | | | 8,920,467 | | | | 12,012,210 | | | | - | |
Equity Index Fund | | | 7,495,243 | | | | 4,565,783 | | | | - | |
Focused Equity Fund | | | 3,317,750 | | | | 12,206,795 | | | | - | |
Foreign Fund | | | 7,813,731 | | | | - | | | | - | |
Fundamental Growth Fund | | | 3,016,690 | | | | 12,227,243 | | | | - | |
Fundamental Value Fund | | | 3,500,862 | | | | 9,506,522 | | | | - | |
Global Fund | | | 1,964,991 | | | | 3,898,538 | | | | - | |
Growth & Income Fund | | | 1,565,916 | | | | - | | | | - | |
Income & Growth Fund | | | 4,454,901 | | | | - | | | | - | |
International Equity Fund | | | 3,393,399 | | | | - | | | | - | |
Large Cap Growth Fund | | | 11,926,761 | | | | 18,769,121 | | | | - | |
Managed Volatility Fund | | | 2,573,217 | | | | 18,726,451 | | | | - | |
Mid Cap Growth Fund | | | 4,467,990 | | | | 49,316,060 | | | | - | |
Mid Cap Value Fund | | | 38,355,923 | | | | 50,145,597 | | | | - | |
Small Cap Growth Equity Fund | | | 22,287,130 | | | | 46,948,948 | | | | - | |
Small Company Value Fund | | | 283,229 | | | | 27,217,896 | | | | - | |
Small/Mid Cap Value Fund | | | 1,551,359 | | | | 5,515,617 | | | | - | |
Total Return Bond Fund | | | 7,515,275 | | | | - | | | | - | |
The tax character of distributions (including capital gain dividends, if any, designated pursuant to Section 852 of the Code) paid during the year ended December 31, 2013, was as follows:
| | | | | | | | | | | | |
| | | Ordinary
Income | | | Long Term
Capital Gain | | | Return of
Capital | |
Blue Chip Growth Fund | | $ | 831,258 | | | $ | 33,916,534 | | | $ | - | |
Equity Income Fund | | | 10,579,555 | | | | - | | | | - | |
Equity Index Fund | | | 6,226,287 | | | | 1,126,570 | | | | - | |
Focused Equity Fund | | | 2,096,884 | | | | - | | | | - | |
Foreign Fund | | | 7,875,596 | | | | - | | | | - | |
Fundamental Growth Fund | | | - | | | | 177,556 | | | | - | |
Fundamental Value Fund | | | 3,556,739 | | | | 7,033,569 | | | | - | |
Global Fund | | | 1,847,211 | | | | - | | | | - | |
Growth & Income Fund | | | 1,791,463 | | | | - | | | | - | |
Income & Growth Fund | | | 3,965,042 | | | | - | | | | - | |
Large Cap Growth Fund | | | 907,460 | | | | 12,341,459 | | | | - | |
Managed Volatility Fund | | | 3,041,273 | | | | - | | | | - | |
Mid Cap Growth Fund | | | 2,536,462 | | | | 23,353,357 | | | | - | |
Mid Cap Value Fund | | | 22,373,019 | | | | 5,399,258 | | | | - | |
Small Cap Growth Equity Fund | | | - | | | | 16,648,071 | | | | - | |
Small Company Value Fund | | | 1,559,604 | | | | 3,533,986 | | | | - | |
Small/Mid Cap Value Fund | | | 1,328,387 | | | | - | | | | - | |
Total Return Bond Fund | | | 10,551,217 | | | | 342,685 | | | | - | |
218
Notes to Financial Statements (Continued)
The following Fund(s) have elected to pass through the foreign tax credit for the year ended December 31, 2014:
| | | | |
| | | Amount | |
Foreign Fund | | $ | 486,585 | |
Global Fund | | | 109,833 | |
Capital accounts within the financial statements are periodically adjusted for permanent differences between book and tax accounting. These adjustments have no impact on net assets or the results of operations. Temporary book and tax accounting differences will reverse in subsequent periods. At December 31, 2014, temporary book and tax accounting differences were primarily attributable to investments in forward contracts, futures contracts, options contracts, swap agreements, premium amortization accruals, passive foreign investment companies, the deferral of wash sale losses, non-taxable dividends and deferred Trustee compensation.
At December 31, 2014, the components of distributable earnings on a tax basis were as follows:
| | | | | | | | | | | | | | | | |
| | | Undistributed
Ordinary
Income | | | Undistributed
Long Term
Capital Gain
(Capital Loss
Carryover) | | | Other
Temporary
Differences | | | Unrealized
Appreciation
(Depreciation) | |
Blue Chip Growth Fund | | $ | 127,608 | | | $ | 67,102,202 | | | $ | (69,327 | ) | | $ | 149,402,280 | |
Equity Income Fund | | | 11,019,994 | | | | 48,930,857 | | | | (116,460 | ) | | | 160,399,583 | |
Equity Index Fund | | | 7,702,814 | | | | 9,277,399 | | | | (156,572 | ) | | | 194,722,055 | |
Focused Equity Fund | | | 3,015,251 | | | | 21,634,312 | | | | (14,936 | ) | | | 43,016,269 | |
Foreign Fund | | | 10,988,661 | | | | (16,492,067 | ) | | | (82,157 | ) | | | 24,733,825 | |
Fundamental Growth Fund | | | 5,080,791 | | | | 32,572,927 | | | | (20,057 | ) | | | 41,530,320 | |
Fundamental Value Fund | | | 3,667,936 | | | | 17,388,668 | | | | (24,091 | ) | | | 67,928,905 | |
Global Fund | | | 3,600,004 | | | | 10,274,819 | | | | (26,935 | ) | | | 59,625,501 | |
Growth & Income Fund | | | 1,584,775 | | | | (31,108,218 | ) | | | (44,251 | ) | | | 43,553,327 | |
Income & Growth Fund | | | 4,630,944 | | | | 15,111,560 | | | | (42,343 | ) | | | 64,092,513 | |
International Equity Fund | | | 335,285 | | | | - | | | | (3,723 | ) | | | (10,098,355 | ) |
Large Cap Growth Fund | | | 8,201,687 | | | | 35,892,286 | | | | (34,704 | ) | | | 41,474,526 | |
Managed Volatility Fund | | | 3,675,042 | | | | (17,827,690 | ) | | | 1,245,208 | | | | 66,653,051 | |
Mid Cap Growth Fund | | | 1,974,835 | | | | 47,826,483 | | | | (81,351 | ) | | | 149,785,775 | |
Mid Cap Value Fund | | | 27,854,483 | | | | 50,054,841 | | | | (508,030 | ) | | | 59,502,935 | |
Small Cap Growth Equity Fund | | | 4,597,996 | | | | 38,195,164 | | | | (75,077 | ) | | | 44,364,634 | |
Small Company Value Fund | | | 319,442 | | | | 10,080,313 | | | | (17,873 | ) | | | 31,653,421 | |
Small/Mid Cap Value Fund | | | 6,980,418 | | | | 32,377,643 | | | | (50,039 | ) | | | 31,844,029 | |
Total Return Bond Fund | | | 11,545,041 | | | | 3,774,189 | | | | (40,540 | ) | | | 147,460 | |
219
Notes to Financial Statements (Continued)
During the year ended December 31, 2014, the following amounts were reclassified due to permanent differences between book and tax accounting:
| | | | | | | | | | | | |
| | | Paid-in
Capital | | | Accumulated
Net Realized
Gain (Loss) on
Investments | | | Undistributed
Net Investment
Income (Loss) | |
Blue Chip Growth Fund | | $ | 265 | | | $ | (419,752 | ) | | $ | 419,487 | |
Equity Income Fund | | | 433 | | | | 335,276 | | | | (335,709 | ) |
Equity Index Fund | | | 493 | | | | 57,955 | | | | (58,448 | ) |
Focused Equity Fund | | | 70 | | | | 9 | | | | (79 | ) |
Foreign Fund | | | 2,616 | | | | 112,944 | | | | (115,560 | ) |
Fundamental Growth Fund | | | 96 | | | | 73,825 | | | | (73,921 | ) |
Fundamental Value Fund | | | 106 | | | | 27,407 | | | | (27,513 | ) |
Global Fund | | | 103 | | | | 69,389 | | | | (69,492 | ) |
Growth & Income Fund | | | 149 | | | | 82,523 | | | | (82,672 | ) |
Income & Growth Fund | | | 154 | | | | 64,893 | | | | (65,047 | ) |
International Equity Fund | | | 11 | | | | (399,940 | ) | | | 399,929 | |
Large Cap Growth Fund | | | 141 | | | | (147,353 | ) | | | 147,212 | |
Managed Volatility Fund | | | 258 | | | | 24,115 | | | | (24,373 | ) |
Mid Cap Growth Fund | | | 302 | | | | (497,058 | ) | | | 496,756 | |
Mid Cap Value Fund | | | (292 | ) | | | (1,685,825 | ) | | | 1,686,117 | |
Small Cap Growth Equity Fund | | | (17,319 | ) | | | (1,140,623 | ) | | | 1,157,942 | |
Small Company Value Fund | | | 76 | | | | (174,026 | ) | | | 173,950 | |
Small/Mid Cap Value Fund | | | 173 | | | | (26,956 | ) | | | 26,783 | |
Total Return Bond Fund | | | 141,693 | | | | (5,000,897 | ) | | | 4,859,204 | |
The Funds did not have any unrecognized tax benefits at December 31, 2014, nor were there any increases or decreases in unrecognized tax benefits for the year then ended. The Funds recognize interest and penalties, if any, related to unrecognized tax benefits as an income tax expense in the Statements of Operations. During the year ended December 31, 2014, the Funds did not incur any such interest or penalties. The Funds are subject to examination by U.S. federal and state tax authorities for returns filed for the prior three fiscal years, or the returns filed to date for Funds in existence less than three years. Foreign taxes are provided for based on the Funds’ understanding of the tax rules and rates that exist in the foreign markets in which they invest.
7. Indemnifications
Under the Funds’ organizational documents, current and former Trustees and Officers are provided with specified rights to indemnification against liabilities arising in connection with the performance of their duties to the Funds, and shareholders are indemnified against personal liability for obligations of the Funds. In the normal course of business, the Funds may also enter into contracts that provide general indemnifications. The Funds’ maximum exposure under these arrangements is unknown as this would be dependent on future claims that may be made against the Funds. The risk of material loss from such claims is considered remote.
8. Acquisition of MML China Fund
Prior to the opening of business on April 28, 2014, the Foreign Fund acquired all assets and liabilities of the MML China Fund (“China Fund”), a series of MML Series Investment Fund II. The acquisition was accomplished by a tax-free exchange of 1,902,397 Initial Class shares and 339,839 Service Class shares of the China Fund, valued at $22,734,945 in total, for 1,701,290 Initial Class shares and 305,170 Service Class shares of the Foreign Fund. The investment portfolio of the China Fund, comprised of $22,769,454 in cash at April 25, 2014, was the principal asset acquired by the Foreign Fund. For financial reporting purposes, assets received and shares issued by the Foreign Fund were recorded at fair value. Immediately prior to the acquisition, the Foreign Fund’s net assets were $360,694,692.
220
Notes to Financial Statements (Continued)
Assuming the acquisition had been completed on January 1, 2014, the beginning of the annual reporting period of the Foreign Fund, the Foreign Fund’s pro forma results of operations for the year ended December 31, 2014, would have been as follows:
| | | | |
Net investment income | | $ | 11,040,925 | * |
Net gain on investments | | $ | (37,197,505 | )** |
Net increase in net assets resulting from operations | | $ | (26,156,580 | ) |
| * | $11,131,531 as reported, minus $101,414 of the China Fund premerger, plus $10,808 of pro-forma eliminated expenses. |
| ** | $(35,842,544) as reported, minus $1,354,961 of the China Fund premerger. |
Because both the Foreign Fund and the China Fund continuously sold and redeemed shares throughout the period, it is not practicable to provide pro-forma information on a per-share basis.
Because the combined investment portfolios have been managed as a single integrated portfolio since the acquisition was completed, it is also not practicable to separate the amounts of revenue and earnings of the China Fund that have been included in the Foreign Fund’s Statement of Operations since April 28, 2014.
See Note 5, Capital Share Transactions, for the changes in shares outstanding for the Foreign Fund during the period.
9. New Accounting Pronouncements
In June 2014, The Financial Accounting Standards Board (“FASB”) issued Accounting Standards Update No. 2014-11, Transfers & Servicing (Topic 860): “Repurchase-to-Maturity Transactions, Repurchase Financings, and Disclosures” (“ASU 2014-11”) to improve the financial reporting of repurchase agreements and other similar transactions. ASU 2014-11 includes expanded disclosure requirements for entities that enter into reverse repurchase agreements and similar transactions accounted for as secured borrowings. ASU 2014-11 is effective for annual reporting periods beginning after December 15, 2014 and interim periods beginning after December 15, 2015. Management is currently evaluating the implications of these changes and their impact on the financial statements.
10. Legal Proceedings
On December 7, 2010, the Trust was named as a defendant and putative member of the proposed defendant class of shareholders named in an adversary proceeding brought by The Official Committee of Unsecured Creditors of Tribune Company (the “Official Committee”) in the U.S. Bankruptcy Court for the District of Delaware, in connection with Tribune Company’s Chapter 11 bankruptcy proceeding (In re Tribune Company). The proceeding relates to a leveraged buyout (“LBO”) transaction by which Tribune Company converted to a privately-held company in 2007, and the putative defendant class is comprised of beneficial owners of shares of Tribune Company who received proceeds (the “Proceeds”) of the LBO. The Official Committee seeks to recover payments of those Proceeds.
The potential amounts sought to be recovered from the Equity Income Fund and Equity Index Fund, plus interest and the Official Committee’s court costs, are approximately $4,562,800 and $207,706, respectively.
In addition, on June 2, 2011, the Equity Income Fund was named as a defendant in two closely related, parallel adversary proceedings brought in connection with the Tribune Company’s LBO by Deutsche Bank Trust Company Americas, in its capacity as successor indenture trustee for a certain series of Senior Notes, Law Debenture Trust Company of New York, in its capacity as successor indenture trustee for a certain series of Senior Notes, and Wilmington Trust Company, in its capacity as successor indenture trustee for the PHONES Notes (together, the “Plaintiffs”), one in the United States District Court for the District of Massachusetts and one in the United States District Court for the District of Connecticut. The Plaintiffs also seek to recover payments of the Proceeds.
The Funds cannot predict the outcome of these proceedings. Accordingly, the Funds have not accrued any amounts related to these proceedings. If the proceedings were to be decided in a manner adverse to the Funds, or if the Funds were to enter into a settlement
221
Notes to Financial Statements (Continued)
agreement with the Official Committee or the Plaintiffs, as applicable, the payment of such judgment or settlement could potentially have a material adverse effect on the Funds’ net asset values depending on the net assets of each applicable Fund at the time of such judgment or settlement.
11. Subsequent Events
In preparation of these financial statements, management has evaluated the events and transactions subsequent to December 31, 2014, through the date when the financial statements were issued, and determined that there are no subsequent events or transactions that would require adjustments to or disclosures in the Funds’ financial statements.
222
Report of Independent Registered Public Accounting Firm
To the Board of Trustees of MML Series Investment Fund and Shareholders of MML Blue Chip Growth Fund, MML Equity Income Fund, MML Equity Index Fund, MML Focused Equity Fund, MML Foreign Fund, MML Fundamental Growth Fund, MML Fundamental Value Fund, MML Global Fund, MML Growth & Income Fund, MML Income & Growth Fund, MML International Equity Fund, MML Large Cap Growth Fund, MML Managed Volatility Fund, MML Mid Cap Growth Fund, MML Mid Cap Value Fund, MML Small Cap Growth Equity Fund, MML Small Company Value Fund, MML Small/Mid Cap Value Fund, and MML Total Return Bond Fund (formerly known as MML PIMCO Total Return Fund) (collectively, the “Funds”):
We have audited the accompanying statements of assets and liabilities, including the portfolios of investments, of the Funds as of December 31, 2014, and the related statements of operations for the year then ended, the statements of changes in net assets for each of the two years in the period then ended, and the financial highlights for each of the periods presented. These financial statements and financial highlights are the responsibility of the Funds’ management. Our responsibility is to express an opinion on these financial statements and financial highlights based on our audits.
We conducted our audits in accordance with the standards of the Public Company Accounting Oversight Board (United States). Those standards require that we plan and perform the audit to obtain reasonable assurance about whether the financial statements and financial highlights are free of material misstatement. The Funds are not required to have, nor were we engaged to perform, an audit of their internal control over financial reporting. Our audits included consideration of internal control over financial reporting as a basis for designing audit procedures that are appropriate in the circumstances, but not for the purpose of expressing an opinion on the effectiveness of the Funds’ internal control over financial reporting. Accordingly, we express no such opinion. An audit also includes examining, on a test basis, evidence supporting the amounts and disclosures in the financial statements, assessing the accounting principles used and significant estimates made by management, as well as evaluating the overall financial statement presentation. Our procedures included confirmation of securities owned as of December 31, 2014, by correspondence with the custodian and brokers; where replies were not received from brokers, we performed other auditing procedures. We believe that our audits provide a reasonable basis for our opinion.
In our opinion, the financial statements and financial highlights referred to above present fairly, in all material respects, the financial position of each of the Funds as of December 31, 2014, the results of their operations for the year ended, the changes in their net assets for each of the two years in the period then ended, and the financial highlights for each of the periods presented, in conformity with accounting principles generally accepted in the United States of America.
Deloitte & Touche LLP
Boston, Massachusetts
February 23, 2015
223
Trustees and Officers (Unaudited)
The following table lists the Trust’s Trustees and Officers as of December 31, 2014; their address and age; their position with the Trust; the length of time holding that position with the Trust; their principal occupation(s) during the past five years; the number of portfolios in the fund complex they oversee; and other directorships they hold in companies subject to registration or reporting requirements of the Securities Exchange Act of 1934 (generally called “public companies”) or in registered investment companies. The Trust’s Statement of Additional Information includes additional information about the Trust’s Trustees and is available, without charge, upon request by calling 1-888-309-3539 or by writing MML Series Investment Fund, c/o Massachusetts Mutual Life Insurance Company, 100 Bright Meadow Blvd., Enfield, Connecticut 06082, Attention: Retirement Services Marketing.
Disinterested Trustees
| | | | | | | | | | |
Name, Address*, and Age | | Position(s)
Held with
Trust | | Term of
Office** and
Length of
Time Served | | Principal Occupation(s)
During Past 5 Years | | Number of
Portfolios in
Fund Complex
Overseen by Trustee | | Other Directorships
Held by Trustee |
Richard H. Ayers Age: 72 | | Chairman Trustee | | Since 2010 Since 1999 | | Retired. | | 89 | | Director (2008-2011), Celera Corporation; Director (1996-2008), Applera Corporation; Chairman (since 2010), Trustee (since 1996), MassMutual Select Funds (open-end investment company); Chairman and Trustee (since 2012), MML Series Investment Fund II (open-end investment company); Chairman and Trustee (since 2012), MassMutual Premier Funds (open-end investment company). |
| | | | | |
Allan W. Blair Age: 66 | | Trustee | | Since 2003 | | Retired; President and Chief Executive Officer (1996-2014), Economic Development Council of Western Massachusetts; President and Chief Executive Officer (1984-2014), Westover Metropolitan Development Corporation. | | 89 | | Trustee (since 2003), MassMutual Select Funds (open-end investment company); Trustee (since 2012), MML Series Investment Fund II (open-end investment company); Trustee (since 2012), MassMutual Premier Funds (open-end investment company). |
| | | | | |
Nabil N. El-Hage
Age: 56 | | Trustee Chairman | | Since 2012 (2006-
2012) | | Chairman (since 2011), Academy of Executive Education, LLC; Consultant (2010-2011); Senior Associate Dean for External Relations (2009-2010), Thomas Henry Carroll Ford Foundation Adjunct Professor of Business Administration (2009-2010), Professor of Management Practice (2005-2009), Harvard Business School. | | 89 | | Director (since 2011), Argo Group International Holdings, Ltd.; Director (2007-2010), Virtual Radiologic Corporation; Trustee (since 2012), MassMutual Select Funds (open-end investment company); Trustee (since 2005), Chairman (2006-2012), MML Series Investment Fund II (open-end investment company); Trustee (since 2003), Chairman (2006-2012), MassMutual Premier Funds (open-end investment company). |
| | | | | |
Maria D. Furman
Age: 60 | | Trustee | | Since 2012 | | Retired. | | 89 | | Trustee (since 2011), GMO Series Trust (open-end investment company); Trustee (since 2012), MassMutual Select Funds (open-end investment company); Trustee (since 2005), MML Series Investment Fund II (open-end investment company); Trustee (since 2004), MassMutual Premier Funds (open-end investment company). |
224
Trustees and Officers (Unaudited) (Continued)
| | | | | | | | | | |
Name, Address*, and Age | | Position(s)
Held with
Trust | | Term of
Office** and
Length of
Time Served | | Principal Occupation(s)
During Past 5 Years | | Number of
Portfolios in
Fund Complex
Overseen by Trustee | | Other Directorships
Held by Trustee |
R. Alan Hunter, Jr. Age: 68 | | Trustee | | Since 2003 | | Retired. | | 89 | | Director (since 2007), Actuant Corporation; Trustee (since 2003), MassMutual Select Funds (open-end investment company); Trustee (since 2012), MML Series Investment Fund II (open-end investment company); Trustee (since 2012), MassMutual Premier Funds (open-end investment company). |
| | | | | |
F. William Marshall, Jr. Age: 72 | | Trustee | | Since 1996 | | Retired; Consultant (1999-2009). | | 127*** | | Trustee (since 2000), Denver Board – Oppenheimer Funds; Trustee (since 1996), MassMutual Select Funds (open-end investment company); Trustee (since 2012), MML Series Investment Fund II (open-end investment company); Trustee (since 2012), MassMutual Premier Funds (open-end investment company). |
| | | | | |
C. Ann Merrifield
Age: 63 | | Trustee | | Since
2012 | | Retired; President and Chief Executive Officer (2012-2014), PathoGenetix; Senior Vice President, Genzyme Business Excellence Initiative (2009-2011), President, Biosurgery (2003-2009), Genzyme Corporation. | | 89 | | Director (since 2014), Flexion Therapeutics; Director (since 2014), InVivo Therapeutics; Trustee (since 2012), MassMutual Select Funds (open-end investment company); Trustee (since 2005), MML Series Investment Fund II (open-end investment company); Trustee (since 2004), MassMutual Premier Funds (open-end investment company). |
| | | | | |
Susan B. Sweeney Age: 62 | | Trustee | | Since 2009 | | Retired; Senior Vice President and Chief Investment Officer (2010-2014), Selective Insurance Group (property and casualty company); Senior Managing Director (2008-2010), Ironwood Capital (private equity firm). | | 91^ | | Trustee (since 2012), Babson Capital Corporate Investors (closed-end investment company); Trustee (since 2012), Babson Capital Participation Investors (closed-end investment company); Trustee (since 2009), MassMutual Select Funds (open-end investment company); Trustee (since 2012), MML Series Investment Fund II (open-end investment company); Trustee (since 2012), MassMutual Premier Funds (open-end investment company). |
225
Trustees and Officers (Unaudited) (Continued)
Interested Trustees
| | | | | | | | | | |
Name, Address*, and Age | | Position(s)
Held with
Trust | | Term of
Office** and
Length of
Time Served | | Principal Occupation(s)
During Past 5 Years | | Number of
Portfolios in
Fund Complex
Overseen by Trustee | | Other Directorships
Held by Trustee |
Robert E. Joyal^^ Age: 69 | | Trustee | | Since 2003 | | Retired. | | 91^ | | Director (since 2013), Leucadia National Corporation (holding company); Director (since 2012), Ormat Technologies, Inc.; Director (2006-2014), Jefferies Group LLC (investment bank); Director (2007-2011), Scottish Re Group Ltd.; Director (2003-2010), Alabama Aircraft Industries, Inc.; Trustee (since 2003), Babson Capital Corporate Investors (closed-end investment company); Trustee (since 2003), Babson Capital Participation Investors (closed-end investment company); Trustee (since 2003), MassMutual Select Funds (open-end investment company); Trustee (since 2012), MML Series Investment Fund II (open-end investment company); Trustee (since 2012), MassMutual Premier Funds (open-end investment company). |
| | | | | |
Elaine A. Sarsynski^^^ Age: 59 | | Trustee Vice Chairperson | | Since
2008 (2011-
2012) | | Executive Vice President (since 2008), MassMutual Retirement Services Division, MassMutual; Chairman (since 2013), President, Chairman & CEO (2012-2013), Chairman & CEO (2008-2012), President & CEO (2006-2008), MassMutual International LLC. | | 89 | | Director (since 2012), Horizon Technology Finance Management LLC; Director (since 2013), MML Advisers; Trustee (since 2008), MassMutual Select Funds (open-end investment company); Vice Chairperson (2011-2012), Trustee (since 2011), MML Series Investment Fund II (open-end investment company); Vice Chairperson (2011-2012), Trustee (since 2011), MassMutual Premier Funds (open-end investment company). |
Principal Officers who are Not Trustees
| | | | | | | | |
Name, Address*, and Age | | Position(s) Held
with Trust | | Term of
Office# and
Length of
Time Served | | Principal Occupation(s) During Past 5 Years | | Number of
Portfolios in
Fund Complex
Overseen by Officer |
Jeffrey M. Dube Age: 46 | | President | | Since
2014 | | Vice President (since 2012), Assistant Vice President (2011-2012), Managing Director (2009-2011), MassMutual; President (since 2014), MML Series Investment Fund II (open-end investment company). | | 36 |
| | | | |
Michael C. Eldredge
Age: 50 | | Vice President | | Since
2009 | | Head of Investments and portfolio manager (since 2014), MML Advisers; Vice President (since 2008), MassMutual; Vice President (2005-2008), ING; Vice President (since 2009), MassMutual Select Funds (open-end investment company); Vice President (since 2009), MML Series Investment Fund II (open-end investment company); Vice President (since 2009), MassMutual Premier Funds (open-end investment company). | | 89 |
| | | | |
Andrew M. Goldberg Age: 48 | | Vice President, Secretary, and Chief Legal Officer Assistant Secretary | | Since
2008 (2001-
2008) | | Assistant Vice President and Counsel (since 2004), MassMutual; Assistant Secretary (since 2013), MML Advisers; Vice President, Secretary, and Chief Legal Officer (since 2008), Assistant Secretary (2001-2008), MassMutual Select Funds (open-end investment company); Vice President, Secretary, (formerly known as “Clerk”), and Chief Legal Officer (since 2008), Assistant Clerk (2005-2008), MML Series Investment Fund II (open-end investment company); Vice President, Secretary, (formerly known as “Clerk”), and Chief Legal Officer (since 2008), Assistant Clerk (2004-2008), MassMutual Premier Funds (open-end investment company). | | 89 |
226
Trustees and Officers (Unaudited) (Continued)
| | | | | | | | |
Name, Address*, and Age | | Position(s) Held
with Trust | | Term of
Office# and
Length of
Time Served | | Principal Occupation(s) During Past 5 Years | | Number of
Portfolios in
Fund Complex
Overseen by Officer |
Brian K. Haendiges Age: 54 | | Vice President | | Since
2014 | | Vice President (since 2014), MML Advisers; Senior Vice President (since 2014), Vice President (2010-2014), MassMutual; Vice President (since 2014), MassMutual Select Funds (open-end investment company); Vice President (since 2014), MML Series Investment Fund II (open-end investment company); Vice President (since 2014), MassMutual Premier Funds (open-end investment company). | | 89 |
| | | | |
Nicholas H. Palmerino Age: 49 | | Chief Financial Officer and Treasurer | | Since
2006 | | Vice President (since 2014), Assistant Vice President (2006-2014), MassMutual; Chief Financial Officer and Treasurer (since 2006), MassMutual Select Funds (open-end investment company); Chief Financial Officer and Treasurer (since 2006), MML Series Investment Fund II (open-end investment company); Chief Financial Officer and Treasurer (since 2006), MassMutual Premier Funds (open-end investment company). | | 89 |
| | | | |
Philip S. Wellman Age: 50 | | Vice President and Chief Compliance Officer | | Since
2007 | | Vice President and Chief Compliance Officer (since 2013), MML Advisers; Vice President and Associate General Counsel (since 2014), Vice President, Associate General Counsel, and Chief Compliance Officer (Mutual Funds and Investment Advisory) (2008-2014), Vice President, Associate General Counsel, and Chief Compliance Officer (Mutual Funds) (2007-2008), MassMutual; Vice President and Chief Compliance Officer (since 2007), MassMutual Select Funds (open-end investment company); Vice President and Chief Compliance Officer (since 2007), MML Series Investment Fund II (open-end investment company); Vice President and Chief Compliance Officer (since 2007), MassMutual Premier Funds (open-end investment company). | | 89 |
| | | | |
Eric H. Wietsma Age: 48 | | Vice President | | Since
2006 | | Director and President (since 2013), MML Advisers; Senior Vice President (since 2010), Corporate Vice President (2007-2010), MassMutual; President (since 2008), Vice President (2006-2008), MassMutual Select Funds (open-end investment company); Vice President (since 2006), MML Series Investment Fund II (open-end investment company); President (since 2008) Vice President (2006-2008), MassMutual Premier Funds (open-end investment company). | | 89 |
| * | The address of each Trustee and Principal Officer is the same as that for the Trust; 100 Bright Meadow Blvd., Enfield, CT 06082. |
| ** | Each Trustee of the Trust serves until the next meeting of shareholders called for the purpose of electing Trustees and until the election and qualification of his or her successor or until he or she dies, resigns, or is removed. Notwithstanding the foregoing, unless the Trustees determine that it is desirable and in the best interest of the Trust that an exception to the retirement policy of the Trust be made, a Trustee shall retire and cease to serve as a Trustee upon the conclusion of the calendar year in which such Trustee attains the age of seventy-two years. Such an exception was made for any Trustee who attained the age of seventy-two years during 2014. Such Trustees shall retire and cease to serve as a Trustee on or before December 31, 2015. |
| | The Chairperson is elected to hold such office for a term of three years or until their successor is elected and qualified to carry out the duties and responsibilities of their office, or until he or she retires, dies, resigns, is removed, or becomes disqualified. |
| *** | Denver Board – Oppenheimer Funds is deemed to be part of the Fund Complex because it is managed by OFI Global Asset Management, Inc., an affiliate of MML Advisers. |
| ^ | Babson Capital Participation Investors and Babson Capital Corporate Investors are deemed to be a part of the Fund Complex because they are managed by Babson Capital Management LLC, an affiliate of MML Advisers. |
| ^^ | Mr. Joyal is an “Interested Person,” as that term is defined in the 1940 Act, through his position as a director of Leucadia National Corporation, which controls Jefferies Group LLC, a broker-dealer that may execute portfolio transactions and/or engage in principal transactions with the Funds, other investment companies advised by MML Advisers or holding themselves out to investors as related companies for purposes of investment or investor services, or any other advisory accounts over which MML Advisers has brokerage placement discretion. |
| ^^^ | Ms. Sarsynski is an Interested Person as a director of MML Advisers. |
| # | The President, Treasurer, and Secretary are elected to hold such office until their successor is elected and qualified to carry out the duties and responsibilities of their office, or until he or she dies, resigns, is removed, or becomes disqualified. Each other officer shall hold office at the pleasure of the Trustees. |
227
Federal Tax Information (Unaudited)
For corporate shareholders, a portion of the ordinary dividends paid during the Fund(s)’ year ended December 31, 2014, qualified for the dividends received deduction, as follows:
| | | | |
| | | Dividends Received
Deductions | |
Blue Chip Growth Fund | | | 100.00 | % |
Equity Income Fund | | | 100.00 | % |
Equity Index Fund | | | 100.00 | % |
Focused Equity Fund | | | 56.28 | % |
Fundamental Value Fund | | | 100.00 | % |
Global Fund | | | 59.27 | % |
Growth & Income Fund | | | 100.00 | % |
Income & Growth Fund | | | 100.00 | % |
Large Cap Growth Fund | | | 10.16 | % |
Managed Volatility Fund | | | 100.00 | % |
Mid Cap Growth Fund | | | 41.20 | % |
Mid Cap Value Fund | | | 23.32 | % |
Small Company Value Fund | | | 100.00 | % |
Small/Mid Cap Value Fund | | | 100.00 | % |
For the year ended December 31, 2014, the following Fund(s) earned the following foreign sources of income:
| | | | |
| | | Amount | |
Foreign Fund | | $ | 11,346,235 | |
Global Fund | | | 2,336,883 | |
228
Other Information (Unaudited)
Proxy Voting
A description of the policies and procedures that each Fund’s investment adviser and subadvisers use to vote proxies relating to the Fund’s portfolio securities is available, without charge, upon request, by calling 1-888-309-3539, and on the Securities and Exchange Commission’s (“SEC”) website at http://www.sec.gov.
Information regarding how the Funds voted proxies relating to portfolio securities during the most recent period ended June 30 is available, without charge, upon request, on the MassMutual website at http://www.massmutual.com/funds and on the SEC’s website at http://www.sec.gov.
Quarterly Reporting
The Funds file their complete schedule of portfolio holdings with the SEC for the first and third quarters of each fiscal year on Form N-Q. The Funds’ Forms N-Q are available on the SEC’s website at http://www.sec.gov and may be reviewed and copied at the SEC’s Public Reference Room in Washington D.C. Information on the operation of the SEC’s Public Reference Room may be obtained by calling 1-800-SEC-0330.
Trustees Approval of Investment Advisory Contracts
At their meeting in November 2014, the Trustees, including the Trustees who are not “interested persons” (as such term is defined in the 1940 Act) of the Trust, MML Advisers, or subadvisers (the “Independent Trustees”), approved a new subadvisory agreement (“New Subadvisory Agreement”) with MetWest for the Total Return Bond Fund (the “Fund”). In preparation for the meeting, the Trustees requested, and MML Advisers provided in advance, certain materials relevant to the consideration of the New Subadvisory Agreement. In all of their deliberations, the Trustees were advised by independent counsel.
In reviewing the New Subadvisory Agreement, the Independent Trustees discussed with MML Advisers and considered a wide range of information about, among other things: (i) MetWest and its respective personnel with responsibilities for providing services to the Fund; (ii) the terms of the New Subadvisory Agreement; (iii) the scope and quality of services that MetWest will provide under the New Subadvisory Agreement; (iv) the historical investment performance track record of MetWest; and (v) the fees payable to MetWest by MML Advisers for the Fund and the effect of such fees on the profitability to MML Advisers.
Prior to the votes being taken to approve the New Subadvisory Agreement, the Independent Trustees met separately in executive session to discuss the appropriateness of such contract. The Independent Trustees weighed the foregoing matters in light of the advice given to them by their independent legal counsel as to the law applicable to the review of investment advisory contracts. In arriving at a decision, the Trustees, including the Independent Trustees, did not identify any single matter as all-important or controlling. The foregoing summary does not detail all of the matters considered.
Based on the foregoing, the Trustees concluded that: (i) overall, they were satisfied with the nature, extent, and quality of services expected to be provided under the New Subadvisory Agreement; (ii) MML Advisers’ projected levels of profitability due to the New Subadvisory Agreement were not excessive and the subadvisory fee amounts under the New Subadvisory Agreement are fair and reasonable; (iii) the investment processes, research capabilities, and philosophies of MetWest appear well suited to the Fund, given its investment objectives and policies; and (iv) the terms of the New Subadvisory Agreement are fair and reasonable with respect to the Fund and are in the best interests of the Fund’s shareholders. After carefully considering the information summarized above, the Trustees, including the Independent Trustees voting separately, unanimously voted to approve the New Subadvisory Agreement.
The New Subadvisory Agreement became effective on December 16, 2014.
Also at their meeting in November 2014, the Trustees, including the Independent Trustees, reviewed and approved a proposal to lower the management fees of the Focused Equity Fund, Fundamental Growth Fund, Fundamental Value Fund, International Equity Fund, and Total Return Bond Fund (the “Funds”). In arriving at their decision, the Trustees considered materials provided by MML Advisers, including revised profitability schedules for the Funds. In their deliberations, the Trustees were advised by independent counsel.
The amendments to the management agreements for the Funds are expected to become effective on May 1, 2015.
229
Other Information (Unaudited) (Continued)
Fund Expenses December 31, 2014
Expense Examples:
The following information is in regards to expenses for the six months ended December 31, 2014:
As a shareholder of the Funds, you incur ongoing costs, including advisory fees, distribution and/or service (12b-1) fees, and other Fund expenses. These examples are intended to help you understand your ongoing costs (in dollars) of investing in the Funds and to compare these costs with the ongoing costs of investing in other mutual funds. These examples are based on an investment of $1,000 invested for the six months ended December 31, 2014.
Actual Expenses:
The first four columns of the table below provide information about actual account values and actual expenses. You may use this information, together with the amount you invested, to estimate the expenses that you paid over the period. Simply divide your account value by $1,000 (for example, an $8,600 account value divided by $1,000 = 8.6), then multiply the result by the number under the heading entitled “Operating Expenses Incurred” to estimate the expenses you paid on your account during this period.
Hypothetical Example for Comparison Purposes:
The last two columns of the table below provide information about hypothetical account values and hypothetical expenses based on the Fund’s actual expense ratio and an assumed rate of return of 5% per year before expenses, which is not the Fund’s actual return. The hypothetical account values and expenses may not be used to estimate the actual ending account balance or expenses you paid for the period. You may use this information to compare the ongoing costs of investing in the Fund and other funds. To do so, compare this 5% hypothetical example with the 5% hypothetical examples that appear in the shareholder reports of the other funds.
Please note that the expenses shown in the table are meant to highlight your ongoing costs only and do not reflect any transactional costs. Therefore, the last two columns of the table are useful in comparing ongoing costs only, and will not help you determine the relative total costs of owning different funds. In addition, if these transactional costs were included, your costs would have been higher.
| | | | | | | | | | | | | | | | | | | | | | | | |
| | | Beginning
Value | | | Annualized
Expense
Ratio | | | Ending
Value (Based
on Actual
Returns and
Expenses) | | | Operating
Expenses
Incurred* | | | Ending
Value
(Based on
Hypothetical
Returns and
Expenses) | | | Operating
Expenses
Incurred* | |
| Blue Chip Growth Fund | | | | | | | | | | | | | | | | | | | | | | | | |
Initial Class | | $ | 1,000 | | | | 0.79 | % | | $ | 1,060.10 | | | $ | 4.10 | | | $ | 1,021.20 | | | $ | 4.02 | |
Service Class | | | 1,000 | | | | 1.04 | % | | | 1,058.50 | | | | 5.40 | | | | 1,020.00 | | | | 5.30 | |
| Equity Income Fund | | | | | | | | | | | | | | | | | | | | | | | | |
Initial Class | | | 1,000 | | | | 0.78 | % | | | 1,013.00 | | | | 3.96 | | | | 1,021.30 | | | | 3.97 | |
Service Class | | | 1,000 | | | | 1.03 | % | | | 1,011.80 | | | | 5.22 | | | | 1,020.00 | | | | 5.24 | |
| Equity Index Fund | | | | | | | | | | | | | | | | | | | | | | | | |
Class I | | | 1,000 | | | | 0.44 | % | | | 1,058.60 | | | | 2.28 | | | | 1,023.00 | | | | 2.24 | |
Class II | | | 1,000 | | | | 0.28 | % | | | 1,059.50 | | | | 1.45 | | | | 1,023.80 | | | | 1.43 | |
Class III | | | 1,000 | | | | 0.14 | % | | | 1,060.30 | | | | 0.73 | | | | 1,024.50 | | | | 0.71 | |
Service Class I | | | 1,000 | | | | 0.69 | % | | | 1,057.90 | | | | 3.58 | | | | 1,021.70 | | | | 3.52 | |
| Focused Equity Fund | | | | | | | | | | | | | | | | | | | | | | | | |
Class II | | | 1,000 | | | | 0.90 | % | | | 1,054.90 | | | | 4.66 | | | | 1,020.70 | | | | 4.58 | |
Service Class I | | | 1,000 | | | | 1.15 | % | | | 1,053.50 | | | | 5.95 | | | | 1,019.40 | | | | 5.85 | |
230
Other Information (Unaudited) (Continued)
| | | | | | | | | | | | | | | | | | | | | | | | |
| | | Beginning
Value | | | Annualized
Expense
Ratio | | | Ending
Value (Based
on Actual
Returns and
Expenses) | | | Operating
Expenses
Incurred* | | | Ending
Value
(Based on
Hypothetical
Returns and
Expenses) | | | Operating
Expenses
Incurred* | |
| Foreign Fund | | | | | | | | | | | | | | | | | | | | | | | | |
Initial Class | | $ | 1,000 | | | | 0.97 | % | | $ | 894.40 | | | $ | 4.63 | | | $ | 1,020.30 | | | $ | 4.94 | |
Service Class | | | 1,000 | | | | 1.22 | % | | | 894.10 | | | | 5.82 | | | | 1,019.10 | | | | 6.21 | |
| Fundamental Growth Fund | | | | | | | | | | | | | | | | | | | | | | | | |
Class II | | | 1,000 | | | | 0.85 | % | | | 1,069.20 | | | | 4.43 | | | | 1,020.90 | | | | 4.33 | |
Service Class I | | | 1,000 | | | | 1.10 | % | | | 1,068.10 | | | | 5.73 | | | | 1,019.70 | | | | 5.60 | |
| Fundamental Value Fund | | | | | | | | | | | | | | | | | | | | | | | | |
Class II | | | 1,000 | | | | 0.79 | % | | | 1,046.30 | | | | 4.07 | | | | 1,021.20 | | | | 4.02 | |
Service Class I | | | 1,000 | | | | 1.04 | % | | | 1,044.60 | | | | 5.36 | | | | 1,020.00 | | | | 5.30 | |
| Global Fund | | | | | | | | | | | | | | | | | | | | | | | | |
Class I | | | 1,000 | | | | 0.90 | % | | | 993.20 | | | | 4.52 | | | | 1,020.70 | | | | 4.58 | |
Class II | | | 1,000 | | | | 0.80 | % | | | 993.60 | | | | 4.02 | | | | 1,021.20 | | | | 4.08 | |
Service Class I | | | 1,000 | | | | 1.15 | % | | | 990.90 | | | | 5.77 | | | | 1,019.40 | | | | 5.85 | |
| Growth & Income Fund | | | | | | | | | | | | | | | | | | | | | | | | |
Initial Class | | | 1,000 | | | | 0.56 | % | | | 1,057.60 | | | | 2.90 | | | | 1,022.40 | | | | 2.85 | |
Service Class | | | 1,000 | | | | 0.81 | % | | | 1,056.60 | | | | 4.20 | | | | 1,021.10 | | | | 4.13 | |
| Income & Growth Fund | | | | | | | | | | | | | | | | | | | | | | | | |
Initial Class | | | 1,000 | | | | 0.70 | % | | | 1,043.60 | | | | 3.61 | | | | 1,021.70 | | | | 3.57 | |
Service Class | | | 1,000 | | | | 0.95 | % | | | 1,042.50 | | | | 4.89 | | | | 1,020.40 | | | | 4.84 | |
| International Equity Fund | | | | | | | | | | | | | | | | | | | | | | | | |
Class II | | | 1,000 | | | | 1.00 | % | | | 923.80 | | | | 4.85 | | | | 1,020.20 | | | | 5.09 | |
Service Class I | | | 1,000 | | | | 1.25 | % | | | 923.00 | | | | 6.06 | | | | 1,018.90 | | | | 6.36 | |
| Large Cap Growth Fund | | | | | | | | | | | | | | | | | | | | | | | | |
Initial Class | | | 1,000 | | | | 0.69 | % | | | 1,066.70 | | | | 3.59 | | | | 1,021.70 | | | | 3.52 | |
Service Class | | | 1,000 | | | | 0.94 | % | | | 1,065.80 | | | | 4.89 | | | | 1,020.50 | | | | 4.79 | |
| Managed Volatility Fund | | | | | | | | | | | | | | | | | | | | | | | | |
Initial Class | | | 1,000 | | | | 0.93 | % | | | 1,013.70 | | | | 4.72 | | | | 1,020.50 | | | | 4.74 | |
Service Class | | | 1,000 | | | | 1.18 | % | | | 1,012.20 | | | | 5.98 | | | | 1,019.30 | | | | 6.01 | |
| Mid Cap Growth Fund | | | | | | | | | | | | | | | | | | | | | | | | |
Initial Class | | | 1,000 | | | | 0.81 | % | | | 1,065.30 | | | | 4.22 | | | | 1,021.10 | | | | 4.13 | |
Service Class | | | 1,000 | | | | 1.06 | % | | | 1,063.10 | | | | 5.51 | | | | 1,019.90 | | | | 5.40 | |
| Mid Cap Value Fund | | | | | | | | | | | | | | | | | | | | | | | | |
Initial Class | | | 1,000 | | | | 0.88 | % | | | 1,058.80 | | | | 4.57 | | | | 1,020.80 | | | | 4.48 | |
Service Class | | | 1,000 | | | | 1.13 | % | | | 1,057.20 | | | | 5.86 | | | | 1,019.50 | | | | 5.75 | |
| Small Cap Growth Equity Fund | | | | | | | | | | | | | | | | | | | | | | | | |
Initial Class | | | 1,000 | | | | 1.08 | % | | | 1,021.10 | | | | 5.50 | | | | 1,019.80 | | | | 5.50 | |
Service Class | | | 1,000 | | | | 1.33 | % | | | 1,018.90 | | | | 6.77 | | | | 1,018.50 | | | | 6.77 | |
| Small Company Value Fund | | | | | | | | | | | | | | | | | | | | | | | | |
Class II | | | 1,000 | | | | 1.15 | % | | | 975.30 | | | | 5.73 | | | | 1,019.40 | | | | 5.85 | |
Service Class I | | | 1,000 | | | | 1.40 | % | | | 974.40 | | | | 6.97 | | | | 1,018.10 | | | | 7.12 | |
| Small/Mid Cap Value Fund | | | | | | | | | | | | | | | | | | | | | | | | |
Initial Class | | | 1,000 | | | | 0.80 | % | | | 1,008.90 | | | | 4.05 | | | | 1,021.20 | | | | 4.08 | |
Service Class | | | 1,000 | | | | 1.05 | % | | | 1,007.20 | | | | 5.31 | | | | 1,019.90 | | | | 5.35 | |
| Total Return Bond Fund | | | | | | | | | | | | | | | | | | | | | | | | |
Class II | | | 1,000 | | | | 0.65 | % | | | 1,017.00 | | | | 3.30 | | | | 1,021.96 | | | | 3.31 | |
Service Class I | | | 1,000 | | | | 0.90 | % | | | 1,015.70 | | | | 4.57 | | | | 1,020.60 | | | | 4.58 | |
| * | Expenses are calculated using the annualized expense ratio for the six months ended December 31, 2014, multiplied by the average account value over the period, multiplied by the number of days in the period, divided by the number of days in the year, unless stated otherwise. |
231
| | |
Underwriter: MML Distributors, LLC 100 Bright Meadow Blvd. Enfield, CT 06082 | |  |

| | |
© 2015 Massachusetts Mutual Life Insurance Company, Springfield, MA. All rights reserved. www.massmutual.com. MassMutual Financial Group is a marketing name for Massachusetts Mutual Life Insurance Company (MassMutual) and its affiliated companies and sales representatives. Investment Adviser: MML Investment Advisers, LLC | | CRN201603-190351 |
Item 2. Code of Ethics.
As of December 31, 2014, the Registrant adopted a Code of Ethics that applies to the Principal Executive Officer and Principal Financial Officer pursuant to the Sarbanes-Oxley Act of 2002. For the year ended December 31, 2014, there were no amendments to a provision of the Code of Ethics. A copy of its Code of Ethics is filed with this Form N-CSR under Item 12(a)(1).
Item 3. Audit Committee Financial Expert.
The Registrant’s Board of Trustees has determined that R. Alan Hunter, Jr. and Nabil N. El-Hage, both members of the Audit Committee, are audit committee financial experts as defined by the Securities and Exchange Commission (the “SEC”). Mr. Hunter and Mr. El-Hage are both “independent” as defined by the SEC for purposes of audit committee financial expert determinations.
Item 4. Principal Accountant Fees and Services.
References below to Deloitte & Touche LLP include its affiliates where applicable.
| | (a) | AUDIT FEES: The aggregate fees billed to the Registrant for professional services rendered by its independent auditors, Deloitte & Touche LLP, for the audit of the Registrant’s annual financial statements for the fiscal years ended 2014 and 2013 were $793,707 and $778,697, respectively. |
| | (b) | AUDIT RELATED FEES: No such fees were billed to the Registrant by Deloitte & Touche LLP for the fiscal years ended 2014 and 2013. No such fees were billed to the Registrant’s adviser and any entity controlling, controlled by, or under common control with the adviser that provides ongoing services to the Registrant by Deloitte & Touche LLP* for the fiscal years ended 2014 and 2013. |
| | (c) | TAX FEES: The aggregate fees billed to the Registrant for professional services rendered by Deloitte & Touche LLP for the review of Form 1120-RIC, Form 8613, excise distribution projections, distribution calculation and reasonable out of pocket expenses for the fiscal years ended 2014 and 2013 were $120,910 and $123,000, respectively. No such fees were billed to the Registrant’s adviser and any entity controlling, controlled by, or under common control with the adviser that provides ongoing services to the Registrant by Deloitte & Touche LLP* for the fiscal years ended 2014 and 2013. |
| | (d) | ALL OTHER FEES: No such fees were billed to the Registrant by Deloitte & Touche LLP for the fiscal years ended 2014 and 2013. No such fees were billed to the Registrant’s adviser and any entity controlling, controlled by, or under common control with the adviser that provides ongoing services to the Registrant by Deloitte & Touche LLP* for the fiscal years ended 2014 and 2013. |
| | (e) | (1) AUDIT COMMITTEE PRE-APPOVAL POLICY: All services to be performed for the Registrant by Deloitte & Touche LLP must be pre-approved by the audit committee. All services performed during the fiscal years ended 2014 and 2013 were pre-approved by the committee. |
(2) Not applicable.
| | (g) | The aggregate non-audit fees billed by Deloitte & Touche LLP for services rendered to the Registrant, the Registrant’s adviser and any entity controlling, controlled by, or under common control with the adviser that provides ongoing services to the Registrant, for the fiscal years ended 2014 and 2013 were $1,959,810 and $706,057, respectively. |
| | (h) | The audit committee considers whether the provision of non-audit services by Deloitte & Touche LLP to the Registrant’s adviser and any entity controlling, controlled by, or under common control with the adviser that provides ongoing services to the Registrant that were not pre-approved pursuant to paragraph (c)(7)(ii) of Rule 2-01 of Regulation S-X is compatible with maintaining Deloitte & Touche LLP’s independence. |
| * | Refers to fees that were required to be approved by the audit committee for services that relate directly to the operations and financial reporting of the Registrant. |
Item 5. Audit Committee of Listed Registrants.
Not applicable to this filing.
Item 6. Investments.
Please see portfolio of investments contained in the Reports to Stockholders included under Item 1 of this form N-CSR.
Item 7. Disclosure of Proxy Voting Policies and Procedures for Closed-End Management Investment Companies.
Not applicable to this filing.
Item 8. Portfolio Managers of Closed-End Management Investment Companies.
Not applicable to this filing.
Item 9. Purchases of Equity Securities by Closed-End Management Investment Company and Affiliated Purchasers.
Not applicable to this filing.
Item 10. Submission of Matters to a Vote of Security Holders.
Not applicable to this filing.
Item 11. Controls and Procedures.
(a) The Registrant’s Principal Executive Officer and Principal Financial Officer have concluded that the Registrant’s disclosure controls and procedures (as defined in Rule 30a-3(c) under the Investment Company Act of 1940, as amended (the “1940 Act”) (17 CFR 270.30a-3(c))) are effective, as of a date within 90 days of the filing date of this Form N-CSR, to provide reasonable assurance that the information required to be disclosed by the Registrant on Form N-CSR is recorded, processed, summarized, and reported within the time periods specified in the SEC’s rules and forms, based on their evaluation of these disclosure controls and procedures required by Rule 30a-3(b) under the 1940 Act (17 CFR 270.30a-3(b)) and Rules 13a-15(b) or 15d-15(b) under the Securities Exchange Act of 1934 (17 CFR 240.13a-15(b) or 240.15d-15(b)).
(b) There were no changes in the Registrant’s internal control over financial reporting (as defined in Rule 30a-3(d) under the 1940 Act (17 CFR 270.30a-3(d))) that occurred during the Registrant’s most recent fiscal quarter that has materially affected, or is reasonably likely to materially affect, the Registrant’s internal control over financial reporting.
Item 12. Exhibits.
(a)(1) Code of Ethics (Item 2) is attached.
(a)(2) Certifications of the Principal Executive Officer and Principal Financial Officer of the Registrant as required by Rule 30a-2(a) under the 1940 Act (17 CFR 270.30a-2(a)) are attached hereto as Exhibit 99CERT.
(a)(3) Not applicable to this filing.
(b) Certifications pursuant to Section 906 of the Sarbanes-Oxley Act of 2002 as required by Rule 30a-2(b), under the 1940 Act (17 CFR 270.30a-2(b)), Rule 15d-14(b) under the Securities Exchange Act of 1934 (17 CFR 240.15d-14(b)) and Section 1350 of Chapter 63 of Title 18 of the United States Code (18 U.S.C. 1350) are attached hereto as Exhibit 99.906CERT.
SIGNATURES
Pursuant to the requirements of the Securities Exchange Act of 1934 and the Investment Company Act of 1940, the registrant has duly caused this report to be signed on its behalf by the undersigned, thereunto duly authorized.
| | | | |
| (Registrant) | | MML Series Investment Fund | | |
| | |
| By (Signature and Title) | | /s/ Jeffrey M. Dube | | |
| | Jeffrey M. Dube, President and Principal Executive Officer | | |
| | |
| Date | | 2/25/15 | | |
Pursuant to the requirements of the Securities Exchange Act of 1934 and the Investment Company Act of 1940, this report has been signed below by the following persons on behalf of the registrant and in the capacities and on the dates indicated.
| | | | |
| By (Signature and Title) | | /s/ Jeffrey M. Dube | | |
| | Jeffrey M. Dube, President and Principal Executive Officer | | |
| | |
| Date | | 2/25/15 | | |
| | |
| By (Signature and Title) | | /s/ Nicholas H. Palmerino | | |
| | Nicholas H. Palmerino, Treasurer and Principal Financial Officer | | |
| | |
| Date | | 2/25/15 | | |