UNITED STATES
SECURITIES AND EXCHANGE COMMISSION
Washington, D.C. 20549
FORM N-CSR
CERTIFIED SHAREHOLDER REPORT OF REGISTERED
MANAGEMENT INVESTMENT COMPANIES
| | | | | | | | |
| Investment Company Act file number | | 811-02224 | | |
| | | | |
|
| MML Series Investment Fund |
|
(Exact name of registrant as specified in charter) |
| |
| 1295 State Street, Springfield, MA | | 01111 |
|
(Address of principal executive offices) | | (Zip code) |
Richard J. Byrne |
1295 State Street, Springfield, MA | | | | 01111 |
|
| (Name and address of agent for service) |
| |
| Registrant’s telephone number, including area code: | | 413-788-8411 |
| | | | | | | | |
| | |
| Date of fiscal year end: | | 12/31/2012 | | |
| | | | | | |
| | |
| Date of reporting period: | | 12/31/2012 | | |
| | | | | | |
Item 1. Reports to Stockholders.
MML SERIES INVESTMENT FUND
Supplement dated March 1, 2013 to the
Annual Report dated December 31, 2012
This supplement provides updated information beyond that contained in the Annual Report. It should be retained and read in conjunction with the Annual Report.
The following information replaces similar information for the Equity Index Fund, Focused Equity Fund, Fundamental Growth Fund, Fundamental Value Fund, Global Fund, PIMCO Total Return Fund, and Small Company Value Fund found on page 203 under the heading Expense Caps and Waivers in the section titled Notes to Financial Statements.
| | | | | | | | |
| | | Class I | | Class II | | Class III | | Service Class I |
| Equity Index Fund***^ | | 0.05% | | 0.05% | | 0.05% | | 0.05% |
| Focused Equity Fund* | | None | | 0.90% | | None | | 1.15% |
| Fundamental Growth Fund* | | None | | 0.85% | | None | | 1.10% |
| Fundamental Value Fund** | | None | | 0.80% | | None | | 1.05% |
| Global Fund** | | 0.90% | | 0.80% | | None | | 1.15% |
| PIMCO Total Return Fund*** | | None | | 0.65% | | None | | 0.90% |
| Small Company Value Fund** | | None | | 1.15% | | None | | 1.40% |
| # | Acquired Fund fees and expenses are expenses borne indirectly by a Fund through investments in other pooled investment vehicles. |
| * | Expense caps in effect through April 30, 2013. |
| ** | Expense caps in effect through April 30, 2013. Interest expense and short sale dividend and loan expense were not excluded from the caps prior to May 1, 2012. |
| *** | Expense caps in effect through April 30, 2013. Short sale dividend and loan expense was not excluded from the caps prior to May 1, 2012. |
| ^ | Expense caps also exclude the management, Rule 12b-1 and administrative fees, taxes and brokerage commissions. |
Table of Contents
This material must be preceded or accompanied by a current prospectus (or summary prospectus, if available) for the MML Series Investment Fund. Investors should consider a Fund’s investment objective, risks, and charges and expenses carefully before investing. This and other information about the investment company is available in the prospectus (or summary prospectus, if available). Read it carefully before investing.
MML Series Investment Fund – President’s Letter to Shareholders (Unaudited)
To Our Shareholders

Richard J. Byrne
“MassMutual believes you can most effectively pursue your retirement goals by creating a long-term investment plan designed to suit your investment time horizon and your tolerance for risk, monitoring that plan regularly, and adjusting your strategy when appropriate.”
December 31, 2012
Retirement investors face ongoing market volatility
I am pleased to present you with the MML Series Investment Fund Annual Report, covering the year ended December 31, 2012. Navigating an environment that included both continued global economic malaise and positive signs for the future, investors drove most major equity markets worldwide to strong advances for the period, despite the volatility and weak stock performance that characterized both the second and fourth quarters of 2012.
The willingness of some central bankers and country leaders to take bold steps to help resolve ongoing problems in both Europe and the U.S. encouraged investors for much of the year. Other reasons for optimism that emerged over the course of 2012 included signs of a strengthening U.S. housing market, positive earnings reports from companies in numerous industries, and improvements in U.S. employment statistics and gross domestic product (GDP) figures.
As 2012 wound down, investors watched and reacted to news surrounding the November U.S. elections and the countdown to the so-called fiscal cliff, a combination of tax hikes and spending cuts set to take effect early in 2013 unless Congress could agree on an alternate plan. Market volatility increased as the year-end fiscal cliff deadline approached, but news about a possible agreement on the last day of the year helped stocks finish 2012 with a rally, and a signed bill addressing many tax issues was in place by the end of the first trading day of 2013.
Investing guidelines for retirement investors
MassMutual believes you can most effectively pursue your retirement goals by creating a long-term investment plan designed to suit your investment time horizon and your tolerance for risk, monitoring that plan regularly, and adjusting your strategy when appropriate. Keeping certain investing guidelines in mind (such as those below) can help you maintain your long-term perspective.
Time may be your ally
Investing for retirement is a decades-long process for most people. The financial markets will be volatile from time to time, but many patient investors who have taken a long-term approach have managed to ride out the downturns and have successfully grown their account balances and reached their retirement goals over time.*
Continue to invest
Some of the most sophisticated investors believe that individuals who can weather a bear market have the potential to be rewarded by amassing larger positions at more favorable prices (relative
to those who do not continue to invest during a down market). That’s why most financial professionals believe it’s important to stay in the market, regardless of short-term results.*
| | * | Systematic investing and asset allocation do not ensure a profit or protect against loss in a declining market. Systematic investing involves continuous investment in securities regardless of fluctuating price levels. Investors should consider
their ability to continue investing through periods of low price levels. |
(Continued)
1
MML Series Investment Fund – President’s Letter to Shareholders (Unaudited) (Continued)
Monitor your asset allocation and diversify
Stocks, bonds, and short-term/money market investments are investment types that typically behave differently depending upon the economic and market environment. Those broad investment types contain an even greater array of sub-categories (such as small-cap stocks, international stocks, and high-yield bonds). Many financial professionals believe that investors can take advantage of different opportunities in the market and reduce the risk of over-exposure to one or two poorly performing investment types by maintaining a portfolio that includes a mix of investment types and sub-categories.*
Who Matters Most to You Says the Most About You.SM
At MassMutual, our customers matter most to us, which is why one of our primary goals is to give retirement investors tools they can use to help them achieve their long-term financial goals. You may want to take this opportunity to make an appointment with your financial professional, so you can evaluate your current retirement-planning strategy and determine whether or not you need to fine-tune the plan – based on your long-term investment objectives, time frame, and risk tolerance. We know how important your financial future is to you, so we thank you for putting your trust in MassMutual.
Sincerely,

Richard J. Byrne
President
The information provided is the opinion of MassMutual Retirement Services Investment Services as of 1/1/13 and is subject to change without notice. It is not to be construed as tax, legal or investment advice. Of course, past performance does not guarantee future results.
2
MML Series Investment Fund – Economic and Market Overview (Unaudited)
December 31, 2012
Stock markets climb despite ongoing uncertainty
In 2012, optimistic investors overcame concerns about the sovereign debt crisis in Europe, slow growth in China, and an improving, but still unsteady, economy here at home to drive stock markets across the globe to solid advances. Investors also contended with game-changing questions in 2012, including who would win the U.S. Presidential and key congressional races and whether or not the uncertainty over the impending “fiscal cliff” would be resolved. (“Fiscal cliff” is the adopted term for a large reduction of the federal budget deficit through significant tax increases and spending cuts, which were scheduled to become effective on January 1, 2013, unless Congress could strike an alternate plan.) The U.S. Federal Reserve (the “Fed”) and other central banks from around the world helped calm occasionally jittery markets by implementing actions intended to stimulate their respective economies, and key interest rates continued to remain near historical lows. Additionally, U.S. manufacturing, employment, gross domestic product (“GDP”), and housing statistics told a story of an economy unsure of its strength at times, but still indicated continued improvement overall for the year.
The price of oil gyrated up and down throughout much of 2012, going from around $103 per barrel in early January, to a low of nearly $78 in late June, before closing the year at $92. Gasoline prices mainly moved in a similar fashion, with consumers getting some relief at the pumps during the early summer of 2012 in between bouts with much higher prices overall – and prices that once again began to escalate as 2013 approached. Gold started the period at around $1,616 per ounce and fluctuated over the 12 months, peaking at $1,781 on October 5. The price of the precious metal ended the year at $1,675.
The Fed continued to keep interest rates at historically low levels, with the federal funds rate remaining at 0.0% to 0.25% – the level the rate has occupied since December 2008 – in an ongoing attempt to stimulate the economy. The federal funds rate is the interest rate that banks and other financial institutions charge each other for borrowing funds overnight. The central bank confirmed its commitment to keeping interest rates low, stating in its Federal Open Market Committee meeting notes in April 2012 that economic conditions were “expected to warrant an exceptionally low federal funds rate through late 2014.” In June, the Fed announced its extension of Operation Twist (the stimulus program under which the Fed has been aiming to boost economic growth by causing long-term interest rates to decline by selling shorter-term U.S. Treasury securities and using the proceeds to buy those with longer terms) through the end of 2012. In September, Chairman Ben Bernanke announced the Fed’s decision to launch a third round of quantitative easing, or QE3, which involves the central bank’s purchase of $40 billion in agency mortgage-backed securities per month in an effort to lower mortgage rates and spur greater activity in the housing market.
Market performance
Equities rewarded investors for the year ended December 31, 2012, with foreign stocks outpacing most U.S. counterparts. The MSCI Emerging Markets Index, a measure of the performance of emerging stock markets throughout the world, advanced 18.22%, and the MSCI® EAFE® Index, a barometer for foreign stocks in developed markets, gained 17.32% for the year. Technology stock benchmark the NASDAQ Composite® Index (“NASDAQ”) was the leader among domestic broad-market indexes and rose an impressive 17.45%. The small-cap Russell 2000® Index and large-cap S&P 500® Index (the “S&P 500”) picked up 16.35% and 16.00%, respectively. The blue-chip Dow Jones Industrial AverageSM (the “Dow”) lagged other U.S. stock indexes, but still posted a double-digit advance, rising 10.24%.
Bonds generally underperformed equities by a wide margin during the 12 months. One exception was the Barclays U.S. Corporate High Yield Index, a measure of the performance of fixed-rate, non-investment-grade debt from corporate sectors, which advanced 15.81%, as investors sought higher returns relative to other bonds. Conversely, the Barclays U.S. Aggregate Bond Index, a broad measure of the U.S. investment-grade bond markets, gained only 4.21%. The environment of low interest rates continued to take its toll, with shorter-term debt investments struggling to stay in positive territory. The Barclays U.S. 1-3 Year Government Bond Index, which measures the performance of short-term U.S. government bonds, returned just 0.51%; and Treasury bills advanced only slightly, as measured by the Citigroup 3-Month Treasury Bill Index, which gained a mere 0.07%.*
| * | Indexes are unmanaged, do not incur fees or expenses and cannot be purchased directly for investment. |
3
MML Series Investment Fund – Economic and Market Overview (Unaudited) (Continued)
First quarter: Stocks outperform bonds to start the year
U.S. and foreign stocks rose solidly in the first quarter of 2012, with share prices grounding out steady gains punctuated by brief and shallow corrections. Bonds underperformed stocks across the board. Treasury yields traded in a relatively narrow range until mid-March, when they spiked higher on growing optimism about the U.S. economy. (Bond prices move in the opposite direction to interest rates [or yields]; when yields rise, the prices of existing bonds fall – and vice versa.) By the end of the month, however, yields had retraced about half of their advance.
The Commerce Department reported in the first quarter that private-sector spending and private investment helped boost the U.S. economy to a 2.8% annualized expansion in the fourth quarter of 2011. The economy typically expands by more than 3% annually during an economic recovery, which is the pace that economists consider necessary to bring down unemployment. Housing had its ups and downs: In January 2012, the Commerce Department reported that sales of new homes had unexpectedly dropped in the previous month. In February 2012, however, reports indicated that big price reductions in the U.S. real estate market had given a lift to existing home sales, which rose 4.3% in January.
In Europe, Standard & Poor’s downgraded the government debt of France, Spain, Italy, and Austria in January on concerns over high debt levels and those countries’ significant need to refinance debt in 2013. Greece’s fiscal situation brightened in March, as significant progress in that country’s negotiations with its private-sector creditors cleared the way for a second €130 billion bailout for the debt-strapped nation from the European Union (“EU”) and the International Monetary Fund. Also in March, Chinese Premier Wen Jiabao cut the country’s 2012 target growth rate to 7.5% – China’s lowest growth target in eight years.
Second quarter: bonds outpace stocks as worries over Europe re-emerge
The U.S. stock market had a challenging second quarter in 2012, with all widely followed market indexes suffering single-digit losses. The European debt crisis, which had receded as a major source of concern for investors in the first quarter, worsened once again. Consequently, foreign stocks trailed their U.S. counterparts. On the positive side, equities trimmed their losses from their early June lows and jumped about 2% on the final day of the quarter on news of a “breakthrough” deal at the two-day summit of EU leaders. In the bond market, the yield of U.S. Treasury securities plummeted and prices soared amid investors’ decreasing appetite for risk. At quarter-end, the yield of the bellwether 10-year Treasury note stood near its all-time low. Longer-dated Treasuries were standout performers, while TIPS (Treasury Inflation-Protected Securities) also did well. Within the corporate sector, investment-grade bonds generally fared better than high-yield debt. Employment trends downshifted during April, and payroll growth slowed in the second quarter. Corporate earnings were mainly positive, but manufacturing was down.
Prices on Spanish and Italian debt fell during the second quarter, after rallying earlier in the year in response to the European Central Bank’s (“ECB”) Long-Term Refinancing Operations lending facility. Spanish and Italian banks were reported to have tapped a direct lending line from the ECB. In addition, concern began building around the prospect of Greece leaving the euro zone. Later in the quarter, there was a positive reaction to the election of a pro-austerity government in Greece. Here in the U.S., the Supreme Court voted 5 to 4 in June to uphold the Affordable Care Act, the health care law signed by President Obama in 2010. The ruling left the law essentially intact, with most mandates taking effect in 2014.
Third quarter: Stocks on top; central banks come to the rescue
Popular stock indexes in the U.S. posted solid gains in the third quarter of 2012, as some of the globe’s most powerful central bankers decided it was time to take action once again. In July, ECB President Mario Draghi stated he would do “whatever it takes” to preserve the euro, and the ECB supported that statement with a new bond-buying program in September. About a week later, Fed Chairman Ben Bernanke announced the launch of QE3. Around the same time, the Bank of Japan followed suit, announcing plans to ramp up its bond-buying program. Foreign equity markets modestly outperformed their domestic counterparts for the quarter, primarily due to a weaker U.S. dollar.
Bonds trailed equities in the third quarter of 2012, as Treasury yields fluctuated, but finished September with minimal change. Conversely, corporate bonds, including high-yield debt, did well, but lost some momentum late in the quarter. Manufacturing showed some expansion as the quarter came to an end, but export orders remained under pressure, reflecting mainly weak global markets. Continued improvement in the unemployment rate as the period ended seemed at odds with data about jobless claims. Housing finished the quarter strongly.
4
MML Series Investment Fund – Economic and Market Overview (Unaudited) (Continued)
Fourth quarter: Stocks mixed; U.S. re-elects President Obama
U.S. stocks turned in a mixed performance for the fourth quarter of 2012, with the most widely followed indexes (the S&P 500, the NASDAQ, and the Dow) declining while small- and mid-cap stock benchmarks advanced. Foreign stocks from developed and emerging markets rose solidly. Bonds were mainly flat, with the exception of high-yield issues, which outperformed most U.S. stock indexes. There was considerable volatility during the period. Stocks declined immediately after the November elections – which included the re-election of President Obama along with Republicans and Democrats maintaining their majorities in the House and Senate, respectively – but negative sentiment persisted for only a brief time, as the market recovered much of its loss by the end of the month. In December, share prices advanced irregularly for much of the month before falling back later on investor concerns that time was running out for lawmakers to reach an agreement to avoid the approaching fiscal cliff. The final day of the year saw all of the major stock indexes turn in healthy advances amid rumors of an impending agreement. In a last-ditch effort, legislators finally struck a deal on New Year’s Day that addresses many tax issues but leaves other questions unresolved.
The November jobs report, released in the first week of December, was surprisingly positive – at least at the headline level. The unemployment rate declined to 7.7% from 7.9% due to lower job market participation, and many more jobs were created than had been forecasted. Third-quarter U.S. GDP, a measure of all final goods and services produced in the nation, underwent an upward revision in December – from 2.7% to 3.1% – and both figures were considerable improvements over the 1.3% rate of expansion posted in the second quarter of 2012. The fourth quarter brought signs of stabilization in the economies of key emerging markets such as China, which had been experiencing slowing economic growth for most of the year. In contrast, much of Europe remained in a recession along with Japan as the year drew to a close.
As 2013 got underway, investors had plenty to occupy their attention, including ongoing economic concerns in Europe and the Far East as well as the still-unresolved aspects of the fiscal cliff here at home. The U.S. will hog the spotlight in the near future as key battles remain in Washington, such as those that focus on the debt ceiling, upcoming spending cuts, and tax and entitlement reform, which many see as key to long-term federal deficit reduction and economic strength. We expect investors will pay attention to these developments and numerous others, as they search for indications about what may lie ahead for the world’s financial markets.
The information provided is the opinion of MassMutual Retirement Services Investment Services as of 1/1/13 and is subject to change without notice. It is not to be construed as tax, legal or investment advice. Of course, past performance does not guarantee future results.
5
MML Blue Chip Growth Fund – Portfolio Manager Report (Unaudited)
What is the investment approach of MML Blue Chip Growth Fund, and who is the Fund’s subadviser?
The Fund seeks long-term capital growth. Income is a secondary objective. Under normal circumstances, the Fund invests at least 80% of net assets in the common stocks of large- and medium-sized blue chip growth companies. The Fund’s subadviser currently defines blue chip growth companies to mean firms that, in its view, are well-established in their industries and have the potential for above-average earnings growth. The Fund’s subadviser is T. Rowe Price Associates, Inc. (T. Rowe Price).
How did the Fund perform during the 12 months ended December 31, 2012?
The Fund’s Initial Class shares returned 18.31%, outpacing the 15.26% return of the Russell 1000® Growth Index (the “benchmark”), an unmanaged index consisting of those Russell 1000 securities (representing the 1,000 largest U.S. companies based on market capitalization) with greater than average growth orientation that tend to exhibit higher price-to-book ratios and higher forecasted growth rates than securities in the value universe. The Fund also outperformed the 16.00% return of the S&P 500® Index, a widely recognized, unmanaged index representative of common stocks of larger capitalized U.S. companies.
For a discussion on the economic and market environment during the 12-month period ended December 31, 2012, please see the Economic and Market Review, beginning on page 3.
Subadviser discussion of factors that contributed to the Fund’s performance
For 2012, sector weighting and stock selection were the two factors that contributed the most to the Fund’s performance. With respect to sectors, information technology, consumer staples, energy, and financials were the standouts. Conversely, health care and industrials and business services were the greatest detractors.
Information technology was by far the leading outperformer, powered by stock selection within the sector. The Fund’s shares of information technology giant Apple were up sharply on continued strength in demand for its products. The company experienced strong sales of its iPad Mini following the new tablet’s release in October 2012 and recently began selling the iPhone in China. Shares of online vendor eBay, another Fund holding, rose substantially, led by growth in popularity of its PayPal electronic payment service as well as increased popularity among smartphone users. An increase in consumer spending benefited global payment networks Visa and MasterCard, as both of these Fund holdings continued to benefit from consumers outside of the U.S., who increasingly favor credit cards over cash. Similarly, the Fund’s investment in Tencent Holdings paid off. Tencent Holdings is China’s largest Internet company by revenue. The company’s shares appreciated on continuing increases in mobile data traffic, particularly in gaming and advertising. Consumer staples outperformed due to the Fund’s significantly underweight position, relative to the benchmark, as investors favored cyclical stocks over defensive sectors. Energy outperformed, as a beneficial overweight position in the sector offset negative stock selection. Finally, financials was a standout due to the Fund’s overweight position and favorable stock selection in that sector.
Hampering the Fund’s performance for the year was the health care sector, which detracted due to less-than-favorable stock selection and the Fund’s underweight allocation to this strong-performing sector. Fund holding Cardinal Health, maker of generic pharmaceuticals and medical instruments for hospitals, faced significant commodity price challenges from its medical/surgical distribution segment. Investors sold off shares of another Fund holding, biotechnology firm Celgene, in June after the company pulled its European Union application for approval of expanded use of its cancer drug, REVLIMID.®
The industrials and business services sectors detracted due to stock selection and unfavorable overweight positioning. Demand for consulting services of IHS, a Fund holding that serves corporations looking for insight into factors that affect business decisions – such as commodities, industry forecasting, pricing, and cost – declined as many clients cut their spending amid economic uncertainty. IHS did, however, show some growth in its subscription revenues.
Subadviser outlook
Now that the first phase of a plan to deal with the U.S. fiscal problems is behind us, we are reasonably optimistic that the policymakers in Washington will come up with some sort of a compromise on the spending side of the equation. We believe the U.S. economy is likely to grow between 2% and 3% in 2013 and are encouraged by positive trends in the housing industry and the declining unemployment rate. In our view, the main impediments to global growth remain – an economic slowdown in China and ongoing sovereign debt problems in Europe. In addition, continuing turmoil in the Middle East carries the potential to escalate into more widespread violence. The Fund remains focused on stocks that we believe can do reasonably well under any conditions.
6
MML Blue Chip Growth Fund – Portfolio Manager Report (Unaudited) (Continued)
| | | | |
MML Blue Chip
Growth Fund
Largest Holdings
(% of Net Assets) on 12/31/12 | |
| | |
Apple, Inc. | | | 8.5 | % |
Google, Inc. Class A | | | 4.9 | % |
Amazon.com, Inc. | | | 4.3 | % |
Danaher Corp. | | | 3.1 | % |
MasterCard, Inc. Class A | | | 3.0 | % |
Priceline.com, Inc. | | | 2.7 | % |
American Tower Corp. | | | 2.3 | % |
QUALCOMM, Inc. | | | 2.1 | % |
Union Pacific Corp. | | | 1.9 | % |
eBay, Inc. | | | 1.9 | % |
| | | | | |
| | | | 34.7 | % |
| | | | | |
| | | | |
MML Blue Chip
Growth Fund
Sector Table
(% of Net Assets) on 12/31/12 | |
| | |
Communications | | | 21.8 | % |
Consumer, Non-cyclical | | | 16.6 | % |
Consumer, Cyclical | | | 15.5 | % |
Technology | | | 15.0 | % |
Industrial | | | 12.1 | % |
Financial | | | 8.7 | % |
Energy | | | 4.7 | % |
Basic Materials | | | 4.6 | % |
Mutual Funds | | | 0.0 | % |
| | | | | |
Total Long-Term Investments | | | 99.0 | % |
Short-Term Investments and Other Assets and Liabilities | | | 1.0 | % |
| | | | | |
Net Assets | | | 100.0 | % |
| | | | | |
7
MML Blue Chip Growth Fund – Portfolio Manager Report (Unaudited) (Continued)
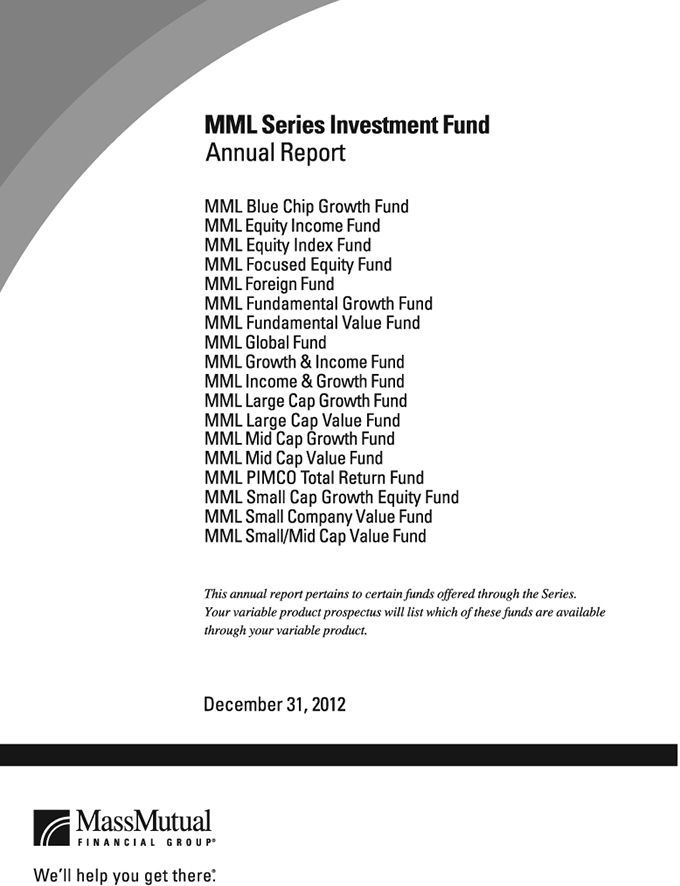
Growth of a $10,000 Investment
Hypothetical Investments in MML Blue Chip Growth Fund Initial Class, the Russell 1000 Growth Index, and the S&P 500 Index.
| | | | | | | | | | | | |
| | | | |
| TOTAL RETURN | | One Year
1/1/12 -
12/31/12 | | | Five Year
Average
Annual
1/1/08 -
12/31/12 | | | Since
Inception
Average
Annual
5/1/06 -
12/31/12 | |
| Initial Class | | | 18.31% | | | | 2.68% | | | | 4.76% | |
| Russell 1000 Growth Index* | | | 15.26% | | | | 3.12% | | | | 4.96% | |
| S&P 500 Index | | | 16.00% | | | | 1.66% | | | | 3.48% | |
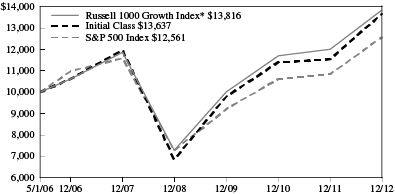
Hypothetical Investments in MML Blue Chip Growth Fund Service Class, the Russell 1000 Growth Index, and the S&P 500 Index.
| | | | | | | | |
| | | |
| TOTAL RETURN | | One Year
1/1/12 -
12/31/12 | | | Since
Inception
Average
Annual
8/15/08 -
12/31/12 | |
| Service Class | | | 17.99% | | | | 5.27% | |
| Russell 1000 Growth Index* | | | 15.26% | | | | 5.72% | |
| S&P 500 Index | | | 16.00% | | | | 4.59% | |
GROWTH OF $10,000 INVESTMENT SINCE INCEPTION
* Benchmark
Performance data quoted represents past performance; past performance is not predictive of future results. The investment return and principal value of shares of the Fund will fluctuate with market conditions so that shares of the Fund, when redeemed, may be worth more or less than their original cost. Current performance of the Fund may be lower or higher than the performance quoted. Performance data current to the most recent month end may be obtained by accessing the website www.massmutual.com.
Investors should note that the Fund is a professionally managed mutual fund, while the Russell 1000 Growth Index and the S&P 500 Index are unmanaged, do not incur expenses, and cannot be purchased directly by investors. Investors should read the Fund’s prospectus with regard to the Fund’s investment objective, risks, and charges and expenses in conjunction with these financial statements. The Fund’s return reflects changes in the net asset value per share without the deduction of any product charges (e.g., cost of insurance, mortality and expense risk charges, administrative fees, and CDSL). The inclusion of these charges would have reduced the performance shown here.
8
MML Equity Income Fund – Portfolio Manager Report (Unaudited)
What is the investment approach of MML Equity Income Fund, and who is the Fund’s subadviser?
The Fund seeks dividend income and long-term capital growth by investing primarily in the common stocks of established companies. Under normal circumstances, the Fund invests at least 80% of its net assets in common stocks, with 65% in the common stocks of well-established companies paying above-average dividends. The Fund’s subadviser currently considers well-established companies to mean companies that it considers to be seasoned companies with relatively long operating histories. The Fund’s subadviser is T. Rowe Price Associates, Inc. (T. Rowe Price).
How did the Fund perform during the 12 months ended December 31, 2012?
The Fund’s Initial Class shares returned 17.32%, outpacing the 16.00% return of the S&P 500® Index (the “benchmark”), a widely recognized, unmanaged index representative of common stocks of larger capitalized U.S. companies. Conversely, the Fund trailed the 17.51% return of the Russell 1000® Value Index, an unmanaged index consisting of those Russell 1000 securities (representing the 1,000 largest U.S. companies, based on market capitalization) with greater than average value orientation that tend to exhibit lower price-to-book ratios and lower forecasted growth rates than securities in the growth universe.
For a discussion on the economic and market environment during the 12-month period ended December 31, 2012, please see the Economic and Market Review, beginning on page 3.
Subadviser discussion of factors that contributed to the Fund’s performance
During 2012, stock selection contributed to the Fund’s performance, relative to the benchmark, while sector weightings detracted. The industrials and business services, consumer discretionary, and materials sectors benefited performance. The most significant detractors were the telecommunication services, utilities, and energy sectors.
Stock selection and an overweight position, relative to the benchmark, in the industrials and business services sector contributed to performance, as Fund holding USG, a diversified building products company, rose on improvements in the housing market. Shares of Fund holding Cooper Industries rose after diversified power products manufacturer Eaton announced it would acquire the electrical products company at a premium. We sold Cooper from the Fund’s portfolio once the deal closed in the fourth quarter. An overweight position in the benchmark’s strongest-performing sector, consumer discretionary, also boosted the Fund’s full-year results. Finally, the materials sector contributed due to stock selection. Fund holding International Paper continued to benefit from its acquisition of Temple-Inland, a building products company, which should help drive 2013 earnings growth. The share price of Fund holding Vulcan Materials rose on rumors that competitor Martin Marietta Materials would renew its bid for this leading producer of construction materials during the third quarter of 2012.
At the other end of the spectrum, the telecommunication services sector detracted from the Fund’s relative returns due to stock selection and the Fund’s overweight position in this sector. Revenues at Fund holding Telefonica, Europe’s largest integrated telecommunications operator, declined due largely to economic problems in Spain. Stock selection in the utilities sector also detracted from relative returns. In the energy sector, Fund holdings Exelon and Entergy suffered when low natural gas prices more than offset improvements in the supply and demand balance for power and resulted in lower power prices and lower earnings power for coal and nuclear power producers. During the fourth quarter, Exelon announced it may lower its dividend unless power prices increase soon.
Subadviser outlook
We are reasonably optimistic that the policymakers in Washington will come up with a compromise on government spending. We believe the U.S. economy is likely to grow in the range of 2% to 3% in 2013. We are encouraged by positive trends in housing industry and unemployment. Conversely, in our view, the main impediments to global growth remain the same as in 2012, including an economic slowdown in China and sovereign debt problems in Europe. In addition, continuing turmoil in the Middle East carries the potential to escalate into more widespread violence. We remain focused on stocks that we believe can do reasonably well under any conditions.
9
MML Equity Income Fund – Portfolio Manager Report (Unaudited) (Continued)
| | | | |
MML Equity Income Fund Largest Holdings (% of Net Assets) on 12/31/12 | |
| | |
General Electric Co. | | | 2.7 | % |
JP Morgan Chase & Co. | | | 2.6 | % |
Chevron Corp. | | | 2.4 | % |
Exxon Mobil Corp. | | | 2.2 | % |
Wells Fargo & Co. | | | 1.9 | % |
AT&T, Inc. | | | 1.8 | % |
Royal Dutch Shell PLC A Shares Sponsored ADR (United Kingdom) | | | 1.7 | % |
U.S. Bancorp | | | 1.6 | % |
American Express Co. | | | 1.5 | % |
International Paper Co. | | | 1.4 | % |
| | | | | |
| | | | 19.8 | % |
| | | | | |
| | | | |
MML Equity Income Fund Sector Table (% of Net Assets) on 12/31/12 | |
| | |
Financial | | | 19.4 | % |
Industrial | | | 16.0 | % |
Energy | | | 14.2 | % |
Communications | | | 11.3 | % |
Consumer, Non-cyclical | | | 10.9 | % |
Consumer, Cyclical | | | 7.3 | % |
Utilities | | | 5.6 | % |
Basic Materials | | | 5.6 | % |
Technology | | | 5.2 | % |
Mutual Funds | | | 0.0 | % |
| | | | | |
Total Long-Term Investments | | | 95.5 | % |
Short-Term Investments and Other Assets and Liabilities | | | 4.5 | % |
| | | | | |
Net Assets | | | 100.0 | % |
| | | | | |
10
MML Equity Income Fund – Portfolio Manager Report (Unaudited) (Continued)
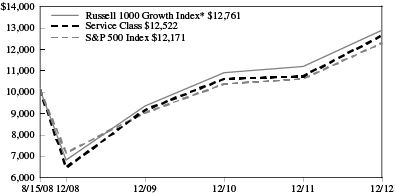
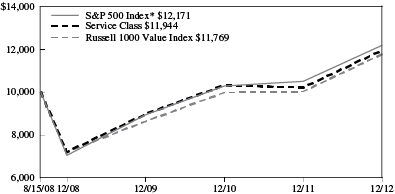
Growth of a $10,000 Investment
Hypothetical Investments in MML Equity Income Fund Initial Class, the S&P 500 Index, and the Russell 1000 Value Index.
| | | | | | | | | | | | |
| | | | |
| TOTAL RETURN | | One Year
1/1/12 -
12/31/12 | | | Five Year
Average
Annual
1/1/08 -
12/31/12 | | | Since
Inception
Average
Annual
5/1/06 -
12/31/12 | |
| Initial Class | | | 17.32% | | | | 1.46% | | | | 3.16% | |
| S&P 500 Index* | | | 16.00% | | | | 1.66% | | | | 3.48% | |
| Russell 1000 Value Index | | | 17.51% | | | | 0.59% | | | | 2.21% | |
Hypothetical Investments in MML Equity Income Fund Service Class, the S&P 500 Index, and the Russell 1000 Value Index.
| | | | | | | | |
| | | |
| TOTAL RETURN | | One Year
1/1/12 -
12/31/12 | | | Since
Inception
Average
Annual
8/15/08 -
12/31/12 | |
| Service Class | | | 17.06% | | | | 4.14% | |
| S&P 500 Index* | | | 16.00% | | | | 4.59% | |
| Russell 1000 Value Index | | | 17.51% | | | | 3.79% | |
GROWTH OF $10,000 INVESTMENT SINCE INCEPTION
* Benchmark
Performance data quoted represents past performance; past performance is not predictive of future results. The investment return and principal value of shares of the Fund will fluctuate with market conditions so that shares of the Fund, when redeemed, may be worth more or less than their original cost. Current performance of the Fund may be lower or higher than the performance quoted. Performance data current to the most recent month end may be obtained by accessing the website www.massmutual.com.
Investors should note that the Fund is a professionally managed mutual fund, while the S&P 500 Index and the Russell 1000 Value Index are unmanaged, do not incur expenses, and cannot be purchased directly by investors. Investors should read the Fund’s prospectus with regard to the Fund’s investment objective, risks, and charges and expenses in conjunction with these financial statements. The Fund’s return reflects changes in the net asset value per share without the deduction of any product charges (e.g., cost of insurance, mortality and expense risk charges, administrative fees, and CDSL). The inclusion of these charges would have reduced the performance shown here.
11
MML Equity Index Fund – Portfolio Manager Report (Unaudited)
What is the investment approach of MML Equity Index Fund, and who is the Fund’s subadviser?
The Fund’s investment objective is to provide investment results that correspond to the price and yield performance of publicly traded common stocks in the aggregate as represented by the S&P 500® Index* (the “Index”). Under normal circumstances, the Fund invests at least 80% (and, typically, substantially all) of its net assets in the equity securities of companies included within the Index. The Fund’s subadviser is Northern Trust Investments, Inc. (NTI).
How did the Fund perform during the 12 months ended December 31, 2012?
The Fund’s Class I shares returned 15.47%, underperforming the 16.00% return of the Index, a widely recognized, unmanaged index representative of common stocks of larger capitalized U.S. companies.
For a discussion on the economic and market environment during the 12-month period ended December 31, 2012, please see the Economic and Market Review, beginning on page 3.
Subadviser discussion of factors that contributed to the Fund’s performance
The Fund’s underperformance versus the Index is mainly attributable to the impact of fees and expenses necessary for the management and operation of the Fund. The Index is not subject to fees or expenses, and it is not possible to invest directly in the Index.
During 2012, large-cap U.S. equities slightly underperformed developed equities outside of the United States. Financials and consumer discretionary were the two strongest-performing sectors within the Index for the year – each of which had a double-digit return. On the other hand, utilities and energy finished in positive territory, but were the two weakest sectors for the year.
2012 got off to a strong start for U.S. equities, as positive economic data reports and healthy developments in Europe’s sovereign debt crisis increased investors’ appetite for risk. The Federal Reserve’s decision to keep interest rates low helped drive a strong surge in U.S. equity indexes.
Fear over Spain’s debt crisis weighed on the market mid-year, but central bank intervention worldwide helped restart the upward trend in U.S. equities. Nevertheless, domestic stocks fell behind international developed equities during the fourth quarter of 2012, narrowing the disparity in their returns for the year, as “fiscal cliff” fears and uncertainty over the upcoming U.S. Presidential election led to a sharp October selloff in stock markets in the U.S. Economists nationwide cut U.S. growth expectations for 2013 during this time, and fear mounted that the U.S. economy might contract into another recession if congressional representatives on both sides of the aisle were unable to reach a bargain in enough time to avert going over the cliff. However, U.S. equities improved overall in November and December, as the domestic economic picture brightened. Indeed, housing sales, prices, and new construction activity showed tangible improvement in a sector of the economy that had long been dormant. Additionally, the Institute for Supply Management’s (ISM) expectations for capital expenditures by purchasing executives increased from 3.5% in 2012 to 7% to 8% in 2013.
Subadviser outlook
While a congressional bargain that extends the Bush era tax cuts for 98% of Americans did come to pass on January 1, 2013, the lack of a more comprehensive bargain to deal with spending cuts means that the federal budget will continue to be a hot issue in 2013. Market volatility will likely continue to follow budget negotiation news out of Capitol Hill, but our view is that improvements in housing and strong corporate balance sheets are likely to lead to growth in U.S. equities, provided congressional leaders can come to an agreement.
*“Standard & Poor’s®,” “S&P®,” “Standard & Poor’s 500,” “500,” and “S&P 500” are trademarks of Standard & Poor’s Financial Services, LLC (“S&P” or “Standard & Poor’s”) and have been licensed for use by MassMutual. The Fund is not sponsored, endorsed, sold, or promoted by Standard & Poor’s, and Standard & Poor’s makes no representation regarding the advisability of investing in the Fund.
12
MML Equity Index Fund – Portfolio Manager Report (Unaudited) (Continued)
| | | | |
MML Equity Index Fund
Largest Holdings
(% of Net Assets) on 12/31/12 | |
| | |
Apple, Inc. | | | 3.8 | % |
Exxon Mobil Corp. | | | 3.0 | % |
General Electric Co. | | | 1.7 | % |
Chevron Corp. | | | 1.6 | % |
International Business Machines Corp. | | | 1.6 | % |
Microsoft Corp. | | | 1.5 | % |
Johnson & Johnson | | | 1.5 | % |
AT&T, Inc. | | | 1.5 | % |
Google, Inc. Class A | | | 1.4 | % |
The Procter & Gamble Co. | | | 1.4 | % |
| | | | | |
| | | | 19.0 | % |
| | | | | |
| | | | |
MML Equity Index Fund
Sector Table
(% of Net Assets) on 12/31/12 | |
| | |
Consumer, Non-cyclical | | | 21.5 | % |
Financial | | | 14.9 | % |
Technology | | | 12.7 | % |
Communications | | | 11.8 | % |
Energy | | | 10.6 | % |
Industrial | | | 10.0 | % |
Consumer, Cyclical | | | 8.9 | % |
Basic Materials | | | 3.6 | % |
Utilities | | | 3.4 | % |
Diversified | | | 0.0 | % |
| | | | | |
Total Long-Term Investments | | | 97.4 | % |
Short-Term Investments and Other Assets and Liabilities | | | 2.6 | % |
| | | | | |
Net Assets | | | 100.0 | % |
| | | | | |
13
MML Equity Index Fund – Portfolio Manager Report (Unaudited) (Continued)
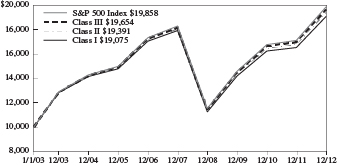
Growth of a $10,000 Investment
Hypothetical Investments in MML Equity Index Fund Class I, Class II, Class III, and the S&P 500 Index.
| | | | | | | | | | | | |
| | | | |
| TOTAL RETURN | | One Year
1/1/12 -
12/31/12 | | | Five Year
Average
Annual
1/1/08 -
12/31/12 | | | Ten Year
Average
Annual
1/1/03 -
12/31/12 | |
| Class I | | | 15.47% | | | | 1.26% | | | | 6.67% | |
| Class II | | | 15.69% | | | | 1.43% | | | | 6.85% | |
| Class III | | | 15.87% | | | | 1.57% | | | | 6.99% | |
| S&P 500 Index | | | 16.00% | | | | 1.66% | | | | 7.10% | |
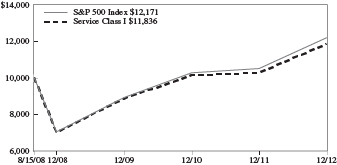
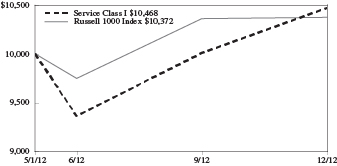
Hypothetical Investments in MML Equity Index Fund Service Class I, and the S&P 500 Index.
| | | | | | | | |
| | | |
| TOTAL RETURN | | One Year
1/1/12 -
12/31/12 | | | Since
Inception
Average
Annual
8/15/08 -
12/31/12 | |
| Service Class I | | | 15.21% | | | | 3.92% | |
| S&P 500 Index | | | 16.00% | | | | 4.59% | |
GROWTH OF $10,000 INVESTMENT FOR THE PAST 10 YEARS
GROWTH OF $10,000 INVESTMENT SINCE INCEPTION
Performance data quoted represents past performance; past performance is not predictive of future results. The investment return and principal value of shares of the Fund will fluctuate with market conditions so that shares of the Fund, when redeemed, may be worth more or less than their original cost. Current performance of the Fund may be lower or higher than the performance quoted. Performance data current to the most recent month end may be obtained by accessing the website www.massmutual.com.
Investors should note that the Fund is a professionally managed mutual fund, while the S&P 500 Index is unmanaged, does not incur expenses, and cannot be purchased directly by investors. Investors should read the Fund’s prospectus with regard to the Fund’s investment objective, risks, and charges and expenses in conjunction with these financial statements. The Fund’s return reflects changes in the net asset value per share without the deduction of any product charges (e.g., cost of insurance, mortality and expense risk charges, administrative fees, and CDSL). The inclusion of these charges would have reduced the performance shown here.
14
MML Focused Equity Fund – Portfolio Manager Report (Unaudited)
What is the investment approach of MML Focused Equity Fund, and who is the Fund’s subadviser?
The Fund seeks growth of capital over the long-term by investing primarily in equity securities of U.S. companies that the Fund’s subadviser believes are undervalued. Under normal circumstances, the Fund invests at least 80% of its net assets in equity securities. The Fund’s subadviser is Harris Associates L.P. (Harris).
How did the Fund perform during the 12 months ended December 31, 2012?
The Fund’s Class II shares returned 20.61%, significantly outperforming the 16.42% return of the Russell 1000® Index (the “benchmark”), a widely recognized, unmanaged index representing the performance of common stocks of larger capitalized U.S. companies.
For a discussion on the economic and market environment during the 12-month period ended December 31, 2012, please see the Economic and Market Review, beginning on page 3.
Subadviser discussion of factors that contributed to the Fund’s performance
Stock selection and sector weightings both added overall relative value to the Fund’s performance for 2012. Consumer discretionary, financials, and industrials sector holdings and a lack of exposure to consumer staples stocks contributed the most to the Fund’s performance, relative to the benchmark, for the year. Fund holdings in the energy and technology sectors were the main detractors from relative performance. The best-performing individual securities were Cabela’s (a retailer of hunting, fishing, camping, and other outdoor recreation merchandise in the consumer discretionary sector); payment technology company Visa (in the financials sector); and Fortune Brands Home & Security, a manufacturer of home fixtures and hardware in the industrials sector. Conversely, energy holding Ultra Petroleum, technology company Intel, and jeweler Tiffany & Co. were all Fund holdings that detracted from 2012 full-year results.
From a Fund positioning standpoint, we purchased Delphi Automotive, Fifth & Pacific (formerly Liz Claiborne Inc.), and Tiffany & Co. in the consumer discretionary sector – and sold Cabela’s. In the financials sector, we added insurance and financial services giants American International Group and JPMorgan Chase and sold credit card company Discover Financial. We also eliminated the Fund’s position in Ultra Petroleum – as well as the Fund’s only utility company, Calpine. Finally, we sold the Fund’s holdings in machinery and engine manufacturer Caterpillar, Fortune Brands Home & Security, and human resource consulting firm Robert Half International. During the year, in addition to consumer staples, the Fund did not have any exposure to the health care, materials, or telecommunications sectors.
Subadviser outlook
Our own analysis of the year’s political battles was too hopeful. In hindsight, we mistakenly applied too much “rationality” in assessing the likelihood of real political compromise on the important fiscal challenges. Even though a last-minute agreement was reached, we believe there may be more late-night brinksmanship in the coming months. Our New Year’s resolution is to think even less about near-term politics, and focus more on the elements that we know drive investment returns: finding strong businesses with robust and growing intrinsic values, shareholder-oriented management teams, and attractive price discounts.
Our fundamental view has not changed, so we believe a continuation of solid corporate performance is likely. Balance sheets, cost control, and prodigious free cash flow imply rising returns for shareholders. Additional positives, in our view, include a more certain recovery in housing markets and the benefits of new, low-cost, domestic energy resources. Stock prices already reflect some of this good news, but the cautious positioning of most investors has kept valuations very reasonable and helped reduce the market risk from negative surprises or disappointments. We continue to believe the short-term risks are overblown, and that the scarcity of true, long-term capital in the equity market creates a favorable environment for investors.
15
MML Focused Equity Fund – Portfolio Manager Report (Unaudited) (Continued)
| | | | |
MML Focused Equity Fund
Largest Holdings
(% of Net Assets) on 12/31/12 | |
| | |
Delphi Automotive PLC | | | 6.2 | % |
CarMax, Inc. | | | 5.6 | % |
Penn National Gaming, Inc. | | | 5.5 | % |
Intel Corp. | | | 5.5 | % |
Wells Fargo & Co. | | | 5.1 | % |
Applied Materials, Inc. | | | 5.0 | % |
Visa, Inc. Class A | | | 5.0 | % |
Franklin Resources, Inc. | | | 5.0 | % |
Starwood Hotels & Resorts Worldwide, Inc. | | | 4.9 | % |
Tiffany & Co. | | | 4.8 | % |
| | | | | |
| | | | 52.6 | % |
| | | | | |
| | | | |
MML Focused Equity Fund
Sector Table
(% of Net Assets) on 12/31/12 | |
| | |
Consumer, Cyclical | | | 35.7 | % |
Financial | | | 19.1 | % |
Technology | | | 13.8 | % |
Energy | | | 10.3 | % |
Industrial | | | 8.4 | % |
Consumer, Non-cyclical | | | 5.0 | % |
| | | | | |
Total Long-Term Investments | | | 92.3 | % |
Short-Term Investments and Other Assets and Liabilities | | | 7.7 | % |
| | | | | |
Net Assets | | | 100.0 | % |
| | | | | |
| | | | |
MML Focused Equity Fund
Country Weightings
(% of Net Assets) on 12/31/12 | |
| | |
United States | | | 81.4 | % |
United Kingdom | | | 6.2 | % |
Panama | | | 4.7 | % |
| | | | | |
Total Long-Term Investments | | | 92.3 | % |
Short-Term Investments and Other Assets and Liabilities | | | 7.7 | % |
| | | | | |
Net Assets | | | 100.0 | % |
| | | | | |
16
MML Focused Equity Fund – Portfolio Manager Report (Unaudited) (Continued)
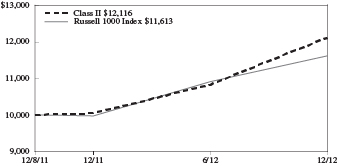
Growth of a $10,000 Investment
Hypothetical Investments in MML Focused Equity Fund Class II and the Russell 1000 Index.
| | | | | | | | |
| | | |
| TOTAL RETURN | | One Year
1/1/12 -
12/31/12 | | | Since
Inception
Average
Annual
12/8/11 -
12/31/12 | |
| Class II | | | 20.61% | | | | 19.74% | |
| Russell 1000 Index | | | 16.42% | | | | 15.03% | |
Hypothetical Investments in MML Focused Equity Fund Service Class I and the Russell 1000 Index.
| | | | |
| | |
| TOTAL RETURN | | Since
Inception
5/1/12 -
12/31/12 | |
| Service Class I | | | 4.68% | |
| Russell 1000 Index | | | 3.72% | |
GROWTH OF $10,000 INVESTMENT SINCE INCEPTION
Performance data quoted represents past performance; past performance is not predictive of future results. The investment return and principal value of shares of the Fund will fluctuate with market conditions so that shares of the Fund, when redeemed, may be worth more or less than their original cost. Current performance of the Fund may be lower or higher than the performance quoted. Performance data current to the most recent month end may be obtained by accessing the website www.massmutual.com
Investors should note that the Fund is a professionally managed mutual fund, while the Russell 1000 Index is unmanaged, does not incur expenses, and cannot be purchased directly by investors. Investors should read the Fund's prospectus with regard to the Fund's investment objective, risks, and charges and expenses in conjunction with these financial statements. The Fund's return reflects changes in the net asset value per share without the deduction of any product charges (e.g., cost of insurance, mortality and expense risk charges, administrative fees, and CDSL). The inclusion of these charges would have reduced the performance shown here.
17
MML Foreign Fund – Portfolio Manager Report (Unaudited)
What is the investment approach of MML Foreign Fund, and who is the Fund’s subadviser?
The Fund seeks long-term capital growth by investing, under normal circumstances, at least 80% of its net assets in investments of issuers located outside of the U.S., including those in emerging markets. Under normal market conditions, the Fund invests predominantly in equity securities, primarily common stocks, and, while there are no set percentage targets, the Fund invests primarily to predominantly in large- to medium-capitalization companies with market capitalization values greater than $2 billion and may invest a portion to a significant amount in smaller companies. The Fund’s subadviser is Templeton Investment Counsel, LLC (Templeton).
How did the Fund perform during the 12 months ended December 31, 2012?
The Fund’s Initial Class shares returned 19.06%, outpacing the 17.32% return of the Morgan Stanley Capital International (MSCI®) Europe, Australasia, Far East (EAFE®) Index (the “benchmark”), a widely recognized, unmanaged index representative of equity securities in developed markets, excluding the U.S. and Canada.
For a discussion on the economic and market environment during the 12-month period ended December 31, 2012, please see the Economic and Market Review, beginning on page 3.
Subadviser discussion of factors that contributed to the Fund’s performance
During 2012, stock selection in Asia and country weightings, especially an underweight position in Japan, relative to the benchmark, and allocation to off-benchmark South Korea, benefited the Fund’s performance. Stock selection in Europe, particularly in Germany and France, also contributed to the Fund’s full-year return.
From a sector perspective, the Fund’s relative performance benefited from stock selection in information technology, with major contributors including Fund holdings South Korean high-tech manufacturer and digital media provider Samsung Electronics (a stock not included in the benchmark) and German software solutions provider SAP. Stock selection in health care boosted relative performance, and German health care provider Rhoen-Klinikum, another out-of-benchmark Fund holding, was a notable contributor. Stock selection in financials also helped drive full-year results, and key Fund holdings that contributed included commercial banks Lloyds Banking Group (U.K.), BNP Paribas (France), DBS Group Holdings (Singapore), and ICICI Bank (India; a non-benchmark stock) – as well as insurers Munich Reinsurance Company (Germany) and Swiss Re (Switzerland). The Fund’s investment in French tire manufacturer and distributor Michelin also aided relative performance.
During the period, the U.S. dollar depreciated against most foreign currencies, which also helped the Fund’s performance because investments in securities with non-U.S. currency exposure gained value as the dollar fell. In contrast, exposure to countries not included in the benchmark – specifically Brazil, China, and Canada – detracted from the Fund’s relative performance in 2012. Stock selection in Sweden, Spain, and Austria also weighed on relative results.
An overweight position and stock selection in the energy sector hindered the Fund’s relative performance for the year, with major detractors including Fund holdings Brazilian oil and natural gas company Petrobras Petroleo Brasileiro, Canadian oil and gas exploration and production company Talisman Energy (both non-benchmark stocks), and Dutch energy equipment services company SBM Offshore. An overweight position in the telecommunication services sector hurt relative results, and key detractors within that sector included the Fund’s investments in diversified telecommunication providers Telefonica (Spain), Telekom Austria, and China Telecom (a non-benchmark stock) – as well as U.K. wireless communications provider Vodafone Group. Stock selection in the consumer staples sector also weighed on relative performance. Finally, although the financials sector benefited performance overall, commercial bank UniCredit (Italy) hurt the Fund’s returns for the year.
Subadviser outlook
We believe the balance between risk and reward in the global financial system has changed dramatically in the past several years. As many governments intervened to stimulate their own economies, massive liabilities were transferred to the public sector. We feel this altered the risk profile of traditionally safe-haven assets and competitively devalued the world’s reserve currencies. Some ratings agencies have based downgrades at least partially on the inability of elected leaders to address these issues. In this environment of negative real interest rates and impaired government credibility, we believe equities are the best-positioned asset class to provide yield, inflation protection, and long-term appreciation potential. In our view, corporate fundamentals remain strong, and investors can still acquire stakes in productive enterprises at reasonable valuations. Furthermore, we believe that lower volatility and falling stock correlations are helping mitigate some broad factors that have influenced stocks in recent years, to the potential benefit of bottom-up stock-pickers.
18
MML Foreign Fund – Portfolio Manager Report (Unaudited) (Continued)
| | | | |
MML Foreign Fund Largest Holdings (% of Net Assets) on 12/31/12 | |
| | |
Sanofi | | | 2.7 | % |
Samsung Electronics Co., Ltd. | | | 2.6 | % |
Telenor ASA | | | 2.2 | % |
BNP Paribas | | | 2.0 | % |
HSBC Holdings PLC | | | 2.0 | % |
Bayer AG | | | 1.9 | % |
DBS Group Holdings, Ltd. | | | 1.9 | % |
Roche Holding AG | | | 1.9 | % |
Lloyds Banking Group PLC | | | 1.9 | % |
Royal Dutch Shell PLC Class B | | | 1.8 | % |
| | | | | |
| | | | 20.9 | % |
| | | | | |
| | | | |
MML Foreign Fund Sector Table (% of Net Assets) on 12/31/12 | |
| | |
Financial | | | 24.2 | % |
Communications | | | 14.3 | % |
Consumer, Non-cyclical | | | 15.8 | % |
Energy | | | 10.8 | % |
Industrial | | | 10.6 | % |
Consumer, Cyclical | | | 8.4 | % |
Technology | | | 6.9 | % |
Mutual Funds | | | 5.2 | % |
Basic Materials | | | 4.4 | % |
Utilities | | | 1.7 | % |
Diversified | | | 0.7 | % |
| | | | | |
Total Long-Term Investments | | | 103.0 | % |
Short-Term Investments and Other Assets and Liabilities | | | (3.0 | )% |
| | | | | |
Net Assets | | | 100.0 | % |
| | | | | |
| | | | |
MML Foreign Fund Country Weightings (% of Net Assets) on 12/31/12 | |
| | |
United Kingdom | | | 18.5 | % |
Germany | | | 12.7 | % |
France | | | 11.5 | % |
Switzerland | | | 10.1 | % |
Netherlands | | | 7.1 | % |
Japan | | | 5.8 | % |
United States | | | 5.2 | % |
Republic of Korea | | | 4.3 | % |
Singapore | | | 4.0 | % |
Hong Kong | | | 4.0 | % |
Norway | | | 3.8 | % |
Italy | | | 2.8 | % |
Brazil | | | 2.7 | % |
Spain | | | 2.5 | % |
China | | | 1.5 | % |
Taiwan | | | 1.4 | % |
Sweden | | | 1.3 | % |
Ireland | | | 1.2 | % |
India | | | 1.0 | % |
Canada | | | 0.9 | % |
South Africa | | | 0.4 | % |
Austria | | | 0.3 | % |
| | | | | |
Total Long-Term Investments | | | 103.0 | % |
Short-Term Investments and Other Assets and Liabilities | | | (3.0 | )% |
| | | | | |
Net Assets | | | 100.0 | % |
| | | | | |
19
MML Foreign Fund – Portfolio Manager Report (Unaudited) (Continued)
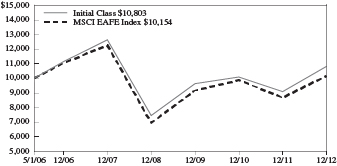
Growth of a $10,000 Investment
Hypothetical Investments in MML Foreign Fund Initial Class and the MSCI EAFE Index.
| | | | | | | | | | | | |
| | | | |
| TOTAL RETURN | | One Year
1/1/12 -
12/31/12 | | | Five Year
Average
Annual
1/1/08 -
12/31/12 | | | Since
Inception
Average
Annual
5/1/06 -
12/31/12 | |
| Initial Class | | | 19.06% | | | | -3.07% | | | | 1.16% | |
| MSCI EAFE Index | | | 17.32% | | | | -3.69% | | | | 0.23% | |
Hypothetical Investments in MML Foreign Fund Service Class and the MSCI EAFE Index.
| | | | | | | | |
| | | |
| TOTAL RETURN | | One Year
1/1/12 -
12/31/12 | | | Since
Inception
Average
Annual
8/15/08 -
12/31/12 | |
| Service Class | | | 18.74% | | | | 0.50% | |
| MSCI EAFE Index | | | 17.32% | | | | 0.11% | |
GROWTH OF $10,000 INVESTMENT SINCE INCEPTION

Performance data quoted represents past performance; past performance is not predictive of future results. The investment return and principal value of shares of the Fund will fluctuate with market conditions so that shares of the Fund, when redeemed, may be worth more or less than their original cost. Current performance of the Fund may be lower or higher than the performance quoted. Performance data current to the most recent month end may be obtained by accessing the website www.massmutual.com.
Investors should note that the Fund is a professionally managed mutual fund, while the MSCI EAFE Index is unmanaged, does not incur expenses, and cannot be purchased directly by investors. Investors should read the Fund’s prospectus with regard to the Fund’s investment objective, risks, and charges and expenses in conjunction with these financial statements. The Fund’s return reflects changes in the net asset value per share without the deduction of any product charges (e.g., cost of insurance, mortality and expense risk charges, administrative fees, and CDSL). The inclusion of these charges would have reduced the performance shown here.
20
MML Fundamental Growth Fund – Portfolio Manager Report (Unaudited)
What is the investment approach of MML Fundamental Growth Fund, and who is the Fund’s subadviser?
The Fund seeks long-term growth of capital by investing primarily in domestic equity securities that the Fund’s subadviser believes offer the potential for long-term growth. The Fund’s subadviser is Wellington Management Company, LLP (Wellington Management).
How did the Fund perform during the 12 months ended December 31, 2012?
The Fund’s Class II shares returned 13.14%, underperforming the 15.26% return of the Russell 1000® Growth Index (the “benchmark”), an unmanaged index consisting of those Russell 1000 securities (representing the 1,000 largest U.S. companies based on market capitalization) with greater than average growth orientation that tend to exhibit higher price-to-book ratios and higher forecasted growth rates than securities in the value universe.
For a discussion on the economic and market environment during the 12-month period ended December 31, 2012, please see the Economic and Market Review, beginning on page 3.
Subadviser discussion of factors that contributed to the Fund’s performance
The primary factor that hampered the Fund’s performance during 2012 was weak stock selection in the information technology, industrials, and materials sectors – although this was partially offset by stronger stock selection in the financials and energy sectors. Sector allocation, a result of our bottom-up, company-by-company stock selection process, contributed to the Fund’s relative results due to an overweight allocation, relative to the benchmark, to the strong-performing information technology sector and an underweight allocation to the underperforming consumer staples sector.
Top detractors from benchmark-relative returns included Fund holdings QLogic (information technology), Apollo Group (consumer discretionary), and Altera (information technology). Shares of QLogic, a designer and supplier of network infrastructure products, declined as the company posted disappointing earnings per share and declining operating cash flow. Private education provider Apollo Group saw its shares decline after management lowered operating profit and new enrollment forecasts; we subsequently eliminated the Fund’s position. Shares of Altera, a programmable logic semiconductor device manufacturer, underperformed, as investors feared that the company could lose market share to competitor Xilinx. Additionally, investors were concerned about the company’s exposure to Europe and China. The Fund continued to hold the stock, as we believe these fears are overblown and the company remains well positioned for future growth.
Top contributors to benchmark-relative returns included Fund holdings Bank of America (financials), eBay (information technology), and Gilead (health care). We established a new position for the Fund in Bank of America during the year and the stock subsequently rose, partially because the recovery in the U.S. housing market helped mitigate the risk of further deterioration in the company’s real estate-related assets. The Fund continued to own the stock. The Fund also continued to hold eBay, a U.S.-based provider of online marketplaces and payment solutions, which saw its share price climb higher after the company posted better-than-expected revenue and earnings due to strength in its marketplace segment and PayPal, an eBay-owned firm that facilitates online payments and money transfers. Shares of Gilead, a U.S.-based biopharmaceutical company, outperformed as the firm’s results exceeded expectations on strong antiviral product sales and investors reacted positively to the firm’s plans for developing its Hepatitis C franchise. The Fund continued to own the stock. Other notable Fund holdings that contributed to the Fund’s benchmark-relative returns included Intel (information technology), a stock included in the benchmark that the Fund did not hold, which declined during the reporting period.
Subadviser outlook
From a sector perspective, we have increased the Fund’s health care exposure, which, as of December 31, 2012, was the Fund’s largest overweight position. The Fund also held an overweight stake in the information technology and energy sectors as of year-end due to our positive outlook for many companies in those sectors.
While the Fund continued to hold an underweight position, we have increased the Fund’s exposure to the financials sector in recent months. U.S. home prices are now rising year-over-year for the first time in several years and our view is that the large mortgage divisions of the Fund’s bank holdings are likely to prosper in such an environment.
The industrials sector ended the year as the Fund’s largest underweight position. While valuations appear attractive for several stocks in this sector, we believe that overall quality is deteriorating for many of these firms. End-user demand is slowing in some key markets (such as China, India, and Europe) and the returns on capital appear to be poised for contraction, in our view.
21
MML Fundamental Growth Fund – Portfolio Manager Report (Unaudited) (Continued)
| | | | |
MML Fundamental Growth Fund Largest Holdings (% of Net Assets) on 12/31/12 | |
| | |
Apple, Inc. | | | 5.6 | % |
Cisco Systems, Inc. | | | 5.0 | % |
Microsoft Corp. | | | 2.9 | % |
Verizon Communications, Inc. | | | 2.6 | % |
Google, Inc. Class A | | | 2.5 | % |
Philip Morris International, Inc. | | | 2.4 | % |
The Coca-Cola Co. | | | 2.4 | % |
Wal-Mart Stores, Inc. | | | 2.4 | % |
International Business Machines Corp. | | | 2.3 | % |
Oracle Corp. | | | 2.2 | % |
| | | | | |
| | | | 30.3 | % |
| | | | | |
| | | | |
MML Fundamental Growth Fund Sector Table (% of Net Assets) on 12/31/12 | |
| | |
Consumer, Non-cyclical | | | 23.8 | % |
Communications | | | 20.5 | % |
Technology | | | 19.6 | % |
Consumer, Cyclical | | | 13.1 | % |
Industrial | | | 6.8 | % |
Energy | | | 4.7 | % |
Financial | | | 3.7 | % |
Basic Materials | | | 3.7 | % |
| | | | | |
Total Long-Term Investments | | | 95.9 | % |
Short-Term Investments and Other Assets and Liabilities | | | 4.1 | % |
| | | | | |
Net Assets | | | 100.0 | % |
| | | | | |
22
MML Fundamental Growth Fund – Portfolio Manager Report (Unaudited) (Continued)
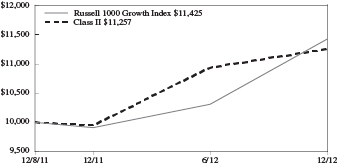
Growth of a $10,000 Investment
Hypothetical Investments in MML Fundamental Growth Fund Class II and the Russell 1000 Growth Index.
| | | | | | | | |
| | | |
| TOTAL RETURN | | One Year
1/1/12 -
12/31/12 | | | Since
Inception
Average
Annual
12/8/11 -
12/31/12 | |
| Class II | | | 13.14% | | | | 11.75% | |
| Russell 1000 Growth Index | | | 15.26% | | | | 13.28% | |
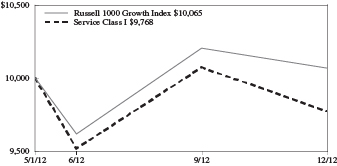
Hypothetical Investments in MML Fundamental Growth Fund Service Class I and the Russell 1000 Growth Index.
| | | | |
| | |
| TOTAL RETURN | | Since Inception
5/1/12 -
12/31/12 | |
| Service Class I | | | -2.32% | |
| Russell 1000 Growth Index | | | 0.65% | |
GROWTH OF $10,000 INVESTMENT SINCE INCEPTION
Performance data quoted represents past performance; past performance is not predictive of future results. The investment return and principal value of shares of the Fund will fluctuate with market conditions so that shares of the Fund, when redeemed, may be worth more or less than their original cost. Current performance of the Fund may be lower or higher than the performance quoted. Performance data current to the most recent month end may be obtained by accessing the website www.massmutual.com
Investors should note that the Fund is a professionally managed mutual fund, while the Russell 1000 Growth Index is unmanaged, does not incur expenses, and cannot be purchased directly by investors. Investors should read the Fund's prospectus with regard to the Fund's investment objective, risks, and charges and expenses in conjunction with these financial statements. The Fund's return reflects changes in the net asset value per share without the deduction of any product charges (e.g., cost of insurance, mortality and expense risk charges, administrative fees, and CDSL). The inclusion of these charges would have reduced the performance shown here.
23
MML Fundamental Value Fund – Portfolio Manager Report (Unaudited)
What is the investment approach of MML Fundamental Value Fund, and who is the Fund’s subadviser?
The Fund seeks long-term total return by investing primarily in equity securities of issuers that the Fund’s subadviser believes are undervalued. Under normal circumstances, the Fund invests at least 80% of its net assets in equity securities, with a focus on companies with large market capitalizations (which the subadviser believes are generally above $2 billion). The Fund’s subadviser is Wellington Management Company, LLP (Wellington Management).
How did the Fund perform during the 12 months ended December 31, 2012?
The Fund’s Class II shares returned 16.31%, underperforming the 17.51% return of the Russell 1000® Value Index (the “benchmark”), an unmanaged index consisting of those Russell 1000 securities (representing the 1,000 largest U.S. companies, based on market capitalization) with greater than average value orientation that tend to exhibit lower price-to-book ratios and lower forecasted growth rates than securities in the growth universe.
For a discussion on the economic and market environment during the 12-month period ended December 31, 2012, please see the Economic and Market Review, beginning on page 3.
Subadviser discussion of factors that contributed to the Fund’s performance
The Fund underperformed its benchmark during 2012 primarily due to weak stock selection in the financials and consumer discretionary sectors – although this was partially offset by positive stock selection in the industrials and health care sectors. Sector positioning, a result of our bottom-up, company-by-company stock selection process, also detracted due to an overweight allocation, relative to the benchmark, to the underperforming information technology sector and an underweight position in the strong-performing financials sector.
Top detractors from benchmark-relative performance included Fund holdings Intel (information technology), Occidental Petroleum (energy), and Kohl’s (consumer discretionary). Shares of Intel, a leading manufacturer of semiconductor chips, declined after the company lowered its revenue outlook, citing sluggish demand for its product. Shares of Occidental Petroleum – an exploration and production company with attractive acreage positions in California, West Texas, and the Middle East – declined amid lingering concerns over the cost of production in California. U.S.-based department store retailer Kohl’s declined, as the company struggled due to weak unit inventory levels, which hurt same-store sales figures. The Fund continued to own all three of these stocks. Other notable detractors included Bank of America in the financials sector. This was a stock the Fund held briefly, but the Fund’s underweight position in this issue strongly detracted on a relative basis, as the stock rose sharply.
Among the top contributors to benchmark-relative returns were Fund holdings Comcast (consumer discretionary), Ingersoll-Rand (industrials), and Home Depot (consumer discretionary). Shares of Comcast, the largest U.S. cable communications company and new owner of NBC Universal, moved higher after the company posted strong earnings and announced a 44% increase in its dividend in tandem with a significant share buyback. Ingersoll-Rand provides industrial machinery, climate control systems, and security products. Shares of this company outperformed during the period after residential markets strengthened and the firm beat consensus earnings estimates. Shares of Home Depot, a leading home improvement retailer, outperformed after the company posted solid earnings and management raised earnings-per-share guidance. Other notable contributors to benchmark-relative performance included Procter & Gamble (consumer staples), a weak-performing stock included in the benchmark that the Fund did not hold.
Subadviser outlook
As 2013 began, the Fund’s largest overweight positions were in the consumer discretionary and information technology sectors, with its largest underweight stakes being in the utilities and energy sectors. We believe slow but steady growth in the U.S., as measured by GDP (Gross Domestic Product), is likely to be somewhere around 2.5% this year. A last-minute deal averted a full dive off the fiscal cliff on New Year’s Day 2013; however, the temporary payroll tax cut of the past two years was allowed to expire, which essentially raised payroll taxes by 2% for most Americans on January 1, 2013. In our view, housing and employment are likely to continue to improve, and corporate earnings have the potential to see moderate growth in 2013. Households have enjoyed a nice boost to their net worth in recent years, which may help cushion the negative impact of higher taxation. Household formation is still going strong in the U.S., and housing starts have just started to improve. It appears that interest rates are slowly creeping higher, which, in our view, is a sign that the economy is improving. We remain cautiously optimistic and believe that the U.S. will be able to avoid a recession in 2013.
24
MML Fundamental Value Fund – Portfolio Manager Report (Unaudited) (Continued)
| | | | |
MML Fundamental Value Fund Largest Holdings
(% of Net Assets) on 12/31/12 | |
| | |
JP Morgan Chase & Co. | | | 3.8 | % |
Wells Fargo & Co. | | | 3.4 | % |
Chevron Corp. | | | 3.4 | % |
Cisco Systems, Inc. | | | 2.7 | % |
Merck & Co., Inc. | | | 2.3 | % |
Exxon Mobil Corp. | | | 2.3 | % |
AT&T, Inc. | | | 2.2 | % |
ACE Ltd. | | | 2.2 | % |
PNC Financial Services Group, Inc. | | | 2.1 | % |
General Electric Co. | | | 2.1 | % |
| | | | | |
| | | | 26.5 | % |
| | | | | |
| | | | |
MML Fundamental Value Fund Sector Table (% of Net Assets) on 12/31/12 | |
| | |
Financial | | | 24.1 | % |
Consumer, Non-cyclical | | | 17.5 | % |
Energy | | | 12.9 | % |
Industrial | | | 10.5 | % |
Consumer, Cyclical | | | 9.6 | % |
Communications | | | 8.6 | % |
Technology | | | 6.0 | % |
Basic Materials | | | 5.3 | % |
Utilities | | | 2.9 | % |
| | | | | |
Total Long-Term Investments | | | 97.4 | % |
Short-Term Investments and Other Assets and Liabilities | | | 2.6 | % |
| | | | | |
Net Assets | | | 100.0 | % |
| | | | | |
| | | | |
MML Fundamental Value Fund Country Weightings
(% of Net Assets) on 12/31/12 | |
| | |
United States | | | 84.2 | % |
Switzerland | | | 6.0 | % |
Ireland | | | 3.5 | % |
Belgium | | | 1.0 | % |
Canada | | | 1.0 | % |
United Kingdom | | | 0.9 | % |
Israel | | | 0.8 | % |
| | | | | |
Total Long-Term Investments | | | 97.4 | % |
Short-Term Investments and Other Assets and Liabilities | | | 2.6 | % |
| | | | | |
Net Assets | | | 100.0 | % |
| | | | | |
25
MML Fundamental Value Fund – Portfolio Manager Report (Unaudited) (Continued)
Growth of a $10,000 Investment
Hypothetical Investments in MML Fundamental Value Fund Class II and the Russell 1000 Value Index.
| | | | | | | | |
| | | |
| TOTAL RETURN | | One Year
1/1/12 -
12/31/12 | | | Since
Inception
Average
Annual
8/10/10 -
12/31/12 | |
| Class II | | | 16.31% | | | | 10.72% | |
| Russell 1000 Value Index | | | 17.51% | | | | 12.12% | |
Hypothetical Investments in MML Fundamental Value Fund Service Class I and the Russell 1000 Value Index.
| | | | |
| | |
| TOTAL RETURN | | Since
Inception
5/1/12 -
12/31/12 | |
| Service Class I | | | 3.90% | |
| Russell 1000 Value Index | | | 6.84% | |
GROWTH OF $10,000 INVESTMENT SINCE INCEPTION
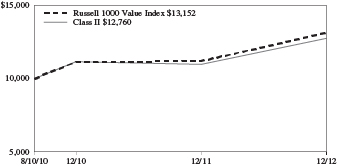
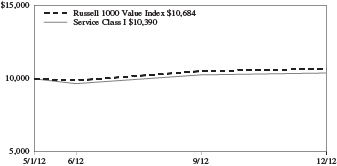
Performance data quoted represents past performance; past performance is not predictive of future results. The investment return and principal value of shares of the Fund will fluctuate with market conditions so that shares of the Fund, when redeemed, may be worth more or less than their original cost. Current performance of the Fund may be lower or higher than the performance quoted. Performance data current to the most recent month end may be obtained by accessing the website www.massmutual.com.
Investors should note that the Fund is a professionally managed mutual fund, while the Russell 1000 Value Index is unmanaged, does not incur expenses, and cannot be purchased directly by investors. Investors should read the Fund’s prospectus with regard to the Fund’s investment objective, risks, and charges and expenses in conjunction with these financial statements. The Fund’s return reflects changes in the net asset value per share without the deduction of any product charges (e.g., cost of insurance, mortality and expense risk charges, administrative fees, and CDSL). The inclusion of these charges would have reduced the performance shown here.
26
MML Global Fund – Portfolio Manager Report (Unaudited)
What is the investment approach of MML Global Fund, and who is the Fund’s subadviser?
The Fund seeks long-term capital appreciation by investing primarily in the equity securities of U.S. and foreign companies, including companies in developed and emerging markets. Equity securities may include common stocks, depositary receipts, preferred stocks, securities convertible into common or preferred stock, rights, and warrants. The Fund’s subadviser is Massachusetts Financial Services Company (MFS).
How did the Fund perform during the 12 months ended December 31, 2012?
The Fund’s Class I shares returned 23.69%, significantly outpacing the 15.83% return of the Morgan Stanley Capital International (MSCI®) World Index (the “benchmark”), an unmanaged index of issuers listed on the stock exchanges of 20 foreign countries and the U.S.
For a discussion on the economic and market environment during the 12-month period ended December 31, 2012, please see the Economic and Market Review, beginning on page 3.
Subadviser discussion of factors that contributed to the Fund’s performance
The Fund’s stock selection in the consumer staples sector contributed to performance, relative to the benchmark, for 2012. Overweight positions in Dutch brewer Heineken International, U.K.-based alcoholic beverage producer Diageo, and Swedish pulp and paper manufacturer and consumer goods company Svenska Cellulosa aided relative results, as all three of these Fund holdings significantly outpaced the benchmark during the reporting period. The Fund’s underweight positioning, relative to the benchmark, in both the energy and utilities/communications sectors was also beneficial. No individual securities within either of these sectors were among the Fund’s top relative contributors for the year.
Fund holdings in other sectors that boosted relative results included German health care product manufacturer Bayer, global payment technologies company Visa, media conglomerate Walt Disney, life sciences company Thermo Fisher Scientific, paint and coatings manufacturer Sherwin-Williams, South Korean microchip and electronics manufacturer Samsung Electronics (which is not included in the benchmark), and Swiss luxury goods company Richemont.
The Fund’s relative currency exposure was another contributor to relative performance during the year and resulted primarily from differences between the Fund’s and the benchmark’s exposures to holdings of securities denominated in foreign currencies.
Detracting from the Fund’s relative performance during the year was its underweight position in the strong financial services sector. With respect to specific Fund holdings, Swiss wealth management firm Julius Baer hindered relative results and lagged the benchmark during the year. The Fund’s investments in Japan printer and computer peripherals manufacturer Canon; oil and gas exploration company INPEX (Japan); ground delivery service company United Parcel Service; Japanese imaging, health care, and medical products manufacturer HOYA; and French food and beverage producer Danone were among the Fund’s top relative detractors for the year.
Specific benchmark stocks that the Fund did not invest in also detracted from the Fund’s relative results for the year, including strong-performing financial services firms Bank of America and U.K.-based bank HSBC. Similarly, the Fund’s failure to invest in shares of computer and personal electronics giant Apple hurt relative performance, as the stock outpaced the benchmark during the reporting period.
Finally, the Fund’s cash and/or cash equivalents position also held back relative performance. We strive to keep the Fund fully invested, typically only maintaining a cash position to buy new holdings and provide liquidity. However, in 2012, a period when equity markets rose, holding any amount of cash hurt the Fund’s relative performance, since the benchmark has no cash position.
Subadviser outlook
The Fund’s investment strategy is focused on high-quality companies with sustainable, above-average growth and returns whose prospects are not reflected in their valuation. Consequently, as 2013 began, the Fund had maintained overweight positions in a
27
MML Global Fund – Portfolio Manager Report (Unaudited) (Continued)
number of consumer staples and media companies, which we believe have strong brands and diverse geographical footprints that may enable them to grow at above-average rates, as well as strong balance sheets, good cash flow generation, and attractive valuations. The Fund maintains an underweight stake in companies that are sensitive to energy and commodity prices, including most integrated energy companies that are facing declining reserves and increasing costs – and the Fund does not own any metals/ mining companies. Finally, the Fund’s continued underweight position in the financials sector is driven by our belief that most developed market commercial banks and insurance companies likely will not grow faster than global gross domestic product (GDP) through a full cycle. However, we have conviction in financial companies with significant exposure to emerging markets, as well as leading companies in global investment servicing and electronic payments.
| | | | |
MML Global Fund Largest Holdings (% of Net Assets) on 12/31/12 | |
| | |
Linde AG | | | 3.0 | % |
Nestle SA | | | 2.9 | % |
The Walt Disney Co. | | | 2.6 | % |
Heineken NV | | | 2.6 | % |
Diageo PLC | | | 2.5 | % |
Reckitt Benckiser Group PLC | | | 2.5 | % |
Honeywell International, Inc. | | | 2.1 | % |
Bayer AG | | | 2.1 | % |
Visa, Inc. Class A | | | 2.0 | % |
Oracle Corp. | | | 2.0 | % |
| | | | | |
| | | | 24.3 | % |
| | | | | |
| | | | |
MML Global Fund Sector Table (% of Net Assets) on 12/31/12 | |
| | |
Consumer, Non-cyclical | | | 29.1 | % |
Industrial | | | 16.8 | % |
Financial | | | 13.0 | % |
Basic Materials | | | 9.7 | % |
Consumer, Cyclical | | | 9.4 | % |
Technology | | | 8.4 | % |
Communications | | | 6.4 | % |
Energy | | | 2.9 | % |
Diversified | | | 2.0 | % |
Mutual Funds | | | 1.9 | % |
Utilities | | | 0.3 | % |
| | | | | |
Total Long-Term Investments | | | 99.9 | % |
Short-Term Investments and Other Assets and Liabilities | | | 0.1 | % |
| | | | | |
Net Assets | | | 100.0 | % |
| | | | | |
| | | | |
MML Global Fund Country Weightings (% of Net Assets) on 12/31/12 | |
| | |
United States | | | 43.9 | % |
United Kingdom | | | 11.2 | % |
Switzerland | | | 8.8 | % |
France | | | 8.8 | % |
Germany | | | 7.7 | % |
Netherlands | | | 4.1 | % |
Japan | | | 3.4 | % |
Ireland | | | 1.9 | % |
Canada | | | 1.7 | % |
Sweden | | | 1.6 | % |
Netherlands Antilles | | | 1.3 | % |
Republic of Korea | | | 1.0 | % |
Brazil | | | 0.9 | % |
Denmark | | | 0.8 | % |
India | | | 0.6 | % |
Austria | | | 0.6 | % |
Czech Republic | | | 0.5 | % |
Israel | | | 0.4 | % |
Bermuda | | | 0.4 | % |
Spain | | | 0.3 | % |
| | | | | |
Total Long-Term Investments | | | 99.9 | % |
Short-Term Investments and Other Assets and Liabilities | | | 0.1 | % |
| | | | | |
Net Assets | | | 100.0 | % |
| | | | | |
28
MML Global Fund – Portfolio Manager Report (Unaudited) (Continued)
Growth of a $10,000 Investment
Hypothetical Investments in MML Global Fund Class I, Class II, and the MSCI World Index.
| | | | | | | | | | | | |
| | | | |
| TOTAL RETURN | | One Year
1/1/12 -
12/31/12 | | | Five Year
Average
Annual
1/1/08 -
12/31/12 | | | Since
Inception
Average
Annual
5/1/06 -
12/31/12 | |
| Class I | | | 23.69% | | | | -0.16% | | | | 1.32% | |
| Class II | | | 23.79% | | | | 0.04% | | | | 1.51% | |
| MSCI World Index | | | 15.83% | | | | -1.18% | | | | 1.76% | |
Hypothetical Investments in MML Global Fund Service Class I and the MSCI World Index.
| | | | | | | | |
| | | |
| TOTAL RETURN | | One Year
1/1/12 -
12/31/12 | | | Since
Inception
Average
Annual
8/15/08 -
12/31/12 | |
| Service Class I | | | 23.35% | | | | 3.55% | |
| MSCI World Index | | | 15.83% | | | | 2.08% | |
GROWTH OF $10,000 INVESTMENT SINCE INCEPTION
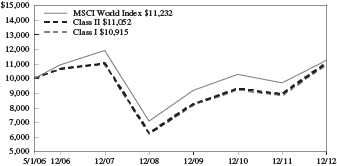
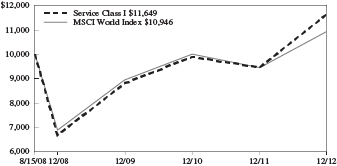
Performance data quoted represents past performance; past performance is not predictive of future results. The investment return and principal value of shares of the Fund will fluctuate with market conditions so that shares of the Fund, when redeemed, may be worth more or less than their original cost. Current performance of the Fund may be lower or higher than the performance quoted. Performance data current to the most recent month end may be obtained by accessing the website www.massmutual.com.
Investors should note that the Fund is a professionally managed mutual fund, while the MSCI World Index is unmanaged, does not incur expenses, and cannot be purchased directly by investors. Investors should read the Fund’s prospectus with regard to the Fund’s investment objective, risks, and charges and expenses in conjunction with these financial statements. The Fund’s return reflects changes in the net asset value per share without the deduction of any product charges (e.g., cost of insurance, mortality and expense risk charges, administrative fees, and CDSL). The inclusion of these charges would have reduced the performance shown here.
29
MML Growth & Income Fund – Portfolio Manager Report (Unaudited)
What is the investment approach of MML Growth & Income Fund, and who is the Fund’s subadviser?
The Fund seeks capital appreciation and income by investing, under normal circumstances, at least 80% of its net assets in equity securities and equity-related securities, including convertible securities, preferred stocks, options, and warrants, of U.S. companies with market capitalizations at the time of purchase greater than $1 billion. The Fund’s subadviser is Massachusetts Financial Services Company (MFS).
How did the Fund perform during the 12 months ended December 31, 2012?
The Fund’s Initial Class shares returned 19.49%, outperforming the 16.00% return of the S&P 500® Index (the “benchmark”), a widely recognized, unmanaged index representative of common stocks of larger capitalized U.S. companies.
For a discussion on the economic and market environment during the 12-month period ended December 31, 2012, please see the Economic and Market Review, beginning on page 3.
Subadviser discussion of factors that contributed to the Fund’s performance
For 2012, stock selection in the financial services, health care, and consumer staples sectors contributed to the Fund’s performance, relative to the benchmark. On a stock-specific basis, in the financial services sector, the Fund’s positions in investment banking firms Goldman Sachs and JPMorgan, and payments technology company Visa, benefited relative performance, as all three stocks outperformed the benchmark. In the health care sector, holding shares of strong-performing biotechnology firm Gilead Sciences and life sciences supply company Thermo Fisher Scientific also supported the Fund’s relative results. In the consumer staples sector, Fund holding Dutch brewer Heineken, which is not included in the benchmark, contributed to relative performance.
A combination of strong stock selection and an overweight position, relative to the benchmark, in the automobile and housing sectors also contributed for the year. The Fund’s investments in paint and coatings manufacturer Sherwin-Williams benefited relative performance, as the stock posted strong results for the year. Stock selection in the technology sector also helped relative results. Specifically, the Fund’s avoidance of semiconductor company Intel and computer products and services provider Hewlett-Packard supported relative performance, as both stocks underperformed the benchmark for the year. Finally, Fund holding Walt Disney, the strong-performing entertainment and media conglomerate, boosted the Fund’s full-year relative performance.
Conversely, stock selection in the retailing sector, where the Fund’s position in discount department store Kohl’s posted losses, weighed down Fund performance. In addition, the Fund’s failure to invest in strong-performing home improvement company Home Depot and Internet retailer Amazon.com held back relative returns.
Stocks in other sectors that hampered relative performance included the Fund’s holdings of semiconductor company Microchip Technology, oil and gas exploration and production company Occidental Petroleum, and Israeli-headquartered security software provider Check Point Software Technologies, which is not a member of the benchmark. Not holding financial services firm Citigroup and online auctioneer eBay also negatively impacted relative returns, as both stocks generated strong performance relative to the benchmark. Additionally, the timing of the Fund’s ownership of shares of pharmaceutical and medical products maker Abbott Laboratories weighed on relative results, as the company’s shares rose after the Fund had eliminated it from the portfolio.
Subadviser outlook
Policymakers in the United States managed to put together a deal to avoid the fiscal cliff, investors seem to have confidence in the current environment, and flows into equities have strengthened. Over the next several months, we believe equities will come under some short-term pressure from continued policy uncertainty in the United States; however, we expect this pressure may create an opportunity to incrementally add to equities. In our view, the economic picture for 2013 looks slightly better than it did last year and the investing environment contains many compelling opportunities.
30
MML Growth & Income Fund – Portfolio Manager Report (Unaudited) (Continued)
Looking at current positioning, we have maintained the Fund’s overweight positions in a number of consumer staples companies – specifically those in the alcoholic beverages and consumer products market segments. This represented, as of year-end, the Fund’s largest sector overweight. Elsewhere, medical equipment was the Fund’s largest industry overweight, but the Fund also held an overweight stake in financial services, particularly select asset managers, payment processing companies, and major banks. The Fund held an overweight allocation to the aerospace and defense industry. Conversely, the Fund continued to have no exposure to real estate investment trusts (REITs) – which we believe continued to look expensive – and to life insurance companies. In addition, the Fund held an underweight position in telephone services companies. Finally, the Fund had no exposure to machinery and tools companies as we entered 2013.
| | | | |
MML Growth & Income Fund Largest Holdings (% of Net Assets) on 12/31/12 | |
| | |
Apple, Inc. | | | 3.8 | % |
Danaher Corp. | | | 2.7 | % |
JP Morgan Chase & Co. | | | 2.6 | % |
Pfizer, Inc. | | | 2.5 | % |
Exxon Mobil Corp. | | | 2.4 | % |
Johnson & Johnson | | | 2.3 | % |
The Walt Disney Co. | | | 2.2 | % |
Google, Inc. Class A | | | 2.1 | % |
EMC Corp. | | | 2.0 | % |
Oracle Corp. | | | 1.8 | % |
| | | | | |
| | | | 24.4 | % |
| | | | | |
| | | | |
MML Growth & Income Fund Sector Table (% of Net Assets) on 12/31/12 | |
| | |
Consumer, Non-cyclical | | | 24.8 | % |
Financial | | | 15.7 | % |
Technology | | | 14.0 | % |
Industrial | | | 12.9 | % |
Energy | | | 10.4 | % |
Consumer, Cyclical | | | 7.6 | % |
Communications | | | 6.4 | % |
Basic Materials | | | 3.2 | % |
Utilities | | | 3.1 | % |
Diversified | | | 1.1 | % |
| | | | | |
Total Long-Term Investments | | | 99.2 | % |
Short-Term Investments and Other Assets and Liabilities | | | 0.8 | % |
| | | | | |
Net Assets | | | 100.0 | % |
| | | | | |
31
MML Growth & Income Fund – Portfolio Manager Report (Unaudited) (Continued)
Growth of a $10,000 Investment
Hypothetical Investments in MML Growth & Income Fund Initial Class and the S&P 500 Index.
| | | | | | | | | | | | |
| | | | |
| TOTAL RETURN | | One Year
1/1/12 -
12/31/12 | | | Five Year
Average
Annual
1/1/08 -
12/31/12 | | | Since
Inception
Average
Annual
5/1/06 -
12/31/12 | |
| Initial Class | | | 19.49% | | | | 0.00% | | | | 0.59% | |
| S&P 500 Index | | | 16.00% | | | | 1.66% | | | | 3.48% | |
Hypothetical Investments in MML Growth & Income Fund Service Class and the S&P 500 Index.
| | | | | | | | |
| | | |
| TOTAL RETURN | | One Year
1/1/12 -
12/31/12 | | | Since
Inception
Average
Annual
8/15/08 -
12/31/12 | |
| Service Class | | | 19.32% | | | | 2.79% | |
| S&P 500 Index | | | 16.00% | | | | 4.59% | |
GROWTH OF $10,000 INVESTMENT SINCE INCEPTION
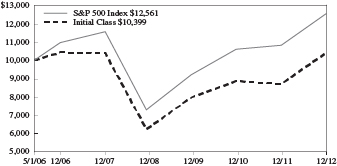
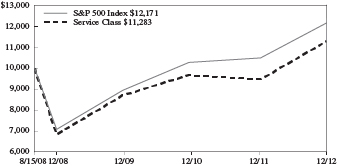
Performance data quoted represents past performance; past performance is not predictive of future results. The investment return and principal value of shares of the Fund will fluctuate with market conditions so that shares of the Fund, when redeemed, may be worth more or less than their original cost. Current performance of the Fund may be lower or higher than the performance quoted. Performance data current to the most recent month end may be obtained by accessing the website www.massmutual.com.
Investors should note that the Fund is a professionally managed mutual fund, while the S&P 500 Index is unmanaged, does not incur expenses, and cannot be purchased directly by investors. Investors should read the Fund’s prospectus with regard to the Fund’s investment objective, risks, and charges and expenses in conjunction with these financial statements. The Fund’s return reflects changes in the net asset value per share without the deduction of any product charges (e.g., cost of insurance, mortality and expense risk charges, administrative fees, and CDSL). The inclusion of these charges would have reduced the performance shown here.
32
MML Income & Growth Fund – Portfolio Manager Report (Unaudited)
What is the investment approach of MML Income & Growth Fund, and who is the Fund’s subadviser?
The Fund seeks long-term total return and current income by investing primarily in equity securities of dividend paying companies that the Fund’s subadviser believes will both increase in value over the long term and provide current income. Equity securities may include common stocks, preferred stocks, securities convertible into common or preferred stock, rights, and warrants. The Fund’s subadviser is BlackRock Investment Management, LLC (BlackRock).
How did the Fund perform during the 12 months ended December 31, 2012?
The Fund’s Initial Class shares returned 11.96%, underperforming the 16.00% return of the S&P 500® Index (the “benchmark”), a widely recognized, unmanaged index representative of common stocks of larger capitalized U.S. companies. The Fund also trailed the 17.51% return of the Russell 1000® Value Index, an unmanaged index consisting of those Russell 1000 securities (representing the 1,000 largest U.S. companies based on market capitalization) with greater than average value orientation that tend to exhibit lower price-to-book ratios and lower forecasted growth rates than securities in the growth universe.
For a discussion on the economic and market environment during the 12-month period ended December 31, 2012, please see the Economic and Market Review, beginning on page 3.
Subadviser discussion of factors that contributed to the Fund’s performance
The largest detractor from relative performance during 2012 came from a combination of stock selection and a large underweight position in the financials sector, followed by weak stock selection within industrials. A combination of overweight positions and security selection in both materials and telecommunications also weighed on relative returns for the year, as did stock selection in consumer discretionary, consumer staples, and information technology. An overweight position in the consumer staples sector and an underweight stake in the energy sector also detracted marginally from relative returns during the course of the year.
From an individual securities perspective, detractors from performance included Fund holdings McDonald’s Corp., a leading fast food provider; technology leader Intel Corp.; and Occidental Petroleum Corp. McDonald’s, specifically, was the most significant detractor, largely because of the company’s European exposure, a market from which the company derives a significant amount of its revenues.
The biggest contributor to the Fund’s returns, relative to the benchmark for 2012 was individual security selection in the energy sector, followed by stock selection in utilities. The Fund’s underweight positions, relative to the benchmark, in information technology and health care also added to performance, as did its overweight allocations to the industrials and consumer discretionary sectors.
Stock selection within the energy sector was a significant contributor to returns during the year, largely because the stocks the Fund held here tended to be oil-focused companies. We believe the supply/demand dynamics in the marketplace tilted in favor of oil-focused firms throughout the year, given the macro-economic variables in the energy sector. The Fund’s utility holdings were largely regulated utilities, all of which benefited from an accommodative regulatory environment in the United States, strong returns on equity, and a global search for yield among investors.
From an individual securities perspective, contributors to Fund performance over the period included Fund holdings JPMorgan Chase & Co. and Wells Fargo Bank (banks in the financials sector) along with Home Depot (a home products giant in the consumer discretionary sector). The banks’ contribution to performance came largely from the fact that they are considered among the highest-quality, lowest-relative-risk financial institutions in the United States. As the industry recovers from the credit crisis, firms within the financials sector will need to derive new ways to enhance margins. JPMorgan Chase and Wells Fargo are two of the leaders in this regard, and innovation and risk management remain central to each bank’s core businesses in 2013.
Subadviser outlook
As we consider all factors in conjunction with the current level of equity valuation, we believe that there is a strong case to be made for investment in U.S. equities, especially among the highest-quality, dividend-paying segment of the market. While equities generally rebounded and proved quite resilient during 2012, they are very attractive relative to other asset classes – especially fixed income, in our view.
33
MML Income & Growth Fund – Portfolio Manager Report (Unaudited) (Continued)
As investors face a new year, we believe they do so with a number of potential challenges, but significant opportunities. Top of mind for many are the current high prices of bonds, the lack of yield in the marketplace, broad underexposure to equities, seniors’ worries about outliving income, and the prospect of inflation on the not-so-distant horizon. We believe that equity income securities can offer a unique benefit in this environment, and expect that investors could place a high degree of confidence in such stocks throughout 2013.
| | | | |
MML Income & Growth Fund
Largest Holdings
(% of Net Assets) on 12/31/12 | |
| | |
Chevron Corp. | | | 3.0 | % |
JP Morgan Chase & Co. | | | 2.9 | % |
Wells Fargo & Co. | | | 2.8 | % |
Pfizer, Inc. | | | 2.2 | % |
Exxon Mobil Corp. | | | 2.1 | % |
The Home Depot, Inc. | | | 2.1 | % |
BHP Billiton Ltd. | | | 2.0 | % |
International Business Machines Corp. | | | 1.9 | % |
Philip Morris International, Inc. | | | 1.9 | % |
Deere & Co. | | | 1.8 | % |
| | | | | |
| | | | 22.7 | % |
| | | | | |
| | | | |
MML Income & Growth Fund
Sector Table
(% of Net Assets) on 12/31/12 | |
| | |
Consumer, Non-cyclical | | | 18.9 | % |
Financial | | | 16.1 | % |
Industrial | | | 14.5 | % |
Energy | | | 12.3 | % |
Communications | | | 8.2 | % |
Utilities | | | 7.9 | % |
Consumer, Cyclical | | | 7.5 | % |
Basic Materials | | | 6.9 | % |
Technology | | | 4.0 | % |
| | | | | |
Total Long-Term Investments | | | 96.3 | % |
Short-Term Investments and Other Assets and Liabilities | | | 3.7 | % |
| | | | | |
Net Assets | | | 100.0 | % |
| | | | | |
| | | | |
MML Income & Growth Fund
Country Weightings
(% of Net Assets) on 12/31/12 | |
| | |
United States | | | 81.6 | % |
Canada | | | 6.4 | % |
Australia | | | 2.6 | % |
United Kingdom | | | 1.9 | % |
France | | | 1.4 | % |
Netherlands | | | 1.2 | % |
Switzerland | | | 0.7 | % |
Netherlands Antilles | | | 0.5 | % |
| | | | | |
Total Long-Term Investments | | | 96.3 | % |
Short-Term Investments and Other Assets and Liabilities | | | 3.7 | % |
| | | | | |
Net Assets | | | 100.0 | % |
| | | | | |
34
MML Income & Growth Fund – Portfolio Manager Report (Unaudited) (Continued)
Growth of a $10,000 Investment
Hypothetical Investments in MML Income & Growth Fund Initial Class, the S&P 500 Index, and the Russell 1000 Value Index.
| | | | | | | | | | | | |
| | | | |
| TOTAL RETURN | | One Year
1/1/12 -
12/31/12 | | | Five Year
Average
Annual
1/1/08 -
12/31/12 | | | Since
Inception
Average
Annual
5/1/06 -
12/31/12 | |
| Initial Class | | | 11.96% | | | | 0.34% | | | | 1.81% | |
| S&P 500 Index* | | | 16.00% | | | | 1.66% | | | | 3.48% | |
| Russell 1000 Value Index | | | 17.51% | | | | 0.59% | | | | 2.21% | |
Hypothetical Investments in MML Income & Growth Fund Service Class, the S&P 500 Index, and the Russell 1000 Value Index.
| | | | | | | | |
| | | |
| TOTAL RETURN | | One Year
1/1/12 -
12/31/12 | | | Since
Inception
Average
Annual
8/15/08 -
12/31/12 | |
| Service Class | | | 11.73% | | | | 2.92% | |
| S&P 500 Index* | | | 16.00% | | | | 4.59% | |
| Russell 1000 Value Index | | | 17.51% | | | | 3.79% | |
GROWTH OF $10,000 INVESTMENT SINCE INCEPTION
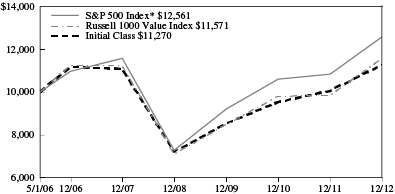
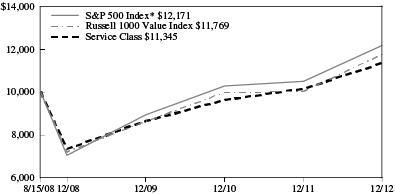
* Benchmark
Performance data quoted represents past performance; past performance is not predictive of future results. The investment return and principal value of shares of the Fund will fluctuate with market conditions so that shares of the Fund, when redeemed, may be worth more or less than their original cost. Current performance of the Fund may be lower or higher than the performance quoted. Performance data current to the most recent month end may be obtained by accessing the website www.massmutual.com.
Investors should note that the Fund is a professionally managed mutual fund, while the S&P 500 Index and the Russell 1000 Value Index are unmanaged, do not incur expenses, and cannot be purchased directly by investors. Investors should read the Fund’s prospectus with regard to the Fund’s investment objective, risks, and charges and expenses in conjunction with these financial statements. The Fund’s return reflects changes in the net asset value per share without the deduction of any product charges (e.g., cost of insurance, mortality and expense risk charges, administrative fees, and CDSL). The inclusion of these charges would have reduced the performance shown here.
35
MML Large Cap Growth Fund – Portfolio Manager Report (Unaudited)
What is the investment approach of MML Large Cap Growth Fund, and who is the Fund’s subadviser?
The Fund seeks long-term capital appreciation by investing primarily in large-capitalization companies that the Fund’s subadviser believes offer the potential for long-term growth. Under normal circumstances, the Fund invests at least 80% of its net assets in the common stocks of companies whose market capitalizations at the time of purchase are within the market capitalization range of companies included in the Russell 1000® Growth Index. The Fund’s subadviser is Rainier Investment Management, Inc. (Rainier).
How did the Fund perform during the 12 months ended December 31, 2012?
The Fund’s Initial Class shares returned 15.81%, outperforming the 15.26% return of the Russell 1000 Growth Index (the “benchmark”), an unmanaged index consisting of those Russell 1000 securities (representing the 1,000 largest U.S. companies based on market capitalization) with greater than average growth orientation that tend to exhibit higher price-to-book ratios and higher forecasted growth rates than securities in the value universe.
For a discussion on the economic and market environment during the 12-month period ended December 31, 2012, please see the Economic and Market Review, beginning on page 3.
Subadviser discussion of factors that contributed to the Fund’s performance
Consumer staples stocks added the most to Fund performance in 2012, relative to the benchmark, despite the sector’s posting some of the worst absolute performance in the benchmark for the year. Almost all outperformance in consumer staples was due to strong stock selection. Fund holding Monster Beverage Corp., maker of Monster Energy drinks and Hansen’s Natural Soda, benefited from the growing energy drink category and continued to increase its market share. Other Fund investments that contributed to the Fund’s performance for the year included cigarette and tobacco company Philip Morris International and natural foods supermarket chain Whole Foods Markets.
Financial stocks also boosted Fund performance on both a relative and an absolute basis for the year. Gains in financial services were led by Fund holdings American Tower, Visa, and MasterCard. American Tower, the leading cell phone tower company in the United States, is benefiting from a surge in demand for wireless data from the boom in smartphones. We believe telecommunications companies will continue to upgrade their wireless networks, providing a lift to the cash flow of American Tower. With global reach and the increasing trend toward greater use of credit and debit cards, Visa and MasterCard again showed their ability in 2012 to deliver impressive results.
Technology shares were the biggest detractors for the Fund during the year ended December 31, 2012. Riverbed Technologies, Oracle, and Check Point Software Technologies were among the Fund’s technology shares that suffered declines in value. Consequently, we eliminated these companies from the Fund during the year. Toward the end of 2012, we initiated a Fund position in SAP, a database management company that we believe is well positioned for the rising need to manage ever-increasing amounts of data. We also believe that SAP will participate in the booming growth in cloud computing.
Subadviser outlook
In our view, prospects for continued above-historical-average equity returns remain good for 2013. We feel this is supported by both the economic environment and equity valuations. Despite a modest uptick in payroll taxes, we believe that a resurgent housing market and relatively healthy automotive, aerospace, and energy employment prospects point toward modest positive economic growth in 2013, as well as a gradual improvement in employment demand.
The global environment also appears moderately encouraging. We believe that a huge global easing cycle has developed, as new political regimes have emerged in important economies – notably China and Japan. Meanwhile, Europe appears to be stabilizing somewhat, evidenced by improving prices of countries’ sovereign bonds, which suggests less credit risk on the continent. Cumulatively, these factors lead us to believe that 2013 is likely to be a positive year for U.S. equity investors.
36
MML Large Cap Growth Fund – Portfolio Manager Report (Unaudited) (Continued)
| | | | |
MML Large Cap Growth Fund
Largest Holdings
(% of Net Assets) on 12/31/12 | |
| | |
Apple, Inc. | | | 5.4 | % |
Google, Inc. Class A | | | 3.7 | % |
EMC Corp. | | | 2.6 | % |
eBay, Inc. | | | 2.6 | % |
QUALCOMM, Inc. | | | 2.5 | % |
Visa, Inc. Class A | | | 2.5 | % |
MasterCard, Inc. Class A | | | 2.3 | % |
Precision Castparts Corp. | | | 2.2 | % |
Allergan, Inc. | | | 2.2 | % |
Comcast Corp. Class A | | | 2.2 | % |
| | | | | |
| | | | 28.2 | % |
| | | | | |
| | | | |
MML Large Cap Growth Fund
Sector Table
(% of Net Assets) on 12/31/12 | |
| | |
Consumer, Non-cyclical | | | 24.9 | % |
Communications | | | 19.2 | % |
Technology | | | 19.2 | % |
Industrial | | | 11.9 | % |
Consumer, Cyclical | | | 10.6 | % |
Energy | | | 4.6 | % |
Basic Materials | | | 4.0 | % |
Financial | | | 3.0 | % |
| | | | | |
Total Long-Term Investments | | | 97.4 | % |
Short-Term Investments and Other Assets and Liabilities | | | 2.6 | % |
| | | | | |
Net Assets | | | 100.0 | % |
| | | | | |
37
MML Large Cap Growth Fund – Portfolio Manager Report (Unaudited) (Continued)
Growth of a $10,000 Investment
Hypothetical Investments in MML Large Cap Growth Fund Initial Class and the Russell 1000 Growth Index.
| | | | | | | | | | | | |
| | | | |
| TOTAL RETURN | | One Year
1/1/12 -
12/31/12 | | | Five Year
Average
Annual
1/1/08 -
12/31/12 | | | Since
Inception
Average
Annual
5/1/06 -
12/31/12 | |
| Initial Class | | | 15.81% | | | | 0.66% | | | | 2.45% | |
| Russell 1000 Growth Index | | | 15.26% | | | | 3.12% | | | | 4.96% | |
Hypothetical Investments in MML Large Cap Growth Fund Service Class and the Russell 1000 Growth Index.
| | | | | | | | |
| | | |
| TOTAL RETURN | | One Year
1/1/12 -
12/31/12 | | | Since
Inception
Average
Annual
8/15/08 -
12/31/12 | |
| Service Class | | | 15.42% | | | | 3.75% | |
| Russell 1000 Growth Index | | | 15.26% | | | | 5.72% | |
GROWTH OF $10,000 INVESTMENT SINCE INCEPTION
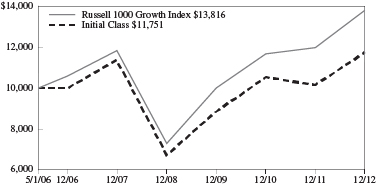
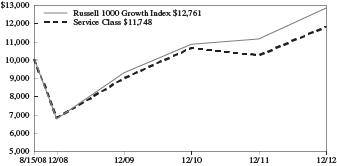
Performance data quoted represents past performance; past performance is not predictive of future results. The investment return and principal value of shares of the Fund will fluctuate with market conditions so that shares of the Fund, when redeemed, may be worth more or less than their original cost. Current performance of the Fund may be lower or higher than the performance quoted. Performance data current to the most recent month end may be obtained by accessing the website www.massmutual.com.
Investors should note that the Fund is a professionally managed mutual fund, while the Russell 1000 Growth Index is unmanaged, does not incur expenses, and cannot be purchased directly by investors. Investors should read the Fund’s prospectus with regard to the Fund’s investment objective, risks, and charges and expenses in conjunction with these financial statements. The Fund’s return reflects changes in the net asset value per share without the deduction of any product charges (e.g., cost of insurance, mortality and expense risk charges, administrative fees, and CDSL). The inclusion of these charges would have reduced the performance shown here.
38
MML Large Cap Value Fund – Portfolio Manager Report (Unaudited)
What is the investment approach of MML Large Cap Value Fund, and who is the Fund’s subadviser?
The Fund seeks both capital growth and income by investing primarily in large-capitalization companies that the Fund’s subadviser believes are undervalued. Under normal circumstances, the Fund will invest at least 80% of its net assets in common stocks of companies with market capitalizations at the time of purchase of at least $5 billion. The Fund’s subadviser is Davis Selected Advisers, L.P. (Davis).
How did the Fund perform during the 12 months ended December 31, 2012?
The Fund’s Initial Class shares returned 13.19%, underperforming the 16.00% return of the S&P 500® Index (the “benchmark”), a widely recognized, unmanaged index representative of common stocks of larger capitalized U.S. companies. In addition, the Fund trailed the 17.51% return of the Russell 1000® Value Index, an unmanaged index consisting of those Russell 1000 securities (representing the 1,000 largest U.S. companies, based on market capitalization) with greater than average value orientation that tend to exhibit lower price-to-book ratios and lower forecasted growth rates than securities in the growth universe.
For a discussion on the economic and market environment during the 12-month period ended December 31, 2012, please see the Economic and Market Review, beginning on page 3.
Subadviser discussion of factors that contributed to the Fund’s performance
For 2012, the sectors within the benchmark that turned in the strongest performance were financials and consumer discretionary. Conversely, the sectors that had the weakest performance (although still positive) were utilities and energy.
The Fund’s holdings in energy companies were the most significant detractors from performance on an absolute and relative basis. The Fund’s energy stock component underperformed that of the benchmark, but the Fund’s underweight position, relative to the benchmark, in this weaker-performing sector helped dampen the negative impact. With respect to Fund holdings, Eog Resources, an oil and natural gas company, was a top performer. On the other hand, the greatest detractors from performance included Canadian Natural Resources, a Calgary-based oil and natural gas exploration, development, and production company; Occidental Petroleum, an oil and gas exploration and production company; OGX Petroleo e Gas Participacoes, S.A., a Brazilian oil and gas company; and Devon Energy, a natural gas and oil producer.
Consumer discretionary companies contributed to the Fund’s absolute performance, but detracted from relative performance. Additionally, the Fund’s underweight position in this stronger-performing sector hampered performance. Entertainment giant Walt Disney was a Fund holding that contributed substantially to performance within the sector. Conversely, Groupon – a website that offers discounts to local and nationwide companies – and domestic merchandise retailer Bed Bath and Beyond were among the most detrimental consumer discretionary fund holdings during the year.
Financial companies made the greatest contribution to the Fund’s absolute performance for the year. The Fund’s financial holdings underperformed the benchmark, but the Fund did benefit from an overweight stake in this stronger-performing sector. Specifically, Wells Fargo and Bank of New York Mellon (both banks), American Express (a financial services company), and property/casualty insurer Progressive were among the holdings that contributed the most to the Fund’s full-year performance. On the other hand, Fund holdings Julius Baer Group (a Swiss private banking company) and Fairfax Financial Holdings (a Canadian financial holding company that focuses on insurance and investment management) were among the most significant detractors from Fund returns.
Consumer staples companies were important contributors to both the Fund’s absolute performance and relative performance for the year. The Fund’s consumer staples component outperformed that of the benchmark, although the Fund had an overweight allocation to this weaker-performing sector, which offset some of the positive impact. Costco Wholesale (a membership warehouse club), CVS Caremark (a drug retailer), and Diageo (a British-based alcoholic beverages giant) were among the Fund holdings that were the most significant contributors to performance within consumer staples.
Because we manage the Fund using a low-turnover strategy, as of December 31, 2012, only two companies had dropped out of the Fund’s top 10 holdings from the end of 2011. Specifically, we replaced Merck and Johnson & Johnson with Berkshire Hathaway and Progressive. The Fund no longer holds any shares of Merck and Johnson & Johnson.
39
MML Large Cap Value Fund – Portfolio Manager Report (Unaudited) (Continued)
Subadviser outlook
Looking ahead, the companies that the Fund owns seem well positioned to continue growing at a respectable rate, in our view. Based on metrics like balance sheet strength, market share, cost structure, brand awareness, and economies of scale, we believe many of the Fund’s core holdings are actually in a stronger competitive position now than five years ago. At the same time, the broader U.S. economy, while certainly not robust, appears to have absorbed the shocks of the residential real estate decline and financial crisis and seems to be in a somewhat healthier position, with unemployment trending down and home prices stabilizing and even beginning to rise modestly in many markets.
Our long-term focus usually results in low Fund turnover. We do not overreact to past short-term performance from individual holdings on either the upside or the downside. We will continue to follow the Fund’s investment strategy, which is to perform extensive research to buy durable companies at a discount to their intrinsic values and to hold them for the long term. As always, we will focus deliberately on the future, considering each company’s long-term business fundamentals.
| | | | |
MML Large Cap Value Fund Largest Holdings (% of Net Assets) on 12/31/12 | |
| | |
American Express Co. | | | 6.2 | % |
CVS Caremark Corp. | | | 6.1 | % |
Wells Fargo & Co. | | | 6.1 | % |
Bank of New York Mellon Corp. | | | 4.9 | % |
Costco Wholesale Corp. | | | 4.6 | % |
Google, Inc. Class A | | | 3.9 | % |
EOG Resources, Inc. | | | 3.0 | % |
Berkshire Hathaway, Inc. Class A | | | 2.7 | % |
Loews Corp. | | | 2.7 | % |
The Progressive Corp. | | | 2.6 | % |
| | | | | |
| | | | 42.8 | % |
| | | | | |
| | | | |
MML Large Cap Value Fund Sector Table (% of Net Assets) on 12/31/12 | |
| | |
Financial | | | 35.5 | % |
Consumer, Cyclical | | | 15.9 | % |
Consumer, Non-cyclical | | | 10.7 | % |
Energy | | | 9.6 | % |
Communications | | | 8.2 | % |
Basic Materials | | | 6.4 | % |
Technology | | | 4.4 | % |
Industrial | | | 2.2 | % |
Diversified | | | 1.3 | % |
Mutual Funds | | | 1.0 | % |
| | | | | |
Total Long-Term Investments | | | 95.2 | % |
Short-Term Investments and Other Assets and Liabilities | | | 4.8 | % |
| | | | | |
Net Assets | | | 100.0 | % |
| | | | | |
| | | | |
MML Large Cap Value Fund Country Weightings (% of Net Assets) on 12/31/12 | |
| | |
United States | | | 76.2 | % |
Switzerland | | | 5.3 | % |
Canada | | | 5.1 | % |
United Kingdom | | | 3.7 | % |
Hong Kong | | | 2.1 | % |
Netherlands | | | 1.3 | % |
Netherlands Antilles | | | 0.7 | % |
Mexico | | | 0.4 | % |
Brazil | | | 0.2 | % |
Bermuda | | | 0.2 | % |
| | | | | |
Total Long-Term Investments | | | 95.2 | % |
Short-Term Investments and Other Assets and Liabilities | | | 4.8 | % |
| | | | | |
Net Assets | | | 100.0 | % |
| | | | | |
40
MML Large Cap Value Fund – Portfolio Manager Report (Unaudited) (Continued)
Growth of a $10,000 Investment
Hypothetical Investments in MML Large Cap Value Fund Initial Class, the S&P 500 Index, and the Russell 1000 Value Index.
| | | | | | | | | | | | |
| | | | |
| TOTAL RETURN | | One Year
1/1/12 -
12/31/12 | | | Five Year
Average
Annual
1/1/08 -
12/31/12 | | | Ten Year
Average
Annual
1/1/03 -
12/31/12 | |
| Initial Class | | | 13.19% | | | | -0.62% | | | | 6.22% | |
| S&P 500 Index* | | | 16.00% | | | | 1.66% | | | | 7.10% | |
| Russell 1000 Value Index | | | 17.51% | | | | 0.59% | | | | 7.38% | |
Hypothetical Investments in MML Large Cap Value Fund Service Class, the S&P 500 Index, and the Russell 1000 Value Index.
| | | | | | | | |
| | | |
| TOTAL RETURN | | One Year
1/1/12 -
12/31/12 | | | Since
Inception
Average
Annual
8/15/08 -
12/31/12 | |
| Service Class | | | 12.83% | | | | 2.08% | |
| S&P 500 Index* | | | 16.00% | | | | 4.59% | |
| Russell 1000 Value Index | | | 17.51% | | | | 3.79% | |
GROWTH OF $10,000 INVESTMENT FOR THE PAST 10 YEARS
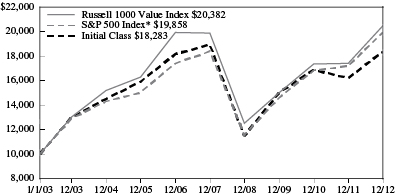
GROWTH OF $10,000 INVESTMENT SINCE INCEPTION
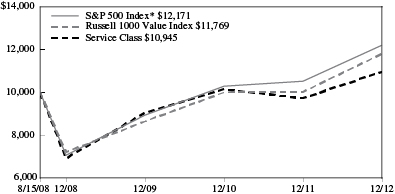
* Benchmark
Performance data quoted represents past performance; past performance is not predictive of future results. The investment return and principal value of shares of the Fund will fluctuate with market conditions so that shares of the Fund, when redeemed, may be worth more or less than their original cost. Current performance of the Fund may be lower or higher than the performance quoted. Performance data current to the most recent month end may be obtained by accessing the website www.massmutual.com.
Investors should note that the Fund is a professionally managed mutual fund, while the S&P 500 Index and the Russell 1000 Value Index are unmanaged, do not incur expenses, and cannot be purchased directly by investors. Investors should read the Fund’s prospectus with regard to the Fund’s investment objective, risks, and charges and expenses in conjunction with these financial statements. The Fund’s return reflects changes in the net asset value per share without the deduction of any product charges (e.g., cost of insurance, mortality and expense risk charges, administrative fees, and CDSL). The inclusion of these charges would have reduced the performance shown here.
41
MML Mid Cap Growth Fund – Portfolio Manager Report (Unaudited)
What is the investment approach of MML Mid Cap Growth Fund, and who is the Fund’s subadviser?
The Fund seeks long-term capital appreciation by investing primarily in equity securities of mid-capitalization companies that the Fund’s subadviser believes offer the potential for above-average earnings growth. Under normal circumstances, the Fund invests at least 80% of its net assets in a broadly diversified portfolio of common stocks of mid-cap companies whose earnings the subadviser expects to grow at a faster rate than the average company. The Fund’s subadviser is T. Rowe Price Associates, Inc. (T. Rowe Price).
How did the Fund perform during the 12 months ended December 31, 2012?
The Fund’s Initial Class shares returned 13.78%, trailing the 15.81% return of the Russell Midcap® Growth Index (the “benchmark”), a widely recognized, unmanaged index that measures the performance of those Russell Midcap companies (representing mid-capitalization U.S. common stocks) with higher price-to-book ratios and higher forecasted growth rates than securities in the value universe. Similarly, the Fund’s 13.78% return underperformed the 17.88% return of the S&P MidCap 400® Index, a widely recognized, unmanaged index representative of common stocks of mid-capitalized U.S. companies.
For a discussion on the economic and market environment during the 12-month period ended December 31, 2012, please see the Economic and Market Review, beginning on page 3.
Subadviser discussion of factors that contributed to the Fund’s performance
Generally speaking, stock selection accounted for most of the Fund’s underperformance in 2012 – while sector allocation helped drive the Fund’s results overall. On the sector level, consumer discretionary, financials, and materials detracted from the Fund’s performance, whereas health care and consumer staples contributed.
Consumer discretionary was a notable detractor due to stock selection and an unfavorable underweight position, relative to the benchmark, in this strong-performing sector. Fund holdings in department store Kohl’s and Groupon – a website that offers discounts to local and nationwide companies –hampered the Fund’s performance. Kohl’s reported lower-than-expected November sales, while Groupon suffered from growing investor skepticism about its business model. We eliminated the Fund’s position in Groupon and remain cautious on this sector, as consumers are still focused on balance sheet repair in the aftermath of the housing bubble. Stock selection in the financials sector also detracted, particularly with the Fund’s investments in Willis Group Holdings and MSCI. Willis Group Holdings, a London-based insurance broker, reported disappointing earnings due to lower-than-expected organic growth and declining profit margins. MSCI, a major provider of investment analytic tools, fell after Vanguard announced it was changing all of the company’s MSCI-branded exchange-traded funds to generic, lower-cost indexes. This sector, however, does not generally represent a major area of investment for the Fund. At the end of the year, the Fund’s largest exposure within this sector was in insurance and diversified financial services.
In materials, the Fund’s underweight position proved detrimental. The Fund’s exposure to materials tends to be limited, as few companies meet the Fund’s long-term growth criteria. We do, however, typically maintain a consistent, albeit small, position in metals and mining.
Health care was an area of relative strength for the Fund in 2012, thanks to favorable stock selection and a beneficial overweight position in this sector. The Fund’s biotechnology holdings were notable contributors, particularly Regeneron Pharmaceuticals and Amylin Pharmaceuticals. Regeneron Pharmaceuticals reported strong sales for a major drug, while Amylin Pharmaceuticals was acquired by Bristol-Myers Squibb at a significant premium. Elsewhere within the sector, the Fund’s shares of pharmacy benefit manager Catamaran, a company that came into existence due to the merger of SXC Health Solutions and Catalyst Health Solutions earlier in the year, traded higher. The combined firm offers expanded product coverage, increased price negotiating power, and reduced redundancy costs.
Limiting the Fund’s exposure to the underperforming consumer staples sector also helped performance during the year. With respect to this sector, we tend to position the Fund with a less-than-benchmark allocation, as few companies meet the Fund’s growth criteria.
42
MML Mid Cap Growth Fund – Portfolio Manager Report (Unaudited) (Continued)
Subadviser outlook
Now that the first phase of a plan to deal with the U.S. fiscal problems is behind us, we are reasonably optimistic that the policymakers in Washington will come up with some sort of a compromise on the spending side of the equation. We believe the U.S. economy is likely to grow between 2% and 3% in 2013. We are encouraged by positive trends in the housing industry and the declining unemployment rate. In our view, the main impediments to global growth remain, including an economic slowdown in China and ongoing sovereign debt problems in Europe. In addition, continuing turmoil in the Middle East carries the potential to escalate into more widespread violence. The Fund remains focused on stocks that we believe can do reasonably well under any conditions.
| | | | |
MML Mid Cap Growth Fund Largest Holdings (% of Net Assets) on 12/31/12 | |
| | |
AMETEK, Inc. | | | 1.9 | % |
DENTSPLY International, Inc. | | | 1.7 | % |
IHS, Inc. Class A | | | 1.7 | % |
T. Rowe Price Government Reserve Investment Fund | | | 1.6 | % |
Roper Industries, Inc. | | | 1.5 | % |
Gartner, Inc. | | | 1.5 | % |
Fiserv, Inc. | | | 1.5 | % |
Trimble Navigation Ltd. | | | 1.5 | % |
CarMax, Inc. | | | 1.4 | % |
Calpine Corp. | | | 1.4 | % |
| | | | | |
| | | | 15.7 | % |
| | | | | |
| | | | |
MML Mid Cap Growth Fund Sector Table (% of Net Assets) on 12/31/12 | |
| | |
Consumer, Non-cyclical | | | 26.5 | % |
Industrial | | | 17.5 | % |
Consumer, Cyclical | | | 14.0 | % |
Technology | | | 13.1 | % |
Communications | | | 9.2 | % |
Financial | | | 5.9 | % |
Energy | | | 5.6 | % |
Mutual Funds | | | 4.0 | % |
Basic Materials | | | 3.2 | % |
Utilities | | | 1.4 | % |
| | | | | |
Total Long-Term Investments | | | 100.4 | % |
Short-Term Investments and Other Assets and Liabilities | | | (0.4 | )% |
| | | | | |
Net Assets | | | 100.0 | % |
| | | | | |
43
MML Mid Cap Growth Fund – Portfolio Manager Report (Unaudited) (Continued)
Growth of a $10,000 Investment
Hypothetical Investments in MML Mid Cap Growth Fund Initial Class, the Russell Midcap Growth Index, and the S&P MidCap 400 Index.
| | | | | | | | | | | | |
| | | | |
| TOTAL RETURN | | One Year
1/1/12 -
12/31/12 | | | Five Year
Average
Annual
1/1/08 -
12/31/12 | | | Since
Inception
Average
Annual
5/1/06 -
12/31/12 | |
| Initial Class | | | 13.78% | | | | 4.58% | | | | 5.94% | |
| Russell Midcap Growth Index* | | | 15.81% | | | | 3.23% | | | | 4.46% | |
| S&P MidCap 400 Index | | | 17.88% | | | | 5.15% | | | | 5.20% | |
Hypothetical Investments in MML Mid Cap Growth Fund Service Class, the Russell Midcap Growth Index, and the S&P MidCap 400 Index.
| | | | | | | | |
| | | |
| TOTAL RETURN | | One Year
1/1/12 -
12/31/12 | | | Since
Inception
Average
Annual
8/15/08 -
12/31/12 | |
| Service Class | | | 13.47% | | | | 6.59% | |
| Russell Midcap Growth Index* | | | 15.81% | | | | 5.83% | |
| S&P MidCap 400 Index | | | 17.88% | | | | 6.72% | |
GROWTH OF $10,000 INVESTMENT SINCE INCEPTION
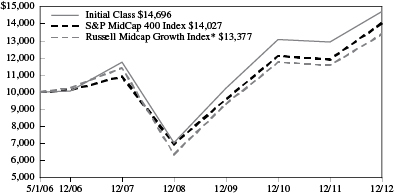
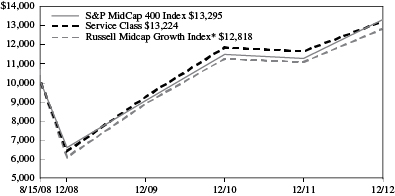
* Benchmark
Performance data quoted represents past performance; past performance is not predictive of future results. The investment return and principal value of shares of the Fund will fluctuate with market conditions so that shares of the Fund, when redeemed, may be worth more or less than their original cost. Current performance of the Fund may be lower or higher than the performance quoted. Performance data current to the most recent month end may be obtained by accessing the website www.massmutual.com.
Investors should note that the Fund is a professionally managed mutual fund, while the Russell Midcap Growth Index and the S&P MidCap 400 Index are unmanaged, do not incur expenses, and cannot be purchased directly by investors. Investors should read the Fund’s prospectus with regard to the Fund’s investment objective, risks, and charges and expenses in conjunction with these financial statements. The Fund’s return reflects changes in the net asset value per share without the deduction of any product charges (e.g., cost of insurance, mortality and expense risk charges, administrative fees, and CDSL). The inclusion of these charges would have reduced the performance shown here.
44
MML Mid Cap Value Fund – Portfolio Manager Report (Unaudited)
What is the investment approach of MML Mid Cap Value Fund, and who is the Fund’s subadviser?
The Fund seeks long-term capital growth. Income is a secondary objective. The Fund invests primarily in equity securities of mid-capitalization companies that the Fund’s subadviser believes offer prospects for long-term capital growth. Under normal circumstances, the Fund invests at least 80% of its net assets in equity securities of medium-size companies. The Fund’s subadviser is American Century Investment Management, Inc. (American Century).
How did the Fund perform during the 12 months ended December 31, 2012?
The Fund’s Initial Class shares returned 16.70%, underperforming the 18.51% return of Russell Midcap® Value Index (the “benchmark”), a widely recognized, unmanaged index that measures the performance of those Russell Midcap companies (representing mid-capitalization U.S. common stocks) with lower price-to-book ratios and lower forecasted growth rates than securities in the growth universe.
For a discussion on the economic and market environment during the 12-month period ended December 31, 2012, please see the Economic and Market Review, beginning on page 3.
Subadviser discussion of factors that contributed to the Fund’s performance
Investors generally favored higher-risk, lower-quality securities during 2012, which was at odds with the Fund’s investment approach of focusing on lower-risk, higher-quality stocks.
The Fund’s energy position declined, primarily due to security selection. A top detractor was Fund holding Ultra Petroleum, a natural gas exploration and production company whose shares declined largely because of supply and demand. New extraction techniques have produced a significant natural gas supply, which held down prices. The Fund’s investment in Imperial Oil also hindered performance, as falling energy prices weighed on Imperial’s share price. In addition, the Fund had an underweight position, relative to the benchmark, in U.S. oil refiners, which performed well during 2012 as the price difference between Brent and West Texas Intermediate (WTI) crude oil widened.
The Fund’s underweight allocation to the consumer discretionary sector, which posted the strongest results in the benchmark, dampened performance for the year. The Fund had an underweight stake in household durables stocks, many of which performed well as the housing market improved.
In materials, the Fund was hurt by its investment in gold producer Newmont Mining Corp. As risk appetite increased during the reporting period, investors traded out of sectors and industries they perceived as defensive (gold being one) – deploying the proceeds into riskier names. Newmont’s share price was also negatively impacted when the company provided a lower-than-expected earnings forecast, citing the higher cost of finding gold and a decline in the amount of gold it expected to produce.
In the industrials sector, the Fund’s overweight position contributed positively. Two Fund holdings from this sector provided notable contributions to performance: Thomas & Betts Corp., a maker of electrical components, appreciated on news it would be acquired by Swiss engineering firm ABB; and Ltd. Oshkosh Corp., the specialty vehicle manufacturer, reported stronger-than-expected earnings and announced a plan to double its earnings per share by 2015.
The Fund’s underweight allocation to information technology, one of the weakest-performing sectors in the benchmark for the year, enhanced performance. Effective security selection also boosted results within this sector, as the Fund owned top performers SanDisk Corp. and Western Digital. SanDisk, a maker of flash drive memory chip products, advanced as supply and demand fundamentals improved. Western Digital reported unexpectedly strong profits in its fourth fiscal quarter, benefiting from the acquisition of Hitachi’s hard-drive operations.
Subadviser outlook
We continue to follow the Fund’s disciplined, bottom-up process, selecting Fund holdings one stock at a time. As of December 31, 2012, we believed there were opportunities in health care and industrials, a view reflected in the Fund’s overweight positions in these sectors relative to the benchmark. Conversely, our fundamental analysis and valuation work has led to smaller relative weightings in consumer discretionary, financials, information technology, and materials stocks.
45
MML Mid Cap Value Fund – Portfolio Manager Report (Unaudited) (Continued)
| | | | |
MML Mid Cap Value Fund Largest Holdings (% of Net Assets) on 12/31/12 | |
| | |
iShares Russell Midcap Value Index Fund | | | 3.5 | % |
Republic Services, Inc. | | | 3.3 | % |
Northern Trust Corp. | | | 2.8 | % |
Imperial Oil Ltd. | | | 2.3 | % |
CareFusion Corp. | | | 1.8 | % |
Great Plains Energy, Inc. | | | 1.7 | % |
Applied Materials, Inc. | | | 1.7 | % |
PG&E Corp. | | | 1.5 | % |
Lowe’s Cos., Inc. | | | 1.4 | % |
AGL Resources, Inc. | | | 1.4 | % |
| | | | | |
| | | | 21.4 | % |
| | | | | |
| | | | |
MML Mid Cap Value Fund Sector Table (% of Net Assets) on 12/31/12 | |
| | |
Financial | | | 25.0 | % |
Consumer, Non-cyclical | | | 19.5 | % |
Industrial | | | 16.5 | % |
Utilities | | | 11.2 | % |
Energy | | | 7.6 | % |
Consumer, Cyclical | | | 6.1 | % |
Technology | | | 5.1 | % |
Mutual Funds | | | 3.5 | % |
Communications | | | 2.5 | % |
Basic Materials | | | 1.8 | % |
| | | | | |
Total Long-Term Investments | | | 98.8 | % |
Short-Term Investments and Other Assets and Liabilities | | | 1.2 | % |
| | | | | |
Net Assets | | | 100.0 | % |
| | | | | |
46
MML Mid Cap Value Fund – Portfolio Manager Report (Unaudited) (Continued)
Growth of a $10,000 Investment
Hypothetical Investments in MML Mid Cap Value Fund Initial Class and the Russell Midcap Value Index.
| | | | | | | | | | | | |
| | | | |
| TOTAL RETURN | | One Year
1/1/12 -
12/31/12 | | | Five Year
Average
Annual
1/1/08 -
12/31/12 | | | Since
Inception
Average
Annual
5/1/06 -
12/31/12 | |
| Initial Class | | | 16.70% | | | | 6.50% | | | | 6.15% | |
| Russell Midcap Value Index | | | 18.51% | | | | 3.79% | | | | 4.17% | |
Hypothetical Investments in MML Mid Cap Value Fund Service Class and the Russell Midcap Value Index.
| | | | | | | | |
| | | |
| TOTAL RETURN | | One Year
1/1/12 -
12/31/12 | | | Since
Inception
Average
Annual
8/15/08 -
12/31/12 | |
| Service Class | | | 16.37% | | | | 7.51% | |
| Russell Midcap Value Index | | | 18.51% | | | | 6.02% | |
GROWTH OF $10,000 INVESTMENT SINCE INCEPTION
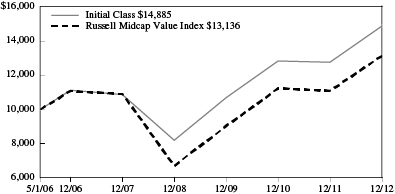
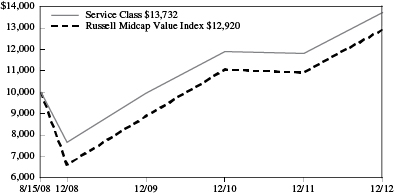
Performance data quoted represents past performance; past performance is not predictive of future results. The investment return and principal value of shares of the Fund will fluctuate with market conditions so that shares of the Fund, when redeemed, may be worth more or less than their original cost. Current performance of the Fund may be lower or higher than the performance quoted. Performance data current to the most recent month end may be obtained by accessing the website www.massmutual.com.
Investors should note that the Fund is a professionally managed mutual fund, while the Russell Midcap Value Index is unmanaged, does not incur expenses, and cannot be purchased directly by investors. Investors should read the Fund’s prospectus with regard to the Fund’s investment objective, risks, and charges and expenses in conjunction with these financial statements. The Fund’s return reflects changes in the net asset value per share without the deduction of any product charges (e.g., cost of insurance, mortality and expense risk charges, administrative fees, and CDSL). The inclusion of these charges would have reduced the performance shown here.
47
MML PIMCO Total Return Fund – Portfolio Manager Report (Unaudited)
What is the investment approach of MML PIMCO Total Return Fund, and who is the Fund’s subadviser?
The Fund seeks maximum total return, consistent with preservation of capital and prudent investment management, by investing, under normal circumstances, at least 65% of its total assets in a diversified portfolio of fixed income securities of varying maturities. The Fund’s subadviser is Pacific Investment Management Company LLC (PIMCO).
How did the Fund perform during the 12 months ended December 31, 2012?
The Fund’s Class II shares returned 8.93%, significantly outperforming the 4.21% return of the Barclays U.S. Aggregate Bond Index (the “benchmark”), an unmanaged index of fixed-rate investment-grade securities with at least one year to maturity, combining the Barclays U.S. Treasury Bond Index, the Barclays U.S. Government-Related Bond Index, the Barclays U.S. Corporate Bond Index, and the Barclays U.S. Securitized Bond Index.
For a discussion on the economic and market environment during the 12-month period ended December 31, 2012, please see the Economic and Market Review, beginning on page 3.
Subadviser discussion of factors that contributed to the Fund’s performance
The Fund outperformed its benchmark for 2012, benefiting from tactical positioning in intermediate-term U.S. Treasury securities, particularly those with 5- to 10-year maturities, whose prices increased when interest rates fell. Bond prices move in the opposite direction of interest rates (or yields); when yields rise, the prices of existing bonds fall – and vice versa. With respect to non-U.S. bonds, the Fund’s focus on short-term Spanish and Italian sovereign debt was also positive for returns, as yields fell across the globe due to easing monetary policies from central banks worldwide. An overweight position in agency mortgage-backed securities (“MBS”), relative to the benchmark, was also positive for performance during the year, as MBS outperformed like-duration Treasuries thanks to the Federal Reserve’s announcement and implementation of another mortgage-bond purchase program. Within investment-grade corporate securities, a tactical focus on bonds of financial institutions proved positive for the Fund, as financials outperformed the broader credit market for the year; however, overall underweight positioning in investment-grade corporate bonds hindered the Fund somewhat in the fourth quarter of 2012.
Beyond core sectors, holdings in high-yield corporate bonds also helped drive the Fund’s full-year performance, as investors pursued higher yields. An overweight position in emerging-market securities, exposure to Treasury Inflation-Protected Securities (TIPS), and a modest position in Build America bonds all helped boost overall results for the Fund.
With respect to the Fund’s use of derivatives, pay fixed interest rate swaps contributed to performance. (Pay fixed interest rate swaps are derivatives that allow counterparties to exchange streams of fixed interest rate payments for streams of floating interest rate payments.) The Fund’s exposure to sovereign credit default swaps also helped to fuel performance. (Sovereign credit default swaps are derivatives that compel the seller of the swap to compensate the buyer of the swap if a loan default or other credit event occurs with the sovereign debt of the country named in the agreement.) Finally, exposure to a variety of foreign currencies, including exposure via the use of currency forwards, contributed to performance. (Currency forwards are derivatives that lock in the price at which an investor can buy or sell a currency on a future date.)
Subadviser outlook
We expect the global economy to grow at a real rate of 1.5% to 2.0% in 2013, representing a slowdown from the 2.2% pace of growth seen over the past 12 months. Real growth will be moderated by fiscal belt-tightening, which will create additional slowdowns in corporate profits, capital expenditures, and global trade. Simultaneously, we believe inflation will decrease in the near term. Households will continue to pay down their debt, while the corporate sector remains reluctant to spend. Nominal growth could, however, be bolstered by the continued resolve of central banks. The balance of these forces will determine the market and economic environment in 2013.
48
MML PIMCO Total Return Fund – Portfolio Manager Report (Unaudited) (Continued)
| | | | |
MML PIMCO Total Return Fund Portfolio Characteristics (% of Net Assets) on 12/31/12 | |
| | |
U.S. Government Agency Obligations and Instrumentalities | | | 51.3 | % |
U.S. Treasury Obligations | | | 33.0 | % |
Corporate Debt | | | 26.2 | % |
Sovereign Debt Obligations | | | 9.4 | % |
Non-U.S. Government Agency Obligations | | | 5.8 | % |
Municipal Obligations | | | 4.0 | % |
Preferred Stock | | | 0.4 | % |
Bank Loans | | | 0.3 | % |
| | | | | |
Total Long-Term Investments | | | 130.4 | % |
Short-Term Investments and Other Assets and Liabilities | | | (30.4 | )% |
| | | | | |
Net Assets | | | 100.0 | % |
| | | | | |
49
MML PIMCO Total Return Fund – Portfolio Manager Report (Unaudited) (Continued)
Growth of a $10,000 Investment
Hypothetical Investments in MML PIMCO Total Return Fund Class II and the Barclays U.S. Aggregate Bond Index.
| | | | | | | | |
| | | |
| TOTAL RETURN | | One Year
1/1/12 -
12/31/12 | | | Since
Inception Average Annual
8/10/10 -
12/31/12 | |
| Class II | | | 8.93% | | | | 4.77% | |
| Barclays U.S. Aggregate Bond Index | | | 4.21% | | | | 4.92% | |
Hypothetical Investments in MML PIMCO Total Return Fund Service Class I and the Barclays U.S. Aggregate Bond Index.
| | | | |
| | |
| TOTAL RETURN | | Since
Inception
5/1/12 -
12/31/12 | |
| Service Class I | | | 4.94% | |
| Barclays U.S. Aggregate Bond Index | | | 2.76% | |
GROWTH OF $10,000 INVESTMENT SINCE INCEPTION
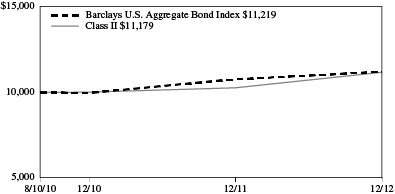
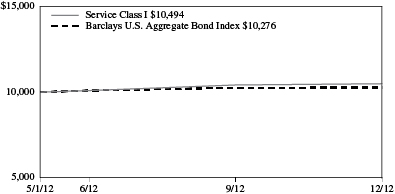
Performance data quoted represents past performance; past performance is not predictive of future results. The investment return and principal value of shares of the Fund will fluctuate with market conditions so that shares of the Fund, when redeemed, may be worth more or less than their original cost. Current performance of the Fund may be lower or higher than the performance quoted. Performance data current to the most recent month end may be obtained by accessing the website www.massmutual.com.
Investors should note that the Fund is a professionally managed mutual fund, while the Barclays U.S. Aggregate Bond Index is unmanaged, does not incur expenses, and cannot be purchased directly by investors. Investors should read the Fund’s prospectus with regard to the Fund’s investment objective, risks, and charges and expenses in conjunction with these financial statements. The Fund’s return reflects changes in the net asset value per share without the deduction of any product charges (e.g., cost of insurance, mortality and expense risk charges, administrative fees, and CDSL). The inclusion of these charges would have reduced the performance shown here.
50
MML Small Cap Growth Equity Fund – Portfolio Manager Report (Unaudited)
What is the investment approach of MML Small Cap Growth Equity Fund, and who are the Fund’s subadvisers?
The Fund seeks long-term capital appreciation by investing primarily in equity securities of smaller companies that the Fund’s subadvisers believe offer potential for long-term growth. Under normal circumstances, the Fund invests at least 80% of its net assets in the securities of companies whose market capitalizations at the time of purchase are within the market capitalization range of companies included in the Russell 2000® Index or the S&P SmallCap 600 Index. The Fund’s subadvisers are Wellington Management Company, LLP (Wellington Management), which managed approximately 53% of the Fund’s portfolio; and Waddell & Reed Investment Management Company (Waddell & Reed), which was responsible for approximately 47% of the Fund’s portfolio, as of December 31, 2012.
How did the Fund perform during the 12 months ended December 31, 2012?
The Fund’s Initial Class shares returned 13.41%, underperforming the 14.59% return of the Russell 2000 Growth Index (the “benchmark”), a widely recognized, unmanaged index that measures the performance of those Russell 2000 Index companies (representing small-capitalization U.S. common stocks) with higher price-to-book ratios and higher forecasted growth rates than securities in the value universe. Similarly, the Fund’s 13.41% return trailed the 16.35% return of the Russell 2000 Index, a widely recognized, unmanaged index representative of common stocks of smaller capitalized U.S. companies.
For a discussion on the economic and market environment during the 12-month period ended December 31, 2012, please see the Economic and Market Review, beginning on page 3.
Subadviser discussion of factors that contributed to the Fund’s performance
With respect to the Fund’s Wellington Management component, stock selection was strongest within the consumer discretionary, industrials, materials, and health care sectors. These positive results were partially offset by negative results from stock selection within the information technology, financials, telecommunication services, and energy sectors. Sector positioning, which is a residual of the bottom-up stock selection process, detracted from the Fund’s relative performance for the year – as overweight allocations to the energy and information technology sectors, as well as an underweight position in the outperforming health care and industrials sectors, hindered the Fund. Conversely, an overweight allocation to the top-performing consumer discretionary sector and an underweight position in the lagging energy sector contributed to Fund returns for the year.
The Waddell & Reed component lost traction for the year due to less-than-favorable stock selection within the consumer discretionary sector. Also hampering Fund performance were the marketplace challenges of many higher-growth stocks, which became a larger factor in the fourth quarter of 2012. On a stock-specific basis, Fund holding Tempur-Pedic International (a retailer of mattresses and pillows), Zumiez (a specialty retailer of action sports apparel), BJ’s Restaurants (restaurants and breweries), Vera Bradley (a firm that designs, produces, and retails fashion accessories for women), and Warnaco (a company that designs, markets, and distributes a broad line of intimate apparel, sportswear, and swimwear) all detracted from the Fund’s full-year performance. Conversely, there was only one clear winner in the consumer discretionary sector: Under Amour – which markets and distributes branded performance products for men, women, and children – advanced 35% in 2012. The Fund sold Tempur-Pedic, Vera Bradley, and Warnaco in the second quarter of 2012.
Subadvisor outlook
In the view of Wellington Management, the economic environment remains uncertain, with unresolved macro-economic issues in the U.S. and internationally, and that strong performance in U.S. equity markets during 2012 presents an added challenge in identifying favorable risk/reward opportunities. Wellington Management is cautiously optimistic that businesses and individuals will continue to make previously delayed decisions and expects incremental improvement in business sentiment as additional clarity emerges on U.S. budget and spending matters.
Looking toward 2013, Waddell & Reed is cautiously optimistic. Challenges surely exist, including slowing corporate profit growth and further political clashes around the federal debt ceiling. Still, Waddell & Reed believes that there are many encouraging signs that could propel the market to new highs. Among these are the continuing massive global easing cycle, housing improvement within the U.S., record levels of investor liquidity, and the potential for a reversal in capital flows from
51
MML Small Cap Growth Equity Fund – Portfolio Manager Report (Unaudited) (Continued)
bonds back toward equities. Waddell & Reed does not expect the improvement to be linear due to the political events in front of us and the small cushion to absorb exogenous events. Although Waddell & Reed believes growth will be erratic, the firm is confident that examples of sustainable organic growth can be found.
| | | | |
MML Small Cap Growth Equity Fund Largest Holdings (% of Net Assets) on 12/31/12 | |
| | |
Portfolio Recovery Associates, Inc. | | | 2.2 | % |
Dril-Quip, Inc. | | | 2.2 | % |
Under Armour, Inc. Class A | | | 1.7 | % |
Dexcom, Inc. | | | 1.7 | % |
Cyberonics, Inc. | | | 1.5 | % |
Financial Engines, Inc. | | | 1.5 | % |
Greenhill & Co., Inc. | | | 1.5 | % |
FactSet Research Systems, Inc. | | | 1.4 | % |
Volcano Corp. | | | 1.4 | % |
Waste Connections, Inc. | | | 1.4 | % |
| | | | | |
| | | | 16.5 | % |
| | | | | |
| | | | |
MML Small Cap Growth Equity Fund Sector Table (% of Net Assets) on 12/31/12 | |
| | |
Consumer, Non-cyclical | | | 19.9 | % |
Consumer, Cyclical | | | 15.6 | % |
Industrial | | | 14.9 | % |
Financial | | | 13.5 | % |
Technology | | | 13.1 | % |
Mutual Funds | | | 9.9 | % |
Communications | | | 9.1 | % |
Energy | | | 7.8 | % |
Basic Materials | | | 2.9 | % |
Utilities | | | 0.3 | % |
| | | | | |
Total Long-Term Investments | | | 107.0 | % |
Short-Term Investments and Other Assets and Liabilities | | | (7.0 | )% |
| | | | | |
Net Assets | | | 100.0 | % |
| | | | | |
52
MML Small Cap Growth Equity Fund – Portfolio Manager Report (Unaudited) (Continued)
Growth of a $10,000 Investment
Hypothetical Investments in MML Small Cap Growth Equity Fund Initial Class, the Russell 2000 Growth Index, and the Russell 2000 Index.
| | | | | | | | | | | | |
| | | | |
| TOTAL RETURN | | One Year
1/1/12 -
12/31/12 | | | Five Year
Average
Annual
1/1/08 -
12/31/12 | | | Ten Year
Average
Annual
1/1/03 -
12/31/12 | |
| Initial Class | | | 13.41% | | | | 2.25% | | | | 9.64% | |
| Russell 2000 Growth Index* | | | 14.59% | | | | 3.49% | | | | 9.80% | |
| Russell 2000 Index | | | 16.35% | | | | 3.56% | | | | 9.72% | |
Hypothetical Investments in MML Small Cap Growth Equity Fund Service Class, the Russell 2000 Growth Index, and the Russell 2000 Index.
| | | | | | | | |
| | | |
| TOTAL RETURN | | One Year
1/1/12 -
12/31/12 | | | Since
Inception
Average
Annual
8/15/08 -
12/31/12 | |
| Service Class | | | 13.07% | | | | 4.08% | |
| Russell 2000 Growth Index* | | | 14.59% | | | | 4.56% | |
| Russell 2000 Index | | | 16.35% | | | | 4.24% | |
GROWTH OF $10,000 INVESTMENT FOR THE PAST 10 YEARS
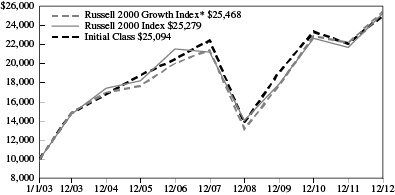
GROWTH OF $10,000 INVESTMENT SINCE INCEPTION
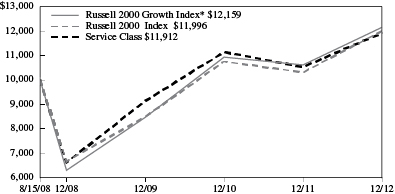
* Benchmark
Performance data quoted represents past performance; past performance is not predictive of future results. The investment return and principal value of shares of the Fund will fluctuate with market conditions so that shares of the Fund, when redeemed, may be worth more or less than their original cost. Current performance of the Fund may be lower or higher than the performance quoted. Performance data current to the most recent month end may be obtained by accessing the website www.massmutual.com.
Investors should note that the Fund is a professionally managed mutual fund, while the Russell 2000 Growth Index and the Russell 2000 Index are unmanaged, do not incur expenses, and cannot be purchased directly by investors. Investors should read the Fund’s prospectus with regard to the Fund’s investment objective, risks, and charges and expenses in conjunction with these financial statements. The Fund’s return reflects changes in the net asset value per share without the deduction of any product charges (e.g., cost of insurance, mortality and expense risk charges, administrative fees, and CDSL). The inclusion of these charges would have reduced the performance shown here.
53
MML Small Company Value Fund – Portfolio Manager Report (Unaudited)
What is the investment approach of MML Small Company Value Fund, and who is the Fund’s subadviser?
The Fund seeks long-term capital appreciation by investing primarily in equity securities that the Fund’s subadviser believes are undervalued. Under normal circumstances, the Fund invests at least 80% of its net assets in the securities of companies whose market capitalizations at the time of purchase are within the market capitalization range of companies included in the Russell 2000® Index. The Fund’s subadviser is T. Rowe Price Associates, Inc. (T. Rowe Price).
How did the Fund perform during the 12 months ended December 31, 2012?
The Fund’s Class II shares returned 15.20%, underperforming the 18.05% return of the Russell 2000 Value Index (the “benchmark”), a widely recognized, unmanaged index that measures the performance of those Russell 2000 Index companies (representing small-capitalization U.S. common stocks) with lower price-to-book ratios and lower forecasted growth rates than securities in the growth universe. The Fund also lagged the 16.35% return of the Russell 2000 Index, a widely recognized, unmanaged index representative of common stocks of smaller capitalized U.S. companies.
For a discussion on the economic and market environment during the 12-month period ended December 31, 2012, please see the Economic and Market Review, beginning on page 3.
Subadviser discussion of factors that contributed to the Fund’s performance
For 2012, stock selection, particularly in the energy, financials, and materials sectors, drove the Fund’s underperformance relative to the benchmark. Overall, sector allocation contributed to performance, most notably in the Fund’s overweight positions, relative to the benchmark, in the industrials and business services and materials sectors – although the Fund’s allocation to the financials sector hindered relative performance somewhat.
Financials was one of the benchmark’s best-performing sectors in 2012. As a result, the Fund’s substantially underweight position detracted from relative performance. Stock selection within the sector also weighed on results versus the benchmark, especially Fund holding Stifel Financial, a financial holding company whose subsidiaries provide wealth management, institutional brokerage, and investment banking services. Throughout the year, volatile capital markets produced challenges for the company, and investors paused to digest news of Stifel’s acquisition of a competing middle-market investment bank. The Fund’s holdings in the energy sector also produced a negative absolute return for the year. One notable detractor was CARBO Ceramics, a leading manufacturer of lightweight ceramic proppants used by pressure pumpers to complete oil and gas wells. The company suffered along with other firms exposed to natural gas prices when the commodity hovered near historic lows.
On the positive side, Fund holdings within the information technology sector outperformed the benchmark, as the Fund’s investment in Cymer, a supplier of light sources used in the photolithography process for semiconductor manufacturing, did well. Cymer advanced when a large customer communicated plans to acquire the company for a significant premium. Stock selection and an overweight position in the industrials and business services sector helped the Fund’s position in the sector outperform that of the benchmark. Fund holding Beacon Roofing Supply, which distributes roofing and other building materials in the United States and Canada, was a top contributor in this sector, boosted by the improving housing market. Finally, the consumer discretionary sector was also a source of outperformance for the Fund, helped by recreational vehicle manufacturer Winnebago – a Fund holding that reported sharply higher revenue due to increased deliveries of motor homes and travel trailers.
Subadviser outlook
The market proved surprisingly resilient in the face of global economic challenges during 2012. Yet, stocks remain relatively inexpensive when viewed against the previous 50 years or against bond yields. So what did we learn? First, those who thought they would wait to invest until the world economic background improved missed a 15% upswing in the market. Second, when the Federal Reserve is aggressively lowering interest rates and providing liquidity to our economy, that backdrop can be good for stocks. Third, don’t count out the U.S. – the resilience of our economy and markets is amazing.
We believe that U.S. equities will rise in 2013, maybe not at the pace of 2012, but probably at a higher rate than that of fixed-income investments. With small-company value stocks valued at close to their 30-year average compared to large companies and growth companies, we think these stocks have the potential to enjoy returns in line with, or better than, the average small-cap stock.
54
MML Small Company Value Fund – Portfolio Manager Report (Unaudited) (Continued)
| | | | |
MML Small Company Value Fund Largest Holdings (% of Net Assets) on 12/31/12 | |
| | |
Aaron’s, Inc. | | | 2.1 | % |
Genesee & Wyoming, Inc. Class A | | | 2.1 | % |
Landstar System, Inc. | | | 2.1 | % |
ProAssurance Corp. | | | 2.1 | % |
Beacon Roofing Supply, Inc. | | | 1.8 | % |
Kirby Corp. | | | 1.7 | % |
Nordson Corp. | | | 1.5 | % |
Alaska Air Group, Inc. | | | 1.4 | % |
East West Bancorp, Inc. | | | 1.4 | % |
Stifel Financial Corp. | | | 1.3 | % |
| | | | | |
| | | | 17.5 | % |
| | | | | |
| | | | |
MML Small Company Value Fund Sector Table (% of Net Assets) on 12/31/12 | |
| | |
Industrial | | | 27.1 | % |
Financial | | | 21.3 | % |
Consumer, Cyclical | | | 12.7 | % |
Consumer, Non-cyclical | | | 10.0 | % |
Basic Materials | | | 9.9 | % |
Energy | | | 4.6 | % |
Utilities | | | 4.1 | % |
Technology | | | 4.0 | % |
Communications | | | 3.2 | % |
Mutual Funds | | | 2.5 | % |
| | | | | |
Total Long-Term Investments | | | 99.4 | % |
Short-Term Investments and Other Assets and Liabilities | | | 0.6 | % |
| | | | | |
Net Assets | | | 100.0 | % |
| | | | | |
55
MML Small Company Value Fund – Portfolio Manager Report (Unaudited) (Continued)
Growth of a $10,000 Investment
Hypothetical Investments in MML Small Company Value Fund Class II, Service Class I, the Russell 2000 Value Index, and the Russell 2000 Index.
| | | | | | | | |
| | | |
| TOTAL RETURN | | One Year
1/1/12 -
12/31/12 | | | Since
Inception
Average
Annual
2/27/09 -
12/31/12 | |
| Class II | | | 15.20% | | | | 23.00% | |
| Service Class I | | | 14.99% | | | | 22.70% | |
| Russell 2000 Value Index* | | | 18.05% | | | | 23.92% | |
| Russell 2000 Index | | | 16.35% | | | | 23.45% | |
GROWTH OF $10,000 INVESTMENT SINCE INCEPTION
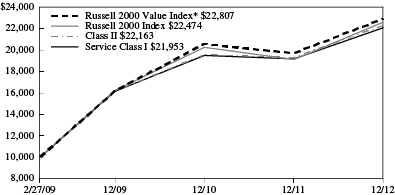
* Benchmark
Performance data quoted represents past performance; past performance is not predictive of future results. The investment return and principal value of shares of the Fund will fluctuate with market conditions so that shares of the Fund, when redeemed, may be worth more or less than their original cost. Current performance of the Fund may be lower or higher than the performance quoted. Performance data current to the most recent month end may be obtained by accessing the website www.massmutual.com.
Investors should note that the Fund is a professionally managed mutual fund, while the Russell 2000 Value Index and the Russell 2000 Index are unmanaged, do not incur expenses, and cannot be purchased directly by investors. Investors should read the Fund’s prospectus with regard to the Fund’s investment objective, risks, and charges and expenses in conjunction with these financial statements. The Fund’s return reflects changes in the net asset value per share without the deduction of any product charges (e.g., cost of insurance, mortality and expense risk charges, administrative fees, and CDSL). The inclusion of these charges would have reduced the performance shown here.
56
MML Small/Mid Cap Value Fund – Portfolio Manager Report (Unaudited)
What is the investment approach of MML Small/Mid Cap Value Fund, and who is the Fund’s subadviser?
The Fund seeks long-term total return by investing primarily in securities that the subadviser believes to be undervalued. Under normal circumstances, the Fund invests at least 80% of its net assets in securities of small- and mid-cap companies. The Fund’s subadviser is AllianceBernstein L.P. (AllianceBernstein).
How did the Fund perform during the 12 months ended December 31, 2012?
The Fund’s Initial Class Shares returned 19.06%, outperforming the 17.88% return of the Russell 2500TM Index (the “benchmark”), an unmanaged index that measures the performance of the 2,500 smallest companies in the Russell 3000® Index, which measures the performance of the 3,000 largest U.S. companies based on total market capitalization. Conversely, the Fund slightly underperformed the 19.21% return of the Russell 2500 Value Index, an unmanaged index representative of common stocks of small- and mid-capitalization U.S. companies with lower price-to-book ratios and lower forecasted growth rates than securities in the growth universe.
For a discussion on the economic and market environment during the 12-month period ended December 31, 2012, please see the Economic and Market Review, beginning on page 3.
Subadviser discussion of factors that contributed to the Fund’s performance
The Fund outperformed the benchmark for 2012, primarily through strong stock selection, particularly in the energy and consumer staples sectors. With respect to the Fund’s holdings, the largest contributor to full-year results was Western Refining, a crude oil refiner and distributor that benefited from strong pricing spreads between crude oil and gasoline and other end products driven by the increase in U.S. oil production. Another Fund holding, managed care provider Molina Healthcare, gained share and capitalized on an expanding market for its Medicaid insurance services. And the Fund’s investment in beverage firm Constellation Brands paid off, as that company’s shares rose after the execution of a favorable distribution contract.
Detracting from performance for the period was the Fund’s stock selection in the consumer cyclicals and financials sectors. The Fund holding that was the largest detractor for the year, retailer Express, reported results that disappointed investors. In financials, the Fund’s real estate investment trust (REIT) holdings detracted. Another Fund holding, insurer Health Net, fell after a sharp increase in expense claims led to a weaker business outlook for the year. Additionally, Fund holding Ferro, a chemical producer, underperformed after reporting deteriorating conditions in the company’s European business.
While we feel that there is a reduced likelihood of catastrophic shocks, the global economic recovery remains uneven and investor risk tolerance remains below historical norms. This environment has proven challenging for stocks with deeper value characteristics, but it has also represented an opportunity in small- and mid-cap equities.
The result has been a mispricing of a number of stocks across a variety of industries. These companies have a combination of compelling valuations, strong quality and significant company-level catalysts. We have positioned the Fund to take advantage of this disconnect. Further, the Fund’s portfolio includes many companies that are generating solid cash flows and have the balance sheet resources needed to create shareholder value through share repurchases, increased dividends, or acquisition activity. While these opportunities are spread across a number of industries, they have become more concentrated in those that are more cyclical in nature. Accordingly, we have increased the Fund’s exposure to these cyclical industries (i.e., in the technology and capital equipment market segments) and decreased its exposure to more expensive, “defensive” industries, such as those in the utilities sector and real estate investment trust (REITs).
Subadviser outlook
Though the economic outlook remains somewhat uncertain, the fears that dominated the equity markets in the second quarter of 2012 have, in our view, eased significantly. We recognize that the recovery remains fragile and there will likely be bumps in the road ahead. Accordingly, our outlook is for only a modest improvement in the business climate. However, our view is that the current environment doesn’t reflect the improvement seen in many cyclical companies. In many cases, these companies have undergone significant restructuring and balance sheet strengthening, positioning themselves to navigate the current economic climate well.
57
MML Small/Mid Cap Value Fund – Portfolio Manager Report (Unaudited) (Continued)
| | | | |
MML Small/Mid Cap Value Fund
Largest Holdings
(% of Net Assets) on 12/31/12 | |
| | |
Lear Corp. | | | 1.7 | % |
Helmerich & Payne, Inc. | | | 1.6 | % |
Zions Bancorp | | | 1.5 | % |
Fidelity National Financial, Inc. Class A | | | 1.5 | % |
Tyson Foods, Inc. Class A | | | 1.5 | % |
The Timken Co. | | | 1.5 | % |
Aspen Insurance Holdings Ltd. | | | 1.5 | % |
Fortune Brands Home & Security, Inc. | | | 1.4 | % |
Huntington Bancshares, Inc. | | | 1.4 | % |
Bristow Group, Inc. | | | 1.4 | % |
| | | | | |
| | | | 15.0 | % |
| | | | | |
| | | | |
MML Small/Mid Cap Value Fund
Sector Table
(% of Net Assets) on 12/31/12 | |
| | |
Financial | | | 27.2 | % |
Industrial | | | 21.2 | % |
Consumer, Cyclical | | | 17.3 | % |
Consumer, Non-cyclical | | | 10.5 | % |
Technology | | | 6.1 | % |
Utilities | | | 5.7 | % |
Basic Materials | | | 5.2 | % |
Energy | | | 4.9 | % |
Communications | | | 4.1 | % |
| | | | | |
Total Long-Term Investments | | | 102.2 | % |
Short-Term Investments and Other Assets and Liabilities | | | (2.2 | )% |
| | | | | |
Net Assets | | | 100.0 | % |
| | | | | |
| | | | |
MML Small/Mid Cap Value Fund
Country Weightings
(% of Net Assets) on 12/31/12 | |
| | |
United States | | | 91.2 | % |
Bermuda | | | 5.2 | % |
United Kingdom | | | 1.3 | % |
Liberia | | | 1.3 | % |
Puerto Rico | | | 0.9 | % |
Taiwan | | | 0.9 | % |
Singapore | | | 0.8 | % |
Canada | | | 0.6 | % |
| | | | | |
Total Long-Term Investments | | | 102.2 | % |
Short-Term Investments and Other Assets and Liabilities | | | (2.2 | )% |
| | | | | |
Net Assets | | | 100.0 | % |
| | | | | |
58
MML Small/Mid Cap Value Fund – Portfolio Manager Report (Unaudited) (Continued)
Growth of a $10,000 Investment
Hypothetical Investments in MML Small/Mid Cap Value Fund Initial Class, the Russell 2500 Index, and the Russell 2500 Value Index.
| | | | | | | | | | | | |
| | | | |
| TOTAL RETURN | | One Year
1/1/12 -
12/31/12 | | | Five Year
Average
Annual
1/1/08 -
12/31/12 | | | Since
Inception
Average
Annual
5/1/06 -
12/31/12 | |
| Initial Class | | | 19.06% | | | | 4.22% | | | | 0.83% | |
| Russell 2500 Index* | | | 17.88% | | | | 4.34% | | | | 4.08% | |
| Russell 2500 Value Index | | | 19.21% | | | | 4.54% | | | | 3.46% | |
Hypothetical Investments in MML Small/Mid Cap Value Fund Service Class, the Russell 2500 Index, and the Russell 2500 Value Index.
| | | | | | | | |
| | | |
| TOTAL RETURN | | One Year
1/1/12 -
12/31/12 | | | Since
Inception
Average
Annual
8/15/08 -
12/31/12 | |
| Service Class | | | 18.78% | | | | 5.56% | |
| Russell 2500 Index* | | | 17.88% | | | | 5.90% | |
| Russell 2500 Value Index | | | 19.21% | | | | 5.79% | |
GROWTH OF $10,000 INVESTMENT SINCE INCEPTION
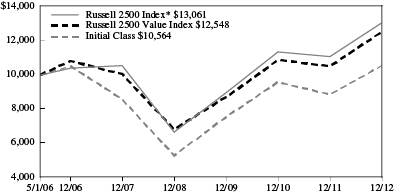
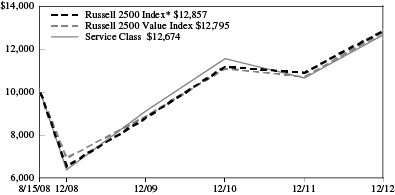
* Benchmark
Performance data quoted represents past performance; past performance is not predictive of future results. The investment return and principal value of shares of the Fund will fluctuate with market conditions so that shares of the Fund, when redeemed, may be worth more or less than their original cost. Current performance of the Fund may be lower or higher than the performance quoted. Performance data current to the most recent month end may be obtained by accessing the website www.massmutual.com.
Investors should note that the Fund is a professionally managed mutual fund, while the Russell 2500 Index and the Russell 2500 Value Index are unmanaged, do not incur expenses, and cannot be purchased directly by investors. Investors should read the Fund’s prospectus with regard to the Fund’s investment objective, risks, and charges and expenses in conjunction with these financial statements. The Fund’s return reflects changes in the net asset value per share without the deduction of any product charges (e.g., cost of insurance, mortality and expense risk charges, administrative fees, and CDSL). The inclusion of these charges would have reduced the performance shown here.
59
MML Blue Chip Growth Fund – Portfolio of Investments
December 31, 2012
| | | | | | | | |
| | | Number of
Shares | | | Value | |
| EQUITIES — 99.0% | |
|
| COMMON STOCK — 99.0% | |
| Basic Materials — 4.6% | |
| Chemicals — 4.6% | |
Ecolab, Inc. | | | 36,100 | | | $ | 2,595,590 | |
Monsanto Co. | | | 30,450 | | | | 2,882,093 | |
Praxair, Inc. | | | 53,430 | | | | 5,847,913 | |
The Sherwin-Williams Co. | | | 28,200 | | | | 4,337,724 | |
| | | | | | | | |
| | | | | | | 15,663,320 | |
| | | | | | | | |
| Communications — 21.8% | |
| Advertising — 0.2% | |
Omnicom Group, Inc. | | | 14,600 | | | | 729,416 | |
| | | | | | | | |
| Internet — 17.6% | |
Akamai Technologies, Inc. (a) | | | 3,300 | | | | 135,003 | |
Amazon.com, Inc. (a) | | | 57,850 | | | | 14,528,449 | |
Baidu, Inc. Sponsored ADR
(Cayman Islands) (a) | | | 43,000 | | | | 4,312,470 | |
eBay, Inc. (a) | | | 124,100 | | | | 6,331,582 | |
Expedia, Inc. | | | 5,600 | | | | 344,120 | |
F5 Networks, Inc. (a) | | | 300 | | | | 29,145 | |
Facebook, Inc. Class A (a) | | | 83,676 | | | | 2,228,292 | |
Google, Inc. Class A (a) | | | 23,000 | | | | 16,315,510 | |
Liberty Interactive Corp. Class A (a) | | | 46,900 | | | | 922,992 | |
LinkedIn Corp. (a) | | | 13,600 | | | | 1,561,552 | |
Priceline.com, Inc. (a) | | | 14,700 | | | | 9,131,640 | |
Tencent Holdings Ltd. | | | 103,900 | | | | 3,373,268 | |
| | | | | | | | |
| | | | | | | 59,214,023 | |
| | | | | | | | |
| Media — 1.5% | |
Discovery Communications, Inc. Series C (a) | | | 52,075 | | | | 3,046,388 | |
The McGraw-Hill Cos., Inc. | | | 600 | | | | 32,802 | |
The Walt Disney Co. | | | 41,400 | | | | 2,061,306 | |
| | | | | | | | |
| | | | | | | 5,140,496 | |
| | | | | | | | |
| Telecommunications — 2.5% | |
Juniper Networks, Inc. (a) | | | 61,050 | | | | 1,200,853 | |
QUALCOMM, Inc. | | | 115,100 | | | | 7,138,502 | |
| | | | | | | | |
| | | | | | | 8,339,355 | |
| | | | | | | | |
| | | | | | | 73,423,290 | |
| | | | | | | | |
| Consumer, Cyclical — 15.5% | |
| Apparel — 1.4% | |
Nike, Inc. Class B | | | 38,540 | | | | 1,988,664 | |
Ralph Lauren Corp. | | | 17,600 | | | | 2,638,592 | |
| | | | | | | | |
| | | | | | | 4,627,256 | |
| | | | | | | | |
| Distribution & Wholesale — 2.5% | |
Fastenal Co. | | | 79,800 | | | | 3,725,862 | |
Fossil, Inc. (a) | | | 35,900 | | | | 3,342,290 | |
W.W. Grainger, Inc. | | | 6,700 | | | | 1,355,879 | |
| | | | | | | | |
| | | | | | | 8,424,031 | |
| | | | | | | | |
| | | | | | | | |
| | | Number of
Shares | | | Value | |
| Home Builders — 0.0% | |
Lennar Corp. Class A | | | 2,500 | | | $ | 96,675 | |
| | | | | | | | |
| Leisure Time — 1.6% | |
Carnival Corp. | | | 101,800 | | | | 3,743,186 | |
Harley-Davidson, Inc. | | | 35,600 | | | | 1,738,704 | |
| | | | | | | | |
| | | | | | | 5,481,890 | |
| | | | | | | | |
| Lodging — 2.5% | |
Las Vegas Sands Corp. | | | 70,600 | | | | 3,258,896 | |
Marriott International, Inc. Class A | | | 41,287 | | | | 1,538,767 | |
Starwood Hotels & Resorts Worldwide, Inc. | | | 62,100 | | | | 3,562,056 | |
Wynn Resorts Ltd. | | | 100 | | | | 11,249 | |
| | | | | | | | |
| | | | | | | 8,370,968 | |
| | | | | | | | |
| Retail — 7.5% | |
Chipotle Mexican Grill, Inc. (a) | | | 6,300 | | | | 1,873,998 | |
Coach, Inc. | | | 15,900 | | | | 882,609 | |
Costco Wholesale Corp. | | | 4,000 | | | | 395,080 | |
CVS Caremark Corp. | | | 24,600 | | | | 1,189,410 | |
Dollar Tree, Inc. (a) | | | 7,800 | | | | 316,368 | |
The Home Depot, Inc. | | | 32,700 | | | | 2,022,495 | |
Limited Brands, Inc. | | | 33,300 | | | | 1,567,098 | |
Michael Kors Holdings Ltd. (a) | | | 38,300 | | | | 1,954,449 | |
O’Reilly Automotive, Inc. (a) | | | 26,100 | | | | 2,333,862 | |
PetSmart, Inc. | | | 1,900 | | | | 129,846 | |
PVH Corp. | | | 28,200 | | | | 3,130,482 | |
Ross Stores, Inc. | | | 14,400 | | | | 779,760 | |
Starbucks Corp. | | | 117,000 | | | | 6,273,540 | |
Tiffany & Co. | | | 100 | | | | 5,734 | |
Tim Hortons, Inc. | | | 1,600 | | | | 78,688 | |
Yum! Brands, Inc. | | | 31,600 | | | | 2,098,240 | |
| | | | | | | | |
| | | | | | | 25,031,659 | |
| | | | | | | | |
| | | | | | | 52,032,479 | |
| | | | | | | | |
| Consumer, Non-cyclical — 16.6% | |
| Beverages — 0.5% | |
Anheuser-Busch InBev NV Sponsored ADR (Belgium) | | | 7,400 | | | | 646,834 | |
The Coca-Cola Co. | | | 1,200 | | | | 43,500 | |
Green Mountain Coffee Roasters, Inc. (a) | | | 7,400 | | | | 306,064 | |
Monster Beverage Corp. (a) | | | 15,900 | | | | 840,792 | |
| | | | | | | | |
| | | | | | | 1,837,190 | |
| | | | | | | | |
| Biotechnology — 4.0% | |
Alexion Pharmaceuticals, Inc. (a) | | | 31,600 | | | | 2,964,396 | |
Amgen, Inc. | | | 4,120 | | | | 355,638 | |
Biogen Idec, Inc. (a) | | | 32,000 | | | | 4,693,440 | |
Celgene Corp. (a) | | | 43,300 | | | | 3,408,576 | |
Regeneron Pharmaceuticals, Inc. (a) | | | 10,900 | | | | 1,864,663 | |
| | | | | | | | |
| | | | | | | 13,286,713 | |
| | | | | | | | |
The accompanying notes are an integral part of the financial statements.
60
MML Blue Chip Growth Fund – Portfolio of Investments (Continued)
| | | | | | | | |
| | | Number of
Shares | | | Value | |
| Commercial Services — 6.5% | |
Alliance Data Systems Corp. (a) | | | 8,900 | | | $ | 1,288,364 | |
MasterCard, Inc. Class A | | | 20,590 | | | | 10,115,455 | |
McKesson Corp. | | | 54,400 | | | | 5,274,624 | |
Verisk Analytics, Inc. Class A (a) | | | 600 | | | | 30,600 | |
Visa, Inc. Class A | | | 34,480 | | | | 5,226,479 | |
| | | | | | | | |
| | | | | | | 21,935,522 | |
| | | | | | | | |
| Foods — 0.7% | |
Whole Foods Market, Inc. | | | 23,900 | | | | 2,182,787 | |
| | | | | | | | |
| Health Care – Products — 1.3% | |
Baxter International, Inc. | | | 20,600 | | | | 1,373,196 | |
Covidien PLC | | | 14,500 | | | | 837,230 | |
Edwards Lifesciences Corp. (a) | | | 10,200 | | | | 919,734 | |
Henry Schein, Inc. (a) | | | 2,600 | | | | 209,196 | |
Intuitive Surgical, Inc. (a) | | | 350 | | | | 171,629 | |
Stryker Corp. | | | 17,830 | | | | 977,441 | |
| | | | | | | | |
| | | | | | | 4,488,426 | |
| | | | | | | | |
| Health Care – Services — 0.6% | |
UnitedHealth Group, Inc. | | | 34,500 | | | | 1,871,280 | |
| | | | | | | | |
| Pharmaceuticals — 3.0% | |
Allergan, Inc. | | | 29,060 | | | | 2,665,674 | |
Cardinal Health, Inc. | | | 2,500 | | | | 102,950 | |
Express Scripts Holding Co. (a) | | | 44,300 | | | | 2,392,200 | |
Gilead Sciences, Inc. (a) | | | 65,100 | | | | 4,781,595 | |
Perrigo Co. | | | 600 | | | | 62,418 | |
Valeant Pharmaceuticals International, Inc. (a) | | | 2,200 | | | | 131,494 | |
| | | | | | | | |
| | | | | | | 10,136,331 | |
| | | | | | | | |
| | | | | | | 55,738,249 | |
| | | | | | | | |
| Energy — 4.7% | |
| Oil & Gas — 2.4% | |
Concho Resources, Inc. (a) | | | 9,000 | | | | 725,040 | |
EOG Resources, Inc. | | | 21,390 | | | | 2,583,698 | |
EQT Corp. | | | 20,700 | | | | 1,220,886 | |
Occidental Petroleum Corp. | | | 1,200 | | | | 91,932 | |
Pioneer Natural Resources Co. | | | 18,700 | | | | 1,993,233 | |
Range Resources Corp. | | | 20,900 | | | | 1,313,147 | |
| | | | | | | | |
| | | | | | | 7,927,936 | |
| | | | | | | | |
| Oil & Gas Services — 2.3% | |
Cameron International Corp. (a) | | | 39,000 | | | | 2,201,940 | |
FMC Technologies, Inc. (a) | | | 11,600 | | | | 496,828 | |
National Oilwell Varco, Inc. | | | 700 | | | | 47,845 | |
Schlumberger Ltd. | | | 73,800 | | | | 5,113,602 | |
| | | | | | | | |
| | | | | | | 7,860,215 | |
| | | | | | | | |
| | | | | | | 15,788,151 | |
| | | | | | | | |
| Financial — 8.7% | |
| Banks — 1.1% | |
M&T Bank Corp. | | | 700 | | | | 68,929 | |
Northern Trust Corp. | | | 26,800 | | | | 1,344,288 | |
| | | | | | | | |
| | | Number of
Shares | | | Value | |
State Street Corp. | | | 16,500 | | | $ | 775,665 | |
U.S. Bancorp | | | 47,900 | | | | 1,529,926 | |
| | | | | | | | |
| | | | | | | 3,718,808 | |
| | | | | | | | |
| Diversified Financial — 5.0% | |
American Express Co. | | | 61,450 | | | | 3,532,146 | |
Ameriprise Financial, Inc. | | | 12,400 | | | | 776,612 | |
Citigroup, Inc. | | | 1,700 | | | | 67,252 | |
Franklin Resources, Inc. | | | 44,950 | | | | 5,650,215 | |
The Goldman Sachs Group, Inc. | | | 6,350 | | | | 810,006 | |
IntercontinentalExchange, Inc. (a) | | | 11,150 | | | | 1,380,481 | |
Invesco Ltd. | | | 131,700 | | | | 3,436,053 | |
JP Morgan Chase & Co. | | | 11,900 | | | | 523,243 | |
Morgan Stanley | | | 6,700 | | | | 128,104 | |
TD Ameritrade Holding Corp. | | | 28,100 | | | | 472,361 | |
| | | | | | | | |
| | | | | | | 16,776,473 | |
| | | | | | | | |
| Insurance — 0.2% | |
Marsh & McLennan Cos., Inc. | | | 21,300 | | | | 734,211 | |
Prudential Financial, Inc. | | | 100 | | | | 5,333 | |
| | | | | | | | |
| | | | | | | 739,544 | |
| | | | | | | | |
| Real Estate Investment Trusts (REITS) — 2.4% | |
American Tower Corp. | | | 102,170 | | | | 7,894,676 | |
| | | | | | | | |
| | | | | | | 29,129,501 | |
| | | | | | | | |
| Industrial — 12.1% | |
| Aerospace & Defense — 0.8% | |
The Boeing Co. | | | 32,100 | | | | 2,419,056 | |
United Technologies Corp. | | | 4,300 | | | | 352,643 | |
| | | | | | | | |
| | | | | | | 2,771,699 | |
| | | | | | | | |
| Electrical Components & Equipment — 0.0% | |
AMETEK, Inc. | | | 600 | | | | 22,542 | |
| | | | | | | | |
| Electronics — 0.2% | |
Amphenol Corp. Class A | | | 4,300 | | | | 278,210 | |
Trimble Navigation Ltd. (a) | | | 3,600 | | | | 215,208 | |
| | | | | | | | |
| | | | | | | 493,418 | |
| | | | | | | | |
| Health Care – Services — 0.7% | |
Thermo Fisher Scientific, Inc. | | | 35,600 | | | | 2,270,568 | |
| | | | | | | | |
| Machinery – Diversified — 0.5% | |
Roper Industries, Inc. | | | 14,500 | | | | 1,616,460 | |
| | | | | | | | |
| Manufacturing — 4.0% | |
3M Co. | | | 7,100 | | | | 659,235 | |
Danaher Corp. | | | 184,460 | | | | 10,311,314 | |
Honeywell International, Inc. | | | 39,300 | | | | 2,494,371 | |
| | | | | | | | |
| | | | | | | 13,464,920 | |
| | | | | | | | |
| Metal Fabricate & Hardware — 1.8% | |
Precision Castparts Corp. | | | 32,300 | | | | 6,118,266 | |
| | | | | | | | |
| Transportation — 4.1% | |
C.H. Robinson Worldwide, Inc. | | | 100 | | | | 6,322 | |
FedEx Corp. | | | 43,300 | | | | 3,971,476 | |
J.B. Hunt Transport Services, Inc. | | | 7,800 | | | | 465,738 | |
The accompanying notes are an integral part of the financial statements.
61
MML Blue Chip Growth Fund – Portfolio of Investments (Continued)
| | | | | | | | |
| | | Number of
Shares | | | Value | |
Kansas City Southern | | | 25,000 | | | $ | 2,087,000 | |
Union Pacific Corp. | | | 51,200 | | | | 6,436,864 | |
United Continental Holdings, Inc. (a) | | | 35,600 | | | | 832,328 | |
| | | | | | | | |
| | | | | | | 13,799,728 | |
| | | | | | | | |
| | | | | | | 40,557,601 | |
| | | | | | | | |
| Technology — 15.0% | |
| Computers — 10.7% | |
Accenture PLC Class A | | | 16,050 | | | | 1,067,325 | |
Apple, Inc. | | | 53,820 | | | | 28,687,675 | |
Cognizant Technology Solutions Corp. Class A (a) | | | 15,200 | | | | 1,125,560 | |
EMC Corp. (a) | | | 142,500 | | | | 3,605,250 | |
IHS, Inc. Class A (a) | | | 16,200 | | | | 1,555,200 | |
| | | | | | | | |
| | | | | | | 36,041,010 | |
| | | | | | | | |
| Semiconductors — 1.5% | |
Altera Corp. | | | 50 | | | | 1,722 | |
Broadcom Corp. Class A (a) | | | 120,150 | | | | 3,990,181 | |
Xilinx, Inc. | | | 33,100 | | | | 1,188,290 | |
| | | | | | | | |
| | | | | | | 5,180,193 | |
| | | | | | | | |
| Software — 2.8% | |
Autodesk, Inc. (a) | | | 35,300 | | | | 1,247,855 | |
Cerner Corp. (a) | | | 3,800 | | | | 295,032 | |
Citrix Systems, Inc. (a) | | | 500 | | | | 32,875 | |
Fiserv, Inc. (a) | | | 13,770 | | | | 1,088,243 | |
Intuit, Inc. | | | 15,000 | | | | 892,500 | |
Oracle Corp. | | | 1,900 | | | | 63,308 | |
Red Hat, Inc. (a) | | | 32,800 | | | | 1,737,088 | |
Salesforce.com, Inc. (a) | | | 23,100 | | | | 3,883,110 | |
| | | | | | | | |
| | | | | | | 9,240,011 | |
| | | | | | | | |
| | | | | | | 50,461,214 | |
| | | | | | | | |
| | |
TOTAL COMMON STOCK
(Cost $244,857,521) | | | | | | | 332,793,805 | |
| | | | | | | | |
| | |
TOTAL EQUITIES
(Cost $244,857,521) | | | | | | | 332,793,805 | |
| | | | | | | | |
|
| MUTUAL FUNDS — 0.0% | |
| Diversified Financial — 0.0% | |
T. Rowe Price Reserve Investment Fund | | | 1,000 | | | | 1,000 | |
| | | | | | | | |
| | |
TOTAL MUTUAL FUNDS
(Cost $1,000) | | | | | | | 1,000 | |
| | | | | | | | |
| | |
TOTAL LONG-TERM INVESTMENTS
(Cost $244,858,521) | | | | | | | 332,794,805 | |
| | | | | | | | |
| | | | | | | | |
| | | Principal
Amount | | | Value | |
| SHORT-TERM INVESTMENTS — 1.0% | |
| Repurchase Agreement — 1.0% | |
State Street Bank & Trust Co. Repurchase Agreement, dated 12/31/12, 0.010%, due 1/02/13 (b) | | $ | 3,315,498 | | | $ | 3,315,498 | |
| | | | | | | | |
| | |
TOTAL SHORT-TERM INVESTMENTS
(Cost $3,315,498) | | | | | | | 3,315,498 | |
| | | | | | | | |
| | |
TOTAL INVESTMENTS — 100.0%
(Cost $248,174,019) (c) | | | | | | | 336,110,303 | |
| | |
| Other Assets/(Liabilities) — 0.0% | | | | | | | 30,133 | |
| | | | | | | | |
| | |
| NET ASSETS — 100.0% | | | | | | $ | 336,140,436 | |
| | | | | | | | |
Notes to Portfolio of Investments
| ADR | American Depositary Receipt |
| (a) | Non-income producing security. |
| (b) | Maturity value of $3,315,500. Collateralized by U.S. Government Agency obligations with a rate of 3.000%, maturity date of 12/01/26, and an aggregate market value, including accrued interest, of $3,383,708. |
| (c) | See Note 6 for aggregate cost for federal tax purposes. |
The accompanying notes are an integral part of the financial statements.
62
MML Equity Income Fund – Portfolio of Investments
December 31, 2012
| | | | | | | | |
| | | Number of
Shares | | | Value | |
| EQUITIES — 95.5% | | | | | | | | |
| | |
| COMMON STOCK — 94.8% | | | | | | | | |
| Basic Materials — 5.6% | | | | | | | | |
| Chemicals — 0.4% | | | | | | | | |
E.I. du Pont de Nemours & Co. | | | 51,200 | | | $ | 2,302,464 | |
| | | | | | | | |
| Forest Products & Paper — 1.9% | | | | | | | | |
International Paper Co. | | | 187,700 | | | | 7,477,968 | |
MeadWestvaco Corp. | | | 82,300 | | | | 2,622,901 | |
| | | | | | | | |
| | | | | | | 10,100,869 | |
| | | | | | | | |
| Iron & Steel — 1.4% | | | | | | | | |
Cliffs Natural Resources, Inc. | | | 46,300 | | | | 1,785,328 | |
Nucor Corp. | | | 122,200 | | | | 5,276,596 | |
| | | | | | | | |
| | | | | | | 7,061,924 | |
| | | | | | | | |
| Mining — 1.1% | | | | | | | | |
Newmont Mining Corp. | | | 32,000 | | | | 1,486,080 | |
Vulcan Materials Co. | | | 77,900 | | | | 4,054,695 | |
| | | | | | | | |
| | | | | | | 5,540,775 | |
| | | | | | | | |
| Real Estate Investment Trusts (REITS) — 0.8% | | | | | |
Weyerhaeuser Co. | | | 140,842 | | | | 3,918,225 | |
| | | | | | | | |
| | | | | | | 28,924,257 | |
| | | | | | | | |
| | |
| Communications — 11.3% | | | | | | | | |
| Media — 4.8% | | | | | | | | |
Cablevision Systems Corp. Class A | | | 139,000 | | | | 2,076,660 | |
Comcast Corp. Class A | | | 85,900 | | | | 3,210,942 | |
The McGraw-Hill Cos., Inc. | | | 85,000 | | | | 4,646,950 | |
The New York Times Co. Class A (a) | | | 145,000 | | | | 1,236,850 | |
Time Warner, Inc. | | | 140,433 | | | | 6,716,910 | |
The Walt Disney Co. | | | 98,600 | | | | 4,909,294 | |
WPP PLC | | | 121,099 | | | | 1,760,449 | |
| | | | | | | | |
| | | | | | | 24,558,055 | |
| | | | | | | | |
| Telecommunications — 6.5% | | | | | | | | |
AT&T, Inc. | | | 278,700 | | | | 9,394,977 | |
CenturyLink, Inc. | | | 67,105 | | | | 2,625,148 | |
Cisco Systems, Inc. | | | 221,000 | | | | 4,342,650 | |
Corning, Inc. | | | 280,400 | | | | 3,538,648 | |
Harris Corp. | | | 100,400 | | | | 4,915,584 | |
Nokia Corp. Sponsored ADR (Finland) | | | 270,200 | | | | 1,067,290 | |
Telefonica SA | | | 115,473 | | | | 1,567,977 | |
Verizon Communications, Inc. | | �� | 104,000 | | | | 4,500,080 | |
Vodafone Group PLC | | | 704,396 | | | | 1,771,462 | |
| | | | | | | | |
| | | | | | | 33,723,816 | |
| | | | | | | | |
| | | | | | | 58,281,871 | |
| | | | | | | | |
| | | | | | | | |
| | | Number of
Shares | | | Value | |
| Consumer, Cyclical — 6.6% | | | | | | | | |
| Auto Manufacturers — 0.5% | | | | | | | | |
Ford Motor Co. | | | 203,100 | | | $ | 2,630,145 | |
| | | | | | | | |
| Automotive & Parts — 0.6% | | | | | | | | |
Johnson Controls, Inc. | | | 91,100 | | | | 2,796,770 | |
| | | | | | | | |
| Distribution & Wholesale — 0.5% | | | | | | | | |
Genuine Parts Co. | | | 41,500 | | | | 2,638,570 | |
| | | | | | | | |
| Entertainment — 0.4% | | | | | | | | |
The Madison Square Garden Co.
Class A (a) | | | 45,625 | | | | 2,023,469 | |
| | | | | | | | |
| Home Furnishing — 0.7% | | | | | | | | |
Whirlpool Corp. | | | 35,000 | | | | 3,561,250 | |
| | | | | | | | |
| Leisure Time — 0.5% | | | | | | | | |
Carnival Corp. | | | 72,300 | | | | 2,658,471 | |
| | | | | | | | |
| Retail — 2.1% | | | | | | | | |
Kohl’s Corp. | | | 101,000 | | | | 4,340,980 | |
Macy’s, Inc. | | | 80,100 | | | | 3,125,502 | |
Staples, Inc. | | | 270,400 | | | | 3,082,560 | |
Tiffany & Co. | | | 5,400 | | | | 309,636 | |
| | | | | | | | |
| | | | | | | 10,858,678 | |
| | | | | | | | |
| Toys, Games & Hobbies — 1.3% | | | | | | | | |
Hasbro, Inc. | | | 46,900 | | | | 1,683,710 | |
Mattel, Inc. | | | 143,200 | | | | 5,243,984 | |
| | | | | | | | |
| | | | | | | 6,927,694 | |
| | | | | | | | |
| | | | | | | 34,095,047 | |
| | | | | | | | |
| Consumer, Non-cyclical — 10.9% | | | | | | | | |
| Agriculture — 0.8% | | | | | | | | |
Archer-Daniels-Midland Co. | | | 159,500 | | | | 4,368,705 | |
| | | | | | | | |
| Beverages — 0.8% | | | | | | | | |
PepsiCo, Inc. | | | 62,200 | | | | 4,256,346 | |
| | | | | | | | |
| Biotechnology — 0.5% | | | | | | | | |
Amgen, Inc. | | | 27,800 | | | | 2,399,696 | |
| | | | | | | | |
| Cosmetics & Personal Care — 0.8% | | | | | | | | |
Avon Products, Inc. | | | 209,800 | | | | 3,012,728 | |
The Procter & Gamble Co. | | | 16,100 | | | | 1,093,029 | |
| | | | | | | | |
| | | | | | | 4,105,757 | |
| | | | | | | | |
| Foods — 1.8% | | | | | | | | |
Campbell Soup Co. | �� | | 126,300 | | | | 4,406,607 | |
ConAgra Foods, Inc. | | | 81,500 | | | | 2,404,250 | |
McCormick & Co., Inc. | | | 37,600 | | | | 2,388,728 | |
| | | | | | | | |
| | | | | | | 9,199,585 | |
| | | | | | | | |
| Health Care – Products — 1.3% | | | | | | | | |
Johnson & Johnson | | | 98,900 | | | | 6,932,890 | |
| | | | | | | | |
| Health Care – Services — 0.5% | | | | | | | | |
Quest Diagnostics, Inc. | | | 45,600 | | | | 2,657,112 | |
| | | | | | | | |
The accompanying notes are an integral part of the financial statements.
63
MML Equity Income Fund – Portfolio of Investments (Continued)
| | | | | | | | |
| | | Number of
Shares | | | Value | |
| Household Products — 1.2% | | | | | | | | |
Avery Dennison Corp. | | | 36,800 | | | $ | 1,285,056 | |
The Clorox Co. | | | 70,200 | | | | 5,140,044 | |
| | | | | | | | |
| | | | | | | 6,425,100 | |
| | | | | | | | |
| Pharmaceuticals — 3.2% | | | | | | | | |
Bristol-Myers Squibb Co. | | | 122,100 | | | | 3,979,239 | |
Merck & Co., Inc. | | | 141,500 | | | | 5,793,010 | |
Pfizer, Inc. | | | 262,454 | | | | 6,582,346 | |
| | | | | | | | |
| | | | | | | 16,354,595 | |
| | | | | | | | |
| | | | | | | 56,699,786 | |
| | | | | | | | |
| Energy — 14.2% | | | | | | | | |
| Coal — 0.7% | | | | | | | | |
CONSOL Energy, Inc. | | | 113,700 | | | | 3,649,770 | |
| | | | | | | | |
| Energy – Alternate Sources — 0.2% | | | | | | | | |
First Solar, Inc. (a) | | | 25,500 | | | | 787,440 | |
| | | | | | | | |
| Oil & Gas — 12.0% | | | | | | | | |
Anadarko Petroleum Corp. | | | 67,900 | | | | 5,045,649 | |
Apache Corp. | | | 51,800 | | | | 4,066,300 | |
BP PLC Sponsored ADR
(United Kingdom) | | | 70,800 | | | | 2,948,112 | |
Chevron Corp. | | | 114,600 | | | | 12,392,844 | |
ConocoPhillips | | | 36,100 | | | | 2,093,439 | |
Diamond Offshore Drilling, Inc. | | | 58,700 | | | | 3,989,252 | |
Exxon Mobil Corp. | | | 129,500 | | | | 11,208,225 | |
Hess Corp. | | | 85,400 | | | | 4,522,784 | |
Murphy Oil Corp. | | | 100,900 | | | | 6,008,595 | |
Petroleo Brasileiro SA Sponsored ADR (Brazil) | | | 75,700 | | | | 1,473,879 | |
Royal Dutch Shell PLC A Shares Sponsored ADR (United Kingdom) | | | 124,300 | | | | 8,570,485 | |
| | | | | | | | |
| | | | | | | 62,319,564 | |
| | | | | | | | |
| Oil & Gas Services — 0.9% | | | | | | | | |
Schlumberger Ltd. | | | 67,100 | | | | 4,649,359 | |
| | | | | | | | |
| Pipelines — 0.4% | | | | | | | | |
Spectra Energy Corp. | | | 69,550 | | | | 1,904,279 | |
| | | | | | | | |
| | | | | | | 73,310,412 | |
| | | | | | | | |
| Financial — 19.4% | | | | | | | | |
| Banks — 9.3% | | | | | | | | |
Bank of America Corp. | | | 567,577 | | | | 6,583,893 | |
Bank of New York Mellon Corp. | | | 131,700 | | | | 3,384,690 | |
Capital One Financial Corp. | | | 60,700 | | | | 3,516,351 | |
Northern Trust Corp. | | | 96,100 | | | | 4,820,376 | |
PNC Financial Services Group, Inc. | | | 90,600 | | | | 5,282,886 | |
Regions Financial Corp. | | | 235,200 | | | | 1,674,624 | |
SunTrust Banks, Inc. | | | 164,700 | | | | 4,669,245 | |
U.S. Bancorp | | | 261,500 | | | | 8,352,310 | |
Wells Fargo & Co. | | | 284,500 | | | | 9,724,210 | |
| | | | | | | | |
| | | | | | | 48,008,585 | |
| | | | | | | | |
| | | | | | | | |
| | | Number of
Shares | | | Value | |
| Diversified Financial — 5.5% | | | | | | | | |
American Express Co. | | | 137,800 | | | $ | 7,920,744 | |
JP Morgan Chase & Co. | | | 311,800 | | | | 13,709,846 | |
Legg Mason, Inc. | | | 133,400 | | | | 3,431,048 | |
SLM Corp. | | | 215,000 | | | | 3,682,950 | |
| | | | | | | | |
| | | | | | | 28,744,588 | |
| | | | | | | | |
| Insurance — 4.6% | | | | | | | | |
The Allstate Corp. | | | 140,700 | | | | 5,651,919 | |
The Chubb Corp. | | | 31,800 | | | | 2,395,176 | |
Lincoln National Corp. | | | 102,600 | | | | 2,657,340 | |
Loews Corp. | | | 39,600 | | | | 1,613,700 | |
Marsh & McLennan Cos., Inc. | | | 162,800 | | | | 5,611,716 | |
Sun Life Financial, Inc. | | | 76,100 | | | | 2,018,933 | |
Willis Group Holdings PLC | | | 69,600 | | | | 2,333,688 | |
XL Group PLC | | | 55,800 | | | | 1,398,348 | |
| | | | | | | | |
| | | | | | | 23,680,820 | |
| | | | | | | | |
| | | | | | | 100,433,993 | |
| | | | | | | | |
| Industrial — 16.0% | | | | | | | | |
| Aerospace & Defense — 1.4% | | | | | | | | |
The Boeing Co. | | | 55,600 | | | | 4,190,016 | |
Lockheed Martin Corp. | | | 25,200 | | | | 2,325,708 | |
United Technologies Corp. | | | 10,700 | | | | 877,507 | |
| | | | | | | | |
| | | | | | | 7,393,231 | |
| | | | | | | | |
| Building Materials — 0.8% | | | | | | | | |
Masco Corp. | | | 156,600 | | | | 2,608,956 | |
USG Corp. (a) | | | 61,400 | | | | 1,723,498 | |
| | | | | | | | |
| | | | | | | 4,332,454 | |
| | | | | | | | |
| Electrical Components & Equipment — 1.6% | | | | | |
Emerson Electric Co. | | | 112,900 | | | | 5,979,184 | |
Energizer Holdings, Inc. | | | 26,800 | | | | 2,143,464 | |
| | | | | | | | |
| | | | | | | 8,122,648 | |
| | | | | | | | |
| Electronics — 0.4% | | | | | | | | |
Agilent Technologies, Inc. | | | 48,200 | | | | 1,973,308 | |
| | | | | | | | |
| Health Care – Services — 1.3% | | | | | | | | |
Thermo Fisher Scientific, Inc. | | | 104,400 | | | | 6,658,632 | |
| | | | | | | | |
| Machinery – Construction & Mining — 0.6% | | | | | |
Ingersoll-Rand PLC | | | 64,000 | | | | 3,069,440 | |
| | | | | | | | |
| Machinery – Diversified — 0.3% | | | | | | | | |
Xylem, Inc. | | | 48,600 | | | | 1,317,060 | |
| | | | | | | | |
| Manufacturing — 6.9% | | | | | | | | |
3M Co. | | | 78,300 | | | | 7,270,155 | |
Eaton Corp. PLC | | | 47,184 | | | | 2,557,373 | |
General Electric Co. | | | 668,200 | | | | 14,025,518 | |
Honeywell International, Inc. | | | 89,300 | | | | 5,667,871 | |
Illinois Tool Works, Inc. | | | 105,900 | | | | 6,439,779 | |
| | | | | | | | |
| | | | | | | 35,960,696 | |
| | | | | | | | |
The accompanying notes are an integral part of the financial statements.
64
MML Equity Income Fund – Portfolio of Investments (Continued)
| | | | | | | | |
| | | Number of
Shares | | | Value | |
| Transportation — 2.7% | | | | | | | | |
Norfolk Southern Corp. | | | 85,400 | | | $ | 5,281,136 | |
United Continental Holdings,
Inc. (a) | | | 160,200 | | | | 3,745,476 | |
United Parcel Service, Inc. Class B | | | 66,200 | | | | 4,880,926 | |
| | | | | | | | |
| | | | | | | 13,907,538 | |
| | | | | | | | |
| | | | | | | 82,735,007 | |
| | | | | | | | |
| Technology — 5.2% | | | | | | | | |
| Computers — 1.9% | | | | | | | | |
Computer Sciences Corp. | | | 110,500 | | | | 4,425,525 | |
Dell, Inc. | | | 353,100 | | | | 3,576,903 | |
Hewlett-Packard Co. | | | 126,900 | | | | 1,808,325 | |
| | | | | | | | |
| | | | | | | 9,810,753 | |
| | | | | | | | |
| Semiconductors — 1.9% | | | | | | | | |
Analog Devices, Inc. | | | 89,600 | | | | 3,768,576 | |
Applied Materials, Inc. | | | 266,900 | | | | 3,053,336 | |
Texas Instruments, Inc. | | | 102,500 | | | | 3,171,350 | |
| | | | | | | | |
| | | | | | | 9,993,262 | |
| | | | | | | | |
| Software — 1.4% | | | | | | | | |
CA, Inc. | | | 48,000 | | | | 1,055,040 | |
Microsoft Corp. | | | 232,300 | | | | 6,209,379 | |
| | | | | | | | |
| | | | | | | 7,264,419 | |
| | | | | | | | |
| | | | | | | 27,068,434 | |
| | | | | | | | |
| Utilities — 5.6% | | | | | | | | |
| Electric — 4.6% | | | | | | | | |
The AES Corp. | | | 128,600 | | | | 1,376,020 | |
Duke Energy Corp. | | | 105,833 | | | | 6,752,145 | |
Entergy Corp. | | | 79,200 | | | | 5,049,000 | |
Exelon Corp. | | | 151,500 | | | | 4,505,610 | |
FirstEnergy Corp. | | | 49,000 | | | | 2,046,240 | |
TECO Energy, Inc. | | | 45,400 | | | | 760,904 | |
Xcel Energy, Inc. | | | 127,100 | | | | 3,394,841 | |
| | | | | | | | |
| | | | | | | 23,884,760 | |
| | | | | | | | |
| Gas — 1.0% | | | | | | | | |
NiSource, Inc. | | | 213,800 | | | | 5,321,482 | |
| | | | | | | | |
| | | | | | | 29,206,242 | |
| | | | | | | | |
| | |
TOTAL COMMON STOCK
(Cost $404,077,906) | | | | | | | 490,755,049 | |
| | | | | | | | |
| | |
| PREFERRED STOCK — 0.7% | | | | | | | | |
| Consumer, Cyclical — 0.7% | | | | | | | | |
| Auto Manufacturers — 0.7% | | | | | | | | |
General Motors Co. 4.750% | | | 83,350 | | | | 3,678,235 | |
| | | | | | | | |
| | |
| TOTAL PREFERRED STOCK (Cost $4,171,345) | | | | | | | 3,678,235 | |
| | | | | | | | |
| | |
TOTAL EQUITIES
(Cost $408,249,251) | | | | | | | 494,433,284 | |
| | | | | | | | |
| | | | | | | | |
| | | Number of
Shares | | | Value | |
| MUTUAL FUNDS — 0.0% | | | | | | | | |
| Diversified Financial — 0.0% | | | | | | | | |
T. Rowe Price Reserve Investment Fund | | | 1,064 | | | $ | 1,064 | |
| | | | | | | | |
| | |
TOTAL MUTUAL FUNDS
(Cost $1,064) | | | | | | | 1,064 | |
| | | | | | | | |
| | |
TOTAL LONG-TERM INVESTMENTS
(Cost $408,250,315) | | | | | | | 494,434,348 | |
| | | | | | | | |
| | |
| | | Principal
Amount | | | | |
| |
| SHORT-TERM INVESTMENTS — 4.5% | | | | | |
| Repurchase Agreement — 4.5% | | | | | | | | |
State Street Bank & Trust Co. Repurchase Agreement, dated 12/31/12, 0.010%, due 1/02/13 (b) | | $ | 23,152,964 | | | | 23,152,964 | |
| | | | | | | | |
| Time Deposits — 0.0% | | | | | | | | |
Euro Time Deposit
0.010% 1/02/13 | | | 91 | | | | 91 | |
| | | | | | | | |
| | |
TOTAL SHORT-TERM INVESTMENTS
(Cost $23,153,055) | | | | | | | 23,153,055 | |
| | | | | | | | |
| | |
TOTAL INVESTMENTS — 100.0%
(Cost $431,403,370) (c) | | | | | | | 517,587,403 | |
| | |
| Other Assets/(Liabilities) — (0.0)% | | | | | | | (93,700 | ) |
| | | | | | | | |
| | |
| NET ASSETS — 100.0% | | | | | | $ | 517,493,703 | |
| | | | | | | | |
Notes to Portfolio of Investments
| ADR | American Depositary Receipt |
| (a) | Non-income producing security. |
| (b) | Maturity value of $23,152,977. Collateralized by U.S. Government Agency obligations with rates ranging from 2.500% – 3.000%, maturity dates ranging from 12/01/26 – 10/20/27, and an aggregate market value, including accrued interest, of $23,618,394. |
| (c) | See Note 6 for aggregate cost for federal tax purposes. |
The accompanying notes are an integral part of the financial statements.
65
MML Equity Index Fund – Portfolio of Investments
December 31, 2012
| | | | | | | | |
| | | Number of
Shares | | | Value | |
| EQUITIES — 97.4% | | | | | | | | |
| | |
| COMMON STOCK — 97.4% | | | | | | | | |
| Basic Materials — 3.6% | | | | | | | | |
| Chemicals — 2.5% | | | | | | | | |
Air Products & Chemicals, Inc. | | | 5,139 | | | $ | 431,779 | |
Airgas, Inc. | | | 1,734 | | | | 158,297 | |
CF Industries Holdings, Inc. | | | 1,510 | | | | 306,771 | |
The Dow Chemical Co. | | | 29,056 | | | | 939,090 | |
E.I. du Pont de Nemours & Co. | | | 22,570 | | | | 1,014,973 | |
Eastman Chemical Co. | | | 3,782 | | | | 257,365 | |
Ecolab, Inc. | | | 6,393 | | | | 459,657 | |
FMC Corp. | | | 3,415 | | | | 199,846 | |
International Flavors & Fragrances, Inc. | | | 1,966 | | | | 130,817 | |
LyondellBasell Industries NV Class A | | | 9,200 | | | | 525,228 | |
Monsanto Co. | | | 13,041 | | | | 1,234,331 | |
The Mosaic Co. | | | 6,687 | | | | 378,685 | |
PPG Industries, Inc. | | | 3,711 | | | | 502,284 | |
Praxair, Inc. | | | 7,246 | | | | 793,075 | |
The Sherwin-Williams Co. | | | 2,109 | | | | 324,406 | |
Sigma-Aldrich Corp. | | | 2,875 | | | | 211,542 | |
| | | | | | | | |
| | | | | | | 7,868,146 | |
| | | | | | | | |
| Forest Products & Paper — 0.2% | | | | | | | | |
International Paper Co. | | | 10,734 | | | | 427,643 | |
MeadWestvaco Corp. | | | 4,337 | | | | 138,220 | |
| | | | | | | | |
| | | | | | | 565,863 | |
| | | | | | | | |
| Iron & Steel — 0.2% | | | | | | | | |
Allegheny Technologies, Inc. | | | 2,563 | | | | 77,812 | |
Cliffs Natural Resources, Inc. | | | 3,555 | | | | 137,081 | |
Nucor Corp. | | | 7,766 | | | | 335,336 | |
United States Steel Corp. | | | 3,605 | | | | 86,051 | |
| | | | | | | | |
| | | | | | | 636,280 | |
| | | | | | | | |
| Mining — 0.5% | | | | | | | | |
Alcoa, Inc. | | | 25,470 | | | | 221,080 | |
Freeport-McMoRan Copper & Gold, Inc. | | | 23,005 | | | | 786,771 | |
Newmont Mining Corp. | | | 12,021 | | | | 558,255 | |
Titanium Metals Corp. | | | 1,884 | | | | 31,105 | |
Vulcan Materials Co. | | | 3,145 | | | | 163,697 | |
| | | | | | | | |
| | | | | | | 1,760,908 | |
| | | | | | | | |
| Real Estate Investment Trusts (REITS) — 0.2% | | | | | |
Plum Creek Timber Co., Inc. | | | 3,941 | | | | 174,862 | |
Weyerhaeuser Co. | | | 13,019 | | | | 362,189 | |
| | | | | | | | |
| | | | | | | 537,051 | |
| | | | | | | | |
| | | | | | | 11,368,248 | |
| | | | | | | | |
| | | | | | | | |
| | | Number of
Shares | | | Value | |
| Communications — 11.8% | | | | | | | | |
| Advertising — 0.1% | | | | | | | | |
The Interpublic Group of Companies, Inc. | | | 10,058 | | | $ | 110,839 | |
Omnicom Group, Inc. | | | 6,348 | | | | 317,146 | |
| | | | | | | | |
| | | | | | | 427,985 | |
| | | | | | | | |
| Internet — 3.4% | | | | | | | | |
Akamai Technologies, Inc. (a) | | | 4,424 | | | | 180,986 | |
Amazon.com, Inc. (a) | | | 8,808 | | | | 2,212,041 | |
eBay, Inc. (a) | | | 28,322 | | | | 1,444,989 | |
Expedia, Inc. | | | 2,222 | | | | 136,542 | |
F5 Networks, Inc. (a) | | | 1,875 | | | | 182,156 | |
Google, Inc. Class A (a) | | | 6,468 | | | | 4,588,205 | |
Netflix, Inc. (a) | | | 1,376 | | | | 127,665 | |
Priceline.com, Inc. (a) | | | 1,209 | | | | 751,031 | |
Symantec Corp. (a) | | | 17,044 | | | | 320,598 | |
TripAdvisor, Inc. (a) | | | 2,715 | | | | 113,921 | |
VeriSign, Inc. (a) | | | 3,880 | | | | 150,622 | |
Yahoo!, Inc. (a) | | | 25,257 | | | | 502,614 | |
| | | | | | | | |
| | | | | | | 10,711,370 | |
| | | | | | | | |
| Media — 3.3% | | | | | | | | |
Cablevision Systems Corp. Class A | | | 5,137 | | | | 76,747 | |
CBS Corp. Class B | | | 14,445 | | | | 549,632 | |
Comcast Corp. Class A | | | 64,629 | | | | 2,415,832 | |
DIRECTV (a) | | | 14,684 | | | | 736,549 | |
Discovery Communications, Inc. Series A (a) | | | 5,807 | | | | 368,628 | |
Gannett Co., Inc. | | | 5,375 | | | | 96,804 | |
The McGraw-Hill Cos., Inc. | | | 6,755 | | | | 369,296 | |
News Corp. Class A | | | 48,982 | | | | 1,251,000 | |
Scripps Networks Interactive Class A | | | 2,118 | | | | 122,675 | |
Time Warner Cable, Inc. | | | 7,330 | | | | 712,403 | |
Time Warner, Inc. | | | 23,014 | | | | 1,100,760 | |
Viacom, Inc. Class B | | | 11,237 | | | | 592,639 | |
The Walt Disney Co. | | | 43,100 | | | | 2,145,949 | |
The Washington Post Co. Class B | | | 96 | | | | 35,060 | |
| | | | | | | | |
| | | | | | | 10,573,974 | |
| | | | | | | | |
| Telecommunications — 5.0% | | | | | | | | |
AT&T, Inc. | | | 138,097 | | | | 4,655,250 | |
CenturyLink, Inc. | | | 15,084 | | | | 590,086 | |
Cisco Systems, Inc. | | | 129,063 | | | | 2,536,088 | |
Corning, Inc. | | | 35,954 | | | | 453,740 | |
Crown Castle International Corp. (a) | | | 7,123 | | | | 513,996 | |
Frontier Communications Corp. | | | 25,344 | | | | 108,472 | |
Harris Corp. | | | 2,755 | | | | 134,885 | |
JDS Uniphase Corp. (a) | | | 5,851 | | | | 79,223 | |
Juniper Networks, Inc. (a) | | | 12,457 | | | | 245,029 | |
MetroPCS Communications, Inc. (a) | | | 7,879 | | | | 78,317 | |
Motorola Solutions, Inc. | | | 6,768 | | | | 376,842 | |
QUALCOMM, Inc. | | | 41,478 | | | | 2,572,466 | |
The accompanying notes are an integral part of the financial statements.
66
MML Equity Index Fund – Portfolio of Investments (Continued)
| | | | | | | | |
| | | Number of
Shares | | | Value | |
Sprint Nextel Corp. (a) | | | 72,336 | | | $ | 410,145 | |
Verizon Communications, Inc. | | | 69,357 | | | | 3,001,077 | |
Windstream Corp. | | | 14,526 | | | | 120,275 | |
| | | | | | | | |
| | | | | | | 15,875,891 | |
| | | | | | | | |
| | | | | | | 37,589,220 | |
| | | | | | | | |
| Consumer, Cyclical — 8.9% | | | | | | | | |
| Airlines — 0.1% | | | | | | | | |
Southwest Airlines Co. | | | 18,090 | | | | 185,242 | |
| | | | | | | | |
| Apparel — 0.5% | | | | | | | | |
Nike, Inc. Class B | | | 17,836 | | | | 920,338 | |
Ralph Lauren Corp. | | | 1,496 | | | | 224,280 | |
VF Corp. | | | 2,137 | | | | 322,623 | |
| | | | | | | | |
| | | | | | | 1,467,241 | |
| | | | | | | | |
| Auto Manufacturers — 0.5% | | | | | | | | |
Ford Motor Co. | | | 92,367 | | | | 1,196,152 | |
Paccar, Inc. | | | 8,527 | | | | 385,506 | |
| | | | | | | | |
| | | | | | | 1,581,658 | |
| | | | | | | | |
| Automotive & Parts — 0.3% | | | | | | | | |
BorgWarner, Inc. (a) | | | 2,826 | | | | 202,398 | |
Delphi Automotive PLC (a) | | | 7,191 | | | | 275,056 | |
The Goodyear Tire & Rubber Co. (a) | | | 5,977 | | | | 82,542 | |
Johnson Controls, Inc. | | | 16,488 | | | | 506,182 | |
| | | | | | | | |
| | | | | | | 1,066,178 | |
| | | | | | | | |
| Distribution & Wholesale — 0.3% | | | | | | | | |
Fastenal Co. | | | 6,476 | | | | 302,364 | |
Fossil, Inc. (a) | | | 1,299 | | | | 120,937 | |
Genuine Parts Co. | | | 3,706 | | | | 235,628 | |
W.W. Grainger, Inc. | | | 1,446 | | | | 292,627 | |
| | | | | | | | |
| | | | | | | 951,556 | |
| | | | | | | | |
| Entertainment — 0.0% | | | | | | | | |
International Game Technology | | | 6,507 | | | | 92,204 | |
| | | | | | | | |
| Home Builders — 0.1% | | | | | | | | |
D.R. Horton, Inc. | | | 6,603 | | | | 130,607 | |
Lennar Corp. Class A | | | 4,070 | | | | 157,387 | |
PulteGroup, Inc. (a) | | | 8,439 | | | | 153,252 | |
| | | | | | | | |
| | | | | | | 441,246 | |
| | | | | | | | |
| Home Furnishing — 0.1% | | | | | | | | |
Harman International Industries, Inc. | | | 1,695 | | | | 75,665 | |
Whirlpool Corp. | | | 1,904 | | | | 193,732 | |
| | | | | | | | |
| | | | | | | 269,397 | |
| | | | | | | | |
| Housewares — 0.1% | | | | | | | | |
Newell Rubbermaid, Inc. | | | 7,118 | | | | 158,518 | |
| | | | | | | | |
| Leisure Time — 0.2% | | | | | | | | |
Carnival Corp. | | | 10,847 | | | | 398,844 | |
Harley-Davidson, Inc. | | | 5,493 | | | | 268,278 | |
| | | | | | | | |
| | | | | | | 667,122 | |
| | | | | | | | |
| | | | | | | | |
| | | Number of
Shares | | | Value | |
| Lodging — 0.3% | | | | | | | | |
Marriott International, Inc. Class A | | | 5,981 | | | $ | 222,912 | |
Starwood Hotels & Resorts Worldwide, Inc. | | | 4,687 | | | | 268,846 | |
Wyndham Worldwide Corp. | | | 3,388 | | | | 180,275 | |
Wynn Resorts Ltd. | | | 1,950 | | | | 219,356 | |
| | | | | | | | |
| | | | | | | 891,389 | |
| | | | | | | | |
| Retail — 6.3% | | | | | | | | |
Abercrombie & Fitch Co. Class A | | | 2,030 | | | | 97,379 | |
AutoNation, Inc. (a) | | | 850 | | | | 33,745 | |
AutoZone, Inc. (a) | | | 901 | | | | 319,341 | |
Bed Bath & Beyond, Inc. (a) | | | 5,565 | | | | 311,139 | |
Best Buy Co., Inc. | | | 6,241 | | | | 73,956 | |
Big Lots, Inc. (a) | | | 1,536 | | | | 43,715 | |
CarMax, Inc. (a) | | | 5,666 | | | | 212,702 | |
Chipotle Mexican Grill, Inc. (a) | | | 781 | | | | 232,316 | |
Coach, Inc. | | | 6,912 | | | | 383,685 | |
Costco Wholesale Corp. | | | 10,485 | | | | 1,035,603 | |
CVS Caremark Corp. | | | 30,308 | | | | 1,465,392 | |
Darden Restaurants, Inc. | | | 3,149 | | | | 141,925 | |
Dollar General Corp. (a) | | | 6,449 | | | | 284,336 | |
Dollar Tree, Inc. (a) | | | 5,453 | | | | 221,174 | |
Family Dollar Stores, Inc. | | | 2,395 | | | | 151,867 | |
GameStop Corp. Class A | | | 2,818 | | | | 70,704 | |
The Gap, Inc. | | | 7,120 | | | | 221,005 | |
The Home Depot, Inc. | | | 36,310 | | | | 2,245,774 | |
J.C. Penney Co., Inc. | | | 3,582 | | | | 70,601 | |
Kohl’s Corp. | | | 5,148 | | | | 221,261 | |
Limited Brands, Inc. | | | 5,715 | | | | 268,948 | |
Lowe’s Cos., Inc. | | | 27,306 | | | | 969,909 | |
Macy’s, Inc. | | | 9,673 | | | | 377,441 | |
McDonald’s Corp. | | | 24,452 | | | | 2,156,911 | |
Nordstrom, Inc. | | | 3,767 | | | | 201,535 | |
O’Reilly Automotive, Inc. (a) | | | 2,831 | | | | 253,148 | |
PetSmart, Inc. | | | 2,551 | | | | 174,335 | |
Ross Stores, Inc. | | | 5,397 | | | | 292,248 | |
Staples, Inc. | | | 16,100 | | | | 183,540 | |
Starbucks Corp. | | | 18,058 | | | | 968,270 | |
Target Corp. | | | 15,877 | | | | 939,442 | |
Tiffany & Co. | | | 2,945 | | | | 168,866 | |
The TJX Cos., Inc. | | | 17,636 | | | | 748,648 | |
Urban Outfitters, Inc. (a) | | | 2,703 | | | | 106,390 | |
Wal-Mart Stores, Inc. | | | 40,613 | | | | 2,771,025 | |
Walgreen Co. | | | 20,778 | | | | 768,994 | |
Yum! Brands, Inc. | | | 10,911 | | | | 724,490 | |
| | | | | | | | |
| | | | | | | 19,911,760 | |
| | | | | | | | |
| Textiles — 0.0% | | | | | | | | |
Cintas Corp. | | | 2,517 | | | | 102,945 | |
| | | | | | | | |
67
The accompanying notes are an integral part of the financial statements.
MML Equity Index Fund – Portfolio of Investments (Continued)
| | | | | | | | |
| | | Number of
Shares | | | Value | |
| Toys, Games & Hobbies — 0.1% | | | | | | | | |
Hasbro, Inc. | | | 2,923 | | | $ | 104,936 | |
Mattel, Inc. | | | 8,425 | | | | 308,523 | |
| | | | | | | | |
| | | | | | | 413,459 | |
| | | | | | | | |
| | | | | | | 28,199,915 | |
| | | | | | | | |
| Consumer, Non-cyclical — 21.5% | | | | | | | | |
| Agriculture — 1.9% | | | | | | | | |
Altria Group, Inc. | | | 49,347 | | | | 1,550,483 | |
Archer-Daniels-Midland Co. | | | 15,964 | | | | 437,254 | |
Lorillard, Inc. | | | 3,165 | | | | 369,261 | |
Philip Morris International, Inc. | | | 40,599 | | | | 3,395,700 | |
Reynolds American, Inc. | | | 7,940 | | | | 328,954 | |
| | | | | | | | |
| | | | | | | 6,081,652 | |
| | | | | | | | |
| Beverages — 2.2% | | | | | | | | |
Brown-Forman Corp. Class B | | | 3,645 | | | | 230,546 | |
The Coca-Cola Co. | | | 93,652 | | | | 3,394,885 | |
Coca-Cola Enterprises, Inc. | | | 6,586 | | | | 208,974 | |
Constellation Brands, Inc. Class A (a) | | | 3,656 | | | | 129,386 | |
Dr. Pepper Snapple Group, Inc. | | | 4,994 | | | | 220,635 | |
Molson Coors Brewing Co. Class B | | | 3,899 | | | | 166,838 | |
Monster Beverage Corp. (a) | | | 3,601 | | | | 190,421 | |
PepsiCo, Inc. | | | 37,617 | | | | 2,574,131 | |
| | | | | | | | |
| | | | | | | 7,115,816 | |
| | | | | | | | |
| Biotechnology — 1.2% | | | | | | | | |
Alexion Pharmaceuticals, Inc. (a) | | | 4,686 | | | | 439,594 | |
Amgen, Inc. | | | 18,692 | | | | 1,613,493 | |
Biogen Idec, Inc. (a) | | | 5,734 | | | | 841,006 | |
Celgene Corp. (a) | | | 10,295 | | | | 810,422 | |
Life Technologies Corp. (a) | | | 4,238 | | | | 208,001 | |
| | | | | | | | |
| | | | | | | 3,912,516 | |
| | | | | | | | |
| Commercial Services — 2.0% | | | | | | | | |
The ADT Corp. | | | 5,694 | | | | 264,714 | |
Apollo Group, Inc. Class A (a) | | | 2,493 | | | | 52,154 | |
Automatic Data Processing, Inc. | | | 11,782 | | | | 671,692 | |
Equifax, Inc. | | | 2,982 | | | | 161,386 | |
H&R Block, Inc. | | | 6,778 | | | | 125,867 | |
Iron Mountain, Inc. | | | 4,095 | | | | 127,150 | |
MasterCard, Inc. Class A | | | 2,604 | | | | 1,279,293 | |
McKesson Corp. | | | 5,706 | | | | 553,254 | |
Moody’s Corp. | | | 4,809 | | | | 241,989 | |
Paychex, Inc. | | | 7,961 | | | | 247,905 | |
Quanta Services, Inc. (a) | | | 5,317 | | | | 145,101 | |
Robert Half International, Inc. | | | 3,562 | | | | 113,343 | |
Total System Services, Inc. | | | 3,866 | | | | 82,810 | |
Visa, Inc. Class A | | | 12,683 | | | | 1,922,489 | |
Western Union Co. | | | 14,484 | | | | 197,127 | |
| | | | | | | | |
| | | | | | | 6,186,274 | |
| | | | | | | | |
| Cosmetics & Personal Care — 1.9% | | | | | | | | |
Avon Products, Inc. | | | 10,505 | | | | 150,852 | |
Colgate-Palmolive Co. | | | 10,839 | | | | 1,133,109 | |
| | | | | | | | |
| | | Number of
Shares | | | Value | |
The Estee Lauder Cos., Inc. Class A | | | 5,813 | | | $ | 347,966 | |
The Procter & Gamble Co. | | | 66,485 | | | | 4,513,667 | |
| | | | | | | | |
| | | | | | | 6,145,594 | |
| | | | | | | | |
| Foods — 1.9% | | | | | | | | |
Campbell Soup Co. | | | 4,421 | | | | 154,249 | |
ConAgra Foods, Inc. | | | 9,856 | | | | 290,752 | |
Dean Foods Co. (a) | | | 4,462 | | | | 73,668 | |
General Mills, Inc. | | | 15,746 | | | | 636,296 | |
H.J. Heinz Co. | | | 7,734 | | | | 446,097 | |
The Hershey Co. | | | 3,638 | | | | 262,736 | |
Hormel Foods Corp. | | | 3,116 | | | | 97,250 | |
The J.M. Smucker Co. | | | 2,667 | | | | 230,002 | |
Kellogg Co. | | | 5,938 | | | | 331,637 | |
Kraft Foods Group, Inc. | | | 14,350 | | | | 652,495 | |
The Kroger Co. | | | 12,459 | | | | 324,183 | |
McCormick & Co., Inc. | | | 3,157 | | | | 200,564 | |
Mondelez International, Inc. Class A | | | 43,044 | | | | 1,096,331 | |
Safeway, Inc. | | | 5,928 | | | | 107,238 | |
Sysco Corp. | | | 14,221 | | | | 450,237 | |
Tyson Foods, Inc. Class A | | | 7,060 | | | | 136,964 | |
Whole Foods Market, Inc. | | | 4,162 | | | | 380,115 | |
| | | | | | | | |
| | | | | | | 5,870,814 | |
| | | | | | | | |
| Health Care – Products — 3.2% | | | | | | | | |
Baxter International, Inc. | | | 13,422 | | | | 894,711 | |
Becton, Dickinson & Co. | | | 4,817 | | | | 376,641 | |
Boston Scientific Corp. (a) | | | 33,510 | | | | 192,012 | |
C.R. Bard, Inc. | | | 1,837 | | | | 179,548 | |
CareFusion Corp. (a) | | | 5,532 | | | | 158,105 | |
Covidien PLC | | | 11,476 | | | | 662,624 | |
Edwards Lifesciences Corp. (a) | | | 2,854 | | | | 257,345 | |
Intuitive Surgical, Inc. (a) | | | 969 | | | | 475,169 | |
Johnson & Johnson | | | 67,435 | | | | 4,727,194 | |
Medtronic, Inc. | | | 24,519 | | | | 1,005,769 | |
St. Jude Medical, Inc. | | | 7,490 | | | | 270,689 | |
Stryker Corp. | | | 7,001 | | | | 383,795 | |
Varian Medical Systems, Inc. (a) | | | 2,605 | | | | 182,975 | |
Zimmer Holdings, Inc. | | | 4,211 | | | | 280,705 | |
| | | | | | | | |
| | | | | | | 10,047,282 | |
| | | | | | | | |
| Health Care – Services — 1.2% | | | | | | | | |
Aetna, Inc. | | | 8,087 | | | | 374,428 | |
Cigna Corp. | | | 6,916 | | | | 369,729 | |
Coventry Health Care, Inc. | | | 3,332 | | | | 149,373 | |
DaVita HealthCare Partners, Inc. (a) | | | 2,037 | | | | 225,150 | |
Humana, Inc. | | | 3,876 | | | | 266,010 | |
Laboratory Corporation of America Holdings (a) | | | 2,254 | | | | 195,241 | |
Quest Diagnostics, Inc. | | | 3,884 | | | | 226,321 | |
Tenet Healthcare Corp. (a) | | | 2,633 | | | | 85,493 | |
UnitedHealth Group, Inc. | | | 24,836 | | | | 1,347,105 | |
WellPoint, Inc. | | | 7,365 | | | | 448,676 | |
| | | | | | | | |
| | | | | | | 3,687,526 | |
| | | | | | | | |
68
The accompanying notes are an integral part of the financial statements.
MML Equity Index Fund – Portfolio of Investments (Continued)
| | | | | | | | |
| | | Number of
Shares | | | Value | |
| Household Products — 0.4% | | | | | | | | |
Avery Dennison Corp. | | | 2,324 | | | $ | 81,154 | |
Beam, Inc. | | | 3,897 | | | | 238,068 | |
The Clorox Co. | | | 3,209 | | | | 234,963 | |
Kimberly-Clark Corp. | | | 9,483 | | | | 800,649 | |
| | | | | | | | |
| | | | | | | 1,354,834 | |
| | | | | | | | |
| Pharmaceuticals — 5.6% | | | | | | | | |
Abbott Laboratories | | | 38,425 | | | | 2,516,838 | |
Allergan, Inc. | | | 7,461 | | | | 684,398 | |
AmerisourceBergen Corp. | | | 5,710 | | | | 246,558 | |
Bristol-Myers Squibb Co. | | | 40,155 | | | | 1,308,651 | |
Cardinal Health, Inc. | | | 8,244 | | | | 339,488 | |
DENTSPLY International, Inc. | | | 3,489 | | | | 138,199 | |
Eli Lilly & Co. | | | 24,773 | | | | 1,221,804 | |
Express Scripts Holding Co. (a) | | | 19,849 | | | | 1,071,846 | |
Forest Laboratories, Inc. (a) | | | 5,804 | | | | 204,997 | |
Gilead Sciences, Inc. (a) | | | 18,350 | | | | 1,347,808 | |
Hospira, Inc. (a) | | | 4,119 | | | | 128,678 | |
Mead Johnson Nutrition Co. | | | 4,941 | | | | 325,562 | |
Merck & Co., Inc. | | | 73,881 | | | | 3,024,688 | |
Mylan, Inc. (a) | | | 10,064 | | | | 276,559 | |
Patterson Cos., Inc. | | | 1,912 | | | | 65,448 | |
Perrigo Co. | | | 2,102 | | | | 218,671 | |
Pfizer, Inc. | | | 179,030 | | | | 4,490,072 | |
Watson Pharmaceuticals, Inc. (a) | | | 3,061 | | | | 263,246 | |
| | | | | | | | |
| | | | | | | 17,873,511 | |
| | | | | | | | |
| | | | | | | 68,275,819 | |
| | | | | | | | |
| Diversified — 0.0% | | | | | | | | |
| Holding Company – Diversified — 0.0% | | | | | |
Leucadia National Corp. | | | 4,867 | | | | 115,786 | |
| | | | | | | | |
| Energy — 10.6% | | | | | | | | |
| Coal — 0.1% | | | | | | | | |
CONSOL Energy, Inc. | | | 5,671 | | | | 182,039 | |
Peabody Energy Corp. | | | 6,442 | | | | 171,422 | |
| | | | | | | | |
| | | | | | | 353,461 | |
| | | | | | | | |
| Energy – Alternate Sources — 0.0% | | | | | | | | |
First Solar, Inc. (a) | | | 1,470 | | | | 45,394 | |
| | | | | | | | |
| Oil & Gas — 8.6% | | | | | | | | |
Anadarko Petroleum Corp. | | | 12,116 | | | | 900,340 | |
Apache Corp. | | | 9,484 | | | | 744,494 | |
Cabot Oil & Gas Corp. | | | 5,199 | | | | 258,598 | |
Chesapeake Energy Corp. | | | 12,416 | | | | 206,354 | |
Chevron Corp. | | | 47,590 | | | | 5,146,383 | |
ConocoPhillips | | | 29,457 | | | | 1,708,211 | |
Denbury Resources, Inc. (a) | | | 9,612 | | | | 155,714 | |
Devon Energy Corp. | | | 9,121 | | | | 474,657 | |
Diamond Offshore Drilling, Inc. | | | 1,690 | | | | 114,852 | |
Ensco PLC Class A | | | 5,713 | | | | 338,667 | |
EOG Resources, Inc. | | | 6,553 | | | | 791,537 | |
EQT Corp. | | | 3,578 | | | | 211,030 | |
| | | | | | | | |
| | | Number of
Shares | | | Value | |
Exxon Mobil Corp. | | | 110,899 | | | $ | 9,598,309 | |
Helmerich & Payne, Inc. | | | 2,640 | | | | 147,866 | |
Hess Corp. | | | 7,190 | | | | 380,782 | |
Marathon Oil Corp. | | | 17,108 | | | | 524,531 | |
Marathon Petroleum Corp. | | | 8,211 | | | | 517,293 | |
Murphy Oil Corp. | | | 4,443 | | | | 264,581 | |
Nabors Industries Ltd. (a) | | | 7,244 | | | | 104,676 | |
Newfield Exploration Co. (a) | | | 3,330 | | | | 89,177 | |
Noble Corp. | | | 6,116 | | | | 212,959 | |
Noble Energy, Inc. | | | 4,281 | | | | 435,549 | |
Occidental Petroleum Corp. | | | 19,645 | | | | 1,505,004 | |
Phillips 66 | | | 15,208 | | | | 807,545 | |
Pioneer Natural Resources Co. | | | 3,024 | | | | 322,328 | |
QEP Resources, Inc. | | | 4,370 | | | | 132,280 | |
Range Resources Corp. | | | 3,995 | | | | 251,006 | |
Rowan Cos. PLC Class A (a) | | | 3,023 | | | | 94,529 | |
Southwestern Energy Co. (a) | | | 8,598 | | | | 287,259 | |
Tesoro Corp. | | | 3,385 | | | | 149,109 | |
Valero Energy Corp. | | | 13,531 | | | | 461,678 | |
WPX Energy, Inc. (a) | | | 5,046 | | | | 75,085 | |
| | | | | | | | |
| | | | | | | 27,412,383 | |
| | | | | | | | |
| Oil & Gas Services — 1.5% | | | | | | | | |
Baker Hughes, Inc. | | | 10,609 | | | | 433,272 | |
Cameron International Corp. (a) | | | 6,063 | | | | 342,317 | |
FMC Technologies, Inc. (a) | | | 5,706 | | | | 244,388 | |
Halliburton Co. | | | 22,490 | | | | 780,178 | |
National Oilwell Varco, Inc. | | | 10,345 | | | | 707,081 | |
Schlumberger Ltd. | | | 32,329 | | | | 2,240,076 | |
| | | | | | | | |
| | | | | | | 4,747,312 | |
| | | | | | | | |
| Pipelines — 0.4% | | | | | | | | |
ONEOK, Inc. | | | 4,868 | | | | 208,107 | |
Spectra Energy Corp. | | | 16,186 | | | | 443,172 | |
The Williams Cos., Inc. | | | 16,316 | | | | 534,186 | |
| | | | | | | | |
| | | | | | | 1,185,465 | |
| | | | | | | | |
| | | | | | | 33,744,015 | |
| | | | | | | | |
| Financial — 14.9% | | | | | | | | |
| Banks — 4.4% | | | | | | | | |
Bank of America Corp. | | | 262,163 | | | | 3,041,091 | |
Bank of New York Mellon Corp. | | | 28,227 | | | | 725,434 | |
BB&T Corp. | | | 16,917 | | | | 492,454 | |
Capital One Financial Corp. | | | 14,085 | | | | 815,944 | |
Comerica, Inc. | | | 4,497 | | | | 136,439 | |
Fifth Third Bancorp | | | 22,139 | | | | 336,292 | |
First Horizon National Corp. | | | 6,141 | | | | 60,857 | |
Huntington Bancshares, Inc. | | | 21,470 | | | | 137,193 | |
KeyCorp | | | 22,108 | | | | 186,149 | |
M&T Bank Corp. | | | 3,000 | | | | 295,410 | |
Northern Trust Corp. | | | 5,477 | | | | 274,726 | |
PNC Financial Services Group, Inc. | | | 12,802 | | | | 746,485 | |
Regions Financial Corp. | | | 34,703 | | | | 247,085 | |
State Street Corp. | | | 11,304 | | | | 531,401 | |
69
The accompanying notes are an integral part of the financial statements.
MML Equity Index Fund – Portfolio of Investments (Continued)
| | | | | | | | |
| | | Number of
Shares | | | Value | |
SunTrust Banks, Inc. | | | 13,260 | | | $ | 375,921 | |
U.S. Bancorp | | | 45,530 | | | | 1,454,228 | |
Wells Fargo & Co. | | | 119,060 | | | | 4,069,471 | |
Zions Bancorp | | | 4,655 | | | | 99,617 | |
| | | | | | | | |
| | | | | | | 14,026,197 | |
| | | | | | | | |
| Diversified Financial — 4.5% | | | | | | | | |
American Express Co. | | | 23,666 | | | | 1,360,322 | |
Ameriprise Financial, Inc. | | | 5,021 | | | | 314,465 | |
BlackRock, Inc. | | | 3,050 | | | | 630,466 | |
The Charles Schwab Corp. | | | 26,601 | | | | 381,990 | |
Citigroup, Inc. | | | 71,342 | | | | 2,822,290 | |
CME Group, Inc. | | | 7,428 | | | | 376,674 | |
Discover Financial Services | | | 12,246 | | | | 472,083 | |
E*TRADE Financial Corp. (a) | | | 6,419 | | | | 57,450 | |
Franklin Resources, Inc. | | | 3,335 | | | | 419,210 | |
The Goldman Sachs Group, Inc. | | | 10,737 | | | | 1,369,612 | |
IntercontinentalExchange, Inc. (a) | | | 1,801 | | | | 222,982 | |
Invesco Ltd. | | | 10,714 | | | | 279,528 | |
JP Morgan Chase & Co. | | | 92,368 | | | | 4,061,421 | |
Legg Mason, Inc. | | | 2,713 | | | | 69,778 | |
Morgan Stanley | | | 33,483 | | | | 640,195 | |
The NASDAQ OMX Group, Inc. | | | 2,940 | | | | 73,529 | |
NYSE Euronext | | | 5,950 | | | | 187,663 | |
SLM Corp. | | | 11,383 | | | | 194,991 | |
T. Rowe Price Group, Inc. | | | 6,157 | | | | 401,005 | |
| | | | | | | | |
| | | | | | | 14,335,654 | |
| | | | | | | | |
| Insurance — 3.9% | | | | | | | | |
ACE Ltd. | | | 8,228 | | | | 656,594 | |
Aflac, Inc. | | | 11,373 | | | | 604,134 | |
The Allstate Corp. | | | 11,686 | | | | 469,427 | |
American International Group, Inc. (a) | | | 35,793 | | | | 1,263,493 | |
Aon PLC | | | 7,824 | | | | 435,014 | |
Assurant, Inc. | | | 1,851 | | | | 64,230 | |
Berkshire Hathaway, Inc. Class B (a) | | | 44,343 | | | | 3,977,567 | |
The Chubb Corp. | | | 6,324 | | | | 476,324 | |
Cincinnati Financial Corp. | | | 3,628 | | | | 142,072 | |
Genworth Financial, Inc. Class A (a) | | | 12,148 | | | | 91,231 | |
The Hartford Financial Services Group, Inc. | | | 10,535 | | | | 236,405 | |
Lincoln National Corp. | | | 6,756 | | | | 174,980 | |
Loews Corp. | | | 7,574 | | | | 308,641 | |
Marsh & McLennan Cos., Inc. | | | 13,118 | | | | 452,177 | |
MetLife, Inc. | | | 26,569 | | | | 875,183 | |
Principal Financial Group, Inc. | | | 6,544 | | | | 186,635 | |
The Progressive Corp. | | | 13,478 | | | | 284,386 | |
Prudential Financial, Inc. | | | 11,292 | | | | 602,202 | |
Torchmark Corp. | | | 2,379 | | | | 122,923 | |
The Travelers Cos., Inc. | | | 9,219 | | | | 662,109 | |
Unum Group | | | 6,469 | | | | 134,685 | |
XL Group PLC | | | 7,359 | | | | 184,417 | |
| | | | | | | | |
| | | | | | | 12,404,829 | |
| | | | | | | | |
| | | | | | | | |
| | | Number of
Shares | | | Value | |
| Real Estate — 0.0% | | | | | | | | |
CBRE Group, Inc. (a) | | | 7,539 | | | $ | 150,026 | |
| | | | | | | | |
| Real Estate Investment Trusts (REITS) — 2.0% | | | | | |
American Tower Corp. | | | 9,587 | | | | 740,788 | |
Apartment Investment & Management Co. Class A | | | 3,688 | | | | 99,797 | |
AvalonBay Communities, Inc. | | | 2,778 | | | | 376,669 | |
Boston Properties, Inc. | | | 3,648 | | | | 385,995 | |
Equity Residential | | | 7,757 | | | | 439,589 | |
HCP, Inc. | | | 10,936 | | | | 494,089 | |
Health Care REIT, Inc. | | | 6,328 | | | | 387,843 | |
Host Hotels & Resorts, Inc. | | | 17,703 | | | | 277,406 | |
Kimco Realty Corp. | | | 9,966 | | | | 192,543 | |
Prologis, Inc. | | | 11,137 | | | | 406,389 | |
Public Storage | | | 3,497 | | | | 506,925 | |
Simon Property Group, Inc. | | | 7,547 | | | | 1,193,105 | |
Ventas, Inc. | | | 7,158 | | | | 463,266 | |
Vornado Realty Trust | | | 4,083 | | | | 326,967 | |
| | | | | | | | |
| | | | | | | 6,291,371 | |
| | | | | | | | |
| Savings & Loans — 0.1% | | | | | | | | |
Hudson City Bancorp, Inc. | | | 11,849 | | | | 96,332 | |
People’s United Financial, Inc. | | | 8,134 | | | | 98,340 | |
| | | | | | | | |
| | | | | | | 194,672 | |
| | | | | | | | |
| | | | | | | 47,402,749 | |
| | | | | | | | |
| Industrial — 10.0% | | | | | | | | |
| Aerospace & Defense — 1.7% | | | | | | | | |
The Boeing Co. | | | 16,542 | | | | 1,246,605 | |
General Dynamics Corp. | | | 8,036 | | | | 556,654 | |
L-3 Communications Holdings, Inc. | | | 2,245 | | | | 172,012 | |
Lockheed Martin Corp. | | | 6,544 | | | | 603,946 | |
Northrop Grumman Corp. | | | 5,951 | | | | 402,169 | |
Raytheon Co. | | | 8,047 | | | | 463,185 | |
Rockwell Collins, Inc. | | | 3,426 | | | | 199,290 | |
United Technologies Corp. | | | 20,490 | | | | 1,680,385 | |
| | | | | | | | |
| | | | | | | 5,324,246 | |
| | | | | | | | |
| Building Materials — 0.1% | | | | | | | | |
Masco Corp. | | | 8,649 | | | | 144,092 | |
| | | | | | | | |
| Electrical Components & Equipment — 0.3% | | | | | |
Emerson Electric Co. | | | 17,648 | | | | 934,638 | |
Molex, Inc. | | | 3,305 | | | | 90,326 | |
| | | | | | | | |
| | | | | | | 1,024,964 | |
| | | | | | | | |
| Electronics — 0.5% | | | | | | | | |
Agilent Technologies, Inc. | | | 8,592 | | | | 351,756 | |
Amphenol Corp. Class A | | | 3,962 | | | | 256,341 | |
FLIR Systems, Inc. | | | 3,803 | | | | 84,845 | |
Garmin Ltd. | | | 2,647 | | | | 108,051 | |
Jabil Circuit, Inc. | | | 4,524 | | | | 87,268 | |
PerkinElmer, Inc. | | | 2,764 | | | | 87,729 | |
70
The accompanying notes are an integral part of the financial statements.
MML Equity Index Fund – Portfolio of Investments (Continued)
| | | | | | | | |
| | | Number of
Shares | | | Value | |
TE Connectivity Ltd. | | | 10,316 | | | $ | 382,930 | |
Waters Corp. (a) | | | 2,091 | | | | 182,168 | |
| | | | | | | | |
| | | | | | | 1,541,088 | |
| | | | | | | | |
| Engineering & Construction — 0.1% | | | | | |
Fluor Corp. | | | 3,979 | | | | 233,727 | |
Jacobs Engineering Group, Inc. (a) | | | 3,141 | | | | 133,712 | |
| | | | | | | | |
| | | | | | | 367,439 | |
| | | | | | | | |
| Environmental Controls — 0.2% | | | | | | | | |
Republic Services, Inc. | | | 7,432 | | | | 217,981 | |
Stericycle, Inc. (a) | | | 2,101 | | | | 195,960 | |
Waste Management, Inc. | | | 10,526 | | | | 355,147 | |
| | | | | | | | |
| | | | | | | 769,088 | |
| | | | | | | | |
| Hand & Machine Tools — 0.1% | | | | | | | | |
Snap-on, Inc. | | | 1,396 | | | | 110,270 | |
Stanley Black & Decker, Inc. | | | 4,078 | | | | 301,650 | |
| | | | | | | | |
| | | | | | | 411,920 | |
| | | | | | | | |
| Health Care – Services — 0.2% | | | | | | | | |
Thermo Fisher Scientific, Inc. | | | 8,712 | | | | 555,651 | |
| | | | | | | | |
| Machinery – Construction & Mining — 0.6% | | | | | |
Caterpillar, Inc. | | | 15,853 | | | | 1,420,112 | |
Ingersoll-Rand PLC | | | 6,715 | | | | 322,051 | |
Joy Global, Inc. | | | 2,652 | | | | 169,145 | |
| | | | | | | | |
| | | | | | | 1,911,308 | |
| | | | | | | | |
| Machinery – Diversified — 0.7% | | | | | | | | |
Cummins, Inc. | | | 4,300 | | | | 465,905 | |
Deere & Co. | | | 9,504 | | | | 821,336 | |
Flowserve Corp. | | | 1,209 | | | | 177,481 | |
Rockwell Automation, Inc. | | | 3,370 | | | | 283,046 | |
Roper Industries, Inc. | | | 2,409 | | | | 268,556 | |
Xylem, Inc. | | | 4,482 | | | | 121,462 | |
| | | | | | | | |
| | | | | | | 2,137,786 | |
| | | | | | | | |
| Manufacturing — 3.7% | | | | | | | | |
3M Co. | | | 15,447 | | | | 1,434,254 | |
Danaher Corp. | | | 14,177 | | | | 792,494 | |
Dover Corp. | | | 4,389 | | | | 288,401 | |
Eaton Corp. PLC | | | 11,280 | | | | 611,376 | |
General Electric Co. | | | 254,896 | | | | 5,350,267 | |
Honeywell International, Inc. | | | 19,088 | | | | 1,211,516 | |
Illinois Tool Works, Inc. | | | 10,335 | | | | 628,471 | |
Leggett & Platt, Inc. | | | 3,453 | | | | 93,991 | |
Pall Corp. | | | 2,703 | | | | 162,883 | |
Parker Hannifin Corp. | | | 3,622 | | | | 308,087 | |
Pentair Ltd. | | | 5,167 | | | | 253,958 | |
Textron, Inc. | | | 6,914 | | | | 171,398 | |
Tyco International Ltd. | | | 11,431 | | | | 334,357 | |
| | | | | | | | |
| | | | | | | 11,641,453 | |
| | | | | | | | |
| Metal Fabricate & Hardware — 0.2% | | | | | |
Precision Castparts Corp. | | | 3,523 | | | | 667,326 | |
| | | | | | | | |
| | | | | | | | |
| | | Number of
Shares | | | Value | |
| Packaging & Containers — 0.1% | | | | | | | | |
Ball Corp. | | | 3,628 | | | $ | 162,353 | |
Bemis Co., Inc. | | | 2,592 | | | | 86,728 | |
Owens-Illinois, Inc. (a) | | | 3,952 | | | | 84,059 | |
Sealed Air Corp. | | | 4,840 | | | | 84,749 | |
| | | | | | | | |
| | | | | | | 417,889 | |
| | | | | | | | |
| Transportation — 1.5% | | | | | | | | |
C.H. Robinson Worldwide, Inc. | | | 3,976 | | | | 251,363 | |
CSX Corp. | | | 25,164 | | | | 496,486 | |
Expeditors International of Washington, Inc. | | | 5,194 | | | | 205,423 | |
FedEx Corp. | | | 7,067 | | | | 648,185 | |
Norfolk Southern Corp. | | | 7,737 | | | | 478,456 | |
Ryder System, Inc. | | | 1,289 | | | | 64,360 | |
Union Pacific Corp. | | | 11,402 | | | | 1,433,459 | |
United Parcel Service, Inc. Class B | | | 17,400 | | | | 1,282,902 | |
| | | | | | | | |
| | | | | | | 4,860,634 | |
| | | | | | | | |
| | | | | | | 31,774,884 | |
| | | | | | | | |
| Technology — 12.7% | | | | | | | | |
| Commercial Services — 0.0% | | | | | | | | |
SAIC, Inc. | | | 6,758 | | | | 76,501 | |
| | | | | | | | |
| Computers — 7.1% | | | | | | | | |
Accenture PLC Class A | | | 15,542 | | | | 1,033,543 | |
Apple, Inc. | | | 22,864 | | | | 12,187,198 | |
Cognizant Technology Solutions Corp. Class A (a) | | | 7,243 | | | | 536,344 | |
Computer Sciences Corp. | | | 3,657 | | | | 146,463 | |
Dell, Inc. | | | 35,303 | | | | 357,619 | |
EMC Corp. (a) | | | 51,281 | | | | 1,297,409 | |
Hewlett-Packard Co. | | | 47,643 | | | | 678,913 | |
International Business Machines Corp. | | | 25,828 | | | | 4,947,353 | |
NetApp, Inc. (a) | | | 8,803 | | | | 295,341 | |
SanDisk Corp. (a) | | | 5,826 | | | | 253,781 | |
Seagate Technology PLC | | | 8,095 | | | | 246,736 | |
Teradata Corp. (a) | | | 4,033 | | | | 249,602 | |
Western Digital Corp. | | | 5,286 | | | | 224,602 | |
| | | | | | | | |
| | | | | | | 22,454,904 | |
| | | | | | | | |
| Office Equipment/Supplies — 0.1% | | | | | | | | |
Pitney Bowes, Inc. | | | 4,479 | | | | 47,657 | |
Xerox Corp. | | | 30,665 | | | | 209,135 | |
| | | | | | | | |
| | | | | | | 256,792 | |
| | | | | | | | |
| Semiconductors — 1.9% | | | | | | | | |
Advanced Micro Devices, Inc. (a) | | | 14,570 | | | | 34,968 | |
Altera Corp. | | | 7,659 | | | | 263,776 | |
Analog Devices, Inc. | | | 7,398 | | | | 311,160 | |
Applied Materials, Inc. | | | 28,920 | | | | 330,845 | |
Broadcom Corp. Class A (a) | | | 12,745 | | | | 423,261 | |
Intel Corp. | | | 120,779 | | | | 2,491,671 | |
KLA-Tencor Corp. | | | 4,131 | | | | 197,296 | |
The accompanying notes are an integral part of the financial statements.
71
MML Equity Index Fund – Portfolio of Investments (Continued)
| | | | | | | | |
| | | Number of
Shares | | | Value | |
Lam Research Corp. (a) | | | 4,145 | | | $ | 149,759 | |
Linear Technology Corp. | | | 5,739 | | | | 196,848 | |
LSI Corp. (a) | | | 12,878 | | | | 91,176 | |
Microchip Technology, Inc. | | | 4,855 | | | | 158,224 | |
Micron Technology, Inc. (a) | | | 24,072 | | | | 152,857 | |
NVIDIA Corp. | | | 15,223 | | | | 187,091 | |
Teradyne, Inc. (a) | | | 4,446 | | | | 75,093 | |
Texas Instruments, Inc. | | | 27,207 | | | | 841,785 | |
Xilinx, Inc. | | | 6,451 | | | | 231,591 | |
| | | | | | | | |
| | | | | | | 6,137,401 | |
| | | | | | | | |
| Software — 3.6% | | | | | | | | |
Adobe Systems, Inc. (a) | | | 11,945 | | | | 450,087 | |
Autodesk, Inc. (a) | | | 5,346 | | | | 188,981 | |
BMC Software, Inc. (a) | | | 3,402 | | | | 134,923 | |
CA, Inc. | | | 8,356 | | | | 183,665 | |
Cerner Corp. (a) | | | 3,495 | | | | 271,352 | |
Citrix Systems, Inc. (a) | | | 4,536 | | | | 298,242 | |
The Dun & Bradstreet Corp. | | | 1,099 | | | | 86,436 | |
Electronic Arts, Inc. (a) | | | 7,135 | | | | 103,671 | |
Fidelity National Information Services, Inc. | | | 5,940 | | | | 206,771 | |
Fiserv, Inc. (a) | | | 3,221 | | | | 254,556 | |
Intuit, Inc. | | | 6,840 | | | | 406,980 | |
Microsoft Corp. | | | 184,094 | | | | 4,920,833 | |
Oracle Corp. | | | 91,349 | | | | 3,043,749 | |
Red Hat, Inc. (a) | | | 4,782 | | | | 253,255 | |
Salesforce.com, Inc. (a) | | | 3,169 | | | | 532,709 | |
| | | | | | | | |
| | | | | | | 11,336,210 | |
| | | | | | | | |
| | | | | | | 40,261,808 | |
| | | | | | | | |
| Utilities — 3.4% | | | | | | | | |
| Electric — 3.0% | | | | | | | | |
The AES Corp. | | | 15,124 | | | | 161,827 | |
Ameren Corp. | | | 6,063 | | | | 186,255 | |
American Electric Power Co., Inc. | | | 11,749 | | | | 501,447 | |
CenterPoint Energy, Inc. | | | 10,420 | | | | 200,585 | |
CMS Energy Corp. | | | 6,515 | | | | 158,836 | |
Consolidated Edison, Inc. | | | 7,081 | | | | 393,279 | |
Dominion Resources, Inc. | | | 13,917 | | | | 720,901 | |
DTE Energy Co. | | | 4,215 | | | | 253,111 | |
Duke Energy Corp. | | | 17,077 | | | | 1,089,513 | |
Edison International | | | 7,882 | | | | 356,188 | |
Entergy Corp. | | | 4,356 | | | | 277,695 | |
Exelon Corp. | | | 20,672 | | | | 614,785 | |
FirstEnergy Corp. | | | 10,090 | | | | 421,358 | |
Integrys Energy Group, Inc. | | | 1,961 | | | | 102,403 | |
NextEra Energy, Inc. | | | 10,266 | | | | 710,305 | |
Northeast Utilities | | | 7,728 | | | | 302,010 | |
NRG Energy, Inc. | | | 7,802 | | | | 179,368 | |
Pepco Holdings, Inc. | | | 5,535 | | | | 108,541 | |
PG&E Corp. | | | 10,563 | | | | 424,421 | |
Pinnacle West Capital Corp. | | | 2,663 | | | | 135,760 | |
PPL Corp. | | | 13,994 | | | | 400,648 | |
Public Service Enterprise Group, Inc. | | | 12,178 | | | | 372,647 | |
SCANA Corp. | | | 3,190 | | | | 145,592 | |
| | | | | | | | |
| | | Number of
Shares | | | Value | |
The Southern Co. | | | 21,224 | | | $ | 908,600 | |
TECO Energy, Inc. | | | 4,853 | | | | 81,336 | |
Wisconsin Energy Corp. | | | 5,486 | | | | 202,159 | |
Xcel Energy, Inc. | | | 11,978 | | | | 319,932 | |
| | | | | | | | |
| | | | | | | 9,729,502 | |
| | | | | | | | |
| Gas — 0.2% | | | | | | | | |
AGL Resources, Inc. | | | 2,947 | | | | 117,791 | |
NiSource, Inc. | | | 7,510 | | | | 186,924 | |
Sempra Energy | | | 5,468 | | | | 387,900 | |
| | | | | | | | |
| | | | | | | 692,615 | |
| | | | | | | | |
| Pipelines — 0.2% | | | | | | | | |
Kinder Morgan, Inc. | | | 15,342 | | | | 542,033 | |
| | | | | | | | |
| | | | | | | 10,964,150 | |
| | | | | | | | |
| | |
TOTAL COMMON STOCK
(Cost $232,473,262) | | | | | | | 309,696,594 | |
| | | | | | | | |
| | |
TOTAL EQUITIES
(Cost $232,473,262) | | | | | | | 309,696,594 | |
| | | | | | | | |
| | |
TOTAL LONG-TERM INVESTMENTS
(Cost $232,473,262) | | | | | | | 309,696,594 | |
| | | | | | | | |
| | |
| | | Principal
Amount | | | | |
| |
| SHORT-TERM INVESTMENTS — 2.4% | | | | | |
| Repurchase Agreement — 2.2% | | | | | | | | |
State Street Bank & Trust Co. Repurchase Agreement, dated 12/31/12, 0.010%, due 1/02/13 (b) | | $ | 7,119,973 | | | | 7,119,973 | |
| | | | | | | �� | |
| U.S. Treasury Bills — 0.2% | | | | | | | | |
U.S. Treasury Bill (c)
0.000% 4/25/13 | | | 465,000 | | | | 464,794 | |
| | | | | | | | |
| | |
TOTAL SHORT-TERM INVESTMENTS
(Cost $7,584,767) | | | | | | | 7,584,767 | |
| | | | | | | | |
| | |
TOTAL INVESTMENTS — 99.8%
(Cost $240,058,029) (d) | | | | | | | 317,281,361 | |
| | |
| Other Assets/(Liabilities) — 0.2% | | | | | | | 697,577 | |
| | | | | | | | |
| | |
| NET ASSETS — 100.0% | | | | | | $ | 317,978,938 | |
| | | | | | | | |
Notes to Portfolio of Investments
| (a) | Non-income producing security. |
| (b) | Maturity value of $7,119,977. Collateralized by U.S. Government Agency obligations with a rate of 3.000%, maturity date of 12/01/26, and an aggregate market value, including accrued interest, of $7,262,862. |
| (c) | A portion of this security is held as collateral for open futures contracts. (Note 2). |
| (d) | See Note 6 for aggregate cost for federal tax purposes. |
72
The accompanying notes are an integral part of the financial statements.
MML Focused Equity Fund – Portfolio of Investments
December 31, 2012
| | | | | | | | |
| | | Number of
Shares | | | Value | |
| EQUITIES — 92.3% | |
|
| COMMON STOCK — 92.3% | |
| Consumer, Cyclical — 35.7% | |
| Automotive & Parts — 6.2% | |
Delphi Automotive PLC (a) | | | 221,000 | | | $ | 8,453,250 | |
| | | | | | | | |
| Entertainment — 5.5% | |
Penn National Gaming, Inc. (a) | | | 154,500 | | | | 7,587,495 | |
| | | | | | | | |
| Leisure Time — 4.7% | |
Carnival Corp. | | | 174,000 | | | | 6,397,980 | |
| | | | | | | | |
| Lodging — 4.9% | |
Starwood Hotels & Resorts Worldwide, Inc. | | | 117,000 | | | | 6,711,120 | |
| | | | | | | | |
| Retail — 10.4% | |
CarMax, Inc. (a) | | | 205,000 | | | | 7,695,700 | |
Tiffany & Co. | | | 115,000 | | | | 6,594,100 | |
| | | | | | | | |
| | | | | | | 14,289,800 | |
| | | | | | | | |
| Textiles — 4.0% | |
Fifth & Pacific Cos., Inc. (a) | | | 440,000 | | | | 5,478,000 | |
| | | | | | | | |
| | | | | | | 48,917,645 | |
| | | | | | | | |
| Consumer, Non-cyclical — 5.0% | |
| Commercial Services — 5.0% | |
Visa, Inc. Class A | | | 45,000 | | | | 6,821,100 | |
| | | | | | | | |
| Energy — 10.3% | |
| Oil & Gas — 2.7% | |
Apache Corp. | | | 47,000 | | | | 3,689,500 | |
| | | | | | | | |
| Oil & Gas Services — 7.6% | |
Dresser-Rand Group, Inc. (a) | | | 87,000 | | | | 4,884,180 | |
National Oilwell Varco, Inc. | | | 81,500 | | | | 5,570,525 | |
| | | | | | | | |
| | | | | | | 10,454,705 | |
| | | | | | | | |
| | | | | | | 14,144,205 | |
| | | | | | | | |
| Financial — 19.1% | |
| Banks — 5.0% | |
Wells Fargo & Co. | | | 203,500 | | | | 6,955,630 | |
| | | | | | | | |
| Diversified Financial — 9.4% | |
Franklin Resources, Inc. | | | 54,000 | | | | 6,787,800 | |
JP Morgan Chase & Co. | | | 138,000 | | | | 6,067,860 | |
| | | | | | | | |
| | | | | | | 12,855,660 | |
| | | | | | | | |
| Insurance — 4.7% | |
American International Group, Inc. (a) | | | 183,000 | | | | 6,459,900 | |
| | | | | | | | |
| | | | | | | 26,271,190 | |
| | | | | | | | |
| Industrial — 8.4% | |
| Aerospace & Defense — 4.1% | |
The Boeing Co. | | | 75,000 | | | | 5,652,000 | |
| | | | | | | | |
| | | | | | | | |
| | | Number of
Shares | | | Value | |
| Manufacturing — 4.3% | |
Illinois Tool Works, Inc. | | | 96,000 | | | $ | 5,837,760 | |
| | | | | | | | |
| | | | | | | 11,489,760 | |
| | | | | | | | |
| Technology — 13.8% | |
| Computers — 3.2% | |
Diebold, Inc. | | | 145,500 | | | | 4,453,755 | |
| | | | | | | | |
| Semiconductors — 10.6% | |
Applied Materials, Inc. | | | 604,500 | | | | 6,915,480 | |
Intel Corp. | | | 367,500 | | | | 7,581,525 | |
| | | | | | | | |
| | | | | | | 14,497,005 | |
| | | | | | | | |
| | | | | | | 18,950,760 | |
| | | | | | | | |
| | |
TOTAL COMMON STOCK
(Cost $111,982,612) | | | | | | | 126,594,660 | |
| | | | | | | | |
| | |
TOTAL EQUITIES
(Cost $111,982,612) | | | | | | | 126,594,660 | |
| | | | | | | | |
| | |
TOTAL LONG-TERM INVESTMENTS
(Cost $111,982,612) | | | | | | | 126,594,660 | |
| | | | | | | | |
| | |
| | | Principal
Amount | | | | |
| SHORT-TERM INVESTMENTS — 7.8% | |
| Repurchase Agreement — 7.8% | |
State Street Bank & Trust Co. Repurchase Agreement, dated 12/31/12, 0.010%, due 1/02/13 (b) | | $ | 10,598,493 | | | | 10,598,493 | |
| | | | | | | | |
| | |
TOTAL SHORT-TERM INVESTMENTS
(Cost $10,598,493) | | | | | | | 10,598,493 | |
| | | | | | | | |
| | |
TOTAL INVESTMENTS — 100.1%
(Cost $122,581,105) (c) | | | | | | | 137,193,153 | |
| | |
| Other Assets/(Liabilities) — (0.1)% | | | | | | | (70,066 | ) |
| | | | | | | | |
| | |
| NET ASSETS — 100.0% | | | | | | $ | 137,123,087 | |
| | | | | | | | |
Notes to Portfolio of Investments
| (a) | Non-income producing security. |
| (b) | Maturity value of $10,598,499. Collateralized by U.S. Government Agency obligations with a rate of 3.000%, maturity date of 12/01/26, and an aggregate market value, including accrued interest, of $10,811,095. |
| (c) | See Note 6 for aggregate cost for federal tax purposes. |
The accompanying notes are an integral part of the financial statements.
73
MML Foreign Fund – Portfolio of Investments
December 31, 2012
| | | | | | | | |
| | | Number of
Shares | | | Value | |
| EQUITIES — 97.8% | |
|
| COMMON STOCK — 96.7% | |
| Basic Materials — 3.3% | |
| Chemicals — 2.4% | |
Akzo Nobel NV | | | 99,020 | | | $ | 6,534,035 | |
Lonza Group AG Registered (a) | | | 36,480 | | | | 1,973,115 | |
| | | | | | | | |
| | | | | | | 8,507,150 | |
| | | | | | | | |
| Iron & Steel — 0.9% | |
POSCO ADR (Republic of Korea) (b) | | | 41,461 | | | | 3,406,021 | |
| | | | | | | | |
| | | | | | | 11,913,171 | |
| | | | | | | | |
| Communications — 14.3% | |
| Internet — 1.4% | |
Trend Micro, Inc. (b) | | | 168,900 | | | | 5,097,168 | |
| | | | | | | | |
| Media — 2.0% | |
Reed Elsevier NV | | | 277,543 | | | | 4,112,073 | |
Vivendi SA | | | 141,262 | | | | 3,181,173 | |
| | | | | | | | |
| | | | | | | 7,293,246 | |
| | | | | | | | |
| Telecommunications — 10.9% | |
China Mobile Ltd. | | | 291,000 | | | | 3,408,731 | |
China Telecom Corp. Ltd. Class H | | | 9,921,643 | | | | 5,558,657 | |
France Telecom SA | | | 198,787 | | | | 2,226,137 | |
Singapore Telecommunications Ltd. | | | 1,849,000 | | | | 5,028,458 | |
Singapore Telecommunications Ltd. | | | 239,000 | | | | 648,092 | |
Telefonaktiebolaget LM Ericsson Sponsored ADR (Sweden) | | | 342,210 | | | | 3,456,321 | |
Telefonica SA Sponsored ADR (Spain) (a) (b) | | | 282,075 | | | | 3,805,192 | |
Telekom Austria AG | | | 132,281 | | | | 1,001,008 | |
Telenor ASA | | | 399,566 | | | | 8,117,864 | |
Vodafone Group PLC Sponsored ADR (United Kingdom) | | | 240,423 | | | | 6,056,255 | |
| | | | | | | | |
| | | | | | | 39,306,715 | |
| | | | | | | | |
| | | | | | | 51,697,129 | |
| | | | | | | | |
| Consumer, Cyclical — 8.4% | |
| Airlines — 0.6% | |
Deutsche Lufthansa AG | | | 124,530 | | | | 2,340,720 | |
| | | | | | | | |
| Auto Manufacturers — 2.5% | |
Nissan Motor Co. Ltd. | | | 412,870 | | | | 3,918,734 | |
Toyota Motor Corp. Sponsored ADR (Japan) | | | 55,520 | | | | 5,177,240 | |
| | | | | | | | |
| | | | | | | 9,095,974 | |
| | | | | | | | |
| Automotive & Parts — 1.6% | |
Cie Generale des Etablissements Michelin Class B | | | 59,760 | | | | 5,665,425 | |
| | | | | | | | |
| Distribution & Wholesale — 1.2% | |
ITOCHU Corp. | | | 403,800 | | | | 4,262,462 | |
| | | | | | | | |
| | | | | | | | |
| | | Number of
Shares | | | Value | |
| Retail — 2.5% | |
Kingfisher PLC | | | 964,114 | | | $ | 4,453,134 | |
Marks & Spencer Group PLC | | | 750,330 | | | | 4,678,084 | |
| | | | | | | | |
| | | | | | | 9,131,218 | |
| | | | | | | | |
| | | | | | | 30,495,799 | |
| | | | | | | | |
| Consumer, Non-cyclical — 15.8% | |
| Commercial Services — 2.5% | |
Adecco SA (a) | | | 37,100 | | | | 1,966,512 | |
G4S PLC | | | 750,040 | | | | 3,131,912 | |
Randstad Holding NV | | | 102,493 | | | | 3,783,437 | |
| | | | | | | | |
| | | | | | | 8,881,861 | |
| | | | | | | | |
| Foods — 2.7% | |
Nestle SA | | | 28,200 | | | | 1,837,910 | |
Tesco PLC | | | 964,140 | | | | 5,296,327 | |
Unilever PLC | | | 71,207 | | | | 2,702,863 | |
| | | | | | | | |
| | | | | | | 9,837,100 | |
| | | | | | | | |
| Pharmaceuticals — 10.6% | |
Bayer AG | | | 73,960 | | | | 7,023,429 | |
GlaxoSmithKline PLC | | | 274,884 | | | | 5,968,167 | |
Merck KGaA | | | 35,150 | | | | 4,637,617 | |
Novartis AG | | | 73,150 | | | | 4,631,237 | |
Roche Holding AG | | | 33,520 | | | | 6,828,859 | |
Sanofi | | | 101,218 | | | | 9,599,031 | |
| | | | | | | | |
| | | | | | | 38,688,340 | |
| | | | | | | | |
| | | | | | | 57,407,301 | |
| | | | | | | | |
| Diversified — 0.7% | |
| Holding Company – Diversified — 0.7% | |
Hutchison Whampoa Ltd. | | | 224,291 | | | | 2,379,347 | |
| | | | | | | | |
| Energy — 10.8% | |
| Oil & Gas — 10.4% | |
BP PLC | | | 468,264 | | | | 3,244,489 | |
ENI SpA | | | 236,535 | | | | 5,835,210 | |
Petroleo Brasileiro SA Sponsored ADR (Brazil) | | | 169,970 | | | | 3,280,421 | |
Repsol YPF SA | | | 136,978 | | | | 2,813,071 | |
Royal Dutch Shell PLC Class A | | | 2,447 | | | | 86,464 | |
Royal Dutch Shell PLC Class B | | | 188,304 | | | | 6,664,520 | |
Sasol Ltd. Sponsored ADR (South Africa) | | | 33,100 | | | | 1,432,899 | |
StatoilHydro ASA | | | 229,020 | | | | 5,747,046 | |
Talisman Energy, Inc. (b) | | | 294,400 | | | | 3,329,647 | |
Total SA | | | 100,112 | | | | 5,181,551 | |
| | | | | | | | |
| | | | | | | 37,615,318 | |
| | | | | | | | |
| Oil & Gas Services — 0.4% | | | | | | | | |
SBM Offshore NV (a) | | | 116,456 | | | | 1,650,582 | |
| | | | | | | | |
| | | | | | | 39,265,900 | |
| | | | | | | | |
The accompanying notes are an integral part of the financial statements.
74
MML Foreign Fund – Portfolio of Investments (Continued)
| | | | | | | | |
| | | Number of
Shares | | | Value | |
| Financial — 24.2% | | | | | | | | |
| Banks — 11.6% | | | | | | | | |
BNP Paribas | | | 128,330 | | | $ | 7,233,597 | |
Credit Agricole SA (a) | | | 207,090 | | | | 1,681,383 | |
DBS Group Holdings, Ltd. | | | 573,479 | | | | 7,020,143 | |
HSBC Holdings PLC | | | 668,000 | | | | 7,091,304 | |
ICICI Bank Ltd. Sponsored ADR (India) | | | 84,850 | | | | 3,700,308 | |
Intesa Sanpaolo SpA | | | 862,040 | | | | 1,491,332 | |
KB Financial Group, Inc. Sponsored ADR (Republic of Korea) (a) | | �� | 80,670 | | | | 2,896,053 | |
Lloyds Banking Group PLC (a) | | | 8,389,340 | | | | 6,722,192 | |
Nordea Bank AB | | | 116,605 | | | | 1,119,451 | |
UniCredit SpA (a) | | | 600,802 | | | | 2,966,815 | |
| | | | | | | | |
| | | | | | | 41,922,578 | |
| | | | | | | | |
| Diversified Financial — 2.5% | | | | | | | | |
Credit Suisse Group (a) (b) | | | 238,580 | | | | 5,986,291 | |
UBS AG (a) | | | 182,700 | | | | 2,873,172 | |
| | | | | | | | |
| | | | | | | 8,859,463 | |
| | | | | | | | |
| Insurance — 9.2% | | | | | | | | |
ACE Ltd. | | | 59,484 | | | | 4,746,823 | |
AIA Group Ltd. | | | 1,336,400 | | | | 5,326,141 | |
Aviva PLC | | | 656,425 | | | | 3,962,705 | |
AXA SA | | | 211,767 | | | | 3,830,432 | |
ING Groep NV (a) | | | 542,240 | | | | 5,185,274 | |
Muenchener Rueckversicherungs AG | | | 26,950 | | | | 4,838,701 | |
Swiss Re AG (a) | | | 75,380 | | | | 5,501,554 | |
| | | | | | | | |
| | | | | | | 33,391,630 | |
| | | | | | | | |
| Real Estate — 0.9% | | | | | | | | |
Cheung Kong Holdings | | | 221,215 | | | | 3,424,158 | |
| | | | | | | | |
| | | | | | | 87,597,829 | |
| | | | | | | | |
| Industrial — 10.6% | | | | | | | | |
| Aerospace & Defense — 1.8% | | | | | | | | |
BAE Systems PLC | | | 698,450 | | | | 3,837,269 | |
Embraer SA Sponsored ADR (Brazil) | | | 95,420 | | | | 2,720,424 | |
| | | | | | | | |
| | | | | | | 6,557,693 | |
| | | | | | | | |
| Building Materials — 2.4% | | | | | | | | |
CRH PLC | | | 217,262 | | | | 4,508,377 | |
HeidelbergCement AG | | | 67,600 | | | | 4,095,394 | |
| | | | | | | | |
| | | | | | | 8,603,771 | |
| | | | | | | | |
| Electronics — 1.8% | | | | | | | | |
Flextronics International Ltd. (a) | | | 315,340 | | | | 1,958,261 | |
Koninklijke Philips Electronics NV | | | 167,890 | | | | 4,504,204 | |
| | | | | | | | |
| | | | | | | 6,462,465 | |
| | | | | | | | |
| Machinery – Diversified — 0.4% | | | | | | | | |
Alstom SA | | | 30,530 | | | | 1,251,027 | |
| | | | | | | | |
| | | | | | | | |
| | | Number of
Shares | | | Value | |
| Manufacturing — 2.4% | | | | | | | | |
Konica Minolta Holdings, Inc. | | | 239,500 | | | $ | 1,725,470 | |
Nikon Corp. (b) | | | 31,900 | | | | 941,801 | |
Siemens AG | | | 56,536 | | | | 6,144,876 | |
| | | | | | | | |
| | | | | | | 8,812,147 | |
| | | | | | | | |
| Packaging & Containers — 0.8% | | | | | | | | |
Rexam PLC | | | 406,640 | | | | 2,857,512 | |
| | | | | | | | |
| Transportation — 1.0% | | | | | | | | |
Deutsche Post AG | | | 172,271 | | | | 3,777,443 | |
| | | | | | | | |
| | | | | | | 38,322,058 | |
| | | | | | | | |
| Technology — 6.9% | | | | | | | | |
| Computers — 0.4% | | | | | | | | |
Compal Electronics, Inc. | | | 2,144,605 | | | | 1,451,138 | |
| | | | | | | | |
| Semiconductors — 4.8% | | | | | | | | |
Infineon Technologies AG | | | 526,057 | | | | 4,268,833 | |
Samsung Electronics Co., Ltd. | | | 6,495 | | | | 9,295,808 | |
Taiwan Semiconductor Manufacturing Co. Ltd. | | | 1,060,275 | | | | 3,548,648 | |
| | | | | | | | |
| | | | | | | 17,113,289 | |
| | | | | | | | |
| Software — 1.7% | | | | | | | | |
SAP AG Sponsored ADR (Germany) | | | 40,100 | | | | 3,223,238 | |
Software AG | | | 70,880 | | | | 3,010,805 | |
| | | | | | | | |
| | | | | | | 6,234,043 | |
| | | | | | | | |
| | | | | | | 24,798,470 | |
| | | | | | | | |
| Utilities — 1.7% | | | | | | | | |
| Electric — 1.3% | | | | | | | | |
E.ON AG | | | 119,450 | | | | 2,224,467 | |
Iberdrola SA | | | 404,797 | | | | 2,257,304 | |
| | | | | | | | |
| | | | | | | 4,481,771 | |
| | | | | | | | |
| Gas — 0.4% | | | | | | | | |
Gaz De France | | | 75,588 | | | | 1,557,409 | |
| | | | | | | | |
| | | | | | | 6,039,180 | |
| | | | | | | | |
| | |
TOTAL COMMON STOCK
(Cost $345,576,930) | | | | | | | 349,916,184 | |
| | | | | | | | |
| | |
| PREFERRED STOCK — 1.1% | | | | | | | | |
| Basic Materials — 1.1% | | | | | | | | |
| Mining — 1.1% | | | | | | | | |
Vale SA Sponsored ADR
5.760% | | | 191,752 | | | | 3,892,566 | |
| | | | | | | | |
| | |
TOTAL PREFERRED STOCK
(Cost $2,736,273) | | | | | | | 3,892,566 | |
| | | | | | | | |
| | |
TOTAL EQUITIES
(Cost $348,313,203) | | | | | | | 353,808,750 | |
| | | | | | | | |
The accompanying notes are an integral part of the financial statements.
75
MML Foreign Fund – Portfolio of Investments (Continued)
| | | | | | | | |
| | | Number of
Shares | | | Value | |
| RIGHTS — 0.0% | | | | | | | | |
| Energy — 0.0% | | | | | | | | |
| Oil & Gas — 0.0% | | | | | | | | |
Repsol SA, expires 1/10/13,
Strike 0.00 (a) (b) | | | 136,978 | | | $ | 83,531 | |
| | | | | | | | |
| | |
TOTAL RIGHTS
(Cost $85,666) | | | | | | | 83,531 | |
| | | | | | | | |
| | |
| MUTUAL FUNDS — 5.2% | | | | | | | | |
| Diversified Financial — 5.2% | | | | | | | | |
State Street Navigator Securities Lending Prime Portfolio (c) | | | 18,720,167 | | | | 18,720,167 | |
| | | | | | | | |
| | |
TOTAL MUTUAL FUNDS
(Cost $18,720,167) | | | | | | | 18,720,167 | |
| | | | | | | | |
| | |
TOTAL LONG-TERM INVESTMENTS
(Cost $367,119,036) | | | | | | | 372,612,448 | |
| | | | | | | | |
| | |
| | | Principal
Amount | | | | |
|
| SHORT-TERM INVESTMENTS — 4.4% | |
| Repurchase Agreement — 4.4% | | | | | | | | |
State Street Bank & Trust Co. Repurchase Agreement, dated 12/31/12, 0.010%, due 1/02/13 (d) | | $ | 15,959,493 | | | | 15,959,493 | |
| | | | | | | | |
| | |
TOTAL SHORT-TERM INVESTMENTS
(Cost $15,959,493) | | | | | | | 15,959,493 | |
| | | | | | | | |
| | |
TOTAL INVESTMENTS — 107.4%
(Cost $383,078,529) (e) | | | | | | | 388,571,941 | |
| | |
| Other Assets/(Liabilities) — (7.4)% | | | | | | | (26,642,616 | ) |
| | | | | | | | |
| | |
| NET ASSETS — 100.0% | | | | | | $ | 361,929,325 | |
| | | | | | | | |
Notes to Portfolio of Investments
| ADR | American Depositary Receipt |
| (a) | Non-income producing security. |
| (b) | Denotes all or a portion of security on loan. The total value of securities on loan as of December 31, 2012, was $17,896,279. Total securities on loan may not correspond with the amounts identified in the Portfolio of Investments because pending sales may be in the process of recall from the brokers. (Note 2). |
| (c) | Represents investment of security lending collateral. (Note 2). |
| (d) | Maturity value of $15,959,502. Collateralized by U.S. Government Agency obligations with a rate of 3.000%, maturity date of 12/01/26, and an aggregate market value, including accrued interest, of $16,279,162. |
| (e) | See Note 6 for aggregate cost for federal tax purposes. |
The accompanying notes are an integral part of the financial statements.
76
MML Fundamental Growth Fund – Portfolio of Investments
December 31, 2012
| | | | | | | | |
| | | Number of
Shares | | | Value | |
| EQUITIES — 95.9% | | | | | | | | |
| | |
| COMMON STOCK — 95.9% | | | | | | | | |
| Basic Materials — 3.7% | | | | | | | | |
| Chemicals — 3.4% | | | | | | | | |
CF Industries Holdings, Inc. | | | 10,928 | | | $ | 2,220,132 | |
Monsanto Co. | | | 32,431 | | | | 3,069,594 | |
The Sherwin-Williams Co. | | | 5,305 | | | | 816,015 | |
| | | | | | | | |
| | | | | | | 6,105,741 | |
| | | | | | | | |
| Mining — 0.3% | | | | | | | | |
Allied Nevada Gold Corp. (a) | | | 18,160 | | | | 547,161 | |
| | | | | | | | |
| | | | | | | 6,652,902 | |
| | | | | | | | |
| Communications — 20.5% | | | | | | | | |
| Advertising — 1.0% | | | | | | | | |
Omnicom Group, Inc. | | | 37,097 | | | | 1,853,366 | |
| | | | | | | | |
| Internet — 7.3% | | | | | | | | |
Amazon.com, Inc. (a) | | | 11,270 | | | | 2,830,348 | |
eBay, Inc. (a) | | | 44,187 | | | | 2,254,420 | |
F5 Networks, Inc. (a) | | | 7,367 | | | | 715,704 | |
Google, Inc. Class A (a) | | | 6,257 | | | | 4,438,528 | |
IAC/InterActiveCorp | | | 45,506 | | | | 2,152,434 | |
Priceline.com, Inc. (a) | | | 1,369 | | | | 850,423 | |
| | | | | | | | |
| | | | | | | 13,241,857 | |
| | | | | | | | |
| Media — 3.4% | | | | | | | | |
Comcast Corp. Class A | | | 75,993 | | | | 2,840,619 | |
News Corp. Class A | | | 64,415 | | | | 1,645,159 | |
Sirius XM Radio, Inc. | | | 544,391 | | | | 1,573,290 | |
| | | | | | | | |
| | | | | | | 6,059,068 | |
| | | | | | | | |
| Telecommunications — 8.8% | | | | | | | | |
Cisco Systems, Inc. | | | 459,481 | | | | 9,028,802 | |
QUALCOMM, Inc. | | | 35,638 | | | | 2,210,269 | |
Verizon Communications, Inc. | | | 106,302 | | | | 4,599,687 | |
| | | | | | | | |
| | | | | | | 15,838,758 | |
| | | | | | | | |
| | | | | | | 36,993,049 | |
| | | | | | | | |
| Consumer, Cyclical — 13.1% | | | | | | | | |
| Auto Manufacturers — 0.7% | | | | | | | | |
Ford Motor Co. | | | 90,456 | | | | 1,171,405 | |
| | | | | | | | |
| Lodging — 0.2% | | | | | | | | |
Starwood Hotels & Resorts Worldwide, Inc. | | | 6,019 | | | | 345,250 | |
| | | | | | | | |
| Retail — 12.2% | | | | | | | | |
Bed Bath & Beyond, Inc. (a) | | | 10,175 | | | | 568,884 | |
The Buckle, Inc. | | | 24,790 | | | | 1,106,626 | |
Costco Wholesale Corp. | | | 20,880 | | | | 2,062,317 | |
CVS Caremark Corp. | | | 45,952 | | | | 2,221,779 | |
Dollar Tree, Inc. (a) | | | 27,105 | | | | 1,099,379 | |
The Home Depot, Inc. | | | 41,959 | | | | 2,595,164 | |
Lowe’s Cos., Inc. | | | 74,640 | | | | 2,651,213 | |
| | | | | | | | |
| | | Number of
Shares | | | Value | |
Lululemon Athletica, Inc. (a) | | | 11,923 | | | $ | 908,890 | |
O’Reilly Automotive, Inc. (a) | | | 20,600 | | | | 1,842,052 | |
PetSmart, Inc. | | | 18,541 | | | | 1,267,092 | |
The TJX Cos., Inc. | | | 21,387 | | | | 907,878 | |
Wal-Mart Stores, Inc. | | | 63,503 | | | | 4,332,810 | |
Yum! Brands, Inc. | | | 7,919 | | | | 525,822 | |
| | | | | | | | |
| | | | | | | 22,089,906 | |
| | | | | | | | |
| | | | | | | 23,606,561 | |
| | | | | | | | |
| Consumer, Non-cyclical — 23.8% | | | | | | | | |
| Agriculture — 2.4% | | | | | | | | |
Philip Morris International, Inc. | | | 52,252 | | | | 4,370,357 | |
| | | | | | | | |
| Beverages — 2.9% | | | | | | | | |
The Coca-Cola Co. | | | 120,404 | | | | 4,364,645 | |
Green Mountain Coffee Roasters,
Inc. (a) | | | 20,786 | | | | 859,709 | |
| | | | | | | | |
| | | | | | | 5,224,354 | |
| | | | | | | | |
| Biotechnology — 4.6% | | | | | | | | |
Amgen, Inc. | | | 43,589 | | | | 3,762,602 | |
Biogen Idec, Inc. (a) | | | 13,996 | | | | 2,052,793 | |
Celgene Corp. (a) | | | 27,290 | | | | 2,148,269 | |
Life Technologies Corp. (a) | | | 6,583 | | | | 323,094 | |
| | | | | | | | |
| | | | | | | 8,286,758 | |
| | | | | | | | |
| Commercial Services — 2.9% | | | | | | | | |
The ADT Corp. | | | 18,468 | | | | 858,577 | |
ITT Educational Services, Inc. (a) | | | 650 | | | | 11,252 | |
McKesson Corp. | | | 17,022 | | | | 1,650,453 | |
Visa, Inc. Class A | | | 18,055 | | | | 2,736,777 | |
| | | | | | | | |
| | | | | | | 5,257,059 | |
| | | | | | | | |
| Health Care – Products — 3.2% | | | | | | | | |
Bruker Corp. (a) | | | 40,858 | | | | 623,901 | |
Edwards Lifesciences Corp. (a) | | | 10,704 | | | | 965,180 | |
Hologic, Inc. (a) | | | 48,459 | | | | 970,634 | |
Johnson & Johnson | | | 21,904 | | | | 1,535,470 | |
Zimmer Holdings, Inc. | | | 24,418 | | | | 1,627,704 | |
| | | | | | | | |
| | | | | | | 5,722,889 | |
| | | | | | | | |
| Health Care – Services — 1.9% | | | | | | | | |
Aetna, Inc. | | | 29,470 | | | | 1,364,461 | |
UnitedHealth Group, Inc. | | | 38,110 | | | | 2,067,087 | |
| | | | | | | | |
| | | | | | | 3,431,548 | |
| | | | | | | | |
| Pharmaceuticals — 5.9% | | | | | | | | |
Abbott Laboratories | | | 48,257 | | | | 3,160,834 | |
Eli Lilly & Co. | | | 51,241 | | | | 2,527,206 | |
Gilead Sciences, Inc. (a) | | | 29,904 | | | | 2,196,449 | |
Herbalife Ltd. | | | 8,249 | | | | 271,722 | |
Merck & Co., Inc. | | | 60,616 | | | | 2,481,619 | |
| | | | | | | | |
| | | | | | | 10,637,830 | |
| | | | | | | | |
| | | | | | | 42,930,795 | |
| | | | | | | | |
The accompanying notes are an integral part of the financial statements.
77
MML Fundamental Growth Fund – Portfolio of Investments (Continued)
| | | | | | | | |
| | | Number of
Shares | | | Value | |
| Energy — 4.7% | | | | | | | | |
| Oil & Gas — 2.5% | | | | | | | | |
Diamond Offshore Drilling, Inc. | | | 23,921 | | | $ | 1,625,671 | |
Exxon Mobil Corp. | | | 22,357 | | | | 1,934,998 | |
Valero Energy Corp. | | | 26,578 | | | | 906,842 | |
| | | | | | | | |
| | | | | | | 4,467,511 | |
| | | | | | | | |
| Oil & Gas Services — 2.2% | | | | | | | | |
Core Laboratories NV | | | 2,079 | | | | 227,256 | |
National Oilwell Varco, Inc. | | | 18,618 | | | | 1,272,540 | |
Oceaneering International, Inc. | | | 24,594 | | | | 1,322,911 | |
Transocean Ltd. | | | 27,098 | | | | 1,209,926 | |
| | | | | | | | |
| | | | | | | 4,032,633 | |
| | | | | | | | |
| | | | | | | 8,500,144 | |
| | | | | | | | |
| Financial — 3.7% | | | | | | | | |
| Banks — 1.8% | | | | | | | | |
Bank of America Corp. | | | 283,263 | | | | 3,285,851 | |
| | | | | | | | |
| Diversified Financial — 1.9% | | | | | | | | |
American Express Co. | | | 34,329 | | | | 1,973,231 | |
JP Morgan Chase & Co. | | | 32,016 | | | | 1,407,743 | |
| | | | | | | | |
| | | | | | | 3,380,974 | |
| | | | | | | | |
| | | | | | | 6,666,825 | |
| | | | | | | | |
| Industrial — 6.8% | | | | | | | | |
| Aerospace & Defense — 1.6% | | | | | | | | |
The Boeing Co. | | | 39,537 | | | | 2,979,508 | |
| | | | | | | | |
| Manufacturing — 5.2% | | | | | | | | |
Dover Corp. | | | 9,252 | | | | 607,949 | |
General Electric Co. | | | 93,854 | | | | 1,969,996 | |
Honeywell International, Inc. | | | 45,341 | | | | 2,877,793 | |
Illinois Tool Works, Inc. | | | 23,717 | | | | 1,442,231 | |
Parker Hannifin Corp. | | | 19,071 | | | | 1,622,179 | |
Tyco International Ltd. | | | 27,065 | | | | 791,651 | |
| | | | | | | | |
| | | | | | | 9,311,799 | |
| | | | | | | | |
| | | | | | | 12,291,307 | |
| | | | | | | | |
| Technology — 19.6% | | | | | | | | |
| Computers — 9.8% | | | | | | | | |
Apple, Inc. | | | 19,014 | | | | 10,135,032 | |
EMC Corp. (a) | | | 34,137 | | | | 863,666 | |
International Business Machines Corp. | | | 21,190 | | | | 4,058,944 | |
NetApp, Inc. (a) | | | 69,510 | | | | 2,332,061 | |
Riverbed Technology, Inc. (a) | | | 17,254 | | | | 340,249 | |
| | | | | | | | |
| | | | | | | 17,729,952 | |
| | | | | | | | |
| Internet — 0.9% | | | | | | | | |
Check Point Software Technologies Ltd. (a) | | | 32,301 | | | | 1,538,820 | |
| | | | | | | | |
| Semiconductors — 2.0% | | | | | | | | |
Altera Corp. | | | 60,683 | | | | 2,089,923 | |
Emulex Corp. (a) | | | 42,378 | | | | 309,359 | |
| | | | | | | | |
| | | Number of
Shares | | | Value | |
QLogic Corp. (a) | | | 9,471 | | | $ | 92,153 | |
Xilinx, Inc. | | | 28,735 | | | | 1,031,586 | |
| | | | | | | | |
| | | | | | | 3,523,021 | |
| | | | | | | | |
| Software — 6.9% | | | | | | | | |
BMC Software, Inc. (a) | | | 19,629 | | | | 778,486 | |
Intuit, Inc. | | | 9,117 | | | | 542,462 | |
Microsoft Corp. | | | 192,948 | | | | 5,157,500 | |
NetSuite, Inc. (a) | | | 9,379 | | | | 631,207 | |
Oracle Corp. | | | 121,097 | | | | 4,034,952 | |
Red Hat, Inc. (a) | | | 24,699 | | | | 1,308,059 | |
| | | | | | | | |
| | | | | | | 12,452,666 | |
| | | | | | | | |
| | | | | | | 35,244,459 | |
| | | | | | | | |
| | |
TOTAL COMMON STOCK
(Cost $159,114,179) | | | | | | | 172,886,042 | |
| | | | | | | | |
| | |
TOTAL EQUITIES
(Cost $159,114,179) | | | | | | | 172,886,042 | |
| | | | | | | | |
| | |
TOTAL LONG-TERM INVESTMENTS
(Cost $159,114,179) | | | | | | | 172,886,042 | |
| | | | | | | | |
| | |
| | | Principal
Amount | | | | |
| |
| SHORT-TERM INVESTMENTS — 4.2% | | | | | |
| Repurchase Agreement — 4.2% | | | | | | | | |
State Street Bank & Trust Co. Repurchase Agreement, dated 12/31/12, 0.010%, due 1/02/13 (b) | | $ | 7,622,724 | | | | 7,622,724 | |
| | | | | | | | |
| | |
TOTAL SHORT-TERM INVESTMENTS
(Cost $7,622,724) | | | | | | | 7,622,724 | |
| | | | | | | | |
| | |
TOTAL INVESTMENTS — 100.1%
(Cost $166,736,903) (c) | | | | | | | 180,508,766 | |
| | |
| Other Assets/(Liabilities) — (0.1)% | | | | | | | (156,647 | ) |
| | | | | | | | |
| | |
| NET ASSETS — 100.0% | | | | | | $ | 180,352,119 | |
| | | | | | | | |
Notes to Portfolio of Investments
| (a) | Non-income producing security. |
| (b) | Maturity value of $7,622,729. Collateralized by U.S. Government Agency obligations with a rate of 3.000%, maturity date of 12/01/26, and an aggregate market value, including accrued interest, of $7,778,251. |
| (c) | See Note 6 for aggregate cost for federal tax purposes. |
The accompanying notes are an integral part of the financial statements.
78
MML Fundamental Value Fund – Portfolio of Investments
December 31, 2012
| | | | | | | | |
| | | Number of
Shares | | | Value | |
| EQUITIES — 97.4% | | | | | | | | |
| | |
| COMMON STOCK — 97.4% | | | | | | | | |
| Basic Materials — 5.3% | | | | | | | | |
| Chemicals — 3.0% | | | | | |
The Dow Chemical Co. | | | 57,450 | | | $ | 1,856,784 | |
E.I. du Pont de Nemours & Co. | | | 31,630 | | | | 1,422,401 | |
The Mosaic Co. | | | 40,950 | | | | 2,318,999 | |
| | | | | | | | |
| | | | | | | 5,598,184 | |
| | | | | | | | |
| Forest Products & Paper — 1.0% | | | | | |
International Paper Co. | | | 45,500 | | | | 1,812,720 | |
| | | | | | | | |
| Iron & Steel — 1.3% | | | | | |
Nucor Corp. | | | 26,220 | | | | 1,132,180 | |
Steel Dynamics, Inc. | | | 93,050 | | | | 1,277,576 | |
| | | | | | | | |
| | | | | | | 2,409,756 | |
| | | | | | | | |
| | | | | | | 9,820,660 | |
| | | | | | | | |
| Communications — 8.6% | | | | | |
| Media — 3.7% | | | | | |
CBS Corp. Class B | | | 30,930 | | | | 1,176,887 | |
Comcast Corp. Class A | | | 101,840 | | | | 3,806,779 | |
Thomson Reuters Corp. | | | 61,300 | | | | 1,781,378 | |
| | | | | | | | |
| | | | | | | 6,765,044 | |
| | | | | | | | |
| Telecommunications — 4.9% | | | | | |
AT&T, Inc. | | | 122,390 | | | | 4,125,767 | |
Cisco Systems, Inc. | | | 254,630 | | | | 5,003,479 | |
| | | | | | | | |
| | | | | | | 9,129,246 | |
| | | | | | | | |
| | | | | | | 15,894,290 | |
| | | | | | | | |
| Consumer, Cyclical — 9.6% | | | | | |
| Auto Manufacturers — 1.1% | | | | | |
General Motors Co. (a) | | | 25,260 | | | | 728,246 | |
Paccar, Inc. | | | 27,770 | | | | 1,255,481 | |
| | | | | | | | |
| | | | | | | 1,983,727 | |
| | | | | | | | |
| Automotive & Parts — 0.5% | | | | | |
The Goodyear Tire & Rubber Co. (a) | | | 68,440 | | | | 945,156 | |
| | | | | | | | |
| Housewares — 0.9% | | | | | |
Newell Rubbermaid, Inc. | | | 73,600 | | | | 1,639,072 | |
| | | | | | | | |
| Retail — 6.6% | | | | | |
AutoZone, Inc. (a) | | | 5,100 | | | | 1,807,593 | |
CVS Caremark Corp. | | | 54,020 | | | | 2,611,867 | |
The Home Depot, Inc. | | | 31,900 | | | | 1,973,015 | |
Kohl’s Corp. | | | 45,220 | | | | 1,943,556 | |
Lowe’s Cos., Inc. | | | 66,000 | | | | 2,344,320 | |
Nordstrom, Inc. | | | 28,970 | | | | 1,549,895 | |
| | | | | | | | |
| | | | | | | 12,230,246 | |
| | | | | | | | |
| Toys, Games & Hobbies — 0.5% | | | | | |
Mattel, Inc. | | | 27,890 | | | | 1,021,332 | |
| | | | | | | | |
| | | | | | | 17,819,533 | |
| | | | | | | | |
| | | | | | | | |
| | | Number of
Shares | | | Value | |
| Consumer, Non-cyclical — 17.5% | | | | | |
| Agriculture — 1.4% | | | | | |
Philip Morris International, Inc. | | | 31,540 | | | $ | 2,638,006 | |
| | | | | | | | |
| Beverages — 2.1% | | | | | |
Anheuser-Busch InBev NV Sponsored ADR (Belgium) | | | 22,050 | | | | 1,927,391 | |
PepsiCo, Inc. | | | 28,340 | | | | 1,939,306 | |
| | | | | | | | |
| | | | | | | 3,866,697 | |
| | | | | | | | |
| Biotechnology — 1.1% | | | | | |
Amgen, Inc. | | | 23,870 | | | | 2,060,458 | |
| | | | | | | | |
| Foods — 1.1% | | | | | |
General Mills, Inc. | | | 33,920 | | | | 1,370,707 | |
Kraft Foods Group, Inc. | | | 16,936 | | | | 770,080 | |
| | | | | | | | |
| | | | | | | 2,140,787 | |
| | | | | | | | |
| Health Care – Products — 3.7% | | | | | |
Baxter International, Inc. | | | 34,260 | | | | 2,283,771 | |
Covidien PLC | | | 40,120 | | | | 2,316,529 | |
Johnson & Johnson | | | 31,710 | | | | 2,222,871 | |
| | | | | | | | |
| | | | | | | 6,823,171 | |
| | | | | | | | |
| Health Care – Services — 1.8% | | | | | |
HCA Holdings, Inc. | | | 23,385 | | | | 705,526 | |
UnitedHealth Group, Inc. | | | 47,610 | | | | 2,582,366 | |
| | | | | | | | |
| | | | | | | 3,287,892 | |
| | | | | | | | |
| Pharmaceuticals — 6.3% | | | | | |
Merck & Co., Inc. | | | 104,490 | | | | 4,277,820 | |
Pfizer, Inc. | | | 142,110 | | | | 3,564,119 | |
Roche Holding AG | | | 11,793 | | | | 2,402,528 | |
Teva Pharmaceutical Industries Ltd. Sponsored ADR (Israel) | | | 41,520 | | | | 1,550,357 | |
| | | | | | | | |
| | | | | | | 11,794,824 | |
| | | | | | | | |
| | | | | | | 32,611,835 | |
| | | | | | | | |
| Energy — 12.9% | | | | | |
| Oil & Gas — 11.5% | | | | | |
Anadarko Petroleum Corp. | | | 24,400 | | | | 1,813,164 | |
Chevron Corp. | | | 58,050 | | | | 6,277,527 | |
EOG Resources, Inc. | | | 7,660 | | | | 925,251 | |
Exxon Mobil Corp. | | | 48,800 | | | | 4,223,640 | |
Marathon Oil Corp. | | | 49,840 | | | | 1,528,094 | |
Noble Corp. | | | 27,400 | | | | 954,068 | |
Occidental Petroleum Corp. | | | 35,470 | | | | 2,717,357 | |
Royal Dutch Shell PLC B Shares Sponsored ADR (United Kingdom) | | | 23,210 | | | | 1,645,357 | |
Southwestern Energy Co. (a) | | | 41,250 | | | | 1,378,163 | |
| | | | | | | | |
| | | | | | | 21,462,621 | |
| | | | | | | | |
| Oil & Gas Services — 1.4% | | | | | |
Halliburton Co. | | | 73,000 | | | | 2,532,370 | |
| | | | | | | | |
| | | | | | | 23,994,991 | |
| | | | | | | | |
The accompanying notes are an integral part of the financial statements.
79
MML Fundamental Value Fund – Portfolio of Investments (Continued)
| | | | | | | | |
| | | Number of
Shares | | | Value | |
| Financial — 24.1% | | | | | |
| Banks — 6.7% | | | | | |
BB&T Corp. | | | 74,100 | | | $ | 2,157,051 | |
PNC Financial Services Group, Inc. | | | 67,390 | | | | 3,929,511 | |
Wells Fargo & Co. | | | 185,590 | | | | 6,343,466 | |
| | | | | | | | |
| | | | | | | 12,430,028 | |
| | | | | | | | |
| Diversified Financial — 9.4% | | | | | |
Ameriprise Financial, Inc. | | | 6,500 | | | | 407,095 | |
BlackRock, Inc. | | | 12,970 | | | | 2,681,029 | |
Citigroup, Inc. | | | 78,300 | | | | 3,097,548 | |
Credit Suisse Group Sponsored ADR (Switzerland) | | | 37,480 | | | | 920,509 | |
The Goldman Sachs Group, Inc. | | | 19,470 | | | | 2,483,593 | |
IntercontinentalExchange, Inc. (a) | | | 7,300 | | | | 903,813 | |
JP Morgan Chase & Co. | | | 161,280 | | | | 7,091,481 | |
| | | | | | | | |
| | | | | | | 17,585,068 | |
| | | | | | | | |
| Insurance — 8.0% | | | | | |
ACE Ltd. | | | 50,440 | | | | 4,025,112 | |
American International Group, Inc. (a) | | | 59,400 | | | | 2,096,820 | |
The Chubb Corp. | | | 23,540 | | | | 1,773,033 | |
Marsh & McLennan Cos., Inc. | | | 87,290 | | | | 3,008,886 | |
Principal Financial Group, Inc. | | | 43,940 | | | | 1,253,169 | |
Swiss Re AG (a) | | | 22,921 | | | | 1,672,872 | |
Unum Group | | | 49,240 | | | | 1,025,177 | |
| | | | | | | | |
| | | | | | | 14,855,069 | |
| | | | | | | | |
| | | | | | | 44,870,165 | |
| | | | | | | | |
| Industrial — 10.5% | | | | | |
| Aerospace & Defense — 2.4% | | | | | |
The Boeing Co. | | | 27,060 | | | | 2,039,242 | |
Spirit AeroSystems Holdings, Inc. Class A (a) | | | 29,000 | | | | 492,130 | |
United Technologies Corp. | | | 23,000 | | | | 1,886,230 | |
| | | | | | | | |
| | | | | | | 4,417,602 | |
| | | | | | | | |
| Hand & Machine Tools — 1.2% | | | | | |
Stanley Black & Decker, Inc. | | | 30,260 | | | | 2,238,332 | |
| | | | | | | | |
| Machinery – Construction & Mining — 0.9% | | | | | |
Ingersoll-Rand PLC | | | 36,670 | | | | 1,758,693 | |
| | | | | | | | |
| Manufacturing — 6.0% | | | | | |
3M Co. | | | 19,750 | | | | 1,833,787 | |
Eaton Corp. PLC | | | 45,400 | | | | 2,460,680 | |
General Electric Co. | | | 186,980 | | | | 3,924,710 | |
Illinois Tool Works, Inc. | | | 30,080 | | | | 1,829,165 | |
Tyco International Ltd. | | | 38,990 | | | | 1,140,458 | |
| | | | | | | | |
| | | | | | | 11,188,800 | |
| | | | | | | | |
| | | | | | | 19,603,427 | |
| | | | | | | | |
| | | | | | | | |
| | | Number of
Shares | | | Value | |
| Technology — 6.0% | | | | | |
| Computers — 0.7% | | | | | |
Hewlett-Packard Co. | | | 40,070 | | | $ | 570,998 | |
NetApp, Inc. (a) | | | 19,900 | | | | 667,645 | |
| | | | | | | | |
| | | | | | | 1,238,643 | |
| | | | | | | | |
| Semiconductors — 4.1% | | | | | |
Analog Devices, Inc. | | | 44,940 | | | | 1,890,176 | |
Intel Corp. | | | 112,870 | | | | 2,328,508 | |
Maxim Integrated Products, Inc. | | | 46,260 | | | | 1,360,044 | |
Xilinx, Inc. | | | 56,550 | | | | 2,030,145 | |
| | | | | | | | |
| | | | | | | 7,608,873 | |
| | | | | | | | |
| Software — 1.2% | | | | | |
Microsoft Corp. | | | 82,760 | | �� | | 2,212,175 | |
| | | | | | | | |
| | | | | | | 11,059,691 | |
| | | | | | | | |
| Utilities — 2.9% | | | | | |
| Electric — 2.9% | | | | | |
Edison International | | | 34,790 | | | | 1,572,160 | |
Entergy Corp. | | | 18,190 | | | | 1,159,612 | |
NextEra Energy, Inc. | | | 13,940 | | | | 964,509 | |
Northeast Utilities | | | 42,760 | | | | 1,671,061 | |
| | | | | | | | |
| | | | | | | 5,367,342 | |
| | | | | | | | |
| | |
TOTAL COMMON STOCK
(Cost $158,664,407) | | | | | | | 181,041,934 | |
| | | | | | | | |
| | |
TOTAL EQUITIES
(Cost $158,664,407) | | | | | | | 181,041,934 | |
| | | | | | | | |
| | |
TOTAL LONG-TERM INVESTMENTS
(Cost $158,664,407) | | | | | | | 181,041,934 | |
| | | | | | | | |
| | |
| | | Principal
Amount | | | | |
| |
| SHORT-TERM INVESTMENTS — 2.7% | | | | | |
| Repurchase Agreement — 2.7% | | | | | |
State Street Bank & Trust Co. Repurchase Agreement, dated 12/31/12, 0.010%, due 1/02/13 (b) | | $ | 5,012,429 | | | | 5,012,429 | |
| | | | | | | | |
| | |
TOTAL SHORT-TERM INVESTMENTS
(Cost $5,012,429) | | | | | | | 5,012,429 | |
| | | | | | | | |
| | |
TOTAL INVESTMENTS — 100.1%
(Cost $163,676,836) (c) | | | | | | | 186,054,363 | |
| | |
| Other Assets/(Liabilities) — (0.1)% | | | | | | | (200,353 | ) |
| | | | | | | | |
| | |
| NET ASSETS — 100.0% | | | | | | $ | 185,854,010 | |
| | | | | | | | |
The accompanying notes are an integral part of the financial statements.
80
MML Fundamental Value Fund – Portfolio of Investments (Continued)
Notes to Portfolio of Investments
| ADR | American Depositary Receipt |
| (a) | Non-income producing security. |
| (b) | Maturity value of $5,012,432. Collateralized by U.S. Government Agency obligations with a rate of 3.000%, maturity date of 12/01/26, and an aggregate market value, including accrued interest, of $5,116,605. |
| (c) | See Note 6 for aggregate cost for federal tax purposes. |
The accompanying notes are an integral part of the financial statements.
81
MML Global Fund – Portfolio of Investments
December 31, 2012
| | | | | | | | |
| | | Number of
Shares | | | Value | |
| EQUITIES — 98.0% | |
|
| COMMON STOCK — 98.0% | |
| Basic Materials — 9.7% | |
| Chemicals — 8.4% | |
Air Liquide | | | 7,217 | | | $ | 904,410 | |
Akzo Nobel NV | | | 35,604 | | | | 2,349,402 | |
Brenntag AG | | | 5,097 | | | | 669,632 | |
International Flavors & Fragrances, Inc. | | | 21,880 | | | | 1,455,895 | |
Linde AG | | | 25,958 | | | | 4,526,801 | |
Praxair, Inc. | | | 16,330 | | | | 1,787,319 | |
The Sherwin-Williams Co. | | | 1,900 | | | | 292,258 | |
Shin-Etsu Chemical Co. Ltd. | | | 11,500 | | | | 702,414 | |
| | | | | | | | |
| | | | | | | 12,688,131 | |
| | | | | | | | |
| Forest Products & Paper — 1.3% | |
Svenska Cellulosa AB Class B | | | 90,409 | | | | 1,979,113 | |
| | | | | | | | |
| | | | | | | 14,667,244 | |
| | | | | | | | |
| Communications — 6.4% | |
| Advertising — 1.2% | |
Omnicom Group, Inc. | | | 38,240 | | | | 1,910,470 | |
| | | | | | | | |
| Media — 4.4% | |
Viacom, Inc. Class B | | | 12,260 | | | | 646,592 | |
The Walt Disney Co. | | | 80,040 | | | | 3,985,192 | |
WPP PLC | | | 140,441 | | | | 2,041,629 | |
| | | | | | | | |
| | | | | | | 6,673,413 | |
| | | | | | | | |
| Telecommunications — 0.8% | |
Cisco Systems, Inc. | | | 60,340 | | | | 1,185,681 | |
| | | | | | | | |
| | | | | | | 9,769,564 | |
| | | | | | | | |
| Consumer, Cyclical — 9.4% | |
| Apparel — 1.0% | |
Burberry Group PLC | | | 39,536 | | | | 809,482 | |
Nike, Inc. Class B | | | 12,540 | | | | 647,064 | |
| | | | | | | | |
| | | | | | | 1,456,546 | |
| | | | | | | | |
| Automotive & Parts — 0.8% | |
Delphi Automotive PLC (a) | | | 32,830 | | | | 1,255,747 | |
| | | | | | | | |
| Entertainment — 0.6% | |
William Hill PLC | | | 162,054 | | | | 920,407 | |
| | | | | | | | |
| Food Services — 1.2% | |
Compass Group PLC | | | 151,600 | | | | 1,792,937 | |
| | | | | | | | |
| Leisure Time — 0.2% | |
Harley-Davidson, Inc. | | | 6,090 | | | | 297,436 | |
| | | | | | | | |
| Retail — 5.6% | |
Cie Financiere Richemont SA | | | 23,753 | | | | 1,899,372 | |
Hennes & Mauritz AB Class B | | | 15,050 | | | | 522,977 | |
Lawson, Inc. (b) | | | 6,400 | | | | 435,030 | |
McDonald’s Corp. | | | 15,330 | | | | 1,352,259 | |
Sally Beauty Holdings, Inc. (a) | | | 37,950 | | | | 894,482 | |
Target Corp. | | | 23,860 | | | | 1,411,796 | |
| | | | | | | | |
| | | Number of
Shares | | | Value | |
Urban Outfitters, Inc. (a) | | | 8,140 | | | $ | 320,390 | |
Walgreen Co. | | | 44,350 | | | | 1,641,394 | |
| | | | | | | | |
| | | | | | | 8,477,700 | |
| | | | | | | | |
| | | | | | | 14,200,773 | |
| | | | | | | | |
| Consumer, Non-cyclical — 29.1% | |
| Beverages — 7.9% | |
Carlsberg A/S Class B | | | 12,609 | | | | 1,239,649 | |
Diageo PLC | | | 131,619 | | | | 3,831,761 | |
Dr. Pepper Snapple Group, Inc. | | | 23,570 | | | | 1,041,322 | |
Heineken NV | | | 58,715 | | | | 3,916,462 | |
Pernod-Ricard SA | | | 16,210 | | | | 1,906,082 | |
| | | | | | | | |
| | | | | | | 11,935,276 | |
| | | | | | | | |
| Commercial Services — 2.7% | |
Adecco SA (a) | | | 17,770 | | | | 941,911 | |
Visa, Inc. Class A | | | 20,470 | | | | 3,102,843 | |
| | | | | | | | |
| | | | | | | 4,044,754 | |
| | | | | | | | |
| Cosmetics & Personal Care — 2.1% | |
Beiersdorf AG | | | 6,305 | | | | 515,180 | |
Colgate-Palmolive Co. | | | 20,450 | | | | 2,137,843 | |
The Procter & Gamble Co. | | | 8,140 | | | | 552,625 | |
| | | | | | | | |
| | | | | | | 3,205,648 | |
| | | | | | | | |
| Foods — 5.3% | |
Danone SA | | | 41,228 | | | | 2,723,919 | |
The J.M. Smucker Co. | | | 7,350 | | | | 633,864 | |
Nestle SA | | | 68,531 | | | | 4,466,447 | |
Tesco PLC | | | 55,530 | | | | 305,044 | |
| | | | | | | | |
| | | | | | | 8,129,274 | |
| | | | | | | | |
| Health Care – Products — 3.7% | |
Johnson & Johnson | | | 14,360 | | | | 1,006,636 | |
Medtronic, Inc. | | | 39,790 | | | | 1,632,186 | |
Sonova Holding AG (a) | | | 7,934 | | | | 878,985 | |
St. Jude Medical, Inc. | | | 59,940 | | | | 2,166,232 | |
| | | | | | | | |
| | | | | | | 5,684,039 | |
| | | | | | | | |
| Household Products — 2.5% | |
Reckitt Benckiser Group PLC | | | 59,547 | | | | 3,730,246 | |
| | | | | | | | |
| Pharmaceuticals — 4.9% | |
Bayer AG | | | 33,339 | | | | 3,165,955 | |
DENTSPLY International, Inc. | | | 29,030 | | | | 1,149,878 | |
Merck KGaA | | | 14,880 | | | | 1,963,236 | |
Roche Holding AG | | | 5,685 | | | | 1,158,176 | |
| | | | | | | | |
| | | | | | | 7,437,245 | |
| | | | | | | | |
| | | | | | | 44,166,482 | |
| | | | | | | | |
| Diversified — 2.0% | |
| Holding Company – Diversified — 2.0% | |
LVMH Moet Hennessy Louis Vuitton SA | | | 16,002 | | | | 2,981,927 | |
| | | | | | | | |
The accompanying notes are an integral part of the financial statements.
82
MML Global Fund – Portfolio of Investments (Continued)
| | | | | | | | |
| | | Number of
Shares | | | Value | |
| Energy — 2.9% | |
| Oil & Gas — 0.6% | |
Inpex Corp. | | | 176 | | | $ | 939,286 | |
| | | | | | | | |
| Oil & Gas Services — 2.3% | |
National Oilwell Varco, Inc. | | | 21,990 | | | | 1,503,016 | |
Schlumberger Ltd. | | | 28,140 | | | | 1,949,821 | |
| | | | | | | | |
| | | | | | | 3,452,837 | |
| | | | | | | | |
| | | | | | | 4,392,123 | |
| | | | | | | | |
| Financial — 13.0% | |
| Banks — 8.4% | |
Banco Santander SA ADS (Brazil) (b) | | | 52,580 | | | | 382,257 | |
Bank of New York Mellon Corp. | | | 90,720 | | | | 2,331,504 | |
Credicorp Ltd. (b) | | | 3,640 | | | | 533,478 | |
Erste Group Bank AG (a) | | | 27,406 | | | | 876,321 | |
ICICI Bank Ltd. Sponsored ADR (India) | | | 21,640 | | | | 943,720 | |
Itau Unibanco Holding SA Sponsored ADR (Brazil) | | | 58,940 | | | | 970,152 | |
Julius Baer Group Ltd. (a) | | | 31,479 | | | | 1,132,572 | |
Komercni Banka AS | | | 3,719 | | | | 786,895 | |
Standard Chartered PLC | | | 90,182 | | | | 2,285,994 | |
State Street Corp. | | | 55,280 | | | | 2,598,713 | |
| | | | | | | | |
| | | | | | | 12,841,606 | |
| | | | | | | | |
| Diversified Financial — 3.8% | |
Aeon Credit Service Co. Ltd. (b) | | | 25,500 | | | | 514,849 | |
American Express Co. | | | 25,270 | | | | 1,452,520 | |
Deutsche Boerse AG | | | 14,665 | | | | 895,093 | |
The Goldman Sachs Group, Inc. | | | 12,040 | | | | 1,535,822 | |
UBS AG (a) | | | 87,698 | | | | 1,379,154 | |
| | | | | | | | |
| | | | | | | 5,777,438 | |
| | | | | | | | |
| Insurance — 0.8% | |
Swiss Re AG (a) | | | 16,210 | | | | 1,183,075 | |
| | | | | | | | |
| | | | | | | 19,802,119 | |
| | | | | | | | |
| Industrial — 16.8% | |
| Aerospace & Defense — 1.8% | |
United Technologies Corp. | | | 33,280 | | | | 2,729,293 | |
| | | | | | | | |
| Electrical Components & Equipment — 2.8% | |
Legrand SA | | | 45,867 | | | | 1,935,899 | |
Schneider Electric SA | | | 30,479 | | | | 2,273,232 | |
| | | | | | | | |
| | | | | | | 4,209,131 | |
| | | | | | | | |
| Electronics — 2.8% | |
Amphenol Corp. Class A | | | 22,030 | | | | 1,425,341 | |
Hoya Corp. | | | 60,800 | | | | 1,197,088 | |
Waters Corp. (a) | | | 18,580 | | | | 1,618,690 | |
| | | | | | | | |
| | | | | | | 4,241,119 | |
| | | | | | | | |
| Health Care – Services — 1.9% | |
Thermo Fisher Scientific, Inc. | | | 45,340 | | | | 2,891,785 | |
| | | | | | | | |
| Machinery – Diversified — 0.2% | |
Rockwell Automation, Inc. | | | 4,330 | | | | 363,677 | |
| | | | | | | | |
| | | | | | | | |
| | | Number of
Shares | | | Value | |
| Manufacturing — 3.8% | |
3M Co. | | | 27,280 | | | $ | 2,532,948 | |
Honeywell International, Inc. | | | 50,400 | | | | 3,198,888 | |
| | | | | | | | |
| | | | | | | 5,731,836 | |
| | | | | | | | |
| Transportation — 3.5% | |
Canadian National Railway Co. | | | 28,510 | | | | 2,594,695 | |
Kuehne & Nagel International AG | | | 2,880 | | | | 350,498 | |
United Parcel Service, Inc. Class B | | | 32,560 | | | | 2,400,649 | |
| | | | | | | | |
| | | | | | | 5,345,842 | |
| | | | | | | | |
| | | | | | | 25,512,683 | |
| | | | | | | | |
| Technology — 8.4% | |
| Computers — 1.9% | |
Accenture PLC Class A | | | 44,280 | | | | 2,944,620 | |
| | | | | | | | |
| Internet — 0.4% | |
Check Point Software Technologies Ltd. (a) | | | 12,020 | | | | 572,633 | |
| | | | | | | | |
| Office Equipment/Supplies — 0.9% | |
Canon, Inc. (b) | | | 33,800 | | | | 1,325,709 | |
| | | | | | | | |
| Semiconductors — 2.2% | |
Altera Corp. | | | 26,000 | | | | 895,440 | |
Microchip Technology, Inc. | | | 29,080 | | | | 947,717 | |
Samsung Electronics Co., Ltd. | | | 1,080 | | | | 1,545,724 | |
| | | | | | | | |
| | | | | | | 3,388,881 | |
| | | | | | | | |
| Software — 3.0% | |
Autodesk, Inc. (a) | | | 22,830 | | | | 807,040 | |
Dassault Systemes SA | | | 5,250 | | | | 587,713 | |
Oracle Corp. | | | 92,200 | | | | 3,072,104 | |
| | | | | | | | |
| | | | | | | 4,466,857 | |
| | | | | | | | |
| | | | | | | 12,698,700 | |
| | | | | | | | |
| Utilities — 0.3% | |
| Electric — 0.3% | |
Red Electrica Corp. SA (b) | | | 9,116 | | | | 450,399 | |
| | | | | | | | |
| | |
TOTAL COMMON STOCK
(Cost $112,206,112) | | | | | | | 148,642,014 | |
| | | | | | | | |
| | |
TOTAL EQUITIES
(Cost $112,206,112) | | | | | | | 148,642,014 | |
| | | | | | | | |
|
| MUTUAL FUNDS — 1.9% | |
| Diversified Financial — 1.9% | |
State Street Navigator Securities Lending Prime Portfolio (c) | | | 2,879,151 | | | | 2,879,151 | |
| | | | | | | | |
| | |
TOTAL MUTUAL FUNDS
(Cost $2,879,151) | | | | | | | 2,879,151 | |
| | | | | | | | |
| | |
TOTAL LONG-TERM INVESTMENTS
(Cost $115,085,263) | | | | | | | 151,521,165 | |
| | | | | | | | |
The accompanying notes are an integral part of the financial statements.
83
MML Global Fund – Portfolio of Investments (Continued)
| | | | | | | | |
| | | Principal
Amount | | | Value | |
| SHORT-TERM INVESTMENTS — 2.0% | |
| Repurchase Agreement — 2.0% | |
State Street Bank & Trust Co. Repurchase Agreement, dated 12/31/12, 0.010%, due 1/02/13 (d) | | $ | 3,107,137 | | | $ | 3,107,137 | |
| | | | | | | | |
| Time Deposits — 0.0% | |
Euro Time Deposit
0.010% 1/02/13 | | | 9,109 | | | | 9,109 | |
| | | | | | | | |
| | |
TOTAL SHORT-TERM INVESTMENTS
(Cost $3,116,246) | | | | | | | 3,116,246 | |
| | | | | | | | |
| | |
TOTAL INVESTMENTS — 101.9%
(Cost $118,201,509) (e) | | | | | | | 154,637,411 | |
| | |
| Other Assets/(Liabilities) — (1.9)% | | | | | | | (2,942,216 | ) |
| | | | | | | | |
| | |
| NET ASSETS — 100.0% | | | | | | $ | 151,695,195 | |
| | | | | | | | |
Notes to Portfolio of Investments
| ADR | American Depositary Receipt |
| ADS | American Depositary Share |
| (a) | Non-income producing security. |
| (b) | Denotes all or a portion of security on loan. The total value of securities on loan as of December 31, 2012, was $2,749,154. Total securities on loan may not correspond with the amounts identified in the Portfolio of Investments because pending sales may be in the process of recall from the brokers. (Note 2). |
| (c) | Represents investment of security lending collateral. (Note 2). |
| (d) | Maturity value of $3,107,140. Collateralized by U.S. Government Agency obligations with a rate of 3.000%, maturity date of 12/01/26, and an aggregate market value, including accrued interest, of $3,171,966. |
| (e) | See Note 6 for aggregate cost for federal tax purposes. |
The accompanying notes are an integral part of the financial statements.
84
MML Growth & Income Fund – Portfolio of Investments
December 31, 2012
| | | | | | | | |
| | | Number of
Shares | | | Value | |
| EQUITIES — 99.2% | | | | | | | | |
| | |
| COMMON STOCK — 99.2% | | | | | | | | |
| Basic Materials — 3.2% | | | | | | | | |
| Chemicals — 3.2% | | | | | | | | |
Celanese Corp. Series A | | | 20,770 | | | $ | 924,888 | |
Linde AG | | | 7,323 | | | | 1,277,054 | |
Praxair, Inc. | | | 11,717 | | | | 1,282,426 | |
The Sherwin-Williams Co. | | | 4,117 | | | | 633,277 | |
| | | | | | | | |
| | | | | | | 4,117,645 | |
| | | | | | | | |
| Communications — 6.4% | | | | | | | | |
| Internet — 2.2% | | | | | | | | |
Facebook, Inc. Class A (a) | | | 8,750 | | | | 233,012 | |
Google, Inc. Class A (a) | | | 3,715 | | | | 2,635,310 | |
| | | | | | | | |
| | | | | | | 2,868,322 | |
| | | | | | | | |
| Media — 3.4% | | | | | | | | |
Comcast Corp. Class A | | | 40,560 | | | | 1,516,133 | |
The Walt Disney Co. | | | 56,187 | | | | 2,797,550 | |
| | | | | | | | |
| | | | | | | 4,313,683 | |
| | | | | | | | |
| Telecommunications — 0.8% | | | | | | | | |
AT&T, Inc. | | | 29,484 | | | | 993,906 | |
| | | | | | | | |
| | | | | | | 8,175,911 | |
| | | | | | | | |
| Consumer, Cyclical — 7.6% | | | | | | | | |
| Apparel — 1.8% | | | | | | | | |
Nike, Inc. Class B | | | 22,846 | | | | 1,178,853 | |
VF Corp. | | | 7,680 | | | | 1,159,450 | |
| | | | | | | | |
| | | | | | | 2,338,303 | |
| | | | | | | | |
| Auto Manufacturers — 0.6% | | | | | | | | |
Bayerische Motoren Werke AG | | | 8,166 | | | | 787,545 | |
| | | | | | | | |
| Automotive & Parts — 0.5% | | | | | | | | |
Delphi Automotive PLC (a) | | | 16,740 | | | | 640,305 | |
| | | | | | | | |
| Distribution & Wholesale — 0.7% | | | | | | | | |
W.W. Grainger, Inc. | | | 4,280 | | | | 866,144 | |
| | | | | | | | |
| Retail — 4.0% | | | | | | | | |
Hennes & Mauritz AB Class B | | | 22,610 | | | | 785,682 | |
Kohl’s Corp. | | | 28,603 | | | | 1,229,357 | |
McDonald’s Corp. | | | 14,890 | | | | 1,313,447 | |
Target Corp. | | | 31,298 | | | | 1,851,903 | |
| | | | | | | | |
| | | | | | | 5,180,389 | |
| | | | | | | | |
| | | | | | | 9,812,686 | |
| | | | | | | | |
| Consumer, Non-cyclical — 24.8% | | | | | | | | |
| Agriculture — 1.6% | | | | | | | | |
Philip Morris International, Inc. | | | 24,083 | | | | 2,014,302 | |
| | | | | | | | |
| | | | | | | | |
| | | Number of
Shares | | | Value | |
| Beverages — 2.2% | | | | | | | | |
Diageo PLC | | | 50,859 | | | $ | 1,480,634 | |
Heineken NV | | | 20,024 | | | | 1,335,659 | |
| | | | | | | | |
| | | | | | | 2,816,293 | |
| | | | | | | | |
| Biotechnology — 0.8% | | | | | | | | |
Celgene Corp. (a) | | | 12,550 | | | | 987,936 | |
| | | | | | | | |
| Commercial Services — 3.0% | | | | | | | | |
MasterCard, Inc. Class A | | | 3,342 | | | | 1,641,858 | |
Visa, Inc. Class A | | | 14,690 | | | | 2,226,710 | |
| | | | | | | | |
| | | | | | | 3,868,568 | |
| | | | | | | | |
| Cosmetics & Personal Care — 2.7% | | | | | | | | |
Colgate-Palmolive Co. | | | 12,494 | | | | 1,306,123 | |
The Procter & Gamble Co. | | | 33,048 | | | | 2,243,628 | |
| | | | | | | | |
| | | | | | | 3,549,751 | |
| | | | | | | | |
| Foods — 2.9% | | | | | | | | |
Danone SA | | | 28,340 | | | | 1,872,413 | |
General Mills, Inc. | | | 21,258 | | | | 859,036 | |
Mondelez International, Inc. Class A | | | 38,580 | | | | 982,633 | |
| | | | | | | | |
| | | | | | | 3,714,082 | |
| | | | | | | | |
| Health Care – Products — 6.7% | | | | | | | | |
Baxter International, Inc. | | | 14,557 | | | | 970,370 | |
Covidien PLC | | | 37,250 | | | | 2,150,815 | |
Johnson & Johnson | | | 41,308 | | | | 2,895,691 | |
Medtronic, Inc. | | | 22,578 | | | | 926,149 | |
St. Jude Medical, Inc. | | | 47,208 | | | | 1,706,097 | |
| | | | | | | | |
| | | | | | | 8,649,122 | |
| | | | | | | | |
| Household Products — 0.9% | | | | | | | | |
Reckitt Benckiser Group PLC | | | 19,564 | | | | 1,225,562 | |
| | | | | | | | |
| Pharmaceuticals — 4.0% | | | | | | | | |
Gilead Sciences, Inc. (a) | | | 14,344 | | | | 1,053,567 | |
Pfizer, Inc. | | | 126,060 | | | | 3,161,585 | |
Valeant Pharmaceuticals International, Inc. (a) | | | 14,800 | | | | 884,596 | |
| | | | | | | | |
| | | | | | | 5,099,748 | |
| | | | | | | | |
| | | | | | | 31,925,364 | |
| | | | | | | | |
| Diversified — 1.1% | | | | | | | | |
| Holding Company – Diversified — 1.1% | | | | | |
LVMH Moet Hennessy Louis Vuitton SA | | | 7,344 | | | | 1,368,534 | |
| | | | | | | | |
| Energy — 10.4% | | | | | | | | |
| Oil & Gas — 6.7% | | | | | | | | |
Chevron Corp. | | | 19,731 | | | | 2,133,710 | |
EOG Resources, Inc. | | | 14,490 | | | | 1,750,247 | |
Exxon Mobil Corp. | | | 36,009 | | | | 3,116,579 | |
Occidental Petroleum Corp. | | | 21,331 | | | | 1,634,168 | |
| | | | | | | | |
| | | | | | | 8,634,704 | |
| | | | | | | | |
The accompanying notes are an integral part of the financial statements.
85
MML Growth & Income Fund – Portfolio of Investments (Continued)
| | | | | | | | |
| | | Number of
Shares | | | Value | |
| Oil & Gas Services — 3.7% | | | | | | | | |
Cameron International Corp. (a) | | | 20,980 | | | $ | 1,184,531 | |
Dresser-Rand Group, Inc. (a) | | | 25,990 | | | | 1,459,078 | |
National Oilwell Varco, Inc. | | | 16,896 | | | | 1,154,842 | |
Schlumberger Ltd. | | | 14,007 | | | | 970,545 | |
| | | | | | | | |
| | | | | | | 4,768,996 | |
| | | | | | | | |
| | | | | | | 13,403,700 | |
| | | | | | | | |
| Financial — 15.7% | | | | | | | | |
| Banks — 3.7% | | | | | | | | |
Bank of America Corp. | | | 110,003 | | | | 1,276,035 | |
Bank of New York Mellon Corp. | | | 26,346 | | | | 677,092 | |
State Street Corp. | | | 12,762 | | | | 599,941 | |
Wells Fargo & Co. | | | 65,760 | | | | 2,247,677 | |
| | | | | | | | |
| | | | | | | 4,800,745 | |
| | | | | | | | |
| Diversified Financial — 8.9% | | | | | | | | |
American Express Co. | | | 34,988 | | | | 2,011,110 | |
BlackRock, Inc. | | | 10,610 | | | | 2,193,193 | |
Franklin Resources, Inc. | | | 12,063 | | | | 1,516,319 | |
The Goldman Sachs Group, Inc. | | | 17,949 | | | | 2,289,575 | |
JP Morgan Chase & Co. | | | 76,932 | | | | 3,382,700 | |
| | | | | | | | |
| | | | | | | 11,392,897 | |
| | | | | | | | |
| Insurance — 1.8% | | | | | | | | |
ACE Ltd. | | | 29,290 | | | | 2,337,342 | |
| | | | | | | | |
| Real Estate Investment Trusts (REITS) — 1.3% | | | | | |
American Tower Corp. | | | 21,462 | | | | 1,658,369 | |
| | | | | | | | |
| | | | | | | 20,189,353 | |
| | | | | | | | |
| Industrial — 12.9% | | | | | | | | |
| Aerospace & Defense — 1.7% | | | | | | | | |
United Technologies Corp. | | | 27,032 | | | | 2,216,894 | |
| | | | | | | | |
| Engineering & Construction — 0.9% | | | | | | | | |
Fluor Corp. | | | 19,870 | | | | 1,167,164 | |
| | | | | | | | |
| Hand & Machine Tools — 0.9% | | | | | | | | |
Stanley Black & Decker, Inc. | | | 16,020 | | | | 1,184,999 | |
| | | | | | | | |
| Health Care – Services — 1.5% | | | | | | | | |
Thermo Fisher Scientific, Inc. | | | 29,600 | | | | 1,887,888 | |
| | | | | | | | |
| Manufacturing — 4.3% | | | | | | | | |
Danaher Corp. | | | 60,972 | | | | 3,408,335 | |
Honeywell International, Inc. | | | 32,970 | | | | 2,092,606 | |
| | | | | | | | |
| | | | | | | 5,500,941 | |
| | | | | | | | |
| Metal Fabricate & Hardware — 1.4% | | | | | |
Precision Castparts Corp. | | | 9,390 | | | | 1,778,654 | |
| | | | | | | | |
| Transportation — 2.2% | | | | | | | | |
Canadian National Railway Co. | | | 17,169 | | | | 1,562,550 | |
United Parcel Service, Inc. Class B | | | 17,460 | | | | 1,287,326 | |
| | | | | | | | |
| | | | | | | 2,849,876 | |
| | | | | | | | |
| | | | | | | 16,586,416 | |
| | | | | | | | |
| | | | | | | | |
| | | Number of
Shares | | | Value | |
| Technology — 14.0% | | | | | | | | |
| Computers — 7.8% | | | | | | | | |
Accenture PLC Class A | | | 22,080 | | | $ | 1,468,320 | |
Apple, Inc. | | | 9,107 | | | | 4,854,304 | |
Cognizant Technology Solutions Corp. Class A (a) | | | 14,890 | | | | 1,102,604 | |
EMC Corp. (a) | | | 101,519 | | | | 2,568,431 | |
| | | | | | | | |
| | | | | | | 9,993,659 | |
| | | | | | | | |
| Internet — 0.8% | | | | | | | | |
Check Point Software Technologies
Ltd. (a) | | | 22,450 | | | | 1,069,518 | |
| | | | | | | | |
| Semiconductors — 3.1% | | | | | | | | |
Altera Corp. | | | 44,610 | | | | 1,536,368 | |
ASML Holding NV | | | 6,623 | | | | 426,588 | |
Microchip Technology, Inc. | | | 59,849 | | | | 1,950,479 | |
| | | | | | | | |
| | | | | | | 3,913,435 | |
| | | | | | | | |
| Software — 2.3% | | | | | | | | |
Citrix Systems, Inc. (a) | | | 8,860 | | | | 582,545 | |
Oracle Corp. | | | 70,900 | | | | 2,362,388 | |
| | | | | | | | |
| | | | | | | 2,944,933 | |
| | | | | | | | |
| | | | | | | 17,921,545 | |
| | | | | | | | |
| Utilities — 3.1% | | | | | | | | |
| Electric — 3.1% | | | | | | | | |
Alliant Energy Corp. | | | 20,070 | | | | 881,274 | |
American Electric Power Co., Inc. | | | 30,073 | | | | 1,283,516 | |
CMS Energy Corp. | | | 36,470 | | | | 889,138 | |
Wisconsin Energy Corp. | | | 24,840 | | | | 915,354 | |
| | | | | | | | |
| | | | | | | 3,969,282 | |
| | | | | | | | |
| | |
TOTAL COMMON STOCK
(Cost $103,200,629) | | | | | | | 127,470,436 | |
| | | | | | | | |
| | |
TOTAL EQUITIES
(Cost $103,200,629) | | | | | | | 127,470,436 | |
| | | | | | | | |
| | |
TOTAL LONG-TERM INVESTMENTS
(Cost $103,200,629) | | | | | | | 127,470,436 | |
| | | | | | | | |
| | |
| | | Principal
Amount | | | | |
| |
| SHORT-TERM INVESTMENTS — 0.7% | | | | | |
| Repurchase Agreement — 0.7% | | | | | | | | |
State Street Bank & Trust Co. Repurchase Agreement, dated 12/31/12, 0.010%, due 1/02/13 (b) | | $ | 916,132 | | | | 916,132 | |
| | | | | | | | |
The accompanying notes are an integral part of the financial statements.
86
MML Growth & Income Fund – Portfolio of Investments (Continued)
| | | | | | | | |
| | | Principal
Amount | | | Value | |
| Time Deposits — 0.0% | | | | | | | | |
Euro Time Deposit
0.010% 1/02/13 | | $ | 5,530 | | | $ | 5,530 | |
| | | | | | | | |
| | |
TOTAL SHORT-TERM INVESTMENTS
(Cost $921,662) | | | | | | | 921,662 | |
| | | | | | | | |
| | |
| TOTAL INVESTMENTS — 99.9% (Cost $104,122,291) (c) | | | | | | | 128,392,098 | |
| | |
| Other Assets/(Liabilities) — 0.1% | | | | | | | 108,052 | |
| | | | | | | | |
| | |
| NET ASSETS — 100.0% | | | | | | $ | 128,500,150 | |
| | | | | | | | |
Notes to Portfolio of Investments
| (a) | Non-income producing security. |
| (b) | Maturity value of $916,132. Collateralized by U.S. Government Agency obligations with a rate of 3.000%, maturity date of 12/01/26, and an aggregate market value, including accrued interest, of $934,920. |
| (c) | See Note 6 for aggregate cost for federal tax purposes. |
The accompanying notes are an integral part of the financial statements.
87
MML Income & Growth Fund – Portfolio of Investments
December 31, 2012
| | | | | | | | |
| | | Number of
Shares | | | Value | |
| EQUITIES — 96.3% | | | | | | | | |
| |
| COMMON STOCK — 96.3% | | | | | |
| Basic Materials — 6.9% | | | | | |
| Chemicals — 2.8% | | | | | |
The Dow Chemical Co. | | | 31,590 | | | $ | 1,020,989 | |
E.I. du Pont de Nemours & Co. | | | 51,790 | | | | 2,328,996 | |
Olin Corp. | | | 18,700 | | | | 403,733 | |
Praxair, Inc. | | | 11,610 | | | | 1,270,715 | |
| | | | | | | | |
| | | | | | | 5,024,433 | |
| | | | | | | | |
| Forest Products & Paper — 0.6% | | | | | |
MeadWestvaco Corp. | | | 36,240 | | | | 1,154,969 | |
| | | | | | | | |
| Mining — 3.4% | | | | | |
Barrick Gold Corp. | | | 17,470 | | | | 611,547 | |
BHP Billiton Ltd. | | | 94,490 | | | | 3,690,127 | |
Rio Tinto Ltd. | | | 16,450 | | | | 1,144,984 | |
Southern Copper Corp. | | | 18,712 | | | | 708,436 | |
| | | | | | | | |
| | | | | | | 6,155,094 | |
| | | | | | | | |
| Real Estate Investment Trusts (REITS) — 0.1% | | | | | |
Weyerhaeuser Co. | | | 8,400 | | | | 233,688 | |
| | | | | | | | |
| | | | | | | 12,568,184 | |
| | | | | | | | |
| Communications — 8.2% | | | | | |
| Media — 2.8% | | | | | |
Comcast Corp. Special Class A | | | 71,780 | | | | 2,580,491 | |
Time Warner Cable, Inc. | | | 17,570 | | | | 1,707,628 | |
The Walt Disney Co. | | | 15,850 | | | | 789,172 | |
| | | | | | | | |
| | | | | | | 5,077,291 | |
| | | | | | | | |
| Telecommunications — 5.4% | | | | | |
AT&T, Inc. | | | 91,360 | | | | 3,079,746 | |
BCE, Inc. | | | 14,140 | | | | 607,172 | |
CenturyLink, Inc. | | | 63,276 | | | | 2,475,357 | |
Verizon Communications, Inc. | | | 69,530 | | | | 3,008,563 | |
Vodafone Group PLC Sponsored ADR (United Kingdom) | | | 26,260 | | | | 661,489 | |
| | | | | | | | |
| | | | | | | 9,832,327 | |
| | | | | | | | |
| | | | | | | 14,909,618 | |
| | | | | | | | |
| Consumer, Cyclical — 7.5% | | | | | |
| Apparel — 1.2% | | | | | |
VF Corp. | | | 14,940 | | | | 2,255,492 | |
| | | | | | | | |
| Automotive & Parts — 0.4% | | | | | |
Johnson Controls, Inc. | | | 24,230 | | | | 743,861 | |
| | | | | | | | |
| Retail — 5.3% | | | | | |
The Home Depot, Inc. | | | 61,170 | | | | 3,783,365 | |
Limited Brands, Inc. | | | 46,940 | | | | 2,208,996 | |
McDonald’s Corp. | | | 29,780 | | | | 2,626,894 | |
Wal-Mart Stores, Inc. | | | 15,040 | | | | 1,026,179 | |
| | | | | | | | |
| | | | | | | 9,645,434 | |
| | | | | | | | |
| | | | | | | | |
| | | Number of
Shares | | | Value | |
| Toys, Games & Hobbies — 0.6% | | | | | |
Mattel, Inc. | | | 28,360 | | | $ | 1,038,543 | |
| | | | | | | | |
| | | | | | | 13,683,330 | |
| | | | | | | | |
| Consumer, Non-cyclical — 18.9% | | | | | |
| Agriculture — 3.2% | | | | | |
Altria Group, Inc. | | | 30,590 | | | | 961,138 | |
Lorillard, Inc. | | | 12,210 | | | | 1,424,541 | |
Philip Morris International, Inc. | | | 40,380 | | | | 3,377,383 | |
| | | | | | | | |
| | | | | | | 5,763,062 | |
| | | | | | | | |
| Beverages — 2.4% | | | | | |
The Coca-Cola Co. | | | 59,870 | | | | 2,170,288 | |
Diageo PLC | | | 77,330 | | | | 2,251,271 | |
| | | | | | | | |
| | | | | | | 4,421,559 | |
| | | | | | | | |
| Commercial Services — 0.2% | | | | | |
Automatic Data Processing, Inc. | | | 8,080 | | | | 460,641 | |
| | | | | | | | |
| Cosmetics & Personal Care — 1.1% | | | | | |
The Procter & Gamble Co. | | | 30,890 | | | | 2,097,122 | |
| | | | | | | | |
| Foods — 3.8% | | | | | |
General Mills, Inc. | | | 35,640 | | | | 1,440,213 | |
H.J. Heinz Co. | | | 18,880 | | | | 1,088,998 | |
Kraft Foods Group, Inc. | | | 18,366 | | | | 835,102 | |
Mondelez International, Inc. Class A | | | 55,100 | | | | 1,403,397 | |
Unilever NV NY Shares | | | 55,020 | | | | 2,107,266 | |
| | | | | | | | |
| | | | | | | 6,874,976 | |
| | | | | | | | |
| Health Care – Products — 1.4% | | | | | |
Johnson & Johnson | | | 37,650 | | | | 2,639,265 | |
| | | | | | | | |
| Health Care – Services — 0.5% | | | | | |
Quest Diagnostics, Inc. | | | 15,590 | | | | 908,429 | |
| | | | | | | | |
| Household Products — 0.8% | | | | | |
Kimberly-Clark Corp. | | | 17,160 | | | | 1,448,819 | |
| | | | | | | | |
| Pharmaceuticals — 5.5% | | | | | |
Abbott Laboratories | | | 18,470 | | | | 1,209,785 | |
Bristol-Myers Squibb Co. | | | 44,820 | | | | 1,460,684 | |
Mead Johnson Nutrition Co. | | | 8,163 | | | | 537,860 | |
Merck & Co., Inc. | | | 66,930 | | | | 2,740,114 | |
Pfizer, Inc. | | | 159,600 | | | | 4,002,768 | |
| | | | | | | | |
| | | | | | | 9,951,211 | |
| | | | | | | | |
| | | | | | | 34,565,084 | |
| | | | | | | | |
| Energy — 12.3% | | | | | |
| Coal — 0.1% | | | | | |
CONSOL Energy, Inc. | | | 4,300 | | | | 138,030 | |
Peabody Energy Corp. | | | 3,700 | | | | 98,457 | |
| | | | | | | | |
| | | | | | | 236,487 | |
| | | | | | | | |
| Oil & Gas — 9.9% | | | | | |
Chevron Corp. | | | 50,680 | | | | 5,480,535 | |
ConocoPhillips | | | 15,900 | | | | 922,041 | |
EQT Corp. | | | 11,700 | | | | 690,066 | |
The accompanying notes are an integral part of the financial statements.
88
MML Income & Growth Fund – Portfolio of Investments (Continued)
| | | | | | | | |
| | | Number of
Shares | | | Value | |
Exxon Mobil Corp. | | | 44,720 | | | $ | 3,870,516 | |
Marathon Oil Corp. | | | 32,710 | | | | 1,002,889 | |
Marathon Petroleum Corp. | | | 16,760 | | | | 1,055,880 | |
Occidental Petroleum Corp. | | | 17,570 | | | | 1,346,038 | |
Phillips 66 | | | 10,250 | | | | 544,275 | |
Royal Dutch Shell PLC Class A | | | 15,040 | | | | 531,431 | |
Total SA Sponsored ADR (France) | | | 50,080 | | | | 2,604,661 | |
| | | | | | | | |
| | | | | | | 18,048,332 | |
| | | | | | | | |
| Oil & Gas Services — 0.5% | | | | | |
Schlumberger Ltd. | | | 12,720 | | | | 881,369 | |
| | | | | | | | |
| Pipelines — 1.8% | | | | | |
Enbridge, Inc. | | | 60,370 | | | | 2,610,955 | |
Spectra Energy Corp. | | | 26,450 | | | | 724,201 | |
| | | | | | | | |
| | | | | | | 3,335,156 | |
| | | | | | | | |
| | | | | | | 22,501,344 | |
| | | | | | | | |
| Financial — 16.1% | | | | | |
| Banks — 8.0% | | | | | |
Bank of Nova Scotia | | | 31,590 | | | | 1,824,833 | |
Fifth Third Bancorp | | | 45,114 | | | | 685,282 | |
M&T Bank Corp. | | | 4,340 | | | | 427,360 | |
National Bank of Canada | | | 26,250 | | | | 2,038,353 | |
The Toronto-Dominion Bank | | | 22,240 | | | | 1,872,524 | |
U.S. Bancorp | | | 80,460 | | | | 2,569,893 | |
Wells Fargo & Co. | | | 149,900 | | | | 5,123,582 | |
| | | | | | | | |
| | | | | | | 14,541,827 | |
| | | | | | | | |
| Diversified Financial — 4.0% | | | | | |
American Express Co. | | | 34,120 | | | | 1,961,217 | |
JP Morgan Chase & Co. | | | 120,740 | | | | 5,308,938 | |
| | | | | | | | |
| | | | | | | 7,270,155 | |
| | | | | | | | |
| Insurance — 4.1% | | | | | |
ACE Ltd. | | | 15,950 | | | | 1,272,810 | |
The Chubb Corp. | | | 25,500 | | | | 1,920,660 | |
Prudential Financial, Inc. | | | 33,210 | | | | 1,771,089 | |
The Travelers Cos., Inc. | | | 36,600 | | | | 2,628,612 | |
| | | | | | | | |
| | | | | | | 7,593,171 | |
| | | | | | | | |
| | | | | | | 29,405,153 | |
| | | | | | | | |
| Industrial — 14.5% | | | | | |
| Aerospace & Defense — 4.6% | | | | | |
General Dynamics Corp. | | | 21,200 | | | | 1,468,524 | |
Northrop Grumman Corp. | | | 23,620 | | | | 1,596,240 | |
Raytheon Co. | | | 42,500 | | | | 2,446,300 | |
Rockwell Collins, Inc. | | | 6,260 | | | | 364,144 | |
United Technologies Corp. | | | 31,590 | | | | 2,590,696 | |
| | | | | | | | |
| | | | | | | 8,465,904 | |
| | | | | | | | |
| Machinery – Construction & Mining — 1.6% | | | | | |
Caterpillar, Inc. | | | 33,620 | | | | 3,011,680 | |
| | | | | | | | |
| | | | | | | | |
| | | Number of
Shares | | | Value | |
| Machinery – Diversified — 2.1% | | | | | |
Deere & Co. | | | 37,350 | | | $ | 3,227,787 | |
Rockwell Automation, Inc. | | | 7,160 | | | | 601,368 | |
| | | | | | | | |
| | | | | | | 3,829,155 | |
| | | | | | | | |
| Manufacturing — 3.3% | | | | | |
3M Co. | | | 16,450 | | | | 1,527,382 | |
General Electric Co. | | | 142,640 | | | | 2,994,014 | |
Honeywell International, Inc. | | | 24,130 | | | | 1,531,531 | |
| | | | | | | | |
| | | | | | | 6,052,927 | |
| | | | | | | | |
| Packaging & Containers — 0.2% | | | | | |
Packaging Corporation of America | | | 7,600 | | | | 292,372 | |
| | | | | | | | |
| Transportation — 2.7% | | | | | |
Canadian National Railway Co. | | | 23,520 | | | | 2,140,555 | |
Union Pacific Corp. | | | 11,410 | | | | 1,434,465 | |
United Parcel Service, Inc. Class B | | | 18,070 | | | | 1,332,301 | |
| | | | | | | | |
| | | | | | | 4,907,321 | |
| | | | | | | | |
| | | | | | | 26,559,359 | |
| | | | | | | | |
| Technology — 4.0% | | | | | |
| Computers — 1.9% | | | | | |
International Business Machines Corp. | | | 17,670 | | | | 3,384,688 | |
| | | | | | | | |
| Semiconductors — 0.9% | | | | | |
Intel Corp. | | | 78,640 | | | | 1,622,343 | |
| | | | | | | | |
| Software — 1.2% | | | | | |
Microsoft Corp. | | | 83,790 | | | | 2,239,707 | |
| | | | | | | | |
| | | | | | | 7,246,738 | |
| | | | | | | | |
| Utilities — 7.9% | | | | | |
| Electric — 6.6% | | | | | |
American Electric Power Co., Inc. | | | 19,380 | | | | 827,138 | |
Consolidated Edison, Inc. | | | 6,860 | | | | 381,004 | |
Dominion Resources, Inc. | | | 32,310 | | | | 1,673,658 | |
Duke Energy Corp. | | | 12,100 | | | | 771,980 | |
Edison International | | | 16,860 | | | | 761,903 | |
FirstEnergy Corp. | | | 23,040 | | | | 962,150 | |
ITC Holdings Corp. | | | 5,450 | | | | 419,160 | |
NextEra Energy, Inc. | | | 24,430 | | | | 1,690,312 | |
Northeast Utilities | | | 18,770 | | | | 733,532 | |
PPL Corp. | | | 13,940 | | | | 399,102 | |
Public Service Enterprise Group, Inc. | | | 37,030 | | | | 1,133,118 | |
The Southern Co. | | | 37,650 | | | | 1,611,797 | |
Wisconsin Energy Corp. | | | 19,480 | | | | 717,838 | |
| | | | | | | | |
| | | | | | | 12,082,692 | |
| | | | | | | | |
| Gas — 0.5% | | | | | |
Sempra Energy | | | 11,410 | | | | 809,425 | |
| | | | | | | | |
| Pipelines — 0.2% | | | | | |
Kinder Morgan, Inc. | | | 9,590 | | | | 338,815 | |
| | | | | | | | |
The accompanying notes are an integral part of the financial statements.
89
MML Income & Growth Fund – Portfolio of Investments (Continued)
| | | | | | | | |
| | | Number of
Shares | | | Value | |
| Water — 0.6% | | | | | |
American Water Works Co., Inc. | | | 31,290 | | | $ | 1,161,798 | |
| | | | | | | | |
| | | | | | | 14,392,730 | |
| | | | | | | | |
| | |
TOTAL COMMON STOCK
(Cost $151,491,363) | | | | | | | 175,831,540 | |
| | | | | | | | |
| | |
TOTAL EQUITIES
(Cost $151,491,363) | | | | | | | 175,831,540 | |
| | | | | | | | |
| | |
TOTAL LONG-TERM INVESTMENTS
(Cost $151,491,363) | | | | | | | 175,831,540 | |
| | | | | | | | |
| | |
| | | Principal
Amount | | | | |
| |
| SHORT-TERM INVESTMENTS — 3.9% | | | | | |
| Repurchase Agreement — 3.9% | | | | | |
State Street Bank & Trust Co. Repurchase Agreement, dated 12/31/12, 0.010%, due 1/02/13 (a) | | $ | 7,079,636 | | | | 7,079,636 | |
| | | | | | | | |
| Time Deposits — 0.0% | | | | | |
Euro Time Deposit
0.010% 1/02/13 | | | 7,514 | | | | 7,514 | |
| | | | | | | | |
| | |
TOTAL SHORT-TERM INVESTMENTS
(Cost $7,087,150) | | | | | | | 7,087,150 | |
| | | | | | | | |
| | |
TOTAL INVESTMENTS — 100.2%
(Cost $158,578,513) (b) | | | | | | | 182,918,690 | |
| | |
| Other Assets/(Liabilities) — (0.2)% | | | | | | | (429,534 | ) |
| | | | | | | | |
| | |
| NET ASSETS — 100.0% | | | | | | $ | 182,489,156 | |
| | | | | | | | |
Notes to Portfolio of Investments
| ADR | American Depositary Receipt |
| (a) | Maturity value of $7,079,640. Collateralized by U.S. Government Agency obligations with a rate of 3.000%, maturity date of 12/01/26, and an aggregate market value, including accrued interest, of $7,224,112. |
| (b) | See Note 6 for aggregate cost for federal tax purposes. |
The accompanying notes are an integral part of the financial statements.
90
MML Large Cap Growth Fund – Portfolio of Investments
December 31, 2012
| | | | | | | | |
| | | Number of
Shares | | | Value | |
| EQUITIES — 97.4% | | | | | |
| |
| COMMON STOCK — 97.4% | | | | | |
| Basic Materials — 4.0% | | | | | |
| Chemicals — 4.0% | | | | | |
Ecolab, Inc. | | | 30,570 | | | $ | 2,197,983 | |
Monsanto Co. | | | 40,500 | | | | 3,833,325 | |
Praxair, Inc. | | | 20,260 | | | | 2,217,457 | |
| | | | | | | | |
| | | | | | | 8,248,765 | |
| | | | | | | | |
| Communications — 19.2% | | | | | |
| Internet — 10.2% | | | | | |
Amazon.com, Inc. (a) | | | 14,510 | | | | 3,644,041 | |
eBay, Inc. (a) | | | 103,740 | | | | 5,292,815 | |
F5 Networks, Inc. (a) | | | 27,730 | | | | 2,693,970 | |
Google, Inc. Class A (a) | | | 10,700 | | | | 7,590,259 | |
Priceline.com, Inc. (a) | | | 3,180 | | | | 1,975,416 | |
| | | | | | | | |
| | | | | | | 21,196,501 | |
| | | | | | | | |
| Telecommunications — 3.4% | | | | | |
Crown Castle International Corp. (a) | | | 25,240 | | | | 1,821,318 | |
QUALCOMM, Inc. | | | 83,040 | | | | 5,150,141 | |
| | | | | | | | |
| | | | | | | 6,971,459 | |
| | | | | | | | |
| Media — 5.6% | | | | | |
CBS Corp. Class B | | | 94,400 | | | | 3,591,920 | |
Comcast Corp. Class A | | | 121,060 | | | | 4,525,223 | |
Discovery Communications, Inc. Series A (a) | | | 6,910 | | | | 438,647 | |
The Walt Disney Co. | | | 63,540 | | | | 3,163,656 | |
| | | | | | | | |
| | | | | | | 11,719,446 | |
| | | | | | | | |
| | | | | | | 39,887,406 | |
| | | | | | | | |
| Consumer, Cyclical — 10.6% | | | | | |
| Apparel — 2.1% | | | | | |
Ralph Lauren Corp. | | | 14,960 | | | | 2,242,803 | |
VF Corp. | | | 13,300 | | | | 2,007,901 | |
| | | | | | | | |
| | | | | | | 4,250,704 | |
| | | | | | | | |
| Lodging — 1.2% | | | | | |
Starwood Hotels & Resorts Worldwide, Inc. | | | 45,010 | | | | 2,581,774 | |
| | | | | | | | |
| Retail — 7.3% | | | | | |
Costco Wholesale Corp. | | | 35,130 | | | | 3,469,790 | |
Dollar General Corp. (a) | | | 41,150 | | | | 1,814,303 | |
The Home Depot, Inc. | | | 65,580 | | | | 4,056,123 | |
Michael Kors Holdings Ltd. (a) | | | 42,330 | | | | 2,160,100 | |
Nordstrom, Inc. | | | 37,560 | | | | 2,009,460 | |
Tractor Supply Co. | | | 18,610 | | | | 1,644,380 | |
| | | | | | | | |
| | | | | | | 15,154,156 | |
| | | | | | | | |
| | | | | | | 21,986,634 | |
| | | | | | | | |
| | | | | | | | |
| | | Number of
Shares | | | Value | |
| Consumer, Non-cyclical — 24.9% | | | | | |
| Beverages — 3.0% | | | | | |
Anheuser-Busch InBev NV Sponsored ADR (Belgium) | | | 46,410 | | | $ | 4,056,698 | |
Diageo PLC Sponsored ADR (United Kingdom) | | | 17,530 | | | | 2,043,648 | |
| | | | | | | | |
| | | | | | | 6,100,346 | |
| | | | | | | | |
| Biotechnology — 1.4% | | | | | |
Alexion Pharmaceuticals, Inc. (a) | | | 14,380 | | | | 1,348,988 | |
Illumina, Inc. (a) | | | 28,040 | | | | 1,558,743 | |
| | | | | | | | |
| | | | | | | 2,907,731 | |
| | | | | | | | |
| Commercial Services — 5.7% | | | | | |
MasterCard, Inc. Class A | | | 9,610 | | | | 4,721,201 | |
Verisk Analytics, Inc. Class A (a) | | | 38,050 | | | | 1,940,550 | |
Visa, Inc. Class A | | | 33,720 | | | | 5,111,278 | |
| | | | | | | | |
| | | | | | | 11,773,029 | |
| | | | | | | | |
| Cosmetics & Personal Care — 1.9% | | | | | |
The Estee Lauder Cos., Inc. Class A | | | 66,780 | | | | 3,997,451 | |
| | | | | | | | |
| Foods — 1.7% | | | | | |
Whole Foods Market, Inc. | | | 38,640 | | | | 3,528,991 | |
| | | | | | | | |
| Health Care – Products — 2.3% | | | | | |
Edwards Lifesciences Corp. (a) | | | 20,200 | | | | 1,821,434 | |
Intuitive Surgical, Inc. (a) | | | 5,820 | | | | 2,853,953 | |
| | | | | | | | |
| | | | | | | 4,675,387 | |
| | | | | | | | |
| Health Care – Services — 1.0% | | | | | |
Catamaran Corp. (a) | | | 44,780 | | | | 2,109,586 | |
| | | | | | | | |
| Pharmaceuticals — 7.9% | | | | | |
Allergan, Inc. | | | 49,870 | | | | 4,574,575 | |
Gilead Sciences, Inc. (a) | | | 55,230 | | | | 4,056,643 | |
Novo Nordisk A/S Sponsored ADR (Denmark) | | | 21,670 | | | | 3,536,761 | |
Shire PLC Sponsored ADR (United Kingdom) | | | 20,560 | | | | 1,895,221 | |
Watson Pharmaceuticals, Inc. (a) | | | 27,790 | | | | 2,389,940 | |
| | | | | | | | |
| | | | | | | 16,453,140 | |
| | | | | | | | |
| | | | | | | 51,545,661 | |
| | | | | | | | |
| Energy — 4.6% | | | | | |
| Oil & Gas — 0.9% | | | | | |
Anadarko Petroleum Corp. | | | 24,170 | | | | 1,796,073 | |
| | | | | | | | |
| Oil & Gas Services — 3.7% | | | | | |
Cameron International Corp. (a) | | | 60,400 | | | | 3,410,184 | |
Schlumberger Ltd. | | | 61,850 | | | | 4,285,586 | |
| | | | | | | | |
| | | | | | | 7,695,770 | |
| | | | | | | | |
| | | | | | | 9,491,843 | |
| | | | | | | | |
| Financial — 3.0% | | | | | |
| Diversified Financial — 1.0% | | | | | |
T. Rowe Price Group, Inc. | | | 32,810 | | | | 2,136,915 | |
| | | | | | | | |
The accompanying notes are an integral part of the financial statements.
91
MML Large Cap Growth Fund – Portfolio of Investments (Continued)
| | | | | | | | |
| | | Number of
Shares | | | Value | |
| Real Estate Investment Trusts (REITS) — 2.0% | | | | | |
American Tower Corp. | | | 53,050 | | | $ | 4,099,174 | |
| | | | | | | | |
| | | | | | | 6,236,089 | |
| | | | | | | | |
| Industrial — 11.9% | | | | | |
| Electrical Components & Equipment — 1.7% | | | | | |
AMETEK, Inc. | | | 95,335 | | | | 3,581,736 | |
| | | | | | | | |
| Electronics — 1.3% | | | | | |
Trimble Navigation Ltd. (a) | | | 44,240 | | | | 2,644,667 | |
| | | | | | | | |
| Environmental Controls — 0.5% | | | | | |
Stericycle, Inc. (a) | | | 12,200 | | | | 1,137,894 | |
| | | | | | | | |
| Machinery – Diversified — 1.5% | | | | | |
Cummins, Inc. | | | 27,850 | | | | 3,017,547 | |
| | | | | | | | |
| Manufacturing — 3.2% | | | | | |
Eaton Corp. PLC | | | 54,330 | | | | 2,944,686 | |
Honeywell International, Inc. | | | 58,480 | | | | 3,711,726 | |
| | | | | | | | |
| | | | | | | 6,656,412 | |
| | | | | | | | |
| Metal Fabricate & Hardware — 2.2% | | | | | |
Precision Castparts Corp. | | | 24,250 | | | | 4,593,435 | |
| | | | | | | | |
| Transportation — 1.5% | | | | | |
Kansas City Southern | | | 37,140 | | | | 3,100,447 | |
| | | | | | | | |
| | | | | | | 24,732,138 | |
| | | | | | | | |
| Technology — 19.2% | | | | | |
| Computers — 11.1% | | | | | |
Accenture PLC Class A | | | 64,760 | | | | 4,306,540 | |
Apple, Inc. | | | 21,180 | | | | 11,289,575 | |
EMC Corp. (a) | | | 214,300 | | | | 5,421,790 | |
Teradata Corp. (a) | | | 32,590 | | | | 2,016,995 | |
| | | | | | | | |
| | | | | | | 23,034,900 | |
| | | | | | | | |
| Semiconductors — 0.7% | | | | | |
Avago Technologies Ltd. | | | 47,100 | | | | 1,491,186 | |
| | | | | | | | |
| Software — 7.4% | | | | | |
Citrix Systems, Inc. (a) | | | 36,560 | | | | 2,403,820 | |
Intuit, Inc. | | | 36,890 | | | | 2,194,955 | |
Microsoft Corp. | | | 126,840 | | | | 3,390,433 | |
Red Hat, Inc. (a) | | | 35,210 | | | | 1,864,722 | |
Salesforce.com, Inc. (a) | | | 14,950 | | | | 2,513,095 | |
SAP AG Sponsored ADR (Germany) | | | 36,260 | | | | 2,914,579 | |
| | | | | | | | |
| | | | | | | 15,281,604 | |
| | | | | | | | |
| | | | | | | 39,807,690 | |
| | | | | | | | |
| | |
TOTAL COMMON STOCK
(Cost $177,146,395) | | | | | | | 201,936,226 | |
| | | | | | | | |
| | |
TOTAL EQUITIES
(Cost $177,146,395) | | | | | | | 201,936,226 | |
| | | | | | | | |
| | |
TOTAL LONG-TERM INVESTMENTS
(Cost $177,146,395) | | | | | | | 201,936,226 | |
| | | | | | | | |
| | | | | | | | |
| | | Principal
Amount | | | Value | |
| SHORT-TERM INVESTMENTS — 2.3% | | | | | |
| Repurchase Agreement — 2.3% | | | | | |
State Street Bank & Trust Co. Repurchase Agreement, dated 12/31/12, 0.010%, due 1/02/13 (b) | | $ | 4,808,134 | | | $ | 4,808,134 | |
| | | | | | | | |
| | |
TOTAL SHORT-TERM INVESTMENTS
(Cost $4,808,134) | | | | | | | 4,808,134 | |
| | | | | | | | |
| | |
TOTAL INVESTMENTS — 99.7%
(Cost $181,954,529) (c) | | | | | | | 206,744,360 | |
| | |
| Other Assets/(Liabilities) — 0.3% | | | | | | | 527,690 | |
| | | | | | | | |
| | |
| NET ASSETS — 100.0% | | | | | | $ | 207,272,050 | |
| | | | | | | | |
Notes to Portfolio of Investments
| ADR | American Depositary Receipt |
| (a) | Non-income producing security. |
| (b) | Maturity value of $4,808,137. Collateralized by U.S. Government Agency obligations with a rate of 3.000%, maturity date of 12/01/26, and an aggregate market value, including accrued interest, of $4,907,272. |
| (c) | See Note 6 for aggregate cost for federal tax purposes. |
The accompanying notes are an integral part of the financial statements.
92
MML Large Cap Value Fund – Portfolio of Investments
December 31, 2012
| | | | | | | | |
| | | Number of
Shares | | | Value | |
| EQUITIES — 94.2% | | | | | |
| |
| COMMON STOCK — 94.2% | | | | | |
| Basic Materials — 6.4% | | | | | |
| Chemicals — 5.1% | | | | | |
Air Products & Chemicals, Inc. | | | 38,180 | | | $ | 3,207,884 | |
Ecolab, Inc. | | | 26,270 | | | | 1,888,813 | |
Monsanto Co. | | | 37,650 | | | | 3,563,572 | |
Potash Corp. of Saskatchewan, Inc. | | | 36,196 | | | | 1,472,815 | |
Praxair, Inc. | | | 7,500 | | | | 820,875 | |
| | | | | | | | |
| | | | | | | 10,953,959 | |
| | | | | | | | |
| Forest Products & Paper — 0.0% | | | | | |
Sino-Forest Corp. (a) (b) | | | 152,310 | | | | - | |
Sino-Forest Corp. (Acquired 12/17/09, Cost $61,902) (a) (b) (c) (d) | | | 3,900 | | | | - | |
| | | | | | | | |
| | | | | | | - | |
| | | | | | | | |
| Machinery – Construction & Mining — 1.3% | | | | | |
BHP Billiton PLC | | | 42,200 | | | | 1,482,887 | |
Rio Tinto PLC | | | 23,672 | | | | 1,379,426 | |
| | | | | | | | |
| | | | | | | 2,862,313 | |
| | | | | | | | |
| | | | | | | 13,816,272 | |
| | | | | | | | |
| Communications — 8.2% | | | | | |
| Internet — 5.5% | | | | | |
Google, Inc. Class A (a) | | | 11,845 | | | | 8,402,488 | |
Groupon, Inc. (a) (e) | | | 68,250 | | | | 333,060 | |
Liberty Interactive Corp. Class A (a) | | | 58,650 | | | | 1,154,232 | |
Liberty Ventures Series A (a) | | | 3,944 | | | | 267,245 | |
Netflix, Inc. (a) (e) | | | 17,790 | | | | 1,650,556 | |
| | | | | | | | |
| | | | | | | 11,807,581 | |
| | | | | | | | |
| Media — 2.5% | | | | | |
Grupo Televisa SAB Sponsored ADR (Mexico) (e) | | | 19,710 | | | | 523,892 | |
The Walt Disney Co. | | | 99,270 | | | | 4,942,653 | |
| | | | | | | | |
| | | | | | | 5,466,545 | |
| | | | | | | | |
| Telecommunications — 0.2% | | | | | |
America Movil SAB de CV Sponsored ADR (Mexico) | | | 16,980 | | | | 392,917 | |
| | | | | | | | |
| | | | | | | 17,667,043 | |
| | | | | | | | |
| Consumer, Cyclical — 15.9% | | | | | |
| Auto Manufacturers — 0.9% | | | | | |
Paccar, Inc. | | | 39,710 | | | | 1,795,289 | |
| | | | | | | | |
| Housewares — 0.1% | | | | | |
Hunter Douglas NV | | | 6,765 | | | | 262,853 | |
| | | | | | | | |
| Leisure Time — 0.6% | | | | | |
Harley-Davidson, Inc. | | | 27,630 | | | | 1,349,449 | |
| | | | | | | | |
| Retail — 14.3% | | | | | |
Bed Bath & Beyond, Inc. (a) | | | 95,060 | | | | 5,314,805 | |
CarMax, Inc. (a) | | | 34,070 | | | | 1,278,988 | |
| | | | | | | | |
| | | Number of
Shares | | | Value | |
Cie Financiere Richemont SA | | | 5,300 | | | $ | 423,806 | |
Costco Wholesale Corp. | | | 101,530 | | | | 10,028,118 | |
CVS Caremark Corp. | | | 273,768 | | | | 13,236,683 | |
Tiffany & Co. | | | 10,160 | | | | 582,574 | |
| | | | | | | | |
| | | | | | | 30,864,974 | |
| | | | | | | | |
| | | | | | | 34,272,565 | |
| | | | | | | | |
| Consumer, Non-cyclical — 10.7% | | | | | |
| Agriculture — 0.9% | | | | | |
Philip Morris International, Inc. | | | 23,240 | | | | 1,943,794 | |
| | | | | | | | |
| Beverages — 4.4% | | | | | |
The Coca-Cola Co. | | | 74,660 | | | | 2,706,425 | |
Diageo PLC Sponsored ADR (United Kingdom) | | | 40,400 | | | | 4,709,832 | |
Heineken Holding NV Class A | | | 40,150 | | | | 2,199,285 | |
| | | | | | | | |
| | | | | | | 9,615,542 | |
| | | | | | | | |
| Commercial Services — 1.9% | | | | | |
Iron Mountain, Inc. | | | 85,834 | | | | 2,665,146 | |
Visa, Inc. Class A | | | 9,760 | | | | 1,479,421 | |
| | | | | | | | |
| | | | | | | 4,144,567 | |
| | | | | | | | |
| Cosmetics & Personal Care — 0.2% | | | | | |
Natura Cosmeticos SA | | | 13,700 | | | | 393,106 | |
| | | | | | | | |
| Foods — 0.7% | | | | | |
Nestle SA | | | 3,070 | | | | 200,085 | |
Sysco Corp. | | | 18,570 | | | | 587,926 | |
Unilever NV NY Shares | | | 16,760 | | | | 641,908 | |
| | | | | | | | |
| | | | | | | 1,429,919 | |
| | | | | | | | |
| Health Care – Services — 0.1% | | | | | |
Laboratory Corporation of America Holdings (a) | | | 2,870 | | | | 248,599 | |
| | | | | | | | |
| Pharmaceuticals — 2.5% | | | | | |
Express Scripts Holding Co. (a) | | | 89,280 | | | | 4,821,120 | |
Pfizer, Inc. | | | 22,880 | | | | 573,830 | |
| | | | | | | | |
| | | | | | | 5,394,950 | |
| | | | | | | | |
| | | | | | | 23,170,477 | |
| | | | | | | | |
| Diversified — 1.3% | | | | | |
| Holding Company – Diversified — 1.3% | | | | | |
China Merchants Holdings International Co. Ltd. | | | 843,822 | | | | 2,747,961 | |
| | | | | | | | |
| Energy — 9.6% | | | | | |
| Oil & Gas — 8.4% | | | | | |
Canadian Natural Resources Ltd. | | | 185,400 | | | | 5,352,498 | |
Devon Energy Corp. | | | 34,820 | | | | 1,812,033 | |
EOG Resources, Inc. | | | 53,860 | | | | 6,505,749 | |
Occidental Petroleum Corp. | | | 59,130 | | | | 4,529,949 | |
| | | | | | | | |
| | | | | | | 18,200,229 | |
| | | | | | | | |
The accompanying notes are an integral part of the financial statements.
93
MML Large Cap Value Fund – Portfolio of Investments (Continued)
| | | | | | | | |
| | | Number of
Shares | | | Value | |
| Oil & Gas Services — 1.2% | | | | | |
Schlumberger Ltd. | | | 18,540 | | | $ | 1,284,637 | |
Transocean Ltd. | | | 28,159 | | | | 1,257,299 | |
| | | | | | | | |
| | | | | | | 2,541,936 | |
| | | | | | | | |
| | | | | | | 20,742,165 | |
| | | | | | | | |
| Financial — 35.5% | | | | | |
| Banks — 13.4% | | | | | |
Bank of New York Mellon Corp. | | | 412,440 | | | | 10,599,708 | |
Julius Baer Group Ltd. | | | 145,285 | | | | 5,227,157 | |
Wells Fargo & Co. | | | 384,473 | | | | 13,141,287 | |
| | | | | | | | |
| | | | | | | 28,968,152 | |
| | | | | | | | |
| Diversified Financial — 8.6% | | | | | |
American Express Co. | | | 232,932 | | | | 13,388,931 | |
Ameriprise Financial, Inc. | | | 15,950 | | | | 998,948 | |
The Charles Schwab Corp. | | | 86,430 | | | | 1,241,135 | |
CME Group, Inc. | | | 7,550 | | | | 382,861 | |
The Goldman Sachs Group, Inc. | | | 8,800 | | | | 1,122,528 | |
JP Morgan Chase & Co. | | | 32,116 | | | | 1,412,141 | |
| | | | | | | | |
| | | | | | | 18,546,544 | |
| | | | | | | | |
| Insurance — 11.5% | | | | | |
ACE Ltd. | | | 21,440 | | | | 1,710,912 | |
Alleghany Corp. (a) | | | 9,772 | | | | 3,277,724 | |
Aon PLC | | | 7,600 | | | | 422,560 | |
Berkshire Hathaway, Inc. Class A (a) | | | 44 | | | | 5,898,640 | |
Everest Re Group Ltd. | | | 3,290 | | | | 361,736 | |
Fairfax Financial Holdings Ltd. | | | 3,500 | | | | 1,263,500 | |
Fairfax Financial Holdings Ltd. (Subordinate Voting Shares) | | | 1,070 | | | | 385,693 | |
Loews Corp. | | | 143,650 | | | | 5,853,737 | |
Markel Corp. (a) | | | 595 | | | | 257,885 | |
The Progressive Corp. | | | 262,050 | | | | 5,529,255 | |
| | | | | | | | |
| | | | | | | 24,961,642 | |
| | | | | | | | |
| Real Estate — 2.0% | | | | | |
Brookfield Asset Management, Inc. Class A | | | 66,700 | | | | 2,444,555 | |
Hang Lung Properties Ltd. | | | 325,000 | | | | 1,861,878 | |
| | | | | | | | |
| | | | | | | 4,306,433 | |
| | | | | | | | |
| | | | | | | 76,782,771 | |
| | | | | | | | |
| Industrial — 2.2% | | | | | |
| Building Materials — 0.2% | | | | | |
Martin Marietta Materials, Inc. (e) | | | 5,530 | | | | 521,368 | |
| | | | | | | | |
| Electrical Components & Equipment — 0.4% | | | | | |
Emerson Electric Co. | | | 15,860 | | | | 839,946 | |
| | | | | | | | |
| Electronics — 0.4% | | | | | |
Agilent Technologies, Inc. | | | 18,590 | | | | 761,075 | |
| | | | | | | | |
| Transportation — 1.2% | | | | | |
Kuehne & Nagel International AG | | | 21,000 | | | | 2,555,716 | |
| | | | | | | | |
| | | | | | | 4,678,105 | |
| | | | | | | | |
| | | | | | | | |
| | | Number of
Shares | | | Value | |
| Technology — 4.4% | | | | | |
| Computers — 0.6% | | | | | |
Hewlett-Packard Co. | | | 41,900 | | | $ | 597,075 | |
International Business Machines Corp. | | | 3,530 | | | | 676,171 | |
| | | | | | | | |
| | | | | | | 1,273,246 | |
| | | | | | | | |
| Semiconductors — 1.7% | | | | | |
Intel Corp. | | | 25,920 | | | | 534,730 | |
Texas Instruments, Inc. | | | 102,610 | | | | 3,174,753 | |
| | | | | | | | |
| | | | | | | 3,709,483 | |
| | | | | | | | |
| Software — 2.1% | | | | | |
Activision Blizzard, Inc. | | | 101,670 | | | | 1,079,736 | |
Microsoft Corp. | | | 61,110 | | | | 1,633,470 | |
Oracle Corp. | | | 55,650 | | | | 1,854,258 | |
| | | | | | | | |
| | | | | | | 4,567,464 | |
| | | | | | | | |
| | | | | | | 9,550,193 | |
| | | | | | | | |
| | |
TOTAL COMMON STOCK
(Cost $166,200,609) | | | | | | | 203,427,552 | |
| | | | | | | | |
| | |
TOTAL EQUITIES
(Cost $166,200,609) | | | | | | | 203,427,552 | |
| | | | | | | | |
| | |
| | | Principal
Amount | | | | |
| | |
| BONDS & NOTES — 0.0% | | | | | | | | |
| | |
| CORPORATE DEBT — 0.0% | | | | | | | | |
| Forest Products & Paper — 0.0% | | | | | |
Sino-Forest Corp. (Acquired 7/23/08, Cost $350,424) (c) (d) (f)
5.000% 8/01/13 | | $ | 359,000 | | | | 50,036 | |
| | | | | | | | |
| | |
TOTAL CORPORATE DEBT
(Cost $350,424) | | | | | | | 50,036 | |
| | | | | | | | |
| | |
TOTAL BONDS & NOTES
(Cost $350,424) | | | | | | | 50,036 | |
| | | | | | | | |
| | |
| | | Number of
Shares | | | | |
| | |
| MUTUAL FUNDS — 1.0% | | | | | | | | |
| Diversified Financial — 1.0% | | | | | |
State Street Navigator Securities Lending Prime Portfolio (g) | | | 2,152,531 | | | | 2,152,531 | |
| | | | | | | | |
| | |
TOTAL MUTUAL FUNDS
(Cost $2,152,531) | | | | | | | 2,152,531 | |
| | | | | | | | |
| | |
TOTAL LONG-TERM INVESTMENTS
(Cost $168,703,564) | | | | | | | 205,630,119 | |
| | | | | | | | |
The accompanying notes are an integral part of the financial statements.
94
MML Large Cap Value Fund – Portfolio of Investments (Continued)
| | | | | | | | |
| | | Principal
Amount | | | Value | |
| |
| SHORT-TERM INVESTMENTS — 4.6% | | | | | |
| Repurchase Agreement — 4.6% | | | | | |
State Street Bank & Trust Co. Repurchase Agreement, dated 12/31/12, 0.010%, due 1/02/13 (h) | | $ | 9,895,096 | | | $ | 9,895,096 | |
| | | | | | | | |
| | |
TOTAL SHORT-TERM INVESTMENTS
(Cost $9,895,096) | | | | | | | 9,895,096 | |
| | | | | | | | |
| | |
TOTAL INVESTMENTS — 99.8%
(Cost $178,598,660) (i) | | | | | | | 215,525,215 | |
| | |
| Other Assets/(Liabilities) — 0.2% | | | | | | | 405,557 | |
| | | | | | | | |
| | |
| NET ASSETS — 100.0% | | | | | | $ | 215,930,772 | |
| | | | | | | | |
Notes to Portfolio of Investments
| ADR | American Depositary Receipt |
| (a) | Non-income producing security. |
| (b) | This security is fair valued in accordance with procedures approved by the Board of Trustees. At December 31, 2012, these securities amounted to a value of $0 or 0.00% of net assets. |
| (c) | Securities exempt from registration under rule 144A of the Securities Act of 1933. These securities may be resold in transactions exempt from registration, normally to qualified institutional buyers. At December 31, 2012, these securities amounted to a value of $50,036 or 0.02% of net assets. |
| (d) | Restricted security. Certain securities are restricted as to resale. At December 31, 2012, these securities amounted to a value of $50,036 or 0.02% of net assets. The Funds generally bear the costs, if any, associated with the disposition of restricted securities. |
| (e) | Denotes all or a portion of security on loan. The total value of securities on loan as of December 31, 2012, was $2,106,320. Total securities on loan may not correspond with the amounts identified in the Portfolio of Investments because pending sales may be in the process of recall from the brokers. (Note 2). |
| (f) | Security is currently in default due to bankruptcy or failure to make payment of principal or interest of the issuer. Income is not being accrued. At December 31, 2012, these securities amounted to a value of $50,036 or 0.02% of net assets. |
| (g) | Represents investment of security lending collateral. (Note 2). |
| (h) | Maturity value of $9,895,101. Collateralized by U.S. Government Agency obligations with a rate of 2.500%, maturity date of 10/20/27, and an aggregate market value, including accrued interest, of $10,094,269. |
| (i) | See Note 6 for aggregate cost for federal tax purposes. |
The accompanying notes are an integral part of the financial statements.
95
MML Mid Cap Growth Fund – Portfolio of Investments
December 31, 2012
| | | | | | | | |
| | | Number of
Shares | | | Value | |
| EQUITIES — 96.4% | | | | | | | | |
| | |
| COMMON STOCK — 95.9% | | | | | | | | |
| Basic Materials — 3.2% | | | | | | | | |
| Chemicals — 1.2% | | | | | | | | |
Celanese Corp. Series A | | | 45,000 | | | $ | 2,003,850 | |
Rockwood Holdings, Inc. | | | 50,000 | | | | 2,473,000 | |
| | | | | | | | |
| | | | | | | 4,476,850 | |
| | | | | | | | |
| Mining — 2.0% | | | | | | | | |
Agnico-Eagle Mines Ltd. | | | 70,000 | | | | 3,672,200 | |
Franco-Nevada Corp. | | | 60,000 | | | | 3,424,953 | |
| | | | | | | | |
| | | | | | | 7,097,153 | |
| | | | | | | | |
| | | | | | | 11,574,003 | |
| | | | | | | | |
| Communications — 8.9% | | | | | | | | |
| Internet — 3.0% | | | | | | | | |
Akamai Technologies, Inc. (a) | | | 44,000 | | | | 1,800,040 | |
Dropbox, Inc. (a) (b) | | | 9,011 | | | | 81,541 | |
Liberty Interactive Corp. Class A (a) | | | 89,000 | | | | 1,751,520 | |
LinkedIn Corp. (a) | | | 7,000 | | | | 803,740 | |
Netflix, Inc. (a) (c) | | | 15,000 | | | | 1,391,700 | |
Rackspace Hosting, Inc. (a) | | | 21,000 | | | | 1,559,670 | |
TIBCO Software, Inc. (a) | | | 80,000 | | | | 1,760,800 | |
TripAdvisor, Inc. (a) | | | 39,000 | | | | 1,636,440 | |
| | | | | | | | |
| | | | | | | 10,785,451 | |
| | | | | | | | |
| Media — 2.1% | | | | | | | | |
Charter Communications, Inc. Class A (a) | | | 42,000 | | | | 3,202,080 | |
Discovery Communications, Inc. Series C (a) | | | 30,000 | | | | 1,755,000 | |
FactSet Research Systems, Inc. | | | 30,000 | | | | 2,641,800 | |
| | | | | | | | |
| | | | | | | 7,598,880 | |
| | | | | | | | |
| Semiconductors — 0.1% | | | | | | | | |
IPG Photonics Corp. (c) | | | 5,000 | | | | 333,250 | |
| | | | | | | | |
| Telecommunications — 3.7% | | | | | | | | |
Amdocs Ltd. | | | 128,000 | | | | 4,350,720 | |
Aruba Networks, Inc. (a) | | | 42,000 | | | | 871,500 | |
JDS Uniphase Corp. (a) | | | 318,000 | | | | 4,305,720 | |
Motorola Solutions, Inc. | | | 69,000 | | | | 3,841,920 | |
| | | | | | | | |
| | | | | | | 13,369,860 | |
| | | | | | | | |
| | | | | | | 32,087,441 | |
| | | | | | | | |
| Consumer, Cyclical — 14.0% | | | | | | | | |
| Airlines — 0.3% | | | | | | | | |
Alaska Air Group, Inc. (a) | | | 29,000 | | | | 1,249,610 | |
| | | | | | | | |
| Auto Manufacturers — 0.1% | | | | | | | | |
Tesla Motors, Inc. (a) (c) | | | 12,000 | | | | 406,440 | |
| | | | | | | | |
| Automotive & Parts — 0.9% | | | | | | | | |
WABCO Holdings, Inc. (a) | | | 49,000 | | | | 3,194,310 | |
| | | | | | | | |
| | | | | | | | |
| | | Number of
Shares | | | Value | |
| Distribution & Wholesale — 1.4% | | | | | | | | |
Fastenal Co. | | | 104,000 | | | $ | 4,855,760 | |
| | | | | | | | |
| Leisure Time — 0.7% | | | | | | | | |
Harley-Davidson, Inc. | | | 49,000 | | | | 2,393,160 | |
| | | | | | | | |
| Lodging — 1.6% | | | | | | | | |
Choice Hotels International, Inc. | | | 51,000 | | | | 1,714,620 | |
Marriott International, Inc. Class A | | | 110,000 | | | | 4,099,700 | |
| | | | | | | | |
| | | | | | | 5,814,320 | |
| | | | | | | | |
| Retail — 9.0% | | | | | | | | |
AutoZone, Inc. (a) | | | 10,000 | | | | 3,544,300 | |
CarMax, Inc. (a) | | | 138,000 | | | | 5,180,520 | |
Chipotle Mexican Grill, Inc. (a) | | | 4,000 | | | | 1,189,840 | |
Dollar General Corp. (a) | | | 109,000 | | | | 4,805,810 | |
Dollar Tree, Inc. (a) | | | 59,000 | | | | 2,393,040 | |
DSW, Inc. Class A | | | 7,700 | | | | 505,813 | |
Kohl’s Corp. | | | 72,000 | | | | 3,094,560 | |
Michael Kors Holdings Ltd. (a) | | | 20,000 | | | | 1,020,600 | |
O’Reilly Automotive, Inc. (a) | | | 35,000 | | | | 3,129,700 | |
Panera Bread Co. Class A (a) | | | 11,000 | | | | 1,747,130 | |
Shoppers Drug Mart Corp. (c) | | | 60,000 | | | | 2,581,683 | |
Starbucks Corp. | | | 17,000 | | | | 911,540 | |
Tim Hortons, Inc. | | | 49,000 | | | | 2,409,820 | |
| | | | | | | | |
| | | | | | | 32,514,356 | |
| | | | | | | | |
| | | | | | | 50,427,956 | |
| | | | | | | | |
| Consumer, Non-cyclical — 26.5% | | | | | | | | |
| Biotechnology — 2.8% | | | | | | | | |
Alexion Pharmaceuticals, Inc. (a) | | | 30,000 | | | | 2,814,300 | |
Alkermes PLC (a) | | | 98,000 | | | | 1,814,960 | |
ARIAD Pharmaceuticals, Inc. (a) | | | 44,000 | | | | 843,920 | |
Illumina, Inc. (a) (c) | | | 20,000 | | | | 1,111,800 | |
Incyte Corp. (a) (c) | | | 44,000 | | | | 730,840 | |
Regeneron Pharmaceuticals, Inc. (a) | | | 16,000 | | | | 2,737,120 | |
| | | | | | | | |
| | | | | | | 10,052,940 | |
| | | | | | | | |
| Commercial Services — 7.4% | | | | | | | | |
Equifax, Inc. | | | 49,000 | | | | 2,651,880 | |
Gartner, Inc. (a) | | | 119,000 | | | | 5,476,380 | |
Global Payments, Inc. | | | 55,000 | | | | 2,491,500 | |
Hertz Global Holdings, Inc. (a) | | | 153,000 | | | | 2,489,310 | |
Manpower, Inc. | | | 94,000 | | | | 3,989,360 | |
Quanta Services, Inc. (a) | | | 189,000 | | | | 5,157,810 | |
Vantiv, Inc. (a) | | | 75,000 | | | | 1,531,500 | |
Verisk Analytics, Inc. Class A (a) | | | 57,000 | | | | 2,907,000 | |
| | | | | | | | |
| | | | | | | 26,694,740 | |
| | | | | | | | |
| Foods — 1.1% | | | | | | | | |
The Fresh Market, Inc. (a) | | | 15,000 | | | | 721,350 | |
TreeHouse Foods, Inc. (a) | | | 39,000 | | | | 2,033,070 | |
Whole Foods Market, Inc. | | | 15,000 | | | | 1,369,950 | |
| | | | | | | | |
| | | | | | | 4,124,370 | |
| | | | | | | | |
The accompanying notes are an integral part of the financial statements.
96
MML Mid Cap Growth Fund – Portfolio of Investments (Continued)
| | | | | | | | |
| | | Number of
Shares | | | Value | |
| Health Care – Products — 5.7% | | | | | | | | |
Bruker Corp. (a) | | | 144,000 | | | $ | 2,198,880 | |
C.R. Bard, Inc. | | | 35,000 | | | | 3,420,900 | |
CareFusion Corp. (a) | | | 124,000 | | | | 3,543,920 | |
The Cooper Cos., Inc. | | | 24,000 | | | | 2,219,520 | |
Edwards Lifesciences Corp. (a) | | | 26,000 | | | | 2,344,420 | |
Henry Schein, Inc. (a) | | | 40,000 | | | | 3,218,400 | |
IDEXX Laboratories, Inc. (a) | | | 38,000 | | | | 3,526,400 | |
| | | | | | | | |
| | | | | | | 20,472,440 | |
| | | | | | | | |
| Health Care – Services — 5.3% | | | | | | | | |
Catamaran Corp. (a) | | | 99,000 | | | | 4,663,890 | |
Covance, Inc. (a) | | | 67,000 | | | | 3,870,590 | |
Laboratory Corporation of America Holdings (a) | | | 55,000 | | | | 4,764,100 | |
MEDNAX, Inc. (a) | | | 30,000 | | | | 2,385,600 | |
Universal Health Services, Inc. Class B | | | 47,000 | | | | 2,272,450 | |
WellCare Health Plans, Inc. (a) | | | 24,000 | | | | 1,168,560 | |
| | | | | | | | |
| | | | | | | 19,125,190 | |
| | | | | | | | |
| Pharmaceuticals — 4.2% | | | | | | | | |
Cubist Pharmaceuticals, Inc. (a) | | | 19,000 | | | | 799,140 | |
DENTSPLY International, Inc. | | | 158,000 | | | | 6,258,380 | |
Elan Corp. PLC Sponsored ADR (Ireland) (a) | | | 154,000 | | | | 1,572,340 | |
Hospira, Inc. (a) | | | 28,000 | | | | 874,720 | |
Onyx Pharmaceuticals, Inc. (a) | | | 20,000 | | | | 1,510,600 | |
Pharmacyclics, Inc. (a) | | | 6,000 | | | | 347,400 | |
Theravance, Inc. (a) | | | 57,000 | | | | 1,269,390 | |
Valeant Pharmaceuticals International, Inc. (a) | | | 39,000 | | | | 2,331,030 | |
| | | | | | | | |
| | | | | | | 14,963,000 | |
| | | | | | | | |
| | | | | | | 95,432,680 | |
| | | | | | | | |
| Energy — 5.6% | | | | | | | | |
| Coal — 0.4% | | | | | | | | |
CONSOL Energy, Inc. | | | 42,200 | | | | 1,354,620 | |
| | | | | | | | |
| Oil & Gas — 5.2% | | | | | | | | |
EQT Corp. | | | 69,000 | | | | 4,069,620 | |
Halcon Resources Corp. (a) | | | 95,000 | | | | 657,400 | |
Laredo Petroleum Holdings, Inc. (a) | | | 54,000 | | | | 980,640 | |
Pioneer Natural Resources Co. | | | 20,000 | | | | 2,131,800 | |
Range Resources Corp. | | | 64,000 | | | | 4,021,120 | |
SM Energy Co. | | | 70,000 | | | | 3,654,700 | |
Southwestern Energy Co. (a) | | | 93,000 | | | | 3,107,130 | |
| | | | | | | | |
| | | | | | | 18,622,410 | |
| | | | | | | | |
| | | | | | | 19,977,030 | |
| | | | | | | | |
| Financial — 5.9% | | | | | | | | |
| Banks — 0.6% | | | | | | | | |
TCF Financial Corp. | | | 165,000 | | | | 2,004,750 | |
| | | | | | | | |
| | | | | | | | |
| | | Number of
Shares | | | Value | |
| Diversified Financial — 2.3% | | | | | | | | |
Air Lease Corp. (a) | | | 21,700 | | | $ | 466,550 | |
CBOE Holdings, Inc. | | | 80,000 | | | | 2,356,800 | |
The Charles Schwab Corp. | | | 116,000 | | | | 1,665,760 | |
IntercontinentalExchange, Inc. (a) | | | 9,000 | | | | 1,114,290 | |
TD Ameritrade Holding Corp. | | | 169,000 | | | | 2,840,890 | |
| | | | | | | | |
| | | | | | | 8,444,290 | |
| | | | | | | | |
| Insurance — 2.1% | | | | | | | | |
HCC Insurance Holdings, Inc. | | | 74,000 | | | | 2,753,540 | |
The Progressive Corp. | | | 129,000 | | | | 2,721,900 | |
Willis Group Holdings PLC | | | 60,000 | | | | 2,011,800 | |
| | | | | | | | |
| | | | | | | 7,487,240 | |
| | | | | | | | |
| Real Estate — 0.5% | | | | | | | | |
Jones Lang LaSalle, Inc. | | | 23,000 | | | | 1,930,620 | |
| | | | | | | | |
| Savings & Loans — 0.4% | | | | | | | | |
BankUnited, Inc. | | | 62,000 | | | | 1,515,280 | |
| | | | | | | | |
| | | | | | | 21,382,180 | |
| | | | | | | | |
| Industrial — 17.5% | | | | | | | | |
| Electrical Components & Equipment — 2.9% | | | | | |
AMETEK, Inc. | | | 178,000 | | | | 6,687,460 | |
The Babcock & Wilcox Co. | | | 150,000 | | | | 3,930,000 | |
| | | | | | | | |
| | | | | | | 10,617,460 | |
| | | | | | | | |
| Electronics — 3.1% | | | | | | | | |
Agilent Technologies, Inc. | | | 79,000 | | | | 3,234,260 | |
Gentex Corp./MI | | | 104,000 | | | | 1,957,280 | |
Mettler-Toledo International, Inc. (a) | | | 4,000 | | | | 773,200 | |
Trimble Navigation Ltd. (a) | | | 89,000 | | | | 5,320,420 | |
| | | | | | | | |
| | | | | | | 11,285,160 | |
| | | | | | | | |
| Engineering & Construction — 0.8% | | | | | |
McDermott International, Inc. (a) | | | 248,000 | | | | 2,732,960 | |
| | | | | | | | |
| Environmental Controls — 1.1% | | | | | | | | |
Clean Harbors, Inc. (a) | | | 29,000 | | | | 1,595,290 | |
Waste Connections, Inc. | | | 69,000 | | | | 2,331,510 | |
| | | | | | | | |
| | | | | | | 3,926,800 | |
| | | | | | | | |
| Machinery – Diversified — 4.1% | | | | | | | | |
Gardner Denver, Inc. | | | 71,000 | | | | 4,863,500 | |
IDEX Corp. | | | 89,000 | | | | 4,141,170 | |
Roper Industries, Inc. | | | 50,000 | | | | 5,574,000 | |
| | | | | | | | |
| | | | | | | 14,578,670 | |
| | | | | | | | |
| Manufacturing — 3.6% | | | | | | | | |
Acuity Brands, Inc. | | | 27,000 | | | | 1,828,710 | |
Colfax Corp. (a) | | | 42,000 | | | | 1,694,700 | |
Pall Corp. | | | 76,000 | | | | 4,579,760 | |
Textron, Inc. | | | 200,000 | | | | 4,958,000 | |
| | | | | | | | |
| | | | | | | 13,061,170 | |
| | | | | | | | |
The accompanying notes are an integral part of the financial statements.
97
MML Mid Cap Growth Fund – Portfolio of Investments (Continued)
| | | | | | | | |
| | | Number of
Shares | | | Value | |
| Metal Fabricate & Hardware — 0.2% | | | | | |
Rexnord Corp. (a) | | | 33,000 | | | $ | 702,900 | |
| | | | | | | | |
| Packaging & Containers — 0.3% | | | | | | | | |
Ball Corp. | | | 21,000 | | | | 939,750 | |
| | | | | | | | |
| Transportation — 1.4% | | | | | | | | |
J.B. Hunt Transport Services, Inc. | | | 39,000 | | | | 2,328,690 | |
Kansas City Southern | | | 32,000 | | | | 2,671,360 | |
| | | | | | | | |
| | | | | | | 5,000,050 | |
| | | | | | | | |
| | | | | | | 62,844,920 | |
| | | | | | | | |
| Technology — 12.9% | | | | | | | | |
| Computers — 2.6% | | | | | | | | |
IHS, Inc. Class A (a) | | | 63,000 | | | | 6,048,000 | |
MICROS Systems, Inc. (a) | | | 38,000 | | | | 1,612,720 | |
SanDisk Corp. (a) | | | 35,000 | | | | 1,524,600 | |
| | | | | | | | |
| | | | | | | 9,185,320 | |
| | | | | | | | |
| Semiconductors — 4.4% | | | | | | | | |
Altera Corp. | | | 60,000 | | | | 2,066,400 | |
Atmel Corp. (a) | | | 357,000 | | | | 2,338,350 | |
Avago Technologies Ltd. | | | 39,000 | | | | 1,234,740 | |
Cree, Inc. (a) (c) | | | 49,000 | | | | 1,665,020 | |
Intersil Corp. Class A | | | 50,000 | | | | 414,500 | |
Microchip Technology, Inc. | | | 60,000 | | | | 1,955,400 | |
NVIDIA Corp. | | | 68,000 | | | | 835,720 | |
Silicon Laboratories, Inc. (a) | | | 40,000 | | | | 1,672,400 | |
Xilinx, Inc. | | | 99,000 | | | | 3,554,100 | |
| | | | | | | | |
| | | | | | | 15,736,630 | |
| | | | | | | | |
| Software — 5.9% | | | | | | | | |
Concur Technologies, Inc. (a) | | | 40,000 | | | | 2,700,800 | |
Fiserv, Inc. (a) | | | 69,000 | | | | 5,453,070 | |
MSCI, Inc. Class A (a) | | | 117,000 | | | | 3,625,830 | |
Nuance Communications, Inc. (a) | | | 145,000 | | | | 3,236,400 | |
Red Hat, Inc. (a) | | | 74,000 | | | | 3,919,040 | |
Servicenow, Inc. (a) (c) | | | 47,000 | | | | 1,411,410 | |
Workday, Inc. (a) (c) | | | 18,100 | | | | 986,450 | |
| | | | | | | | |
| | | | | | | 21,333,000 | |
| | | | | | | | |
| | | | | | | 46,254,950 | |
| | | | | | | | |
| Utilities — 1.4% | | | | | | | | |
| Electric — 1.4% | | | | | | | | |
Calpine Corp. (a) | | | 285,000 | | | | 5,167,051 | |
| | | | | | | | |
| | |
TOTAL COMMON STOCK
(Cost $266,167,689) | | | | | | | 345,148,211 | |
| | | | | | | | |
| | |
| PREFERRED STOCK — 0.5% | | | | | | | | |
| Communications — 0.3% | | | | | | | | |
| Internet — 0.3% | | | | | | | | |
Coupons.com (a) (b) | | | 134,468 | | | | 368,106 | |
Dropbox, Inc. Series A (a) (b) | | | 11,190 | | | | 101,259 | |
| | | | | | | | |
| | | Number of
Shares | | | Value | |
Dropbox, Inc. Series A1 (a) (b) | | | 54,965 | | | $ | 497,384 | |
Living Social (a) (b) | | | 158,890 | | | | 49,256 | |
| | | | | | | | |
| | | | | | | 1,016,005 | |
| | | | | | | | |
| Technology — 0.2% | | | | | | | | |
| Software — 0.2% | | | | | | | | |
Workday, Inc. (a) (b) | | | 15,008 | | | | 777,039 | |
| | | | | | | | |
| | |
| TOTAL PREFERRED STOCK (Cost $2,435,083) | | | | | | | 1,793,044 | |
| | | | | | | | |
| | |
TOTAL EQUITIES
(Cost $268,602,772) | | | | | | | 346,941,255 | |
| | | | | | | | |
| | |
| MUTUAL FUNDS — 4.0% | | | | | | | | |
| Diversified Financial — 4.0% | | | | | | | | |
State Street Navigator Securities Lending Prime Portfolio (d) | | | 8,652,209 | | | | 8,652,209 | |
T. Rowe Price Government Reserve Investment Fund | | | 5,793,620 | | | | 5,793,620 | |
| | | | | | | | |
| | | | | | | 14,445,829 | |
| | | | | | | | |
| | |
TOTAL MUTUAL FUNDS
(Cost $14,445,829) | | | | | | | 14,445,829 | |
| | | | | | | | |
| | |
TOTAL LONG-TERM INVESTMENTS
(Cost $283,048,601) | | | | | | | 361,387,084 | |
| | | | | | | | |
| | |
| | | Principal
Amount | | | | |
| SHORT-TERM INVESTMENTS — 2.2% | | | | | |
| Repurchase Agreement — 2.2% | | | | | | | | |
State Street Bank & Trust Co. Repurchase Agreement, dated 12/31/12, 0.010%, due 1/02/13 (e) | | $ | 7,779,361 | | | | 7,779,361 | |
| | | | | | | | |
| | |
TOTAL SHORT-TERM INVESTMENTS
(Cost $7,779,361) | | | | | | | 7,779,361 | |
| | | | | | | | |
| | |
TOTAL INVESTMENTS — 102.6%
(Cost $290,827,962) (f) | | | | | | | 369,166,445 | |
| | |
| Other Assets/(Liabilities) — (2.6)% | | | | | | | (9,281,340 | ) |
| | | | | | | | |
| | |
| NET ASSETS — 100.0% | | | | | | $ | 359,885,105 | |
| | | | | | | | |
Notes to Portfolio of Investments
| ADR | American Depositary Receipt |
| (a) | Non-income producing security. |
The accompanying notes are an integral part of the financial statements.
98
MML Mid Cap Growth Fund – Portfolio of Investments (Continued)
Notes to Portfolio of Investments (Continued)
| (b) | This security is fair valued in accordance with procedures approved by the Board of Trustees. At December 31, 2012, these securities amounted to a value of $1,874,585 or 0.52% of net assets. |
| (c) | Denotes all or a portion of security on loan. The total value of securities on loan as of December 31, 2012, was $8,393,292. Total securities on loan may not correspond with the amounts identified in the Portfolio of Investments because pending sales may be in the process of recall from the brokers. (Note 2). |
| (d) | Represents investment of security lending collateral. (Note 2). |
| (e) | Maturity value of $7,779,366. Collateralized by U.S. Government Agency obligations with a rate of 3.000%, maturity date of 12/01/26, and an aggregate market value, including accrued interest, of $7,938,219. |
| (f) | See Note 6 for aggregate cost for federal tax purposes. |
The accompanying notes are an integral part of the financial statements.
99
MML Mid Cap Value Fund – Portfolio of Investments
December 31, 2012
| | | | | | | | |
| | | Number of
Shares | | | Value | |
| EQUITIES — 95.3% | |
|
| COMMON STOCK — 95.3% | |
| Basic Materials — 1.8% | |
| Chemicals — 0.2% | |
Minerals Technologies, Inc. | | | 19,305 | | | $ | 770,655 | |
| | | | | | | | |
| Iron & Steel — 0.4% | |
Nucor Corp. | | | 49,295 | | | | 2,128,558 | |
| | | | | | | | |
| Mining — 1.0% | |
Newmont Mining Corp. | | | 98,411 | | | | 4,570,207 | |
| | | | | | | | |
| Real Estate Investment Trusts (REITS) — 0.2% | |
Weyerhaeuser Co. | | | 30,935 | | | | 860,612 | |
| | | | | | | | |
| | | | | | | 8,330,032 | |
| | | | | | | | |
| Communications — 2.5% | |
| Telecommunications — 2.5% | |
CenturyLink, Inc. | | | 88,056 | | | | 3,444,751 | |
Rogers Communications, Inc. Class B | | | 66,781 | | | | 3,031,899 | |
tw telecom, Inc. (a) | | | 181,521 | | | | 4,623,340 | |
| | | | | | | | |
| | | | | | | 11,099,990 | |
| | | | | | | | |
| Consumer, Cyclical — 6.1% | |
| Airlines — 0.8% | |
Southwest Airlines Co. (a) | | | 352,987 | | | | 3,614,587 | |
| | | | | | | | |
| Automotive & Parts — 0.5% | |
Autoliv, Inc. | | | 30,144 | | | | 2,031,404 | |
| | | | | | | | |
| Entertainment — 0.9% | |
International Game Technology | | | 203,070 | | | | 2,877,502 | |
International Speedway Corp. Class A | | | 45,176 | | | | 1,247,761 | |
| | | | | | | | |
| | | | | | | 4,125,263 | |
| | | | | | | | |
| Leisure Time — 0.4% | |
Carnival Corp. | | | 51,217 | | | | 1,883,249 | |
| | | | | | | | |
| Retail — 3.0% | |
CEC Entertainment, Inc. | | | 105,117 | | | | 3,488,833 | |
Lowe’s Cos., Inc. | | | 182,656 | | | | 6,487,941 | |
Target Corp. | | | 62,825 | | | | 3,717,356 | |
| | | | | | | | |
| | | | | | | 13,694,130 | |
| | | | | | | | |
| Toys, Games & Hobbies — 0.5% | |
Hasbro, Inc. | | | 64,586 | | | | 2,318,637 | |
| | | | | | | | |
| | | | | | | 27,667,270 | |
| | | | | | | | |
| Consumer, Non-cyclical — 19.5% | |
| Beverages — 0.9% | |
Dr. Pepper Snapple Group, Inc. | | | 95,548 | | | | 4,221,311 | |
| | | | | | | | |
| Biotechnology — 0.3% | |
Life Technologies Corp. (a) | | | 31,615 | | | | 1,551,664 | |
| | | | | | | | |
| Commercial Services — 1.2% | |
The ADT Corp. | | | 83,732 | | | | 3,892,701 | |
| | | | | | | | |
| | | Number of
Shares | | | Value | |
Corrections Corporation of America | | | 38,441 | | | $ | 1,363,502 | |
| | | | | | | | |
| | | | | | | 5,256,203 | |
| | | | | | | | |
| Foods — 4.2% | |
Campbell Soup Co. | | | 34,688 | | | | 1,210,264 | |
ConAgra Foods, Inc. | | | 77,349 | | | | 2,281,796 | |
General Mills, Inc. | | | 110,428 | | | | 4,462,395 | |
Kellogg Co. | | | 57,626 | | | | 3,218,412 | |
Kraft Foods Group, Inc. | | | 103,059 | | | | 4,686,093 | |
Sysco Corp. | | | 97,935 | | | | 3,100,622 | |
| | | | | | | | |
| | | | | | | 18,959,582 | |
| | | | | | | | |
| Health Care – Products — 7.5% | |
Becton, Dickinson & Co. | | | 61,928 | | | | 4,842,151 | |
Boston Scientific Corp. (a) | | | 431,366 | | | | 2,471,727 | |
CareFusion Corp. (a) | | | 292,367 | | | | 8,355,849 | |
Medtronic, Inc. | | | 77,809 | | | | 3,191,725 | |
Steris Corp. | | | 109,356 | | | | 3,797,934 | |
Stryker Corp. | | | 96,168 | | | | 5,271,930 | |
Zimmer Holdings, Inc. | | | 93,776 | | | | 6,251,108 | |
| | | | | | | | |
| | | | | | | 34,182,424 | |
| | | | | | | | |
| Health Care – Services — 2.6% | |
Cigna Corp. | | | 46,407 | | | | 2,480,918 | |
Humana, Inc. | | | 49,864 | | | | 3,422,166 | |
LifePoint Hospitals, Inc. (a) | | | 149,782 | | | | 5,654,271 | |
| | | | | | | | |
| | | | | | | 11,557,355 | |
| | | | | | | | |
| Household Products — 1.1% | |
The Clorox Co. | | | 34,728 | | | | 2,542,784 | |
Kimberly-Clark Corp. | | | 27,209 | | | | 2,297,256 | |
| | | | | | | | |
| | | | | | | 4,840,040 | |
| | | | | | | | |
| Pharmaceuticals — 1.7% | |
Hospira, Inc. (a) | | | 121,344 | | | | 3,790,786 | |
Patterson Cos., Inc. | | | 118,903 | | | | 4,070,050 | |
| | | | | | | | |
| | | | | | | 7,860,836 | |
| | | | | | | | |
| | | | | | | 88,429,415 | |
| | | | | | | | |
| Energy — 7.6% | |
| Coal — 0.4% | |
Peabody Energy Corp. | | | 66,034 | | | | 1,757,165 | |
| | | | | | | | |
| Oil & Gas — 6.7% | |
Apache Corp. | | | 44,561 | | | | 3,498,039 | |
Devon Energy Corp. | | | 79,272 | | | | 4,125,315 | |
EQT Corp. | | | 50,536 | | | | 2,980,613 | |
Helmerich & Payne, Inc. | | | 40,371 | | | | 2,261,180 | |
Imperial Oil Ltd. | | | 244,482 | | | | 10,502,378 | |
Murphy Oil Corp. | | | 68,446 | | | | 4,075,959 | |
Southwestern Energy Co. (a) | | | 89,689 | | | | 2,996,510 | |
| | | | | | | | |
| | | | | | | 30,439,994 | |
| | | | | | | | |
The accompanying notes are an integral part of the financial statements.
100
MML Mid Cap Value Fund – Portfolio of Investments (Continued)
| | | | | | | | |
| | | Number of
Shares | | | Value | |
| Pipelines — 0.5% | |
Spectra Energy Partners LP | | | 68,571 | | | $ | 2,141,472 | |
| | | | | | | | |
| | | | | | | 34,338,631 | |
| | | | | | | | |
| Financial — 25.0% | |
| Banks — 9.2% | |
Comerica, Inc. | | | 157,955 | | | | 4,792,355 | |
Commerce Bancshares, Inc. | | | 162,979 | | | | 5,714,044 | |
Cullen/Frost Bankers, Inc. | | | 45,539 | | | | 2,471,401 | |
KeyCorp | | | 334,727 | | | | 2,818,401 | |
Northern Trust Corp. | | | 250,421 | | | | 12,561,117 | |
PNC Financial Services Group, Inc. | | | 102,610 | | | | 5,983,189 | |
State Street Corp. | | | 31,568 | | | | 1,484,012 | |
SunTrust Banks, Inc. | | | 87,216 | | | | 2,472,574 | |
Westamerica Bancorp. | | | 81,229 | | | | 3,459,543 | |
| | | | | | | | |
| | | | | | | 41,756,636 | |
| | | | | | | | |
| Diversified Financial — 1.3% | |
The Charles Schwab Corp. | | | 325,853 | | | | 4,679,249 | |
Franklin Resources, Inc. | | | 11,448 | | | | 1,439,014 | |
| | | | | | | | |
| | | | | | | 6,118,263 | |
| | | | | | | | |
| Insurance — 9.7% | |
ACE Ltd. | | | 49,903 | | | | 3,982,259 | |
The Allstate Corp. | | | 73,386 | | | | 2,947,916 | |
Aon PLC | | | 81,798 | | | | 4,547,969 | |
The Chubb Corp. | | | 82,783 | | | | 6,235,215 | |
HCC Insurance Holdings, Inc. | | | 153,566 | | | | 5,714,191 | |
Marsh & McLennan Cos., Inc. | | | 142,675 | | | | 4,918,007 | |
Principal Financial Group, Inc. | | | 63,565 | | | | 1,812,874 | |
Reinsurance Group of America, Inc. Class A | | | 85,993 | | | | 4,602,345 | |
Symetra Financial Corp. | | | 181,417 | | | | 2,354,793 | |
The Travelers Cos., Inc. | | | 49,457 | | | | 3,552,002 | |
Unum Group | | | 164,477 | | | | 3,424,411 | |
| | | | | | | | |
| | | | | | | 44,091,982 | |
| | | | | | | | |
| Real Estate Investment Trusts (REITS) — 2.9% | |
American Tower Corp. | | | 57,166 | | | | 4,417,217 | |
HCP, Inc. | | | 75,719 | | | | 3,420,984 | |
Piedmont Office Realty Trust, Inc. Class A | | | 294,585 | | | | 5,317,259 | |
| | | | | | | | |
| | | | | | | 13,155,460 | |
| | | | | | | | |
| Savings & Loans — 1.9% | |
Capitol Federal Financial, Inc. | | | 338,846 | | | | 3,961,110 | |
People’s United Financial, Inc. | | | 381,259 | | | | 4,609,421 | |
| | | | | | | | |
| | | | | | | 8,570,531 | |
| | | | | | | | |
| | | | | | | 113,692,872 | |
| | | | | | | | |
| Industrial — 16.5% | |
| Aerospace & Defense — 2.9% | |
General Dynamics Corp. | | | 84,513 | | | | 5,854,216 | |
L-3 Communications Holdings, Inc. | | | 11,298 | | | | 865,653 | |
Northrop Grumman Corp. | | | 59,690 | | | | 4,033,850 | |
| | | | | | | | |
| | | Number of
Shares | | | Value | |
Rockwell Collins, Inc. | | | 38,437 | | | $ | 2,235,880 | |
| | | | | | | | |
| | | | | | | 12,989,599 | |
| | | | | | | | |
| Electrical Components & Equipment — 0.7% | |
Emerson Electric Co. | | | 22,412 | | | | 1,186,939 | |
Molex, Inc. | | | 81,303 | | | | 1,814,683 | |
| | | | | | | | |
| | | | | | | 3,001,622 | |
| | | | | | | | |
| Electronics — 3.4% | |
Agilent Technologies, Inc. | | | 58,922 | | | | 2,412,267 | |
Brady Corp. Class A | | | 58,881 | | | | 1,966,625 | |
Koninklijke Philips Electronics NV | | | 162,759 | | | | 4,366,548 | |
TE Connectivity Ltd. | | | 94,913 | | | | 3,523,170 | |
Woodward, Inc. | | | 77,154 | | | | 2,941,882 | |
| | | | | | | | |
| | | | | | | 15,210,492 | |
| | | | | | | | |
| Engineering & Construction — 0.9% | |
ABB Ltd. Sponsored ADR (Switzerland) (a) | | | 199,840 | | | | 4,154,674 | |
| | | | | | | | |
| Environmental Controls — 3.7% | |
Republic Services, Inc. | | | 507,607 | | | | 14,888,113 | |
Waste Management, Inc. | | | 63,315 | | | | 2,136,248 | |
| | | | | | | | |
| | | | | | | 17,024,361 | |
| | | | | | | | |
| Manufacturing — 2.0% | |
ITT Corp. | | | 212,865 | | | | 4,993,813 | |
Tyco International Ltd. | | | 147,017 | | | | 4,300,247 | |
| | | | | | | | |
| | | | | | | 9,294,060 | |
| | | | | | | | |
| Metal Fabricate & Hardware — 0.7% | |
Kaydon Corp. | | | 139,977 | | | | 3,349,650 | |
| | | | | | | | |
| Packaging & Containers — 1.4% | |
Bemis Co., Inc. | | | 112,232 | | | | 3,755,283 | |
Sonoco Products Co. | | | 82,169 | | | | 2,442,884 | |
| | | | | | | | |
| | | | | | | 6,198,167 | |
| | | | | | | | |
| Transportation — 0.8% | |
Heartland Express, Inc. | | | 286,324 | | | | 3,742,255 | |
| | | | | | | | |
| | | | | | | 74,964,880 | |
| | | | | | | | |
| Technology — 5.1% | |
| Computers — 1.1% | |
SanDisk Corp. (a) | | | 56,126 | | | | 2,444,849 | |
Western Digital Corp. | | | 58,770 | | | | 2,497,137 | |
| | | | | | | | |
| | | | | | | 4,941,986 | |
| | | | | | | | |
| Semiconductors — 4.0% | |
Analog Devices, Inc. | | | 49,261 | | | | 2,071,918 | |
Applied Materials, Inc. | | | 656,990 | | | | 7,515,966 | |
KLA-Tencor Corp. | | | 46,626 | | | | 2,226,858 | |
Microchip Technology, Inc. | | | 56,294 | | | | 1,834,621 | |
Teradyne, Inc. (a) | | | 268,714 | | | | 4,538,579 | |
| | | | | | | | |
| | | | | | | 18,187,942 | |
| | | | | | | | |
| | | | | | | 23,129,928 | |
| | | | | | | | |
The accompanying notes are an integral part of the financial statements.
101
MML Mid Cap Value Fund – Portfolio of Investments (Continued)
| | | | | | | | |
| | | Number of
Shares | | | Value | |
| Utilities — 11.2% | |
| Electric — 9.5% | |
The Empire District Electric Co. | | | 198,493 | | | $ | 4,045,287 | |
Great Plains Energy, Inc. | | | 390,299 | | | | 7,926,973 | |
IDACORP, Inc. | | | 57,306 | | | | 2,484,215 | |
Northeast Utilities | | | 73,012 | | | | 2,853,309 | |
NV Energy, Inc. | | | 166,427 | | | | 3,018,986 | |
PG&E Corp. | | | 168,634 | | | | 6,775,714 | |
Portland General Electric Co. | | | 118,355 | | | | 3,238,193 | |
Westar Energy, Inc. | | | 192,783 | | | | 5,517,449 | |
Wisconsin Energy Corp. | | | 44,376 | | | | 1,635,256 | |
Xcel Energy, Inc. | | | 211,203 | | | | 5,641,232 | |
| | | | | | | | |
| | | | | | | 43,136,614 | |
| | | | | | | | |
| Gas — 1.7% | |
AGL Resources, Inc. | | | 160,626 | | | | 6,420,221 | |
WGL Holdings, Inc. | | | 31,598 | | | | 1,238,326 | |
| | | | | | | | |
| | | | | | | 7,658,547 | |
| | | | | | | | |
| | | | | | | 50,795,161 | |
| | | | | | | | |
| | |
TOTAL COMMON STOCK
(Cost $404,374,521) | | | | | | | 432,448,179 | |
| | | | | | | | |
| | |
TOTAL EQUITIES
(Cost $404,360,668) | | | | | | | 432,448,179 | |
| | | | | | | | |
|
| MUTUAL FUNDS — 3.5% | |
| Diversified Financial — 3.5% | |
iShares Russell Midcap Value Index Fund | | | 319,206 | | | | 16,036,909 | |
| | | | | | | | |
| | |
TOTAL MUTUAL FUNDS
(Cost $15,615,494) | | | | | | | 16,036,909 | |
| | | | | | | | |
| | |
TOTAL LONG-TERM INVESTMENTS
(Cost $419,990,015) | | | | | | | 448,485,088 | |
| | | | | | | | |
| | |
| | | Principal
Amount | | | | |
| SHORT-TERM INVESTMENTS — 1.3% | |
| Repurchase Agreement — 1.3% | |
State Street Bank & Trust Co. Repurchase Agreement, dated 12/31/12, 0.010%, due 1/02/13 (b) | | $ | 5,984,258 | | | | 5,984,258 | |
| | | | | | | | |
| | |
TOTAL SHORT-TERM INVESTMENTS
(Cost $5,984,258) | | | | | | | 5,984,258 | |
| | | | | | | | |
| | | | | | |
| | | | | Value | |
TOTAL INVESTMENTS — 100.1%
(Cost $425,974,273) (c) | | | | $ | 454,469,346 | |
| | |
| Other Assets/(Liabilities) — (0.1)% | | | | | (502,939 | ) |
| | | | | | |
| | |
| NET ASSETS — 100.0% | | | | $ | 453,966,407 | |
| | | | | | |
Notes to Portfolio of Investments
| ADR | American Depositary Receipt |
| (a) | Non-income producing security. |
| (b) | Maturity value of $5,984,261. Collateralized by U.S. Government Agency obligations with a rate of 3.000%, maturity date of 12/01/26, and an aggregate market value, including accrued interest, of $6,107,281. |
| (c) | See Note 6 for aggregate cost for federal tax purposes. |
The accompanying notes are an integral part of the financial statements.
102
MML PIMCO Total Return Fund – Portfolio of Investments
December 31, 2012
| | | | | | | | |
| | | Number
of Shares | | | Value | |
| EQUITIES — 0.4% | | | | | | | | |
| | |
| PREFERRED STOCK — 0.4% | | | | | | | | |
| Financial — 0.4% | | | | | | | | |
| Savings & Loans — 0.4% | | | | | | | | |
GMAC Capital Trust I
8.125% 2/15/40 | | | 44,000 | | | $ | 1,172,600 | |
| | | | | | | | |
| | |
TOTAL PREFERRED STOCK
(Cost $1,100,000) | | | | | | | 1,172,600 | |
| | | | | | | | |
| | |
TOTAL EQUITIES
(Cost $1,100,000) | | | | | | | 1,172,600 | |
| | | | | | | | |
| | |
| | | Principal
Amount | | | | |
| BONDS & NOTES — 130.0% | | | | | | | | |
| | |
| BANK LOANS — 0.3% | | | | | | | | |
| Diversified Financial — 0.3% | | | | | | | | |
Springleaf Financial Funding Co. Term Loan
5.500% 5/10/17 | | $ | 1,000,000 | | | | 993,390 | |
| | | | | | | | |
| | |
TOTAL BANK LOANS
(Cost $996,309) | | | | | | | 993,390 | |
| | | | | | | | |
| | |
| CORPORATE DEBT — 26.2% | | | | | | | | |
| Aerospace & Defense — 0.9% | | | | | | | | |
United Technologies Corp. FRN
0.581% 12/02/13 | | | 2,700,000 | | | | 2,707,398 | |
| | | | | | | | |
| Agriculture — 0.0% | | | | | | | | |
Altria Group, Inc.
7.750% 2/06/14 | | | 100,000 | | | | 107,480 | |
| | | | | | | | |
| Auto Manufacturers — 0.1% | | | | | | | | |
Daimler Finance NA LLC FRN (a)
1.510% 9/13/13 | | | 200,000 | | | | 201,120 | |
| | | | | | | | |
| Banks — 5.5% | | | | | | | | |
Banco Santander Brasil SA (a)
4.250% 1/14/16 | | | 800,000 | | | | 830,000 | |
Bank of America Corp. FRN
1.733% 1/30/14 | | | 500,000 | | | | 504,176 | |
Bank of India (b)
6.250% 2/16/21 | | | 500,000 | | | | 544,024 | |
Bank of Nova Scotia (a)
1.650% 10/29/15 | | | 100,000 | | | | 102,910 | |
Bank of Nova Scotia (a)
1.950% 1/30/17 | | | 200,000 | | | | 208,320 | |
BBVA US Senior SA FRN
2.435% 5/16/14 | | | 800,000 | | | | 793,179 | |
BNP Paribas SA FRN
1.250% 1/10/14 | | | 500,000 | | | | 501,520 | |
| | | | | | | | |
| | | Principal
Amount | | | Value | |
Cie de Financement Foncier SA
(Acquired 8/19/10,
Cost $1,016,310) (a) (c)
2.125% 4/22/13 | | $ | 1,000,000 | | | $ | 1,004,499 | |
Dexia Credit Local SA (b)
2.750% 4/29/14 | | | 600,000 | | | | 608,464 | |
GMAC, Inc.
7.500% 12/31/13 | | | 100,000 | | | | 105,625 | |
HBOS PLC FRN EUR (d)
0.897% 3/29/16 | | | 2,100,000 | | | | 2,478,871 | |
HBOS PLC
(Acquired 3/10/11,
Cost $95,137) (a) (c)
6.750% 5/21/18 | | | 100,000 | | | | 107,625 | |
HSBC Bank PLC
(Acquired 1/19/11,
Cost $99,910) (a) (c)
2.000% 1/19/14 | | | 100,000 | | | | 101,035 | |
ICICI Bank Ltd. (a)
4.750% 11/25/16 | | | 900,000 | | | | 943,404 | |
ICICI Bank Ltd. (a)
5.750% 11/16/20 | | | 200,000 | | | | 215,769 | |
ING Bank NV FRN
(Acquired 6/13/11,
Cost $1,103,883) (a) (c)
1.358% 3/15/13 | | | 1,100,000 | | | | 1,101,649 | |
Intesa Sanpaolo SpA FRN
(Acquired 2/24/11,
Cost $200,000) (a) (c)
2.712% 2/24/14 | | | 200,000 | | | | 199,776 | |
Intesa Sanpaolo SpA
(Acquired 3/28/11,
Cost $839,480) (a) (c)
6.500% 2/24/21 | | | 800,000 | | | | 842,964 | |
The Royal Bank of Scotland PLC
FRN CAD (d)
2.014% 3/30/15 | | | 100,000 | | | | 87,414 | |
The Royal Bank of Scotland PLC
EUR (d)
6.934% 4/09/18 | | | 100,000 | | | | 148,974 | |
Santander Issuances SA Unipersonal
VRN GBP (d)
7.300% 7/27/19 | | | 2,500,000 | | | | 4,065,186 | |
Santander US Debt SA Unipersonal (Acquired 10/07/10,
Cost $200,000) (a) (c)
2.991% 10/07/13 | | | 200,000 | | | | 200,338 | |
Sberbank of Russia Via SB
Capital SA
5.499% 7/07/15 | | | 800,000 | | | | 864,800 | |
State Bank of India
4.500% 10/23/14 | | | 200,000 | | | | 207,739 | |
The accompanying notes are an integral part of the financial statements.
103
MML PIMCO Total Return Fund – Portfolio of Investments (Continued)
| | | | | | | | |
| | | Principal
Amount | | | Value | |
State Bank of India (a)
4.500% 7/27/15 | | $ | 300,000 | | | $ | 314,700 | |
Turkiye Garanti Bankasi
AS FRN (a)
2.819% 4/20/16 | | | 200,000 | | | | 198,500 | |
| | | | | | | | |
| | | | | | | 17,281,461 | |
| | | | | | | | |
| Beverages — 0.3% | | | | | | | | |
Anheuser-Busch InBev
Worldwide, Inc. FRN
0.863% 1/27/14 | | | 500,000 | | | | 502,637 | |
Pernod-Ricard SA (a)
5.750% 4/07/21 | | | 300,000 | | | | 358,838 | |
| | | | | | | | |
| | | | | | | 861,475 | |
| | | | | | | | |
| Chemicals — 0.4% | | | | | | | | |
Braskem Finance Ltd. (a)
5.750% 4/15/21 | | | 800,000 | | | | 842,000 | |
Braskem Finance Ltd. (a)
7.250% 6/05/18 | | | 400,000 | | | | 457,000 | |
| | | | | | | | |
| | | | | | | 1,299,000 | |
| | | | | | | | |
| Commercial Services — 0.5% | | | | | | | | |
Massachusetts Institute of Technology
5.600% 7/01/2111 | | | 1,000,000 | | | | 1,451,120 | |
| | | | | | | | |
| Computers — 0.3% | | | | | | | | |
Hewlett-Packard Co. FRN
0.592% 5/24/13 | | | 800,000 | | | | 797,684 | |
| | | | | | | | |
| Diversified Financial — 11.2% | | | | | | | | |
Ally Financial, Inc. FRN
3.510% 2/11/14 | | | 1,100,000 | | | | 1,119,657 | |
Ally Financial, Inc. FRN
3.709% 6/20/14 | | | 2,100,000 | | | | 2,148,237 | |
Ally Financial, Inc.
7.500% 9/15/20 | | | 1,000,000 | | | | 1,207,500 | |
American Express Credit Corp.
5.875% 5/02/13 | | | 595,000 | | | | 605,743 | |
American General Finance Corp.
EUR (b) (d)
4.125% 11/29/13 | | | 1,500,000 | | | | 1,962,162 | |
Banque PSA Finance
(Acquired 4/04/11,
Cost $300,000) FRN (a) (c)
2.254% 4/04/14 | | | 300,000 | | | | 296,258 | |
Citigroup, Inc. FRN
1.160% 2/15/13 | | | 100,000 | | | | 100,010 | |
Citigroup, Inc. FRN
1.790% 1/13/14 | | | 200,000 | | | | 201,839 | |
Credit Agricole Home Loan
(Acquired 4/21/11,
Cost $600,000) FRN (a) (c)
1.069% 7/21/14 | | | 600,000 | | | | 601,004 | |
Federal Home Loan Mortgage Corp.
1.000% 6/29/17 | | | 3,500,000 | | | | 3,538,223 | |
| | | | | | | | |
| | | Principal
Amount | | | Value | |
Federal Home Loan Mortgage Corp.
1.000% 7/28/17 | | $ | 2,900,000 | | | $ | 2,930,304 | |
Federal Home Loan Mortgage Corp.
1.000% 9/29/17 | | | 1,300,000 | | | | 1,311,605 | |
Federal Home Loan Mortgage Corp.
1.250% 8/01/19 | | | 1,300,000 | | | | 1,300,732 | |
Federal Home Loan Mortgage Corp.
1.250% 10/02/19 | | | 700,000 | | | | 698,367 | |
Federal Home Loan Mortgage Corp.
2.375% 1/13/22 | | | 100,000 | | | | 104,450 | |
Federal Home Loan Mortgage Corp.
3.750% 3/27/19 | | | 500,000 | | | | 578,832 | |
Federal Home Loan Mortgage Corp.
5.500% 8/23/17 | | | 100,000 | | | | 121,550 | |
Federal National Mortgage Association
0.875% 8/28/17 | | | 2,300,000 | | | | 2,309,742 | |
Federal National Mortgage Association
1.125% 4/27/17 | | | 700,000 | | | | 712,128 | |
Federal National Mortgage Association
1.250% 1/30/17 | | | 800,000 | | | | 819,018 | |
Federal National Mortgage Association
5.000% 2/13/17 | | | 100,000 | | | | 117,545 | |
Federal National Mortgage Association
5.375% 6/12/17 | | | 100,000 | | | | 120,248 | |
Ford Motor Credit Co. LLC
5.625% 9/15/15 | | | 1,000,000 | | | | 1,095,034 | |
Ford Motor Credit Co. LLC
7.000% 4/15/15 | | | 200,000 | | | | 223,008 | |
Ford Motor Credit Co. LLC
8.700% 10/01/14 | | | 100,000 | | | | 111,998 | |
Hyundai Capital Services, Inc. (a)
4.375% 7/27/16 | | | 300,000 | | | | 322,624 | |
International Lease Finance Corp. (a)
6.750% 9/01/16 | | | 600,000 | | | | 673,500 | |
Macquarie Bank Ltd.
(Acquired 04/07/11,
Cost $1,796,490) (a) (c)
6.625% 4/07/21 | | | 1,800,000 | | | | 1,989,612 | |
Merrill Lynch & Co., Inc.
EUR (d)
4.875% 5/30/14 | | | 600,000 | | | | 832,283 | |
Merrill Lynch & Co., Inc.
5.450% 2/05/13 | | | 100,000 | | | | 100,434 | |
Morgan Stanley FRN
2.810% 5/14/13 | | | 100,000 | | | | 100,686 | |
Morgan Stanley, Series F
6.625% 4/01/18 | | | 800,000 | | | | 942,860 | |
SLM Corp.
5.000% 10/01/13 | | | 900,000 | | | | 921,375 | |
SLM Corp.
5.050% 11/14/14 | | | 4,300,000 | | | | 4,513,534 | |
SLM Corp.
8.450% 6/15/18 | | | 100,000 | | | | 117,000 | |
| | | | | | | | |
| | | | | | | 34,849,102 | |
| | | | | | | | |
The accompanying notes are an integral part of the financial statements.
104
MML PIMCO Total Return Fund – Portfolio of Investments (Continued)
| | | | | | | | |
| | | Principal
Amount | | | Value | |
| Electric — 0.6% | | | | | | | | |
Comision Federal de Electricidad (a)
4.875% 5/26/21 | | $ | 900,000 | | | $ | 1,019,250 | |
Duquesne Light Holdings, Inc. (a)
6.400% 9/15/20 | | | 100,000 | | | | 120,952 | |
Entergy Corp.
3.625% 9/15/15 | | | 100,000 | | | | 104,649 | |
Korea Electric Power Corp. (a)
3.000% 10/05/15 | | | 200,000 | | | | 208,612 | |
Korea Hydro & Nuclear
Power Co. Ltd. (a)
3.125% 9/16/15 | | | 100,000 | | | | 104,420 | |
Majapahit Holdings BV (b)
7.250% 6/28/17 | | | 100,000 | | | | 118,500 | |
Majapahit Holdings BV (b)
7.750% 10/17/16 | | | 200,000 | | | | 236,500 | |
| | | | | | | | |
| | | | | | | 1,912,883 | |
| | | | | | | | |
| Forest Products & Paper — 0.0% | | | | | |
Celulosa Arauco y Constitucion SA
5.000% 1/21/21 | | | 100,000 | | | | 106,355 | |
| | | | | | | | |
| Holding Company – Diversified — 0.5% | | | | | |
Hutchison Whampoa
International Ltd. (a)
6.500% 2/13/13 | | | 1,000,000 | | | | 1,006,075 | |
Noble Group Ltd. (a)
6.625% 8/05/20 | | | 200,000 | | | | 206,500 | |
Noble Group Ltd. (a)
6.750% 1/29/20 | | | 300,000 | | | | 316,125 | |
Noble Group Ltd. (b)
6.750% 1/29/20 | | | 100,000 | | | | 105,375 | |
| | | | | | | | |
| | | | | | | 1,634,075 | |
| | | | | | | | |
| Insurance — 1.0% | | | | | | | | |
American International Group, Inc.
6.250% 3/15/37 | | | 1,600,000 | | | | 1,708,000 | |
American International Group, Inc.
VRN 8.175% 5/15/58 | | | 1,000,000 | | | | 1,302,500 | |
| | | | | | | | |
| | | | | | | 3,010,500 | |
| | | | | | | | |
| Iron & Steel — 0.5% | | | | | | | | |
CSN Resources SA (a)
6.500% 7/21/20 | | | 400,000 | | | | 434,000 | |
Gerdau Holdings, Inc. (a)
7.000% 1/20/20 | | | 600,000 | | | | 697,500 | |
Gerdau Trade, Inc. (a)
5.750% 1/30/21 | | | 500,000 | | | | 550,000 | |
| | | | | | | | |
| | | | | | | 1,681,500 | |
| | | | | | | | |
| Machinery – Construction & Mining — 0.2% | |
Caterpillar, Inc. FRN
0.482% 5/21/13 | | | 700,000 | | | | 700,730 | |
| | | | | | | | |
| | | | | | | | |
| | | Principal
Amount | | | Value | |
| Oil & Gas — 0.9% | | | | | | | | |
Ecopetrol SA
7.625% 7/23/19 | | $ | 200,000 | | | $ | 258,500 | |
Indian Oil Corp. Ltd. (b)
4.750% 1/22/15 | | | 500,000 | | | | 522,658 | |
Petrobras International Finance Co.
5.375% 1/27/21 | | | 400,000 | | | | 450,328 | |
Petrobras International Finance Co.
5.750% 1/20/20 | | | 400,000 | | | | 455,342 | |
Petrobras International Finance Co.
8.375% 12/10/18 | | | 200,000 | | | | 253,737 | |
Petroleos Mexicanos
6.500% 6/02/41 | | | 700,000 | | | | 878,500 | |
Transocean, Inc.
4.950% 11/15/15 | | | 100,000 | | | | 109,493 | |
| | | | | | | | |
| | | | | | | 2,928,558 | |
| | | | | | | | |
| Real Estate — 0.1% | | | | | | | | |
Qatari Diar Finance QSC (b)
5.000% 7/21/20 | | | 200,000 | | | | 233,500 | |
| | | | | | | | |
| Savings & Loans — 0.1% | | | | | | | | |
Odebrecht Drilling Norbe
VIII/IX Ltd. (a)
6.350% 6/30/21 | | | 380,000 | | | | 426,550 | |
| | | | | | | | |
| Telecommunications — 2.7% | | | | | | | | |
Deutsche Telekom International Finance BV GBP (d)
6.500% 4/08/22 | | | 1,500,000 | | | | 3,051,355 | |
France Telecom SA
4.375% 7/08/14 | | | 5,000,000 | | | | 5,262,140 | |
| | | | | | | | |
| | | | | | | 8,313,495 | |
| | | | | | | | |
| Transportation — 0.4% | | | | | | | | |
Asciano Finance (a)
5.000% 4/07/18 | | | 1,200,000 | | | | 1,296,764 | |
| | | | | | | | |
| | |
TOTAL CORPORATE DEBT
(Cost $77,542,095) | | | | | | | 81,800,750 | |
| | | | | | | | |
|
| MUNICIPAL OBLIGATIONS — 4.0% | |
Bay Area Toll Authority BAB
6.793% 4/01/30 | | | 800,000 | | | | 1,016,816 | |
Bay Area Toll Authority BAB
7.043% 4/01/50 | | | 1,800,000 | | | | 2,623,932 | |
Dallas/Fort Worth International Airport
5.000% 11/01/21 | | | 1,300,000 | | | | 1,509,586 | |
Dallas/Fort Worth International Airport
5.000% 11/01/26 | | | 1,500,000 | | | | 1,751,040 | |
Irvine Ranch Water District Joint Powers Agency
2.388% 3/15/14 | | | 500,000 | | | | 500,705 | |
Los Angeles Community College District BAB
6.600% 8/01/42 | | | 1,000,000 | | | | 1,362,530 | |
The accompanying notes are an integral part of the financial statements.
105
MML PIMCO Total Return Fund – Portfolio of Investments (Continued)
| | | | | | | | |
| | | Principal
Amount | | | Value | |
Los Angeles Community College
District BAB
6.750% 8/01/49 | | $ | 1,200,000 | | | $ | 1,693,248 | |
San Diego County Regional Airport Authority BAB
6.628% 7/01/40 | | | 1,300,000 | | | | 1,466,374 | |
State of California BAB
5.700% 11/01/21 | | | 500,000 | | | | 595,770 | |
| | | | | | | | |
| | | | | | | 12,520,001 | |
| | | | | | | | |
| | |
TOTAL MUNICIPAL OBLIGATIONS
(Cost $10,553,917) | | | | | | | 12,520,001 | |
| | | | | | | | |
| | |
| NON-U.S. GOVERNMENT AGENCY OBLIGATIONS — 5.8% | | | | | | | | |
| Automobile ABS — 0.1% | | | | | | | | |
Auto Compartiment, Series 2007-2, Class A FRN EUR (b) (d)
0.343% 10/25/20 | | | 103,346 | | | | 136,245 | |
| | | | | | | | |
| Commercial MBS — 2.0% | | | | | | | | |
Banc of America Large Loan, Inc.,
Series 2010-HLTN,
Class HLTN FRN (a)
2.509% 11/15/15 | | | 183,096 | | | | 182,719 | |
Banc of America Large Loan, Inc.,
Series 2009-UB2, Class A4AA
VRN (a)
5.689% 2/24/51 | | | 900,000 | | | | 1,047,096 | |
Bear Stearns Commercial Mortgage Securities, Series 2007-PW16,
Class A2 VRN
5.663% 6/11/40 | | | 787,083 | | | | 817,027 | |
Eclipse Ltd., Series 2007-1X,
Class A FRN GBP (b) (d)
0.698% 1/25/20 | | | 755,945 | | | | 1,173,327 | |
European Loan Conduit,
Series 25A, Class A
FRN EUR (a) (d)
0.342% 5/15/19 | | | 312,360 | | | | 392,003 | |
JP Morgan Chase Commercial Mortgage Securities Corp.,
Series 2010-C2, Class A3 (a)
4.070% 11/15/43 | | | 100,000 | | | | 112,421 | |
Morgan Stanley Reremic Trust,
Series 2010-GG10, Class A4A
VRN (a)
5.789% 8/15/45 | | | 1,500,000 | | | | 1,750,095 | |
Titan Europe PLC, Series 2007-3X,
Class A1 FRN GBP (b) (d)
0.809% 10/23/16 | | | 436,582 | | | | 687,832 | |
| | | | | | | | |
| | | | | | | 6,162,520 | |
| | | | | | | | |
| | | | | | | | |
| | | Principal
Amount | | | Value | |
| Credit Card ABS — 0.2% | | | | | | | | |
Citibank Omni Master Trust,
Series 2009-A14A,
Class A14 FRN (a)
2.959% 8/15/18 | | $ | 600,000 | | | $ | 622,593 | |
| | | | | | | | |
| Other ABS — 1.2% | | | | | | | | |
Duane Street CLO, Series 2005-1A,
Class A FRN (a)
0.562% 11/08/17 | | | 868,405 | | | | 860,156 | |
Hillmark Funding, Series 2006-1A, Class A1 FRN (a)
0.562% 5/21/21 | | | 500,000 | | | | 482,299 | |
RAMP Trust, Series 2005-RS2,
Class M2 FRN
0.690% 2/25/35 | | | 2,725,000 | | | | 2,425,104 | |
Wind River CLO Ltd., Series 2004-1A,
Class A1 FRN (a)
0.639% 12/19/16 | | | 107,335 | | | | 106,045 | |
| | | | | | | | |
| | | | | | | 3,873,604 | |
| | | | | | | | |
| WL Collateral CMO — 2.3% | | | | | | | | |
Chase Mortgage Finance Corp.,
Series 2006-A1, Class 4A1 FRN
5.770% 9/25/36 | | | 99,667 | | | | 96,871 | |
Citigroup Mortgage Loan Trust 2005-11, Series 2005-11, Class A2A FRN
2.570% 10/25/35 | | | 702,864 | | | | 672,271 | |
Granite Master Issuer PLC,
Series 2006-1X,
Class A6 FRN EUR (b) (d)
0.310% 12/20/54 | | | 264,346 | | | | 343,906 | |
Granite Master Issuer PLC, Series 2006-3, Class A5 FRN EUR (d)
0.330% 12/20/54 | | | 561,734 | | | | 730,801 | |
Granite Master Issuer PLC, Series 2005-2,
Class A5 FRN EUR (b) (d)
0.388% 12/20/54 | | | 224,496 | | | | 292,064 | |
Granite Master Issuer PLC, Series 2005-2, Class A6 FRN
0.471% 12/20/54 | | | 224,496 | | | | 221,037 | |
Granite Mortgages PLC, Series 2003-3,
Class 2A FRN EUR (b) (d)
0.585% 1/20/44 | | | 9,872 | | | | 12,952 | |
Granite Mortgages PLC, Series 2004-3,
Class 3A1 FRN GBP (b) (d)
0.878% 9/20/44 | | | 272,121 | | | | 438,318 | |
Granite Mortgages PLC, Series 2004-3,
Class 3A2 FRN GBP (b) (d)
0.898% 9/20/44 | | | 81,636 | | | | 131,495 | |
GSR Mortgage Loan Trust,
Series 2005-AR6, Class 1A1 FRN
2.654% 9/25/35 | | | 718,544 | | | | 729,844 | |
The accompanying notes are an integral part of the financial statements.
106
MML PIMCO Total Return Fund – Portfolio of Investments (Continued)
| | | | | | | | |
| | | Principal
Amount | | | Value | |
JP Morgan Alternative Loan Trust,
Series 2005-A2, Class 1A1 FRN
0.470% 1/25/36 | | $ | 609,841 | | | $ | 503,591 | |
Nomura Asset Acceptance Corp.,
Series 2004-R3, Class A1 (a)
6.500% 2/25/35 | | | 1,246,009 | | | | 1,295,522 | |
Opteum Mortgage Acceptance Corp.,
Series 2005-5, Class 1APT FRN
0.490% 12/25/35 | | | 497,863 | | | | 393,225 | |
Structured Asset Securities Corp.,
Series 2005-16, Class 1A2
5.500% 9/25/35 | | | 1,453,252 | | | | 1,447,752 | |
| | | | | | | | |
| | | | | | | 7,309,649 | |
| | | | | | | | |
| | |
TOTAL NON-U.S. GOVERNMENT AGENCY OBLIGATIONS
(Cost $17,565,348) | | | | | | | 18,104,611 | |
| | | | | | | | |
|
| SOVEREIGN DEBT OBLIGATIONS — 9.4% | |
Banco Nacional de Desenvolvimento Economico e Social EUR (a) (d)
4.125% 9/15/17 | | | 100,000 | | | | 141,895 | |
Indonesia Government International Bond (b)
7.250% 4/20/15 | | | 100,000 | | | | 112,625 | |
Italy Buoni Poliennali Del Tesoro EUR (d)
2.500% 3/01/15 | | | 400,000 | | | | 531,339 | |
Italy Buoni Poliennali Del Tesoro EUR (d)
3.000% 4/01/14 | | | 900,000 | | | | 1,206,013 | |
Italy Buoni Poliennali Del Tesoro EUR (d)
3.500% 6/01/14 | | | 100,000 | | | | 134,939 | |
Italy Buoni Poliennali Del Tesoro EUR (d)
3.750% 8/01/15 | | | 100,000 | | | | 136,377 | |
Italy Buoni Poliennali Del Tesoro EUR (d)
3.750% 4/15/16 | | | 500,000 | | | | 684,074 | |
Italy Buoni Poliennali Del Tesoro EUR (d)
4.500% 7/15/15 | | | 100,000 | | | | 138,671 | |
Italy Buoni Poliennali Del Tesoro EUR (d)
4.750% 5/01/17 | | | 2,800,000 | | | | 3,938,311 | |
Italy Buoni Poliennali Del Tesoro EUR (d)
4.750% 6/01/17 | | | 1,400,000 | | | | 1,966,838 | |
Italy Certificati di Credito del Tesoro Zero Coupon EUR (d)
0.000% 9/30/13 | | | 400,000 | | | | 522,953 | |
| | | | | | | | |
| | | Principal
Amount | | | Value | |
Korea Finance Corp.
3.250% 9/20/16 | | $ | 100,000 | | | $ | 104,942 | |
Korea Housing Finance Corp. (b)
4.125% 12/15/15 | | | 400,000 | | | | 431,378 | |
Mexican Bonos MXN (d)
6.000% 6/18/15 | | | 800,000 | | | | 63,574 | |
Mexican Bonos MXN (d)
7.750% 12/14/17 | | | 2,300,000 | | | | 198,056 | |
Province of Ontario Canada
1.600% 9/21/16 | | | 2,800,000 | | | | 2,889,088 | |
Province of Ontario Canada
1.650% 9/27/19 | | | 100,000 | | | | 99,940 | |
Province of Ontario Canada CAD (d)
3.150% 6/02/22 | | | 300,000 | | | | 312,025 | |
Province of Ontario Canada CAD (d)
4.000% 6/02/21 | | | 1,900,000 | | | | 2,113,857 | |
Province of Ontario Canada CAD (d)
4.200% 6/02/20 | | | 200,000 | | | | 225,431 | |
Province of Ontario Canada CAD (d)
4.400% 6/02/19 | | | 300,000 | | | | 340,288 | |
Province of Ontario Canada
4.400% 4/14/20 | | | 500,000 | | | | 588,824 | |
Province of Quebec Canada
2.750% 8/25/21 | | | 200,000 | | | | 208,923 | |
Province of Quebec Canada CAD (d)
3.500% 12/01/22 | | | 1,800,000 | | | | 1,904,757 | |
Province of Quebec Canada CAD (d)
4.250% 12/01/21 | | | 1,900,000 | | | | 2,135,747 | |
Province of Quebec Canada CAD (d)
4.500% 12/01/20 | | | 500,000 | | | | 571,605 | |
Republic of Indonesia
7.500% 1/15/16 | | | 100,000 | | | | 116,875 | |
Spain Government Bond EUR (d)
3.000% 4/30/15 | | | 100,000 | | | | 131,625 | |
Spain Government Bond EUR (d)
3.150% 1/31/16 | | | 3,400,000 | | | | 4,445,109 | |
Spain Government Bond EUR (d)
3.750% 10/31/15 | | | 600,000 | | | | 796,944 | |
Spain Government Bond EUR (d)
4.250% 10/31/16 | | | 500,000 | | | | 669,479 | |
Spain Government Bond EUR (d)
4.400% 1/31/15 | | | 200,000 | | | | 271,725 | |
Spain Letras del Tesoro EUR (d)
0.000% 4/16/14 | | | 900,000 | | | | 1,150,787 | |
United Mexican States MXN (d)
10.000% 12/05/24 | | | 200,000 | | | | 21,650 | |
| | | | | | | | |
| | | | | | | 29,306,664 | |
| | | | | | | | |
| | |
TOTAL SOVEREIGN DEBT OBLIGATIONS
(Cost $28,325,871) | | | | | | | 29,306,664 | |
| | | | | | | | |
The accompanying notes are an integral part of the financial statements.
107
MML PIMCO Total Return Fund – Portfolio of Investments (Continued)
| | | | | | | | |
| | | Principal
Amount | | | Value | |
U.S. GOVERNMENT AGENCY OBLIGATIONS
AND INSTRUMENTALITIES — 51.3% | |
| Pass-Through Securities — 51.3% | |
Federal National Mortgage Association 0.875%
12/20/17 | | $ | 200,000 | | | $ | 200,266 | |
Pool #AM0359 2.310%
8/01/22 | | | 500,000 | | | | 510,782 | |
Pool #AP8844 2.500%
10/01/27 | | | 995,198 | | | | 1,041,265 | |
Pool #AM0414 2.870%
9/01/27 | | | 200,000 | | | | 197,091 | |
Pool #AB1602 3.500%
10/01/25 | | | 1,874,636 | | | | 1,988,140 | |
Pool #993382 4.000%
6/01/24 | | | 767,373 | | | | 820,849 | |
Pool #AE7266 4.000%
1/01/41 | | | 186,395 | | | | 199,581 | |
Pool #AI8873 4.000%
8/01/41 | | | 415,342 | | | | 444,724 | |
Pool #AI8985 4.000%
8/01/41 | | | 439,798 | | | | 470,910 | |
Pool #AJ4460 4.000%
12/01/41 | | | 2,401,425 | | | | 2,575,060 | |
Pool #MA0531 4.500%
8/01/20 | | | 51,467 | | | | 55,336 | |
Pool #931412 4.500%
6/01/24 | | | 385,020 | | | | 413,956 | |
Pool #932561 4.500%
2/01/25 | | | 72,412 | | | | 77,854 | |
Pool #AD3832 4.500%
4/01/25 | | | 830,014 | | | | 892,394 | |
Pool #930997 4.500%
4/01/29 | | | 1,944,961 | | | | 2,104,129 | |
Pool #931504 4.500%
7/01/39 | | | 278,601 | | | | 304,927 | |
Pool #AC1095 4.500%
7/01/39 | | | 589,439 | | | | 641,452 | |
Pool #932277 4.500%
12/01/39 | | | 238,928 | | | | 261,878 | |
Pool #AD1593 4.500%
2/01/40 | | | 10,729,014 | | | | 11,575,182 | |
Pool #AD1656 4.500%
3/01/40 | | | 4,931,348 | | | | 5,320,270 | |
Pool #AE3461 4.500%
10/01/40 | | | 751,419 | | | | 816,787 | |
Pool #AH1275 4.500%
1/01/41 | | | 1,731,562 | | | | 1,869,208 | |
Pool #AH5583 4.500%
2/01/41 | | | 21,178 | | | | 22,862 | |
Pool #AH4108 4.500%
3/01/41 | | | 696,092 | | | | 751,425 | |
Pool #AH7801 4.500%
3/01/41 | | | 798,288 | | | | 867,858 | |
| | | | | | | | |
| | | Principal
Amount | | | Value | |
Pool #AH8594 4.500%
3/01/41 | | $ | 359,426 | | | $ | 387,998 | |
Pool #AL0160 4.500%
5/01/41 | | | 1,347,088 | | | | 1,453,329 | |
Pool #AI0788 4.500%
6/01/41 | | | 726,710 | | | | 786,068 | |
Pool #889996 5.500%
6/01/38 | | | 17,951,079 | | | | 19,474,116 | |
Federal National Mortgage Association TBA
Pool #1312 3.000%
11/01/26 (e) | | | 8,000,000 | | | | 8,445,000 | |
Pool #4241 3.000%
8/01/42 (e) | | | 6,000,000 | | | | 6,274,687 | |
Pool #1963 3.500%
12/01/41 (e) | | | 21,000,000 | | | | 22,387,970 | |
Pool #7737 4.000%
4/01/24 (e) | | | 6,000,000 | | | | 6,424,687 | |
Pool #9174 4.000%
8/01/40 (e) | | | 29,000,000 | | | | 31,082,110 | |
Pool #11054 4.500%
3/01/21 (e) | | | 2,000,000 | | | | 2,148,438 | |
Pool #18718 4.500%
6/01/39 (e) | | | 17,000,000 | | | | 18,365,312 | |
Pool #26607 5.000%
12/01/36 (e) | | | 8,000,000 | | | | 8,665,625 | |
| | | | | | | | |
| | | | | | | 160,319,526 | |
| | | | | | | | |
TOTAL U.S. GOVERNMENT AGENCY OBLIGATIONS AND INSTRUMENTALITIES
(Cost $159,726,401) | | | | | | | 160,319,526 | |
| | | | | | | | |
|
| U.S. TREASURY OBLIGATIONS — 33.0% | |
| U.S. Treasury Bonds & Notes — 33.0% | |
U.S. Treasury Inflation Index
0.125% 4/15/17 | | | 407,376 | | | | 436,242 | |
U.S. Treasury Inflation Index
0.125% 1/15/22 | | | 2,146,263 | | | | 2,330,709 | |
U.S. Treasury Inflation Index
0.125% 7/15/22 | | | 905,310 | | | | 982,757 | |
U.S. Treasury Inflation Index
0.625% 7/15/21 | | | 1,128,974 | | | | 1,283,326 | |
U.S. Treasury Inflation Index
0.750% 2/15/42 | | | 1,126,092 | | | | 1,233,334 | |
U.S. Treasury Inflation Index
1.125% 1/15/21 | | | 105,745 | | | | 124,201 | |
U.S. Treasury Inflation Index
1.250% 7/15/20 | | | 530,345 | | | | 629,122 | |
U.S. Treasury Inflation Index
1.750% 1/15/28 | | | 1,214,587 | | | | 1,572,226 | |
U.S. Treasury Inflation Index
2.000% 1/15/26 | | | 116,547 | | | | 152,840 | |
U.S. Treasury Inflation Index
2.375% 1/15/25 | | | 122,718 | | | | 165,545 | |
The accompanying notes are an integral part of the financial statements.
108
MML PIMCO Total Return Fund – Portfolio of Investments (Continued)
| | | | | | | | |
| | | Principal
Amount | | | Value | |
U.S. Treasury Inflation Index (f)
2.375% 1/15/27 | | $ | 6,652,890 | | | $ | 9,172,672 | |
U.S. Treasury Inflation Index
2.500% 1/15/29 | | | 2,478,043 | | | | 3,534,309 | |
U.S. Treasury Note
0.375% 11/15/15 | | | 31,900,000 | | | | 31,929,160 | |
U.S. Treasury Note (f) (g)
0.750% 10/31/17 | | | 12,800,000 | | | | 12,841,999 | |
U.S. Treasury Note
0.750% 12/31/17 | | | 13,900,000 | | | | 13,923,891 | |
U.S. Treasury Note (f) (g)
0.875% 7/31/19 | | | 6,500,000 | | | | 6,419,207 | |
U.S. Treasury Note
1.250% 10/31/19 | | | 3,700,000 | | | | 3,730,236 | |
U.S. Treasury Note
1.625% 8/15/22 | | | 2,300,000 | | | | 2,284,870 | |
U.S. Treasury Note
1.625% 11/15/22 | | | 8,500,000 | | | | 8,406,766 | |
U.S. Treasury Note (f) (g)
1.750% 5/15/22 | | | 2,100,000 | | | | 2,118,178 | |
| | | | | | | | |
| | | | | | | 103,271,590 | |
| | | | | | | | |
| | |
TOTAL U.S. TREASURY OBLIGATIONS
(Cost $101,923,589) | | | | | | | 103,271,590 | |
| | | | | | | | |
| | |
TOTAL BONDS & NOTES
(Cost $396,633,530) | | | | | | | 406,316,532 | |
| | | | | | | | |
| | |
TOTAL LONG-TERM INVESTMENTS
(Cost $397,733,530) | | | | | | | 407,489,132 | |
| | | | | | | | |
|
| SHORT-TERM INVESTMENTS — 2.3% | |
| Commercial Paper — 0.6% | | | | | | | | |
Itau Unibanco SA
0.010% 10/31/13 | | | 1,900,000 | | | | 1,876,367 | |
| | | | | | | | |
| Repurchase Agreements — 1.7% | | | | | | | | |
JP Morgan Chase Bank Repurchase Agreement, dated 12/31/12, 0.250%, due 1/02/13 (h) | | | 4,600,000 | | | | 4,600,000 | |
State Street Bank & Trust Co. Repurchase Agreement,
dated 12/31/12, 0.010%,
due 1/02/13 (i) | | | 675,785 | | | | 675,785 | |
| | | | | | | | |
| | | | | | | 5,275,785 | |
| | | | | | | | |
| Time Deposits — 0.0% | | | | | | | | |
Euro Time Deposit
0.010% 1/02/13 | | | 26,250 | | | | 26,250 | |
| | | | | | | | |
| | |
TOTAL SHORT-TERM INVESTMENTS
(Cost $7,178,402) | | | | | | | 7,178,402 | |
| | | | | | | | |
| | | | | | |
| | | | | Value | |
TOTAL INVESTMENTS — 132.7%
(Cost $404,911,932) (j) | | | | $ | 414,667,534 | |
| | |
| Other Assets/(Liabilities) —(32.7)% | | | | | (102,191,644 | ) |
| | | | | | |
| | |
| NET ASSETS — 100.0% | | | | $ | 312,475,890 | |
| | | | | | |
Notes to Portfolio of Investments
| CLO | Collateralized Loan Obligation |
| CMO | Collateralized Mortgage Obligation |
| MBS | Mortgage-Backed Security |
| (a) | Securities exempt from registration under rule 144A of the Securities Act of 1933. These securities may be resold in transactions exempt from registration, normally to qualified institutional buyers. At December 31, 2012, these securities amounted to a value of $25,493,037 or 8.16% of net assets. |
| (b) | Security exempt from registration under Regulation S of the Securities Act of 1933, which exempts from registration securities offered and sold outside the United States. Security may not be offered or sold in the United States except pursuant to an exemption from, or in a transaction not subject to, the registration requirements of the Securities Act of 1933. At December 31, 2012, these securities amounted to a value of $8,091,325 or 2.59% of net assets. |
| (c) | Restricted security. Certain securities are restricted as to resale. At December 31, 2012, these securities amounted to a value of $6,444,760 or 2.06% of net assets. The Funds generally bear the costs, if any, associated with the disposition of restricted securities. |
| (d) | The principal amount of the security is in foreign currency. The market value is in U.S. dollars. |
| (e) | A portion of this security is purchased on a when-issued, delayed-delivery or forward commitment basis. (Note 2). |
| (f) | A portion of this security is held as collateral for open futures contracts. (Note 2). |
| (g) | All or a portion of this security is held as collateral for open swap agreements and written options outstanding. (Note 2). |
| (h) | Maturity value of $4,600,064. Collateralized by U.S. Government Agency obligations with a rate of 2.375%, maturity date of 10/31/14, and an aggregate market value, including accrued interest, of $4,701,372. |
| (i) | Maturity value of $675,785. Collateralized by U.S. Government Agency obligations with a rate of 3.000%, maturity date of 12/01/26, and an aggregate market value, including accrued interest, of $691,993. |
| (j) | See Note 6 for aggregate cost for federal tax purposes. |
The accompanying notes are an integral part of the financial statements.
109
MML Small Cap Growth Equity Fund – Portfolio of Investments
December 31, 2012
| | | | | | | | |
| | | Number of
Shares | | | Value | |
| EQUITIES — 97.1% | | | | | | | | |
| | |
| COMMON STOCK — 97.1% | | | | | | | | |
| Basic Materials — 2.9% | | | | | | | | |
| Chemicals — 1.4% | | | | | | | | |
American Vanguard Corp. | | | 25,800 | | | $ | 801,606 | |
Ferro Corp. (a) | | | 137,590 | | | | 575,126 | |
Methanex Corp. | | | 58,365 | | | | 1,860,093 | |
Minerals Technologies, Inc. | | | 9,600 | | | | 383,232 | |
| | | | | | | | |
| | | | | | | 3,620,057 | |
| | | | | | | | |
| Forest Products & Paper — 1.3% | | | | | | | | |
KapStone Paper and Packaging Corp. | | | 88,610 | | | | 1,966,256 | |
Potlatch Corp. | | | 35,820 | | | | 1,403,785 | |
| | | | | | | | |
| | | | | | | 3,370,041 | |
| | | | | | | | |
| Mining — 0.2% | | | | | | | | |
AuRico Gold, Inc. (a) | | | 72,900 | | | | 596,322 | |
| | | | | | | | |
| | | | | | | 7,586,420 | |
| | | | | | | | |
| Communications — 9.1% | | | | | | | | |
| Internet — 3.9% | | | | | | | | |
Bazaarvoice, Inc. (a) | | | 23,500 | | | | 219,725 | |
Dealertrack Technologies, Inc. (a) | | | 24,860 | | | | 713,979 | |
Dropbox, Inc. (a) (b) | | | 12,328 | | | | 111,557 | |
HomeAway, Inc. (a) | | | 27,460 | | | | 604,120 | |
IAC/InterActiveCorp | | | 41,770 | | | | 1,975,721 | |
OpenTable, Inc. (a) (c) | | | 58,700 | | | | 2,864,560 | |
Sapient Corp. (a) | | | 191,700 | | | | 2,024,352 | |
Shutterstock, Inc. (a) | | | 11,730 | | | | 304,980 | |
ValueClick, Inc. (a) | | | 49,700 | | | | 964,677 | |
Web.com Group, Inc. (a) | | | 41,230 | | | | 610,204 | |
| | | | | | | | |
| | | | | | | 10,393,875 | |
| | | | | | | | |
| Media — 1.9% | | | | | | | | |
FactSet Research Systems, Inc. | | | 43,162 | | | | 3,800,846 | |
Pandora Media, Inc. (a) (c) | | | 120,420 | | | | 1,105,455 | |
| | | | | | | | |
| | | | | | | 4,906,301 | |
| | | | | | | | |
| Semiconductors — 0.2% | | | | | | | | |
IPG Photonics Corp. (c) | | | 9,430 | | | | 628,510 | |
| | | | | | | | |
| Software — 1.2% | | | | | | | | |
BroadSoft, Inc. (a) (c) | | | 75,040 | | | | 2,726,203 | |
Splunk, Inc. (a) | | | 13,320 | | | | 386,547 | |
| | | | | | | | |
| | | | | | | 3,112,750 | |
| | | | | | | | |
| Telecommunications — 1.9% | | | | | | | | |
Aruba Networks, Inc. (a) | | | 15,230 | | | | 316,022 | |
Ciena Corp. (a) | | | 37,140 | | | | 583,098 | |
DigitalGlobe, Inc. (a) | | | 37,800 | | | | 923,832 | |
Ixia (a) | | | 55,770 | | | | 946,975 | |
JDS Uniphase Corp. (a) | | | 39,880 | | | | 539,975 | |
Palo Alto Networks, Inc. (a) (c) | | | 3,000 | | | | 160,560 | |
| | | | | | | | |
| | | Number of
Shares | | | Value | |
tw telecom, Inc. (a) | | | 27,470 | | | $ | 699,661 | |
Vonage Holdings Corp. (a) | | | 314,210 | | | | 744,678 | |
| | | | | | | | |
| | | | | | | 4,914,801 | |
| | | | | | | | |
| | | | | | | 23,956,237 | |
| | | | | | | | |
| Consumer, Cyclical — 15.6% | | | | | | | | |
| Airlines — 0.5% | | | | | | | | |
Spirit Airlines, Inc. (a) | | | 51,330 | | | | 909,568 | |
US Airways Group, Inc. (a) | | | 29,680 | | | | 400,680 | |
| | | | | | | | |
| | | | | | | 1,310,248 | |
| | | | | | | | |
| Apparel — 2.1% | | | | | | | | |
Deckers Outdoor Corp. (a) (c) | | | 8,700 | | | | 350,349 | |
Steven Madden Ltd. (a) | | | 15,560 | | | | 657,721 | |
Under Armour, Inc. Class A (a) | | | 93,800 | | | | 4,552,114 | |
| | | | | | | | |
| | | | | | | 5,560,184 | |
| | | | | | | | |
| Automotive & Parts — 1.4% | | | | | | | | |
Allison Transmission Holdings,
Inc. (c) | | | 29,294 | | | | 598,183 | |
Dana Holding Corp. | | | 64,550 | | | | 1,007,626 | |
Tenneco, Inc. (a) | | | 55,660 | | | | 1,954,223 | |
| | | | | | | | |
| | | | | | | 3,560,032 | |
| | | | | | | | |
| Distribution & Wholesale — 1.3% | | | | | | | | |
Watsco, Inc. | | | 35,100 | | | | 2,628,990 | |
WESCO International, Inc. (a) | | | 10,490 | | | | 707,341 | |
| | | | | | | | |
| | | | | | | 3,336,331 | |
| | | | | | | | |
| Entertainment — 0.7% | | | | | | | | |
Churchill Downs, Inc. | | | 18,850 | | | | 1,252,582 | |
DreamWorks Animation SKG, Inc.
Class A (a) (c) | | | 42,570 | | | | 705,385 | |
| | | | | | | | |
| | | | | | | 1,957,967 | |
| | | | | | | | |
| Foods — 0.3% | | | | | | | | |
Burger King Worldwide, Inc. (c) | | | 50,730 | | | | 834,001 | |
| | | | | | | | |
| Home Builders — 0.7% | | | | | | | | |
Standard Pacific Corp. (a) (c) | | | 240,040 | | | | 1,764,294 | |
| | | | | | | | |
| Leisure Time — 0.8% | | | | | | | | |
Brunswick Corp. | | | 19,480 | | | | 566,673 | |
LIFE TIME FITNESS, Inc. (a) | | | 31,100 | | | | 1,530,431 | |
| | | | | | | | |
| | | | | | | 2,097,104 | |
| | | | | | | | |
| Office Furnishings — 0.0% | | | | | | | | |
Interface, Inc. | | | 4,900 | | | | 78,792 | |
| | | | | | | | |
| Retail — 7.4% | | | | | | | | |
AFC Enterprises, Inc. (a) | | | 20,000 | | | | 522,600 | |
ANN, Inc. (a) | | | 13,890 | | | | 470,038 | |
BJ’s Restaurants, Inc. (a) | | | 47,600 | | | | 1,566,040 | |
Buffalo Wild Wings, Inc. (a) | | | 6,760 | | | | 492,263 | |
Casey’s General Stores, Inc. | | | 10,140 | | | | 538,434 | |
The Cheesecake Factory, Inc. | | | 43,720 | | | | 1,430,518 | |
The accompanying notes are an integral part of the financial statements.
110
MML Small Cap Growth Equity Fund – Portfolio of Investments (Continued)
| | | | | | | | |
| | | Number of
Shares | | | Value | |
Columbia Sportswear Co. (c) | | | 5,100 | | | $ | 272,136 | |
Denny’s Corp. (a) | | | 143,070 | | | | 698,182 | |
Domino’s Pizza, Inc. | | | 33,700 | | | | 1,467,635 | |
DSW, Inc. Class A | | | 8,550 | | | | 561,649 | |
Francesca’s Holdings Corp. (a) (c) | | | 55,840 | | | | 1,449,606 | |
GameStop Corp. Class A (c) | | | 41,100 | | | | 1,031,199 | |
Hanesbrands, Inc. (a) | | | 22,224 | | | | 796,064 | |
Hibbett Sports, Inc. (a) | | | 6,460 | | | | 340,442 | |
HSN, Inc. | | | 28,010 | | | | 1,542,791 | |
Panera Bread Co. Class A (a) | | | 7,700 | | | | 1,222,991 | |
Pier 1 Imports, Inc. | | | 26,020 | | | | 520,400 | |
Rue21, Inc. (a) | | | 15,490 | | | | 439,761 | |
Tile Shop Holdings, Inc. (a) (c) | | | 36,800 | | | | 619,344 | |
Urban Outfitters, Inc. (a) | | | 17,160 | | | | 675,418 | |
Zumiez, Inc. (a) | | | 145,500 | | | | 2,824,155 | |
| | | | | | | | |
| | | | | | | 19,481,666 | |
| | | | | | | | |
| Textiles — 0.4% | | | | | | | | |
Fifth & Pacific Cos., Inc. (a) | | | 87,040 | | | | 1,083,648 | |
| | | | | | | | |
| | | | | | | 41,064,267 | |
| | | | | | | | |
| Consumer, Non-cyclical — 19.9% | | | | | | | | |
| Beverages — 1.0% | | | | | | | | |
The Boston Beer Co., Inc.
Class A (a) (c) | | | 19,000 | | | | 2,554,550 | |
| | | | | | | | |
| Biotechnology — 3.1% | | | | | | | | |
Algeta ASA (a) | | | 10,900 | | | | 306,118 | |
Alkermes PLC (a) | | | 38,700 | | | | 716,724 | |
Arena Pharmaceuticals, Inc. (a) (c) | | | 34,770 | | | | 313,625 | |
AVEO Pharmaceuticals, Inc. (a) | | | 69,360 | | | | 558,348 | |
Exelixis, Inc. (a) (c) | | | 144,120 | | | | 658,628 | |
Immunogen, Inc. (a) (c) | | | 22,050 | | | | 281,137 | |
Incyte Corp. (a) (c) | | | 130,380 | | | | 2,165,612 | |
Ironwood Pharmaceuticals, Inc. (a) | | | 164,040 | | | | 1,819,204 | |
NPS Pharmaceuticals, Inc. (a) | | | 37,790 | | | | 343,889 | |
Seattle Genetics, Inc. (a) (c) | | | 42,690 | | | | 990,408 | |
| | | | | | | | |
| | | | | | | 8,153,693 | |
| | | | | | | | |
| Commercial Services — 2.5% | | | | | | | | |
AerCap Holdings NV (a) | | | 77,460 | | | | 1,062,751 | |
Convergys Corp. | | | 65,680 | | | | 1,077,809 | |
CoStar Group, Inc. (a) | | | 4,530 | | | | 404,846 | |
Forrester Research, Inc. | | | 24,300 | | | | 651,240 | |
Huron Consulting Group, Inc. (a) | | | 17,910 | | | | 603,388 | |
On Assignment, Inc. (a) | | | 26,320 | | | | 533,770 | |
Team Health Holdings, Inc. (a) | | | 23,360 | | | | 672,067 | |
WEX, Inc. (a) | | | 21,700 | | | | 1,635,529 | |
| | | | | | | | |
| | | | | | | 6,641,400 | |
| | | | | | | | |
| Cosmetics & Personal Care — 0.4% | | | | | | | | |
Elizabeth Arden, Inc. (a) | | | 22,900 | | | | 1,030,729 | |
| | | | | | | | |
| | | | | | | | |
| | | Number of
Shares | | | Value | |
| Foods — 1.0% | | | | | | | | |
Annie’s, Inc. (a) | | | 45,300 | | | $ | 1,514,379 | |
Sanderson Farms, Inc. | | | 12,000 | | | | 570,600 | |
WhiteWave Foods Co. (a) (c) | | | 35,600 | | | | 553,224 | |
| | | | | | | | |
| | | | | | | 2,638,203 | |
| | | | | | | | |
| Health Care – Products — 6.3% | | | | | | | | |
Cyberonics, Inc. (a) | | | 77,100 | | | | 4,050,063 | |
Dexcom, Inc. (a) | | | 324,800 | | | | 4,420,528 | |
Globus Medical, Inc. Class A (a) (c) | | | 13,771 | | | | 144,458 | |
HeartWare International, Inc. (a) (c) | | | 34,760 | | | | 2,918,102 | |
Insulet Corp. (a) | | | 56,800 | | | | 1,205,296 | |
Volcano Corp. (a) | | | 159,700 | | | | 3,770,517 | |
| | | | | | | | |
| | | | | | | 16,508,964 | |
| | | | | | | | |
| Health Care – Services — 2.5% | | | | | | | | |
Air Methods Corp. | | | 15,470 | | | | 570,688 | |
Catamaran Corp. (a) | | | 14,176 | | | | 667,831 | |
Covance, Inc. (a) | | | 33,000 | | | | 1,906,410 | |
Health Management Associates, Inc. Class A (a) | | | 105,150 | | | | 979,998 | |
HealthSouth Corp. (a) | | | 19,530 | | | | 412,278 | |
Kindred Healthcare, Inc. (a) | | | 89,240 | | | | 965,577 | |
WellCare Health Plans, Inc. (a) | | | 22,150 | | | | 1,078,484 | |
| | | | | | | | |
| | | | | | | 6,581,266 | |
| | | | | | | | |
| Household Products — 0.1% | | | | | | | | |
Spectrum Brands Holdings, Inc. | | | 9,190 | | | | 412,907 | |
| | | | | | | | |
| Pharmaceuticals — 2.3% | | | | | | | | |
Auxilium Pharmaceuticals, Inc. (a) | | | 13,260 | | | | 245,708 | |
AVANIR Pharmaceuticals,
Inc. (a) (c) | | | 124,400 | | | | 327,172 | |
Cubist Pharmaceuticals, Inc. (a) | | | 39,340 | | | | 1,654,640 | |
The Medicines Co. (a) | | | 20,360 | | | | 488,029 | |
Neogen Corp. (a) | | | 28,700 | | | | 1,300,684 | |
Onyx Pharmaceuticals, Inc. (a) | | | 5,060 | | | | 382,182 | |
Optimer Pharmaceuticals, Inc. (a) (c) | | | 31,100 | | | | 281,455 | |
Rigel Pharmaceuticals, Inc. (a) | | | 28,080 | | | | 182,520 | |
Salix Pharmaceuticals Ltd. (a) | | | 29,720 | | | | 1,203,066 | |
| | | | | | | | |
| | | | | | | 6,065,456 | |
| | | | | | | | |
| Real Estate Investment Trusts (REITS) — 0.2% | | | | | |
Zillow, Inc. Class A (a) (c) | | | 18,130 | | | | 503,107 | |
| | | | | | | | |
| Textiles — 0.5% | | | | | | | | |
Samsonite International SA | | | 318,560 | | | | 666,413 | |
Tumi Holdings, Inc. (a) | | | 27,380 | | | | 570,873 | |
| | | | | | | | |
| | | | | | | 1,237,286 | |
| | | | | | | | |
| | | | | | | 52,327,561 | |
| | | | | | | | |
| Energy — 7.8% | | | | | | | | |
| Coal — 0.3% | | | | | | | | |
Arch Coal, Inc. | | | 63,300 | | | | 463,356 | |
Cloud Peak Energy, Inc. (a) | | | 18,850 | | | | 364,371 | |
| | | | | | | | |
| | | | | | | 827,727 | |
| | | | | | | | |
The accompanying notes are an integral part of the financial statements.
111
MML Small Cap Growth Equity Fund – Portfolio of Investments (Continued)
| | | | | | | | |
| | | Number of
Shares | | | Value | |
| Energy – Alternate Sources — 0.7% | | | | | | | | |
First Solar, Inc. (a) (c) | | | 25,600 | | | $ | 790,528 | |
Headwaters, Inc. (a) | | | 70,000 | | | | 599,200 | |
Solarcity Corp. (a) (c) | | | 27,900 | | | | 332,847 | |
| | | | | | | | |
| | | | | | | 1,722,575 | |
| | | | | | | | |
| Oil & Gas — 2.4% | | | | | | | | |
Atwood Oceanics, Inc. (a) | | | 8,460 | | | | 387,384 | |
Comstock Resources, Inc. (a) | | | 46,470 | | | | 703,091 | |
Painted Pony Petroleum Ltd. (a) | | | 33,300 | | | | 351,513 | |
Patterson-UTI Energy, Inc. | | | 87,840 | | | | 1,636,459 | |
Rex Energy Corp. (a) | | | 26,250 | | | | 341,775 | |
Rosetta Resources, Inc. (a) | | | 28,370 | | | | 1,286,863 | |
SemGroup Corp. Class A (a) | | | 42,500 | | | | 1,660,900 | |
| | | | | | | | |
| | | | | | | 6,367,985 | |
| | | | | | | | |
| Oil & Gas Services — 4.4% | | | | | | | | |
Core Laboratories NV | | | 21,400 | | | | 2,339,234 | |
Dril-Quip, Inc. (a) | | | 78,900 | | | | 5,763,645 | |
Forum Energy Technologies, Inc. (a) | | | 83,500 | | | | 2,066,625 | |
ION Geophysical Corp. (a) | | | 110,153 | | | | 717,096 | |
Trican Well Service Ltd. (c) | | | 50,300 | | | | 663,452 | |
| | | | | | | | |
| | | | | | | 11,550,052 | |
| | | | | | | | |
| | | | | | | 20,468,339 | |
| | | | | | | | |
| Financial — 13.5% | | | | | | | | |
| Banks — 2.9% | | | | | | | | |
Associated Banc-Corp. | | | 55,400 | | | | 726,848 | |
BancorpSouth, Inc. | | | 50,560 | | | | 735,142 | |
Boston Private Financial Holdings, Inc. | | | 114,900 | | | | 1,035,249 | |
East West Bancorp, Inc. | | | 24,720 | | | | 531,233 | |
First Horizon National Corp. | | | 93,060 | | | | 922,225 | |
International Bancshares Corp. | | | 45,030 | | | | 812,791 | |
National Penn Bancshares, Inc. | | | 84,100 | | | | 783,812 | |
Pinnacle Financial Partners, Inc. (a) | | | 24,170 | | | | 455,363 | |
Sterling Financial Corp. | | | 23,093 | | | | 482,182 | |
Webster Financial Corp. | | | 31,000 | | | | 637,050 | |
Western Alliance Bancorp (a) | | | 38,770 | | | | 408,248 | |
| | | | | | | | |
| | | | | | | 7,530,143 | |
| | | | | | | | |
| Diversified Financial — 7.4% | | | | | | | | |
AllianceBernstein Holding LP | | | 141,900 | | | | 2,473,317 | |
Financial Engines, Inc. (a) | | | 143,980 | | | | 3,995,445 | |
Greenhill & Co., Inc. | | | 73,500 | | | | 3,821,265 | |
Investment Technology Group, Inc. (a) | | | 14,300 | | | | 128,700 | |
National Financial Partners
Corp. (a) (c) | | | 42,030 | | | | 720,394 | |
Netspend Holdings, Inc. (a) | | | 20,130 | | | | 237,937 | |
Ocwen Financial Corp. (a) | | | 10,840 | | | | 374,956 | |
Portfolio Recovery Associates, Inc. (a) | | | 54,000 | | | | 5,770,440 | |
WageWorks, Inc. (a) | | | 63,630 | | | | 1,132,614 | |
WisdomTree Investments, Inc. (a) | | | 123,830 | | | | 757,839 | |
| | | | | | | | |
| | | | | | | 19,412,907 | |
| | | | | | | | |
| | | | | | | | |
| | | Number of
Shares | | | Value | |
| Insurance — 1.4% | | | | | | | | |
eHealth, Inc. (a) | | | 48,480 | | | $ | 1,332,231 | |
The Hanover Insurance Group, Inc. | | | 19,200 | | | | 743,808 | |
Primerica, Inc. | | | 31,400 | | | | 942,314 | |
Protective Life Corp. | | | 26,350 | | | | 753,083 | |
| | | | | | | | |
| | | | | | | 3,771,436 | |
| | | | | | | | |
| Investment Companies — 0.3% | | | | | | | | |
Solar Capital Ltd. | | | 31,000 | | | | 741,210 | |
| | | | | | | | |
| Real Estate Investment Trusts (REITS) — 1.5% | | | | | |
Acadia Realty Trust | | | 29,000 | | | | 727,320 | |
American Campus Communities, Inc. | | | 5,370 | | | | 247,718 | |
MFA Financial, Inc. | | | 65,300 | | | | 529,583 | |
Pebblebrook Hotel Trust | | | 31,340 | | | | 723,954 | |
PS Business Parks, Inc. | | | 4,580 | | | | 297,608 | |
Redwood Trust, Inc. | | | 12,000 | | | | 202,680 | |
Sunstone Hotel Investors, Inc. (a) | | | 106,880 | | | | 1,144,685 | |
| | | | | | | | |
| | | | | | | 3,873,548 | |
| | | | | | | | |
| | | | | | | 35,329,244 | |
| | | | | | | | |
| Industrial — 14.9% | | | | | | | | |
| Aerospace & Defense — 1.1% | | | | | | | | |
Moog, Inc. Class A (a) | | | 33,820 | | | | 1,387,635 | |
Teledyne Technologies, Inc. (a) | | | 21,490 | | | | 1,398,354 | |
| | | | | | | | |
| | | | | | | 2,785,989 | |
| | | | | | | | |
| Building Materials — 1.1% | | | | | | | | |
Armstrong World Industries, Inc. | | | 12,410 | | | | 629,559 | |
Lennox International, Inc. | | | 8,420 | | | | 442,218 | |
Louisiana-Pacific Corp. (a) | | | 43,270 | | | | 835,976 | |
Owens Corning, Inc. (a) | | | 21,330 | | | | 788,997 | |
Trex Co., Inc. (a) | | | 5,124 | | | | 190,767 | |
| | | | | | | | |
| | | | | | | 2,887,517 | |
| | | | | | | | |
| Electronics — 1.3% | | | | | | | | |
Coherent, Inc. | | | 9,450 | | | | 478,359 | |
Fabrinet (a) | | | 7,480 | | | | 98,287 | |
Faro Technologies, Inc. (a) | | | 47,700 | | | | 1,701,936 | |
Rogers Corp. (a) | | | 24,610 | | | | 1,222,133 | |
| | | | | | | | |
| | | | | | | 3,500,715 | |
| | | | | | | | |
| Environmental Controls — 1.4% | | | | | | | | |
Waste Connections, Inc. | | | 106,200 | | | | 3,588,498 | |
| | | | | | | | |
| Hand & Machine Tools — 0.5% | | | | | | | | |
Kennametal, Inc. | | | 33,140 | | | | 1,325,600 | |
| | | | | | | | |
| Machinery – Diversified — 3.9% | | | | | | | | |
Applied Industrial Technologies, Inc. | | | 8,950 | | | | 375,989 | |
DXP Enterprises, Inc. (a) | | | 7,030 | | | | 344,962 | |
Graco, Inc. | | | 30,200 | | | | 1,554,998 | |
IDEX Corp. | | | 9,190 | | | | 427,611 | |
The Middleby Corp. (a) | | | 1,960 | | | | 251,292 | |
Nordson Corp. | | | 29,200 | | | | 1,843,104 | |
The accompanying notes are an integral part of the financial statements.
112
MML Small Cap Growth Equity Fund – Portfolio of Investments (Continued)
| | | | | | | | |
| | | Number of
Shares | | | Value | |
Proto Labs, Inc. (a) | | | 49,100 | | | $ | 1,935,522 | |
Wabtec Corp. | | | 40,800 | | | | 3,571,632 | |
| | | | | | | | |
| | | | | | | 10,305,110 | |
| | | | | | | | |
| Manufacturing — 3.4% | | | | | | | | |
Acuity Brands, Inc. | | | 39,310 | | | | 2,662,466 | |
Colfax Corp. (a) | | | 9,540 | | | | 384,939 | |
FreightCar America, Inc. | | | 23,938 | | | | 536,690 | |
Hexcel Corp. (a) | | | 83,300 | | | | 2,245,768 | |
Polypore International, Inc. (a) (c) | | | 20,960 | | | | 974,640 | |
Raven Industries, Inc. | | | 86,000 | | | | 2,266,960 | |
| | | | | | | | |
| | | | | | | 9,071,463 | |
| | | | | | | | |
| Packaging & Containers — 1.2% | | | | | | | | |
Graphic Packaging Holding Co. (a) | | | 182,570 | | | | 1,179,402 | |
Packaging Corporation of America | | | 16,890 | | | | 649,758 | |
Silgan Holdings, Inc. | | | 30,760 | | | | 1,279,309 | |
| | | | | | | | |
| | | | | | | 3,108,469 | |
| | | | | | | | |
| Transportation — 1.0% | | | | | | | | |
Con-way, Inc. | | | 15,460 | | | | 430,097 | |
Landstar System, Inc. | | | 11,940 | | | | 626,372 | |
Old Dominion Freight Line, Inc. (a) | | | 24,517 | | | | 840,443 | |
Swift Transportation Co. (a) | | | 75,900 | | | | 692,208 | |
| | | | | | | | |
| | | | | | | 2,589,120 | |
| | | | | | | | |
| | | | | | | 39,162,481 | |
| | | | | | | | |
| Technology — 13.1% | | | | | | | | |
| Computers — 3.1% | | | | | | | | |
Cadence Design Systems, Inc. (a) | | | 74,930 | | | | 1,012,304 | |
FleetMatics Group PLC (a) (c) | | | 14,200 | | | | 357,272 | |
LivePerson, Inc. (a) | | | 35,260 | | | | 463,317 | |
LogMeIn, Inc. (a) | | | 89,700 | | | | 2,010,177 | |
MICROS Systems, Inc. (a) | | | 64,800 | | | | 2,750,112 | |
Stratasys Ltd. (a) | | | 16,900 | | | | 1,354,535 | |
Syntel, Inc. | | | 5,310 | | | | 284,563 | |
| | | | | | | | |
| | | | | | | 8,232,280 | |
| | | | | | | | |
| Health Care – Services — 0.7% | | | | | | | | |
Vocera Communications, Inc. (a) | | | 66,700 | | | | 1,674,170 | |
| | | | | | | | |
| Semiconductors — 3.4% | | | | | | | | |
Cypress Semiconductor Corp. (a) | | | 59,400 | | | | 643,896 | |
Fairchild Semiconductor International, Inc. (a) | | | 57,090 | | | | 822,096 | |
Hittite Microwave Corp. (a) | | | 54,900 | | | | 3,409,290 | |
Lattice Semiconductor Corp. (a) | | | 113,180 | | | | 451,588 | |
Microsemi Corp. (a) | | | 39,200 | | | | 824,768 | |
Monolithic Power Systems, Inc. | | | 31,600 | | | | 704,048 | |
Nanometrics, Inc. (a) | | | 37,240 | | | | 537,001 | |
ON Semiconductor Corp. (a) | | | 92,000 | | | | 648,600 | |
Ultratech, Inc. (a) | | | 21,510 | | | | 802,323 | |
| | | | | | | | |
| | | | | | | 8,843,610 | |
| | | | | | | | |
| | | | | | | | |
| | | Number of
Shares | | | Value | |
| Software — 5.9% | | | | | | | | |
Concur Technologies, Inc. (a) | | | 10,720 | | | $ | 723,814 | |
Cornerstone OnDemand, Inc. (a) | | | 49,500 | | | | 1,461,735 | |
Demandware, Inc. (a) | | | 7,100 | | | | 193,972 | |
Fair Isaac Corp. | | | 13,360 | | | | 561,521 | |
Imperva, Inc. (a) | | | 33,230 | | | | 1,047,742 | |
Parametric Technology Corp. (a) | | | 24,710 | | | | 556,222 | |
Pegasystems, Inc. | | | 17,720 | | | | 401,889 | |
QLIK Technologies, Inc. (a) | | | 12,700 | | | | 275,844 | |
Servicenow, Inc. (a) (c) | | | 21,470 | | | | 644,744 | |
Solera Holdings, Inc. | | | 48,200 | | | | 2,577,254 | |
TiVo, Inc. (a) | | | 142,290 | | | | 1,753,013 | |
Tyler Technologies, Inc. (a) | | | 59,600 | | | | 2,887,024 | |
The Ultimate Software Group,
Inc. (a) | | | 26,470 | | | | 2,499,033 | |
| | | | | | | | |
| | | | | | | 15,583,807 | |
| | | | | | | | |
| | | | | | | 34,333,867 | |
| | | | | | | | |
| Utilities — 0.3% | | | | | | | | |
| Gas — 0.3% | | | | | | | | |
Southwest Gas Corp. | | | 19,950 | | | | 846,080 | |
| | | | | | | | |
| | |
TOTAL COMMON STOCK
(Cost $224,693,736) | | | | | | | 255,074,496 | |
| | | | | | | | |
| | |
TOTAL EQUITIES
(Cost $224,693,736) | | | | | | | 255,074,496 | |
| | | | | | | | |
| | |
| MUTUAL FUNDS — 9.9% | | | | | | | | |
| Diversified Financial — 9.9% | | | | | | | | |
iShares Russell 2000 Index Fund (c) | | | 10,270 | | | | 865,658 | |
State Street Navigator Securities Lending Prime Portfolio (d) | | | 25,143,114 | | | | 25,143,114 | |
| | | | | | | | |
| | | | | | | 26,008,772 | |
| | | | | | | | |
| | |
TOTAL MUTUAL FUNDS
(Cost $25,992,063) | | | | | | | 26,008,772 | |
| | | | | | | | |
| | |
TOTAL LONG-TERM INVESTMENTS
(Cost $250,685,799) | | | | | | | 281,083,268 | |
| | | | | | | | |
| | |
| | | Principal
Amount | | | | |
| |
| SHORT-TERM INVESTMENTS — 1.9% | | | | | |
| Repurchase Agreement — 1.9% | | | | | | | | |
State Street Bank & Trust Co. Repurchase Agreement, dated 12/31/12, 0.010%, due 1/02/13 (e) | | $ | 5,067,915 | | | | 5,067,915 | |
| | | | | | | | |
| Time Deposits — 0.0% | | | | | | | | |
Euro Time Deposit
0.010% 1/02/13 | | | 8,659 | | | | 8,659 | |
| | | | | | | | |
The accompanying notes are an integral part of the financial statements.
113
MML Small Cap Growth Equity Fund – Portfolio of Investments (Continued)
| | | | | | |
| | | | | Value | |
| | |
TOTAL SHORT-TERM INVESTMENTS
(Cost $5,076,574) | | | | $ | 5,076,574 | |
| | | | | | |
| | |
TOTAL INVESTMENTS — 108.9%
(Cost $255,762,373) (f) | | | | | 286,159,842 | |
| | |
| Other Assets/(Liabilities) — (8.9)% | | | | | (23,361,824 | ) |
| | | | | | |
| | |
| NET ASSETS — 100.0% | | | | $ | 262,798,018 | |
| | | | | | |
Notes to Portfolio of Investments
| (a) | Non-income producing security. |
| (b) | This security is fair valued in accordance with procedures approved by the Board of Trustees. At December 31, 2012, these securities amounted to a value of $111,557 or 0.04% of net assets. |
| (c) | Denotes all or a portion of security on loan. The total value of securities on loan as of December 31, 2012, was $24,515,680. Total securities on loan may not correspond with the amounts identified in the Portfolio of Investments because pending sales may be in the process of recall from the brokers. (Note 2). |
| (d) | Represents investment of security lending collateral. (Note 2). |
| (e) | Maturity value of $5,067,918. Collateralized by U.S. Government Agency obligations with a rate of 3.000%, maturity date of 12/01/26, and an aggregate market value, including accrued interest, of $5,177,280. |
| (f) | See Note 6 for aggregate cost for federal tax purposes. |
The accompanying notes are an integral part of the financial statements.
114
MML Small Company Value Fund – Portfolio of Investments
December 31, 2012
| | | | | | | | |
| | | Number of
Shares | | | Value | |
| EQUITIES — 96.9% | |
|
| COMMON STOCK — 96.8% | |
| Basic Materials — 9.9% | |
| Chemicals — 2.8% | |
American Vanguard Corp. | | | 34,000 | | | $ | 1,056,380 | |
Innospec, Inc. | | | 43,400 | | | | 1,496,866 | |
Minerals Technologies, Inc. | | | 20,000 | | | | 798,400 | |
| | | | | | | | |
| | | | | | | 3,351,646 | |
| | | | | | | | |
| Forest Products & Paper — 3.1% | |
Clearwater Paper Corp. (a) | | | 24,200 | | | | 947,672 | |
Deltic Timber Corp. | | | 15,900 | | | | 1,122,858 | |
Potlatch Corp. | | | 30,000 | | | | 1,175,700 | |
Wausau Paper Corp. | | | 52,800 | | | | 457,248 | |
| | | | | | | | |
| | | | | | | 3,703,478 | |
| | | | | | | | |
| Iron & Steel — 1.3% | |
Carpenter Technology Corp. | | | 23,000 | | | | 1,187,490 | |
Schnitzer Steel Industries, Inc. Class A | | | 14,900 | | | | 451,917 | |
| | | | | | | | |
| | | | | | | 1,639,407 | |
| | | | | | | | |
| Mining — 2.7% | |
AMCOL International Corp. | | | 21,400 | | | | 656,552 | |
Franco-Nevada Corp. | | | 19,700 | | | | 1,124,526 | |
North American Palladium Ltd. (a) (b) | | | 200,000 | | | | 260,000 | |
Royal Gold, Inc. | | | 14,800 | | | | 1,203,388 | |
| | | | | | | | |
| | | | | | | 3,244,466 | |
| | | | | | | | |
| | | | | | | 11,938,997 | |
| | | | | | | | |
| Communications — 3.2% | |
| Internet — 1.0% | |
Safeguard Scientifics, Inc. (a) | | | 51,200 | | | | 755,200 | |
Websense, Inc. (a) | | | 32,300 | | | | 485,792 | |
| | | | | | | | |
| | | | | | | 1,240,992 | |
| | | | | | | | |
| Media — 0.7% | |
The Dolan Co. (a) | | | 43,900 | | | | 170,771 | |
Saga Communications, Inc. Class A | | | 13,000 | | | | 604,500 | |
| | | | | | | | |
| | | | | | | 775,271 | |
| | | | | | | | |
| Telecommunications — 1.5% | |
Ixia (a) | | | 57,200 | | | | 971,256 | |
Premiere Global Services, Inc. (a) | | | 61,000 | | | | 596,580 | |
Sonus Networks, Inc. (a) | | | 141,100 | | | | 239,870 | |
| | | | | | | | |
| | | | | | | 1,807,706 | |
| | | | | | | | |
| | | | | | | 3,823,969 | |
| | | | | | | | |
| Consumer, Cyclical — 12.7% | |
| Airlines — 1.4% | |
Alaska Air Group, Inc. (a) | | | 40,000 | | | | 1,723,600 | |
| | | | | | | | |
| Apparel — 0.2% | |
True Religion Apparel, Inc. | | | 9,700 | | | | 246,574 | |
| | | | | | | | |
| | | | | | | | |
| | | Number of
Shares | | | Value | |
| Automotive & Parts — 0.3% | |
Modine Manufacturing Co. (a) | | | 47,300 | | | $ | 384,549 | |
| | | | | | | | |
| Distribution & Wholesale — 2.9% | |
Beacon Roofing Supply, Inc. (a) | | | 66,000 | | | | 2,196,480 | |
Pool Corp. | | | 29,800 | | | | 1,261,136 | |
| | | | | | | | |
| | | | | | | 3,457,616 | |
| | | | | | | | |
| Entertainment — 0.7% | |
Ascent Media Corp. Series A (a) | | | 12,900 | | | | 799,026 | |
| | | | | | | | |
| Home Builders — 2.1% | |
M/I Homes, Inc. (a) | | | 20,700 | | | | 548,550 | |
Meritage Home Corp. (a) | | | 32,800 | | | | 1,225,080 | |
Winnebago Industries, Inc. (a) | | | 45,200 | | | | 774,276 | |
| | | | | | | | |
| | | | | | | 2,547,906 | |
| | | | | | | | |
| Home Furnishing — 0.4% | |
Ethan Allen Interiors, Inc. | | | 14,800 | | | | 380,508 | |
Stanley Furniture Co., Inc. (a) | | | 24,000 | | | | 108,000 | |
| | | | | | | | |
| | | | | | | 488,508 | |
| | | | | | | | |
| Leisure Time — 0.4% | |
Brunswick Corp. | | | 16,500 | | | | 479,985 | |
| | | | | | | | |
| Lodging — 0.6% | |
Orient-Express Hotels Ltd. (a) | | | 63,700 | | | | 744,653 | |
| | | | | | | | |
| Retail — 2.4% | |
Fred’s, Inc. Class A | | | 35,000 | | | | 465,850 | |
Haverty Furniture Cos., Inc. | | | 41,500 | | | | 676,865 | |
MarineMax, Inc. (a) | | | 37,400 | | | | 334,356 | |
The Men’s Wearhouse, Inc. | | | 29,100 | | | | 906,756 | |
Stein Mart, Inc. | | | 67,900 | | | | 511,966 | |
| | | | | | | | |
| | | | | | | 2,895,793 | |
| | | | | | | | |
| Textiles — 1.3% | |
Culp, Inc. | | | 23,700 | | | | 355,737 | |
Fifth & Pacific Cos., Inc. (a) | | | 26,300 | | | | 327,435 | |
G&K Services, Inc. Class A | | | 24,500 | | | | 836,675 | |
| | | | | | | | |
| | | | | | | 1,519,847 | |
| | | | | | | | |
| | | | | | | 15,288,057 | |
| | | | | | | | |
| Consumer, Non-cyclical — 10.0% | |
| Agriculture — 0.3% | |
Alliance One International, Inc. (a) | | | 83,500 | | | | 303,940 | |
| | | | | | | | |
| Biotechnology — 0.3% | |
Momenta Pharmaceuticals, Inc. (a) | | | 32,200 | | | | 379,316 | |
| | | | | | | | |
| Commercial Services — 6.1% | |
Aaron’s, Inc. | | | 90,600 | | | | 2,562,168 | |
Electro Rent Corp. | | | 55,400 | | | | 852,052 | |
FTI Consulting, Inc. (a) | | | 10,800 | | | | 356,400 | |
Landauer, Inc. | | | 9,500 | | | | 581,495 | |
McGrath RentCorp | | | 46,500 | | | | 1,349,430 | |
Navigant Consulting, Inc. (a) | | | 49,400 | | | | 551,304 | |
The accompanying notes are an integral part of the financial statements.
115
MML Small Company Value Fund – Portfolio of Investments (Continued)
| | | | | | | | |
| | | Number of
Shares | | | Value | |
On Assignment, Inc. (a) | | | 40,400 | | | $ | 819,312 | |
TNS, Inc. (a) | | | 14,900 | | | | 308,877 | |
| | | | | | | | |
| | | | | | | 7,381,038 | |
| | | | | | | | |
| Foods — 0.4% | |
Nash Finch Co. | | | 21,000 | | | | 446,880 | |
| | | | | | | | |
| Health Care – Products — 1.4% | |
Quidel Corp. (a) (b) | | | 28,500 | | | | 532,095 | |
West Pharmaceutical Services, Inc. | | | 22,100 | | | | 1,209,975 | |
| | | | | | | | |
| | | | | | | 1,742,070 | |
| | | | | | | | |
| Health Care – Services — 1.1% | |
National Healthcare Corp. | | | 16,900 | | | | 794,638 | |
Triple-S Management Corp. Class B (a) | | | 25,500 | | | | 470,985 | |
| | | | | | | | |
| | | | | | | 1,265,623 | |
| | | | | | | | |
| Household Products — 0.4% | |
CSS Industries, Inc. | | | 23,300 | | | | 510,037 | |
| | | | | | | | |
| | | | | | | 12,028,904 | |
| | | | | | | | |
| Energy — 4.6% | |
| Coal — 0.5% | |
Cloud Peak Energy, Inc. (a) | | | 30,000 | | | | 579,900 | |
| | | | | | | | |
| Oil & Gas — 2.9% | |
Atwood Oceanics, Inc. (a) | | | 13,000 | | | | 595,270 | |
Hercules Offshore, Inc. (a) | | | 44,600 | | | | 275,628 | |
Northern Oil and Gas, Inc. (a) (b) | | | 43,500 | | | | 731,670 | |
Oasis Petroleum, Inc. (a) | | | 34,900 | | | | 1,109,820 | |
PDC Energy, Inc. (a) | | | 12,700 | | | | 421,767 | |
Swift Energy Co. (a) | | | 26,300 | | | | 404,757 | |
| | | | | | | | |
| | | | | | | 3,538,912 | |
| | | | | | | | |
| Oil & Gas Services — 1.2% | |
C&J Energy Services, Inc. (a) | | | 18,200 | | | | 390,208 | |
CARBO Ceramics, Inc. | | | 8,300 | | | | 650,222 | |
TETRA Technologies, Inc. (a) | | | 59,000 | | | | 447,810 | |
| | | | | | | | |
| | | | | | | 1,488,240 | |
| | | | | | | | |
| | | | | | | 5,607,052 | |
| | | | | | | | |
| Financial — 21.2% | |
| Banks — 6.7% | |
Columbia Banking System, Inc. | | | 20,500 | | | | 367,770 | |
East West Bancorp, Inc. | | | 76,600 | | | | 1,646,134 | |
Glacier Bancorp, Inc. | | | 53,600 | | | | 788,456 | |
Home Bancshares, Inc. | | | 34,800 | | | | 1,149,096 | |
Sandy Spring Bancorp, Inc. | | | 25,700 | | | | 499,094 | |
Signature Bank (a) | | | 14,400 | | | | 1,027,296 | |
SVB Financial Group (a) | | | 28,200 | | | | 1,578,354 | |
Wintrust Financial Corp. | | | 29,100 | | | | 1,067,970 | |
| | | | | | | | |
| | | | | | | 8,124,170 | |
| | | | | | | | |
| Diversified Financial — 2.0% | |
JMP Group, Inc. | | | 27,700 | | | | 168,139 | |
KBW, Inc. | | | 20,000 | | | | 306,000 | |
| | | | | | | | |
| | | Number of
Shares | | | Value | |
Piper Jaffray Cos., Inc. (a) | | | 10,600 | | | $ | 340,578 | |
Stifel Financial Corp. (a) | | | 50,100 | | | | 1,601,697 | |
| | | | | | | | |
| | | | | | | 2,416,414 | |
| | | | | | | | |
| Insurance — 5.4% | |
Alterra Capital Holdings Ltd. | | | 33,900 | | | | 955,641 | |
Assured Guaranty Ltd. | | | 31,582 | | | | 449,412 | |
Employers Holdings, Inc. | | | 18,500 | | | | 380,730 | |
Markel Corp. (a) | | | 1,720 | | | | 745,482 | |
Meadowbrook Insurance Group, Inc. | | | 39,000 | | | | 225,420 | |
National Interstate Corp. | | | 34,300 | | | | 988,526 | |
ProAssurance Corp. | | | 59,800 | | | | 2,522,962 | |
Radian Group, Inc. (b) | | | 44,000 | | | | 268,840 | |
| | | | | | | | |
| | | | | | | 6,537,013 | |
| | | | | | | | |
| Investment Companies — 0.3% | |
Ares Capital Corp. | | | 20,000 | | | | 350,000 | |
| | | | | | | | |
| Real Estate Investment Trusts (REITS) — 6.8% | |
Acadia Realty Trust | | | 33,800 | | | | 847,704 | |
CBL & Associates Properties, Inc. | | | 71,400 | | | | 1,514,394 | |
Cedar Realty Trust, Inc. | | | 63,000 | | | | 332,640 | |
First Potomac Realty Trust | | | 54,500 | | | | 673,620 | |
Kilroy Realty Corp. | | | 32,100 | | | | 1,520,577 | |
LaSalle Hotel Properties | | | 38,950 | | | | 988,941 | |
Pebblebrook Hotel Trust | | | 40,000 | | | | 924,000 | |
PS Business Parks, Inc. | | | 1,700 | | | | 110,466 | |
Saul Centers, Inc. | | | 15,800 | | | | 676,082 | |
Washington Real Estate Investment Trust | | | 20,500 | | | | 536,075 | |
| | | | | | | | |
| | | | | | | 8,124,499 | |
| | | | | | | | |
| | | | | | | 25,552,096 | |
| | | | | | | | |
| Industrial — 27.1% | |
| Aerospace & Defense — 0.9% | |
Kaman Corp. | | | 21,400 | | | | 787,520 | |
Kratos Defense & Security Solutions, Inc. (a) | | | 59,000 | | | | 296,770 | |
| | | | | | | | |
| | | | | | | 1,084,290 | |
| | | | | | | | |
| Building Materials — 3.4% | |
Comfort Systems USA, Inc. | | | 35,900 | | | | 436,544 | |
Drew Industries, Inc. | | | 36,300 | | | | 1,170,675 | |
Gibraltar Industries, Inc. (a) | | | 48,000 | | | | 764,160 | |
Quanex Building Products Corp. | | | 27,800 | | | | 567,398 | |
Texas Industries, Inc. (a) (b) | | | 7,800 | | | | 397,878 | |
Universal Forest Products, Inc. | | | 20,100 | | | | 764,604 | |
| | | | | | | | |
| | | | | | | 4,101,259 | |
| | | | | | | | |
| Electrical Components & Equipment — 2.5% | |
Advanced Energy Industries, Inc. (a) | | | 45,000 | | | | 621,450 | |
Belden, Inc. | | | 27,000 | | | | 1,214,730 | |
Littelfuse, Inc. | | | 19,300 | | | | 1,191,003 | |
| | | | | | | | |
| | | | | | | 3,027,183 | |
| | | | | | | | |
The accompanying notes are an integral part of the financial statements.
116
MML Small Company Value Fund – Portfolio of Investments (Continued)
| | | | | | | | |
| | | Number of
Shares | | | Value | |
| Electronics — 2.6% | |
Analogic Corp. | | | 9,500 | | | $ | 705,850 | |
Cymer, Inc. (a) | | | 2,600 | | | | 235,118 | |
Electro Scientific Industries, Inc. | | | 35,100 | | | | 349,245 | |
Methode Electronics, Inc. | | | 22,200 | | | | 222,666 | |
Newport Corp. (a) | | | 32,800 | | | | 441,160 | |
Woodward, Inc. | | | 30,800 | | | | 1,174,404 | |
| | | | | | | | |
| | | | | | | 3,128,443 | |
| | | | | | | | |
| Engineering & Construction — 0.8% | |
Aegion Corp. (a) | | | 41,600 | | | | 923,104 | |
| | | | | | | | |
| Environmental Controls — 1.6% | |
Mine Safety Appliances Co. | | | 17,600 | | | | 751,696 | |
Waste Connections, Inc. | | | 35,500 | | | | 1,199,545 | |
| | | | | | | | |
| | | | | | | 1,951,241 | |
| | | | | | | | |
| Hand & Machine Tools — 0.5% | |
Franklin Electric Co., Inc. | | | 10,500 | | | | 652,785 | |
| | | | | | | | |
| Machinery – Construction & Mining — 0.4% | |
Astec Industries, Inc. | | | 14,900 | | | | 496,617 | |
| | | | | | | | |
| Machinery – Diversified — 4.4% | |
Cascade Corp. | | | 10,600 | | | | 681,580 | |
Cognex Corp. | | | 10,200 | | | | 375,564 | |
IDEX Corp. | | | 27,500 | | | | 1,279,575 | |
Nordson Corp. | | | 28,000 | | | | 1,767,360 | |
Proto Labs, Inc. (a) | | | 7,000 | | | | 275,940 | |
Robbins & Myers, Inc. | | | 15,100 | | | | 897,695 | |
| | | | | | | | |
| | | | | | | 5,277,714 | |
| | | | | | | | |
| Manufacturing — 2.7% | |
AptarGroup, Inc. | | | 32,000 | | | | 1,527,040 | |
Matthews International Corp. Class A | | | 30,200 | | | | 969,420 | |
Myers Industries, Inc. | | | 53,400 | | | | 809,010 | |
| | | | | | | | |
| | | | | | | 3,305,470 | |
| | | | | | | | |
| Metal Fabricate & Hardware — 0.6% | |
Circor International, Inc. | | | 17,500 | | | | 692,825 | |
| | | | | | | | |
| Transportation — 6.7% | |
Genesee & Wyoming, Inc. Class A (a) | | | 33,550 | | | | 2,552,484 | |
Hub Group, Inc. Class A (a) | | | 21,300 | | | | 715,680 | |
Kirby Corp. (a) | | | 33,350 | | | | 2,064,031 | |
Landstar System, Inc. | | | 48,500 | | | | 2,544,310 | |
Teekay Tankers Ltd. Class A (b) | | | 84,500 | | | | 245,050 | |
| | | | | | | | |
| | | | | | | 8,121,555 | |
| | | | | | | | |
| | | | | | | 32,762,486 | |
| | | | | | | | |
| Technology — 4.0% | |
| Computers — 0.2% | |
Xyratex Ltd. (b) | | | 27,000 | | | | 227,070 | |
| | | | | | | | |
| Semiconductors — 2.0% | |
ATMI, Inc. (a) | | | 20,800 | | | | 434,304 | |
Brooks Automation, Inc. | | | 41,100 | | | | 330,855 | |
Cabot Microelectronics Corp. | | | 17,200 | | | | 610,772 | |
| | | | | | | | |
| | | Number of
Shares | | | Value | |
Entegris, Inc. (a) | | | 19,700 | | | $ | 180,846 | |
Teradyne, Inc. (a) | | | 51,700 | | | | 873,213 | |
| | | | | | | | |
| | | | | | | 2,429,990 | |
| | | | | | | | |
| Software — 1.8% | |
Accelrys, Inc. (a) | | | 30,010 | | | | 271,591 | |
Progress Software Corp. (a) | | | 46,200 | | | | 969,738 | |
SYNNEX Corp. (a) | | | 25,600 | | | | 880,128 | |
| | | | | | | | |
| | | | | | | 2,121,457 | |
| | | | | | | | |
| | | | | | | 4,778,517 | |
| | | | | | | | |
| Utilities — 4.1% | |
| Electric — 2.8% | |
Black Hills Corp. | | | 14,900 | | | | 541,466 | |
Cleco Corp. | | | 31,450 | | | | 1,258,314 | |
El Paso Electric Co. | | | 28,800 | | | | 919,008 | |
NorthWestern Corp. | | | 19,300 | | | | 670,289 | |
| | | | | | | | |
| | | | | | | 3,389,077 | |
| | | | | | | | |
| Gas — 1.3% | |
PNM Resources, Inc. | | | 23,500 | | | | 481,985 | |
Southwest Gas Corp. | | | 21,800 | | | | 924,538 | |
Vectren Corp. | | | 6,700 | | | | 196,980 | |
| | | | | | | | |
| | | | | | | 1,603,503 | |
| | | | | | | | |
| | | | | | | 4,992,580 | |
| | | | | | | | |
| | |
TOTAL COMMON STOCK
(Cost $82,362,443) | | | | | | | 116,772,658 | |
| | | | | | | | |
|
| CONVERTIBLE PREFERRED STOCK — 0.1% | |
| Financial — 0.1% | |
| Banks — 0.1% | |
East West Bancorp, Inc., Series A 8.000% | | | 100 | | | | 150,500 | |
| | | | | | | | |
| | |
TOTAL CONVERTIBLE PREFERRED STOCK
(Cost $69,897) | | | | | | | 150,500 | |
| | | | | | | | |
| | |
TOTAL EQUITIES
(Cost $82,432,340) | | | | | | | 116,923,158 | |
| | | | | | | | |
|
| MUTUAL FUNDS — 2.5% | |
| Diversified Financial — 2.5% | |
iShares Russell 2000 Value Index Fund | | | 11,300 | | | | 853,263 | |
State Street Navigator Securities Lending Prime Portfolio (c) | | | 2,183,668 | | | | 2,183,668 | |
T. Rowe Price Reserve Investment Fund | | | 1,001 | | | | 1,001 | |
| | | | | | | | |
| | | | | | | 3,037,932 | |
| | | | | | | | |
| | |
TOTAL MUTUAL FUNDS
(Cost $2,932,100) | | | | | | | 3,037,932 | |
| | | | | | | | |
The accompanying notes are an integral part of the financial statements.
117
MML Small Company Value Fund – Portfolio of Investments (Continued)
| | | | | | | | |
| | | | | | Value | |
| |
TOTAL LONG-TERM INVESTMENTS
(Cost $85,364,440) | | | $ | 119,961,090 | |
| | | | | | | | |
| | |
| | | Principal
Amount | | | | |
| SHORT-TERM INVESTMENTS — 2.8% | |
| Repurchase Agreement — 2.8% | |
State Street Bank & Trust Co. Repurchase Agreement, dated 12/31/12, 0.010%, due 1/02/13 (d) | | $ | 3,371,980 | | | | 3,371,980 | |
| | | | | | | | |
| | |
TOTAL SHORT-TERM INVESTMENTS
(Cost $3,371,980) | | | | | | | 3,371,980 | |
| | | | | | | | |
| | |
TOTAL INVESTMENTS — 102.2%
(Cost $88,736,420) (e) | | | | | | | 123,333,070 | |
| | |
| Other Assets/(Liabilities) — (2.2)% | | | | | | | (2,705,183 | ) |
| | | | | | | | |
| | |
| NET ASSETS — 100.0% | | | | | | $ | 120,627,887 | |
| | | | | | | | |
Notes to Portfolio of Investments
| (a) | Non-income producing security. |
| (b) | Denotes all or a portion of security on loan. The total value of securities on loan as of December 31, 2012, was $2,092,226. Total securities on loan may not correspond with the amounts identified in the Portfolio of Investments because pending sales may be in the process of recall from the brokers. (Note 2). |
| (c) | Represents investment of security lending collateral. (Note 2). |
| (d) | Maturity value of $3,371,982. Collateralized by U.S. Government Agency obligations with a rate of 3.000%, maturity date of 12/01/26, and an aggregate market value, including accrued interest, of $3,442,003. |
| (e) | See Note 6 for aggregate cost for federal tax purposes. |
The accompanying notes are an integral part of the financial statements.
118
MML Small/Mid Cap Value Fund – Portfolio of Investments
December 31, 2012
| | | | | | | | |
| | | Number of
Shares | | | Value | |
| EQUITIES — 102.2% | | | | | | | | |
| | |
| COMMON STOCK — 102.2% | | | | | | | | |
| Basic Materials — 5.2% | | | | | | | | |
| Chemicals — 1.6% | | | | | | | | |
Chemtura Corp. (a) | | | 59,990 | | | $ | 1,275,387 | |
Huntsman Corp. | | | 95,270 | | | | 1,514,792 | |
| | | | | | | | |
| | | | | | | 2,790,179 | |
| | | | | | | | |
| Iron & Steel — 2.5% | | | | | | | | |
Reliance Steel & Aluminum Co. | | | 38,880 | | | | 2,414,448 | |
Steel Dynamics, Inc. | | | 150,990 | | | | 2,073,093 | |
| | | | | | | | |
| | | | | | | 4,487,541 | |
| | | | | | | | |
| Real Estate Investment Trusts (REITS) — 1.1% | | | | | |
Plum Creek Timber Co., Inc. | | | 42,640 | | | | 1,891,937 | |
| | | | | | | | |
| | | | | | | 9,169,657 | |
| | | | | | | | |
| Communications — 4.1% | | | | | | | | |
| Media — 0.9% | | | | | | | | |
Gannett Co., Inc. | | | 87,210 | | | | 1,570,652 | |
| | | | | | | | |
| Telecommunications — 3.2% | | | | | | | | |
Amdocs Ltd. | | | 67,860 | | | | 2,306,562 | |
Anixter International, Inc. | | | 28,090 | | | | 1,797,198 | |
Harris Corp. | | | 32,080 | | | | 1,570,637 | |
| | | | | | | | |
| | | | | | | 5,674,397 | |
| | | | | | | | |
| | | | | | | 7,245,049 | |
| | | | | | | | |
| Consumer, Cyclical — 17.3% | | | | | | | | |
| Apparel — 1.0% | | | | | | | | |
The Jones Group, Inc. | | | 156,050 | | | | 1,725,913 | |
| | | | | | | | |
| Automotive & Parts — 4.0% | | | | | | | | |
Dana Holding Corp. | | | 123,640 | | | | 1,930,020 | |
Lear Corp. | | | 64,890 | | | | 3,039,448 | |
TRW Automotive Holdings Corp. (a) | | | 38,310 | | | | 2,053,799 | |
| | | | | | | | |
| | | | | | | 7,023,267 | |
| | | | | | | | |
| Distribution & Wholesale — 0.8% | | | | | | | | |
Ingram Micro, Inc. Class A (a) | | | 81,170 | | | | 1,373,397 | |
| | | | | | | | |
| Home Builders — 3.6% | | | | | | | | |
Meritage Home Corp. (a) | | | 58,410 | | | | 2,181,613 | |
NVR, Inc. (a) | | | 2,320 | | | | 2,134,400 | |
PulteGroup, Inc. (a) | | | 117,410 | | | | 2,132,166 | |
| | | | | | | | |
| | | | | | | 6,448,179 | |
| | | | | | | | |
| Housewares — 0.6% | | | | | | | | |
Newell Rubbermaid, Inc. | | | 48,780 | | | | 1,086,331 | |
| | | | | | | | |
| Leisure Time — 1.2% | | | | | | | | |
Royal Caribbean Cruises Ltd. | | | 65,560 | | | | 2,229,040 | |
| | | | | | | | |
| Lodging — 1.4% | | | | | | | | |
MGM Resorts International (a) | | | 209,000 | | | | 2,432,760 | |
| | | | | | | | |
| Office Furnishings — 0.5% | | | | | | | | |
Steelcase, Inc. Class A | | | 65,660 | | | | 836,508 | |
| | | | | | | | |
| | | | | | | | |
| | | Number of
Shares | | | Value | |
| Retail — 4.2% | | | | | | | | |
ANN, Inc. (a) | | | 55,040 | | | $ | 1,862,553 | |
GameStop Corp. Class A | | | 58,120 | | | | 1,458,231 | |
The Men’s Wearhouse, Inc. | | | 77,600 | | | | 2,418,016 | |
Office Depot, Inc. (a) | | | 499,320 | | | | 1,637,770 | |
| | | | | | | | |
| | | | | | | 7,376,570 | |
| | | | | | | | |
| | | | | | | 30,531,965 | |
| | | | | | | | |
| Consumer, Non-cyclical — 10.5% | | | | | | | | |
| Beverages — 1.0% | | | | | | | | |
Constellation Brands, Inc. Class A (a) | | | 48,660 | | | | 1,722,077 | |
| | | | | | | | |
| Commercial Services — 3.4% | | | | | | | | |
Avis Budget Group, Inc. (a) | | | 101,320 | | | | 2,008,162 | |
Convergys Corp. | | | 110,782 | | | | 1,817,933 | |
Hertz Global Holdings, Inc. (a) | | | 132,420 | | | | 2,154,474 | |
| | | | | | | | |
| | | | | | | 5,980,569 | |
| | | | | | | | |
| Foods — 2.5% | | | | | | | | |
Dole Food Co., Inc. (a) | | | 149,530 | | | | 1,715,109 | |
Tyson Foods, Inc. Class A | | | 140,650 | | | | 2,728,610 | |
| | | | | | | | |
| | | | | | | 4,443,719 | |
| | | | | | | | |
| Health Care – Services — 2.8% | | | | | | | | |
Health Net, Inc. (a) | | | 61,450 | | | | 1,493,235 | |
LifePoint Hospitals, Inc. (a) | | | 42,540 | | | | 1,605,885 | |
Universal Health Services, Inc.
Class B | | | 40,140 | | | | 1,940,769 | |
| | | | | | | | |
| | | | | | | 5,039,889 | |
| | | | | | | | |
| Household Products — 0.8% | | | | | | | | |
Avery Dennison Corp. | | | 42,350 | | | | 1,478,862 | |
| | | | | | | | |
| | | | | | | 18,665,116 | |
| | | | | | | | |
| Energy — 4.9% | | | | | | | | |
| Oil & Gas — 4.9% | | | | | | | | |
Cimarex Energy Co. | | | 40,590 | | | | 2,343,261 | |
Helmerich & Payne, Inc. | | | 51,690 | | | | 2,895,157 | |
Plains Exploration & Production
Co. (a) | | | 44,470 | | | | 2,087,422 | |
Stone Energy Corp. (a) | | | 61,330 | | | | 1,258,491 | |
| | | | | | | | |
| | | | | | | 8,584,331 | |
| | | | | | | | |
| Financial — 27.2% | | | | | | | | |
| Banks — 9.1% | | | | | | | | |
Associated Banc-Corp. | | | 144,060 | | | | 1,890,067 | |
CapitalSource, Inc. | | | 283,380 | | | | 2,148,020 | |
Comerica, Inc. | | | 72,730 | | | | 2,206,628 | |
Huntington Bancshares, Inc. | | | 392,620 | | | | 2,508,842 | |
Popular, Inc. (a) | | | 79,169 | | | | 1,645,924 | |
Susquehanna Bancshares, Inc. | | | 181,035 | | | | 1,897,247 | |
Webster Financial Corp. | | | 50,090 | | | | 1,029,349 | |
Zions Bancorp | | | 128,160 | | | | 2,742,624 | |
| | | | | | | | |
| | | | | | | 16,068,701 | |
| | | | | | | | |
The accompanying notes are an integral part of the financial statements.
119
MML Small/Mid Cap Value Fund – Portfolio of Investments (Continued)
| | | | | | | | |
| | | Number of
Shares | | | Value | |
| Diversified Financial — 0.9% | | | | | | | | |
Legg Mason, Inc. | | | 63,000 | | | $ | 1,620,360 | |
| | | | | | | | |
| Insurance — 8.8% | | | | | | | | |
Aspen Insurance Holdings Ltd. | | | 82,210 | | | | 2,637,297 | |
Fidelity National Financial, Inc. Class A | | | 116,080 | | | | 2,733,684 | |
Platinum Underwriters Holdings Ltd. | | | 50,500 | | | | 2,323,000 | |
Reinsurance Group of America, Inc. Class A | | | 30,980 | | | | 1,658,050 | |
Torchmark Corp. | | | 42,740 | | | | 2,208,376 | |
Unum Group | | | 87,190 | | | | 1,815,296 | |
Validus Holdings Ltd. | | | 63,570 | | | | 2,198,250 | |
| | | | | | | | |
| | | | | | | 15,573,953 | |
| | | | | | | | |
| Real Estate Investment Trusts (REITS) — 7.2% | | | | | |
BioMed Realty Trust, Inc. | | | 115,100 | | | | 2,224,883 | |
Camden Property Trust | | | 20,060 | | | | 1,368,293 | |
DiamondRock Hospitality Co. | | | 147,510 | | | | 1,327,590 | |
EPR Properties | | | 48,740 | | | | 2,247,401 | |
Glimcher Realty Trust | | | 188,230 | | | | 2,087,471 | |
Mid-America Apartment Communities, Inc. | | | 20,350 | | | | 1,317,662 | |
RLJ Lodging Trust | | | 112,560 | | | | 2,180,287 | |
| | | | | | | | |
| | | | | | | 12,753,587 | |
| | | | | | | | |
| Savings & Loans — 1.2% | | | | | | | | |
First Niagara Financial Group, Inc. | | | 271,430 | | | | 2,152,440 | |
| | | | | | | | |
| | | | | | | 48,169,041 | |
| | | | | | | | |
| Industrial — 21.2% | | | | | | | | |
| Building Materials — 1.4% | | | | | | | | |
Fortune Brands Home & Security,
Inc. (a) | | | 87,080 | | | | 2,544,478 | |
| | | | | | | | |
| Electrical Components & Equipment — 2.5% | | | | | |
EnerSys (a) | | | 54,730 | | | | 2,059,490 | |
General Cable Corp. (a) | | | 77,930 | | | | 2,369,851 | |
| | | | | | | | |
| | | | | | | 4,429,341 | |
| | | | | | | | |
| Electronics — 6.3% | | | | | | | | |
Arrow Electronics, Inc. (a) | | | 56,290 | | | | 2,143,523 | |
AU Optronics Corp. Sponsored ADR (Taiwan) (a) | | | 354,826 | | | | 1,596,717 | |
Avnet, Inc. (a) | | | 65,350 | | | | 2,000,364 | |
Flextronics International Ltd. (a) | | | 236,120 | | | | 1,466,305 | |
TTM Technologies, Inc. (a) | | | 182,510 | | | | 1,679,092 | |
Vishay Intertechnology, Inc. (a) | | | 204,800 | | | | 2,177,024 | |
| | | | | | | | |
| | | | | | | 11,063,025 | |
| | | | | | | | |
| Engineering & Construction — 0.7% | | | | | | | | |
Tutor Perini Corp. (a) | | | 88,130 | | | | 1,207,381 | |
| | | | | | | | |
| Hand & Machine Tools — 1.1% | | | | | | | | |
Kennametal, Inc. | | | 49,280 | | | | 1,971,200 | |
| | | | | | | | |
| Machinery – Construction & Mining — 1.3% | | | | | |
Terex Corp. (a) | | | 82,610 | | | | 2,322,167 | |
| | | | | | | | |
| | | | | | | | |
| | | Number of
Shares | | | Value | |
| Machinery – Diversified — 0.7% | | | | | | | | |
Sauer-Danfoss, Inc. | | | 24,060 | | | $ | 1,284,082 | |
| | | | | | | | |
| Metal Fabricate & Hardware — 2.9% | | | | | |
Commercial Metals Co. | | | 161,940 | | | | 2,406,428 | |
The Timken Co. | | | 55,600 | | | | 2,659,348 | |
| | | | | | | | |
| | | | | | | 5,065,776 | |
| | | | | | | | |
| Transportation — 3.2% | | | | | | | | |
Bristow Group, Inc. | | | 45,930 | | | | 2,464,604 | |
Con-way, Inc. | | | 76,400 | | | | 2,125,448 | |
Teekay Corp. | | | 33,020 | | | | 1,059,942 | |
| | | | | | | | |
| | | | | | | 5,649,994 | |
| | | | | | | | |
| Trucking & Leasing — 1.1% | | | | | | | | |
Aircastle Ltd. | | | 162,180 | | | | 2,033,737 | |
| | | | | | | | |
| | | | | | | 37,571,181 | |
| | | | | | | | |
| Technology — 6.1% | | | | | | | | |
| Retail — 1.1% | | | | | | | | |
Insight Enterprises, Inc. (a) | | | 114,480 | | | | 1,988,518 | |
| | | | | | | | |
| Semiconductors — 5.0% | | | | | | | | |
Amkor Technology, Inc. (a) | | | 213,080 | | | | 905,590 | |
Entegris, Inc. (a) | | | 229,190 | | | | 2,103,964 | |
Lam Research Corp. (a) | | | 59,410 | | | | 2,146,483 | |
Micron Technology, Inc. (a) | | | 341,140 | | | | 2,166,239 | |
MKS Instruments, Inc. | | | 60,178 | | | | 1,551,389 | |
| | | | | | | | |
| | | | | | | 8,873,665 | |
| | | | | | | | |
| | | | | | | 10,862,183 | |
| | | | | | | | |
| Utilities — 5.7% | | | | | | | | |
| Electric — 2.4% | | | | | | | | |
Great Plains Energy, Inc. | | | 98,370 | | | | 1,997,895 | |
NV Energy, Inc. | | | 122,640 | | | | 2,224,689 | |
| | | | | | | | |
| | | | | | | 4,222,584 | |
| | | | | | | | |
| Gas — 3.3% | | | | | | | | |
Atmos Energy Corp. | | | 50,300 | | | | 1,766,536 | |
PNM Resources, Inc. | | | 102,120 | | | | 2,094,481 | |
UGI Corp. | | | 61,840 | | | | 2,022,787 | |
| | | | | | | | |
| | | | | | | 5,883,804 | |
| | | | | | | | |
| | | | | | | 10,106,388 | |
| | | | | | | | |
| | |
TOTAL COMMON STOCK
(Cost $165,705,002) | | | | | | | 180,904,911 | |
| | | | | | | | |
| | |
TOTAL EQUITIES
(Cost $165,705,002) | | | | | | | 180,904,911 | |
| | | | | | | | |
| |
TOTAL LONG-TERM INVESTMENTS
(Cost $165,705,002) | | | | 180,904,911 | |
| | | | | | | | |
The accompanying notes are an integral part of the financial statements.
120
MML Small/Mid Cap Value Fund – Portfolio of Investments (Continued)
| | | | | | | | |
| | | Principal
Amount | | | Value | |
| |
| SHORT-TERM INVESTMENTS — 0.6% | | | | | |
| Repurchase Agreement — 0.6% | | | | | | | | |
State Street Bank & Trust Co. Repurchase Agreement, dated 12/31/12, 0.010%, due 1/02/13 (b) | | $ | 1,092,573 | | | $ | 1,092,573 | |
| | | | | | | | |
| | |
TOTAL SHORT-TERM INVESTMENTS
(Cost $1,092,573) | | | | | | | 1,092,573 | |
| | | | | | | | |
| | |
TOTAL INVESTMENTS — 102.8%
(Cost $166,797,575) (c) | | | | | | | 181,997,484 | |
| | |
| Other Assets/(Liabilities) — (2.8)% | | | | | | | (5,032,691 | ) |
| | | | | | | | |
| | |
| NET ASSETS — 100.0% | | | | | | $ | 176,964,793 | |
| | | | | | | | |
Notes to Portfolio of Investments
| ADR | American Depositary Receipt |
| (a) | Non-income producing security. |
| (b) | Maturity value of $1,092,574. Collateralized by U.S. Government Agency obligations with a rate of 3.000%, maturity date of 12/01/26, and an aggregate market value, including accrued interest, of $1,116,831. |
| (c) | See Note 6 for aggregate cost for federal tax purposes. |
The accompanying notes are an integral part of the financial statements.
121
MML Series Investment Fund – Financial Statements
Statements of Assets and Liabilities
December 31, 2012
| | | | | | | | |
| | | MML
Blue Chip
Growth Fund | | | MML
Equity
Income Fund | |
| Assets: | | | | | | | | |
Investments, at value (Note 2) (a) | | $ | 332,794,805 | | | $ | 494,434,348 | |
Short-term investments, at value (Note 2) (b) | | | 3,315,498 | | | | 23,153,055 | |
| | | | | | | | |
Total investments (c) | | | 336,110,303 | | | | 517,587,403 | |
| | | | | | | | |
Foreign currency, at value (d) | | | - | | | | - | |
Receivables from: | | | | | | | | |
Investments sold | | | 65,641 | | | | - | |
Investment adviser (Note 3) | | | - | | | | - | |
Fund shares sold | | | 352,508 | | | | 419,379 | |
Variation margin on open derivative instruments (Note 2) | | | - | | | | - | |
Interest and dividends | | | 99,662 | | | | 594,123 | |
Foreign taxes withheld | | | 8,012 | | | | - | |
| | | | | | | | |
Total assets | | | 336,636,126 | | | | 518,600,905 | |
| | | | | | | | |
| Liabilities: | | | | | | | | |
Payables for: | | | | | | | | |
Investments purchased | | | 68,702 | | | | 193,581 | |
Fund shares repurchased | | | 94,596 | | | | 396,145 | |
Securities on loan (Note 2) | | | - | | | | - | |
Investment advisory fees | | | - | | | | - | |
Trustees’ fees and expenses (Note 3) | | | 52,705 | | | | 97,298 | |
Affiliates (Note 3): | | | | | | | | |
Investment management fees | | | 211,699 | | | | 326,564 | |
Administration fees | | | - | | | | - | |
Service fees | | | 9,244 | | | | 24,645 | |
Accrued expense and other liabilities | | | 58,744 | | | | 68,969 | |
| | | | | | | | |
Total liabilities | | | 495,690 | | | | 1,107,202 | |
| | | | | | | | |
Net assets | | $ | 336,140,436 | | | $ | 517,493,703 | |
| | | | | | | | |
| Net assets consist of: | | | | | | | | |
Paid-in capital | | $ | 216,576,516 | | | $ | 451,650,291 | |
Undistributed (accumulated) net investment income (loss) | | | 792,196 | | | | 10,573,396 | |
Distributions in excess of net investment income | | | - | | | | - | |
Accumulated net realized gain (loss) on investments and foreign currency transactions | | | 30,833,878 | | | | (30,914,731 | ) |
Net unrealized appreciation (depreciation) on investments and foreign currency translations | | | 87,937,846 | | | | 86,184,747 | |
| | | | | | | | |
Net assets | | $ | 336,140,436 | | | $ | 517,493,703 | |
| | | | | | | | |
| | | | | | | | |
(a) Cost of investments: | | $ | 244,858,521 | | | $ | 408,250,315 | |
(b) Cost of short-term investments: | | $ | 3,315,498 | | | $ | 23,153,055 | |
(c) Securities on loan with market value of: | | $ | - | | | $ | - | |
(d) Cost of foreign currency: | | $ | - | | | $ | - | |
The accompanying notes are an integral part of the financial statements.
122
| | | | | | | | | | | | | | | | | | |
MML
Equity
Index Fund | | | MML
Focused
Equity Fund | | | MML
Foreign
Fund | | | MML
Fundamental
Growth Fund | | | MML
Fundamental
Value Fund | |
| | | | | | | | | | | | | | | | | | |
| $ | 309,696,594 | | | $ | 126,594,660 | | | $ | 372,612,448 | | | $ | 172,886,042 | | | $ | 181,041,934 | |
| | 7,584,767 | | | | 10,598,493 | | | | 15,959,493 | | | | 7,622,724 | | | | 5,012,429 | |
| | | | | | | | | | | | | | | | | | |
| | 317,281,361 | | | | 137,193,153 | | | | 388,571,941 | | | | 180,508,766 | | | | 186,054,363 | |
| | | | | | | | | | | | | | | | | | |
| | - | | | | - | | | | 16,920 | | | | - | | | | - | |
| | | | | | | | | | | | | | | | | | |
| | 41,248 | | | | - | | | | - | | | | 435,421 | | | | - | |
| | 9,621 | | | | - | | | | - | | | | 4,531 | | | | 562 | |
| | 498,068 | | | | 76,767 | | | | 81,531 | | | | 121,536 | | | | 126,190 | |
| | 207,575 | | | | - | | | | - | | | | - | | | | - | |
| | 341,648 | | | | 36,803 | | | | 573,003 | | | | 107,662 | | | | 214,277 | |
| | - | | | | - | | | | 512,202 | | | | - | | | | 3,936 | |
| | | | | | | | | | | | | | | | | | |
| | 318,379,521 | | | | 137,306,723 | | | | 389,755,597 | | | | 181,177,916 | | | | 186,399,328 | |
| | | | | | | | | | | | | | | | | | |
| | | | | | | | | | | | | | | | | | |
| | | | | | | | | | | | | | | | | | |
| | - | | | | - | | | | - | | | | 590,688 | | | | 319,971 | |
| | 108,063 | | | | 40,370 | | | | 8,688,929 | | | | 54,267 | | | | 52,154 | |
| | - | | | | - | | | | 18,720,167 | | | | - | | | | - | |
| | - | | | | 1,842 | | | | - | | | | - | | | | - | |
| | 157,193 | | | | 5,824 | | | | 66,599 | | | | 8,115 | | | | 12,426 | |
| | | | | | | | | | | | | | | | | | |
| | 26,756 | | | | 85,382 | | | | 274,824 | | | | 106,342 | | | | 101,393 | |
| | 45,044 | | | | 11,384 | | | | - | | | | 15,192 | | | | 15,599 | |
| | 6,251 | | | | 444 | | | | 4,262 | | | | 252 | | | | 208 | |
| | 57,276 | | | | 38,390 | | | | 71,491 | | | | 50,941 | | | | 43,567 | |
| | | | | | | | | | | | | | | | | | |
| | 400,583 | | | | 183,636 | | | | 27,826,272 | | | | 825,797 | | | | 545,318 | |
| | | | | | | | | | | | | | | | | | |
| $ | 317,978,938 | | | $ | 137,123,087 | | | $ | 361,929,325 | | | $ | 180,352,119 | | | $ | 185,854,010 | |
| | | | | | | | | | | | | | | | | | |
| | | | | | | | | | | | | | | | | | |
| $ | 241,400,219 | | | $ | 120,419,217 | | | $ | 380,042,085 | | | $ | 166,630,829 | | | $ | 152,966,998 | |
| | 6,101,047 | | | | - | | | | 7,698,377 | | | | - | | | | 3,470,383 | |
| | - | | | | (5,059 | ) | | | - | | | | (7,045 | ) | | | - | |
| | (6,749,195 | ) | | | 2,096,881 | | | | (31,346,373 | ) | | | (43,528 | ) | | | 7,039,102 | |
| | 77,226,867 | | | | 14,612,048 | | | | 5,535,236 | | | | 13,771,863 | | | | 22,377,527 | |
| | | | | | | | | | | | | | | | | | |
| $ | 317,978,938 | | | $ | 137,123,087 | | | $ | 361,929,325 | | | $ | 180,352,119 | | | $ | 185,854,010 | |
| | | | | | | | | | | | | | | | | | |
| | | | | | | | | | | | | | | | | | |
| $ | 232,473,262 | | | $ | 111,982,612 | | | $ | 367,119,036 | | | $ | 159,114,179 | | | $ | 158,664,407 | |
| $ | 7,584,767 | | | $ | 10,598,493 | | | $ | 15,959,493 | | | $ | 7,622,724 | | | $ | 5,012,429 | |
| $ | - | | | $ | - | | | $ | 17,896,279 | | | $ | - | | | $ | - | |
| $ | - | | | $ | - | | | $ | 16,890 | | | $ | - | | | $ | - | |
123
MML Series Investment Fund – Financial Statements (Continued)
Statements of Assets and Liabilities
December 31, 2012
| | | | | | | | |
| | | MML
Blue Chip
Growth Fund | | | MML
Equity
Income Fund | |
| Initial Class shares: | | | | | | | | |
Net assets | | $ | 321,245,445 | | | $ | 478,096,470 | |
| | | | | | | | |
Shares outstanding (a) | | | 23,798,785 | | | | 45,217,213 | |
| | | | | | | | |
Net asset value, offering price and redemption price per share | | $ | 13.50 | | | $ | 10.57 | |
| | | | | | | | |
| Class I shares: | | | | | | | | |
Net assets | | $ | - | | | $ | - | |
| | | | | | | | |
Shares outstanding (a) | | | - | | | | - | |
| | | | | | | | |
Net asset value, offering price and redemption price per share | | $ | - | | | $ | - | |
| | | | | | | | |
| Class II shares: | | | | | | | | |
Net assets | | $ | - | | | $ | - | |
| | | | | | | | |
Shares outstanding (a) | | | - | | | | - | |
| | | | | | | | |
Net asset value, offering price and redemption price per share | | $ | - | | | $ | - | |
| | | | | | | | |
| Class III shares: | | | | | | | | |
Net assets | | $ | - | | | $ | - | |
| | | | | | | | |
Shares outstanding (a) | | | - | | | | - | |
| | | | | | | | |
Net asset value, offering price and redemption price per share | | $ | - | | | $ | - | |
| | | | | | | | |
| Service Class shares: | | | | | | | | |
Net assets | | $ | 14,894,991 | | | $ | 39,397,233 | |
| | | | | | | | |
Shares outstanding (a) | | | 1,113,171 | | | | 3,746,644 | |
| | | | | | | | |
Net asset value, offering price and redemption price per share | | $ | 13.38 | | | $ | 10.52 | |
| | | | | | | | |
| Service Class I shares: | | | | | | | | |
Net assets | | $ | - | | | $ | - | |
| | | | | | | | |
Shares outstanding (a) | | | - | | | | - | |
| | | | | | | | |
Net asset value, offering price and redemption price per share | | $ | - | | | $ | - | |
| | | | | | | | |
| (a) | Authorized unlimited number of shares with no par value. |
The accompanying notes are an integral part of the financial statements.
124
| | | | | | | | | | | | | | | | | | |
MML
Equity
Index Fund | | | MML
Focused
Equity Fund | | | MML
Foreign
Fund | | | MML
Fundamental
Growth Fund | | | MML
Fundamental
Value Fund | |
| | | | | | | | | | | | | | | | | | |
| $ | - | | | $ | - | | | $ | 355,173,621 | | | $ | - | | | $ | - | |
| | | | | | | | | | | | | | | | | | |
| | - | | | | - | | | | 37,508,986 | | | | - | | | | - | |
| | | | | | | | | | | | | | | | | | |
| $ | - | | | $ | - | | | $ | 9.47 | | | $ | - | | | $ | - | |
| | | | | | | | | | | | | | | | | | |
| | | | | | | | | | | | | | | | | | |
| $ | 79,070,367 | | | $ | - | | | $ | - | | | $ | - | | | $ | - | |
| | | | | | | | | | | | | | | | | | |
| | 4,418,584 | | | | - | | | | - | | | | - | | | | - | |
| | | | | | | | | | | | | | | | | | |
| $ | 17.89 | | | $ | - | | | $ | - | | | $ | - | | | $ | - | |
| | | | | | | | | | | | | | | | | | |
| | | | | | | | | | | | | | | | | | |
| $ | 109,645,711 | | | $ | 136,305,236 | | | $ | - | | | $ | 179,834,485 | | | $ | 185,473,009 | |
| | | | | | | | | | | | | | | | | | |
| | 6,115,751 | | | | 11,861,940 | | | | - | | | | 16,437,445 | | | | 14,897,880 | |
| | | | | | | | | | | | | | | | | | |
| $ | 17.93 | | | $ | 11.49 | | | $ | - | | | $ | 10.94 | | | $ | 12.45 | |
| | | | | | | | | | | | | | | | | | |
| | | | | | | | | | | | | | | | | | |
| $ | 119,033,916 | | | $ | - | | | $ | - | | | $ | - | | | $ | - | |
| | | | | | | | | | | | | | | | | | |
| | 6,646,395 | | | | - | | | | - | | | | - | | | | - | |
| | | | | | | | | | | | | | | | | | |
| $ | 17.91 | | | $ | - | | | $ | - | | | $ | - | | | $ | - | |
| | | | | | | | | | | | | | | | | | |
| | | | | | | | | | | | | | | | | | |
| $ | - | | | $ | - | | | $ | 6,755,704 | | | $ | - | | | $ | - | |
| | | | | | | | | | | | | | | | | | |
| | - | | | | - | | | | 716,616 | | | | - | | | | - | |
| | | | | | | | | | | | | | | | | | |
| $ | - | | | $ | - | | | $ | 9.43 | | | $ | - | | | $ | - | |
| | | | | | | | | | | | | | | | | | |
| | | | | | | | | | | | | | | | | | |
| $ | 10,228,944 | | | $ | 817,851 | | | $ | - | | | $ | 517,634 | | | $ | 381,001 | |
| | | | | | | | | | | | | | | | | | |
| | 580,549 | | | | 71,244 | | | | - | | | | 47,383 | | | | 30,670 | |
| | | | | | | | | | | | | | | | | | |
| $ | 17.62 | | | $ | 11.48 | | | $ | - | | | $ | 10.92 | | | $ | 12.42 | |
| | | | | | | | | | | | | | | | | | |
125
MML Series Investment Fund – Financial Statements (Continued)
Statements of Assets and Liabilities
December 31, 2012
| | | | | | | | |
| | | MML
Global Fund | | | MML
Growth &
Income Fund | |
| Assets: | | | | | | | | |
Investments, at value (Note 2) (a) | | $ | 151,521,165 | | | $ | 127,470,436 | |
Short-term investments, at value (Note 2) (b) | | | 3,116,246 | | | | 921,662 | |
| | | | | | | | |
Total investments (c ) | | | 154,637,411 | | | | 128,392,098 | |
| | | | | | | | |
Receivables from: | | | | | | | | |
Investments sold | | | 32,006 | | | | 1,342,667 | |
Investment adviser (Note 3) | | | 5,076 | | | | - | |
Fund shares sold | | | 81,577 | | | | 11,245 | |
Interest and dividends | | | 104,738 | | | | 60,308 | |
Foreign taxes withheld | | | 122,469 | | | | 2,995 | |
| | | | | | | | |
Total assets | | | 154,983,277 | | | | 129,809,313 | |
| | | | | | | | |
| Liabilities: | | | | | | | | |
Payables for: | | | | | | | | |
Investments purchased | | | 34,339 | | | | 1,091,619 | |
Fund shares repurchased | | | 200,244 | | | | 74,247 | |
Securities on loan (Note 2) | | | 2,879,151 | | | | - | |
Trustees’ fees and expenses (Note 3) | | | 17,546 | | | | 42,348 | |
Affiliates (Note 3): | | | | | | | | |
Investment management fees | | | 76,209 | | | | 54,246 | |
Administration fees | | | 34,188 | | | | - | |
Service fees | | | 2,253 | | | | 7,766 | |
Accrued expense and other liabilities | | | 44,152 | | | | 38,937 | |
| | | | | | | | |
Total liabilities | | | 3,288,082 | | | | 1,309,163 | |
| | | | | | | | |
Net assets | | $ | 151,695,195 | | | $ | 128,500,150 | |
| | | | | | | | |
| Net assets consist of: | | | | | | | | |
Paid-in capital | | $ | 120,692,960 | | | $ | 164,807,593 | |
Undistributed (accumulated) net investment income (loss) | | | 1,670,455 | | | | 1,827,397 | |
Accumulated net realized gain (loss) on investments and foreign currency transactions | | | (7,113,233 | ) | | | (62,404,680 | ) |
Net unrealized appreciation (depreciation) on investments and foreign currency translations | | | 36,445,013 | | | | 24,269,840 | |
| | | | | | | | |
Net assets | | $ | 151,695,195 | | | $ | 128,500,150 | |
| | | | | | | | |
| | | | | | | | |
(a) Cost of investments: | | $ | 115,085,263 | | | $ | 103,200,629 | |
(b) Cost of short-term investments: | | $ | 3,116,246 | | | $ | 921,662 | |
(c) Securities on loan with market value of: | | $ | 2,749,154 | | | $ | - | |
The accompanying notes are an integral part of the financial statements.
126
| | | | | | | | | | | | | | |
MML
Income &
Growth Fund | | | MML
Large Cap
Growth Fund | | | MML
Large Cap
Value Fund | | | MML
Mid Cap
Growth Fund | |
| | | | | | | | | | | | | | |
| $ | 175,831,540 | | | $ | 201,936,226 | | | $ | 205,630,119 | | | $ | 361,387,084 | |
| | 7,087,150 | | | | 4,808,134 | | | | 9,895,096 | | | | 7,779,361 | |
| | | | | | | | | | | | | | |
| | 182,918,690 | | | | 206,744,360 | | | | 215,525,215 | | | | 369,166,445 | |
| | | | | | | | | | | | | | |
| | | | | | | | | | | | | | |
| | - | | | | 2,156,388 | | | | 1,233,649 | | | | 1,301,593 | |
| | - | | | | - | | | | - | | | | - | |
| | 180,719 | | | | 129,214 | | | | 1,440,132 | | | | 310,830 | |
| | 331,154 | | | | 44,840 | | | | 102,890 | | | | 111,714 | |
| | - | | | | - | | | | 61,181 | | | | - | |
| | | | | | | | | | | | | | |
| | 183,430,563 | | | | 209,074,802 | | | | 218,363,067 | | | | 370,890,582 | |
| | | | | | | | | | | | | | |
| | | | | | | | | | | | | | |
| | | | | | | | | | | | | | |
| | 672,874 | | | | 1,569,562 | | | | - | | | | 1,891,979 | |
| | 87,749 | | | | 52,760 | | | | 1,569 | | | | 86,829 | |
| | - | | | | - | | | | 2,152,531 | | | | 8,652,209 | |
| | 33,054 | | | | 23,571 | | | | 73,084 | | | | 66,369 | |
| | | | | | | | | | | | | | |
| | 100,097 | | | | 113,510 | | | | 139,848 | | | | 232,247 | |
| | - | | | | - | | | | - | | | | - | |
| | 7,077 | | | | 918 | | | | 14,178 | | | | 17,838 | |
| | 40,556 | | | | 42,431 | | | | 51,085 | | | | 58,006 | |
| | | | | | | | | | | | | | |
| | 941,407 | | | | 1,802,752 | | | | 2,432,295 | | | | 11,005,477 | |
| | | | | | | | | | | | | | |
| $ | 182,489,156 | | | $ | 207,272,050 | | | $ | 215,930,772 | | | $ | 359,885,105 | |
| | | | | | | | | | | | | | |
| | | | | | | | | | | | | | |
| $ | 159,667,572 | | | $ | 169,383,566 | | | $ | 189,869,127 | | | $ | 257,768,470 | |
| | 3,932,978 | | | | 956,083 | | | | 2,969,495 | | | | (580,116 | ) |
| | (5,451,504 | ) | | | 12,142,570 | | | | (13,839,942 | ) | | | 24,358,266 | |
| | 24,340,110 | | | | 24,789,831 | | | | 36,932,092 | | | | 78,338,485 | |
| | | | | | | | | | | | | | |
| $ | 182,489,156 | | | $ | 207,272,050 | | | $ | 215,930,772 | | | $ | 359,885,105 | |
| | | | | | | | | | | | | | |
| | | | | | | | | | | | | | |
| $ | 151,491,363 | | | $ | 177,146,395 | | | $ | 168,703,564 | | | $ | 283,048,601 | |
| $ | 7,087,150 | | | $ | 4,808,134 | | | $ | 9,895,096 | | | $ | 7,779,361 | |
| $ | - | | | $ | - | | | $ | 2,106,320 | | | $ | 8,393,292 | |
127
MML Series Investment Fund – Financial Statements (Continued)
Statements of Assets and Liabilities
December 31, 2012
| | | | | | | | |
| | | MML
Global Fund | | | MML
Growth &
Income Fund | |
| Initial Class shares: | | | | | | | | |
Net assets | | $ | - | | | $ | 116,115,224 | |
| | | | | | | | |
Shares outstanding (a) | | | - | | | | 12,569,318 | |
| | | | | | | | |
Net asset value, offering price and redemption price per share | | $ | - | | | $ | 9.24 | |
| | | | | | | | |
| Class I shares: | | | | | | | | |
Net assets | | $ | 131,664,675 | | | $ | - | |
| | | | | | | | |
Shares outstanding (a) | | | 13,407,045 | | | | - | |
| | | | | | | | |
Net asset value, offering price and redemption price per share | | $ | 9.82 | | | $ | - | |
| | | | | | | | |
| Class II shares: | | | | | | | | |
Net assets | | $ | 16,323,949 | | | $ | - | |
| | | | | | | | |
Shares outstanding (a) | | | 1,638,679 | | | | - | |
| | | | | | | | |
Net asset value, offering price and redemption price per share | | $ | 9.96 | | | $ | - | |
| | | | | | | | |
| Service Class shares: | | | | | | | | |
Net assets | | $ | - | | | $ | 12,384,926 | |
| | | | | | | | |
Shares outstanding (a) | | | - | | | | 1,346,747 | |
| | | | | | | | |
Net asset value, offering price and redemption price per share | | $ | - | | | $ | 9.20 | |
| | | | | | | | |
| Service Class I shares: | | | | | | | | |
Net assets | | $ | 3,706,571 | | | $ | - | |
| | | | | | | | |
Shares outstanding (a) | | | 378,807 | | | | - | |
| | | | | | | | |
Net asset value, offering price and redemption price per share | | $ | 9.78 | | | $ | - | |
| | | | | | | | |
| (a) | Authorized unlimited number of shares with no par value. |
The accompanying notes are an integral part of the financial statements.
128
| | | | | | | | | | | | | | |
MML
Income &
Growth Fund | | | MML
Large Cap
Growth Fund | | | MML
Large Cap
Value Fund | | | MML
Mid Cap
Growth Fund | |
| | | | | | | | | | | | | | |
| $ | 171,207,040 | | | $ | 205,832,684 | | | $ | 193,270,857 | | | $ | 330,731,070 | |
| | | | | | | | | | | | | | |
| | 18,060,084 | | | | 17,713,356 | | | | 15,664,924 | | | | 25,523,663 | |
| | | | | | | | | | | | | | |
| $ | 9.48 | | | $ | 11.62 | | | $ | 12.34 | | | $ | 12.96 | |
| | | | | | | | | | | | | | |
| | | | | | | | | | | | | | |
| $ | - | | | $ | - | | | $ | - | | | $ | - | |
| | | | | | | | | | | | | | |
| | - | | | | - | | | | - | | | | - | |
| | | | | | | | | | | | | | |
| $ | - | | | $ | - | | | $ | - | | | $ | - | |
| | | | | | | | | | | | | | |
| | | | | | | | | | | | | | |
| $ | - | | | $ | - | | | $ | - | | | $ | - | |
| | | | | | | | | | | | | | |
| | - | | | | - | | | | - | | | | - | |
| | | | | | | | | | | | | | |
| $ | - | | | $ | - | | | $ | - | | | $ | - | |
| | | | | | | | | | | | | | |
| | | | | | | | | | | | | | |
| $ | 11,282,116 | | | $ | 1,439,366 | | | $ | 22,659,915 | | | $ | 29,154,035 | |
| | | | | | | | | | | | | | |
| | 1,198,127 | | | | 124,828 | | | | 1,846,174 | | | | 2,275,383 | |
| | | | | | | | | | | | | | |
| $ | 9.42 | | | $ | 11.53 | | | $ | 12.27 | | | $ | 12.81 | |
| | | | | | | | | | | | | | |
| | | | | | | | | | | | | | |
| $ | - | | | $ | - | | | $ | - | | | $ | - | |
| | | | | | | | | | | | | | |
| | - | | | | - | | | | - | | | | - | |
| | | | | | | | | | | | | | |
| $ | - | | | $ | - | | | $ | - | | | $ | - | |
| | | | | | | | | | | | | | |
129
MML Series Investment Fund – Financial Statements (Continued)
Statements of Assets and Liabilities
December 31, 2012
| | | | | | | | |
| | | MML
Mid Cap
Value Fund | | | MML
PIMCO Total
Return Fund | |
| Assets: | | | | | | | | |
Investments, at value (Note 2) (a) | | $ | 448,485,088 | | | $ | 407,489,132 | |
Short-term investments, at value (Note 2) (b) | | | 5,984,258 | | | | 7,178,402 | |
| | | | | | | | |
Total investments (c) | | | 454,469,346 | | | | 414,667,534 | |
| | | | | | | | |
Cash | | | - | | | | 2,943 | |
Foreign currency, at value (d) | | | - | | | | 120,583 | |
Receivables from: | | | | | | | | |
Investments sold | | | 4,107,103 | | | | - | |
Investments sold on a when-issued basis (Note 2) | | | - | | | | 24,530,156 | |
Collateral held for swap agreements (Note 2) | | | - | | | | 21,000 | |
Open forward foreign currency contracts (Note 2) | | | 21,066 | | | | 148,148 | |
Investment adviser (Note 3) | | | - | | | | 18,928 | |
Fund shares sold | | | 144,547 | | | | 295,184 | |
Collateral held for open futures contracts (Note 2) | | | - | | | | 81,000 | |
Variation margin on open derivative instruments (Note 2) | | | - | | | | 136,083 | |
Interest and dividends | | | 670,534 | | | | 1,840,129 | |
Open swap agreements, at value (Note 2) | | | - | | | | 321,900 | |
| | | | | | | | |
Total assets | | | 459,412,596 | | | | 442,183,588 | |
| | | | | | | | |
| Liabilities: | | | | | | | | |
Payables for: | | | | | | | | |
Investments purchased | | | 2,557,062 | | | | - | |
Written options outstanding, at value (Note 2) (e) | | | - | | | | 1,044 | |
Open forward foreign currency contracts (Note 2) | | | 6,386 | | | | 708,669 | |
Fund shares repurchased | | | 2,396,240 | | | | 76,307 | |
Interest and dividends | | | - | | | | 5,601 | |
Investments purchased on a when-issued basis (Note 2) | | | - | | | | 128,191,367 | |
Variation margin on open derivative instruments (Note 2) | | | - | | | | 9,363 | |
Securities on loan | | | - | | | | - | |
Open swap agreements, at value (Note 2) | | | - | | | | 23,785 | |
Trustees’ fees and expenses (Note 3) | | | 86,498 | | | | 17,797 | |
Collateral pledged for open swap agreements (Note 2) | | | - | | | | 390,000 | |
Affiliates (Note 3): | | | | | | | | |
Investment management fees | | | 322,010 | | | | 131,445 | |
Administration fees | | | - | | | | 26,289 | |
Service fees | | | 10,074 | | | | 2,483 | |
Accrued expense and other liabilities | | | 67,919 | | | | 123,548 | |
| | | | | | | | |
Total liabilities | | | 5,446,189 | | | | 129,707,698 | |
| | | | | | | | |
Net assets | | $ | 453,966,407 | | | $ | 312,475,890 | |
| | | | | | | | |
| Net assets consist of: | | | | | | | | |
Paid-in capital | | $ | 405,492,940 | | | $ | 292,272,012 | |
Undistributed (accumulated) net investment income (loss) | | | 8,825,991 | | | | 7,798,109 | |
Accumulated net realized gain (loss) on investments and foreign currency transactions | | | 11,137,996 | | | | 2,687,677 | |
Net unrealized appreciation (depreciation) on investments and foreign currency translations | | | 28,509,480 | | | | 9,718,092 | |
| | | | | | | | |
Net assets | | $ | 453,966,407 | | | $ | 312,475,890 | |
| | | | | | | | |
| | | | | | | | |
(a) Cost of investments: | | $ | 419,990,015 | | | $ | 397,733,530 | |
(b) Cost of short-term investments: | | $ | 5,984,258 | | | $ | 7,178,402 | |
(c) Securities on loan with market value of: | | $ | - | | | $ | - | |
(d) Cost of foreign currency: | | $ | - | | | $ | 120,681 | |
(e) Premiums on written options: | | $ | - | | | $ | 44,133 | |
The accompanying notes are an integral part of the financial statements.
130
| | | | | | | | | | |
MML
Small Cap
Growth
Equity Fund | | | MML
Small
Company
Value Fund | | | MML
Small/Mid
Cap Value
Fund | |
| | | | | | | | | | |
| $ | 281,083,268 | | | $ | 119,961,090 | | | $ | 180,904,911 | |
| | 5,076,574 | | | | 3,371,980 | | | | 1,092,573 | |
| | | | | | | | | | |
| | 286,159,842 | | | | 123,333,070 | | | | 181,997,484 | |
| | | | | | | | | | |
| | - | | | | - | | | | - | |
| | - | | | | - | | | | - | |
| | | | | | | | | | |
| | 1,343,021 | | | | 75,805 | | | | 219,112 | |
| | - | | | | - | | | | - | |
| | - | | | | - | | | | - | |
| | - | | | | - | | | | - | |
| | 7,593 | | | | 600 | | | | - | |
| | 2,677,137 | | | | 67,598 | | | | 2,962 | |
| | - | | | | - | | | | - | |
| | - | | | | - | | | | - | |
| | 106,065 | | | | 71,651 | | | | 233,698 | |
| | - | | | | - | | | | - | |
| | | | | | | | | | |
| | 290,293,658 | | | | 123,548,724 | | | | 182,453,256 | |
| | | | | | | | | | |
| | | | | | | | | | |
| | | | | | | | | | |
| | 1,930,470 | | | | 507,317 | | | | 610,578 | |
| | - | | | | - | | | | - | |
| | - | | | | - | | | | - | |
| | 61,187 | | | | 67,475 | | | | 4,674,789 | |
| | - | | | | - | | | | - | |
| | - | | | | - | | | | - | |
| | - | | | | - | | | | - | |
| | 25,143,114 | | | | 2,183,668 | | | | - | |
| | - | | | | - | | | | - | |
| | 68,746 | | | | 12,526 | | | | 42,746 | |
| | - | | | | - | | | | - | |
| | | | | | | | | | |
| | 232,036 | | | | 84,653 | | | | 114,139 | |
| | - | | | | 24,898 | | | | - | |
| | 3,596 | | | | 3,886 | | | | 5,529 | |
| | 56,491 | | | | 36,414 | | | | 40,682 | |
| | | | | | | | | | |
| | 27,495,640 | | | | 2,920,837 | | | | 5,488,463 | |
| | | | | | | | | | |
| $ | 262,798,018 | | | $ | 120,627,887 | | | $ | 176,964,793 | |
| | | | | | | | | | |
| | | | | | | | | | |
| $ | 217,951,820 | | | $ | 81,697,998 | | | $ | 185,312,568 | |
| | (67,357 | ) | | | 996,396 | | | | 1,234,360 | |
| | 14,516,058 | | | | 3,336,843 | | | | (24,782,044 | ) |
| | 30,397,497 | | | | 34,596,650 | | | | 15,199,909 | |
| | | | | | | | | | |
| $ | 262,798,018 | | | $ | 120,627,887 | | | $ | 176,964,793 | |
| | | | | | | | | | |
| | | | | | | | | | |
| $ | 250,685,799 | | | $ | 85,364,440 | | | $ | 165,705,002 | |
| $ | 5,076,574 | | | $ | 3,371,980 | | | $ | 1,092,573 | |
| $ | 24,515,680 | | | $ | 2,092,226 | | | $ | - | |
| $ | - | | | $ | - | | | $ | - | |
| $ | - | | | $ | - | | | $ | - | |
131
MML Series Investment Fund – Financial Statements (Continued)
Statements of Assets and Liabilities
December 31, 2012
| | | | | | | | |
| | | MML
Mid Cap
Value Fund | | | MML
PIMCO Total
Return Fund | |
| Initial Class shares: | | | | | | | | |
Net assets | | $ | 437,725,029 | | | $ | - | |
| | | | | | | | |
Shares outstanding (a) | | | 39,392,971 | | | | - | |
| | | | | | | | |
Net asset value, offering price and redemption price per share | | $ | 11.11 | | | $ | - | |
| | | | | | | | |
| Class II shares: | | | | | | | | |
Net assets | | $ | - | | | $ | 306,746,184 | |
| | | | | | | | |
Shares outstanding (a) | | | - | | | | 28,347,893 | |
| | | | | | | | |
Net asset value, offering price and redemption price per share | | $ | - | | | $ | 10.82 | |
| | | | | | | | |
| Service Class shares: | | | | | | | | |
Net assets | | $ | 16,241,378 | | | $ | - | |
| | | | | | | | |
Shares outstanding (a) | | | 1,470,903 | | | | - | |
| | | | | | | | |
Net asset value, offering price and redemption price per share | | $ | 11.04 | | | $ | - | |
| | | | | | | | |
| Service Class I shares: | | | | | | | | |
Net assets | | $ | - | | | $ | 5,729,706 | |
| | | | | | | | |
Shares outstanding (a) | | | - | | | | 531,108 | |
| | | | | | | | |
Net asset value offering price and redemption price per share | | $ | - | | | $ | 10.79 | |
| | | | | | | | |
| (a) | Authorized unlimited number of shares with no par value. |
The accompanying notes are an integral part of the financial statements.
132
| | | | | | | | | | |
MML
Small Cap
Growth
Equity Fund | | | MML
Small
Company
Value Fund | | | MML
Small/Mid
Cap Value
Fund | |
| | | | | | | | | | |
| $ | 256,961,078 | | | $ | - | | | $ | 168,247,598 | |
| | | | | | | | | | |
| | 15,763,626 | | | | - | | | | 16,718,345 | |
| | | | | | | | | | |
| $ | 16.30 | | | $ | - | | | $ | 10.06 | |
| | | | | | | | | | |
| | | | | | | | | | |
| $ | - | | | $ | 114,273,596 | | | $ | - | |
| | | | | | | | | | |
| | - | | | | 6,058,383 | | | | - | |
| | | | | | | | | | |
| $ | - | | | $ | 18.86 | | | $ | - | |
| | | | | | | | | | |
| | | | | | | | | | |
| $ | 5,836,940 | | | $ | - | | | $ | 8,717,195 | |
| | | | | | | | | | |
| | 362,669 | | | | - | | | | 870,476 | |
| | | | | | | | | | |
| $ | 16.09 | | | $ | - | | | $ | 10.01 | |
| | | | | | | | | | |
| | | | | | | | | | |
| $ | - | | | $ | 6,354,291 | | | $ | - | |
| | | | | | | | | | |
| | - | | | | 339,868 | | | | - | |
| | | | | | | | | | |
| $ | - | | | $ | 18.70 | | | $ | - | |
| | | | | | | | | | |
133
MML Series Investment Fund – Financial Statements (Continued)
Statements of Operations
For the Year Ended December 31, 2012
| | | | | | | | |
| | | MML
Blue Chip
Growth Fund | | | MML
Equity
Income Fund | |
| Investment income (Note 2): | | | | | | | | |
Dividends (a) | | $ | 3,487,715 | | | $ | 14,764,110 | |
Interest | | | 1,682 | | | | 2,969 | |
Securities lending net income | | | - | | | | - | |
| | | | | | | | |
Total investment income | | | 3,489,397 | | | | 14,767,079 | |
| | | | | | | | |
| Expenses (Note 3): | | | | | | | | |
Investment management fees | | | 2,473,813 | | | | 3,834,784 | |
Custody fees | | | 37,836 | | | | 48,295 | |
Audit fees | | | 33,588 | | | | 33,091 | |
Legal fees | | | 3,007 | | | | 4,645 | |
Proxy fees | | | 1,108 | | | | 1,108 | |
Shareholder reporting fees | | | 48,865 | | | | 61,233 | |
Trustees’ fees | | | 25,437 | | | | 39,506 | |
| | | | | | | | |
| | | 2,623,654 | | | | 4,022,662 | |
Administration fees: | | | | | | | | |
Class I | | | - | | | | - | |
Class II | | | - | | | | - | |
Class III | | | - | | | | - | |
Service Class I | | | - | | | | - | |
Service fees: | | | | | | | | |
Service Class | | | 31,711 | | | | 88,081 | |
Service Class I | | | - | | | | - | |
| | | | | | | | |
Total expenses | | | 2,655,365 | | | | 4,110,743 | |
Expenses waived (Note 3): | | | | | | | | |
Class II fees waived by adviser | | | - | | | | - | |
Service Class I fees waived by adviser | | | - | | | | - | |
Class II administrative fees waived | | | - | | | | - | |
Class III administrative fees waived | | | - | | | | - | |
| | | | | | | | |
Net expenses | | | 2,655,365 | | | | 4,110,743 | |
| | | | | | | | |
Net investment income (loss) | | | 834,032 | | | | 10,656,336 | |
| | | | | | | | |
| Realized and unrealized gain (loss): | | | | | | | | |
Net realized gain (loss) on: | | | | | | | | |
Investment transactions | | | 36,496,996 | | | | 25,375,265 | |
Futures contracts | | | - | | | | - | |
Foreign currency transactions | | | (84 | ) | | | (966 | ) |
| | | | | | | | |
Net realized gain (loss) | | | 36,496,912 | | | | 25,374,299 | |
| | | | | | | | |
Net change in unrealized appreciation (depreciation) on: | | | | | | | | |
Investment transactions | | | 20,423,236 | | | | 48,740,392 | |
Futures contracts | | | - | | | | - | |
Translation of assets and liabilities in foreign currencies | | | 210 | | | | 2,354 | |
| | | | | | | | |
Net change in unrealized appreciation (depreciation) | | | 20,423,446 | | | | 48,742,746 | |
| | | | | | | | |
Net realized gain (loss) and change in unrealized appreciation (depreciation) | | | 56,920,358 | | | | 74,117,045 | |
| | | | | | | | |
Net increase (decrease) in net assets resulting from operations | | $ | 57,754,390 | | | $ | 84,773,381 | |
| | | | | | | | |
| | | | | | | | |
(a) Net of withholding tax of: | | $ | 211 | | | $ | 108,783 | |
| * | Service Class I shares commenced operations on May 1, 2012. |
The accompanying notes are an integral part of the financial statements.
134
| | | | | | | | | | | | | | | | | | |
MML
Equity
Index Fund | | | MML
Focused
Equity Fund | | | MML
Foreign
Fund | | | MML
Fundamental
Growth Fund | | | MML
Fundamental
Value Fund | |
| | | | | | | | | | | | | | | | | | |
| $ | 7,149,720 | | | $ | 2,089,105 | | | $ | 11,257,376 | | | $ | 2,845,758 | | | $ | 4,877,130 | |
| | 731 | | | | 819 | | | | 1,720 | | | | 444 | | | | 382 | |
| | - | | | | - | | | | 61,129 | | | | - | | | | - | |
| | | | | | | | | | | | | | | | | | |
| | 7,150,451 | | | | 2,089,924 | | | | 11,320,225 | | | | 2,846,202 | | | | 4,877,512 | |
| | | | | | | | | | | | | | | | | | |
| | | | | | | | | | | | | | | | | | |
| | 312,697 | | | | 943,655 | | | | 3,011,499 | | | | 1,217,343 | | | | 1,140,380 | |
| | 37,809 | | | | 9,597 | | | | 151,795 | | | | 52,674 | | | | 17,830 | |
| | 33,581 | | | | 33,365 | | | | 36,533 | | | | 33,369 | | | | 32,910 | |
| | 2,877 | | | | 836 | | | | 3,033 | | | | 1,109 | | | | 1,549 | |
| | 1,109 | | | | 1,108 | | | | 1,109 | | | | 1,109 | | | | 1,109 | |
| | 47,766 | | | | 11,089 | | | | 45,338 | | | | 14,504 | | | | 17,594 | |
| | 24,097 | | | | 8,945 | | | | 25,665 | | | | 12,467 | | | | 13,371 | |
| | | | | | | | | | | | | | | | | | |
| | 459,936 | | | | 1,008,595 | | | | 3,274,972 | | | | 1,332,575 | | | | 1,224,743 | |
| | | | | | | | | | | | | | | | | | |
| | 236,444 | | | | - | | | | - | | | | - | | | | - | |
| | 207,715 | | | | 125,471 | | | | - | | | | 173,714 | | | | 175,302 | |
| | 58,234 | | | | - | | | | - | | | | - | | | | - | |
| | 24,270 | | | | 350 | * | | | - | | | | 191 | * | | | 140 | * |
| | | | | | | | | | | | | | | | | | |
| | - | | | | - | | | | 15,838 | | | | - | | | | - | |
| | 20,225 | | | | 874 | * | | | - | | | | 477 | * | | | 349 | * |
| | | | | | | | | | | | | | | | | | |
| | 1,006,824 | | | | 1,135,290 | | | | 3,290,810 | | | | 1,506,957 | | | | 1,400,534 | |
| | | | | | | | | | | | | | | | | | |
| | - | | | | (2,042 | ) | | | - | | | | (28,242 | ) | | | - | |
| | - | | | | - | | | | - | | | | (36 | )* | | | - | |
| | (54,662 | ) | | | - | | | | - | | | | - | | | | - | |
| | (58,234 | ) | | | - | | | | - | | | | - | | | | - | |
| | | | | | | | | | | | | | | | | | |
| | 893,928 | | | | 1,133,248 | | | | 3,290,810 | | | | 1,478,679 | | | | 1,400,534 | |
| | | | | | | | | | | | | | | | | | |
| | 6,256,523 | | | | 956,676 | | | | 8,029,415 | | | | 1,367,523 | | | | 3,476,978 | |
| | | | | | | | | | | | | | | | | | |
| | | | | | | | | | | | | | | | | | |
| | | | | | | | | | | | | | | | | | |
| | 4,904,889 | | | | 8,001,798 | | | | (5,827,300 | ) | | | 3,728,961 | | | | 7,032,908 | |
| | 551,948 | | | | - | | | | - | | | | - | | | | - | |
| | - | | | | - | | | | (161,511 | ) | | | 170 | | | | (1,531 | ) |
| | | | | | | | | | | | | | | | | | |
| | 5,456,837 | | | | 8,001,798 | | | | (5,988,811 | ) | | | 3,729,131 | | | | 7,031,377 | |
| | | | | | | | | | | | | | | | | | |
| | | | | | | | | | | | | | | | | | |
| | 33,528,020 | | | | 14,202,537 | | | | 57,549,333 | | | | 14,493,531 | | | | 16,600,633 | |
| | (34,346 | ) | | | - | | | | - | | | | - | | | | - | |
| | - | | | | - | | | | 22,742 | | | | (109 | ) | | | - | |
| | | | | | | | | | | | | | | | | | |
| | 33,493,674 | | | | 14,202,537 | | | | 57,572,075 | | | | 14,493,422 | | | | 16,600,633 | |
| | | | | | | | | | | | | | | | | | |
| | 38,950,511 | | | | 22,204,335 | | | | 51,583,264 | | | | 18,222,553 | | | | 23,632,010 | |
| | | | | | | | | | | | | | | | | | |
| $ | 45,207,034 | | | $ | 23,161,011 | | | $ | 59,612,679 | | | $ | 19,590,076 | | | $ | 27,108,988 | |
| | | | | | | | | | | | | | | | | | |
| | | | | | | | | | | | | | | | | | |
| $ | 3,895 | | | $ | - | | | $ | 1,040,052 | | | $ | 1,581 | | | $ | 27,714 | |
135
MML Series Investment Fund – Financial Statements (Continued)
Statements of Operations
For the Year Ended December 31, 2012
| | | | | | | | |
| | | MML
Global
Fund | | | MML
Growth &
Income Fund | |
| Investment income (Note 2): | | | | | | | | |
Dividends (a) | | $ | 2,977,373 | | | $ | 2,654,201 | |
Interest | | | 218 | | | | 70 | |
Securities lending net income | | | 8,787 | | | | - | |
| | | | | | | | |
Total investment income | | | 2,986,378 | | | | 2,654,271 | |
| | | | | | | | |
| Expenses (Note 3): | | | | | | | | |
Investment management fees | | | 802,182 | | | | 653,058 | |
Custody fees | | | 60,064 | | | | 25,058 | |
Audit fees | | | 36,420 | | | | 32,879 | |
Legal fees | | | 1,297 | | | | 1,356 | |
Proxy fees | | | 1,109 | | | | 1,109 | |
Shareholder reporting fees | | | 28,837 | | | | 27,716 | |
Trustees’ fees | | | 10,023 | | | | 10,183 | |
| | | | | | | | |
| | | 939,932 | | | | 751,359 | |
Administration fees: | | | | | | | | |
Class I | | | 321,496 | | | | - | |
Class II | | | 28,567 | | | | - | |
Service Class I | | | 8,419 | | | | - | |
Service fees: | | | | | | | | |
Service Class | | | - | | | | 28,520 | |
Service Class I | | | 7,517 | | | | - | |
| | | | | | | | |
Total expenses | | | 1,305,931 | | | | 779,879 | |
Expenses waived (Note 3): | | | | | | | | |
Class I fees waived by adviser | | | (95,306 | ) | | | - | |
Class II fees waived by adviser | | | (13,215 | ) | | | - | |
Service Class I fees waived by adviser | | | (2,490 | ) | | | - | |
| | | | | | | | |
Net expenses | | | 1,194,920 | | | | 779,879 | |
| | | | | | | | |
Net investment income (loss) | | | 1,791,458 | | | | 1,874,392 | |
| | | | | | | | |
| Realized and unrealized gain (loss): | | | | | | | | |
Net realized gain (loss) on: | | | | | | | | |
Investment transactions | | | 3,543,644 | | | | 9,144,962 | |
Foreign currency transactions | | | (25,353 | ) | | | (6,797 | ) |
| | | | | | | | |
Net realized gain (loss) | | | 3,518,291 | | | | 9,138,165 | |
| | | | | | | | |
Net change in unrealized appreciation (depreciation) on: | | | | | | | | |
Investment transactions | | | 22,614,983 | | | | 12,291,829 | |
Translation of assets and liabilities in foreign currencies | | | 4,796 | | | | 888 | |
| | | | | | | | |
Net change in unrealized appreciation (depreciation) | | | 22,619,779 | | | | 12,292,717 | |
| | | | | | | | |
Net realized gain (loss) and change in unrealized appreciation (depreciation) | | | 26,138,070 | | | | 21,430,882 | |
| | | | | | | | |
Net increase (decrease) in net assets resulting from operations | | $ | 27,929,528 | | | $ | 23,305,274 | |
| | | | | | | | |
| | | | | | | | |
(a) Net of withholding tax of: | | $ | 187,743 | | | $ | 41,967 | |
The accompanying notes are an integral part of the financial statements.
136
| | | | | | | | | | | | | | |
MML
Income &
Growth Fund | | | MML
Large Cap
Growth Fund | | | MML
Large Cap
Value Fund | | | MML
Mid Cap
Growth Fund | |
| | | | | | | | | | | | | | |
| $ | 5,141,890 | | | $ | 2,389,452 | | | $ | 4,884,516 | | | $ | 2,949,393 | |
| | 765 | | | | 531 | | | | 3,098 | | | | 6,915 | |
| | - | | | | - | | | | 11,978 | | | | 66,271 | |
| | | | | | | | | | | | | | |
| | 5,142,655 | | | | 2,389,983 | | | | 4,899,592 | | | | 3,022,579 | |
| | | | | | | | | | | | | | |
| | | | | | | | | | | | | | |
| | 1,038,608 | | | | 1,304,898 | | | | 1,669,112 | | | | 2,704,397 | |
| | 28,341 | | | | 23,196 | | | | 39,545 | | | | 51,120 | |
| | 33,506 | | | | 32,921 | | | | 32,925 | | | | 33,597 | |
| | 1,608 | | | | 1,970 | | | | 2,103 | | | | 3,266 | |
| | 1,109 | | | | 1,109 | | | | 1,109 | | | | 1,108 | |
| | 37,117 | | | | 34,842 | | | | 37,983 | | | | 47,381 | |
| | 11,784 | | | | 15,494 | | | | 16,805 | | | | 27,162 | |
| | | | | | | | | | | | | | |
| | 1,152,073 | | | | 1,414,430 | | | | 1,799,582 | | | | 2,868,031 | |
| | | | | | | | | | | | | | |
| | - | | | | - | | | | - | | | | - | |
| | - | | | | - | | | | - | | | | - | |
| | - | | | | - | | | | - | | | | - | |
| | | | | | | | | | | | | | |
| | 25,065 | | | | 3,420 | | | | 52,557 | | | | 65,270 | |
| | - | | | | - | | | | - | | | | - | |
| | | | | | | | | | | | | | |
| | 1,177,138 | | | | 1,417,850 | | | | 1,852,139 | | | | 2,933,301 | |
| | | | | | | | | | | | | | |
| | - | | | | - | | | | - | | | | - | |
| | - | | | | - | | | | - | | | | - | |
| | - | | | | - | | | | - | | | | - | |
| | | | | | | | | | | | | | |
| | 1,177,138 | | | | 1,417,850 | | | | 1,852,139 | | | | 2,933,301 | |
| | | | | | | | | | | | | | |
| | 3,965,517 | | | | 972,133 | | | | 3,047,453 | | | | 89,278 | |
| | | | | | | | | | | | | | |
| | | | | | | | | | | | | | |
| | | | | | | | | | | | | | |
| | 111,075 | | | | 14,730,369 | | | | 9,494,509 | | | | 25,475,926 | |
| | (8,679 | ) | | | - | | | | (6,861 | ) | | | (4,266 | ) |
| | | | | | | | | | | | | | |
| | 102,396 | | | | 14,730,369 | | | | 9,487,648 | | | | 25,471,660 | |
| | | | | | | | | | | | | | |
| | | | | | | | | | | | | | |
| | 11,731,304 | | | | 14,042,650 | | | | 14,011,391 | | | | 19,439,033 | |
| | (87 | ) | | | - | | | | 1,073 | | | | (114 | ) |
| | | | | | | | | | | | | | |
| | 11,731,217 | | | | 14,042,650 | | | | 14,012,464 | | | | 19,438,919 | |
| | | | | | | | | | | | | | |
| | 11,833,613 | | | | 28,773,019 | | | | 23,500,112 | | | | 44,910,579 | |
| | | | | | | | | | | | | | |
| $ | 15,799,130 | | | $ | 29,745,152 | | | $ | 26,547,565 | | | $ | 44,999,857 | |
| | | | | | | | | | | | | | |
| | | | | | | | | | | | | | |
| $ | 83,745 | | | $ | 5,161 | | | $ | 62,178 | | | $ | 33,163 | |
137
MML Series Investment Fund – Financial Statements (Continued)
Statements of Operations
For the Year Ended December 31, 2012
| | | | | | | | |
| | | MML
Mid Cap
Value Fund | | |
MML
PIMCO Total
Return Fund | |
| Investment income (Note 2): | | | | | | | | |
Dividends (a) | | $ | 13,221,932 | | | $ | 89,375 | |
Interest | | | 453 | | | | 6,725,377 | |
Securities lending net income | | | - | | | | - | |
| | | | | | | | |
Total investment income | | | 13,222,385 | | | | 6,814,752 | |
| | | | | | | | |
| Expenses (Note 3): | | | | | | | | |
Investment management fees | | | 3,691,135 | | | | 1,366,965 | |
Custody fees | | | 77,902 | | | | 204,360 | |
Interest expense | | | - | | | | 2,278 | |
Audit fees | | | 33,651 | | | | 88,832 | |
Legal fees | | | 3,983 | | | | 2,201 | |
Proxy fees | | | 1,109 | | | | 1,109 | |
Shareholder reporting fees | | | 55,420 | | | | 24,977 | |
Trustees’ fees | | | 33,772 | | | | 20,218 | |
| | | | | | | | |
| | | 3,896,972 | | | | 1,710,940 | |
Administration fees: | | | | | | | | |
Class II | | | - | | | | 271,907 | |
Service Class I | | | - | | | | 1,486 | * |
Service fees: | | | | | | | | |
Service Class | | | 36,408 | | | | - | |
Service Class I | | | - | | | | 3,715 | * |
| | | | | | | | |
Total expenses | | | 3,933,380 | | | | 1,988,048 | |
Expenses waived (Note 3): | | | | | | | | |
Class II fees waived by adviser | | | - | | | | (203,905 | ) |
Service Class I fees waived by adviser | | | - | | | | (1,097 | )* |
Initial Class management fees waived | | | - | | | | - | |
Service Class management fees waived | | | - | | | | - | |
| | | | | | | | |
Net expenses | | | 3,933,380 | | | | 1,783,046 | |
| | | | | | | | |
Net investment income (loss) | | | 9,289,005 | | | | 5,031,706 | |
| | | | | | | | |
| Realized and unrealized gain (loss): | | | | | | | | |
Net realized gain (loss) on: | | | | | | | | |
Investment transactions | | | 21,093,183 | | | | 6,754,640 | |
Futures contracts | | | - | | | | 1,182,784 | |
Written options | | | - | | | | 252,359 | |
Swap agreements | | | - | | | | 68,600 | |
Foreign currency transactions | | | (448,661 | ) | | | (558,490 | ) |
| | | | | | | | |
Net realized gain (loss) | | | 20,644,522 | | | | 7,699,893 | |
| | | | | | | | |
Net change in unrealized appreciation (depreciation) on: | | | | | | | | |
Investment transactions | | | 37,668,399 | | | | 10,589,967 | |
Futures contracts | | | - | | | | (466,700 | ) |
Written options | | | - | | | | (69,310 | ) |
Swap agreements | | | - | | | | 1,300,711 | |
Translation of assets and liabilities in foreign currencies | | | (40,025 | ) | | | (1,220,582 | ) |
| | | | | | | | |
Net change in unrealized appreciation (depreciation) | | | 37,628,374 | | | | 10,134,086 | |
| | | | | | | | |
Net realized gain (loss) and change in unrealized appreciation (depreciation) | | | 58,272,896 | | | | 17,833,979 | |
| | | | | | | | |
Net increase (decrease) in net assets resulting from operations | | $ | 67,561,901 | | | $ | 22,865,685 | |
| | | | | | | | |
| | | | | | | | |
(a) Net of withholding tax of: | | $ | 43,100 | | | $ | - | |
| * | Service Class I shares commenced operations on May 1, 2012. |
The accompanying notes are an integral part of the financial statements.
138
| | | | | | | | | | |
| | |
MML
Small Cap
Growth Equity
Fund | | | MML
Small Company
Value
Fund | | | MML
Small/Mid Cap
Value
Fund | |
| | | | | | | | | | |
| $ | 1,679,366 | | | $ | 2,387,733 | | | $ | 2,904,062 | |
| | 570 | | | | 220 | | | | 188 | |
| | 228,724 | | | | 39,022 | | | | - | |
| | | | | | | | | | |
| | 1,908,660 | | | | 2,426,975 | | | | 2,904,250 | |
| | | | | | | | | | |
| | | | | | | | | | |
| | 2,771,086 | | | | 935,469 | | | | 1,333,372 | |
| | 54,191 | | | | 14,946 | | | | 21,099 | |
| | - | | | | - | | | | - | |
| | 35,583 | | | | 33,470 | | | | 32,905 | |
| | 2,503 | | | | 1,089 | | | | 1,778 | |
| | 1,108 | | | | 1,109 | | | | 1,109 | |
| | 43,058 | | | | 21,555 | | | | 31,924 | |
| | 20,175 | | | | 8,420 | | | | 13,804 | |
| | | | | | | | | | |
| | 2,927,704 | | | | 1,016,058 | | | | 1,435,991 | |
| | | | | | | | | | |
| | - | | | | 261,949 | | | | - | |
| | - | | | | 13,188 | | | | - | |
| | | | | | | | | | |
| | 13,868 | | | | - | | | | 20,061 | |
| | - | | | | 13,188 | | | | - | |
| | | | | | | | | | |
| | 2,941,572 | | | | 1,304,383 | | | | 1,456,052 | |
| | | | | | | | | | |
| | - | | | | (24,346 | ) | | | - | |
| | - | | | | (1,216 | ) | | | - | |
| | (26,764 | ) | | | - | | | | - | |
| | (598 | ) | | | - | | | | - | |
| | | | | | | | | | |
| | 2,914,210 | | | | 1,278,821 | | | | 1,456,052 | |
| | | | | | | | | | |
| | (1,005,550 | ) | | | 1,148,154 | | | | 1,448,198 | |
| | | | | | | | | | |
| | | | | | | | | | |
| | | | | | | | | | |
| | 17,793,558 | | | | 3,520,786 | | | | 15,814,437 | |
| | - | | | | - | | | | - | |
| | - | | | | - | | | | - | |
| | - | | | | - | | | | - | |
| | (3,155 | ) | | | (239 | ) | | | - | |
| | | | | | | | | | |
| | 17,790,403 | | | | 3,520,547 | | | | 15,814,437 | |
| | | | | | | | | | |
| | | | | | | | | | |
| | 16,394,981 | | | | 11,458,712 | | | | 14,208,144 | |
| | - | | | | - | | | | - | |
| | - | | | | - | | | | - | |
| | - | | | | - | | | | - | |
| | (11 | ) | | | - | | | | - | |
| | | | | | | | | | |
| | 16,394,970 | | | | 11,458,712 | | | | 14,208,144 | |
| | | | | | | | | | |
| | 34,185,373 | | | | 14,979,259 | | | | 30,022,581 | |
| | | | | | | | | | |
| $ | 33,179,823 | | | $ | 16,127,413 | | | $ | 31,470,779 | |
| | | | | | | | | | |
| | | | | | | | | | |
| $ | 11,485 | | | $ | 1,660 | | | $ | - | |
139
MML Series Investment Fund – Financial Statements (Continued)
Statements of Changes in Net Assets
| | | | | | | | |
| | | MML
Blue Chip Growth Fund | |
| | | Year
Ended
December 31, 2012 | | | Year
Ended
December 31, 2011 | |
| Increase (Decrease) in Net Assets: | | | | | | | | |
| Operations: | | | | | | | | |
Net investment income (loss) | | $ | 834,032 | | | $ | 299,365 | |
Net realized gain (loss) on investment transactions | | | 36,496,912 | | | | 22,245,113 | |
Net change in unrealized appreciation (depreciation) on investments | | | 20,423,446 | | | | (16,890,138 | ) |
| | | | | | | | |
Net increase (decrease) in net assets resulting from operations | | | 57,754,390 | | | | 5,654,340 | |
| | | | | | | | |
| Distributions to shareholders (Note 2): | | | | | | | | |
From net investment income: | | | | | | | | |
Initial Class | | | (267,550 | ) | | | (128,353 | ) |
Class I | | | - | | | | - | |
Class II | | | - | | | | - | |
Class III | | | - | | | | - | |
Service Class | | | - | | | | - | |
Service Class I | | | - | | | | - | |
| | | | | | | | |
Total distributions from net investment income | | | (267,550 | ) | | | (128,353 | ) |
| | | | | | | | |
| Net fund share transactions (Note 5): | | | | | | | | |
Initial Class | | | (58,195,122 | ) | | | (17,885,991 | ) |
Class I | | | - | | | | - | |
Class II | | | - | | | | - | |
Class III | | | - | | | | - | |
Service Class | | | 3,594,383 | | | | 1,566,442 | |
Service Class I | | | - | | | | - | |
| | | | | | | | |
Increase (decrease) in net assets from fund share transactions | | | (54,600,739 | ) | | | (16,319,549 | ) |
| | | | | | | | |
Total increase (decrease) in net assets | | | 2,886,101 | | | | (10,793,562 | ) |
| Net assets | | | | | | | | |
Beginning of year | | | 333,254,335 | | | | 344,047,897 | |
| | | | | | | | |
End of year | | $ | 336,140,436 | | | $ | 333,254,335 | |
| | | | | | | | |
Undistributed (accumulated) net investment income (loss) included in net assets at end of year | | $ | 792,196 | | | $ | 268,826 | |
| | | | | | | | |
The accompanying notes are an integral part of the financial statements.
140
| | | | | | | | | | | | | | |
MML
Equity Income Fund | | | MML
Equity Index Fund | |
Year
Ended
December 31, 2012 | | | Year
Ended
December 31, 2011 | | | Year
Ended
December 31, 2012 | | | Year
Ended
December 31, 2011 | |
| | | | | | | | | | | | | | |
| | | |
| $ | 10,656,336 | | | $ | 10,637,704 | | | $ | 6,256,523 | | | $ | 5,374,487 | |
| | 25,374,299 | | | | 18,007,886 | | | | 5,456,837 | | | | 2,848,881 | |
| | 48,742,746 | | | | (29,897,581 | ) | | | 33,493,674 | | | | (2,448,810 | ) |
| | | | | | | | | | | | | | |
| | 84,773,381 | | | | (1,251,991 | ) | | | 45,207,034 | | | | 5,774,558 | |
| | | | | | | | | | | | | | |
| | | | | | | | | | | | | | |
| | | | | | | | | | | | | | |
| | (9,826,163 | ) | | | (8,870,840 | ) | | | - | | | | - | |
| | - | | | | - | | | | (1,206,610 | ) | | | (1,253,286 | ) |
| | - | | | | - | | | | (1,830,764 | ) | | | (1,863,933 | ) |
| | - | | | | - | | | | (2,157,110 | ) | | | (2,033,964 | ) |
| | (688,805 | ) | | | (442,894 | ) | | | - | | | | - | |
| | - | | | | - | | | | (130,207 | ) | | | (91,663 | ) |
| | | | | | | | | | | | | | |
| | (10,514,968 | ) | | | (9,313,734 | ) | | | (5,324,691 | ) | | | (5,242,846 | ) |
| | | | | | | | | | | | | | |
| | | | | | | | | | | | | | |
| | (103,417,605 | ) | | | (29,120,650 | ) | | | - | | | | - | |
| | - | | | | - | | | | (5,970,268 | ) | | | (6,371,600 | ) |
| | - | | | | - | | | | (10,625,114 | ) | | | (9,877,049 | ) |
| | - | | | | - | | | | (2,273,712 | ) | | | 592,354 | |
| | 3,813,619 | | | | 6,770,393 | | | | - | | | | - | |
| | - | | | | - | | | | 3,089,040 | | | | 2,982,027 | |
| | | | | | | | | | | | | | |
| | (99,603,986 | ) | | | (22,350,257 | ) | | | (15,780,054 | ) | | | (12,674,268 | ) |
| | | | | | | | | | | | | | |
| | (25,345,573 | ) | | | (32,915,982 | ) | | | 24,102,289 | | | | (12,142,556 | ) |
| | | | | | | | | | | | | | |
| | 542,839,276 | | | | 575,755,258 | | | | 293,876,649 | | | | 306,019,205 | |
| | | | | | | | | | | | | | |
| $ | 517,493,703 | | | $ | 542,839,276 | | | $ | 317,978,938 | | | $ | 293,876,649 | |
| | | | | | | | | | | | | | |
| | | | | | | | | | | | | | |
| $ | 10,573,396 | | | $ | 10,563,816 | | | $ | 6,101,047 | | | $ | 5,258,687 | |
| | | | | | | | | | | | | | |
141
MML Series Investment Fund – Financial Statements (Continued)
Statements of Changes in Net Assets
| | | | | | | | |
| | | MML
Focused Equity Fund | |
| | | Year
Ended
December 31, 2012 | | | Year
Ended
December 31, 2011+ | |
| Increase (Decrease) in Net Assets: | | | | | | | | |
| Operations: | | | | | | | | |
Net investment income (loss) | | $ | 956,676 | | | $ | 133,895 | |
Net realized gain (loss) on investment transactions | | | 8,001,798 | | | | 6,658 | |
Net change in unrealized appreciation (depreciation) on investments | | | 14,202,537 | | | | 409,511 | |
| | | | | | | | |
Net increase (decrease) in net assets resulting from operations | | | 23,161,011 | | | | 550,064 | |
| | | | | | | | |
| Distributions to shareholders (Note 2): | | | | | | | | |
From net investment income: | | | | | | | | |
Initial Class | | | - | | | | - | |
Class II | | | (960,339 | ) | | | (140,745 | ) |
Service Class | | | - | | | | - | |
Service Class I | | | (5,292 | )* | | | - | |
| | | | | | | | |
Total distributions from net investment income | | | (965,631 | ) | | | (140,745 | ) |
| | | | | | | | |
From net realized gains: | | | | | | | | |
Class II | | | (5,865,595 | ) | | | - | |
Service Class I | | | (35,195 | )* | | | - | |
| | | | | | | | |
Total distributions from net realized gains | | | (5,900,790 | ) | | | - | |
| | | | | | | | |
Tax return of capital: | | | | | | | | |
Class II | | | - | | | | (26,048 | ) |
| | | | | | | | |
Total tax return of capital | | | - | | | | (26,048 | ) |
| | | | | | | | |
| Net fund share transactions (Note 5): | | | | | | | | |
Initial Class | | | - | | | | - | |
Class II | | | 9,481,372 | | | | 110,166,793 | |
Service Class | | | - | | | | - | |
Service Class I | | | 797,061 | * | | | - | |
| | | | | | | | |
Increase (decrease) in net assets from fund share transactions | | | 10,278,433 | | | | 110,166,793 | |
| | | | | | | | |
Total increase (decrease) in net assets | | | 26,573,023 | | | | 110,550,064 | |
| Net assets | | | | | | | | |
Beginning of year | | | 110,550,064 | | | | - | |
| | | | | | | | |
End of year | | $ | 137,123,087 | | | $ | 110,550,064 | |
| | | | | | | | |
Undistributed (accumulated) net investment income (loss) included in net assets at end of year | | $ | - | | | $ | - | |
| | | | | | | | |
Distributions in excess of net investment income included in net assets at end of year | | $ | (5,059 | ) | | $ | (192 | ) |
| | | | | | | | |
| + | Fund commenced operations on December 8, 2011. |
| * | Service Class I shares commenced operations on May 1, 2012. |
The accompanying notes are an integral part of the financial statements.
142
| | | | | | | | | | | | | | |
MML
Foreign Fund | | | MML
Fundamental Growth Fund | |
Year
Ended
December 31, 2012 | | | Year
Ended
December 31, 2011 | | | Year
Ended
December 31, 2012 | | | Year
Ended
December 31, 2011+ | |
| | | | | | | | | | | | | | |
| | | |
| $ | 8,029,415 | | | $ | 8,310,826 | | | $ | 1,367,523 | | | $ | (4,709 | ) |
| | (5,988,811 | ) | | | 5,106,368 | | | | 3,729,131 | | | | - | |
| | 57,572,075 | | | | (44,417,375 | ) | | | 14,493,422 | | | | (721,559 | ) |
| | | | | | | | | | | | | | |
| | 59,612,679 | | | | (31,000,181 | ) | | | 19,590,076 | | | | (726,268 | ) |
| | | | | | | | | | | | | | |
| | | | | | | | | | | | | | |
| | | | | | | | | | | | | | |
| | (7,361,231 | ) | | | (6,113,493 | ) | | | - | | | | - | |
| | - | | | | - | | | | (1,369,882 | ) | | | - | |
| | (125,859 | ) | | | (101,845 | ) | | | - | | | | - | |
| | - | | | | - | | | | (3,776 | )* | | | - | |
| | | | | | | | | | | | | | |
| | (7,487,090 | ) | | | (6,215,338 | ) | | | (1,373,658 | ) | | | - | |
| | | | | | | | | | | | | | |
| | | | | | | | | | | | | | |
| | - | | | | - | | | | (3,762,431 | ) | | | - | |
| | - | | | | - | | | | (10,823 | )* | | | - | |
| | | | | | | | | | | | | | |
| | - | | | | - | | | | (3,773,254 | ) | | | - | |
| | | | | | | | | | | | | | |
| | | | | | | | | | | | | | |
| | - | | | | - | | | | - | | | | - | |
| | | | | | | | | | | | | | |
| | - | | | | - | | | | - | | | | - | |
| | | | | | | | | | | | | | |
| | | | | | | | | | | | | | |
| | 789,238 | | | | 1,241,464 | | | | - | | | | - | |
| | - | | | | - | | | | 16,108,437 | | | | 150,000,000 | |
| | 170,306 | | | | 466,608 | | | | - | | | | - | |
| | - | | | | - | | | | 526,786 | * | | | - | |
| | | | | | | | | | | | | | |
| | 959,544 | | | | 1,708,072 | | | | 16,635,223 | | | | 150,000,000 | |
| | | | | | | | | | | | | | |
| | 53,085,133 | | | | (35,507,447 | ) | | | 31,078,387 | | | | 149,273,732 | |
| | | | | | | | | | | | | | |
| | 308,844,192 | | | | 344,351,639 | | | | 149,273,732 | | | | - | |
| | | | | | | | | | | | | | |
| $ | 361,929,325 | | | $ | 308,844,192 | | | $ | 180,352,119 | | | $ | 149,273,732 | |
| | | | | | | | | | | | | | |
| | | | | | | | | | | | | | |
| $ | 7,698,377 | | | $ | 7,319,607 | | | $ | - | | | $ | (262 | ) |
| | | | | | | | | | | | | | |
| $ | - | | | $ | - | | | $ | (7,045 | ) | | $ | - | |
| | | | | | | | | | | | | | |
143
MML Series Investment Fund – Financial Statements (Continued)
Statements of Changes in Net Assets
| | | | | | | | |
| | | MML
Fundamental Value Fund | |
| | | Year
Ended
December 31, 2012 | | | Year
Ended
December 31, 2011 | |
| Increase (Decrease) in Net Assets: | | | | | | | | |
| Operations: | | | | | | | | |
Net investment income (loss) | | $ | 3,476,978 | | | $ | 2,505,909 | |
Net realized gain (loss) on investment transactions | | | 7,031,377 | | | | 393,489 | |
Net change in unrealized appreciation (depreciation) on investments | | | 16,600,633 | | | | (5,939,831 | ) |
| | | | | | | | |
Net increase (decrease) in net assets resulting from operations | | | 27,108,988 | | | | (3,040,433 | ) |
| | | | | | | | |
| Distributions to shareholders (Note 2): | | | | | | | | |
From net investment income: | | | | | | | | |
Initial Class | | | - | | | | - | |
Class I | | | - | | | | - | |
Class II | | | (2,486,267 | ) | | | - | |
Service Class | | | - | | | | - | |
Service Class I | | | (2,547 | )* | | | - | |
| | | | | | | | |
Total distributions from net investment income | | | (2,488,814 | ) | | | - | |
| | | | | | | | |
From net realized gains: | | | | | | | | |
Class II | | | (388,649 | ) | | | (199,927 | ) |
Service Class I | | | (376 | )* | | | - | |
| | | | | | | | |
Total distributions from net realized gains | | | (389,025 | ) | | | (199,927 | ) |
| | | | | | | | |
| Net fund share transactions (Note 5): | | | | | | | | |
Initial Class | | | - | | | | - | |
Class I | | | - | | | | - | |
Class II | | | (11,394,604 | ) | | | 49,194,831 | |
Service Class | | | - | | | | - | |
Service Class I | | | 372,397 | * | | | - | |
| | | | | | | | |
Increase (decrease) in net assets from fund share transactions | | | (11,022,207 | ) | | | 49,194,831 | |
| | | | | | | | |
Total increase (decrease) in net assets | | | 13,208,942 | | | | 45,954,471 | |
| Net assets | | | | | | | | |
Beginning of year | | | 172,645,068 | | | | 126,690,597 | |
| | | | | | | | |
End of year | | $ | 185,854,010 | | | $ | 172,645,068 | |
| | | | | | | | |
Undistributed (accumulated) net investment income (loss) included in net assets at end of year | | $ | 3,470,383 | | | $ | 2,507,709 | |
| | | | | | | | |
| * | Service Class I shares commenced operations on May 1, 2012. |
The accompanying notes are an integral part of the financial statements.
144
| | | | | | | | | | | | | | |
MML
Global Fund | | | MML
Growth & Income Fund | |
Year
Ended
December 31, 2012 | | | Year
Ended
December 31, 2011 | | | Year
Ended
December 31, 2012 | | | Year
Ended
December 31, 2011 | |
| | | | | | | | | | | | | | |
| | | |
| $ | 1,791,458 | | | $ | 1,355,915 | | | $ | 1,874,392 | | | $ | 1,722,574 | |
| | 3,518,291 | | | | 4,383,823 | | | | 9,138,165 | | | | 8,158,077 | |
| | 22,619,779 | | | | (9,820,506 | ) | | | 12,292,717 | | | | (11,729,759 | ) |
| | | | | | | | | | | | | | |
| | 27,929,528 | | | | (4,080,768 | ) | | | 23,305,274 | | | | (1,849,108 | ) |
| | | | | | | | | | | | | | |
| | | | | | | | | | | | | | |
| | | | | | | | | | | | | | |
| | - | | | | - | | | | (1,472,103 | ) | | | (1,414,550 | ) |
| | (1,205,096 | ) | | | (819,719 | ) | | | - | | | | - | |
| | (162,460 | ) | | | (167,123 | ) | | | - | | | | - | |
| | - | | | | - | | | | (121,326 | ) | | | (86,148 | ) |
| | (28,603 | ) | | | (19,559 | ) | | | - | | | | - | |
| | | | | | | | | | | | | | |
| | (1,396,159 | ) | | | (1,006,401 | ) | | | (1,593,429 | ) | | | (1,500,698 | ) |
| | | | | | | | | | | | | | |
| | | | | | | | | | | | | | |
| | - | | | | - | | | | - | | | | - | |
| | - | | | | - | | | | - | | | | - | |
| | | | | | | | | | | | | | |
| | - | | | | - | | | | - | | | | - | |
| | | | | | | | | | | | | | |
| | | | | | | | | | | | | | |
| | - | | | | - | | | | (20,633,999 | ) | | | (23,487,335 | ) |
| | 16,380,797 | | | | 13,002,862 | | | | - | | | | - | |
| | (2,127,712 | ) | | | (3,069,471 | ) | | | - | | | | - | |
| | - | | | | - | | | | 464,394 | | | | (3,055,537 | ) |
| | 765,793 | | | | 1,016,682 | | | | - | | | | - | |
| | | | | | | | | | | | | | |
| | 15,018,878 | | | | 10,950,073 | | | | (20,169,605 | ) | | | (26,542,872 | ) |
| | | | | | | | | | | | | | |
| | 41,552,247 | | | | 5,862,904 | | | | 1,542,240 | | | | (29,892,678 | ) |
| | | | | | | | | | | | | | |
| | 110,142,948 | | | | 104,280,044 | | | | 126,957,910 | | | | 156,850,588 | |
| | | | | | | | | | | | | | |
| $ | 151,695,195 | | | $ | 110,142,948 | | | $ | 128,500,150 | | | $ | 126,957,910 | |
| | | | | | | | | | | | | | |
| | | |
| $ | 1,670,455 | | | $ | 1,309,460 | | | $ | 1,827,397 | | | $ | 1,668,572 | |
| | | | | | | | | | | | | | |
145
MML Series Investment Fund – Financial Statements (Continued)
Statements of Changes in Net Assets
| | | | | | | | |
| | | MML
Income & Growth Fund | |
| | | Year
Ended
December 31, 2012 | | | Year
Ended
December 31, 2011 | |
| Increase (Decrease) in Net Assets: | | | | | | | | |
| Operations: | | | | | | | | |
Net investment income (loss) | | $ | 3,965,517 | | | $ | 1,882,070 | |
Net realized gain (loss) on investment transactions | | | 102,396 | | | | 1,309,290 | |
Net change in unrealized appreciation (depreciation) on investments | | | 11,731,217 | | | | 1,983,443 | |
| | | | | | | | |
Net increase (decrease) in net assets resulting from operations | | | 15,799,130 | | | | 5,174,803 | |
| | | | | | | | |
| Distributions to shareholders (Note 2): | | | | | | | | |
From net investment income: | | | | | | | | |
Initial Class | | | (1,768,900 | ) | | | (2,052,810 | ) |
Service Class | | | (97,325 | ) | | | (222,620 | ) |
| | | | | | | | |
Total distributions from net investment income | | | (1,866,225 | ) | | | (2,275,430 | ) |
| | | | | | | | |
| Net fund share transactions (Note 5): | | | | | | | | |
Initial Class | | | 69,781,179 | | | | 12,823,710 | |
Service Class | | | 1,844,319 | | | | 4,465,650 | |
| | | | | | | | |
Increase (decrease) in net assets from fund share transactions | | | 71,625,498 | | | | 17,289,360 | |
| | | | | | | | |
Total increase (decrease) in net assets | | | 85,558,403 | | | | 20,188,733 | |
| Net assets | | | | | | | | |
Beginning of year | | | 96,930,753 | | | | 76,742,020 | |
| | | | | | | | |
End of year | | $ | 182,489,156 | | | $ | 96,930,753 | |
| | | | | | | | |
Undistributed (accumulated) net investment income (loss) included in net assets at end of year | | $ | 3,932,978 | | | $ | 1,858,483 | |
| | | | | | | | |
The accompanying notes are an integral part of the financial statements.
146
| | | | | | | | | | | | | | |
MML
Large Cap Growth Fund | | | MML
Large Cap Value Fund | |
Year
Ended
December 31, 2012 | | | Year
Ended
December 31, 2011 | | | Year
Ended
December 31, 2012 | | | Year
Ended
December 31, 2011 | |
| | | | | | | | | | | | | | |
| | | |
| $ | 972,133 | | | $ | 139,334 | | | $ | 3,047,453 | | | $ | 1,963,252 | |
| | 14,730,369 | | | | 8,315,080 | | | | 9,487,648 | | | | 9,540,328 | |
| | 14,042,650 | | | | (13,994,868 | ) | | | 14,012,464 | | | | (20,073,503 | ) |
| | | | | | | | | | | | | | |
| | 29,745,152 | | | | (5,540,454 | ) | | | 26,547,565 | | | | (8,569,923 | ) |
| | | | | | | | | | | | | | |
| | | | | | | | | | | | | | |
| | | | | | | | | | | | | | |
| | (123,758 | ) | | | (376,875 | ) | | | (1,366,218 | ) | | | (1,833,087 | ) |
| | - | | | | (1,629 | ) | | | (108,476 | ) | | | (127,051 | ) |
| | | | | | | | | | | | | | |
| | (123,758 | ) | | | (378,504 | ) | | | (1,474,694 | ) | | | (1,960,138 | ) |
| | | | | | | | | | | | | | |
| | | | | | | | | | | | | | |
| | (11,834,704 | ) | | | 27,536,931 | | | | (22,866,497 | ) | | | (15,543,400 | ) |
| | 73,966 | | | | 477,753 | | | | 1,813,499 | | | | 2,798,661 | |
| | | | | | | | | | | | | | |
| | (11,760,738 | ) | | | 28,014,684 | | | | (21,052,998 | ) | | | (12,744,739 | ) |
| | | | | | | | | | | | | | |
| | 17,860,656 | | | | 22,095,726 | | | | 4,019,873 | | | | (23,274,800 | ) |
| | | | | | | | | | | | | | |
| | 189,411,394 | | | | 167,315,668 | | | | 211,910,899 | | | | 235,185,699 | |
| | | | | | | | | | | | | | |
| $ | 207,272,050 | | | $ | 189,411,394 | | | $ | 215,930,772 | | | $ | 211,910,899 | |
| | | | | | | | | | | | | | |
| | | |
| $ | 956,083 | | | $ | 128,047 | | | $ | 2,969,495 | | | $ | 1,318,459 | |
| | | | | | | | | | | | | | |
147
MML Series Investment Fund – Financial Statements (Continued)
Statements of Changes in Net Assets
| | | | | | | | |
| | | MML
Mid Cap Growth Fund | |
| | | Year
Ended
December 31, 2012 | | | Year
Ended
December 31, 2011 | |
| Increase (Decrease) in Net Assets: | | | | | | | | |
| Operations: | | | | | | | | |
Net investment income (loss) | | $ | 89,278 | | | $ | (1,172,114 | ) |
Net realized gain (loss) on investment transactions | | | 25,471,660 | | | | 34,190,967 | |
Net change in unrealized appreciation (depreciation) on investments | | | 19,438,919 | | | | (36,507,970 | ) |
| | | | | | | | |
Net increase (decrease) in net assets resulting from operations | | | 44,999,857 | | | | (3,489,117 | ) |
| | | | | | | | |
| Distributions to shareholders (Note 2): | | | | | | | | |
From net investment income: | | | | | | | | |
Initial Class | | | - | | | | - | |
Class II | | | - | | | | - | |
Service Class | | | - | | | | - | |
Service Class I | | | - | | | | - | |
| | | | | | | | |
Total distributions from net investment income | | | - | | | | - | |
| | | | | | | | |
From net realized gains: | | | | | | | | |
Initial Class | | | (18,818,251 | ) | | | - | |
Service Class | | | (1,530,879 | ) | | | - | |
| | | | | | | | |
Total distributions from net realized gains | | | (20,349,130 | ) | | | - | |
| | | | | | | | |
| Net fund share transactions (Note 5): | | | | | | | | |
Initial Class | | | 1,985,117 | | | | (21,917,717 | ) |
Class II | | | - | | | | - | |
Service Class | | | 4,696,652 | | | | 6,012,491 | |
Service Class I | | | - | | | | - | |
| | | | | | | | |
Increase (decrease) in net assets from fund share transactions | | | 6,681,769 | | | | (15,905,226 | ) |
| | | | | | | | |
Total increase (decrease) in net assets | | | 31,332,496 | | | | (19,394,343 | ) |
| Net assets | | | | | | | | |
Beginning of year | | | 328,552,609 | | | | 347,946,952 | |
| | | | | | | | |
End of year | | $ | 359,885,105 | | | $ | 328,552,609 | |
| | | | | | | | |
Undistributed (accumulated) net investment income (loss) included in net assets at end of year | | $ | (580,116 | ) | | $ | (912,269 | ) |
| | | | | | | | |
| * | Service Class I shares commenced operations on May 1, 2012. |
The accompanying notes are an integral part of the financial statements.
148
| | | | | | | | | | | | | | |
MML
Mid Cap Value Fund | | | MML
PIMCO Total Return Fund | |
Year
Ended
December 31, 2012 | | | Year
Ended
December 31, 2011 | | | Year
Ended
December 31, 2012 | | | Year
Ended
December 31, 2011 | |
| | | | | | | | | | | | | | |
| | | |
| $ | 9,289,005 | | | $ | 6,720,964 | | | $ | 5,031,706 | | | $ | 4,451,444 | |
| | 20,644,522 | | | | 47,415,488 | | | | 7,699,893 | | | | (250,594 | ) |
| | 37,628,374 | | | | (54,879,133 | ) | | | 10,134,086 | | | | 610,807 | |
| | | | | | | | | | | | | | |
| | 67,561,901 | | | | (742,681 | ) | | | 22,865,685 | | | | 4,811,657 | |
| | | | | | | | | | | | | | |
| | | | | | | | | | | | | | |
| | | | | | | | | | | | | | |
| | (7,027,997 | ) | | | (8,190,527 | ) | | | - | | | | - | |
| | - | | | | - | | | | (5,464,323 | ) | | | (267,068 | ) |
| | (218,645 | ) | | | (223,550 | ) | | | - | | | | - | |
| | - | | | | - | | | | (35,888 | )* | | | - | |
| | | | | | | | | | | | | | |
| | (7,246,642 | ) | | | (8,414,077 | ) | | | (5,500,211 | ) | | | (267,068 | ) |
| | | | | | | | | | | | | | |
| | | | | | | | | | | | | | |
| | (20,340,161 | ) | | | - | | | | - | | | | - | |
| | (714,121 | ) | | | - | | | | - | | | | - | |
| | | | | | | | | | | | | | |
| | (21,054,282 | ) | | | - | | | | - | | | | - | |
| | | | | | | | | | | | | | |
| | | | | | | | | | | | | | |
| | (7,894,796 | ) | | | (3,398,141 | ) | | | - | | | | - | |
| | - | | | | - | | | | 62,767,403 | | | | 89,321,002 | |
| | 2,014,886 | | | | 3,591,638 | | | | - | | | | - | |
| | - | | | | - | | | | 5,679,679 | * | | | - | |
| | | | | | | | | | | | | | |
| | (5,879,910 | ) | | | 193,497 | | | | 68,447,082 | | | | 89,321,002 | |
| | | | | | | | | | | | | | |
| | 33,381,067 | | | | (8,963,261 | ) | | | 85,812,556 | | | | 93,865,591 | |
| | | | | | | | | | | | | | |
| | 420,585,340 | | | | 429,548,601 | | | | 226,663,334 | | | | 132,797,743 | |
| | | | | | | | | | | | | | |
| $ | 453,966,407 | | | $ | 420,585,340 | | | $ | 312,475,890 | | | $ | 226,663,334 | |
| | | | | | | | | | | | | | |
| | | |
| $ | 8,825,991 | | | $ | 7,230,169 | | | $ | 7,798,109 | | | $ | 5,790,986 | |
| | | | | | | | | | | | | | |
149
MML Series Investment Fund – Financial Statements (Continued)
Statements of Changes in Net Assets
| | | | | | | | |
| | | MML
Small Cap Growth Equity Fund | |
| | | Year
Ended
December 31, 2012 | | | Year
Ended
December 31, 2011 | |
| Increase (Decrease) in Net Assets: | | | | | | | | |
| Operations: | | | | | | | | |
Net investment income (loss) | | $ | (1,005,550 | ) | | $ | (1,762,796 | ) |
Net realized gain (loss) on investment transactions | | | 17,790,403 | | | | 27,192,243 | |
Net change in unrealized appreciation (depreciation) on investments | | | 16,394,970 | | | | (35,133,647 | ) |
| | | | | | | | |
Net increase (decrease) in net assets resulting from operations | | | 33,179,823 | | | | (9,704,200 | ) |
| | | | | | | | |
| Distributions to shareholders (Note 2): | | | | | | | | |
From net investment income: | | | | | | | | |
Initial Class | | | - | | | | - | |
Class II | | | - | | | | - | |
Service Class | | | - | | | | - | |
| | | | | | | | |
Total distributions from net investment income | | | - | | | | - | |
| | | | | | | | |
From net realized gains: | | | | | | | | |
Initial Class | | | (26,329,348 | ) | | | (9,981,321 | ) |
Class II | | | - | | | | - | |
Service Class | | | (595,062 | ) | | | (205,164 | ) |
Service Class I | | | - | | | | - | |
| | | | | | | | |
Total distributions from net realized gains | | | (26,924,410 | ) | | | (10,186,485 | ) |
| | | | | | | | |
| Net fund share transactions (Note 5): | | | | | | | | |
Initial Class | | | 494,613 | | | | 10,859,398 | |
Class II | | | - | | | | - | |
Service Class | | | 648,997 | | | | 1,157,562 | |
Service Class I | | | - | | | | - | |
| | | | | | | | |
Increase (decrease) in net assets from fund share transactions | | | 1,143,610 | | | | 12,016,960 | |
| | | | | | | | |
Total increase (decrease) in net assets | | | 7,399,023 | | | | (7,873,725 | ) |
| Net assets | | | | | | | | |
Beginning of year | | | 255,398,995 | | | | 263,272,720 | |
| | | | | | | | |
End of year | | $ | 262,798,018 | | | $ | 255,398,995 | |
| | | | | | | | |
Undistributed (accumulated) net investment income (loss) included in net assets at end of year | | $ | (67,357 | ) | | $ | (60,779 | ) |
| | | | | | | | |
The accompanying notes are an integral part of the financial statements.
150
| | | | | | | | | | | | | | |
MML
Small Company Value Fund | | | MML
Small/Mid Cap Value Fund | |
Year
Ended
December 31, 2012 | | | Year
Ended
December 31, 2011 | | | Year
Ended
December 31, 2012 | | | Year
Ended
December 31, 2011 | |
| | | | | | | | | | | | | | |
| | | |
| $ | 1,148,154 | | | $ | (68,743 | ) | | $ | 1,448,198 | | | $ | 981,885 | |
| | 3,520,547 | | | | 2,944,271 | | | | 15,814,437 | | | | 24,421,795 | |
| | 11,458,712 | | | | (4,333,813 | ) | | | 14,208,144 | | | | (37,849,828 | ) |
| | | | | | | | | | | | | | |
| | 16,127,413 | | | | (1,458,285 | ) | | | 31,470,779 | | | | (12,446,148 | ) |
| | | | | | | | | | | | | | |
| | | | | | | | | | | | | | |
| | | | | | | | | | | | | | |
| | - | | | | - | | | | (1,197,285 | ) | | | (1,037,218 | ) |
| | (12,933 | ) | | | - | | | | - | | | | - | |
| | - | | | | - | | | | (41,422 | ) | | | (30,232 | ) |
| | | | | | | | | | | | | | |
| | (12,933 | ) | | | - | | | | (1,238,707 | ) | | | (1,067,450 | ) |
| | | | | | | | | | | | | | |
| | | | | | | | | | | | | | |
| | - | | | | - | | | | - | | | | - | |
| | (2,862,451 | ) | | | (1,420,523 | ) | | | - | | | | - | |
| | - | | | | - | | | | - | | | | - | |
| | (162,411 | ) | | | (50,561 | ) | | | - | | | | - | |
| | | | | | | | | | | | | | |
| | (3,024,862 | ) | | | (1,471,084 | ) | | | - | | | | - | |
| | | | | | | | | | | | | | |
| | | | | | | | | | | | | | |
| | - | | | | - | | | | (31,578,914 | ) | | | (7,313,534 | ) |
| | (859,205 | ) | | | (394,799 | ) | | | - | | | | - | |
| | - | | | | - | | | | 319,571 | | | | 1,290,527 | |
| | 1,813,550 | | | | 1,497,284 | | | | - | | | | - | |
| | | | | | | | | | | | | | |
| | 954,345 | | | | 1,102,485 | | | | (31,259,343 | ) | | | (6,023,007 | ) |
| | | | | | | | | | | | | | |
| | 14,043,963 | | | | (1,826,884 | ) | | | (1,027,271 | ) | | | (19,536,605 | ) |
| | | | | | | | | | | | | | |
| | 106,583,924 | | | | 108,410,808 | | | | 177,992,064 | | | | 197,528,669 | |
| | | | | | | | | | | | | | |
| $ | 120,627,887 | | | $ | 106,583,924 | | | $ | 176,964,793 | | | $ | 177,992,064 | |
| | | | | | | | | | | | | | |
| | | | | | | | | | | | | | |
| $ | 996,396 | | | $ | (207,781 | ) | | $ | 1,234,360 | | | $ | 1,026,493 | |
| | | | | | | | | | | | | | |
151
MML Series Investment Fund – Financial Statements (Continued)
Financial Highlights (For a share outstanding throughout each period)
MML Blue Chip Growth Fund
| | | | | | | | | | | | | | | | | | | | | | | | | | | | | | | | | | | | | | | | | | | | | | | | |
| | | | | | Income (loss) from investment
operations | | | Less distributions to
shareholders | | | | | | | | | Ratios / Supplemental Data | |
| | | Net
asset
value,
beginning
of the
period | | | Net
investment
income
(loss)c,j | | | Net
realized
and
unrealized
gain (loss)
on
investments | | | Total
income
(loss) from
investment
operations | | | From net
investment
income | | | Total
distributions | | | Net
asset
value,
end of
the
period | | | Total
Returnm | | | Net
assets,
end of
the
period
(000’s) | | | Ratio of
expenses
to average
daily net
assets
before
expense
waivers | | | Ratio of
expenses
to average
daily net
assets
after
expense
waivers | | | Net
investment
income
(loss) to
average
daily net
assets | |
Initial Class | | | | | | | | | | | | | | | | | | | | | | | | | | | | | | | | | | | | | | | | | | | | | |
| 12/31/12 | | $ | 11.42 | | | $ | 0.03 | | | $ | 2.06 | | | $ | 2.09 | | | $ | (0.01 | ) | | $ | (0.01 | ) | | $ | 13.50 | | | | 18.31% | | | $ | 321,245 | | | | 0.80% | | | | N/A | | | | 0.26% | |
| 12/31/11 | | | 11.27 | | | | 0.01 | | | | 0.14 | | | | 0.15 | | | | (0.00 | )d | | | (0.00 | )d | | | 11.42 | | | | 1.37% | | | | 323,779 | | | | 0.80% | | | | N/A | | | | 0.09% | |
| 12/31/10 | | | 9.71 | | | | 0.01 | | | | 1.56 | | | | 1.57 | | | | (0.01 | ) | | | (0.01 | ) | | | 11.27 | | | | 16.17% | | | | 336,211 | | | | 0.80% | | | | N/A | | | | 0.06% | |
| 12/31/09 | | | 6.83 | | | | 0.01 | | | | 2.88 | | | | 2.89 | | | | (0.01 | ) | | | (0.01 | ) | | | 9.71 | | | | 42.38% | | | | 182,984 | | | | 0.83% | | | | N/A | | | | 0.12% | |
| 12/31/08 | | | 11.87 | | | | 0.02 | | | | (5.06 | ) | | | (5.04 | ) | | | - | | | | - | | | | 6.83 | | | | (42.46% | ) | | | 168,558 | | | | 0.85% | | | | 0.84% | j | | | 0.23% | |
Service Class | | | | | | | | | | | | | | | | | | | | | | | | | | | | | | | | | | | | | | | | | | | | | |
| 12/31/12 | | $ | 11.34 | | | $ | 0.01 | | | $ | 2.03 | | | $ | 2.04 | | | $ | - | | | $ | - | | | $ | 13.38 | | | | 17.99% | | | $ | 14,895 | | | | 1.05% | | | | N/A | | | | 0.06% | |
| 12/31/11 | | | 11.22 | | | | (0.02 | ) | | | 0.14 | | | | 0.12 | | | | - | | | | - | | | | 11.34 | | | | 1.07% | | | | 9,476 | | | | 1.05% | | | | N/A | | | | (0.15% | ) |
| 12/31/10 | | | 9.68 | | | | (0.02 | ) | | | 1.56 | | | | 1.54 | | | | - | | | | - | | | | 11.22 | | | | 15.91% | | | | 7,837 | | | | 1.05% | | | | N/A | | | | (0.20% | ) |
| 12/31/09 | | | 6.83 | | | | (0.01 | ) | | | 2.87 | | | | 2.86 | | | | (0.01 | ) | | | (0.01 | ) | | | 9.68 | | | | 41.93% | | | | 5,600 | | | | 1.08% | | | | N/A | | | | (0.13% | ) |
| 12/31/08g | | | 10.70 | | | | 0.00 | d | | | (3.87 | ) | | | (3.87 | ) | | | - | | | | - | | | | 6.83 | | | | (36.17% | )b | | | 1,816 | | | | 1.10% | a | | | N/A | | | | 0.17% | a |
| | | | | | | | | | | | | | | | | | | | |
| | | Year ended December 31 | |
| | | 2012 | | | 2011 | | | 2010 | | | 2009 | | | 2008 | |
Portfolio turnover rate for all share classes | | | 25 | % | | | 37 | % | | | 37 | % | | | 80 | %t | | | 33 | % |
| b | Percentage represents the results for the period and is not annualized. |
| c | Per share amount calculated on the average shares method. |
| d | Amount is less than $0.005 per share. |
| g | For the period August 15, 2008 (commencement of operations) through December 31, 2008. |
| j | Computed after giving effect to an agreement by MassMutual to waive certain fees and expenses of the Fund. |
| m | Total return does not reflect expenses that apply at the separate account level or to related insurance products. Inclusion of these charges would reduce the total return figures for all periods shown. |
| t | The portfolio turnover rate excludes merger activity. |
The accompanying notes are an integral part of the financial statements.
152
MML Series Investment Fund – Financial Statements (Continued)
Financial Highlights (For a share outstanding throughout each period)
MML Equity Income Fund
| | | | | | | | | | | | | | | | | | | | | | | | | | | | | | | | | | | | | | | | | | | | | | | | |
| | | | | | Income (loss) from investment
operations | | | Less distributions to shareholders | | | | | | | | | Ratios / Supplemental Data | |
| | | Net
asset
value,
beginning
of the
period | | | Net
investment
income
(loss)c | | | Net
realized
and
unrealized
gain (loss)
on
investments | | | Total
income
(loss) from
investment
operations | | | From net
investment
income | | | From net
realized
gains | | | Total
distributions | | | Net
asset
value,
end of
the
period | | | Total
Returnm | | | Net
assets,
end of
the
period
(000’s) | | | Ratio of
expenses
to average
daily net
assets | | | Net
investment
income
(loss) to
average
daily net
assets | |
Initial Class | | | | | | | | | | | | | | | | | | | | | | | | | | | | | | | | | | | | | | | | | |
| 12/31/12 | | $ | 9.20 | | | $ | 0.21 | | | $ | 1.37 | | | $ | 1.58 | | | $ | (0.21 | ) | | $ | - | | | $ | (0.21 | ) | | $ | 10.57 | | | | 17.32% | | | $ | 478,096 | | | | 0.79% | | | | 2.12% | |
| 12/31/11 | | | 9.44 | | | | 0.18 | | | | (0.26 | ) | | | (0.08 | ) | | | (0.16 | ) | | | - | | | | (0.16 | ) | | | 9.20 | | | | (0.79% | ) | | | 511,951 | | | | 0.79% | | | | 1.92% | |
| 12/31/10 | | | 8.35 | | | | 0.16 | | | | 1.06 | | | | 1.22 | | | | (0.13 | ) | | | - | | | | (0.13 | ) | | | 9.44 | | | | 14.95% | | | | 550,834 | | | | 0.79% | | | | 1.87% | |
| 12/31/09 | | | 6.82 | | | | 0.15 | | | | 1.56 | | | | 1.71 | | | | (0.18 | ) | | | - | | | | (0.18 | ) | | | 8.35 | | | | 25.19% | | | | 430,300 | | | | 0.81% | | | | 2.13% | |
| 12/31/08 | | | 10.77 | | | | 0.22 | | | | (4.04 | ) | | | (3.82 | ) | | | - | | | | (0.13 | ) | | | (0.13 | ) | | | 6.82 | | | | (35.80% | ) | | | 353,862 | | | | 0.80% | | | | 2.51% | |
Service Class | | | | | | | | | | | | | | | | | | | | | | | | | | | | | | | | | | | | | | | | | |
| 12/31/12 | | $ | 9.16 | | | $ | 0.19 | | | $ | 1.36 | | | $ | 1.55 | | | $ | (0.19 | ) | | $ | - | | | $ | (0.19 | ) | | $ | 10.52 | | | | 17.06% | | | $ | 39,397 | | | | 1.04% | | | | 1.88% | |
| 12/31/11 | | | 9.40 | | | | 0.16 | | | | (0.26 | ) | | | (0.10 | ) | | | (0.14 | ) | | | - | | | | (0.14 | ) | | | 9.16 | | | | (0.97% | ) | | | 30,889 | | | | 1.04% | | | | 1.69% | |
| 12/31/10 | | | 8.32 | | | | 0.14 | | | | 1.06 | | | | 1.20 | | | | (0.12 | ) | | | - | | | | (0.12 | ) | | | 9.40 | | | | 14.70% | | | | 24,921 | | | | 1.04% | | | | 1.62% | |
| 12/31/09 | | | 6.82 | | | | 0.13 | | | | 1.54 | | | | 1.67 | | | | (0.17 | ) | | | - | | | | (0.17 | ) | | | 8.32 | | | | 24.74% | | | | 16,629 | | | | 1.06% | | | | 1.77% | |
| 12/31/08g | | | 9.60 | | | | 0.09 | | | | (2.74 | ) | | | (2.65 | ) | | | - | | | | (0.13 | ) | | | (0.13 | ) | | | 6.82 | | | | (27.98% | )b | | | 6,302 | | | | 1.06% | a | | | 3.36% | a |
| | | | | | | | | | | | | | | | | | | | |
| | | Year ended December 31 | |
| | | 2012 | | | 2011 | | | 2010 | | | 2009 | | | 2008 | |
Portfolio turnover rate for all share classes | | | 15 | % | | | 22 | % | | | 16 | % | | | 31 | % | | | 32 | % |
| b | Percentage represents the results for the period and is not annualized. |
| c | Per share amount calculated on the average shares method. |
| g | For the period August 15, 2008 (commencement of operations) through December 31, 2008. |
| m | Total return does not reflect expenses that apply at the separate account level or to related insurance products. Inclusion of these charges would reduce the total return figures for all periods shown. |
The accompanying notes are an integral part of the financial statements.
153
MML Series Investment Fund – Financial Statements (Continued)
Financial Highlights (For a share outstanding throughout each period)
MML Equity Index Fund
| | | | | | | | | | | | | | | | | | | | | | | | | | | | | | | | | | | | | | | | | | | | | | | | |
| | | | | | Income (loss) from investment
operations | | | Less distributions to
shareholders | | | | | | | | | Ratios / Supplemental Data | |
| | | Net
asset
value,
beginning
of the
period | | | Net
investment
income
(loss)c,j | | | Net
realized
and
unrealized
gain (loss)
on
investments | | | Total
income
(loss) from
investment
operations | | | From net
investment
income | | | Total
distributions | | | Net
asset
value,
end of
the
period | | | Total
Returnm | | | Net
assets,
end of
the
period
(000's) | | | Ratio of
expenses
to average
daily net
assets
before
expense
waivers | | | Ratio of
expenses
to average
daily net
assets
after
expense
waivers | | | Net
investment
income
(loss) to
average
daily net
assets | |
Class I | | | | | | | | | | | | | | | | | | | | | | | | | | | | | | | | | | | | | | | | | | | | | |
| 12/31/12 | | $ | 15.73 | | | $ | 0.32 | | | $ | 2.11 | | | $ | 2.43 | | | $ | (0.27 | ) | | $ | (0.27 | ) | | $ | 17.89 | | | | 15.47% | | | $ | 79,070 | | | | 0.45% | | | | 0.45% | l | | | 1.84% | |
| 12/31/11 | | | 15.73 | | | | 0.26 | | | | 0.00 | d | | | 0.26 | | | | (0.26 | ) | | | (0.26 | ) | | | 15.73 | | | | 1.71% | | | | 74,927 | | | | 0.44% | | | | N/A | | | | 1.62% | |
| 12/31/10 | | | 13.97 | | | | 0.23 | | | | 1.76 | | | | 1.99 | | | | (0.23 | ) | | | (0.23 | ) | | | 15.73 | | | | 14.51% | | | | 81,199 | | | | 0.45% | | | | N/A | | | | 1.60% | |
| 12/31/09 | | | 11.33 | | | | 0.22 | | | | 2.72 | | | | 2.94 | | | | (0.30 | ) | | | (0.30 | ) | | | 13.97 | | | | 26.15% | | | | 74,938 | | | | 0.46% | | | | 0.45% | j | | | 1.84% | |
| 12/31/08 | | | 18.06 | | | | 0.29 | | | | (7.02 | ) | | | (6.73 | ) | | | - | | | | - | | | | 11.33 | | | | (37.26% | ) | | | 48,279 | | | | 0.45% | | | | 0.45% | k | | | 1.88% | |
Class II | | | | | | | | | | | | | | | | | | | | | | | | | | | | | | | | | | | | | | | | | | | | | |
| 12/31/12 | | $ | 15.76 | | | $ | 0.35 | | | $ | 2.12 | | | $ | 2.47 | | | $ | (0.30 | ) | | $ | (0.30 | ) | | $ | 17.93 | | | | 15.69% | | | $ | 109,646 | | | | 0.34% | | | | 0.29% | j | | | 2.00% | |
| 12/31/11 | | | 15.76 | | | | 0.28 | | | | (0.00 | )d | | | 0.28 | | | | (0.28 | ) | | | (0.28 | ) | | | 15.76 | | | | 1.84% | | | | 106,050 | | | | 0.33% | | | | 0.28% | j | | | 1.78% | |
| 12/31/10 | | | 13.98 | | | | 0.25 | | | | 1.77 | | | | 2.02 | | | | (0.24 | ) | | | (0.24 | ) | | | 15.76 | | | | 14.76% | | | | 115,521 | | | | 0.34% | | | | 0.29% | j | | | 1.76% | |
| 12/31/09 | | | 11.34 | | | | 0.24 | | | | 2.72 | | | | 2.96 | | | | (0.32 | ) | | | (0.32 | ) | | | 13.98 | | | | 26.33% | | | | 137,083 | | | | 0.35% | | | | 0.29% | j | | | 2.03% | |
| 12/31/08 | | | 18.04 | | | | 0.31 | | | | (7.01 | ) | | | (6.70 | ) | | | - | | | | - | | | | 11.34 | | | | (37.14% | ) | | | 117,274 | | | | 0.34% | | | | 0.29% | j | | | 2.01% | |
Class III | | | | | | | | | | | | | | | | | | | | | | | | | | | | | | | | | | | | | | | | | | | | | |
| 12/31/12 | | $ | 15.74 | | | $ | 0.37 | | | $ | 2.12 | | | $ | 2.49 | | | $ | (0.32 | ) | | $ | (0.32 | ) | | $ | 17.91 | | | | 15.87% | | | $ | 119,034 | | | | 0.20% | | | | 0.15% | j | | | 2.14% | |
| 12/31/11 | | | 15.75 | | | | 0.31 | | | | (0.02 | ) | | | 0.29 | | | | (0.30 | ) | | | (0.30 | ) | | | 15.74 | | | | 1.96% | | | | 106,669 | | | | 0.19% | | | | 0.14% | j | | | 1.92% | |
| 12/31/10 | | | 13.97 | | | | 0.27 | | | | 1.77 | | | | 2.04 | | | | (0.26 | ) | | | (0.26 | ) | | | 15.75 | | | | 14.93% | | | | 106,015 | | | | 0.20% | | | | 0.15% | j | | | 1.90% | |
| 12/31/09 | | | 11.33 | | | | 0.26 | | | | 2.72 | | | | 2.98 | | | | (0.34 | ) | | | (0.34 | ) | | | 13.97 | | | | 26.57% | | | | 89,566 | | | | 0.21% | | | | 0.15% | j | | | 2.17% | |
| 12/31/08 | | | 18.01 | | | | 0.34 | | | | (7.02 | ) | | | (6.68 | ) | | | - | | | | - | | | | 11.33 | | | | (37.09% | ) | | | 76,287 | | | | 0.20% | | | | 0.15% | j | | | 2.23% | |
Service Class I | | | | | | | | | | | | | | | | | | | | | | | | | | | | | | | | | | | | | | | | | | | | | |
| 12/31/12 | | $ | 15.53 | | | $ | 0.28 | | | $ | 2.08 | | | $ | 2.36 | | | $ | (0.27 | ) | | $ | (0.27 | ) | | $ | 17.62 | | | | 15.21% | | | $ | 10,229 | | | | 0.70% | | | | 0.70% | l | | | 1.63% | |
| 12/31/11 | | | 15.59 | | | | 0.22 | | | | 0.00 | d | | | 0.22 | | | | (0.28 | ) | | | (0.28 | ) | | | 15.53 | | | | 1.47% | | | | 6,231 | | | | 0.69% | | | | N/A | | | | 1.40% | |
| 12/31/10 | | | 13.88 | | | | 0.20 | | | | 1.73 | | | | 1.93 | | | | (0.22 | ) | | | (0.22 | ) | | | 15.59 | | | | 14.22% | | | | 3,284 | | | | 0.70% | | | | N/A | | | | 1.39% | |
| 12/31/09 | | | 11.32 | | | | 0.18 | | | | 2.71 | | | | 2.89 | | | | (0.33 | ) | | | (0.33 | ) | | | 13.88 | | | | 25.83% | | | | 1,171 | | | | 0.71% | | | | 0.70% | j | | | 1.53% | |
| 12/31/08g | | | 16.07 | | | | 0.10 | | | | (4.85 | ) | | | (4.75 | ) | | | - | | | | - | | | | 11.32 | | | | (29.56% | )b | | | 478 | | | | 0.72% | a | | | 0.70% | a,j | | | 2.33% | a |
| | | | | | | | | | | | | | | | | | | | |
| | | Year ended December 31 | |
| | | 2012 | | | 2011 | | | 2010 | | | 2009 | | | 2008 | |
Portfolio turnover rate for all share classes | | | 3 | % | | | 4 | % | | | 5 | % | | | 6 | % | | | 5 | % |
| b | Percentage represents the results for the period and is not annualized. |
| c | Per share amount calculated on the average shares method. |
| d | Amount is less than $0.005 per share. |
| g | For the period August 15, 2008 (commencement of operations) through December 31, 2008. |
| j | Computed after giving effect to an agreement by MassMutual to waive certain fees and expenses of the Fund. |
| k | Amount waived had no impact on the ratio of expenses to average daily net assets. |
| l | Expenses incurred during the period fell under the expense cap. |
| m | Total return does not reflect expenses that apply at the separate account level or to related insurance products. Inclusion of these charges would reduce the total return figures for all periods shown. |
The accompanying notes are an integral part of the financial statements.
154
MML Series Investment Fund – Financial Statements (Continued)
Financial Highlights (For a share outstanding throughout each period)
MML Focused Equity Fund
| | | | | | | | | | | | | | | | | | | | | | | | | | | | | | | | | | | | | | | | | | | | | | | | | | | | | | | | |
| | | | | | Income (loss) from investment
operations | | | Less distributions to shareholders | | | | | | | | | Ratios / Supplemental Data | |
| | | Net
asset
value,
beginning
of the
period | | | Net
investment
income
(loss)c,j | | | Net
realized
and
unrealized
gain (loss)
on
investments | | | Total
income
(loss) from
investment
operations | | | From net
investment
income | | | From net
realized
gain | | | Tax
return of
capital | | | Total
distributions | | | Net
asset
value,
end of
the
period | | | Total
Returnm | | | Net
assets,
end of
the
period
(000’s) | | | Ratio of
expenses
to average
daily net
assets
before
expense
waivers | | | Ratio of
expenses
to average
daily net
assets
after
expense
waivers | | | Net
investment
income
(loss) to
average
daily net
assets | |
Class II | | | | | | | | | | | | | | | | | | | | | | | | | | | | | | | | | | | | | | | | | | | | | | | | | | | | | |
| 12/31/12 | | $ | 10.03 | | | $ | 0.09 | | | $ | 1.98 | | | $ | 2.07 | | | $ | (0.09 | ) | | $ | (0.52 | ) | | $ | - | | | $ | (0.61 | ) | | $ | 11.49 | | | | 20.61% | | | $ | 136,305 | | | | 0.90% | | | | 0.90% | k | | | 0.76% | |
| 12/31/11i | | | 10.00 | | | | 0.01 | | | | 0.04 | | | | 0.05 | | | | (0.02 | ) | | | - | | | | (0.00 | )d | | | (0.02 | ) | | | 10.03 | | | | 0.46% | b | | | 110,550 | | | | 1.58% | a | | | 0.90% | a,j | | | 1.94% | a |
Service Class I | | | | | | | | | | | | | | | | | | | | | | | | | | | | | | | | | | | | | | | | | | | | | | | | | | | | | |
| 12/31/12h | | $ | 11.54 | | | $ | 0.07 | | | $ | 0.47 | | | $ | 0.54 | | | $ | (0.08 | ) | | $ | (0.52 | ) | | $ | - | | | $ | (0.60 | ) | | $ | 11.48 | | | | 4.68% | b | | $ | 818 | | | | 1.15% | a | | | 1.15% | l | | | 0.91% | a |
| | | | | | | | |
| | | Year ended December 31 | |
| | | 2012 | | | 2011 | |
Portfolio turnover rate for all share classes | | | 34 | % | | | 13 | %b |
| b | Percentage represents the results for the period and is not annualized. |
| c | Per share amount calculated on the average shares method. |
| d | Amount is less than $0.005 per share. |
| h | For the period May 1, 2012 (commencement of operations) through December 31, 2012. |
| i | For the period December 8, 2011 (commencement of operations) through December 31, 2011. |
| j | Computed after giving effect to an agreement by MassMutual to waive certain fees and expenses of the Fund. |
| k | Amount waived had no impact on the ratio of expenses to average daily net assets. |
| l | Expenses incurred for the period fell under the expense cap. |
| m | Total return does not reflect expenses that apply at the separate account level or to related insurance products. Inclusion of these charges would reduce the total return figures for all periods shown. |
The accompanying notes are an integral part of the financial statements.
155
MML Series Investment Fund – Financial Statements (Continued)
Financial Highlights (For a share outstanding throughout each period)
MML Foreign Fund
| | | | | | | | | | | | | | | | | | | | | | | | | | | | | | | | | | | | | | | | | | | | | | | | |
| | | | | | Income (loss) from investment
operations | | | Less distributions to
shareholders | | | | | | | | | Ratios / Supplemental Data | |
| | | Net
asset
value,
beginning
of the
period | | | Net
investment
income
(loss)c,j | | | Net
realized
and
unrealized
gain (loss)
on
investments | | | Total
income
(loss) from
investment
operations | | | From net
investment
income | | | Total
distributions | | | Net
asset
value,
end of
the
period | | | Total
Returnm | | | Net
assets,
end of
the
period
(000’s) | | | Ratio of
expenses
to average
daily net
assets
before
expense
waivers | | | Ratio of
expenses
to average
daily net
assets
after
expense
waivers | | | Net
investment
income
(loss) to
average
daily net
assets | |
Initial Class | | | | | | | | | | | | | | | | | | | | | | | | | | | | | | | | | | | | | |
| 12/31/12 | | $ | 8.13 | | | $ | 0.21 | | | $ | 1.32 | | | $ | 1.53 | | | $ | (0.19 | ) | | $ | (0.19 | ) | | $ | 9.47 | | | | 19.06% | | | $ | 355,174 | | | | 0.97% | | | | N/A | | | | 2.38% | |
| 12/31/11 | | | 9.21 | | | | 0.23 | | | | (1.14 | ) | | | (0.91 | ) | | | (0.17 | ) | | | (0.17 | ) | | | 8.13 | | | | (9.90% | ) | | | 303,229 | | | | 0.98% | | | | N/A | | | | 2.50% | |
| 12/31/10 | | | 8.95 | | | | 0.16 | | | | 0.24 | | | | 0.40 | | | | (0.14 | ) | | | (0.14 | ) | | | 9.21 | | | | 4.70% | | | | 338,495 | | | | 0.99% | | | | N/A | | | | 1.85% | |
| 12/31/09 | | | 7.08 | | | | 0.16 | | | | 1.90 | | | | 2.06 | | | | (0.19 | ) | | | (0.19 | ) | | | 8.95 | | | | 29.28% | | | | 288,815 | | | | 1.01% | | | | N/A | | | | 2.08% | |
| 12/31/08 | | | 12.02 | | | | 0.27 | | | | (5.21 | ) | | | (4.94 | ) | | | (0.00 | )d | | | (0.00 | )d | | | 7.08 | | | | (41.07% | ) | | | 208,709 | | | | 1.00% | | | | 0.98% | j | | | 2.74% | |
Service Class | | | | | | | | | | | | | | | | | | | | | | | | | | | | | | | | | | | | | |
| 12/31/12 | | $ | 8.10 | | | $ | 0.18 | | | $ | 1.32 | | | $ | 1.50 | | | $ | (0.17 | ) | | $ | (0.17 | ) | | $ | 9.43 | | | | 18.74% | | | $ | 6,756 | | | | 1.22% | | | | N/A | | | | 2.13% | |
| 12/31/11 | | | 9.18 | | | | 0.20 | | | | (1.12 | ) | | | (0.92 | ) | | | (0.16 | ) | | | (0.16 | ) | | | 8.10 | | | | (10.13% | ) | | | 5,615 | | | | 1.23% | | | | N/A | | | | 2.23% | |
| 12/31/10 | | | 8.92 | | | | 0.13 | | | | 0.26 | | | | 0.39 | | | | (0.13 | ) | | | (0.13 | ) | | | 9.18 | | | | 4.54% | | | | 5,857 | | | | 1.24% | | | | N/A | | | | 1.56% | |
| 12/31/09 | | | 7.07 | | | | 0.15 | | | | 1.89 | | | | 2.04 | | | | (0.19 | ) | | | (0.19 | ) | | | 8.92 | | | | 29.01% | | | | 4,313 | | | | 1.26% | | | | N/A | | | | 1.88% | |
| 12/31/08g | | | 9.96 | | | | 0.03 | | | | (2.92 | ) | | | (2.89 | ) | | | (0.00 | )d | | | (0.00 | )d | | | 7.07 | | | | (28.99% | )b | | | 1,675 | | | | 1.25% | a | | | N/A | | | | 1.00% | a |
| | | | | | | | | | | | | | | | | | | | |
| | | Year ended December 31 | |
| | | 2012 | | | 2011 | | | 2010 | | | 2009 | | | 2008 | |
Portfolio turnover rate for all share classes | | | 15 | % | | | 9 | % | | | 8 | % | | | 11 | % | | | 10 | % |
| b | Percentage represents the results for the period and is not annualized. |
| c | Per share amount calculated on the average shares method. |
| d | Amount is less than $0.005 per share. |
| g | For the period August 15, 2008 (commencement of operations) through December 31, 2008. |
| j | Computed after giving effect to an agreement by MassMutual to waive certain fees and expenses of the Fund. |
| m | Total return does not reflect expenses that apply at the separate account level or to related insurance products. Inclusion of these charges would reduce the total return figures for all periods shown. |
The accompanying notes are an integral part of the financial statements.
156
MML Series Investment Fund – Financial Statements (Continued)
Financial Highlights (For a share outstanding throughout each period)
MML Fundamental Growth Fund
| | | | | | | | | | | | | | | | | | | | | | | | | | | | | | | | | | | | | | | | | | | | | | | | | | | | |
| | | | | | Income (loss) from investment
operations | | | Less distributions to shareholders | | | | | | | | | Ratios / Supplemental Data | |
| | | Net
asset
value,
beginning
of the
period | | | Net
investment
income
(loss)c,j | | | Net
realized
and
unrealized
gain (loss)
on
investments | | | Total
income
(loss) from
investment
operations | | | From net
investment
income | | | From net
realized
gains | | | Total
distributions | | | Net
asset
value,
end of
the
period | | | Total
Returnm | | | Net
assets,
end of
the
period
(000’s) | | | Ratio of
expenses
to average
daily net
assets
before
expense
waivers | | | Ratio of
expenses
to average
daily net
assets
after
expense
waivers | | | Net
investment
income
(loss) to
average
daily net
assets | |
Class II | | | | | | | | | | | | | | | | | | | | | | | | | | | | | | | | | | | | | | | | | | | | | | | | | | | | |
| 12/31/12 | | $ | 9.95 | | | $ | 0.09 | | | $ | 1.23 | | | $ | 1.32 | | | $ | (0.09 | ) | | $ | (0.24 | ) | | $ | (0.33 | ) | | $ | 10.94 | | | | 13.14% | | | $ | 179,834 | | | | 0.87% | | | | 0.85% | j | | | 0.79% | |
| 12/31/11i | | | 10.00 | | | | (0.00 | )d | | | (0.05 | ) | | | (0.05 | ) | | | - | | | | - | | | | - | | | | 9.95 | | | | (0.50% | )b | | | 149,274 | | | | 1.41% | a | | | 0.85% | a,j | | | (0.05% | )a |
Service Class I | | | | | | | | | | | | | | | | | | | | | | | | | | | | | | | | | | | | | | | | | | | | | | | | | |
| 12/31/12h | | $ | 11.50 | | | $ | 0.07 | | | $ | (0.33 | ) | | $ | (0.26 | ) | | $ | (0.08 | ) | | $ | (0.24 | ) | | $ | (0.32 | ) | | $ | 10.92 | | | | (2.32% | )b | | $ | 518 | | | | 1.12% | a | | | 1.10% | a,j | | | 0.94% | a |
| | | | | | | | |
| | | Year ended December 31 | |
| | | 2012 | | | 2011 | |
Portfolio turnover rate for all share classes | | | 66 | % | | | 0 | %b |
| b | Percentage represents the results for the period and is not annualized. |
| c | Per share amount calculated on the average shares method. |
| d | Amount is less than $0.005 per share. |
| h | For the period May 1, 2012 (commencement of operations) through December 31, 2012. |
| i | For the period December 8, 2011 (commencement of operations) through December 31, 2011. |
| j | Computed after giving effect to an agreement by MassMutual to waive certain fees and expenses of the Fund. |
| m | Total return does not reflect expenses that apply at the separate account level or to related insurance products. Inclusion of these charges would reduce the total return figures for all periods shown. |
The accompanying notes are an integral part of the financial statements.
157
MML Series Investment Fund – Financial Statements (Continued)
Financial Highlights (For a share outstanding throughout each period)
MML Fundamental Value Fund
| | | | | | | | | | | | | | | | | | | | | | | | | | | | | | | | | | | | | | | | | | | | | | | | | | | | |
| | | | | | Income (loss) from investment
operations | | | Less distributions
to shareholders | | | | | | | | | Ratios / Supplemental Data | |
| | | Net
asset
value,
beginning
of the
period | | | Net
investment
income
(loss)c,j | | | Net
realized
and
unrealized
gain (loss)
on
investments | | | Total
income
(loss) from
investment
operations | | | From net
investment
income | | | From net
realized
gains | | | Total
distributions | | | Net
asset
value,
end of
the
period | | | Total
Returnm | | | Net
assets,
end of
the
period
(000’s) | | | Ratio of
expenses
to average
daily net
assets
before
expense
waivers | | | Ratio of
expenses
to average
daily net
assets
after
expense
waivers | | | Net
investment
income
(loss) to
average
daily net
assets | |
Class II | | | | | | | | | | | | | | | | | | | | | | | | | | | | | | | | | | | | | | | | | | | | | |
| 12/31/12 | | $ | 10.88 | | | $ | 0.24 | | | $ | 1.53 | | | $ | 1.77 | | | $ | (0.17 | ) | | $ | (0.03 | ) | | $ | (0.20 | ) | | $ | 12.45 | | | | 16.31% | | | $ | 185,473 | | | | 0.80% | | | | 0.80% | l | | | 1.98% | |
| 12/31/11 | | | 11.08 | | | | 0.18 | | | | (0.37 | ) | | | (0.19 | ) | | | - | | | | (0.01 | ) | | | (0.01 | ) | | | 10.88 | | | | (1.68% | ) | | | 172,645 | | | | 0.81% | | | | 0.80% | j | | | 1.65% | |
| 12/31/10g | | | 10.00 | | | | 0.06 | | | | 1.10 | | | | 1.16 | | | | (0.05 | ) | | | (0.03 | ) | | | (0.08 | ) | | | 11.08 | | | | 11.59% | b | | | 126,691 | | | | 0.90% | a | | | 0.80% | a,j | | | 1.51% | a |
Service Class I | | | | | | | | | | | | | | | | | | | | | | | | | | | | | | | | | | | | | | | | | | | | | | | | | |
| 12/31/12h | | $ | 12.16 | | | $ | 0.14 | | | $ | 0.33 | | | $ | 0.47 | | | $ | (0.18 | ) | | $ | (0.03 | ) | | $ | (0.21 | ) | | $ | 12.42 | | | | 3.90% | b | | $ | 381 | | | | 1.05% | a | | | 1.05% | l | | | 1.78% | a |
| | | | | | | | | | | | |
| | | Year ended December 31 | |
| | | 2012 | | | 2011 | | | 2010 | |
Portfolio turnover rate for all share classes | | | 24 | % | | | 14 | % | | | 10 | %b |
| b | Percentage represents the results for the period and is not annualized. |
| c | Per share amount calculated on the average shares method. |
| g | For the period August 10, 2010 (commencement of operations) through December 31, 2010. |
| h | For the period May 1, 2012 (commencement of operations) through December 31, 2012. |
| j | Computed after giving effect to an agreement by MassMutual to waive certain fees and expenses of the Fund. |
| l | Expenses incurred for the period fell under the expense cap. |
| m | Total return does not reflect expenses that apply at the separate account level or to related insurance products. Inclusion of these charges would reduce the total return figures for all periods shown. |
The accompanying notes are an integral part of the financial statements.
158
MML Series Investment Fund – Financial Statements (Continued)
Financial Highlights (For a share outstanding throughout each period)
MML Global Fund
| | | | | | | | | | | | | | | | | | | | | | | | | | | | | | | | | | | | | | | | | | | | | | | | | | | | |
| | | | | | Income (loss) from investment
operations | | | Less distributions to shareholders | | | | | | | | | Ratios / Supplemental Data | |
| | | Net
asset
value,
beginning
of the
period | | | Net
investment
income
(loss)c,j | | | Net
realized
and
unrealized
gain (loss)
on
investments | | | Total
income
(loss) from
investment
operations | | | From net
investment
income | | | From net
realized
gains | | | Total
distributions | | | Net
asset
value,
end of
the
period | | | Total
Returnm | | | Net
assets,
end of
the
period
(000’s) | | | Ratio of
expenses
to average
daily net
assets
before
expense
waivers | | | Ratio of
expenses
to average
daily net
assets
after
expense
waivers | | | Net
investment
income
(loss) to
average
daily net
assets | |
Class I | | | | | | | | | | | | | | | | | | | | | | | | | | | | | | | | | | | | | | | | | | | | | |
| 12/31/12 | | $ | 8.02 | | | $ | 0.12 | | | $ | 1.77 | | | $ | 1.89 | | | $ | (0.09 | ) | | $ | - | | | $ | (0.09 | ) | | $ | 9.82 | | | | 23.69% | | | $ | 131,665 | | | | 0.98% | | | | 0.90% | j | | | 1.33% | |
| 12/31/11 | | | 8.46 | | | | 0.11 | | | | (0.47 | ) | | | (0.36 | ) | | | (0.08 | ) | | | - | | | | (0.08 | ) | | | 8.02 | | | | (4.24% | ) | | | 92,595 | | | | 1.00% | | | | 0.90% | j | | | 1.28% | |
| 12/31/10 | | | 7.56 | | | | 0.08 | | | | 0.87 | | | | 0.95 | | | | (0.05 | ) | | | - | | | | (0.05 | ) | | | 8.46 | | | | 12.64% | | | | 83,762 | | | | 1.01% | | | | 0.90% | j | | | 1.05% | |
| 12/31/09 | | | 5.78 | | | | 0.05 | | | | 1.80 | | | | 1.85 | | | | (0.07 | ) | | | - | | | | (0.07 | ) | | | 7.56 | | | | 32.06% | | | | 65,305 | | | | 1.14% | | | | 0.90% | j | | | 0.76% | |
| 12/31/08 | | | 10.31 | | | | 0.15 | | | | (4.64 | ) | | | (4.49 | ) | | | - | | | | (0.04 | ) | | | (0.04 | ) | | | 5.78 | | | | (43.70% | ) | | | 5,589 | | | | 1.27% | | | | 0.83% | j | | | 1.82% | |
Class II | | | | | | | | | | | | | | | | | | | | | | | | | | | | | | | | | | | | | | | | | | | | | |
| 12/31/12 | | $ | 8.13 | | | $ | 0.13 | | | $ | 1.80 | | | $ | 1.93 | | | $ | (0.10 | ) | | $ | - | | | $ | (0.10 | ) | | $ | 9.96 | | | | 23.79% | | | $ | 16,324 | | | | 0.88% | | | | 0.80% | j | | | 1.45% | |
| 12/31/11 | | | 8.57 | | | | 0.12 | | | | (0.48 | ) | | | (0.36 | ) | | | (0.08 | ) | | | - | | | | (0.08 | ) | | | 8.13 | | | | (4.15% | ) | | | 15,218 | | | | 0.90% | | | | 0.80% | j | | | 1.42% | |
| 12/31/10 | | | 7.64 | | | | 0.09 | | | | 0.88 | | | | 0.97 | | | | (0.04 | ) | | | - | | | | (0.04 | ) | | | 8.57 | | | | 12.83% | | | | 19,095 | | | | 0.91% | | | | 0.80% | j | | | 1.19% | |
| 12/31/09 | | | 5.83 | | | | 0.10 | | | | 1.76 | | | | 1.86 | | | | (0.05 | ) | | | - | | | | (0.05 | ) | | | 7.64 | | | | 31.96% | | | | 20,163 | | | | 1.04% | | | | 0.80% | j | | | 1.63% | |
| 12/31/08 | | | 10.31 | | | | 0.17 | | | | (4.61 | ) | | | (4.44 | ) | | | - | | | | (0.04 | ) | | | (0.04 | ) | | | 5.83 | | | | (43.27% | ) | | | 18,607 | | | | 1.17% | | | | 0.72% | j | | | 1.95% | |
Service Class I | | | | | | | | | | | | | | | | | | | | | | | | | | | | | | | | | | | | | | | | | | | | | |
| 12/31/12 | | $ | 8.00 | | | $ | 0.09 | | | $ | 1.77 | | | $ | 1.86 | | | $ | (0.08 | ) | | $ | - | | | $ | (0.08 | ) | | $ | 9.78 | | | | 23.35% | | | $ | 3,707 | | | | 1.23% | | | | 1.15% | j | | | 1.03% | |
| 12/31/11 | | | 8.47 | | | | 0.08 | | | | (0.47 | ) | | | (0.39 | ) | | | (0.08 | ) | | | - | | | | (0.08 | ) | | | 8.00 | | | | (4.58% | ) | | | 2,330 | | | | 1.25% | | | | 1.15% | j | | | 0.98% | |
| 12/31/10 | | | 7.57 | | | | 0.05 | | | | 0.89 | | | | 0.94 | | | | (0.04 | ) | | | - | | | | (0.04 | ) | | | 8.47 | | | | 12.46% | | | | 1,424 | | | | 1.26% | | | | 1.15% | j | | | 0.71% | |
| 12/31/09 | | | 5.80 | | | | 0.08 | | | | 1.76 | | | | 1.84 | | | | (0.07 | ) | | | - | | | | (0.07 | ) | | | 7.57 | | | | 31.77% | | | | 559 | | | | 1.39% | | | | 1.15% | j | | | 1.20% | |
| 12/31/08g | | | 8.72 | | | | 0.01 | | | | (2.89 | ) | | | (2.88 | ) | | | - | | | | (0.04 | ) | | | (0.04 | ) | | | 5.80 | | | | (33.21% | )b | | | 265 | | | | 1.19% | a | | | 1.15% | a,j | | | 0.46% | a |
| | | | | | | | | | | | | | | | | | | | |
| | | Year ended December 31 | |
| | | 2012 | | | 2011 | | | 2010 | | | 2009 | | | 2008 | |
Portfolio turnover rate for all share classes | | | 11 | % | | | 16 | % | | | 18 | % | | | 88 | % | | | 65 | % |
| b | Percentage represents the results for the period and is not annualized. |
| c | Per share amount calculated on the average shares method. |
| g | For the period August 15, 2008 (commencement of operations) through December 31, 2008. |
| j | Computed after giving effect to an agreement by MassMutual to waive certain fees and expenses of the Fund. |
| m | Total return does not reflect expenses that apply at the separate account level or to related insurance products. Inclusion of these charges would reduce the total return figures for all periods shown. |
The accompanying notes are an integral part of the financial statements.
159
MML Series Investment Fund – Financial Statements (Continued)
Financial Highlights (For a share outstanding throughout each period)
MML Growth & Income Fund
| | | | | | | | | | | | | | | | | | | | | | | | | | | | | | | | | | | | | | | | | | | | | | | | |
| | | | | | Income (loss) from investment
operations | | | Less distributions to
shareholders | | | | | | | | | Ratios / Supplemental Data | |
| | | Net
asset
value,
beginning
of the
period | | | Net
investment
income
(loss)c,j | | | Net
realized
and
unrealized
gain (loss)
on
investments | | | Total
income
(loss) from
investment
operations | | | From net
investment
income | | | Total
distributions | | | Net
asset
value,
end of
the
period | | | Total
Returnm | | | Net
assets,
end of
the
period
(000’s) | | | Ratio of
expenses
to average
daily net
assets
before
expense
waivers | | | Ratio of
expenses
to average
daily net
assets
after
expense
waivers | | | Net
investment
income
(loss) to
average
daily net
assets | |
Initial Class | | | | | | | | | | | | | | | | | | | | | | | | | | | | | | | | | | | | | | | | | |
| 12/31/12 | | $ | 7.83 | | | $ | 0.13 | | | $ | 1.39 | | | $ | 1.52 | | | $ | (0.11 | ) | | $ | (0.11 | ) | | $ | 9.24 | | | | 19.49% | | | $ | 116,115 | | | | 0.58% | | | | N/A | | | | 1.46% | |
| 12/31/11 | | | 8.07 | | | | 0.10 | | | | (0.25 | ) | | | (0.15 | ) | | | (0.09 | ) | | | (0.09 | ) | | | 7.83 | | | | (1.83% | ) | | | 116,867 | | | | 0.58% | | | | N/A | | | | 1.23% | |
| 12/31/10 | | | 7.35 | | | | 0.08 | | | | 0.74 | | | | 0.82 | | | | (0.10 | ) | | | (0.10 | ) | | | 8.07 | | | | 11.47% | | | | 143,556 | | | | 0.56% | | | | N/A | | | | 1.06% | |
| 12/31/09 | | | 5.87 | | | | 0.09 | | | | 1.52 | | | | 1.61 | | | | (0.13 | ) | | | (0.13 | ) | | | 7.35 | | | | 27.66% | | | | 147,773 | | | | 0.58% | | | | N/A | | | | 1.51% | |
| 12/31/08 | | | 9.80 | | | | 0.11 | | | | (4.04 | ) | | | (3.93 | ) | | | - | | | | - | | | | 5.87 | | | | (40.10% | ) | | | 133,236 | | | | 0.56% | | | | 0.55 | %j | | | 1.39% | |
Service Class | | | | | | | | | | | | | | | | | | | | | | | | | | | | | | | | | | | | | | | | | |
| 12/31/12 | | $ | 7.79 | | | $ | 0.11 | | | $ | 1.39 | | | $ | 1.50 | | | $ | (0.09 | ) | | $ | (0.09 | ) | | $ | 9.20 | | | | 19.32% | | | $ | 12,385 | | | | 0.83% | | | | N/A | | | | 1.21% | |
| 12/31/11 | | | 8.03 | | | | 0.08 | | | | (0.25 | ) | | | (0.17 | ) | | | (0.07 | ) | | | (0.07 | ) | | | 7.79 | | | | (2.13% | ) | | | 10,090 | | | | 0.83% | | | | N/A | | | | 0.97% | |
| 12/31/10 | | | 7.32 | | | | 0.06 | | | | 0.74 | | | | 0.80 | | | | (0.09 | ) | | | (0.09 | ) | | | 8.03 | | | | 11.21% | | | | 13,294 | | | | 0.81% | | | | N/A | | | | 0.82% | |
| 12/31/09 | | | 5.86 | | | | 0.07 | | | | 1.52 | | | | 1.59 | | | | (0.13 | ) | | | (0.13 | ) | | | 7.32 | | | | 27.35% | | | | 11,212 | | | | 0.83% | | | | N/A | | | | 1.05% | |
| 12/31/08g | | | 8.59 | | | | 0.05 | | | | (2.78 | ) | | | (2.73 | ) | | | - | | | | - | | | | 5.86 | | | | (31.78% | )b | | | 1,319 | | | | 0.84% | a | | | N/A | | | | 2.15% | a |
| | | | | | | | | | | | | | | | | | | | |
| | | Year ended December 31 | |
| | | 2012 | | | 2011 | | | 2010 | | | 2009 | | | 2008 | |
Portfolio turnover rate for all share classes | | | 26 | % | | | 22 | % | | | 95 | % | | | 47 | % | | | 48 | % |
| b | Percentage represents the results for the period and is not annualized. |
| c | Per share amount calculated on the average shares method. |
| g | For the period August 15, 2008 (commencement of operations) through December 31, 2008. |
| j | Computed after giving effect to an agreement by MassMutual to waive certain fees and expenses of the Fund. |
| m | Total return does not reflect expenses that apply at the separate account level or to related insurance products. Inclusion of these charges would reduce the total return figures for all periods shown. |
The accompanying notes are an integral part of the financial statements.
160
MML Series Investment Fund – Financial Statements (Continued)
Financial Highlights (For a share outstanding throughout each period)
MML Income & Growth Fund
| | | | | | | | | | | | | | | | | | | | | | | | | | | | | | | | | | | | | | | | | | | | | | | | | | | | |
| | | | | | Income (loss) from investment
operations | | | Less distributions to shareholders | | | | | | | | | Ratios / Supplemental Data | |
| | | Net
asset
value,
beginning
of the
period | | | Net
investment
income
(loss)c,j | | | Net
realized
and
unrealized
gain (loss)
on
investments | | | Total
income
(loss) from
investment
operations | | | From net
investment
income | | | From net
realized
gains | | | Total
distributions | | | Net
asset
value,
end of
the
period | | | Total
Returnm | | | Net
assets,
end of
the
period
(000’s) | | | Ratio of
expenses
to average
daily net
assets
before
expense
waivers | | | Ratio of
expenses
to average
daily net
assets
after
expense
waivers | | | Net
investment
income
(loss) to
average
daily net
assets | |
Initial Class | | | | | | | | | | | | | | | | | | | | | | | | | | | | | | | | | | | | | | | | | | | | | |
| 12/31/12 | | $ | 8.56 | | | $ | 0.23 | | | $ | 0.79 | | | $ | 1.02 | | | $ | (0.10 | ) | | $ | - | | | $ | (0.10 | ) | | $ | 9.48 | | | | 11.96% | | | $ | 171,207 | | | | 0.72% | | | | N/A | | | | 2.51% | |
| 12/31/11 | | | 8.37 | | | | 0.20 | | | | 0.25 | | | | 0.45 | | | | (0.26 | ) | | | - | | | | (0.26 | ) | | | 8.56 | | | | 5.60% | | | | 88,465 | | | | 0.74% | | | | N/A | | | | 2.37% | |
| 12/31/10 | | | 7.82 | | | | 0.13 | | | | 0.73 | | | | 0.86 | | | | (0.31 | ) | | | - | | | | (0.31 | ) | | | 8.37 | | | | 11.70% | | | | 72,789 | | | | 0.73% | | | | N/A | | | | 1.62% | |
| 12/31/09 | | | 6.68 | | | | 0.13 | | | | 1.07 | | | | 1.20 | | | | (0.06 | ) | | | - | | | | (0.06 | ) | | | 7.82 | | | | 18.06% | | | | 270,263 | | | | 0.72% | | | | N/A | | | | 1.79% | |
| 12/31/08 | | | 10.24 | | | | 0.16 | | | | (3.72 | ) | | | (3.56 | ) | | | (0.00 | )d | | | (0.00 | )d | | | (0.00 | )d | | | 6.68 | | | | (34.76% | ) | | | 76,447 | | | | 0.74% | | | | 0.73% | j | | | 1.82% | |
Service Class | | | | | | | | | | | | | | | | | | | | | | | | | | | | | | | | | | | | | | | | | | | | | |
| 12/31/12 | | $ | 8.51 | | | $ | 0.20 | | | $ | 0.80 | | | $ | 1.00 | | | $ | (0.09 | ) | | $ | - | | | $ | (0.09 | ) | | $ | 9.42 | | | | 11.73% | | | $ | 11,282 | | | | 0.97% | | | | N/A | | | | 2.23% | |
| 12/31/11 | | | 8.33 | | | | 0.18 | | | | 0.26 | | | | 0.44 | | | | (0.26 | ) | | | - | | | | (0.26 | ) | | | 8.51 | | | | 5.40% | | | | 8,466 | | |
| 0.99%
|
| | | N/A | | | | 2.18% | |
| 12/31/10 | | | 7.79 | | | | 0.13 | | | | 0.71 | | | | 0.84 | | | | (0.30 | ) | | | - | | | | (0.30 | ) | | | 8.33 | | | | 11.47% | | | | 3,953 | | | | 0.98% | | | | N/A | | | | 1.64% | |
| 12/31/09 | | | 6.68 | | | | 0.11 | | | | 1.06 | | | | 1.17 | | | | (0.06 | ) | | | - | | | | (0.06 | ) | | | 7.79 | | | | 17.59% | | | | 2,406 | | | | 0.97% | | | | N/A | | | | 1.59% | |
| 12/31/08g | | | 9.09 | | | | 0.06 | | | | (2.47 | ) | | | (2.41 | ) | | | (0.00 | )d | | | (0.00 | )d | | | (0.00 | )d | | | 6.68 | | | | (26.51% | )b | | | 650 | | | | 1.03% | a | | | N/A | | | | 2.33% | a |
| | | | | | | | | | | | | | | | | | | | |
| | | Year ended December 31 | |
| | | 2012 | | | 2011 | | | 2010 | | | 2009 | | | 2008 | |
Portfolio turnover rate for all share classes | | | 3 | % | | | 12 | % | | | 64 | % | | | 52 | % | | | 59 | % |
| b | Percentage represents the results for the period and is not annualized. |
| c | Per share amount calculated on the average shares method. |
| d | Amount is less than $0.005 per share. |
| g | For the period August 15, 2008 (commencement of operations) through December 31, 2008. |
| j | Computed after giving effect to an agreement by MassMutual to waive certain fees and expenses of the Fund. |
| m | Total return does not reflect expenses that apply at the separate account level or to related insurance products. Inclusion of these charges would reduce the total return figures for all periods shown. |
The accompanying notes are an integral part of the financial statements.
161
MML Series Investment Fund – Financial Statements (Continued)
Financial Highlights (For a share outstanding throughout each period)
MML Large Cap Growth Fund
| | | | | | | | | | | | | | | | | | | | | | | | | | | | | | | | | | | | | | | | | | | | | | | | |
| | | | | | Income (loss) from investment
operations | | | Less distributions to
shareholders | | | | | | | | | Ratios / Supplemental Data | |
| | | Net
asset
value,
beginning
of the
period | | | Net
investment
income
(loss)c,j | | | Net
realized
and
unrealized
gain (loss)
on
investments | | | Total
income
(loss) from
investment
operations | | | From net
investment
income | | | Total
distributions | | | Net
asset
value,
end of
the
period | | | Total
Returnm | | | Net
assets,
end of
the
period
(000’s) | | | Ratio of
expenses
to average
daily net
assets
before
expense
waivers | | | Ratio of
expenses
to average
daily net
assets
after
expense
waivers | | | Net
investment
income
(loss) to
average
daily net
assets | |
Initial Class | | | | | | | | | | | | | | | | | | | | | | | | | | | | | | | | | | | | | | | | | |
| 12/31/12 | | $ | 10.04 | | | $ | 0.05 | | | $ | 1.54 | | | $ | 1.59 | | | $ | (0.01 | ) | | $ | (0.01 | ) | | $ | 11.62 | | | | 15.81% | | | $ | 205,833 | | | | 0.70% | | | | N/A | | | | 0.49% | |
| 12/31/11 | | | 10.45 | | | | 0.01 | | | | (0.40 | ) | | | (0.39 | ) | | | (0.02 | ) | | | (0.02 | ) | | | 10.04 | | | | (3.69% | ) | | | 188,235 | | | | 0.71% | | | | N/A | | | | 0.08% | |
| 12/31/10 | | | 8.80 | | | | 0.03 | | | | 1.63 | | | | 1.66 | | | | (0.01 | ) | | | (0.01 | ) | | | 10.45 | | | | 18.87% | | | | 166,552 | | | | 0.72% | | | | N/A | | | | 0.36% | |
| 12/31/09 | | | 6.71 | | | | 0.03 | | | | 2.10 | | | | 2.13 | | | | (0.04 | ) | | | (0.04 | ) | | | 8.80 | | | | 31.75% | | | | 41,071 | | | | 0.81% | | | | N/A | | | | 0.35% | |
| 12/31/08 | | | 11.34 | | | | 0.03 | | | | (4.66 | ) | | | (4.63 | ) | | | - | | | | - | | | | 6.71 | | | | (40.83% | ) | | | 36,197 | | | | 0.78% | | | | 0.77% | j | | | 0.35% | |
Service Class | | | | | | | | | | | | | | | | | | | | | | | | | | | | | | | | | | | | | | | | | |
| 12/31/12 | | $ | 9.99 | | | $ | 0.03 | | | $ | 1.51 | | | $ | 1.54 | | | $ | - | | | $ | - | | | $ | 11.53 | | | | 15.42% | | | $ | 1,439 | | |
| 0.95%
|
| | | N/A | | | | 0.25% | |
| 12/31/11 | | | 10.40 | | | | (0.02 | ) | | | (0.38 | ) | | | (0.40 | ) | | | (0.01 | ) | | | (0.01 | ) | | | 9.99 | | | | (3.82% | ) | | | 1,176 | | | | 0.96% | | | | N/A | | | | (0.17% | ) |
| 12/31/10 | | | 8.78 | | | | 0.01 | | | | 1.61 | | | | 1.62 | | | | - | | | | - | | | | 10.40 | | | | 18.45% | | | | 763 | | | | 0.97% | | | | N/A | | | | 0.11% | |
| 12/31/09 | | | 6.71 | | | | 0.01 | | | | 2.09 | | | | 2.10 | | | | (0.03 | ) | | | (0.03 | ) | | | 8.78 | | | | 31.43% | | | | 636 | | | | 1.06% | | | | N/A | | | | 0.08% | |
| 12/31/08g | | | 9.87 | | | | 0.01 | | | | (3.17 | ) | | | (3.16 | ) | | | - | | | | - | | | | 6.71 | | | | (32.02% | )b | | | 236 | | | | 1.13% | a | | | N/A | | | | 0.53% | a |
| | | | | | | | | | | | | | | | | | | | |
| | | Year ended December 31 | |
| | | 2012 | | | 2011 | | | 2010 | | | 2009 | | | 2008 | |
Portfolio turnover rate for all shares | | | 91 | % | | | 90 | % | | | 88 | % | | | 151 | % | | | 86 | % |
| b | Percentage represents the results for the period and is not annualized. |
| c | Per share amount calculated on the average shares method. |
| g | For the period August 15, 2008 (commencement of operations) through December 31, 2008. |
| j | Computed after giving effect to an agreement by MassMutual to waive certain fees and expenses of the Fund. |
| m | Total return does not reflect expenses that apply at the separate account level or to related insurance products. Inclusion of these charges would reduce the total return figures for all periods shown. |
The accompanying notes are an integral part of the financial statements.
162
MML Series Investment Fund – Financial Statements (Continued)
Financial Highlights (For a share outstanding throughout each period)
MML Large Cap Value Fund
| | | | | | | | | | | | | | | | | | | | | | | | | | | | | | | | | | | | | | | | | | | | | | | | |
| | | | | | Income (loss) from investment
operations | | | Less distributions to shareholders | | | | | | | | | Ratios / Supplemental Data | |
| | | Net
asset
value,
beginning
of the
period | | | Net
investment
income
(loss)c | | | Net
realized
and
unrealized
gain (loss)
on
investments | | | Total
income
(loss) from
investment
operations | | | From net
investment
income | | | From net
realized
gains | | | Total
distributions | | | Net
asset
value,
end of
the
period | | | Total
Returnm | | | Net
assets,
end of
the
period
(000’s) | | | Ratio of
expenses
to average
daily net
assets | | | Net
investment
income
(loss) to
average
daily net
assets | |
Initial Class | | | | | | | | | | | | | | | | | | | | | | | | | | | | | | | | | | | | | | | | | | | | | |
| 12/31/12 | | $ | 10.98 | | | $ | 0.17 | | | $ | 1.27 | | | $ | 1.44 | | | $ | (0.08 | ) | | $ | - | | | $ | (0.08 | ) | | $ | 12.34 | | | | 13.19% | | | $ | 193,271 | | | | 0.83% | | | | 1.43% | |
| 12/31/11 | | | 11.54 | | | | 0.10 | | | | (0.56 | ) | | | (0.46 | ) | | | (0.10 | ) | | | - | | | | (0.10 | ) | | | 10.98 | | | | (3.94% | ) | | | 193,403 | | | | 0.82% | | | | 0.89% | |
| 12/31/10 | | | 10.36 | | | | 0.08 | | | | 1.19 | | | | 1.27 | | | | (0.09 | ) | | | - | | | | (0.09 | ) | | | 11.54 | | | | 12.38% | | | | 218,666 | | | | 0.83% | | | | 0.79% | |
| 12/31/09 | | | 8.01 | | | | 0.07 | | | | 2.38 | | | | 2.45 | | | | (0.10 | ) | | | - | | | | (0.10 | ) | | | 10.36 | | | | 30.71% | | | | 211,859 | | | | 0.85% | | | | 0.77% | |
| 12/31/08 | | | 13.21 | | | | 0.10 | | | | (5.29 | ) | | | (5.19 | ) | | | - | | | | (0.01 | ) | | | (0.01 | ) | | | 8.01 | | | | (39.30% | ) | | | 175,313 | | | | 0.84% | | | | 0.92% | |
Service Class | | | | | | | | | | | | | | | | | | | | | | | | | | | | | | | | | | | | | | | | | | | | | |
| 12/31/12 | | $ | 10.93 | | | $ | 0.14 | | | $ | 1.26 | | | $ | 1.40 | | | $ | (0.06 | ) | | $ | - | | | $ | (0.06 | ) | | $ | 12.27 | | | | 12.83% | | | $ | 22,660 | | | | 1.08% | | | | 1.21% | |
| 12/31/11 | | | 11.49 | | | | 0.07 | | | | (0.55 | ) | | | (0.48 | ) | | | (0.08 | ) | | | - | | | | (0.08 | ) | | | 10.93 | | | | (4.14% | ) | | | 18,508 | | | | 1.07% | | | | 0.64% | |
| 12/31/10 | | | 10.33 | | | | 0.06 | | | | 1.17 | | | | 1.23 | | | | (0.07 | ) | | | - | | | | (0.07 | ) | | | 11.49 | | | | 12.04% | | | | 16,519 | | | | 1.08% | | | | 0.56% | |
| 12/31/09 | | | 8.01 | | | | 0.04 | | | | 2.38 | | | | 2.42 | | | | (0.10 | ) | | | - | | | | (0.10 | ) | | | 10.33 | | | | 30.32% | | | | 10,807 | | | | 1.10% | | | | 0.47% | |
| 12/31/08g | | | 11.57 | | | | 0.01 | | | | (3.56 | ) | | | (3.55 | ) | | | - | | | | (0.01 | ) | | | (0.01 | ) | | | 8.01 | | | | (30.69% | )b | | | 4,823 | | | | 1.12% | a | | | 0.48% | a |
| | | | | | | | | | | | | | | | | | | | |
| | | Year ended December 31 | |
| | | 2012 | | | 2011 | | | 2010 | | | 2009 | | | 2008 | |
Portfolio turnover rate for all share classes | | | 11 | % | | | 15 | % | | | 17 | % | | | 21 | % | | | 20 | % |
| b | Percentage represents the results for the period and is not annualized. |
| c | Per share amount calculated on the average shares method. |
| g | For the period August 15, 2008 (commencement of operations) through December 31, 2008. |
| m | Total return does not reflect expenses that apply at the separate account level or to related insurance products. Inclusion of these charges would reduce the total return figures for all periods shown. |
The accompanying notes are an integral part of the financial statements.
163
MML Series Investment Fund – Financial Statements (Continued)
Financial Highlights (For a share outstanding throughout each period)
MML Mid Cap Growth Fund
| | | | | | | | | | | | | | | | | | | | | | | | | | | | | | | | | | | | | | | | | | | | |
| | | | | | Income (loss) from investment
operations | | | Less distributions to
shareholders | | | | | | | | | Ratios / Supplemental Data | |
| | | Net
asset
value,
beginning
of the
period | | | Net
investment
income
(loss)c | | | Net
realized
and
unrealized
gain (loss)
on
investments | | | Total
income
(loss) from
investment
operations | | | From net
realized
gains | | | Total
distributions | | | Net
asset
value,
end of
the
period | | | Total
Returnm | | | Net
assets,
end of
the
period
(000’s) | | | Ratio of
expenses
to average
daily net
assets | | | Net
investment
income
(loss)
to average
daily net
assets | |
Initial Class | | | | | | | | | | | | | | | | | | | | | | | | | | | | | | | | | | | | | |
| 12/31/12 | | $ | 12.08 | | | $ | 0.01 | | | $ | 1.63 | | | $ | 1.64 | | | $ | (0.76 | ) | | $ | (0.76 | ) | | $ | 12.96 | | | | 13.78% | | | $ | 330,731 | | | | 0.82% | | | | 0.04% | |
| 12/31/11 | | | 12.23 | | | | (0.04 | ) | | | (0.11 | ) | | | (0.15 | ) | | | - | | | | - | | | | 12.08 | | | | (1.23% | ) | | | 305,757 | | | | 0.82% | | | | (0.33% | ) |
| 12/31/10 | | | 9.55 | | | | (0.02 | ) | | | 2.70 | | | | 2.68 | | | | - | | | | - | | | | 12.23 | | | | 28.06% | | | | 330,711 | | | | 0.82% | | | | (0.20% | ) |
| 12/31/09 | | | 6.57 | | | | (0.02 | ) | | | 3.00 | | | | 2.98 | | | | - | | | | - | | | | 9.55 | | | | 45.36% | | | | 274,954 | | | | 0.84% | | | | (0.25% | ) |
| 12/31/08 | | | 11.18 | | | | (0.02 | ) | | | (4.41 | ) | | | (4.43 | ) | | | (0.18 | ) | | | (0.18 | ) | | | 6.57 | | | | (40.21% | ) | | | 183,886 | | | | 0.83% | | | | (0.21% | ) |
Service Class | | | | | | | | | | | | | | �� | | | | | | | | | | | | | | | | | | | | | | | |
| 12/31/12 | | $ | 11.98 | | | $ | (0.02 | ) | | $ | 1.61 | | | $ | 1.59 | | | $ | (0.76 | ) | | $ | (0.76 | ) | | $ | 12.81 | | | | 13.47% | | | $ | 29,154 | | | | 1.07% | | | | (0.19% | ) |
| 12/31/11 | | | 12.17 | | | | (0.07 | ) | | | (0.12 | ) | | | (0.19 | ) | | | - | | | | - | | | | 11.98 | | | | (1.56% | ) | | | 22,796 | | | | 1.07% | | | | (0.57% | ) |
| 12/31/10 | | | 9.52 | | | | (0.04 | ) | | | 2.69 | | | | 2.65 | | | | - | | | | - | | | | 12.17 | | | | 27.84% | | | | 17,236 | | | | 1.07% | | | | (0.42% | ) |
| 12/31/09 | | | 6.57 | | | | (0.04 | ) | | | 2.99 | | | | 2.95 | | | | - | | | | - | | | | 9.52 | | | | 44.90% | | | | 9,743 | | | | 1.09% | | | | (0.50% | ) |
| 12/31/08g | | | 10.46 | | | | (0.01 | ) | | | (3.70 | ) | | | (3.71 | ) | | | (0.18 | ) | | | (0.18 | ) | | | 6.57 | | | | (36.09% | )b | | | 3,757 | | | | 1.11% | a | | | (0.29% | )a |
| | | | | | | | | | | | | | | | | | | | |
| | | Year ended December 31 | |
| | | 2012 | | | 2011 | | | 2010 | | | 2009 | | | 2008 | |
Portfolio turnover rate for all share classes | | | 31 | % | | | 33 | % | | | 29 | % | | | 52 | % | | | 32 | % |
| b | Percentage represents the results for the period and is not annualized. |
| c | Per share amount calculated on the average shares method. |
| g | For the period August 15, 2008 (commencement of operations) through December 31, 2008. |
| m | Total return does not reflect expenses that apply at the separate account level or to related insurance products. Inclusion of these charges would reduce the total return figures for all periods shown. |
The accompanying notes are an integral part of the financial statements.
164
MML Series Investment Fund – Financial Statements (Continued)
Financial Highlights (For a share outstanding throughout each period)
MML Mid Cap Value Fund
| | | | | | | | | | | | | | | | | | | | | | | | | | | | | | | | | | | | | | | | | | | | | | | | |
| | | | | | Income (loss) from investment
operations | | | Less distributions to shareholders | | | | | | | | | Ratios / Supplemental Data | |
| | | Net
asset
value,
beginning
of the
period | | | Net
investment
income
(loss)c | | | Net
realized
and
unrealized
gain (loss)
on
investments | | | Total
income
(loss) from
investment
operations | | | From net
investment
income | | | From net
realized
gains | | | Total
distributions | | | Net asset
value,
end of
the
period | | | Total
Returnm | | | Net
assets,
end of
the
period
(000’s) | | | Ratio of
expenses
to average
daily net
assets | | | Net
investment
income
(loss) to
average
daily net
assets | |
Initial Class | | | | | | | | | | | | | | | | | | | | | | | | | | | | | | | | | | | | | | | | | |
| 12/31/12 | | $ | 10.17 | | | $ | 0.23 | | | $ | 1.42 | | | $ | 1.65 | | | $ | (0.18 | ) | | $ | (0.53 | ) | | $ | (0.71 | ) | | $ | 11.11 | | | | 16.70% | | | $ | 437,725 | | | | 0.89% | | | | 2.12% | |
| 12/31/11 | | | 10.46 | | | | 0.17 | | | | (0.25 | ) | | | (0.08 | ) | | | (0.21 | ) | | | - | | | | (0.21 | ) | | | 10.17 | | | | (0.64% | ) | | | 407,615 | | | | 0.90% | | | | 1.62% | |
| 12/31/10 | | | 8.85 | | | | 0.22 | | | | 1.53 | | | | 1.75 | | | | (0.14 | ) | | | - | | | | (0.14 | ) | | | 10.46 | | | | 20.09% | | | | 419,863 | | | | 0.89% | | | | 2.36% | |
| 12/31/09 | | | 6.93 | | | | 0.15 | | | | 1.93 | | | | 2.08 | | | | (0.16 | ) | | | - | | | | (0.16 | ) | | | 8.85 | | | | 30.31% | | | | 375,386 | | | | 0.91% | | | | 1.99% | |
| 12/31/08 | | | 9.18 | | | | 0.17 | | | | (2.42 | ) | | | (2.25 | ) | | | (0.00 | )d | | | - | | | | (0.00 | )d | | | 6.93 | | | | (24.51% | ) | | | 291,433 | | | | 0.90% | | | | 2.09% | |
Service Class | | | | | | | | | | | | | | | | | | | | | | | | | | | | | | | | | | | | | | | | | |
| 12/31/12 | | $ | 10.12 | | | $ | 0.20 | | | $ | 1.41 | | | $ | 1.61 | | | $ | (0.16 | ) | | $ | (0.53 | ) | | $ | (0.69 | ) | | $ | 11.04 | | | | 16.37% | | | $ | 16,241 | | | | 1.14% | | | | 1.89% | |
| 12/31/11 | | | 10.41 | | | | 0.14 | | | | (0.23 | ) | | | (0.09 | ) | | | (0.20 | ) | | | - | | | | (0.20 | ) | | | 10.12 | | | | (0.81% | ) | | | 12,970 | | | | 1.15% | | | | 1.38% | |
| 12/31/10 | | | 8.83 | | | | 0.20 | | | | 1.51 | | | | 1.71 | | | | (0.13 | ) | | | - | | | | (0.13 | ) | | | 10.41 | | | | 19.62% | | | | 9,686 | | | | 1.14% | | | | 2.14% | |
| 12/31/09 | | | 6.92 | | | | 0.13 | | | | 1.94 | | | | 2.07 | | | | (0.16 | ) | | | - | | | | (0.16 | ) | | | 8.83 | | | | 30.20% | | | | 6,160 | | | | 1.16% | | | | 1.76% | |
| 12/31/08g | | | 9.06 | | | | 0.09 | | | | (2.23 | ) | | | (2.14 | ) | | | (0.00 | )d | | | - | | | | (0.00 | )d | | | 6.92 | | | | (23.62% | )b | | | 2,279 | | | | 1.16% | a | | | 3.51% | a |
| | | | | | | | | | | | | | | | | | | | |
| | | Year ended December 31 | |
| | | 2012 | | | 2011 | | | 2010 | | | 2009 | | | 2008 | |
Portfolio turnover rate for all share classes | | | 81 | % | | | 106 | % | | | 125 | % | | | 159 | % | | | 189 | % |
| b | Percentage represents the results for the period and is not annualized. |
| c | Per share amount calculated on the average shares method. |
| d | Amount is less than $0.005 per share. |
| g | For the period August 15, 2008 (commencement of operations) through December 31, 2008. |
| m | Total return does not reflect expenses that apply at the separate account level or to related insurance products. Inclusion of these charges would reduce the total return figures for all periods shown. |
The accompanying notes are an integral part of the financial statements.
165
MML Series Investment Fund – Financial Statements (Continued)
Financial Highlights (For a share outstanding throughout each period)
MML PIMCO Total Return Fund
| | | | | | | | | | | | | | | | | | | | | | | | | | | | | | | | | | | | |
| | | | | | Income (loss) from investment
operations | | | Less distributions
to shareholders | | | | | | | |
| | | Net
asset
value,
beginning
of
the
period | | | Net
investment
income
(loss)c,j | | |
Net
realized
and
unrealized
gain (loss)
on
investments | | | Total
income
(loss) from
investment
operations | | | From net
investment
income | | | From net
realized
gains | | | Total
distributions | | | Net
asset
value,
end of
the
period | | | Total
Returnm | |
Class II | | | | | | | | | | | | | | | | | | | | | | | | | | | | | |
| 12/31/12 | | $ | 10.13 | | | $ | 0.20 | | | $ | 0.70 | | | $ | 0.90 | | | $ | (0.21 | ) | | $ | - | | | $ | (0.21 | ) | | $ | 10.82 | | | | 8.93% | |
| 12/31/11 | | | 9.90 | | | | 0.22 | | | | 0.02 | | | | 0.24 | | | | (0.01 | ) | | | - | | | | (0.01 | ) | | | 10.13 | | | | 2.45% | |
| 12/31/10g | | | 10.00 | | | | 0.06 | | | | (0.05 | ) | | | 0.01 | | | | (0.04 | ) | | | (0.07 | ) | | | (0.11 | ) | | | 9.90 | | | | 0.17% | b |
Service Class I | | | | | | | | | | | | | | | | | | | | | | | | | | | | | | | | | |
| 12/31/12h | | $ | 10.49 | | | $ | 0.10 | | | $ | 0.41 | | | $ | 0.51 | | | $ | (0.21 | ) | | $ | - | | | $ | (0.21 | ) | | $ | 10.79 | | | | 4.94% | b |
| | | | | | | | | | | | |
| | | Year ended December 31 | |
| | | 2012 | | | 2011 | | | 2010 | |
Portfolio turnover rate for all share classes | | | 583 | %u | | | 417 | % | | | 221 | %b |
| b | Percentage represents the results for the period and is not annualized. |
| c | Per share amount calculated on the average shares method. |
| e | Amount is less than 0.005%. |
| g | Fund commenced operations on August 10, 2010 (commencement of operations) through December 31, 2010. |
| h | For the period May 1, 2012 (commencement of operations) through December 31, 2012. |
| j | Computed after giving effect to an agreement by MassMutual to waive certain fees and expenses of the Fund. |
| m | Total return does not reflect expenses that apply at the separate account level or to related insurance products. Inclusion of these charges would reduce the total return figures for all periods shown. |
| n | Includes interest expense. |
| o | Excludes interest expense. |
| p | Interest expense incurred as a result of entering into reverse repurchase agreements or dollar roll transactions is included in the Fund’s net expenses in the Statements of Operations. Income earned on investing proceeds from reverse repurchase agreements is included in interest income in the Statements of Operations. |
| u | Excludes dollar roll transactions. Including these transactions, the portfolio turnover would have been 618%. |
The accompanying notes are an integral part of the financial statements.
166
| | | | | | | | | | | | | | | | | | | | | | | | | | |
Ratios / Supplemental Data | |
Net
assets,
end of
the
period
(000’s) | | | Ratio of
expenses
to average
daily net
assets
before
expense
waiverso | | | Ratio of
expenses
to average
daily net
assets
after
expense
waiverso | | | Ratio of
interest
expense
to average
daily net
assetsp | | | Ratio of
expenses
to average
daily net
assets
before
expense
waiversn | | | Ratio of
expenses
to average
daily net
assets
after
expense
waiversn | | | Net
investment
income
(loss) to
average
daily net
assets | |
| | | | | | | | | | | | | | | | | | | | | | | | | | |
| $ | 306,746 | | | | 0.72 | % | | | 0.65 | %j | | | 0.00 | %e | | | 0.72 | % | | | 0.65 | %j | | | 1.84 | % |
| | 226,663 | | | | 0.70 | % | | | 0.65 | %j | | | N/A | | | | 0.70 | % | | | 0.65 | %j | | | 2.21 | % |
| | 132,798 | | | | 0.91 | %a | | | 0.65 | %a,j | | | 0.00 | %a,e | | | 0.91 | %a | | | 0.65 | %a,j | | | 1.40 | %a |
| | | | | | | | | | | | | | | | | | | | | | | | | | |
| $ | 5,730 | | | | 0.97 | %a | | | 0.90 | %a,j | | | 0.00 | %a,e | | | 0.97 | %a | | | 0.90 | %a,j | | | 1.45 | %a |
167
MML Series Investment Fund – Financial Statements (Continued)
Financial Highlights (For a share outstanding throughout each period)
MML Small Cap Growth Equity Fund
| | | | | | | | | | | | | | | | | | | | | | | | | | | | | | | | | | | | | | | | | | | | | | | | |
| | | | | | Income (loss) from investment
operations | | | Less distributions to
shareholders | | | | | | | | | Ratios / Supplemental Data | |
| | | Net
asset
value,
beginning
of the
period | | | Net
investment
income
(loss)c,j | | | Net
realized
and
unrealized
gain (loss)
on
investments | | | Total
income
(loss) from
investment
operations | | | From net
realized
gains | | | Total
distributions | | | Net
asset
value,
end of
the
period | | | Total
Returnm | | | Net
assets,
end of
the
period
(000's) | | | Ratio of
expenses
to average
daily net
assets
before
expense
waivers | | | Ratio of
expenses
to average
daily net
assets
after
expense
waivers | | | Net
investment
income
(loss) to
average
daily net
assets | |
Initial Class | | | | | | | | | | | | | | | | | | | | | | | | | | | | | | | | | | | | | | | | | | | | | |
| 12/31/12 | | $ | 16.05 | | | $ | (0.06 | ) | | $ | 2.17 | | | $ | 2.11 | | | $ | (1.86 | ) | | $ | (1.86 | ) | | $ | 16.30 | | | | 13.41% | | | $ | 256,961 | | | | 1.13% | | | | 1.12 | %j | | | (0.38% | ) |
| 12/31/11 | | | 17.70 | | | | (0.12 | ) | | | (0.82 | ) | | | (0.94 | ) | | | (0.71 | ) | | | (0.71 | ) | | | 16.05 | | | | (5.23% | ) | | | 250,279 | | | | 1.13% | | | | N/A | | | | (0.68% | ) |
| 12/31/10 | | | 14.48 | | | | (0.10 | ) | | | 3.32 | | | | 3.22 | | | | - | | | | - | | | | 17.70 | | | | 22.24% | | | | 258,833 | | | | 1.14% | | | | N/A | | | | (0.64% | ) |
| 12/31/09 | | | 10.46 | | | | (0.08 | ) | | | 4.10 | | | | 4.02 | | | | - | | | | - | | | | 14.48 | | | | 38.43% | | | | 250,006 | | | | 1.15% | | | | N/A | | | | (0.66% | ) |
| 12/31/08 | | | 17.02 | | | | (0.01 | ) | | | (6.55 | ) | | | (6.56 | ) | | | - | | | | - | | | | 10.46 | | | | (38.54% | ) | | | 171,302 | | | | 1.15% | | | | N/A | | | | (0.06% | ) |
Service Class | | | | | | | | | | | | | | | | | | | | | | | | | | | | | | | | | | | | | | | | | | | | | |
| 12/31/12 | | $ | 15.91 | | | $ | (0.10 | ) | | $ | 2.14 | | | $ | 2.04 | | | $ | (1.86 | ) | | $ | (1.86 | ) | | $ | 16.09 | | | | 13.07% | | | $ | 5,837 | | | | 1.38% | | | | 1.37 | %j | | | (0.63% | ) |
| 12/31/11 | | | 17.59 | | | | (0.16 | ) | | | (0.81 | ) | | | (0.97 | ) | | | (0.71 | ) | | | (0.71 | ) | | | 15.91 | | | | (5.43% | ) | | | 5,120 | | | | 1.38% | | | | N/A | | | | (0.92% | ) |
| 12/31/10 | | | 14.42 | | | | (0.14 | ) | | | 3.31 | | | | 3.17 | | | | - | | | | - | | | | 17.59 | | | | 21.90% | | | | 4,440 | | | | 1.39% | | | | N/A | | | | (0.87% | ) |
| 12/31/09 | | | 10.45 | | | | (0.11 | ) | | | 4.08 | | | | 3.97 | | | | - | | | | - | | | | 14.42 | | | | 38.09% | | | | 2,616 | | | | 1.40% | | | | N/A | | | | (0.91% | ) |
| 12/31/08g | | | 15.79 | | | | 0.01 | | | | (5.35 | ) | | | (5.34 | ) | | | - | | | | - | | | | 10.45 | | | | (33.82% | )b | | | 831 | | | | 1.43% | a | | | N/A | | | | 0.21% | a |
| | | | | | | | | | | | | | | | | | | | |
| | | Year ended December 31 | |
| | | 2012 | | | 2011 | | | 2010 | | | 2009 | | | 2008 | |
Portfolio turnover rate for all share classes | | | 90 | % | | | 91 | % | | | 95 | % | | | 90 | % | | | 86 | % |
| b | Percentage represents the results for the period and is not annualized. |
| c | Per share amount calculated on the average shares method. |
| g | For the period August 15, 2008 (commencement of operations) through December 31, 2008. |
| j | Computed after giving effect to an agreement by MassMutual to waive certain fees and expenses of the Fund. |
| m | Total return does not reflect expenses that apply at the separate account level or to related insurance products. Inclusion of these charges would reduce the total return figures for all periods shown. |
The accompanying notes are an integral part of the financial statements.
168
MML Series Investment Fund – Financial Statements (Continued)
Financial Highlights (For a share outstanding throughout each period)
MML Small Company Value Fund
| | | | | | | | | | | | | | | | | | | | | | | | | | | | | | | | | | | | | | | | | | | | | | | | | | | | |
| | | | | | Income (loss) from investment
operations | | | Less distributions to shareholders | | | | | | | | | Ratios / Supplemental Data | |
| | | Net
asset
value,
beginning
of the
period | | | Net
investment
income
(loss)c,j | | | Net
realized
and
unrealized
gain (loss)
on
investments | | | Total
income
(loss) from
investment
operations | | | From net
investment
income | | | From net
realized
gains | | | Total
distributions | | | Net
asset
value,
end of
the
period | | | Total
Returnm | | | Net
assets,
end of
the
period
(000’s) | | | Ratio of
expenses
to average
daily net
assets
before
expense
waivers | | | Ratio of
expenses
to average
daily net
assets
after
expense
waivers | | | Net
investment
income
(loss) to
average
daily net
assets | |
Class II | | | | | | | | | | | | | | | | | | | | | | | | | | | | | | | | | | | | | | | | | |
| 12/31/12 | | $ | 16.83 | | | $ | 0.19 | | | $ | 2.34 | | | $ | 2.53 | | | $ | (0.00 | )d | | $ | (0.50 | ) | | $ | (0.50 | ) | | $ | 18.86 | | | | 15.20% | | | $ | 114,274 | | | | 1.17% | | | | 1.15% | j | | | 1.05% | |
| 12/31/11 | | | 17.30 | | | | (0.01 | ) | | | (0.23 | ) | | | (0.24 | ) | | | - | | | | (0.23 | ) | | | (0.23 | ) | | | 16.83 | | | | (1.26% | ) | | | 102,633 | | | | 1.17% | | | | 1.15% | j | | | (0.06% | ) |
| 12/31/10 | | | 15.70 | | | | 0.06 | | | | 3.19 | | | | 3.25 | | | | (0.14 | ) | | | (1.51 | ) | | | (1.65 | ) | | | 17.30 | | | | 20.83% | | | | 105,829 | | | | 1.18% | | | | 1.15% | j | | | 0.34% | |
| 12/31/09g | | | 10.00 | | | | 0.05 | | | | 6.07 | | | | 6.12 | | | | (0.04 | ) | | | (0.38 | ) | | | (0.42 | ) | | | 15.70 | | | | 61.26% | b | | | 96,203 | | | | 1.26% | a | | | 1.15% | a,j | | | 0.41% | a |
Service Class I | | | | | | | | | | | | | | | | | | | | | | | | | | | | | | | | | | | | | | | | | |
| 12/31/12 | | $ | 16.73 | | | $ | 0.15 | | | $ | 2.32 | | | $ | 2.47 | | | $ | - | | | $ | (0.50 | ) | | $ | (0.50 | ) | | $ | 18.70 | | | | 14.99% | | | $ | 6,354 | | | | 1.42% | | | | 1.40% | j | | | 0.86% | |
| 12/31/11 | | | 17.24 | | | | (0.05 | ) | | | (0.23 | ) | | | (0.28 | ) | | | - | | | | (0.23 | ) | | | (0.23 | ) | | | 16.73 | | | | (1.56% | ) | | | 3,951 | | | | 1.42% | | | | 1.40% | j | | | (0.28% | ) |
| 12/31/10 | | | 15.67 | | | | 0.03 | | | | 3.18 | | | | 3.21 | | | | (0.13 | ) | | | (1.51 | ) | | | (1.64 | ) | | | 17.24 | | | | 20.59% | | | | 2,581 | | | | 1.43% | | | | 1.40% | j | | | 0.20% | |
| 12/31/09g | | | 10.00 | | | | 0.03 | | | | 6.04 | | | | 6.07 | | | | (0.02 | ) | | | (0.38 | ) | | | (0.40 | ) | | | 15.67 | | | | 60.83% | b | | | 677 | | | | 1.51% | a | | | 1.40% | a,j | | | 0.25% | a |
| | | | | | | | | | | | | | | | |
| | | Year ended December 31 | |
| | | 2012 | | | 2011 | | | 2010 | | | 2009 | |
Portfolio turnover rate for all share classes | | | 14 | % | | | 13 | % | | | 29 | % | | | 44 | %b |
| b | Percentage represents the results for the period and is not annualized. |
| c | Per share amount calculated on the average shares method. |
| d | Amount is less than $0.005 per share. |
| g | For the period February 27, 2009 (commencement of operations) through December 31, 2009. |
| j | Computed after giving effect to an agreement by MassMutual to waive certain fees and expenses of the Fund. |
| m | Total return does not reflect expenses that apply at the separate account level or to related insurance products. Inclusion of these charges would reduce the total return figures for all periods shown. |
The accompanying notes are an integral part of the financial statements.
169
MML Series Investment Fund – Financial Statements (Continued)
Financial Highlights (For a share outstanding throughout each period)
MML Small/Mid Cap Value Fund
| | | | | | | | | | | | | | | | | | | | | | | | | | | | | | | | | | | | | | | | | | | | |
| | | | | | Income (loss) from investment
operations | | | Less distributions to
shareholders | | | | | | | | | Ratios / Supplemental Data | |
| | | Net
asset
value,
beginning
of the
period | | | Net
investment
income
(loss)c | | | Net
realized
and
unrealized
gain (loss)
on
investments | | | Total
income
(loss) from
investment
operations | | | From net
investment
income | | | Total
distributions | | | Net
asset
value,
end of
the
period | | | Total
Returnm | | | Net
assets,
end of
the
period
(000’s) | | | Ratio of
expenses
to average
daily net
assets | | | Net
investment
income
(loss) to
average
daily net
assets | |
Initial Class | | | | | | | | | | | | | | | | | | | | | | | | | | | | | | | | | | | | | | | | | |
| 12/31/12 | | $ | 8.51 | | | $ | 0.08 | | | $ | 1.54 | | | $ | 1.62 | | | $ | (0.07 | ) | | $ | (0.07 | ) | | $ | 10.06 | | | | 19.06% | | | $ | 168,248 | | | | 0.81% | | | | 0.82% | |
| 12/31/11 | | | 9.26 | | | | 0.05 | | | | (0.75 | ) | | | (0.70 | ) | | | (0.05 | ) | | | (0.05 | ) | | | 8.51 | | | | (7.50% | ) | | | 170,925 | | | | 0.81% | | | | 0.53% | |
| 12/31/10 | | | 7.35 | | | | 0.05 | | | | 1.91 | | | | 1.96 | | | | (0.05 | ) | | | (0.05 | ) | | | 9.26 | | | | 26.84% | | | | 191,141 | | | | 0.81% | | | | 0.62% | |
| 12/31/09 | | | 5.21 | | | | 0.04 | | | | 2.18 | | | | 2.22 | | | | (0.08 | ) | | | (0.08 | ) | | | 7.35 | | | | 42.73% | | | | 178,318 | | | | 0.82% | | | | 0.69% | |
| 12/31/08 | | | 8.45 | | | | 0.08 | | | | (3.32 | ) | | | (3.24 | ) | | | - | | | | - | | | | 5.21 | | | | (38.34% | ) | | | 145,129 | | | | 0.81% | | | | 1.10% | |
Service Class | | | | | | | | | | | | | | | | | | | | | | | | | | | | | | | | | | | | | | | | | |
| 12/31/12 | | $ | 8.47 | | | $ | 0.06 | | | $ | 1.53 | | | $ | 1.59 | | | $ | (0.05 | ) | | $ | (0.05 | ) | | $ | 10.01 | | | | 18.78% | | | $ | 8,717 | | | | 1.06% | | | | 0.60% | |
| 12/31/11 | | | 9.22 | | | | 0.03 | | | | (0.74 | ) | | | (0.71 | ) | | | (0.04 | ) | | | (0.04 | ) | | | 8.47 | | | | (7.70% | ) | | | 7,067 | | | | 1.06% | | | | 0.30% | |
| 12/31/10 | | | 7.33 | | | | 0.03 | | | | 1.90 | | | | 1.93 | | | | (0.04 | ) | | | (0.04 | ) | | | 9.22 | | | | 26.44% | | | | 6,388 | | | | 1.06% | | | | 0.40% | |
| 12/31/09 | | | 5.21 | | | | 0.02 | | | | 2.18 | | | | 2.20 | | | | (0.08 | ) | | | (0.08 | ) | | | 7.33 | | | | 42.32% | | | | 3,806 | | | | 1.07% | | | | 0.40% | |
| 12/31/08g | | | 8.11 | | | | 0.03 | | | | (2.93 | ) | | | (2.90 | ) | | | - | | | | - | | | | 5.21 | | | | (35.76% | )b | | | 1,535 | | | | 1.07% | a | | | 1.79% | a |
| | | | | | | | | | | | | | | | | | | | |
| | | Year ended December 31 | |
| | | 2012 | | | 2011 | | | 2010 | | | 2009 | | | 2008 | |
Portfolio turnover rate for all share classes | | | 49 | % | | | 72 | % | | | 52 | % | | | 65 | % | | | 145 | % |
| b | Percentage represents the results for the period and is not annualized. |
| c | Per share amount calculated on the average shares method. |
| g | For the period August 15, 2008 (commencement of operations) through December 31, 2008. |
| m | Total return does not reflect expenses that apply at the separate account level or to related insurance products. Inclusion of these charges would reduce the total return figures for all periods shown. |
The accompanying notes are an integral part of the financial statements.
170
Notes to Financial Statements
MML Series Investment Fund (the “Trust”) is registered under the Investment Company Act of 1940, as amended (the “1940 Act”), as a no-load, open-end, management investment company. The Trust is organized under the laws of the Commonwealth of Massachusetts as a Massachusetts business trust pursuant to an Agreement and Declaration of Trust dated December 19, 1984, as restated May 14, 1993, and further amended and restated as of December 15, 2011, as it may be further amended from time to time. The following are 18 series of the Trust (each individually referred to as a “Fund” or collectively as the “Funds”):
MML Blue Chip Growth Fund (“Blue Chip Growth Fund”)
MML Equity Income Fund (“Equity Income Fund”)
MML Equity Index Fund (“Equity Index Fund”)
MML Focused Equity Fund (“Focused Equity Fund”)
MML Foreign Fund (“Foreign Fund”)
MML Fundamental Growth Fund (“Fundamental Growth Fund”)
MML Fundamental Value Fund (“Fundamental Value Fund”)
MML Global Fund (“Global Fund”)
MML Growth & Income Fund (“Growth & Income Fund”)
MML Income & Growth Fund (“Income & Growth Fund”)
MML Large Cap Growth Fund (“Large Cap Growth Fund”)
MML Large Cap Value Fund (“Large Cap Value Fund”)
MML Mid Cap Growth Fund (“Mid Cap Growth Fund”)
MML Mid Cap Value Fund (“Mid Cap Value Fund”)
MML PIMCO Total Return Fund (“PIMCO Total Return Fund”)
MML Small Cap Growth Equity Fund (“Small Cap Growth Equity Fund”)
MML Small Company Value Fund (“Small Company Value Fund”)
MML Small/Mid Cap Value Fund (“Small/Mid Cap Value Fund”)
The Trust makes shares of the Funds available for the investment of assets of various separate investment accounts established by Massachusetts Mutual Life Insurance Company (“MassMutual”) and by life insurance companies which are subsidiaries of MassMutual. Shares of the Trust are not offered to the general public. MassMutual, MML Bay State Life Insurance Company, and C.M. Life Insurance Company are the record owners of all of the outstanding shares of the Funds.
The following table shows the classes available for each Fund, including the date each class commenced operations. Each share class represents an interest in the same portfolio of assets. The principal difference among the classes is the level of service and administration fees, and shareholder and distribution service expenses borne by the classes. Because each class will have different fees and expenses, performance and share prices will vary between the classes. The classes of shares are offered to different types of investors, as outlined in the Funds’ Prospectus.
| | | | | | | | | | | | | | | | | | | | | | | | |
| | | Initial
Class | | | Class I | | | Class II | | | Class III | | | Service
Class | | | Service
Class I | |
Blue Chip Growth Fund | | | 5/1/2006 | | | | None | | | | None | | | | None | | | | 8/15/2008 | | | | None | |
Equity Income Fund | | | 5/1/2006 | | | | None | | | | None | | | | None | | | | 8/15/2008 | | | | None | |
Equity Index Fund | | | None | | | | 5/1/1997 | | | | 5/1/2000 | | | | 5/1/2000 | | | | None | | | | 8/15/2008 | |
Focused Equity Fund | | | None | | | | None | | | | 12/8/2011 | | | | None | | | | None | | | | 5/1/2012 | |
Foreign Fund | | | 5/1/2006 | | | | None | | | | None | | | | None | | | | 8/15/2008 | | | | None | |
Fundamental Growth Fund | | | None | | | | None | | | | 12/8/2011 | | | | None | | | | None | | | | 5/1/2012 | |
Fundamental Value Fund | | | None | | | | None | | | | 8/10/2010 | | | | None | | | | None | | | | 5/1/2012 | |
Global Fund | | | None | | | | 5/1/2006 | | | | 5/1/2006 | | | | None | | | | None | | | | 8/15/2008 | |
Growth & Income Fund | | | 5/1/2006 | | | | None | | | | None | | | | None | | | | 8/15/2008 | | | | None | |
Income & Growth Fund | | | 5/1/2006 | | | | None | | | | None | | | | None | | | | 8/15/2008 | | | | None | |
Large Cap Growth Fund | | | 5/1/2006 | | | | None | | | | None | | | | None | | | | 8/15/2008 | | | | None | |
Large Cap Value Fund | | | 5/1/2000 | | | | None | | | | None | | | | None | | | | 8/15/2008 | | | | None | |
171
Notes to Financial Statements (Continued)
| | | | | | | | | | | | | | | | | | | | | | | | |
| | | Initial
Class | | | Class I | | | Class II | | | Class III | | | Service
Class | | | Service
Class I | |
Mid Cap Growth Fund | | | 5/1/2006 | | | | None | | | | None | | | | None | | | | 8/15/2008 | | | | None | |
Mid Cap Value Fund | | | 5/1/2006 | | | | None | | | | None | | | | None | | | | 8/15/2008 | | | | None | |
PIMCO Total Return Fund | | | None | | | | None | | | | 8/10/2010 | | | | None | | | | None | | | | 5/1/2012 | |
Small Cap Growth Equity Fund | | | 5/3/1999 | | | | None | | | | None | | | | None | | | | 8/15/2008 | | | | None | |
Small Company Value Fund | | | None | | | | None | | | | 2/27/2009 | | | | None | | | | None | | | | 2/27/2009 | |
Small/Mid Cap Value Fund | | | 5/1/2006 | | | | None | | | | None | | | | None | | | | 8/15/2008 | | | | None | |
| 2. | | Significant Accounting Policies |
The following is a summary of significant accounting policies followed consistently by each Fund in the preparation of the financial statements in conformity with accounting principles generally accepted in the United States of America (“generally accepted accounting principles”). The preparation of the financial statements in accordance with generally accepted accounting principles requires management to make estimates and assumptions that affect the reported amounts and disclosures in the financial statements. Actual results could differ from those estimates.
Investment Valuation
The net asset value of each Fund’s shares is determined once daily as of the close of regular trading on the New York Stock Exchange, on each day the New York Stock Exchange is open for trading (a “business day”). The New York Stock Exchange normally closes at 4:00 p.m. Eastern Time, but may close earlier on some days.
Equity securities and derivative contracts that are actively traded on a national securities exchange or contract market are valued on the basis of information furnished by a pricing service, which provides the last reported sale price for securities or derivatives listed on the exchange or contract market or the official closing price on the NASDAQ National Market System, or in the case of over-the-counter (“OTC”) securities for which an official closing price is unavailable or not reported on the NASDAQ System, the last reported bid price. Portfolio securities traded on more than one national securities exchange are valued at the last price at the close of the exchange representing the principal market for such securities. Debt securities (other than short-term obligations) are valued on the basis of valuations furnished by a pricing service, which generally determines valuations taking into account factors such as institutional-size trading in similar securities, yield, quality, coupon rate, maturity, type of issue, trading characteristics, and other market data. Short-term debt securities are valued at either amortized cost or at original cost plus accrued interest, whichever the Funds’ investment adviser determines more closely approximates current market value. Shares of other open-end mutual funds are valued at their closing net asset values as reported on each business day.
Investments for which market quotations are readily available are marked to market daily based on those quotations. Market quotations may be provided by third-party vendors or market makers, and may be determined on the basis of a variety of factors, such as broker quotations, financial modeling, and other market data, such as market indexes and yield curves, counterparty information, and foreign exchange rates. U.S. Government and agency securities may be valued on the basis of market quotations or using a model that may incorporate market observable data such as reported sales of similar securities, broker quotes, yields, bids, offers, quoted market prices, and reference data. The fair values of OTC derivative contracts, including forward, swap, and option contracts related to interest rates, foreign currencies, credit standing of reference entities, equity prices, or commodity prices, may be based on market quotations or may be modeled using a series of techniques, including simulation models, depending on the contract and the terms of the transaction. The fair values of asset-backed securities and mortgage-backed securities are estimated based on models that consider the estimated cash flows of each debt tranche of the issuer, establish a benchmark yield, and develop an estimated tranche-specific spread to the benchmark yield based on the unique attributes of the tranche including, but not limited to, prepayment speed assumptions and attributes of the collateral. Many pricing models do not entail material subjectivity because the methodologies employed do not necessitate significant judgments and the pricing inputs are observed from actively quoted markets, as is the case of interest rate swap and option contracts. Restricted securities are generally valued at a discount to similar publicly traded securities.
Investments for which market quotations are not available or for which a pricing service or vendor does not provide a value, or for which such market quotations or values are considered by the investment adviser or subadviser to be unreliable (including, for
172
Notes to Financial Statements (Continued)
example, certain foreign securities, thinly-traded securities, certain restricted securities, certain initial public offerings, or securities whose values may have been affected by a significant event) are stated at fair valuations determined by the Funds’ Valuation Committee1 in accordance with procedures approved annually by the Board of Trustees (“Trustees”), and under the general oversight of the Trustees. The Funds’ Valuation Committee employs various methods to determine fair valuations including a regular review of key inputs and assumptions and review of any related market activity. The Funds’ Valuation Committee reports to the Trustees at their regularly scheduled meetings. It is possible that fair value prices will be used by the Funds to a significant extent. The value determined for an investment using the Funds’ fair value procedures may differ from recent market prices for the investment and may be significantly different from the value realized upon the sale of such investment.
The Funds may invest in securities that are traded principally in foreign markets and that trade on weekends and other days when the Funds do not price their shares. As a result, the values of the Funds’ portfolio securities may change on days when the prices of the Funds’ shares are not calculated. The prices of the Funds’ shares will reflect any such changes when the prices of the Funds’ shares are next calculated, which is the next business day. The Funds may use fair value pricing more frequently for securities primarily traded in foreign markets because, among other things, most foreign markets close well before the Funds value their securities. The earlier close of these foreign markets gives rise to the possibility that significant events, including broad market moves, may have occurred in the interim. The Funds’ investments may be priced based on fair values provided by a third-party fair valuation vendor, based on certain factors and methodologies applied by such vendor, in the event that there is movement in the U.S. market, between the close of the foreign market and the time the Funds calculate their net asset values. All assets and liabilities expressed in foreign currencies are converted into U.S. dollars at the mean between the buying and selling rates of such currencies against the U.S. dollar at the end of each business day.
Fair value is defined as the price that would be received to sell an asset or paid to transfer a liability in an orderly transaction between market participants at the measurement date. A three-tier hierarchy is utilized to maximize the use of observable market data inputs and minimize the use of unobservable inputs and to establish classification of fair value measurements for disclosure purposes. Inputs refer broadly to the assumptions that market participants would use in pricing the asset or liability, including assumptions about risk, for example, the risk inherent in a particular valuation technique used to measure fair value (such as a pricing model) and/or the risk inherent in the inputs to the valuation technique. Inputs may be observable or unobservable. Observable inputs are inputs that reflect the assumptions market participants would use in pricing the asset or liability and are developed based on market data obtained from sources independent of the reporting entity. Unobservable inputs are inputs that reflect the reporting entity’s own assumptions about the assumptions market participants would use in pricing the asset or liability and are developed based on the best information available in the circumstances. The three-tier hierarchy of inputs is summarized in the three broad Levels listed below. The inputs or methodology used for valuing investments are not necessarily an indication of the risk associated with investing in those investments and the determination of the significance of a particular input to the fair value measurement in its entirety requires judgment and consideration of factors specific to each security.
Level 1 – quoted prices (unadjusted) in active markets for identical investments that the Funds can access at the measurement date
The types of assets and liabilities categorized in Level 1 generally include actively traded domestic and certain foreign equity securities, derivatives actively traded on a national securities exchange (such as some warrants, rights, futures, and options), and shares of open-end mutual funds.
Level 2 – other significant observable inputs (including quoted prices for similar investments, interest rates, prepayment speeds, credit risk, etc.)
The types of assets and liabilities categorized in Level 2 generally include debt securities such as U.S. government and agency securities, mortgage-backed securities, asset-backed securities, municipal obligations, sovereign debt obligations, bank loans, corporate bonds, and those securities valued at amortized cost; OTC derivatives such as swaps, options, swaptions, and forward foreign currency exchange contracts; certain restricted securities; and non-exchange traded equity securities and certain foreign equity securities traded on particular foreign exchanges that close before the Funds determine their net asset values.
| 1 | The Valuation Committee consists of the President, Treasurer, Assistant Treasurers, Vice Presidents (except for the CCO), Secretary, and Assistant Secretaries of the Trust, as well as such alternate members as the Trustees may from time to time designate. The Valuation Committee reviews and makes recommendations concerning the fair valuation of portfolio securities and the Funds’ pricing procedures in general. |
173
Notes to Financial Statements (Continued)
Level 3 – significant unobservable inputs (including the Funds’ own assumptions in determining the fair value of investments)
The types of assets and liabilities categorized in Level 3 generally include securities for which prices, spreads, or any of the other aforementioned key inputs are unobservable. Generally, securities whose trading has been suspended or that have been de-listed from their current primary trading exchange; securities in default or bankruptcy proceedings for which there is no current market quotation; securities and certain derivatives valued by broker quotes which may include brokers’ assumptions; and any illiquid Rule 144A securities or restricted securities issued by non-public entities are categorized in Level 3.
The availability of observable inputs can vary from security to security and is affected by a wide variety of factors, including, for example, the type of security, whether the security is new and not yet established in the marketplace, the liquidity of markets, and other characteristics particular to the security. To the extent that valuation is based on models or inputs that are less observable or unobservable in the market, the determination of fair value requires more judgment. Accordingly, the degree of judgment exercised in determining fair value is greatest for instruments categorized in Level 3.
Changes in valuation techniques may result in transfers in or out of an investment’s assigned Level within the hierarchy. In addition, in periods of market dislocation, the observability of prices and inputs may be reduced for many instruments. This condition, as well as changes related to liquidity of investments, could cause a security to be reclassified between Level 1, Level 2, or Level 3.
In certain cases, the inputs used to measure fair value may fall into different levels of the fair value hierarchy. In such cases, for disclosure purposes the level in the fair value hierarchy within which the fair value measurement falls is determined based on the lowest level input that is significant to the overall fair value measurement.
The Equity Index Fund, Focused Equity Fund, Fundamental Growth Fund, Large Cap Growth Fund, and Small/Mid Cap Value Fund characterized all long-term investments at Level 1, and all short-term investments at Level 2, as of December 31, 2012. For each Fund noted in the preceding sentence, the level classification by major category of investments is the same as the category presentation in the Portfolio of Investments.
The following is the aggregate value by input level, as of December 31, 2012, for the remaining Funds’ investments:
Asset Valuation Inputs
| | | | | | | | | | | | | | | | |
| | | Investments in Securities | |
| | | Level 1 —
Quoted Prices | | | Level 2 —
Other
Significant
Observable
Inputs | | | Level 3 —
Significant
Unobservable
Inputs | | | Total | |
Blue Chip Growth Fund | | | | | | | | | | | | | | | | |
Equities | | | | | | | | | | | | | | | | |
Common Stock | | | | | | | | | | | | | | | | |
Basic Materials | | $ | 15,663,320 | | | $ | - | | | $ | - | | | $ | 15,663,320 | |
Communications | | | 69,844,971 | | | | 3,578,319 | | | | - | | | | 73,423,290 | |
Consumer, Cyclical | | | 52,032,479 | | | | - | | | | - | | | | 52,032,479 | |
Consumer, Non-cyclical | | | 55,738,249 | | | | - | | | | - | | | | 55,738,249 | |
Energy | | | 15,788,151 | | | | - | | | | - | | | | 15,788,151 | |
Financial | | | 29,129,501 | | | | - | | | | - | | | | 29,129,501 | |
Industrial | | | 40,557,601 | | | | - | | | | - | | | | 40,557,601 | |
Technology | | | 50,461,214 | | | | - | | | | - | | | | 50,461,214 | |
| | | | | | | | | | | | | | | | |
Total Common Stock | | | 329,215,486 | | | | 3,578,319 | | | | - | | | | 332,793,805 | |
| | | | | | | | | | | | | | | | |
Total Equities | | | 329,215,486 | | | | 3,578,319 | | | | - | | | | 332,793,805 | |
| | | | | | | | | | | | | | | | |
Total Mutual Funds | | | 1,000 | | | | - | | | | - | | | | 1,000 | |
| | | | | | | | | | | | | | | | |
| Total Long-Term Investments | | | 329,216,486 | | | | 3,578,319 | | | | - | | | | 332,794,805 | |
| | | | | | | | | | | | | | | | |
| Total Short-Term Investments | | | - | | | | 3,315,498 | | | | - | | | | 3,315,498 | |
| | | | | | | | | | | | | | | | |
| Total Investments | | $ | 329,216,486 | | | $ | 6,893,817 | | | $ | - | | | $ | 336,110,303 | |
| | | | | | | | | | | | | | | | |
174
Notes to Financial Statements (Continued)
| | | | | | | | | | | | | | | | |
| | | Investments in Securities | |
| | | Level 1 —
Quoted Prices | | | Level 2 —
Other
Significant
Observable
Inputs | | | Level 3 —
Significant
Unobservable
Inputs | | | Total | |
Equity Income Fund | | | | | | | | | | | | | | | | |
Equities | | | | | | | | | | | | | | | | |
Common Stock | | | | | | | | | | | | | | | | |
Basic Materials | | $ | 28,924,257 | | | $ | - | | | $ | - | | | $ | 28,924,257 | |
Communications | | | 53,181,983 | | | | 5,099,888 | | | | - | | | | 58,281,871 | |
Consumer, Cyclical | | | 34,095,047 | | | | - | | | | - | | | | 34,095,047 | |
Consumer, Non-cyclical | | | 56,699,786 | | | | - | | | | - | | | | 56,699,786 | |
Energy | | | 73,310,412 | | | | - | | | | - | | | | 73,310,412 | |
Financial | | | 100,433,993 | | | | - | | | | - | | | | 100,433,993 | |
Industrial | | | 82,735,007 | | | | - | | | | - | | | | 82,735,007 | |
Technology | | | 27,068,434 | | | | - | | | | - | | | | 27,068,434 | |
Utilities | | | 29,206,242 | | | | - | | | | - | | | | 29,206,242 | |
| | | | | | | | | | | | | | | | |
Total Common Stock | | | 485,655,161 | | | | 5,099,888 | | | | - | | | | 490,755,049 | |
| | | | | | | | | | | | | | | | |
Preferred Stock | | | | | | | | | | | | | | | | |
Consumer, Cyclical | | | 3,678,235 | | | | - | | | | - | | | | 3,678,235 | |
| | | | | | | | | | | | | | | | |
Total Preferred Stock | | | 3,678,235 | | | | - | | | | - | | | | 3,678,235 | |
| | | | | | | | | | | | | | | | |
Total Equities | | | 489,333,396 | | | | 5,099,888 | | | | - | | | | 494,433,284 | |
| | | | | | | | | | | | | | | | |
Total Mutual Funds | | | 1,064 | | | | - | | | | - | | | | 1,064 | |
| | | | | | | | | | | | | | | | |
| Total Long-Term Investments | | | 489,334,460 | | | | 5,099,888 | | | | - | | | | 494,434,348 | |
| | | | | | | | | | | | | | | | |
| Total Short-Term Investments | | | - | | | | 23,153,055 | | | | - | | | | 23,153,055 | |
| | | | | | | | | | | | | | | | |
| Total Investments | | $ | 489,334,460 | | | $ | 28,252,943 | | | $ | - | | | $ | 517,587,403 | |
| | | | | | | | | | | | | | | | |
| | | | |
Foreign Fund | | | | | | | | | | | | | | | | |
Equities | | | | | | | | | | | | | | | | |
Common Stock | | | | | | | | | | | | | | | | |
Basic Materials | | $ | 3,406,021 | | | $ | 8,507,150 | | | $ | - | | | $ | 11,913,171 | |
Communications | | | 13,317,768 | | | | 38,379,361 | | | | - | | | | 51,697,129 | |
Consumer, Cyclical | | | 5,177,240 | | | | 25,318,559 | | | | - | | | | 30,495,799 | |
Consumer, Non-cyclical | | | - | | | | 57,407,301 | | | | - | | | | 57,407,301 | |
Diversified | | | - | | | | 2,379,347 | | | | - | | | | 2,379,347 | |
Energy | | | 8,042,967 | | | | 31,222,933 | | | | - | | | | 39,265,900 | |
Financial | | | 11,343,184 | | | | 76,254,645 | | | | - | | | | 87,597,829 | |
Industrial | | | 4,678,685 | | | | 33,643,373 | | | | - | | | | 38,322,058 | |
Technology | | | 3,223,238 | | | | 21,575,232 | | | | - | | | | 24,798,470 | |
Utilities | | | - | | | | 6,039,180 | | | | - | | | | 6,039,180 | |
| | | | | | | | | | | | | | | | |
Total Common Stock | | | 49,189,103 | | | | 300,727,081 | | | | - | | | | 349,916,184 | |
| | | | | | | | | | | | | | | | |
Preferred Stock | | | | | | | | | | | | | | | | |
Basic Materials | | | 3,892,566 | | | | - | | | | - | | | | 3,892,566 | |
| | | | | | | | | | | | | | | | |
Total Preferred Stock | | | 3,892,566 | | | | - | | | | - | | | | 3,892,566 | |
| | | | | | | | | | | | | | | | |
Total Equities | | | 53,081,669 | | | | 300,727,081 | | | | - | | | | 353,808,750 | |
| | | | | | | | | | | | | | | | |
Rights | | | | | | | | | | | | | | | | |
Energy | | | 83,531 | | | | - | | | | - | | | | 83,531 | |
| | | | | | | | | | | | | | | | |
Total Rights | | | 83,531 | | | | - | | | | - | | | | 83,531 | |
| | | | | | | | | | | | | | | | |
Total Mutual Funds | | | 18,720,167 | | | | - | | | | - | | | | 18,720,167 | |
| | | | | | | | | | | | | | | | |
| Total Long-Term Investments | | | 71,885,367 | | | | 300,727,081 | | | | - | | | | 372,612,448 | |
| | | | | | | | | | | | | | | | |
| Total Short-Term Investments | | | - | | | | 15,959,493 | | | | - | | | | 15,959,493 | |
| | | | | | | | | | | | | | | | |
| Total Investments | | $ | 71,885,367 | | | $ | 316,686,574 | | | $ | - | | | $ | 388,571,941 | |
| | | | | | | | | | | | | | | | |
175
Notes to Financial Statements (Continued)
| | | | | | | | | | | | | | | | |
| | | Investments in Securities | |
| | | Level 1 —
Quoted Prices | | | Level 2 —
Other
Significant
Observable
Inputs | | | Level 3 —
Significant
Unobservable
Inputs | | | Total | |
Fundamental Value Fund | | | | | | | | | | | | | | | | |
Equities | | | | | | | | | | | | | | | | |
Common Stock | | | | | | | | | | | | | | | | |
Basic Materials | | $ | 9,820,660 | | | $ | - | | | $ | - | | | $ | 9,820,660 | |
Communications | | | 15,894,290 | | | | - | | | | - | | | | 15,894,290 | |
Consumer, Cyclical | | | 17,819,533 | | | | - | | | | - | | | | 17,819,533 | |
Consumer, Non-cyclical | | | 30,209,307 | | | | 2,402,528 | | | | - | | | | 32,611,835 | |
Energy | | | 23,994,991 | | | | - | | | | - | | | | 23,994,991 | |
Financial | | | 43,197,293 | | | | 1,672,872 | | | | - | | | | 44,870,165 | |
Industrial | | | 19,603,427 | | | | - | | | | - | | | | 19,603,427 | |
Technology | | | 11,059,691 | | | | - | | | | - | | | | 11,059,691 | |
Utilities | | | 5,367,342 | | | | - | | | | - | | | | 5,367,342 | |
| | | | | | | | | | | | | | | | |
Total Common Stock | | | 176,966,534 | | | | 4,075,400 | | | | - | | | | 181,041,934 | |
| | | | | | | | | | | | | | | | |
Total Equities | | | 176,966,534 | | | | 4,075,400 | | | | - | | | | 181,041,934 | |
| | | | | | | | | | | | | | | | |
| Total Long-Term Investments | | | 176,966,534 | | | | 4,075,400 | | | | - | | | | 181,041,934 | |
| | | | | | | | | | | | | | | | |
| Total Short-Term Investments | | | - | | | | 5,012,429 | | | | - | | | | 5,012,429 | |
| | | | | | | | | | | | | | | | |
| Total Investments | | $ | 176,966,534 | | | $ | 9,087,829 | | | $ | - | | | $ | 186,054,363 | |
| | | | | | | | | | | | | | | | |
| | | | |
Global Fund | | | | | | | | | | | | | | | | |
Equities | | | | | | | | | | | | | | | | |
Common Stock | | | | | | | | | | | | | | | | |
Basic Materials | | $ | 3,535,472 | | | $ | 11,131,772 | | | $ | - | | | $ | 14,667,244 | |
Communications | | | 7,727,935 | | | | 2,041,629 | | | | - | | | | 9,769,564 | |
Consumer, Cyclical | | | 7,820,568 | | | | 6,380,205 | | | | - | | | | 14,200,773 | |
Consumer, Non-cyclical | | | 13,423,429 | | | | 30,743,053 | | | | - | | | | 44,166,482 | |
Diversified | | | - | | | | 2,981,927 | | | | - | | | | 2,981,927 | |
Energy | | | 3,452,837 | | | | 939,286 | | | | - | | | | 4,392,123 | |
Financial | | | 10,748,166 | | | | 9,053,953 | | | | - | | | | 19,802,119 | |
Industrial | | | 19,755,966 | | | | 5,756,717 | | | | - | | | | 25,512,683 | |
Technology | | | 9,239,555 | | | | 3,459,145 | | | | - | | | | 12,698,700 | |
Utilities | | | - | | | | 450,399 | | | | - | | | | 450,399 | |
| | | | | | | | | | | | | | | | |
Total Common Stock | | | 75,703,928 | | | | 72,938,086 | | | | - | | | | 148,642,014 | |
| | | | | | | | | | | | | | | | |
Total Equities | | | 75,703,928 | | | | 72,938,086 | | | | - | | | | 148,642,014 | |
| | | | | | | | | | | | | | | | |
Total Mutual Funds | | | 2,879,151 | | | | - | | | | - | | | | 2,879,151 | |
| | | | | | | | | | | | | | | | |
| Total Long-Term Investments | | | 78,583,079 | | | | 72,938,086 | | | | - | | | | 151,521,165 | |
| | | | | | | | | | | | | | | | |
| Total Short-Term Investments | | | - | | | | 3,116,246 | | | | - | | | | 3,116,246 | |
| | | | | | | | | | | | | | | | |
| Total Investments | | $ | 78,583,079 | | | $ | 76,054,332 | | | $ | - | | | $ | 154,637,411 | |
| | | | | | | | | | | | | | | | |
176
Notes to Financial Statements (Continued)
| | | | | | | | | | | | | | | | |
| | | Investments in Securities | |
| | | Level 1 —
Quoted Prices | | | Level 2 —
Other
Significant
Observable
Inputs | | | Level 3 —
Significant
Unobservable
Inputs | | | Total | |
Growth & Income Fund | | | | | | | | | | | | | | | | |
Equities | | | | | | | | | | | | | | | | |
Common Stock | | | | | | | | | | | | | | | | |
Basic Materials | | $ | 2,840,591 | | | $ | 1,277,054 | | | $ | - | | | $ | 4,117,645 | |
Communications | | | 8,175,911 | | | | - | | | | - | | | | 8,175,911 | |
Consumer, Cyclical | | | 8,239,459 | | | | 1,573,227 | | | | - | | | | 9,812,686 | |
Consumer, Non-cyclical | | | 26,011,096 | | | | 5,914,268 | | | | - | | | | 31,925,364 | |
Diversified | | | - | | | | 1,368,534 | | | | - | | | | 1,368,534 | |
Energy | | | 13,403,700 | | | | - | | | | - | | | | 13,403,700 | |
Financial | | | 20,189,353 | | | | - | | | | - | | | | 20,189,353 | |
Industrial | | | 16,586,416 | | | | - | | | | - | | | | 16,586,416 | |
Technology | | | 17,921,545 | | | | - | | | | - | | | | 17,921,545 | |
Utilities | | | 3,969,282 | | | | - | | | | - | | | | 3,969,282 | |
| | | | | | | | | | | | | | | | |
Total Common Stock | | | 117,337,353 | | | | 10,133,083 | | | | - | | | | 127,470,436 | |
| | | | | | | | | | | | | | | | |
Total Equities | | | 117,337,353 | | | | 10,133,083 | | | | - | | | | 127,470,436 | |
| | | | | | | | | | | | | | | | |
| Total Long-Term Investments | | | 117,337,353 | | | | 10,133,083 | | | | - | | | | 127,470,436 | |
| | | | | | | | | | | | | | | | |
| Total Short-Term Investments | | | - | | | | 921,662 | | | | - | | | | 921,662 | |
| | | | | | | | | | | | | | | | |
| Total Investments | | $ | 117,337,353 | | | $ | 11,054,745 | | | $ | - | | | $ | 128,392,098 | |
| | | | | | | | | | | | | | | | |
| | | | |
Income & Growth Fund | | | | | | | | | | | | | | | | |
Equities | | | | | | | | | | | | | | | | |
Common Stock | | | | | | | | | | | | | | | | |
Basic Materials | | $ | 7,733,073 | | | $ | 4,835,111 | | | $ | - | | | $ | 12,568,184 | |
Communications | | | 14,909,618 | | | | - | | | | - | | | | 14,909,618 | |
Consumer, Cyclical | | | 13,683,330 | | | | - | | | | - | | | | 13,683,330 | |
Consumer, Non-cyclical | | | 32,313,813 | | | | 2,251,271 | | | | - | | | | 34,565,084 | |
Energy | | | 21,969,913 | | | | 531,431 | | | | - | | | | 22,501,344 | |
Financial | | | 29,405,153 | | | | - | | | | - | | | | 29,405,153 | |
Industrial | | | 26,559,359 | | | | - | | | | - | | | | 26,559,359 | |
Technology | | | 7,246,738 | | | | - | | | | - | | | | 7,246,738 | |
Utilities | | | 14,392,730 | | | | - | | | | - | | | | 14,392,730 | |
| | | | | | | | | | | | | | | | |
Total Common Stock | | | 168,213,727 | | | | 7,617,813 | | | | - | | | | 175,831,540 | |
| | | | | | | | | | | | | | | | |
Total Equities | | | 168,213,727 | | | | 7,617,813 | | | | - | | | | 175,831,540 | |
| | | | | | | | | | | | | | | | |
| Total Long-Term Investments | | | 168,213,727 | | | | 7,617,813 | | | | - | | | | 175,831,540 | |
| | | | | | | | | | | | | | | | |
| Total Short-Term Investments | | | - | | | | 7,087,150 | | | | - | | | | 7,087,150 | |
| | | | | | | | | | | | | | | | |
| Total Investments | | $ | 168,213,727 | | | $ | 14,704,963 | | | $ | - | | | $ | 182,918,690 | |
| | | | | | | | | | | | | | | | |
| | | | |
Large Cap Value Fund | | | | | | | | | | | | | | | | |
Equities | | | | | | | | | | | | | | | | |
Common Stock | | | | | | | | | | | | | | | | |
Basic Materials | | $ | 10,953,959 | | | $ | 2,862,313 | | | $ | - | + | | $ | 13,816,272 | |
Communications | | | 17,667,043 | | | | - | | | | - | | | | 17,667,043 | |
Consumer, Cyclical | | | 33,585,906 | | | | 686,659 | | | | - | | | | 34,272,565 | |
Consumer, Non-cyclical | | | 20,378,001 | | | | 2,792,476 | | | | - | | | | 23,170,477 | |
177
Notes to Financial Statements (Continued)
| | | | | | | | | | | | | | | | |
| | | Investments in Securities | |
| | | Level 1 —
Quoted Prices | | | Level 2 —
Other
Significant
Observable
Inputs | | | Level 3 —
Significant
Unobservable
Inputs | | | Total | |
Large Cap Value Fund (Continued) | | | | | | | | | | | | | | | | |
Diversified | | $ | - | | | $ | 2,747,961 | | | $ | - | | | $ | 2,747,961 | |
Energy | | | 20,742,165 | | | | - | | | | - | | | | 20,742,165 | |
Financial | | | 68,430,236 | | | | 8,352,535 | | | | - | | | | 76,782,771 | |
Industrial | | | 2,122,389 | | | | 2,555,716 | | | | - | | | | 4,678,105 | |
Technology | | | 9,550,193 | | | | - | | | | - | | | | 9,550,193 | |
| | | | | | | | | | | | | | | | |
Total Common Stock | | | 183,429,892 | | | | 19,997,660 | | | | - | | | | 203,427,552 | |
| | | | | | | | | | | | | | | | |
Total Equities | | | 183,429,892 | | | | 19,997,660 | | | | - | | | | 203,427,552 | |
| | | | | | | | | | | | | | | | |
Bonds & Notes | | | | | | | | | | | | | | | | |
Total Corporate Debt | | | - | | | | - | | | | 50,036 | | | | 50,036 | |
| | | | | | | | | | | | | | | | |
Total Bonds & Notes | | | - | | | | - | | | | 50,036 | | | | 50,036 | |
| | | | | | | | | | | | | | | | |
Total Mutual Funds | | | 2,152,531 | | | | - | | | | - | | | | 2,152,531 | |
| | | | | | | | | | | | | | | | |
| Total Long-Term Investments | | | 185,582,423 | | | | 19,997,660 | | | | 50,036 | | | | 205,630,119 | |
| | | | | | | | | | | | | | | | |
| Total Short-Term Investments | | | - | | | | 9,895,096 | | | | - | | | | 9,895,096 | |
| | | | | | | | | | | | | | | | |
| Total Investments | | $ | 185,582,423 | | | $ | 29,892,756 | | | $ | 50,036 | | | $ | 215,525,215 | |
| | | | | | | | | | | | | | | | |
| | | | |
Mid Cap Growth Fund | | | | | | | | | | | | | | | | |
Equities | | | | | | | | | | | | | | | | |
Common Stock | | | | | | | | | | | | | | | | |
Basic Materials | | $ | 11,574,003 | | | $ | - | | | $ | - | | | $ | 11,574,003 | |
Communications | | | 32,005,900 | | | | - | | | | 81,541 | | | | 32,087,441 | |
Consumer, Cyclical | | | 50,427,956 | | | | - | | | | - | | | | 50,427,956 | |
Consumer, Non-cyclical | | | 95,432,680 | | | | - | | | | - | | | | 95,432,680 | |
Energy | | | 19,977,030 | | | | - | | | | - | | | | 19,977,030 | |
Financial | | | 21,382,180 | | | | - | | | | - | | | | 21,382,180 | |
Industrial | | | 62,844,920 | | | | - | | | | - | | | | 62,844,920 | |
Technology | | | 46,254,950 | | | | - | | | | - | | | | 46,254,950 | |
Utilities | | | 5,167,051 | | | | - | | | | - | | | | 5,167,051 | |
| | | | | | | | | | | | | | | | |
Total Common Stock | | | 345,066,670 | | | | - | | | | 81,541 | | | | 345,148,211 | |
| | | | | | | | | | | | | | | | |
Preferred Stock | | | | | | | | | | | | | | | | |
Communications | | | - | | | | - | | | | 1,016,005 | | | | 1,016,005 | |
Technology | | | - | | | | 777,039 | | | | - | | | | 777,039 | |
| | | | | | | | | | | | | | | | |
Total Preferred Stock | | | - | | | | 777,039 | | | | 1,016,005 | | | | 1,793,044 | |
| | | | | | | | | | | | | | | | |
Total Equities | | | 345,066,670 | | | | 777,039 | | | | 1,097,546 | | | | 346,941,255 | |
| | | | | | | | | | | | | | | | |
Total Mutual Funds | | | 14,445,829 | | | | - | | | | - | | | | 14,445,829 | |
| | | | | | | | | | | | | | | | |
| Total Long-Term Investments | | | 359,512,499 | | | | 777,039 | | | | 1,097,546 | | | | 361,387,084 | |
| | | | | | | | | | | | | | | | |
| Total Short-Term Investments | | | - | | | | 7,779,361 | | | | - | | | | 7,779,361 | |
| | | | | | | | | | | | | | | | |
| Total Investments | | $ | 359,512,499 | | | $ | 8,556,400 | | | $ | 1,097,546 | | | $ | 369,166,445 | |
| | | | | | | | | | | | | | | | |
| | | | |
Mid Cap Value Fund | | | | | | | | | | | | | | | | |
Equities | | | | | | | | | | | | | | | | |
Common Stock | | | | | | | | | | | | | | | | |
Basic Materials | | $ | 8,330,032 | | | $ | - | | | $ | - | | | $ | 8,330,032 | |
Communications | | | 11,099,990 | | | | - | | | | - | | | | 11,099,990 | |
Consumer, Cyclical | | | 27,667,270 | | | | - | | | | - | | | | 27,667,270 | |
178
Notes to Financial Statements (Continued)
| | | | | | | | | | | | | | | | |
| | | Investments in Securities | |
| | | Level 1 —
Quoted Prices | | | Level 2 —
Other
Significant
Observable
Inputs | | | Level 3 —
Significant
Unobservable
Inputs | | | Total | |
Mid Cap Value Fund (Continued) | | | | | | | | | | | | | | | | |
Consumer, Non-cyclical | | $ | 88,429,415 | | | $ | - | | | $ | - | | | $ | 88,429,415 | |
Energy | | | 34,338,631 | | | | - | | | | - | | | | 34,338,631 | |
Financial | | | 113,692,872 | | | | - | | | | - | | | | 113,692,872 | |
Industrial | | | 70,598,332 | | | | 4,366,548 | | | | - | | | | 74,964,880 | |
Technology | | | 23,129,928 | | | | - | | | | - | | | | 23,129,928 | |
Utilities | | | 50,795,161 | | | | - | | | | - | | | | 50,795,161 | |
| | | | | | | | | | | | | | | | |
Total Common Stock | | | 428,081,631 | | | | 4,366,548 | | | | - | | | | 432,448,179 | |
| | | | | | | | | | | | | | | | |
Total Equities | | | 428,081,631 | | | | 4,366,548 | | | | - | | | | 432,448,179 | |
| | | | | | | | | | | | | | | | |
Total Mutual Funds | | | 16,036,909 | | | | - | | | | - | | | | 16,036,909 | |
| | | | | | | | | | | | | | | | |
| Total Long-Term Investments | | | 444,118,540 | | | | 4,366,548 | | | | - | | | | 448,485,088 | |
| | | | | | | | | | | | | | | | |
| Total Short-Term Investments | | | - | | | | 5,984,258 | | | | - | | | | 5,984,258 | |
| | | | | | | | | | | | | | | | |
| Total Investments | | $ | 444,118,540 | | | $ | 10,350,806 | | | $ | - | | | $ | 454,469,346 | |
| | | | | | | | | | | | | | | | |
| | | | |
PIMCO Total Return Fund | | | | | | | | | | | | | | | | |
Equities | | | | | | | | | | | | | | | | |
Preferred Stock | | | | | | | | | | | | | | | | |
Financial | | $ | 1,172,600 | | | $ | - | | | $ | - | | | $ | 1,172,600 | |
| | | | | | | | | | | | | | | | |
Total Preferred Stock | | | 1,172,600 | | | | - | | | | - | | | | 1,172,600 | |
| | | | | | | | | | | | | | | | |
Total Equities | | | 1,172,600 | | | | - | | | | - | | | | 1,172,600 | |
| | | | | | | | | | | | | | | | |
Bonds & Notes | | | | | | | | | | | | | | | | |
Total Bank Loans | | | - | | | | 993,390 | | | | - | | | | 993,390 | |
| | | | | | | | | | | | | | | | |
Total Corporate Debt | | | - | | | | 75,355,990 | | | | 6,444,760 | | | | 81,800,750 | |
| | | | | | | | | | | | | | | | |
Total Municipal Obligations | | | - | | | | 12,520,001 | | | | - | | | | 12,520,001 | |
| | | | | | | | | | | | | | | | |
Non-U.S. Government Agency Obligations | | | | | | | | | | | | | | | | |
Automobile ABS | | | - | | | | 136,245 | | | | - | | | | 136,245 | |
Commercial MBS | | | - | | | | 6,162,520 | | | | - | | | | 6,162,520 | |
Credit Card ABS | | | - | | | | 622,593 | | | | - | | | | 622,593 | |
Other ABS | | | - | | | | 3,873,604 | | | | - | | | | 3,873,604 | |
WL Collateral CMO | | | - | | | | 7,309,649 | | | | - | | | | 7,309,649 | |
| | | | | | | | | | | | | | | | |
Total Non-U.S. Government Agency Obligations | | | - | | | | 18,104,611 | | | | - | | | | 18,104,611 | |
| | | | | | | | | | | | | | | | |
Total Sovereign Debt Obligations | | | - | | | | 29,306,664 | | | | - | | | | 29,306,664 | |
| | | | | | | | | | | | | | | | |
U.S. Government Agency Obligations and Instrumentalities | | | | | | | | | | | | | | | | |
Pass-Through Securities | | | - | | | | 160,319,526 | | | | - | | | | 160,319,526 | |
| | | | | | | | | | | | | | | | |
Total U.S. Government Agency Obligations and Instrumentalities | | | - | | | | 160,319,526 | | | | - | | | | 160,319,526 | |
| | | | | | | | | | | | | | | | |
U.S. Treasury Obligations | | | | | | | | | | | | | | | | |
U.S. Treasury Bonds & Notes | | | - | | | | 103,271,590 | | | | - | | | | 103,271,590 | |
| | | | | | | | | | | | | | | | |
Total U.S. Treasury Obligations | | | - | | | | 103,271,590 | | | | - | | | | 103,271,590 | |
| | | | | | | | | | | | | | | | |
| Total Long-Term Investments | | | 1,172,600 | | | | 399,871,772 | | | | 6,444,760 | | | | 407,489,132 | |
| | | | | | | | | | | | | | | | |
| Total Short-Term Investments | | | - | | | | 7,178,402 | | | | - | | | | 7,178,402 | |
| | | | | | | | | | | | | | | | |
| Total Investments | | $ | 1,172,600 | | | $ | 407,050,174 | | | $ | 6,444,760 | | | $ | 414,667,534 | |
| | | | | | | | | | | | | | | | |
179
Notes to Financial Statements (Continued)
| | | | | | | | | | | | | | | | |
| | | Investments in Securities | |
| | | Level 1 —
Quoted Prices | | | Level 2 —
Other
Significant
Observable
Inputs | | | Level 3 —
Significant
Unobservable
Inputs | | | Total | |
Small Cap Growth Equity Fund | | | | | | | | | | | | | | | | |
Equities | | | | | | | | | | | | | | | | |
Common Stock | | | | | | | | | | | | | | | | |
Basic Materials | | $ | 7,586,420 | | | $ | - | | | $ | - | | | $ | 7,586,420 | |
Communications | | | 23,844,680 | | | | - | | | | 111,557 | | | | 23,956,237 | |
Consumer, Cyclical | | | 41,064,267 | | | | - | | | | - | | | | 41,064,267 | |
Consumer, Non-cyclical | | | 51,355,030 | | | | 972,531 | | | | - | | | | 52,327,561 | |
Energy | | | 20,468,339 | | | | - | | | | - | | | | 20,468,339 | |
Financial | | | 35,329,244 | | | | - | | | | - | | | | 35,329,244 | |
Industrial | | | 39,162,481 | | | | - | | | | - | | | | 39,162,481 | |
Technology | | | 34,333,867 | | | | - | | | | - | | | | 34,333,867 | |
Utilities | | | 846,080 | | | | - | | | | - | | | | 846,080 | |
| | | | | | | | | | | | | | | | |
Total Common Stock | | | 253,990,408 | | | | 972,531 | | | | 111,557 | | | | 255,074,496 | |
| | | | | | | | | | | | | | | | |
Total Equities | | | 253,990,408 | | | | 972,531 | | | | 111,557 | | | | 255,074,496 | |
| | | | | | | | | | | | | | | | |
Total Mutual Funds | | | 26,008,772 | | | | - | | | | - | | | | 26,008,772 | |
| | | | | | | | | | | | | | | | |
| Total Long-Term Investments | | | 279,999,180 | | | | 972,531 | | | | 111,557 | | | | 281,083,268 | |
| | | | | | | | | | | | | | | | |
| Total Short-Term Investments | | | - | | | | 5,076,574 | | | | - | | | | 5,076,574 | |
| | | | | | | | | | | | | | | | |
| Total Investments | | $ | 279,999,180 | | | $ | 6,049,105 | | | $ | 111,557 | | | $ | 286,159,842 | |
| | | | | | | | | | | | | | | | |
| | | | |
Small Company Value Fund | | | | | | | | | | | | | | | | |
Equities | | | | | | | | | | | | | | | | |
Common Stock | | | | | | | | | | | | | | | | |
Basic Materials | | $ | 11,938,997 | | | $ | - | | | $ | - | | | $ | 11,938,997 | |
Communications | | | 3,823,969 | | | | - | | | | - | | | | 3,823,969 | |
Consumer, Cyclical | | | 15,288,057 | | | | - | | | | - | | | | 15,288,057 | |
Consumer, Non-cyclical | | | 12,028,904 | | | | - | | | | - | | | | 12,028,904 | |
Energy | | | 5,607,052 | | | | - | | | | - | | | | 5,607,052 | |
Financial | | | 25,552,096 | | | | - | | | | - | | | | 25,552,096 | |
Industrial | | | 32,762,486 | | | | - | | | | - | | | | 32,762,486 | |
Technology | | | 4,778,517 | | | | - | | | | - | | | | 4,778,517 | |
Utilities | | | 4,992,580 | | | | - | | | | - | | | | 4,992,580 | |
| | | | | | | | | | | | | | | | |
Total Common Stock | | | 116,772,658 | | | | - | | | | - | | | | 116,772,658 | |
| | | | | | | | | | | | | | | | |
Convertible Preferred Stock | | | | | | | | | | | | | | | | |
Financial | | | - | | | | 150,500 | | | | - | | | | 150,500 | |
| | | | | | | | | | | | | | | | |
Total Convertible Preferred Stock | | | - | | | | 150,500 | | | | - | | | | 150,500 | |
| | | | | | | | | | | | | | | | |
Total Equities | | | 116,772,658 | | | | 150,500 | | | | - | | | | 116,923,158 | |
| | | | | | | | | | | | | | | | |
Total Mutual Funds | | | 3,037,932 | | | | - | | | | - | | | | 3,037,932 | |
| | | | | | | | | | | | | | | | |
| Total Long-Term Investments | | | 119,810,590 | | | | 150,500 | | | | - | | | | 119,961,090 | |
| | | | | | | | | | | | | | | | |
| Total Short-Term Investments | | | - | | | | 3,371,980 | | | | - | | | | 3,371,980 | |
| | | | | | | | | | | | | | | | |
| Total Investments | | $ | 119,810,590 | | | $ | 3,522,480 | | | $ | - | | | $ | 123,333,070 | |
| | | | | | | | | | | | | | | | |
| + | Represents security at $0 value as of December 31, 2012. |
180
Notes to Financial Statements (Continued)
The following is the aggregate value by input level, as of December 31, 2012, for the Funds’ other financial instruments:
Asset Valuation Inputs
| | | | | | | | | | | | | | | | |
| | | Other Financial Instruments | |
| | | Level 1 —
Quoted
Prices | | | Level 2 —
Other
Significant
Observable
Inputs | | | Level 3 —
Significant
Unobservable
Inputs | | | Total | |
Equity Index Fund | | | | | | | | | | | | | | | | |
Futures Contracts | | | | | | | | | | | | | | | | |
Equity Risk | | $ | 3,535 | | | $ | - | | | $ | - | | | $ | 3,535 | |
Mid Cap Value Fund | | | | | | | | | | | | | | | | |
Forward Contracts | | | | | | | | | | | | | | | | |
Foreign Exchange Risk | | | - | | | | 21,066 | | | | - | | | | 21,066 | |
PIMCO Total Return Fund | | | | | | | | | | | | | | | | |
Forward Contracts | | | | | | | | | | | | | | | | |
Foreign Exchange Risk | | | - | | | | 148,148 | | | | - | | | | 148,148 | |
Futures Contracts | | | | | | | | | | | | | | | | |
Interest Rate Risk | | | 70,958 | | | | - | | | | - | | | | 70,958 | |
Swap Agreements | | | | | | | | | | | | | | | | |
Credit Risk | | | - | | | | 293,548 | | | | - | | | | 293,548 | |
Interest Rate Risk | | | - | | | | 629,190 | | | | - | | | | 629,190 | |
Liability Valuation Inputs | |
| |
| | | Other Financial Instruments | |
| | | Level 1 —
Quoted
Prices | | | Level 2 —
Other
Significant
Observable
Inputs | | | Level 3 —
Significant
Unobservable
Inputs | | | Total | |
Mid Cap Value Fund | | | | | | | | | | | | | | | | |
Forward Contracts | | | | | | | | | | | | | | | | |
Foreign Exchange Risk | | $ | - | | | $ | (6,386 | ) | | $ | - | | | $ | (6,386 | ) |
PIMCO Total Return Fund | | | | | | | | | | | | | | | | |
Forward Contracts | | | | | | | | | | | | | | | | |
Foreign Exchange Risk | | | - | | | | (708,669 | ) | | | - | | | | (708,669 | ) |
Futures Contracts | | | | | | | | | | | | | | | | |
Interest Rate Risk | | | (27,059 | ) | | | - | | | | - | | | | (27,059 | ) |
Swap Agreements | | | | | | | | | | | | | | | | |
Credit Risk | | | - | | | | (94,323 | ) | | | - | | | | (94,323 | ) |
Written Options | | | | | | | | | | | | | | | | |
Interest Rate Risk | | | - | | | | (1,044 | ) | | | - | | | | (1,044 | ) |
The asset and liability shown in the Statement of Assets and Liabilities related to investments sold and purchased on a when-issued basis for the PIMCO Total Return Fund, approximates fair value, which would be categorized at Level 2, as of December 31, 2012. The liabilities shown in the Statements of Assets and Liabilities related to securities on loan for the Foreign Fund, Global Fund, Large Cap Value Fund, Mid Cap Growth Fund, Small Cap Growth Equity Fund, and Small Company Value Fund, approximate fair value, which would be categorized at Level 2, as of December 31, 2012. The asset and liability shown in the Statement of Assets and Liabilities related to collateral held and pledged for open swap agreements for the PIMCO Total Return Fund, approximates fair value, which would be categorized at Level 2, as of December 31, 2012. The asset shown in the Statement of Assets and Liabilities related to collateral held for open futures contracts for the PIMCO Total Return Fund, approximates fair value, which would be categorized at Level 2, as of December 31, 2012.
181
Notes to Financial Statements (Continued)
The Funds had no transfers between Level 1 and Level 2 of the fair value hierarchy during the year ended December 31, 2012. The Funds recognize transfers between the Levels as of the beginning of the year.
Following is a reconciliation of investments for which significant unobservable inputs (Level 3) were used in determining value:
Asset Valuation Inputs
| | | | | | | | | | | | | | | | | | | | | | | | | | | | | | | | | | | | | | | | |
| | | Investments in Securities | |
| | | Balance
as of
12/31/11 | | | Accrued
Discounts
(Premiums) | | | Realized
Gain
(Loss) | | | Change in
Unrealized
Appreciation
(Depreciation) | | | Purchases | | | (Sales) | | | Transfers
into
Level 3* | | | Transfers
(out) of
Level 3* | | | Balance
as of
12/31/12 | | | Net Change
in Unrealized
Appreciation
(Depreciation)
from
Investments
Still Held
as of
12/31/12 | |
Blue Chip Growth Fund | | | | | | | | | | | | | | | | | | | | | | | | | | | | | | | | | |
Long-Term Investments Equities | | | | | | | | | | | | | | | | | | | | | | | | | | | | | | | | | | | | | | | | |
Common Stock | | | | | | | | | | | | | | | | | | | | | | | | | | | | | | | | | | | | | | | | |
Communications | | $ | 2,428,726 | | | $ | - | | | $ | - | | | $ | - | | | $ | - | | | $ | - | | | $ | - | | | $ | (2,428,726 | )‡ | | $ | - | | | $ | - | |
| | | | | | | | | | | | | | | | | | | | | | | | | | | | | | | | | | | | | | | | |
Large Cap Value Fund | | | | | | | | | | | | | | | | | | | | | | | | | | | | | | | | | |
| Long-Term Investments | | | | | | | | | | | | | | | | | | | | | | | | | | | | | | | | | | | | | | | | |
Equities | | | | | | | | | | | | | | | | | | | | | | | | | | | | | | | | | | | | | | | | |
Common Stock | | | | | | | | | | | | | | | | | | | | | | | | | | | | | | | | | | | | | | | | |
Basic Materials | | $ | 1,321 | | | $ | - | | | $ | - | | | $ | (1,321 | ) | | $ | - | | | $ | - | | | $ | - | | | $ | - | | | $ | - | ** | | $ | (1,321 | ) |
Bonds & Notes | | | | | | | | | | | | | | | | | | | | | | | | | | | | | | | | | | | | | | | | |
Corporate Debt† | | | 93,340 | | | | - | | | | - | | | | (43,304 | ) | | | - | | | | - | | | | - | | | | - | | | | 50,036 | | | | (43,304 | ) |
| | | | | | | | | | | | | | | | | | | | | | | | | | | | | | | | | | | | | | | | |
| | $ | 94,661 | | | $ | - | | | $ | - | | | $ | (44,625 | ) | | $ | - | | | $ | - | | | $ | - | | | $ | - | | | $ | 50,036 | | | $ | (44,625 | ) |
| | | | | | | | | | | | | | | | | | | | | | | | | | | | | | | | | | | | | | | | |
Mid Cap Growth Fund | | | | | | | | | | | | | | | | | | | | | | | | | | | | | | | | | |
| Long-Term Investments | | | | | | | | | | | | | | | | | | | | | | | | | | | | | | | | | | | | | | | | |
Equities | | | | | | | | | | | | | | | | | | | | | | | | | | | | | | | | | | | | | | | | |
Common Stock | | | | | | | | | | | | | | | | | | | | | | | | | | | | | | | | | | | | | | | | |
Communications | | $ | - | | | $ | - | | | $ | - | | | $ | - | | | $ | 81,541 | | | $ | - | | | $ | - | | | $ | - | | | $ | 81,541 | | | $ | - | |
Preferred Stock | | | | | | | | | | | | | | | | | | | | | | | | | | | | | | | | | | | | | | | | |
Communications | | | 1,960,544 | | | | - | | | | - | | | | (1,543,182 | ) | | | 598,643 | | | | - | | | | - | | | | - | | | | 1,016,005 | | | | (1,543,182 | ) |
| | | | | | | | | | | | | | | | | | | | | | | | | | | | | | | | | | | | | | | | |
| | $ | 1,960,544 | | | $ | - | | | $ | - | | | $ | (1,543,182 | ) | | $ | 680,184 | | | $ | - | | | $ | - | | | $ | - | | | $ | 1,097,546 | | | $ | (1,543,182 | ) |
| | | | | | | | | | | | | | | | | | | | | | | | | | | | | | | | | | | | | | | | |
PIMCO Total Return Fund | | | | | | | | | | | | | | | | | | | | | | | | | | | | | | | | | |
| Long-Term Investments | | | | | | | | | | | | | | | | | | | | | | | | | | | | | | | | | | | | | | | | |
Bonds & Notes | | | | | | | | | | | | | | | | | | | | | | | | | | | | | | | | | | | | | | | | |
Corporate Debt† | | $ | 77,269 | | | $ | - | | | $ | - | | | $ | 664,818 | | | $ | - | | | $ | - | | | $ | 5,779,942 | *** | | $ | (77,269 | )*** | | $ | 6,444,760 | | | $ | 664,818 | |
| | | | | | | | | | | | | | | | | | | | | | | | | | | | | | | | | | | | | | | | |
Small Cap Growth Equity Fund | | | | | | | | | | | | | | | | | | | | | | | | | | | | | | | | | |
| Long-Term Investments | | | | | | | | | | | | | | | | | | | | | | | | | | | | | | | | | | | | | | | | |
Equities | | | | | | | | | | | | | | | | | | | | | | | | | | | | | | | | | | | | | | | | |
Common Stock | | | | | | | | | | | | | | | | | | | | | | | | | | | | | | | | | | | | | | | | |
Communications | | $ | - | | | $ | - | | | $ | - | | | $ | (34 | ) | | $ | 111,591 | | | $ | - | | | $ | - | | | $ | - | | | $ | 111,557 | | | $ | (34 | ) |
| | | | | | | | | | | | | | | | | | | | | | | | | | | | | | | | | | | | | | | | |
| * | The Fund(s) recognize transfers between the Levels as of the beginning of the year. |
| ** | Represents securities at $0 value as of December 31, 2012. |
| *** | Transfers occurred between Level 3 and Level 2 as a result of changes in liquidity. |
| † | Represents (i) an illiquid 144A security valued by a broker quote or vendor price or (ii) a restricted security issued by a non-public entity valued by a broker quote or vendor price. |
| ‡ | Transfers occurred between Level 3 and Level 2 as a result of securities receiving a price directly from a pricing service rather than being fair valued. |
None of the unobservable inputs, individually or collectively, had a material impact on the Fund(s).
182
Notes to Financial Statements (Continued)
Derivative Instruments
Derivatives are financial instruments whose values are based on the values of one or more indicators, such as a security, asset, currency, interest rate, or index. Derivative transactions can create investment leverage and may be highly volatile. It is possible that a derivative transaction will result in a loss greater than the principal amount invested. A Fund may not be able to close out a derivative transaction at a favorable time or price. For those Funds that held derivatives during the year ended December 31, 2012, the following table shows how the Fund used these derivatives during the period (marked with an “A”), as well as additional uses, if any, it may have for them in the future (marked with an “M”).
| | | | | | | | | | | | | | | | | | |
Type of Derivative and
Objective for Use | | Blue Chip Growth Fund | | Equity
Income
Fund | | Equity
Index
Fund | | Foreign
Fund | | Global
Fund | | Large Cap Value Fund | | Mid Cap Growth Fund | | Mid Cap
Value
Fund | | PIMCO
Total
Return
Fund |
Foreign Currency Exchange Transactions* | | | | | | | | | | | | | | | | | | |
Hedging/Risk Management | | | | | | | | | | | | | | | | A | | A |
Directional Exposures to Currencies | | | | | | | | | | | | | | | | | | A |
| | | | | | | | | | |
Futures Contracts** | | | | | | | | | | | | | | | | | | |
Hedging/Risk Management | | | | | | | | | | | | | | | | | | A |
Duration/Credit Quality Management | | | | | | | | | | | | | | | | | | A |
Substitution for Direct Investment | | | | | | A | | | | | | | | | | | | A |
| | | | | | | | | | |
Interest Rate Swaps*** | | | | | | | | | | | | | | | | | | |
Hedging/Risk Management | | | | | | | | | | | | | | | | | | A |
Duration Management | | | | | | | | | | | | | | | | | | A |
Substitution for Direct Investment | | | | | | | | | | | | | | | | | | A |
| | | | | | | | | | |
Credit Default Swaps (Protection Buyer) | | | | | | | | | | | | | | | | | | |
Hedging/Risk Management | | | | | | | | | | | | | | | | | | A |
Duration/Credit Quality Management | | | | | | | | | | | | | | | | | | A |
Substitution for Direct Investment | | | | | | | | | | | | | | | | | | A |
| | | | | | | | | | |
Credit Default Swaps (Protection Seller) | | | | | | | | | | | | | | | | | | |
Hedging/Risk Management | | | | | | | | | | | | | | | | | | A |
183
Notes to Financial Statements (Continued)
| | | | | | | | | | | | | | | | | | |
Type of Derivative and
Objective for Use | | Blue Chip Growth Fund | | Equity
Income
Fund | | Equity
Index
Fund | | Foreign
Fund | | Global
Fund | | Large Cap Value Fund | | Mid Cap Growth Fund | | Mid Cap
Value
Fund | | PIMCO
Total
Return
Fund |
| | | | | | | | | | |
Credit Default Swaps (Protection Seller) (Continued) | | | | | | | | | | | | | | | | | | |
Duration/Credit Quality Management | | | | | | | | | | | | | | | | | | A |
Income | | | | | | | | | | | | | | | | | | A |
Substitution for Direct Investment | | | | | | | | | | | | | | | | | | A |
| | | | | | | | | | |
Options (Purchased) | | | | | | | | | | | | | | | | | | |
Hedging/Risk Management | | | | | | | | | | | | | | | | | | A |
Duration/Credit Quality Management | | | | | | | | | | | | | | | | | | A |
Directional Investment | | | | | | | | | | | | | | | | | | M |
Substitution for Direct Investment | | | | | | | | | | | | | | | | | | A |
| | | | | | | | | | |
Options (Written) | | | | | | | | | | | | | | | | | | |
Hedging/Risk Management | | | | | | | | | | | | | | | | | | A |
Duration/Credit Quality Management | | | | | | | | | | | | | | | | | | A |
Income | | | | | | | | | | | | | | | | | | A |
| | | | | | | | | | |
Rights and Warrants | | | | | | | | | | | | | | | | | | |
Result of a Corporate Action | | A | | A | | A | | A | | A | | A | | A | | | | |
| * | Includes any options purchased or written, futures contracts, forward contracts, and swap agreements, if applicable. |
| ** | Includes any options purchased or written on futures contracts, if applicable. |
| *** | Includes any caps, floors, and collars, and related purchased or written options, if applicable. |
At December 31, 2012, and during the year then ended, the Fund(s) had the following derivatives and transactions in derivatives, grouped into the indicated risk categories:
| | | | | | | | | | | | | | | | | | | | |
| | | Credit
Risk | | | Equity
Risk | | | Foreign
Exchange
Risk | | | Interest
Rate
Risk | | | Total | |
| Blue Chip Growth Fund | | | | | | | | | | | | | | | | | | | | |
| Realized Gain (Loss)# | | | | | | | | | | | | | | | | | | | | |
Rights | | $ | - | | | $ | 3,254 | | | $ | - | | | $ | - | | | $ | 3,254 | |
| | | | | | | | | | | | | | | | | | | | |
Number of Contracts, Notional Amounts or
Shares/Units† | | | | | | | | | | | | | | | | | | | | |
Rights | | | - | | | | 448 | | | | - | | | | - | | | | 448 | |
184
Notes to Financial Statements (Continued)
| | | | | | | | | | | | | | | | | | | | |
| | | Credit
Risk | | | Equity
Risk | | | Foreign
Exchange
Risk | | | Interest
Rate
Risk | | | Total | |
| Equity Income Fund | | | | | | | | | | | | | | | | | | | | |
| Realized Gain (Loss)# | | | | | | | | | | | | | | | | | | | | |
Rights | | $ | - | | | $ | (2 | ) | | $ | - | | | $ | - | | | $ | (2 | ) |
| | | | | | | | | | | | | | | | | | | | |
Number of Contracts, Notional Amounts or
Shares/Units† | | | | | | | | | | | | | | | | | | | | |
Rights | | | - | | | | 112,513 | | | | - | | | | - | | | | 112,513 | |
| | | | | |
| Equity Index Fund | | | | | | | | | | | | | | | | | | | | |
| Asset Derivatives | | | | | | | | | | | | | | | | | | | | |
Futures Contracts^^ | | $ | - | | | $ | 3,535 | | | $ | - | | | $ | - | | | $ | 3,535 | |
| | | | | | | | | | | | | | | | | | | | |
| Realized Gain (Loss)# | | | | | | | | | | | | | | | | | | | | |
Futures Contracts | | $ | - | | | $ | 551,948 | | | $ | - | | | $ | - | | | $ | 551,948 | |
Warrants | | | - | | | | (9,940 | ) | | | - | | | | - | | | | (9,940 | ) |
| | | | | | | | | | | | | | | | | | | | |
Total Realized Gain (Loss) | | $ | - | | | $ | 542,008 | | | $ | - | | | $ | - | | | $ | 542,008 | |
| | | | | | | | | | | | | | | | | | | | |
| Change in Appreciation (Depreciation)## | | | | | | | | | | | | | | | | | | | | |
Futures Contracts | | $ | - | | | $ | (34,346 | ) | | $ | - | | | $ | - | | | $ | (34,346 | ) |
| | | | | | | | | | | | | | | | | | | | |
Number of Contracts, Notional Amounts or
Shares/Units† | | | | | | | | | | | | | | | | | | | | |
Futures Contracts | | | - | | | | 70 | | | | - | | | | - | | | | 70 | |
Warrants | | | - | | | | 12,167 | | | | - | | | | - | | | | 12,167 | |
| | | | | |
| Foreign Fund | | | | | | | | | | | | | | | | | | | | |
| Asset Derivatives | | | | | | | | | | | | | | | | | | | | |
Rights* | | $ | - | | | $ | 83,531 | | | $ | - | | | $ | - | | | $ | 83,531 | |
| | | | | | | | | | | | | | | | | | | | |
| Realized Gain (Loss)# | | | | | | | | | | | | | | | | | | | | |
Rights | | $ | - | | | $ | (11,376 | ) | | $ | - | | | $ | - | | | $ | (11,376 | ) |
| | | | | | | | | | | | | | | | | | | | |
| Change in Appreciation (Depreciation)## | | | | | | | | | | | | | | | | | | | | |
Rights | | $ | - | | | $ | (2,135 | ) | | $ | - | | | $ | - | | | $ | (2,135 | ) |
| | | | | | | | | | | | | | | | | | | | |
Number of Contracts, Notional Amounts or
Shares/Units† | | | | | | | | | | | | | | | | | | | | |
Rights | | | - | | | | 385,855 | | | | - | | | | - | | | | 385,855 | |
| | | | | |
| Global Fund | | | | | | | | | | | | | | | | | | | | |
Number of Contracts, Notional Amounts or
Shares/Units† | | | | | | | | | | | | | | | | | | | | |
Rights | | | - | | | | 28,530 | | | | - | | | | - | | | | 28,530 | |
| | | | | |
| Large Cap Value Fund | | | | | | | | | | | | | | | | | | | | |
Number of Contracts, Notional Amounts or
Shares/Units† | | | | | | | | | | | | | | | | | | | | |
Rights | | | - | | | | 44,540 | | | | - | | | | - | | | | 44,540 | |
| | | | | |
| Mid Cap Growth Fund | | | | | | | | | | | | | | | | | | | | |
| Realized Gain (Loss)# | | | | | | | | | | | | | | | | | | | | |
Rights | | $ | - | | | $ | 3,813 | | | $ | - | | | $ | - | | | $ | 3,813 | |
| | | | | | | | | | | | | | | | | | | | |
Number of Contracts, Notional Amounts or
Shares/Units† | | | | | | | | | | | | | | | | | | | | |
Rights | | | - | | | | 742 | | | | - | | | | - | | | | 742 | |
185
Notes to Financial Statements (Continued)
| | | | | | | | | | | | | | | | | | | | |
| | | Credit Risk | | | Equity
Risk | | | Foreign
Exchange
Risk | | | Interest
Rate Risk | | | Total | |
| Mid Cap Value Fund | | | | | | | | | | | | | | | | | | | | |
| Asset Derivatives | | | | | | | | | | | | | | | | | | | | |
Forward Contracts* | | $ | - | | | $ | - | | | $ | 21,066 | | | $ | - | | | $ | 21,066 | |
| | | | | | | | | | | | | | | | | | | | |
| Liability Derivatives | | | | | | | | | | | | | | | | | | | | |
Forward Contracts^ | | $ | - | | | $ | - | | | $ | (6,386 | ) | | $ | - | | | $ | (6,386 | ) |
| | | | | | | | | | | | | | | | | | | | |
| Realized Gain (Loss)# | | | | | | | | | | | | | | | | | | | | |
Forward Contracts | | $ | - | | | $ | - | | | $ | (452,254 | ) | | $ | - | | | $ | (452,254 | ) |
| | | | | | | | | | | | | | | | | | | | |
| Change in Appreciation (Depreciation)## | | | | | | | | | | | | | | | | | | | | |
Forward Contracts | | $ | - | | | $ | - | | | $ | (39,493 | ) | | $ | - | | | $ | (39,493 | ) |
| | | | | | | | | | | | | | | | | | | | |
Number of Contracts, Notional Amounts or
Shares/Units† | | | | | | | | | | | | | | | | | | | | |
Forward Contracts | | $ | - | | | $ | - | | | $ | 18,360,111 | | | $ | - | | | $ | 18,360,111 | |
| | | | | |
| PIMCO Total Return Fund | | | | | | | | | | | | | | | | | | | | |
| Asset Derivatives | | | | | | | | | | | | | | | | | | | | |
Forward Contracts* | | $ | - | | | $ | - | | | $ | 148,148 | | | $ | - | | | $ | 148,148 | |
Futures Contracts^^ | | | - | | | | - | | | | - | | | | 70,958 | | | | 70,958 | |
Swap Agreements*,^^ | | | 293,548 | | | | - | | | | - | | | | 629,190 | | | | 922,738 | |
| | | | | | | | | | | | | | | | | | | | |
Total Value | | $ | 293,548 | | | $ | - | | | $ | 148,148 | | | $ | 700,148 | | | $ | 1,141,844 | |
| | | | | | | | | | | | | | | | | | | | |
| Liability Derivatives | | | | | | | | | | | | | | | | | | | | |
Forward Contracts^ | | $ | - | | | $ | - | | | $ | (708,669 | ) | | $ | - | | | $ | (708,669 | ) |
Futures Contracts^^ | | | - | | | | - | | | | - | | | | (27,059 | ) | | | (27,059 | ) |
Swap Agreements^,^^ | | | (94,323 | ) | | | - | | | | - | | | | - | | | | (94,323 | ) |
Written Options^ | | | - | | | | - | | | | - | | | | (1,044 | ) | | | (1,044 | ) |
| | | | | | | | | | | | | | | | | | | | |
Total Value | | $ | (94,323 | ) | | $ | - | | | $ | (708,669 | ) | | $ | (28,103 | ) | | $ | (831,095 | ) |
| | | | | | | | | | | | | | | | | | | | |
| Realized Gain (Loss)# | | | | | | | | | | | | | | | | | | | | |
Forward Contracts | | $ | - | | | $ | - | | | $ | (910,432 | ) | | $ | - | | | $ | (910,432 | ) |
Futures Contracts | | | - | | | | - | | | | - | | | | 1,182,784 | | | | 1,182,784 | |
Swap Agreements | | | (210,702 | ) | | | - | | | | - | | | | 279,302 | | | | 68,600 | |
Purchased Options | | | - | | | | - | | | | - | | | | 43,838 | | | | 43,838 | |
Written Options | | | - | | | | - | | | | - | | | | 252,359 | | | | 252,359 | |
| | | | | | | | | | | | | | | | | | | | |
Total Realized Gain (Loss) | | $ | (210,702 | ) | | $ | - | | | $ | (910,432 | ) | | $ | 1,758,283 | | | $ | 637,149 | |
| | | | | | | | | | | | | | | | | | | | |
| Change in Appreciation (Depreciation)## | | | | | | | | | | | | | | | | | | | | |
Forward Contracts | | $ | - | | | $ | - | | | $ | (1,239,568 | ) | | $ | - | | | $ | (1,239,568 | ) |
Futures Contracts | | | - | | | | - | | | | - | | | | (466,700 | ) | | | (466,700 | ) |
Swap Agreements | | | 1,146,258 | | | | - | | | | - | | | | 154,453 | | | | 1,300,711 | |
Purchased Options | | | - | | | | - | | | | - | | | | (16,889 | ) | | | (16,889 | ) |
Written Options | | | - | | | | - | | | | - | | | | (69,310 | ) | | | (69,310 | ) |
| | | | | | | | | | | | | | | | | | | | |
Total Change in Appreciation (Depreciation) | | $ | 1,146,258 | | | $ | - | | | $ | (1,239,568 | ) | | $ | (398,446 | ) | | $ | (491,756 | ) |
| | | | | | | | | | | | | | | | | | | | |
Number of Contracts Notional Amounts or
Shares/Units† | | | | | | | | | | | | | | | | | | | | |
Forward Contracts | | $ | - | | | $ | - | | | $ | 49,880,072 | | | $ | - | | | $ | 49,880,072 | |
Futures Contracts | | | - | | | | - | | | | - | | | | 255 | | | | 255 | |
Swap Agreements | | $ | 36,475,000 | | | $ | - | | | $ | - | | | $ | 26,166,667 | | | $ | 62,641,667 | |
Purchased Options | | | - | | | | - | | | | - | | | | 10,700,000 | | | | 10,700,000 | |
Written Options | | | - | | | | - | | | | - | | | | 23,100,021 | | | | 23,100,021 | |
| * | Statements of Assets and Liabilities location: Investments, at value, Receivables from: open forward foreign currency contracts or open swap agreements, at value, as applicable. |
186
Notes to Financial Statements (Continued)
| ^ | Statements of Assets and Liabilities location: Payables for: open forward foreign currency contracts, open swap agreements, at value, or written options outstanding, at value, as applicable. |
| ^^ | Cumulative appreciation (depreciation) on futures contracts and centrally cleared swaps is reported in “Futures Contracts” and “Swap Agreements” below. Only current day’s variation margin, if any, is reported within the Statements of Assets and Liabilities. |
| # | Statements of Operations location: Amounts are included in net realized gain (loss) on: investment transactions, futures contracts, written options, swap agreements, or foreign currency transactions, as applicable. |
| ## | Statements of Operations location: Amounts are included in net change in unrealized appreciation (depreciation) on: investment transactions, futures contracts, written options, swap agreements, or translation of assets and liabilities in foreign currencies, as applicable. |
| † | Amount(s) disclosed represent average number of contracts for futures contracts, notional amounts for forward contracts and swap agreements, or shares/units outstanding for written options, purchased options, rights, and warrants, which is indicative of volume of this derivative type, for the months that the Fund held such derivatives during the year ended December 31, 2012. |
The Global Fund and Large Cap Value Fund had no realized gain (loss) on rights during the year ended December 31, 2012.
Further details regarding the derivatives and other investments held by the Funds during the year ended December 31, 2012, are discussed below.
Foreign Currency Exchange Transactions
A Fund may engage in foreign currency exchange transactions for hedging purposes in order to protect against uncertainty in the level of future foreign currency exchange rates, or for other, non-hedging purposes.
A Fund may enter into foreign currency exchange transactions for hedging purposes to protect against two principal risks. First, if a Fund has assets or liabilities denominated in foreign (non-U.S. dollar) currencies, the Fund is exposed to the risk that the values of those assets or liabilities in U.S. dollars may fall or rise due to changes in currency exchange rates. Second, if the Fund agrees, or expects, to receive or deliver an asset denominated in a foreign currency, it is exposed to currency exchange risk until the date of receipt or delivery. In order to reduce those risks, a Fund may enter into foreign currency forward contracts, which call for the Fund to deliver in the future an amount of one currency in return for an amount of another currency, at an exchange rate determined at the time the contract is entered into. Forward contracts are private contractual arrangements and a Fund is subject to the risk that its counterparty will not, or will not be able to, perform its obligations. This type of arrangement may require the Fund to post margin.
Whenever a Fund enters into a foreign currency exchange transaction, it is subject to the risk that the value of the transaction will move in a direction unfavorable to it. When the Fund uses the transactions for hedging purposes, it is likely that the Fund will have an asset or liability that will offset any loss (or gain) on the transactions, at least in part. If a Fund enters into foreign currency exchange transactions other than for hedging purposes (for example, seeking to profit from an anticipated change in the values of currencies by creating directional exposures in the portfolio with respect to one or more currencies), it will generally be subject to the same risks, but is less likely to have assets or liabilities that will offset any losses on the transactions. There can be no assurance that a Fund will be able to terminate any foreign currency exchange transaction prior to its maturity in order to limit its loss on the transaction.
Forward foreign currency contracts are marked to market daily and the change in their value is recorded by the Funds as an unrealized gain or loss. Forward foreign currency contracts are valued at the settlement price established through dealers or other market sources on the day which they are traded. When a forward foreign currency contract is extinguished, through delivery or offset by entering into another forward foreign currency contract, the Funds record a realized gain or loss equal to the difference between the value of the contract at the time it was opened and the value of the contract at the time it was extinguished or offset. The notional or contractual amounts of these instruments do not necessarily represent the amounts potentially subject to risk. The measurement of the risk associated with these instruments is meaningful only when all related and offsetting transactions and counterparty risks are considered.
187
Notes to Financial Statements (Continued)
The Fund(s) listed in the following table had open forward foreign currency contracts at December 31, 2012. A Fund’s current exposure to a counterparty is typically the unrealized appreciation on the contract.
| | | | | | | | | | | | | | | | | | | | | | | | |
| | | Counterparty | | Units of
Currency | | | Contracts to
Deliver/Receive | | Settlement
Date | | | In Exchange
for U.S.
Dollars | | | Contracts at
Value | | | Unrealized
Appreciation
(Depreciation) | |
| Mid Cap Value Fund | | | | | | | | | | | | | | | | | | | | | | |
| SELLS | | | | | | | | | | | | | | | | | | | | | | |
| | Credit Suisse Securities LLC | | | 3,205,419 | | | Swiss Franc | | | 1/31/13 | | | $ | 3,503,190 | | | $ | 3,506,467 | | | $ | (3,277 | ) |
| | | | | | | | | | | | | | | | | | | | | | | | |
| | | | | | | |
| | UBS AG | | | 11,622,431 | | | Canadian Dollar | | | 1/31/13 | | | | 11,698,719 | | | | 11,677,653 | | | | 21,066 | |
| | UBS AG | | | 2,773,820 | | | Euro | | | 1/31/13 | | | | 3,659,071 | | | | 3,662,180 | | | | (3,109 | ) |
| | | | | | | | | | | | | |
| | | | | | | | | | | | | | | 15,357,790 | | | | 15,339,833 | | | | 17,957 | |
| | | | | | | | | | | | | |
| | | | | | | | | | | | | | $ | 18,860,980 | | | $ | 18,846,300 | | | $ | 14,680 | |
| | | | | | | | | | | | | | | | | | | | | | | | |
| | | | | |
| PIMCO Total Return Fund | | | | | | | | | | | | | | | | | | | |
| BUYS | | | | | | | | | | | | | | | | | | | | | | |
| | Barclays Capital | | | 308,195 | | | Brazilian Real | | | 2/04/13 | | | $ | 150,000 | | | $ | 149,889 | | | $ | (111 | ) |
| | | | | | | | | | | | | |
| | | | | | | |
| | JP Morgan Chase Bank | | | 19,835,814 | | | Mexican Peso | | | 4/03/13 | | | | 1,533,736 | | | | 1,521,700 | | | | (12,036 | ) |
| | | | | | | | | | | | | |
| | | | | | | |
| | UBS AG | | | 3,175,995 | | | Brazilian Real | | | 2/04/13 | | | | 1,542,285 | | | | 1,544,632 | | | | 2,347 | |
| | UBS AG | | | 170,000 | | | Euro | | | 3/18/13 | | | | 222,369 | | | | 224,540 | | | | 2,171 | |
| | UBS AG | | | 17,376,570 | | | Mexican Peso | | | 4/03/13 | | | | 1,325,950 | | | | 1,333,040 | | | | 7,090 | |
| | | | | | | | | | | | | |
| | | | | | | | | | | | | | | 3,090,604 | | | | 3,102,212 | | | | 11,608 | |
| | | | | | | | | | | | | |
| | | | | | | | | | | | | | $ | 4,774,340 | | | $ | 4,773,801 | | | $ | (539 | ) |
| | | | | | | | | | | | | |
| SELLS | | | | | | | | | | | | | | | | | | | |
| | Barclays Bank PLC | | | 99,000 | | | Canadian Dollar | | | 3/21/13 | | | $ | 100,177 | | | $ | 99,363 | | | $ | 814 | |
| | Barclays Bank PLC | | | 97,000 | | | Euro | | | 3/18/13 | | | | 127,821 | | | | 128,120 | | | | (299 | ) |
| | Barclays Bank PLC | | | 2,467 | | | Singapore Dollar | | | 1/25/13 | | | | 2,026 | | | | 2,019 | | | | 7 | |
| | | | | | | | | | | | | |
| | | | | | | | | | | | | | | 230,024 | | | | 229,502 | | | | 522 | |
| | | | | | | | | | | | | |
| | | | | | | |
| | Credit Suisse International | | | 100,000 | | | Euro | | | 6/02/14 | | | | 126,800 | | | | 132,774 | | | | (5,974 | ) |
| | | | | | | | | | | | | |
| | | | | | | |
| | JP Morgan Chase Bank | | | 327,000 | | | Euro | | | 3/18/13 | | | | 430,953 | | | | 431,909 | | | | (956 | ) |
| | JP Morgan Chase Bank | | | 5,828,000 | | | British Pound | | | 3/12/13 | | | | 9,333,816 | | | | 9,465,309 | | | | (131,493 | ) |
| | JP Morgan Chase Bank | | | 103,370,000 | | | Japanese Yen | | | 1/17/13 | | | | 1,255,700 | | | | 1,193,265 | | | | 62,435 | |
| | JP Morgan Chase Bank | | | 5,358,146 | | | Mexican Peso | | | 4/03/13 | | | | 409,973 | | | | 411,049 | | | | (1,076 | ) |
| | | | | | | | | | | | | |
| | | | | | | | | | | | | | | 11,430,442 | | | | 11,501,532 | | | | (71,090 | ) |
| | | | | | | | | | | | | |
188
Notes to Financial Statements (Continued)
| | | | | | | | | | | | | | | | | | | | | | | | |
| | | Counterparty | | Units of
Currency | | | Contracts to
Deliver/Receive | | Settlement
Date | | | In Exchange
for U.S.
Dollars | | | Contracts at
Value | | | Unrealized
Appreciation
(Depreciation) | |
| PIMCO Total Return Fund (Continued) | | | | | | | | | | | | | | | | | | | |
| SELLS (Continued) | | | | | | | | | | | | | | | | | | | |
| | Royal Bank of Scotland PLC | | | 7,521,000 | | | Canadian Dollar | | | 3/21/13 | | | $ | 7,619,829 | | | $ | 7,548,607 | | | $ | 71,222 | |
| | Royal Bank of Scotland PLC | | | 17,192,000 | | | Euro | | | 3/18/13 | | | | 22,199,394 | | | | 22,707,585 | | | | (508,191 | ) |
| | Royal Bank of Scotland PLC | | | 8,412,000 | | | Japanese Yen | | | 1/17/13 | | | | 99,167 | | | | 97,105 | | | | 2,062 | |
| | | | | | | | | | | | | |
| | | | | | | | | | | | | | | 29,918,390 | | | | 30,353,297 | | | | (434,907 | ) |
| | | | | | | | | | | | | |
| | | | | | | |
| | UBS AG | | | 174,000 | | | British Pound | | | 3/12/13 | | | | 279,507 | | | | 282,595 | | | | (3,088 | ) |
| | UBS AG | | | 36,000 | | | Euro | | | 3/18/13 | | | | 47,484 | | | | 47,550 | | | | (66 | ) |
| | UBS AG | | | 700,000 | | | Euro | | | 9/04/13 | | | | 883,659 | | | | 926,165 | | | | (42,506 | ) |
| | UBS AG | | | 291,497 | | | Euro | | | 9/20/13 | | | | 382,874 | | | | 385,747 | | | | (2,873 | ) |
| | | | | | | | | | | | | |
| | | | | | | | | | | | | | | 1,593,524 | | | | 1,642,057 | | | | (48,533 | ) |
| | | | | | | | | | | | | |
| | | | | | | | | | | | | | $ | 43,299,180 | | | $ | 43,859,162 | | | $ | (559,982 | ) |
| | | | | | | | | | | | | |
Futures Contracts
A Fund may seek to manage a variety of different risks, such as interest rate risk, equity price risk, and currency risk, through the use of futures contracts. A Fund may use interest rate futures contracts to adjust the interest rate sensitivity (duration) of its portfolio or the credit exposure of the portfolio. Interest rate futures contracts obligate the long or short holder to take or make delivery of a specified quantity of a financial instrument, such as a specific fixed-income security, during a specified future period at a specified price. A Fund may use index futures to hedge against broad market risks to its portfolio or to gain broad market exposure when it holds uninvested cash or as an inexpensive substitute for cash investments directly in securities or other assets. Securities index futures contracts are contracts to buy or sell units of a securities index at a specified future date at a price agreed upon when the contract is made and are settled in cash. Positions in futures may be closed out only on an exchange or board of trade which provides a secondary market for such futures. Because futures contracts are exchange-traded, they typically have minimal exposure to counterparty risk.
Parties to a futures contract are not required to post the entire notional amount of the contract, but rather a small percentage of that amount (by way of margin), both at the time they enter into futures transactions, and then on a daily basis if their positions decline in value; as a result, futures contracts are highly leveraged. Such payments are known as variation margin and are recorded by the Funds as unrealized gains or losses. Because futures markets are highly leveraged, they can be extremely volatile, and there can be no assurance that the pricing of a futures contract will correlate precisely with the pricing of the asset or index underlying it or the asset or liability of the Fund that is the subject of the hedge. It may not always be possible for a Fund to enter into a closing transaction with respect to a futures contract it has entered into, at a favorable time or price. When a Fund enters into a futures transaction, it is subject to the risk that the value of the futures contract will move in a direction unfavorable to it. When the Fund uses futures contracts for hedging purposes, it is likely that the Fund will have an asset or liability that will offset any loss (or gain) on the transactions, at least in part.
When a futures contract is closed, the Fund records a realized gain or loss equal to the difference between the value of the contract at the time it was opened and the value at the time it was closed. Futures contracts are valued at the settlement price established each day by the board of trade or exchange on which they are traded.
189
Notes to Financial Statements (Continued)
The Fund(s) listed in the following table had open futures contracts at December 31, 2012:
| | | | | | | | | | | | | | |
Number of
Contracts | | Type | | Expiration
Date | | | Notional
Contract
Value | | | Net Unrealized
Appreciation
(Depreciation) | |
| Equity Index Fund | | | | | | | | | | | | |
| BUYS | | | | | | | | | | | | | | |
| 115 | | S&P 500 E Mini Index | | | 3/15/13 | | | $ | 8,165,575 | | | $ | 3,535 | |
| | | | | | | | | | | | | | |
| PIMCO Total Return Fund | | | | | | | | | | | | |
| BUYS | | | | | | | | | | | | | | |
| 4 | | U.S. Treasury Note 10 Year | | | 3/19/13 | | | $ | 531,125 | | | $ | (3 | ) |
| 4 | | 3 Month EURIBOR | | | 12/15/14 | | | | 1,314,605 | | | | 3,426 | |
| 1 | | 3 Month EURIBOR | | | 3/16/15 | | | | 328,470 | | | | (18 | ) |
| 1 | | 3 Month EURIBOR | | | 6/15/15 | | | | 328,239 | | | | 15 | |
| 128 | | 90 Day Eurodollar | | | 6/15/15 | | | | 31,779,200 | | | | 56,274 | |
| 28 | | 90 Day Eurodollar | | | 9/14/15 | | | | 6,945,750 | | | | 10,110 | |
| 129 | | 90 Day Eurodollar | | | 12/14/15 | | | | 31,964,587 | | | | 273 | |
| 36 | | 90 Day Eurodollar | | | 3/14/16 | | | | 8,909,100 | | | | 833 | |
| 2 | | 90 Day Eurodollar | | | 6/13/16 | | | | 494,250 | | | | 22 | |
| 1 | | 90 Day Eurodollar | | | 9/19/16 | | | | 246,750 | | | | 5 | |
| | | | | |
| | | | | | | | | | | | $ | 70,937 | |
| | | | | |
| SELLS | | | | | | | | | | | | | | |
| 23 | | German Euro Bund | | | 3/07/13 | | | $ | (4,421,466 | ) | | $ | (27,038 | ) |
| | | | | | | | | | | | | | |
Swap Agreements
Swap agreements are typically two-party contracts entered into primarily by institutional investors. In a standard “swap” transaction, two parties agree to exchange the returns (or differentials in rates of return) earned or realized on particular predetermined investments or instruments, which may be adjusted for an interest factor. The gross returns to be exchanged or “swapped” between the parties are generally calculated with respect to a “notional amount,” (i.e., the return on or increase in value of a particular dollar amount invested at a particular interest rate or in a “basket” of securities representing a particular index).
Interest Rate Swaps. When a Fund enters into an interest rate swap, it typically agrees to make payments to its counterparty based on a specified long- or short-term interest rate, and will receive payments from its counterparty based on another interest rate. Other forms of interest rate swap agreements include interest rate caps, under which, in return for a specified payment stream, one party agrees to make payments to the other to the extent that interest rates exceed a specified rate, or “cap”; interest rate floors, under which, in return for a specified payment stream, one party agrees to make payments to the other to the extent that interest rates fall below a specified rate, or “floor”; and interest rate collars, under which a party sells a cap and purchases a floor or vice versa in an attempt to protect itself against interest rate movements exceeding given minimum or maximum levels. A Fund may enter into an interest rate swap in order, for example, to hedge against the effect of interest rate changes on the value of specific securities in its portfolio, or to adjust the interest rate sensitivity (duration) or the credit exposure of its portfolio overall, or otherwise as a substitute for a direct investment in debt securities.
Credit Default Swaps. A Fund also may enter into credit default swap transactions, as a “buyer” or “seller” of credit protection. In a credit default swap, one party provides what is in effect insurance against a default or other adverse credit event affecting an issuer of debt securities (typically referred to as a “reference entity”). In general, the buyer of credit protection is obligated to pay the protection seller an upfront amount or a periodic stream of payments over the term of the swap. If a “credit event” occurs, the buyer has the right to deliver to the seller bonds or other obligations of the reference entity (with a value up to the full notional value of the swap), and to receive a payment equal to the par value of the bonds or other obligations. Credit events that would
190
Notes to Financial Statements (Continued)
trigger a request that the seller make payment are specific to each credit default swap agreement, but generally include bankruptcy, failure to pay, restructuring, obligation acceleration, obligation default, or repudiation/moratorium. When a Fund buys protection, it may or may not own securities of the reference entity. If it does own securities of the reference entity, the swap serves as a hedge against a decline in the value of the securities due to the occurrence of a credit event involving the issuer of the securities. If the Fund does not own securities of the reference entity, the credit default swap may be seen to create a short position in the reference entity. If a Fund is a buyer and no credit event occurs, the Fund will typically recover nothing under the swap, but will have had to pay the required upfront payment or stream of continuing payments under the swap. When a Fund sells protection under a credit default swap, the position may have the effect of creating leverage in the Fund’s portfolio through the Fund’s indirect long exposure to the issuer or securities on which the swap is written. When a Fund sells protection, it may do so either to earn additional income or to create such a “synthetic” long position.
Whenever a Fund enters into a swap agreement, it takes on counterparty risk — the risk that its counterparty will be unable or unwilling to meet its obligations under the swap agreement. The Fund also takes the risk that the market will move against its position in the swap agreement. In the case of an interest rate swap, the value of the swap may increase or decrease depending on changes in interest rates. In the case of a credit default swap, the swap will become more or less valuable depending on the credit of the issuer of the underlying security, and, if a credit event occurs under a swap where the Fund is the seller of credit protection, the Fund could be required to purchase the security at par value, resulting in a significant loss to the Fund. When the Fund enters into any type of swap for hedging purposes, it is likely that the Fund will have an asset or liability that will offset any loss (or gain) on the swap, at least in part. Swap agreements may be non-transferable or otherwise highly illiquid, and a Fund may not be able to terminate or transfer a swap agreement at any particular time or at an acceptable price.
Swaptions. A Fund may also enter into options on swap agreements (“swaptions”). A swaption is a contract that gives a counterparty the right (but not the obligation) to enter into a new swap agreement or to shorten, extend, cancel, or otherwise modify an existing swap agreement, at some designated future time on specified terms. A Fund may write (sell) and purchase put and call swaptions. Depending on the terms of the particular option agreement, a Fund will generally incur a greater degree of risk when it writes a swaption than it will incur when it purchases a swaption. When a Fund purchases a swaption, it risks losing only the amount of the premium it has paid should it decide to let the option expire unexercised. However, when a Fund writes a swaption, upon exercise of the option the Fund will become obligated according to the terms of the underlying agreement. A Fund may enter into swaptions for the same purposes as swaps. For information regarding the accounting treatment of options, see “Options, Rights, and Warrants” below.
Centrally Cleared Swaps. Certain clearinghouses currently offer clearing for limited types of derivatives transactions, principally credit derivatives. In a cleared derivative transaction, a Fund typically enters into the transaction with a financial institution counterparty, and performance of the transaction is effectively guaranteed by a central clearinghouse, thereby reducing or eliminating the Fund’s exposure to the credit risk of its original counterparty. The Fund will be required to post specified levels of margin with the clearinghouse or at the instruction of the clearinghouse; the margin required by a clearinghouse may be greater than the margin the Fund would be required to post in an uncleared transaction. Only a limited number of transactions are currently eligible for clearing.
During the term of a swap transaction, changes in the value of the swap are recognized as unrealized gains or losses by marking to market to reflect the market value of the swap. When the swap is terminated, a Fund will record a realized gain or loss equal to the difference, if any, between the proceeds from (or cost of) the closing transaction and a Fund’s basis in the agreement. Upfront swap premium payments paid or received by a Fund, if any, are recorded within the value of the open swap agreement on the Fund’s Statement of Assets and Liabilities and represent payments paid or received upon entering into the swap agreement to compensate for differences between stated terms of the swap agreement and prevailing market conditions (credit spreads, currency exchange rates, and other relevant factors). These upfront payments are recorded as realized gain or loss on the Fund’s Statement of Operations upon termination or maturity of the swap agreement.
During the term of a swap transaction, the periodic net payments can be made for a set period of time or may be triggered by a predetermined credit event. The net periodic payments may be based on a fixed or variable interest rate, the change in market value of a specified security, basket of securities or index, or the return generated by a security. These periodic payments received or made by the Funds are recorded in the accompanying Statements of Operations as realized gains and losses, respectively.
191
Notes to Financial Statements (Continued)
The Fund(s) listed in the following table had open swap agreements at December 31, 2012. A Fund’s current exposure to a counterparty is typically the fair value of the agreement.
| | | | | | | | | | | | | | | | | | | | | | | | | | | | | | |
Notional
Amount | | | Currency | | Expiration
Date | | | Counterparty | | Buy/Sell
Protection | | Receive
(Pay)
Fixed
Rate | | | Deliverable on Default | | Unrealized
Appreciation
(Depreciation) | | | Premium
(Received)
Paid | | | Value | |
| PIMCO Total Return Fund* | | | | | | | | | | | | | | | | | | | | |
| Credit Default Swaps | | | | | | | | | | | | | | | | | | | | |
| OTC Swaps | | | | | | | | | | | | | | | | | | | | |
| $ | 1,600,000 | | | USD | | | 6/20/15 | | | Barclays Bank PLC | | Sell*** | | | 5.000% | | | CDX.EM.13†
(PIMCO Rating: BA+)** | | $ | (8,560 | ) | | $ | 133,850 | | | $ | 125,290 | |
| | 400,000 | | | USD | | | 12/20/15 | | | Barclays Bank PLC | | Sell*** | | | 1.000% | | | Federative Republic of Brazil
(PIMCO Rating: BAA)** | | | 5,683 | | | | (2,308 | ) | | | 3,375 | |
| | 1,500,000 | | | USD | | | 3/20/16 | | | Barclays Bank PLC | | Sell*** | | | 1.000% | | | Federative Republic of Brazil
(PIMCO Rating: BAA)** | | | 17,456 | | | | (6,149 | ) | | | 11,307 | |
| | 900,000 | | | USD | | | 3/20/16 | | | Barclays Bank PLC | | Sell*** | | | 1.000% | | | United Mexican States
(PIMCO Rating: BAA+)** | | | 13,345 | | | | (4,343 | ) | | | 9,002 | |
| | 1,300,000 | | | USD | | | 6/20/16 | | | Barclays Bank PLC | | Sell*** | | | 1.000% | | | People’s Republic of China
(PIMCO Rating: AA-)** | | | 9,670 | | | | 16,884 | | | | 26,554 | |
| | 1,100,000 | | | USD | | | 6/20/16 | | | Barclays Bank PLC | | Sell*** | | | 1.000% | | | Federative Republic of Brazil
(PIMCO Rating: BAA)** | | | 8,722 | | | | (1,593 | ) | | | 7,129 | |
| | 100,000 | | | USD | | | 9/20/16 | | | Barclays Bank PLC | | Sell*** | | | 0.250% | | | French Republic
(PIMCO Rating: AA+)** | | | 4,709 | | | | (6,114 | ) | | | (1,405 | ) |
| | 800,000 | | | USD | | | 12/20/16 | | | Barclays Bank PLC | | Sell*** | | | 1.000% | | | Federative Republic of Brazil
(PIMCO Rating: BAA)** | | | 23,630 | | | | (20,149 | ) | | | 3,481 | |
| | 400,000 | | | USD | | | 6/20/17 | | | Barclays Bank PLC | | Sell*** | | | 1.000% | | | Australia Government
(PIMCO Rating: AAA)** | | | 6,087 | | | | 4,734 | | | | 10,821 | |
| | 900,000 | | | USD | | | 6/20/17 | | | Barclays Bank PLC | | Sell*** | | | 1.000% | | | United Mexican States
(PIMCO Rating: BAA+)** | | | 10,313 | | | | (7,138 | ) | | | 3,175 | |
| | 500,000 | | | EUR | | | 6/20/17 | | | Barclays Bank PLC | | Buy | | | (1.000% | ) | | ITRAXX Europe Series 17† | | | (17,576 | ) | | | 32,348 | | | | 14,772 | |
| | 200,000 | | | USD | | | 6/20/17 | | | Barclays Bank PLC | | Sell*** | | | 1.000% | | | Berkshire Hathaway Finance
(PIMCO Rating: AA+)** | | | 4,291 | | | | (5,140 | ) | | | (849 | ) |
| | 500,000 | | | USD | | | 9/20/17 | | | Barclays Bank PLC | | Sell*** | | | 1.000% | | | Republic of Indonesia
(PIMCO Rating: BAA-)** | | | 13,188 | | | | (18,206 | ) | | | (5,018 | ) |
| | 400,000 | | | USD | | | 3/20/21 | | | Barclays Bank PLC | | Sell*** | | | 1.000% | | | United Mexican States
(PIMCO Rating: BAA+)** | | | 11,046 | | | | (19,146 | ) | | | (8,100 | ) |
| | | | | | | | | | | | | |
| | | | | | | | | | | | | | | | | | | | | 102,004 | | | | 97,530 | | | | 199,534 | |
| | | | | | | | | | | | | |
| | 800,000 | | | USD | | | 6/20/16 | | | Credit Suisse Securities LLC | | Sell*** | | | 1.000% | | | Federative Republic of Brazil
(PIMCO Rating: BAA)** | | | 6,349 | | | | (1,164 | ) | | | 5,185 | |
| | 400,000 | | | USD | | | 6/20/17 | | | Credit Suisse Securities LLC | | Sell*** | | | 1.000% | | | United Mexican States
(PIMCO Rating: BAA+)** | | | 4,589 | | | | (3,178 | ) | | | 1,411 | |
| | 200,000 | | | USD | | | 6/20/17 | | | Credit Suisse Securities LLC | | Sell*** | | | 1.000% | | | Berkshire Hathaway Finance
(PIMCO Rating: AA+)** | | | 4,108 | | | | (4,957 | ) | | | (849 | ) |
| | 200,000 | | | USD | | | 9/20/17 | | | Credit Suisse Securities LLC | | Sell*** | | | 1.000% | | | Republic of Indonesia
(PIMCO Rating: BAA-)** | | | 5,182 | | | | (7,190 | ) | | | (2,008 | ) |
| | | | | | | | | | | | | |
| | | | | | | | | | | | | | | | | | | | | 20,228 | | | | (16,489 | ) | | | 3,739 | |
| | | | | | | | | | | | | |
| | 1,300,000 | | | USD | | | 12/20/14 | | | Goldman Sachs & Co. | | Sell*** | | | 1.000% | | | MetLife, Inc.
(PIMCO Rating: A-)** | | | 38,443 | | | | (32,175 | ) | | | 6,268 | |
| | 200,000 | | | USD | | | 6/20/15 | | | Goldman Sachs & Co. | | Sell*** | | | 1.000% | | | United Kingdom Gilt
(PIMCO Rating: AAA)** | | | 1,893 | | | | 2,014 | | | | 3,907 | |
| | 100,000 | | | USD | | | 3/20/16 | | | Goldman Sachs & Co. | | Sell*** | | | 1.000% | | | General Electric Capital Corp.
(PIMCO Rating: AA+)** | | | 2,112 | | | | (1,685 | ) | | | 427 | |
| | 300,000 | | | USD | | | 9/20/16 | | | Goldman Sachs & Co. | | Sell*** | | | 1.000% | | | United Mexican States
(PIMCO Rating: BAA+)** | | | 3,640 | | | | (1,414 | ) | | | 2,226 | |
| | 400,000 | | | USD | | | 6/20/17 | | | Goldman Sachs & Co. | | Sell*** | | | 1.000% | | | United Mexican States
(PIMCO Rating: BAA+)** | | | 3,176 | | | | (1,765 | ) | | | 1,411 | |
| | 100,000 | | | USD | | | 6/20/17 | | | Goldman Sachs & Co. | | Sell*** | | | 5.000% | | | NRG Energy, Inc.
(PIMCO Rating: BA-)** | | | 19,198 | | | | (10,000 | ) | | | 9,198 | |
| | | | | | | | | | | | | |
| | | | | | | | | | | | | | | | | | | | | 68,462 | | | | (45,025 | ) | | | 23,437 | |
| | | | | | | | | | | | | |
192
Notes to Financial Statements (Continued)
| | | | | | | | | | | | | | | | | | | | | | | | | | | | | | |
Notional
Amount | | | Currency | | Expiration
Date | | | Counterparty | | Buy/Sell
Protection | | Receive
(Pay)
Fixed
Rate | | | Deliverable on Default | | Unrealized
Appreciation
(Depreciation) | | | Premium
(Received)
Paid | | | Value | |
| PIMCO Total Return Fund* (Continued) | | | | | | | | | | | | | | | | | | | | |
| Credit Default Swaps (Continued) | | | | | | | | | | | | | | | | | | | | |
| OTC Swaps (Continued) | | | | | | | | | | | | | | | | | | | | | | | |
| $ | 200,000 | | | USD | | | 6/20/16 | | | JP Morgan Chase Bank | | Sell*** | | | 1.000% | | | Republic of Indonesia
(PIMCO Rating: BAA-)** | | $ | 4,708 | | | $ | (3,707 | ) | | $ | 1,001 | |
| | 100,000 | | | USD | | | 9/20/16 | | | JP Morgan Chase Bank | | Sell*** | | | 1.000% | | | Federative Republic of Brazil
(PIMCO Rating: BAA)** | | | 1,150 | | | | (609 | ) | | | 541 | |
| | 300,000 | | | USD | | | 9/20/16 | | | JP Morgan Chase Bank | | Sell*** | | | 1.000% | | | People’s Republic of China
(PIMCO Rating: AA-)** | | | 4,543 | | | | 1,632 | | | | 6,175 | |
| | 300,000 | | | USD | | | 6/20/17 | | | JP Morgan Chase Bank | | Sell*** | | | 1.000% | | | Republic of Indonesia
(PIMCO Rating: BAA-)** | | | 7,045 | | | | (8,966 | ) | | | (1,921 | ) |
| | 700,000 | | | USD | | | 6/20/17 | | | JP Morgan Chase Bank | | Sell*** | | | 1.000% | | | Japan Government
(PIMCO Rating: AA-)** | | | 9,822 | | | | (1,215 | ) | | | 8,607 | |
| | 1,200,000 | | | USD | | | 6/20/17 | | | JP Morgan Chase Bank | | Sell*** | | | 1.000% | | | Federative Republic of Brazil
(PIMCO Rating: BAA)** | | | 15,727 | | | | (15,318 | ) | | | 409 | |
| | | | | | | | | | | | | |
| | | | | | | | | | | | | | | | | | | | | 42,995 | | | | (28,183 | ) | | | 14,812 | |
| | | | | | | | | | | | | |
| | 200,000 | | | USD | | | 3/20/16 | | | Royal Bank of Scotland PLC | | Sell*** | | | 0.250% | | | French Republic
(PIMCO Rating: AA+)** | | | 4,443 | | | | (6,157 | ) | | | (1,714 | ) |
| | 600,000 | | | USD | | | 3/20/16 | | | Royal Bank of Scotland PLC | | Sell*** | | | 1.000% | | | Japan Government
(PIMCO Rating: AA-)** | | | 2,883 | | | | 6,663 | | | | 9,546 | |
| | | | | | | | | | | | | |
| | | | | | | | | | | | | | | | | | | | | 7,326 | | | | 506 | | | | 7,832 | |
| | | | | | | | | | | | | |
| | 100,000 | | | USD | | | 9/20/16 | | | UBS AG | | Sell*** | | | 1.000% | | | Republic of Indonesia
(PIMCO Rating: BAA-)** | | | 2,078 | | | | (1,578 | ) | | | 500 | |
| | 1,000,000 | | | USD | | | 9/20/16 | | | UBS AG | | Sell*** | | | 1.000% | | | United Mexican States
(PIMCO Rating: BAA+)** | | | 11,809 | | | | (4,388 | ) | | | 7,421 | |
| | 700,000 | | | USD | | | 9/20/16 | | | UBS AG | | Sell*** | | | 1.000% | | | People’s Republic of China
(PIMCO Rating: AA-)** | | | 10,775 | | | | 3,634 | | | | 14,409 | |
| | 300,000 | | | USD | | | 6/20/17 | | | UBS AG | | Sell*** | | | 1.000% | | | Republic of Indonesia
(PIMCO Rating: BAA-)** | | | 7,327 | | | | (9,248 | ) | | | (1,921 | ) |
| | | | | | | | | | | | | |
| | | | | | | | | | | | | | | | | | | | | 31,989 | | | | (11,580 | ) | | | 20,409 | |
| | | | | | | | | | | | | |
| Centrally Cleared Swaps | | | | | | | | | | | | | | | | | | | | |
| | 10,500,000 | | | USD | | | 6/20/17 | | | | | Buy | | | (1.000 | )% | | CDX.1G.18† | | | (17,897 | ) | | | (52,641 | ) | | | (70,538 | ) |
| | | | | | | | | | | | | | | | | | | | | | | | | | | | | | |
| | | | | | | | | | | | | | | | | | | | | | | | | | |
Notional
Amount | | | Currency | | Expiration
Date | | | Counterparty | | Payments Made by Fund | | Payments Received by Fund | | Unrealized
Appreciation
(Depreciation) | | | Premium
Received
(Paid) | | | Value | |
| Interest Rate Swaps | | | | | | | | | | | | | | | | |
| OTC Swaps | | | | | | | | | | | | | | | | |
| $ | 9,000,000 | | | MXN | | | 9/13/17 | | | Barclays Bank PLC | | MXN TIIE Mexican Banxico | | Fixed 5.500% | | $ | 13,894 | | | $ | (6,702 | ) | | $ | 7,192 | |
| | 14,000,000 | | | MXN | | | 9/02/22 | | | Barclays Bank PLC | | MXN TIIE Mexican Banxico | | Fixed 6.000% | | | 21,781 | | | | (7,325 | ) | | | 14,456 | |
| | | | | | | | | | | | | | | | | | | | | | | | | | |
| | | | | | | | | | | | | | | | | 35,675 | | | | (14,027 | ) | | | 21,648 | |
| | | | | | | | | | | | | | | | | | | | | | | | | | |
| | 17,400,000 | | | USD | | | 10/15/17 | | | Goldman Sachs & Co. | | Federal Funds Effective Rate US | | Fixed 1.000% | | | 12,034 | | | | (5,330 | ) | | | 6,704 | |
| | | | | | | | | | | | | |
| | | | | | | | | | | | | | | | | | | | | | | | | | |
| | | | | | | | | | | | | |
| | | | | | | | | | | | | | | | | | | | | | | | | | |
| | | | | | | | | | | | | |
| Centrally Cleared Swaps | | | | | | | | | | | | | | | | |
| | 18,000,000 | | | USD | | | 3/18/16 | | | | | 3-Month USD-LIBOR-BBA | | Fixed 1.500% | | | (10,013 | ) | | | 146,774 | | | | 136,761 | |
| | 1,800,000 | | | USD | | | 6/20/42 | | | | | Fixed 2.750% | | 3-Month USD-LIBOR-BBA | | | (12,459 | ) | | | 23,691 | | | | 11,232 | |
| | 7,300,000 | | | USD | | | 12/19/42 | | | | | Fixed 2.500% | | 3-Month USD-LIBOR-BBA | | | 150,345 | | | | 302,500 | | | | 452,845 | |
| | | | | | | | | | | | | |
| | | | | | | | | | | | | | | | | 127,873 | | | | 472,965 | | | | 600,838 | |
| | | | | | | | | | | | | |
193
Notes to Financial Statements (Continued)
| * | Collateral for swap agreements held by Citigroup Global Markets, Inc. and UBS AG, and received from Barclays Bank PLC amounted to $1,000, $20,000, and $390,000 in cash, respectively, at December 31, 2012; and collateral for swap agreements held by Barclays Bank PLC, Citigroup Global Markets, Inc., Credit Suisse Securities LLC, Deutsche Bank Securities, Inc., Morgan Stanley & Co., Royal Bank of Scotland PLC, and UBS AG amounted to $593,191, $46,406, $184,519, $245,145, $25,221, $555,587, and $41,362 in securities, respectively, at December 31, 2012. |
| ** | Rating is determined by Pacific Investment Management Company LLC and represents a weighted average rating of all securities in the underlying index for credit default swaps. The source of the ratings for the underlying securities are Moody’s Investors Service, Inc., Standard & Poor’s Ratings Group, and/or Fitch Ratings. All ratings are as of the report date and do not reflect subsequent changes. |
| *** | For each credit derivative with sold protection, the credit ratings of the entities referenced, as rated by any rating organization, are included in the equivalent Pacific Investment Management Company LLC’s rating category. The reference entity rating represents the likelihood of a potential payment by the Fund if the referenced entity experiences a credit event as of period end. Notional amounts represent the maximum potential amount of future payments (undiscounted) the Fund could be required to make under the credit derivatives with sold protection. |
| † | Payment is based on a percentage of the index. Reference entities are a number of individual issuers comprising the index. |
Options, Rights, and Warrants
A Fund may purchase and sell put and call options on securities or an index of securities to enhance investment performance or to protect against changes in market prices. A Fund that invests in debt securities may also purchase and sell put and call options to adjust the interest rate sensitivity of its portfolio or the credit exposure of the portfolio.
Call Options. A call option gives the holder the right to purchase, and obligates the writer to sell, a security at the strike price at any time before the expiration date. A Fund may write call options on a security it owns, in a “directional” strategy hoping to realize a greater current return through the receipt of premiums. In return for the option premium, the Fund takes the risk that it will have to forego any increase in the value of the security over the strike price. When a Fund has written a call option on a security it does not own, its exposure on such an option is theoretically unlimited. A Fund may enter into closing purchase transactions in order to realize a profit or limit a loss on a previously written call option or, in the case of a call option on a security it owns, to free itself to sell the underlying security or to write another call on the security, or protect a security from being called in an unexpected market rise. Any profits from a closing purchase transaction in the case of a call option on a security a Fund owns may be offset by a decline in the value of the underlying security. Conversely, because increases in the market price of a call option will generally reflect increases in the market price of the underlying security, any loss resulting from a closing purchase transaction relating to a call option on a security a Fund owns is likely to be offset in whole or in part by unrealized appreciation of the underlying security owned by the Fund. A Fund may not be able to close out a call option that it has previously written.
Put Options. A put option gives the holder the right to sell, and obligates the writer to buy, a security at the exercise price at any time before the expiration date. A Fund may write put options in order to enhance its current return by taking a long directional position as to a security or index of securities. By writing a put option, the Fund assumes the risk that it may be required to purchase the underlying security for an exercise price higher than its then current market value, resulting in a potential capital loss unless the security later appreciates in value. A Fund may terminate a put option that it has written before it expires by entering into a closing purchase transaction. Any loss from this transaction may be partially or entirely offset by the premium received on the terminated option. A Fund may not be able to close out a put option that it has previously written.
Writing put and call options. When a Fund writes a call or put option, an amount equal to the premium received is recorded as a liability. Premiums received from writing options which expire are treated as realized gains. Premiums received from writing options which are exercised or closed are added to the proceeds or offset against the amount paid on the underlying investment to determine the realized gain or loss.
194
Notes to Financial Statements (Continued)
Purchasing put and call options. A Fund may purchase put options to protect portfolio holdings against a decline in market value of a security or securities held by it. A Fund may also purchase a put option hoping to profit from an anticipated decline in the value of the underlying security. If the Fund holds the security underlying the option, the option premium and any transaction costs will reduce any profit the Fund might have realized had it sold the underlying security instead of buying the put option. A Fund may purchase call options to hedge against an increase in the price of securities that the Fund wants ultimately to buy. A Fund may also purchase a call option as a long directional investment hoping to profit from an anticipated increase in the value of the underlying security. In order for a call option to be profitable, the market price of the underlying security must rise sufficiently above the exercise price to cover the premium and transaction costs. These costs will reduce any profit the Fund might have realized had it bought the underlying security at the time it purchased the call option.
When a Fund purchases an option, it runs the risk that it will lose its entire investment in the option in a relatively short period of time, unless the Fund exercises the option or enters into a closing sale transaction before the option’s expiration. If the price of the underlying security does not rise (in the case of a call) or fall (in the case of a put) to an extent sufficient to cover the option premium and transaction costs, the Fund will lose part or all of its investment in the option. This contrasts with an investment by a Fund in the underlying security, since the Fund will not realize a loss if the security’s price does not change. Premiums paid for purchasing options that expire are treated as realized losses.
Exchange Traded Options. Exchange traded options purchased or sold by a Fund may be traded on a securities or options exchange or market. Such options typically have minimal exposure to counterparty risk. However, an exchange or market may at times find it necessary to impose restrictions on particular types of options transactions, such as opening transactions. If an underlying security ceases to meet qualifications imposed by the market or the Options Clearing Corporation, new series of options on that security will no longer be opened to replace expiring series, and opening transactions in existing series may be prohibited. Exchange traded options are valued at the last sale price, or if no sales are reported, the last bid price.
OTC Options. OTC options purchased or sold by a Fund are not traded on securities or options exchanges or backed by clearinghouses. Rather, they are entered into directly between a Fund and the counterparty to the option. In the case of an OTC option purchased by the Fund, the value of the option to the Fund will depend on the willingness and ability of the option writer to perform its obligations to the Fund. In addition, OTC options may not be transferable and there may be little or no secondary market for them, so they may be considered illiquid. It may not be possible to enter into closing transactions with respect to OTC options or otherwise to terminate such options, and as a result a Fund may be required to remain obligated on an unfavorable OTC option until its expiration. OTC options are valued using prices supplied by a primary pricing source, selected pursuant to procedures approved by the Trustees.
Rights and Warrants. A Fund may purchase or hold warrants or rights in order to gain exposure to the underlying security without owning the security, including, for example, cases where the Fund hopes to lock in the price today of a security it may wish to purchase in the future. Warrants generally give the holder the right, but not the obligation, to buy a security at a stated price. In order for a warrant to be profitable, the market price of the underlying security must rise sufficiently above the exercise price to cover any premium and transaction costs. Rights may similarly confer on the holder the right to purchase or acquire securities, including through participation in a so-called rights offering. Bonds may be issued with warrants or other rights attached to purchase or acquire equity or other debt securities, typically of the bond issuer. The market prices of bonds with warrants or rights attached to purchase equity securities or bonds may, to some degree, reflect changes in the values of the underlying securities.
When a Fund purchases or otherwise acquires warrants or other rights, it runs the risk that it will lose its entire investment in the warrants or rights, unless the Fund exercises the warrant or right, acquires the underlying securities, or enters into a closing transaction before expiration. If the price of the underlying security does not rise to an extent sufficient to cover any premium and transaction costs, the Fund will lose part or all of its investment. Any premiums or purchase price paid for warrants or other rights that expire are treated as realized losses. Warrants and similar rights differ from options in that they are typically written by the issuer of the security underlying the warrant or right. Although some warrants and rights may be non-transferable, others may be traded over-the-counter or on an exchange.
195
Notes to Financial Statements (Continued)
The Fund(s) listed in the following table had open written option contracts at December 31, 2012. A Fund’s current exposure to a counterparty is typically the fair value of the contract.
| | | | | | | | | | | | | | | | |
Notional
Amount | | | Expiration
Date | | | Description | | Premiums
Received | | | Value | |
| | PIMCO Total Return Fund | | | | | | | | |
| $ | 400,000 | | | | 1/21/13 | | | Interest Rate Swaption EUR 5 Year Put, Strike 1.10* | | $ | 2,621 | | | $ | 3 | |
| | 1,300,000 | | | | 3/18/13 | | | Interest Rate Swaption USD 5 Year Put, Strike 1.40** | | | 25,090 | | | | 251 | |
| | 1,800,000 | | | | 3/18/13 | | | Interest Rate Swaption USD 5 Year Put, Strike 1.40* | | | 4,985 | | | | 351 | |
| | 1,500,000 | | | | 5/30/13 | | | Interest Rate Swaption USD 5 Year Put, Strike 1.75*** | | | 11,437 | | | | 439 | |
| | | | | | | | | |
| | | | | | | | | | $ | 44,133 | | | $ | 1,044 | |
| | | | | | | | | |
| * | OTC traded option counterparty Goldman Sachs & Co. |
| ** | OTC traded option counterparty Credit Suisse Securities LLC. |
| *** | OTC traded option counterparty Royal Bank of Scotland PLC. |
Transactions in written option contracts during the year ended December 31, 2012, were as follows:
| | | | | | | | |
| | | Number of
Contracts | | | Premiums
Received | |
| PIMCO Total Return Fund | | | | | | | | |
Options outstanding at December 31, 2011 | | | 33,000,015 | | | $ | 138,070 | |
Options written | | | 47,100,128 | | | | 214,097 | |
Options terminated in closing purchase transactions | | | (75,100,143 | ) | | | (308,034 | ) |
| | | | | | | | |
Options outstanding at December 31, 2012 | | | 5,000,000 | | | $ | 44,133 | |
| | | | | | | | |
When-Issued, Delayed-Delivery, Forward Commitment, and To-Be-Announced Transactions
A Fund may enter into when-issued, delayed-delivery, forward commitment, or to-be-announced (“TBA”) transactions in order to lock in the purchase price of the underlying security, or in order to adjust the interest rate exposure of the Fund’s existing portfolio. In when-issued, delayed-delivery, or forward commitment transactions, a Fund commits to purchase or sell particular securities, with payment and delivery to take place at a future date. In the case of TBA purchase commitments, the unit price and the estimated principal amount are established when the Fund enters into a commitment, with the actual principal amount being within a specified range of the estimate. Although a Fund does not typically pay for the securities in these types of transactions until they are delivered, it immediately assumes the risks of ownership, including the risk of price fluctuation. If a Fund’s counterparty fails to deliver a security purchased on a when-issued, delayed-delivery, forward commitment, or TBA basis, there may be a loss, and the Fund may have missed an opportunity to make an alternative investment.
Prior to settlement of these transactions, the value of the subject securities will fluctuate. In addition, because the Fund is not required to make payment under these transactions until the delivery date, they may result in a form of leverage.
These securities are valued on the basis of valuations furnished by a pricing service, selected pursuant to procedures approved by the Trustees, which determines valuations taking into account appropriate factors such as institutional-size trading in similar groups of securities, yield, quality, coupon rate, maturity, type of issue, trading characteristics, and other market data. Securities for which no market quotation is available are valued at fair value in accordance with procedures approved by the Trustees. The Funds record on a daily basis the unrealized appreciation (depreciation) based upon changes in the values of these securities. When a when-issued, delayed-delivery, forward commitment, or TBA transaction is closed, the Funds record a realized gain or loss equal to the difference between the value of the transaction at the time it was opened and the value of the transaction at the time it was closed.
196
Notes to Financial Statements (Continued)
Dollar Roll Transactions
A Fund may enter into dollar roll transactions, in which the Fund sells mortgage-backed securities for delivery in the current month and simultaneously contracts to purchase substantially similar securities on a specified future date from the same party. A Fund may invest in dollar rolls in order to benefit from anticipated changes in pricing for the mortgage-backed securities during the term of the transaction, or for the purpose of creating investment leverage. In a dollar roll, the securities that are to be purchased will be of the same type as the securities sold, but will be supported by different pools of mortgages.
Dollar rolls involve the risk that the Fund’s counterparty will be unable to deliver the mortgage-backed securities underlying the dollar roll at the fixed time. If the counterparty files for bankruptcy or becomes insolvent, a Fund’s use of the transaction proceeds may be restricted pending a determination by the counterparty or its representative, whether to enforce the Fund’s obligation to repurchase the securities. A Fund can incur a loss on a dollar roll transaction (either because its counterparty fails to perform or because the value of the mortgages subject to the transaction declines) and on the investments made by the Fund with the proceeds of the dollar roll transaction. Dollar roll transactions generally have the effect of creating leverage in a Fund’s portfolio.
A Fund accounts for a dollar roll transaction as a purchase and sale whereby the difference in the sales price and purchase price of the security sold is recorded as a realized gain (loss). If certain criteria are met, these dollar roll transactions may be considered financing transactions, whereby the difference in the sales price and the future purchase price is recorded as an adjustment to interest income.
Inflation-Indexed Bonds
The Funds may invest in inflation-indexed bonds, which are fixed income securities whose principal value or coupon is periodically adjusted according to the rate of inflation, as measured by the Consumer Price Index for All Urban Consumers (“CPI-U”) (for U.S. Treasury inflation-indexed bonds) or, generally, by a comparable inflation index calculated by the foreign government issuing the inflation-indexed bonds.
If the periodic adjustment rate measuring inflation falls, the principal value of inflation-indexed bonds will be adjusted downward, and consequently the interest payable on these securities (calculated with respect to a smaller principal amount) will be reduced. Repayment of the original bond principal upon maturity (as adjusted for inflation) is guaranteed in the case of U.S. Treasury inflation-indexed bonds, even during a period of deflation. However, the current market value of the bonds is not guaranteed, and will fluctuate. The Funds may also invest in other inflation related bonds which may or may not provide a similar guarantee. If a guarantee of principal is not provided, the adjusted principal value of the bond repaid at maturity may be less than the original principal. Any adjustments to the principal amount of an inflation-indexed bond due to inflation will be reflected as increases or decreases to interest income. Such adjustments may have a significant impact on the Fund’s distributions.
The value of inflation-indexed bonds is generally based on changes in real interest rates, which in turn are tied to the relationship between nominal interest rates and the rate of inflation. Therefore, if nominal interest rates increased at a faster rate than inflation, real interest rates might rise, leading to a decrease in value of inflation-indexed bonds. While the values of these securities are expected to be protected from long-term inflationary trends, short-term increases in inflation may lead to a decline in value. There can be no assurance that the CPI-U or any foreign inflation index will accurately measure the real rate of inflation, or that the rate of inflation in a foreign country will correlate to the rate of inflation in the United States. Additionally, if interest rates rise due to reasons other than inflation, investors in these securities may not be protected to the extent that the increase is not reflected in the bond’s inflation measure.
Bank Loans
Certain of the Funds may invest in bank loans including, for example, corporate loans, loan participations, direct debt, bank debt, and bridge debt. A Fund may invest in a loan by lending money to a borrower directly as part of a syndicate of lenders. In a syndicated loan, the agent that originated and structured the loan typically administers and enforces the loan on behalf of the syndicate. Failure by the agent to fulfill its obligations may delay or adversely affect receipt of payment by a Fund. A Fund may also invest in loans through novations, assignments, and participation interests. In a novation, a Fund typically assumes all of the rights of a lending institution in a loan, including the right to receive payments of principal and interest and other amounts directly from the borrower and to enforce its rights as a lender directly against the borrower. When a Fund takes an assignment of a loan, the Fund acquires some or all of the interest of another lender (or assignee) in the loan. In such cases, the Fund may be required
197
Notes to Financial Statements (Continued)
generally to rely upon the assignor to demand payment and enforce rights under the loan. If a Fund acquires a participation in the loan, the Fund purchases an indirect interest in a loan held by a third party and the Fund typically will have a contractual relationship only with the third party loan investor, not with the borrower. As a result, a Fund may have the right to receive payments of principal, interest, and any fees to which it is entitled only from the loan investor selling the participation and only upon receipt by such loan investor of such payments from the borrower. In such cases, a Fund assumes the credit risk of both the borrower and the loan investor selling the participation, and the Fund may be unable to realize some or all of the value of its interest in the loan in the event of the insolvency of the third party.
Changes in the financial condition of the borrower or economic conditions or other circumstances may reduce the capacity of the borrower to make principal and interest payments on such instruments and may lead to defaults. The value of any collateral securing a bank loan may decline after the Fund invests, and there is a risk that the value of the collateral may not be sufficient to cover the amount owed to the Fund.
At December 31, 2012, the Funds had no unfunded loan commitments.
Repurchase Agreements
Each Fund may enter into repurchase agreements with certain banks and broker-dealers whereby a Fund acquires a security for cash and obtains a simultaneous commitment from the seller to repurchase the security at an agreed upon price and date. A Fund, through its custodian, takes possession of the securities collateralizing the repurchase agreement in a segregated account. Repurchase agreements must be fully collateralized at all times, but involve some risk to a Fund if the other party should default on its obligation and the Fund is delayed or prevented from recovering the collateral, or if the Fund is required to return collateral to a borrower at a time when it may realize a loss on the investment of that collateral. Collateral for certain tri-party repurchase agreements is held at the Fund’s custodian or sub-custodian in a segregated account for the benefit of the Fund and the counterparty.
Reverse Repurchase Agreements and Treasury Rolls
Each Fund may enter into reverse repurchase agreements or Treasury rolls with banks and broker-dealers to enhance return. Reverse repurchase agreements involve sales by a Fund of portfolio securities concurrently with an agreement by the Fund to repurchase the same securities at a later date at a fixed price (typically equal to the original sale price plus interest). During the reverse repurchase agreement period, the Fund continues to receive principal and interest payments on the securities and also has the opportunity to earn a return on the purchase price received by it from the counterparty. Similarly, in a Treasury roll transaction, a Fund sells a Treasury security and simultaneously enters into an agreement to repurchase the security from the buyer at a later date, at the original sale price plus interest. The repurchase price is typically adjusted to provide the Fund the economic benefit of any interest that accrued on the Treasury security during the term of the transaction. The Fund may use the purchase price received by it to earn additional return during the term of the Treasury roll transaction.
Reverse repurchase agreements and Treasury rolls generally create investment leverage. If the counterparty in such a transaction files for bankruptcy or becomes insolvent, a Fund’s use of the proceeds from the sale of its securities may be restricted or forfeited, and the counterparty may fail to return/resell the securities in question to the Fund.
A Fund accounts for a Treasury roll transaction as a purchase and sale whereby the difference in the sales price and purchase price of the security sold is recorded as a realized gain (loss). If certain criteria are met, these Treasury roll transactions may be considered financing transactions, whereby the difference in the sales price and the future price is recorded as an adjustment to interest income.
The Fund(s) listed in the following table had reverse repurchase transactions during the year ended December 31, 2012;
| | | | |
| PIMCO Total Return Fund | | | | |
Average balance outstanding | | $ | 760,797 | |
Maximum balance outstanding | | $ | 9,723,780 | |
Average interest rate | | | 0.01% | |
Weighted average maturity | | | 2 days | |
198
Notes to Financial Statements (Continued)
Average balance outstanding was calculated based on daily balances outstanding during the period that the Fund had entered into reverse repurchase agreements.
The Fund(s) listed in the following table had Treasury roll transactions during the year ended December 31, 2012, which were accounted for as financing transactions:
| | | | |
| PIMCO Total Return Fund | | | | |
Average balance outstanding | | $ | 716,303 | |
Weighted average interest rate | | | (0.05)% | |
Average balance outstanding was calculated based on daily balances outstanding during the period that the Fund had entered into Treasury roll transactions.
Securities Lending
Each Fund may lend its securities to qualified brokers; however, securities lending cannot exceed 33% of the total assets of the Fund taken at current value.
The loans are collateralized at all times with cash or securities with a market value at least equal to 100% of the market value of the securities on loan. The market value of the loaned securities is determined at the close of business of a Fund and any additional collateral is delivered to the Fund the next business day. As with other extensions of credit, the Funds may bear the risk of delay in recovery or even loss of rights in the collateral should the borrower of the securities fail financially. The Funds receive compensation for lending their securities in the form of a securities loan fee paid by the borrower, as well as a share of the income earned on investment of the cash collateral received for the loan of securities.
The Funds employ an agent to implement their securities lending program and the agent receives a fee from the Funds for its services. In addition, the Funds may be required to pay a rebate to the borrower. Accordingly, a Fund’s compensation for lending its securities is reduced by any such fees or rebate paid to the securities lending agent or borrower, respectively. For the year ended December 31, 2012, the Fund(s) earned securities lending net income as follows:
| | | | | | | | | | | | |
| | | Securities
Lending Gross
Income | | | Securities
Lending Fees
and Expenses | | | Securities
Lending Net
Income | |
Foreign Fund | | $ | 76,373 | | | $ | 15,244 | | | $ | 61,129 | |
Global Fund | | | 10,962 | | | | 2,175 | | | | 8,787 | |
Large Cap Value Fund | | | 14,951 | | | | 2,973 | | | | 11,978 | |
Mid Cap Growth Fund | | | 82,688 | | | | 16,417 | | | | 66,271 | |
Small Cap Growth Equity Fund | | | 285,496 | | | | 56,772 | | | | 228,724 | |
Small Company Value Fund | | | 48,726 | | | | 9,704 | | | | 39,022 | |
| | | | | | | | | | | | |
| | $ | 519,196 | | | $ | 103,285 | | | $ | 415,911 | |
| | | | | | | | | | | | |
Accounting for Investment Transactions
Investment transactions are accounted for on the trade date. Realized gains and losses on sales of investments and unrealized appreciation and depreciation of investments are computed by the specific identification cost method. Proceeds received from litigation, if any, are included in realized gains on investment transactions for any investments that are no longer held in the portfolio and as a reduction in cost for investments that continue to be held in the portfolio. Interest income, adjusted for amortization of discounts and premiums on debt securities, is earned from the settlement date and is recorded on the accrual basis. Dividend income is recorded on the ex-dividend date. Withholding taxes on foreign interest, dividends, and capital gains have been provided for in accordance with the applicable country’s tax rules and rates. Foreign dividend income is recorded on the
199
Notes to Financial Statements (Continued)
ex-dividend date or as soon as practicable after the Fund determines the existence of a dividend declaration after exercising reasonable due diligence. Distributions received on securities that represent a return of capital or capital gain are recorded as a reduction of cost of investments and/or as a realized gain. The Funds estimate the components of distributions received that may be considered return of capital distributions or capital gain distributions.
Foreign Currency Translation
The books and records of the Funds are maintained in U.S. dollars. The market values of foreign currencies, foreign securities, and other assets and liabilities denominated in foreign currencies are translated into U.S. dollars at the mean of the buying and selling rates of such currencies against the U.S. dollar at the end of each business day. Purchases and sales of foreign securities and income and expense items are translated at the rates of exchange prevailing on the respective dates of such transactions. The Funds do not isolate that portion of the results of operations arising from changes in the exchange rates from that portion arising from changes in the market prices of securities. Net realized foreign currency gains and losses resulting from changes in exchange rates include foreign currency gains and losses between trade date and settlement date on investment securities transactions, foreign currency transactions, and the difference between the amounts of dividends or interest recorded on the books of the Funds and the amount actually received.
Allocation of Operating Activity
In maintaining the records for the Funds, the income and expense accounts are allocated to each class of shares. Investment income and loss, and unrealized and realized gains or losses are prorated among the classes of shares based on the relative net assets of each. Expenses are allocated to each class of shares depending on the nature of the expenditures. Administration and service fees, if any, which are directly attributable to a class of shares, are charged to that class’s operations. Expenses of the Fund not directly attributable to the operations of any class of shares or Fund are prorated among the Funds and classes to which the expense relates based on the relative net assets of each.
Foreign Securities
The Foreign Fund invests substantially all of its assets and the Global Fund invests a significant amount of its assets in foreign securities. The other Funds may also invest in foreign securities. Foreign securities, including ADRs, are subject to additional risks compared to securities of U.S. issuers, including international trade, currency, political, regulatory, and diplomatic risks. In addition, fluctuations in currency exchange rates may adversely affect the values of foreign securities and the price of a Fund’s shares. Emerging markets securities are subject to greater risks than securities issued in developed foreign markets, including less liquidity, greater price volatility, higher relative rates of inflation, greater political, economic, and social instability, greater custody and operational risks, and greater volatility in currency exchange rates.
Credit Risk
The Funds may invest a portion of their assets, directly or indirectly, in securities backed by mortgage loans, credit card receivables, and automotive loans. The values and related income of these securities are sensitive to changes in economic conditions, including delinquencies and/or defaults. Continuing shifts in the market’s perception of credit quality on such securities have resulted in increased volatility of market price and periods of decreased market activity that have adversely impacted the valuation and liquidity of such securities.
Federal Income Tax
It is each Fund’s intent to continue to comply with the provisions of subchapter M of the Internal Revenue Code of 1986, as amended (the “Code”), applicable to a regulated investment company. Under such provisions, the Funds would not be subject to federal income taxes on their ordinary income and net realized capital gains to the extent they are distributed or deemed to have been distributed to their shareholders. Therefore, the Funds have not made any provision for federal income tax.
200
Notes to Financial Statements (Continued)
Dividends and Distributions to Shareholders
Dividends from net investment income and distributions of any net realized capital gains of each Fund are declared and paid annually and at other times as may be required to satisfy tax or regulatory requirements.
Distributions to shareholders are recorded on the ex-dividend date. Income and capital gain distributions are determined in accordance with income tax regulations, which may differ from generally accepted accounting principles. As a result, net investment income and net realized capital gains on investment transactions for a reporting period may differ significantly from distributions during such period.
| 3. | | Management Fees and Other Transactions |
Investment Management Fees
Under agreements between MassMutual and the Trust on behalf of each Fund, MassMutual is responsible for providing investment management services for each Fund. In return for these services, MassMutual receives advisory fees, based upon each Fund’s average daily net assets, at the following annual rates:
| | |
Blue Chip Growth Fund* | | 0.75% on the first $600 million; and |
| | 0.70% on any excess over $600 million |
Equity Income Fund* | | 0.75% on the first $750 million; |
| | 0.725% on the next $250 million; and |
| | 0.70% on any excess over $1 billion |
Equity Index Fund* | | 0.10% on the first $750 million; and |
| | 0.08% on any excess over $750 million |
Focused Equity Fund | | 0.75% |
Foreign Fund* | | 0.89% on the first $500 million; and |
| | 0.85% on any excess over $500 million |
Fundamental Growth Fund | | 0.70% |
Fundamental Value Fund* | | 0.65% on the first $1 billion; and |
| | 0.625% on any excess over $1 billion |
Global Fund | | 0.60% |
Growth & Income Fund | | 0.50% |
Income & Growth Fund | | 0.65% |
Large Cap Growth Fund | | 0.65% |
Large Cap Value Fund | | 0.80% on the first $100 million; |
| | 0.75% on the next $400 million; and |
| | 0.70% on any excess over $500 million |
Mid Cap Growth Fund | | 0.77% |
Mid Cap Value Fund | | 0.84% |
PIMCO Total Return Fund | | 0.50% |
Small Cap Growth Equity Fund | | 1.075% on the first $200 million; |
| | 1.05% on the next $200 million; |
| | 1.025% on the next $600 million; and |
| | 1.00% on any excess over $1 billion |
Small Company Value Fund | | 0.85% |
Small/Mid Cap Value Fund | | 0.75% |
| * | Prior to June 1, 2012, the investment management fees were as follows: |
| | |
Blue Chip Growth Fund | | 0.75% |
Equity Income Fund | | 0.75% |
Equity Index Fund | | 0.10% |
Foreign Fund | | 0.89% |
Fundamental Value Fund | | 0.65% |
201
Notes to Financial Statements (Continued)
MassMutual has entered into investment subadvisory agreements with the following unaffiliated investment subadvisers: AllianceBernstein L.P. for the Small/Mid Cap Value Fund; American Century Investment Management, Inc. for the Mid Cap Value Fund; BlackRock Investment Management, LLC for the Income & Growth Fund; Davis Selected Advisers, L.P. for the Large Cap Value Fund; Harris Associates L.P. for the Focused Equity Fund; Massachusetts Financial Services Company for the Global Fund and Growth & Income Fund; Northern Trust Investments, Inc. for the Equity Index Fund; Pacific Investment Management Company LLC for the PIMCO Total Return Fund; Rainier Investment Management, Inc. for the Large Cap Growth Fund; Templeton Investment Counsel, LLC for the Foreign Fund; T. Rowe Price Associates, Inc. for the Blue Chip Growth Fund, Equity Income Fund, Mid Cap Growth Fund, and Small Company Value Fund; Waddell & Reed Investment Management Company for a portion of the Small Cap Growth Equity Fund; and Wellington Management Company, LLP for the Fundamental Growth Fund, Fundamental Value Fund, and a portion of the Small Cap Growth Equity Fund. MassMutual pays a subadvisory fee to each of these subadvisers based upon the aggregate net assets under management which include (1) the average daily net assets of the specified Fund which it manages, and, if applicable, (2) the average daily net assets of all other funds or accounts of MassMutual or its affiliates for which the subadviser provides subadvisory services and which have substantially the same investment objectives, policies and investment strategies.
The Funds’ subadvisory fees are paid by MassMutual out of the management fees previously disclosed above.
Administration Fees
For the Equity Index Fund, Focused Equity Fund, Fundamental Growth Fund, Fundamental Value Fund, Global Fund, PIMCO Total Return Fund, and Small Company Value Fund, under separate administrative and shareholder services agreements between the Funds and MassMutual, MassMutual provides certain administrative and shareholder services and bears some of the class specific administrative expenses. In return for these services, MassMutual receives an administrative services fee based upon the average daily net assets of the applicable class of shares of the Funds, at the following annual rates:
| | | | | | | | | | | | |
| | | Class I | | Class II | | | Class III | | | Service Class I |
Equity Index Fund | | 0.30% on the first $100 million; 0.28% on the next $150 million; and 0.26% on any excess over $250 million | | | 0.19% | | | | 0.05% | | | 0.30% on the first $100 million; 0.28% on the next $150 million; and 0.26% on any excess over $250 million |
Focused Equity Fund | | None | | | 0.10% | | | | None | | | 0.10% |
Fundamental Growth Fund | | None | | | 0.10% | | | | None | | | 0.10% |
Fundamental Value Fund | | None | | | 0.10% | | | | None | | | 0.10% |
Global Fund | | 0.28% | | | 0.18% | | | | None | | | 0.28% |
PIMCO Total Return Fund | | None | | | 0.10% | | | | None | | | 0.10% |
Small Company Value Fund | | None | | | 0.25% | | | | None | | | 0.25% |
Distribution and Service Fees
MML Distributors, LLC (the “Distributor”) acts as distributor to the Funds. Pursuant to a Distribution and Services Plan adopted by the Funds pursuant to Rule 12b-1 under the 1940 Act, Service Class shares and Service Class I shares of the Funds pay an annual fee of 0.25% of the average daily net asset value of Service Class shares and Service Class I shares. This fee, or a portion thereof, is paid to: (i) the Distributor for services provided and expenses incurred by it in connection with the distribution of Service Class shares or Service Class I shares, as applicable, of each Fund; and/or (ii) MassMutual for services provided and expenses incurred by it for purposes of maintaining or providing personal services to Service Class and Service Class I shareholders.
202
Notes to Financial Statements (Continued)
Expense Caps and Waivers
MassMutual agreed to cap the fees and expenses of the Funds noted below (other than extraordinary litigation and legal expenses, Acquired Fund fees and expenses#, interest expense, short sale dividend and loan expense, or other non-recurring or unusual expenses such as, for example, organizational expenses and shareholder meeting expenses) based upon the average daily net assets of the applicable class of shares of the Funds, as follows:
| | | | | | | | | | | | | | | | |
| | | Class I | | | Class II | | | Class III | | | Service Class I | |
Equity Index Fund**^ | | | 0.05% | | | | 0.05% | | | | 0.05% | | | | 0.05% | |
Focused Equity Fund* | | | None | | | | 0.90% | | | | None | | | | 1.15% | |
Fundamental Growth Fund* | | | None | | | | 0.85% | | | | None | | | | 1.10% | |
Fundamental Value Fund* | | | None | | | | 0.80% | | | | None | | | | 1.05% | |
Global Fund* | | | 0.90% | | | | 0.80% | | | | None | | | | 1.15% | |
PIMCO Total Return Fund* | | | None | | | | 0.65% | | | | None | | | | 0.90% | |
Small Company Value Fund* | | | None | | | | 1.15% | | | | None | | | | 1.40% | |
| # | Acquired Fund fees and expenses are expenses borne indirectly by a Fund through investments in other pooled investment vehicles. |
| * | Expense caps in effect through April 30, 2013. Interest expense and short sale dividend and loan expense were not excluded from the caps prior to May 1, 2012. |
| ** | Expense caps in effect through April 30, 2012. Short sale dividend and loan expense was not excluded. |
| ^ | Expense cap also excludes the management, Rule 12b-1 and administrative fees, taxes and brokerage commissions. |
MassMutual has agreed to waive, through April 30, 2013, 0.05% of the administrative and shareholder service fee for Class II and Class III shares of the Equity Index Fund. Effective September 12, 2012, MassMutual has agreed to voluntarily waive 0.035% of the management fee for the Small Cap Growth Equity Fund.
Expense caps and waiver amounts are reflected as a reduction of expenses on the Statements of Operations.
Rebated Brokerage Commissions
The Funds listed below have entered into agreements with certain brokers whereby the brokers will rebate to the Funds, in cash, a portion of brokerage commissions. Rebated brokerage commissions are amounts earned by the Funds and are included with realized gain or loss on investment transactions presented in the Statements of Operations. For the year ended December 31, 2012, brokerage commissions rebated under these agreements were as follows:
| | | | |
| | | Rebated
Commissions | |
Foreign Fund | | $ | 81 | |
Fundamental Growth Fund | | | 20 | |
Fundamental Value Fund | | | 1,532 | |
Large Cap Growth Fund | | | 2,273 | |
Large Cap Value Fund | | | 886 | |
Small Cap Growth Equity Fund | | | 112,357 | |
Small/Mid Cap Value Fund | | | 1,549 | |
Deferred Compensation
Trustees of the Funds who are not employees of MassMutual or its subsidiaries may elect to defer receipt of their annual fees in accordance with terms of a Non-Qualified Deferred Compensation Plan. Amounts deferred shall accrue interest or earnings and shall be recorded on the Funds’ books as other liabilities. Deferred compensation is included within Trustees’ fees and expenses in the Statements of Assets and Liabilities.
203
Notes to Financial Statements (Continued)
Other
Certain officers and trustees of the Funds are also employees of MassMutual. The compensation of each trustee who is not an employee of MassMutual is borne by the Funds.
| 4. | | Purchases and Sales of Investments |
Cost of purchases and proceeds from sales of investment securities (excluding short-term investments) for the year ended December 31, 2012, were as follows:
| | | | | | | | | | | | | | | | |
| | | Purchases | | | Sales | |
| | | Long-Term U.S.
Government
Securities | | | Other
Long-Term
Securities | | | Long-Term U.S.
Government
Securities | | | Other
Long-Term
Securities | |
Blue Chip Growth Fund | | $ | - | | | $ | 82,870,651 | | | $ | - | | | $ | 138,006,808 | |
Equity Income Fund | | | - | | | | 72,132,114 | | | | - | | | | 177,310,375 | |
Equity Index Fund | | | - | | | | 10,603,843 | | | | - | | | | 27,662,217 | |
Focused Equity Fund | | | - | | | | 39,519,398 | | | | - | | | | 39,962,703 | |
Foreign Fund | | | - | | | | 54,594,634 | | | | - | | | | 47,481,865 | |
Fundamental Growth Fund | | | - | | | | 119,904,377 | | | | - | | | | 112,146,151 | |
Fundamental Value Fund | | | - | | | | 41,660,883 | | | | - | | | | 51,825,921 | |
Global Fund | | | - | | | | 28,927,010 | | | | - | | | | 14,339,582 | |
Growth & Income Fund | | | - | | | | 34,129,202 | | | | - | | | | 53,410,397 | |
Income & Growth Fund | | | - | | | | 80,224,775 | | | | - | | | | 4,329,122 | |
Large Cap Growth Fund | | | - | | | | 179,127,712 | | | | - | | | | 187,417,593 | |
Large Cap Value Fund | | | - | | | | 22,084,594 | | | | - | | | | 43,253,561 | |
Mid Cap Growth Fund | | | - | | | | 106,778,213 | | | | - | | | | 119,813,180 | |
Mid Cap Value Fund | | | - | | | | 354,479,601 | | | | - | | | | 379,002,162 | |
PIMCO Total Return Fund | | | 2,161,396,249 | | | | 39,652,848 | | | | 2,034,406,527 | | | | 39,256,345 | |
Small Cap Growth Equity Fund | | | - | | | | 229,040,342 | | | | - | | | | 258,341,812 | |
Small Company Value Fund | | | - | | | | 15,569,642 | | | | - | | | | 17,272,394 | |
Small/Mid Cap Value Fund | | | - | | | | 85,421,768 | | | | - | | | | 109,245,131 | |
| 5. | | Capital Share Transactions |
Changes in shares outstanding for each Fund were as follows:
| | | | | | | | | | | | | | | | |
| | | Year Ended December 31, 2012 | | | Year Ended December 31, 2011 | |
| | | | |
| | | Shares | | | Amount | | | Shares | | | Amount | |
Blue Chip Growth Fund Initial Class | | | | | | | | | | | | | | | | |
Sold | | | 3,038,667 | | | $ | 39,781,954 | | | | 2,916,726 | | | $ | 33,187,507 | |
Issued as reinvestment of dividends | | | 20,086 | | | | 267,550 | | | | 11,429 | | | | 128,353 | |
Redeemed | | | (7,612,426 | ) | | | (98,244,626 | ) | | | (4,396,963 | ) | | | (51,201,851 | ) |
| | | | | | | | | | | | | | | | |
Net increase (decrease) | | | (4,553,673 | ) | | $ | (58,195,122 | ) | | | (1,468,808 | ) | | $ | (17,885,991 | ) |
| | | | | | | | | | | | | | | | |
Blue Chip Growth Fund Service Class | | | | | | | | | | | | | | | | |
Sold | | | 431,924 | | | $ | 5,601,619 | | | | 292,777 | | | $ | 3,344,457 | |
Issued as reinvestment of dividends | | | - | | | | - | | | | - | | | | - | |
Redeemed | | | (154,393 | ) | | | (2,007,236 | ) | | | (155,697 | ) | | | (1,778,015 | ) |
| | | | | | | | | | | | | | | | |
Net increase (decrease) | | | 277,531 | | | $ | 3,594,383 | | | | 137,080 | | | $ | 1,566,442 | |
| | | | | | | | | | | | | | | | |
204
Notes to Financial Statements (Continued)
| | | | | | | | | | | | | | | | |
| | | Year Ended December 31, 2012 | | | Year Ended December 31, 2011 | |
| | | | |
| | | Shares | | | Amount | | | Shares | | | Amount | |
Equity Income Fund Initial Class | | | | | | | | | | | | | | | | |
Sold | | | 2,970,596 | | | $ | 30,007,399 | | | | 4,401,336 | | | $ | 38,920,863 | |
Issued as reinvestment of dividends | | | 969,050 | | | | 9,826,163 | | | | 1,009,197 | | | | 8,870,840 | |
Redeemed | | | (14,351,877 | ) | | | (143,251,167 | ) | | | (8,117,821 | ) | | | (76,912,353 | ) |
| | | | | | | | | | | | | | | | |
Net increase (decrease) | | | (10,412,231 | ) | | $ | (103,417,605 | ) | | | (2,707,288 | ) | | $ | (29,120,650 | ) |
| | | | | | | | | | | | | | | | |
Equity Income Fund Service Class | | | | | | | | | | | | | | | | |
Sold | | | 656,313 | | | $ | 6,605,555 | | | | 885,299 | | | $ | 8,269,125 | |
Issued as reinvestment of dividends | | | 68,266 | | | | 688,805 | | | | 50,559 | | | | 442,894 | |
Redeemed | | | (350,743 | ) | | | (3,480,741 | ) | | | (213,038 | ) | | | (1,941,626 | ) |
| | | | | | | | | | | | | | | | |
Net increase (decrease) | | | 373,836 | | | $ | 3,813,619 | | | | 722,820 | | | $ | 6,770,393 | |
| | | | | | | | | | | | | | | | |
Equity Index Fund Class I | | | | | | | | | | | | | | | | |
Sold | | | 286,277 | | | $ | 4,963,876 | | | | 217,630 | | | $ | 3,470,318 | |
Issued as reinvestment of dividends | | | 68,635 | | | | 1,206,610 | | | | 83,330 | | | | 1,253,286 | |
Redeemed | | | (700,301 | ) | | | (12,140,754 | ) | | | (697,958 | ) | | | (11,095,204 | ) |
| | | | | | | | | | | | | | | | |
Net increase (decrease) | | | (345,389 | ) | | $ | (5,970,268 | ) | | | (396,998 | ) | | $ | (6,371,600 | ) |
| | | | | | | | | | | | | | | | |
Equity Index Fund Class II | | | | | | | | | | | | | | | | |
Sold | | | 432,504 | | | $ | 7,519,183 | | | | 409,315 | | | $ | 6,510,464 | |
Issued as reinvestment of dividends | | | 104,021 | | | | 1,830,763 | | | | 123,767 | | | | 1,863,933 | |
Redeemed | | | (1,151,450 | ) | | | (19,975,060 | ) | | | (1,133,865 | ) | | | (18,251,446 | ) |
| | | | | | | | | | | | | | | | |
Net increase (decrease) | | | (614,925 | ) | | $ | (10,625,114 | ) | | | (600,783 | ) | | $ | (9,877,049 | ) |
| | | | | | | | | | | | | | | | |
Equity Index Fund Class III | | | | | | | | | | | | | | | | |
Sold | | | 30,235 | | | $ | 535,573 | | | | 935 | | | $ | 14,202 | |
Issued as reinvestment of dividends | | | 122,702 | | | | 2,157,110 | | | | 135,327 | | | | 2,033,964 | |
Redeemed | | | (283,465 | ) | | | (4,966,395 | ) | | | (91,860 | ) | | | (1,455,812 | ) |
| | | | | | | | | | | | | | | | |
Net increase (decrease) | | | (130,528 | ) | | $ | (2,273,712 | ) | | | 44,402 | | | $ | 592,354 | |
| | | | | | | | | | | | | | | | |
Equity Index Fund Service Class I | | | | | | | | | | | | | | | | |
Sold | | | 240,445 | | | $ | 4,126,995 | | | | 222,351 | | | $ | 3,467,205 | |
Issued as reinvestment of dividends | | | 7,518 | | | | 130,207 | | | | 6,169 | | | | 91,663 | |
Redeemed | | | (68,723 | ) | | | (1,168,162 | ) | | | (37,826 | ) | | | (576,841 | ) |
| | | | | | | | | | | | | | | | |
Net increase (decrease) | | | 179,240 | | | $ | 3,089,040 | | | | 190,694 | | | $ | 2,982,027 | |
| | | | | | | | | | | | | | | | |
Focused Equity Fund Class II* | | | | | | | | | | | | | | | | |
Sold | | | 12,300,977 | | | $ | 135,851,304 | | | | 11,000,000 | | | $ | 110,000,000 | |
Issued as reinvestment of dividends | | | 594,593 | | | | 6,825,934 | | | | 17,374 | | | | 166,793 | |
Redeemed | | | (12,051,004 | ) | | | (133,195,866 | ) | | | - | | | | - | |
| | | | | | | | | | | | | | | | |
Net increase (decrease) | | | 844,566 | | | $ | 9,481,372 | | | | 11,017,374 | | | $ | 110,166,793 | |
| | | | | | | | | | | | | | | | |
Focused Equity Fund Service Class I** | | | | | | | | | | | | | | | | |
Sold | | | 75,330 | | | $ | 843,504 | | | | | | | | | |
Issued as reinvestment of dividends | | | 3,530 | | | | 40,487 | | | | | | | | | |
Redeemed | | | (7,616 | ) | | | (86,930 | ) | | | | | | | | |
| | | | | | | | | | | | | | | | |
Net increase (decrease) | | | 71,244 | | | $ | 797,061 | | | | | | | | | |
| | | | | | | | | | | | | | | | |
Foreign Fund Initial Class | | | | | | | | | | | | | | | | |
Sold | | | 5,361,549 | | | $ | 46,254,081 | | | | 4,136,946 | | | $ | 34,749,775 | |
Issued as reinvestment of dividends | | | 865,010 | | | | 7,361,231 | | | | 726,068 | | | | 6,113,493 | |
Redeemed | | | (6,006,857 | ) | | | (52,826,074 | ) | | | (4,320,957 | ) | | | (39,621,804 | ) |
| | | | | | | | | | | | | | | | |
Net increase (decrease) | | | 219,702 | | | $ | 789,238 | | | | 542,057 | | | $ | 1,241,464 | |
| | | | | | | | | | | | | | | | |
205
Notes to Financial Statements (Continued)
| | | | | | | | | | | | | | | | |
| | | Year Ended December 31, 2012 | | | Year Ended December 31, 2011 | |
| | | | |
| | | Shares | | | Amount | | | Shares | | | Amount | |
Foreign Fund Service Class | | | | | | | | | | | | | | | | |
Sold | | | 130,716 | | | $ | 1,118,100 | | | | 134,908 | | | $ | 1,203,806 | |
Issued as reinvestment of dividends | | | 14,842 | | | | 125,859 | | | | 12,124 | | | | 101,845 | |
Redeemed | | | (122,294 | ) | | | (1,073,653 | ) | | | (91,868 | ) | | | (839,043 | ) |
| | | | | | | | | | | | | | | | |
Net increase (decrease) | | | 23,264 | | | $ | 170,306 | | | | 55,164 | | | $ | 466,608 | |
| | | | | | | | | | | | | | | | |
Fundamental Growth Fund Class II* | | | | | | | | | | | | | | | | |
Sold | | | 17,301,697 | | | $ | 192,143,061 | | | | 15,000,000 | | | $ | 150,000,000 | |
Issued as reinvestment of dividends | | | 462,370 | | | | 5,132,313 | | | | - | | | | - | |
Redeemed | | | (16,326,622 | ) | | | (181,166,937 | ) | | | - | | | | - | |
| | | | | | | | | | | | | | | | |
Net increase (decrease) | | | 1,437,445 | | | $ | 16,108,437 | | | | 15,000,000 | | | $ | 150,000,000 | |
| | | | | | | | | | | | | | | | |
Fundamental Growth Fund Service Class I** | | | | | | | | | | | | | | | | |
Sold | | | 49,338 | | | $ | 548,919 | | | | | | | | | |
Issued as reinvestment of dividends | | | 1,318 | | | | 14,599 | | | | | | | | | |
Redeemed | | | (3,273 | ) | | | (36,732 | ) | | | | | | | | |
| | | | | | | | | | | | | | | | |
Net increase (decrease) | | | 47,383 | | | $ | 526,786 | | | | | | | | | |
| | | | | | | | | | | | | | | | |
Fundamental Value Fund Class II | | | | | | | | | | | | | | | | |
Sold | | | 1,822,064 | | | $ | 21,820,832 | | | | 5,217,989 | | | $ | 57,202,389 | |
Issued as reinvestment of dividends | | | 239,576 | | | | 2,874,916 | | | | 19,242 | | | | 199,927 | |
Redeemed | | | (3,028,092 | ) | | | (36,090,352 | ) | | | (805,857 | ) | | | (8,207,485 | ) |
| | | | | | | | | | | | | | | | |
Net increase (decrease) | | | (966,452 | ) | | $ | (11,394,604 | ) | | | 4,431,374 | | | $ | 49,194,831 | |
| | | | | | | | | | | | | | | | |
Fundamental Value Fund Service Class I** | | | | | | | | | | | | | | | | |
Sold | | | 32,686 | | | $ | 397,064 | | | | | | | | | |
Issued as reinvestment of dividends | | | 244 | | | | 2,923 | | | | | | | | | |
Redeemed | | | (2,260 | ) | | | (27,590 | ) | | | | | | | | |
| | | | | | | | | | | | | | | | |
Net increase (decrease) | | | 30,670 | | | $ | 372,397 | | | | | | | | | |
| | | | | | | | | | | | | | | | |
Global Fund Class I | | | | | | | | | | | | | | | | |
Sold | | | 2,845,061 | | | $ | 25,222,955 | | | | 2,628,306 | | | $ | 21,407,446 | |
Issued as reinvestment of dividends | | | 133,160 | | | | 1,205,096 | | | | 101,702 | | | | 819,719 | |
Redeemed | | | (1,117,187 | ) | | | (10,047,254 | ) | | | (1,081,040 | ) | | | (9,224,303 | ) |
| | | | | | | | | | | | | | | | |
Net increase (decrease) | | | 1,861,034 | | | $ | 16,380,797 | | | | 1,648,968 | | | $ | 13,002,862 | |
| | | | | | | | | | | | | | | | |
Global Fund Class II | | | | | | | | | | | | | | | | |
Sold | | | 84,572 | | | $ | 763,261 | | | | 114,991 | | | $ | 982,634 | |
Issued as reinvestment of dividends | | | 17,697 | | | | 162,460 | | | | 20,456 | | | | 167,123 | |
Redeemed | | | (335,760 | ) | | | (3,053,433 | ) | | | (490,953 | ) | | | (4,219,228 | ) |
| | | | | | | | | | | | | | | | |
Net increase (decrease) | | | (233,491 | ) | | $ | (2,127,712 | ) | | | (355,506 | ) | | $ | (3,069,471 | ) |
| | | | | | | | | | | | | | | | |
Global Fund Service Class I | | | | | | | | | | | | | | | | |
Sold | | | 155,998 | | | $ | 1,389,887 | | | | 146,423 | | | $ | 1,216,196 | |
Issued as reinvestment of dividends | | | 3,168 | | | | 28,603 | | | | 2,430 | | | | 19,559 | |
Redeemed | | | (71,560 | ) | | | (652,697 | ) | | | (25,835 | ) | | | (219,073 | ) |
| | | | | | | | | | | | | | | | |
Net increase (decrease) | | | 87,606 | | | $ | 765,793 | | | | 123,018 | | | $ | 1,016,682 | |
| | | | | | | | | | | | | | | | |
Growth & Income Fund Initial Class | | | | | | | | | | | | | | | | |
Sold | | | 299,018 | | | $ | 2,605,004 | | | | 284,443 | | | $ | 2,299,704 | |
Issued as reinvestment of dividends | | | 165,219 | | | | 1,472,103 | | | | 183,470 | | | | 1,414,550 | |
Redeemed | | | (2,827,748 | ) | | | (24,711,106 | ) | | | (3,332,682 | ) | | | (27,201,589 | ) |
| | | | | | | | | | | | | | | | |
Net increase (decrease) | | | (2,363,511 | ) | | $ | (20,633,999 | ) | | | (2,864,769 | ) | | $ | (23,487,335 | ) |
| | | | | | | | | | | | | | | | |
206
Notes to Financial Statements (Continued)
| | | | | | | | | | | | | | | | |
| | | Year Ended December 31, 2012 | | | Year Ended December 31, 2011 | |
| | | | |
| | | Shares | | | Amount | | | Shares | | | Amount | |
Growth & Income Fund Service Class | | | | | | | | | | | | | | | | |
Sold | | | 167,055 | | | $ | 1,455,084 | | | | 95,255 | | | $ | 756,663 | |
Issued as reinvestment of dividends | | | 13,663 | | | | 121,326 | | | | 11,217 | | | | 86,148 | |
Redeemed | | | (128,750 | ) | | | (1,112,016 | ) | | | (467,490 | ) | | | (3,898,348 | ) |
| | | | | | | | | | | | | | | | |
Net increase (decrease) | | | 51,968 | | | $ | 464,394 | | | | (361,018 | ) | | $ | (3,055,537 | ) |
| | | | | | | | | | | | | | | | |
Income & Growth Fund Initial Class | | | | | | | | | | | | | | | | |
Sold | | | 9,803,508 | | | $ | 88,820,522 | | | | 3,131,271 | | | $ | 25,696,930 | |
Issued as reinvestment of dividends | | | 191,232 | | | | 1,768,900 | | | | 252,809 | | | | 2,052,810 | |
Redeemed | | | (2,269,354 | ) | | | (20,808,243 | ) | | | (1,747,858 | ) | | | (14,926,030 | ) |
| | | | | | | | | | | | | | | | |
Net increase (decrease) | | | 7,725,386 | | | $ | 69,781,179 | | | | 1,636,222 | | | $ | 12,823,710 | |
| | | | | | | | | | | | | | | | |
Income & Growth Fund Service Class | | | | | | | | | | | | | | | | |
Sold | | | 302,779 | | | $ | 2,749,232 | | | | 560,284 | | | $ | 4,821,339 | |
Issued as reinvestment of dividends | | | 10,579 | | | | 97,325 | | | | 27,552 | | | | 222,620 | |
Redeemed | | | (109,956 | ) | | | (1,002,238 | ) | | | (67,483 | ) | | | (578,309 | ) |
| | | | | | | | | | | | | | | | |
Net increase (decrease) | | | 203,402 | | | $ | 1,844,319 | | | | 520,353 | | | $ | 4,465,650 | |
| | | | | | | | | | | | | | | | |
Large Cap Growth Fund Initial Class | | | | | | | | | | | | | | | | |
Sold | | | 2,370,695 | | | $ | 26,659,276 | | | | 4,710,378 | | | $ | 47,532,590 | |
Issued as reinvestment of dividends | | | 10,790 | | | | 123,758 | | | | 37,915 | | | | 376,875 | |
Redeemed | | | (3,408,441 | ) | | | (38,617,738 | ) | | | (1,949,388 | ) | | | (20,372,534 | ) |
| | | | | | | | | | | | | | | | |
Net increase (decrease) | | | (1,026,956 | ) | | $ | (11,834,704 | ) | | | 2,798,905 | | | $ | 27,536,931 | |
| | | | | | | | | | | | | | | | |
Large Cap Growth Fund Service Class | | | | | | | | | | | | | | | | |
Sold | | | 25,252 | | | $ | 280,192 | | | | 87,848 | | | $ | 916,051 | |
Issued as reinvestment of dividends | | | - | | | | - | | | | 165 | | | | 1,629 | |
Redeemed | | | (18,207 | ) | | | (206,226 | ) | | | (43,634 | ) | | | (439,927 | ) |
| | | | | | | | | | | | | | | | |
Net increase (decrease) | | | 7,045 | | | $ | 73,966 | | | | 44,379 | | | $ | 477,753 | |
| | | | | | | | | | | | | | | | |
Large Cap Value Fund Initial Class | | | | | | | | | | | | | | | | |
Sold | | | 563,444 | | | $ | 6,745,377 | | | | 1,044,540 | | | $ | 11,727,693 | |
Issued as reinvestment of dividends | | | 114,553 | | | | 1,366,218 | | | | 171,292 | | | | 1,833,087 | |
Redeemed | | | (2,626,400 | ) | | | (30,978,092 | ) | | | (2,559,042 | ) | | | (29,104,180 | ) |
| | | | | | | | | | | | | | | | |
Net increase (decrease) | | | (1,948,403 | ) | | $ | (22,866,497 | ) | | | (1,343,210 | ) | | $ | (15,543,400 | ) |
| | | | | | | | | | | | | | | | |
Large Cap Value Fund Service Class | | | | | | | | | | | | | | | | |
Sold | | | 350,206 | | | $ | 4,137,537 | | | | 410,844 | | | $ | 4,599,891 | |
Issued as reinvestment of dividends | | | 9,135 | | | | 108,476 | | | | 11,918 | | | | 127,051 | |
Redeemed | | | (206,634 | ) | | | (2,432,514 | ) | | | (167,238 | ) | | | (1,928,281 | ) |
| | | | | | | | | | | | | | | | |
Net increase (decrease) | | | 152,707 | | | $ | 1,813,499 | | | | 255,524 | | | $ | 2,798,661 | |
| | | | | | | | | | | | | | | | |
Mid Cap Growth Fund Initial Class | | | | | | | | | | | | | | | | |
Sold | | | 2,635,901 | | | $ | 34,261,340 | | | | 2,780,661 | | | $ | 34,004,025 | |
Issued as reinvestment of dividends | | | 1,500,658 | | | | 18,818,251 | | | | - | | | | - | |
Redeemed | | | (3,933,400 | ) | | | (51,094,474 | ) | | | (4,491,896 | ) | | | (55,921,742 | ) |
| | | | | | | | | | | | | | | | |
Net increase (decrease) | | | 203,159 | | | $ | 1,985,117 | | | | (1,711,235 | ) | | $ | (21,917,717 | ) |
| | | | | | | | | | | | | | | | |
Mid Cap Growth Fund Service Class | | | | | | | | | | | | | | | | |
Sold | | | 413,025 | | | $ | 5,290,170 | | | | 593,880 | | | $ | 7,304,954 | |
Issued as reinvestment of dividends | | | 123,359 | | | | 1,530,879 | | | | - | | | | - | |
Redeemed | | | (164,235 | ) | | | (2,124,397 | ) | | | (107,465 | ) | | | (1,292,463 | ) |
| | | | | | | | | | | | | | | | |
Net increase (decrease) | | | 372,149 | | | $ | 4,696,652 | | | | 486,415 | | | $ | 6,012,491 | |
| | | | | | | | | | | | | | | | |
207
Notes to Financial Statements (Continued)
| | | | | | | | | | | | | | | | |
| | | Year Ended December 31, 2012 | | | Year Ended December 31, 2011 | |
| | | | |
| | | Shares | | | Amount | | | Shares | | | Amount | |
Mid Cap Value Fund Initial Class | | | | | | | | | | | | | | | | |
Sold | | | 2,713,077 | | | $ | 29,448,878 | | | | 4,519,649 | | | $ | 44,735,145 | |
Issued as reinvestment of dividends | | | 2,599,065 | | | | 27,368,158 | | | | 845,255 | | | | 8,190,527 | |
Redeemed | | | (5,987,540 | ) | | | (64,711,832 | ) | | | (5,443,603 | ) | | | (56,323,813 | ) |
| | | | | | | | | | | | | | | | |
Net increase (decrease) | | | (675,398 | ) | | $ | (7,894,796 | ) | | | (78,699 | ) | | $ | (3,398,141 | ) |
| | | | | | | | | | | | | | | | |
Mid Cap Value Fund Service Class | | | | | | | | | | | | | | | | |
Sold | | | 257,324 | | | $ | 2,771,129 | | | | 424,579 | | | $ | 4,320,603 | |
Issued as reinvestment of dividends | | | 89,089 | | | | 932,766 | | | | 23,190 | | | | 223,550 | |
Redeemed | | | (157,318 | ) | | | (1,689,009 | ) | | | (96,187 | ) | | | (952,515 | ) |
| | | | | | | | | | | | | | | | |
Net increase (decrease) | | | 189,095 | | | $ | 2,014,886 | | | | 351,582 | | | $ | 3,591,638 | |
| | | | | | | | | | | | | | | | |
PIMCO Total Return Fund Class II | | | | | | | | | | | | | | | | |
Sold | | | 7,303,849 | | | $ | 76,908,792 | | | | 11,707,541 | | | $ | 117,047,558 | |
Issued as reinvestment of dividends | | | 515,502 | | | | 5,464,322 | | | | 26,442 | | | | 267,068 | |
Redeemed | | | (1,853,083 | ) | | | (19,605,711 | ) | | | (2,770,352 | ) | | | (27,993,624 | ) |
| | | | | | | | | | | | | | | | |
Net increase (decrease) | | | 5,966,268 | | | $ | 62,767,403 | | | | 8,963,631 | | | $ | 89,321,002 | |
| | | | | | | | | | | | | | | | |
PIMCO Total Return Fund Service Class I** | | | | | | | | | | | | | | | | |
Sold | | | 582,570 | | | $ | 6,231,995 | | | | | | | | | |
Issued as reinvestment of dividends | | | 3,392 | | | | 35,888 | | | | | | | | | |
Redeemed | | | (54,854 | ) | | | (588,204 | ) | | | | | | | | |
| | | | | | | | | | | | | | | | |
Net increase (decrease) | | | 531,108 | | | $ | 5,679,679 | | | | | | | | | |
| | | | | | | | | | | | | | | | |
Small Cap Growth Equity Fund Initial Class | | | | | | | | | | | | | | | | |
Sold | | | 1,156,458 | | | $ | 19,523,695 | | | | 2,327,802 | | | $ | 36,752,778 | |
Issued as reinvestment of dividends | | | 1,650,316 | | | | 26,329,349 | | | | 635,838 | | | | 9,981,321 | |
Redeemed | | | (2,636,771 | ) | | | (45,358,431 | ) | | | (1,991,618 | ) | | | (35,874,701 | ) |
| | | | | | | | | | | | | | | | |
Net increase (decrease) | | | 170,003 | | | $ | 494,613 | | | | 972,022 | | | $ | 10,859,398 | |
| | | | | | | | | | | | | | | | |
Small Cap Growth Equity Fund Service Class | | | | | | | | | | | | | | | | |
Sold | | | 50,726 | | | $ | 858,613 | | | | 94,343 | | | $ | 1,621,277 | |
Issued as reinvestment of dividends | | | 37,745 | | | | 595,062 | | | | 13,176 | | | | 205,164 | |
Redeemed | | | (47,663 | ) | | | (804,678 | ) | | | (38,030 | ) | | | (668,879 | ) |
| | | | | | | | | | | | | | | | |
Net increase (decrease) | | | 40,808 | | | $ | 648,997 | | | | 69,489 | | | $ | 1,157,562 | |
| | | | | | | | | | | | | | | | |
Small Company Value Fund Class II | | | | | | | | | | | | | | | | |
Sold | | | 722,798 | | | $ | 13,012,293 | | | | 730,127 | | | $ | 12,256,881 | |
Issued as reinvestment of dividends | | | 164,027 | | | | 2,875,384 | | | | 88,561 | | | | 1,420,523 | |
Redeemed | | | (924,862 | ) | | | (16,746,882 | ) | | | (839,044 | ) | | | (14,072,203 | ) |
| | | | | | | | | | | | | | | | |
Net increase (decrease) | | | (38,037 | ) | | $ | (859,205 | ) | | | (20,356 | ) | | $ | (394,799 | ) |
| | | | | | | | | | | | | | | | |
Small Company Value Fund Service Class I | | | | | | | | | | | | | | | | |
Sold | | | 141,751 | | | $ | 2,490,797 | | | | 122,387 | | | $ | 2,097,556 | |
Issued as reinvestment of dividends | | | 9,339 | | | | 162,411 | | | | 3,170 | | | | 50,561 | |
Redeemed | | | (47,409 | ) | | | (839,658 | ) | | | (39,122 | ) | | | (650,833 | ) |
| | | | | | | | | | | | | | | | |
Net increase (decrease) | | | 103,681 | | | $ | 1,813,550 | | | | 86,435 | | | $ | 1,497,284 | |
| | | | | | | | | | | | | | | | |
Small/Mid Cap Value Fund Initial Class | | | | | | | | | | | | | | | | |
Sold | | | 661,493 | | | $ | 6,151,513 | | | | 2,266,753 | | | $ | 18,386,009 | |
Issued as reinvestment of dividends | | | 127,371 | | | | 1,197,285 | | | | 126,490 | | | | 1,037,218 | |
Redeemed | | | (4,164,313 | ) | | | (38,927,712 | ) | | | (2,942,206 | ) | | | (26,736,761 | ) |
| | | | | | | | | | | | | | | | |
Net increase (decrease) | | | (3,375,449 | ) | | $ | (31,578,914 | ) | | | (548,963 | ) | | $ | (7,313,534 | ) |
| | | | | | | | | | | | | | | | |
208
Notes to Financial Statements (Continued)
| | | | | | | | | | | | | | | | |
| | | Year Ended December 31, 2012 | | | Year Ended December 31, 2011 | |
| | | | |
| | | Shares | | | Amount | | | Shares | | | Amount | |
Small/Mid Cap Value Fund Service Class | | | | | | | | | | | | | | | | |
Sold | | | 152,305 | | | $ | 1,411,804 | | | | 243,770 | | | $ | 2,170,634 | |
Issued as reinvestment of dividends | | | 4,425 | | | | 41,422 | | | | 3,700 | | | | 30,232 | |
Redeemed | | | (120,770 | ) | | | (1,133,655 | ) | | | (105,479 | ) | | | (910,339 | ) |
| | | | | | | | | | | | | | | | |
Net increase (decrease) | | | 35,960 | | | $ | 319,571 | | | | 141,991 | | | $ | 1,290,527 | |
| | | | | | | | | | | | | | | | |
| * | Fund commenced operations on December 8, 2011. |
| ** | Service Class I shares commenced operations on May 1, 2012. |
| 6. | | Federal Income Tax Information |
At December 31, 2012, the cost of securities and the unrealized appreciation (depreciation) in the value of investments owned by the Funds, as computed on a federal income tax basis, were as follows:
| | | | | | | | | | | | | | | | |
| | | Federal Income
Tax Cost | | | Tax Basis
Unrealized
Appreciation | | | Tax Basis
Unrealized
(Depreciation) | | | Net Unrealized
Appreciation
(Depreciation) | |
Blue Chip Growth Fund | | $ | 248,784,239 | | | $ | 88,931,806 | | | $ | (1,605,742 | ) | | $ | 87,326,064 | |
Equity Income Fund | | | 436,926,103 | | | | 95,851,337 | | | | (15,190,037 | ) | | | 80,661,300 | |
Equity Index Fund | | | 247,936,176 | | | | 94,664,577 | | | | (25,319,392 | ) | | | 69,345,185 | |
Focused Equity Fund | | | 122,581,105 | | | | 17,579,806 | | | | (2,967,758 | ) | | | 14,612,048 | |
Foreign Fund | | | 383,311,447 | | | | 50,591,077 | | | | (45,330,583 | ) | | | 5,260,494 | |
Fundamental Growth Fund | | | 166,967,269 | | | | 15,548,049 | | | | (2,006,552 | ) | | | 13,541,497 | |
Fundamental Value Fund | | | 163,769,324 | | | | 26,347,063 | | | | (4,062,024 | ) | | | 22,285,039 | |
Global Fund | | | 118,525,904 | | | | 37,509,062 | | | | (1,397,555 | ) | | | 36,111,507 | |
Growth & Income Fund | | | 104,333,499 | | | | 25,045,171 | | | | (986,572 | ) | | | 24,058,599 | |
Income & Growth Fund | | | 158,865,505 | | | | 25,472,743 | | | | (1,419,558 | ) | | | 24,053,185 | |
Large Cap Growth Fund | | | 182,082,424 | | | | 26,026,154 | | | | (1,364,218 | ) | | | 24,661,936 | |
Large Cap Value Fund | | | 178,808,941 | | | | 43,823,061 | | | | (7,106,787 | ) | | | 36,716,274 | |
Mid Cap Growth Fund | | | 293,007,173 | | | | 84,227,934 | | | | (8,068,662 | ) | | | 76,159,272 | |
Mid Cap Value Fund | | | 433,628,113 | | | | 28,385,105 | | | | (7,543,872 | ) | | | 20,841,233 | |
PIMCO Total Return Fund | | | 405,546,553 | | | | 10,137,466 | | | | (1,016,485 | ) | | | 9,120,981 | |
Small Cap Growth Equity Fund | | | 257,848,150 | | | | 37,135,849 | | | | (8,824,157 | ) | | | 28,311,692 | |
Small Company Value Fund | | | 89,473,006 | | | | 37,106,888 | | | | (3,246,824 | ) | | | 33,860,064 | |
Small/Mid Cap Value Fund | | | 167,479,402 | | | | 21,027,998 | | | | (6,509,916 | ) | | | 14,518,082 | |
Net capital loss carryforwards may be applied against any net realized taxable gains in succeeding years, subject to the carryforward period limitations, where applicable. On December 22, 2010, the Regulated Investment Company Modernization Act of 2010 (the “Modernization Act”) was signed by the President. The Modernization Act changed the capital loss carryforward rules as they relate to regulated investment companies. Capital losses generated in tax years beginning after the date of enactment may now be carried forward indefinitely, and retain the character of the original loss. Under pre-enactment law, capital losses could be carried forward for up to eight tax years as short-term capital losses. The provisions affecting the utilization of capital loss carryforwards under the Modernization Act also require the utilization of post-enactment losses prior to the utilization of pre-enactment losses.
209
Notes to Financial Statements (Continued)
At December 31, 2012, the following Fund(s) had available, for federal income tax purposes, unused capital losses:
| | | | | | | | | | | | | | | | |
| | | | | | | | | | | | | |
| | | Expiring
2015 | | | Expiring
2016 | | | Expiring
2017 | | | Expiring
2018 | |
Blue Chip Growth Fund | | $ | 575,550 | | | $ | 1,885,854 | | | $ | - | | | $ | - | |
Equity Income Fund | | | - | | | | - | | | | 25,391,998 | | | | - | |
Foreign Fund | | | - | | | | - | | | | 20,915,928 | | | | 4,482,917 | |
Global Fund | | | - | | | | - | | | | 6,981,967 | | | | - | |
Growth & Income Fund | | | - | | | | 29,067,985 | | | | 33,125,485 | | | | - | |
Income & Growth Fund | | | - | | | | - | | | | 4,856,903 | | | | - | |
Large Cap Value Fund | | | - | | | | - | | | | 12,906,699 | | | | 722,962 | |
Small/Mid Cap Value Fund | | | - | | | | - | | | | 24,198,611 | | | | - | |
Net capital loss carryforwards for the Funds shown in the above table are from pre-enactment years and are, therefore, subject to the eight-year carryforward period and possible expiration.
At December 31, 2012, the following Fund(s) had post-enactment accumulated capital loss carryforwards:
| | | | | | | | |
| | | Long Term
Capital Loss
Carryforward | | | Short Term
Capital Loss
Carryforward | |
Income & Growth Fund | | $ | 307,611 | | | $ | - | |
Foreign Fund | | | 5,827,275 | | | | - | |
The following Fund(s) elected to defer to the fiscal year beginning January 1, 2013 post-October capital losses:
Accounting principles generally accepted in the United States of America require that only distributions in excess of tax basis earnings and profits be reported in the financial statements as a return of capital.
The tax character of distributions (including capital gain dividends, if any, designated pursuant to Section 852 of the Code) paid during the year ended December 31, 2012, was as follows:
| | | | | | | | | | | | |
| | | Ordinary
Income | | | Long Term
Capital Gain | | | Return of
Capital | |
Blue Chip Growth Fund | | $ | 267,550 | | | $ | - | | | $ | - | |
Equity Income Fund | | | 10,514,968 | | | | - | | | | - | |
Equity Index Fund | | | 5,324,691 | | | | - | | | | - | |
Focused Equity Fund | | | 6,866,421 | | | | - | | | | - | |
Foreign Fund | | | 7,487,090 | | | | - | | | | - | |
Fundamental Growth Fund | | | 5,009,030 | | | | 137,881 | | | | - | |
Fundamental Value Fund | | | 2,877,839 | | | | - | | | | - | |
Global Fund | | | 1,396,159 | | | | - | | | | - | |
Growth & Income Fund | | | 1,593,429 | | | | - | | | | - | |
Income & Growth Fund | | | 1,866,225 | | | | - | | | | - | |
Large Cap Growth Fund | | | 123,758 | | | | - | | | | - | |
Large Cap Value Fund | | | 1,474,694 | | | | - | | | | - | |
Mid Cap Growth Fund | | | - | | | | 20,349,130 | | | | - | |
Mid Cap Value Fund | | | 7,386,198 | | | | 20,914,726 | | | | - | |
PIMCO Total Return Fund | | | 5,500,211 | | | | - | | | | - | |
Small Cap Growth Equity Fund | | | 4,751,604 | | | | 22,172,806 | | | | - | |
Small Company Value Fund | | | 12,933 | | | | 3,024,862 | | | | - | |
Small/Mid Cap Value Fund | | | 1,238,707 | | | | - | | | | - | |
210
Notes to Financial Statements (Continued)
The tax character of distributions (including capital gain dividends, if any, designated pursuant to Section 852 of the Code) paid during the year ended December 31, 2011, was as follows:
| | | | | | | | | | | | |
| | | Ordinary
Income | | | Long Term
Capital Gain | | | Return of
Capital | |
Blue Chip Growth Fund | | $ | 267,550 | | | $ | - | | | $ | - | |
Equity Income Fund | | | 10,514,968 | | | | - | | | | - | |
Equity Index Fund | | | 5,324,691 | | | | - | | | | - | |
Focused Equity Fund | | | 6,866,421 | | | | - | | | | - | |
Foreign Fund | | | 7,478,090 | | | | 934,631 | | | | - | |
Fundamental Growth Fund | | | 5,009,030 | | | | - | | | | - | |
Fundamental Value Fund | | | 2,877,839 | | | | - | | | | - | |
Global Fund | | | 1,396,159 | | | | - | | | | - | |
Growth & Income Fund | | | 1,593,429 | | | | - | | | | - | |
Income & Growth Fund | | | 1,866,225 | | | | - | | | | - | |
Large Cap Growth Fund | | | 123,758 | | | | - | | | | - | |
Large Cap Value Fund | | | 1,474,694 | | | | - | | | | - | |
Mid Cap Growth Fund | | | - | | | | 20,349,130 | | | | - | |
Mid Cap Value Fund | | | 7,386,198 | | | | 20,914,726 | | | | - | |
PIMCO Total Return Fund | | | 5,500,211 | | | | - | | | | - | |
Small Cap Growth Equity Fund | | | 4,751,604 | | | | 22,172,806 | | | | - | |
Small Company Value Fund | | | 12,933 | | | | 3,024,862 | | | | - | |
Small/Mid Cap Value Fund | | | 1,238,707 | | | | - | | | | - | |
The following Fund(s) have elected to pass through the foreign tax credit for the year ended December 31, 2012:
| | | | |
| | | Amount | |
Foreign Fund | | $ | 934,631 | |
Global Fund | | | 169,376 | |
Capital accounts within financial statements are periodically adjusted for permanent differences between book and tax accounting. These adjustments have no impact on net assets or the results of operations. Temporary book and tax accounting differences will reverse in subsequent periods. At December 31, 2012, temporary book and tax accounting differences were primarily attributable to investments in forward contracts, futures contracts, swap agreements, premium amortization accruals, passive foreign investment companies, the deferral of wash sale losses, and deferred Trustee compensation.
At December 31, 2012, the components of distributable earnings on a tax basis were as follows:
| | | | | | | | | | | | | | | | |
| | | Undistributed
Ordinary
Income | | | Undistributed
Long Term
Capital Gain
(Capital Loss
Carryover) | | | Other
Temporary
Differences | | | Unrealized
Appreciation
(Depreciation) | |
Blue Chip Growth Fund | | $ | 842,898 | | | $ | 31,444,098 | | | $ | (50,702 | ) | | $ | 87,327,626 | |
Equity Income Fund | | | 10,667,602 | | | | (25,391,998 | ) | | | (94,206 | ) | | | 80,662,014 | |
Equity Index Fund | | | 6,256,331 | | | | 1,132,489 | | | | (155,286 | ) | | | 69,345,185 | |
Focused Equity Fund | | | 2,096,881 | | | | - | | | | (5,059 | ) | | | 14,612,048 | |
Foreign Fund | | | 7,875,581 | | | | (31,226,120 | ) | | | (64,539 | ) | | | 5,302,318 | |
Fundamental Growth Fund | | | - | | | | 186,839 | | | | (7,046 | ) | | | 13,541,497 | |
Fundamental Value Fund | | | 3,587,930 | | | | 7,025,409 | | | | (11,366 | ) | | | 22,285,039 | |
Global Fund | | | 1,880,325 | | | | (6,981,967 | ) | | | (16,730 | ) | | | 36,120,607 | |
211
Notes to Financial Statements (Continued)
| | | | | | | | | | | | | | | | |
| | | Undistributed
Ordinary
Income | | | Undistributed
Long Term
Capital Gain
(Capital Loss
Carryover) | | | Other
Temporary
Differences | | | Unrealized
Appreciation
(Depreciation) | |
Growth & Income Fund | | $ | 1,868,947 | | | $ | (62,193,470 | ) | | $ | (41,552 | ) | | $ | 24,058,632 | |
Income & Growth Fund | | | 3,965,038 | | | | (5,164,514 | ) | | | (32,058 | ) | | | 24,053,118 | |
Large Cap Growth Fund | | | 978,432 | | | | 12,270,465 | | | | (22,349 | ) | | | 24,661,936 | |
Large Cap Value Fund | | | 3,041,261 | | | | (13,629,661 | ) | | | (71,766 | ) | | | 36,721,811 | |
Mid Cap Growth Fund | | | 2,670,349 | | | | 23,351,247 | | | | (64,235 | ) | | | 76,159,274 | |
Mid Cap Value Fund | | | 22,360,135 | | | | 5,356,151 | | | | (83,826 | ) | | | 20,841,007 | |
PIMCO Total Return Fund | | | 10,551,148 | | | | 342,685 | | | | (7,909 | ) | | | 9,317,954 | |
Small Cap Growth Equity Fund | | | - | | | | 16,601,835 | | | | (67,165 | ) | | | 28,311,528 | |
Small Company Value Fund | | | 1,577,715 | | | | 3,503,970 | | | | (11,860 | ) | | | 33,860,064 | |
Small/Mid Cap Value Fund | | | 1,374,422 | | | | (24,198,611 | ) | | | (41,668 | ) | | | 14,518,082 | |
During the year ended December 31, 2012, the following amounts were reclassified due to permanent differences between book and tax accounting:
| | | | | | | | | | | | |
| | | Paid-in
Capital | | | Accumulated
Net Realized
Gain (Loss) on
Investments | | | Undistributed
Net Investment
Income (Loss) | |
Blue Chip Growth Fund | | $ | 1,529 | | | $ | 41,583 | | | $ | (43,112 | ) |
Equity Income Fund | | | 2,967 | | | | 128,821 | | | | (131,788 | ) |
Equity Index Fund | | | 5,519 | | | | 83,953 | | | | (89,472 | ) |
Focused Equity Fund | | | 39 | | | | (4,127 | ) | | | 4,088 | |
Foreign Fund | | | 2,044 | | | | 161,511 | | | | (163,555 | ) |
Fundamental Growth Fund | | | 53 | | | | 595 | | | | (648 | ) |
Fundamental Value Fund | | | 220 | | | | 25,270 | | | | (25,490 | ) |
Global Fund | | | 472 | | | | 33,832 | | | | (34,304 | ) |
Growth & Income Fund | | | 1,419 | | | | 120,719 | | | | (122,138 | ) |
Income & Growth Fund | | | 1,016 | | | | 23,781 | | | | (24,797 | ) |
Large Cap Growth Fund | | | 605 | | | | 19,734 | | | | (20,339 | ) |
Large Cap Value Fund | | | 2,464 | | | | (80,741 | ) | | | 78,277 | |
Mid Cap Growth Fund | | | (72,451 | ) | | | (170,424 | ) | | | 242,875 | |
Mid Cap Value Fund | | | 2,232 | | | | 444,309 | | | | (446,541 | ) |
PIMCO Total Return Fund | | | 281 | | | | (2,475,909 | ) | | | 2,475,628 | |
Small Cap Growth Equity Fund | | | (377,637 | ) | | | (621,335 | ) | | | 998,972 | |
Small Company Value Fund | | | 318 | | | | (69,274 | ) | | | 68,956 | |
Small/Mid Cap Value Fund | | | 1,368 | | | | 256 | | | | (1,624 | ) |
The Funds did not have any unrecognized tax benefits at December 31, 2012, nor were there any increases or decreases in unrecognized tax benefits for the year then ended. The Funds recognize interest and penalties, if any, related to unrecognized tax benefits as an income tax expense in the Statements of Operations. During the year ended December 31, 2012, the Funds did not incur any such interest or penalties. The Funds are subject to examination by U.S. federal and state tax authorities for returns filed for the prior three fiscal years or the returns filed to date for Funds in existence less than three years. Foreign taxes are provided for based on the Funds’ understanding of the tax rules and rates that exist in the foreign markets in which they invest.
Under the Funds’ organizational documents, current and former Trustees and Officers are provided with specified rights to indemnification against liabilities arising in connection with the performance of their duties to the Funds, and shareholders are indemnified against personal liability for obligations of the Funds. In the normal course of business, the Funds may also enter into
212
Notes to Financial Statements (Continued)
contracts that provide general indemnifications. The Funds’ maximum exposure under these arrangements is unknown as this would be dependent on future claims that may be made against the Funds. The risk of material loss from such claims is considered remote.
| 8. | | New Accounting Pronouncements |
On December 16, 2011, the Financial Accounting Standards Board (“FASB”) issued Accounting Standards Update No. 2011-11, “Disclosures about Offsetting Assets and Liabilities” (“ASU 2011-11”), as clarified with ASU 2013-01 “Clarifying the Scope of Disclosures about Offsetting Assets and Liabilities” issued in January 2013. ASU 2011-11 amends FASB Accounting Standards Codification Topic 210, specifically requiring an entity to disclose information about offsetting and related arrangements and the effect those arrangements have on the financial position. ASU 2011-11 is effective in annual reporting periods beginning on or after January 1, 2013, and for interim periods within those annual reporting periods. Management is currently evaluating the implications of these changes and their impact on the financial statements.
On December 7, 2010, the Trust was named as a defendant and putative member of the proposed defendant class of shareholders named in an adversary proceeding brought by The Official Committee of Unsecured Creditors of Tribune Company (the “Official Committee”) in the U.S. Bankruptcy Court for the District of Delaware, in connection with Tribune Company’s Chapter 11 bankruptcy proceeding (In re Tribune Company). The proceeding relates to a leveraged buyout (“LBO”) transaction by which Tribune Company converted to a privately-held company in 2007, and the putative defendant class is comprised of beneficial owners of shares of Tribune Company who received proceeds (the “Proceeds”) of the LBO. The Official Committee seeks to recover payments of those Proceeds.
The potential amounts sought to be recovered from the Equity Income Fund and Equity Index Fund, plus interest and the Official Committee’s court costs, are approximately $4,562,800 and $207,706, respectively.
In addition, on June 2, 2011, the Equity Income Fund was named as a defendant in two closely related, parallel adversary proceedings brought in connection with the Tribune Company’s LBO by Deutsche Bank Trust Company Americas, in its capacity as successor indenture trustee for a certain series of Senior Notes, Law Debenture Trust Company of New York, in its capacity as successor indenture trustee for a certain series of Senior Notes, and Wilmington Trust Company, in its capacity as successor indenture trustee for the PHONES Notes (together, the “Plaintiffs”), one in the United States District Court for the District of Massachusetts and one in the United States District Court for the District of Connecticut. The Plaintiffs also seek to recover payments of the Proceeds.
The Funds cannot predict the outcome of these proceedings. If the proceedings were to be decided in a manner adverse to the Funds, or if the Funds were to enter into a settlement agreement with the Official Committee or the Plaintiffs, as applicable, the payment of such judgment or settlement could potentially have a material adverse effect on the Funds’ net asset values depending on the net assets of each applicable Fund at the time of such judgment or settlement.
In preparation of these financial statements management has evaluated the events and transactions subsequent to December 31, 2012, through the date when the financial statements were issued, and determined that there are no material events or transactions that would require adjustments to or disclosures in the Funds’ financial statements.
213
Report of Independent Registered Public Accounting Firm
To the Board of Trustees of MML Series Investment Fund and Shareholders of MML Blue Chip Growth Fund, MML Equity Income Fund, MML Equity Index Fund, MML Focused Equity Fund, MML Foreign Fund, MML Fundamental Growth Fund, MML Fundamental Value Fund, MML Global Fund, MML Growth & Income Fund, MML Income & Growth Fund, MML Large Cap Growth Fund, MML Large Cap Value Fund, MML Mid Cap Growth Fund, MML Mid Cap Value Fund, MML PIMCO Total Return Fund, MML Small Cap Growth Equity Fund, MML Small Company Value Fund, and MML Small/Mid Cap Value Fund (collectively, the “Funds”):
We have audited the accompanying statements of assets and liabilities, including the portfolios of investments, of the Funds as of December 31, 2012, and the related statements of operations for the year then ended, the statements of changes in net assets for each of the two years in the period then ended, and the financial highlights for each of the periods presented. These financial statements and financial highlights are the responsibility of the Funds’ management. Our responsibility is to express an opinion on these financial statements and financial highlights based on our audits.
We conducted our audits in accordance with the standards of the Public Company Accounting Oversight Board (United States). Those standards require that we plan and perform the audit to obtain reasonable assurance about whether the financial statements and financial highlights are free of material misstatement. The Funds are not required to have, nor were we engaged to perform, an audit of their internal control over financial reporting. Our audits included consideration of internal control over financial reporting as a basis for designing audit procedures that are appropriate in the circumstances, but not for the purpose of expressing an opinion on the effectiveness of the Funds’ internal control over financial reporting. Accordingly, we express no such opinion. An audit also includes examining, on a test basis, evidence supporting the amounts and disclosures in the financial statements, assessing the accounting principles used and significant estimates made by management, as well as evaluating the overall financial statement presentation. Our procedures included confirmation of securities owned as of December 31, 2012, by correspondence with the custodian and brokers; where replies were not received from brokers, we performed other auditing procedures. We believe that our audits provide a reasonable basis for our opinion.
In our opinion, the financial statements and financial highlights referred to above present fairly, in all material respects, the financial position of each of the Funds as of December 31, 2012, the results of their operations for the year then ended, the changes in their net assets for each of the two years in the period then ended, and the financial highlights for each of the periods presented, in conformity with accounting principles generally accepted in the United States of America.
Deloitte & Touche LLP
Boston, Massachusetts
February 22, 2013
214
Trustees and Officers (Unaudited)
The following table lists the Trust’s Trustees and Officers as of December 31, 2012; their address and age; their position with the Trust; the length of time holding that position with the Trust; their principal occupation(s) during the past five years; the number of portfolios in the fund complex they oversee; and other directorships they hold in companies subject to registration or reporting requirements of the Securities Exchange Act of 1934 (generally called “public companies”) or in registered investment companies. The Trust’s Statement of Additional Information includes additional information about the Trust’s Trustees and is available, without charge, upon request by calling 1-888-309-3539 or by writing MML Series Investment Fund, c/o Massachusetts Mutual Life Insurance Company, 1295 State Street, Springfield, Massachusetts 01111-0001, Attention: Retirement Services Marketing.
Disinterested Trustees
| | | | | | | | | | |
Name, Address*, and Age | | Position(s)
Held with
Trust | | Term of
Office** and
Length of
Time Served | | Principal Occupation(s)
During Past 5 Years | | Number of
Portfolios in
Fund Complex
Overseen by Trustee | | Other Directorships Held by Trustee |
Richard H. Ayers Age: 70 | | Chairman Trustee | | Since 2010 Since 1999 | | Retired. | | 91 | | Director (2008-2011), Celera Corporation; Director (1996-2008), Applera Corporation; Chairman (since 2010), Trustee (since 1996), MassMutual Select Funds (open-end investment company); Chairman and Trustee (since 2012), MML Series Investment Fund II (open-end investment company); Chairman and Trustee (since 2012), MassMutual Premier Funds (open-end investment company). |
| | | | | |
Allan W. Blair Age: 64 | | Trustee | | Since 2003 | | President and Chief Executive Officer (since 1996), Economic Development Council of Western Massachusetts; President and Chief Executive Officer (since 1984), Westover Metropolitan Development Corporation. | | 91 | | Trustee (since 2003), MassMutual Select Funds (open-end investment company); Trustee (since 2012), MML Series Investment Fund II (open-end investment company); Trustee (since 2012), MassMutual Premier Funds (open-end investment company). |
| | | | | |
Nabil N. El-Hage
Age: 54 | | Trustee | | Since 2012 | | Consultant (since 2010); Chairman (since 2011), Academy of Executive Education, LLC; Senior Associate Dean for External Relations (2009-2010), Thomas Henry Carroll Ford Foundation Adjunct Professor of Business Administration (2009-2010), Professor of Management Practice (2005-2009), Harvard Business School. | | 91 | | Director (2007-2010), Virtual Radiologic Corporation; Trustee (since 2012), MassMutual Select Funds (open-end investment company); Trustee (since 2005), Chairman (2006-2012), MML Series Investment Fund II (open-end investment company); Trustee (since 2003), Chairman (2006-2012), MassMutual Premier Funds (open-end investment company). |
| | | | | |
Maria D. Furman
Age: 58 | | Trustee | | Since 2012 | | Retired. | | 91 | | Trustee (since 2011), GMO Series Trust (open-end investment company); Trustee (since 2012), MassMutual Select Funds (open-end investment company); Trustee (since 2005), MML Series Investment Fund II (open-end investment company); Trustee (since 2004), MassMutual Premier Funds (open-end investment company). |
215
Trustees and Officers (Unaudited) (Continued)
| | | | | | | | | | |
Name, Address*, and Age | | Position(s)
Held with
Trust | | Term of
Office** and
Length of
Time Served | | Principal Occupation(s)
During Past 5 Years | | Number of
Portfolios in
Fund Complex
Overseen by Trustee | | Other Directorships Held by Trustee |
R. Alan Hunter, Jr. Age: 66 | | Trustee | | Since 2003 | | Retired. | | 91 | | Director (since 2007), Actuant Corporation; Trustee (since 2003), MassMutual Select Funds (open-end investment company); Trustee (since 2012), MML Series Investment Fund II (open-end investment company); Trustee (since 2012), MassMutual Premier Funds (open-end investment company). |
| | | | | |
F. William Marshall, Jr. Age: 70 | | Trustee | | Since 1996 | | Retired; Consultant (1999-2009). | | 127*** | | Trustee (since 2000), Denver Board – Oppenheimer Funds; Trustee (since 1996), MassMutual Select Funds (open-end investment company); Trustee (since 2012), MML Series Investment Fund II (open-end investment company); Trustee (since 2012), MassMutual Premier Funds (open-end investment company). |
| | | | | |
C. Ann Merrifield
Age: 61 | | Trustee | | Since
2012 | | President and Chief Executive Officer (since 2012), PathoGenetix; Senior Vice President, Genzyme Business Excellence Initiative (2009-2011), President, Biosurgery (2003-2009), Genzyme Corporation. | | 91 | | Trustee (since 2012), MassMutual Select Funds (open-end investment company); Trustee (since 2005), MML Series Investment Fund II (open-end investment company); Trustee (since 2004), MassMutual Premier Funds (open-end investment company). |
| | | | | |
Susan B. Sweeney Age: 60 | | Trustee | | Since 2009 | | Senior Vice President and Chief Investment Officer (since 2010), Selective Insurance Group (property and casualty company); Senior Managing Director (2008-2010), Ironwood Capital (private equity firm). | | 93^^ | | Trustee (since 2012), Babson Capital Corporate Investors (closed-end investment company); Trustee (since 2012), Babson Capital Participation Investors (closed-end investment company); Trustee (since 2009), MassMutual Select Funds (open-end investment company); Trustee (since 2012), MML Series Investment Fund II (open-end investment company); Trustee (since 2012), MassMutual Premier Funds (open-end investment company). |
216
Trustees and Officers (Unaudited) (Continued)
Interested Trustees
| | | | | | | | | | |
Name, Address*, and Age | | Position(s)
Held with
Trust | | Term of
Office** and
Length of
Time Served | | Principal Occupation(s)
During Past 5 Years | | Number of
Portfolios in
Fund Complex
Overseen by Trustee | | Other Directorships Held by Trustee |
Robert E. Joyal^ Age: 67 | | Trustee | | Since 2003 | | Retired. | | 93^^ | | Director (since 2012), Ormat Technologies, Inc.; Director (since 2006), Jefferies Group, Inc. (investment bank); Director (2007-2011), Scottish Re Group Ltd.; Director (2003-2010), Alabama Aircraft Industries, Inc.; Trustee (since 2003), Babson Capital Corporate Investors (closed-end investment company); Trustee (since 2003), Babson Capital Participation Investors (closed-end investment company); Trustee (since 2003), MassMutual Select Funds (open-end investment company); Trustee (since 2012), MML Series Investment Fund II (open-end investment company); Trustee (since 2012), MassMutual Premier Funds (open-end investment company). |
| | | | | |
Elaine A. Sarsynski^^^ Age: 57 | | Trustee | | Since 2008 | | Executive Vice President (since 2008), MassMutual Retirement Services Division, MassMutual; Chairman, President, and CEO (since 2012), MassMutual International LLC. | | 91 | | Director (since 2012), Horizon Technology Finance Management LLC; Trustee (since 2008), MassMutual Select Funds (open-end investment company); Vice Chairperson (2011-2012), Trustee (since 2011), MML Series Investment Fund II (open-end investment company); Vice Chairperson (2011-2012), Trustee (since 2011), MassMutual Premier Funds (open-end investment company). |
Principal Officers who are Not Trustees
| | | | | | | | |
Name, Address*, and Age | | Position(s) Held
with Trust | | Term of
Office# and
Length of
Time Served | | Principal Occupation(s) During Past 5 Years | | Number of
Portfolios in
Fund Complex
Overseen by Officer |
Richard J. Byrne Age: 50 | | President | | Since
2007 | | Vice President (since 2007), MassMutual; President (since 2007), MML Series Investment Fund II (open-end investment company). | | 36 |
| | | | |
Michael C. Eldredge
Age: 48 | | Vice President | | Since
2009 | | Vice President (since 2008), MassMutual; Vice President (2005-2008), ING; Vice President (since 2009), MassMutual Select Funds (open-end investment company); Vice President (since 2009), MML Series Investment Fund II (open-end investment company); Vice President (since 2009), MassMutual Premier Funds (open-end investment company). | | 91 |
| | | | |
Andrew M. Goldberg Age: 46 | | Vice President, Secretary, and Chief Legal Officer Assistant Secretary | | Since
2008 (2001-
2008) | | Assistant Vice President and Counsel (since 2004), MassMutual; Vice President, Secretary, and Chief Legal Officer (since 2008), Assistant Secretary (2001-2008), MassMutual Select Funds (open-end investment company); Vice President, Secretary, (formerly known as “Clerk”), and Chief Legal Officer (since 2008), Assistant Clerk (2005-2008), MML Series Investment Fund II (open-end investment company); Vice President, Secretary, (formerly known as “Clerk”), and Chief Legal Officer (since 2008), Assistant Clerk (2004-2008), MassMutual Premier Funds (open-end investment company). | | 91 |
217
Trustees and Officers (Unaudited) (Continued)
| | | | | | | | |
Name, Address*, and Age | | Position(s) Held
with Trust | | Term of
Office# and
Length of
Time Served | | Principal Occupation(s) During Past 5 Years | | Number of
Portfolios in
Fund Complex
Overseen by Officer |
Nicholas H. Palmerino
Age: 47 | | Chief Financial Officer and Treasurer | | Since
2006 | | Assistant Vice President (since 2006), MassMutual; Chief Financial Officer and Treasurer (since 2006), MassMutual Select Funds (open-end investment company); Chief Financial Officer and Treasurer (since 2006), MML Series Investment Fund II (open-end investment company); Chief Financial Officer and Treasurer (since 2006), MassMutual Premier Funds (open-end investment company). | | 91 |
| | | | |
Philip S. Wellman
Age: 48 | | Vice President and Chief Compliance Officer | | Since
2007 | | Vice President, Associate General Counsel, and Chief Compliance Officer (Mutual Funds and Investment Advisory) (since 2008), Vice President, Associate General Counsel, and Chief Compliance Officer (Mutual Funds) (2007-2008), MassMutual; Vice President and Chief Compliance Officer (since 2007), MassMutual Select Funds (open-end investment company); Vice President and Chief Compliance Officer (since 2007), MML Series Investment Fund II (open-end investment company); Vice President and Chief Compliance Officer (since 2007), MassMutual Premier Funds (open-end investment company). | | 91 |
| | | | |
Eric H. Wietsma
Age: 46 | | Vice President | | Since
2006 | | Senior Vice President (since 2010), Corporate Vice President (2007-2010), MassMutual; President (since 2008), Vice President (2006-2008), MassMutual Select Funds (open-end investment company); Vice President (since 2006), MML Series Investment Fund II (open-end investment company); President (since 2008) Vice President (2006-2008), MassMutual Premier Funds (open-end investment company). | | 91 |
| * | The address of each Trustee and Principal Officer is the same as that for the Trust; 1295 State Street, Springfield, Massachusetts 01111. |
| ** | Each Trustee of the Trust serves until the next meeting of shareholders called for the purpose of electing Trustees and until the election and qualification of his or her successor or until he or she dies, resigns, or is removed. Notwithstanding the foregoing, a Trustee shall retire and cease to serve as a Trustee upon the conclusion of the calendar year in which such Trustee attains the age of seventy-two years. |
| | The Chairperson is elected to hold such office for a term of three years or until their successor is elected and qualified to carry out the duties and responsibilities of their office, or until he or she retires, dies, resigns, is removed, or becomes disqualified. |
| *** | Denver Board – Oppenheimer Funds is deemed to be part of the Fund Complex because it is managed by OppenheimerFunds, Inc., an indirect subsidiary of MassMutual. |
| ^ | Mr. Joyal is an “Interested Person,” as that term is defined in the 1940 Act, through his position as a director of Jefferies Group, Inc., a broker-dealer that may execute portfolio transactions and/or engage in principal transactions with the Funds, other investment companies advised by MassMutual or holding themselves out to investors as related companies for purposes of investment or investor services, or any other advisory accounts over which MassMutual has brokerage placement discretion. |
| ^^ | Babson Capital Participation Investors and Babson Capital Corporate Investors are deemed to be a part of the Fund Complex because they are managed by Babson Capital Management LLC, an indirect subsidiary of MassMutual. |
| ^^^ | Ms. Sarsynski is an Interested Person through her employment with MassMutual. |
| # | The President, Treasurer, and Secretary are elected to hold such office until their successor is elected and qualified to carry out the duties and responsibilities of their office, or until he or she dies, resigns, is removed, or becomes disqualified. Each other officer shall hold office at the pleasure of the Trustees. |
218
Federal Tax Information (Unaudited)
For corporate shareholders, a portion of the ordinary dividends paid during the Fund(s)’ year ended December 31, 2012, qualified for the dividends received deduction, as follows:
| | | | |
| |
| | | Dividends Received
Deductions | |
Blue Chip Growth Fund | | | 100.00% | |
Equity Income Fund | | | 100.00% | |
Equity Index Fund | | | 100.00% | |
Focused Equity Fund | | | 20.44% | |
Fundamental Growth Fund | | | 56.00% | |
Fundamental Value Fund | | | 100.00% | |
Global Fund | | | 53.11% | |
Growth & Income Fund | | | 100.00% | |
Income & Growth Fund | | | 100.00% | |
Large Cap Growth Fund | | | 100.00% | |
Large Cap Value Fund | | | 100.00% | |
Mid Cap Value Fund | | | 100.00% | |
Small Cap Growth Equity Fund | | | 100.00% | |
Small/Mid Cap Value Fund | | | 100.00% | |
For the year ended December 31, 2012, the following Fund(s) earned the following foreign sources of income:
| | | | |
| |
| | | Foreign Sources
of Income | |
Foreign Fund | | $ | 12,297,428 | |
Global Fund | | | 1,883,536 | |
219
Other Information (Unaudited)
Proxy Voting
A description of the policies and procedures that each Fund’s investment adviser and subadvisers use to vote proxies relating to the Fund’s portfolio securities is available, without charge, upon request, by calling 1-888-309-3539, and on the Securities and Exchange Commission’s (“SEC”) website at http://www.sec.gov.
Information regarding how the Funds voted proxies relating to portfolio securities during the most recent 12-month period ended June 30 is available, without charge, upon request, on the MassMutual website at http://www.massmutual.com/funds and on the SEC’s website at http://www.sec.gov.
Quarterly Reporting
The Funds file their complete schedule of portfolio holdings with the SEC for the first and third quarters of each fiscal year on Form N-Q. The Funds’ Forms N-Q are available on the SEC’s website at http://www.sec.gov and may be reviewed and copied at the SEC’s Public Reference Room in Washington D.C. Information on the operation of the SEC’s Public Reference Room may be obtained by calling 1-800-SEC-0330.
Trustees’ Approval of Investment Advisory Contracts
At their meeting in August 2012, the Trustees, including the Independent Trustees who are not “interested persons” (as such term is defined in the 1940 Act) of the Trust, MassMutual, or subadvisers (the “Independent Trustees”), approved amendments to the subadvisory agreements with Davis Selected Advisers, L.P. (“Davis”) for the Large Cap Value Fund, and Waddell & Reed Investment Management Company (“Waddell & Reed”) for the Small Cap Growth Equity Fund (the “Amendments”). Under the Amendments, the investment subadvisory fees paid to Davis and Waddell and Reed, respectively, would be slightly reduced. In preparation for the meeting, the Trustees requested, and MassMutual provided in advance, certain materials relevant to the consideration of the Amendments (the “August Materials”). In all of their deliberations, the Trustees were advised by independent counsel.
Prior to the votes being taken to approve the Amendments, the Independent Trustees met separately in executive session to discuss the appropriateness of the contracts. The Independent Trustees weighed the foregoing matters in light of the advice given to them by their independent legal counsel as to the law applicable to the review of investment advisory contracts.
In approving the Amendments, the Trustees discussed with MassMutual and considered the fees payable to Davis and Waddell & Reed, respectively, by MassMutual and the effect of such fees on the profitability of MassMutual. In arriving at a decision, the Trustees, including the Independent Trustees, did not identify any single matter as all-important or controlling. The foregoing summary does not detail all of the matters considered. The Trustees concluded that MassMutual’s level of profitability from its relationship to the Large Cap Value Fund and the Small Cap Growth Equity Fund was not excessive and that the subadvisory fee amounts under the amended Subadvisory Agreements with Davis and Waddell & Reed, respectively, were fair and reasonable.
The Amendments became effective September 1, 2012.
At their meeting in November 2012, the Trustees, including the Independent Trustees, approved a renegotiated subadvisory agreement with Templeton Investment Counsel, LLC (“Templeton”) for the Foreign Fund, which is based on the new form of subadvisory agreement previously presented to the Trustees (“Renegotiated Subadvisory Agreement”). In preparation for the meeting, the Trustees requested, and MassMutual provided in advance, certain materials relevant to the consideration of the Renegotiated Subadvisory Agreement (the “November Materials”). In all of their deliberations, the Trustees were advised by independent counsel.
In reviewing the Renegotiated Subadvisory Agreement, the Trustees discussed with MassMutual and considered a wide range of information about, among other things: (i) Templeton and its personnel with responsibilities for providing services to the Foreign Fund; (ii) the terms of the Renegotiated Subadvisory Agreement; and (iii) the scope and quality of services that Templeton will provide under the Renegotiated Subadvisory Agreement.
220
Other Information (Unaudited) (Continued)
Prior to the votes being taken to approve the Renegotiated Subadvisory Agreement, the Independent Trustees met separately in executive session to discuss the appropriateness of the contract. The Independent Trustees weighed the foregoing matters in light of the advice given to them by their independent legal counsel as to the law applicable to the review of investment advisory contracts. In arriving at a decision, the Trustees, including the Independent Trustees, did not identify any single matter as all-important or controlling. The foregoing summary does not detail all of the matters considered.
Based on the foregoing, the Trustees concluded that: (i) overall, they were satisfied with the nature, extent, and quality of services expected to be provided under the Renegotiated Subadvisory Agreement; and (ii) the terms of the Renegotiated Subadvisory Agreement are fair and reasonable with respect to Foreign Fund and are in the best interest of the Fund’s shareholders. After carefully considering the information summarized above, the Trustees, including the Independent Trustees voting separately, unanimously voted to approve the Renegotiated Subadvisory Agreement.
The Renegotiated Subadvisory Agreement became effective on December 3, 2012.
221
Other Information (Unaudited) (Continued)
Fund Expenses December 31, 2012
Expense Examples:
The following information is in regards to expenses for the six months ended December 31, 2012:
As a shareholder of the Funds, you incur ongoing costs, including management fees, distribution and/or service (12b-1) fees, and other Fund expenses. These examples are intended to help you understand your ongoing costs (in dollars) of investing in the Funds and to compare these costs with the ongoing costs of investing in other mutual funds. These examples are based on an investment of $1,000 invested for the six months ended December 31, 2012.
Actual Expenses:
The first four columns of the table below provide information about actual account values and actual expenses. You may use this information, together with the amount you invested, to estimate the expenses that you paid over the period. Simply divide your account value by $1,000 (for example, an $8,600 account value divided by $1,000 = 8.6), then multiply the result by the number under the heading entitled “Operating Expenses Incurred” to estimate the expenses you paid on your account during this period.
Hypothetical Example for Comparison Purposes:
The last two columns of the table below provide information about hypothetical account values and hypothetical expenses based on the Fund’s actual expense ratio and an assumed rate of return of 5% per year before expenses, which is not the Fund’s actual return. The hypothetical account values and expenses may not be used to estimate the actual ending account balance or expenses you paid for the period. You may use this information to compare the ongoing costs of investing in the Fund and other funds. To do so, compare this 5% hypothetical example with the 5% hypothetical examples that appear in the shareholder reports of the other funds.
Please note that the expenses shown in the table are meant to highlight your ongoing costs only and do not reflect any transactional costs. Therefore, the last two columns of the table are useful in comparing ongoing costs only, and will not help you determine the relative total costs of owning different funds. In addition, if these transactional costs were included, your costs would have been higher.
| | | | | | | | | | | | | | | | | | | | | | | | |
| | | Beginning
Value | | | Annualized
Expense
Ratio | | | Ending
Value (Based
on Actual
Returns and
Expenses) | | | Operating
Expenses
Incurred* | | | Ending
Value (Based
on
Hypothetical
Returns and
Expenses) | | | Operating
Expenses
Incurred* | |
| Blue Chip Growth Fund | | | | | | | | | | | | | | | | | | | | | | | | |
Initial Class | | $ | 1,000 | | | | 0.79 | % | | $ | 1,054.70 | | | $ | 4.10 | | | $ | 1,021.30 | | | $ | 4.04 | |
Service Class | | | 1,000 | | | | 1.04 | % | | | 1,052.70 | | | | 5.40 | | | | 1,020.00 | | | | 5.31 | |
| Equity Income Fund | | | | | | | | | | | | | | | | | | | | | | | | |
Initial Class | | | 1,000 | | | | 0.78 | % | | | 1,082.60 | | | | 4.11 | | | | 1,021.30 | | | | 3.98 | |
Service Class | | | 1,000 | | | | 1.03 | % | | | 1,083.10 | | | | 5.42 | | | | 1,020.10 | | | | 5.26 | |
| Equity Index Fund | | | | | | | | | | | | | | | | | | | | | | | | |
Class I | | | 1,000 | | | | 0.45 | % | | | 1,057.30 | | | | 2.34 | | | | 1,023.00 | | | | 2.30 | |
Class II | | | 1,000 | | | | 0.29 | % | | | 1,058.20 | | | | 1.51 | | | | 1,023.80 | | | | 1.48 | |
Class III | | | 1,000 | | | | 0.15 | % | | | 1,059.10 | | | | 0.78 | | | | 1,024.50 | | | | 0.77 | |
Service Class I | | | 1,000 | | | | 0.69 | % | | | 1,056.20 | | | | 3.59 | | | | 1,021.80 | | | | 3.53 | |
| Focused Equity Fund | | | | | | | | | | | | | | | | | | | | | | | | |
Class II | | | 1,000 | | | | 0.90 | % | | | 1,119.10 | | | | 4.82 | | | | 1,020.70 | | | | 4.60 | |
Service Class I | | | 1,000 | | | | 1.15 | % | | | 1,118.50 | | | | 6.16 | | | | 1,019.50 | | | | 5.87 | |
222
Other Information (Unaudited) (Continued)
| | | | | | | | | | | | | | | | | | | | | | | | |
| | | Beginning
Value | | | Annualized
Expense
Ratio | | | Ending
Value (Based
on Actual
Returns and
Expenses) | | | Operating
Expenses
Incurred* | | | Ending
Value (Based
on
Hypothetical
Returns and
Expenses) | | | Operating
Expenses
Incurred* | |
| Foreign Fund | | | | | | | | | | | | | | | | | | | | | | | | |
Initial Class | | $ | 1,000 | | | | 0.96 | % | | $ | 1,167.70 | | | $ | 5.26 | | | $ | 1,020.40 | | | $ | 4.90 | |
Service Class | | | 1,000 | | | | 1.21 | % | | | 1,165.80 | | | | 6.62 | | | | 1,019.20 | | | | 6.17 | |
| Fundamental Growth Fund | | | | | | | | | | | | | | | | | | | | | | | | |
Class II | | | 1,000 | | | | 0.85 | % | | | 1,029.00 | | | | 4.36 | | | | 1,021.00 | | | | 4.34 | |
Service Class I | | | 1,000 | | | | 1.10 | % | | | 1,026.80 | | | | 5.63 | | | | 1,019.70 | | | | 5.61 | |
| Fundamental Value Fund | | | | | | | | | | | | | | | | | | | | | | | | |
Class II | | | 1,000 | | | | 0.80 | % | | | 1,075.20 | | | | 4.20 | | | | 1,021.20 | | | | 4.09 | |
Service Class I | | | 1,000 | | | | 1.05 | % | | | 1,073.50 | | | | 5.50 | | | | 1,020.00 | | | | 5.36 | |
| Global Fund | | | | | | | | | | | | | | | | | | | | | | | | |
Class I | | | 1,000 | | | | 0.90 | % | | | 1,140.20 | | | | 4.87 | | | | 1,020.70 | | | | 4.60 | |
Class II | | | 1,000 | | | | 0.80 | % | | | 1,141.00 | | | | 4.33 | | | | 1,021.20 | | | | 4.09 | |
Service Class I | | | 1,000 | | | | 1.15 | % | | | 1,138.20 | | | | 6.21 | | | | 1,019.50 | | | | 5.87 | |
| Growth & Income Fund | | | | | | | | | | | | | | | | | | | | | | | | |
Initial Class | | | 1,000 | | | | 0.57 | % | | | 1,096.80 | | | | 3.02 | | | | 1,022.40 | | | | 2.91 | |
Service Class | | | 1,000 | | | | 0.82 | % | | | 1,096.10 | | | | 4.34 | | | | 1,021.10 | | | | 4.19 | |
| Income & Growth Fund | | | | | | | | | | | | | | | | | | | | | | | | |
Initial Class | | | 1,000 | | | | 0.71 | % | | | 1,049.70 | | | | 3.68 | | | | 1,021.70 | | | | 3.63 | |
Service Class | | | 1,000 | | | | 0.96 | % | | | 1,049.50 | | | | 4.97 | | | | 1,020.40 | | | | 4.90 | |
| Large Cap Growth Fund | | | | | | | | | | | | | | | | | | | | | | | | |
Initial Class | | | 1,000 | | | | 0.70 | % | | | 1,050.30 | | | | 3.63 | | | | 1,021.70 | | | | 3.58 | |
Service Class | | | 1,000 | | | | 0.95 | % | | | 1,049.10 | | | | 4.92 | | | | 1,020.50 | | | | 4.85 | |
| Large Cap Value Fund | | | | | | | | | | | | | | | | | | | | | | | | |
Initial Class | | | 1,000 | | | | 0.83 | % | | | 1,059.50 | | | | 4.32 | | | | 1,021.10 | | | | 4.24 | |
Service Class | | | 1,000 | | | | 1.08 | % | | | 1,057.70 | | | | 5.62 | | | | 1,019.80 | | | | 5.51 | |
| Mid Cap Growth Fund | | | | | | | | | | | | | | | | | | | | | | | | |
Initial Class | | | 1,000 | | | | 0.81 | % | | | 1,057.30 | | | | 4.21 | | | | 1,021.20 | | | | 4.14 | |
Service Class | | | 1,000 | | | | 1.06 | % | | | 1,055.40 | | | | 5.51 | | | | 1,019.90 | | | | 5.41 | |
| Mid Cap Value Fund | | | | | | | | | | | | | | | | | | | | | | | | |
Initial Class | | | 1,000 | | | | 0.88 | % | | | 1,086.90 | | | | 4.64 | | | | 1,020.80 | | | | 4.49 | |
Service Class | | | 1,000 | | | | 1.13 | % | | | 1,085.40 | | | | 5.96 | | | | 1,019.60 | | | | 5.77 | |
| PIMCO Total Return Fund | | | | | | | | | | | | | | | | | | | | | | | | |
Class II | | | 1,000 | | | | 0.65 | % | | | 1,042.00 | | | | 3.35 | | | | 1,022.00 | | | | 3.32 | |
Service Class I | | | 1,000 | | | | 0.90 | % | | | 1,040.50 | | | | 4.64 | | | | 1,020.70 | | | | 4.60 | |
| Small Cap Growth Equity Fund | | | | | | | | | | | | | | | | | | | | | | | | |
Initial Class | | | 1,000 | | | | 1.11 | % | | | 1,047.90 | | | | 5.75 | | | | 1,019.70 | | | | 5.67 | |
Service Class | | | 1,000 | | | | 1.36 | % | | | 1,046.50 | | | | 7.03 | | | | 1,018.40 | | | | 6.94 | |
| Small Company Value Fund | | | | | | | | | | | | | | | | | | | | | | | | |
Class II | | | 1,000 | | | | 1.15 | % | | | 1,098.50 | | | | 6.10 | | | | 1,019.50 | | | | 5.87 | |
Service Class I | | | 1,000 | | | | 1.40 | % | | | 1,097.40 | | | | 7.42 | | | | 1,018.20 | | | | 7.14 | |
| Small/Mid Cap Value Fund | | | | | | | | | | | | | | | | | | | | | | | | |
Initial Class | | | 1,000 | | | | 0.80 | % | | | 1,111.00 | | | | 4.27 | | | | 1,021.20 | | | | 4.09 | |
Service Class | | | 1,000 | | | | 1.05 | % | | | 1,109.20 | | | | 5.60 | | | | 1,020.00 | | | | 5.36 | |
| * | Expenses are calculated using the annualized expense ratio for the six months ended December 31, 2012, multiplied by the average account value over the period, multiplied by the number of days in the period, divided by the number of days in the year, unless stated otherwise. |
223
Distributor:
MML Distributors, LLC
1295 State Street
Springfield, MA 01111-0001

| | |
©2013 Massachusetts Mutual Life Insurance Company, Springfield, MA 01111-0001. All rights reserved. www.massmutual.com. MassMutual
Financial Group is a marketing name for Massachusetts Mutual Life Insurance Company (MassMutual) and its affiliated companies and sales representatives. | | L4540a 113 CRN201309-162849 |
MML SERIES INVESTMENT FUND
Supplement dated March 1, 2013 to the
Annual Report dated December 31, 2012
This supplement provides updated information beyond that contained in the Annual Report. It should be retained and read in conjunction with the Annual Report.
The following information replaces similar information for the Aggressive Allocation Fund, American Funds Growth Fund, American Funds International Fund, and American Funds Core Allocation Fund found on page 56 under the heading Expense Caps and Waivers in the section titled Notes to Financial Statements.
| | | | | | |
| | | Initial Class | | Service Class | | Service Class I |
| Aggressive Allocation Fund* | | 0.20% | | 0.45% | | None |
| American Funds Growth Fund* | | None | | None | | 0.70% |
| American Funds International Fund* | | None | | None | | 0.70% |
| American Funds Core Allocation Fund* | | None | | None | | 0.75% |
| # | Master/Acquired Fund fees and expenses are expenses borne indirectly by a Fund through investments in other pooled investment vehicles. |
| * | Expense caps in effect through April 30, 2013. Interest expense and short sale dividend and loan expense were not excluded from the caps prior to May 1, 2012. |
Table of Contents
This material must be preceded or accompanied by a current prospectus (or summary prospectus, if available) for the MML Series Investment Fund. Investors should consider a Fund’s investment objective, risks, and charges and expenses carefully before investing. This and other information about the investment company is available in the prospectus (or summary prospectus, if available). Read it carefully before investing.
MML Series Investment Fund – President’s Letter to Shareholders (Unaudited)
To Our Shareholders

Richard J. Byrne
“MassMutual believes you can most effectively pursue your retirement goals by creating a long-term investment plan designed to suit your investment time horizon and your tolerance for risk, monitoring that plan regularly, and adjusting your strategy when appropriate.”
December 31, 2012
Retirement investors face ongoing market volatility
I am pleased to present you with the MML Series Investment Fund Annual Report, covering the year ended December 31, 2012. Navigating an environment that included both continued global economic malaise and positive signs for the future, investors drove most major equity markets worldwide to strong advances for the period, despite the volatility and weak stock performance that characterized both the second and fourth quarters of 2012.
The willingness of some central bankers and country leaders to take bold steps to help resolve ongoing problems in both Europe and the U.S. encouraged investors for much of the year. Other reasons for optimism that emerged over the course of 2012 included signs of a strengthening U.S. housing market, positive earnings reports from companies in numerous industries, and improvements in U.S. employment statistics and gross domestic product (GDP) figures.
As 2012 wound down, investors watched and reacted to news surrounding the November U.S. elections and the countdown to the so-called fiscal cliff, a combination of tax hikes and spending cuts set to take effect early in 2013 unless Congress could agree on an alternate plan. Market volatility increased as the year-end fiscal cliff deadline approached, but news about a possible agreement on the last day of the year helped stocks finish 2012 with a rally, and a signed bill addressing many tax issues was in place by the end of the first trading day of 2013.
Investing guidelines for retirement investors
MassMutual believes you can most effectively pursue your retirement goals by creating a long-term investment plan designed to suit your investment time horizon and your tolerance for risk, monitoring that plan regularly, and adjusting your strategy when appropriate. Keeping certain investing guidelines in mind (such as those below) can help you maintain your long-term perspective.
Time may be your ally
Investing for retirement is a decades-long process for most people. The financial markets will be volatile from time to time, but many patient investors who have taken a long-term approach have managed to ride out the downturns and have successfully grown their account balances and reached their retirement goals over time.*
Continue to invest
Some of the most sophisticated investors believe that individuals who can weather a bear market have the potential to be rewarded by amassing larger positions at more favorable prices (relative to those who do not continue to invest during a down market). That’s why most financial professionals believe it’s important to stay in the market, regardless of short-term results.*
| | * | Systematic investing and asset allocation do not ensure a profit or protect against loss in a declining market. Systematic investing involves continuous investment in securities regardless of fluctuating price levels. Investors should consider
their ability to continue investing through periods of low price levels. |
(Continued)
1
MML Series Investment Fund – President’s Letter to Shareholders (Unaudited) (Continued)
Monitor your asset allocation and diversify
Stocks, bonds, and short-term/money market investments are investment types that typically behave differently depending upon the economic and market environment. Those broad investment types contain an even greater array of sub-categories (such as small-cap stocks, international stocks, and high-yield bonds). Many financial professionals believe that investors can take advantage of different opportunities in the market and reduce the risk of over-exposure to one or two poorly performing investment types by maintaining a portfolio that includes a mix of investment types and sub-categories.*
Who Matters Most to You Says the Most About You.SM
At MassMutual, our customers matter most to us, which is why one of our primary goals is to give retirement investors tools they can use to help them achieve their long-term financial goals. You may want to take this opportunity to make an appointment with your financial professional, so you can evaluate your current retirement-planning strategy and determine whether or not you need to fine-tune the plan – based on your long-term investment objectives, time frame, and risk tolerance. We know how important your financial future is to you, so we thank you for putting your trust in MassMutual.
Sincerely,

Richard J. Byrne
President
The information provided is the opinion of MassMutual Retirement Services Investment Services as of 1/1/13 and is subject to change without notice. It is not to be construed as tax, legal or investment advice. Of course, past performance does not guarantee future results.
2
MML Series Investment Fund – Economic and Market Overview (Unaudited)
December 31, 2012
Stock markets climb despite ongoing uncertainty
In 2012, optimistic investors overcame concerns about the sovereign debt crisis in Europe, slow growth in China, and an improving, but still unsteady, economy here at home to drive stock markets across the globe to solid advances. Investors also contended with game-changing questions in 2012, including who would win the U.S. Presidential and key congressional races and whether or not the uncertainty over the impending “fiscal cliff” would be resolved. (“Fiscal cliff” is the adopted term for a large reduction of the federal budget deficit through significant tax increases and spending cuts, which were scheduled to become effective on January 1, 2013, unless Congress could strike an alternate plan.) The U.S. Federal Reserve (the “Fed”) and other central banks from around the world helped calm occasionally jittery markets by implementing actions intended to stimulate their respective economies, and key interest rates continued to remain near historical lows. Additionally, U.S. manufacturing, employment, gross domestic product (“GDP”), and housing statistics told a story of an economy unsure of its strength at times, but still indicated continued improvement overall for the year.
The price of oil gyrated up and down throughout much of 2012, going from around $103 per barrel in early January, to a low of nearly $78 in late June, before closing the year at $92. Gasoline prices mainly moved in a similar fashion, with consumers getting some relief at the pumps during the early summer of 2012 in between bouts with much higher prices overall – and prices that once again began to escalate as 2013 approached. Gold started the period at around $1,616 per ounce and fluctuated over the 12 months, peaking at $1,781 on October 5. The price of the precious metal ended the year at $1,675.
The Fed continued to keep interest rates at historically low levels, with the federal funds rate remaining at 0.0% to 0.25% – the level the rate has occupied since December 2008 – in an ongoing attempt to stimulate the economy. The federal funds rate is the interest rate that banks and other financial institutions charge each other for borrowing funds overnight. The central bank confirmed its commitment to keeping interest rates low, stating in its Federal Open Market Committee meeting notes in April 2012 that economic conditions were “expected to warrant an exceptionally low federal funds rate through late 2014.” In June, the Fed announced its extension of Operation Twist (the stimulus program under which the Fed has been aiming to boost economic growth by causing long-term interest rates to decline by selling shorter-term U.S. Treasury securities and using the proceeds to buy those with longer terms) through the end of 2012. In September, Chairman Ben Bernanke announced the Fed’s decision to launch a third round of quantitative easing, or QE3, which involves the central bank’s purchase of $40 billion in agency mortgage-backed securities per month in an effort to lower mortgage rates and spur greater activity in the housing market.
Market performance
Equities rewarded investors for the year ended December 31, 2012, with foreign stocks outpacing most U.S. counterparts. The MSCI Emerging Markets Index, a measure of the performance of emerging stock markets throughout the world, advanced 18.22%, and the MSCI® EAFE® Index, a barometer for foreign stocks in developed markets, gained 17.32% for the year. Technology stock benchmark the NASDAQ Composite® Index (“NASDAQ”) was the leader among domestic broad-market indexes and rose an impressive 17.45%. The small-cap Russell 2000® Index and large-cap S&P 500® Index (the “S&P 500”) picked up 16.35% and 16.00%, respectively. The blue-chip Dow Jones Industrial AverageSM (the “Dow”) lagged other U.S. stock indexes, but still posted a double-digit advance, rising 10.24%.
Bonds generally underperformed equities by a wide margin during the 12 months. One exception was the Barclays U.S. Corporate High Yield Index, a measure of the performance of fixed-rate, non-investment-grade debt from corporate sectors, which advanced 15.81%, as investors sought higher returns relative to other bonds. Conversely, the Barclays U.S. Aggregate Bond Index, a broad measure of the U.S. investment-grade bond markets, gained only 4.21%. The environment of low interest rates continued to take its toll, with shorter-term debt investments struggling to stay in positive territory. The Barclays U.S. 1-3 Year Government Bond Index, which measures the performance of short-term U.S. government bonds, returned just 0.51%; and Treasury bills advanced only slightly, as measured by the Citigroup 3-Month Treasury Bill Index, which gained a mere 0.07%.*
| * | Indexes are unmanaged, do not incur fees or expenses and cannot be purchased directly for investment. |
3
MML Series Investment Fund – Economic and Market Overview (Unaudited) (Continued)
First quarter: Stocks outperform bonds to start the year
U.S. and foreign stocks rose solidly in the first quarter of 2012, with share prices grounding out steady gains punctuated by brief and shallow corrections. Bonds underperformed stocks across the board. Treasury yields traded in a relatively narrow range until mid-March, when they spiked higher on growing optimism about the U.S. economy. (Bond prices move in the opposite direction to interest rates [or yields]; when yields rise, the prices of existing bonds fall – and vice versa.) By the end of the month, however, yields had retraced about half of their advance.
The Commerce Department reported in the first quarter that private-sector spending and private investment helped boost the U.S. economy to a 2.8% annualized expansion in the fourth quarter of 2011. The economy typically expands by more than 3% annually during an economic recovery, which is the pace that economists consider necessary to bring down unemployment. Housing had its ups and downs: In January 2012, the Commerce Department reported that sales of new homes had unexpectedly dropped in the previous month. In February 2012, however, reports indicated that big price reductions in the U.S. real estate market had given a lift to existing home sales, which rose 4.3% in January.
In Europe, Standard & Poor’s downgraded the government debt of France, Spain, Italy, and Austria in January on concerns over high debt levels and those countries’ significant need to refinance debt in 2013. Greece’s fiscal situation brightened in March, as significant progress in that country’s negotiations with its private-sector creditors cleared the way for a second €130 billion bailout for the debt-strapped nation from the European Union (“EU”) and the International Monetary Fund. Also in March, Chinese Premier Wen Jiabao cut the country’s 2012 target growth rate to 7.5% – China’s lowest growth target in eight years.
Second quarter: bonds outpace stocks as worries over Europe re-emerge
The U.S. stock market had a challenging second quarter in 2012, with all widely followed market indexes suffering single-digit losses. The European debt crisis, which had receded as a major source of concern for investors in the first quarter, worsened once again. Consequently, foreign stocks trailed their U.S. counterparts. On the positive side, equities trimmed their losses from their early June lows and jumped about 2% on the final day of the quarter on news of a “breakthrough” deal at the two-day summit of EU leaders. In the bond market, the yield of U.S. Treasury securities plummeted and prices soared amid investors’ decreasing appetite for risk. At quarter-end, the yield of the bellwether 10-year Treasury note stood near its all-time low. Longer-dated Treasuries were standout performers, while TIPS (Treasury Inflation-Protected Securities) also did well. Within the corporate sector, investment-grade bonds generally fared better than high-yield debt. Employment trends downshifted during April, and payroll growth slowed in the second quarter. Corporate earnings were mainly positive, but manufacturing was down.
Prices on Spanish and Italian debt fell during the second quarter, after rallying earlier in the year in response to the European Central Bank’s (“ECB”) Long-Term Refinancing Operations lending facility. Spanish and Italian banks were reported to have tapped a direct lending line from the ECB. In addition, concern began building around the prospect of Greece leaving the euro zone. Later in the quarter, there was a positive reaction to the election of a pro-austerity government in Greece. Here in the U.S., the Supreme Court voted 5 to 4 in June to uphold the Affordable Care Act, the health care law signed by President Obama in 2010. The ruling left the law essentially intact, with most mandates taking effect in 2014.
Third quarter: Stocks on top; central banks come to the rescue
Popular stock indexes in the U.S. posted solid gains in the third quarter of 2012, as some of the globe’s most powerful central bankers decided it was time to take action once again. In July, ECB President Mario Draghi stated he would do “whatever it takes” to preserve the euro, and the ECB supported that statement with a new bond-buying program in September. About a week later, Fed Chairman Ben Bernanke announced the launch of QE3. Around the same time, the Bank of Japan followed suit, announcing plans to ramp up its bond-buying program. Foreign equity markets modestly outperformed their domestic counterparts for the quarter, primarily due to a weaker U.S. dollar.
Bonds trailed equities in the third quarter of 2012, as Treasury yields fluctuated, but finished September with minimal change. Conversely, corporate bonds, including high-yield debt, did well, but lost some momentum late in the quarter. Manufacturing showed some expansion as the quarter came to an end, but export orders remained under pressure, reflecting mainly weak global markets. Continued improvement in the unemployment rate as the period ended seemed at odds with data about jobless claims. Housing finished the quarter strongly.
4
MML Series Investment Fund – Economic and Market Overview (Unaudited) (Continued)
Fourth quarter: Stocks mixed; U.S. re-elects President Obama
U.S. stocks turned in a mixed performance for the fourth quarter of 2012, with the most widely followed indexes (the S&P 500, the NASDAQ, and the Dow) declining while small- and mid-cap stock benchmarks advanced. Foreign stocks from developed and emerging markets rose solidly. Bonds were mainly flat, with the exception of high-yield issues, which outperformed most U.S. stock indexes. There was considerable volatility during the period. Stocks declined immediately after the November elections – which included the re-election of President Obama along with Republicans and Democrats maintaining their majorities in the House and Senate, respectively – but negative sentiment persisted for only a brief time, as the market recovered much of its loss by the end of the month. In December, share prices advanced irregularly for much of the month before falling back later on investor concerns that time was running out for lawmakers to reach an agreement to avoid the approaching fiscal cliff. The final day of the year saw all of the major stock indexes turn in healthy advances amid rumors of an impending agreement. In a last-ditch effort, legislators finally struck a deal on New Year’s Day that addresses many tax issues but leaves other questions unresolved.
The November jobs report, released in the first week of December, was surprisingly positive – at least at the headline level. The unemployment rate declined to 7.7% from 7.9% due to lower job market participation, and many more jobs were created than had been forecasted. Third-quarter U.S. GDP, a measure of all final goods and services produced in the nation, underwent an upward revision in December – from 2.7% to 3.1% – and both figures were considerable improvements over the 1.3% rate of expansion posted in the second quarter of 2012. The fourth quarter brought signs of stabilization in the economies of key emerging markets such as China, which had been experiencing slowing economic growth for most of the year. In contrast, much of Europe remained in a recession along with Japan as the year drew to a close.
As 2013 got underway, investors had plenty to occupy their attention, including ongoing economic concerns in Europe and the Far East as well as the still-unresolved aspects of the fiscal cliff here at home. The U.S. will hog the spotlight in the near future as key battles remain in Washington, such as those that focus on the debt ceiling, upcoming spending cuts, and tax and entitlement reform, which many see as key to long-term federal deficit reduction and economic strength. We expect investors will pay attention to these developments and numerous others, as they search for indications about what may lie ahead for the world’s financial markets.
The information provided is the opinion of MassMutual Retirement Services Investment Services as of 1/1/13 and is subject to change without notice. It is not to be construed as tax, legal or investment advice. Of course, past performance does not guarantee future results.
5
MML Allocation Fund Series – Portfolio Manager Report (Unaudited)
What are the investment approaches of the Funds that constitute the MML Allocation Series (the “Series”), and who is the Series’ investment adviser?
The MML Allocation Series comprises five Funds – each of which has a “fund of funds” structure. The five Funds in the Series are MML Conservative Allocation Fund, MML Balanced Allocation Fund, MML Moderate Allocation Fund, MML Growth Allocation Fund, and MML Aggressive Allocation Fund.
Each Fund seeks to achieve as high a total rate of return on an annual basis as is considered consistent with prudent investment risk and the preservation of capital. Each Fund invests in a combination of domestic and international mutual funds (“Underlying Funds”) using an asset allocation strategy. Underlying Funds can include series of the MML Series Investment Fund and MML Series Investment Fund II (which are advised by Massachusetts Mutual Life Insurance Company (MassMutual)), OppenheimerFunds (which are advised by OppenheimerFunds, Inc. (OFI), a majority owned, indirect subsidiary of MassMutual), and non-affiliated funds. The Series’ investment adviser is MassMutual.
Through their investment in Underlying Funds, the Funds may be exposed to a wide range of securities and other instruments with differing characteristics (such as credit quality, duration, geography, industry, and market capitalization), including, but not limited to, equity securities of small-, mid-, or large-capitalization U.S. or non-U.S. issuers, fixed income securities of U.S. or non-U.S. private or governmental issuers (including “junk” or “high-yield” bonds, including securities in default), inflation-protected securities, bank loans, and short-term investments of any kind.
Each Fund’s assets are allocated to its Underlying Funds according to an asset allocation strategy, as follows:
| • | | MML Conservative Allocation Fund: Approximately 40% in equity funds and 60% in fixed income funds, including money market funds. |
| • | | MML Balanced Allocation Fund: Approximately 50% in equity funds and 50% in fixed income funds, including money market funds. |
| • | | MML Moderate Allocation Fund: Approximately 60% in equity funds and 40% in fixed income funds, including money market funds. |
| • | | MML Growth Allocation Fund: Approximately 75% in equity funds and 25% in fixed income funds, including money market funds. |
| • | | MML Aggressive Allocation Fund: Approximately 90% in equity funds and 10% in fixed income funds, including money market funds. |
6
MML Allocation Fund Series – Portfolio Manager Report (Unaudited) (Continued)
How did each Fund perform during the 12 months ended December 31, 2012?
The return of each Fund’s Initial Class shares is shown below. Also shown are the returns of each Fund’s Custom Index (defined below); the Russell 3000® Index, a widely recognized, unmanaged index that measures the performance of the 3,000 largest U.S. companies based on market capitalization; the Morgan Stanley Capital International All Country World Index (MSCI® ACWI) ex-U.S., an unmanaged index representative of stocks domiciled in global developed and emerging markets, excluding the United States; and the Barclays U.S. Aggregate Bond Index, an unmanaged index of fixed-rate investment-grade securities with at least one year to maturity, combining the Barclays U.S. Treasury Bond Index, the Barclays U.S. Government-Related Bond Index, the Barclays U.S. Corporate Bond Index, and the Barclays U.S. Securitized Bond Index.
| | | | | | | | | | |
| | | Fund’s Initial
Class Return | | Custom
Index Return | | Russell 3000
Index Return | | MSCI ACWI
ex-U.S. Return | | Barclays U.S.
Aggregate Bond
Index Return |
MML Conservative
Allocation Fund | | 11.40% | | 9.27% | | 16.42% | | 16.83% | | 4.21%* |
| | | | | |
MML Balanced
Allocation Fund | | 12.40% | | 10.52% | | 16.42%* | | 16.83% | | 4.21% |
| | | | | |
MML Moderate
Allocation Fund | | 13.17% | | 11.76% | | 16.42%* | | 16.83% | | 4.21% |
| | | | | |
| MML Growth Allocation Fund | | 14.49% | | 13.62% | | 16.42%* | | 16.83% | | 4.21% |
| | | | | |
| MML Aggressive Allocation Fund | | 15.73% | | 15.46% | | 16.42%* | | 16.83% | | 4.21% |
* Benchmark return
Each of the MML Allocation Series Funds outperformed its respective Custom Index for the full year – and all five Funds (each of which has a stock component) also outpaced the Barclays U.S. Aggregate Bond Index. Conversely, all of the Series Funds underperformed both the Russell 3000 Index and the MSCI ACWI ex-U.S.
MML Allocation Fund Series Custom Indexes
| • | | The Custom MML Conservative Allocation Index comprises the Barclays U.S. Aggregate Bond Index, the Russell 3000 Index, and the MSCI ACWI ex-U.S. The weightings of each index are 60%, 30%, and 10%, respectively. |
| • | | The Custom MML Balanced Allocation Index comprises the Barclays U.S. Aggregate Bond Index, the Russell 3000 Index, and the MSCI ACWI ex-U.S. The weightings of each index are 50%, 37.5%, and 12.5%, respectively. |
| • | | The Custom MML Moderate Allocation Index comprises the Barclays U.S. Aggregate Bond Index, the Russell 3000 Index, and the MSCI ACWI ex-U.S. The weightings of each index are 40%, 45%, and 15%, respectively. |
| • | | The Custom MML Growth Allocation Index comprises the Barclays U.S. Aggregate Bond Index, the Russell 3000 Index, and the MSCI ACWI ex-U.S. The weightings of each index are 25%, 56.25%, and 18.75%, respectively. |
| • | | The Custom MML Aggressive Allocation Index comprises the Barclays U.S. Aggregate Bond Index, the Russell 3000 Index, and the MSCI ACWI ex-U.S. The weightings of each index are 10%, 67.5%, and 22.5%, respectively. |
7
MML Allocation Fund Series – Portfolio Manager Report (Unaudited) (Continued)
For a discussion on the economic and market environment during the 12-month period ended December 31, 2012, please see the Economic and Market Review, beginning on page 3.
Investment adviser discussion of factors that contributed to the Funds’ performance
The Series had a strong year overall by diversifying across asset classes and managers. From an allocation perspective, positions in fixed-income Underlying Funds that focused their objectives outside of the Barclays U.S. Aggregate Bond Index proved beneficial – and served to be a key performance driver for 2012. For example, during the year the Series Funds realized strong returns from the high-yield segment of the fixed-income market through their investment in MML High Yield Fund, which outperformed its own high-yield bond benchmark to amplify the positive impact of the Series Funds’ high-yield investment. Secondarily, positions in multi-sector fixed-income funds, such as Oppenheimer Global Securities Fund, which includes international bonds and corporate high-yield bonds, significantly outperformed the Barclays U.S. Aggregate Bond Index. Lastly, the Series Funds’ investments in MML Inflation-Protected and Income Fund also contributed to the Series Funds’ overall performance, as U.S. Treasury inflation-protected securities (TIPS) outperformed domestic investment-grade bonds.
With respect to the Series Funds’ equity investments, allocations to international equities were an important driver in the second half of 2012, after a difficult first half. For the year, international equities, as represented by the MSCI EAFE® Index, outperformed the S&P 500® Index. The Series Funds maintained significant exposure to international equities throughout 2012, a move that proved beneficial during the year. From a market-capitalization perspective, positioning in large-cap equities over small caps proved to be a slight detractor from performance, as the S&P 500 Index modestly trailed the small-cap Russell 2000® Index for the year. From an investment style perspective, the Series Funds’ overweight positioning in value stocks, relative to growth stocks, benefited performance, as the Russell 1000® Value Index outperformed the Russell 1000 Growth Index for the year.
Reviewing the Underlying Fund positions in the Series, 2012 marked the addition of two funds. The first was MML Focused Equity Fund, a large-cap fund with a concentrated value orientation, which had strong relative and absolute performance in 2012 and has the potential to be a key performance driver across the Series. The second new fund, MML Fundamental Growth Fund, became part of a diversifying strategy in the Series’ important large-cap growth component. MML Blue Chip Growth Fund and MML Large Cap Growth Fund helped drive solid performance in the challenging large-cap growth category. The addition of MML Fundamental Growth Fund will further diversify the category and allow for potentially greater allocations to the Series’ large growth segment as we move into 2013.
Investment adviser outlook
We expect 2013 to be a more difficult year for the markets, with tougher year-over-year comparisons for equities, fiscal drag from changes to payroll taxes hampering the consumer (particularly the return of the 6.2% FICA contribution rate for employees from the temporarily reduced 4.2% level), and price/earnings ratios fairly consistent with historical averages. During 2013, we plan to seek to gain greater exposure for the Series in Underlying Funds focused on international equities and growth stocks on an opportunistic basis. With respect to the Series Funds’ fixed-income investments, we remain diligent and have positioned the Underlying Funds’ exposure to help cushion the impact of any unexpected upticks in interest rates and the potential downside of currently high valuations of riskier bonds.
8
MML Allocation Fund Series – Portfolio Manager Report (Unaudited) (Continued)
| | | | |
MML Conservative Allocation Fund Asset Allocation (% of Net Assets) on 12/31/12 | |
| | |
Fixed Income Funds | | | 60.7 | % |
Equity Funds | | | 39.4 | % |
| | | | | |
Total Long-Term Investments | | | 100.1 | % |
Other Assets & Liabilities | | | (0.1 | )% |
| | | | | |
Net Assets | | | 100.0 | % |
| | | | | |
| | | | |
MML Moderate Allocation Fund Asset Allocation (% of Net Assets) on 12/31/12 | |
| | |
Equity Funds | | | 59.7 | % |
Fixed Income Funds | | | 40.4 | % |
| | | | | |
Total Long-Term Investments | | | 100.1 | % |
Other Assets & Liabilities | | | (0.1 | )% |
| | | | | |
Net Assets | | | 100.0 | % |
| | | | | |
| | | | |
MML Balanced Allocation Fund Asset Allocation (% of Net Assets) on 12/31/12 | |
| | |
Fixed Income Funds | | | 51.0 | % |
Equity Funds | | | 49.1 | % |
| | | | | |
Total Long-Term Investments | | | 100.1 | % |
Other Assets & Liabilities | | | (0.1 | )% |
| | | | | |
Net Assets | | | 100.0 | % |
| | | | | |
| | | | |
MML Growth Allocation Fund Asset Allocation (% of Net Assets) on 12/31/12 | |
| | |
Equity Funds | | | 74.8 | % |
Fixed Income Funds | | | 25.3 | % |
| | | | | |
Total Long-Term Investments | | | 100.1 | % |
Other Assets & Liabilities | | | (0.1 | )% |
| | | | | |
Net Assets | | | 100.0 | % |
| | | | | |
| | | | |
MML Aggressive Allocation Fund Asset Allocation (% of Net Assets) on 12/31/12 | |
| | |
Equity Funds | | | 90.2 | % |
Fixed Income Funds | | | 9.9 | % |
| | | | | |
Total Long-Term Investments | | | 100.1 | % |
Other Assets & Liabilities | | | (0.1 | )% |
| | | | | |
Net Assets | | | 100.0 | % |
| | | | | |
9
MML Conservative Allocation Fund – Portfolio Manager Report (Unaudited) (Continued)
Growth of a $10,000 Investment
Hypothetical Investments in MML Conservative Allocation Fund Initial Class, the Barclays U.S. Aggregate Bond Index, the Russell 3000 Index, the MSCI ACWI ex-U.S., and the Custom MML Conservative Allocation Index.
| | | | | | | | | | | | |
| | | | |
| TOTAL RETURN | | One Year
1/1/12 -
12/31/12 | | | Five Year
Average
Annual
1/1/08 -
12/31/12 | | | Since
Inception
Average
Annual
8/31/07 -
12/31/12 | |
| Initial Class | | | 11.40% | | | | 4.54% | | | | 4.85% | |
| Barclays U.S. Aggregate Bond Index* | | | 4.21% | | | | 5.95% | | | | 6.26% | |
| Russell 3000 Index | | | 16.42% | | | | 2.04% | | | | 2.17% | |
MSCI ACWI ex-U.S. | | | 16.83% | | | | -3.43% | | | | -2.22% | |
| Custom MML Conservative Allocation Index | | | 9.27% | | | | 4.79% | | | | 5.05%+ | |
Hypothetical Investments in MML Conservative Allocation Fund Service Class, the Barclays U.S. Aggregate Bond Index, the Russell 3000 Index, the MSCI ACWI ex-U.S., and the Custom MML Conservative Allocation Index.
| | | | | | | | |
| | | |
| TOTAL RETURN | | One Year
1/1/12 -
12/31/12 | | | Since
Inception
Average
Annual
8/15/08 -
12/31/12 | |
| Service Class | | | 11.15% | | | | 5.71% | |
| Barclays U.S. Aggregate Bond Index* | | | 4.21% | | | | 6.53% | |
| Russell 3000 Index | | | 16.42% | | | | 4.75% | |
| MSCI ACWI ex-U.S. | | | 16.83% | | | | 1.01% | |
| Custom MML Conservative Allocation Index | | | 9.27% | | | | 6.44%++ | |
GROWTH OF $10,000 INVESTMENT SINCE INCEPTION
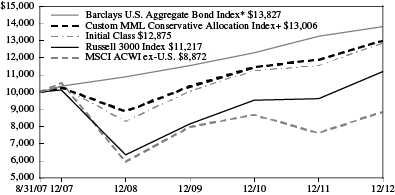

* Benchmark
+ From 9/4/07.
++ From 9/2/08.
Performance data quoted represents past performance; past performance is not predictive of future results. The investment return and principal value of shares of the Fund will fluctuate with market conditions so that shares of the Fund, when redeemed, may be worth more or less than their original cost. Current performance of the Fund may be lower or higher than the performance quoted. Performance data current to the most recent month end may be obtained by accessing the website www.massmutual.com.
Investors should note that the Fund is a professionally managed mutual fund, while the Barclays U.S. Aggregate Bond Index, the Russell 3000 Index, the MSCI ACWI ex-U.S., and the Custom MML Conservative Allocation Index are unmanaged, do not incur expenses, and cannot be purchased directly by investors. Investors should read the Fund’s prospectus with regard to the Fund’s investment objective, risks, and charges and expenses in conjunction with these financial statements. The Fund’s return reflects changes in the net asset value per share without the deduction of any product charges (e.g., cost of insurance, mortality and expense risk charges, administrative fees, and CDSL). The inclusion of these charges would have reduced the performance shown here.
10
MML Balanced Allocation Fund – Portfolio Manager Report (Unaudited) (Continued)
Growth of a $10,000 Investment
Hypothetical Investments in MML Balanced Allocation Fund Initial Class, the Russell 3000 Index, the Barclays U.S. Aggregate Bond Index, the MSCI ACWI ex-U.S., and the Custom MML Balanced Allocation Index.
| | | | | | | | | | | | |
| | | | |
| TOTAL RETURN | | One Year 1/1/12 -
12/31/12 | | | Five Year
Average
Annual 1/1/08 -
12/31/12 | | | Since
Inception
Average
Annual 8/31/07 -
12/31/12 | |
| Initial Class | | | 12.40% | | | | 3.69% | | | | 4.02% | |
| Russell 3000 Index* | | | 16.42% | | | | 2.04% | | | | 2.17% | |
| Barclays U.S. Aggregate Bond Index | | | 4.21% | | | | 5.95% | | | | 6.26% | |
MSCI ACWI ex-U.S. | | | 16.83% | | | | -3.43% | | | | -2.22% | |
| Custom MML Balanced Allocation Index | | | 10.52% | | | | 4.33% | | | | 4.57%+ | |
Hypothetical Investments in MML Balanced Allocation Fund Service Class, the Russell 3000 Index, the Barclays U.S. Aggregate Bond Index, the MSCI ACWI ex-U.S., and the Custom MML Balanced Allocation Index.
| | | | | | | | |
| | | |
| TOTAL RETURN | | One Year 1/1/12 -
12/31/12 | | | Since
Inception
Average
Annual 8/15/08 -
12/31/12 | |
| Service Class | | | 12.12% | | | | 5.16% | |
| Russell 3000 Index* | | | 16.42% | | | | 4.75% | |
| Barclays U.S. Aggregate Bond Index | | | 4.21% | | | | 6.53% | |
| MSCI ACWI ex-U.S. | | | 16.83% | | | | 1.01% | |
| Custom MML Balanced Allocation Index | | | 10.52% | | | | 6.25%++ | |
GROWTH OF $10,000 INVESTMENT SINCE INCEPTION
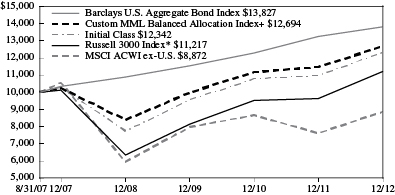
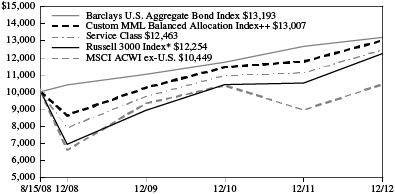
* Benchmark
+ From 9/4/07.
++ From 9/2/08.
Performance data quoted represents past performance; past performance is not predictive of future results. The investment return and principal value of shares of the Fund will fluctuate with market conditions so that shares of the Fund, when redeemed, may be worth more or less than their original cost. Current performance of the Fund may be lower or higher than the performance quoted. Performance data current to the most recent month end may be obtained by accessing the website www.massmutual.com.
Investors should note that the Fund is a professionally managed mutual fund, while the Russell 3000 Index, the Barclays U.S. Aggregate Bond Index, the MSCI ACWI ex-U.S., and the Custom MML Balanced Allocation Index are unmanaged, do not incur expenses, and cannot be purchased directly by investors. Investors should read the Fund’s prospectus with regard to the Fund’s investment objective, risks, and charges and expenses in conjunction with these financial statements. The Fund’s return reflects changes in the net asset value per share without the deduction of any product charges (e.g., cost of insurance, mortality and expense risk charges, administrative fees, and CDSL). The inclusion of these charges would have reduced the performance shown here.
11
MML Moderate Allocation Fund – Portfolio Manager Report (Unaudited) (Continued)
Growth of a $10,000 Investment
Hypothetical Investments in MML Moderate Allocation Fund Initial Class, the Russell 3000 Index, the Barclays U.S. Aggregate Bond Index, the MSCI ACWI ex-U.S., and the Custom MML Moderate Allocation Index.
| | | | | | | | | | | | |
| | | | |
| TOTAL RETURN | | One Year 1/1/12 -
12/31/12 | | | Five Year
Average
Annual 1/1/08 -
12/31/12 | | | Since
Inception
Average
Annual 8/31/07 -
12/31/12 | |
| Initial Class | | | 13.17% | | | | 3.38% | | | | 3.67% | |
| Russell 3000 Index* | | | 16.42% | | | | 2.04% | | | | 2.17% | |
| Barclays U.S. Aggregate Bond Index | | | 4.21% | | | | 5.95% | | | | 6.26% | |
MSCI ACWI ex-U.S. | | | 16.83% | | | | -3.43% | | | | -2.22% | |
| Custom MML Moderate Allocation Index | | | 11.76% | | | | 3.79% | | | | 4.03%+ | |
Hypothetical Investments in MML Moderate Allocation Fund Service Class, the Russell 3000 Index, the Barclays U.S. Aggregate Bond Index, the MSCI ACWI ex-U.S., and the Custom MML Moderate Allocation Index.
| | | | | | | | |
| | | |
| TOTAL RETURN | | One Year 1/1/12 -
12/31/12 | | | Since
Inception
Average
Annual 8/15/08 -
12/31/12 | |
| Service Class | | | 12.82% | | | | 5.07% | |
| Russell 3000 Index* | | | 16.42% | | | | 4.75% | |
| Barclays U.S. Aggregate Bond Index | | | 4.21% | | | | 6.53% | |
| MSCI ACWI ex-U.S. | | | 16.83% | | | | 1.01% | |
| Custom MML Moderate Allocation Index | | | 11.76% | | | | 5.99%++ | |
GROWTH OF $10,000 INVESTMENT SINCE INCEPTION
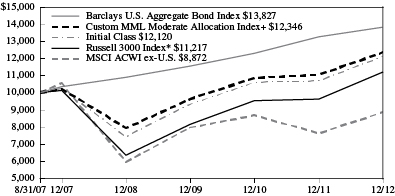
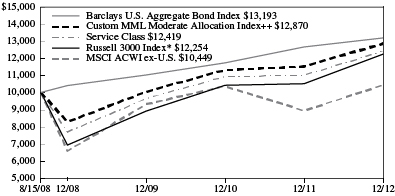
* Benchmark
+ From 9/4/07.
++ From 9/2/08.
Performance data quoted represents past performance; past performance is not predictive of future results. The investment return and principal value of shares of the Fund will fluctuate with market conditions so that shares of the Fund, when redeemed, may be worth more or less than their original cost. Current performance of the Fund may be lower or higher than the performance quoted. Performance data current to the most recent month end may be obtained by accessing the website www.massmutual.com.
Investors should note that the Fund is a professionally managed mutual fund, while the Russell 3000 Index, the Barclays U.S. Aggregate Bond Index, the MSCI ACWI ex-U.S., and the Custom MML Moderate Allocation Index are unmanaged, do not incur expenses, and cannot be purchased directly by investors. Investors should read the Fund’s prospectus with regard to the Fund’s investment objective, risks, and charges and expenses in conjunction with these financial statements. The Fund’s return reflects changes in the net asset value per share without the deduction of any product charges (e.g., cost of insurance, mortality and expense risk charges, administrative fees, and CDSL). The inclusion of these charges would have reduced the performance shown here.
12
MML Growth Allocation Fund – Portfolio Manager Report (Unaudited) (Continued)
Growth of a $10,000 Investment
Hypothetical Investments in MML Growth Allocation Fund Initial Class, the Russell 3000 Index, the Barclays U.S. Aggregate Bond Index, the MSCI ACWI ex-U.S., and the Custom MML Growth Allocation Index.
| | | | | | | | | | | | |
| | | | |
| TOTAL RETURN | | One Year 1/1/12 -
12/31/12 | | | Five Year
Average
Annual 1/1/08 -
12/31/12 | | | Since
Inception
Average
Annual 8/31/07 -
12/31/12 | |
| Initial Class | | | 14.49% | | | | 2.45% | | | | 2.76% | |
| Russell 3000 Index* | | | 16.42% | | | | 2.04% | | | | 2.17% | |
| Barclays U.S. Aggregate Bond Index | | | 4.21% | | | | 5.95% | | | | 6.26% | |
MSCI ACWI ex-U.S. | | | 16.83% | | | | -3.43% | | | | -2.22% | |
| Custom MML Growth Allocation Index | | | 13.62% | | | | 2.86% | | | | 3.09%+ | |
Hypothetical Investments in MML Growth Allocation Fund Service Class, the Russell 3000 Index, the Barclays U.S. Aggregate Bond Index, the MSCI ACWI ex-U.S., and the Custom MML Growth Allocation Index.
| | | | | | | | |
| | | |
| TOTAL RETURN | | One Year 1/1/12 -
12/31/12 | | | Since
Inception
Average
Annual 8/15/08 -
12/31/12 | |
| Service Class | | | 14.28% | | | | 4.59% | |
| Russell 3000 Index* | | | 16.42% | | | | 4.75% | |
| Barclays U.S. Aggregate Bond Index | | | 4.21% | | | | 6.53% | |
| MSCI ACWI ex-U.S. | | | 16.83% | | | | 1.01% | |
| Custom MML Growth Allocation Index | | | 13.62% | | | | 5.45%++ | |
GROWTH OF $10,000 INVESTMENT SINCE INCEPTION
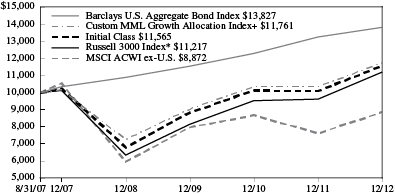
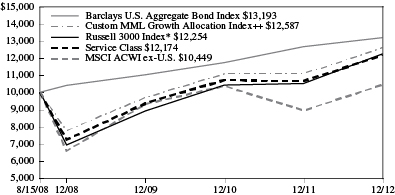
* Benchmark
+ From 9/4/07.
++ From 9/2/08.
Performance data quoted represents past performance; past performance is not predictive of future results. The investment return and principal value of shares of the Fund will fluctuate with market conditions so that shares of the Fund, when redeemed, may be worth more or less than their original cost. Current performance of the Fund may be lower or higher than the performance quoted. Performance data current to the most recent month end may be obtained by accessing the website www.massmutual.com.
Investors should note that the Fund is a professionally managed mutual fund, while the Russell 3000 Index, the Barclays U.S. Aggregate Bond Index, the MSCI ACWI ex-U.S., and the Custom MML Growth Allocation Index are unmanaged, do not incur expenses, and cannot be purchased directly by investors. Investors should read the Fund’s prospectus with regard to the Fund’s investment objective, risks, and charges and expenses in conjunction with these financial statements. The Fund’s return reflects changes in the net asset value per share without the deduction of any product charges (e.g., cost of insurance, mortality and expense risk charges, administrative fees, and CDSL). The inclusion of these charges would have reduced the performance shown here.
13
MML Aggressive Allocation Fund – Portfolio Manager Report (Unaudited) (Continued)
Growth of a $10,000 Investment
Hypothetical Investments in MML Aggressive Allocation Fund Initial Class, the Russell 3000 Index, the Barclays U.S. Aggregate Bond Index, the MSCI ACWI ex-U.S., and the Custom MML Aggressive Allocation Index.
| | | | | | | | | | | | |
| | | | |
| TOTAL RETURN | | One Year 1/1/12 -
12/31/12 | | | Five Year
Average
Annual 1/1/08 -
12/31/12 | | | Since
Inception
Average
Annual 8/31/07 -
12/31/12 | |
| Initial Class | | | 15.73% | | | | 1.70% | | | | 2.00% | |
| Russell 3000 Index* | | | 16.42% | | | | 2.04% | | | | 2.17% | |
| Barclays U.S. Aggregate Bond Index | | | 4.21% | | | | 5.95% | | | | 6.26% | |
| MSCI ACWI ex-U.S. | | | 16.83% | | | | -3.43% | | | | -2.22% | |
| Custom MML Aggressive Allocation Index | | | 15.46% | | | | 1.75% | | | | 1.99%+ | |
Hypothetical Investments in MML Aggressive Allocation Fund Service Class, the Russell 3000 Index, the Barclays U.S. Aggregate Bond Index, the MSCI ACWI ex-U.S., and the Custom MML Aggressive Allocation Index.
| | | | | | | | |
| | | |
| TOTAL RETURN | | One Year 1/1/12 -
12/31/12 | | | Since
Inception
Average
Annual 8/15/08 -
12/31/12 | |
| Service Class | | | 15.35% | | | | 4.17% | |
| Russell 3000 Index* | | | 16.42% | | | | 4.75% | |
| Barclays U.S. Aggregate Bond Index | | | 4.21% | | | | 6.53% | |
| MSCI ACWI ex-U.S. | | | 16.83% | | | | 1.01% | |
| Custom MML Aggressive Allocation Index | | | 15.46% | | | | 4.72%++ | |
GROWTH OF $10,000 INVESTMENT SINCE INCEPTION
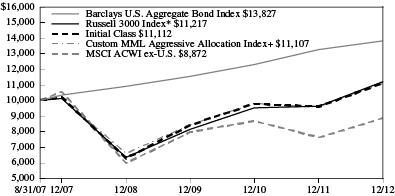
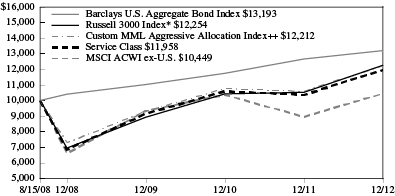
* Benchmark
+ From 9/4/07.
++ From 9/2/08.
Performance data quoted represents past performance; past performance is not predictive of future results. The investment return and principal value of shares of the Fund will fluctuate with market conditions so that shares of the Fund, when redeemed, may be worth more or less than their original cost. Current performance of the Fund may be lower or higher than the performance quoted. Performance data current to the most recent month end may be obtained by accessing the website www.massmutual.com.
Investors should note that the Fund is a professionally managed mutual fund, while the Russell 3000 Index, the Barclays U.S. Aggregate Bond Index, the MSCI ACWI ex-U.S., and the Custom MML Aggressive Allocation Index are unmanaged, do not incur expenses, and cannot be purchased directly by investors. Investors should read the Fund’s prospectus with regard to the Fund’s investment objective, risks, and charges and expenses in conjunction with these financial statements. The Fund’s return reflects changes in the net asset value per share without the deduction of any product charges (e.g., cost of insurance, mortality and expense risk charges, administrative fees, and CDSL). The inclusion of these charges would have reduced the performance shown here.
14
MML American Funds Growth Fund – Portfolio Manager Report (Unaudited)
What is the investment approach of MML American Funds® Growth Fund, and who is the Fund’s investment adviser?
The Fund seeks to provide investors with long-term capital growth through a “master feeder” relationship. (See page 52 of this report for information about the “master feeder” relationship.) The Fund invests all of its assets in Class 1 shares of the American Funds Insurance Series – Growth Fund (the “Master Growth Fund”), a series of the American Funds Insurance Series®, a registered open-end investment company, managed by Capital Research and Management Company (Capital Research) with substantially the same investment objective. The Master Growth Fund invests primarily in common stocks and seeks to invest in companies that appear to offer superior opportunities for growth of capital. The Master Growth Fund may invest a portion of its assets in common stocks and other securities of issuers domiciled outside the United States. Although the Master Growth Fund focuses on investments in medium- to large-capitalization companies, the Master Growth Fund’s investments are not limited to a particular capitalization size. The Fund’s investment adviser is Massachusetts Mutual Life Insurance Company (MassMutual).
How did the Fund perform during the 12 months ended December 31, 2012?
The Fund returned 17.41%, outperforming the 16.00% return of the S&P 500® Index (the “benchmark”), a widely recognized, unmanaged index representative of common stocks of larger capitalized U.S. companies. The Fund also outpaced the 15.26% return of the Russell 1000® Growth Index, an unmanaged index consisting of those Russell 1000 securities (representing the 1,000 largest U.S. companies based on market capitalization) with greater than average growth orientation that tend to exhibit higher price-to-book ratios and higher forecasted growth rates than securities in the value universe.
For a discussion on the economic and market environment during the 12-month period ended December 31, 2012, please see the Economic and Market Review, beginning on page 3.
Capital Research’s discussion of factors that contributed to the Fund’s performance
The Fund outperformed the benchmark primarily due to strong stock selection. Our stock holdings choices within health care and technology proved to be the greatest driver of the Fund’s returns for the 2012. Within the health care sector, biotechnology stocks in particular outperformed, as Fund holdings Regeneron Pharmaceuticals, Grifolf (based in Spain), and Gilead Sciences were three strong drivers of performance. In the technology sector, Fund holding Apple was the clear standout among the Fund’s technology stocks. We did, however, significantly reduce the Fund’s exposure to this consumer electronics giant throughout the second half of the year. Also within the technology sector, the Fund’s lack of exposure to semiconductor chip manufacturer Intel proved beneficial, as the company experienced a challenging year due to declining sales of personal computers. Finally, the Fund’s greater-than-benchmark exposure to the consumer discretionary sector, which represented the largest overweight position within the Fund for the year, helped performance, as the consumer discretionary sector performed well during the 12-month period.
During 2012, the Fund faced some challenges. The greatest detractor from performance was the Fund’s cash position, which averaged 8% of its assets. While this was a normal allocation for the Fund, it nevertheless hampered performance in 2012’s mostly strong equity market environment. Also providing a drag on performance was stock selection in the materials sector. Mining companies detracted the most, with the laggards including Fund holdings Barrick Gold (a Canadian metals and mining company that is not a member of the S&P 500 Index); Newmont Mining, one of the world’s largest producers of gold; and Potash, a producer of fertilizer, industrial, and animal feed products. This Canadian company is another of the Fund’s out-of-benchmark holdings. In the energy sector, our stock selection proved challenging, as Concho Resources – an oil, gas, and consumable fuel company not represented in the S&P 500 Index – lost 14%.
Although sector positioning was strong overall, the Fund’s slightly overweight position in the energy sector, relative to the benchmark, detracted slightly from performance, as this sector lagged the overall market for the year. In addition, the Fund’s overweight allocation to the materials sector hampered Fund returns somewhat, as this was also an underperforming sector in 2012.
During the year, the Fund held an approximate 20% allocation to non-U.S. equities. In general, the Fund’s positioning from a country standpoint (outside of the U.S.) was positive – particularly with respect to Spain and India – but the Fund’s allocations to certain countries, such as Canada, detracted, although the Fund’s exposure to the strong-performing Canadian dollar contributed to performance for the year.
15
MML American Funds Growth Fund – Portfolio Manager Report (Unaudited) (Continued)
Capital Research’s outlook
With macro-economic risks in Europe declining, the U.S. and China putting political transitions behind them, and corporate managements getting better clarity on fiscal and tax policies, we believe that 2013 will be a year of investing selectively. As macro-economic risks become less pronounced and correlations among stocks and bonds are declining, we see a more helpful environment for active managers.
As fundamentally based active managers, we invest in companies as opposed to markets. Despite the expectations for global economic growth to remain sluggish in 2013, corporations overall remain in great financial health, with solid balance sheets and lean cost structures. Our managers and analysts are finding attractive investment opportunities in companies across sectors, particularly in biotechnology, the shale-gas boom, cloud computing, and products and services oriented toward consumer demand from rapidly growing developing economies. Additionally, with investors eager for income in a low interest rate environment, cash-flow-rich companies that pay and increase dividends will remain attractive.
| | | | |
MML American Funds Growth Fund Asset Allocation (% of Net Assets) on 12/31/12 | |
| | |
Equity Funds | | | 100.1 | % |
| | | | | |
Total Long-Term Investments | | | 100.1 | % |
Other Assets & Liabilities | | | (0.1 | )% |
| | | | | |
Net Assets | | | 100.0 | % |
| | | | | |
16
MML American Funds Growth Fund – Portfolio Manager Report (Unaudited) (Continued)
Growth of a $10,000 Investment
Hypothetical Investments in MML American Funds Growth Fund Service Class I, the S&P 500 Index, and the Russell 1000 Growth Index.
| | | | | | | | |
| | | |
| TOTAL RETURN | | One Year 1/1/12 -
12/31/12 | | | Since
Inception
Average
Annual 8/15/08 -
12/31/12 | |
| Service Class I | | | 17.41% | | | | 3.59% | |
| S&P 500 Index* | | | 16.00% | | | | 4.59% | |
| Russell 1000 Growth Index | | | 15.26% | | | | 5.72% | |
GROWTH OF $10,000 INVESTMENT SINCE INCEPTION
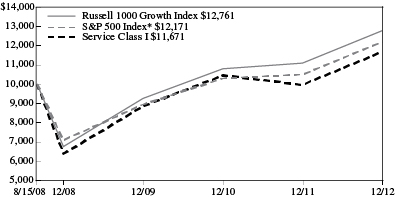
* Benchmark
Performance data quoted represents past performance; past performance is not predictive of future results. The investment return and principal value of shares of the Fund will fluctuate with market conditions so that shares of the Fund, when redeemed, may be worth more or less than their original cost. Current performance of the Fund may be lower or higher than the performance quoted. Performance data current to the most recent month end may be obtained by accessing the website www.massmutual.com.
Investors should note that the Fund is a professionally managed mutual fund, while the S&P 500 Index and the Russell 1000 Growth Index are unmanaged, do not incur expenses, and cannot be purchased directly by investors. Investors should read the Fund’s prospectus with regard to the Fund’s investment objective, risks, and charges and expenses in conjunction with these financial statements. The Fund’s return reflects changes in the net asset value per share without the deduction of any product charges (e.g., cost of insurance, mortality and expense risk charges, administrative fees, and CDSL). The inclusion of these charges would have reduced the performance shown here.
17
MML American Funds International Fund – Portfolio Manager Report (Unaudited)
What is the investment approach of MML American Funds® International Fund, and who is the Fund’s investment adviser?
The Fund seeks long-term capital growth of assets through a “master-feeder” relationship. (See page 52 of this report for information about the “master feeder” relationship.) The Fund invests all of its assets in Class 1 shares of the American Funds Insurance Series – International Fund (the “Master International Fund”), a series of the American Funds Insurance Series®, a registered open-end investment company managed by Capital Research and Management Company (Capital Research) with substantially the same investment objective. The Master International Fund invests primarily in common stocks of companies located outside the United States, including in emerging and developing countries, that Capital Research believes have the potential for growth. Although the Master International Fund focuses on investments in medium- to large-capitalization companies, the Master International Fund’s investments are not limited to a particular capitalization size. The Fund’s investment adviser is Massachusetts Mutual Life Insurance Company (MassMutual).
How did the Fund perform during the 12 months ended December 31, 2012?
The Fund returned 17.38%, outperforming the 16.83% return of Morgan Stanley Capital International All Country World Index (MSCI® ACWI®) ex-U.S. (the “benchmark”), an unmanaged index representative of stocks domiciled in global developed and emerging markets, excluding the United States. The Fund also outpaced the 17.32% return of the Morgan Stanley Capital International (MSCI) Europe, Australasia, Far East (EAFE®) Index, a widely recognized, unmanaged index representative of equity securities in developed markets, excluding the U.S. and Canada.
For a discussion on the economic and market environment during the 12-month period ended December 31, 2012, please see the Economic and Market Review, beginning on page 3.
Capital Research’s discussion of factors that contributed to the Fund’s performance
The Fund outperformed the benchmark in 2012, largely due to favorable stock selection. The strongest-performing Fund holdings came from the industrials sector and included French professional services company Bureau Veritas, Swedish building products company Assa Abloy, and Irish airline Ryanair Holdings. Other Fund holdings that were standouts in this sector included French electrical equipment company LeGrand, German airline Deutsche Lufthansa, and French electric equipment company Schneider Electric.
The Fund’s underweight position in the materials sector, relative to the benchmark, helped drive performance, as this sector lagged the broader market. Stock selection within materials was also strong – particularly with respect to stocks that the Fund didn’t own, such as metals/mining company Barrick Gold, and U.K.-based Anglo American, a diversified mining company that focuses on platinum, diamonds, copper, nickel, and iron ore. In the telecommunications sector, Fund holding Hellenic Telecommunications – a Greek diversified telecommunications company that offers broadband Internet and other related services – had a strong year. Additionally, the Fund’s underweight stake in Vodafone, a U.K.-based wireless provider that faced severe fines and penalties in both Europe and Asia, helped performance, as did the Fund’s avoidance of Telefonica, a weak-performing Spanish diversified telecommunications provider. Fund holding MTN Group Ltd., a South Africa-based multinational mobile telecommunications company, also did well. The Fund’s underweight allocation to energy was a strong positive, and we increased the Fund’s position in this sector over the course of the year. Finally, from a country attribution perspective, the Fund’s allocation to Germany was the biggest contributor to performance, as German markets in general had a strong year. The Fund’s stock selection in Germany also proved beneficial. Stock selection in Korea was also favorable, as Samsung Electronics was a top-performing Fund holding for the year. Conversely, the Fund’s overweight position in Korea hurt, as that market lagged the benchmark – but the Fund’s exposure to that country’s currency helped boost overall performance.
Top detractors for the Fund in 2012 included an underweight stake and less-than-favorable stock selection in the strong-performing financials sector. Here, it was a matter of which stocks the Fund either didn’t own or didn’t own enough of. Stocks in one or the other category included Australian commercial banks Australia & New Zealand Banking Group, Commonwealth Bank of Australia, and Westpac Banking Corp. Other strong performers that the Fund didn’t own that did well included German insurer Allianz and U.K.-based commercial bank Lloyd’s Banking Group. Ultimately, we decreased the Fund’s allocation to the financials sector as the year progressed – a move that ultimately hurt the Fund’s performance. The Fund’s 7% cash position, a lower-than-average allocation, also was a drag on absolute performance results in 2012’s mostly strong equity market environment. Stock selection in the strong-performing consumer discretionary sector also hindered the Fund’s full-year results.
18
MML American Funds International Fund – Portfolio Manager Report (Unaudited) (Continued)
Consumer discretionary holdings that were the top detractors included Japanese companies Internet and catalog retailer Rakuten and specialty retailer Yamada Denki Company. Not owning Japanese auto manufacturer Toyota also detracted from performance. Korean and Indonesian automobile stocks that the Fund did own were also detractors and included Kia and Hyundai (both Korean), as well as Astra International (Indonesian). From a country allocation standpoint, the Fund’s only position in Israel, Teva Pharmaceuticals, hampered performance. Finally, stock selection in China also proved challenging, as NetEase, the largest Internet provider in China, had a tough year. During the year, we reduced the Fund’s weighting in China slightly, but maintained the country’s overweight position as 2012 came to a close.
Capital Research’s outlook
With macro-economic risks in Europe declining, the U.S. and China putting political transitions behind them, and corporate managements getting better clarity on fiscal and tax policies, we believe that 2013 will be a year of investing selectively. As macro-economic risks become less pronounced and correlations among stocks and bonds are declining, we see a more helpful environment for active managers.
As fundamentally based active managers, we invest in companies as opposed to markets. Despite the expectations for global economic growth to remain sluggish in 2013, corporations overall remain in great financial health, with solid balance sheets and lean cost structures. Our managers and analysts are finding attractive investment opportunities in companies across sectors, particularly in biotechnology, the shale-gas boom, cloud computing, and products and services oriented toward consumer demand from rapidly growing developing economies. Additionally, with investors eager for income in a low interest rate environment, cash-flow-rich companies that pay and increase dividends will remain attractive.
| | | | |
MML American Funds International Fund Asset Allocation (% of Net Assets) on 12/31/12 | |
| | |
Equity Funds | | | 100.2 | % |
| | | | | |
Total Long-Term Investments | | | 100.2 | % |
Other Assets and Liabilities | | | (0.2 | )% |
| | | | | |
Net Assets | | | 100.0 | % |
| | | | | |
19
MML American Funds International Fund – Portfolio Manager Report (Unaudited) (Continued)
Growth of a $10,000 Investment
Hypothetical Investments in MML American Funds International Fund Service Class I, the MSCI ACWI ex-U.S., and the MSCI EAFE Index.
| | | | | | | | |
| | | |
| TOTAL RETURN | | One Year 1/1/12 -
12/31/12 | | | Since
Inception
Average
Annual 8/15/08 -
12/31/12 | |
| Service Class I | | | 17.38% | | | | 1.34% | |
| MSCI ACWI ex-U.S.* | | | 16.83% | | | | 1.01% | |
| MSCI EAFE Index | | | 17.32% | | | | 0.11% | |
GROWTH OF $10,000 INVESTMENT SINCE INCEPTION
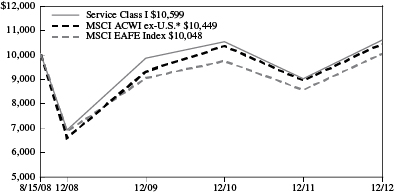
* Benchmark
Performance data quoted represents past performance; past performance is not predictive of future results. The investment return and principal value of shares of the Fund will fluctuate with market conditions so that shares of the Fund, when redeemed, may be worth more or less than their original cost. Current performance of the Fund may be lower or higher than the performance quoted. Performance data current to the most recent month end may be obtained by accessing the website www.massmutual.com.
Investors should note that the Fund is a professionally managed mutual fund, while the MSCI ACWI ex-U.S. and the MSCI EAFE Index are unmanaged, do not incur expenses, and cannot be purchased directly by investors. Investors should read the Fund’s prospectus with regard to the Fund’s investment objective, risks, and charges and expenses in conjunction with these financial statements. The Fund’s return reflects changes in the net asset value per share without the deduction of any product charges (e.g., cost of insurance, mortality and expense risk charges, administrative fees, and CDSL). The inclusion of these charges would have reduced the performance shown here.
20
MML American Funds Core Allocation Fund – Portfolio Manager Report (Unaudited)
What is the investment approach of MML American Funds® Core Allocation Fund, and who is the Fund’s investment adviser?
The Fund seeks as high a total rate of return on an annual basis as is considered consistent with prudent investment risk and the preservation of capital. The Fund is a “fund of funds” and seeks to achieve its investment objective by principally investing in a combination of series of the American Funds Insurance Series® (the “Underlying Funds”), managed by Capital Research and Management Company (Capital Research), using a flexible asset allocation approach. As of the date of this report, it is expected that the Underlying Funds will include Class 1 shares of the American Funds Insurance Series – Bond Fund, the American Funds Insurance Series – Blue Chip Income and Growth Fund, the American Funds Insurance Series – Growth-Income Fund, and the American Funds Insurance Series – International Fund. The Fund’s investment adviser allocates the Fund’s assets among a variety of different asset classes through investing in Underlying Funds in response to changing market, economic, and investment conditions. The Fund’s investment adviser invests the Fund’s assets in a combination of domestic and international Underlying Funds. The Fund’s investment adviser is Massachusetts Mutual Life Insurance Company (MassMutual).
How did the Fund perform during the 12 months ended December 31, 2012?
The Fund returned 11.70%, trailing the 16.00% return of the S&P 500® Index (the “benchmark”), a widely recognized, unmanaged index representative of common stocks of larger capitalized U.S. companies. The Fund also underperformed the 16.83% return of the Morgan Stanley Capital International All Country World Index (MSCI® ACWI®) ex-U.S., an unmanaged index representative of stocks domiciled in global developed and emerging markets, excluding the United States. The Fund outperformed the 4.21% return of the Barclays U.S. Aggregate Bond Index, an unmanaged index of fixed-rate investment-grade securities with at least one year to maturity, combining the Barclays U.S. Treasury Bond Index, the Barclays U.S. Government-Related Bond Index, the Barclays U.S. Corporate Bond Index, and the Barclays U.S. Securitized Bond Index. Finally, the Fund’s 11.70% return underperformed the 12.04% return of the Custom MML Core Allocation Index, which comprises the benchmark (55%), the Barclays U.S. Aggregate Bond Index (35%), and the MSCI ACWI ex-U.S. (10%).
For a discussion on the economic and market environment during the 12-month period ended December 31, 2012, please see the Economic and Market Review, beginning on page 3.
Capital Research’s discussion of factors that contributed to the Fund’s performance
The following paragraphs discuss the results of each of the Fund’s underlying portfolio components. Because the Fund invests in both stock- and bond-based portfolios, its overall performance may vary considerably from the broad market indexes listed above, which each measure the performance of a specific group of securities. These component-specific discussions focus on results and positioning versus each component’s main comparative index, not how the Fund as a whole performed or was positioned versus those indexes.
With respect to the American Funds Insurance Series – Bond Fund (the “Bond Fund”), the Fund outperformed the Barclays U.S. Aggregate Bond Index (the “Index”). In the investment-grade corporate bond sector, issuer selection was the strongest contributor to performance. With respect to the Fund’s banking/financial holdings, U.K.-based Lloyd’s Banking Group, Royal Bank of Scotland, and Italian bank Unicredit were strong performers – as was Bank of America. In telecommunications, Fund holding Telecom Italia, Italy’s largest telecommunications company, also did well for the year. In addition, the Fund’s overweight allocation to high-yield bonds, relative to the benchmark, helped performance, as these lower-quality bonds (i.e., issues rated lower than BBB) outperformed in an environment where investors sought higher yield. The Fund’s underweight position in U.S. Treasuries also helped returns, since Treasuries didn’t keep pace with the broader market. The Fund’s higher-than-benchmark allocation to emerging-market debt also proved positive. Conversely, hampering the Fund’s performance for the year was its overweight position in agencies and agency pass-throughs, which continued to underperform due to the expected persistency of lower interest rates. In the Fund’s corporate bond component, Netherlands-based oil refiner Petro Plus and U.K.-based industrial conglomerate Revel Holdings were two issues that underperformed. Finally, the Fund’s underweight position in longer-duration Treasuries hampered performance for the year.
The American Funds Insurance Series – Blue Chip Income and Growth Fund (the “Income and Growth Fund”) underperformed the benchmark in 2012, as dividend-paying companies, which are a particular area of focus for the Fund, were out of favor for most of the year. Stock selection in the technology sector hampered performance, as Fund holdings including leading computer
21
MML American Funds Core Allocation Fund – Portfolio Manager Report (Unaudited) (Continued)
manufacturer Hewlett-Packard Co. and computer software giant Microsoft, which was a top Fund holding, both had a challenging year. The Fund’s 6.5% cash position, while not high for the Fund, did hamper performance in 2012’s mostly strong equity market. An underweight position in financials, the top-performing sector for the year, also hindered the Fund’s full-year results. The Fund’s avoidance of strong performers Bank of America and Goldman Sachs also created a drag on Fund performance. On the positive side, stock selection in health care was strong, particularly with respect to biotechnology stocks, as Fund holdings Amgen (one of the Fund’s largest holdings) and Gilead Sciences both had a very strong year. In the telecommunications sector, the Fund’s overweight position helped performance, as did specific Fund holdings, including wireless provider Sprint Nextel, which gained 142% for the year. In the consumer discretionary sector, Fund holding automobile manufacturer General Motors, which is not included in the S&P 500 Index, gave the Fund a lift and advanced 40% for the year. Finally, the Fund’s avoidance of McDonald’s Corp. was also a positive, as the leading fast-food provider had a difficult year.
The American Funds Insurance Series – Growth-Income Fund (the “Growth-Income Fund”) outperformed the benchmark, with strong stock selection making the greatest contribution to Fund performance – although an overweight position in the strong-performing consumer discretionary sector also contributed. Three of the four top-performing Fund holdings within the sector were media companies, including cable providers Comcast and Time-Warner Cable, as well as News Corp., a diversified multinational mass media company. Other top performers in the Fund’s consumer discretionary portfolio included home improvement giant Home Depot and auto manufacturer General Motors. In the health care sector, biotechnology company Gilead Sciences was the standout among the Fund’s holdings, followed by Amgen – also a biotechnology firm. The Fund’s underweight stake in the challenging pharmaceuticals area also helped performance for the year. On the other hand, hampering the Fund’s performance was its 10% cash position (a below-average weight for the Fund). The Fund’s underweight position in the financials sector also hurt performance, as did the Fund’s avoidance of Bank of America, which had a strong year. The Fund’s holdings in rail companies CSX and Norfolk Southern also worked against the Fund’s progress for the year.
The American Funds Insurance Series – International Fund (the “International Fund”) outperformed the MSCI All Country World Index ex-U.S. (the “Index”) for the year, largely due to favorable stock selection. The strongest-performing Fund holdings came from the industrials sector and included French professional services company Bureau Veritas, Swedish building products company Assa Abloy, and Irish airline Ryanair Holdings. The Fund’s underweight position in the materials sector, relative to the benchmark, helped drive performance, as this sector lagged the broader market. In the telecommunications sector, Fund holding Hellenic Telecommunications – a Greek diversified telecommunications company that offers broadband Internet and other related services – had a strong year. The Fund’s underweight allocation to energy was also a strong positive, and we increased the Fund’s position in this sector over the course of the year. From a country attribution perspective, the Fund’s allocation to Germany was the biggest contributor to performance, as German markets in general had a strong year. Top detractors for the Fund in 2012 included its underweight stake and less-than-favorable stock selection in the strong-performing financials sector. The Fund’s 7% cash position, a lower-than-average allocation, also was a drag on absolute Fund results. Stock selection in the strong-performing consumer discretionary sector also hindered the Fund’s full-year results. Consumer discretionary holdings that were the top detractors included Japanese companies Internet and catalog retailer Rakuten and specialty retailer Yamada Denki Company. From a country allocation standpoint, the Fund’s only position in Israel, Teva Pharmaceuticals, hampered performance. Finally, stock selection in China also proved challenging, as NetEase, the largest Internet provider in China, had a tough year. During the year, we reduced the Fund’s weighting in China slightly, but maintained the country’s overweight position as 2012 came to a close.
Capital Research’s outlook
With macro-economic risks in Europe declining, the U.S. and China putting political transitions behind them, and corporate managements getting better clarity on fiscal and tax policies, we believe that 2013 will be a year of investing selectively. As macro-economic risks become less pronounced and correlations among stocks and bonds are declining, we see a more helpful environment for active managers.
As fundamentally based active managers, we invest in companies as opposed to markets. Despite the expectations for global economic growth to remain sluggish in 2013, corporations overall remain in great financial health, with solid balance sheets and lean cost structures. Our managers and analysts are finding attractive investment opportunities in companies across sectors, particularly in biotechnology, the shale-gas boom, cloud computing, and products and services oriented toward consumer demand from rapidly growing developing economies. Additionally, with investors eager for income in a low interest rate environment, cash-flow-rich companies that pay and increase dividends will remain attractive.
22
MML American Funds Core Allocation Fund – Portfolio Manager Report (Unaudited) (Continued)
| | | | |
MML American Funds Core Allocation Fund Asset Allocation (% of Net Assets) on 12/31/12 | |
| | |
Equity Funds | | | 64.9 | % |
Fixed Income Funds | | | 35.2 | % |
| | | | | |
Total Long-Term Investments | | | 100.1 | % |
Other Assets & Liabilities | | | (0.1 | )% |
| | | | | |
Net Assets | | | 100.0 | % |
| | | | | |
23
MML American Funds Core Allocation Fund – Portfolio Manager Report (Unaudited) (Continued)
Growth of a $10,000 Investment
Hypothetical Investments in MML American Funds Core Allocation Fund Service Class I, the S&P 500 Index, the Barclays U.S. Aggregate Bond Index, the MSCI ACWI ex-U.S., and the Custom MML Core Allocation Index.
| | | | | | | | |
| | | |
| TOTAL RETURN | | One Year 1/1/12 -
12/31/12 | | | Since
Inception
Average
Annual 8/15/08 -
12/31/12 | |
| Service Class I | | | 11.70% | | | | 3.75% | |
| S&P 500 Index* | | | 16.00% | | | | 4.59% | |
| Barclays U.S. Aggregate Bond Index | | | 4.21% | | | | 6.53% | |
| MSCI ACWI ex-U.S. | | | 16.83% | | | | 1.01% | |
| Custom MML Core Allocation Index | | | 12.04% | | | | 5.51%+ | |
GROWTH OF $10,000 INVESTMENT SINCE INCEPTION
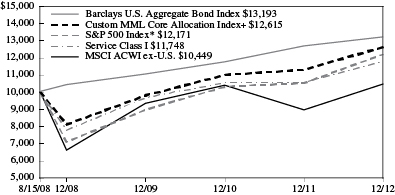
* Benchmark
+ From 9/2/08.
Performance data quoted represents past performance; past performance is not predictive of future results. The investment return and principal value of shares of the Fund will fluctuate with market conditions so that shares of the Fund, when redeemed, may be worth more or less than their original cost. Current performance of the Fund may be lower or higher than the performance quoted. Performance data current to the most recent month end may be obtained by accessing the website www.massmutual.com.
Investors should note that the Fund is a professionally managed mutual fund, while the S&P 500 Index, the Barclays U.S. Aggregate Bond Index, the MSCI ACWI ex-U.S., and the Custom MML Core Allocation Index are unmanaged, do not incur expenses, and cannot be purchased directly by investors. Investors should read the Fund’s prospectus with regard to the Fund’s investment objective, risks, and charges and expenses in conjunction with these financial statements. The Fund’s return reflects changes in the net asset value per share without the deduction of any product charges (e.g., cost of insurance, mortality and expense risk charges, administrative fees, and CDSL). The inclusion of these charges would have reduced the performance shown here.
24
MML Conservative Allocation Fund – Portfolio of Investments
December 31, 2012
| | | | | | | | |
| | | Number of
Shares | | | Value | |
| MUTUAL FUNDS — 100.1% | | | | | | | | |
| Diversified Financial — 100.1% | | | | | | | | |
MML Blue Chip Growth Fund, Initial Class (a) | | | 1,328,169 | | | $ | 17,930,281 | |
MML Equity Fund, Initial Class (a) | | | 215,910 | | | | 4,549,508 | |
MML Equity Income Fund, Initial Class (a) | | | 2,047,205 | | | | 21,638,961 | |
MML Focused Equity Fund, Class II (a) | | | 573,050 | | | | 6,584,341 | |
MML Foreign Fund, Initial Class (a) | | | 1,143,392 | | | | 10,827,917 | |
MML Fundamental Growth Fund, Class II (a) | | | 1,136,095 | | | | 12,428,883 | |
MML Fundamental Value Fund, Class II (a) | | | 1,297,551 | | | | 16,154,513 | |
MML Global Fund, Class I (a) | | | 1,074,322 | | | | 10,549,843 | |
MML High Yield Fund, Class II (a) | | | 1,734,005 | | | | 18,952,674 | |
MML Income & Growth Fund, Initial Class (a) | | | 1,037,984 | | | | 9,840,091 | |
MML Inflation-Protected and Income Fund, Initial Class (a) | | | 996,499 | | | | 11,818,480 | |
MML Large Cap Growth Fund, Initial Class (a) | | | 1,005,431 | | | | 11,683,107 | |
MML Managed Bond Fund, Initial Class (a) | | | 8,562,962 | | | | 113,049,221 | |
MML Mid Cap Growth Fund, Initial Class (a) | | | 818,543 | | | | 10,608,321 | |
MML Mid Cap Value Fund, Initial Class (a) | | | 1,183,681 | | | | 13,150,691 | |
MML PIMCO Total Return Fund, Class II (a) | | | 5,253,197 | | | | 56,839,592 | |
MML Short-Duration Bond Fund, Class II (a) | | | 3,159,118 | | | | 31,907,092 | |
MML Small Cap Growth Equity Fund, Initial Class (a) | | | 252,717 | | | | 4,119,417 | |
MML Small Company Value Fund, Class II (a) | | | 343,864 | | | | 6,485,275 | |
Oppenheimer Global Securities Fund, Non-Service Shares (a) | | | 256,904 | | | | 8,362,234 | |
Oppenheimer Global Strategic Income Fund, Non-Service Shares (a) | | | 5,672,492 | | | | 32,163,032 | |
Oppenheimer International Growth Fund, Non-Service Shares (a) | | | 3,432,563 | | | | 7,105,406 | |
| | | | | | | | |
| | | | | | | 436,748,880 | |
| | | | | | | | |
| | |
TOTAL MUTUAL FUNDS
(Cost $405,016,495) | | | | | | | 436,748,880 | |
| | | | | | | | |
| | | | | | |
| | | | | Value | |
TOTAL LONG-TERM
INVESTMENTS
(Cost $405,016,495) | | | | $ | 436,748,880 | |
| | | | | | |
| |
TOTAL INVESTMENTS — 100.1%
(Cost $405,016,495) (b) | | | 436,748,880 | |
| |
| Other Assets/(Liabilities) — (0.1)% | | | (290,008 | ) |
| | | | | | |
| | |
| NET ASSETS — 100.0% | | | | $ | 436,458,872 | |
| | | | | | |
Notes to Portfolio of Investments
| (a) | Affiliated issuer. (See Note 7 for a summary of transactions in the investments of affiliated issuers). |
| (b) | See Note 6 for aggregate cost for federal tax purposes. |
The accompanying notes are an integral part of the financial statements.
25
MML Balanced Allocation Fund – Portfolio of Investments
December 31, 2012
| | | | | | | | |
| | | Number of
Shares | | | Value | |
| MUTUAL FUNDS — 100.1% | | | | | | | | |
| Diversified Financial — 100.1% | | | | | | | | |
MML Blue Chip Growth Fund, Initial Class (a) | | | 1,734,143 | | | $ | 23,410,936 | |
MML Equity Fund, Initial
Class (a) | | | 286,759 | | | | 6,042,410 | |
MML Equity Income Fund, Initial Class (a) | | | 2,381,784 | | | | 25,175,460 | |
MML Focused Equity Fund,
Class II (a) | | | 908,339 | | | | 10,436,812 | |
MML Foreign Fund, Initial
Class (a) | | | 1,472,428 | | | | 13,943,890 | |
MML Fundamental Growth Fund,
Class II (a) | | | 1,500,939 | | | | 16,420,270 | |
MML Fundamental Value Fund,
Class II (a) | | | 1,555,416 | | | | 19,364,930 | |
MML Global Fund, Class I (a) | | | 1,382,303 | | | | 13,574,218 | |
MML High Yield Fund,
Class II (a) | | | 1,583,240 | | | | 17,304,808 | |
MML Income & Growth Fund, Initial Class (a) | | | 1,158,342 | | | | 10,981,084 | |
MML Inflation-Protected and Income Fund, Initial Class (a) | | | 828,180 | | | | 9,822,220 | |
MML Large Cap Growth Fund, Initial Class (a) | | | 1,351,817 | | | | 15,708,110 | |
MML Managed Bond Fund, Initial Class (a) | | | 7,811,503 | | | | 103,128,371 | |
MML Mid Cap Growth Fund, Initial Class (a) | | | 1,208,795 | | | | 15,665,979 | |
MML Mid Cap Value Fund, Initial Class (a) | | | 1,564,594 | | | | 17,382,638 | |
MML PIMCO Total Return Fund,
Class II (a) | | | 4,576,444 | | | | 49,517,124 | |
MML Short-Duration Bond Fund,
Class II (a) | | | 2,666,755 | | | | 26,934,230 | |
MML Small Cap Growth Equity Fund, Initial
Class (a) | | | 411,132 | | | | 6,701,670 | |
MML Small Company Value Fund,
Class II (a) | | | 554,875 | | | | 10,464,936 | |
Oppenheimer Global Securities Fund, Non-Service Shares (a) | | | 347,918 | | | | 11,324,740 | |
Oppenheimer Global Strategic Income Fund, Non-Service Shares (a) | | | 4,968,204 | | | | 28,169,716 | |
Oppenheimer International Growth Fund, Non-Service Shares (a) | | | 4,819,525 | | | | 9,976,418 | |
| | | | | | | | |
| | | | | | | 461,450,970 | |
| | | | | | | | |
| | |
TOTAL MUTUAL FUNDS
(Cost $413,770,102) | | | | | | | 461,450,970 | |
| | | | | | | | |
| | | | | | |
| | | | | Value | |
TOTAL LONG-TERM
INVESTMENTS
(Cost $413,770,102) | | | | $ | 461,450,970 | |
| | | | | | |
| | |
TOTAL INVESTMENTS — 100.1%
(Cost $413,770,102) (b) | | | | | 461,450,970 | |
| | |
| Other Assets/(Liabilities) — (0.1)% | | | | | (311,191 | ) |
| | | | | | |
| | |
| NET ASSETS — 100.0% | | | | $ | 461,139,779 | |
| | | | | | |
Notes to Portfolio of Investments
| (a) | Affiliated issuer. (See Note 7 for a summary of transactions in the investments of affiliated issuers). |
| (b) | See Note 6 for aggregate cost for federal tax purposes. |
The accompanying notes are an integral part of the financial statements.
26
MML Moderate Allocation Fund — Portfolio of Investments
December 31, 2012
| | | | | | | | |
| | | Number of
Shares | | | Value | |
| MUTUAL FUNDS — 100.1% | | | | | | | | |
| Diversified Financial — 100.1% | | | | | | | | |
MML Blue Chip Growth Fund, Initial Class (a) | | | 6,918,911 | | | $ | 93,405,308 | |
MML Equity Fund, Initial Class (a) | | | 1,071,634 | | | | 22,580,831 | |
MML Equity Income Fund, Initial Class (a) | | | 7,955,580 | | | | 84,090,483 | |
MML Focused Equity Fund, Class II (a) | | | 4,192,188 | | | | 48,168,237 | |
MML Foreign Fund, Initial Class (a) | | | 5,088,664 | | | | 48,189,649 | |
MML Fundamental Growth Fund, Class II (a) | | | 6,076,542 | | | | 66,477,375 | |
MML Fundamental Value Fund, Class II (a) | | | 5,554,412 | | | | 69,152,428 | |
MML Global Fund, Class I (a) | | | 4,778,673 | | | | 46,926,568 | |
MML High Yield Fund, Class II (a) | | | 4,586,960 | | | | 50,135,477 | |
MML Income & Growth Fund, Initial Class (a) | | | 4,710,783 | | | | 44,658,220 | |
MML Inflation-Protected and Income Fund, Initial Class (a) | | | 1,999,327 | | | | 23,712,019 | |
MML Large Cap Growth Fund, Initial Class (a) | | | 5,249,301 | | | | 60,996,878 | |
MML Managed Bond Fund, Initial Class (a) | | | 18,881,613 | | | | 249,277,242 | |
MML Mid Cap Growth Fund, Initial Class (a) | | | 4,782,203 | | | | 61,977,345 | |
MML Mid Cap Value Fund, Initial Class (a) | | | 5,999,051 | | | | 66,649,456 | |
MML PIMCO Total Return Fund, Class II (a) | | | 11,678,662 | | | | 126,363,121 | |
MML Short-Duration Bond Fund, Class II (a) | | | 7,321,417 | | | | 73,946,311 | |
MML Small Cap Growth Equity Fund, Initial Class (a) | | | 1,971,100 | | | | 32,130,004 | |
MML Small Company Value Fund, Class II (a) | | | 2,167,001 | | | | 40,869,646 | |
MML Strategic Emerging Markets Fund, Class II (a) | | | 1,404,551 | | | | 15,323,647 | |
Oppenheimer Global Securities Fund, Non-Service Shares (a) | | | 1,347,189 | | | | 43,850,988 | |
Oppenheimer Global Strategic Income Fund, Non-Service Shares (a) | | | 12,563,439 | | | | 71,234,702 | |
Oppenheimer International Growth Fund, Non-Service Shares (a) | | | 15,271,227 | | | | 31,611,441 | |
| | | | | | | | |
| | | | | | | 1,471,727,376 | |
| | | | | | | | |
| | |
TOTAL MUTUAL FUNDS
(Cost $1,308,084,727) | | | | | | | 1,471,727,376 | |
| | | | | | | | |
| | | | | | |
| | | | | Value | |
TOTAL LONG-TERM
INVESTMENTS
(Cost $1,308,084,727) | | | | $ | 1,471,727,376 | |
| | | | | | |
| | |
TOTAL INVESTMENTS — 100.1%
(Cost $1,308,084,727) (b) | | | | | 1,471,727,376 | |
| | |
| Other Assets/(Liabilities) — (0.1)% | | | | | (949,544 | ) |
| | | | | | |
| | |
| NET ASSETS — 100.0% | | | | $ | 1,470,777,832 | |
| | | | | | |
Notes to Portfolio of Investments
| (a) | Affiliated issuer. (See Note 7 for a summary of transactions in the investments of affiliated issuers). |
| (b) | See Note 6 for aggregate cost for federal tax purposes. |
The accompanying notes are an integral part of the financial statements.
27
MML Growth Allocation Fund – Portfolio of Investments
December 31, 2012
| | | | | | | | |
| | | Number of
Shares | | | Value | |
| MUTUAL FUNDS — 100.1% | | | | | | | | |
| Diversified Financial — 100.1% | | | | | | | | |
MML Blue Chip Growth Fund, Initial
Class (a) | | | 8,270,941 | | | $ | 111,657,692 | |
MML Equity Fund, Initial
Class (a) | | | 1,171,340 | | | | 24,681,777 | |
MML Equity Income Fund, Initial
Class (a) | | | 8,492,060 | | | | 89,761,076 | |
MML Focused Equity Fund,
Class II (a) | | | 5,783,858 | | | | 66,456,524 | |
MML Foreign Fund, Initial
Class (a) | | | 5,963,094 | | | | 56,470,502 | |
MML Fundamental Growth Fund,
Class II (a) | | | 7,235,526 | | | | 79,156,654 | |
MML Fundamental Value Fund,
Class II (a) | �� | | 6,072,947 | | | | 75,608,189 | |
MML Global Fund, Class I (a) | | | 5,219,942 | | | | 51,259,827 | |
MML High Yield Fund,
Class II (a) | | | 3,179,981 | | | | 34,757,192 | |
MML Income & Growth Fund, Initial
Class (a) | | | 4,292,548 | | | | 40,693,352 | |
MML Inflation-Protected and Income
Fund, Initial Class (a) | | | 1,715,109 | | | | 20,341,199 | |
MML Large Cap Growth Fund, Initial
Class (a) | | | 6,701,305 | | | | 77,869,167 | |
MML Managed Bond Fund, Initial
Class (a) | | | 11,187,058 | | | | 147,692,838 | |
MML Mid Cap Growth Fund, Initial
Class (a) | | | 5,774,607 | | | | 74,838,910 | |
MML Mid Cap Value Fund, Initial
Class (a) | | | 6,924,717 | | | | 76,933,611 | |
MML PIMCO Total Return Fund,
Class II (a) | | | 6,671,442 | | | | 72,185,002 | |
MML Short-Duration Bond Fund,
Class II (a) | | | 3,273,556 | | | | 33,062,911 | |
MML Small Cap Growth Equity Fund, Initial Class (a) | | | 2,683,877 | | | | 43,748,666 | |
MML Small Company Value Fund,
Class II (a) | | | 2,788,574 | | | | 52,592,506 | |
MML Strategic Emerging Markets
Fund, Class II (a) | | | 2,653,796 | | | | 28,952,915 | |
Oppenheimer Global Securities Fund, Non-Service Shares (a) | | | 1,491,976 | | | | 48,563,809 | |
| | | | | | | | |
| | | Number of
Shares | | | Value | |
Oppenheimer Global Strategic Income Fund, Non-Service
Shares (a) | | | 7,505,308 | | | $ | 42,555,097 | |
Oppenheimer International Growth Fund, Non-Service Shares (a) | | | 17,879,589 | | | | 37,010,749 | |
| | | | | | | | |
| | | | | | | 1,386,850,165 | |
| | | | | | | | |
| | |
TOTAL MUTUAL FUNDS
(Cost $1,169,200,269) | | | | | | | 1,386,850,165 | |
| | | | | | | | |
| | |
TOTAL LONG-TERM INVESTMENTS
(Cost $1,169,200,269) | | | | | | | 1,386,850,165 | |
| | | | | | | | |
| |
| TOTAL INVESTMENTS — 100.1% | | | | | |
| (Cost $1,169,200,269) (b) | | | | | | | 1,386,850,165 | |
| |
| Other Assets/(Liabilities) — (0.1)% | | | | (846,276 | ) |
| | | | | | | | |
| | |
| NET ASSETS — 100.0% | | | | | | $ | 1,386,003,889 | |
| | | | | | | | |
Notes to Portfolio of Investments
| (a) | Affiliated issuer. (See Note 7 for a summary of transactions in the investments of affiliated issuers). |
| (b) | See Note 6 for aggregate cost for federal tax purposes. |
The accompanying notes are an integral part of the financial statements.
28
MML Aggressive Allocation Fund – Portfolio of Investments
December 31, 2012
| | | | | | | | |
| | | Number of
Shares | | | Value | |
| MUTUAL FUNDS — 100.1% | | | | | | | | |
| Diversified Financial — 100.1% | | | | | | | | |
MML Blue Chip Growth Fund, Initial Class (a) | | | 568,446 | | | $ | 7,674,005 | |
MML Equity Fund, Initial Class (a) | | | 67,091 | | | | 1,413,688 | |
MML Equity Income Fund, Initial
Class (a) | | | 584,899 | | | | 6,182,386 | |
MML Focused Equity Fund,
Class II (a) | | | 404,507 | | | | 4,647,781 | |
MML Foreign Fund, Initial Class (a) | | | 385,468 | | | | 3,650,386 | |
MML Fundamental Growth Fund,
Class II (a) | | | 488,343 | | | | 5,342,471 | |
MML Fundamental Value Fund,
Class II (a) | | | 417,553 | | | | 5,198,539 | |
MML Global Fund, Class I (a) | | | 340,893 | | | | 3,347,567 | |
MML High Yield Fund, Class II (a) | | | 96,467 | | | | 1,054,387 | |
MML Income & Growth Fund, Initial Class (a) | | | 282,496 | | | | 2,678,065 | |
MML Inflation-Protected and Income Fund, Initial Class (a) | | | 31,669 | | | | 375,599 | |
MML Large Cap Growth Fund, Initial Class (a) | | | 452,979 | | | | 5,263,618 | |
MML Managed Bond Fund, Initial
Class (a) | | | 262,637 | | | | 3,467,359 | |
MML Mid Cap Growth Fund, Initial Class (a) | | | 424,972 | | | | 5,507,643 | |
MML Mid Cap Value Fund, Initial
Class (a) | | | 513,508 | | | | 5,705,077 | |
MML PIMCO Total Return Fund,
Class II (a) | | | 168,148 | | | | 1,819,367 | |
MML Short-Duration Bond Fund,
Class II (a) | | | 18,580 | | | | 187,663 | |
MML Small Cap Growth Equity Fund, Initial Class (a) | | | 202,990 | | | | 3,308,850 | |
MML Small Company Value Fund, Class II (a) | | | 204,069 | | | | 3,848,737 | |
MML Strategic Emerging Markets Fund, Class II (a) | | | 229,855 | | | | 2,507,717 | |
Oppenheimer Global Securities Fund, Non-Service Shares (a) | | | 98,206 | | | | 3,196,591 | |
Oppenheimer Global Strategic Income Fund, Non-Service Shares (a) | | | 180,449 | | | | 1,023,146 | |
Oppenheimer International Growth Fund, Non-Service Shares (a) | | | 1,224,292 | | | | 2,534,284 | |
| | | | | | | | |
| | | | | | | 79,934,926 | |
| | | | | | | | |
| | |
TOTAL MUTUAL FUNDS
(Cost $69,695,622) | | | | | | | 79,934,926 | |
| | | | | | | | |
| | | | | | |
| | | | | Value | |
TOTAL LONG-TERM
INVESTMENTS
(Cost $69,695,622) | | | | $ | 79,934,926 | |
| | | | | | |
| | |
TOTAL INVESTMENTS — 100.1%
(Cost $69,695,622) (b) | | | | | 79,934,926 | |
| | |
| Other Assets/(Liabilities) — (0.1)% | | | | | (64,265 | ) |
| | | | | | |
| | |
| NET ASSETS — 100.0% | | | | $ | 79,870,661 | |
| | | | | | |
Notes to Portfolio of Investments
| (a) | Affiliated issuer. (See Note 7 for a summary of transactions in the investments of affiliated issuers). |
| (b) | See Note 6 for aggregate cost for federal tax purposes. |
The accompanying notes are an integral part of the financial statements.
29
MML American Funds Growth Fund – Portfolio of Investments
December 31, 2012
| | | | | | | | |
| | | Number of
Shares | | | Value | |
| MUTUAL FUNDS — 100.1% | | | | | | | | |
| Diversified Financial — 100.1% | | | | | | | | |
American Funds Growth Fund, Class 1 | | | 1,086,394 | | | $ | 66,161,420 | |
| | | | | | | | |
| | |
TOTAL MUTUAL FUNDS
(Cost $52,412,520) | | | | | | | 66,161,420 | |
| | | | | | | | |
| | |
| TOTAL INVESTMENTS — 100.1% (Cost $52,412,520) (a) | | | | | | | 66,161,420 | |
| | |
| Other Assets/(Liabilities) — (0.1)% | | | | | | | (92,590 | ) |
| | | | | | | | |
| | |
| NET ASSETS — 100.0% | | | | | | $ | 66,068,830 | |
| | | | | | | | |
Notes to Portfolio of Investments
| (a) | See Note 6 for aggregate cost for federal tax purposes. |
The accompanying notes are an integral part of the financial statements.
30
MML American Funds International Fund – Portfolio of Investments
December 31, 2012
| | | | | | | | |
| | | Number of
Shares | | | Value | |
| MUTUAL FUNDS — 100.2% | | | | | | | | |
| Diversified Financial — 100.2% | | | | | | | | |
American Funds International Fund, Class 1 | | | 2,188,237 | | | $ | 38,688,036 | |
| | | | | | | | |
| | |
TOTAL MUTUAL FUNDS
(Cost $33,916,864) | | | | | | | 38,688,036 | |
| | | | | | | | |
| | |
| TOTAL INVESTMENTS — 100.2% (Cost $33,916,864) (a) | | | | | | | 38,688,036 | |
| | |
| Other Assets/(Liabilities) — (0.2)% | | | | | | | (64,311 | ) |
| | | | | | | | |
| | |
| NET ASSETS — 100.0% | | | | | | $ | 38,623,725 | |
| | | | | | | | |
Notes to Portfolio of Investments
| (a) | See Note 6 for aggregate cost for federal tax purposes. |
The accompanying notes are an integral part of the financial statements.
31
MML American Funds Core Allocation Fund — Portfolio of Investments
December 31, 2012
| | | | | | | | |
| | | Number
of Shares | | | Value | |
| MUTUAL FUNDS — 100.1% | | | | | | | | |
| Diversified Financial — 100.1% | | | | | | | | |
American Funds Blue Chip Income and Growth Fund, Class 1 | | | 10,369,339 | | | $ | 104,211,856 | |
American Funds Bond Fund, Class 1 | | | 13,198,332 | | | | 149,009,167 | |
American Funds Growth-Income Fund, Class 1 | | | 3,287,650 | | | | 126,508,758 | |
American Funds International Fund, Class 1 | | | 2,476,148 | | | | 43,778,304 | |
| | | | | | | | |
| | | | | | | 423,508,085 | |
| | | | | | | | |
| |
TOTAL MUTUAL FUNDS
(Cost $355,782,695) | | | | 423,508,085 | |
| | | | | | | | |
| |
TOTAL LONG-TERM INVESTMENTS
(Cost $355,782,695) | | | | 423,508,085 | |
| | | | | | | | |
| |
TOTAL INVESTMENTS — 100.1%
(Cost $355,782,695) (a) | | | | 423,508,085 | |
| |
| Other Assets/(Liabilities) — (0.1)% | | | | (510,881 | ) |
| | | | | | | | |
| |
| NET ASSETS — 100.0% | | | $ | 422,997,204 | |
| | | | | | | | |
Notes to Portfolio of Investments
| (a) | See Note 6 for aggregate cost for federal tax purposes. |
The accompanying notes are an integral part of the financial statements.
32
[THIS PAGE INTENTIONALLY LEFT BLANK]
MML Series Investment Fund – Financial Statements
Statements of Assets and Liabilities
December 31, 2012
| | | | | | | | |
| | | MML
Conservative
Allocation
Fund | | | MML
Balanced
Allocation
Fund | |
| Assets: | | | | | | | | |
Investments, at value - unaffiliated issuers (Note 2) (a) | | $ | - | | | $ | - | |
Investments, at value - affiliated issuers (Note 7) (b) | | | 436,748,880 | | | | 461,450,970 | |
| | | | | | | | |
Total investments | | | 436,748,880 | | | | 461,450,970 | |
| | | | | | | | |
Receivables from: | | | | | | | | |
Investments sold | | | 93,670 | | | | 17,458 | |
Investment adviser (Note 3) | | | - | | | | - | |
Fund shares sold | | | 899,210 | | | | 98,444 | |
| | | | | | | | |
Total assets | | | 437,741,760 | | | | 461,566,872 | |
| | | | | | | | |
| Liabilities: | | | | | | | | |
Payables for: | | | | | | | | |
Investments purchased | | | 899,210 | | | | 98,444 | |
Fund shares repurchased | | | 91,696 | | | | 15,364 | |
Trustees’ fees and expenses (Note 3) | | | 39,523 | | | | 47,410 | |
Affiliates (Note 3): | | | | | | | | |
Investment management fees | | | 36,592 | | | | 38,716 | |
Administration fees | | | - | | | | - | |
Service fees | | | 183,369 | | | | 194,182 | |
Accrued expense and other liabilities | | | 32,498 | | | | 32,977 | |
| | | | | | | | |
Total liabilities | | | 1,282,888 | | | | 427,093 | |
| | | | | | | | |
Net assets | | $ | 436,458,872 | | | $ | 461,139,779 | |
| | | | | | | | |
| Net assets consist of: | | | | | | | | |
Paid-in capital | | $ | 382,246,199 | | | $ | 381,651,921 | |
Undistributed (accumulated) net investment income (loss) | | | 9,831,425 | | | | 11,558,580 | |
Accumulated net realized gain (loss) on investments and foreign currency transactions | | | 12,648,863 | | | | 20,248,410 | |
Net unrealized appreciation (depreciation) on investments and foreign currency translations | | | 31,732,385 | | | | 47,680,868 | |
| | | | | | | | |
Net assets | | $ | 436,458,872 | | | $ | 461,139,779 | |
| | | | | | | | |
| | | | | | | | |
(a) Cost of Investments - unaffiliated issuers: | | $ | - | | | $ | - | |
(b) Cost of investments - affiliated issuers: | | $ | 405,016,495 | | | $ | 413,770,102 | |
The accompanying notes are an integral part of the financial statements.
34
| | | | | | | | | | | | | | | | | | | | | | |
MML
Moderate
Allocation
Fund | | | MML
Growth
Allocation
Fund | | | MML
Aggressive
Allocation
Fund | | | MML
American
Funds Growth
Fund | | | MML
American
Funds
International
Fund | | | MML
American
Funds Core
Allocation
Fund | |
| | | | | | | | | | | | | | | | | | | | | | |
| $ | - | | | $ | - | | | $ | - | | | $ | 66,161,420 | | | $ | 38,688,036 | | | $ | 423,508,085 | |
| | 1,471,727,376 | | | | 1,386,850,165 | | | | 79,934,926 | | | | - | | | | - | | | | - | |
| | | | | | | | | | | | | | | | | | | | | | |
| | 1,471,727,376 | | | | 1,386,850,165 | | | | 79,934,926 | | | | 66,161,420 | | | | 38,688,036 | | | | 423,508,085 | |
| | | | | | | | | | | | | | | | | | | | | | |
| | | | | | | | | | | | | | | | | | | | | | |
| | 339,821 | | | | 559,260 | | | | 15,093 | | | | 402,577 | | | | 733,817 | | | | - | |
| | - | | | | - | | | | 1,326 | | | | 1,516 | | | | 2,397 | | | | - | |
| | 1,783,529 | | | | 49,750 | | | | 12,795 | | | | 791 | | | | 90 | | | | 94,324 | |
| | | | | | | | | | | | | | | | | | | | | | |
| | 1,473,850,726 | | | | 1,387,459,175 | | | | 79,964,140 | | | | 66,566,304 | | | | 39,424,340 | | | | 423,602,409 | |
| | | | | | | | | | | | | | | | | | | | | | |
| | | | | | | | | | | | | | | | | | | | | | |
| | | | | | | | | | | | | | | | | | | | | | |
| | 1,783,528 | | | | 49,750 | | | | 12,795 | | | | - | | | | - | | | | 71,195 | |
| | 333,197 | | | | 552,876 | | | | 14,734 | | | | 403,073 | | | | 733,732 | | | | 21,200 | |
| | 138,305 | | | | 167,315 | | | | 8,789 | | | | 5,037 | | | | 3,749 | | | | 40,354 | |
| | | | | | | | | | | | | | | | | | | | | | |
| | 122,951 | | | | 116,755 | | | | 6,651 | | | | 8,262 | | | | 4,903 | | | | 71,133 | |
| | - | | | | - | | | | - | | | | 13,770 | | | | 8,171 | | | | 88,918 | |
| | 651,707 | | | | 523,694 | | | | 21,172 | | | | 40,733 | | | | 24,123 | | | | 265,760 | |
| | 43,206 | | | | 44,896 | | | | 29,338 | | | | 26,599 | | | | 25,937 | | | | 46,645 | |
| | | | | | | | | | | | | | | | | | | | | | |
| | 3,072,894 | | | | 1,455,286 | | | | 93,479 | | | | 497,474 | | | | 800,615 | | | | 605,205 | |
| | | | | | | | | | | | | | | | | | | | | | |
| $ | 1,470,777,832 | | | $ | 1,386,003,889 | | | $ | 79,870,661 | | | $ | 66,068,830 | | | $ | 38,623,725 | | | $ | 422,997,204 | |
| | | | | | | | | | | | | | | | | | | | | | |
| | | | | | | | | | | | | | | | | | | | | | |
| $ | 1,210,206,970 | | | $ | 1,033,564,158 | | | $ | 63,448,891 | | | $ | 50,638,584 | | | $ | 32,503,798 | | | $ | 340,555,203 | |
| | 28,551,696 | | | | 24,392,526 | | | | 1,053,154 | | | | 252,098 | | | | 395,034 | | | | 6,371,735 | |
| | 68,376,517 | | | | 110,397,309 | | | | 5,129,312 | | | | 1,429,248 | | | | 953,721 | | | | 8,344,876 | |
| | 163,642,649 | | | | 217,649,896 | | | | 10,239,304 | | | | 13,748,900 | | | | 4,771,172 | | | | 67,725,390 | |
| | | | | | | | | | | | | | | | | | | | | | |
| $ | 1,470,777,832 | | | $ | 1,386,003,889 | | | $ | 79,870,661 | | | $ | 66,068,830 | | | $ | 38,623,725 | | | $ | 422,997,204 | |
| | | | | | | | | | | | | | | | | | | | | | |
| | | | | | | | | | | | | | | | | | | | | | |
| $ | - | | | $ | - | | | $ | - | | | $ | 52,412,520 | | | $ | 33,916,864 | | | $ | 355,782,695 | |
| $ | 1,308,084,727 | | | $ | 1,169,200,269 | | | $ | 69,695,622 | | | $ | - | | | $ | - | | | $ | - | |
35
MML Series Investment Fund – Financial Statements (Continued)
Statements of Assets and Liabilities
December 31, 2012
| | | | | | | | |
| | | MML
Conservative
Allocation
Fund | | | MML
Balanced
Allocation
Fund | |
| Initial Class shares: | | | | | | | | |
Net assets | | $ | 140,898,697 | | | $ | 148,871,899 | |
| | | | | | | | |
Shares outstanding (a) | | | 13,036,994 | | | | 13,717,120 | |
| | | | | | | | |
Net asset value, offering price and redemption price per share | | $ | 10.81 | | | $ | 10.85 | |
| | | | | | | | |
| Service Class shares: | | | | | | | | |
Net assets | | $ | 295,560,175 | | | $ | 312,267,880 | |
| | | | | | | | |
Shares outstanding (a) | | | 27,520,732 | | | | 28,916,383 | |
| | | | | | | | |
Net asset value, offering price and redemption price per share | | $ | 10.74 | | | $ | 10.80 | |
| | | | | | | | |
| Service Class I shares: | | | | | | | | |
Net assets | | $ | - | | | $ | - | |
| | | | | | | | |
Shares outstanding (a) | | | - | | | | - | |
| | | | | | | | |
Net asset value, offering price and redemption price per share | | $ | - | | | $ | - | |
| | | | | | | | |
| (a) | Authorized unlimited number of shares with no par value. |
36
| | | | | | | | | | | | | | | | | | | | | | |
MML
Moderate
Allocation
Fund | | | MML
Growth
Allocation
Fund | | | MML
Aggressive
Allocation
Fund | | | MML
American
Funds
Growth
Fund | | | MML
American
Funds
International
Fund | | | MML
American
Funds Core
Allocation
Fund | |
| | | | | | | | | | | | | | | | | | | | | | |
| $ | 410,034,949 | | | $ | 559,044,317 | | | $ | 45,398,836 | | | $ | - | | | $ | - | | | $ | - | |
| | | | | | | | | | | | | | | | | | | | | | |
| | 37,422,689 | | | | 52,424,609 | | | | 4,336,265 | | | | - | | | | - | | | | - | |
| | | | | | | | | | | | | | | | | | | | | | |
| $ | 10.96 | | | $ | 10.66 | | | $ | 10.47 | | | $ | - | | | $ | - | | | $ | - | |
| | | | | | | | | | | | | | | | | | | | | | |
| | | | | | | | | | | | | | | | | | | | | | |
| $ | 1,060,742,883 | | | $ | 826,959,572 | | | $ | 34,471,825 | | | $ | - | | | $ | - | | | $ | - | |
| | | | | | | | | | | | | | | | | | | | | | |
| | 97,369,172 | | | | 77,886,478 | | | | 3,313,316 | | | | - | | | | - | | | | - | |
| | | | | | | | | | | | | | | | | | | | | | |
| $ | 10.89 | | | $ | 10.62 | | | $ | 10.40 | | | $ | - | | | $ | - | | | $ | - | |
| | | | | | | | | | | | | | | | | | | | | | |
| | | | | | | | | | | | | | | | | | | | | | |
| $ | - | | | $ | - | | | $ | - | | | $ | 66,068,830 | | | $ | 38,623,725 | | | $ | 422,997,204 | |
| | | | | | | | | | | | | | | | | | | | | | |
| | - | | | | - | | | | - | | | | 5,921,029 | | | | 4,016,368 | | | | 39,441,147 | |
| | | | | | | | | | | | | | | | | | | | | | |
| $ | - | | | $ | - | | | $ | - | | | $ | 11.16 | | | $ | 9.62 | | | $ | 10.72 | |
| | | | | | | | | | | | | | | | | | | | | | |
37
MML Series Investment Fund – Financial Statements (Continued)
Statements of Operations
For the Year Ended December 31, 2012
| | | | | | | | |
| | | MML
Conservative
Allocation Fund | | | MML
Balanced
Allocation Fund | |
| Investment income (Note 2): | | | | | | | | |
Dividends - unaffiliated issuers | | $ | - | | | $ | - | |
Dividends - affiliated issuers (Note 7) | | | 9,274,058 | | | | 9,356,677 | |
| | | | | | | | |
Total investment income | | | 9,274,058 | | | | 9,356,677 | |
| | | | | | | | |
| Expenses (Note 3): | | | | | | | | |
Investment management fees | | | 383,153 | | | | 423,717 | |
Custody fees | | | 25,427 | | | | 25,430 | |
Audit fees | | | 28,637 | | | | 28,650 | |
Legal fees | | | 3,264 | | | | 3,729 | |
Proxy fees | | | 1,108 | | | | 1,108 | |
Shareholder reporting fees | | | 21,600 | | | | 22,654 | |
Trustees’ fees | | | 28,507 | | | | 31,989 | |
| | | | | | | | |
| | | 491,696 | | | | 537,277 | |
Administration fees: | | | | | | | | |
Service Class I | | | - | | | | - | |
Service fees: | | | | | | | | |
Service Class | | | 645,152 | | | | 705,880 | |
Service Class I | | | - | | | | - | |
| | | | | | | | |
Total expenses | | | 1,136,848 | | | | 1,243,157 | |
Expenses waived (Note 3): | | | | | | | | |
Initial Class fees waived by adviser | | | - | | | | - | |
Service Class fees waived by adviser | | | - | | | | - | |
Service Class I fees waived by adviser | | | - | | | | - | |
| | | | | | | | |
Net expenses | | | 1,136,848 | | | | 1,243,157 | |
| | | | | | | | |
Net investment income (loss) | | | 8,137,210 | | | | 8,113,520 | |
| | | | | | | | |
| Realized and unrealized gain (loss): | | | | | | | | |
Net realized gain (loss) on: | | | | | | | | |
Investment transactions - unaffiliated issuers | | | - | | | | - | |
Investment transactions - affiliated issuers (Note 7) | | | 10,959,537 | | | | 22,077,039 | |
Realized gain distributions - affiliated issuers (Note 7) | | | 4,405,680 | | | | 5,424,607 | |
| | | | | | | | |
Net realized gain (loss) | | | 15,365,217 | | | | 27,501,646 | |
| | | | | | | | |
Net change in unrealized appreciation (depreciation) on: | | | | | | | | |
Investment transactions - unaffiliated issuers | | | - | | | | - | |
Investment transactions - affiliated issuers | | | 16,542,495 | | | | 12,286,977 | |
| | | | | | | | |
Net change in unrealized appreciation (depreciation) | | | 16,542,495 | | | | 12,286,977 | |
| | | | | | | | |
Net realized gain (loss) and change in unrealized appreciation (depreciation) | | | 31,907,712 | | | | 39,788,623 | |
| | | | | | | | |
Net increase (decrease) in net assets resulting from operations | | $ | 40,044,922 | | | $ | 47,902,143 | |
| | | | | | | | |
38
| | | | | | | | | | | | | | | | | | | | | | |
MML
Moderate
Allocation Fund | | | MML
Growth
Allocation Fund | | | MML
Aggressive
Allocation Fund | | | MML
American Funds
Growth Fund | | | MML
American Funds
International Fund | | | MML
American
Funds Core
Allocation Fund | |
| | | | | | | | | | | | | | | | | | | | | | |
| $ | - | | | $ | - | | | $ | - | | | $ | 663,654 | | | $ | 649,076 | | | $ | 9,241,732 | |
| | 25,712,163 | | | | 20,894,068 | | | | 876,263 | | | | - | | | | - | | | | - | |
| | | | | | | | | | | | | | | | | | | | | | |
| | 25,712,163 | | | | 20,894,068 | | | | 876,263 | | | | 663,654 | | | | 649,076 | | | | 9,241,732 | |
| | | | | | | | | | | | | | | | | | | | | | |
| | | | | | | | | | | | | | | | | | | | | | |
| | 1,311,636 | | | | 1,349,609 | | | | 74,617 | | | | 87,609 | | | | 53,930 | | | | 782,853 | |
| | 26,552 | | | | 26,422 | | | | 26,615 | | | | 1,006 | | | | 1,006 | | | | 5,563 | |
| | 29,167 | | | | 29,149 | | | | 28,451 | | | | 28,443 | | | | 28,429 | | | | 28,632 | |
| | 11,405 | | | | 12,573 | | | | 778 | | | | 636 | | | | 662 | | | | 3,937 | |
| | 1,108 | | | | 1,108 | | | | 1,108 | | | | 1,109 | | | | 1,108 | | | | 1,109 | |
| | 43,002 | | | | 44,295 | | | | 14,659 | | | | 16,479 | | | | 15,060 | | | | 35,846 | |
| | 98,350 | | | | 103,681 | | | | 5,704 | | | | 4,382 | | | | 2,735 | | | | 29,618 | |
| | | | | | | | | | | | | | | | | | | | | | |
| | 1,521,220 | | | | 1,566,837 | | | | 151,932 | | | | 139,664 | | | | 102,930 | | | | 887,558 | |
| | | | | | | | | | | | | | | | | | | | | | |
| | - | | | | - | | | | - | | | | 146,016 | | | | 89,883 | | | | 978,566 | |
| | | | | | | | | | | | | | | | | | | | | | |
| | 2,293,575 | | | | 2,000,834 | | | | 78,556 | | | | - | | | | - | | | | - | |
| | - | | | | - | | | | - | | | | 146,016 | | | | 89,883 | | | | 978,566 | |
| | | | | | | | | | | | | | | | | | | | | | |
| | 3,814,795 | | | | 3,567,671 | | | | 230,488 | | | | 431,696 | | | | 282,696 | | | | 2,844,690 | |
| | | | | | | | | | | | | | | | | | | | | | |
| | - | | | | - | | | | (1,551 | ) | | | - | | | | - | | | | - | |
| | - | | | | - | | | | (1,147 | ) | | | - | | | | - | | | | - | |
| | - | | | | - | | | | - | | | | (22,852 | ) | | | (31,023 | ) | | | - | |
| | | | | | | | | | | | | | | | | | | | | | |
| | 3,814,795 | | | | 3,567,671 | | | | 227,790 | | | | 408,844 | | | | 251,673 | | | | 2,844,690 | |
| | | | | | | | | | | | | | | | | | | | | | |
| | 21,897,368 | | | | 17,326,397 | | | | 648,473 | | | | 254,810 | | | | 397,403 | | | | 6,397,042 | |
| | | | | | | | | | | | | | | | | | | | | | |
| | | | | | | | | | | | | | | | | | | | | | |
| | | | | | | | | | | | | | | | | | | | | | |
| | - | | | | - | | | | - | | | | 1,540,695 | | | | 1,019,228 | | | | 8,807,009 | |
| | 65,026,346 | | | | 109,876,626 | | | | 6,205,337 | | | | - | | | | - | | | | - | |
| | 19,026,659 | | | | 21,818,913 | | | | 1,383,597 | | | | - | | | | - | | | | - | |
| | | | | | | | | | | | | | | | | | | | | | |
| | 84,053,005 | | | | 131,695,539 | | | | 7,588,934 | | | | 1,540,695 | | | | 1,019,228 | | | | 8,807,009 | |
| | | | | | | | | | | | | | | | | | | | | | |
| | | | | | | | | | | | | | | | | | | | | | |
| | - | | | | - | | | | - | | | | 7,211,388 | | | | 4,371,380 | | | | 27,684,714 | |
| | 49,638,152 | | | | 29,520,733 | | | | 2,416,834 | | | | - | | | | - | | | | - | |
| | | | | | | | | | | | | | | | | | | | | | |
| | 49,638,152 | | | | 29,520,733 | | | | 2,416,834 | | | | 7,211,388 | | | | 4,371,380 | | | | 27,684,714 | |
| | | | | | | | | | | | | | | | | | | | | | |
| | 133,691,157 | | | | 161,216,272 | | | | 10,005,768 | | | | 8,752,083 | | | | 5,390,608 | | | | 36,491,723 | |
| | | | | | | | | | | | | | | | | | | | | | |
| $ | 155,588,525 | | | $ | 178,542,669 | | | $ | 10,654,241 | | | $ | 9,006,893 | | | $ | 5,788,011 | | | $ | 42,888,765 | |
| | | | | | | | | | | | | | | | | | | | | | |
39
MML Series Investment Fund — Financial Statements (Continued)
Statements of Changes in Net Assets
| | | | | | | | |
| | | MML Conservative Allocation Fund | |
| | | Year
Ended
December 31, 2012 | | | Year
Ended
December 31, 2011 | |
| Increase (Decrease) in Net Assets: | | | | | | | | |
| Operations: | | | | | | | | |
Net investment income (loss) | | $ | 8,137,210 | | | $ | 5,729,725 | |
Net realized gain (loss) on investment transactions | | | 15,365,217 | | | | 15,178,243 | |
Net change in unrealized appreciation (depreciation) on investments | | | 16,542,495 | | | | (13,363,938 | ) |
| | | | | | | | |
Net increase (decrease) in net assets resulting from operations | | | 40,044,922 | | | | 7,544,030 | |
| | | | | | | | |
| Distributions to shareholders (Note 2): | | | | | | | | |
From net investment income: | | | | | | | | |
Initial Class | | | (2,392,553 | ) | | | (3,051,751 | ) |
Service Class | | | (4,520,655 | ) | | | (5,605,373 | ) |
| | | | | | | | |
Total distributions from net investment income | | | (6,913,208 | ) | | | (8,657,124 | ) |
| | | | | | | | |
From net realized gains: | | | | | | | | |
Initial Class | | | (4,249,213 | ) | | | (5,392,249 | ) |
Service Class | | | (8,942,690 | ) | | | (10,641,810 | ) |
| | | | | | | | |
Total distributions from net realized gains | | | (13,191,903 | ) | | | (16,034,059 | ) |
| | | | | | | | |
| Net fund share transactions (Note 5): | | | | | | | | |
Initial Class | | | 20,585,781 | | | | 18,030,181 | |
Service Class | | | 50,933,302 | | | | 46,169,044 | |
| | | | | | | | |
Increase (decrease) in net assets from fund share transactions | | | 71,519,083 | | | | 64,199,225 | |
| | | | | | | | |
Total increase (decrease) in net assets | | | 91,458,894 | | | | 47,052,072 | |
| Net assets | | | | | | | | |
Beginning of year | | | 344,999,978 | | | | 297,947,906 | |
| | | | | | | | |
End of year | | $ | 436,458,872 | | | $ | 344,999,978 | |
| | | | | | | | |
Undistributed (accumulated) net investment income (loss) included in net assets at end of year | | $ | 9,831,425 | | | $ | 6,889,117 | |
| | | | | | | | |
The accompanying notes are an integral part of the financial statements.
40
| | | | | | | | | | | | | | | | | | | | | | |
| MML Balanced Allocation Fund | | | MML Moderate Allocation Fund | | | MML Growth Allocation Fund | |
Year
Ended
December 31, 2012 | | | Year
Ended
December 31, 2011 | | | Year
Ended
December 31, 2012 | | | Year
Ended
December 31, 2011 | | | Year
Ended
December 31, 2012 | | | Year
Ended
December 31, 2011 | |
| | | | | | | | | | | | | | | | | | | | | | |
| | | | | | | | | | | | | | | | | | | | | | |
| $ | 8,113,520 | | | $ | 5,833,500 | | | $ | 21,897,368 | | | $ | 15,184,776 | | | $ | 17,326,397 | | | $ | 14,171,791 | |
| | 27,501,646 | | | | 11,567,782 | | | | 84,053,005 | | | | 31,451,409 | | | | 131,695,539 | | | | 37,516,616 | |
| | 12,286,977 | | | | (11,825,966 | ) | | | 49,638,152 | | | | (39,990,939 | ) | | | 29,520,733 | | | | (58,562,832 | ) |
| | | | | | | | | | | | | | | | | | | | | | |
| | 47,902,143 | | | | 5,575,316 | | | | 155,588,525 | | | | 6,645,246 | | | | 178,542,669 | | | | (6,874,425 | ) |
| | | | | | | | | | | | | | | | | | | | | | |
| | | | | | | | | | | | | | | | | | | | | | |
| | | | | | | | | | | | | | | | | | | | | | |
| | (2,533,489 | ) | | | (3,253,466 | ) | | | (5,831,328 | ) | | | (7,579,608 | ) | | | (7,398,962 | ) | | | (9,582,060 | ) |
| | (4,492,605 | ) | | | (5,634,912 | ) | | | (12,161,972 | ) | | | (13,812,163 | ) | | | (8,967,612 | ) | | | (12,212,438 | ) |
| | | | | | | | | | | | | | | | | | | | | | |
| | (7,026,094 | ) | | | (8,888,378 | ) | | | (17,993,300 | ) | | | (21,391,771 | ) | | | (16,366,574 | ) | | | (21,794,498 | ) |
| | | | | | | | | | | | | | | | | | | | | | |
| | | | | | | | | | | | | | | | | | | | | | |
| | (3,348,248 | ) | | | (2,260,716 | ) | | | (8,320,844 | ) | | | (280,682 | ) | | | (5,230,349 | ) | | | - | |
| | (6,714,308 | ) | | | (4,234,292 | ) | | | (19,894,894 | ) | | | (557,033 | ) | | | (7,698,844 | ) | | | - | |
| | | | | | | | | | | | | | | | | | | | | | |
| | (10,062,556 | ) | | | (6,495,008 | ) | | | (28,215,738 | ) | | | (837,715 | ) | | | (12,929,193 | ) | | | - | |
| | | | | | | | | | | | | | | | | | | | | | |
| | | | | | | | | | | | | | | | | | | | | | |
| | 12,116,176 | | | | (494,036 | ) | | | 10,347,681 | | | | (12,168,979 | ) | | | (20,128,378 | ) | | | (8,909,732 | ) |
| | 42,319,768 | | | | 36,889,288 | | | | 204,955,868 | | | | 169,204,137 | | | | (6,856,832 | ) | | | 7,857,051 | |
| | | | | | | | | | | | | | | | | | | | | | |
| | 54,435,944 | | | | 36,395,252 | | | | 215,303,549 | | | | 157,035,158 | | | | (26,985,210 | ) | | | (1,052,681 | ) |
| | | | | | | | | | | | | | | | | | | | | | |
| | 85,249,437 | | | | 26,587,182 | | | | 324,683,036 | | | | 141,450,918 | | | | 122,261,692 | | | | (29,721,604 | ) |
| | | | | | | | | | | | | | | | | | | | | | |
| | 375,890,342 | | | | 349,303,160 | | | | 1,146,094,796 | | | | 1,004,643,878 | | | | 1,263,742,197 | | | | 1,293,463,801 | |
| | | | | | | | | | | | | | | | | | | | | | |
| $ | 461,139,779 | | | $ | 375,890,342 | | | $ | 1,470,777,832 | | | $ | 1,146,094,796 | | | $ | 1,386,003,889 | | | $ | 1,263,742,197 | |
| | | | | | | | | | | | | | | | | | | | | | |
| | | | | |
| $ | 11,558,580 | | | $ | 6,995,763 | | | $ | 28,551,696 | | | $ | 17,908,033 | | | $ | 24,392,526 | | | $ | 16,253,336 | |
| | | | | | | | | | | | | | | | | | | | | | |
41
MML Series Investment Fund – Financial Statements(Continued)
Statements of Changes in Net Assets
| | | | | | | | |
| | | MML Aggressive
Allocation Fund | |
| | | Year Ended
December 31, 2012 | | | Year Ended
December 31, 2011 | |
| Increase (Decrease) in Net Assets: | | | | | | | | |
| Operations: | | | | | | | | |
Net investment income (loss) | | $ | 648,473 | | | $ | 496,386 | |
Net realized gain (loss) on investment transactions | | | 7,588,934 | | | | 2,108,303 | |
Net change in unrealized appreciation (depreciation) on investments | | | 2,416,834 | | | | (4,087,820 | ) |
| | | | | | | | |
Net increase (decrease) in net assets resulting from operations | | | 10,654,241 | | | | (1,483,131 | ) |
| | | | | | | | |
| Distributions to shareholders (Note 2): | | | | | | | | |
From net investment income: | | | | | | | | |
Initial Class | | | (348,090 | ) | | | (466,841 | ) |
Service Class | | | (186,793 | ) | | | (261,800 | ) |
Service Class I | | | - | | | | - | |
| | | | | | | | |
Total distributions from net investment income | | | (534,883 | ) | | | (728,641 | ) |
| | | | | | | | |
From net realized gains: | | | | | | | | |
Service Class I | | | - | | | | - | |
| | | | | | | | |
Total distributions from net realized gains | | | - | | | | - | |
| | | | | | | | |
| Net fund share transactions (Note 5): | | | | | | | | |
Initial Class | | | (517,891 | ) | | | (417,550 | ) |
Service Class | | | 1,381,764 | | | | 7,060,105 | |
Service Class I | | | - | | | | - | |
| | | | | | | | |
Increase (decrease) in net assets from fund share transactions | | | 863,873 | | | | 6,642,555 | |
| | | | | | | | |
Total increase (decrease) in net assets | | | 10,983,231 | | | | 4,430,783 | |
| Net assets | | | | | | | | |
Beginning of year | | | 68,887,430 | | | | 64,456,647 | |
| | | | | | | | |
End of year | | $ | 79,870,661 | | | $ | 68,887,430 | |
| | | | | | | | |
Undistributed (accumulated) net investment income (loss) included in net assets at end of year | | $ | 1,053,154 | | | $ | 529,096 | |
| | | | | | | | |
The accompanying notes are an integral part of the financial statements.
42
| | | | | | | | | | | | | | | | | | | | | | |
MML American
Funds Growth Fund | | | MML American
Funds International Fund | | | MML American
Funds Core Allocation Fund | |
Year Ended
December 31, 2012 | | | Year Ended
December 31, 2011 | | | Year Ended
December 31, 2012 | | | Year Ended
December 31, 2011 | | | Year Ended
December 31, 2012 | | | Year Ended
December 31, 2011 | |
| | | | | | | | | | | | | | | | | | | | | | |
| | | | | | | | | | | | | | | | | | | | | | |
| $ | 254,810 | | | $ | 115,989 | | | $ | 397,403 | | | $ | 481,716 | | | $ | 6,397,042 | | | $ | 5,990,388 | |
| | 1,540,695 | | | | 560,289 | | | | 1,019,228 | | | | 608,793 | | | | 8,807,009 | | | | 10,386,762 | |
| | 7,211,388 | | | | (3,006,314 | ) | | | 4,371,380 | | | | (5,949,589 | ) | | | 27,684,714 | | | | (17,143,986 | ) |
| | | | | | | | | | | | | | | | | | | | | | |
| | 9,006,893 | | | | (2,330,036 | ) | | | 5,788,011 | | | | (4,859,080 | ) | | | 42,888,765 | | | | (766,836 | ) |
| | | | | | | | | | | | | | | | | | | | | | |
| | | | | | | | | | | | | | | | | | | | | | |
| | | | | | | | | | | | | | | | | | | | | | |
| | - | | | | - | | | | - | | | | - | | | | - | | | | - | |
| | - | | | | - | | | | - | | | | - | | | | - | | | | - | |
| | (117,069 | ) | | | (119,840 | ) | | | (482,538 | ) | | | (445,209 | ) | | | (5,998,788 | ) | | | (5,079,356 | ) |
| | | | | | | | | | | | | | | | | | | | | | |
| | (117,069 | ) | | | (119,840 | ) | | | (482,538 | ) | | | (445,209 | ) | | | (5,998,788 | ) | | | (5,079,356 | ) |
| | | | | | | | | | | | | | | | | | | | | | |
| | | | | | | | | | | | | | | | | | | | | | |
| | (531,546 | ) | | | (876,919 | ) | | | (556,561 | ) | | | (646,232 | ) | | | (10,223,523 | ) | | | (1,254,946 | ) |
| | | | | | | | | | | | | | | | | | | | | | |
| | (531,546 | ) | | | (876,919 | ) | | | (556,561 | ) | | | (646,232 | ) | | | (10,223,523 | ) | | | (1,254,946 | ) |
| | | | | | | | | | | | | | | | | | | | | | |
| | | | | | | | | | | | | | | | | | | | | | |
| | - | | | | - | | | | - | | | | - | | | | - | | | | - | |
| | - | | | | - | | | | - | | | | - | | | | - | | | | - | |
| | 8,431,522 | | | | 14,845,241 | | | | 2,074,021 | | | | 6,414,361 | | | | 40,091,108 | | | | 38,003,550 | |
| | | | | | | | | | | | | | | | | | | | | | |
| | 8,431,522 | | | | 14,845,241 | | | | 2,074,021 | | | | 6,414,361 | | | | 40,091,108 | | | | 38,003,550 | |
| | | | | | | | | | | | | | | | | | | | | | |
| | 16,789,800 | | | | 11,518,446 | | | | 6,822,933 | | | | 463,840 | | | | 66,757,562 | | | | 30,902,412 | |
| | | | | | | | | | | | | | | | | | | | | | |
| | 49,279,030 | | | | 37,760,584 | | | | 31,800,792 | | | | 31,336,952 | | | | 356,239,642 | | | | 325,337,230 | |
| | | | | | | | | | | | | | | | | | | | | | |
| $ | 66,068,830 | | | $ | 49,279,030 | | | $ | 38,623,725 | | | $ | 31,800,792 | | | $ | 422,997,204 | | | $ | 356,239,642 | |
| | | | | | | | | | | | | | | | | | | | | | |
| $ | 252,098 | | | $ | 114,464 | | | $ | 395,034 | | | $ | 480,259 | | | $ | 6,371,735 | | | $ | 5,974,448 | |
| | | | | | | | | | | | | | | | | | | | | | |
43
MML Series Investment Fund – Financial Statements (Continued)
Financial Highlights (For a share outstanding throughout each period)
MML Conservative Allocation Fund
| | | | | | | | | | | | | | | | | | | | | | | | | | | | | | | | | | | | | | | | | | | | | | | | | | | | |
| | | | | | Income (loss) from investment
operations | | | Less distributions to shareholders | | | | | | | | | Ratios / Supplemental Data | |
| | | Net
asset
value,
beginning
of period | | | Net
investment
income
(loss)c,j | | | Net
realized
and
unrealized
gain (loss)
on
investments | | | Total
income
(loss)
from
investment
operations | | | From
net
investment
income | | | From
net
realized
gains | | | Total
distributions | | | Net
asset
value,
end of
the
period | | | Total
Returnm | | | Net
assets,
end of
the
period
(000’s) | | | Ratio of
expenses
to
average
daily net
assets
before
expense
waiversw | | | Ratio of
expenses
to
average
daily net
assets
after
expense
waiversw | | | Net
investment
income
(loss) to
average
daily net
assets | |
| Initial Class | | | | | | | | | | | | | | | | | | | | | | | | | | | | | | | | | | | | | | | | | | | | | |
12/31/12 | | $ | 10.24 | | | $ | 0.25 | | | $ | 0.90 | | | $ | 1.15 | | | $ | (0.21 | ) | | $ | (0.37 | ) | | $ | (0.58 | ) | | $ | 10.81 | | | | 11.40% | | | $ | 140,899 | | | | 0.13% | | | | N/A | | | | 2.29% | |
| 12/31/11 | | | 10.82 | | | | 0.21 | | | | 0.06 | | | | 0.27 | | | | (0.31 | ) | | | (0.54 | ) | | | (0.85 | ) | | | 10.24 | | | | 2.57% | | | | 113,666 | | | | 0.13% | | | | N/A | | | | 2.00% | |
| 12/31/10 | | | 9.81 | | | | 0.32 | | | | 0.84 | | | | 1.16 | | | | (0.15 | ) | | | - | | | | (0.15 | ) | | | 10.82 | | | | 11.91% | | | | 101,461 | | | | 0.13% | | | | N/A | | | | 3.12% | |
| 12/31/09 | | | 8.15 | | | | 0.19 | | | | 1.53 | | | | 1.72 | | | | (0.05 | ) | | | (0.01 | ) | | | (0.06 | ) | | | 9.81 | | | | 21.15% | | | | 83,810 | | | | 0.15% | | | | N/A | | | | 2.11% | |
| 12/31/08 | | | 10.11 | | | | 0.28 | | | | (2.24 | ) | | | (1.96 | ) | | | (0.00 | )d | | | (0.00 | )d | | | (0.00 | )d | | | 8.15 | | | | (19.38% | ) | | | 52,819 | | | | 0.27% | | | | 0.20% | j | | | 3.06% | |
| Service Class | | | | | | | | | | | | | | | | | | | | | | | | | | | | | | | | | | | | | | | | | | | | | | | | | |
12/31/12 | | $ | 10.18 | | | $ | 0.22 | | | $ | 0.90 | | | $ | 1.12 | | | $ | (0.19 | ) | | $ | (0.37 | ) | | $ | (0.56 | ) | | $ | 10.74 | | | | 11.15% | | | $ | 295,560 | | | | 0.38% | | | | N/A | | | | 2.05% | |
| 12/31/11 | | | 10.77 | | | | 0.19 | | | | 0.04 | | | | 0.23 | | | | (0.28 | ) | | | (0.54 | ) | | | (0.82 | ) | | | 10.18 | | | | 2.28% | | | | 231,334 | | | | 0.38% | | | | N/A | | | | 1.75% | |
| 12/31/10 | | | 9.78 | | | | 0.29 | | | | 0.83 | | | | 1.12 | | | | (0.13 | ) | | | - | | | | (0.13 | ) | | | 10.77 | | | | 11.59% | | | | 196,487 | | | | 0.38% | | | | N/A | | | | 2.87% | |
| 12/31/09 | | | 8.14 | | | | 0.18 | | | | 1.52 | | | | 1.70 | | | | (0.05 | ) | | | (0.01 | ) | | | (0.06 | ) | | | 9.78 | | | | 20.91% | | | | 143,548 | | | | 0.40% | | | | N/A | | | | 1.96% | |
| 12/31/08g | | | 9.79 | | | | 0.05 | | | | (1.70 | ) | | | (1.65 | ) | | | (0.00 | )d | | | (0.00 | )d | | | (0.00 | )d | | | 8.14 | | | | (16.85% | )b | | | 38,451 | | | | 0.49% | a | | | 0.45% | a,j | | | 1.62% | a |
| | | | | | | | | | | | | | | | | | | | |
| | | Year ended December 31 | |
| | | 2012 | | | 2011 | | | 2010 | | | 2009 | | | 2008 | |
Portfolio turnover rate for all share classesx | | | 18 | % | | | 20 | % | | | 44 | % | | | 47 | % | | | 37 | % |
| b | Percentage represents the results for the period and is not annualized. |
| c | Per share amount calculated on the average shares method. |
| d | Amount is less than $0.005 per share. |
| g | For the period August 15, 2008 (commencement of operations) through December 31, 2008. |
| j | Computed after giving effect to an agreement by MassMutual to waive certain fees and expenses of the Fund. |
| m | Total return does not reflect expenses that apply at the separate account level or to related insurance products. Inclusion of these charges would reduce the total return figures for all periods shown. |
| w | Expenses of the underlying funds are not included in the Fund’s expense ratio. The Fund indirectly bears its proportionate share of the expenses of any underlying fund. |
| x | Amount does not include the portfolio activity of any underlying fund. |
The accompanying notes are an integral part of the financial statements.
44
MML Series Investment Fund – Financial Statements (Continued)
Financial Highlights (For a share outstanding throughout each period)
MML Balanced Allocation Fund
| | | | | | | | | | | | | | | | | | | | | | | | | | | | | | | | | | | | | | | | | | | | | | | | | | | | |
| | | | | | Income (loss) from investment
operations | | | Less distributions to shareholders | | | | | | | | | Ratios / Supplemental Data | |
| | | Net asset
value,
beginning
of period | | | Net
investment
income
(loss)c,j | | | Net
realized
and
unrealized
gain (loss)
on
investments | | | Total
income
(loss)
from
investment
operations | | | From
net
investment
income | | | From
net
realized
gains | | | Total
distributions | | | Net
asset
value,
end of
the
period | | | Total
Returnm | | | Net
assets,
end of
the
period
(000’s) | | | Ratio of
expenses
to
average
daily net
assets
before
expense
waiversw | | | Ratio of
expenses
to
average
daily net
assets
after
expense
waiversw | | | Net
investment
income
(loss) to
average
daily net
assets | |
Initial Class | | | | | | | | | | | | | | | | | | | | | | | | | | | | | | | | | | | | | | | | | | | | | | | | | |
| 12/31/12 | | $ | 10.06 | | | $ | 0.22 | | | $ | 1.01 | | | $ | 1.23 | | | $ | (0.19 | ) | | $ | (0.25 | ) | | $ | (0.44 | ) | | $ | 10.85 | | | | 12.40% | | | $ | 148,872 | | | | 0.13% | | | | N/A | | | | 2.08% | |
| 12/31/11 | | | 10.34 | | | | 0.18 | | | | (0.00 | )d | | | 0.18 | | | | (0.27 | ) | | | (0.19 | ) | | | (0.46 | ) | | | 10.06 | | | | 1.73% | | | | 126,438 | | | | 0.13% | | | | N/A | | | | 1.76% | |
| 12/31/10 | | | 9.31 | | | | 0.26 | | | | 0.91 | | | | 1.17 | | | | (0.14 | ) | | | - | | | | (0.14 | ) | | | 10.34 | | | | 12.73% | | | | 130,142 | | | | 0.13% | | | | N/A | | | | 2.71% | |
| 12/31/09 | | | 7.59 | | | | 0.15 | | | | 1.63 | | | | 1.78 | | | | (0.05 | ) | | | (0.01 | ) | | | (0.06 | ) | | | 9.31 | | | | 23.50% | | | | 120,940 | | | | 0.14% | | | | N/A | | | | 1.83% | |
| 12/31/08 | | | 10.08 | | | | 0.21 | | | | (2.70 | ) | | | (2.49 | ) | | | - | | | | (0.00 | )d | | | (0.00 | )d | | | 7.59 | | | | (24.70% | ) | | | 88,583 | | | | 0.20% | | | | 0.20% | k | | | 2.43% | |
Service Class | | | | | | | | | | | | | | | | | | | | | | | | | | | | | | | | | | | | | | | | | | | | | | | | | |
| 12/31/12 | | $ | 10.02 | | | $ | 0.19 | | | $ | 1.01 | | | $ | 1.20 | | | $ | (0.17 | ) | | $ | (0.25 | ) | | $ | (0.42 | ) | | $ | 10.80 | | | | 12.12% | | | $ | 312,268 | | | | 0.38% | | | | N/A | | | | 1.83% | |
| 12/31/11 | | | 10.30 | | | | 0.16 | | | | 0.00 | d | | | 0.16 | | | | (0.25 | ) | | | (0.19 | ) | | | (0.44 | ) | | | 10.02 | | | | 1.54% | | | | 249,453 | | | | 0.38% | | | | N/A | | | | 1.51% | |
| 12/31/10 | | | 9.28 | | | | 0.24 | | | | 0.91 | | | | 1.15 | | | | (0.13 | ) | | | - | | | | (0.13 | ) | | | 10.30 | | | | 12.49% | | | | 219,161 | | | | 0.38% | | | | N/A | | | | 2.46% | |
| 12/31/09 | | | 7.59 | | | | 0.14 | | | | 1.61 | | | | 1.75 | | | | (0.05 | ) | | | (0.01 | ) | | | (0.06 | ) | | | 9.28 | | | | 23.09% | | | | 161,300 | | | | 0.39% | | | | N/A | | | | 1.65% | |
| 12/31/08g | | | 9.60 | | | | 0.02 | | | | (2.03 | ) | | | (2.01 | ) | | | - | | | | (0.00 | )d | | | (0.00 | )d | | | 7.59 | | | | (20.94% | )b | | | 49,286 | | | | 0.47% | a | | | 0.45% | a,j | | | 0.87% | a |
| | | | | | | | | | | | | | | | | | | | |
| | | Year ended December 31 | |
| | | 2012 | | | 2011 | | | 2010 | | | 2009 | | | 2008 | |
Portfolio turnover rate for all share classesx | | | 21 | % | | | 12 | % | | | 39 | % | | | 42 | % | | | 21 | % |
| b | Percentage represents the results for the period and is not annualized. |
| c | Per share amount calculated on the average shares method. |
| d | Amount is less than $0.005 per share. |
| g | For the period August 15, 2008 (commencement of operations) through December 31, 2008. |
| j | Computed after giving effect to an agreement by MassMutual to waive certain fees and expenses of the Fund. |
| k | Amount waived had no impact on the ratio of expenses to average daily net assets. |
| m | Total return does not reflect expenses that apply at the separate account level or to related insurance products. Inclusion of these charges would reduce the total return figures for all periods shown. |
| w | Expenses of the underlying funds are not included in the Fund’s expense ratio. The Fund indirectly bears its proportionate share of the expenses of any underlying fund. |
| x | Amount does not include the portfolio activity of any underlying fund. |
The accompanying notes are an integral part of the financial statements.
45
MML Series Investment Fund – Financial Statements (Continued)
Financial Highlights (For a share outstanding throughout each period)
MML Moderate Allocation Fund
| | | | | | | | | | | | | | | | | | | | | | | | | | | | | | | | | | | | | | | | | | | | | | | | |
| | | | | | Income (loss) from investment
operations | | | Less distributions to shareholders | | | | | | | | | Ratios / Supplemental Data | |
| | | Net asset
value,
beginning
of period | | | Net
investment
income
(loss)c | | | Net
realized
and
unrealized
gain (loss)
on
investments | | | Total
income
(loss) from
investment
operations | | | From net
investment
income | | | From
net
realized
gains | | | Total
distributions | | | Net
asset
value,
end of
the
period | | | Total
Returnm | | | Net
assets,
end of
the
period
(000’s) | | | Ratio of
expenses
to
average
daily net
assetsw | | | Net
investment
income
(loss) to
average
daily net
assets | |
| Initial Class | | | | | | | | | | | | | | | | | | | | | | | | | | | | | | | | | | | | | | | | | |
12/31/12 | | $ | 10.04 | | | $ | 0.20 | | | $ | 1.11 | | | $ | 1.31 | | | $ | (0.16 | ) | | $ | (0.23 | ) | | $ | (0.39 | ) | | $ | 10.96 | | | | 13.17% | | | $ | 410,035 | | | | 0.12% | | | | 1.82% | |
| 12/31/11 | | | 10.16 | | | | 0.16 | | | | (0.06 | ) | | | 0.10 | | | | (0.21 | ) | | | (0.01 | ) | | | (0.22 | ) | | | 10.04 | | | | 1.00% | | | | 365,793 | | | | 0.12% | | | | 1.55% | |
| 12/31/10 | | | 9.08 | | | | 0.22 | | | | 0.99 | | | | 1.21 | | | | (0.13 | ) | | | - | | | | (0.13 | ) | | | 10.16 | | | | 13.48% | | | | 382,041 | | | | 0.12% | | | | 2.30% | |
| 12/31/09 | | | 7.26 | | | | 0.14 | | | | 1.74 | | | | 1.88 | | | | (0.05 | ) | | | (0.01 | ) | | | (0.06 | ) | | | 9.08 | | | | 25.90% | | | | 331,628 | | | | 0.13% | | | | 1.77% | |
| 12/31/08 | | | 10.04 | | | | 0.18 | | | | (2.96 | ) | | | (2.78 | ) | | | - | | | | (0.00 | )d | | | (0.00 | )d | | | 7.26 | | | | (27.69% | ) | | | 251,682 | | | | 0.14% | | | | 2.09% | |
| Service Class | | | | | | | | | | | | | | | | | | | | | | | | | | | | | | | | | | | | | | | | | |
12/31/12 | | $ | 9.99 | | | $ | 0.17 | | | $ | 1.10 | | | $ | 1.27 | | | $ | (0.14 | ) | | $ | (0.23 | ) | | $ | (0.37 | ) | | $ | 10.89 | | | | 12.82% | | | $ | 1,060,743 | | | | 0.37% | | | | 1.60% | |
| 12/31/11 | | | 10.12 | | | | 0.13 | | | | (0.06 | ) | | | 0.07 | | | | (0.19 | ) | | | (0.01 | ) | | | (0.20 | ) | | | 9.99 | | | | 0.73% | | | | 780,302 | | | | 0.37% | | | | 1.31% | |
| 12/31/10 | | | 9.05 | | | | 0.19 | | | | 0.99 | | | | 1.18 | | | | (0.11 | ) | | | - | | | | (0.11 | ) | | | 10.12 | | | | 13.24% | | | | 622,603 | | | | 0.37% | | | | 2.07% | |
| 12/31/09 | | | 7.26 | | | | 0.12 | | | | 1.73 | | | | 1.85 | | | | (0.05 | ) | | | (0.01 | ) | | | (0.06 | ) | | | 9.05 | | | | 25.48% | | | | 403,209 | | | | 0.38% | | | | 1.54% | |
| 12/31/08g | | | 9.44 | | | | 0.02 | | | | (2.20 | ) | | | (2.18 | ) | | | - | | | | (0.00 | )d | | | (0.00 | )d | | | 7.26 | | | | (23.09% | )b | | | 146,775 | | | | 0.39% | a | | | 0.86% | a |
| | | | | | | | | | | | | | | | | | | | |
| | | Year ended December 31 | |
| | | 2012 | | | 2011 | | | 2010 | | | 2009 | | | 2008 | |
Portfolio turnover rate for all share classesx | | | 18 | % | | | 12 | % | | | 31 | % | | | 39 | % | | | 18 | % |
| b | Percentage represents the results for the period and is not annualized. |
| c | Per share amount calculated on the average shares method. |
| d | Amount is less than $0.005 per share. |
| g | For the period August 15, 2008 (commencement of operations) through December 31, 2008. |
| m | Total return does not reflect expenses that apply at the separate account level or to related insurance products. Inclusion of these charges would reduce the total return figures for all periods shown. |
| w | Expenses of the underlying funds are not included in the Fund’s expense ratio. The Fund indirectly bears its proportionate share of the expenses of any underlying fund. |
| x | Amount does not include the portfolio activity of any underlying fund. |
The accompanying notes are an integral part of the financial statements.
46
MML Series Investment Fund – Financial Statements (Continued)
Financial Highlights (For a share outstanding throughout each period)
MML Growth Allocation Fund
| | | | | | | | | | | | | | | | | | | | | | | | | | | | | | | | | | | | | | | | | | | | | | | | |
| | | | | | Income (loss) from investment
operations | | | Less distributions to shareholders | | | | | | | | | Ratios / Supplemental Data | |
| | | Net asset
value,
beginning
of period | | | Net
investment
income
(loss)c | | | Net
realized
and
unrealized
gain (loss)
on
investments | | | Total
income
(loss)
from
investment
operations | | | From
net
investment
income | | | From
net
realized
gains | | | Total
distributions | | | Net
asset
value,
end of
the
period | | | Total
Returnm | | | Net
assets,
end of
the
period
(000’s) | | | Ratio of
expenses
to
average
daily net
assetsw | | | Net
investment
income
(loss) to
average
daily net
assets | |
| Initial Class | | | | | | | | | | | | | | | | | | | | | | | | | | | | | | | | | | | | | | | | | |
12/31/12 | | $ | 9.53 | | | $ | 0.15 | | | $ | 1.22 | | | $ | 1.37 | | | $ | (0.14 | ) | | $ | (0.10 | ) | | $ | (0.24 | ) | | $ | 10.66 | | | | 14.49% | | | $ | 559,044 | | | | 0.12% | | | | 1.43% | |
| 12/31/11 | | | 9.75 | | | | 0.12 | | | | (0.16 | ) | | | (0.04 | ) | | | (0.18 | ) | | | - | | | | (0.18 | ) | | | 9.53 | | | | (0.41% | ) | | | 518,216 | | | | 0.12% | | | | 1.23% | |
| 12/31/10 | | | 8.59 | | | | 0.15 | | | | 1.11 | | | | 1.26 | | | | (0.10 | ) | | | - | | | | (0.10 | ) | | | 9.75 | | | | 14.92% | | | | 538,363 | | | | 0.12% | | | | 1.68% | |
| 12/31/09 | | | 6.66 | | | | 0.12 | | | | 1.85 | | | | 1.97 | | | | (0.03 | ) | | | (0.01 | ) | | | (0.04 | ) | | | 8.59 | | | | 29.61% | | | | 470,601 | | | | 0.12% | | | | 1.57% | |
| 12/31/08 | | | 10.02 | | | | 0.10 | | | | (3.46 | ) | | | (3.36 | ) | | | - | | | | (0.00 | )d | | | (0.00 | )d | | | 6.66 | | | | (33.53% | ) | | | 354,595 | | | | 0.13% | | | | 1.24% | |
| Service Class | | | | | | | | | | | | | | | | | | | | | | | | | | | | | | | | | | | | | | | | | |
12/31/12 | | $ | 9.49 | | | $ | 0.12 | | | $ | 1.23 | | | $ | 1.35 | | | $ | (0.12 | ) | | $ | (0.10 | ) | | $ | (0.22 | ) | | $ | 10.62 | | | | 14.28% | | | $ | 826,960 | | | | 0.37% | | | | 1.18% | |
| 12/31/11 | | | 9.71 | | | | 0.10 | | | | (0.16 | ) | | | (0.06 | ) | | | (0.16 | ) | | | - | | | | (0.16 | ) | | | 9.49 | | | | (0.63% | ) | | | 745,526 | | | | 0.37% | | | | 0.98% | |
| 12/31/10 | | | 8.57 | | | | 0.13 | | | | 1.10 | | | | 1.23 | | | | (0.09 | ) | | | - | | | | (0.09 | ) | | | 9.71 | | | | 14.54% | | | | 755,101 | | | | 0.37% | | | | 1.45% | |
| 12/31/09 | | | 6.66 | | | | 0.10 | | | | 1.85 | | | | 1.95 | | | | (0.03 | ) | | | (0.01 | ) | | | (0.04 | ) | | | 8.57 | | | | 29.29% | | | | 559,084 | | | | 0.37% | | | | 1.34% | |
| 12/31/08g | | | 9.20 | | | | 0.01 | | | | (2.55 | ) | | | (2.54 | ) | | | - | | | | (0.00 | )d | | | (0.00 | )d | | | 6.66 | | | | (27.61% | )b | | | 184,401 | | | | 0.39% | a | | | 0.24% | a |
| | | | | | | | | | | | | | | | | | | | |
| | | Year ended December 31 | |
| | | 2012 | | | 2011 | | | 2010 | | | 2009 | | | 2008 | |
Portfolio turnover rate for all share classesx | | | 27 | % | | | 12 | % | | | 32 | % | | | 40 | % | | | 14 | % |
| b | Percentage represents the results for the period and is not annualized. |
| c | Per share amount calculated on the average shares method. |
| d | Amount is less than $0.005 per share. |
| g | For the period August 15, 2008 (commencement of operations) through December 31, 2008. |
| m | Total return does not reflect expenses that apply at the separate account level or to related insurance products. Inclusion of these charges would reduce the total return figures for all periods shown. |
| w | Expenses of the underlying funds are not included in the Fund’s expense ratio. The Fund indirectly bears its proportionate share of the expenses of any underlying fund. |
| x | Amount does not include the portfolio activity of any underlying fund. |
The accompanying notes are an integral part of the financial statements.
47
MML Series Investment Fund – Financial Statements (Continued)
Financial Highlights (For a share outstanding throughout each period)
MML Aggressive Allocation Fund
| | | | | | | | | | | | | | | | | | | | | | | | | | | | | | | | | | | | | | | | | | | | | | | | | | | | |
| | | | | | Income (loss) from investment
operations | | | Less distributions to shareholders | | | | | | | | | Ratios / Supplemental Data | |
| | | Net asset
value,
beginning
of period | | | Net
investment
income
(loss)c,j | | | Net
realized
and
unrealized
gain (loss)
on
investments | | | Total
income
(loss)
from
investment
operations | | | From
net
investment
income | | | From
net
realized
gains | | | Total
distributions | | | Net
asset
value,
end of
the
period | | | Total
Returnm | | | Net
assets,
end of
the
period
(000’s) | | | Ratio of
expenses
to
average
daily
net
assets
before
expense
waiversw | | | Ratio of
expenses
to
average
daily
net
assets
after
expense
waiversw | | | Net
investment
income
(loss) to
average
daily net
assets | |
| Initial Class | | | | | | | | | | | | | | | | | | | | | | | | | | | | | | | | | | | | | | | | | | | | | | | | | | | | |
12/31/12 | | $ | 9.12 | | | $ | 0.10 | | | $ | 1.33 | | | $ | 1.43 | | | $ | (0.08 | ) | | $ | - | | | $ | (0.08 | ) | | $ | 10.47 | | | | 15.73% | | | $ | 45,399 | | | | 0.20% | | | | 0.20% | j,k | | | 0.98% | |
| 12/31/11 | | | 9.40 | | | | 0.08 | | | | (0.26 | ) | | | (0.18 | ) | | | (0.10 | ) | | | - | | | | (0.10 | ) | | | 9.12 | | | | (1.86% | ) | | | 40,085 | | | | 0.19% | | | | N/A | | | | 0.81% | |
| 12/31/10 | | | 8.20 | | | | 0.09 | | | | 1.21 | | | | 1.30 | | | | (0.10 | ) | | | - | | | | (0.10 | ) | | | 9.40 | | | | 16.05% | | | | 41,787 | | | | 0.21% | | | | 0.20% | j | | | 1.08% | |
| 12/31/09 | | | 6.15 | | | | 0.09 | | | | 2.00 | | | | 2.09 | | | | (0.02 | ) | | | (0.02 | ) | | | (0.04 | ) | | | 8.20 | | | | 34.04% | | | | 33,931 | | | | 0.24% | | | | 0.20% | j | | | 1.34% | |
| 12/31/08 | | | 9.99 | | | | 0.04 | | | | (3.88 | ) | | | (3.84 | ) | | | - | | | | (0.00 | )d | | | (0.00 | )d | | | 6.15 | | | | (38.43% | ) | | | 24,477 | | | | 0.40% | | | | 0.20% | j | | | 0.46% | |
| Service Class | | | | | | | | | | | | | | | | | | | | | | | | | | | | | | | | | | | | | | | | | | | | | | | | | | | | |
12/31/12 | | $ | 9.07 | | | $ | 0.07 | | | $ | 1.32 | | | $ | 1.39 | | | $ | (0.06 | ) | | $ | - | | | $ | (0.06 | ) | | $ | 10.40 | | | | 15.35% | | | $ | 34,472 | | | | 0.45% | | | | 0.45% | j,k | | | 0.72% | |
| 12/31/11 | | | 9.35 | | | | 0.05 | | | | (0.24 | ) | | | (0.19 | ) | | | (0.09 | ) | | | - | | | | (0.09 | ) | | | 9.07 | | | | (2.03% | ) | | | 28,803 | | | | 0.44% | | | | N/A | | | | 0.59% | |
| 12/31/10 | | | 8.16 | | | | 0.07 | | | | 1.20 | | | | 1.27 | | | | (0.08 | ) | | | - | | | | (0.08 | ) | | | 9.35 | | | | 15.83% | | | | 22,669 | | | | 0.46% | | | | 0.45% | j | | | 0.86% | |
| 12/31/09 | | | 6.14 | | | | 0.08 | | | | 1.98 | | | | 2.06 | | | | (0.02 | ) | | | (0.02 | ) | | | (0.04 | ) | | | 8.16 | | | | 33.60% | | | | 15,066 | | | | 0.49% | | | | 0.45% | j | | | 1.11% | |
| 12/31/08g | | | 8.98 | | | | (0.01 | ) | | | (2.83 | ) | | | (2.84 | ) | | | - | | | | (0.00 | )d | | | (0.00 | )d | | | 6.14 | | | | (31.62% | )b | | | 3,953 | | | | 0.63% | a | | | 0.45% | a,j | | | (0.27% | )a |
| | | | | | | | | | | | | | | | | | | | |
| | | Year ended December 31 | |
| | | 2012 | | | 2011 | | | 2010 | | | 2009 | | | 2008 | |
Portfolio turnover rate for all share classesx | | | 35 | % | | | 20 | % | | | 42 | % | | | 38 | % | | | 18 | % |
| b | Percentage represents the results for the period and is not annualized. |
| c | Per share amount calculated on the average shares method. |
| d | Amount is less than $0.005 per share. |
| g | For the period August 15, 2008 (commencement of operations) through December 31, 2008. |
| j | Computed after giving effect to an agreement by MassMutual to waive certain fees and expenses of the Fund. |
| k | Amount waived had no impact on the ratio of expenses to average daily net assets. |
| m | Total return does not reflect expenses that apply at the separate account level or to related insurance products. Inclusion of these charges would reduce the total return figures for all periods shown. |
| w | Expenses of the underlying funds are not included in the Fund’s expense ratio. The Fund indirectly bears its proportionate share of the expenses of any underlying fund. |
| x | Amount does not include the portfolio activity of any underlying fund. |
The accompanying notes are an integral part of the financial statements.
48
MML Series Investment Fund – Financial Statements (Continued)
Financial Highlights (For a share outstanding throughout each period)
MML American Funds Growth Fund
| | | | | | | | | | | | | | | | | | | | | | | | | | | | | | | | | | | | | | | | | | | | | | | | | | | | |
| | | | | | Income (loss) from investment
operations | | | Less distributions to shareholders | | | | | | | | | Ratios / Supplemental Data | |
| | | Net asset
value,
beginning
of period | | | Net
investment
income
(loss)c,j | | | Net
realized
and
unrealized
gain (loss)
on
investments | | | Total
income
(loss)
from
investment
operations | | | From
net
investment
income | | | From
net
realized
gains | | | Total
distributions | | | Net
asset
value,
end of
the
period | | | Total
Returnm | | | Net
assets,
end of
the
period
(000’s) | | | Ratio of
expenses
to
average
daily net
assets
before
expense
waiversu | | | Ratio of
expenses
to
average
daily net
assets
after
expense
waiversu | | | Net
investment
income
(loss) to
average
daily net
assets | |
| Service Class I | | | | | | | | | | | | | | | | | | | | | | | | | | | | | | | | | | | | | | | | | | | | | |
| 12/31/12 | | $ | 9.61 | | | $ | 0.05 | | | $ | 1.62 | | | $ | 1.67 | | | $ | (0.02 | ) | | $ | (0.10 | ) | | $ | (0.12 | ) | | $ | 11.16 | | | | 17.41% | | | $ | 66,069 | | | | 0.74% | | | | 0.70% | j | | | 0.44% | |
| 12/31/11 | | | 10.32 | | | | 0.03 | | | | (0.51 | ) | | | (0.48 | ) | | | (0.03 | ) | | | (0.20 | ) | | | (0.23 | ) | | | 9.61 | | | | (4.74% | ) | | | 49,279 | | | | 0.77% | | | | 0.70% | j | | | 0.26% | |
| 12/31/10 | | | 8.80 | | | | 0.04 | | | | 1.55 | | | | 1.59 | | | | (0.02 | ) | | | (0.05 | ) | | | (0.07 | ) | | | 10.32 | | | | 18.16% | | | | 37,761 | | | | 0.81% | | | | 0.70% | j | | | 0.43% | |
| 12/31/09 | | | 6.36 | | | | 0.03 | | | | 2.44 | | | | 2.47 | | | | - | | | | (0.03 | ) | | | (0.03 | ) | | | 8.80 | | | | 38.86% | | | | 22,130 | | | | 0.90% | | | | 0.70% | j | | | 0.39% | |
| 12/31/08g | | | 10.00 | | | | 0.22 | | | | (3.86 | ) | | | (3.64 | ) | | | - | | | | - | | | | - | | | | 6.36 | | | | (36.40% | )b | | | 6,080 | | | | 13.92% | a | | | 0.70% | a,j | | | 9.23% | a |
| | | | | | | | | | | | | | | | | | | | |
| | | Year ended December 31 | |
| | | 2012 | | | 2011 | | | 2010 | | | 2009 | | | 2008 | |
Portfolio turnover rate for all share classesx | | | 6 | % | | | 3 | % | | | 10 | % | | | 9 | % | | | 5 | %b |
| b | Percentage represents the results for the period and is not annualized. |
| c | Per share amount calculated on the average shares method. |
| g | For the period August 15, 2008 (commencement of operations) through December 31, 2008. |
| j | Computed after giving effect to an agreement by MassMutual to waive certain fees and expenses of the Fund. |
| m | Total return does not reflect expenses that apply at the separate account level or to related insurance products. Inclusion of these charges would reduce the total return figures for all periods shown. |
| u | Expenses of the Master Fund are not included in the Fund’s expense ratio. The Fund indirectly bears its proportionate share of the expenses of the Master Fund. |
| x | Amount does not include the portfolio activity of the Master Fund. |
The accompanying notes are an integral part of the financial statements.
49
MML Series Investment Fund – Financial Statements (Continued)
Financial Highlights (For a share outstanding throughout each period)
MML American Funds International Fund
| | | | | | | | | | | | | | | | | | | | | | | | | | | | | | | | | | | | | | | | | | | | | | | | | | | | |
| | | | | | Income (loss) from investment
operations | | | Less distributions to shareholders | | | | | | | | | Ratios / Supplemental Data | |
| | | Net
asset
value,
beginning
of period | | | Net
investment
income
(loss)c,j | | | Net
realized
and
unrealized
gain (loss)
on
investments | | | Total
income
(loss)
from
investment
operations | | | From
net
investment
income | | | From
net
realized
gains | | | Total
distributions | | | Net
asset
value,
end of
the
period | | | Total
Returnm | | | Net
assets,
end of
the
period
(000’s) | | | Ratio of
expenses
to
average
daily net
assets
before
expense
waiversu | | | Ratio of
expenses
to
average
daily net
assets
after
expense
waiversu | | | Net
investment
income
(loss) to
average
daily net
assets | |
| Service Class I | | | | | | | | | | | | | | | | | | | | | | | | | | | | | | | | | | | | | | | | | | | | | | | | | |
| 12/31/12 | | $ | 8.44 | | | $ | 0.10 | | | $ | 1.34 | | | $ | 1.44 | | | $ | (0.12 | ) | | $ | (0.14 | ) | | $ | (0.26 | ) | | $ | 9.62 | | | | 17.38% | | | $ | 38,624 | | | | 0.79% | | | | 0.70% | j | | | 1.11% | |
| 12/31/11 | | | 10.22 | | | | 0.14 | | | | (1.60 | ) | | | (1.46 | ) | | | (0.13 | ) | | | (0.19 | ) | | | (0.32 | ) | | | 8.44 | | | | (14.36% | ) | | | 31,801 | | | | 0.81% | | | | 0.70% | j | | | 1.49% | |
| 12/31/10 | | | 9.79 | | | | 0.17 | | | | 0.47 | | | | 0.64 | | | | (0.08 | ) | | | (0.13 | ) | | | (0.21 | ) | | | 10.22 | | | | 6.82% | | | | 31,337 | | | | 0.83% | | | | 0.70% | j | | | 1.78% | |
| 12/31/09 | | | 6.92 | | | | 0.12 | | | | 2.82 | | | | 2.94 | | | | - | | | | (0.07 | ) | | | (0.07 | ) | | | 9.79 | | | | 42.63% | | | | 21,308 | | | | 0.91% | | | | 0.70% | j | | | 1.48% | |
| 12/31/08g | | | 10.00 | | | | 0.51 | | | | (3.59 | ) | | | (3.08 | ) | | | - | | | | - | | | | - | | | | 6.92 | | | | (30.80% | )b | | | 6,410 | | | | 13.59% | a | | | 0.70% | a,j | | | 19.94% | a |
| | | | | | | | | | | | | | | | | | | | |
| | | Year ended December 31 | |
| | | 2012 | | | 2011 | | | 2010 | | | 2009 | | | 2008 | |
Portfolio turnover rate for all share classesx | | | 10 | % | | | 6 | % | | | 9 | % | | | 12 | % | | | 7 | %b |
| b | Percentage represents the results for the period and is not annualized. |
| c | Per share amount calculated on the average shares method. |
| g | For the period August 15, 2008 (commencement of operations) through December 31, 2008. |
| j | Computed after giving effect to an agreement by MassMutual to waive certain fees and expenses of the Fund. |
| m | Total return does not reflect expenses that apply at the separate account level or to related insurance products. Inclusion of these charges would reduce the total return figures for all periods shown. |
| u | Expenses of the Master Fund are not included in the Fund’s expense ratio. The Fund indirectly bears its proportionate share of the expenses of the Master Fund. |
| x | Amount does not include the portfolio activity of the Master Fund. |
The accompanying notes are an integral part of the financial statements.
50
MML Series Investment Fund – Financial Statements (Continued)
Financial Highlights (For a share outstanding throughout each period)
MML American Funds Core Allocation Fund
| | | | | | | | | | | | | | | | | | | | | | | | | | | | | | | | | | | | | | | | | | | | | | | | | | | | |
| | | | | | Income (loss) from investment
operations | | | Less distributions to shareholders | | | | | | | | | Ratios / Supplemental Data | |
| | | Net
asset
value,
beginning
of period | | | Net
investment
income
(loss)c,j | | | Net
realized
and
unrealized
gain (loss)
on
investments | | | Total
income
(loss)
from
investment
operations | | | From
net
investment
income | | | From
net
realized
gains | | | Total
distributions | | | Net
asset
value,
end of
the
period | | | Total
Returnm | | | Net
assets,
end of
the
period
(000’s) | | | Ratio of
expenses
to
average
daily net
assets
before
expense
waiversw | | | Ratio of
expenses
to
average
daily net
assets
after
expense
waiversw | | | Net
investment
income
(loss) to
average
daily net
assets | |
| Service Class I | | | | | | | | | | | | | | | | | | | | | | | | | | | | | | | | | | | | | | | | | | | | | |
| 12/31/12 | | $ | 10.00 | | | $ | 0.17 | | | $ | 0.99 | | | $ | 1.16 | | | $ | (0.16 | ) | | $ | (0.28 | ) | | $ | (0.44 | ) | | $ | 10.72 | | | | 11.70% | | | $ | 422,997 | | | | 0.73% | | | | 0.73% | l | | | 1.63% | |
| 12/31/11 | | | 10.21 | | | | 0.18 | | | | (0.20 | ) | | | (0.02 | ) | | | (0.15 | ) | | | (0.04 | ) | | | (0.19 | ) | | | 10.00 | | | | (0.16% | ) | | | 356,240 | | | | 0.75% | | | | N/A | | | | 1.77% | |
| 12/31/10 | | | 9.56 | | | | 0.18 | | | | 0.67 | | | | 0.85 | | | | (0.13 | ) | | | (0.07 | ) | | | (0.20 | ) | | | 10.21 | | | | 9.17% | | | | 325,337 | | | | 0.76% | | | | 0.75% | j | | | 1.89% | |
| 12/31/09 | | | 7.75 | | | | 0.20 | | | | 1.69 | | | | 1.89 | | | | (0.08 | ) | | | - | | | | (0.08 | ) | | | 9.56 | | | | 24.52% | | | | 231,008 | | | | 0.77% | | | | 0.75% | j | | | 2.31% | |
| 12/31/08g | | | 10.00 | | | | 0.72 | | | | (2.97 | ) | | | (2.25 | ) | | | - | | | | - | | | | - | | | | 7.75 | | | | (22.50% | )b | | | 67,874 | | | | 1.85% | a | | | 0.75% | a,j | | | 25.06% | a |
| | | | | | | | | | | | | | | | | | | | |
| | | Year ended December 31 | |
| | | 2012 | | | 2011 | | | 2010 | | | 2009 | | | 2008 | |
Portfolio turnover rate for all share classesx | | | 8 | % | | | 13 | % | | | 3 | % | | | 10 | % | | | 1 | %b |
| b | Percentage represents the results for the period and is not annualized. |
| c | Per share amount calculated on the average shares method. |
| g | For the period August 15, 2008 (commencement of operations) through December 31, 2008. |
| j | Computed after giving effect to an agreement by MassMutual to waive certain fees and expenses of the Fund. |
| l | Expenses incurred during the period fell under the expense cap. |
| m | Total return does not reflect expenses that apply at the separate account level or to related insurance products. Inclusion of these charges would reduce the total return figures for all periods shown. |
| w | Expenses of the underlying funds are not included in the Fund’s expense ratio. The Fund indirectly bears its proportionate share of the expenses of any underlying fund. |
| x | Amount does not include the portfolio activity of any underlying fund. |
The accompanying notes are an integral part of the financial statements.
51
Notes to Financial Statements
MML Series Investment Fund (the “Trust”) is registered under the Investment Company Act of 1940, as amended (the “1940 Act”), as a no-load, open-end, management investment company. The Trust is organized under the laws of the Commonwealth of Massachusetts as a Massachusetts business trust pursuant to an Agreement and Declaration of Trust dated December 19, 1984, as restated May 14, 1993, and further amended and restated as of December 15, 2011, as it may be further amended from time to time. The following are eight series of the Trust (each individually referred to as a “Fund” or collectively as the “Funds”):
MML Conservative Allocation Fund (“Conservative Allocation Fund”)
MML Balanced Allocation Fund (“Balanced Allocation Fund”)
MML Moderate Allocation Fund (“Moderate Allocation Fund”)
MML Growth Allocation Fund (“Growth Allocation Fund”)
MML Aggressive Allocation Fund (“Aggressive Allocation Fund”)
MML American Funds® Growth Fund (“American Funds Growth Fund”)
MML American Funds® International Fund (“American Funds International Fund”)
MML American Funds® Core Allocation Fund (“American Funds Core Allocation Fund”)
The Trust makes shares of the Funds available for the investment of assets of various separate investment accounts established by Massachusetts Mutual Life Insurance Company (“MassMutual”) and by life insurance companies which are subsidiaries of MassMutual. Shares of the Trust are not offered to the general public. MassMutual, MML Bay State Life Insurance Company, and C.M. Life Insurance Company are the record owners of all of the outstanding shares of the Funds.
The Conservative Allocation Fund, Balanced Allocation Fund, Moderate Allocation Fund, Growth Allocation Fund, and Aggressive Allocation Fund (the “Allocation Funds”) invest their investable assets primarily in shares of various funds advised by MassMutual or a control affiliate of MassMutual. The Allocation Funds may also invest in non-affiliated funds. The financial statements of other series of the Trust, the applicable series of the MML Series Investment Fund II (which are advised by MassMutual), Oppenheimer Funds (which are advised by OppenheimerFunds, Inc., a majority-owned, indirect subsidiary of MassMutual), and non-affiliated funds are presented separately and can be obtained from the Securities and Exchange Commission’s (“SEC”) EDGAR database on its Internet site at www.sec.gov or by calling MassMutual at 1-888-309-3539. The assets of each of the five Allocation Funds listed above are diversified and a shareholder’s interest is limited to the series of the Trust, MML Series Investment Fund II, Oppenheimer Funds, or any non-affiliated funds in which the shares are invested.
American Funds Growth Fund and American Funds International Fund (each a “Feeder Fund,” collectively the “Feeder Funds”) invest all of their assets in Class 1 shares of the Growth and International Funds, respectively, each a series of the American Funds Insurance Series (each a “Master Fund,” collectively the “Master Funds”). Each Master Fund is an open-end investment company and organized as a Massachusetts business trust. Each Feeder Fund has an investment objective that is consistent with its corresponding Master Fund. Each Master Fund intends to comply with the requirements under Subchapter M of the Internal Revenue Code applicable to mutual funds and intends to distribute substantially all of its taxable income and capital gains to shareholders, which includes the applicable Feeder Fund, to qualify as a regulated investment company. The performance of the Feeder Funds is directly affected by the performance of the Master Funds. The financial statements of the Master Funds, including the Summary Investment Portfolios, are provided separately and should be read in conjunction with the Feeder Funds’ financial statements. As of December 31, 2012, the American Funds Growth Fund and American Funds International Fund owned 0.30% and 0.42% of the Growth and International Master Funds, respectively. The American Funds Core Allocation Fund invests all of its investable assets in shares of various series of American Funds Insurance Series, which are managed by Capital Research and Management Company.
The following table shows the classes available for each Fund, including the date each class commenced operations. Each share class represents an interest in the same portfolio of assets. The principal difference among the classes is the level of service and administration fees, and shareholder and distribution service expenses borne by the classes. Because each class will have different fees and expenses, performance and share prices will vary between the classes. The classes of shares are offered to different types of investors, as outlined in the Funds’ Prospectus.
52
Notes to Financial Statements (Continued)
| | | | | | | | | | | | |
| | | Initial Class | | | Service Class | | | Service Class I | |
Conservative Allocation Fund | | | 8/31/2007 | | | | 8/15/2008 | | | | None | |
Balanced Allocation Fund | | | 8/31/2007 | | | | 8/15/2008 | | | | None | |
Moderate Allocation Fund | | | 8/31/2007 | | | | 8/15/2008 | | | | None | |
Growth Allocation Fund | | | 8/31/2007 | | | | 8/15/2008 | | | | None | |
Aggressive Allocation Fund | | | 8/31/2007 | | | | 8/15/2008 | | | | None | |
American Funds Growth Fund | | | None | | | | None | | | | 8/15/2008 | |
American Funds International Fund | | | None | | | | None | | | | 8/15/2008 | |
American Funds Core Allocation Fund | | | None | | | | None | | | | 8/15/2008 | |
| 2. | | Significant Accounting Policies |
The following is a summary of significant accounting policies followed consistently by each Fund in the preparation of the financial statements in conformity with accounting principles generally accepted in the United States of America (“generally accepted accounting principles”). The preparation of the financial statements in accordance with generally accepted accounting principles requires management to make estimates and assumptions that affect the reported amounts and disclosures in the financial statements. Actual results could differ from those estimates.
Investment Valuation
The net asset value of each Fund’s shares is determined once daily as of the close of regular trading on the New York Stock Exchange, on each day the New York Stock Exchange is open for trading (a “business day”). The New York Stock Exchange normally closes at 4:00 p.m. Eastern Time, but may close earlier on some days.
The net asset value of each Fund is based upon the net asset value(s) of its corresponding Master Fund or underlying funds. Shares of the Master Funds and underlying funds are valued at their closing net asset values as reported on each business day.
Certain underlying funds or Master Funds may invest in securities that are traded principally in foreign markets and that trade on weekends and other days when the Funds do not price their shares. As a result, the values of the Funds’ portfolio securities may change on days when the prices of the Funds’ shares are not calculated. The prices of the Funds’ shares will reflect any such changes when the prices of the Funds’ shares are next calculated, which is the next business day.
The Prospectuses and Statements of Additional Information (“SAIs”) for the underlying funds or Master Funds, as applicable, explain the valuation methods for the underlying funds or Master Funds, including the circumstances under which the underlying funds or Master Funds may use fair value pricing and the effects of doing so. Such Prospectuses and SAIs are available on the SEC EDGAR database on its Internet site at www.sec.gov.
Various inputs may be used to determine the value of the Funds’ investments. The Funds categorize the inputs to valuation techniques used to value their investments into a disclosure hierarchy consisting of three levels as summarized below. The inputs or methodology used for valuing investments are not necessarily an indication of the risk associated with investing in those investments.
Level 1 – quoted prices (unadjusted) in active markets for identical investments that the Funds can access at the measurement date
Level 2 – other significant observable inputs (including quoted prices for similar investments, interest rates, prepayment speeds, credit risk, etc.)
Level 3 – significant unobservable inputs (including the Funds’ own assumptions in determining the fair value of investments)
All Funds characterized all investments at Level 1, as of December 31, 2012. For each Fund, the level classification by major category of investments is the same as the category presentation in the Portfolio of Investments.
The Funds had no transfers between Level 1, Level 2 and Level 3 of the fair value hierarchy during the year ended December 31, 2012. The Funds recognize transfers between the Levels as of the beginning of the year.
53
Notes to Financial Statements (Continued)
Accounting for Investment Transactions
Investment transactions are accounted for on the trade date. Realized gains and losses on sales of investments and unrealized appreciation and depreciation of investments are computed by the specific identification cost method. Proceeds received from litigation, if any, are included in realized gains on investment transactions for any investments that are no longer held in the portfolio and as a reduction in cost for investments that continue to be held in the portfolio. Interest income, adjusted for amortization of discounts and premiums on debt securities, is earned from the settlement date and is recorded on the accrual basis. Dividend income and distributions are recorded on the ex-dividend date. Withholding taxes on foreign interest, dividends, and capital gains have been provided for in accordance with the applicable country’s tax rules and rates. Foreign dividend income is recorded on the ex-dividend date or as soon as practicable after the Fund determines the existence of a dividend declaration after exercising reasonable due diligence. Distributions received on securities that represent a return of capital or capital gain are recorded as a reduction of cost of investments and/or as a realized gain. The Funds estimate the components of distributions received that may be considered return of capital distributions or capital gain distributions.
Allocation of Operating Activity
In maintaining the records for the Funds, the income and expense accounts are allocated to each class of shares. Investment income and loss, and unrealized and realized gains or losses are prorated among the classes of shares based on the relative net assets of each. Expenses are allocated to each class of shares depending on the nature of the expenditures. Administration and service fees, if any, which are directly attributable to a class of shares, are charged to that class’s operations. Expenses of the Fund not directly attributable to the operations of any class of shares or Fund are prorated among the Funds and classes to which the expense relates based on the relative net assets of each.
In addition, each Fund will also incur certain fees and expenses indirectly as a shareholder in the underlying funds. Because the underlying funds have varied expense and fee levels and each Fund, except American Funds Growth Fund and American Funds International Fund, may own different proportions of underlying funds at different times, the amount of fees and expenses indirectly incurred by each Fund will vary.
Foreign Securities
Certain underlying funds or Master Funds may invest in foreign securities. Foreign securities, including ADRs, are subject to additional risks compared to securities of U.S. issuers, including international trade, currency, political, regulatory, and diplomatic risks. In addition, fluctuations in currency exchange rates may adversely affect the values of foreign securities and the price of a Fund’s shares. Emerging markets securities are subject to greater risks than securities issued in developed foreign markets, including less liquidity, greater price volatility, higher relative rates of inflation, greater political, economic, and social instability, greater custody and operational risks, and greater volatility in currency exchange rates.
Credit Risk
Certain underlying funds or Master Funds may invest a portion of their assets, directly or indirectly, in securities backed by mortgage loans, credit card receivables, and automotive loans. The values and related income of these securities are sensitive to changes in economic conditions, including delinquencies and/or defaults. Continuing shifts in the market’s perception of credit quality on such securities have resulted in increased volatility of market price and periods of decreased market activity that have adversely impacted the valuation and liquidity of such securities.
Federal Income Tax
It is each Fund’s intent to continue to comply with the provisions of subchapter M of the Internal Revenue Code of 1986, as amended (the “Code”), applicable to a regulated investment company. Under such provisions, the Funds would not be subject to federal income taxes on their ordinary income and net realized capital gains to the extent they are distributed or deemed to have been distributed to their shareholders. Therefore, the Funds have not made any provision for federal income tax.
54
Notes to Financial Statements (Continued)
Dividends and Distributions to Shareholders
Dividends from net investment income and distributions of any net realized capital gains of each Fund are declared and paid annually and at other times as may be required to satisfy tax or regulatory requirements.
Distributions to shareholders are recorded on the ex-dividend date. Income and capital gain distributions are determined in accordance with income tax regulations, which may differ from generally accepted accounting principles. As a result, net investment income and net realized capital gains on investment transactions for a reporting period may differ significantly from distributions during such period.
| 3. | | Management Fees and Other Transactions |
Investment Management Fees
Under agreements between MassMutual and the Trust on behalf of each Fund, MassMutual is responsible for providing investment management services for each Fund. In return for these services, MassMutual receives advisory fees, based upon each Fund’s average daily net assets, at the following annual rates:
| | | | | | | | | | |
Conservative Allocation Fund | | | 0.10% | | | Aggressive Allocation Fund | | | 0.10% | |
Balanced Allocation Fund | | | 0.10% | | | American Funds Growth Fund | | | 0.15% | |
Moderate Allocation Fund | | | 0.10% | | | American Funds International Fund | | | 0.15% | |
Growth Allocation Fund | | | 0.10% | | | American Funds Core Allocation Fund | | | 0.20% | |
Administration Fees
For the American Funds Growth Fund, American Funds International Fund, and American Funds Core Allocation Fund, under separate administrative and shareholder services agreements between the Funds and MassMutual, MassMutual provides certain administrative and shareholder services and bears some of the class specific administrative expenses. In return for these services, MassMutual receives an administrative services fee based upon the average daily net assets of the applicable class of shares of the Funds, at the following annual rates:
| | | | |
| | | Service Class I | |
American Funds Growth Fund | | | 0.25% | |
American Funds International Fund | | | 0.25% | |
American Funds Core Allocation Fund | | | 0.25% | |
Distribution and Service Fees
MML Distributors, LLC (the “Distributor”) acts as distributor to the Funds. Pursuant to a Distribution and Services Plan adopted by the Funds pursuant to Rule 12b-1 under the 1940 Act, Service Class shares and Service Class I shares of the Funds pay an annual fee of 0.25% of the average daily net asset value of Service Class shares and Service Class I shares. This fee, or a portion thereof, is paid to: (i) the Distributor for services provided and expenses incurred by it in connection with the distribution of Service Class shares or Service Class I shares, as applicable, of each Fund; and/or (ii) MassMutual for services provided and expenses incurred by it for purposes of maintaining or providing personal services to Service Class and Service Class I shareholders.
Expense Caps and Waivers
MassMutual agreed to cap the fees and expenses of the Funds (other than extraordinary litigation and legal expenses, Master/Acquired Fund fees and expenses#, interest expense, short sale dividend and loan expense, or other non-recurring or unusual
55
Notes to Financial Statements (Continued)
expenses such as, for example, organizational expenses and shareholder meeting expenses) based upon the average daily net assets of the applicable class of shares of the Funds, as follows:
| | | | | | | | | | | | |
| | | Initial Class | | | Service Class | | | Service Class I | |
Aggressive Allocation Fund* | | | 0.20% | | | | 0.45% | | | | None | |
American Funds Growth Fund** | | | None | | | | None | | | | 0.70% | |
American Funds International Fund** | | | None | | | | None | | | | 0.70% | |
American Funds Core Allocation Fund* | | | None | | | | None | | | | 0.75% | |
| # | Master/Acquired Fund fees and expenses are expenses borne indirectly by a Fund through investments in other pooled investment vehicles. |
| * | Expense caps in effect through April 30, 2012. Interest expense and short sale dividend and loan expense were not excluded from the caps. |
| ** | Expense caps in effect through April 30, 2013. Interest expense and short sale dividend and loan expense were not excluded from the caps prior to May 1, 2012. |
Expense caps and waiver amounts are reflected as a reduction of expenses on the Statements of Operations.
Deferred Compensation
Trustees of the Funds who are not employees of MassMutual or its subsidiaries may elect to defer receipt of their annual fees in accordance with terms of a Non-Qualified Deferred Compensation Plan. Amounts deferred shall accrue interest or earnings and shall be recorded on the Funds’ books as other liabilities. Deferred compensation is included within Trustees’ fees and expenses in the Statements of Assets and Liabilities.
Other
Certain officers and trustees of the Funds are also employees of MassMutual. The compensation of each trustee who is not an employee of MassMutual is borne by the Funds.
| 4. | | Purchases and Sales of Investments |
Cost of purchases and proceeds from sales of investment securities (excluding short-term investments) for the year ended December 31, 2012, were as follows:
| | | | | | | | | | | | | | | | |
| | | Purchases | | | Sales | |
| | | Long-Term U.S.
Government
Securities | | | Other
Long-Term
Securities | | | Long-Term U.S.
Government
Securities | | | Other
Long-Term
Securities | |
Conservative Allocation Fund | | $ | - | | | $ | 132,765,052 | | | $ | - | | | $ | 68,745,238 | |
Balanced Allocation Fund | | | - | | | | 137,926,573 | | | | - | | | | 86,977,411 | |
Moderate Allocation Fund | | | - | | | | 446,789,732 | | | | - | | | | 236,523,185 | |
Growth Allocation Fund | | | - | | | | 358,812,081 | | | | - | | | | 375,838,530 | |
Aggressive Allocation Fund | | | - | | | | 28,302,341 | | | | - | | | | 25,932,530 | |
American Funds Growth Fund | | | - | | | | 11,537,111 | | | | - | | | | 3,478,823 | |
American Funds International Fund | | | - | | | | 5,087,508 | | | | - | | | | 3,645,101 | |
American Funds Core Allocation Fund | | | - | | | | 61,012,598 | | | | - | | | | 30,668,195 | |
56
Notes to Financial Statements (Continued)
| 5. | | Capital Share Transactions |
Changes in shares outstanding for each Fund were as follows:
| | | | | | | | | | | | | | | | |
| | | Year Ended December 31, 2012 | | | Year Ended December 31, 2011 | |
| | | Shares | | | Amount | | | Shares | | | Amount | |
Conservative Allocation Fund Initial Class | | | | | | | | | | | | | | | | |
Sold | | | 2,979,839 | | | $ | 31,948,401 | | | | 2,938,180 | | | $ | 31,644,495 | |
Issued as reinvestment of dividends | | | 634,968 | | | | 6,641,766 | | | | 835,213 | | | | 8,444,000 | |
Redeemed | | | (1,679,318 | ) | | | (18,004,386 | ) | | | (2,049,651 | ) | | | (22,058,314 | ) |
| | | | | | | | | | | | | | | | |
Net increase (decrease) | | | 1,935,489 | | | $ | 20,585,781 | | | | 1,723,742 | | | $ | 18,030,181 | |
| | | | | | | | | | | | | | | | |
Conservative Allocation Fund Service Class | | | | | | | | | | | | | | | | |
Sold | | | 5,625,441 | | | $ | 60,005,784 | | | | 6,788,014 | | | $ | 72,536,785 | |
Issued as reinvestment of dividends | | | 1,293,309 | | | | 13,463,345 | | | | 1,615,028 | | | | 16,247,183 | |
Redeemed | | | (2,116,789 | ) | | | (22,535,827 | ) | | | (3,928,305 | ) | | | (42,614,924 | ) |
| | | | | | | | | | | | | | | | |
Net increase (decrease) | | | 4,801,961 | | | $ | 50,933,302 | | | | 4,474,737 | | | $ | 46,169,044 | |
| | | | | | | | | | | | | | | | |
Balanced Allocation Fund Initial Class | | | | | | | | | | | | | | | | |
Sold | | | 2,319,860 | | | $ | 24,707,815 | | | | 1,389,631 | | | $ | 14,409,840 | |
Issued as reinvestment of dividends | | | 561,771 | | | | 5,881,737 | | | | 555,306 | | | | 5,514,182 | |
Redeemed | | | (1,732,319 | ) | | | (18,473,376 | ) | | | (1,962,578 | ) | | | (20,418,058 | ) |
| | | | | | | | | | | | | | | | |
Net increase (decrease) | | | 1,149,312 | | | $ | 12,116,176 | | | | (17,641 | ) | | $ | (494,036 | ) |
| | | | | | | | | | | | | | | | |
Balanced Allocation Fund Service Class | | | | | | | | | | | | | | | | |
Sold | | | 4,659,402 | | | $ | 49,389,515 | | | | 4,611,528 | | | $ | 47,516,797 | |
Issued as reinvestment of dividends | | | 1,074,488 | | | | 11,206,913 | | | | 997,897 | | | | 9,869,204 | |
Redeemed | | | (1,721,202 | ) | | | (18,276,660 | ) | | | (1,976,746 | ) | | | (20,496,713 | ) |
| | | | | | | | | | | | | | | | |
Net increase (decrease) | | | 4,012,688 | | | $ | 42,319,768 | | | | 3,632,679 | | | $ | 36,889,288 | |
| | | | | | | | | | | | | | | | |
Moderate Allocation Fund Initial Class | | | | | | | | | | | | | | | | |
Sold | | | 3,497,176 | | | $ | 37,444,715 | | | | 2,761,263 | | | $ | 28,324,294 | |
Issued as reinvestment of dividends | | | 1,343,986 | | | | 14,152,172 | | | | 793,969 | | | | 7,860,290 | |
Redeemed | | | (3,851,795 | ) | | | (41,249,206 | ) | | | (4,722,023 | ) | | | (48,353,563 | ) |
| | | | | | | | | | | | | | | | |
Net increase (decrease) | | | 989,367 | | | $ | 10,347,681 | | | | (1,166,791 | ) | | $ | (12,168,979 | ) |
| | | | | | | | | | | | | | | | |
Moderate Allocation Fund Service Class | | | | | | | | | | | | | | | | |
Sold | | | 18,187,217 | | | $ | 193,806,084 | | | | 18,107,507 | | | $ | 184,955,340 | |
Issued as reinvestment of dividends | | | 3,058,861 | | | | 32,056,866 | | | | 1,457,322 | | | | 14,369,196 | |
Redeemed | | | (1,981,538 | ) | | | (20,907,082 | ) | | | (2,985,816 | ) | | | (30,120,399 | ) |
| | | | | | | | | | | | | | | | |
Net increase (decrease) | | | 19,264,540 | | | $ | 204,955,868 | | | | 16,579,013 | | | $ | 169,204,137 | |
| | | | | | | | | | | | | | | | |
Growth Allocation Fund Initial Class | | | | | | | | | | | | | | | | |
Sold | | | 1,874,036 | | | $ | 19,279,430 | | | | 2,364,266 | | | $ | 23,064,310 | |
Issued as reinvestment of dividends | | | 1,239,383 | | | | 12,629,311 | | | | 1,020,454 | | | | 9,582,060 | |
Redeemed | | | (5,059,502 | ) | | | (52,037,119 | ) | | | (4,257,728 | ) | | | (41,556,102 | ) |
| | | | | | | | | | | | | | | | |
Net increase (decrease) | | | (1,946,083 | ) | | $ | (20,128,378 | ) | | | (873,008 | ) | | $ | (8,909,732 | ) |
| | | | | | | | | | | | | | | | |
Growth Allocation Fund Service Class | | | | | | | | | | | | | | | | |
Sold | | | 1,777,143 | | | $ | 18,216,236 | | | | 4,707,313 | | | $ | 46,613,827 | |
Issued as reinvestment of dividends | | | 1,642,015 | | | | 16,666,456 | | | | 1,306,143 | | | | 12,212,438 | |
Redeemed | | | (4,078,032 | ) | | | (41,739,524 | ) | | | (5,242,633 | ) | | | (50,969,214 | ) |
| | | | | | | | | | | | | | | | |
Net increase (decrease) | | | (658,874 | ) | | $ | (6,856,832 | ) | | | 770,823 | | | $ | 7,857,051 | |
| | | | | | | | | | | | | | | | |
57
Notes to Financial Statements (Continued)
| | | | | | | | | | | | | | | | |
| | | Year Ended December 31, 2012 | | | Year Ended December 31, 2011 | |
| | | Shares | | | Amount | | | Shares | | | Amount | |
Aggressive Allocation Fund Initial Class | | | | | | | | | | | | | | | | |
Sold | | | 499,229 | | | $ | 4,990,949 | | | | 766,724 | | | $ | 7,355,850 | |
Issued as reinvestment of dividends | | | 34,984 | | | | 348,090 | | | | 51,987 | | | | 466,841 | |
Redeemed | | | (591,254 | ) | | | (5,856,930 | ) | | | (871,542 | ) | | | (8,240,241 | ) |
| | | | | | | | | | | | | | | | |
Net increase (decrease) | | | (57,041 | ) | | $ | (517,891 | ) | | | (52,831 | ) | | $ | (417,550 | ) |
| | | | | | | | | | | | | | | | |
Aggressive Allocation Fund Service Class | | | | | | | | | | | | | | | | |
Sold | | | 456,872 | | | $ | 4,565,027 | | | | 980,730 | | | $ | 9,246,135 | |
Issued as reinvestment of dividends | | | 18,868 | | | | 186,793 | | | | 29,284 | | | | 261,800 | |
Redeemed | | | (337,631 | ) | | | (3,370,056 | ) | | | (258,714 | ) | | | (2,447,830 | ) |
| | | | | | | | | | | | | | | | |
Net increase (decrease) | | | 138,109 | | | $ | 1,381,764 | | | | 751,300 | | | $ | 7,060,105 | |
| | | | | | | | | | | | | | | | |
American Funds Growth Fund Service Class I | | | | | | | | | | | | | | | | |
Sold | | | 1,253,317 | | | $ | 13,396,343 | | | | 1,638,423 | | | $ | 16,633,249 | |
Issued as reinvestment of dividends | | | 61,133 | | | | 648,615 | | | | 102,232 | | | | 996,759 | |
Redeemed | | | (521,024 | ) | | | (5,613,436 | ) | | | (272,033 | ) | | | (2,784,767 | ) |
| | | | | | | | | | | | | | | | |
Net increase (decrease) | | | 793,426 | | | $ | 8,431,522 | | | | 1,468,622 | | | $ | 14,845,241 | |
| | | | | | | | | | | | | | | | |
American Funds International Fund Service Class I | | | | | | | | | | | | | | | | |
Sold | | | 655,019 | | | $ | 5,851,223 | | | | 886,469 | | | $ | 8,245,094 | |
Issued as reinvestment of dividends | | | 117,945 | | | | 1,039,099 | | | | 123,187 | | | | 1,091,441 | |
Redeemed | | | (526,695 | ) | | | (4,816,301 | ) | | | (306,685 | ) | | | (2,922,174 | ) |
| | | | | | | | | | | | | | | | |
Net increase (decrease) | | | 246,269 | | | $ | 2,074,021 | | | | 702,971 | | | $ | 6,414,361 | |
| | | | | | | | | | | | | | | | |
American Funds Core Allocation Fund Service Class I | | | | | | | | | | | | | | | | |
Sold | | | 4,424,765 | | | $ | 46,822,170 | | | | 5,145,933 | | | $ | 52,316,793 | |
Issued as reinvestment of dividends | | | 1,553,861 | | | | 16,222,311 | | | | 645,698 | | | | 6,334,302 | |
Redeemed | | | (2,175,338 | ) | | | (22,953,373 | ) | | | (2,017,807 | ) | | | (20,647,545 | ) |
| | | | | | | | | | | | | | | | |
Net increase (decrease) | | | 3,803,288 | | | $ | 40,091,108 | | | | 3,773,824 | | | $ | 38,003,550 | |
| | | | | | | | | | | | | | | | |
| 6. | | Federal Income Tax Information |
At December 31, 2012, the cost of securities and the unrealized appreciation (depreciation) in the value of investments owned by the Funds, as computed on a federal income tax basis, were as follows:
| | | | | | | | | | | | | | | | |
| | | Federal Income
Tax Cost | | | Tax Basis
Unrealized
Appreciation | | | Tax Basis
Unrealized
(Depreciation) | | | Net
Unrealized
Appreciation
(Depreciation) | |
Conservative Allocation Fund | | $ | 405,591,911 | | | $ | 31,378,009 | | | $ | (221,040 | ) | | $ | 31,156,969 | |
Balanced Allocation Fund | | | 416,111,899 | | | | 45,646,462 | | | | (307,391 | ) | | | 45,339,071 | |
Moderate Allocation Fund | | | 1,313,531,684 | | | | 159,288,523 | | | | (1,092,831 | ) | | | 158,195,692 | |
Growth Allocation Fund | | | 1,178,383,751 | | | | 209,973,854 | | | | (1,507,440 | ) | | | 208,466,414 | |
Aggressive Allocation Fund | | | 70,202,997 | | | | 9,846,687 | | | | (114,758 | ) | | | 9,731,929 | |
American Funds Growth Fund | | | 52,507,537 | | | | 13,653,883 | | | | - | | | | 13,653,883 | |
American Funds International Fund | | | 33,939,873 | | | | 4,748,163 | | | | - | | | | 4,748,163 | |
American Funds Core Allocation Fund | | | 356,204,230 | | | | 67,303,855 | | | | - | | | | 67,303,855 | |
Net capital loss carryforwards may be applied against any net realized taxable gains in succeeding years, subject to the carryforward period limitations, where applicable. On December 22, 2010, the Regulated Investment Company Modernization Act of 2010 (the “Modernization Act”) was signed by the President. The Modernization Act changed the capital loss carryforward rules
58
Notes to Financial Statements (Continued)
as they relate to regulated investment companies. Capital losses generated in tax years beginning after the date of enactment may now be carried forward indefinitely, and retain the character of the original loss. Under pre-enactment law, capital losses could be carried forward for up to eight tax years as short-term capital losses. The provisions affecting the utilization of capital loss carryforwards under the Modernization Act also require the utilization of post-enactment losses prior to the utilization of pre-enactment losses.
At December 31, 2012, for federal income tax purposes, there were no unused capital losses.
Accounting principles generally accepted in the United States of America require that only distributions in excess of tax basis earnings and profits be reported in the financial statements as a return of capital.
The tax character of distributions (including capital gain dividends, if any, designated pursuant to Section 852 of the Code) paid during the year ended December 31, 2012, was as follows:
| | | | | | | | | | | | |
| | | Ordinary
Income | | | Long Term
Capital Gain | | | Return of
Capital | |
Conservative Allocation Fund | | $ | 7,133,928 | | | $ | 12,971,183 | | | $ | - | |
Balanced Allocation Fund | | | 7,120,778 | | | | 9,967,872 | | | | - | |
Moderate Allocation Fund | | | 18,247,700 | | | | 27,961,338 | | | | - | |
Growth Allocation Fund | | | 16,366,574 | | | | 12,929,193 | | | | - | |
Aggressive Allocation Fund | | | 534,883 | | | | - | | | | - | |
American Funds Growth Fund | | | 117,069 | | | | 531,546 | | | | - | |
American Funds International Fund | | | 482,538 | | | | 556,561 | | | | - | |
American Funds Core Allocation Fund | | | 5,998,788 | | | | 10,223,523 | | | | - | |
The tax character of distributions (including capital gain dividends, if any, designated pursuant to Section 852 of the Code) paid during the year ended December 31, 2011, was as follows:
| | | | | | | | | | | | |
| | | Ordinary
Income | | | Long Term
Capital Gain | | | Return of
Capital | |
Conservative Allocation Fund | | $ | 12,804,782 | | | $ | 11,886,401 | | | $ | - | |
Balanced Allocation Fund | | | 8,922,415 | | | | 6,460,971 | | | | - | |
Moderate Allocation Fund | | | 21,391,771 | | | | 837,715 | | | | - | |
Growth Allocation Fund | | | 21,794,498 | | | | - | | | | - | |
Aggressive Allocation Fund | | | 728,641 | | | | - | | | | - | |
American Funds Growth Fund | | | 119,840 | | | | 876,919 | | | | - | |
American Funds International Fund | | | 445,209 | | | | 646,232 | | | | - | |
American Funds Core Allocation Fund | | | 5,079,356 | | | | 1,254,946 | | | | - | |
Capital accounts within financial statements are periodically adjusted for permanent differences between book and tax accounting. These adjustments have no impact on net assets or the results of operations. Temporary book and tax accounting differences will reverse in subsequent periods. At December 31, 2012, temporary book and tax accounting differences were primarily attributable to the deferral of wash sale losses and deferred Trustee compensation.
59
Notes to Financial Statements (Continued)
At December 31, 2012, the components of distributable earnings on a tax basis were as follows:
| | | | | | | | | | | | | | | | |
| | | Undistributed
Ordinary
Income | | | Undistributed
Long Term
Capital Gain
(Capital Loss
Carryover) | | | Other
Temporary
Differences | | | Unrealized
Appreciation
(Depreciation) | |
Conservative Allocation Fund | | $ | 9,991,880 | | | $ | 13,101,035 | | | $ | (37,211 | ) | | $ | 31,156,969 | |
Balanced Allocation Fund | | | 11,799,500 | | | | 22,394,126 | | | | (44,838 | ) | | | 45,339,070 | |
Moderate Allocation Fund | | | 29,064,752 | | | | 73,440,761 | | | | (130,343 | ) | | | 158,195,692 | |
Growth Allocation Fund | | | 25,806,347 | | | | 118,326,052 | | | | (159,082 | ) | | | 208,466,414 | |
Aggressive Allocation Fund | | | 1,061,488 | | | | 5,636,688 | | | | (8,335 | ) | | | 9,731,929 | |
American Funds Growth Fund | | | 256,780 | | | | 1,524,264 | | | | (4,681 | ) | | | 13,653,883 | |
American Funds International Fund | | | 398,565 | | | | 976,731 | | | | (3,531 | ) | | | 4,748,162 | |
American Funds Core Allocation Fund | | | 6,409,712 | | | | 8,766,411 | | | | (37,977 | ) | | | 67,303,855 | |
During the year ended December 31, 2012, the following amounts were reclassified due to permanent differences between book and tax accounting:
| | | | | | | | | | | | |
| | | Paid-in
Capital | | | Accumulated
Net Realized
Gain (Loss) on
Investments | | | Undistributed
Net Investment
Income (Loss) | |
Conservative Allocation Fund | | $ | 955 | | | $ | (1,719,261 | ) | | $ | 1,718,306 | |
Balanced Allocation Fund | | | 1,187 | | | | (3,476,578 | ) | | | 3,475,391 | |
Moderate Allocation Fund | | | 3,360 | | | | (6,742,955 | ) | | | 6,739,595 | |
Growth Allocation Fund | | | 4,395 | | | | (7,183,762 | ) | | | 7,179,367 | |
Aggressive Allocation Fund | | | 226 | | | | (410,694 | ) | | | 410,468 | |
American Funds Growth Fund | | | 107 | | | | - | | | | (107 | ) |
American Funds International Fund | | | 90 | | | | - | | | | (90 | ) |
American Funds Core Allocation Fund | | | 967 | | | | - | | | | (967 | ) |
The Funds did not have any unrecognized tax benefits at December 31, 2012, nor were there any increases or decreases in unrecognized tax benefits for the year then ended. The Funds recognize interest and penalties, if any, related to unrecognized tax benefits as an income tax expense in the Statements of Operations. During the year ended December 31, 2012, the Funds did not incur any such interest or penalties. The Funds are subject to examination by U.S. federal and state tax authorities for returns filed for the prior three fiscal years. Foreign taxes are provided for based on the Funds’ understanding of the tax rules and rates that exist in the foreign markets in which they invest.
| 7. | | Investment in Affiliated Issuers |
A summary of the Funds’ transactions in the securities of affiliated issuers during the year ended December 31, 2012, was as follows:
| | | | | | | | | | | | | | | | | | | | | | | | | | | | | | | | |
| | | Number of
Shares Held
as of
12/31/11 | | | Purchases | | | Sales | | | Number of
Shares Held
as of
12/31/12 | | | Value
as of
12/31/12 | | | Dividend
Income | | | Realized
Gains
Distributions | | | Net
Realized
Gain (Loss) | |
Conservative Allocation Fund | | | | |
MML Blue Chip Growth Fund, Initial Class | | | 1,488,404 | | | | 252,752 | | | | 412,987 | | | | 1,328,169 | | | $ | 17,930,281 | | | $ | 14,241 | | | $ | - | | | $ | 1,579,663 | |
MML Concentrated Growth Fund, Class I | | | 331,368 | | | | 455 | | | | 331,823 | | | | - | | | | - | | | | 3,519 | | | | - | | | | 485,903 | |
MML Equity Fund, Initial Class | | | 515,411 | | | | 57,409 | | | | 356,910 | | | | 215,910 | | | | 4,549,508 | | | | 129,892 | | | | - | | | | 1,193,014 | |
MML Equity Income Fund, Initial Class | | | 2,010,423 | | | | 414,238 | | | | 377,456 | | | | 2,047,205 | | | | 21,638,961 | | | | 411,711 | | | | - | | | | 700,783 | |
60
Notes to Financial Statements (Continued)
| | | | | | | | | | | | | | | | | | | | | | | | | | | | | | | | |
| | | Number of
Shares Held
as of
12/31/11 | | | Purchases | | | Sales | | | Number of
Shares Held
as of
12/31/12 | | | Value
as of
12/31/12 | | | Dividend
Income | | | Realized
Gains
Distributions | | | Net
Realized
Gain (Loss) | |
Conservative Allocation Fund (Continued) | | | | |
MML Focused Equity Fund, Class II | | | - | | | | 603,556 | | | | 30,506 | | | | 573,050 | | | $ | 6,584,341 | | | $ | 46,200 | | | $ | 282,181 | | | $ | 25,873 | |
MML Foreign Fund, Initial Class | | | 897,831 | | | | 338,915 | | | | 93,354 | | | | 1,143,392 | | | | 10,827,917 | | | | 196,416 | | | | - | | | | 13,194 | |
MML Fundamental Growth Fund, Class II | | | - | | | | 1,200,642 | | | | 64,547 | | | | 1,136,095 | | | | 12,428,883 | | | | 94,294 | | | | 258,982 | | | | 40,549 | |
MML Fundamental Value Fund, Class II | | | 1,494,572 | | | | 291,509 | | | | 488,530 | | | | 1,297,551 | | | | 16,154,513 | | | | 207,911 | | | | 32,500 | | | | 1,140,551 | |
MML Global Fund, Class I | | | 929,969 | | | | 264,691 | | | | 120,338 | | | | 1,074,322 | | | | 10,549,843 | | | | 91,083 | | | | - | | | | 341,540 | |
MML High Yield Fund, Class II | | | 1,039,595 | | | | 810,613 | | | | 116,203 | | | | 1,734,005 | | | | 18,952,674 | | | | 1,033,494 | | | | 87,496 | | | | 107,064 | |
MML Income & Growth Fund, Initial Class | | | 389,176 | | | | 711,813 | | | | 63,005 | | | | 1,037,984 | | | | 9,840,091 | | | | 94,210 | | | | - | | | | 81,171 | |
MML Inflation-Protected and Income Fund, Initial Class | | | 1,106,756 | | | | 182,172 | | | | 292,429 | | | | 996,499 | | | | 11,818,480 | | | | 371,517 | | | | 103,390 | | | | 384,264 | |
MML Large Cap Growth Fund, Initial Class | | | 1,060,042 | | | | 218,404 | | | | 273,015 | | | | 1,005,431 | | | | 11,683,107 | | | | 6,458 | | | | - | | | | 565,855 | |
MML Managed Bond Fund, Initial Class | | | 6,448,330 | | | | 2,492,915 | | | | 378,283 | | | | 8,562,962 | | | | 113,049,221 | | | | 2,902,124 | | | | 1,015,898 | | | | 365,854 | |
MML Mid Cap Growth Fund, Initial Class | | | 609,994 | | | | 263,205 | | | | 54,656 | | | | 818,543 | | | | 10,608,321 | | | | - | | | | 535,130 | | | | 356,597 | |
MML Mid Cap Value Fund, Initial Class | | | 1,086,331 | | | | 311,822 | | | | 214,472 | | | | 1,183,681 | | | | 13,150,691 | | | | 196,119 | | | | 567,599 | | | | 867,115 | |
MML Money Market Fund, Initial Class | | | 67,160 | | | | - | | | | 67,160 | | | | - | | | | - | | | | - | | | | - | | | | (22 | ) |
MML PIMCO Total Return Fund, Class II | | | 4,200,011 | | | | 1,377,775 | | | | 324,589 | | | | 5,253,197 | | | | 56,839,592 | | | | 974,517 | | | | - | | | | 158,601 | |
MML Short-Duration Bond Fund, Class II | | | 3,109,540 | | | | 595,270 | | | | 545,692 | | | | 3,159,118 | | | | 31,907,092 | | | | 588,455 | | | | 665,921 | | | | 157,880 | |
MML Small Cap Growth Equity Fund, Initial Class | | | 242,297 | | | | 70,340 | | | | 59,920 | | | | 252,717 | | | | 4,119,417 | | | | - | | | | 388,953 | | | | 224,495 | |
MML Small Company Value Fund, Class II | | | 444,226 | | | | 72,884 | | | | 173,246 | | | | 343,864 | | | | 6,485,275 | | | | 697 | | | | 154,371 | | | | 594,508 | |
MML Small/Mid Cap Equity Fund, Initial Class | | | 253,909 | | | | - | | | | 253,909 | | | | - | | | | - | | | | - | | | | - | | | | 127,971 | |
Oppenheimer Capital Appreciation Fund, Non-Service Shares* | | | 79,120 | | | | - | | | | 79,120 | | | | - | | | | - | | | | - | | | | - | | | | 440,497 | |
Oppenheimer Global Securities Fund, Non-Service Shares* | | | 215,552 | | | | 68,558 | | | | 27,206 | | | | 256,904 | | | | 8,362,234 | | | | 134,336 | | | | - | | | | 306,061 | |
Oppenheimer Global Strategic Income Fund, Non-Service Shares* | | | 4,622,873 | | | | 1,700,310 | | | | 650,691 | | | | 5,672,492 | | | | 32,163,032 | | | | 1,697,931 | | | | 313,259 | | | | 308,215 | |
Oppenheimer International Growth Fund, Non-Service Shares* | | | 3,337,619 | | | | 818,528 | | | | 723,584 | | | | 3,432,563 | | | | 7,105,406 | | | | 78,933 | | | | - | | | | 392,341 | |
| | | | | | | | | | | | | | | | | | | | | | | | | | | | | | | | |
| | | | | | | | | | | | | | | | | | $ | 436,748,880 | | | $ | 9,274,058 | | | $ | 4,405,680 | | | $ | 10,959,537 | |
| | | | | | | | | | | | | | | | | | | | | | | | | | | | | | | | |
Balanced Allocation Fund | | | | | | | | | | | | | | | | | | | | | | | | | | | | | | | | |
MML Blue Chip Growth Fund, Initial Class | | | 2,198,086 | | | | 223,893 | | | | 687,836 | | | | 1,734,143 | | | $ | 23,410,936 | | | $ | 19,508 | | | $ | - | | | $ | 4,142,253 | |
MML Concentrated Growth Fund, Class I | | | 586,286 | | | | 866 | | | | 587,152 | | | | - | | | | - | | | | 6,703 | | | | - | | | | 1,497,633 | |
MML Equity Fund, Initial Class | | | 779,040 | | | | 60,378 | | | | 552,659 | | | | 286,759 | | | | 6,042,410 | | | | 186,492 | | | | - | | | | 3,181,579 | |
MML Equity Income Fund, Initial Class | | | 2,651,368 | | | | 344,660 | | | | 614,244 | | | | 2,381,784 | | | | 25,175,460 | | | | 503,180 | | | | - | | | | 2,554,581 | |
MML Focused Equity Fund, Class II | | | - | | | | 960,995 | | | | 52,656 | | | | 908,339 | | | | 10,436,812 | | | | 73,480 | | | | 448,805 | | | | 51,687 | |
MML Foreign Fund, Initial Class | | | 962,986 | | | | 577,693 | | | | 68,251 | | | | 1,472,428 | | | | 13,943,890 | | | | 266,169 | | | | - | | | | 79,053 | |
MML Fundamental Growth Fund, Class II | | | - | | | | 1,613,909 | | | | 112,970 | | | | 1,500,939 | | | | 16,420,270 | | | | 125,020 | | | | 343,372 | | | | 98,020 | |
MML Fundamental Value Fund, Class II | | | 2,002,129 | | | | 259,292 | | | | 706,005 | | | | 1,555,416 | | | | 19,364,930 | | | | 261,268 | | | | 40,841 | | | | 1,699,601 | |
MML Global Fund, Class I | | | 1,011,877 | | | | 446,805 | | | | 76,379 | | | | 1,382,303 | | | | 13,574,218 | | | | 123,432 | | | | - | | | | 230,078 | |
MML High Yield Fund, Class II | | | 944,872 | | | | 734,465 | | | | 96,097 | | | | 1,583,240 | | | | 17,304,808 | | | | 988,477 | | | | 86,688 | | | | 93,787 | |
MML Income & Growth Fund, Initial Class | | | 312,109 | | | | 916,199 | | | | 69,966 | | | | 1,158,342 | | | | 10,981,084 | | | | 112,559 | | | | - | | | | 98,724 | |
MML Inflation-Protected and Income Fund, Initial Class | | | 926,384 | | | | 150,266 | | | | 248,470 | | | | 828,180 | | | | 9,822,220 | | | | 331,855 | | | | 95,931 | | | | 369,759 | |
MML Large Cap Growth Fund, Initial Class | | | 1,277,521 | | | | 284,038 | | | | 209,742 | | | | 1,351,817 | | | | 15,708,110 | | | | 9,398 | | | | - | | | | 433,011 | |
MML Managed Bond Fund, Initial Class | | | 5,932,700 | | | | 2,181,583 | | | | 302,780 | | | | 7,811,503 | | | | 103,128,371 | | | | 2,741,541 | | | | 977,521 | | | | 309,903 | |
MML Mid Cap Growth Fund, Initial Class | | | 1,065,088 | | | | 253,371 | | | | 109,664 | | | | 1,208,795 | | | | 15,665,979 | | | | - | | | | 836,453 | | | | 676,394 | |
MML Mid Cap Value Fund, Initial Class | | | 1,185,032 | | | | 498,852 | | | | 119,290 | | | | 1,564,594 | | | | 17,382,638 | | | | 271,796 | | | | 786,620 | | | | 308,662 | |
MML Money Market Fund, Initial Class | | | 50,686 | | | | - | | | | 50,686 | | | | - | | | | - | | | | - | | | | - | | | | (17 | ) |
MML PIMCO Total Return Fund, Class II | | | 3,546,503 | | | | 1,247,678 | | | | 217,737 | | | | 4,576,444 | | | | 49,517,124 | | | | 885,366 | | | | - | | | | 130,700 | |
MML Short-Duration Bond Fund, Class II | | | 2,834,126 | | | | 335,794 | | | | 503,165 | | | | 2,666,755 | | | | 26,934,230 | | | | 516,624 | | | | 600,536 | | | | 154,547 | |
MML Small Cap Growth Equity Fund, Initial Class | | | 500,492 | | | | 106,031 | | | | 195,391 | | | | 411,132 | | | | 6,701,670 | | | | - | | | | 651,094 | | | | 1,128,945 | |
MML Small Company Value Fund, Class II | | | 490,527 | | | | 105,656 | | | | 41,308 | | | | 554,875 | | | | 10,464,936 | | | | 1,169 | | | | 258,701 | | | | 211,902 | |
MML Small/Mid Cap Equity Fund, Initial Class | | | 372,302 | | | | - | | | | 372,302 | | | | - | | | | - | | | | - | | | | - | | | | 305,473 | |
Oppenheimer Capital Appreciation Fund, Non-Service Shares* | | | 152,708 | | | | - | | | | 152,708 | | | | - | | | | - | | | | - | | | | - | | | | 1,232,985 | |
61
Notes to Financial Statements (Continued)
| | | | | | | | | | | | | | | | | | | | | | | | | | | | | | | | |
| | | Number of
Shares Held
as of
12/31/11 | | | Purchases | | | Sales | | | Number of
Shares Held
as of
12/31/12 | | | Value
as of 12/31/12 | | | Dividend
Income | | | Realized
Gains
Distributions | | | Net
Realized
Gain (Loss) | |
Balanced Allocation Fund (Continued) | | | | | | | | | | | | | | | | | | | | | | | | | | | | | | | | |
Oppenheimer Global Securities Fund, Non-Service Shares* | | | 363,203 | | | | 70,690 | | | | 85,975 | | | | 347,918 | | | $ | 11,324,740 | | | $ | 197,079 | | | $ | - | | | $ | 955,860 | |
Oppenheimer Global Strategic Income Fund, Non-Service Shares* | | | 4,205,814 | | | | 1,386,108 | | | | 623,718 | | | | 4,968,204 | | | | 28,169,716 | | | | 1,615,473 | | | | 298,045 | | | | 696,015 | |
Oppenheimer International Growth Fund, Non-Service Shares* | | | 5,737,047 | | | | 880,123 | | | | 1,797,645 | | | | 4,819,525 | | | | 9,976,418 | | | | 120,088 | | | | - | | | | 1,435,904 | |
| | | | | | | | | | | | | | | | | | | | | | | | | | | | | | | | |
| | | | | | | | | | | | | | | | | | $ | 461,450,970 | | | $ | 9,356,677 | | | $ | 5,424,607 | | | $ | 22,077,039 | |
| | | | | | | | | | | | | | | | | | | | | | | | | | | | | | | | |
Moderate Allocation Fund | | | | | | | | | | | | | | | | | | | | | | | | | | | | | | | | |
MML Blue Chip Growth Fund, Initial Class | | | 7,883,233 | | | | 913,895 | | | | 1,878,217 | | | | 6,918,911 | | | $ | 93,405,308 | | | $ | 74,854 | | | $ | - | | | $ | 11,650,917 | |
MML Concentrated Growth Fund, Class I | | | 2,285,171 | | | | 3,320 | | | | 2,288,491 | | | | - | | | | - | | | | 25,702 | | | | - | | | | 5,672,507 | |
MML Equity Fund, Initial Class | | | 2,709,905 | | | | 219,409 | | | | 1,857,680 | | | | 1,071,634 | | | | 22,580,831 | | | | 533,737 | | | | - | | | | 12,260,000 | |
MML Equity Income Fund, Initial Class | | | 9,564,791 | | | | 1,202,634 | | | | 2,811,845 | | | | 7,955,580 | | | | 84,090,483 | | | | 1,637,113 | | | | - | | | | 10,520,890 | |
MML Focused Equity Fund, Class II | | | - | | | | 4,392,332 | | | | 200,144 | | | | 4,192,188 | | | | 48,168,237 | | | | 338,176 | | | | 2,065,526 | | | | 250,473 | |
MML Foreign Fund, Initial Class | | | 4,278,250 | | | | 1,098,812 | | | | 288,398 | | | | 5,088,664 | | | | 48,189,649 | | | | 897,658 | | | | - | | | | 394,824 | |
MML Fundamental Growth Fund, Class II | | | - | | | | 6,241,411 | | | | 164,869 | | | | 6,076,542 | | | | 66,477,375 | | | | 504,649 | | | | 1,386,036 | | | | 136,083 | |
MML Fundamental Value Fund, Class II | | | 5,304,724 | | | | 903,480 | | | | 653,792 | | | | 5,554,412 | | | | 69,152,428 | | | | 902,452 | | | | 141,070 | | | | 1,638,239 | |
MML Global Fund, Class I | | | 3,587,624 | | | | 1,299,054 | | | | 108,005 | | | | 4,778,673 | | | | 46,926,568 | | | | 416,194 | | | | - | | | | 341,832 | |
MML High Yield Fund, Class II | | | 2,660,716 | | | | 2,015,014 | | | | 88,770 | | | | 4,586,960 | | | | 50,135,477 | | | | 2,794,028 | | | | 239,519 | | | | 87,926 | |
MML Income & Growth Fund, Initial Class | | | 1,409,629 | | | | 3,380,337 | | | | 79,183 | | | | 4,710,783 | | | | 44,658,220 | | | | 431,210 | | | | - | | | | 98,801 | |
MML Inflation-Protected and Income Fund, Initial Class | | | 1,903,695 | | | | 656,805 | | | | 561,173 | | | | 1,999,327 | | | | 23,712,019 | | | | 813,302 | | | | 236,341 | | | | 626,289 | |
MML Large Cap Growth Fund, Initial Class | | | 5,508,194 | | | | 940,459 | | | | 1,199,352 | | | | 5,249,301 | | | | 60,996,878 | | | | 34,794 | | | | - | | | | 2,272,819 | |
MML Managed Bond Fund, Initial Class | | | 13,752,011 | | | | 5,390,168 | | | | 260,566 | | | | 18,881,613 | | | | 249,277,242 | | | | 6,497,180 | | | | 2,285,702 | | | | 267,672 | |
MML Mid Cap Growth Fund, Initial Class | | | 3,905,750 | | | | 1,193,832 | | | | 317,379 | | | | 4,782,203 | | | | 61,977,345 | | | | - | | | | 3,348,385 | | | | 1,189,602 | |
MML Mid Cap Value Fund, Initial Class | | | 4,834,722 | | | | 1,393,562 | | | | 229,233 | | | | 5,999,051 | | | | 66,649,456 | | | | 1,008,092 | | | | 2,917,580 | | | | 500,049 | |
MML Money Market Fund, Initial Class | | | 137,405 | | | | - | | | | 137,405 | | | | - | | | | - | | | | - | | | | - | | | | (45 | ) |
MML PIMCO Total Return Fund, Class II | | | 9,091,807 | | | | 2,770,511 | | | | 183,656 | | | | 11,678,662 | | | | 126,363,121 | | | | 2,215,588 | | | | - | | | | 115,081 | |
MML Short-Duration Bond Fund, Class II | | | 8,310,107 | | | | 813,952 | | | | 1,802,642 | | | | 7,321,417 | | | | 73,946,311 | | | | 1,409,982 | | | | 1,631,135 | | | | 603,674 | |
MML Small Cap Growth Equity Fund, Initial Class | | | 1,654,476 | | | | 498,007 | | | | 181,383 | | | | 1,971,100 | | | | 32,130,004 | | | | - | | | | 3,051,500 | | | | 1,415,674 | |
MML Small Company Value Fund, Class II | | | 1,939,887 | | | | 383,613 | | | | 156,499 | | | | 2,167,001 | | | | 40,869,646 | | | | 4,461 | | | | 987,334 | | | | 809,535 | |
MML Small/Mid Cap Equity Fund, Initial Class | | | 757,740 | | | | - | | | | 757,740 | | | | - | | | | - | | | | - | | | | - | | | | 473,891 | |
MML Strategic Emerging Markets Fund, Class II | | | 171,912 | | | | 1,254,366 | | | | 21,727 | | | | 1,404,551 | | | | 15,323,647 | | | | 65,488 | | | | - | | | | 6,786 | |
Oppenheimer Capital Appreciation Fund, Non-Service Shares* | | | 395,908 | | | | - | | | | 395,908 | | | | - | | | | - | | | | - | | | | - | | | | 2,628,260 | |
Oppenheimer Global Securities Fund, Non-Service Shares* | | | 1,129,459 | | | | 278,948 | | | | 61,218 | | | | 1,347,189 | | | | 43,850,988 | | | | 744,477 | | | | - | | | | 723,860 | |
Oppenheimer Global Strategic Income Fund, Non-Service Shares* | | | 10,736,277 | | | | 3,195,726 | | | | 1,368,564 | | | | 12,563,439 | | | | 71,234,702 | | | | 3,992,161 | | | | 736,531 | | | | 1,572,597 | |
Oppenheimer International Growth Fund, Non-Service Shares* | | | 24,185,994 | | | | 2,751,160 | | | | 11,665,927 | | | | 15,271,227 | | | | 31,611,441 | | | | 370,865 | | | | - | | | | 8,768,110 | |
| | | | | | | | | | | | | | | | | | | | | | | | | | | | | | | | |
| | | | | | | | | | | | | | | | | | $ | 1,471,727,376 | | | $ | 25,712,163 | | | $ | 19,026,659 | | | $ | 65,026,346 | |
| | | | | | | | | | | | | | | | | | | | | | | | | | | | | | | | |
Growth Allocation Fund | | | | | | | | | | | | | | | | | | | | | | | | | | | | | |
MML Blue Chip Growth Fund, Initial Class | | | 11,287,257 | | | | 120,306 | | | | 3,136,622 | | | | 8,270,941 | | | $ | 111,657,692 | | | $ | 96,126 | | | $ | - | | | $ | 19,621,532 | |
MML Concentrated Growth Fund, Class I | | | 4,051,161 | | | | 5,853 | | | | 4,057,014 | | | | - | | | | - | | | | 45,305 | | | | - | | | | 11,173,280 | |
MML Equity Fund, Initial Class | | | 3,888,832 | | | | 47,705 | | | | 2,765,197 | | | | 1,171,340 | | | | 24,681,777 | | | | 568,759 | | | | - | | | | 18,603,705 | |
MML Equity Income Fund, Initial Class | | | 13,457,219 | | | | 299,793 | | | | 5,264,952 | | | | 8,492,060 | | | | 89,761,076 | | | | 1,870,352 | | | | - | | | | 19,196,362 | |
MML Focused Equity Fund, Class II | | | - | | | | 6,249,133 | | | | 465,275 | | | | 5,783,858 | | | | 66,456,524 | | | | 469,920 | | | | 2,870,195 | | | | 486,259 | |
MML Foreign Fund, Initial Class | | | 4,780,221 | | | | 1,497,217 | | | | 314,344 | | | | 5,963,094 | | | | 56,470,502 | | | | 1,122,513 | | | | - | | | | 407,781 | |
MML Fundamental Growth Fund, Class II | | | - | | | | 7,808,810 | | | | 573,284 | | | | 7,235,526 | | | | 79,156,654 | | | | 605,454 | | | | 1,662,901 | | | | 460,826 | |
MML Fundamental Value Fund, Class II | | | 6,488,024 | | | | 189,630 | | | | 604,707 | | | | 6,072,947 | | | | 75,608,189 | | | | 1,045,745 | | | | 163,469 | | | | 1,517,371 | |
MML Global Fund, Class I | | | 4,993,725 | | | | 560,002 | | | | 333,785 | | | | 5,219,942 | | | | 51,259,827 | | | | 485,683 | | | | - | | | | 1,017,798 | |
MML High Yield Fund, Class II | | | 2,336,290 | | | | 1,056,168 | | | | 212,477 | | | | 3,179,981 | | | | 34,757,192 | | | | 2,106,696 | | | | 196,555 | | | | 204,963 | |
MML Income & Growth Fund, Initial Class | | | 562,338 | | | | 3,974,521 | | | | 244,311 | | | | 4,292,548 | | | | 40,693,352 | | | | 411,844 | | | | - | | | | 338,081 | |
62
Notes to Financial Statements (Continued)
| | | | | | | | | | | | | | | | | | | | | | | | | | | | | | | | |
| | | Number of
Shares Held
as of
12/31/11 | | | Purchases | | | Sales | | | Number of
Shares Held
as of
12/31/12 | | | Value
as of 12/31/12 | | | Dividend
Income | | | Realized
Gains
Distributions | | | Net Realized
Gain (Loss) | |
Growth Allocation Fund (Continued) | | | | | | | | | | | | | | | | | | | | | | | | | | | | | |
MML Inflation-Protected and Income Fund, Initial Class | | | 2,087,561 | | | | 92,866 | | | | 465,318 | | | | 1,715,109 | | | $ | 20,341,199 | | | $ | 663,440 | | | $ | 192,746 | | | $ | 868,617 | |
MML Large Cap Growth Fund, Initial Class | | | 7,033,144 | | | | 392,834 | | | | 724,673 | | | | 6,701,305 | | | | 77,869,167 | | | | 47,881 | | | | - | | | | 1,470,029 | |
MML Managed Bond Fund, Initial Class | | | 8,807,144 | | | | 2,947,821 | | | | 567,907 | | | | 11,187,058 | | | | 147,692,838 | | | | 4,149,436 | | | | 1,548,411 | | | | 482,654 | |
MML Mid Cap Growth Fund, Initial Class | | | 5,675,655 | | | | 708,305 | | | | 609,353 | | | | 5,774,607 | | | | 74,838,910 | | | | - | | | | 4,334,559 | | | | 1,811,231 | |
MML Mid Cap Value Fund, Initial Class | | | 7,030,963 | | | | 555,350 | | | | 661,596 | | | | 6,924,717 | | | | 76,933,611 | | | | 1,235,825 | | | | 3,576,677 | | | | 1,398,239 | |
MML Money Market Fund, Initial Class | | | 158,878 | | | | - | | | | 158,878 | | | | - | | | | - | | | | - | | | | - | | | | (53 | ) |
MML PIMCO Total Return Fund, Class II | | | 5,398,947 | | | | 1,634,947 | | | | 362,452 | | | | 6,671,442 | | | | 72,185,002 | | | | 1,358,821 | | | | - | | | | 212,331 | |
MML Short-Duration Bond Fund, Class II | | | 5,574,388 | | | | 199,375 | | | | 2,500,207 | | | | 3,273,556 | | | | 33,062,911 | | | | 760,179 | | | | 1,024,867 | | | | 604,750 | |
MML Small Cap Growth Equity Fund, Initial Class | | | 2,582,822 | | | | 387,390 | | | | 286,335 | | | | 2,683,877 | | | | 43,748,666 | | | | - | | | | 4,459,697 | | | | 2,139,538 | |
MML Small Company Value Fund, Class II | | | 2,999,794 | | | | 163,325 | | | | 374,545 | | | | 2,788,574 | | | | 52,592,506 | | | | 6,157 | | | | 1,362,681 | | | | 1,909,311 | |
MML Small/Mid Cap Equity Fund, Initial Class | | | 890,443 | | | | - | | | | 890,443 | | | | - | | | | - | | | | - | | | | - | | | | 1,005,852 | |
MML Strategic Emerging Markets Fund, Class II | | | 135,330 | | | | 2,662,605 | | | | 144,139 | | | | 2,653,796 | | | | 28,952,915 | | | | 124,507 | | | | - | | �� | | (10,803 | ) |
Oppenheimer Capital Appreciation Fund, Non-Service Shares* | | | 773,453 | | | | - | | | | 773,453 | | | | - | | | | - | | | | - | | | | - | | | | 6,263,668 | |
Oppenheimer Global Securities Fund, Non-Service Shares* | | | 1,398,118 | | | | 188,479 | | | | 94,621 | | | | 1,491,976 | | | | 48,563,809 | | | | 923,170 | | | | - | | | | 1,077,433 | |
Oppenheimer Global Strategic Income Fund, Non-Service Shares* | | | 6,653,145 | | | | 1,260,246 | | | | 408,083 | | | | 7,505,308 | | | | 42,555,097 | | | | 2,309,852 | | | | 426,155 | | | | 518,113 | |
Oppenheimer International Growth Fund, Non-Service Shares* | | | 39,084,869 | | | | 1,076,636 | | | | 22,281,916 | | | | 17,879,589 | | | | 37,010,749 | | | | 486,403 | | | | - | | | | 17,097,758 | |
| | | | | | | | | | | | | | | | | | | | | | | | | | | | | | | | |
| | | | | | | | | | | | | | | | | | $ | 1,386,850,165 | | | $ | 20,894,068 | | | $ | 21,818,913 | | | $ | 109,876,626 | |
| | | | | | | | | | | | | | | | | | | | | | | | | | | | | | | | |
Aggressive Allocation Fund | | | | | | | | | | | | | | | | | | | | | | | | | | | | | |
MML Blue Chip Growth Fund, Initial Class | | | 684,254 | | | | 53,056 | | | | 168,864 | | | | 568,446 | | | $ | 7,674,005 | | | $ | 6,298 | | | $ | - | | | $ | 1,000,786 | |
MML Concentrated Growth Fund, Class I | | | 254,295 | | | | 361 | | | | 254,656 | | | | - | | | | - | | | | 2,795 | | | | - | | | | 535,502 | |
MML Equity Fund, Initial Class | | | 248,136 | | | | 8,861 | | | | 189,906 | | | | 67,091 | | | | 1,413,688 | | | | 25,608 | | | | - | | | | 859,317 | |
MML Equity Income Fund, Initial Class | | | 735,498 | | | | 66,194 | | | | 216,793 | | | | 584,899 | | | | 6,182,386 | | | | 123,669 | | | | - | | | | 782,313 | |
MML Focused Equity Fund, Class II | | | - | | | | 445,338 | | | | 40,831 | | | | 404,507 | | | | 4,647,781 | | | | 32,563 | | | | 198,887 | | | | 36,129 | |
MML Foreign Fund, Initial Class | | | 322,056 | | | | 98,271 | | | | 34,859 | | | | 385,468 | | | | 3,650,386 | | | | 69,950 | | | | - | | | | 36,607 | |
MML Fundamental Growth Fund, Class II | | | - | | | | 542,903 | | | | 54,560 | | | | 488,343 | | | | 5,342,471 | | | | 40,466 | | | | 111,142 | | | | 41,482 | |
MML Fundamental Value Fund, Class II | | | 574,883 | | | | 45,933 | | | | 203,263 | | | | 417,553 | | | | 5,198,539 | | | | 68,891 | | | | 10,769 | | | | 472,750 | |
MML Global Fund, Class I | | | 329,753 | | | | 43,197 | | | | 32,057 | | | | 340,893 | | | | 3,347,567 | | | | 30,554 | | | | - | | | | 89,137 | |
MML High Yield Fund, Class II | | | 56,055 | | | | 48,589 | | | | 8,177 | | | | 96,467 | | | | 1,054,387 | | | | 61,500 | | | | 5,615 | | | | 4,887 | |
MML Income & Growth Fund, Initial Class | | | 75,311 | | | | 230,703 | | | | 23,518 | | | | 282,496 | | | | 2,678,065 | | | | 25,533 | | | | - | | | | 31,126 | |
MML Inflation-Protected and Income Fund, Initial Class | | | 107,192 | | | | 5,823 | | | | 81,346 | | | | 31,669 | | | | 375,599 | | | | 16,159 | | | | 5,298 | | | | 86,564 | |
MML Large Cap Growth Fund, Initial Class | | | 433,918 | | | | 73,118 | | | | 54,057 | | | | 452,979 | | | | 5,263,618 | | | | 3,162 | | | | - | | | | 108,664 | |
MML Managed Bond Fund, Initial Class | | | 123,732 | | | | 155,198 | | | | 16,293 | | | | 262,637 | | | | 3,467,359 | | | | 95,750 | | | | 35,747 | | | | 9,012 | |
MML Mid Cap Growth Fund, Initial Class | | | 412,616 | | | | 73,161 | | | | 60,805 | | | | 424,972 | | | | 5,507,643 | | | | - | | | | 303,319 | | | | 185,178 | |
MML Mid Cap Value Fund, Initial Class | | | 425,923 | | | | 136,422 | | | | 48,837 | | | | 513,508 | | | | 5,705,077 | | | | 87,709 | | | | 253,845 | | | | 108,220 | |
MML PIMCO Total Return Fund, Class II | | | 144,356 | | | | 38,481 | | | | 14,689 | | | | 168,148 | | | | 1,819,367 | | | | 30,030 | | | | - | | | | 9,721 | |
MML Short-Duration Bond Fund, Class II | | | 102,340 | | | | 4,777 | | | | 88,537 | | | | 18,580 | | | | 187,663 | | | | 7,300 | | | | 12,645 | | | | 8,616 | |
MML Small Cap Growth Equity Fund, Initial Class | | | 185,498 | | | | 46,485 | | | | 28,993 | | | | 202,990 | | | | 3,308,850 | | | | - | | | | 338,592 | | | | 175,004 | |
MML Small Company Value Fund, Class II | | | 221,987 | | | | 30,663 | | | | 48,581 | | | | 204,069 | | | | 3,848,737 | | | | 449 | | | | 99,365 | | | | 248,798 | |
MML Small/Mid Cap Equity Fund, Initial Class | | | 50,626 | | | | - | | | | 50,626 | | | | - | | | | - | | | | - | | | | - | | | | (2,069 | ) |
MML Strategic Emerging Markets Fund, Class II | | | 9,853 | | | | 239,915 | | | | 19,913 | | | | 229,855 | | | | 2,507,717 | | | | 10,688 | | | | - | | | | (487 | ) |
Oppenheimer Capital Appreciation Fund, Non-Service Shares* | | | 53,378 | | | | - | | | | 53,378 | | | | - | | | | - | | | | - | | | | - | | | | 303,810 | |
Oppenheimer Global Securities Fund, Non-Service Shares* | | | 70,751 | | | | 36,484 | | | | 9,029 | | | | 98,206 | | | | 3,196,591 | | | | 59,314 | | | | - | | | | 98,691 | |
63
Notes to Financial Statements (Continued)
| | | | | | | | | | | | | | | | | | | | | | | | | | | | | | | | |
| | | Number of
Shares Held
as of
12/31/11 | | | Purchases | | | Sales | | | Number of
Shares Held
as of
12/31/12 | | | Value
as of
12/31/12 | | | Dividend
Income | | | Realized
Gains
Distributions | | | Net
Realized
Gain (Loss) | |
Aggressive Allocation Fund (Continued) | | | | | | | | | | | | | | | | | | | | | | | | | | | | | |
Oppenheimer Global Strategic Income Fund, Non-Service Shares* | | | 131,332 | | | | 62,829 | | | | 13,712 | | | | 180,449 | | | $ | 1,023,146 | | | $ | 45,382 | | | $ | 8,373 | | | $ | 761 | |
Oppenheimer International Growth Fund, Non-Service Shares* | | | 2,471,111 | �� | | | 149,544 | | | | 1,396,363 | | | | 1,224,292 | | | | 2,534,284 | | | | 32,493 | | | | - | | | | 974,818 | |
| | | | | | | | | | | | | | | | | | | | | | | | | | | | | | | | |
| | | | | | | | | | | | | | | | | | $ | 79,934,926 | | | $ | 876,263 | | | $ | 1,383,597 | | | $ | 6,205,337 | |
| | | | | | | | | | | | | | | | | | | | | | | | | | | | | | | | |
| * | Fund advised by OppenheimerFunds, Inc. |
Under the Funds’ organizational documents, current and former Trustees and Officers are provided with specified rights to indemnification against liabilities arising in connection with the performance of their duties to the Funds, and shareholders are indemnified against personal liability for obligations of the Funds. In the normal course of business, the Funds may also enter into contracts that provide general indemnifications. The Funds’ maximum exposure under these arrangements is unknown as this would be dependent on future claims that may be made against the Funds. The risk of material loss from such claims is considered remote.
| 9. | | New Accounting Pronouncements |
On December 16, 2011, the Financial Accounting Standards Board (“FASB”) issued Accounting Standards Update No. 2011-11, “Disclosures about Offsetting Assets and Liabilities” (“ASU 2011-11”), as clarified with ASU 2013-01 “Clarifying the Scope of Disclosures about Offsetting Assets and Liabilities” issued in January 2013. ASU 2011-11 amends FASB Accounting Standards Codification Topic 210, specifically requiring an entity to disclose information about offsetting and related arrangements and the effect those arrangements have on the financial position. ASU 2011-11 is effective in annual reporting periods beginning on or after January 1, 2013, and for interim periods within those annual reporting periods. Management is currently evaluating the implications of these changes and their impact on the financial statements.
In preparation of these financial statements management has evaluated the events and transactions subsequent to December 31, 2012, through the date when the financial statements were issued, and determined that there are no material events or transactions that would require adjustments to or disclosures in the Funds’ financial statements.
64
Report of Independent Registered Public Accounting Firm
To the Board of Trustees of MML Series Investment Fund and Shareholders of MML Conservative Allocation Fund, MML Balanced Allocation Fund, MML Moderate Allocation Fund, MML Growth Allocation Fund, MML Aggressive Allocation Fund, MML American Funds Growth Fund, MML American Funds International Fund, and MML American Funds Core Allocation Fund (collectively, the “Funds”):
We have audited the accompanying statements of assets and liabilities, including the portfolios of investments, of the Funds as of December 31, 2012, and the related statements of operations for the year then ended, the statements of changes in net assets for each of the two years in the period then ended, and the financial highlights for each of the periods presented. These financial statements and financial highlights are the responsibility of the Funds’ management. Our responsibility is to express an opinion on these financial statements and financial highlights based on our audits.
We conducted our audits in accordance with the standards of the Public Company Accounting Oversight Board (United States). Those standards require that we plan and perform the audit to obtain reasonable assurance about whether the financial statements and financial highlights are free of material misstatement. The Funds are not required to have, nor were we engaged to perform, an audit of their internal control over financial reporting. Our audits included consideration of internal control over financial reporting as a basis for designing audit procedures that are appropriate in the circumstances, but not for the purpose of expressing an opinion on the effectiveness of the Funds’ internal control over financial reporting. Accordingly, we express no such opinion. An audit also includes examining, on a test basis, evidence supporting the amounts and disclosures in the financial statements, assessing the accounting principles used and significant estimates made by management, as well as evaluating the overall financial statement presentation. Our procedures included confirmation of securities owned as of December 31, 2012, by correspondence with the transfer agents; where replies were not received from transfer agents, we performed other auditing procedures. We believe that our audits provide a reasonable basis for our opinion.
In our opinion, the financial statements and financial highlights referred to above present fairly, in all material respects, the financial position of each of the Funds as of December 31, 2012, the results of their operations for the year then ended, the changes in their net assets for each of the two years in the period then ended, and the financial highlights for each of the periods presented, in conformity with accounting principles generally accepted in the United States of America.
Deloitte & Touche LLP
Boston, Massachusetts
February 22, 2013
65
Trustees and Officers (Unaudited)
The following table lists the Trust’s Trustees and Officers as of December 31, 2012; their address and age; their position with the Trust; the length of time holding that position with the Trust; their principal occupation(s) during the past five years; the number of portfolios in the fund complex they oversee; and other directorships they hold in companies subject to registration or reporting requirements of the Securities Exchange Act of 1934 (generally called “public companies”) or in registered investment companies. The Trust’s Statement of Additional Information includes additional information about the Trust’s Trustees and is available, without charge, upon request by calling 1-888-309-3539 or by writing MML Series Investment Fund, c/o Massachusetts Mutual Life Insurance Company, 1295 State Street, Springfield, Massachusetts 01111-0001, Attention: Retirement Services Marketing.
Disinterested Trustees
| | | | | | | | | | |
Name, Address*, and Age | | Position(s)
Held with
Trust | | Term of
Office** and
Length of
Time Served | | Principal Occupation(s)
During Past 5 Years | | Number of
Portfolios in
Fund Complex
Overseen by Trustee | | Other Directorships
Held by Trustee |
Richard H. Ayers
Age: 70 | | Chairman Trustee | | Since 2010 Since 1999 | | Retired. | | 91 | | Director (2008-2011), Celera Corporation; Director (1996-2008), Applera Corporation; Chairman (since 2010), Trustee (since 1996), MassMutual Select Funds (open-end investment company); Chairman and Trustee (since 2012), MML Series Investment Fund II (open-end investment company); Chairman and Trustee (since 2012), MassMutual Premier Funds (open-end investment company). |
| | | | | |
Allan W. Blair
Age: 64 | | Trustee | | Since 2003 | | President and Chief Executive Officer (since 1996), Economic Development Council of Western Massachusetts; President and Chief Executive Officer (since 1984), Westover Metropolitan Development Corporation. | | 91 | | Trustee (since 2003), MassMutual Select Funds (open-end investment company); Trustee (since 2012), MML Series Investment Fund II (open-end investment company); Trustee (since 2012), MassMutual Premier Funds (open-end investment company). |
| | | | | |
Nabil N. El-Hage
Age: 54 | | Trustee | | Since 2012 | | Consultant (since 2010); Chairman (since 2011), Academy of Executive Education, LLC; Senior Associate Dean for External Relations (2009-2010), Thomas Henry Carroll Ford Foundation Adjunct Professor of Business Administration (2009-2010), Professor of Management Practice (2005-2009), Harvard Business School. | | 91 | | Director (2007-2010), Virtual Radiologic Corporation; Trustee (since 2012), MassMutual Select Funds (open-end investment company); Trustee (since 2005), Chairman (2006-2012), MML Series Investment Fund II (open-end investment company); Trustee (since 2003), Chairman (2006-2012), MassMutual Premier Funds (open-end investment company). |
| | | | | |
Maria D. Furman
Age: 58 | | Trustee | | Since 2012 | | Retired. | | 91 | | Trustee (since 2011), GMO Series Trust (open-end investment company); Trustee (since 2012), MassMutual Select Funds (open-end investment company); Trustee (since 2005), MML Series Investment Fund II (open-end investment company); Trustee (since 2004), MassMutual Premier Funds (open-end investment company). |
66
Trustees and Officers (Unaudited) (Continued)
| | | | | | | | | | |
Name, Address*, and Age | | Position(s)
Held with
Trust | | Term of
Office** and
Length of
Time Served | | Principal Occupation(s)
During Past 5 Years | | Number of
Portfolios in
Fund Complex
Overseen by Trustee | | Other Directorships
Held by Trustee |
R. Alan Hunter, Jr.
Age: 66 | | Trustee | | Since 2003 | | Retired. | | 91 | | Director (since 2007), Actuant Corporation; Trustee (since 2003), MassMutual Select Funds (open-end investment company); Trustee (since 2012), MML Series Investment Fund II (open-end investment company); Trustee (since 2012), MassMutual Premier Funds (open-end investment company). |
| | | | | |
F. William Marshall, Jr.
Age: 70 | | Trustee | | Since 1996 | | Retired; Consultant (1999-2009). | | 127*** | | Trustee (since 2000), Denver Board – Oppenheimer Funds; Trustee (since 1996), MassMutual Select Funds (open-end investment company); Trustee (since 2012), MML Series Investment Fund II (open-end investment company); Trustee (since 2012), MassMutual Premier Funds (open-end investment company). |
| | | | | |
C. Ann Merrifield
Age: 61 | | Trustee | | Since
2012 | | President and Chief Executive Officer (since 2012), PathoGenetix; Senior Vice President, Genzyme Business Excellence Initiative (2009-2011), President, Biosurgery (2003-2009), Genzyme Corporation. | | 91 | | Trustee (since 2012), MassMutual Select Funds (open-end investment company); Trustee (since 2005), MML Series Investment Fund II (open-end investment company); Trustee (since 2004), MassMutual Premier Funds (open-end investment company). |
| | | | | |
Susan B. Sweeney
Age: 60 | | Trustee | | Since 2009 | | Senior Vice President and Chief Investment Officer (since 2010), Selective Insurance Group (property and casualty company); Senior Managing Director (2008-2010), Ironwood Capital (private equity firm). | | 93^^ | | Trustee (since 2012), Babson Capital Corporate Investors (closed-end investment company); Trustee (since 2012), Babson Capital Participation Investors (closed-end investment company); Trustee (since 2009), MassMutual Select Funds (open-end investment company); Trustee (since 2012), MML Series Investment Fund II (open-end investment company); Trustee (since 2012), MassMutual Premier Funds (open-end investment company). |
67
Trustees and Officers (Unaudited) (Continued)
Interested Trustees
| | | | | | | | | | |
Name, Address*, and Age | | Position(s)
Held with
Trust | | Term of
Office** and
Length of
Time Served | | Principal Occupation(s)
During Past 5 Years | | Number of
Portfolios in
Fund Complex
Overseen by Trustee | | Other Directorships Held by Trustee |
Robert E. Joyal^
Age: 67 | | Trustee | | Since 2003 | | Retired. | | 93^^ | | Director (since 2012), Ormat Technologies, Inc.; Director (since 2006), Jefferies Group, Inc. (investment bank); Director (2007-2011), Scottish Re Group Ltd.; Director (2003-2010), Alabama Aircraft Industries, Inc.; Trustee (since 2003), Babson Capital Corporate Investors (closed-end investment company); Trustee (since 2003), Babson Capital Participation Investors (closed-end investment company); Trustee (since 2003), MassMutual Select Funds (open-end investment company); Trustee (since 2012), MML Series Investment Fund II (open-end investment company); Trustee (since 2012), MassMutual Premier Funds (open-end investment company). |
| | | | | |
Elaine A. Sarsynski^^^
Age: 57 | | Trustee | | Since
2008 | | Executive Vice President (since 2008), MassMutual Retirement Services Division, MassMutual; Chairman, President, and CEO (since 2012), MassMutual International LLC. | | 91 | | Director (since 2012), Horizon Technology Finance Management LLC; Trustee (since 2008), MassMutual Select Funds (open-end investment company); Vice Chairperson (2011-2012), Trustee (since 2011), MML Series Investment Fund II (open-end investment company); Vice Chairperson (2011-2012), Trustee (since 2011), MassMutual Premier Funds (open-end investment company). |
Principal Officers who are Not Trustees
| | | | | | | | |
Name, Address*, and Age | | Position(s) Held
with Trust | | Term of
Office# and
Length of
Time Served | | Principal Occupation(s) During Past 5 Years | | Number of
Portfolios in
Fund Complex
Overseen by Officer |
Richard J. Byrne
Age: 50 | | President | | Since
2007 | | Vice President (since 2007), MassMutual; President (since 2007), MML Series Investment Fund II (open-end investment company). | | 36 |
| | | | |
Michael C. Eldredge
Age: 48 | | Vice President | | Since
2009 | | Vice President (since 2008), MassMutual; Vice President (2005-2008), ING; Vice President (since 2009), MassMutual Select Funds (open-end investment company); Vice President (since 2009), MML Series Investment Fund II (open-end investment company); Vice President (since 2009), MassMutual Premier Funds (open-end investment company). | | 91 |
| | | | |
Andrew M. Goldberg
Age: 46 | | Vice President, Secretary, and
Chief Legal
Officer Assistant Secretary | | Since
2008 (2001-
2008) | | Assistant Vice President and Counsel (since 2004), MassMutual; Vice President, Secretary, and Chief Legal Officer (since 2008), Assistant Secretary (2001-2008), MassMutual Select Funds (open-end investment company); Vice President, Secretary, (formerly known as “Clerk”), and Chief Legal Officer (since 2008), Assistant Clerk (2005-2008), MML Series Investment Fund II (open-end investment company); Vice President, Secretary, (formerly known as “Clerk”), and Chief Legal Officer (since 2008), Assistant Clerk (2004-2008), MassMutual Premier Funds (open-end investment company). | | 91 |
68
Trustees and Officers (Unaudited) (Continued)
| | | | | | | | |
Name, Address*, and Age | | Position(s) Held
with Trust | | Term of
Office# and
Length of
Time Served | | Principal Occupation(s) During Past 5 Years | | Number of
Portfolios in
Fund Complex
Overseen by Officer |
Nicholas H. Palmerino
Age: 47 | | Chief Financial Officer and Treasurer | | Since
2006 | | Assistant Vice President (since 2006), MassMutual; Chief Financial Officer and Treasurer (since 2006), MassMutual Select Funds (open-end investment company); Chief Financial Officer and Treasurer (since 2006), MML Series Investment Fund II (open-end investment company); Chief Financial Officer and Treasurer (since 2006), MassMutual Premier Funds (open-end investment company). | | 91 |
| | | | |
Philip S. Wellman
Age: 48 | | Vice President and Chief Compliance Officer | | Since
2007 | | Vice President, Associate General Counsel, and Chief Compliance Officer (Mutual Funds and Investment Advisory) (since 2008), Vice President, Associate General Counsel, and Chief Compliance Officer (Mutual Funds) (2007-2008), MassMutual; Vice President and Chief Compliance Officer (since 2007), MassMutual Select Funds (open-end investment company); Vice President and Chief Compliance Officer (since 2007), MML Series Investment Fund II (open-end investment company); Vice President and Chief Compliance Officer (since 2007), MassMutual Premier Funds (open-end investment company). | | 91 |
| | | | |
Eric H. Wietsma
Age: 46 | | Vice President | | Since
2006 | | Senior Vice President (since 2010), Corporate Vice President (2007-2010), MassMutual; President (since 2008), Vice President (2006-2008), MassMutual Select Funds (open-end investment company); Vice President (since 2006), MML Series Investment Fund II (open-end investment company); President (since 2008) Vice President (2006-2008), MassMutual Premier Funds (open-end investment company). | | 91 |
| * | The address of each Trustee and Principal Officer is the same as that for the Trust; 1295 State Street, Springfield, Massachusetts 01111. |
| ** | Each Trustee of the Trust serves until the next meeting of shareholders called for the purpose of electing Trustees and until the election and qualification of his or her successor or until he or she dies, resigns, or is removed. Notwithstanding the foregoing, a Trustee shall retire and cease to serve as a Trustee upon the conclusion of the calendar year in which such Trustee attains the age of seventy-two years. |
| | The Chairperson is elected to hold such office for a term of three years or until their successor is elected and qualified to carry out the duties and responsibilities of their office, or until he or she retires, dies, resigns, is removed, or becomes disqualified. |
| *** | Denver Board – Oppenheimer Funds is deemed to be part of the Fund Complex because it is managed by OppenheimerFunds, Inc., an indirect subsidiary of MassMutual. |
| ^ | Mr. Joyal is an “Interested Person,” as that term is defined in the 1940 Act, through his position as a director of Jefferies Group, Inc., a broker-dealer that may execute portfolio transactions and/or engage in principal transactions with the Funds, other investment companies advised by MassMutual or holding themselves out to investors as related companies for purposes of investment or investor services, or any other advisory accounts over which MassMutual has brokerage placement discretion. |
| ^^ | Babson Capital Participation Investors and Babson Capital Corporate Investors are deemed to be a part of the Fund Complex because they are managed by Babson Capital Management LLC, an indirect subsidiary of MassMutual. |
| ^^^ | Ms. Sarsynski is an Interested Person through her employment with MassMutual. |
| # | The President, Treasurer, and Secretary are elected to hold such office until their successor is elected and qualified to carry out the duties and responsibilities of their office, or until he or she dies, resigns, is removed, or becomes disqualified. Each other officer shall hold office at the pleasure of the Trustees. |
69
Federal Tax Information (Unaudited)
For corporate shareholders, a portion of the ordinary dividends paid during the Fund(s)’ year ended December 31, 2012, qualified for the dividends received deduction, as follows:
| | | | |
| |
| | | Dividends Received
Deductions | |
Conservative Allocation Fund | | | 16.07% | |
Balanced Allocation Fund | | | 21.81% | |
Moderate Allocation Fund | | | 26.09% | |
Growth Allocation Fund | | | 42.56% | |
Aggressive Allocation Fund | | | 76.28% | |
American Funds Growth Fund | | | 100.00% | |
American Funds Core Allocation Fund | | | 61.85% | |
70
Other Information (Unaudited)
Proxy Voting
A description of the policies and procedures that each Fund’s investment adviser uses to vote proxies relating to the Fund’s portfolio securities is available, without charge, upon request, by calling 1-888-309-3539, and on the SEC’s website at http://www.sec.gov.
Information regarding how the Funds voted proxies relating to portfolio securities during the most recent 12-month period ended June 30 is available, without charge, upon request, on the MassMutual website at http://www.massmutual.com/funds and on the SEC’s website at http://www.sec.gov.
Quarterly Reporting
The Funds file their complete schedule of portfolio holdings with the SEC for the first and third quarters of each fiscal year on Form N-Q. The Funds’ Forms N-Q are available on the SEC’s website at http://www.sec.gov and may be reviewed and copied at the SEC’s Public Reference Room in Washington D.C. Information on the operation of the SEC’s Public Reference Room may be obtained by calling 1-800-SEC-0330.
71
Other Information (Unaudited) (Continued)
Fund Expenses December 31, 2012
Expense Examples:
The following information is in regards to expenses for the six months ended December 31, 2012:
As a shareholder of the Funds, you incur ongoing costs, including management fees, distribution and/or service (12b-1) fees, and other Fund expenses. These examples are intended to help you understand your ongoing costs (in dollars) of investing in the Funds and to compare these costs with the ongoing costs of investing in other mutual funds. These examples are based on an investment of $1,000 invested for the six months ended December 31, 2012.
Actual Expenses:
The first four columns of the table below provide information about actual account values and actual expenses. You may use this information, together with the amount you invested, to estimate the expenses that you paid over the period. Simply divide your account value by $1,000 (for example, an $8,600 account value divided by $1,000 = 8.6), then multiply the result by the number under the heading entitled “Operating Expenses Incurred” to estimate the expenses you paid on your account during this period.
Hypothetical Example for Comparison Purposes:
The last two columns of the table below provide information about hypothetical account values and hypothetical expenses based on the Fund’s actual expense ratio and an assumed rate of return of 5% per year before expenses, which is not the Fund’s actual return. The hypothetical account values and expenses may not be used to estimate the actual ending account balance or expenses you paid for the period. You may use this information to compare the ongoing costs of investing in the Fund and other funds. To do so, compare this 5% hypothetical example with the 5% hypothetical examples that appear in the shareholder reports of the other funds.
Please note that the expenses shown in the table are meant to highlight your ongoing costs only and do not reflect any transactional costs. Therefore, the last two columns of the table are useful in comparing ongoing costs only, and will not help you determine the relative total costs of owning different funds. In addition, if these transactional costs were included, your costs would have been higher.
| | | | | | | | | | | | | | | | | | | | | | | | |
| | | Beginning
Value | | | Annualized
Expense
Ratio | | | Ending
Value (Based
on Actual
Returns and
Expenses) | | | Operating
Expenses
Incurred* | | | Ending
Value (Based
on
Hypothetical
Returns and
Expenses) | | | Operating
Expenses
Incurred* | |
| Conservative Allocation Fund | | | | | | | | | | | | | | | | | | | | | | | | |
Initial Class | | | 1,000 | | | | 0.13 | % | | | 1,056.30 | | | | 0.68 | | | | 1,024.60 | | | | 0.67 | |
Service Class | | | 1,000 | | | | 0.38 | % | | | 1,054.50 | | | | 1.97 | | | | 1,023.40 | | | | 1.94 | |
| Balanced Allocation Fund | | | | | | | | | | | | | | | | | | | | | | | | |
Initial Class | | | 1,000 | | | | 0.13 | % | | | 1,060.70 | | | | 0.68 | | | | 1,024.60 | | | | 0.67 | |
Service Class | | | 1,000 | | | | 0.38 | % | | | 1,059.80 | | | | 1.98 | | | | 1,023.40 | | | | 1.94 | |
| Moderate Allocation Fund | | | | | | | | | | | | | | | | | | | | | | | | |
Initial Class | | | 1,000 | | | | 0.11 | % | | | 1,065.90 | | | | 0.57 | | | | 1,024.70 | | | | 0.56 | |
Service Class | | | 1,000 | | | | 0.37 | % | | | 1,063.30 | | | | 1.93 | | | | 1,023.40 | | | | 1.89 | |
| Growth Allocation Fund | | | | | | | | | | | | | | | | | | | | | | | | |
Initial Class | | | 1,000 | | | | 0.12 | % | | | 1,072.90 | | | | 0.63 | | | | 1,024.70 | | | | 0.61 | |
Service Class | | | 1,000 | | | | 0.37 | % | | | 1,071.60 | | | | 1.94 | | | | 1,023.40 | | | | 1.89 | |
72
Other Information (Unaudited) (Continued)
| | | | | | | | | | | | | | | | | | | | | | | | |
| | | Beginning
Value | | | Annualized
Expense
Ratio | | | Ending
Value (Based
on Actual
Returns and
Expenses) | | | Operating
Expenses
Incurred* | | | Ending
Value (Based
on
Hypothetical
Returns and
Expenses) | | | Operating
Expenses
Incurred* | |
| Aggressive Allocation Fund | | | | | | | | | | | | | | | | | | | | | | | | |
Initial Class | | | 1,000 | | | | 0.20 | % | | | 1,080.30 | | | | 1.05 | | | | 1,024.30 | | | | 1.02 | |
Service Class | | | 1,000 | | | | 0.45 | % | | | 1,078.60 | | | | 2.36 | | | | 1,023.00 | | | | 2.30 | |
| American Funds Growth Fund | | | | | | | | | | | | | | | | | | | | | | | | |
Service Class I** | | | 1,000 | | | | 1.05 | % | | | 1,087.00 | | | | 5.54 | | | | 1,020.00 | | | | 5.36 | |
| American Funds International Fund | | | | | | | | | | | | | | | | | | | | | | | | |
Service Class I** | | | 1,000 | | | | 1.24 | % | | | 1,127.10 | | | | 6.67 | | | | 1,019.00 | | | | 6.33 | |
| American Funds Core Allocation Fund | | | | | | | | | | | | | | | | | | | | | | | | |
Service Class I | | | 1,000 | | | | 0.72 | % | | | 1,054.70 | | | | 3.74 | | | | 1,021.60 | | | | 3.68 | |
| * | Expenses are calculated using the annualized expense ratio for the six months ended December 31, 2012, multiplied by the average account value over the period, multiplied by the number of days in the period, divided by the number of days in the year, unless stated otherwise. |
| ** | The annualized expense ratio reflects the expenses of both the Feeder Fund and the Master Fund in which it invests. |
73
Distributor
MML Distributors, LLC
1295 State Street
Springfield, MA 01111-0001

© 2013 Massachusetts Mutual Life Insurance Company, Springfield, MA 01111-0001. All rights reserved. www.massmutual.com. MassMutual Financial Group is a marketing name for Massachusetts Mutual Life Insurance Company (MassMutual) and its affiliated companies and sales representatives.
L4540b 113 CRN201303-156807
Item 2. Code of Ethics.
As of December 31, 2012, the Registrant adopted a Code of Ethics that applies to the Principal Executive Officer and Principal Financial Officer pursuant to the Sarbanes-Oxley Act of 2002. For the year ended December 31, 2012, there were no amendments to a provision of the Code of Ethics. A copy of its Code of Ethics is filed with this Form N-CSR under Item 12(a)(1).
Item 3. Audit Committee Financial Expert.
The Registrant’s Board of Trustees has determined that R. Alan Hunter, Jr. and Nabil N. El-Hage, both members of the Audit Committee, are audit committee financial experts as defined by the Securities and Exchange Commission (the “SEC”). Mr. Hunter and Mr. El-Hage are both “independent” as defined by the SEC for purposes of audit committee financial expert determinations.
Item 4. Principal Accountant Fees and Services.
References below to Deloitte & Touche LLP include its affiliates where applicable.
| | (a) | AUDIT FEES: The aggregate fees billed to the Registrant for professional services rendered by its independent auditors, Deloitte & Touche LLP, for the audit of the Registrant’s annual financial statements for 2012 and 2011 were $905,546 and $845,123, respectively. |
| | (b) | AUDIT RELATED FEES: No such fees were billed to the Registrant by Deloitte & Touche LLP for 2012 and 2011. No such fees were billed to the Registrant’s adviser and any entity controlling, controlled by, or under common control with the adviser that provides ongoing services to the Registrant by Deloitte & Touche LLP* for 2012 and 2011. |
| | (c) | TAX FEES: The aggregate fees billed to the Registrant for professional services rendered by Deloitte & Touche LLP for the review of Form 1120-RIC, Form 8613, excise distribution projections, distribution calculation and reasonable out of pocket expenses for 2012 and 2011 were $133,070 and $204,510, respectively. No such fees were billed to the Registrant’s adviser and any entity controlling, controlled by, or under common control with the adviser that provides ongoing services to the Registrant by Deloitte & Touche LLP* for 2012 and 2011. |
| | (d) | ALL OTHER FEES: No such fees were billed to the Registrant by Deloitte & Touche LLP for 2012 and 2011. No such fees were billed to the Registrant’s adviser and any entity controlling, controlled by, or under common control with the adviser that provides ongoing services to the Registrant by Deloitte & Touche LLP* for 2012 and 2011. |
| | (e) | (1) AUDIT COMMITTEE PRE-APPOVAL POLICY: All services to be performed for the Registrant by Deloitte & Touche LLP must be pre-approved by the audit committee. All services performed during 2012 and 2011 were pre-approved by the committee. |
(2) Not applicable.
| | (g) | The aggregate non-audit fees billed by Deloitte & Touche LLP for services rendered to the Registrant, the Registrant’s adviser and any entity controlling, controlled by, or under common control with the adviser that provides ongoing services to the Registrant, for the fiscal years 2012 and 2011 were $4,715,550 and $2,853,248, respectively. |
| | (h) | The audit committee considers whether the provision of non-audit services by Deloitte & Touche LLP to the Registrant’s adviser and any entity controlling, controlled by, or under common control with the adviser that provides ongoing services to the Registrant that were not pre-approved pursuant to paragraph (c)(7)(ii) of Rule 2-01 of Regulation S-X is compatible with maintaining Deloitte & Touche LLP’s independence. |
| | * | Refers to fees that were required to be approved by the audit committee for services that relate directly to the operations and financial reporting of the Registrant. |
Item 5. Audit Committee of Listed Registrants.
Not applicable to this filing.
Item 6. Investments.
Please see portfolio of investments contained in the Reports to Stockholders included under Item 1 of this form N-CSR.
Item 7. Disclosure of Proxy Voting Policies and Procedures for Closed-End Management Investment Companies.
Not applicable to this filing.
Item 8. Portfolio Managers of Closed-End Management Investment Companies.
Not applicable to this filing.
Item 9. Purchases of Equity Securities by Closed-End Management Investment Company and Affiliated Purchasers.
Not applicable to this filing.
Item 10. Submission of Matters to a Vote of Security Holders.
Not applicable to this filing.
Item 11. Controls and Procedures.
(a) The Registrant’s Principal Executive Officer and Principal Financial Officer have concluded that the Registrant’s disclosure controls and procedures (as defined in Rule 30a-3(c) under the Investment Company Act of 1940, as amended (the “1940 Act”) (17 CFR 270.30a-3(c))) are effective, as of a date within 90 days of the filing date of this Form N-CSR, to provide reasonable assurance that the information required to be disclosed by the Registrant on Form N-CSR is recorded, processed, summarized, and reported within the time periods specified in the SEC’s rules and forms, based on their evaluation of these disclosure controls and procedures required by Rule 30a-3(b) under the 1940 Act (17 CFR 270.30a-3(b)) and Rules 13a-15(b) or 15d-15(b) under the Securities Exchange Act of 1934 (17 CFR 240.13a-15(b) or 240.15d-15(b)).
(b) There were no changes in the Registrant’s internal control over financial reporting (as defined in Rule 30a-3(d) under the 1940 Act (17 CFR 270.30a-3(d))) that occurred during the Registrant’s most recent fiscal quarter that has materially affected, or is reasonably likely to materially affect, the Registrant’s internal control over financial reporting.
Item 12. Exhibits.
(a)(1) Code of Ethics (Item 2) is attached.
(a)(2) Certifications of the Principal Executive Officer and Principal Financial Officer of the Registrant as required by Rule 30a-2(a) under the 1940 Act (17 CFR 270.30a-2(a)) are attached hereto as Exhibit 99CERT.
(a)(3) Not applicable to this filing.
(b) Certifications pursuant to Section 906 of the Sarbanes-Oxley Act of 2002 as required by Rule 30a-2(b), under the 1940 Act (17 CFR 270.30a-2(b)), Rule 15d-14(b) under the Securities Exchange Act of 1934 (17 CFR 240.15d-14(b)) and Section 1350 of Chapter 63 of Title 18 of the United States Code (18 U.S.C. 1350) are attached hereto as Exhibit 99.906CERT.
SIGNATURES
Pursuant to the requirements of the Securities Exchange Act of 1934 and the Investment Company Act of 1940, the registrant has duly caused this report to be signed on its behalf by the undersigned, thereunto duly authorized.
| | | | | | | | |
| (Registrant) | | MML Series Investment Fund |
| | | | |
| |
| By (Signature and Title) | | /s/ Richard J. Byrne |
| | | | | | |
| | | | | | Richard J. Byrne, President and Principal Executive Officer |
| | |
| Date | | 3/1/13 | | |
| | | | |
Pursuant to the requirements of the Securities Exchange Act of 1934 and the Investment Company Act of 1940, this report has been signed below by the following persons on behalf of the registrant and in the capacities and on the dates indicated.
| | | | | | |
| By (Signature and Title) | | /s/ Richard J. Byrne |
| | | | |
| | | | Richard J. Byrne, President and Principal Executive Officer |
| | |
| Date | | 3/1/13 | | |
| | | | |
| |
| By (Signature and Title) | | /s/ Nicholas H. Palmerino |
| | | | |
| | | | Nicholas H. Palmerino, Treasurer and Principal Financial Officer |
| | |
| Date | | 3/1/13 | | |
| | | | |