UNITED STATES
SECURITIES AND EXCHANGE COMMISSION
Washington, D.C. 20549
FORM N-CSR
CERTIFIED SHAREHOLDER REPORT OF REGISTERED
MANAGEMENT INVESTMENT COMPANIES
Investment Company Act file number 811-02224
|
| MML Series Investment Fund |
(Exact name of registrant as specified in charter)
|
| 1295 State Street, Springfield, MA 01111 |
(Address of principal executive offices) (Zip code)
|
Richard J. Byrne 1295 State Street, Springfield, MA 01111 |
(Name and address of agent for service)
Registrant’s telephone number, including area code: 413-788-8411
Date of fiscal year end: 12/31/2010
Date of reporting period: 12/31/2010
Item 1. Reports to Stockholders.
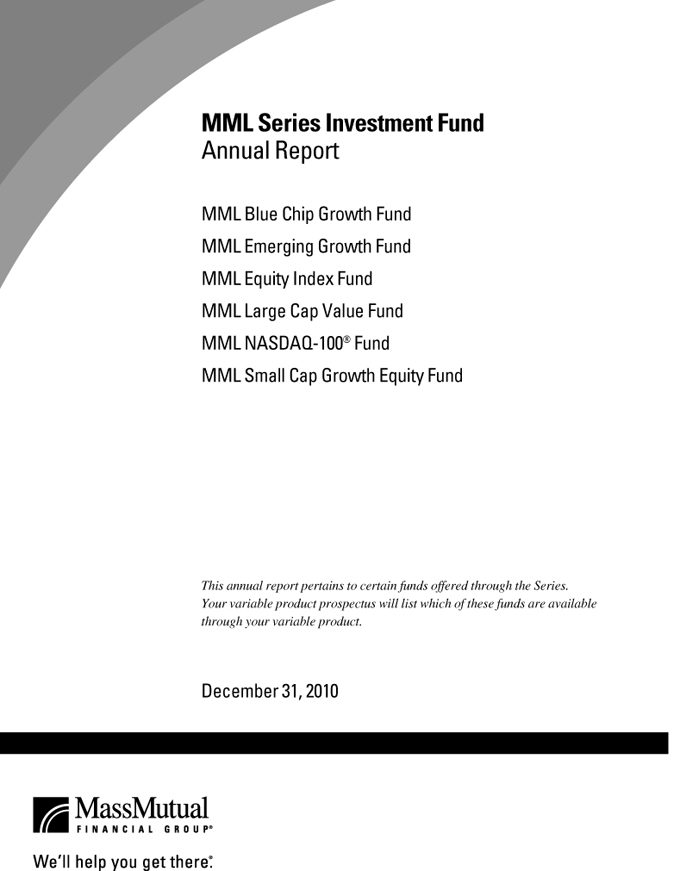
Table of Contents
This material must be preceded or accompanied by a current prospectus (or summary prospectus, if available) for the MML Series Investment Fund. Investors should consider a Fund’s investment objective, risks and charges and expenses carefully before investing. This and other information about the investment company is available in the prospectus (or summary prospectus, if available). Read it carefully before investing.
MML Series Investment Fund – President’s Letter to Shareholders
To Our Shareholders

Richard J. Byrne
“MassMutual’s view is that a retirement investment plan tailored to your time horizon and your tolerance for risk can help you navigate short-term gyrations in the markets. By monitoring your plan regularly and adjusting your retirement planning strategy when appropriate, you can help yourself as you pursue your long-term financial objectives.”
December 31, 2010
Cautious optimism emerges as recovery continues
I am pleased to present you with the MML Series Investment Fund Annual Report, covering the year ended December 31, 2010. Equity markets worldwide advanced during this period (some in the double digits), yet volatility continued to be a factor. Investors in the U.S. and abroad repeatedly demonstrated how connected we all are to the global economy in this modern era, driving U.S. and foreign markets up and down in reaction to the latest news events and economic data from around the world. Despite generally improving market conditions, economic challenges remained for most of the countries where markets advanced. But investors in the U.S. found reason for optimism, as several economic indicators in December pointed to possible signs of sustained recovery.
Retirement investing is a long-term proposition
If you work with a financial professional, you may wish to consider contacting him or her to help you evaluate and fine-tune your overall investment strategy. This can be an effective way to help ensure that you are on the right path toward your long-term investment objectives.
The market environment we witnessed in 2010 should remind us that investing for retirement is a long-term proposition – despite whatever changes or events may occur in the short term. The markets are cyclical, and investors who realized this and stayed the course over the past few years were rewarded in 2010. The major equity markets in the U.S. advanced in 2010, with a similar scenario playing out in many markets abroad.
One reason why financial professionals typically believe it is important to stay invested through all market conditions can be seen in the five-year performance history of the S&P 500® Index1 (the “S&P 500”), a widely used measure of large-cap stock performance in the U.S. On January 3, 2006, the S&P 500 closed at 1268.80. As you may recall, stock prices dropped significantly, beginning in late 2007 and through early 2009. On March 9, 2009, the S&P 500 closed at 676.53, its lowest level over the five years. Yet, by market close on December 31, 2010, the S&P 500 was back up to 1257.64. Consequently, investors in large-cap U.S. stocks who remained invested throughout this period likely benefited from the market recovery that began in March 2009. Conversely, those who “cashed out” of these stocks during the market downturn locked in their losses and did not participate in the recovery rally.
Keep these basic ideas in mind
| • | | Retirement investing is different. Investing for retirement is not like saving or investing for short-term needs, such as a vacation or a new car. The longer time that many retirement investors have to invest may give them an advantage over individuals with a shorter time frame to work with. |
| • | | Invest regularly and boost your contribution rate. Contributing to your retirement account on a regular basis can help you to buy more shares or units of an investment when its price is lower and fewer shares or units when its price is higher.2 Boosting your contribution rate periodically (even by a small amount), over time, may help you increase the amount of money in your account as retirement approaches. |
| 1 | Indexes are unmanaged, do not incur fees or expenses and cannot be purchased directly for investment. |
| 2 | Systematic investing and asset allocation do not ensure a profit or protect against loss in a declining market. Systematic investing involves continuous investment in securities regardless of fluctuating price levels. Investors should consider their ability to continue investing through periods of low price levels. |
1
MML Series Investment Fund – President’s Letter to Shareholders (Continued)
| • | | Choose investments that work for you and monitor your account regularly. No one knows your financial goals and objectives better than you. So be sure to select the stock, bond and short-term/money market investments that you feel will help you reach your goals. One of the greatest advantages you have when you diversify your investment choices is that these three distinct investment types tend to behave differently under various economic conditions. Consequently, many financial professionals hold the view that individuals can help reduce their risk of overexposure to one or two poorly performing investment types by diversifying across multiple types. |
Keep your eye on the future and stay current with your plan
We believe doing business with MassMutual is the sign of a good decision – as is focusing on the long term when it comes to planning for retirement. As you can see from the S&P 500 example noted above, short-term changes in the markets don’t necessarily have to result in a long-term impact on your retirement account. MassMutual’s view is that a retirement investment plan tailored to your time horizon and your tolerance for risk can help you navigate short-term gyrations in the markets. By monitoring your plan regularly and adjusting your retirement planning strategy when appropriate, you can help yourself as you pursue your long-term financial objectives.
As always, thank you for your confidence and trust in MassMutual.
Sincerely,

Richard J. Byrne
President
The information provided is the opinion of MassMutual Retirement Services Investment Services as of 1/1/11 and is subject to change without notice. It is not to be construed as tax, legal or investment advice. Of course, past performance does not guarantee future results.
2
MML Series Investment Fund – Economic and Market Review
December 31, 2010
A challenging year, with emerging signs of recovery
The turnaround in the financial markets that began in March 2009 continued during the year ended December 31, 2010, although there were numerous – and some significant – bumps along the way. The stock market in the United States was largely positive throughout the year, despite notable periods of underperformance. Foreign equity markets also overcame difficulties and did well overall, despite generally lagging their U.S. counterparts. Many of the debt-related problems that had plagued some of the more highly leveraged countries in the euro zone (particularly Greece and Ireland) underwent short-term resolution through government intervention, but European debt issues continued to hinder the investing environment as the period ended.
The U.S. dollar remained strong throughout much of the year, although late in the period, investor fears over the Federal Reserve’s (the “Fed”) announced purchase of U.S. Treasury bonds caused the dollar to weaken – against the backdrop of an ongoing run-up in commodity (specifically, gold and oil) prices, which commonly occurs when the dollar declines in value. Crude oil finished the year at roughly $91 per barrel (versus $79 on December 31, 2009) and gold continued to trade higher, closing the year at approximately $1,422 per ounce (versus $1,096 on December 31, 2009).
Key pieces of legislation passed in the year included health care reform (March), which did not have much of an immediate impact on the markets, and the extension of the Bush-era income-tax cuts (December), which linked a two-year extension of the Bush tax cuts (initially signed into law in 2001, but slated to expire without Congressional action on December 31, 2010) to a one-year extension of unemployment benefits and other aid to middle-income earners. Also in politics, the mid-term elections delivered a Republican majority in the U.S. House of Representatives, but the U.S. Senate continued to hold a Democratic majority.
The Fed kept interest rates low, holding the federal funds rate at 0.0% to 0.25%, in its continued focus on stimulating the economy. The federal funds rate is the interest rate that banks and other financial institutions charge each other for borrowing funds overnight.
Certain economic indicators were troubling during the period and seemed mainly to show more bad news than good until the end of the year, when some bright spots appeared on the horizon. Indeed, December economic reports indicated that consumer confidence rose, initial jobless claims fell, and Gross Domestic Product (“GDP”) for the third quarter of the year was revised to reflect a gain of 2.6%, after an initial estimated advance of 2.0%. GDP reflects the total value of goods and services produced in the United States.
Market performance
Both bonds and equities advanced for the 12-month period ended December 31, 2010, although stocks generally outperformed their fixed-income counterparts. The Dow Jones Industrial AverageSM (the “Dow”), a well-known measure of blue-chip stock performance, advanced 11.02%. In a similar fashion, the S&P 500® Index of U.S. large-cap stocks returned 15.06%. The small-cap Russell 2000® Index outpaced both of the aforementioned indexes, with a return of 26.85% for the period. The barometer for technology stocks, the NASDAQ Composite® Index, posted a 16.91% return for the period. Performance was also positive in worldwide equity markets. The MSCI® EAFE® Index, a benchmark for foreign stocks in developed markets, advanced 7.75%. The foreign market winner, however, was the MSCI Emerging Markets Index, a benchmark that represents the performance of emerging stock markets throughout the world, which advanced 18.88%.
Fixed-income investments generally trailed their equity counterparts during the 12-month period. The Barclays Capital U.S. Aggregate Bond Index, a broad measure of the U.S. investment-grade bond markets, gained 6.54%. Treasury bills gained just 0.13%. The outstanding performer in the fixed-income arena was the Barclays Capital U.S. Corporate High Yield Index, a measure of the performance of fixed-rate, non-investment-grade debt from corporate sectors, which advanced 15.12%. Conversely, the Barclays Capital U.S. 1-3 Year Government Bond Index, which measures the performance of short-term U.S. government bonds, returned 2.40%.*
| * | Indexes are unmanaged, do not incur fees or expenses and cannot be purchased directly for investment. |
3
MML Series Investment Fund – Economic and Market Review (Continued)
First quarter of 2010: A ‘mixed’ start to the year
Despite struggling in January and into the early part of February, the U.S. stock market turned in a solid performance during the first three months of 2010. In the bond market, yields of U.S. Treasury securities were lower, and prices higher, for most of the first quarter. Bond prices move in the opposite direction of interest rates (or yields); when yields rise, the prices of existing bonds fall – and vice versa.
Concerns over the sovereign debt problems of Greece, Portugal, Italy, Ireland, and Spain hindered U.S. and foreign stock performance early in the quarter, but efforts by the European Union to find a sustainable solution helped the markets rally in February and March. These debt concerns increased the attractiveness of the U.S. dollar, which rose against the euro and other key foreign currencies.
Financial news for the quarter was decidedly mixed. On the positive side, the final estimate for fourth-quarter 2009 GDP came in at a healthy 5.6%, and fourth-quarter 2009 corporate earnings benefited from aggressive cost-cutting and favorable comparisons with the weak fourth quarter of 2008. Unemployment, at 9.7% for February, remained stubbornly high, and the residential real estate market remained hampered by a large supply of homes for sale, weak demand and widespread borrower defaults. On the bright side, U.S. corporate earnings reports were generally strong.
Second quarter of 2010 marred by stock market downturn, mixed economic indicators
U.S. and foreign stock markets pulled back sharply during the second quarter of 2010 – after a vigorous rally that had lasted more than 13 months. This selloff was largely due to deepening fears about the European debt crisis as well as growing concerns about a possible double-dip recession in the United States. The April 20 explosion of the BP-licensed Deepwater Horizon oil-drilling rig and the resulting oil spill contributed to the uncertainty of the economic environment and held the media’s attention until the spill was stopped and the well capped later in the summer. May was especially challenging, with most of the major indexes giving up substantial ground. May 6 was particularly memorable, when the Dow, down more than 300 points already for the day, dropped more than 600 additional points and recovered most of the additional loss in about 20 minutes in what was subsequently termed a “flash crash” by market pundits (due to the market’s quick descent and recovery). The flash crash set a Dow record for the largest-ever intraday decline: almost 1,000 points.
During this period, bonds responded well to signs that the U.S. economy might be facing slower growth than previously expected. Treasury yields dropped sharply and prices posted healthy advances, with the largest gains occurring in longer maturities. The U.S. dollar continued to appreciate, and emerging markets equities suffered shallower declines than most developed markets. Economic data releases pointed to a still-expanding, but fragile, U.S. economy. In June, the third and final estimate of GDP growth for the first quarter was revised downward to 2.7% from 3.0%. Also noteworthy was the unemployment rate, which remained at 9.7%.
Third quarter of 2010: Stocks rebound; recession officially ‘ends’
U.S. stocks delivered solid gains in the third quarter of 2010, although the up-down-up pattern of the major indexes left many investors perplexed. Solid second-quarter earnings and economic reports that were not as bad as expected helped fuel the advance. Bond prices rose, and yields of U.S. Treasury securities continued the precipitous decline that began in April, taking the yield of the bellwether 10-year note from 2.97% at the end of the second quarter down to 2.53% at the end of the third quarter. The yield of the 10-year note is an important factor in determining mortgage rates, so the historically low rates drove significant mortgage refinancing activity.
The U.S. economy had expanded in the second quarter of 2010, but at a slower pace than in the first quarter, so the Commerce Department’s final estimate of second-quarter GDP released in the third quarter was a tepid 1.7% on an annualized basis. The third quarter’s report on unemployment, released at the beginning of September, revealed a jobless rate of 9.6%. Concern about the euro zone’s sovereign debt crisis eased further, as Spain’s issuance of 6 billion euros of debt at the beginning of July met strong demand and offered better-than-expected pricing. The U.S. dollar weakened against most key developed market currencies. Finally, in September, the National Bureau of Economic Research issued a statement identifying June 2009 as the end of the Great Recession (which began in December 2007) – a conclusion that was questioned by many, since so many economic problems remained unresolved.
4
MML Series Investment Fund – Economic and Market Review (Continued)
Fourth quarter of 2010: Signs of recovery continue
The stock market continued its upward march in the final quarter of the year – although November proved challenging for most domestic equities. Equity markets regained momentum in December; all broad domestic stock indexes advanced for the quarter and turned in double-digit returns for the full year. Conversely, bonds struggled during the fourth quarter of 2010. After falling precipitously for much of the year, yields in the Treasury market reversed course and surged higher from early October through mid-December, pressuring bond prices. For example, the yield of the bellwether 10-year Treasury note rose from 2.52% to 3.31% during the quarter. As a result, most bond indexes finished the quarter with losses, with the longer maturities suffering the most. Losses in corporate bonds were cushioned somewhat by growing optimism about the U.S. economy and corporate profits. High-yield bonds, which tend to correlate more with the fortunes of the issuing company or the issuer’s industry, rather than interest rates, managed solid gains for the quarter.
Although the extension of the Bush-era tax cuts passed by Congress in December – a legislative package estimated to be worth $858 billion – undoubtedly helped the stock market to finish the year on a positive note, it may also be that the Fed’s decision to engage in another round of quantitative easing – referred to as “QE2” – was the main driver of the financial markets during the second half of 2010.
Formally announced on November 3, 2010, QE2 included plans for the Fed to purchase $600 billion of longer-term Treasuries, at a pace of roughly $75 billion per month, by the end of the second quarter of 2011. The plan also called for the reinvestment of $250 billion to $300 billion of proceeds from earlier investments. The stated goal of QE2, as characterized in the Fed’s minutes released on November 3, was to “promote a stronger pace of economic recovery and to help insure that inflation, over time, is at levels consistent with [the Fed’s] mandate.”
While 2010 ended on a positive note, the U.S. economy must still prove itself in 2011. Specifically, investors will be watching to see if the economy can generate enough momentum to meaningfully reduce unemployment and begin to heal the battered residential real estate market. For long-term investors, as always, the challenge is staying disciplined amid constantly shifting markets and avoiding the temptation to buy or sell based on short-term developments.
The information provided is the opinion of MassMutual Retirement Services Investment Services as of 1/1/11 and is subject to change without notice. It is not to be construed as tax, legal or investment advice. Of course, past performance does not guarantee future results.
5
MML Blue Chip Growth Fund – Portfolio Manager Report
What is the investment approach of MML Blue Chip Growth Fund, and who is the Fund’s subadviser?
The Fund seeks long-term capital growth. Income is a secondary objective. Under normal circumstances, the Fund invests at least 80% of its net assets in the common stocks of large- and medium-sized blue chip growth companies. The Fund’s subadviser currently defines blue chip growth companies to mean firms that, in its view, are well-established in their industries and have the potential for above-average earnings growth. The Fund’s subadviser is T. Rowe Price Associates, Inc. (T. Rowe Price).
How did the Fund perform during the 12 months ended December 31, 2010?
The Fund’s Initial Class shares returned 16.17%, modestly trailing the 16.71% return of the Russell 1000® Growth Index (the “benchmark”), an unmanaged index consisting of those Russell 1000 securities (representing the 1,000 largest U.S. companies based on market capitalization) with greater than average growth orientation that tend to exhibit higher price-to-book ratios and higher forecasted growth rates than securities in the value universe. Conversely, the Fund outperformed the 15.06% return of the S&P 500® Index, a widely recognized, unmanaged index representative of common stocks of larger capitalized U.S. companies.
For a discussion on the economic and market environment during the 12-month period ended December 31, 2010, please see the Economic and Market Review, beginning on page 3.
Subadviser discussion of factors that contributed to the Fund’s performance
Sector weighting was the primary reason for the Fund’s strong absolute performance in 2010, but stock selection was also positive. The information technology (“IT”), consumer discretionary, and energy sectors were the leading relative outperformers. The financials and materials sectors were primary relative detractors.
The Fund’s results in the IT sector benefited from strong stock selection. Apple, the top absolute portfolio contributor, experienced sales growth in all three major products (iPhones, iPods, and Macs) and appeared, at year-end, poised to benefit strongly from the new iPad. The share price of Baidu, operator of China’s most popular Web site, more than doubled on continued earnings growth, benefiting from the effective withdrawal of Google from the Chinese market. Baidu is the dominant search engine in the world’s largest Internet market. Limiting exposure to several significant benchmark holdings that underperformed, such as Cisco Systems, Hewlett-Packard, and Microsoft, also aided the Fund’s performance, relative to the benchmark.
The portfolio’s overweight position in the consumer discretionary sector, relative to the benchmark, also contributed to performance. Marriott, the largest U.S. hotel chain, benefited from a rebound in travel after occupancies hit a 30-year low in 2009. The company turned a profit in the third quarter of 2010 and announced plans to increase the number of rooms, including a significant increase in Brazil. Shares of Starbucks rose steadily on continuing stronger sales. In addition to improving sales in the United States, the coffee chain showed potential for notable international growth, announcing that it would triple the number of stores in China over five years. Amazon.com continued to outperform, due to strong earnings results and a positive impact from the introduction of a new version of its Kindle eReader. The company continued to gain Internet retail market share, as Internet retailers continued to acquire market share at the expense of traditional retailers.
The Fund’s energy position outperformed on stock selection, offsetting an unfavorable underweighting in the strong-performing sector. Schlumberger, the global oilfield services firm, was a top absolute portfolio contributor.
On the downside, the financials sector was by far the Fund’s biggest relative detractor in 2010, largely due to stock selection. Investment banker Goldman Sachs suffered from charges related to its mortgage securities sales. Shares fell sharply after the U.S. Securities and Exchange Commission filed fraud charges against the firm. Consequently, the portfolio reduced its position in the stock. Sector results were also negatively affected by portfolio holdings in bank stocks. Banks are facing regulatory challenges and net interest margins are squeezed by the low interest rate environment.
Subadviser outlook
For 2011, we hold a modestly positive view of the equities market. In our view, earnings and cash flow should improve, boosting investor confidence and thus strengthening equity markets. We are particularly focused on exposure to companies positioned to
6
MML Blue Chip Growth Fund – Portfolio Manager Report (Continued)
benefit from high overseas exposure to emerging markets, as we expect economic growth in these areas to outpace growth in developed markets. There is also a good chance for multiple expansions in U.S. equities, as cash sitting on the sidelines is reallocated back into stocks. The Fund is poised to capitalize on the improving market environment, with overweight investments in the consumer discretionary, industrials, and business services sectors.
| | | | |
MML Blue Chip Growth Fund
Largest Holdings
(% of Net Assets) on 12/31/10
(Unaudited) | |
| | |
Apple, Inc. | | | 7.3 | % |
Google, Inc. Class A | | | 5.4 | % |
Amazon.com, Inc. | | | 4.7 | % |
Danaher Corp. | | | 3.4 | % |
Schlumberger Ltd. | | | 2.9 | % |
Franklin Resources, Inc. | | | 2.1 | % |
Praxair, Inc. | | | 1.9 | % |
Express Scripts, Inc. | | | 1.9 | % |
QUALCOMM, Inc. | | | 1.9 | % |
Starbucks Corp. | | | 1.7 | % |
| | | | | |
| | | | 33.2 | % |
| | | | | |
| | | | |
MML Blue Chip Growth Fund
Sector Table
(% of Net Assets) on 12/31/10
(Unaudited) | |
| | |
Communications | | | 23.4 | % |
Consumer, Cyclical | | | 15.5 | % |
Technology | | | 13.7 | % |
Industrial | | | 13.4 | % |
Consumer, Non-cyclical | | | 11.2 | % |
Financial | | | 10.8 | % |
Energy | | | 7.9 | % |
Basic Materials | | | 3.8 | % |
Mutual Funds | | | 0.0 | % |
| | | | | |
Total Long-Term Investments | | | 99.7 | % |
Short-Term Investments and Other Assets and Liabilities | | | 0.3 | % |
| | | | | |
Net Assets | | | 100.0 | % |
| | | | | |
7
MML Blue Chip Growth Fund – Portfolio Manager Report (Continued)
Growth of a $10,000 Investment
Hypothetical Investments in MML Blue Chip Growth Fund Initial Class, the Russell 1000 Growth Index and the S&P 500 Index.
| | | | | | | | |
| | | |
| TOTAL RETURN | | One Year 1/1/10- 12/31/10 | | | Since
Inception
Average
Annual 5/1/06 -
12/31/10 | |
| Initial Class | | | 16.17% | | | | 2.79% | |
Russell 1000 Growth Index* | | | 16.71% | | | | 3.38% | |
| S&P 500 Index | | | 15.06% | | | | 1.27% | |
Hypothetical Investments in MML Blue Chip Growth Fund Service Class, the Russell 1000 Growth Index and the S&P 500 Index.
| | | | | | | | |
| | | |
| TOTAL RETURN | | One Year 1/1/10- 12/31/10 | | | Since
Inception
Average
Annual 8/15/08 -
12/31/10 | |
| Service Class | | | 15.91% | | | | 2.07% | |
Russell 1000 Growth Index* | | | 16.71% | | | | 3.90%+ | |
| S&P 500 Index | | | 15.06% | | | | 1.47%+ | |
GROWTH OF $10,000 INVESTMENT SINCE INCEPTION

* Benchmark
+ From 9/2/08.
Performance data quoted represents past performance; past performance is not predictive of future results. The investment return and principal value of shares of the Fund will fluctuate with market conditions so that shares of the Fund, when redeemed, may be worth more or less than their original cost. Current performance of the Fund may be lower or higher than the performance quoted. Performance data current to the most recent month end may be obtained by accessing the website www.massmutual.com.
Investors should note that the Fund is a professionally managed mutual fund, while the Russell 1000 Growth Index and the S&P 500 Index are unmanaged, do not incur expenses, and cannot be purchased directly by investors. Investors should read the Fund’s prospectus with regard to the Fund’s investment objective, risks and charges and expenses in conjunction with these financial statements. The Fund’s return reflects changes in the net asset value per share without the deduction of any product charges (e.g., cost of insurance, mortality and expense risk charges, administrative fees, and CDSL). The inclusion of these charges would have reduced the performance shown here.
8
MML Emerging Growth Fund – Portfolio Manager Report
What is the investment approach of MML Emerging Growth Fund, and who is the Fund’s subadviser?
The Fund seeks capital appreciation by investing primarily in smaller, rapidly growing emerging growth companies, which may include companies growing earnings per share and/or revenues at above average rates. Under normal circumstances, the Fund will invest at least 80% of its net assets in equity securities (primarily common stocks) of emerging growth companies. Effective August 20, 2010, Insight Capital Research & Management, Inc. (Insight Capital) was removed as co-subadviser to the Fund, leaving Essex Investment Management Company, LLC (Essex) as the sole subadviser of the Fund.
How did the Fund perform during the 12 months ended December 31, 2010?
The Fund’s Initial Class shares returned 25.26%, underperforming the 29.09% return of the Russell 2000® Growth Index (the “benchmark”), a widely recognized, unmanaged index that measures the performance of those Russell 2000 Index companies (representing small-capitalization U.S. common stocks) with higher price-to-book ratios and higher forecasted growth rates than securities in the value universe.
For a discussion on the economic and market environment during the 12-month period ended December 31, 2010, please see the Economic and Market Review, beginning on page 3.
Subadviser discussion of factors that contributed to the Fund’s performance
From Essex, which subadvised the Fund for all of 2010:
Although industrials lagged at the beginning of 2010, an improved global economic outlook led to a return of confidence in industrial stocks. Notably, the portfolio posted strong gains in industrial holdings connected to growth in the alternative energy market, including Power-One, Inc., which provides renewable energy and energy-efficient power conversion and management solutions. Adding significant value to the portfolio’s full-year performance was stock selection in producer durables, which benefited from alternative energy and mining exposure, as well as merger and acquisition (M&A) activity within the sector. The portfolio lagged the benchmark early in the year in the materials sector, but gained ground in the second half of 2010, thanks to stock selection within the sector. For example, Interface, Inc. was a bright spot, with increased demand for the company’s carpeting tiles boosting the stock.
Despite a difficult second quarter following the Gulf oil spill, energy shares posted robust gains in the second half of the year on strong oil prices. The portfolio’s traditional energy holdings added value, although alternative energy and natural gas-exposed names were detractors. Alternative energy returns were weak early in the period, as investors worried about changes to government subsidies. Technology posted market-leading returns during the year, as investors cheered strong demand trends and acquisition activity in the sector. The portfolio’s underweight position, relative to the benchmark, in the energy sector dampened returns; however, and strong selection in communications technology was outweighed by mixed returns in software.
The health care sector was challenged during the year, weighed down by reform uncertainty and the mid-term congressional elections. However, the portfolio outperformed the benchmark in the health care sector, thanks to stock selection that focused on companies with solid fundamentals and positive product cycles. Consumer discretionary posted solid returns for the year, with a second-quarter slowdown trumped by a strong second half, which was driven by increasingly optimistic expectations for consumer spending. Finally, the portfolio outperformed the benchmark in retail, but lost ground, relative to the benchmark, in the consumer services segment.
From Insight Capital, which co-subadvised the Fund from January 1 – August 19, 2010:
Earlier in 2010, positive reactions to strong earnings revisions resulted in the most significant contributions to the portfolio’s performance. Advancing stocks included Lululemon Athletica (which designs and develops innovative athletic apparel) and SXC Health Solutions, a pharmacy benefit manager that taps into a wide cross-section of markets. Conversely, the portfolio experienced disappointing performance from a few positions – the most notable being DragonWave, which develops and sells microwave backhaul solutions for wireless network operators.
As 2010 progressed, positive reactions to strong earnings revisions was a significant performance driver, with individual contributions coming from Acme Packet, a leading telecommunications equipment vendor with little true competition within its market segment; and Cirrus Logic, which produces high-precision analog and mixed-signal integrated circuits for audio and
9
MML Emerging Growth Fund – Portfolio Manager Report (Continued)
energy markets (its largest customer is Apple). On the other hand, disappointing performance came from portfolio holdings such as Northern Oil & Gas (an independent oil and natural gas exploration company) and Power-One.
Subadviser outlook
We believe the advancement set forth by the Federal Reserve’s second round of monetary easing in the fourth quarter of 2010 will be strengthened by continued expansion in lending. As interest rates continue to move upward, we expect a continuation in the shift to equities as investors look for higher rates of return. While our view is that high unemployment and the threat of inflation from rising commodity prices will keep financial markets on edge, further easing in financials, along with M&A activity, should remain key drivers for stock prices in 2011.
| | | | |
MML Emerging Growth Fund
Largest Holdings
(% of Net Assets) on 12/31/10
(Unaudited) | |
| | |
Blackboard, Inc. | | | 2.5 | % |
PAREXEL International Corp. | | | 2.4 | % |
Ulta Salon Cosmetics & Fragrance, Inc. | | | 2.3 | % |
Wabtec Corp. | | | 2.3 | % |
Kaydon Corp. | | | 2.2 | % |
Acme Packet, Inc. | | | 2.1 | % |
HEALTHSOUTH Corp. | | | 2.0 | % |
Titan International, Inc. | | | 1.9 | % |
SINA Corp. | | | 1.9 | % |
Intrepid Potash, Inc. | | | 1.9 | % |
| | | | | |
| | | | 21.5 | % |
| | | | | |
| | | | |
MML Emerging Growth Fund
Sector Table
(% of Net Assets) on 12/31/10
(Unaudited) | |
| | |
Consumer, Non-cyclical | | | 24.6 | % |
Industrial | | | 18.2 | % |
Technology | | | 12.9 | % |
Communications | | | 12.9 | % |
Consumer, Cyclical | | | 12.4 | % |
Energy | | | 8.1 | % |
Basic Materials | | | 3.7 | % |
Financial | | | 3.3 | % |
| | | | | |
Total Long-Term Investments | | | 96.1 | % |
Short-Term Investments and Other Assets and Liabilities | | | 3.9 | % |
| | | | | |
Net Assets | | | 100.0 | % |
| | | | | |
| | | | |
MML Emerging Growth Fund
Country Weightings
(% of Net Assets) on 12/31/10
(Unaudited) | |
| | |
United States | | | 87.6 | % |
Cayman Islands | | | 5.0 | % |
Canada | | | 2.6 | % |
Bermuda | | | 0.9 | % |
| | | | | |
Total Long-Term Investments | | | 96.1 | % |
Short-Term Investments and Other Assets and Liabilities | | | 3.9 | % |
| | | | | |
Net Assets | | | 100.0 | % |
| | | | | |
10
MML Emerging Growth Fund – Portfolio Manager Report (Continued)
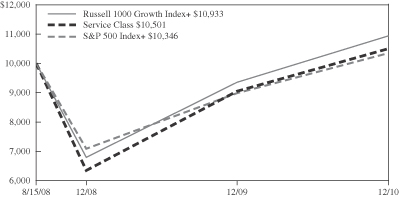
Growth of a $10,000 Investment
Hypothetical Investments in MML Emerging Growth Fund Initial Class and the Russell 2000 Growth Index.
| | | | | | | | | | | | |
| | | | |
| TOTAL RETURN | | One Year 1/1/10 -
12/31/10 | | | Five
Year
Average
Annual 1/1/06 -
12/31/10 | | | Ten
Year
Average
Annual 1/1/01 -
12/31/10 | |
| Initial Class | | | 25.26% | | | | 0.27% | | | | -1.93% | |
| Russell 2000 Growth Index | | | 29.09% | | | | 5.30% | | | | 3.78% | |
Hypothetical Investments in MML Emerging Growth Fund Service Class and the Russell 2000 Growth Index.
| | | | | | | | |
| | | |
| TOTAL RETURN | | One Year 1/1/10 -
12/31/10 | | | Since
Inception
Average
Annual 8/15/08 -
12/31/10 | |
| Service Class | | | 24.95% | | | | -4.58% | |
| Russell 2000 Growth Index | | | 29.09% | | | | 4.86%+ | |
GROWTH OF $10,000 INVESTMENT FOR PAST TEN YEARS
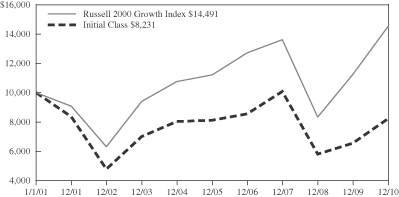
GROWTH OF $10,000 INVESTMENT SINCE INCEPTION
+ From 9/2/08.
Performance data quoted represents past performance; past performance is not predictive of future results. The investment return and principal value of shares of the Fund will fluctuate with market conditions so that shares of the Fund, when redeemed, may be worth more or less than their original cost. Current performance of the Fund may be lower or higher than the performance quoted. Performance data current to the most recent month end may be obtained by accessing the website www.massmutual.com.
Investors should note that the Fund is a professionally managed mutual fund, while the Russell 2000 Growth Index is unmanaged, does not incur expenses, and cannot be purchased directly by investors. Investors should read the Fund’s prospectus with regard to the Fund’s investment objective, risks and charges and expenses in conjunction with these financial statements. The Fund’s return reflects changes in the net asset value per share without the deduction of any product charges (e.g., cost of insurance, mortality and expense risk charges, administrative fees, and CDSL). The inclusion of these charges would have reduced the performance shown here.
11
MML Equity Index Fund – Portfolio Manager Report
What is the investment approach of MML Equity Index Fund, and who is the Fund’s subadviser?
The Fund’s investment objective is to provide investment results that correspond to the price and yield performance of publicly traded common stocks in the aggregate as represented by the S&P 500® Index. Under normal circumstances, the Fund invests at least 80% (and, typically, substantially all) of its net assets in the equity securities of companies included within the S&P 500 Index. The Fund’s subadviser is Northern Trust Investments, Inc. (NTI).
How did the Fund perform during the 12 months ended December 31, 2010?
The Fund’s Class I shares returned 14.51%, lagging the 15.06% return of the S&P 500 Index (the “benchmark”), a widely recognized, unmanaged index representative of common stocks of larger capitalized U.S. companies.
For a discussion on the economic and market environment during the 12-month period ended December 31, 2010, please see the Economic and Market Review, beginning on page 3.
Subadviser discussion of factors that contributed to the Fund’s performance
For the year ended December 31, 2010, large-capitalization stocks underperformed both mid- and small-capitalization stocks. All sectors in the benchmark posted positive returns for the year. The largest gain was in consumer discretionary, which returned 27.66% for the year. Information technology, the largest sector in the benchmark, returned 10.19% for the year. Other strong performers were the industrials and materials sectors, which posted returns of 26.71% and 22.20%, respectively. Conversely, health care returned just 2.90%, the smallest sector gain for the year.
The year started in negative territory, as U.S. equity markets suffered losses in January, fueled by mixed corporate earnings and continued concerns around jobless data and consumer confidence levels. In February and March, the equity markets advanced, as many U.S. corporations posted unexpected positive earnings, in tandem with increased corporate activity.
The second quarter started with a better-than-expected earnings season and multiple merger and acquisition (“M&A”) announcements; however, disappointing macroeconomic data and Securities and Exchange Commission (SEC) fraud charges against Goldman Sachs in mid-April helped reverse the market. Multiple sovereign credit downgrades in Europe placed further downward pressure on performance. In mid-June, M&A activity and comments from the Federal Reserve (the “Fed”) provided a brief rally, but the market quickly reverted after disappointing U.S. home sales, Gross Domestic Product (GDP), and several lower-than-expected corporate earnings and guidance announcements.
U.S. markets rallied in the third quarter, driven by better-than-expected earnings reports, increased M&A activity, and speculation concerning the Fed’s quantitative easing efforts, which ultimately resulted in the announcement of further quantitative easing in the form of $600 billion in U.S. Treasury purchases. Share repurchases and/or dividend increases by Microsoft, MasterCard, and Thermo Fisher were seen as positive news by the markets.
A better-than-anticipated start to the earnings season helped equity markets early in the fourth quarter, along with further M&A activity and better-than-expected macroeconomic data. The year ended on a positive note, as December provided positive performance on strong manufacturing data, both in the U.S. and internationally.
Subadviser outlook
In our view, growing new orders in the industrials sector, against a backdrop of falling inventories, bode well for 2011 growth, and many have embraced this more robust outlook. In addition to the economic check-up, policy discussions have focused on two key risks: the European credit crisis and U.S. state and local financial deterioration. With regard to the European credit crisis, while we expect a journey toward greater fiscal unity to be bumpy, we do expect the European Union to work its way through this crisis – predicated on an expectation for reluctant (but forthcoming) German support. Importantly, we see limited systemic risk in the U.S., as meaningful intervention by Fed authorities seems unlikely and potential losses will likely be immaterial to aggregate net worth.
“Standard & Poor’s®,” “S&P®,” “S&P 500®,” “Standard & Poor’s 500” and “500” are trademarks of The McGraw-Hill Companies and have been licensed for use by the Fund. The Fund is not sponsored, endorsed, sold or promoted by Standard & Poor’s, and Standard & Poor’s makes no representation regarding the advisability of investing in the Fund.
12
MML Equity Index Fund – Portfolio Manager Report (Continued)
| | | | |
MML Equity Index Fund
Largest Holdings
(% of Net Assets) on 12/31/10
(Unaudited) | |
| | |
Exxon Mobil Corp. | | | 3.2 | % |
Apple, Inc. | | | 2.6 | % |
Microsoft Corp. | | | 1.8 | % |
General Electric Co. | | | 1.7 | % |
Chevron Corp. | | | 1.6 | % |
International Business Machines Corp. | | | 1.6 | % |
The Procter & Gamble Co. | | | 1.6 | % |
AT&T, Inc. | | | 1.5 | % |
Johnson & Johnson | | | 1.5 | % |
JP Morgan Chase & Co. | | | 1.4 | % |
| | | | | |
| | | | 18.5 | % |
| | | | | |
| | | | |
MML Equity Index Fund
Sector Table
(% of Net Assets) on 12/31/10
(Unaudited) | |
| | |
Consumer, Non-cyclical | | | 20.3 | % |
Financial | | | 15.7 | % |
Technology | | | 13.0 | % |
Energy | | | 12.1 | % |
Communications | | | 11.5 | % |
Industrial | | | 11.0 | % |
Consumer, Cyclical | | | 8.7 | % |
Basic Materials | | | 3.7 | % |
Utilities | | | 3.2 | % |
Diversified | | | 0.0 | % |
| | | | | |
Total Long-Term Investments | | | 99.2 | % |
Short-Term Investments and Other Assets and Liabilities | | | 0.8 | % |
| | | | | |
Net Assets | | | 100.0 | % |
| | | | | |
13
MML Equity Index Fund – Portfolio Manager Report (Continued)
Growth of a $10,000 Investment
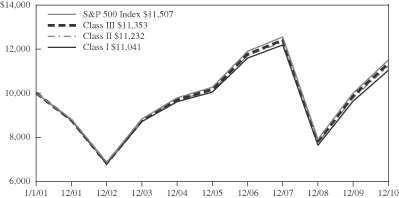
Hypothetical Investments in MML Equity Index Fund Class I, Class II, Class III and the S&P 500 Index.
| | | | | | | | | | | | |
| | | | |
| TOTAL RETURN | | One Year 1/1/10 -
12/31/10 | | | Five
Year
Average
Annual 1/1/06 -
12/31/10 | | | Ten
Year
Average
Annual 1/1/01 -
12/31/10 | |
| Class I | | | 14.51% | | | | 1.90% | | | | 1.00% | |
| Class II | | | 14.76% | | | | 2.08% | | | | 1.17% | |
| Class III | | | 14.93% | | | | 2.22% | | | | 1.28% | |
| S&P 500 Index | | | 15.06% | | | | 2.29% | | | | 1.41% | |
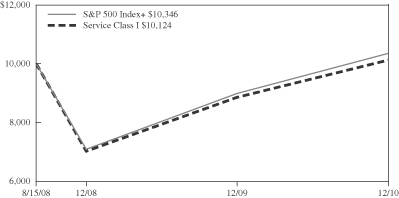
Hypothetical Investments in MML Equity Index Fund Service Class I and the S&P 500 Index.
| | | | | | | | |
| | | |
| TOTAL RETURN | | One Year 1/1/10 -
12/31/10 | | | Since
Inception
Average
Annual 8/15/08 -
12/31/10 | |
| Service Class I | | | 14.22% | | | | 0.52% | |
| S&P 500 Index | | | 15.06% | | | | 1.47%+ | |
GROWTH OF $10,000 INVESTMENT FOR PAST TEN YEARS
GROWTH OF $10,000 INVESTMENT SINCE INCEPTION
+ From 9/2/08.
Performance data quoted represents past performance; past performance is not predictive of future results. The investment return and principal value of shares of the Fund will fluctuate with market conditions so that shares of the Fund, when redeemed, may be worth more or less than their original cost. Current performance of the Fund may be lower or higher than the performance quoted. Performance data current to the most recent month end may be obtained by accessing the website www.massmutual.com.
Investors should note that the Fund is a professionally managed mutual fund, while the S&P 500 Index is unmanaged, does not incur expenses, and cannot be purchased directly by investors. Investors should read the Fund’s prospectus with regard to the Fund’s investment objective, risks and charges and expenses in conjunction with these financial statements. The Fund’s return reflects changes in the net asset value per share without the deduction of any product charges (e.g., cost of insurance, mortality and expense risk charges, administrative fees, and CDSL). The inclusion of these charges would have reduced the performance shown here.
14
MML Large Cap Value Fund – Portfolio Manager Report
What is the investment approach of MML Large Cap Value Fund, and who is the Fund’s subadviser?
The Fund seeks both capital growth and income by investing primarily in large-capitalization companies that the Fund’s subadviser believes are undervalued. Under normal circumstances, the Fund will invest at least 80% of its net assets in common stocks of companies with market capitalizations at the time of purchase of at least $5 billion. The Fund’s subadviser is Davis Selected Advisers, L.P. (Davis).
How did the Fund perform during the 12 months ended December 31, 2010?
The Fund’s Initial Class shares returned 12.38%, trailing the 15.06% return of the S&P 500® Index (the “benchmark”), a widely recognized, unmanaged index representative of common stocks of larger capitalized U.S. companies. Similarly, the Fund underperformed the 15.51% return of the Russell 1000® Value Index, an unmanaged index consisting of those Russell 1000 securities (representing the 1,000 largest U.S. companies based on market capitalization) with greater than average value orientation that tend to exhibit lower price-to-book ratios and lower forecasted growth rates than securities in the growth universe.
For a discussion on the economic and market environment during the 12-month period ended December 31, 2010, please see the Economic and Market Review, beginning on page 3.
Subadviser discussion of factors that contributed to the Fund’s performance
All sectors of the market registered increases in 2010. Consumer discretionary, industrials, and materials were the sectors within benchmark that increased the most. Conversely, health care and utilities were the benchmark sectors that increased the least.
The portfolio had more of an allocation to the financials sector than any other sector in the benchmark – and this was the most important contributor to the Fund’s performance. The Fund’s financial holdings outperformed the corresponding sector within the benchmark and had a higher relative average weighting than the benchmark. Berkshire Hathaway, Wells Fargo, and Julius Baer were among the most important contributors to the Fund’s full-year performance.
Consumer staples companies were also an important reason for the Fund’s performance in 2010. The portfolio’s consumer staples holdings outperformed the corresponding sector within the benchmark – and had a higher relative average weighting than did the benchmark. From this sector, Costco was among the most important contributors to performance for the year.
While energy companies made positive contributions to absolute performance, they were the most important reason that the Fund lagged the benchmark for the year. The Fund’s energy companies underperformed the corresponding benchmark sector, but these firms occupied a higher relative average weighting in the portfolio (when compared to the benchmark). Occidental Petroleum and Canadian Natural Resources were some of the strongest contributors to Fund results from within the energy sector, whereas EOG Resources, Transocean, and China Coal Energy were among the most significant detractors from this sector.
Portfolio holdings within the industrials sector also contributed to absolute performance; however, they were another important reason that the Fund’s performance lagged the benchmark. The Fund’s industrial companies underperformed the benchmark sector and had a lower relative average weighting in industrials than did the benchmark. China Shipping Development was a significant detractor. Elsewhere, three companies – Hewlett-Packard, Microsoft, and Visa – were noteworthy detractors.
Subadviser outlook
Our long-term focus usually results in low fund turnover. We do not overreact to past short-term performance from individual holdings on either the upside or the downside. The Fund’s investment strategy is to perform extensive research to buy durable companies at a discount to their intrinsic values and to hold them for the long term. We focus on the future, considering each company’s long-term business fundamentals.
Consistent with our low-turnover strategy, as of December 31, 2010, only two companies had dropped out of the Fund’s top 10 holdings from the end of 2009: Berkshire Hathaway and JPMorgan Chase. The Fund continues to own both of these companies, but in reduced amounts. The two new additions to the Fund’s top 10 holdings, CVS Caremark and Bank of New York Mellon, were among the Fund’s top 20 holdings as of December 31, 2009.
15
MML Large Cap Value Fund – Portfolio Manager Report (Continued)
| | | | |
MML Large Cap Value Fund
Largest Holdings
(% of Net Assets) on 12/31/10
(Unaudited) | |
| | |
Costco Wholesale Corp. | | | 5.4 | % |
Wells Fargo & Co. | | | 4.9 | % |
American Express Co. | | | 4.4 | % |
Occidental Petroleum Corp. | | | 4.0 | % |
CVS Caremark Corp. | | | 3.8 | % |
EOG Resources, Inc. | | | 3.7 | % |
Devon Energy Corp. | | | 3.5 | % |
Loews Corp. | | | 3.1 | % |
Merck & Co., Inc. | | | 3.0 | % |
Bank of New York Mellon Corp. | | | 2.9 | % |
| | | | | |
| | | | 38.7 | % |
| | | | | |
| | | | |
MML Large Cap Value Fund
Sector Table
(% of Net Assets) on 12/31/10
(Unaudited) | |
| | |
Financial | | | 26.8 | % |
Consumer, Non-cyclical | | | 20.7 | % |
Energy | | | 16.0 | % |
Consumer, Cyclical | | | 13.7 | % |
Industrial | | | 6.3 | % |
Technology | | | 4.9 | % |
Basic Materials | | | 4.6 | % |
Communications | | | 2.2 | % |
Diversified | | | 1.0 | % |
| | | | | |
Total Long-Term Investments | | | 96.2 | % |
Short-Term Investments and Other Assets and Liabilities | | | 3.8 | % |
| | | | | |
Net Assets | | | 100.0 | % |
| | | | | |
| | | | |
MML Large Cap Value Fund
Country Weightings
(% of Net Assets) on 12/31/10
(Unaudited) | |
| | |
United States | | | 77.7 | % |
Canada | | | 5.5 | % |
Switzerland | | | 4.4 | % |
United Kingdom | | | 2.5 | % |
Hong Kong | | | 1.8 | % |
Netherlands | | | 1.4 | % |
China | | | 1.0 | % |
Brazil | | | 0.8 | % |
Mexico | | | 0.7 | % |
Netherlands Antilles | | | 0.4 | % |
| | | | | |
Total Long-Term Investments | | | 96.2 | % |
Short-Term Investments and Other Assets and Liabilities | | | 3.8 | % |
| | | | | |
Net Assets | | | 100.0 | % |
| | | | | |
16
MML Large Cap Value Fund – Portfolio Manager Report (Continued)
Growth of a $10,000 Investment
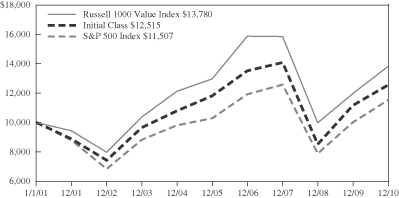
Hypothetical Investments in MML Large Cap Value Fund Initial Class, the S&P 500 Index and the Russell 1000 Value Index.
| | | | | | | | | | | | |
| | | | |
| TOTAL RETURN | | One Year
1/1/10 -
12/31/10 | | | Five Year
Average
Annual
1/1/06 -
12/31/10 | | | Ten Year
Average
Annual
1/1/01 -
12/31/10 | |
| Initial Class | | | 12.38% | | | | 1.19% | | | | 2.27% | |
S&P 500 Index* | | | 15.06% | | | | 2.29% | | | | 1.41% | |
| Russell 1000 Value Index | | | 15.51% | | | | 1.28% | | | | 3.26% | |
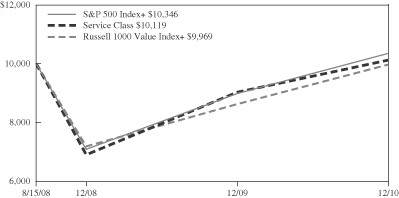
Hypothetical Investments in MML Large Cap Value Fund Service Class, the S&P 500 Index and the Russell 1000 Value Index.
| | | | | | | | |
| | | |
| TOTAL RETURN | | One Year 1/1/10 -
12/31/10 | | | Since
Inception
Average
Annual 8/15/08 -
12/31/10 | |
| Service Class | | | 12.04% | | | | 0.50% | |
S&P 500 Index* | | | 15.06% | | | | 1.47%+ | |
| Russell 1000 Value Index | | | 15.51% | | | | -0.13%+ | |
GROWTH OF $10,000 INVESTMENT FOR PAST TEN YEARS
GROWTH OF $10,000 INVESTMENT SINCE INCEPTION
* Benchmark
+ From 9/2/08.
Performance data quoted represents past performance; past performance is not predictive of future results. The investment return and principal value of shares of the Fund will fluctuate with market conditions so that shares of the Fund, when redeemed, may be worth more or less than their original cost. Current performance of the Fund may be lower or higher than the performance quoted. Performance data current to the most recent month end may be obtained by accessing the website www.massmutual.com.
Investors should note that the Fund is a professionally managed mutual fund, while the S&P 500 Index and the Russell 1000 Value Index are unmanaged, do not incur expenses, and cannot be purchased directly by investors. Investors should read the Fund’s prospectus with regard to the Fund’s investment objective, risks and charges and expenses in conjunction with these financial statements. The Fund’s return reflects changes in the net asset value per share without the deduction of any product charges (e.g., cost of insurance, mortality and expense risk charges, administrative fees, and CDSL). The inclusion of these charges would have reduced the performance shown here.
17
MML NASDAQ-100® Fund – Portfolio Manager Report
What is the investment approach of MML NASDAQ-100® Fund, and who is the Fund’s subadviser?
The Fund seeks to approximate as closely as practicable (before fees and expenses) the total return of the NASDAQ-100 Index®. Under normal circumstances, the Fund invests at least 80% (and, typically, substantially all) of its net assets in the equity securities of companies included in the NASDAQ-100 Index. The Fund’s subadviser is Northern Trust Investments, Inc. (NTI).
How did the Fund perform during the 12 months ended December 31, 2010?
The Fund’s Initial Class shares returned 19.58%, moderately outperforming the 19.22% return of the NASDAQ-100 Index (the “benchmark”). The benchmark is a modified capitalization-weighted index composed of the 100 largest non-financial companies listed on the National Association of Securities Dealers Automated Quotations System (NASDAQ).
For a discussion on the economic and market environment during the 12-month period ended December 31, 2010, please see the Economic and Market Review, beginning on page 3.
Subadviser discussion of factors that contributed to the Fund’s performance
Sector performance was positive for the year ended December 31, 2010. Information technology, the largest weight in the benchmark, returned 20.49%; consumer discretionary returned 26.89%.
The year started in negative territory, as U.S. equity markets suffered losses in January, fueled by mixed corporate earnings and continued concerns around jobless data and consumer confidence levels. In February and March, the equity markets advanced, as many U.S. corporations posted unexpected positive earnings, in tandem with increased corporate activity.
The second quarter started with a better-than-expected earnings season and multiple merger and acquisition (“M&A”) announcements; however, disappointing macroeconomic data and Securities and Exchange Commission (SEC) fraud charges against Goldman Sachs in mid-April helped reverse the market. Multiple sovereign credit downgrades in Europe placed further downward pressure on performance. In mid-June, M&A activity and comments from the Federal Reserve (the “Fed”) provided a brief rally, but the market quickly reverted after disappointing U.S. home sales, Gross Domestic Product (GDP), and several lower-than-expected corporate earnings and guidance announcements.
U.S. markets rallied in the third quarter, driven by better-than-expected earnings reports, increased M&A activity, and speculation concerning the Fed’s quantitative easing efforts, which ultimately resulted in the announcement of further quantitative easing in the form of $600 billion in U.S. Treasury purchases. Share repurchases and/or dividend increases by Microsoft, MasterCard, and Thermo Fisher were seen as positive news by the markets.
A better-than-anticipated start to the earnings season helped equity markets early in the fourth quarter, along with further M&A activity and better-than-expected macroeconomic data. The year ended on a positive note, as December provided positive performance on strong manufacturing data, both in the U.S. and internationally.
Subadviser outlook
In our view, growing new orders in the industrials sector, against a backdrop of falling inventories, bode well for 2011 growth, and many have embraced this more robust outlook. In addition to the economic check-up, policy discussions have focused on two key risks: the European credit crisis and U.S. state and local financial deterioration. With regard to the European credit crisis, while we expect a journey toward greater fiscal unity to be bumpy, we do expect the European Union to work its way through this crisis – predicated on an expectation for reluctant (but forthcoming) German support. Importantly, we see limited systemic risk in the U.S., as meaningful intervention by Fed authorities seems unlikely and potential losses will likely be immaterial to aggregate net worth.
NASDAQ®, NASDAQ-100® and NASDAQ-100 Index® are trademarks of The NASDAQ Stock Market, Inc. (together with its affiliates, “NASDAQ”) and are licensed for use by the Fund. The Fund has not been passed on by NASDAQ as to its legality or suitability. The Fund is not issued, endorsed, sold or promoted by NASDAQ. NASDAQ MAKES NO WARRANTIES AND BEARS NO LIABILITY WITH RESPECT TO THE FUND.
18
MML NASDAQ-100® Fund – Portfolio Manager Report (Continued)
| | | | |
MML NASDAQ-100 Fund
Largest Holdings
(% of Net Assets) on 12/31/10
(Unaudited) | |
| | |
Apple, Inc. | | | 19.6 | % |
QUALCOMM, Inc. | | | 4.6 | % |
Google, Inc. Class A | | | 4.3 | % |
Microsoft Corp. | | | 3.9 | % |
Oracle Corp. | | | 3.1 | % |
Amazon.com, Inc. | | | 2.5 | % |
Intel Corp. | | | 2.0 | % |
Cisco Systems, Inc. | | | 1.9 | % |
Teva Pharmaceutical Industries Ltd. Sponsored ADR (Israel) | | | 1.8 | % |
Starbucks Corp. | | | 1.6 | % |
| | | | | |
| | | | 45.3 | % |
| | | | | |
| | | | | |
| | | | |
MML NASDAQ-100 Fund
Sector Table
(% of Net Assets) on 12/31/10
(Unaudited) | |
| | |
Technology | | | 45.4 | % |
Communications | | | 26.4 | % |
Consumer, Non-cyclical | | | 14.1 | % |
Consumer, Cyclical | | | 8.2 | % |
Industrial | | | 2.7 | % |
Energy | | | 0.5 | % |
Basic Materials | | | 0.4 | % |
Mutual Funds | | | 0.4 | % |
| | | | | |
Total Long-Term Investments | | | 98.1 | % |
Short-Term Investments and Other Assets and Liabilities | | | | |
| | | | | |
Net Assets | | | 100.0 | % |
| | | | | |
19
MML NASDAQ-100® Fund – Portfolio Manager Report (Continued)
Growth of a $10,000 Investment
Hypothetical Investments in MML NASDAQ-100 Fund Initial Class and the NASDAQ-100 Index.
| | | | | | | | | | | | |
| | | | |
| TOTAL RETURN | | One Year 1/1/10 -
12/31/10 | | | Five Year
Average
Annual 1/1/06 -
12/31/10 | | | Ten Year
Average
Annual 1/1/01 -
12/31/10 | |
| Initial Class | | | 19.58% | | | | 6.30% | | | | -0.61% | |
| NASDAQ-100 Index | | | 19.22% | | | | 6.16% | | | | -0.54% | |
Hypothetical Investments in MML NASDAQ-100 Fund Service Class and the NASDAQ-100 Index.
| | | | | | | | |
| | | |
| TOTAL RETURN | | One Year
1/1/10 -
12/31/10 | | | Since
Inception
Average
Annual
8/15/08 -
12/31/10 | |
| Service Class | | | 19.51% | | | | 5.29% | |
| NASDAQ-100 Index | | | 19.22% | | | | 7.52%+ | |
GROWTH OF $10,000 INVESTMENT FOR PAST TEN YEARS
GROWTH OF $10,000 INVESTMENT SINCE INCEPTION
+ From 9/2/08.
Performance data quoted represents past performance; past performance is not predictive of future results. The investment return and principal value of shares of the Fund will fluctuate with market conditions so that shares of the Fund, when redeemed, may be worth more or less than their original cost. Current performance of the Fund may be lower or higher than the performance quoted. Performance data current to the most recent month end may be obtained by accessing the website www.massmutual.com.
Investors should note that the Fund is a professionally managed mutual fund, while the NASDAQ-100 Index is unmanaged, does not incur expenses, and cannot be purchased directly by investors. Investors should read the Fund’s prospectus with regard to the Fund’s investment objective, risks and charges and expenses in conjunction with these financial statements. The Fund’s return reflects changes in the net asset value per share without the deduction of any product charges (e.g., cost of insurance, mortality and expense risk charges, administrative fees, and CDSL). The inclusion of these charges would have reduced the performance shown here.
20
MML Small Cap Growth Equity Fund – Portfolio Manager Report
What is the investment approach of MML Small Cap Growth Equity Fund, and who are the Fund’s subadvisers?
The Fund seeks long-term capital appreciation by investing primarily in equity securities of smaller companies that the Fund’s subadvisers believe offer potential for long-term growth. Under normal circumstances, the Fund invests at least 80% of its net assets in the securities of companies whose market capitalizations at the time of purchase are within the market capitalization range of companies included in the Russell 2000® Index or the S&P SmallCap 600 Index. The Fund’s two subadvisers are Wellington Management Company, LLP (Wellington Management), which managed approximately 49% of the Fund’s portfolio; and Waddell & Reed Investment Management Company (Waddell & Reed), which was responsible for approximately 51% of the Fund’s portfolio, as of December 31, 2010.
How did the Fund perform during the 12 months ended December 31, 2010?
The Fund’s Initial Class shares returned 22.24%, significantly underperforming the 29.09% return of the Russell 2000 Growth Index (the “benchmark”), a widely recognized, unmanaged index that measures the performance of those Russell 2000 Index companies (representing small-capitalization U.S. common stocks) with higher price-to-book ratios and higher forecasted growth rates than securities in the value universe. Similarly, the Fund’s 22.24% return trailed the 26.85% return of the Russell 2000 Index, a widely recognized, unmanaged index representative of common stocks of smaller capitalized U.S. companies.
For a discussion on the economic and market environment during the 12-month period ended December 31, 2010, please see the Economic and Market Review, beginning on page 3.
Subadviser discussion of factors that contributed to the Fund’s performance
The Fund’s Waddell & Reed component experienced strong absolute performance for the year, despite lagging the benchmark, with all sectors except health care posting double-digit gains. Over the course of the year, the largest sector allocation increases were in cyclical sectors, such as industrials and energy, as mounting economic evidence and stimulative monetary and fiscal policy led to the market’s conviction that a “double-dip” recession would be avoided. An overweight position in the energy sector, relative to the benchmark, contributed to performance for the year, but stock selection within this sector trailed the benchmark. Despite the fact that the energy sector was, in 2010, a benefactor of the resurgence in global economic activity, holdings within the portfolio were concentrated in the deep-water drilling service industry, which generally underperformed.
The consumer discretionary sector performed well, but occupied a larger position in the portfolio early in 2010. Waddell & Reed reduced the portfolio’s allocation in consumer discretionary in the latter half of the year, taking profits in some positions. Detracting from the portfolio’s performance, relative to the benchmark, was stock selection within the health care sector, where continued regulatory pressure on reimbursements and uncertainty on insurance coverage led to a great deal of investor uncertainty. Toward the second half of the year, Waddell & Reed leveraged some opportunities to increase exposure to specific health care device companies – after which time the sector’s performance improved. The technology sector performed well for the year, although Waddell & Reed trimmed some software holdings on profit-taking. Waddell & Reed increased the portfolio’s exposure within the technology sector in some areas that could be more prone to benefit from the economic rebound – such as semi-conductors.
With respect to the Fund’s Wellington Management component, weak stock selection in the consumer discretionary, energy, information technology (“IT”), financials, health care, and industrials sectors hampered the portfolio’s performance for the year – which more than offset Wellington Management’s strong stock selection in the health care, consumer discretionary, and industrials sectors.
Stocks that detracted the most from relative returns during the period were Equinix (IT), a commercial data center and Internet exchange services company (eliminated from the portfolio); SunPower (IT), an integrated solar products company; DreamWorks Animation (consumer discretionary), a computer-generated, animated feature film company; NutriSystem (consumer discretionary), a provider of weight-loss products and services (eliminated from the portfolio); Comstock Resources (energy), which engages in the acquisition, development, production, and exploration of oil and natural gas; and VistaPrint (IT), an online provider of customized marketing products and services to small businesses worldwide.
Top contributors to relative performance during the period included Netezza (IT), an innovative provider of data warehouse and analytic appliances; Skyworks Solutions (IT), a wireless handset chip supplier; OSI Pharmaceuticals (health care), a
21
MML Small Cap Growth Equity Fund – Portfolio Manager Report (Continued)
biotechnology company (eliminated from the portfolio); Tenneco (consumer discretionary), a supplier of emissions and ride control components for automobiles and commercial vehicles; TRW Automotive (consumer discretionary), an auto parts supplier that was eliminated from the portfolio, as the stock’s market capitalization rose out of the portfolio’s range; and ArvinMeritor (industrials), a commercial vehicle components manufacturer with market-leading positions in axles and brakes.
Subadviser outlook
We believe that strong profits, low interest rates, and stimulative federal and monetary actions should continue to drive the momentum in the market and economy at least over the near term. Margin improvement has helped support profit growth and consequently, our view is that revenue growth will become a bigger factor in driving earnings growth going forward. Our view is that a recent improvement in bank lending is a strong positive, as the money supply has grown, although velocity has been lacking. Employment and housing continue to be in an elongated recovery process, with prospects for gradual improvement. Finally, we believe that if bond flows reverse direction, this could provide another boost for equities.
| | | | |
MML Small Cap Growth Equity Fund
Largest Holdings
(% of Net Assets) on 12/31/10
(Unaudited) | |
| | |
Wabtec Corp. | | | 2.2 | % |
Under Armour, Inc. Class A | | | 2.1 | % |
LKQ Corp. | | | 2.1 | % |
Portfolio Recovery Associates, Inc. | | | 2.1 | % |
MICROS Systems, Inc. | | | 2.0 | % |
General Cable Corp. | | | 1.9 | % |
Greenhill & Co., Inc. | | | 1.9 | % |
PerkinElmer, Inc. | | | 1.8 | % |
Volcano Corp. | | | 1.8 | % |
Strayer Education, Inc. | | | 1.7 | % |
| | | | | |
| | | | 19.6 | % |
| | | | | |
| | | | |
MML Small Cap Growth Equity Fund
Sector Table
(% of Net Assets) on 12/31/10
(Unaudited) | |
| | |
Consumer, Non-cyclical | | | 20.2 | % |
Industrial | | | 19.6 | % |
Consumer, Cyclical | | | 18.7 | % |
Technology | | | 16.1 | % |
Communications | | | 9.8 | % |
Financial | | | 8.1 | % |
Energy | | | 6.0 | % |
Basic Materials | | | 1.2 | % |
Utilities | | | 0.7 | % |
Mutual Funds | | | 0.3 | % |
| | | | | |
Total Long-Term Investments | | | 100.7 | % |
Short-Term Investments and Other Assets and Liabilities | | | (0.7 | )% |
| | | | | |
Net Assets | | | 100.0 | % |
| | | | | |
22
MML Small Cap Growth Equity Fund – Portfolio Manager Report (Continued)
Growth of a $10,000 Investment
Hypothetical Investments in MML Small Cap Growth Equity Fund Initial Class, the Russell 2000 Growth Index and the Russell 2000 Index.
| | | | | | | | | | | | |
| | | | |
| TOTAL RETURN | | One Year
1/1/10 -
12/31/10 | | | Five Year
Average
Annual
1/1/06 -
12/31/10 | | | Ten Year
Average
Annual
1/1/01 -
12/31/10 | |
| Initial Class | | | 22.24% | | | | 4.45% | | | | 4.20% | |
Russell 2000 Growth
Index* | | | 29.09% | | | | 5.30% | | | | 3.78% | |
| Russell 2000 Index | | | 26.85% | | | | 4.47% | | | | 6.33% | |
Hypothetical Investments in MML Small Cap Growth Equity Fund Service Class, the Russell 2000 Growth Index and the Russell 2000 Index.
| | | | | | | | |
| | | |
| TOTAL RETURN | | One Year
1/1/10 -
12/31/10 | | | Since
Inception
Average
Annual
8/15/08 -
12/31/10 | |
| Service Class | | | 21.90% | | | | 4.64% | |
Russell 2000 Growth Index* | | | 29.09% | | | | 4.86%+ | |
| Russell 2000 Index | | | 26.85% | | | | 4.04%+ | |
GROWTH OF $10,000 INVESTMENT FOR PAST TEN YEARS
GROWTH OF $10,000 INVESTMENT SINCE INCEPTION
* Benchmark
+ From 9/2/08.
Performance data quoted represents past performance; past performance is not predictive of future results. The investment return and principal value of shares of the Fund will fluctuate with market conditions so that shares of the Fund, when redeemed, may be worth more or less than their original cost. Current performance of the Fund may be lower or higher than the performance quoted. Performance data current to the most recent month end may be obtained by accessing the website www.massmutual.com.
Investors should note that the Fund is a professionally managed mutual fund, while the Russell 2000 Growth Index and the Russell 2000 Index are unmanaged, do not incur expenses, and cannot be purchased directly by investors. Investors should read the Fund’s prospectus with regard to the Fund’s investment objective, risks and charges and expenses in conjunction with these financial statements. The Fund’s return reflects changes in the net asset value per share without the deduction of any product charges (e.g., cost of insurance, mortality and expense risk charges, administrative fees, and CDSL). The inclusion of these charges would have reduced the performance shown here.
23
MML Blue Chip Growth Fund – Portfolio of Investments
December 31, 2010
| | | | | | | | |
| | | Number of
Shares | | | Value | |
| EQUITIES — 99.7% | | | | | | | | |
| | |
| COMMON STOCK — 99.7% | | | | | | | | |
| Advertising — 0.6% | | | | | | | | |
Omnicom Group, Inc. | | | 47,300 | | | $ | 2,166,340 | |
| | | | | | | | |
| Aerospace & Defense — 0.9% | | | | | | | | |
United Technologies Corp. | | | 38,600 | | | | 3,038,592 | |
| | | | | | | | |
| Apparel — 1.0% | | | | | | | | |
Nike, Inc. Class B | | | 41,270 | | | | 3,525,283 | |
| | | | | | | | |
| Auto Manufacturers — 0.3% | | | | | | | | |
General Motors Co. (a) | | | 30,800 | | | | 1,135,288 | |
| | | | | | | | |
| Automotive & Parts — 0.6% | | | | | | | | |
Johnson Controls, Inc. | | | 51,000 | | | | 1,948,200 | |
| | | | | | | | |
| Banks — 2.2% | | | | | | | | |
Bank of New York Mellon Corp. | | | 3,700 | | | | 111,740 | |
Northern Trust Corp. | | | 28,200 | | | | 1,562,562 | |
PNC Financial Services Group, Inc. | | | 1,100 | | | | 66,792 | |
State Street Corp. | | | 24,000 | | | | 1,112,160 | |
U.S. Bancorp | | | 85,600 | | | | 2,308,632 | |
Wells Fargo & Co. | | | 78,000 | | | | 2,417,220 | |
| | | | | | | | |
| | | | | | | 7,579,106 | |
| | | | | | | | |
| Beverages — 0.4% | | | | | | | | |
The Coca-Cola Co. | | | 900 | | | | 59,193 | |
InBev NV | | | 4,600 | | | | 263,396 | |
PepsiCo, Inc. | | | 14,550 | | | | 950,552 | |
| | | | | | | | |
| | | | | | | 1,273,141 | |
| | | | | | | | |
| Biotechnology — 1.4% | | | | | | | | |
Amgen, Inc. (a) | | | 720 | | | | 39,528 | |
Celgene Corp. (a) | | | 75,600 | | | | 4,470,984 | |
Life Technologies Corp. (a) | | | 1,900 | | | | 105,450 | |
Vertex Pharmaceuticals, Inc. (a) | | | 8,700 | | | | 304,761 | |
| | | | | | | | |
| | | | | | | 4,920,723 | |
| | | | | | | | |
| Chemicals — 3.2% | | | | | | | | |
Air Products & Chemicals, Inc. | | | 14,500 | | | | 1,318,775 | |
Monsanto Co. | | | 5,850 | | | | 407,394 | |
The Mosaic Co. | | | 36,900 | | | | 2,817,684 | |
Praxair, Inc. | | | 69,330 | | | | 6,618,935 | |
The Sherwin-Williams Co. | | | 300 | | | | 25,125 | |
| | | | | | | | |
| | | | | | | 11,187,913 | |
| | | | | | | | |
| Coal — 0.9% | | | | | | | | |
Peabody Energy Corp. | | | 46,500 | | | | 2,975,070 | |
| | | | | | | | |
| Commercial Services — 4.4% | | | | | | | | |
Automatic Data Processing, Inc. | | | 7,150 | | | | 330,902 | |
MasterCard, Inc. Class A | | | 19,590 | | | | 4,390,315 | |
McKesson Corp. | | | 59,900 | | | | 4,215,762 | |
Visa, Inc. Class A | | | 64,480 | | | | 4,538,102 | |
Western Union Co. | | | 85,300 | | | | 1,584,021 | |
| | | | | | | | |
| | | | | | | 15,059,102 | |
| | | | | | | | |
| | | | | | | | |
| | | Number of
Shares | | | Value | |
| Computers — 9.5% | | | | | |
Accenture PLC Class A | | | 58,650 | | | $ | 2,843,939 | |
Apple, Inc. (a) | | | 77,420 | | | | 24,972,595 | |
EMC Corp. (a) | | | 110,600 | | | | 2,532,740 | |
Hewlett-Packard Co. | | | 3,300 | | | | 138,930 | |
International Business Machines Corp. | | | 9,000 | | | | 1,320,840 | |
NetApp, Inc. (a) | | | 16,000 | | | | 879,360 | |
| | | | | | | | |
| | | | | | | 32,688,404 | |
| | | | | | | | |
| Cosmetics & Personal Care — 0.7% | | | | | |
The Procter & Gamble Co. | | | 36,900 | | | | 2,373,777 | |
| | | | | | | | |
| Distribution & Wholesale — 1.6% | | | | | |
Fastenal Co. | | | 59,900 | | | | 3,588,609 | |
W.W. Grainger, Inc. | | | 14,600 | | | | 2,016,406 | |
| | | | | | | | |
| | | | | | | 5,605,015 | |
| | | | | | | | |
| Diversified Financial — 8.3% | | | | | |
American Express Co. | | | 102,250 | | | | 4,388,570 | |
Ameriprise Financial, Inc. | | | 40,600 | | | | 2,336,530 | |
BlackRock, Inc. | | | 1,600 | | | | 304,928 | |
The Charles Schwab Corp. | | | 37,400 | | | | 639,914 | |
CME Group, Inc. | | | 600 | | | | 193,050 | |
Credit Suisse Group | | | 7,284 | | | | 294,133 | |
Franklin Resources, Inc. | | | 63,850 | | | | 7,100,758 | |
The Goldman Sachs Group, Inc. | | | 14,550 | | | | 2,446,728 | |
IntercontinentalExchange, Inc. (a) | | | 24,550 | | | | 2,925,133 | |
Invesco Ltd. | | | 105,900 | | | | 2,547,954 | |
JP Morgan Chase & Co. | | | 103,500 | | | | 4,390,470 | |
NYSE Euronext | | | 25,600 | | | | 767,488 | |
TD Ameritrade Holding Corp. | | | 14,500 | | | | 275,355 | |
| | | | | | | | |
| | | | | | | 28,611,011 | |
| | | | | | | | |
| Electrical Components & Equipment — 1.2% | |
Emerson Electric Co. | | | 71,000 | | | | 4,059,070 | |
| | | | | | | | |
| Engineering & Construction — 0.2% | | | | | |
McDermott International, Inc. (a) | | | 28,100 | | | | 581,389 | |
| | | | | | | | |
| Foods — 0.0% | | | | | |
Whole Foods Market, Inc. (a) | | | 1,200 | | | | 60,708 | |
| | | | | | | | |
| Hand & Machine Tools — 0.2% | | | | | |
Stanley Black & Decker, Inc. | | | 13,300 | | | | 889,371 | |
| | | | | | | | |
| Health Care – Products — 1.0% | | | | | |
Edwards Lifesciences Corp. (a) | | | 7,300 | | | | 590,132 | |
Intuitive Surgical, Inc. (a) | | | 550 | | | | 141,763 | |
St. Jude Medical, Inc. (a) | | | 14,450 | | | | 617,737 | |
Stryker Corp. | | | 42,330 | | | | 2,273,121 | |
| | | | | | | | |
| | | | | | | 3,622,753 | |
| | | | | | | | |
| Health Care – Services — 0.1% | | | | | |
Thermo Fisher Scientific, Inc. (a) | | | 3,200 | | | | 177,152 | |
| | | | | | | | |
| Insurance — 0.3% | | | | | |
Prudential Financial, Inc. | | | 15,900 | | | | 933,489 | |
| | | | | | | | |
The accompanying notes are an integral part of the financial statements.
24
MML Blue Chip Growth Fund – Portfolio of Investments (Continued)
| | | | | | | | |
| | | Number of
Shares | | | Value | |
| Internet — 14.8% | | | | | | | | |
Akamai Technologies, Inc. (a) | | | 17,700 | | | $ | 832,785 | |
Amazon.com, Inc. (a) | | | 89,050 | | | | 16,029,000 | |
Baidu, Inc. Sponsored ADR (Cayman Islands) (a) | | | 47,600 | | | | 4,594,828 | |
eBay, Inc. (a) | | | 68,300 | | | | 1,900,789 | |
Google, Inc. Class A (a) | | | 31,200 | | | | 18,531,864 | |
Liberty Media Corp.-Interactive Class A (a) | | | 141,600 | | | | 2,233,032 | |
Priceline.com, Inc. (a) | | | 7,800 | | | | 3,116,490 | |
Tencent Holdings Ltd. | | | 166,400 | | | | 3,659,456 | |
| | | | | | | | |
| | | | | | | 50,898,244 | |
| | | | | | | | |
| Leisure Time — 1.3% | | | | | | | | |
Carnival Corp. | | | 94,400 | | | | 4,352,784 | |
| | | | | | | | |
| Lodging — 3.4% | | | | | | | | |
Las Vegas Sands Corp. (a) | | | 55,400 | | | | 2,545,630 | |
Marriott International, Inc. Class A | | | 122,687 | | | | 5,096,418 | |
Starwood Hotels & Resorts Worldwide, Inc. | | | 50,800 | | | | 3,087,624 | |
Wynn Resorts Ltd. | | | 8,300 | | | | 861,872 | |
| | | | | | | | |
| | | | | | | 11,591,544 | |
| | | | | | | | |
| Machinery – Construction & Mining — 0.1% | | | | | |
Joy Global, Inc. | | | 4,600 | | | | 399,050 | |
| | | | | | | | |
| Machinery – Diversified — 1.4% | | | | | | | | |
Cummins, Inc. | | | 4,600 | | | | 506,046 | |
Deere & Co. | | | 15,100 | | | | 1,254,055 | |
Eaton Corp. | | | 5,400 | | | | 548,154 | |
Rockwell Automation, Inc. | | | 33,600 | | | | 2,409,456 | |
Roper Industries, Inc. | | | 2,500 | | | | 191,075 | |
| | | | | | | | |
| | | | | | | 4,908,786 | |
| | | | | | | | |
| Manufacturing — 4.7% | | | | | | | | |
3M Co. | | | 36,900 | | | | 3,184,470 | |
Danaher Corp. | | | 244,660 | | | | 11,540,612 | |
Honeywell International, Inc. | | | 25,600 | | | | 1,360,896 | |
Illinois Tool Works, Inc. | | | 4,600 | | | | 245,640 | |
| | | | | | | | |
| | | | | | | 16,331,618 | |
| | | | | | | | |
| Media — 2.4% | | | | | | | | |
Discovery Communications, Inc. Series C (a) | | | 77,575 | | | | 2,846,227 | |
Time Warner, Inc. | | | 37,733 | | | | 1,213,870 | |
The Walt Disney Co. | | | 110,200 | | | | 4,133,602 | |
| | | | | | | | |
| | | | | | | 8,193,699 | |
| | | | | | | | |
| Metal Fabricate & Hardware — 1.4% | | | | | |
Precision Castparts Corp. | | | 34,200 | | | | 4,760,982 | |
| | | | | | | | |
| Mining — 0.6% | | | | | | | | |
Freeport-McMoRan Copper & Gold, Inc. | | | 16,800 | | | | 2,017,512 | |
| | | | | | | | |
| | | | | | | | |
| | | Number of
Shares | | | Value | |
| Oil & Gas — 2.1% | | | | | |
Concho Resources, Inc. (a) | | | 8,700 | | | $ | 762,729 | |
EOG Resources, Inc. | | | 23,790 | | | | 2,174,644 | |
Exxon Mobil Corp. | | | 930 | | | | 68,002 | |
Occidental Petroleum Corp. | | | 18,100 | | | | 1,775,610 | |
Range Resources Corp. | | | 12,500 | | | | 562,250 | |
Suncor Energy, Inc. | | | 40,700 | | | | 1,558,403 | |
Ultra Petroleum Corp. (a) | | | 4,500 | | | | 214,965 | |
| | | | | | | | |
| | | | | | | 7,116,603 | |
| | | | | | | | |
| Oil & Gas Services — 5.0% | | | | | |
Cameron International Corp. (a) | | | 56,600 | | | | 2,871,318 | |
FMC Technologies, Inc. (a) | | | 32,000 | | | | 2,845,120 | |
Halliburton Co. | | | 28,200 | | | | 1,151,406 | |
National Oilwell Varco, Inc. | | | 4,200 | | | | 282,450 | |
Schlumberger Ltd. | | | 120,600 | | | | 10,070,100 | |
| | | | | | | | |
| | | | | | | 17,220,394 | |
| | | | | | | | |
| Pharmaceuticals — 3.3% | | | | | |
Allergan, Inc. | | | 44,860 | | | | 3,080,536 | |
Cardinal Health, Inc. | | | 21,200 | | | | 812,172 | |
Express Scripts, Inc. (a) | | | 121,900 | | | | 6,588,695 | |
Medco Health Solutions, Inc. (a) | | | 1,200 | | | | 73,524 | |
Shire PLC Sponsored ADR (United Kingdom) | | | 9,900 | | | | 716,562 | |
| | | | | | | | |
| | | | | | | 11,271,489 | |
| | | | | | | | |
| Retail — 7.1% | | | | | | | | |
Bed Bath & Beyond, Inc. (a) | | | 55,200 | | | | 2,713,080 | |
CarMax, Inc. (a) | | | 16,600 | | | | 529,208 | |
Coach, Inc. | | | 57,900 | | | | 3,202,449 | |
Costco Wholesale Corp. | | | 6,100 | | | | 440,481 | |
Dollar Tree, Inc. (a) | | | 6,400 | | | | 358,912 | |
Kohl’s Corp. (a) | | | 31,900 | | | | 1,733,446 | |
Lowe’s Cos., Inc. | | | 79,600 | | | | 1,996,368 | |
McDonald’s Corp. | | | 39,950 | | | | 3,066,562 | |
O’Reilly Automotive, Inc. (a) | | | 44,800 | | | | 2,706,816 | |
Polo Ralph Lauren Corp. | | | 12,900 | | | | 1,430,868 | |
Starbucks Corp. | | | 179,500 | | | | 5,767,335 | |
Target Corp. | | | 4,600 | | | | 276,598 | |
Tiffany & Co. | | | 1,500 | | | | 93,405 | |
| | | | | | | | |
| | | | | | | 24,315,528 | |
| | | | | | | | |
| Semiconductors — 3.0% | | | | | |
Altera Corp. | | | 37,750 | | | | 1,343,145 | |
Broadcom Corp. Class A | | | 94,850 | | | | 4,130,717 | |
Intel Corp. | | | 300 | | | | 6,309 | |
Marvell Technology Group Ltd. (a) | | | 119,150 | | | | 2,210,233 | |
Xilinx, Inc. | | | 95,300 | | | | 2,761,794 | |
| | | | | | | | |
| | | | | | | 10,452,198 | |
| | | | | | | | |
| Software — 1.2% | | | | | |
Autodesk, Inc. (a) | | | 20,300 | | | | 775,460 | |
Cerner Corp. (a) | | | 3,800 | | | | 360,012 | |
The accompanying notes are an integral part of the financial statements.
25
MML Blue Chip Growth Fund – Portfolio of Investments (Continued)
| | | | | | | | |
| | | Number of
Shares | | | Value | |
Fiserv, Inc. (a) | | | 30,770 | | | $ | 1,801,891 | |
Intuit, Inc. (a) | | | 18,500 | | | | 912,050 | |
Microsoft Corp. | | | 250 | | | | 6,980 | |
Salesforce.com, Inc. (a) | | | 2,100 | | | | 277,200 | |
| | | | | | | | |
| | | | | | | 4,133,593 | |
| | | | | | | | |
| Telecommunications — 5.5% | | | | | | | | |
American Tower Corp. Class A (a) | | | 103,970 | | | | 5,369,011 | |
Corning, Inc. | | | 90,000 | | | | 1,738,800 | |
Juniper Networks, Inc. (a) | | | 142,850 | | | | 5,274,022 | |
QUALCOMM, Inc. | | | 132,200 | | | | 6,542,578 | |
| | | | | | | | |
| | | | | | | 18,924,411 | |
| | | | | | | | |
| Toys, Games & Hobbies — 0.2% | | | | | | | | |
Mattel, Inc. | | | 29,000 | | | | 737,470 | |
| | | | | | | | |
| Transportation — 3.2% | | | | | | | | |
CSX Corp. | | | 6,400 | | | | 413,504 | |
Expeditors International of Washington, Inc. | | | 63,600 | | | | 3,472,560 | |
FedEx Corp. | | | 33,400 | | | | 3,106,534 | |
Union Pacific Corp. | | | 42,200 | | | | 3,910,252 | |
| | | | | | | | |
| | | | | | | 10,902,850 | |
| | | | | | | | |
| | |
TOTAL COMMON STOCK
(Cost $258,536,508) | | | | | | | 342,939,652 | |
| | | | | | | | |
| | |
TOTAL EQUITIES
(Cost $258,536,508) | | | | | | | 342,939,652 | |
| | | | | | | | |
| | |
| MUTUAL FUNDS — 0.0% | | | | | | | | |
| Diversified Financial — 0.0% | | | | | | | | |
T. Rowe Price Reserve Investment Fund | | | 1,002 | | | | 1,002 | |
| | | | | | | | |
| | |
TOTAL MUTUAL FUNDS
(Cost $1,002) | | | | | | | 1,002 | |
| | | | | | | | |
| | |
TOTAL LONG-TERM INVESTMENTS
(Cost $258,537,510) | | | | | | | 342,940,654 | |
| | | | | | | | |
| | |
| | | Principal
Amount | | | | |
| |
| SHORT-TERM INVESTMENTS — 0.6% | | | | | |
| Repurchase Agreement — 0.6% | | | | | | | | |
State Street Bank & Trust Co. Repurchase Agreement, dated 12/31/10, 0.010%, due 1/03/11 (b) | | $ | 2,018,988 | | | | 2,018,988 | |
| | | | | | | | |
| | |
TOTAL SHORT-TERM INVESTMENTS
(Cost $2,018,988) | | | | | | | 2,018,988 | |
| | | | | | | | |
| | | | | | | | |
| | | | | | Value | |
TOTAL INVESTMENTS — 100.3%
(Cost $260,556,498) (c) | | | | | | $ | 344,959,642 | |
| | |
| Other Assets/(Liabilities) — (0.3)% | | | | | | | (911,745 | ) |
| | | | | | | | |
| | |
| NET ASSETS — 100.0% | | | | | | $ | 344,047,897 | |
| | | | | | | | |
Notes to Portfolio of Investments
| ADR | American Depositary Receipt |
| (a) | Non-income producing security. |
| (b) | Maturity value of $2,018,990. Collateralized by U.S. Government Agency obligations with a rate of 4.000%, maturity date of 12/25/38, and an aggregate market value, including accrued interest, of $2,063,364. |
| (c) | See Note 6 for aggregate cost for federal tax purposes. |
The accompanying notes are an integral part of the financial statements.
26
MML Emerging Growth Fund – Portfolio of Investments
December 31, 2010
| | | | | | | | |
| | | Number of
Shares | | | Value | |
| EQUITIES — 96.1% | | | | | | | | |
|
| COMMON STOCK — 96.1% | |
| Apparel — 1.4% | | | | | | | | |
Steven Madden Ltd. (a) | | | 4,720 | | | $ | 196,918 | |
| | | | | | | | |
| Auto Manufacturers — 1.4% | |
Wabash National Corp. (a) | | | 16,470 | | | | 195,169 | |
| | | | | | | | |
| Automotive & Parts — 5.1% | |
Exide Technologies (a) | | | 26,087 | | | | 245,479 | |
Titan International, Inc. | | | 14,044 | | | | 274,420 | |
Westport Innovations, Inc. (a) | | | 10,397 | | | | 192,552 | |
| | | | | | | | |
| | | | | | | 712,451 | |
| | | | | | | | |
| Banks — 1.1% | | | | | | | | |
Cathay General Bancorp | | | 9,376 | | | | 156,579 | |
| | | | | | | | |
| Biotechnology — 1.9% | | | | | | | | |
3SBio, Inc. ADR
(Cayman Islands) (a) | | | 11,527 | | | | 174,980 | |
Affymetrix, Inc. (a) | | | 17,749 | | | | 89,277 | |
| | | | | | | | |
| | | | | | | 264,257 | |
| | | | | | | | |
| Chemicals — 3.7% | | | | | | | | |
Intrepid Potash, Inc. (a) | | | 7,013 | | | | 261,515 | |
Rockwood Holdings, Inc. (a) | | | 6,646 | | | | 259,991 | |
| | | | | | | | |
| | | | | | | 521,506 | |
| | | | | | | | |
| Commercial Services — 7.7% | | | | | | | | |
Alliance Data Systems Corp. (a) | | | 3,464 | | | | 246,048 | |
American Public Education, Inc. (a) | | | 3,079 | | | | 114,662 | |
Cardtronics, Inc. (a) | | | 10,557 | | | | 186,859 | |
Corinthian Colleges, Inc. (a) | | | 9,101 | | | | 47,416 | |
Kforce, Inc. (a) | | | 9,124 | | | | 147,626 | |
PAREXEL International Corp. (a) | | | 16,212 | | | | 344,181 | |
| | | | | | | | |
| | | | | | | 1,086,792 | |
| | | | | | | | |
| Computers — 1.1% | |
Electronics for Imaging, Inc. (a) | | | 10,299 | | | | 147,379 | |
| | | | | | | | |
| Diversified Financial — 2.2% | | | | | | | | |
Evercore Partners, Inc. Class A | | | 4,430 | | | | 150,620 | |
Janus Capital Group, Inc. | | | 12,501 | | | | 162,138 | |
| | | | | | | | |
| | | | | | | 312,758 | |
| | | | | | | | |
| Electrical Components & Equipment — 3.8% | |
American Superconductor Corp. (a) | | | 4,771 | | | | 136,403 | |
JA Solar Holdings Co. Ltd. ADR (Cayman Islands) (a) | | | 21,149 | | | | 146,351 | |
Power-One, Inc. (a) | | | 24,728 | | | | 252,226 | |
| | | | | | | | |
| | | | | | | 534,980 | |
| | | | | | | | |
| Electronics — 2.7% | | | | | | | | |
Analogic Corp. | | | 4,095 | | | | 202,744 | |
Newport Corp. (a) | | | 10,603 | | | | 184,174 | |
| | | | | | | | |
| | | | | | | 386,918 | |
| | | | | | | | |
| | | | | | | | |
| | | Number of
Shares | | | Value | |
| Energy – Alternate Sources — 1.6% | |
FuelCell Energy, Inc. (a) | | | 66,286 | | | $ | 153,121 | |
Headwaters, Inc. (a) | | | 15,914 | | | | 72,886 | |
| | | | | | | | |
| | | | | | | 226,007 | |
| | | | | | | | |
| Environmental Controls — 1.0% | | | | | | | | |
TETRA Technologies, Inc. (a) | | | 5,664 | | | | 141,940 | |
| | | | | | | | |
| Hand & Machine Tools — 1.6% | |
Snap-on, Inc. | | | 3,968 | | | | 224,509 | |
| | | | | | | | |
| Health Care – Products — 4.4% | |
Bruker Corp. (a) | | | 8,648 | | | | 143,557 | |
NxStage Medical, Inc. (a) | | | 9,130 | | | | 227,154 | |
Thoratec Corp. (a) | | | 8,659 | | | | 245,223 | |
| | | | | | | | |
| | | | | | | 615,934 | |
| | | | | | | | |
| Health Care – Services — 4.6% | |
Air Methods Corp. (a) | | | 2,764 | | | | 155,530 | |
Health Management Associates, Inc. Class A (a) | | | 21,875 | | | | 208,688 | |
HEALTHSOUTH Corp. (a) | | | 13,413 | | | | 277,783 | |
| | | | | | | | |
| | | | | | | 642,001 | |
| | | | | | | | |
| Internet — 4.5% | | | | | | | | |
Limelight Networks, Inc. (a) | | | 19,670 | | | | 114,283 | |
LoopNet, Inc. (a) | | | 10,208 | | | | 113,411 | |
SINA Corp. (a) | | | 3,819 | | | | 262,823 | |
Vocus, Inc. (a) | | | 5,201 | | | | 143,860 | |
| | | | | | | | |
| | | | | | | 634,377 | |
| | | | | | | | |
| Lodging — 0.8% | | | | | | | | |
7 Days Group Holdings Ltd. ADR (Cayman Islands) (a) | | | 5,586 | | | | 118,982 | |
| | | | | | | | |
| Machinery – Diversified — 2.3% | |
Wabtec Corp. | | | 6,062 | | | | 320,619 | |
| | | | | | | | |
| Manufacturing — 3.4% | | | | | | | | |
Acuity Brands, Inc. | | | 3,659 | | | | 211,015 | |
ESCO Technologies, Inc. | | | 3,332 | | | | 126,083 | |
LSB Industries, Inc. (a) | | | 5,924 | | | | 143,716 | |
| | | | | | | | |
| | | | | | | 480,814 | |
| | | | | | | | |
| Media — 2.5% | | | | | | | | |
Acacia Research-Acacia Technologies (a) | | | 8,699 | | | | 225,652 | |
DG FastChannel, Inc. (a) | | | 4,135 | | | | 119,419 | |
| | | | | | | | |
| | | | | | | 345,071 | |
| | | | | | | | |
| Metal Fabricate & Hardware — 3.4% | |
Circor International, Inc. | | | 3,945 | | | | 166,794 | |
Kaydon Corp. | | | 7,679 | | | | 312,689 | |
| | | | | | | | |
| | | | | | | 479,483 | |
| | | | | | | | |
| Office Furnishings — 1.4% | | | | | | | | |
Interface, Inc. Class A | | | 12,674 | | | | 198,348 | |
| | | | | | | | |
The accompanying notes are an integral part of the financial statements.
27
MML Emerging Growth Fund – Portfolio of Investments (Continued)
| | | | | | | | |
| | | Number of
Shares | | | Value | |
| Oil & Gas — 4.0% | | | | | | | | |
CVR Energy, Inc. (a) | | | 11,802 | | | $ | 179,154 | |
GeoResources, Inc. (a) | | | 7,335 | | | | 162,910 | |
GMX Resources, Inc. (a) | | | 7,151 | | | | 39,474 | |
Swift Energy Co. (a) | | | 4,777 | | | | 187,020 | |
| | | | | | | | |
| | | | | | | 568,558 | |
| | | | | | | | |
| Oil & Gas Services — 2.4% | | | | | |
Superior Energy Services, Inc. (a) | | | 4,874 | | | | 170,541 | |
Tesco Corp. (a) | | | 10,821 | | | | 171,838 | |
| | | | | | | | |
| | | | | | | 342,379 | |
| | | | | | | | |
| Pharmaceuticals — 6.1% | | | | | |
Akorn, Inc. (a) | | | 24,877 | | | | 151,004 | |
BioMarin Pharmaceutical, Inc. (a) | | | 5,024 | | | | 135,296 | |
Mylan, Inc. (a) | | | 10,489 | | | | 221,633 | |
Neogen Corp. (a) | | | 4,966 | | | | 203,755 | |
Questcor Pharmaceuticals, Inc. (a) | | | 9,984 | | | | 147,064 | |
| | | | | | | | |
| | | | | | | 858,752 | |
| | | | | | | | |
| Retail — 2.3% | | | | | | | | |
Ulta Salon Cosmetics & Fragrance, Inc. (a) | | | 9,548 | | | | 324,632 | |
| | | | | | | | |
| Semiconductors — 0.9% | | | | | | | | |
Integrated Device Technology, Inc. (a) | | | 19,022 | | | | 126,686 | |
| | | | | | | | |
| Software — 10.9% | | | | | | | | |
Acxiom Corp. (a) | | | 7,054 | | | | 120,976 | |
Advent Software, Inc. (a) | | | 2,288 | | | | 132,521 | |
Blackboard, Inc. (a) | | | 8,424 | | | | 347,911 | |
Compuware Corp. (a) | | | 18,282 | | | | 213,351 | |
Concur Technologies, Inc. (a) | | | 2,294 | | | | 119,127 | |
Medidata Solutions, Inc. (a) | | | 6,543 | | | | 156,247 | |
RealPage, Inc. (a) | | | 5,320 | | | | 164,548 | |
Renaissance Learning, Inc. | | | 4,886 | | | | 57,850 | |
Solera Holdings, Inc. | | | 4,490 | | | | 230,427 | |
| | | | | | | | |
| | | | | | | 1,542,958 | |
| | | | | | | | |
| Telecommunications — 5.9% | | | | | |
Acme Packet, Inc. (a) | | | 5,465 | | | | 290,519 | |
Aruba Networks, Inc. (a) | | | 8,952 | | | | 186,918 | |
Global Crossing Ltd. (a) | | | 10,127 | | | | 130,841 | |
Ixia (a) | | | 13,522 | | | | 226,899 | |
| | | | | | | | |
| | | | | | | 835,177 | |
| | | | | | | | |
| | |
TOTAL COMMON STOCK
(Cost $10,911,370) | | | | | | | 13,542,934 | |
| | | | | | | | |
| | |
TOTAL EQUITIES
(Cost $10,911,370) | | | | | | | 13,542,934 | |
| | | | | | | | |
| | | | | | | | |
| | | Number of
Shares | | | Value | |
| | |
| WARRANTS — 0.0% | | | | | | | | |
| Internet — 0.0% | | | | | | | | |
Lantronix, Inc., Expires
2/09/11, Strike 4.68 (a) (b) | | | 99 | | | $ | - | |
| | | | | | | | |
| | |
TOTAL WARRANTS
(Cost $0) | | | | | | | - | |
| | | | | | | | |
| | |
TOTAL LONG-TERM INVESTMENTS
(Cost $10,911,370) | | | | | | | 13,542,934 | |
| | | | | | | | |
| | |
| | | Principal
Amount | | | | |
|
| SHORT-TERM INVESTMENTS — 5.3% | |
| Repurchase Agreement — 5.3% | | | | | |
State Street Bank & Trust Co. Repurchase Agreement, dated 12/31/10, 0.010%, due 1/03/11 (c) | | $ | 749,910 | | | | 749,910 | |
| | | | | | | | |
| | |
TOTAL SHORT-TERM INVESTMENTS
(Cost $749,910) | | | | | | | 749,910 | |
| | | | | | | | |
| | |
TOTAL INVESTMENTS — 101.4%
(Cost $11,661,280) (d) | | | | | | | 14,292,844 | |
| | |
| Other Assets/(Liabilities) — (1.4)% | | | | | | | (194,433 | ) |
| | | | | | | | |
| | |
| NET ASSETS — 100.0% | | | | | | $ | 14,098,411 | |
| | | | | | | | |
Notes to Portfolio of Investments
| ADR | American Depositary Receipt |
| (a) | Non-income producing security. |
| (b) | This security is valued in good faith under procedures established by the Board of Trustees. |
| (c) | Maturity value of $749,910. Collateralized by U.S. Government Agency obligations with a rate of 4.000%, maturity date of 12/15/17, and an aggregate market value, including accrued interest, of $765,043. |
| (d) | See Note 6 for aggregate cost for federal tax purposes. |
The accompanying notes are an integral part of the financial statements.
28
MML Equity Index Fund – Portfolio of Investments
December 31, 2010
| | | | | | | | |
| | | Number of
Shares | | | Value | |
| EQUITIES — 99.2% | | | | | | | | |
| |
| COMMON STOCK — 99.2% | | | | | |
| Advertising — 0.2% | | | | | | | | |
The Interpublic Group of Companies, Inc. (a) | | | 12,930 | | | $ | 137,317 | |
Omnicom Group, Inc. | | | 8,003 | | | | 366,537 | |
| | | | | | | | |
| | | | | | | 503,854 | |
| | | | | | | | |
| Aerospace & Defense — 2.0% | | | | | |
The Boeing Co. | | | 19,495 | | | | 1,272,244 | |
General Dynamics Corp. | | | 10,041 | | | | 712,510 | |
Goodrich Corp. | | | 3,339 | | | | 294,066 | |
L-3 Communications Holdings, Inc. | | | 3,019 | | | | 212,809 | |
Lockheed Martin Corp. | | | 7,863 | | | | 549,702 | |
Northrop Grumman Corp. | | | 7,776 | | | | 503,729 | |
Raytheon Co. | | | 9,692 | | | | 449,127 | |
Rockwell Collins, Inc. | | | 4,164 | | | | 242,595 | |
United Technologies Corp. | | | 24,561 | | | | 1,933,442 | |
| | | | | | | | |
| | | | | | | 6,170,224 | |
| | | | | | | | |
| Agriculture — 1.7% | | | | | | | | |
Altria Group, Inc. | | | 55,478 | | | | 1,365,868 | |
Archer-Daniels-Midland Co. | | | 16,963 | | | | 510,247 | |
Lorillard, Inc. | | | 3,977 | | | | 326,353 | |
Philip Morris International, Inc. | | | 48,227 | | | | 2,822,726 | |
Reynolds American, Inc. | | | 8,982 | | | | 292,993 | |
| | | | | | | | |
| | | | | | | 5,318,187 | |
| | | | | | | | |
| Airlines — 0.1% | | | | | | | | |
Southwest Airlines Co. | | | 19,666 | | | | 255,265 | |
| | | | | | | | |
| Apparel — 0.3% | | | | | | | | |
Nike, Inc. Class B | | | 10,164 | | | | 868,209 | |
VF Corp. | | | 2,311 | | | | 199,162 | |
| | | | | | | | |
| | | | | | | 1,067,371 | |
| | | | | | | | |
| Auto Manufacturers — 0.7% | | | | | |
Ford Motor Co. (a) | | | 99,525 | | | | 1,671,025 | |
Paccar, Inc. | | | 9,684 | | | | 556,055 | |
| | | | | | | | |
| | | | | | | 2,227,080 | |
| | | | | | | | |
| Automotive & Parts — 0.2% | | | | | | | | |
The Goodyear Tire & Rubber Co. (a) | | | 6,457 | | | | 76,515 | |
Johnson Controls, Inc. | | | 17,900 | | | | 683,780 | |
| | | | | | | | |
| | | | | | | 760,295 | |
| | | | | | | | |
| Banks — 4.9% | | | | | | | | |
Bank of America Corp. | | | 268,027 | | | | 3,575,480 | |
Bank of New York Mellon Corp. | | | 32,938 | | | | 994,728 | |
BB&T Corp. | | | 18,352 | | | | 482,474 | |
Capital One Financial Corp. | | | 12,147 | | | | 516,976 | |
Comerica, Inc. | | | 4,630 | | | | 195,571 | |
Fifth Third Bancorp | | | 21,059 | | | | 309,146 | |
First Horizon National Corp. (a) | | | 6,184 | | | | 72,848 | |
Huntington Bancshares, Inc. | | | 22,943 | | | | 157,618 | |
| | | | | | | | |
| | | Number of
Shares | | | Value | |
KeyCorp | | | 23,280 | | | $ | 206,028 | |
M&T Bank Corp. | | | 3,162 | | | | 275,252 | |
Marshall & Ilsley Corp. | | | 13,714 | | | | 94,901 | |
Northern Trust Corp. | | | 6,439 | | | | 356,785 | |
PNC Financial Services Group, Inc. | | | 13,938 | | | | 846,315 | |
Regions Financial Corp. | | | 33,226 | | | | 232,582 | |
State Street Corp. | | | 13,337 | | | | 618,037 | |
SunTrust Banks, Inc. | | | 13,224 | | | | 390,240 | |
U.S. Bancorp | | | 50,909 | | | | 1,373,016 | |
Wells Fargo & Co. | | | 139,457 | | | | 4,321,772 | |
Zions Bancorp | | | 4,655 | | | | 112,791 | |
| | | | | | | | |
| | | | | | | 15,132,560 | |
| | | | | | | | |
| Beverages — 2.5% | | | | | | | | |
Brown-Forman Corp. Class B | | | 2,752 | | | | 191,594 | |
The Coca-Cola Co. | | | 61,734 | | | | 4,060,245 | |
Coca-Cola Enterprises, Inc. | | | 8,951 | | | | 224,044 | |
Constellation Brands, Inc. Class A (a) | | | 4,735 | | | | 104,880 | |
Dr. Pepper Snapple Group, Inc. | | | 6,029 | | | | 211,980 | |
Molson Coors Brewing Co. Class B | | | 4,204 | | | | 210,999 | |
PepsiCo, Inc. | | | 42,147 | | | | 2,753,463 | |
| | | | | | | | |
| | | | | | | 7,757,205 | |
| | | | | | | | |
| Biotechnology — 1.1% | | | | | | | | |
Amgen, Inc. (a) | | | 25,088 | | | | 1,377,331 | |
Biogen Idec, Inc. (a) | | | 6,308 | | | | 422,951 | |
Celgene Corp. (a) | | | 12,499 | | | | 739,191 | |
Genzyme Corp. (a) | | | 6,859 | | | | 488,361 | |
Life Technologies Corp. (a) | | | 4,941 | | | | 274,226 | |
| | | | | | | | |
| | | | | | | 3,302,060 | |
| | | | | | | | |
| Building Materials — 0.0% | | | | | |
Masco Corp. | | | 9,500 | | | | 120,270 | |
| | | | | | | | |
| Chemicals — 2.1% | | | | | | | | |
Air Products & Chemicals, Inc. | | | 5,700 | | | | 518,415 | |
Airgas, Inc. | | | 1,984 | | | | 123,921 | |
CF Industries Holdings, Inc. | | | 1,879 | | | | 253,947 | |
The Dow Chemical Co. | | | 30,827 | | | | 1,052,434 | |
E.I. du Pont de Nemours & Co. | | | 24,276 | | | | 1,210,887 | |
Eastman Chemical Co. | | | 1,915 | | | | 161,013 | |
Ecolab, Inc. | | | 6,174 | | | | 311,293 | |
FMC Corp. | | | 1,919 | | | | 153,309 | |
International Flavors & Fragrances, Inc. | | | 2,140 | | | | 118,963 | |
Monsanto Co. | | | 14,248 | | | | 992,231 | |
PPG Industries, Inc. | | | 4,348 | | | | 365,536 | |
Praxair, Inc. | | | 8,160 | | | | 779,035 | |
The Sherwin-Williams Co. | | | 2,390 | | | | 200,162 | |
Sigma-Aldrich Corp. | | | 3,218 | | | | 214,190 | |
| | | | | | | | |
| | | | | | | 6,455,336 | |
| | | | | | | | |
| Coal — 0.3% | |
CONSOL Energy, Inc. | | | 5,979 | | | | 291,416 | |
The accompanying notes are an integral part of the financial statements.
29
MML Equity Index Fund – Portfolio of Investments (Continued)
| | | | | | | | |
| | | Number of
Shares | | | Value | |
Massey Energy Co. | | | 2,717 | | | $ | 145,767 | |
Peabody Energy Corp. | | | 7,168 | | | | 458,609 | |
| | | | | | | | |
| | | | | | | 895,792 | |
| | | | | | | | |
| Commercial Services — 1.5% | |
Apollo Group, Inc. Class A (a) | | | 3,373 | | | | 133,200 | |
Automatic Data Processing, Inc. | | | 13,116 | | | | 607,009 | |
DeVry, Inc. | | | 1,647 | | | | 79,023 | |
Donnelley (R.R.) & Sons Co. | | | 5,515 | | | | 96,347 | |
Equifax, Inc. | | | 3,285 | | | | 116,946 | |
H&R Block, Inc. | | | 8,161 | | | | 97,198 | |
Iron Mountain, Inc. | | | 5,305 | | | | 132,678 | |
MasterCard, Inc. Class A | | | 2,574 | | | | 576,859 | |
McKesson Corp. | | | 6,622 | | | | 466,056 | |
Monster Worldwide, Inc. (a) | | | 3,417 | | | | 80,744 | |
Moody’s Corp. | | | 5,409 | | | | 143,555 | |
Paychex, Inc. | | | 8,580 | | | | 265,208 | |
Quanta Services, Inc. (a) | | | 5,696 | | | | 113,464 | |
Robert Half International, Inc. | | | 3,892 | | | | 119,095 | |
SAIC, Inc. (a) | | | 7,807 | | | | 123,819 | |
Total System Services, Inc. | | | 4,322 | | | | 66,472 | |
Visa, Inc. Class A | | | 12,956 | | | | 911,843 | |
Western Union Co. | | | 17,427 | | | | 323,619 | |
| | | | | | | | |
| | | | | | | 4,453,135 | |
| | | | | | | | |
| Computers — 6.3% | |
Apple, Inc. (a) | | | 24,386 | | | | 7,865,948 | |
Cognizant Technology Solutions Corp.
Class A (a) | | | 8,058 | | | | 590,571 | |
Computer Sciences Corp. | | | 4,103 | | | | 203,509 | |
Dell, Inc. (a) | | | 44,632 | | | | 604,763 | |
EMC Corp. (a) | | | 54,801 | | | | 1,254,943 | |
Hewlett-Packard Co. | | | 60,299 | | | | 2,538,588 | |
International Business Machines Corp. | | | 33,039 | | | | 4,848,804 | |
Lexmark International, Inc. Class A (a) | | | 2,084 | | | | 72,565 | |
NetApp, Inc. (a) | | | 9,596 | | | | 527,396 | |
SanDisk Corp. (a) | | | 6,231 | | | | 310,678 | |
Teradata Corp. (a) | | | 4,428 | | | | 182,256 | |
Western Digital Corp. (a) | | | 6,097 | | | | 206,688 | |
| | | | | | | | |
| | | | | | | 19,206,709 | |
| | | | | | | | |
| Cosmetics & Personal Care — 2.1% | |
Avon Products, Inc. | | | 11,369 | | | | 330,383 | |
Colgate-Palmolive Co. | | | 12,830 | | | | 1,031,147 | |
The Estee Lauder Cos., Inc. Class A | | | 3,006 | | | | 242,584 | |
The Procter & Gamble Co. | | | 74,417 | | | | 4,787,246 | |
| | | | | | | | |
| | | | | | | 6,391,360 | |
| | | | | | | | |
| Distribution & Wholesale — 0.2% | |
Fastenal Co. | | | 3,915 | | | | 234,548 | |
Genuine Parts Co. | | | 4,218 | | | | 216,552 | |
W.W. Grainger, Inc. | | | 1,547 | | | | 213,656 | |
| | | | | | | | |
| | | | | | | 664,756 | |
| | | | | | | | |
| | | | | | | | |
| | | Number of
Shares | | | Value | |
| Diversified Financial — 5.4% | |
American Express Co. | | | 27,826 | | | $ | 1,194,292 | |
Ameriprise Financial, Inc. | | | 6,590 | | | | 379,254 | |
The Charles Schwab Corp. | | | 26,329 | | | | 450,489 | |
Citigroup, Inc. (a) | | | 771,968 | | | | 3,651,409 | |
CME Group, Inc. | | | 1,784 | | | | 574,002 | |
Discover Financial Services | | | 14,467 | | | | 268,074 | |
E*TRADE Financial Corp. (a) | | | 5,265 | | | | 84,240 | |
Federated Investors, Inc. Class B | | | 2,443 | | | | 63,933 | |
Franklin Resources, Inc. | | | 3,862 | | | | 429,493 | |
The Goldman Sachs Group, Inc. | | | 13,598 | | | | 2,286,640 | |
IntercontinentalExchange, Inc. (a) | | | 1,953 | | | | 232,700 | |
Invesco Ltd. | | | 12,270 | | | | 295,216 | |
Janus Capital Group, Inc. | | | 4,819 | | | | 62,502 | |
JP Morgan Chase & Co. | | | 103,899 | | | | 4,407,396 | |
Legg Mason, Inc. | | | 4,057 | | | | 147,147 | |
Morgan Stanley | | | 40,239 | | | | 1,094,903 | |
The NASDAQ OMX Group, Inc. (a) | | | 3,760 | | | | 89,150 | |
NYSE Euronext | | | 6,950 | | | | 208,361 | |
SLM Corp. (a) | | | 12,920 | | | | 162,663 | |
T. Rowe Price Group, Inc. | | | 6,810 | | | | 439,517 | |
| | | | | | | | |
| | | | | | | 16,521,381 | |
| | | | | | | | |
| Electric — 3.1% | |
The AES Corp. (a) | | | 17,507 | | | | 213,235 | |
Allegheny Energy, Inc. | | | 4,507 | | | | 109,250 | |
Ameren Corp. | | | 6,380 | | | | 179,852 | |
American Electric Power Co., Inc. | | | 12,788 | | | | 460,112 | |
CenterPoint Energy, Inc. | | | 11,204 | | | | 176,127 | |
CMS Energy Corp. | | | 6,515 | | | | 121,179 | |
Consolidated Edison, Inc. | | | 7,741 | | | | 383,721 | |
Constellation Energy Group, Inc. | | | 5,331 | | | | 163,289 | |
Dominion Resources, Inc. | | | 15,425 | | | | 658,956 | |
DTE Energy Co. | | | 4,504 | | | | 204,121 | |
Duke Energy Corp. | | | 35,226 | | | | 627,375 | |
Edison International | | | 8,670 | | | | 334,662 | |
Entergy Corp. | | | 4,825 | | | | 341,755 | |
Exelon Corp. | | | 17,588 | | | | 732,364 | |
FirstEnergy Corp. | | | 8,090 | | | | 299,492 | |
Integrys Energy Group, Inc. | | | 2,054 | | | | 99,640 | |
NextEra Energy, Inc. | | | 11,043 | | | | 574,126 | |
Northeast Utilities | | | 4,676 | | | | 149,071 | |
NRG Energy, Inc. (a) | | | 6,566 | | | | 128,300 | |
Pepco Holdings, Inc. | | | 5,920 | | | | 108,040 | |
PG&E Corp. | | | 10,432 | | | | 499,067 | |
Pinnacle West Capital Corp. | | | 2,888 | | | | 119,708 | |
PPL Corp. | | | 12,841 | | | | 337,975 | |
Progress Energy, Inc. | | | 7,811 | | | | 339,622 | |
Public Service Enterprise Group, Inc. | | | 13,442 | | | | 427,590 | |
SCANA Corp. | | | 2,998 | | | | 121,719 | |
The Southern Co. | | | 22,311 | | | | 852,949 | |
TECO Energy, Inc. | | | 5,713 | | | | 101,691 | |
Wisconsin Energy Corp. | | | 3,108 | | | | 182,937 | |
Xcel Energy, Inc. | | | 12,179 | | | | 286,815 | |
| | | | | | | | |
| | | | | | | 9,334,740 | |
| | | | | | | | |
The accompanying notes are an integral part of the financial statements.
30
MML Equity Index Fund – Portfolio of Investments (Continued)
| | | | | | | | |
| | | Number of
Shares | | | Value | |
| Electrical Components & Equipment — 0.4% | |
Emerson Electric Co. | | | 20,025 | | | $ | 1,144,829 | |
Molex, Inc. | | | 3,670 | | | | 83,383 | |
| | | | | | | | |
| | | | | | | 1,228,212 | |
| | | | | | | | |
| Electronics — 0.4% | | | | | |
Agilent Technologies, Inc. (a) | | | 9,187 | | | | 380,617 | |
Amphenol Corp. Class A | | | 4,629 | | | | 244,319 | |
FLIR Systems, Inc. (a) | | | 4,203 | | | | 125,039 | |
Jabil Circuit, Inc. | | | 5,217 | | | | 104,810 | |
PerkinElmer, Inc. | | | 3,118 | | | | 80,507 | |
Waters Corp. (a) | | | 2,431 | | | | 188,913 | |
| | | | | | | | |
| | | | | | | 1,124,205 | |
| | | | | | | | |
| Energy – Alternate Sources — 0.1% | | | | | |
First Solar, Inc. (a) | | | 1,433 | | | | 186,491 | |
| | | | | | | | |
| Engineering & Construction — 0.2% | | | | | | | | |
Fluor Corp. | | | 4,755 | | | | 315,066 | |
Jacobs Engineering Group, Inc. (a) | | | 3,343 | | | | 153,277 | |
| | | | | | | | |
| | | | | | | 468,343 | |
| | | | | | | | |
| Entertainment — 0.0% | | | | | |
International Game Technology | | | 7,905 | | | | 139,839 | |
| | | | | | | | |
| Environmental Controls — 0.3% | | | | | |
Republic Services, Inc. | | | 8,187 | | | | 244,464 | |
Stericycle, Inc. (a) | | | 2,268 | | | | 183,527 | |
Waste Management, Inc. | | | 12,673 | | | | 467,253 | |
| | | | | | | | |
| | | | | | | 895,244 | |
| | | | | | | | |
| Foods — 1.9% | | | | | |
Campbell Soup Co. | | | 5,110 | | | | 177,573 | |
ConAgra Foods, Inc. | | | 11,656 | | | | 263,192 | |
Dean Foods Co. (a) | | | 4,777 | | | | 42,229 | |
General Mills, Inc. | | | 17,034 | | | | 606,240 | |
H.J. Heinz Co. | | | 8,563 | | | | 423,526 | |
The Hershey Co. | | | 4,104 | | | | 193,504 | |
Hormel Foods Corp. | | | 1,823 | | | | 93,447 | |
The J.M. Smucker Co. | | | 3,186 | | | | 209,161 | |
Kellogg Co. | | | 6,778 | | | | 346,220 | |
Kraft Foods, Inc. Class A | | | 46,448 | | | | 1,463,576 | |
The Kroger Co. | | | 16,956 | | | | 379,136 | |
McCormick & Co., Inc. | | | 3,523 | | | | 163,925 | |
Safeway, Inc. | | | 9,884 | | | | 222,291 | |
Sara Lee Corp. | | | 16,931 | | | | 296,462 | |
SUPERVALU, Inc. | | | 5,471 | | | | 52,686 | |
Sysco Corp. | | | 15,577 | | | | 457,964 | |
Tyson Foods, Inc. Class A | | | 7,897 | | | | 135,986 | |
Whole Foods Market, Inc. (a) | | | 3,885 | | | | 196,542 | |
| | | | | | | | |
| | | | | | | 5,723,660 | |
| | | | | | | | |
| Forest Products & Paper — 0.3% | | | | | |
International Paper Co. | | | 11,627 | | | | 316,719 | |
MeadWestvaco Corp. | | | 4,442 | | | | 116,203 | |
Plum Creek Timber Co., Inc. | | | 4,307 | | | | 161,297 | |
Weyerhaeuser Co. | | | 14,235 | | | | 269,469 | |
| | | | | | | | |
| | | | | | | 863,688 | |
| | | | | | | | |
| | | | | | | | |
| | | Number of
Shares | | | Value | |
| Gas — 0.2% | | | | | | | | |
Nicor, Inc. | | | 1,183 | | | $ | 59,055 | |
NiSource, Inc. | | | 7,314 | | | | 128,873 | |
Sempra Energy | | | 6,365 | | | | 334,035 | |
| | | | | | | | |
| | | | | | | 521,963 | |
| | | | | | | | |
| Hand & Machine Tools — 0.1% | | | | | | | | |
Snap-on, Inc. | | | 1,560 | | | | 88,265 | |
Stanley Black & Decker, Inc. | | | 4,411 | | | | 294,963 | |
| | | | | | | | |
| | | | | | | 383,228 | |
| | | | | | | | |
| Health Care – Products — 3.0% | | | | | | | | |
Baxter International, Inc. | | | 15,482 | | | | 783,699 | |
Becton, Dickinson & Co. | | | 6,136 | | | | 518,615 | |
Boston Scientific Corp. (a) | | | 40,246 | | | | 304,662 | |
C.R. Bard, Inc. | | | 2,485 | | | | 228,049 | |
CareFusion Corp. (a) | | | 5,896 | | | | 151,527 | |
Intuitive Surgical, Inc. (a) | | | 1,040 | | | | 268,060 | |
Johnson & Johnson | | | 72,992 | | | | 4,514,555 | |
Medtronic, Inc. | | | 28,692 | | | | 1,064,186 | |
St. Jude Medical, Inc. (a) | | | 9,118 | | | | 389,795 | |
Stryker Corp. | | | 9,072 | | | | 487,166 | |
Varian Medical Systems, Inc. (a) | | | 3,155 | | | | 218,578 | |
Zimmer Holdings, Inc. (a) | | | 5,242 | | | | 281,391 | |
| | | | | | | | |
| | | | | | | 9,210,283 | |
| | | | | | | | |
| Health Care – Services — 1.3% | | | | | | | | |
Aetna, Inc. | | | 10,614 | | | | 323,833 | |
CIGNA Corp. | | | 7,171 | | | | 262,889 | |
Coventry Health Care, Inc. (a) | | | 3,921 | | | | 103,514 | |
DaVita, Inc. (a) | | | 2,590 | | | | 179,979 | |
Humana, Inc. (a) | | | 4,451 | | | | 243,648 | |
Laboratory Corporation of America Holdings (a) | | | 2,717 | | | | 238,879 | |
Quest Diagnostics, Inc. | | | 3,759 | | | | 202,873 | |
Tenet Healthcare Corp. (a) | | | 12,844 | | | | 85,926 | |
Thermo Fisher Scientific, Inc. (a) | | | 10,563 | | | | 584,768 | |
UnitedHealth Group, Inc. | | | 29,235 | | | | 1,055,676 | |
WellPoint, Inc. (a) | | | 10,460 | | | | 594,756 | |
| | | | | | | | |
| | | | | | | 3,876,741 | |
| | | | | | | | |
| Holding Company – Diversified — 0.1% | |
Leucadia National Corp. | | | 5,212 | | | | 152,086 | |
| | | | | | | | |
| Home Builders — 0.1% | | | | | | | | |
D.R. Horton, Inc. | | | 7,409 | | | | 88,390 | |
Lennar Corp. Class A | | | 4,228 | | | | 79,275 | |
Pulte Group, Inc. (a) | | | 8,841 | | | | 66,484 | |
| | | | | | | | |
| | | | | | | 234,149 | |
| | | | | | | | |
| Home Furnishing — 0.1% | | | | | | | | |
Harman International Industries, Inc. (a) | | | 1,835 | | | | 84,960 | |
Whirlpool Corp. | | | 2,020 | | | | 179,437 | |
| | | | | | | | |
| | | | | | | 264,397 | |
| | | | | | | | |
The accompanying notes are an integral part of the financial statements.
31
MML Equity Index Fund – Portfolio of Investments (Continued)
| | | | | | | | |
| | | Number of
Shares | | | Value | |
| Household Products — 0.4% | | | | | | | | |
Avery Dennison Corp. | | | 2,874 | | | $ | 121,685 | |
The Clorox Co. | | | 3,730 | | | | 236,034 | |
Fortune Brands, Inc. | | | 4,051 | | | | 244,073 | |
Kimberly-Clark Corp. | | | 10,871 | | | | 685,308 | |
| | | | | | | | |
| | | | | | | 1,287,100 | |
| | | | | | | | |
| Housewares — 0.0% | | | | | | | | |
Newell Rubbermaid, Inc. | | | 7,663 | | | | 139,313 | |
| | | | | | | | |
| Insurance — 3.9% | | | | | | | | |
ACE Ltd. | | | 9,031 | | | | 562,180 | |
Aflac, Inc. | | | 12,507 | | | | 705,770 | |
The Allstate Corp. | | | 14,312 | | | | 456,267 | |
American International Group, Inc. (a) | | | 3,705 | | | | 213,482 | |
Aon Corp. | | | 8,789 | | | | 404,382 | |
Assurant, Inc. | | | 2,809 | | | | 108,203 | |
Berkshire Hathaway, Inc. Class B (a) | | | 46,007 | | | | 3,685,621 | |
The Chubb Corp. | | | 8,112 | | | | 483,800 | |
Cincinnati Financial Corp. | | | 4,356 | | | | 138,042 | |
Genworth Financial, Inc. Class A (a) | | | 12,968 | | | | 170,399 | |
The Hartford Financial Services Group, Inc. | | | 11,821 | | | | 313,138 | |
Lincoln National Corp. | | | 8,405 | | | | 233,743 | |
Loews Corp. | | | 8,436 | | | | 328,245 | |
Marsh & McLennan Cos., Inc. | | | 14,463 | | | | 395,418 | |
MetLife, Inc. | | | 24,099 | | | | 1,070,959 | |
Principal Financial Group, Inc. | | | 8,468 | | | | 275,718 | |
The Progressive Corp. | | | 17,564 | | | | 348,997 | |
Prudential Financial, Inc. | | | 12,911 | | | | 758,005 | |
Torchmark Corp. | | | 2,138 | | | | 127,724 | |
The Travelers Cos., Inc. | | | 12,217 | | | | 680,609 | |
Unum Group | | | 8,454 | | | | 204,756 | |
XL Group PLC | | | 8,543 | | | | 186,408 | |
| | | | | | | | |
| | | | | | | 11,851,866 | |
| | | | | | | | |
| Internet — 3.0% | | | | | | | | |
Akamai Technologies, Inc. (a) | | | 4,837 | | | | 227,581 | |
Amazon.com, Inc. (a) | | | 9,424 | | | | 1,696,320 | |
eBay, Inc. (a) | | | 30,487 | | | | 848,453 | |
Expedia, Inc. | | | 5,350 | | | | 134,232 | |
F5 Networks, Inc. (a) | | | 2,151 | | | | 279,974 | |
Google, Inc. Class A (a) | | | 6,631 | | | | 3,938,615 | |
McAfee, Inc. (a) | | | 4,095 | | | | 189,639 | |
Netflix, Inc. (a) | | | 1,153 | | | | 202,582 | |
Priceline.com, Inc. (a) | | | 1,304 | | | | 521,013 | |
Symantec Corp. (a) | | | 20,590 | | | | 344,677 | |
VeriSign, Inc. | | | 4,582 | | | | 149,694 | |
Yahoo!, Inc. (a) | | | 34,640 | | | | 576,063 | |
| | | | | | | | |
| | | | | | | 9,108,843 | |
| | | | | | | | |
| Iron & Steel — 0.3% | |
AK Steel Holding Corp. | | | 2,887 | | | | 47,260 | |
Allegheny Technologies, Inc. | | | 2,619 | | | | 144,517 | |
| | | | | | | | |
| | | Number of
Shares | | | Value | |
Cliffs Natural Resources, Inc. | | | 3,592 | | | $ | 280,212 | |
Nucor Corp. | | | 8,417 | | | | 368,833 | |
United States Steel Corp. | | | 3,815 | | | | 222,872 | |
| | | | | | | | |
| | | | | | | 1,063,694 | |
| | | | | | | | |
| Leisure Time — 0.2% | |
Carnival Corp. | | | 11,439 | | | | 527,452 | |
Harley-Davidson, Inc. | | | 6,253 | | | | 216,792 | |
| | | | | | | | |
| | | | | | | 744,244 | |
| | | | | | | | |
| Lodging — 0.3% | |
Marriott International, Inc. Class A | | | 7,662 | | | | 318,280 | |
Starwood Hotels & Resorts
Worldwide, Inc. | | | 5,066 | | | | 307,912 | |
Wyndham Worldwide Corp. | | | 4,639 | | | | 138,984 | |
Wynn Resorts Ltd. | | | 2,010 | | | | 208,718 | |
| | | | | | | | |
| | | | | | | 973,894 | |
| | | | | | | | |
| Machinery – Construction & Mining — 0.6% | |
Caterpillar, Inc. | | | 16,874 | | | | 1,580,419 | |
Ingersoll-Rand PLC | | | 8,599 | | | | 404,927 | |
| | | | | | | | |
| | | | | | | 1,985,346 | |
| | | | | | | | |
| Machinery – Diversified — 0.9% | |
Cummins, Inc. | | | 5,248 | | | | 577,333 | |
Deere & Co. | | | 11,273 | | | | 936,223 | |
Eaton Corp. | | | 4,473 | | | | 454,054 | |
Flowserve Corp. | | | 1,478 | | | | 176,207 | |
Rockwell Automation, Inc. | | | 3,762 | | | | 269,773 | |
Roper Industries, Inc. | | | 2,517 | | | | 192,374 | |
| | | | | | | | |
| | | | | | | 2,605,964 | |
| | | | | | | | |
| Manufacturing — 3.6% | |
3M Co. | | | 19,024 | | | | 1,641,771 | |
Danaher Corp. | | | 14,259 | | | | 672,597 | |
Dover Corp. | | | 4,956 | | | | 289,678 | |
General Electric Co. | | | 283,291 | | | | 5,181,393 | |
Honeywell International, Inc. | | | 20,738 | | | | 1,102,432 | |
Illinois Tool Works, Inc. | | | 13,193 | | | | 704,506 | |
ITT Corp. | | | 4,885 | | | | 254,557 | |
Leggett & Platt, Inc. | | | 3,884 | | | | 88,400 | |
Pall Corp. | | | 3,047 | | | | 151,070 | |
Parker Hannifin Corp. | | | 4,281 | | | | 369,450 | |
Textron, Inc. | | | 7,270 | | | | 171,863 | |
Tyco International Ltd. | | | 13,013 | | | | 539,259 | |
| | | | | | | | |
| | | | | | | 11,166,976 | |
| | | | | | | | |
| Media — 2.9% | |
Cablevision Systems Corp. Class A | | | 6,385 | | | | 216,068 | |
CBS Corp. Class B | | | 18,041 | | | | 343,681 | |
Comcast Corp. Class A | | | 74,217 | | | | 1,630,547 | |
DIRECTV Class A (a) | | | 22,188 | | | | 885,967 | |
Discovery Communications, Inc. Series A (a) | | | 7,547 | | | | 314,710 | |
Gannett Co., Inc. | | | 6,260 | | | | 94,463 | |
The McGraw-Hill Cos., Inc. | | | 8,156 | | | | 296,960 | |
The accompanying notes are an integral part of the financial statements.
32
MML Equity Index Fund – Portfolio of Investments (Continued)
| | | | | | | | |
| | | Number of
Shares | | | Value | |
Meredith Corp. | | | 986 | | | $ | 34,165 | |
News Corp. Class A | | | 60,653 | | | | 883,108 | |
Scripps Networks Interactive Class A | | | 2,385 | | | | 123,424 | |
Time Warner Cable, Inc. | | | 9,477 | | | | 625,766 | |
Time Warner, Inc. | | | 29,510 | | | | 949,337 | |
Viacom, Inc. Class B | | | 16,072 | | | | 636,612 | |
The Walt Disney Co. | | | 50,320 | | | | 1,887,503 | |
The Washington Post Co. Class B | | | 147 | | | | 64,607 | |
| | | | | | | | |
| | | | | | | 8,986,918 | |
| | | | | | | | |
| Metal Fabricate & Hardware — 0.2% | |
Precision Castparts Corp. | | | 3,784 | | | | 526,771 | |
| | | | | | | | |
| Mining — 1.0% | |
Alcoa, Inc. | | | 27,164 | | | | 418,054 | |
Freeport-McMoRan Copper & Gold, Inc. | | | 12,513 | | | | 1,502,686 | |
Newmont Mining Corp. | | | 13,093 | | | | 804,303 | |
Titanium Metals Corp. (a) | | | 2,370 | | | | 40,717 | |
Vulcan Materials Co. | | | 3,407 | | | | 151,134 | |
| | | | | | | | |
| | | | | | | 2,916,894 | |
| | | | | | | | |
| Office Equipment/Supplies — 0.2% | |
Pitney Bowes, Inc. | | | 5,479 | | | | 132,482 | |
Xerox Corp. | | | 36,853 | | | | 424,547 | |
| | | | | | | | |
| | | | | | | 557,029 | |
| | | | | | | | |
| Oil & Gas — 9.3% | |
Anadarko Petroleum Corp. | | | 13,169 | | | | 1,002,951 | |
Apache Corp. | | | 10,160 | | | | 1,211,377 | |
Cabot Oil & Gas Corp. | | | 2,754 | | | | 104,239 | |
Chesapeake Energy Corp. | | | 17,396 | | | | 450,730 | |
Chevron Corp. | | | 53,524 | | | | 4,884,065 | |
ConocoPhillips | | | 39,083 | | | | 2,661,552 | |
Denbury Resources, Inc. (a) | | | 10,579 | | | | 201,953 | |
Devon Energy Corp. | | | 11,493 | | | | 902,315 | |
Diamond Offshore Drilling, Inc. | | | 1,850 | | | | 123,710 | |
EOG Resources, Inc. | | | 6,747 | | | | 616,743 | |
EQT Corp. | | | 3,940 | | | | 176,670 | |
Exxon Mobil Corp. | | | 134,065 | | | | 9,802,833 | |
Helmerich & Payne, Inc. | | | 2,819 | | | | 136,665 | |
Hess Corp. | | | 7,970 | | | | 610,024 | |
Marathon Oil Corp. | | | 18,870 | | | | 698,756 | |
Murphy Oil Corp. | | | 5,099 | | | | 380,130 | |
Nabors Industries Ltd. (a) | | | 7,570 | | | | 177,592 | |
Newfield Exploration Co. (a) | | | 3,561 | | | | 256,784 | |
Noble Energy, Inc. | | | 4,653 | | | | 400,530 | |
Occidental Petroleum Corp. | | | 21,607 | | | | 2,119,647 | |
Pioneer Natural Resources Co. | | | 3,068 | | | | 266,364 | |
QEP Resources, Inc. | | | 4,644 | | | | 168,624 | |
Range Resources Corp. | | | 4,242 | | | | 190,805 | |
Rowan Cos., Inc. (a) | | | 3,344 | | | | 116,739 | |
Southwestern Energy Co. (a) | | | 9,187 | | | | 343,869 | |
Sunoco, Inc. | | | 3,200 | | | | 128,992 | |
Tesoro Corp. (a) | | | 3,750 | | | | 69,525 | |
| | | | | | | | |
| | | Number of
Shares | | | Value | |
Valero Energy Corp. | | | 15,056 | | | $ | 348,095 | |
| | | | | | | | |
| | | | | | | 28,552,279 | |
| | | | | | | | |
| Oil & Gas Services — 2.0% | | | | | |
Baker Hughes, Inc. | | | 11,485 | | | | 656,597 | |
Cameron International Corp. (a) | | | 6,438 | | | | 326,600 | |
FMC Technologies, Inc. (a) | | | 3,179 | | | | 282,645 | |
Halliburton Co. | | | 24,160 | | | | 986,453 | |
National Oilwell Varco, Inc. | | | 11,160 | | | | 750,510 | |
Schlumberger Ltd. | | | 36,276 | | | | 3,029,046 | |
| | | | | | | | |
| | | | | | | 6,031,851 | |
| | | | | | | | |
| Packaging & Containers — 0.2% | | | | | |
Ball Corp. | | | 2,380 | | | | 161,959 | |
Bemis Co., Inc. | | | 2,908 | | | | 94,975 | |
Owens-IIlinois, Inc. (a) | | | 4,360 | | | | 133,852 | |
Sealed Air Corp. | | | 4,210 | | | | 107,145 | |
| | | | | | | | |
| | | | | | | 497,931 | |
| | | | | | | | |
| Pharmaceuticals — 5.1% | | | | | |
Abbott Laboratories | | | 41,075 | | | | 1,967,903 | |
Allergan, Inc. | | | 8,140 | | | | 558,974 | |
AmerisourceBergen Corp. | | | 7,140 | | | | 243,617 | |
Bristol-Myers Squibb Co. | | | 45,279 | | | | 1,198,988 | |
Cardinal Health, Inc. | | | 9,134 | | | | 349,923 | |
Cephalon, Inc. (a) | | | 1,998 | | | | 123,317 | |
DENTSPLY International, Inc. | | | 3,766 | | | | 128,684 | |
Eli Lilly & Co. | | | 26,744 | | | | 937,110 | |
Express Scripts, Inc. (a) | | | 14,004 | | | | 756,916 | |
Forest Laboratories, Inc. (a) | | | 7,387 | | | | 236,236 | |
Gilead Sciences, Inc. (a) | | | 21,547 | | | | 780,863 | |
Hospira, Inc. (a) | | | 4,439 | | | | 247,208 | |
King Pharmaceuticals, Inc. (a) | | | 2,422 | | | | 34,029 | |
Mead Johnson Nutrition Co. | | | 5,432 | | | | 338,142 | |
Medco Health Solutions, Inc. (a) | | | 11,268 | | | | 690,390 | |
Merck & Co., Inc. | | | 81,676 | | | | 2,943,603 | |
Mylan, Inc. (a) | | | 11,336 | | | | 239,530 | |
Patterson Cos., Inc. | | | 2,555 | | | | 78,260 | |
Pfizer, Inc. | | | 212,460 | | | | 3,720,175 | |
Watson Pharmaceuticals, Inc. (a) | | | 3,237 | | | | 167,191 | |
| | | | | | | | |
| | | | | | | 15,741,059 | |
| | | | | | | | |
| Pipelines — 0.4% | | | | | |
El Paso Corp. | | | 18,651 | | | | 256,638 | |
ONEOK, Inc. | | | 2,826 | | | | 156,758 | |
Spectra Energy Corp. | | | 17,228 | | | | 430,527 | |
The Williams Cos., Inc. | | | 15,501 | | | | 383,185 | |
| | | | | | | | |
| | | | | | | 1,227,108 | |
| | | | | | | | |
| Real Estate — 0.1% | | | | | |
CB Richard Ellis Group, Inc. Class A (a) | | | 7,709 | | | | 157,880 | |
| | | | | | | | |
| Real Estate Investment Trusts (REITS) — 1.3% | |
Apartment Investment & Management Co.
Class A | | | 3,083 | | | | 79,665 | |
The accompanying notes are an integral part of the financial statements.
33
MML Equity Index Fund – Portfolio of Investments (Continued)
| | | | | | | | |
| | | Number of
Shares | | | Value | |
AvalonBay Communities, Inc. | | | 2,261 | | | $ | 254,476 | |
Boston Properties, Inc. | | | 3,729 | | | | 321,067 | |
Equity Residential | | | 7,588 | | | | 394,197 | |
HCP, Inc. | | | 9,683 | | | | 356,238 | |
Health Care REIT, Inc. | | | 3,866 | | | | 184,176 | |
Host Hotels & Resorts, Inc. | | | 17,661 | | | | 315,602 | |
Kimco Realty Corp. | | | 10,754 | | | | 194,002 | |
ProLogis | | | 15,076 | | | | 217,697 | |
Public Storage | | | 3,710 | | | | 376,268 | |
Simon Property Group, Inc. | | | 7,783 | | | | 774,331 | |
Ventas, Inc. | | | 4,192 | | | | 219,996 | |
Vornado Realty Trust | | | 4,322 | | | | 360,152 | |
| | | | | | | | |
| | | | | | | 4,047,867 | |
| | | | | | | | |
| Retail — 6.1% | | | | | | | | |
Abercrombie & Fitch Co. Class A | | | 2,328 | | | | 134,163 | |
AutoNation, Inc. (a) | | | 1,692 | | | | 47,714 | |
AutoZone, Inc. (a) | | | 729 | | | | 198,718 | |
Bed Bath & Beyond, Inc. (a) | | | 6,887 | | | | 338,496 | |
Best Buy Co., Inc. | | | 8,770 | | | | 300,723 | |
Big Lots, Inc. (a) | | | 2,000 | | | | 60,920 | |
CarMax, Inc. (a) | | | 5,954 | | | | 189,814 | |
Coach, Inc. | | | 7,875 | | | | 435,566 | |
Costco Wholesale Corp. | | | 11,495 | | | | 830,054 | |
CVS Caremark Corp. | | | 36,156 | | | | 1,257,144 | |
Darden Restaurants, Inc. | | | 3,667 | | | | 170,295 | |
Family Dollar Stores, Inc. | | | 3,344 | | | | 166,230 | |
GameStop Corp. Class A (a) | | | 4,007 | | | | 91,680 | |
The Gap, Inc. | | | 11,689 | | | | 258,794 | |
The Home Depot, Inc. | | | 43,589 | | | | 1,528,230 | |
J.C. Penney Co., Inc. | | | 6,273 | | | | 202,681 | |
Kohl’s Corp. (a) | | | 7,769 | | | | 422,167 | |
Limited Brands, Inc. | | | 7,033 | | | | 216,124 | |
Lowe’s Cos., Inc. | | | 36,687 | | | | 920,110 | |
Macy’s, Inc. | | | 11,240 | | | | 284,372 | |
McDonald’s Corp. | | | 28,099 | | | | 2,156,879 | |
Nordstrom, Inc. | | | 4,473 | | | | 189,566 | |
O’Reilly Automotive, Inc. (a) | | | 3,718 | | | | 224,642 | |
Polo Ralph Lauren Corp. | | | 1,715 | | | | 190,228 | |
RadioShack Corp. | | | 3,018 | | | | 55,803 | |
Ross Stores, Inc. | | | 3,208 | | | | 202,906 | |
Sears Holdings Corp. (a) | | | 1,160 | | | | 85,550 | |
Staples, Inc. | | | 19,219 | | | | 437,617 | |
Starbucks Corp. | | | 19,673 | | | | 632,094 | |
Target Corp. | | | 18,838 | | | | 1,132,729 | |
Tiffany & Co. | | | 3,351 | | | | 208,667 | |
The TJX Cos., Inc. | | | 10,521 | | | | 467,027 | |
Urban Outfitters, Inc. (a) | | | 3,410 | | | | 122,112 | |
Wal-Mart Stores, Inc. | | | 52,119 | | | | 2,810,778 | |
Walgreen Co. | | | 24,601 | | | | 958,455 | |
Yum! Brands, Inc. | | | 12,446 | | | | 610,476 | |
| | | | | | | | |
| | | | | | | 18,539,524 | |
| | | | | | | | |
| | | | | | | | |
| | | Number of
Shares | | | Value | |
| Savings & Loans — 0.1% | | | | | | | | |
Hudson City Bancorp, Inc. | | | 13,808 | | | $ | 175,914 | |
People’s United Financial, Inc. | | | 9,693 | | | | 135,799 | |
| | | | | | | | |
| | | | | | | 311,713 | |
| | | | | | | | |
| Semiconductors — 2.4% | | | | | | | | |
Advanced Micro Devices, Inc. (a) | | | 15,212 | | | | 124,434 | |
Altera Corp. | | | 8,295 | | | | 295,136 | |
Analog Devices, Inc. | | | 7,924 | | | | 298,497 | |
Applied Materials, Inc. | | | 35,540 | | | | 499,337 | |
Broadcom Corp. Class A | | | 12,086 | | | | 526,345 | |
Intel Corp. | | | 148,331 | | | | 3,119,401 | |
KLA-Tencor Corp. | | | 4,445 | | | | 171,755 | |
Linear Technology Corp. | | | 6,026 | | | | 208,439 | |
LSI Corp. (a) | | | 16,290 | | | | 97,577 | |
MEMC Electronic Materials, Inc. (a) | | | 6,040 | | | | 68,011 | |
Microchip Technology, Inc. | | | 4,982 | | | | 170,434 | |
Micron Technology, Inc. (a) | | | 22,761 | | | | 182,543 | |
National Semiconductor Corp. | | | 6,404 | | | | 88,119 | |
Novellus Systems, Inc. (a) | | | 2,390 | | | | 77,245 | |
NVIDIA Corp. (a) | | | 15,396 | | | | 237,099 | |
QLogic Corp. (a) | | | 2,766 | | | | 47,077 | |
Teradyne, Inc. (a) | | | 4,803 | | | | 67,434 | |
Texas Instruments, Inc. | | | 31,201 | | | | 1,014,033 | |
Xilinx, Inc. | | | 6,903 | | | | 200,049 | |
| | | | | | | | |
| | | | | | | 7,492,965 | |
| | | | | | | | |
| Software — 4.0% | | | | | | | | |
Adobe Systems, Inc. (a) | | | 13,494 | | | | 415,345 | |
Autodesk, Inc. (a) | | | 6,026 | | | | 230,193 | |
BMC Software, Inc. (a) | | | 4,732 | | | | 223,067 | |
CA, Inc. | | | 10,227 | | | | 249,948 | |
Cerner Corp. (a) | | | 1,891 | | | | 179,153 | |
Citrix Systems, Inc. (a) | | | 4,979 | | | | 340,613 | |
Compuware Corp. (a) | | | 5,789 | | | | 67,558 | |
Dun & Bradstreet Corp. | | | 1,340 | | | | 110,001 | |
Electronic Arts, Inc. (a) | | | 8,769 | | | | 143,636 | |
Fidelity National Information
Services, Inc. | | | 7,055 | | | | 193,236 | |
Fiserv, Inc. (a) | | | 3,970 | | | | 232,483 | |
Intuit, Inc. (a) | | | 7,417 | | | | 365,658 | |
Microsoft Corp. | | | 200,128 | | | | 5,587,574 | |
Novell, Inc. (a) | | | 9,206 | | | | 54,500 | |
Oracle Corp. | | | 102,863 | | | | 3,219,612 | |
Red Hat, Inc. (a) | | | 5,039 | | | | 230,030 | |
Salesforce.com, Inc. (a) | | | 3,142 | | | | 414,744 | |
| | | | | | | | |
| | | | | | | 12,257,351 | |
| | | | | | | | |
| Telecommunications — 5.5% | | | | | | | | |
American Tower Corp. Class A (a) | | | 10,614 | | | | 548,107 | |
AT&T, Inc. | | | 157,159 | | | | 4,617,331 | |
CenturyLink, Inc. | | | 8,058 | | | | 372,038 | |
Cisco Systems, Inc. (a) | | | 147,322 | | | | 2,980,324 | |
Corning, Inc. | | | 41,587 | | | | 803,461 | |
The accompanying notes are an integral part of the financial statements.
34
MML Equity Index Fund – Portfolio of Investments (Continued)
| | | | | | | | |
| | | Number of
Shares | | | Value | |
Frontier Communications Corp. | | | 26,429 | | | $ | 257,154 | |
Harris Corp. | | | 3,420 | | | | 154,926 | |
JDS Uniphase Corp. (a) | | | 5,851 | | | | 84,722 | |
Juniper Networks, Inc. (a) | | | 13,903 | | | | 513,299 | |
MetroPCS Communications, Inc. (a) | | | 6,957 | | | | 87,867 | |
Motorola, Inc. (a) | | | 62,386 | | | | 565,841 | |
QUALCOMM, Inc. | | | 42,999 | | | | 2,128,021 | |
Qwest Communications International, Inc. | | | 46,210 | | | | 351,658 | |
Sprint Nextel Corp. (a) | | | 79,193 | | | | 334,986 | |
Tellabs, Inc. | | | 9,746 | | | | 66,078 | |
Verizon Communications, Inc. | | | 75,149 | | | | 2,688,831 | |
Windstream Corp. | | | 12,872 | | | | 179,436 | |
| | | | | | | | |
| | | | | | | 16,734,080 | |
| | | | | | | | |
| Textiles — 0.0% | | | | | | | | |
Cintas Corp. | | | 3,379 | | | | 94,477 | |
| | | | | | | | |
| Toys, Games & Hobbies — 0.1% | | | | | |
Hasbro, Inc. | | | 3,628 | | | | 171,169 | |
Mattel, Inc. | | | 9,551 | | | | 242,882 | |
| | | | | | | | |
| | | | | | | 414,051 | |
| | | | | | | | |
| Transportation — 1.9% | | | | | | | | |
C.H. Robinson Worldwide, Inc. | | | 4,406 | | | | 353,317 | |
CSX Corp. | | | 9,936 | | | | 641,965 | |
Expeditors International of Washington, Inc. | | | 5,643 | | | | 308,108 | |
FedEx Corp. | | | 8,364 | | | | 777,936 | |
Norfolk Southern Corp. | | | 9,662 | | | | 606,967 | |
Ryder System, Inc. | | | 1,371 | | | | 72,169 | |
Union Pacific Corp. | | | 13,109 | | | | 1,214,680 | |
United Parcel Service, Inc. Class B | | | 26,304 | | | | 1,909,144 | |
| | | | | | | | |
| | | | | | | 5,884,286 | |
| | | | | | | | |
| | |
TOTAL COMMON STOCK
(Cost $257,584,885) | | | | | | | 303,709,383 | |
| | | | | | | | |
| | |
TOTAL EQUITIES
(Cost $257,584,885) | | | | | | | 303,709,383 | |
| | | | | | | | |
| | |
TOTAL LONG-TERM INVESTMENTS
(Cost $257,584,885) | | | | | | | 303,709,383 | |
| | | | | | | | |
| | |
| | | Principal
Amount | | | | |
|
| SHORT-TERM INVESTMENTS — 0.8% | |
| Repurchase Agreement — 0.6% | | | | | |
State Street Bank & Trust Co. Repurchase Agreement, dated 12/31/10, 0.010%, due 1/03/11 (b) | | $ | 1,814,217 | | | | 1,814,217 | |
| | | | | | | | |
| | | | | | | | |
| | | Principal
Amount | | | Value | |
| U.S. Treasury Bills — 0.2% | | | | | |
U.S. Treasury Bill (c)
0.170% 5/05/11 | | $ | 455,000 | | | $ | 454,734 | |
| | | | | | | | |
| | |
TOTAL SHORT-TERM
INVESTMENTS
(Cost $2,268,951) | | | | | | | 2,268,951 | |
| | | | | | | | |
| | |
TOTAL INVESTMENTS — 100.0%
(Cost $259,853,836) (d) | | | | | | | 305,978,334 | |
| | |
| Other Assets/(Liabilities) — 0.0% | | | | | | | 40,871 | |
| | | | | | | | |
| | |
| NET ASSETS — 100.0% | | | | | | $ | 306,019,205 | |
| | | | | | | | |
Notes to Portfolio of Investments
| (a) | Non-income producing security. |
| (b) | Maturity value of $1,814,219. Collateralized by U.S. Government Agency obligations with a rate of 4.000%, maturity date of 9/25/39, and an aggregate market value, including accrued interest, of $1,852,088. |
| (c) | This security is held as collateral for open futures contracts. (Note 2). |
| (d) | See Note 6 for aggregate cost for federal tax purposes. |
The accompanying notes are an integral part of the financial statements.
35
MML Large Cap Value Fund – Portfolio of Investments
December 31, 2010
| | | | | | | | |
| | | Number
of Shares | | | Value | |
| EQUITIES — 96.0% | | | | | | | | |
| |
| COMMON STOCK — 96.0% | | | | | |
| Aerospace & Defense — 0.6% | | | | | |
Lockheed Martin Corp. | | | 21,330 | | | $ | 1,491,180 | |
| | | | | | | | |
| Agriculture — 1.2% | | | | | | | | |
Philip Morris International, Inc. | | | 47,640 | | | | 2,788,369 | |
| | | | | | | | |
| Banks — 10.1% | | | | | | | | |
Bank of New York Mellon Corp. | | | 223,240 | | | | 6,741,848 | |
GAM Holding Ltd. (a) | | | 59,040 | | | | 976,192 | |
Julius Baer Group Ltd. | | | 95,740 | | | | 4,487,631 | |
Wells Fargo & Co. | | | 369,773 | | | | 11,459,265 | |
| | | | | | | | |
| | | | | | | 23,664,936 | |
| | | | | | | | |
| Beverages — 3.9% | | | | | | | | |
The Coca-Cola Co. | | | 52,530 | | | | 3,454,898 | |
Diageo PLC Sponsored ADR (United Kingdom) | | | 40,400 | | | | 3,002,932 | |
Heineken Holding NV Class A | | | 62,550 | | | | 2,728,603 | |
| | | | | | | | |
| | | | | | | 9,186,433 | |
| | | | | | | | |
| Building Materials — 0.7% | | | | | | | | |
Martin Marietta Materials, Inc. | | | 17,700 | | | | 1,632,648 | |
| | | | | | | | |
| Chemicals — 1.8% | | | | | | | | |
Air Products & Chemicals, Inc. | | | 5,720 | | | | 520,234 | |
Monsanto Co. | | | 34,980 | | | | 2,436,007 | |
Potash Corporation of Saskatchewan, Inc. | | | 5,032 | | | | 779,105 | |
Praxair, Inc. | | | 4,600 | | | | 439,162 | |
| | | | | | | | |
| | | | | | | 4,174,508 | |
| | | | | | | | |
| Coal — 0.7% | | | | | | | | |
China Coal Energy Co. Class H | | | 1,073,700 | | | | 1,676,258 | |
| | | | | | | | |
| Commercial Services — 2.3% | | | | | |
Iron Mountain, Inc. | | | 149,699 | | | | 3,743,972 | |
Moody’s Corp. | | | 35,090 | | | | 931,288 | |
PortX Operacoes Portuarias SA (a) | | | 28,300 | | | | 63,249 | |
Visa, Inc. Class A | | | 8,760 | | | | 616,529 | |
| | | | | | | | |
| | | | | | | 5,355,038 | |
| | | | | | | | |
| Computers — 0.8% | | | | | | | | |
Hewlett-Packard Co. | | | 45,100 | | | | 1,898,710 | |
| | | | | | | | |
| Cosmetics & Personal Care — 1.1% | | | | | |
Natura Cosmeticos SA | | | 13,700 | | | | 393,691 | |
The Procter & Gamble Co. | | | 33,760 | | | | 2,171,781 | |
| | | | | | | | |
| | | | | | | 2,565,472 | |
| | | | | | | | |
| Diversified Financial — 6.3% | |
American Express Co. | | | 241,400 | | | | 10,360,888 | |
Ameriprise Financial, Inc. | | | 44,890 | | | | 2,583,419 | |
The Charles Schwab Corp. | | | 7,400 | | | | 126,614 | |
The Goldman Sachs Group, Inc. | | | 8,800 | | | | 1,479,808 | |
JP Morgan Chase & Co. | | | 6,016 | | | | 255,199 | |
| | | | | | | | |
| | | | | | | 14,805,928 | |
| | | | | | | | |
| | | | | | | | |
| | | Number of
Shares | | | Value | |
| Electronics — 1.2% | |
Agilent Technologies, Inc. (a) | | | 67,990 | | | $ | 2,816,826 | |
| | | | | | | | |
| Foods — 0.9% | |
The Hershey Co. | | | 5,850 | | | | 275,828 | |
Kraft Foods, Inc. Class A | | | 22,300 | | | | 702,673 | |
Nestle SA | | | 6,600 | | | | 386,922 | |
Unilever NV NY Shares | | | 20,800 | | | | 653,120 | |
| | | | | | | | |
| | | | | | | 2,018,543 | |
| | | | | | | | |
| Forest Products & Paper — 1.1% | |
Sino-Forest Corp. (a) | | | 107,610 | | | | 2,519,591 | |
Sino-Forest Corp. (a) (b) (c) | | | 3,900 | | | | 91,315 | |
| | | | | | | | |
| | | | | | | 2,610,906 | |
| | | | | | | | |
| Health Care – Products — 4.2% | |
Baxter International, Inc. | | | 27,290 | | | | 1,381,420 | |
Becton, Dickinson & Co. | | | 29,500 | | | | 2,493,340 | |
Johnson & Johnson | | | 97,790 | | | | 6,048,311 | |
| | | | | | | | |
| | | | | | | 9,923,071 | |
| | | | | | | | |
| Holding Company – Diversified — 1.0% | |
China Merchants Holdings International Co. Ltd. | | | 602,337 | | | | 2,378,117 | |
| | | | | | | | |
| Housewares — 0.2% | |
Hunter Douglas NV | | | 6,765 | | | | 358,754 | |
| | | | | | | | |
| Insurance — 9.0% | |
Aon Corp. | | | 6,000 | | | | 276,060 | |
Berkshire Hathaway, Inc. Class A (a) | | | 31 | | | | 3,733,950 | |
Fairfax Financial Holdings Ltd. | | | 2,220 | | | | 909,223 | |
Fairfax Financial Holdings Ltd. (Subordinate Voting Shares) | | | 1,070 | | | | 439,951 | |
Loews Corp. | | | 190,050 | | | | 7,394,845 | |
Markel Corp. (a) | | | 595 | | | | 224,987 | |
The Progressive Corp. | | | 297,550 | | | | 5,912,319 | |
Transatlantic Holdings, Inc. | | | 42,743 | | | | 2,206,394 | |
| | | | | | | | |
| | | | | | | 21,097,729 | |
| | | | | | | | |
| Internet — 1.4% | |
Google, Inc. Class A (a) | | | 4,275 | | | | 2,539,222 | |
Liberty Media Corp.-Interactive
Class A (a) | | | 52,450 | | | | 827,136 | |
| | | | | | | | |
| | | | | | | 3,366,358 | |
| | | | | | | | |
| Leisure Time — 1.6% | |
Harley-Davidson, Inc. | | | 109,630 | | | | 3,800,872 | |
| | | | | | | | |
| Machinery – Construction & Mining — 1.2% | |
BHP Billiton PLC | | | 36,200 | | | | 1,443,800 | |
Rio Tinto PLC | | | 19,672 | | | | 1,380,161 | |
| | | | | | | | |
| | | | | | | 2,823,961 | |
| | | | | | | | |
| Manufacturing — 0.4% | | | | | | | | |
Tyco International Ltd. | | | 22,990 | | | | 952,706 | |
| | | | | | | | |
The accompanying notes are an integral part of the financial statements.
36
MML Large Cap Value Fund – Portfolio of Investments (Continued)
| | | | | | | | |
| | | Number of
Shares | | | Value | |
| Media — 0.7% | | | | | | | | |
Grupo Televisa SA Sponsored ADR (Mexico) (a) | | | 49,200 | | | $ | 1,275,756 | |
Liberty Media Corp.-Starz Series A (a) | | | 3,746 | | | | 249,034 | |
| | | | | | | | |
| | | | | | | 1,524,790 | |
| | | | | | | | |
| Mining — 0.3% | | | | | | | | |
Vulcan Materials Co. | | | 14,000 | | | | 621,040 | |
| | | | | | | | |
| Oil & Gas — 14.3% | | | | | | | | |
Canadian Natural Resources Ltd. | | | 136,880 | | | | 6,080,210 | |
Devon Energy Corp. | | | 105,440 | | | | 8,278,094 | |
EOG Resources, Inc. | | | 94,960 | | | | 8,680,293 | |
Occidental Petroleum Corp. | | | 95,330 | | | | 9,351,873 | |
OGX Petroleo e Gas Participacoes SA (a) | | | 110,000 | | | | 1,325,357 | |
| | | | | | | | |
| | | | | | | 33,715,827 | |
| | | | | | | | |
| Oil & Gas Services — 1.0% | | | | | | | | |
Schlumberger Ltd. | | | 5,600 | | | | 467,600 | |
Transocean Ltd. (a) | | | 26,459 | | | | 1,839,165 | |
| | | | | | | | |
| | | | | | | 2,306,765 | |
| | | | | | | | |
| Packaging & Containers — 2.3% | | | | | | | | |
Sealed Air Corp. | | | 216,000 | | | | 5,497,200 | |
| | | | | | | | |
| Pharmaceuticals — 7.2% | | | | | | | | |
Express Scripts, Inc. (a) | | | 78,380 | | | | 4,236,439 | |
Mead Johnson Nutrition Co. | | | 17,630 | | | | 1,097,468 | |
Merck & Co., Inc. | | | 195,205 | | | | 7,035,188 | |
Pfizer, Inc. | | | 257,900 | | | | 4,515,829 | |
| | | | | | | | |
| | | | | | | 16,884,924 | |
| | | | | | | | |
| Real Estate — 1.4% | | | | | | | | |
Brookfield Asset Management, Inc. Class A | | | 48,000 | | | | 1,597,920 | |
Hang Lung Properties Ltd. | | | 265,000 | | | | 1,744,962 | |
| | | | | | | | |
| | | | | | | 3,342,882 | |
| | | | | | | | |
| Retail — 11.9% | | | | | | | | |
Bed Bath & Beyond, Inc. (a) | | | 83,830 | | | | 4,120,245 | |
CarMax, Inc. (a) | | | 67,070 | | | | 2,138,192 | |
Costco Wholesale Corp. | | | 176,830 | | | | 12,768,894 | |
CVS Caremark Corp. | | | 258,268 | | | | 8,979,978 | |
| | | | | | | | |
| | | | | | | 28,007,309 | |
| | | | | | | | |
| Semiconductors — 2.0% | | | | | | | | |
Texas Instruments, Inc. | | | 145,800 | | | | 4,738,500 | |
| | | | | | | | |
| Software — 2.1% | | | | | | | | |
Activision Blizzard, Inc. | | | 108,470 | | | | 1,349,367 | |
Dun & Bradstreet Corp. | | | 11,450 | | | | 939,930 | |
Microsoft Corp. | | | 91,400 | | | | 2,551,888 | |
| | | | | | | | |
| | | | | | | 4,841,185 | |
| | | | | | | | |
| Telecommunications — 0.1% | | | | | | | | |
America Movil SAB de CV Sponsored ADR (Mexico) | | | 6,000 | | | | 344,040 | |
| | | | | | | | |
| | | | | | | | |
| | | Number of
Shares | | | Value | |
| Transportation — 1.0% | | | | | |
China Shipping Development Co. Ltd. Class H | | | 482,000 | | | $ | 642,056 | |
Kuehne & Nagel International AG | | | 12,400 | | | | 1,724,111 | |
LLX Logistica SA (a) | | | 28,300 | | | | 80,652 | |
| | | | | | | | |
| | | | | | | 2,446,819 | |
| | | | | | | | |
| | |
TOTAL COMMON STOCK
(Cost $182,801,563) | | | | | | | 225,658,604 | |
| | | | | | | | |
| | |
TOTAL EQUITIES
(Cost $182,801,563) | | | | | | | 225,658,604 | |
| | | | | | | | |
| | |
| | | Principal
Amount | | | | |
| BONDS & NOTES — 0.2% | | | | | |
| CORPORATE DEBT — 0.2% | | | | | |
| Forest Products & Paper — 0.2% | | | | | |
Sino-Forest Corp.
(Acquired 7/23/08,
Cost $350,424) (b) (d)
5.000% 8/01/13 | | $ | 359,000 | | | | 481,509 | |
| | | | | | | | |
TOTAL CORPORATE DEBT
(Cost $350,424) | | | | | | | 481,509 | |
| | | | | | | | |
| | |
TOTAL BONDS & NOTES
(Cost $350,424) | | | | | | | 481,509 | |
| | | | | | | | |
| | |
TOTAL LONG-TERM INVESTMENTS
(Cost $183,151,987) | | | | | | | 226,140,113 | |
| | | | | | | | |
|
| SHORT-TERM INVESTMENTS — 4.8% | |
| Repurchase Agreement — 4.8% | | | | | |
State Street Bank & Trust Co.
Repurchase Agreement, dated
12/31/10, 0.010%, due 1/03/11 (e) | | | 11,343,449 | | | | 11,343,449 | |
| | | | | | | | |
TOTAL SHORT-TERM INVESTMENTS
(Cost $11,343,449) | | | | | | | 11,343,449 | |
| | | | | | | | |
| | |
TOTAL INVESTMENTS — 101.0%
(Cost $194,495,436) (f) | | | | | | | 237,483,562 | |
| | |
| Other Assets/(Liabilities) — (1.0)% | | | | | | | (2,297,863 | ) |
| | | | | | | | |
| | |
| NET ASSETS — 100.0% | | | | | | $ | 235,185,699 | |
| | | | | | | | |
Notes to Portfolio of Investments
| ADR | American Depositary Receipt |
| (a) | Non-income producing security. |
| (b) | Securities exempt from registration under rule 144A of the Securities Act of 1933. These securities may be resold in transactions exempt from registration, normally to qualified institutional buyers. At December 31, 2010, these securities amounted to a value of $572,824 or 0.24% of net assets. |
The accompanying notes are an integral part of the financial statements.
37
MML Large Cap Value Fund – Portfolio of Investments (Continued)
Notes to Portfolio of Investments (Continued)
| (c) | This security is valued in good faith under procedures established by the Board of Trustees. |
| (d) | Restricted security. Certain securities are restricted as to resale. At December 31, 2010, these securities amounted to a value of $481,509 or 0.20% of net assets. The Fund generally bears the costs, if any, associated with the disposition of restricted securities. |
| (e) | Maturity value of $11,343,459. Collateralized by U.S. Government Agency obligations with a rate of 4.000%, maturity date of 8/15/39, and an aggregate market value, including accrued interest, of $11,570,330. |
| (f) | See Note 6 for aggregate cost for federal tax purposes. |
The accompanying notes are an integral part of the financial statements.
38
MML NASDAQ-100 Fund – Portfolio of Investments
December 31, 2010
| | | | | | | | |
| | | Number of
Shares | | | Value | |
| EQUITIES — 97.7% | | | | | | | | |
| |
| COMMON STOCK — 97.7% | | | | | |
| Auto Manufacturers — 1.1% | | | | | |
Paccar, Inc. | | | 2,372 | | | $ | 136,200 | |
| | | | | | | | |
| Biotechnology — 5.6% | | | | | | | | |
Amgen, Inc. (a) | | | 2,556 | | | | 140,325 | |
Biogen Idec, Inc. (a) | | | 1,504 | | | | 100,843 | |
Celgene Corp. (a) | | | 2,709 | | | | 160,210 | |
Genzyme Corp. (a) | | | 1,885 | | | | 134,212 | |
Illumina, Inc. (a) | | | 708 | | | | 44,845 | |
Life Technologies Corp. (a) | | | 1,098 | | | | 60,939 | |
Vertex Pharmaceuticals, Inc. (a) | | | 1,231 | | | | 43,122 | |
| | | | | | | | |
| | | | | | | 684,496 | |
| | | | | | | | |
| Chemicals — 0.4% | | | | | | | | |
Sigma-Aldrich Corp. | | | 677 | | | | 45,061 | |
| | | | | | | | |
| Commercial Services — 1.5% | | | | | |
Apollo Group, Inc. Class A (a) | | | 870 | | | | 34,357 | |
Automatic Data Processing, Inc. | | | 2,022 | | | | 93,578 | |
Paychex, Inc. | | | 1,988 | | | | 61,449 | |
| | | | | | | | |
| | | | | | | 189,384 | |
| | | | | | | | |
| Computers — 24.4% | | | | | | | | |
Apple, Inc. (a) | | | 7,427 | | | | 2,395,653 | |
Cognizant Technology Solutions Corp.
Class A (a) | | | 1,718 | | | | 125,912 | |
Dell, Inc. (a) | | | 4,161 | | | | 56,382 | |
NetApp, Inc. (a) | | | 2,167 | | | | 119,098 | |
Research In Motion Ltd. (a) | | | 3,037 | | | | 176,541 | |
SanDisk Corp. (a) | | | 1,387 | | | | 69,156 | |
Seagate Technology PLC (a) | | | 2,721 | | | | 40,897 | |
| | | | | | | | |
| | | | | | | 2,983,639 | |
| | | | | | | | |
| Distribution & Wholesale — 0.4% | | | | | |
Fastenal Co. | | | 818 | | | | 49,006 | |
| | | | | | | | |
| Electronics — 0.8% | | | | | | | | |
Flextronics International Ltd. (a) | | | 4,834 | | | | 37,947 | |
FLIR Systems, Inc. (a) | | | 961 | | | | 28,590 | |
Garmin Ltd. | | | 1,039 | | | | 32,198 | |
| | | | | | | | |
| | | | | | | 98,735 | |
| | | | | | | | |
| Energy – Alternate Sources — 0.5% | | | | | |
First Solar, Inc. (a) | | | 435 | | | | 56,611 | |
| | | | | | | | |
| Environmental Controls — 0.3% | | | | | |
Stericycle, Inc. (a) | | | 520 | | | | 42,078 | |
| | | | | | | | |
| Foods — 0.4% | | | | | | | | |
Whole Foods Market, Inc. (a) | | | 1,053 | | | | 53,271 | |
| | | | | | | | |
| Health Care – Products — 1.0% | | | | | |
Henry Schein, Inc. (a) | | | 539 | | | | 33,089 | |
Intuitive Surgical, Inc. (a) | | | 228 | | | | 58,767 | |
QIAGEN NV (a) | | | 1,371 | | | | 26,803 | |
| | | | | | | | |
| | | | | | | 118,659 | |
| | | | | | | | |
| | | | | | | | |
| | | Number of
Shares | | | Value | |
| Internet — 14.5% | | | | | | | | |
Akamai Technologies, Inc. (a) | | | 1,059 | | | $ | 49,826 | |
Amazon.com, Inc. (a) | | | 1,730 | | | | 311,400 | |
Baidu, Inc. Sponsored ADR (Cayman Islands) (a) | | | 1,592 | | | | 153,676 | |
Check Point Software Technologies Ltd. (a) | | | 1,195 | | | | 55,281 | |
Ctrip.com International Ltd. ADR (Cayman Islands) (a) | | | 888 | | | | 35,920 | |
eBay, Inc. (a) | | | 5,645 | | | | 157,100 | |
Expedia, Inc. | | | 1,577 | | | | 39,567 | |
F5 Networks, Inc. (a) | | | 451 | | | | 58,702 | |
Google, Inc. Class A (a) | | | 877 | | | | 520,912 | |
Liberty Media Corp.-Interactive Class A (a) | | | 3,184 | | | | 50,212 | |
Netflix, Inc. (a) | | | 289 | | | | 50,777 | |
Priceline.com, Inc. (a) | | | 302 | | | | 120,664 | |
Symantec Corp. (a) | | | 4,716 | | | | 78,946 | |
VeriSign, Inc. | | | 935 | | | | 30,546 | |
Yahoo!, Inc. (a) | | | 3,637 | | | | 60,483 | |
| | | | | | | | |
| | | | | | | 1,774,012 | |
| | | | | | | | |
| Lodging — 0.7% | | | | | | | | |
Wynn Resorts Ltd. | | | 782 | | | | 81,203 | |
| | | | | | | | |
| Machinery – Construction & Mining — 0.4% | | | | | |
Joy Global, Inc. | | | 589 | | | | 51,096 | |
| | | | | | | | |
| Media — 3.6% | | | | | | | | |
Comcast Corp. Class A | | | 8,406 | | | | 184,680 | |
DIRECTV Class A (a) | | | 3,528 | | | | 140,873 | |
News Corp. Class A | | | 8,270 | | | | 120,411 | |
| | | | | | | | |
| | | | | | | 445,964 | |
| | | | | | | | |
| Pharmaceuticals — 5.5% | | | | | | | | |
Cephalon, Inc. (a) | | | 425 | | | | 26,231 | |
DENTSPLY International, Inc. | | | 791 | | | | 27,028 | |
Express Scripts, Inc. (a) | | | 2,727 | | | | 147,394 | |
Gilead Sciences, Inc. (a) | | | 4,642 | | | | 168,226 | |
Mylan, Inc. (a) | | | 2,575 | | | | 54,410 | |
Teva Pharmaceutical Industries Ltd. Sponsored ADR (Israel) | | | 4,205 | | | | 219,207 | |
Warner Chilcott PLC Class A | | | 1,459 | | | | 32,915 | |
| | | | | | | | |
| | | | | | | 675,411 | |
| | | | | | | | |
| Retail — 5.5% | | | | | | | | |
Bed Bath & Beyond, Inc. (a) | | | 2,023 | | | | 99,430 | |
Costco Wholesale Corp. | | | 1,320 | | | | 95,317 | |
Dollar Tree, Inc. (a) | | | 766 | | | | 42,957 | |
O’Reilly Automotive, Inc. (a) | | | 812 | | | | 49,061 | |
Ross Stores, Inc. | | | 706 | | | | 44,655 | |
Sears Holdings Corp. (a) | | | 672 | | | | 49,560 | |
Staples, Inc. | | | 2,820 | | | | 64,211 | |
Starbucks Corp. | | | 5,973 | | | | 191,913 | |
Urban Outfitters, Inc. (a) | | | 943 | | | | 33,769 | |
| | | | | | | | |
| | | | | | | 670,873 | |
| | | | | | | | |
The accompanying notes are an integral part of the financial statements.
39
MML NASDAQ-100 Fund – Portfolio of Investments (Continued)
| | | | | | | | |
| | | Number of
Shares | | | Value | |
| Semiconductors — 7.6% | |
Altera Corp. | | | 2,551 | | | $ | 90,765 | |
Applied Materials, Inc. | | | 4,029 | | | | 56,607 | |
Broadcom Corp. Class A | | | 2,417 | | | | 105,260 | |
Intel Corp. | | | 11,344 | | | | 238,564 | |
KLA-Tencor Corp. | | | 1,169 | | | | 45,170 | |
Lam Research Corp. (a) | | | 736 | | | | 38,110 | |
Linear Technology Corp. | | | 1,756 | | | | 60,740 | |
Marvell Technology Group Ltd. (a) | | | 3,601 | | | | 66,799 | |
Maxim Integrated Products, Inc. | | | 1,703 | | | | 40,225 | |
Microchip Technology, Inc. | | | 895 | | | | 30,618 | |
Micron Technology, Inc. (a) | | | 5,923 | | | | 47,503 | |
NVIDIA Corp. (a) | | | 3,272 | | | | 50,389 | |
Xilinx, Inc. | | | 1,992 | | | | 57,728 | |
| | | | | | | | |
| | | | | | | 928,478 | |
| | | | | | | | |
| Software — 13.1% | |
Activision Blizzard, Inc. | | | 6,257 | | | | 77,837 | |
Adobe Systems, Inc. (a) | | | 2,897 | | | | 89,170 | |
Autodesk, Inc. (a) | | | 1,370 | | | | 52,334 | |
BMC Software, Inc. (a) | | | 1,198 | | | | 56,474 | |
CA, Inc. | | | 2,851 | | | | 69,678 | |
Cerner Corp. (a) | | | 482 | | | | 45,665 | |
Citrix Systems, Inc. (a) | | | 1,298 | | | | 88,796 | |
Electronic Arts, Inc. (a) | | | 1,932 | | | | 31,646 | |
Fiserv, Inc. (a) | | | 1,080 | | | | 63,245 | |
Infosys Technologies Ltd. Sponsored ADR (India) | | | 652 | | | | 49,604 | |
Intuit, Inc. (a) | | | 2,284 | | | | 112,601 | |
Microsoft Corp. | | | 17,094 | | | | 477,264 | |
Oracle Corp. | | | 12,163 | | | | 380,702 | |
| | | | | | | | |
| | | | | | | 1,595,016 | |
| | | | | | | | |
| Telecommunications — 8.7% | |
Cisco Systems, Inc. (a) | | | 11,496 | | | | 232,564 | |
Millicom International Cellular SA | | | 605 | | | | 57,838 | |
NII Holdings, Inc. (a) | | | 950 | | | | 42,427 | |
QUALCOMM, Inc. | | | 11,327 | | | | 560,573 | |
Virgin Media, Inc. | | | 1,920 | | | | 52,301 | |
Vodafone Group PLC Sponsored ADR (United Kingdom) | | | 4,244 | | | | 112,169 | |
| | | | | | | | |
| | | | | | | 1,057,872 | |
| | | | | | | | |
| Toys, Games & Hobbies — 0.5% | |
Mattel, Inc. | | | 2,380 | | | | 60,523 | |
| | | | | | | | |
| Transportation — 1.2% | | | | | | | | |
C.H. Robinson Worldwide, Inc. | | | 951 | | | | 76,261 | |
Expeditors International of Washington, Inc. | | | 1,208 | | | | 65,957 | |
| | | | | | | | |
| | | | | | | 142,218 | |
| | | | | | | | |
| | |
TOTAL COMMON STOCK
(Cost $8,277,489) | | | | | | | 11,939,806 | |
| | | | | | | | |
| | | | | | | | |
| | | Number of
Shares | | | Value | |
TOTAL EQUITIES
(Cost $8,277,489) | | | | | | $ | 11,939,806 | |
| | | | | | | | |
| | |
| MUTUAL FUNDS — 0.4% | | | | | | | | |
| Diversified Financial — 0.4% | | | | | |
PowerShares QQQ Trust, Series 1 | | | 775 | | | | 42,214 | |
| | | | | | | | |
| | |
TOTAL MUTUAL FUNDS
(Cost $34,495) | | | | | | | 42,214 | |
| | | | | | | | |
| | |
TOTAL LONG-TERM INVESTMENTS
(Cost $8,311,984) | | | | | | | 11,982,020 | |
| | | | | | | | |
| | |
| | | Principal
Amount | | | | |
| SHORT-TERM INVESTMENTS — 2.6% | |
| Repurchase Agreement — 2.2% | |
State Street Bank & Trust Co. Repurchase Agreement, dated 12/31/10, 0.010%, due 1/03/11 (b) | | $ | 269,983 | | | | 269,983 | |
| | | | | | | | |
| U.S. Treasury Bills — 0.4% | |
U.S. Treasury Bill (c)
0.170% 5/05/11 | | | 45,000 | | | | 44,974 | |
| | | | | | | | |
| | |
TOTAL SHORT-TERM INVESTMENTS
(Cost $314,957) | | | | | | | 314,957 | |
| | | | | | | | |
| | |
TOTAL INVESTMENTS — 100.7%
(Cost $8,626,941) (d) | | | | | | | 12,296,977 | |
| | |
| Other Assets/(Liabilities) — (0.7)% | | | | | | | (79,716 | ) |
| | | | | | | | |
| | |
| NET ASSETS — 100.0% | | | | | | $ | 12,217,261 | |
| | | | | | | | |
Notes to Portfolio of Investments
| ADR | American Depositary Receipt |
| (a) | Non-income producing security. |
| (b) | Maturity value of $269,983. Collateralized by U.S. Government Agency obligations with a rate of 4.000%, maturity date of 9/25/39, and an aggregate market value, including accrued interest, of $275,678. |
| (c) | This security is held as collateral for open futures contracts. (Note 2). |
| (d) | See Note 6 for aggregate cost for federal tax purposes. |
The accompanying notes are an integral part of the financial statements.
40
MML Small Cap Growth Equity Fund – Portfolio of Investments
December 31, 2010
| | | | | | | | |
| | | Number of
Shares | | | Value | |
| EQUITIES — 100.4% | | | | | | | | |
| |
| COMMON STOCK — 100.4% | | | | | |
| Advertising — 0.6% | | | | | | | | |
APAC Customer Services, Inc. (a) | | | 128,100 | | | $ | 777,567 | |
Harte-Hanks, Inc. | | | 62,300 | | | | 795,571 | |
| | | | | | | | |
| | | | | | | 1,573,138 | |
Aerospace & Defense — 0.6% | | | | | |
| | | | |
Cubic Corp. | | | 16,000 | | | | 754,400 | |
Teledyne Technologies, Inc. (a) | | | 21,100 | | | | 927,767 | |
| | | | | | | | |
| | | | | | | 1,682,167 | |
| | | | | | | | |
| Airlines — 1.0% | | | | | | | | |
Allegiant Travel Co. | | | 7,490 | | | | 368,808 | |
Copa Holdings SA Class A | | | 9,240 | | | | 543,681 | |
JetBlue Airways Corp. (a) | | | 131,420 | | | | 868,686 | |
US Airways Group, Inc. (a) | | | 74,800 | | | | 748,748 | |
| | | | | | | | |
| | | | | | | 2,529,923 | |
| | | | | | | | |
| Apparel — 2.3% | | | | | | | | |
Crocs, Inc. (a) | | | 23,200 | | | | 397,184 | |
Under Armour, Inc. Class A (a) | | | 102,460 | | | | 5,618,906 | |
| | | | | | | | |
| | | | | | | 6,016,090 | |
| | | | | | | | |
| Automotive & Parts — 1.1% | | | | | |
ArvinMeritor, Inc. (a) | | | 85,900 | | | | 1,762,668 | |
Tenneco, Inc. (a) | | | 24,900 | | | | 1,024,884 | |
| | | | | | | | |
| | | | | | | 2,787,552 | |
| | | | | | | | |
| Banks — 1.5% | | | | | | | | |
Boston Private Financial Holdings, Inc. | | | 112,900 | | | | 739,495 | |
CVB Financial Corp. | | | 65,600 | | | | 568,752 | |
East West Bancorp, Inc. | | | 13,600 | | | | 265,880 | |
MB Financial, Inc. | | | 40,600 | | | | 703,192 | |
Synovus Financial Corp. | | | 182,300 | | | | 481,272 | |
TCF Financial Corp. | | | 27,000 | | | | 399,870 | |
Umpqua Holdings Corp. | | | 68,500 | | | | 834,330 | |
| | | | | | | | |
| | | | | | | 3,992,791 | |
| | | | | | | | |
| Beverages — 0.6% | | | | | | | | |
Cott Corp. (a) | | | 70,500 | | | | 635,205 | |
Green Mountain Coffee Roasters, Inc. (a) | | | 27,120 | | | | 891,163 | |
| | | | | | | | |
| | | | | | | 1,526,368 | |
| | | | | | | | |
| Biotechnology — 1.0% | | | | | | | | |
Incyte Corp. (a) | | | 50,490 | | | | 836,114 | |
Regeneron Pharmaceuticals, Inc. (a) | | | 31,610 | | | | 1,037,756 | |
Seattle Genetics, Inc. (a) | | | 59,910 | | | | 895,655 | |
| | | | | | | | |
| | | | | | | 2,769,525 | |
| | | | | | | | |
| Building Materials — 0.6% | | | | | | | | |
Lennox International, Inc. | | | 22,200 | | | | 1,049,838 | |
Trex Co., Inc. (a) | | | 19,164 | | | | 459,169 | |
| | | | | | | | |
| | | | | | | 1,509,007 | |
| | | | | | | | |
| | | | | | | | |
| | | Number of
Shares | | | Value | |
| Chemicals — 1.2% | | | | | | | | |
Ferro Corp. (a) | | | 48,600 | | | $ | 711,504 | |
Georgia Gulf Corp. (a) | | | 7,500 | | | | 180,450 | |
Methanex Corp. | | | 52,980 | | | | 1,610,592 | |
Olin Corp. | | | 36,000 | | | | 738,720 | |
| | | | | | | | |
| | | | | | | 3,241,266 | |
| | | | | | | | |
| Commercial Services — 8.6% | | | | | |
The Advisory Board Co. (a) | | | 15,020 | | | | 715,403 | |
AerCap Holdings NV (a) | | | 80,600 | | | | 1,138,072 | |
Capella Education Co. (a) | | | 61,300 | | | | 4,081,354 | |
Convergys Corp. (a) | | | 77,000 | | | | 1,014,090 | |
Corrections Corporation of America (a) | | | 27,250 | | | | 682,885 | |
CoStar Group, Inc. (a) | | | 53,800 | | | | 3,096,728 | |
The Geo Group, Inc. (a) | | | 20,400 | | | | 503,064 | |
Healthspring, Inc. (a) | | | 29,600 | | | | 785,288 | |
HMS Holdings Corp. (a) | | | 11,200 | | | | 725,424 | |
Huron Consulting Group, Inc. (a) | | | 38,000 | | | | 1,005,100 | |
Localiza Rent a Car SA | | | 32,580 | | | | 528,067 | |
PAREXEL International Corp. (a) | | | 19,527 | | | | 414,558 | |
Pharmaceutical Product Development, Inc. | | | 30,010 | | | | 814,471 | |
RSC Holdings, Inc. (a) | | | 43,450 | | | | 423,203 | |
Strayer Education, Inc. | | | 29,000 | | | | 4,414,380 | |
SuccessFactors, Inc. (a) | | | 24,110 | | | | 698,226 | |
TrueBlue, Inc. (a) | | | 17,800 | | | | 320,222 | |
United Rentals, Inc. (a) | | | 39,460 | | | | 897,715 | |
VistaPrint NV (a) | | | 7,120 | | | | 327,520 | |
| | | | | | | | |
| | | | | | | 22,585,770 | |
| | | | | | | | |
| Computers — 6.1% | | | | | | | | |
Cadence Design Systems, Inc. (a) | | | 72,810 | | | | 601,411 | |
Compellent Technologies, Inc. (a) | | | 16,400 | | | | 452,476 | |
Fortinet, Inc. (a) | | | 28,300 | | | | 915,505 | |
MICROS Systems, Inc. (a) | | | 118,500 | | | | 5,197,410 | |
RealD, Inc. (a) | | | 32,780 | | | | 849,657 | |
Riverbed Technology, Inc. (a) | | | 72,540 | | | | 2,551,232 | |
STEC, Inc. (a) | | | 11,100 | | | | 195,915 | |
Stratasys, Inc. (a) | | | 99,500 | | | | 3,247,680 | |
SYKES Enterprises, Inc. (a) | | | 79,153 | | | | 1,603,640 | |
Syntel, Inc. | | | 7,600 | | | | 363,204 | |
| | | | | | | | |
| | | | | | | 15,978,130 | |
| | | | | | | | |
| Distribution & Wholesale — 3.1% | | | | | | | | |
Beacon Roofing Supply, Inc. (a) | | | 52,270 | | | | 934,065 | |
Ingram Micro, Inc. Class A (a) | | | 53,600 | | | | 1,023,224 | |
LKQ Corp. (a) | | | 246,388 | | | | 5,597,935 | |
Watsco, Inc. | | | 9,800 | | | | 618,184 | |
| | | | | | | | |
| | | | | | | 8,173,408 | |
| | | | | | | | |
| Diversified Financial — 5.0% | | | | | |
Evercore Partners, Inc. Class A | | | 3,300 | | | | 112,200 | |
Financial Engines, Inc. (a) | | | 44,500 | | | | 882,435 | |
The accompanying notes are an integral part of the financial statements.
41
MML Small Cap Growth Equity Fund – Portfolio of Investments (Continued)
| | | | | | | | |
| | | Number of
Shares | | | Value | |
Greenhill & Co., Inc. | | | 59,900 | | | $ | 4,892,632 | |
National Financial Partners Corp. (a) | | | 32,300 | | | | 432,820 | |
Portfolio Recovery Associates,
Inc. (a) | | | 72,000 | | | | 5,414,400 | |
Stifel Financial Corp. (a) | | | 13,790 | | | | 855,532 | |
Waddell & Reed Financial, Inc. Class A | | | 12,990 | | | | 458,417 | |
| | | | | | | | |
| | | | | | | 13,048,436 | |
| | | | | | | | |
| Electric — 0.4% | | | | | | | | |
ITC Holdings Corp. | | | 15,900 | | | | 985,482 | |
| | | | | | | | |
| Electrical Components & Equipment — 3.3% | | | | | |
A123 Systems, Inc. (a) | | | 46,300 | | | | 441,702 | |
General Cable Corp. (a) | | | 139,600 | | | | 4,898,564 | |
GrafTech International Ltd. (a) | | | 111,600 | | | | 2,214,144 | |
Power-One, Inc. (a) | | | 37,400 | | | | 381,480 | |
SunPower Corp. Class B (a) | | | 72,226 | | | | 896,325 | |
| | | | | | | | |
| | | | | | | 8,832,215 | |
| | | | | | | | |
| Electronics — 3.4% | | | | | | | | |
Celestica, Inc. (a) | | | 107,500 | | | | 1,042,750 | |
Jabil Circuit, Inc. | | | 108,890 | | | | 2,187,600 | |
PerkinElmer, Inc. | | | 188,100 | | | | 4,856,742 | |
Stoneridge, Inc. (a) | | | 50,600 | | | | 798,974 | |
| | | | | | | | |
| | | | | | | 8,886,066 | |
| | | | | | | | |
| Engineering & Construction — 0.5% | | | | | | | | |
Aecom Technology Corp. (a) | | | 28,220 | | | | 789,314 | |
Foster Wheeler AG (a) | | | 13,960 | | | | 481,899 | |
| | | | | | | | |
| | | | | | | 1,271,213 | |
| | | | | | | | |
| Entertainment — 2.3% | | | | | | | | |
Bally Technologies, Inc. (a) | | | 22,500 | | | | 949,275 | |
Churchill Downs, Inc. | | | 22,000 | | | | 954,800 | |
Cinemark Holdings, Inc. | | | 70,330 | | | | 1,212,489 | |
DreamWorks Animation SKG, Inc. Class A (a) | | | 41,900 | | | | 1,234,793 | |
Penn National Gaming, Inc. (a) | | | 45,520 | | | | 1,600,028 | |
| | | | | | | | |
| | | | | | | 5,951,385 | |
| | | | | | | | |
| Foods — 0.2% | | | | | | | | |
The Fresh Market, Inc. (a) | | | 10,200 | | | | 420,240 | |
| | | | | | | | |
| Gas — 0.4% | | | | | | | | |
UGI Corp. | | | 30,000 | | | | 947,400 | |
| | | | | | | | |
| Health Care – Products — 5.9% | | | | | |
Gen-Probe, Inc. (a) | | | 5,900 | | | | 344,265 | |
HeartWare International, Inc. (a) | | | 5,120 | | | | 448,358 | |
Masimo Corp. | | | 101,500 | | | | 2,950,605 | |
NuVasive, Inc. (a) | | | 145,630 | | | | 3,735,410 | |
Orthovita, Inc. (a) | | | 143,952 | | | | 289,344 | |
Stereotaxis, Inc. (a) | | | 155,400 | | | | 595,182 | |
Volcano Corp. (a) | | | 176,237 | | | | 4,813,032 | |
Zoll Medical Corp. (a) | | | 66,800 | | | | 2,486,964 | |
| | | | | | | | |
| | | | | | | 15,663,160 | |
| | | | | | | | |
| | | | | | | | |
| | | Number of
Shares | | | Value | |
| Health Care – Services — 2.3% | | | | | |
Fleury SA | | | 21,100 | | | $ | 338,761 | |
Health Management Associates, Inc. Class A (a) | | | 134,000 | | | | 1,278,360 | |
Healthways, Inc. (a) | | | 118,100 | | | | 1,317,996 | |
Kindred Healthcare, Inc. (a) | | | 48,100 | | | | 883,597 | |
RehabCare Group, Inc. (a) | | | 32,300 | | | | 765,510 | |
WellCare Health Plans, Inc. (a) | | | 48,990 | | | | 1,480,478 | |
| | | | | | | | |
| | | | | | | 6,064,702 | |
| | | | | | | | |
| Home Builders — 0.1% | | | | | | | | |
Thor Industries, Inc. | | | 7,200 | | | | 244,512 | |
| | | | | | | | |
| Home Furnishing — 1.7% | | | | | |
DTS, Inc. (a) | | | 43,550 | | | | 2,136,128 | |
Tempur-Pedic International, Inc. (a) | | | 26,370 | | | | 1,056,382 | |
TiVo, Inc. (a) | | | 165,200 | | | | 1,425,676 | |
| | | | | | | | |
| | | | | | | 4,618,186 | |
| | | | | | | | |
| Insurance — 0.4% | | | | | | | | |
Assured Guaranty Ltd. | | | 17,850 | | | | 315,945 | |
eHealth, Inc. (a) | | | 52,200 | | | | 740,718 | |
| | | | | | | | |
| | | | | | | 1,056,663 | |
| | | | | | | | |
| Internet — 5.2% | | | | | | | | |
Ancestry.com, Inc. (a) | | | 13,540 | | | | 383,453 | |
Archipelago Learning, Inc. (a) | | | 100,800 | | | | 988,848 | |
Ariba, Inc. (a) | | | 13,400 | | | | 314,766 | |
Blue Nile, Inc. (a) | | | 17,100 | | | | 975,726 | |
Constant Contact, Inc. (a) | | | 130,600 | | | | 4,047,294 | |
DealerTrack Holdings, Inc. (a) | | | 199,850 | | | | 4,010,989 | |
Dice Holdings, Inc. (a) | | | 21,400 | | | | 307,090 | |
IAC/InterActiveCorp (a) | | | 34,200 | | | | 981,540 | |
QuinStreet, Inc. (a) | | | 20,480 | | | | 393,421 | |
S1 Corp. (a) | | | 91,800 | | | | 633,420 | |
TIBCO Software, Inc. (a) | | | 28,840 | | | | 568,436 | |
| | | | | | | | |
| | | | | | | 13,604,983 | |
| | | | | | | | |
| Leisure Time — 0.2% | | | | | | | | |
Brunswick Corp. | | | 28,310 | | | | 530,529 | |
| | | | | | | | |
| Machinery – Diversified — 6.3% | | | | | |
Gardner Denver, Inc. | | | 54,900 | | | | 3,778,218 | |
Graco, Inc. | | | 97,800 | | | | 3,858,210 | |
Hollysys Automation Technologies Ltd. (a) | | | 42,500 | | | | 644,300 | |
Lindsay Corp. | | | 5,360 | | | | 318,545 | |
Nordson Corp. | | | 24,800 | | | | 2,278,624 | |
Wabtec Corp. | | | 109,700 | | | | 5,802,033 | |
| | | | | | | | |
| | | | | | | 16,679,930 | |
| | | | | | | | |
| Manufacturing — 1.1% | | | | | | | | |
Acuity Brands, Inc. | | | 30,200 | | | | 1,741,634 | |
FreightCar America, Inc. | | | 24,600 | | | | 711,924 | |
LSB Industries, Inc. (a) | | | 18,560 | | | | 450,266 | |
| | | | | | | | |
| | | | | | | 2,903,824 | |
| | | | | | | | |
The accompanying notes are an integral part of the financial statements.
42
MML Small Cap Growth Equity Fund – Portfolio of Investments (Continued)
| | | | | | | | |
| | | Number of
Shares | | | Value | |
| Media — 1.4% | | | | | | | | |
FactSet Research Systems, Inc. | | | 39,162 | | | $ | 3,671,829 | |
| | | | | | | | |
| Office Furnishings — 0.3% | | | | | |
Knoll, Inc. | | | 52,650 | | | | 880,835 | |
| | | | | | | | |
| Oil & Gas — 0.8% | | | | | | | | |
Atlas Energy, Inc. (a) | | | 10,800 | | | | 474,876 | |
Cabot Oil & Gas Corp. | | | 11,080 | | | | 419,378 | |
Comstock Resources, Inc. (a) | | | 32,200 | | | | 790,832 | |
Rosetta Resources, Inc. (a) | | | 14,400 | | | | 542,016 | |
| | | | | | | | |
| | | | | | | 2,227,102 | |
| | | | | | | | |
| Oil & Gas Services — 5.1% | | | | | |
Core Laboratories NV | | | 22,200 | | | | 1,976,910 | |
Dresser-Rand Group, Inc. (a) | | | 100,600 | | | | 4,284,554 | |
Dril-Quip, Inc. (a) | | | 55,930 | | | | 4,346,880 | |
Global Industries Ltd. (a) | | | 171,400 | | | | 1,187,802 | |
ION Geophysical Corp. (a) | | | 146,143 | | | | 1,239,293 | |
Oceaneering International, Inc. (a) | | | 5,680 | | | | 418,218 | |
| | | | | | | | |
| | | | | | | 13,453,657 | |
| | | | | | | | |
| Packaging & Containers — 0.6% | | | | | |
Silgan Holdings, Inc. | | | 48,130 | | | | 1,723,535 | |
| | | | | | | | |
| Pharmaceuticals — 1.5% | | | | | | | | |
Amylin Pharmaceuticals, Inc. (a) | | | 34,100 | | | | 501,611 | |
Cadence Pharmaceuticals, Inc. (a) | | | 56,000 | | | | 422,800 | |
Onyx Pharmaceuticals, Inc. (a) | | | 9,280 | | | | 342,154 | |
Pharmasset, Inc. (a) | | | 5,900 | | | | 256,119 | |
Salix Pharmaceuticals Ltd. (a) | | | 25,140 | | | | 1,180,574 | |
SXC Health Solutions Corp. (a) | | | 14,150 | | | | 606,469 | |
Targacept, Inc. (a) | | | 21,800 | | | | 577,700 | |
| | | | | | | | |
| | | | | | | 3,887,427 | |
| | | | | | | | |
| Real Estate Investment Trusts (REITS) — 1.3% | |
Glimcher Realty Trust | | | 85,400 | | | | 717,360 | |
MFA Financial, Inc. | | | 85,200 | | | | 695,232 | |
OMEGA Healthcare Investors, Inc. | | | 31,200 | | | | 700,128 | |
Redwood Trust, Inc. | | | 59,900 | | | | 894,307 | |
Sabra Health Care REIT, Inc. | | | 17,400 | | | | 320,160 | |
| | | | | | | | |
| | | | | | | 3,327,187 | |
| | | | | | | | |
| Retail — 6.3% | | | | | | | | |
AFC Enterprises, Inc (a) | | | 17,980 | | | | 249,922 | |
Big Lots, Inc. (a) | | | 15,240 | | | | 464,210 | |
The Cheesecake Factory, Inc. (a) | | | 36,060 | | | | 1,105,600 | |
The Children’s Place Retail Store, Inc. (a) | | | 18,740 | | | | 930,254 | |
Columbia Sportswear Co. | | | 61,230 | | | | 3,692,169 | |
Denny’s Corp. (a) | | | 191,000 | | | | 683,780 | |
Dick’s Sporting Goods, Inc. (a) | | | 16,290 | | | | 610,875 | |
Domino’s Pizza UK & IRL PLC | | | 55,163 | | | | 474,784 | |
Domino’s Pizza, Inc. (a) | | | 25,930 | | | | 413,583 | |
Hanesbrands, Inc. (a) | | | 33,430 | | | | 849,122 | |
Liz Claiborne, Inc. (a) | | | 40,000 | | | | 286,400 | |
Lumber Liquidators Holdings, Inc. (a) | | | 13,300 | | | | 331,303 | |
| | | | | | | | |
| | | Number of
Shares | | | Value | |
Nu Skin Enterprises, Inc. Class A | | | 22,700 | | | $ | 686,902 | |
O’Reilly Automotive, Inc. (a) | | | 33,490 | | | | 2,023,466 | |
Rush Enterprises, Inc. Class A (a) | | | 19,390 | | | | 396,332 | |
The Talbots, Inc. (a) | | | 77,700 | | | | 662,004 | |
Zumiez, Inc. (a) | | | 102,400 | | | | 2,751,488 | |
| | | | | | | | |
| | | | | | | 16,612,194 | |
| | | | | | | | |
| Semiconductors — 4.7% | | | | | | | | |
Applied Micro Circuits Corp. (a) | | | 39,780 | | | | 424,850 | |
Cavium Networks, Inc. (a) | | | 60,000 | | | | 2,260,800 | |
Fairchild Semiconductor International, Inc. (a) | | | 72,100 | | | | 1,125,481 | |
LSI Corp. (a) | | | 57,700 | | | | 345,623 | |
Microsemi Corp. (a) | | | 39,100 | | | | 895,390 | |
Nanometrics, Inc. (a) | | | 67,800 | | | | 869,874 | |
Netlogic Microsystems, Inc. (a) | | | 12,700 | | | | 398,907 | |
OmniVision Technologies, Inc. (a) | | | 18,560 | | | | 549,562 | |
ON Semiconductor Corp. (a) | | | 135,000 | | | | 1,333,800 | |
QLogic Corp. (a) | | | 39,600 | | | | 673,992 | |
Semtech Corp. (a) | | | 119,900 | | | | 2,714,536 | |
Skyworks Solutions, Inc. (a) | | | 27,240 | | | | 779,881 | |
| | | | | | | | |
| | | | | | | 12,372,696 | |
| | | | | | | | |
| Software — 5.2% | | | | | | | | |
Allscripts Healthcare Solutions,
Inc. (a) | | | 25,040 | | | | 482,521 | |
CommVault Systems, Inc. (a) | | | 106,900 | | | | 3,059,478 | |
Concur Technologies, Inc. (a) | | | 31,360 | | | | 1,628,525 | |
Emdeon, Inc. Class A (a) | | | 20,200 | | | | 273,508 | |
Informatica Corp. (a) | | | 21,140 | | | | 930,794 | |
Omnicell, Inc. (a) | | | 36,813 | | | | 531,948 | |
Parametric Technology Corp. (a) | | | 19,590 | | | | 441,363 | |
Quest Software, Inc. (a) | | | 11,500 | | | | 319,010 | |
RealPage, Inc. (a) | | | 9,400 | | | | 290,742 | |
RightNow Technologies, Inc. (a) | | | 35,600 | | | | 842,652 | |
Rosetta Stone, Inc. (a) | | | 85,261 | | | | 1,809,238 | |
SolarWinds, Inc. (a) | | | 32,600 | | | | 627,550 | |
Synchronoss Technologies, Inc. (a) | | | 63,400 | | | | 1,693,414 | |
Totvs SA | | | 4,390 | | | | 447,043 | |
VeriFone Systems, Inc. (a) | | | 9,200 | | | | 354,752 | |
| | | | | | | | |
| | | | | | | 13,732,538 | |
| | | | | | | | |
| Storage & Warehousing — 0.2% | | | | | |
Mobile Mini, Inc. (a) | | | 28,400 | | | | 559,196 | |
| | | | | | | | |
| Telecommunications — 2.9% | | | | | |
AAC Acoustic Technologies Holdings, Inc. | | | 148,000 | | | | 394,678 | |
Acme Packet, Inc. (a) | | | 11,180 | | | | 594,329 | |
ADTRAN, Inc. | | | 17,300 | | | | 626,433 | |
Aruba Networks, Inc. (a) | | | 15,600 | | | | 325,728 | |
Ciena Corp. (a) | | | 34,900 | | | | 734,645 | |
Finisar Corp. (a) | | | 19,710 | | | | 585,190 | |
Ixia (a) | | | 14,510 | | | | 243,478 | |
JDS Uniphase Corp. (a) | | | 33,350 | | | | 482,908 | |
The accompanying notes are an integral part of the financial statements.
43
MML Small Cap Growth Equity Fund – Portfolio of Investments (Continued)
| | | | | | | | |
| | | Number of
Shares | | | Value | |
Leap Wireless International, Inc. (a) | | | 66,900 | | | $ | 820,194 | |
MetroPCS Communications, Inc. (a) | | | 45,890 | | | | 579,591 | |
Polycom, Inc. (a) | | | 18,210 | | | | 709,826 | |
tw telecom, inc. (a) | | | 44,100 | | | | 751,905 | |
Vonage Holdings Corp. (a) | | | 387,000 | | | | 866,880 | |
| | | | | | | | |
| | | | | | | 7,715,785 | |
| | | | | | | | |
| Toys, Games & Hobbies — 0.1% | | | | | |
RC2 Corp. (a) | | | 14,290 | | | | 311,093 | |
| | | | | | | | |
| Transportation — 3.0% | | | | | | | | |
Con-way, Inc. | | | 41,900 | | | | 1,532,283 | |
Genesee & Wyoming, Inc. Class A (a) | | | 16,800 | | | | 889,560 | |
J.B. Hunt Transport Services, Inc. | | | 83,590 | | | | 3,411,308 | |
Old Dominion Freight Line, Inc. (a) | | | 15,535 | | | | 496,965 | |
Overseas Shipholding Group, Inc. | | | 13,430 | | | | 475,690 | |
Swift Transportation Co. (a) | | | 51,600 | | | | 645,516 | |
Vitran Corp., Inc. (a) | | | 26,760 | | | | 351,091 | |
| | | | | | | | |
| | | | | | | 7,802,413 | |
| | | | | | | | |
| | |
TOTAL COMMON STOCK
(Cost $215,218,029) | | | | | | | 264,351,548 | |
| | | | | | | | |
| | |
TOTAL EQUITIES
(Cost $215,218,029) | | | | | | | 264,351,548 | |
| | | | | | | | |
| | |
| MUTUAL FUNDS — 0.3% | | | | | | | | |
| Diversified Financial — 0.3% | | | | | | | | |
iShares Russell 2000 Index Fund | | | 10,651 | | | | 833,228 | |
| | | | | | | | |
| | |
TOTAL MUTUAL FUNDS
(Cost $827,295) | | | | | | | 833,228 | |
| | | | | | | | |
| | |
TOTAL LONG-TERM INVESTMENTS
(Cost $216,045,324) | | | | | | | 265,184,776 | |
| | | | | | | | |
| | |
| | | Principal
Amount | | | | |
| SHORT-TERM INVESTMENTS — 1.3% | |
| Repurchase Agreement — 1.3% | |
State Street Bank & Trust Co. Repurchase Agreement, dated 12/31/10, 0.010%, due 1/03/11 (b) | | $ | 3,397,256 | | | | 3,397,256 | |
| | | | | | | | |
| | |
TOTAL SHORT-TERM INVESTMENTS
(Cost $3,397,256) | | | | | | | 3,397,256 | |
| | | | | | | | |
| | |
TOTAL INVESTMENTS — 102.0%
(Cost $219,442,580) (c) | | | | | | | 268,582,032 | |
| | |
| Other Assets/(Liabilities) — (2.0)% | | | | | | | (5,309,312 | ) |
| | | | | | | | |
| | |
| NET ASSETS — 100.0% | | | | | | $ | 263,272,720 | |
| | | | | | | | |
Notes to Portfolio of Investments
| (a) | Non-income producing security. |
| (b) | Maturity value of $3,397,259. Collateralized by U.S. Government Agency obligations with a rate of 4.000%, maturity dates ranging from 12/15/17 - 5/15/39, and an aggregate market value, including accrued interest, of $3,473,428. |
| (c) | See Note 6 for aggregate cost for federal tax purposes. |
The accompanying notes are an integral part of the financial statements.
44
THIS PAGE INTENTIONALLY LEFT BLANK
MML Series Investment Fund – Financial Statements
Statements of Assets and Liabilities
December 31, 2010
| | | | | | | | |
| | | MML Blue
Chip Growth
Fund | | | MML
Emerging
Growth Fund | |
| Assets: | | | | | | | | |
Investments, at value (Note 2) (a) | | $ | 342,940,654 | | | $ | 13,542,934 | |
Short-term investments, at value (Note 2) (b) | | | 2,018,988 | | | | 749,910 | |
| | | | | | | | |
Total investments | | | 344,959,642 | | | | 14,292,844 | |
| | | | | | | | |
Foreign currency, at value (c) | | | - | | | | - | |
Receivables from: | | | | | | | | |
Investments sold | | | 226,160 | | | | - | |
Open forward foreign currency contracts (Note 2) | | | - | | | | - | |
Investment adviser (Note 3) | | | - | | | | 864 | |
Fund shares sold | | | 13,312 | | | | 12,065 | |
Interest and dividends | | | 212,875 | | | | 1,529 | |
Foreign taxes withheld | | | 7,844 | | | | - | |
| | | | | | | | |
Total assets | | | 345,419,833 | | | | 14,307,302 | |
| | | | | | | | |
| Liabilities: | | | | | | | | |
Payables for: | | | | | | | | |
Investments purchased | | | 504,363 | | | | 63,932 | |
Open forward foreign currency contracts (Note 2) | | | - | | | | - | |
Fund shares repurchased | | | 555,151 | | | | 94,991 | |
Variation margin on open futures contracts (Note 2) | | | - | | | | - | |
Trustees’ fees and expenses (Note 3) | | | 33,941 | | | | 6,384 | |
Affiliates (Note 3): | | | | | | | | |
Investment management fees | | | 218,944 | | | | 12,479 | |
Administration fees | | | - | | | | - | |
Service fees | | | 4,791 | | | | 530 | |
Due to custodian | | | 3,738 | | | | - | |
Accrued expense and other liabilities | | | 51,008 | | | | 30,575 | |
| | | | | | | | |
Total liabilities | | | 1,371,936 | | | | 208,891 | |
| | | | | | | | |
Net assets | | $ | 344,047,897 | | | $ | 14,098,411 | |
| | | | | | | | |
| Net assets consist of: | | | | | | | | |
Paid-in capital | | $ | 287,495,275 | | | $ | 17,261,844 | |
Undistributed (accumulated) net investment income (loss) | | | 119,414 | | | | (6,287 | ) |
Accumulated net realized gain (loss) on investments and foreign currency transactions | | | (27,971,330 | ) | | | (5,788,710 | ) |
Net unrealized appreciation (depreciation) on investments and foreign currency translations | | | 84,404,538 | | | | 2,631,564 | |
| | | | | | | | |
Net assets | | $ | 344,047,897 | | | $ | 14,098,411 | |
| | | | | | | | |
| | | | | | | | |
(a) Cost of investments: | | $ | 258,537,510 | | | $ | 10,911,370 | |
(b) Cost of short-term investments: | | $ | 2,018,988 | | | $ | 749,910 | |
(c) Cost of foreign currency: | | $ | - | | | $ | - | |
The accompanying notes are an integral part of the financial statements.
46
| | | | | | | | | | | | | | |
MML
Equity
Index Fund | | | MML Large
Cap Value
Fund | | | MML
NASDAQ-100
Fund | | | MML Small
Cap Growth
Equity Fund | |
| | | | | | | | | | | | | | |
| $ | 303,709,383 | | | $ | 226,140,113 | | | $ | 11,982,020 | | | $ | 265,184,776 | |
| | 2,268,951 | | | | 11,343,449 | | | | 314,957 | | | | 3,397,256 | |
| | | | | | | | | | | | | | | |
| | 305,978,334 | | | | 237,483,562 | | | | 12,296,977 | | | | 268,582,032 | |
| | | | | | | | | | | | | | | |
| | - | | | | - | | | | - | | | | 2,030 | |
| | | | | | | | | | | | | | |
| | 50,757 | | | | 12,293 | | | | - | | | | 561,166 | |
| | - | | | | - | | | | - | | | | 10,911 | |
| | 9,290 | | | | - | | | | 2,584 | | | | - | |
| | 28,048 | | | | 11,370 | | | | 17,369 | | | | 13,132 | |
| | 356,629 | | | | 207,604 | | | | 3,161 | | | | 95,642 | |
| | - | | | | 30,490 | | | | - | | | | - | |
| | | | | | | | | | | | | | | |
| | 306,423,058 | | | | 237,745,319 | | | | 12,320,091 | | | | 269,264,913 | |
| | | | | | | | | | | | | | | |
| | | | | | | | | | | | | | |
| | | | | | | | | | | | | | |
| | - | | | | 69,608 | | | | - | | | | 1,246,212 | |
| | - | | | | - | | | | - | | | | 14,257 | |
| | 125,359 | | | | 2,213,179 | | | | 60,642 | | | | 4,369,560 | |
| | 3,365 | | | | - | | | | 887 | | | | - | |
| | 148,101 | | | | 63,813 | | | | 4,995 | | | | 56,437 | |
| | | | | | | | | | | | | | |
| | 25,678 | | | | 153,252 | | | | 4,598 | | | | 246,373 | |
| | 44,176 | | | | - | | | | - | | | | - | |
| | 1,593 | | | | 9,373 | | | | 728 | | | | 2,473 | |
| | - | | | | - | | | | - | | | | - | |
| | 55,581 | | | | 50,395 | | | | 30,980 | | | | 56,881 | |
| | | | | | | | | | | | | | | |
| | 403,853 | | | | 2,559,620 | | | | 102,830 | | | | 5,992,193 | |
| | | | | | | | | | | | | | | |
| $ | 306,019,205 | | | $ | 235,185,699 | | | $ | 12,217,261 | | | $ | 263,272,720 | |
| | | | | | | | | | | | | | | |
| | | | | | | | | | | | | | |
| $ | 269,849,022 | | | $ | 223,664,400 | | | $ | 12,691,970 | | | $ | 205,168,887 | |
| | 5,170,342 | | | | 1,319,809 | | | | 30,748 | | | | (65,759 | ) |
| | (15,182,162 | ) | | | (32,791,641 | ) | | | (4,175,903 | ) | | | 9,033,418 | |
| | 46,182,003 | | | | 42,993,131 | | | | 3,670,446 | | | | 49,136,174 | |
| | | | | | | | | | | | | | | |
| $ | 306,019,205 | | | $ | 235,185,699 | | | $ | 12,217,261 | | | $ | 263,272,720 | |
| | | | | | | | | | | | | | | |
| | | | | | | | | | | | | | |
| $ | 257,584,885 | | | $ | 183,151,987 | | | $ | 8,311,984 | | | $ | 216,045,324 | |
| $ | 2,268,951 | | | $ | 11,343,449 | | | $ | 314,957 | | | $ | 3,397,256 | |
| $ | - | | | $ | - | | | $ | - | | | $ | 2,005 | |
47
MML Series Investment Fund – Financial Statements (Continued)
Statements of Assets and Liabilities
December 31, 2010
| | | | | | | | |
| | | MML
Blue Chip
Growth Fund | | | MML
Emerging
Growth Fund | |
| Initial Class shares: | | | | | | | | |
Net assets | | $ | 336,210,984 | | | $ | 13,145,707 | |
| | | | | | | | |
Shares outstanding (a) | | | 29,821,266 | | | | 2,174,394 | |
| | | | | | | | |
Net asset value, offering price and redemption price per share | | $ | 11.27 | | | $ | 6.05 | |
| | | | | | | | |
| Class I shares: | | | | | | | | |
Net assets | | $ | - | | | $ | - | |
| | | | | | | | |
Shares outstanding (a) | | | - | | | | - | |
| | | | | | | | |
Net asset value, offering price and redemption price per share | | $ | - | | | $ | - | |
| | | | | | | | |
| Class II shares: | | | | | | | | |
Net assets | | $ | - | | | $ | - | |
| | | | | | | | |
Shares outstanding (a) | | | - | | | | - | |
| | | | | | | | |
Net asset value, offering price and redemption price per share | | $ | - | | | $ | - | |
| | | | | | | | |
| Class III shares: | | | | | | | | |
Net assets | | $ | - | | | $ | - | |
| | | | | | | | |
Shares outstanding (a) | | | - | | | | - | |
| | | | | | | | |
Net asset value, offering price and redemption price per share | | $ | - | | | $ | - | |
| | | | | | | | |
| Service Class shares: | | | | | | | | |
Net assets | | $ | 7,836,913 | | | $ | 952,704 | |
| | | | | | | | |
Shares outstanding (a) | | | 698,560 | | | | 158,502 | |
| | | | | | | | |
Net asset value, offering price and redemption price per share | | $ | 11.22 | | | $ | 6.01 | |
| | | | | | | | |
| Service Class I shares: | | | | | | | | |
Net assets | | $ | - | | | $ | - | |
| | | | | | | | |
Shares outstanding (a) | | | - | | | | - | |
| | | | | | | | |
Net asset value, offering price and redemption price per share | | $ | - | | | $ | - | |
| | | | | | | | |
(a) Authorized unlimited number of shares with no par value.
The accompanying notes are an integral part of the financial statements.
48
| | | | | | | | | | | | | | |
MML
Equity Index
Fund | | | MML
Large Cap
Value Fund | | | MML
NASDAQ-100
Fund | | | MML Small
Cap Growth
Equity Fund | |
| | | | | | | | | | | | | | |
| $ | - | | | $ | 218,666,274 | | | $ | 10,913,325 | | | $ | 258,832,600 | |
| | | | | | | | | | | | | | | |
| | - | | | | | | | | 1,926,606 | | | | 14,621,601 | |
| | | | | | | | | | | | | | | |
| $ | - | | | $ | 11.54 | | | $ | 5.66 | | | $ | 17.70 | |
| | | | | | | | | | | | | | | |
| | | | | | | | | | | | | | |
| $ | 81,198,697 | | | $ | - | | | $ | - | | | $ | - | |
| | | | | | | | | | | | | | | |
| | 5,160,971 | | | | - | | | | - | | | | - | |
| | | | | | | | | | | | | | | |
| $ | 15.73 | | | $ | - | | | $ | - | | | $ | - | |
| | | | | | | | | | | | | | | |
| | | | | | | | | | | | | | |
| $ | 115,520,952 | | | $ | - | | | $ | - | | | $ | - | |
| | | | | | | | | | | | | | | |
| | 7,331,459 | | | | - | | | | - | | | | - | |
| | | | | | | | | | | | | | | |
| $ | 15.76 | | | $ | - | | | $ | - | | | $ | - | |
| | | | | | | | | | | | | | | |
| | | | | | | | | | | | | | |
| $ | 106,015,262 | | | $ | - | | | $ | - | | | $ | - | |
| | | | | | | | | | | | | | | |
| | 6,732,521 | | | | - | | | | - | | | | - | |
| | | | | | | | | | | | | | | |
| $ | 15.75 | | | $ | - | | | $ | - | | | $ | - | |
| | | | | | | | | | | | | | | |
| | | | | | | | | | | | | | |
| $ | - | | | $ | 16,519,425 | | | $ | 1,303,936 | | | $ | 4,440,120 | |
| | | | | | | | | | | | | | | |
| | - | | | | 1,437,943 | | | | 231,260 | | | | 252,372 | |
| | | | | | | | | | | | | | | |
| $ | - | | | $ | 11.49 | | | $ | 5.64 | | | $ | 17.59 | |
| | | | | | | | | | | | | | | |
| | | | | | | | | | | | | | |
| $ | 3,284,294 | | | $ | - | | | $ | - | | | $ | - | |
| | | | | | | | | | | | | | | |
| | 210,615 | | | | - | | | | - | | | | - | |
| | | | | | | | | | | | | | | |
| $ | 15.59 | | | $ | - | | | $ | - | | | $ | - | |
| | | | | | | | | | | | | | | |
49
MML Series Investment Fund — Financial Statements (Continued)
Statements of Operations
For the Year Ended December 31, 2010
| | | | | | | | |
| | | MML Blue
Chip Growth
Fund | | | MML
Emerging
Growth
Fund | |
| Investment income (Note 2): | | | | | | | | |
Dividends (a) | | $ | 2,267,518 | | | $ | 38,672 | |
Interest | | | 405 | | | | 44 | |
| | | | | | | | |
Total investment income | | | 2,267,923 | | | | 38,716 | |
| | | | | | | | |
| Expenses (Note 3): | | | | | | | | |
Investment management fees | | | 1,979,140 | | | | 122,001 | |
Custody fees | | | 36,905 | | | | 8,490 | |
Audit fees | | | 29,762 | | | | 31,294 | |
Legal fees | | | 5,459 | | | | 236 | |
Proxy fees | | | 969 | | | | 969 | |
Shareholder reporting fees | | | 32,415 | | | | 4,066 | |
Trustees’ fees | | | 24,158 | | | | 1,153 | |
| | | | | | | | |
| | | 2,108,808 | | | | 168,209 | |
Administration fees: | | | | | | | | |
Class I | | | - | | | | - | |
Class II | | | - | | | | - | |
Class III | | | - | | | | - | |
Service Class I | | | - | | | | - | |
Service fees: | | | | | | | | |
Service Class | | | 16,128 | | | | 1,569 | |
Service Class I | | | - | | | | - | |
| | | | | | | | |
Total expenses | | | 2,124,936 | | | | 169,778 | |
Expenses waived (Note 3): | | | | | | | | |
Initial Class fees waived by advisor | | | - | | | | (21,729 | ) |
Service Class fees waived by advisor | | | - | | | | (1,239 | ) |
Class II administrative fees waived | | | - | | | | - | |
Class III administrative fees waived | | | - | | | | - | |
| | | | | | | | |
Net expenses | | | 2,124,936 | | | | 146,810 | |
| | | | | | | | |
Net investment income (loss) | | | 142,987 | | | | (108,094 | ) |
| | | | | | | | |
| Realized and unrealized gain (loss): | | | | | | | | |
Net realized gain (loss) on: | | | | | | | | |
Investment transactions | | | 11,980,089 | | | | 1,391,605 | |
Futures contracts | | | - | | | | - | |
Foreign currency transactions | | | (401 | ) | | | - | |
| | | | | | | | |
Net realized gain (loss) | | | 11,979,688 | | | | 1,391,605 | |
| | | | | | | | |
Net change in unrealized appreciation (depreciation) on: | | | | | | | | |
Investment transactions | | | 36,997,751 | | | | 1,477,981 | |
Futures contracts | | | - | | | | - | |
Translation of assets and liabilities in foreign currencies | | | 478 | | | | - | |
| | | | | | | | |
Net change in unrealized appreciation (depreciation) | | | 36,998,229 | | | | 1,477,981 | |
| | | | | | | | |
Net realized gain (loss) and change in unrealized appreciation (depreciation) | | | 48,977,917 | | | | 2,869,586 | |
| | | | | | | | |
Net increase (decrease) in net assets resulting from operations | | $ | 49,120,904 | | | $ | 2,761,492 | |
| | | | | | | | |
| | | | | | | | |
(a) Net of withholding tax of: | | $ | 4,330 | | | $ | 88 | |
The accompanying notes are an integral part of the financial statements.
50
| | | | | | | | | | | | | | |
MML Equity
Index Fund | | |
MML Large
Cap Value
Fund | | | MML
NASDAQ-
100 Fund | | | MML Small
Cap Growth
Equity Fund | |
| | | | | | | | | | | | | | |
| $ | 6,192,239 | | | $ | 3,400,920 | | | $ | 95,821 | | | $ | 1,219,054 | |
| | 1,802 | | | | 158,044 | | | | 97 | | | | 781 | |
| | | | | | | | | | | | | | | |
| | 6,194,041 | | | | 3,558,964 | | | | 95,918 | | | | 1,219,835 | |
| | | | | | | | | | | | | | | |
| | | | | | | | | | | | | | |
| | 302,121 | | | | 1,697,873 | | | | 46,867 | | | | 2,629,587 | |
| | 38,873 | | | | 38,324 | | | | 4,712 | | | | 68,833 | |
| | 31,770 | | | | 31,179 | | | | 32,404 | | | | 32,773 | |
| | 3,603 | | | | 2,670 | | | | 206 | | | | 3,096 | |
| | 969 | | | | 968 | | | | 969 | | | | 969 | |
| | 41,974 | | | | 30,610 | | | | 3,899 | | | | 34,105 | |
| | 30,848 | | | | 22,553 | | | | 1,017 | | | | 25,133 | |
| | | | | | | | | | | | | | | |
| | 450,158 | | | | 1,824,177 | | | | 90,074 | | | | 2,794,496 | |
| | | | | | | | | | | | | | |
| | 229,047 | | | | - | | | | - | | | | - | |
| | 244,644 | | | | - | | | | - | | | | - | |
| | 47,678 | | | | - | | | | - | | | | - | |
| | 4,970 | | | | - | | | | - | | | | - | |
| | | | | | | | | | | | | | |
| | - | | | | 31,780 | | | | 2,240 | | | | 8,295 | |
| | 4,141 | | | | - | | | | - | | | | - | |
| | | | | | | | | | | | | | | |
| | 980,638 | | | | 1,855,957 | | | | 92,314 | | | | 2,802,791 | |
| | | | | | | | | | | | | | |
| | - | | | | - | | | | (29,019 | ) | | | - | |
| | - | | | | - | | | | (2,731 | ) | | | - | |
| | (64,380 | ) | | | - | | | | - | | | | - | |
| | (47,678 | ) | | | - | | | | - | | | | - | |
| | | | | | | | | | | | | | | |
| | 868,580 | | | | 1,855,957 | | | | 60,564 | | | | 2,802,791 | |
| | | | | | | | | | | | | | | |
| | 5,325,461 | | | | 1,703,007 | | | | 35,354 | | | | (1,582,956 | ) |
| | | | | | | | | | | | | | | |
| | | | | | | | | | | | | | |
| | | | | | | | | | | | | | |
| | 247,745 | | | | 6,339,660 | | | | 1,912 | | | | 34,892,344 | |
| | 435,862 | | | | - | | | | 35,320 | | | | - | |
| | | | | (1,538 | ) | | | - | | | | (67,586 | ) |
| | | | | | | | | | | | | | | |
| | | | | 6,338,122 | | | | 37,232 | | | | 34,824,758 | |
| | | | | | | | | | | | | | | |
| | | | | | | | | | | | | | |
| | | | | 18,395,707 | | | | 1,909,986 | | | | 20,039,782 | |
| | | | | - | | | | (17,033 | ) | | | - | |
| | | | | 2,787 | | | | - | | | | (2,682 | ) |
| | | | | | | | | | | | | | | |
| | | | | 18,398,494 | | | | 1,892,953 | | | | 20,037,100 | |
| | | | | | | | | | | | | | | |
| | | | | 24,736,616 | | | | 1,930,185 | | | | 54,861,858 | |
| | | | | | | | | | | | | | | |
| | | | $ | 26,439,623 | | | $ | 1,965,539 | | | $ | 53,278,902 | |
| | | | | | | | | | | | | | | |
| | | | | | | | | | | | | | |
| $ | - | | | $ | 47,120 | | | $ | 960 | | | $ | 13,108 | |
51
MML Series Investment Fund – Financial Statements (Continued)
Statements of Changes in Net Assets
| | | | | | | | |
| | | MML
Blue Chip Growth Fund | |
| | | Year
Ended
December 31, 2010 | | | Year
Ended
December 31, 2009 | |
Increase (Decrease) in Net Assets: | | | | | | | | |
| Operations: | | | | | | | | |
Net investment income (loss) | | $ | 142,987 | | | $ | 228,260 | |
Net realized gain (loss) on investment transactions | | | 11,979,688 | | | | (18,646,199 | ) |
Net change in unrealized appreciation (depreciation) on investments | | | 36,998,229 | | | | 88,600,456 | |
| | | | | | | | |
Net increase (decrease) in net assets resulting from operations | | | 49,120,904 | | | | 70,182,517 | |
| | | | | | | | |
Distributions to shareholders (Note 2): | | | | | | | | |
From net investment income: | | | | | | | | |
Initial Class | | | (233,055 | ) | | | (241,496 | ) |
Class I | | | - | | | | - | |
Class II | | | - | | | | - | |
Class III | | | - | | | | - | |
Service Class | | | - | | | | (7,049 | ) |
Service Class I | | | - | | | | - | |
| | | | | | | | |
Total distributions from net investment income | | | (233,055 | ) | | | (248,545 | ) |
| | | | | | | | |
Net fund share transactions (Note 5): | | | | | | | | |
Initial Class | | | 105,421,315 | | | | (53,912,108 | ) |
Class I | | | - | | | | - | |
Class II | | | - | | | | - | |
Class III | | | - | | | | - | |
Service Class | | | 1,155,540 | | | | 2,186,924 | |
Service Class I | | | - | | | | - | |
| | | | | | | | |
Increase (decrease) in net assets from fund share transactions | | | 106,576,855 | | | | (51,725,184 | ) |
| | | | | | | | |
Total increase (decrease) in net assets | | | 155,464,704 | | | | 18,208,788 | |
Net assets | | | | | | | | |
Beginning of year | | | 188,583,193 | | | | 170,374,405 | |
| | | | | | | | |
End of year | | $ | 344,047,897 | | | $ | 188,583,193 | |
| | | | | | | | |
Undistributed (accumulated) net investment income (loss) included in net assets at end of year | | $ | 119,414 | | | $ | 209,883 | |
| | | | | | | | |
The accompanying notes are an integral part of the financial statements.
52
| | | | | | | | | | | | | | | | | | | | | | |
MML
Emerging Growth Fund | | | MML
Equity Index Fund | | | | | | | |
Year
Ended
December 31, 2010 | | | Year
Ended
December 31, 2009 | | | Year
Ended
December 31, 2010 | | | Year
Ended
December 31, 2009 | | | | | | | |
| | | | | | | | | | | | | | | | | | | | | | |
| | | | | | | | | | | | | | | | | | | | | | |
| $ | (108,094 | ) | | $ | (92,680 | ) | | $ | 5,325,461 | | | $ | 5,142,123 | | | | | | | | | |
| | 1,391,605 | | | | (1,635,614 | ) | | | 683,607 | | | | (3,633,320 | ) | | | | | | | | |
| | 1,477,981 | | | | 2,934,703 | | | | 35,126,179 | | | | 60,518,550 | | | | | | | | | |
| | | | | | | | | | | | | | | | | | | | | | | |
| | 2,761,492 | | | | 1,206,409 | | | | 41,135,247 | | | | 62,027,353 | | | | | | | | | |
| | | | | | | | | | | | | | | | | | | | | | | |
| | | | | | | | | | | | | | | | | | | | | | |
| | | | | | | | | | | | | | | | | | | | | | |
| | - | | | | - | | | | - | | | | - | | | | | | | | | |
| | - | | | | - | | | | (1,198,204 | ) | | | (1,403,134 | ) | | | | | | | | |
| | - | | | | - | | | | (2,245,451 | ) | | | (3,118,953 | ) | | | | | | | | |
| | - | | | | - | | | | (1,702,367 | ) | | | (2,163,050 | ) | | | | | | | | |
| | - | | | | - | | | | - | | | | - | | | | | | | | | |
| | - | | | | - | | | | (28,744 | ) | | | (23,510 | ) | | | | | | | | |
| | | | | | | | | | | | | | | | | | | | | | | |
| | - | | | | - | | | | (5,174,766 | ) | | | (6,708,647 | ) | | | | | | | | |
| | | | | | | | | | | | | | | | | | | | | | | |
| | | | | | | | | | | | | | | | | | | | | | |
| | (10,765 | ) | | | (457,974 | ) | | | - | | | | - | | | | | | | | | |
| | - | | | | - | | | | (3,051,896 | ) | | | 14,076,632 | | | | | | | | | |
| | - | | | | - | | | | (35,685,394 | ) | | | (6,174,695 | ) | | | | | | | | |
| | - | | | | - | | | | 4,218,185 | | | | (3,233,978 | ) | | | | | | | | |
| | 284,563 | | | | 260,921 | | | | - | | | | - | | | | | | | | | |
| | - | | | | - | | | | 1,819,674 | | | | 453,186 | | | | | | | | | |
| | | | | | | | | | | | | | | | | | | | | | | |
| | 273,798 | | | | (197,053 | ) | | | (32,699,431 | ) | | | 5,121,145 | | | | | | | | | |
| | | | | | | | | | | | | | | | | | | | | | | |
| | 3,035,290 | | | | 1,009,356 | | | | 3,261,050 | | | | 60,439,851 | | | | | | | | | |
| | | | | | | | | | | | | | | | | | | | | | |
| | 11,063,121 | | | | 10,053,765 | | | | 302,758,155 | | | | 242,318,304 | | | | | | | | | |
| | | | | | | | | | | | | | | | | | | | | | | |
| $ | 14,098,411 | | | $ | 11,063,121 | | | $ | 306,019,205 | | | $ | 302,758,155 | | | | | | | | | |
| | | | | | | | | | | | | | | | | | | | | | | |
| | | | | |
| $ | (6,287 | ) | | $ | (5,957 | ) | | $ | 5,170,342 | | | $ | 5,010,988 | | | | | | | | | |
| | | | | | | | | | | | | | | | | | | | | | | |
53
MML Series Investment Fund – Financial Statements (Continued)
Statements of Changes in Net Assets
| | | | | | | | |
| | | MML
Large Cap Value Fund | |
| | | Year
Ended
December 31, 2010 | | | Year
Ended
December 31, 2009 | |
Increase (Decrease) in Net Assets: | | | | | | | | |
Operations: | | | | | | | | |
Net investment income (loss) | | $ | 1,703,007 | | | $ | 1,457,067 | |
Net realized gain (loss) on investment transactions | | | 6,338,122 | | | | (29,255,457 | ) |
Net change in unrealized appreciation (depreciation) on investments | | | 18,398,494 | | | | 82,638,534 | |
| | | | | | | | |
Net increase (decrease) in net assets resulting from operations | | | 26,439,623 | | | | 54,840,144 | |
| | | | | | | | |
Distributions to shareholders (Note 2): | | | | | | | | |
From net investment income: | | | | | | | | |
Initial Class | | | (1,687,136 | ) | | | (2,119,042 | ) |
Service Class | | | (90,042 | ) | | | (101,036 | ) |
| | | | | | | | |
Total distributions from net investment income | | | (1,777,178 | ) | | | (2,220,078 | ) |
| | | | | | | | |
Net fund share transactions (Note 5): | | | | | | | | |
Initial Class | | | (16,256,458 | ) | | | (13,460,500 | ) |
Service Class | | | 4,114,295 | | | | 3,369,669 | |
| | | | | | | | |
Increase (decrease) in net assets from fund share transactions | | | (12,142,163 | ) | | | (10,090,831 | ) |
| | | | | | | | |
Total increase (decrease) in net assets | | | 12,520,282 | | | | 42,529,235 | |
Net assets | | | | | | | | |
Beginning of year | | | 222,665,417 | | | | 180,136,182 | |
| | | | | | | | |
End of year | | $ | 235,185,699 | | | $ | 222,665,417 | |
| | | | | | | | |
Undistributed (accumulated) net investment income (loss) included in net assets at end of year | | $ | 1,319,809 | | | $ | 1,395,518 | |
| | | | | | | | |
The accompanying notes are an integral part of the financial statements.
54
| | | | | | | | | | | | | | | | | | | | | | |
MML
NASDAQ-100 Fund | | | MML
Small Cap Growth Equity Fund | | | | | | | |
Year
Ended
December 31, 2010 | | | Year
Ended
December 31, 2009 | | | Year
Ended
December 31, 2010 | | | Year
Ended
December 31, 2009 | | | | | | | |
| | | | | | | | | | | | | | | | | | | | | | |
| | | | | | | | | | | | | | | | | | | | | | |
| $ | 35,354 | | | $ | 12,426 | | | $ | (1,582,956 | ) | | $ | (1,333,528 | ) | | | | | | | | |
| | 37,232 | | | | 31,002 | | | | 34,824,758 | | | | (3,143,377 | ) | | | | | | | | |
| | 1,892,953 | | | | 3,138,181 | | | | 20,037,100 | | | | 75,176,327 | | | | | | | | | |
| | | | | | | | | | | | | | | | | | | | | | | |
| | 1,965,539 | | | | 3,181,609 | | | | 53,278,902 | | | | 70,699,422 | | | | | | | | | |
| | | | | | | | | | | | | | | | | | | | | | | |
| | | | | | | | | | | | | | | | | | | | | | |
| | | | | | | | | | | | | | | | | | | | | | |
| | (12,546 | ) | | | (184 | ) | | | - | | | | - | | | | | | | | | |
| | (172 | ) | | | - | | | | - | | | | - | | | | | | | | | |
| | | | | | | | | | | | | | | | | | | | | | | |
| | (12,718 | ) | | | (184 | ) | | | - | | | | - | | | | | | | | | |
| | | | | | | | | | | | | | | | | | | | | | | |
| | | | | | | | | | | | | | | | | | | | | | |
| | | | | | | | | | | | | | | | | | | | | | |
| | 39,217 | | | | 805,925 | | | | (43,733,654 | ) | | | 8,660,175 | | | | | | | | | |
| | 441,975 | | | | 223,226 | | | | 1,105,424 | | | | 1,129,031 | | | | | | | | | |
| | | | | | | | | | | | | | | | | | | | | | | |
| | 481,192 | | | | 1,029,151 | | | | (42,628,230 | ) | | | 9,789,206 | | | | | | | | | |
| | | | | | | | | | | | | | | | | | | | | | | |
| | 2,434,013 | | | | 4,210,576 | | | | 10,650,672 | | | | 80,488,628 | | | | | | | | | |
| | | | | | | | | | | | | | | | | | | | | | |
| | 9,783,248 | | | | 5,572,672 | | | | 252,622,048 | | | | 172,133,420 | | | | | | | | | |
| | | | | | | | | | | | | | | | | | | | | | | |
| $ | 12,217,261 | | | $ | 9,783,248 | | | $ | 263,272,720 | | | $ | 252,622,048 | | | | | | | | | |
| | | | | | | | | | | | | | | | | | | | | | | |
| | | | | |
| $ | 30,748 | | | $ | 8,112 | | | $ | (65,759 | ) | | $ | (52,717 | ) | | | | | | | | |
| | | | | | | | | | | | | | | | | | | | | | | |
55
MML Series Investment Fund – Financial Highlights
(For a share outstanding throughout each period)
MML Blue Chip Growth Fund
| | | | | | | | | | | | | | | | | | | | |
| | | Initial Class | |
| | | Year
Ended
12/31/10 | | | Year
Ended
12/31/09 | | | Year Ended
12/31/08 | | | Year
Ended
12/31/07 | | | Period
Ended
12/31/06 + | |
Net asset value, beginning of period | | $ | 9.71 | | | $ | 6.83 | | | $ | 11.87 | | | $ | 10.58 | | | $ | 10.00 | |
| | | | | | | | | | | | | | | | | | | | |
Income (loss) from investment operations: | | | | | | | | | | | | | | | | | | | | |
Net investment income (loss) *** | | | 0.01 | | | | 0.01 | | | | 0.02 | | | | 0.05 | | | | 0.02 | |
Net realized and unrealized gain (loss) on investments | | | 1.56 | | | | 2.88 | | | | (5.06 | ) | | | 1.29 | | | | 0.58 | |
| | | | | | | | | | | | | | | | | | | | |
Total income (loss) from investment operations | | | 1.57 | | | | 2.89 | | | | (5.04 | ) | | | 1.34 | | | | 0.60 | |
| | | | | | | | | | | | | | | | | | | | |
Less distributions to shareholders: | | | | | | | | | | | | | | | | | | | | |
From net investment income | | | (0.01 | ) | | | (0.01 | ) | | | - | | | | (0.05 | ) | | | (0.02 | ) |
Tax return of capital | | | - | | | | - | | | | - | | | | (0.00 | ) † | | | - | |
| | | | | | | | | | | | | | | | | | | | |
Total distributions | | | (0.01 | ) | | | (0.01 | ) | | | - | | | | (0.05 | ) | | | (0.02 | ) |
| | | | | | | | | | | | | | | | | | | | |
Net asset value, end of period | | $ | 11.27 | | | $ | 9.71 | | | $ | 6.83 | | | $ | 11.87 | | | $ | 10.58 | |
| | | | | | | | | | | | | | | | | | | | |
Total Return ^^ | | | 16.17% | | | | 42.38% | | | | (42.46% | ) | | | 12.67% | | | | 6.04% | ** |
| | | | | |
Ratios / Supplemental Data: | | | | | | | | | | | | | | | | | | | | |
Net assets, end of period (000’s) | | $ | 336,211 | | | $ | 182,984 | | | $ | 168,558 | | | $ | 61,701 | | | $ | 54,746 | |
Ratio of expenses to average daily net assets: | | | | | | | | | | | | | | | | | | | | |
Before expense waiver | | | 0.80% | | | | 0.83% | | | | 0.85% | | | | 0.84% | | | | 0.90% | * |
After expense waiver | | | N/A | | | | N/A | | | | 0.84% | # | | | N/A | | | | 0.85% | *# |
Net investment income (loss) to average daily net assets | | | 0.06% | | | | 0.12% | | | | 0.23% | | | | 0.40% | | | | 0.37% | * |
Portfolio turnover rate | | | 37% | | | | 80% | >> | | | 33% | | | | 35% | | | | 24% | ** |
| | | |
| | | Service Class | | | | | | | |
| | | Year
Ended
12/31/10 | | | Year
Ended
12/31/09 | | | Period
Ended
12/31/08 +++ | | | | | | | |
Net asset value, beginning of period | | $ | 9.68 | | | $ | 6.83 | | | $ | 10.70 | | | | | | | | | |
| | | | | | | | | | | | | | | | | | | | |
Income (loss) from investment operations: | | | | | | | | | | | | | | | | | | | | |
Net investment income (loss) *** | | | (0.02 | ) | | | (0.01 | ) | | | 0.00 | † | | | | | | | | |
Net realized and unrealized gain (loss) on investments | | | 1.56 | | | | 2.87 | | | | (3.87 | ) | | | | | | | | |
| | | | | | | | | | | | | | | | | | | | |
Total income (loss) from investment operations | | | 1.54 | | | | 2.86 | | | | (3.87 | ) | | | | | | | | |
| | | | | | | | | | | | | | | | | | | | |
Less distributions to shareholders: | | | | | | | | | | | | | | | | | | | | |
From net investment income | | | - | | | | (0.01 | ) | | | - | | | | | | | | | |
| | | | | | | | | | | | | | | | | | | | |
Total distributions | | | - | | | | (0.01 | ) | | | - | | | | | | | | | |
| | | | | | | | | | | | | | | | | | | | |
Net asset value, end of period | | $ | 11.22 | | | $ | 9.68 | | | $ | 6.83 | | | | | | | | | |
| | | | | | | | | | | | | | | | | | | | |
Total Return ^^ | | | 15.91% | | | | 41.93% | | | | (36.17% | ) ** | | | | | | | | |
| | | | | |
Ratios / Supplemental Data: | | | | | | | | | | | | | | | | | | | | |
Net assets, end of period (000’s) | | $ | 7,837 | | | $ | 5,600 | | | $ | 1,816 | | | | | | | | | |
Ratio of expenses to average daily net assets | | | 1.05% | | | | 1.08% | | | | 1.10% | * | | | | | | | | |
Net investment income (loss) to average daily net assets | | | (0.20% | ) | | | (0.13% | ) | | | 0.17% | * | | | | | | | | |
Portfolio turnover rate | | | 37% | | | | 80% | >> | | | 33% | ~ | | | | | | | | |
| ** | Percentage represents the results for the period and is not annualized. |
| *** | Per share amount calculated on the average shares method. |
| † | Amount is less than $0.005 per share. |
| + | For the period May 1, 2006 (commencement of operations) through December 31, 2006. |
| +++ | For the period August 15, 2008 (commencement of operations) through December 31, 2008. |
| # | Computed after giving effect to an agreement by MassMutual to waive certain fees and expenses of the Fund. |
| ^^ | Total return does not reflect expenses that apply at the separate account level or to related insurance products. Inclusion of these charges would reduce the total return figures for all periods shown. |
| ~ | The portfolio turnover rate results are for the Fund. |
| >> | The portfolio turnover rate excludes merger activity. |
The accompanying notes are an integral part of the financial statements.
56
MML Series Investment Fund – Financial Highlights (Continued)
(For a share outstanding throughout each period)
MML Emerging Growth Fund
| | | | | | | | | | | | | | | | | | | | |
| | | Initial Class | |
| | | Year
Ended
12/31/10 | | | Year
Ended
12/31/09 | | | Year Ended
12/31/08 | | | Year
Ended
12/31/07 | | | Year
Ended
12/31/06 | |
Net asset value, beginning of year | | $ | 4.83 | | | $ | 4.30 | | | $ | 7.41 | | | $ | 6.29 | | | $ | 5.97 | |
| | | | | | | | | | | | | | | | | | | | |
Income (loss) from investment operations: | | | | | | | | | | | | | | | | | | | | |
Net investment income (loss) *** | | | (0.05 | ) | | | (0.04 | ) | | | (0.05 | ) | | | (0.05 | ) | | | (0.05 | ) |
Net realized and unrealized gain (loss) on investments | | | 1.27 | | | | 0.57 | | | | (3.06 | ) | | | 1.17 | | | | 0.37 | |
| | | | | | | | | | | | | | | | | | | | |
Total income (loss) from investment operations | | | 1.22 | | | | 0.53 | | | | (3.11 | ) | | | 1.12 | | | | 0.32 | |
| | | | | | | | | | | | | | | | | | | | |
Net asset value, end of year | | $ | 6.05 | | | $ | 4.83 | | | $ | 4.30 | | | $ | 7.41 | | | $ | 6.29 | |
| | | | | | | | | | | | | | | | | | | | |
Total Return ^^ | | | 25.26% | | | | 12.33% | | | | (41.97% | ) | | | 17.81% | | | | 5.36% | |
| | | | | |
Ratios / Supplemental Data: | | | | | | | | | | | | | | | | | | | | |
Net assets, end of year (000’s) | | $ | 13,146 | | | $ | 10,566 | | | $ | 9,873 | | | $ | 18,911 | | | $ | 14,703 | |
Ratio of expenses to average daily net assets: | | | | | | | | | | | | | | | | | | | | |
Before expense waiver | | | 1.45% | | | | 1.52% | | | | 1.58% | | | | 1.44% | | | | 1.55% | |
After expense waiver | | | 1.25% | # | | | 1.25% | # | | | 1.22% | # | | | 1.16% | # | | | 1.16% | # |
Net investment income (loss) to average daily net assets | | | (0.92% | ) | | | (0.95% | ) | | | (0.89% | ) | | | (0.72% | ) | | | (0.83% | ) |
Portfolio turnover rate | | | 175% | | | | 184% | | | | 280% | | | | 195% | | | | 291% | |
| | | |
| | | Service Class | | | | | | | |
| | | Year
Ended
12/31/10 | | | Year
Ended
12/31/09 | | | Period
Ended
12/31/08 +++ | | | | | | | |
Net asset value, beginning of period | | $ | 4.81 | | | $ | 4.30 | | | $ | 6.72 | | | | | | | | | |
| | | | | | | | | | | | | | | | | | | | |
Income (loss) from investment operations: | | | | | | | | | | | | | | | | | | | | |
Net investment income (loss) *** | | | (0.06 | ) | | | (0.05 | ) | | | (0.02 | ) | | | | | | | | |
Net realized and unrealized gain (loss) on investments | | | 1.26 | | | | 0.56 | | | | (2.40 | ) | | | | | | | | |
| | | | | | | | | | | | | | | | | | | | |
Total income (loss) from investment operations | | | 1.20 | | | | 0.51 | | | | (2.42 | ) | | | | | | | | |
| | | | | | | | | | | | | | | | | | | | |
Net asset value, end of period | | $ | 6.01 | | | $ | 4.81 | | | $ | 4.30 | | | | | | | | | |
| | | | | | | | | | | | | | | | | | | | |
Total Return ^^ | | | 24.95% | | | | 11.86% | | | | (36.01% | ) ** | | | | | | | | |
| | | | | |
Ratios / Supplemental Data: | | | | | | | | | | | | | | | | | | | | |
Net assets, end of period (000’s) | | $ | 953 | | | $ | 497 | | | $ | 181 | | | | | | | | | |
Ratio of expenses to average daily net assets: | | | | | | | | | | | | | | | | | | | | |
Before expense waiver | | | 1.70% | | | | 1.77% | | | | 2.27% | * | | | | | | | | |
After expense waiver | | | 1.50% | # | | | 1.50% | # | | | 1.50% | *# | | | | | | | | |
Net investment income (loss) to average daily net assets | | | (1.14% | ) | | | (1.21% | ) | | | (1.10% | ) * | | | | | | | | |
Portfolio turnover rate | | | 175% | | | | 184% | | | | 280% | ~ | | | | | | | | |
| ** | Percentage represents the results for the period and is not annualized. |
| *** | Per share amount calculated on the average shares method. |
| +++ | For the period August 15, 2008 (commencement of operations) through December 31, 2008. |
| # | Computed after giving effect to an agreement by MassMutual to waive certain fees and expenses of the Fund. |
| ^^ | Total return does not reflect expenses that apply at the separate account level or to related insurance products. Inclusion of these charges would reduce the total return figures for all periods shown. |
| ~ | The portfolio turnover rate results are for the Fund. |
The accompanying notes are an integral part of the financial statements.
57
MML Series Investment Fund – Financial Highlights (Continued)
(For a share outstanding throughout each period)
MML Equity Index Fund
| | | | | | | | | | | | | | | | | | | | |
| | | Class I | |
| | | Year
Ended
12/31/10 | | | Year
Ended
12/31/09 | | | Year
Ended
12/31/08 | | | Year
Ended
12/31/07 | | | Year
Ended
12/31/06 | |
Net asset value, beginning of year | | $ | 13.97 | | | $ | 11.33 | | | $ | 18.06 | | | $ | 17.45 | | | $ | 15.36 | |
| | | | | | | | | | | | | | | | | | | | |
Income (loss) from investment operations: | | | | | | | | | | | | | | | | | | | | |
Net investment income (loss) *** | | | 0.23 | | | | 0.22 | | | | 0.29 | | | | 0.28 | | | | 0.25 | |
Net realized and unrealized gain (loss) on investments | | | 1.76 | | | | 2.72 | | | | (7.02 | ) | | | 0.61 | | | | 2.10 | |
| | | | | | | | | | | | | | | | | | | | |
Total income (loss) from investment operations | | | 1.99 | | | | 2.94 | | | | (6.73 | ) | | | 0.89 | | | | 2.35 | |
| | | | | | | | | | | | | | | | | | | | |
Less distributions to shareholders: | | | | | | | | | | | | | | | | | | | | |
From net investment income | | | (0.23 | ) | | | (0.30 | ) | | | - | | | | (0.28 | ) | | | (0.26 | ) |
| | | | | | | | | | | | | | | | | | | | |
Total distributions | | | (0.23 | ) | | | (0.30 | ) | | | - | | | | (0.28 | ) | | | (0.26 | ) |
| | | | | | | | | | | | | | | | | | | | |
Net asset value, end of year | | $ | 15.73 | | | $ | 13.97 | | | $ | 11.33 | | | $ | 18.06 | | | $ | 17.45 | |
| | | | | | | | | | | | | | | | | | | | |
Total Return ^^ | | | 14.51% | | | | 26.15% | | | | (37.26% | ) | | | 5.13% | | | | 15.30% | |
| | | | | |
Ratios / Supplemental Data: | | | | | | | | | | | | | | | | | | | | |
Net assets, end of year (000’s) | | $ | 81,199 | | | $ | 74,938 | | | $ | 48,279 | | | $ | 88,058 | | | $ | 85,288 | |
Ratio of expenses to average daily net assets: | | | | | | | | | | | | | | | | | | | | |
Before expense waiver | | | 0.45% | | | | 0.46% | | | | 0.45% | | | | 0.45% | | | | 0.46% | |
After expense waiver | | | N/A | | | | 0.45% | # | | | 0.45% | ## | | | N/A | | | | 0.45% | # |
Net investment income (loss) to average daily net assets | | | 1.60% | | | | 1.84% | | | | 1.88% | | | | 1.53% | | | | 1.54% | |
Portfolio turnover rate | | | 5% | | | | 6% | | | | 5% | | | | 6% | | | | 4% | |
| |
| | | Class II | |
| | | Year
Ended
12/31/10 | | | Year
Ended
12/31/09 | | | Year
Ended
12/31/08 | | | Year
Ended
12/31/07 | | | Year
Ended
12/31/06 | |
Net asset value, beginning of year | | $ | 13.98 | | | $ | 11.34 | | | $ | 18.04 | | | $ | 17.44 | | | $ | 15.34 | |
| | | | | | | | | | | | | | | | | | | | |
Income (loss) from investment operations: | | | | | | | | | | | | | | | | | | | | |
Net investment income (loss) *** | | | 0.25 | | | | 0.24 | | | | 0.31 | | | | 0.31 | | | | 0.28 | |
Net realized and unrealized gain (loss) on investments | | | 1.77 | | | | 2.72 | | | | (7.01 | ) | | | 0.60 | | | | 2.10 | |
| | | | | | | | | | | | | | | | | | | | |
Total income (loss) from investment operations | | | 2.02 | | | | 2.96 | | | | (6.70 | ) | | | 0.91 | | | | 2.38 | |
| | | | | | | | | | | | | | | | | | | | |
Less distributions to shareholders: | | | | | | | | | | | | | | | | | | | | |
From net investment income | | | (0.24 | ) | | | (0.32 | ) | | | - | | | | (0.31 | ) | | | (0.28 | ) |
| | | | | | | | | | | | | | | | | | | | |
Total distributions | | | (0.24 | ) | | | (0.32 | ) | | | - | | | | (0.31 | ) | | | (0.28 | ) |
| | | | | | | | | | | | | | | | | | | | |
Net asset value, end of year | | $ | 15.76 | | | $ | 13.98 | | | $ | 11.34 | | | $ | 18.04 | | | $ | 17.44 | |
| | | | | | | | | | | | | | | | | | | | |
Total Return ^^ | | | 14.76% | | | | 26.33% | | | | (37.14% | ) | | | 5.24% | | | | 15.54% | |
| | | | | |
Ratios / Supplemental Data: | | | | | | | | | | | | | | | | | | | | |
Net assets, end of year (000’s) | | $ | 115,521 | | | $ | 137,083 | | | $ | 117,274 | | | $ | 197,826 | | | $ | 189,688 | |
Ratio of expenses to average daily net assets: | | | | | | | | | | | | | | | | | | | | |
Before expense waiver | | | 0.34% | | | | 0.35% | | | | 0.34% | | | | 0.34% | | | | 0.35% | |
After expense waiver | | | 0.29% | # | | | 0.29% | # | | | 0.29% | # | | | 0.29% | # | | | 0.29% | # |
Net investment income (loss) to average daily net assets | | | 1.76% | | | | 2.03% | | | | 2.01% | | | | 1.69% | | | | 1.70% | |
Portfolio turnover rate | | | 5% | | | | 6% | | | | 5% | | | | 6% | | | | 4% | |
| *** | Per share amount calculated on the average shares method. |
| # | Computed after giving effect to an agreement by MassMutual to waive certain fees and expenses of the Fund. |
| ## | Amount waived had no impact on the ratio of expenses to average daily net assets. |
| ^^ | Total return does not reflect expenses that apply at the separate account level or to related insurance products. Inclusion of these charges would reduce the total return figures for all periods shown. |
The accompanying notes are an integral part of the financial statements.
58
MML Series Investment Fund – Financial Highlights (Continued)
(For a share outstanding throughout each period)
MML Equity Index Fund (Continued)
| | | | | | | | | | | | | | | | | | | | |
| | | Class III | |
| | | Year
Ended
12/31/10 | | | Year
Ended
12/31/09 | | | Year
Ended
12/31/08 | | | Year
Ended
12/31/07 | | | Year
Ended
12/31/06 | |
Net asset value, beginning of year | | $ | 13.97 | | | $ | 11.33 | | | $ | 18.01 | | | $ | 17.41 | | | $ | 15.31 | |
| | | | | | | | | | | | | | | | | | | | |
Income (loss) from investment operations: | | | | | | | | | | | | | | | | | | | | |
Net investment income (loss) *** | | | 0.27 | | | | 0.26 | | | | 0.34 | | | | 0.33 | | | | 0.30 | |
Net realized and unrealized gain (loss) on investments | | | 1.77 | | | | 2.72 | | | | (7.02 | ) | | | 0.61 | | | | 2.11 | |
| | | | | | | | | | | | | | | | | | | | |
Total income (loss) from investment operations | | | 2.04 | | | | 2.98 | | | | (6.68 | ) | | | 0.94 | | | | 2.41 | |
| | | | | | | | | | | | | | | | | | | | |
Less distributions to shareholders: | | | | | | | | | | | | | | | | | | | | |
From net investment income | | | (0.26 | ) | | | (0.34 | ) | | | - | | | | (0.34 | ) | | | (0.31 | ) |
| | | | | | | | | | | | | | | | | | | | |
Total distributions | | | (0.26 | ) | | | (0.34 | ) | | | - | | | | (0.34 | ) | | | (0.31 | ) |
| | | | | | | | | | | | | | | | | | | | |
Net asset value, end of year | | $ | 15.75 | | | $ | 13.97 | | | $ | 11.33 | | | $ | 18.01 | | | $ | 17.41 | |
| | | | | | | | | | | | | | | | | | | | |
Total Return ^^ | | | 14.93% | | | | 26.57% | | | | (37.09% | ) | | | 5.40% | | | | 15.72% | |
| | | | | |
Ratios / Supplemental Data: | | | | | | | | | | | | | | | | | | | | |
Net assets, end of year (000’s) | | $ | 106,015 | | | $ | 89,566 | | | $ | 76,287 | | | $ | 122,979 | | | $ | 127,549 | |
Ratio of expenses to average daily net assets: | | | | | | | | | | | | | | | | | | | | |
Before expense waiver | | | 0.20% | | | | 0.21% | | | | 0.20% | | | | 0.20% | | | | 0.21% | |
After expense waiver | | | 0.15% | # | | | 0.15% | # | | | 0.15% | # | | | 0.15% | # | | | 0.15% | # |
Net investment income (loss) to average daily net
assets | | | 1.90% | | | | 2.17% | | | | 2.23% | | | | 1.83% | | | | 1.83% | |
Portfolio turnover rate | | | 5% | | | | 6% | | | | 5% | | | | 6% | | | | 4% | |
| | | |
| | | Service Class I | | | | | | | |
| | | Year
Ended
12/31/10 | | | Year
Ended
12/31/09 | | | Period
Ended
12/31/08 +++ | | | | | | | |
Net asset value, beginning of period | | $ | 13.88 | | | $ | 11.32 | | | $ | 16.07 | | | | | | | | | |
| | | | | | | | | | | | | | | | | | | | |
Income (loss) from investment operations: | | | | | | | | | | | | | | | | | | | | |
Net investment income (loss) *** | | | 0.20 | | | | 0.18 | | | | 0.10 | | | | | | | | | |
Net realized and unrealized gain (loss) on investments | | | 1.73 | | | | 2.71 | | | | (4.85 | ) | | | | | | | | |
| | | | | | | | | | | | | | | | | | | | |
Total income (loss) from investment operations | | | 1.93 | | | | 2.89 | | | | (4.75 | ) | | | | | | | | |
| | | | | | | | | | | | | | | | | | | | |
Less distributions to shareholders: | | | | | | | | | | | | | | | | | | | | |
From net investment income | | | (0.22 | ) | | | (0.33 | ) | | | - | | | | | | | | | |
| | | | | | | | | | | | | | | | | | | | |
Total distributions | | | (0.22 | ) | | | (0.33 | ) | | | - | | | | | | | | | |
| | | | | | | | | | | | | | | | | | | | |
Net asset value, end of period | | $ | 15.59 | | | $ | 13.88 | | | $ | 11.32 | | | | | | | | | |
| | | | | | | | | | | | | | | | | | | | |
Total Return ^^ | | | 14.22% | | | | 25.83% | | | | (29.56% | ) ** | | | | | | | | |
| | | | | |
Ratios / Supplemental Data: | | | | | | | | | | | | | | | | | | | | |
Net assets, end of period (000’s) | | $ | 3,284 | | | $ | 1,171 | | | $ | 478 | | | | | | | | | |
Ratio of expenses to average daily net assets: | | | | | | | | | | | | | | | | | | | | |
Before expense waiver | | | 0.70% | | | | 0.71% | | | | 0.72% | * | | | | | | | | |
After expense waiver | | | N/A | | | | 0.70% | # | | | 0.70% | *# | | | | | | | | |
Net investment income (loss) to average daily net
assets | | | 1.39% | | | | 1.53% | | | | 2.33% | * | | | | | | | | |
Portfolio turnover rate | | | 5% | | | | 6% | | | | 5% | ~ | | | | | | | | |
| ** | Percentage represents the results for the period and is not annualized. |
| *** | Per share amount calculated on the average shares method. |
| +++ | For the period August 15, 2008 (commencement of operations) through December 31, 2008. |
| # | Computed after giving effect to an agreement by MassMutual to waive certain fees and expenses of the Fund. |
| ^^ | Total return does not reflect expenses that apply at the separate account level or to related insurance products. Inclusion of these charges would reduce the total return figures for all periods shown. |
| ~ | The portfolio turnover rate results are for the Fund. |
The accompanying notes are an integral part of the financial statements.
59
MML Series Investment Fund – Financial Highlights (Continued)
(For a share outstanding throughout each period)
MML Large Cap Value Fund
| | | | | | | | | | | | | | | | | | | | |
| | | Initial Class | |
| | | Year
Ended
12/31/10 | | | Year
Ended
12/31/09 | | | Year Ended
12/31/08 | | | Year
Ended
12/31/07 | | | Year
Ended
12/31/06 | |
Net asset value, beginning of year | | $ | 10.36 | | | $ | 8.01 | | | $ | 13.21 | | | $ | 12.80 | | | $ | 11.27 | |
| | | | | | | | | | | | | | | | | | | | |
Income (loss) from investment operations: | | | | | | | | | | | | | | | | | | | | |
Net investment income (loss) *** | | | 0.08 | | | | 0.07 | | | | 0.10 | | | | 0.15 | | | | 0.09 | |
Net realized and unrealized gain (loss) on investments | | | 1.19 | | | | 2.38 | | | | (5.29 | ) | | | 0.39 | | | | 1.52 | |
| | | | | | | | | | | | | | | | | | | | |
Total income (loss) from investment operations | | | 1.27 | | | | 2.45 | | | | (5.19 | ) | | | 0.54 | | | | 1.61 | |
| | | | | | | | | | | | | | | | | | | | |
Less distributions to shareholders: | | | | | | | | | | | | | | | | | | | | |
From net investment income | | | (0.09 | ) | | | (0.10 | ) | | | - | | | | (0.13 | ) | | | (0.08 | ) |
From net realized gains | | | - | | | | - | | | | (0.01 | ) | | | - | | | | - | |
| | | | | | | | | | | | | | | | | | | | |
Total distributions | | | (0.09 | ) | | | (0.10 | ) | | | (0.01 | ) | | | (0.13 | ) | | | (0.08 | ) |
| | | | | | | | | | | | | | | | | | | | |
Net asset value, end of year | | $ | 11.54 | | | $ | 10.36 | | | $ | 8.01 | | | $ | 13.21 | | | $ | 12.80 | |
| | | | | | | | | | | | | | | | | | | | |
Total Return ^^ | | | 12.38% | | | | 30.71% | | | | (39.30% | ) | | | 4.22% | | | | 14.18% | |
| | | | | |
Ratios / Supplemental Data: | | | | | | | | | | | | | | | | | | | | |
Net assets, end of year (000’s) | | $ | 218,666 | | | $ | 211,859 | | | $ | 175,313 | | | $ | 290,938 | | | $ | 216,821 | |
Ratio of expenses to average daily net assets | | | 0.83% | | | | 0.85% | | | | 0.84% | | | | 0.82% | | | | 0.85% | |
Net investment income (loss) to average daily net assets | | | 0.79% | | | | 0.77% | | | | 0.92% | | | | 1.10% | | | | 0.80% | |
Portfolio turnover rate | | | 17% | | | | 21% | | | | 20% | | | | 7% | | | | 10% | |
| | | |
| | | Service Class | | | | | | | |
| | | Year
Ended
12/31/10 | | | Year
Ended
12/31/09 | | | Period
Ended
12/31/08 +++ | | | | | | | |
Net asset value, beginning of period | | $ | 10.33 | | | $ | 8.01 | | | $ | 11.57 | | | | | | | | | |
| | | | | | | | | | | | | | | | | | | | |
Income (loss) from investment operations: | | | | | | | | | | | | | | | | | | | | |
Net investment income (loss) *** | | | 0.06 | | | | 0.04 | | | | 0.01 | | | | | | | | | |
Net realized and unrealized gain (loss) on investments | | | 1.17 | | | | 2.38 | | | | (3.56 | ) | | | | | | | | |
| | | | | | | | | | | | | | | | | | | | |
Total income (loss) from investment operations | | | 1.23 | | | | 2.42 | | | | (3.55 | ) | | | | | | | | |
| | | | | | | | | | | | | | | | | | | | |
Less distributions to shareholders: | | | | | | | | | | | | | | | | | | | | |
From net investment income | | | (0.07 | ) | | | (0.10 | ) | | | - | | | | | | | | | |
From net realized gains | | | - | | | | - | | | | (0.01 | ) | | | | | | | | |
| | | | | | | | | | | | | | | | | | | | |
Total distributions | | | (0.07 | ) | | | (0.10 | ) | | | (0.01 | ) | | | | | | | | |
| | | | | | | | | | | | | | | | | | | | |
Net asset value, end of period | | $ | 11.49 | | | $ | 10.33 | | | $ | 8.01 | | | | | | | | | |
| | | | | | | | | | | | | | | | | | | | |
Total Return ^^ | | | 12.04% | | | | 30.32% | | | | (30.69% | ) ** | | | | | | | | |
| | | | | |
Ratios / Supplemental Data: | | | | | | | | | | | | | | | | | | | | |
Net assets, end of period (000’s) | | $ | 16,519 | | | $ | 10,807 | | | $ | 4,823 | | | | | | | | | |
Ratio of expenses to average daily net assets | | | 1.08% | | | | 1.10% | | | | 1.12% | * | | | | | | | | |
Net investment income (loss) to average daily net assets | | | 0.56% | | | | 0.47% | | | | 0.48% | * | | | | | | | | |
Portfolio turnover rate | | | 17% | | | | 21% | | | | 20% | ~ | | | | | | | | |
| ** | Percentage represents the results for the period and is not annualized. |
| *** | Per share amount calculated on the average shares method. |
| +++ | For the period August 15, 2008 (commencement of operations) through December 31, 2008. |
| ^^ | Total return does not reflect expenses that apply at the separate account level or to related insurance products. Inclusion of these charges would reduce the total return figures for all periods shown. |
| ~ | The portfolio turnover rate results are for the Fund. |
The accompanying notes are an integral part of the financial statements.
60
MML Series Investment Fund – Financial Highlights (Continued)
(For a share outstanding throughout each period)
MML NASDAQ-100 Fund
| | | | | | | | | | | | | | | | | | | | |
| | | Initial Class | |
| | | Year
Ended
12/31/10 | | | Year
Ended
12/31/09 | | | Year Ended
12/31/08 | | | Year
Ended
12/31/07 | | | Year
Ended
12/31/06 | |
Net asset value, beginning of year | | $ | 4.74 | | | $ | 3.08 | | | $ | 5.30 | | | $ | 4.46 | | | $ | 4.18 | |
| | | | | | | | | | | | | | | | | | | | |
Income (loss) from investment operations: | | | | | | | | | | | | | | | | | | | | |
Net investment income (loss) *** | | | 0.02 | | | | 0.01 | | | | 0.00 | † | | | 0.00 | † | | | 0.01 | |
Net realized and unrealized gain (loss) on investments | | | 0.91 | | | | 1.65 | | | | (2.22 | ) | | | 0.84 | | | | 0.27 | |
| | | | | | | | | | | | | | | | | | | | |
Total income (loss) from investment operations | | | 0.93 | | | | 1.66 | | | | (2.22 | ) | | | 0.84 | | | | 0.28 | |
| | | | | | | | | | | | | | | | | | | | |
Less distributions to shareholders: | | | | | | | | | | | | | | | | | | | | |
From net investment income | | | (0.01 | ) | | | (0.00 | ) † | | | (0.00 | ) † | | | (0.00 | ) † | | | (0.00 | ) † |
| | | | | | | | | | | | | | | | | | | | |
Total distributions | | | (0.01 | ) | | | (0.00 | ) † | | | (0.00 | ) † | | | (0.00 | ) † | | | (0.00 | ) † |
| | | | | | | | | | | | | | | | | | | | |
Net asset value, end of year | | $ | 5.66 | | | $ | 4.74 | | | $ | 3.08 | | | $ | 5.30 | | | $ | 4.46 | |
| | | | | | | | | | | | | | | | | | | | |
Total Return ^^ | | | 19.58% | | | | 53.90% | | | | (41.89% | ) | | | 18.86% | | | | 6.75% | |
| | | | | |
Ratios / Supplemental Data: | | | | | | | | | | | | | | | | | | | | |
Net assets, end of year (000’s) | | $ | 10,913 | | | $ | 9,105 | | | $ | 5,322 | | | $ | 10,369 | | | $ | 8,474 | |
Ratio of expenses to average daily net assets: | | | | | | | | | | | | | | | | | | | | |
Before expense waiver | | | 0.86% | | | | 1.09% | | | | 1.23% | | | | 0.99% | | | | 1.08% | |
After expense waiver | | | 0.56% | # | | | 0.56% | # | | | 0.56% | # | | | 0.56% | # | | | 0.56% | # |
Net investment income (loss) to average daily net assets | | | 0.36% | | | | 0.18% | | | | 0.01% | | | | 0.02% | | | | 0.13% | |
Portfolio turnover rate | | | 5% | | | | 9% | | | | 18% | | | | 17% | | | | 9% | |
| | | |
| | | Service Class | | | | | | | |
| | | Year
Ended
12/31/10 | | | Year
Ended
12/31/09 | | | Period
Ended
12/31/08 +++ | | | | | | | |
Net asset value, beginning of period | | $ | 4.72 | | | $ | 3.08 | | | $ | 4.99 | | | | | | | | | |
| | | | | | | | | | | | | | | | | | | | |
Income (loss) from investment operations: | | | | | | | | | | | | | | | | | | | | |
Net investment income (loss) *** | | | 0.01 | | | | (0.00 | ) † | | | (0.00 | ) † | | | | | | | | |
Net realized and unrealized gain (loss) on investments | | | 0.91 | | | | 1.64 | | | | (1.91 | ) | | | | | | | | |
| | | | | | | | | | | | | | | | | | | | |
Total income (loss) from investment operations | | | 0.92 | | | | 1.64 | | | | (1.91 | ) | | | | | | | | |
| | | | | | | | | | | | | | | | | | | | |
Less distributions to shareholders: | | | | | | | | | | | | | | | | | | | | |
From net investment income | | | (0.00 | ) † | | | - | | | | (0.00 | ) † | | | | | | | | |
| | | | | | | | | | | | | | | | | | | | |
Total distributions | | | (0.00 | ) † | | | - | | | | (0.00 | ) † | | | | | | | | |
| | | | | | | | | | | | | | | | | | | | |
Net assets, end of period | | $ | 5.64 | | | $ | 4.72 | | | $ | 3.08 | | | | | | | | | |
| | | | | | | | | | | | | | | | | | | | |
Total Return ^^ | | | 19.51% | | | | 53.25% | | | | (38.28% | ) ** | | | | | | | | |
| | | | | |
Ratios / Supplemental Data: | | | | | | | | | | | | | | | | | | | | |
Net assets, end of period (000’s) | | $ | 1,304 | | | $ | 679 | | | $ | 251 | | | | | | | | | |
Ratio of expenses to average daily net assets: | | | | | | | | | | | | | | | | | | | | |
Before expense waiver | | | 1.11% | | | | 1.34% | | | | 2.05% | * | | | | | | | | |
After expense waiver | | | 0.81% | # | | | 0.81% | # | | | 0.81% | *# | | | | | | | | |
Net investment income (loss) to average daily net assets | | | 0.14% | | | | (0.06% | ) | | | (0.16% | ) * | | | | | | | | |
Portfolio turnover rate | | | 5% | | | | 9% | | | | 18% | ~ | | | | | | | | |
| ** | Percentage represents the results for the period and is not annualized. |
| *** | Per share amount calculated on the average shares method. |
| † | Amount is less than $0.005 per share. |
| +++ | For the period August 15, 2008 (commencement of operations) through December 31, 2008. |
| # | Computed after giving effect to an agreement by MassMutual to waive certain fees and expenses of the Fund. |
| ^^ | Total return does not reflect expenses that apply at the separate account level or to related insurance products. Inclusion of these charges would reduce the total return figures for all periods shown. |
| ~ | The portfolio turnover rate results are for the Fund. |
The accompanying notes are an integral part of the financial statements.
61
MML Series Investment Fund – Financial Highlights (Continued)
(For a share outstanding throughout each period)
MML Small Cap Growth Equity Fund
| | | | | | | | | | | | | | | | | | | | |
| | | Initial Class | |
| | | Year
Ended
12/31/10 | | | Year
Ended
12/31/09 | | | Year Ended
12/31/08 | | | Year
Ended
12/31/07 | | | Year
Ended
12/31/06 | |
Net asset value, beginning of year | | $ | 14.48 | | | $ | 10.46 | | | $ | 17.02 | | | $ | 16.07 | | | $ | 14.73 | |
| | | | | | | | | | | | | | | | | | | | |
Income (loss) from investment operations: | | | | | | | | | | | | | | | | | | | | |
Net investment income (loss) *** | | | (0.10 | ) | | | (0.08 | ) | | | (0.01 | ) | | | (0.07 | ) | | | (0.06 | ) |
Net realized and unrealized gain (loss) on investments | | | 3.32 | | | | 4.10 | | | | (6.55 | ) | | | 1.63 | | | | 1.40 | |
| | | | | | | | | | | | | | | | | | | | |
Total income (loss) from investment operations | | | 3.22 | | | | 4.02 | | | | (6.56 | ) | | | 1.56 | | | | 1.34 | |
| | | | | | | | | | | | | | | | | | | | |
Less distributions to shareholders: | | | | | | | | | | | | | | | | | | | | |
From net investment income | | | - | | | | - | | | | - | | | | (0.02 | ) | | | - | |
From net realized gains | | | - | | | | - | | | | - | | | | (0.59 | ) | | | - | |
| | | | | | | | | | | | | | | | | | | | |
Total distributions | | | - | | | | - | | | | - | | | | (0.61 | ) | | | - | |
| | | | | | | | | | | | | | | | | | | | |
Net asset value, end of year | | $ | 17.70 | | | $ | 14.48 | | | $ | 10.46 | | | $ | 17.02 | | | $ | 16.07 | |
| | | | | | | | | | | | | | | | | | | | |
Total Return ^^ | | | 22.24% | | | | 38.43% | | | | (38.54% | ) | | | 9.66% | | | | 9.10% | |
| | | | | |
Ratios / Supplemental Data: | | | | | | | | | | | | | | | | | | | | |
Net assets, end of year (000’s) | | $ | 258,833 | | | $ | 250,006 | | | $ | 171,302 | | | $ | 238,185 | | | $ | 169,941 | |
Ratio of expenses to average daily net assets | | | 1.14% | | | | 1.15% | | | | 1.15% | | | | 1.14% | | | | 1.18% | |
Net investment income (loss) to average daily net
assets | | | (0.64% | ) | | | (0.66% | ) | | | (0.06% | ) | | | (0.39% | ) | | | (0.41% | ) |
Portfolio turnover rate | | | 95% | | | | 90% | | | | 86% | | | | 70% | | | | 79% | |
| | | |
| | | Service Class | | | | | | | |
| | | Year
Ended
12/31/10 | | | Year
Ended
12/31/09 | | | Period Ended
12/31/08 +++ | | | | | | | |
Net asset value, beginning of period | | $ | 14.42 | | | $ | 10.45 | | | $ | 15.79 | | | | | | | | | |
| | | | | | | | | | | | | | | | | | | | |
Income (loss) from investment operations: | | | | | | | | | | | | | | | | | | | | |
Net investment income (loss) *** | | | (0.14 | ) | | | (0.11 | ) | | | 0.01 | | | | | | | | | |
Net realized and unrealized gain (loss) on investments | | | 3.31 | | | | 4.08 | | | | (5.35 | ) | | | | | | | | |
| | | | | | | | | | | | | | | | | | | | |
Total income (loss) from investment operations | | | 3.17 | | | | 3.97 | | | | (5.34 | ) | | | | | | | | |
| | | | | | | | | | | | | | | | | | | | |
Net asset value, end of period | | $ | 17.59 | | | $ | 14.42 | | | $ | 10.45 | | | | | | | | | |
| | | | | | | | | | | | | | | | | | | | |
Total Return ^^ | | | 21.90% | | | | 38.09% | | | | (33.82% | ) ** | | | | | | | | |
| | | | | |
Ratios / Supplemental Data: | | | | | | | | | | | | | | | | | | | | |
Net assets, end of period (000’s) | | $ | 4,440 | | | $ | 2,616 | | | $ | 831 | | | | | | | | | |
Ratio of expenses to average daily net assets | | | 1.39% | | | | 1.40% | | | | 1.43% | * | | | | | | | | |
Net investment income (loss) to average daily net
assets | | | (0.87% | ) | | | (0.91% | ) | | | 0.21% | * | | | | | | | | |
Portfolio turnover rate | | | 95% | | | | 90% | | | | 86% | ~ | | | | | | | | |
| ** | Percentage represents the results for the period and is not annualized. |
| *** | Per share amount calculated on the average shares method. |
| +++ | For the period August 15, 2008 (commencement of operations) through December 31, 2008. |
| ^^ | Total return does not reflect expenses that apply at the separate account level or to related insurance products. Inclusion of these charges would reduce the total return figures for all periods shown. |
| ~ | The portfolio turnover rate results are for the Fund |
The accompanying notes are an integral part of the financial statements.
62
Notes to Financial Statements
MML Series Investment Fund (the “Trust”) is registered under the Investment Company Act of 1940, as amended (the “1940 Act”), as a no-load, open-end, management investment company. The Trust is organized under the laws of the Commonwealth of Massachusetts as a Massachusetts business trust pursuant to an Agreement and Declaration of Trust dated May 14, 1993, as amended. The following are six series of the Trust (each individually referred to as a “Fund” or collectively as the “Funds”): MML Blue Chip Growth Fund (“Blue Chip Growth Fund”), MML Emerging Growth Fund (“Emerging Growth Fund”), MML Equity Index Fund (“Equity Index Fund”), MML Large Cap Value Fund (“Large Cap Value Fund”), MML NASDAQ-100® Fund (“NASDAQ-100 Fund”), and MML Small Cap Growth Equity Fund (“Small Cap Growth Equity Fund”).
The Trust makes shares of the Funds available for the investment of assets of various separate investment accounts established by Massachusetts Mutual Life Insurance Company (“MassMutual”) and by life insurance companies which are subsidiaries of MassMutual. Shares of the Trust are not offered to the general public. MassMutual, MML Bay State Life Insurance Company, and C.M. Life Insurance Company are the record owners of all of the outstanding shares of the Funds.
Each Fund, other than the Equity Index Fund, offers the following two classes of shares: Initial Class and Service Class shares. The Equity Index Fund offers the following four classes of shares: Class I, Class II, Class III, and Service Class I shares. Each share class represents an interest in the same portfolio of assets. The principal difference among the classes is the level of service and administration fees, and shareholder and distribution service expenses borne by the classes. Because each class will have different fees and expenses, performance and share prices will vary between the classes. The classes of shares are offered to different types of investors, as outlined in the Funds’ Prospectus.
Prior to the opening of business on May 1, 2009, the Blue Chip Growth Fund acquired all assets and liabilities of the MML Growth Equity Fund (“Growth Equity Fund”). The purpose of the transaction was to combine two funds managed by T. Rowe Price Associates, Inc. with comparable investment objectives and strategies. The acquisition was accomplished by a tax-free exchange of 2,313,857 Initial Class shares and 116,110 Service Class shares of the Growth Equity Fund, valued at $11,676,491 in total, for 1,492,512 Initial Class shares and 74,903 Service Class shares of the Blue Chip Growth Fund. The investment portfolio of the Growth Equity Fund, with a fair value of $11,704,785 and identified cost of $13,656,656 at April 30, 2009, was the principal asset acquired by the Blue Chip Growth Fund. For financial reporting purposes, assets received and shares issued by the Blue Chip Growth Fund were recorded at fair value; however, the cost basis of the investments received from the Growth Equity Fund was carried forward to align ongoing reporting of the Blue Chip Growth Fund’s realized and unrealized gains and losses with amounts distributable to shareholders for tax purposes. Immediately prior to the acquisition, Blue Chip Growth Fund’s net assets were $225,485,091.
| 2. | | Significant Accounting Policies |
The following is a summary of significant accounting policies followed consistently by each Fund in the preparation of the financial statements in conformity with accounting principles generally accepted in the United States of America (“generally accepted accounting principles”). The preparation of the financial statements in accordance with generally accepted accounting principles requires management to make estimates and assumptions that affect the reported amounts and disclosures in the financial statements. Actual results could differ from those estimates.
Investment Valuation
The net asset value of each Fund’s shares is determined once daily as of the close of regular trading on the New York Stock Exchange, on each day the New York Stock Exchange is open for trading. The New York Stock Exchange normally closes at 4:00 p.m. Eastern Time, but may close earlier on some days.
Equity securities are valued on the basis of information furnished by a pricing service, which provides the last reported sale price for securities listed on a national securities exchange or the official closing price on the NASDAQ National Market System, or in the case of over-the-counter (“OTC”) securities for which an official closing price is unavailable or not reported on the NASDAQ System, the last reported bid price. Debt securities (other than short-term obligations) are valued on the basis of valuations furnished by a pricing service, which determines valuations taking into account factors such as institutional-size trading in similar securities, yield, quality, coupon rate, maturity, type of issue, trading characteristics, and other market data. Short-term debt securities are valued at either amortized cost or at original cost plus accrued interest, whichever approximates current market value.
63
Notes to Financial Statements (Continued)
Shares of other open-end mutual funds are valued at their closing net asset values as reported on each business day. Investments are marked to market daily based on values provided by third-party vendors or market makers to the extent available or based on model prices. Valuations provided by third-party vendors and representative bids provided by market makers may be determined on the basis of a variety of factors, such as broker quotations, financial modeling, and other market data, such as market indexes and yield curves, counterparty information, and foreign exchange rates.
Investments for which market quotations are not available or for which a pricing service or vendor does not provide a value, or for which such market quotations or values are considered by the investment adviser or subadviser to be unreliable (including, for example, certain foreign securities, thinly-traded securities, initial public offerings, or securities whose values may have been affected by a significant event) are stated at fair valuations determined by the Funds’ Valuation Committee in accordance with procedures approved by the Board of Trustees (“Trustees”), and under the general oversight of the Trustees. It is possible that fair value prices will be used by the Funds to a significant extent. The value determined for an investment using the Funds’ fair value procedures may differ from recent market prices for the investment and may be significantly different from the value realized upon such asset’s sale.
Portfolio securities traded on more than one national securities exchange are valued at the last price on the business day at the close of the exchange representing the principal market for such securities. All assets and liabilities expressed in foreign currencies are converted into U.S. dollars at the mean between the buying and selling rates of such currencies against the U.S. dollar at the end of each business day.
The Funds may invest in securities that are traded principally in foreign markets and that trade on weekends and other days when the Funds do not price their shares. As a result, the values of the Funds’ portfolio securities may change on days when the prices of the Funds’ shares are not calculated. The prices of the Funds’ shares will reflect any such changes when the prices of the Funds’ shares are next calculated, which is the next day the New York Stock Exchange is open. The Funds may use fair value pricing more frequently for securities primarily traded in foreign markets because, among other things, most foreign markets close well before the Funds value their securities. The earlier close of these foreign markets gives rise to the possibility that significant events, including broad market moves, may have occurred in the interim. The Funds’ investments may be priced based on fair values provided by a third-party fair valuation vendor, based on certain factors and methodologies applied by such vendor, in the event that there is movement in the U.S. market that exceeds a specific threshold established by the Funds’ Valuation Committee pursuant to guidelines established by the Trustees, and under the general oversight of the Trustees.
Fair value is defined as the price that would be received to sell an asset or paid to transfer a liability in an orderly transaction between market participants at the measurement date. A three-tier hierarchy is utilized to maximize the use of observable market data inputs and minimize the use of unobservable inputs and to establish classification of fair value measurements for disclosure purposes. Inputs refer broadly to the assumptions that market participants would use in pricing the asset or liability, including assumptions about risk, for example, the risk inherent in a particular valuation technique used to measure fair value (such as a pricing model) and/or the risk inherent in the inputs to the valuation technique. Inputs may be observable or unobservable. Observable inputs are inputs that reflect the assumptions market participants would use in pricing the asset or liability and are developed based on market data obtained from sources independent of the reporting entity. Unobservable inputs are inputs that reflect the reporting entity’s own assumptions about the assumptions market participants would use in pricing the asset or liability and are developed based on the best information available in the circumstances. The three-tier hierarchy of inputs is summarized in the three broad Levels listed below.
Level 1 – quoted prices (unadjusted) in active markets for identical investments
Level 2 – other significant observable inputs (including quoted prices for similar investments, interest rates, prepayment speeds, credit risk, etc.)
Level 3 – significant unobservable inputs (including the Fund’s own assumptions in determining the fair value of investments)
Changes in valuation techniques may result in transfers in or out of an investment’s assigned Level within the hierarchy. The inputs or methodology used for valuing investments are not necessarily an indication of the risk associated with investing in those investments and the determination of the significance of a particular input to the fair value measurement in its entirety requires judgment and consideration of factors specific to each security.
The availability of observable inputs can vary from security to security and is affected by a wide variety of factors, including, for example, the type of security, whether the security is new and not yet established in the marketplace, the liquidity of markets, and
64
Notes to Financial Statements (Continued)
other characteristics particular to the security. To the extent that valuation is based on models or inputs that are less observable or unobservable in the market, the determination of fair value requires more judgment. Accordingly, the degree of judgment exercised in determining fair value is greatest for instruments categorized in Level 3.
In periods of market dislocation, the observability of prices and inputs may be reduced for many instruments. This condition, as well as changes related to liquidity of investments, could cause a security to be reclassified between Level 1, Level 2, or Level 3.
In certain cases, the inputs used to measure fair value may fall into different levels of the fair value hierarchy. In such cases, for disclosure purposes the level in the fair value hierarchy within which the fair value measurement falls is determined based on the lowest level input that is significant to the fair value measurement.
Fair Value Measurements
A description of the valuation techniques applied to the Funds’ major categories of assets and liabilities measured at fair value on a recurring basis follows.
Equity securities. Securities are generally valued based on quoted prices from the applicable exchange. To the extent these securities are actively traded, valuation adjustments are not applied and they are categorized in Level 1 of the fair value hierarchy. Certain foreign securities may be fair valued using a pricing service that considers the correlation of the trading patterns of the foreign security to the intraday trading in the U.S. markets for investments such as depositary receipts, futures, exchange-traded funds (“ETFs”), and the movement of certain indexes of securities based on a statistical analysis of the historical relationship and are categorized in Level 2 of the fair value hierarchy.
Corporate bonds. The fair value of corporate bonds is estimated using recently executed transactions, market price quotations (where observable), bond spreads, or credit default swap spreads adjusted for any basis difference between cash and derivative instruments. Corporate bonds are generally categorized in Level 2 of the fair value hierarchy; in instances where prices, spreads, or any of the other aforementioned key inputs are unobservable, they are categorized in Level 3 of the hierarchy.
Asset-backed securities and mortgage-backed securities. The fair value of asset-backed securities and mortgage-backed securities is estimated based on models that consider the estimated cash flows of each debt tranche of the issuer, establish a benchmark yield, and develop an estimated tranche specific spread to the benchmark yield based on the unique attributes of the tranche including, but not limited to, the prepayment speed assumptions and attributes of the collateral. To the extent the inputs are observable and timely, the values would be categorized in Level 2 of the fair value hierarchy, otherwise they would be categorized as Level 3.
U.S. Government and agency securities. U.S. government and agency securities are normally valued using a model that incorporates market observable data such as reported sales of similar securities, broker quotes, yields, bids, offers, quoted market prices, and reference data. Accordingly, U.S. government and agency securities are normally categorized in Level 2 of the fair value hierarchy.
Derivative contracts. Derivative contracts that are actively traded on an exchange are valued based on quoted prices from the exchange and are categorized in Level 1 of the fair value hierarchy. OTC derivative contracts include forward, swap, and option contracts related to interest rates, foreign currencies, credit standing of reference entities, equity prices, or commodity prices. Depending on the contract and the terms of the transaction, the fair value of the OTC derivative contracts can be modeled using a series of techniques, including simulation models. Many pricing models do not entail material subjectivity because the methodologies employed do not necessitate significant judgments and the pricing inputs are observed from actively quoted markets, as is the case of interest rate swap and option contracts. A majority of OTC derivative contracts valued by the Funds using pricing models fall into this category and are categorized within Level 2 of the fair value hierarchy.
Restricted securities. Restricted securities are valued at a discount to similar publicly traded securities and may be categorized as Level 2 of the fair value hierarchy to the extent that the discount is considered to be insignificant to the fair value measurement in its entirety; otherwise they may be categorized as Level 3. Any illiquid Rule 144A securities or restricted securities held in non-public entities are included in Level 3 of the fair value hierarchy because they trade infrequently and, therefore, the inputs are unobservable.
The Emerging Growth Fund characterized all long-term investments at Level 1 (except for warrants that were all at Level 3 and had $0 value throughout the period), and all short-term investments at Level 2, as of December 31, 2010. The Equity Index Fund
65
Notes to Financial Statements (Continued)
and NASDAQ-100 Fund characterized all long-term investments at Level 1, and all short-term investments at Level 2, as of December 31, 2010. For each Fund noted above, the level classification by major category of investments is the same as the category presentation in the Portfolio of Investments.
The following is the aggregate value by input level as of December 31, 2010 for the remaining Funds’ investments:
Asset Valuation Inputs
| | | | | | | | | | | | | | | | |
| | | Investments in Securities | |
| | | Level 1 —
Quoted Prices | | | Level 2 —
Other
Significant
Observable
Inputs | | | Level 3 —
Significant
Unobservable
Inputs | | | Total | |
Blue Chip Growth Fund | | | | | | | | | | | | | | | | |
Equities | | | | | | | | | | | | | | | | |
Common Stock | | | | | | | | | | | | | | | | |
Basic Materials | | $ | 13,205,425 | | | $ | - | | | $ | - | | | $ | 13,205,425 | |
Communications | | | 76,523,238 | | | | 3,659,456 | | | | - | | | | 80,182,694 | |
Consumer, Cyclical | | | 53,211,112 | | | | - | | | | - | | | | 53,211,112 | |
Consumer, Non-cyclical | | | 38,318,297 | | | | 263,396 | | | | - | | | | 38,581,693 | |
Energy | | | 27,312,067 | | | | - | | | | - | | | | 27,312,067 | |
Financial | | | 36,829,473 | | | | 294,133 | | | | - | | | | 37,123,606 | |
Industrial | | | 46,048,860 | | | | - | | | | - | | | | 46,048,860 | |
Technology | | | 47,274,195 | | | | - | | | | - | | | | 47,274,195 | |
| | | | | | | | | | | | | | | | |
Total Common Stock | | | 338,722,667 | | | | 4,216,985 | | | | - | | | | 342,939,652 | |
| | | | | | | | | | | | | | | | |
Total Equities | | | 338,722,667 | | | | 4,216,985 | | | | - | | | | 342,939,652 | |
| | | | | | | | | | | | | | | | |
Total Mutual Funds | | | 1,002 | | | | - | | | | - | | | | 1,002 | |
| | | | | | | | | | | | | | | | |
| Total Long-Term Investments | | | 338,723,669 | | | | 4,216,985 | | | | - | | | | 342,940,654 | |
| | | | | | | | | | | | | | | | |
| Total Short-Term Investments | | | - | | | | 2,018,988 | | | | - | | | | 2,018,988 | |
| | | | | | | | | | | | | | | | |
| Total Investments | | $ | 338,723,669 | | | $ | 6,235,973 | | | $ | - | | | $ | 344,959,642 | |
| | | | | | | | | | | | | | | | |
|
Large Cap Value Fund | |
Equities | | | | | | | | | | | | | | | | |
Common Stock | | | | | | | | | | | | | | | | |
Basic Materials | | $ | 7,315,139 | | | $ | 2,915,276 | | | $ | - | | | $ | 10,230,415 | |
Communications | | | 5,235,188 | | | | - | | | | - | | | | 5,235,188 | |
Consumer, Cyclical | | | 31,808,181 | | | | 358,754 | | | | - | | | | 32,166,935 | |
Consumer, Non-cyclical | | | 45,149,384 | | | | 3,572,465 | | | | - | | | | 48,721,849 | |
Diversified | | | - | | | | 2,378,117 | | | | - | | | | 2,378,117 | |
Energy | | | 34,697,236 | | | | 3,001,615 | | | | - | | | | 37,698,851 | |
Financial | | | 54,793,467 | | | | 8,118,008 | | | | - | | | | 62,911,475 | |
Industrial | | | 12,390,560 | | | | 2,446,819 | | | | - | | | | 14,837,379 | |
Technology | | | 11,478,395 | | | | - | | | | - | | | | 11,478,395 | |
| | | | | | | | | | | | | | | | |
Total Common Stock | | | 202,867,550 | | | | 22,791,054 | | | | - | | | | 225,658,604 | |
| | | | | | | | | | | | | | | | |
Total Equities | | | 202,867,550 | | | | 22,791,054 | | | | - | | | | 225,658,604 | |
| | | | | | | | | | | | | | | | |
Bonds & Notes | | | | | | | | | | | | | | | | |
Total Corporate Debt | | | - | | | | - | | | | 481,509 | | | | 481,509 | |
| | | | | | | | | | | | | | | | |
Total Bonds & Notes | | | - | | | | - | | | | 481,509 | | | | 481,509 | |
| | | | | | | | | | | | | | | | |
| Total Long-Term Investments | | | 202,867,550 | | | | 22,791,054 | | | | 481,509 | | | | 226,140,113 | |
| | | | | | | | | | | | | | | | |
| Total Short-Term Investments | | | - | | | | 11,343,449 | | | | - | | | | 11,343,449 | |
| | | | | | | | | | | | | | | | |
| Total Investments | | $ | 202,867,550 | | | $ | 34,134,503 | | | $ | 481,509 | | | $ | 237,483,562 | |
| | | | | | | | | | | | | | | | |
66
Notes to Financial Statements (Continued)
| | | | | | | | | | | | | | | | |
| | | Investments in Securities | |
| | | Level 1 —
Quoted Prices | | | Level 2 —
Other
Significant
Observable
Inputs | | | Level 3 —
Significant
Unobservable
Inputs | | | Total | |
Small Cap Growth Equity Fund | | | | | | | | | | | | | | | | |
Equities | | | | | | | | | | | | | | | | |
Common Stock | | | | | | | | | | | | | | | | |
Basic Materials | | $ | 3,241,266 | | | $ | - | | | $ | - | | | $ | 3,241,266 | |
Communications | | | 25,856,291 | | | | - | | | | - | | | | 25,856,291 | |
Consumer, Cyclical | | | 48,740,120 | | | | 474,784 | | | | - | | | | 49,214,904 | |
Consumer, Non-cyclical | | | 52,050,363 | | | | 866,829 | | | | - | | | | 52,917,192 | |
Energy | | | 15,680,759 | | | | - | | | | - | | | | 15,680,759 | |
Financial | | | 21,425,077 | | | | - | | | | - | | | | 21,425,077 | |
Industrial | | | 51,290,370 | | | | 394,678 | | | | - | | | | 51,685,048 | |
Technology | | | 41,951,086 | | | | 447,043 | | | | - | | | | 42,398,129 | |
Utilities | | | 1,932,882 | | | | - | | | | - | | | | 1,932,882 | |
| | | | | | | | | | | | | | | | |
Total Common Stock | | | 262,168,214 | | | | 2,183,334 | | | | - | | | | 264,351,548 | |
| | | | | | | | | | | | | | | | |
Total Equities | | | 262,168,214 | | | | 2,183,334 | | | | - | | | | 264,351,548 | |
| | | | | | | | | | | | | | | | |
Total Mutual Funds | | | 833,228 | | | | - | | | | - | | | | 833,228 | |
| | | | | | | | | | | | | | | | |
| Total Long-Term Investments | | | 263,001,442 | | | | 2,183,334 | | | | - | | | | 265,184,776 | |
| | | | | | | | | | | | | | | | |
| Total Short-Term Investments | | | - | | | | 3,397,256 | | | | - | | | | 3,397,256 | |
| | | | | | | | | | | | | | | | |
| Total Investments | | $ | 263,001,442 | | | $ | 5,580,590 | | | $ | - | | | $ | 268,582,032 | |
| | | | | | | | | | | | | | | | |
The following is the aggregate value by input level as of December 31, 2010 for the Funds’ other financial instruments:
Asset Valuation Inputs
| | | | | | | | | | | | | | | | |
| | | Other Financial Instruments | |
| | | Level 1 —
Quoted Prices | | | Level 2 —
Other
Significant
Observable
Inputs | | | Level 3 —
Significant
Unobservable
Inputs | | | Total | |
| Equity Index Fund | | | | | | | | | | | | | | | | |
Futures Contracts | | | | | | | | | | | | | | | | |
Equity Risk | | $ | 57,505 | | | $ | - | | | $ | - | | | $ | 57,505 | |
| NASDAQ-100 Fund | | | | | | | | | | | | | | | | |
Futures Contracts | | | | | | | | | | | | | | | | |
Equity Risk | | | 410 | | | | - | | | | - | | | | 410 | |
| Small Cap Growth Equity Fund | | | | | | | | | | | | | | | | |
Forward Contracts | | | | | | | | | | | | | | | | |
Foreign Exchange Risk | | | - | | | | 10,911 | | | | - | | | | 10,911 | |
Liability Valuation Inputs
| | | | | | | | | | | | | | | | |
| | | Other Financial Instruments | |
| | | Level 1 —
Quoted Prices | | | Level 2 —
Other
Significant
Observable
Inputs | | | Level 3 —
Significant
Unobservable
Inputs | | | Total | |
| Small Cap Growth Equity Fund | | | | | | | | | | | | | | | | |
Forward Contracts | | | | | | | | | | | | | | | | |
Foreign Exchange Risk | | $ | - | | | $ | (14,257 | ) | | $ | - | | | $ | (14,257 | ) |
67
Notes to Financial Statements (Continued)
The following table shows transfers between Level 1 and Level 2 of the fair value hierarchy:
| | | | | | | | | | | | | | | | |
| | | Transfers In* | | | Transfers Out* | |
| | | Level 1 —
Quoted Prices | | | Level 2 —
Other
Significant
Observable
Inputs | | | Level 1 —
Quoted Prices | | | Level 2 —
Other
Significant
Observable
Inputs | |
| Large Cap Value Fund | | $ | - | | | $ | 865,711 | | | $ | (865,711 | ) | | $ | - | |
| * | The Fund(s) recognize transfers between the Levels as of the beginning of the year. Transfers occurred between Level 1 and Level 2 as a result of securities transitioning between exchange traded and non-exchange traded. |
Following is a reconciliation of investments for which significant unobservable inputs (Level 3) were used in determining value:
Asset Valuation Inputs
| | | | | | | | | | | | | | | | | | | | | | | | | | | | | | | | | | | | |
| | | Investments in Securities | |
| | | Balance
as of
12/31/09 | | | Accrued
Discounts
(Premiums) | | | Realized
Gain
(Loss) | | | Change in
Unrealized
Appreciation
(Depreciation) | | | Net
Purchases
(Sales) | | | Transfers
into
Level 3* | | | Transfers
(out) of
Level 3* | | | Balance
as of
12/31/10 | | | Net Change
in Unrealized
Appreciation
(Depreciation)
from
Investments
Still Held
as of 12/31/10 | |
Large Cap Value Fund | | | | | | | | | | | | | | | | | | | | | | | | | | | | | | | | | | | | |
Long-Term Investments Bonds & Notes | | | | | | | | | | | | | | | | | | | | | | | | | | | | | | | | | | | | |
Corporate Debt | | $ | 424,069 | | | $ | (2,224 | ) | | $ | - | | | $ | 59,664 | | | $ | - | | | $ | - | | | $ | - | | | $ | 481,509 | | | $ | 59,664 | |
| | | | | | | | | | | | | | | | | | | | | | | | | | | | | | | | | | | | |
| * | The Fund recognizes transfers between the Levels as of the beginning of the period. |
Derivative Instruments
Derivatives are financial instruments whose values are based on the values of one or more indicators, such as a security, asset, currency, interest rate, or index. Derivative transactions can create investment leverage and may be highly volatile. It is possible that a derivative transaction will result in a loss greater than the principal amount invested. A Fund may not be able to close out a derivative transaction at a favorable time or price. For those Funds that held derivatives during the year ended December 31, 2010, the following table shows how the Fund used these derivatives during the period (marked with an “A”), as well as any additional uses it may have for them in the future (marked with an “M”).
| | | | | | | | |
| Type of Derivative and Objective for Use | | Emerging
Growth
Fund | | Equity
Index
Fund | | NASDAQ-100
Fund | | Small Cap
Growth
Equity
Fund |
Foreign Currency Exchange Transactions* | | | | | | | | |
Hedging/Risk Management | | | | | | | | A |
| | | | | |
Futures Contracts** | | | | | | | | |
Substitution for Cash Investment | | | | A | | A | | |
Rights and Warrants | | | | | | | | |
Result of Corporate Action | | A | | | | | | |
| * | Includes any options, futures contracts, forward contracts, and swap agreements, if applicable. |
| ** | Includes any options on futures contracts, if applicable. |
68
Notes to Financial Statements (Continued)
At December 31, 2010, and during the year then ended, the Fund(s) had the following derivatives and transactions in derivatives, grouped into the indicated risk categories:
| | | | | | | | | | | | |
| | | Equity
Risk | | | Foreign
Exchange
Risk | | | Total | |
| Emerging Growth Fund | | | | | | | | | | | | |
| Number of Contracts, Notional Amounts or Shares/Units† | | | | | | | | | | | | |
Warrants | | | 99 | | | | - | | | | 99 | |
| | | |
| Equity Index Fund | | | | | | | | | | | | |
| Asset Derivatives | | | | | | | | | | | | |
Futures Contracts^^ | | $ | 57,505 | | | $ | - | | | $ | 57,505 | |
| | | | | | | | | | | | |
| Realized Gain (Loss)# | | | | | | | | | | | | |
Futures Contracts | | $ | 435,862 | | | $ | - | | | $ | 435,862 | |
| | | | | | | | | | | | |
| Change in Appreciation (Depreciation)## | | | | | | | | | | | | |
Futures Contracts | | $ | (81,580 | ) | | $ | - | | | $ | (81,580 | ) |
| | | | | | | | | | | | |
| Number of Contracts, Notional Amounts or Shares/Units† | | | | | | | | | | | | |
Futures Contracts | | | 85 | | | | - | | | | 85 | |
| | | |
| NASDAQ-100 Fund | | | | | | | | | | | | |
| Asset Derivatives | | | | | | | | | | | | |
Futures Contracts^^ | | $ | 410 | | | $ | - | | | $ | 410 | |
| | | | | | | | | | | | |
| Realized Gain (Loss)# | | | | | | | | | | | | |
Futures Contracts | | $ | 35,320 | | | $ | - | | | $ | 35,320 | |
| | | | | | | | | | | | |
| Change in Appreciation (Depreciation)## | | | | | | | | | | | | |
Futures Contracts | | $ | (17,033 | ) | | $ | - | | | $ | (17,033 | ) |
| | | | | | | | | | | | |
| Number of Contracts, Notional Amounts or Shares/Units† | | | | | | | | | | | | |
Futures Contracts | | | 5 | | | | - | | | | 5 | |
| | | | | | | | | | | | |
| | | |
| Small Cap Growth Equity Fund | | | | | | | | | | | | |
| Asset Derivatives | | | | | | | | | | | | |
Forward Contracts* | | $ | - | | | $ | 10,911 | | | $ | 10,911 | |
| | | | | | | | | | | | |
| Liability Derivatives | | | | | | | | | | | | |
Forward Contracts^ | | $ | - | | | $ | (14,257 | ) | | $ | (14,257 | ) |
| | | | | | | | | | | | |
| Realized Gain (Loss)# | | | | | | | | | | | | |
Forward Contracts | | $ | - | | | $ | (32,170 | ) | | $ | (32,170 | ) |
| | | | | | | | | | | | |
| Change in Appreciation (Depreciation)## | | | | | | | | | | | | |
Forward Contracts | | $ | - | | | $ | (3,346 | ) | | $ | (3,346 | ) |
| | | | | | | | | | | | |
| Number of Contracts, Notional Amounts or Shares/Units† | | | | | | | | | | | | |
Forward Contracts | | $ | - | | | $ | 354,894 | | | $ | 354,894 | |
69
Notes to Financial Statements (Continued)
| * | Statements of Assets and Liabilities location: Receivables from: open forward foreign currency contracts. |
| ^ | Statements of Assets and Liabilities location: Payables for: open forward foreign currency contracts. |
| ^^ | Cumulative appreciation (depreciation) on futures contracts is reported in “Futures Contracts” below. Only current day’s variation margin, if any, is reported within the Statements of Assets and Liabilities. |
| # | Statements of Operations location: Amounts are included in net realized gain (loss) on: futures contracts or foreign currency transactions, as applicable. |
| ## | Statements of Operations location: Amounts are included in net change in unrealized appreciation (depreciation) on: futures contracts or translation of assets and liabilities in foreign currencies, as applicable. |
| † | Amount(s) disclosed represent average number of contracts, notional amounts, or shares/units outstanding, which is indicative of the volume of this derivative type for the months that the Fund held such derivatives during the year ended December 31, 2010. |
The Emerging Growth Fund had no change in appreciation (depreciation) and no realized gain (loss) on warrants during the year ended December 31, 2010.
Further details regarding the derivatives and other investments held by the Funds during the year ended December 31, 2010, are discussed below.
Foreign Currency Exchange Transactions
A Fund may engage in foreign currency exchange transactions for hedging purposes in order to protect against uncertainty in the level of future foreign currency exchange rates, or for other, non-hedging purposes.
A Fund may use foreign currency exchange transactions for hedging purposes to protect against two principal risks. First, if a Fund has assets or liabilities denominated in foreign (non-U.S. dollar) currencies, the Fund is exposed to the risk that the values of those assets or liabilities in U.S. dollars may fall or rise due to changes in currency exchange rates. Second, if the Fund agrees, or expects, to receive or deliver an asset denominated in a foreign currency, it is exposed to currency exchange risk until the date of receipt or delivery. In order to reduce those risks, a Fund may enter into foreign currency forward contracts, which call for the Fund to purchase or sell a foreign currency at a time in the future at a price determined at the time the contract is entered into. Forward contracts are private contractual arrangements and a Fund is subject to the risk that its counterparty will not, or will not be able to, perform its obligations. This type of arrangement may require the Fund to post margin.
Whenever a Fund enters into a foreign currency exchange transaction, it is subject to the risk that the value of the transaction will move in a direction unfavorable to it. When the Fund uses the transactions for hedging purposes, it is likely that the Fund will have an asset or liability that will offset any loss (or gain) on the transactions, at least in part. If a Fund enters into foreign currency exchange transactions other than for hedging purposes (for example, seeking to profit from an anticipated change in the values of currencies by creating directional exposures in the portfolio with respect to one or more currencies), it will generally be subject to the same risks, but is less likely to have assets or liabilities that will offset any losses on the transactions. There can be no assurance that a Fund will be able to terminate any foreign currency exchange transaction prior to its maturity in order to limit its loss on the transaction.
Forward foreign currency contracts are marked to market daily and the change in their value is recorded by the Funds as an unrealized gain or loss. Forward foreign currency contracts are valued at the settlement price established through dealers or other market sources on the day which they are traded. When a forward foreign currency contract is extinguished, through delivery or offset by entering into another forward foreign currency contract, the Funds record a realized gain or loss equal to the difference between the value of the contract at the time it was opened and the value of the contract at the time it was extinguished or offset. The notional or contractual amounts of these instruments do not necessarily represent the amounts potentially subject to risk. The measurement of the risk associated with these instruments is meaningful only when all related and offsetting transactions and counterparty risks are considered.
The Fund(s) listed in the following table had open forward foreign currency contracts at December 31, 2010. A Fund’s current exposure to a counterparty is typically the fair value of the contract.
70
Notes to Financial Statements (Continued)
| | | | | | | | | | | | | | | | | | | | | | | | |
| | | Counterparty | | Units of
Currency | | | Contracts to
Deliver/Receive | | Settlement
Date | | | In Exchange
for U.S.
Dollars | | | Contracts at
Value | | | Unrealized
Appreciation
(Depreciation) | |
| Small Cap Growth Equity Fund | | | | | | | | | | | | | | | | | | | | | | |
| BUYS | | | | | | | | | | | | | | | | | | | | | | |
| | Barclays Bank PLC | | | 14,000 | | | Australian Dollar | | | 1/05/11 | | | $ | 13,734 | | | $ | 14,329 | | | $ | 595 | |
| | | | | | | | | | | | | | | | | | | | | | | | |
| | | | | | | |
| | Deutsche Bank AG London | | | 96,000 | | | Australian Dollar | | | 1/05/11 | | | | 93,690 | | | | 98,256 | | | | 4,566 | |
| | | | | | | | | | | | | | | | | | | | | | | | |
| | | | | | | |
| | UBS AG | | | 58,000 | | | Australian Dollar | | | 1/05/11 | | | | 57,072 | | | | 59,363 | | | | 2,291 | |
| | | | | | | | | | | | | | | | | | | | | | | | |
| | | | | | | |
| | Westpac Banking Corp. | | | 60,000 | | | Australian Dollar | | | 1/05/11 | | | | 57,951 | | | | 61,410 | | | | 3,459 | |
| | | | | | | | | | | | | | | | | | | | | | | | |
| | | | | | | | | | | | | | $ | 222,447 | | | $ | 233,358 | | | $ | 10,911 | |
| | | | | | | | | | | | | | | | | | | | | | | | |
| SELLS | | | | | | | | | | | | | | | | | | | | | | |
| | Barclays Bank PLC | | | 228,000 | | | Australian Dollar | | | 1/05/11 | | | $ | 219,101 | | | $ | 233,358 | | | $ | (14,257 | ) |
| | | | | | | | | | | | | | | | | | | | | | | | |
Futures Contracts
A Fund may seek to manage a variety of different risks through the use of futures contracts, such as interest rate risk, equity price risk, and currency risk. A Fund may use interest rate futures contracts to adjust the interest rate sensitivity (duration) of its portfolio or the credit exposure of the portfolio. Interest rate futures contracts obligate the long or short holder to take or make delivery of a specified quantity of a financial instrument, such as a specific fixed-income security, during a specified future period at a specified price. A Fund may use index futures to hedge against broad market risks to its portfolio or to gain broad market exposure when it holds uninvested cash or as an inexpensive substitute for cash investments directly in securities or other assets. Securities index futures contracts are contracts to buy or sell units of a securities index at a specified future date at a price agreed upon when the contract is made and are settled in cash. Positions in futures may be closed out only on an exchange or board of trade which provides a secondary market for such futures. Because futures contracts are exchange-traded, they typically have minimal exposure to counterparty risk.
Parties to a futures contract are not required to post the entire notional amount of the contract, but rather a small percentage of that amount (by way of margin), both at the time they enter into futures transactions, and then on a daily basis if their positions decline in value; as a result, futures contracts are highly leveraged. Such payments are known as variation margin and are recorded by the Funds as unrealized gains or losses. Because futures markets are highly leveraged, they can be extremely volatile, and there can be no assurance that the pricing of a futures contract will correlate precisely with the pricing of the asset or index underlying it or the asset or liability of the Fund that is the subject of the hedge. It may not always be possible for a Fund to enter into a closing transaction with respect to a futures contract it has entered into, at a favorable time or price. When a Fund enters into a futures transaction, it is subject to the risk that the value of the futures contract will move in a direction unfavorable to it. When the Fund uses futures contracts for hedging purposes, it is likely that the Fund will have an asset or liability that will offset any loss (or gain) on the transactions, at least in part.
When a futures contract is closed, the Fund records a realized gain or loss equal to the difference between the value of the contract at the time it was opened and the value at the time it was closed. Futures contracts are valued at the settlement price established each day by the board of trade or exchange on which they are traded.
71
Notes to Financial Statements (Continued)
The Fund(s) listed in the following table had open futures contracts at December 31, 2010:
| | | | | | | | | | | | | | |
Number of
Contracts | | Type | | Expiration
Date | | | Notional
Contract
Value | | | Net Unrealized
Appreciation
(Depreciation) | |
| Equity Index Fund | | | | | | | | | | | | |
| BUYS | | | | | | | | | | | | | | |
| 43 | | S&P 500 E Mini Index | | | 3/18/11 | | | $ | 2,693,950 | | | $ | 57,505 | |
| | | | | | | | | | | | | | |
| NASDAQ-100 Fund | | | | | | | | | | | | |
| BUYS | | | | | | | | | | | | | | |
| 7 | | NASDAQ 100 E Mini Index | | | 3/18/11 | | | $ | 310,240 | | | $ | 410 | |
| | | | | | | | | | | | | | |
Options, Rights, and Warrants
A Fund may purchase and sell put and call options on securities or an index of securities to enhance investment performance or to protect against changes in market prices. A Fund that invests in debt securities may also purchase and sell put and call options to adjust the interest rate sensitivity of its portfolio or the credit exposure of the portfolio.
A call option gives the holder the right to purchase, and obligates the writer to sell, a security at the strike price at any time before the expiration date. A Fund may write call options on a security it owns, in a “directional” strategy hoping to realize a greater current return through the receipt of premiums. In return for the option premium, the Fund takes the risk that it will have to forego any increase in the value of the security over the strike price. When a Fund has written a call option on a security it does not own, its exposure on such an option is theoretically unlimited. A Fund may enter into closing purchase transactions in order to realize a profit or limit a loss on a previously written call option or, in the case of a call option on a security it owns, to free itself to sell the underlying security or to write another call on the security, or protect a security from being called in an unexpected market rise. Any profits from a closing purchase transaction in the case of a call option on a security a Fund owns may be offset by a decline in the value of the underlying security. Conversely, because increases in the market price of a call option will generally reflect increases in the market price of the underlying security, any loss resulting from a closing purchase transaction relating to a call option on a security a Fund owns is likely to be offset in whole or in part by unrealized appreciation of the underlying security owned by the Fund. A Fund may not be able to close out a call option that it has previously written.
A put option gives the holder the right to sell, and obligates the writer to buy, a security at the exercise price at any time before the expiration date. A Fund may write put options in order to enhance its current return by taking a long directional position as to a security or index of securities. By writing a put option, the Fund assumes the risk that it may be required to purchase the underlying security for an exercise price higher than its then current market value, resulting in a potential capital loss unless the security later appreciates in value. A Fund may terminate a put option that it has written before it expires by entering into a closing purchase transaction. Any loss from this transaction may be partially or entirely offset by the premium received on the terminated option. A Fund may not be able to close out a put option that it has previously written.
When a Fund writes a call or put option, an amount equal to the premium received is recorded as a liability. Premiums received from writing options which expire are treated as realized gains. Premiums received from writing options which are exercised or closed are added to the proceeds or offset against the amount paid on the underlying investment to determine the realized gain or loss.
A Fund may purchase put options to protect portfolio holdings against a decline in market value of a security or securities held by it. A Fund may also purchase a put option hoping to profit from an anticipated decline in the value of the underlying security. If the Fund holds the security underlying the option, the option premium and any transaction costs will reduce any profit the Fund might have realized had it sold the underlying security instead of buying the put option. A Fund may purchase call options to hedge against an increase in the price of securities that the Fund wants ultimately to buy. A Fund may also purchase a call option as a long directional investment hoping to profit from an anticipated increase in the value of the underlying security. In order for a call option to be profitable, the market price of the underlying security must rise sufficiently above the exercise price to cover the premium and transaction costs. These costs will reduce any profit the Fund might have realized had it bought the underlying security at the time it purchased the call option.
72
Notes to Financial Statements (Continued)
When a Fund purchases an option, it runs the risk that it will lose its entire investment in the option in a relatively short period of time, unless the Fund exercises the option or enters into a closing sale transaction before the option’s expiration. If the price of the underlying security does not rise (in the case of a call) or fall (in the case of a put) to an extent sufficient to cover the option premium and transaction costs, the Fund will lose part or all of its investment in the option. This contrasts with an investment by a Fund in the underlying security, since the Fund will not realize a loss if the security’s price does not change. Premiums paid for purchasing options that expire are treated as realized losses.
Options purchased or sold by a Fund may be traded on a securities or options exchange or market. Such options typically have minimal exposure to counterparty risk. However, an exchange or market may at times find it necessary to impose restrictions on particular types of options transactions, such as opening transactions. If an underlying security ceases to meet qualifications imposed by the market or the Options Clearing Corporation, new series of options on that security will no longer be opened to replace expiring series, and opening transactions in existing series may be prohibited.
OTC options purchased or sold by a Fund are not traded on securities or options exchanges or backed by clearinghouses. Rather, they are entered into directly between a Fund and the counterparty to the option. In the case of an OTC option purchased by the Fund, the value of the option to the Fund will depend on the willingness and ability of the option writer to perform its obligations to the Fund. In addition, OTC options may not be transferable and there may be little or no secondary market for them, so they may be considered illiquid. It may not be possible to enter into closing transactions with respect to OTC options or otherwise to terminate such options, and as a result a Fund may be required to remain obligated on an unfavorable OTC option until its expiration.
Exchange traded options are valued at the last sale price, or if no sales are reported, the last bid price for purchased options and the last ask price for written options. OTC options are valued using prices supplied by a primary pricing source, selected pursuant to procedures approved by the Trustees.
A Fund may invest in rights and warrants to purchase securities. Rights or warrants generally give the holder the right to receive, upon exercise, a security at a stated price. Funds typically use rights and warrants in a manner similar to their use of options on securities, as described above. Risks associated with the use of rights or warrants are generally similar to risks associated with the use of options.
The Fund(s) had warrants as shown in the Portfolio(s) of Investments at December 31, 2010.
The Fund(s) had no rights, purchased options, or written options at December 31, 2010.
Repurchase Agreements
Each Fund may enter into repurchase agreements with certain banks and broker-dealers whereby a Fund acquires a security for cash and obtains a simultaneous commitment from the seller to repurchase the security at an agreed upon price and date. A Fund, through its custodian, takes possession of the securities collateralizing the repurchase agreement. Repurchase agreements must be fully collateralized at all times, but involve some risk to the Fund if the other party should default on its obligation and the Fund is delayed or prevented from recovering the collateral, or if the Fund is required to return collateral to a borrower at a time when it may realize a loss on the investment of that collateral. Collateral for certain tri-party repurchase agreements is held at the Fund’s custodian or sub-custodian in a segregated account for the benefit of the Fund and the counterparty.
The Fund(s) had repurchase agreements as shown in the Portfolio(s) of Investments at December 31, 2010.
Accounting for Investment Transactions
Investment transactions are accounted for on the trade date. Realized gains and losses on sales of investments and unrealized appreciation and depreciation of investments are computed by the specific identification cost method. Proceeds received from litigation, if any, are included in realized gains on investment transactions for any investments that are no longer held in the portfolio and as a reduction in cost for investments that continue to be held in the portfolio. Interest income, adjusted for
73
Notes to Financial Statements (Continued)
amortization of discounts and premiums on debt securities, is earned from the settlement date and is recorded on the accrual basis. Dividend income and distributions are recorded on the ex-dividend date. Withholding taxes on foreign interest, dividends, and capital gains have been provided for in accordance with the applicable country’s tax rules and rates. Foreign dividend income is recorded on the ex-dividend date or as soon as practicable after the Fund determines the existence of a dividend declaration after exercising reasonable due diligence. Distributions received on securities that represent a return of capital or capital gain are recorded as a reduction of cost of investments and/or as a realized gain. The Funds estimate the components of distributions received that may be considered return of capital distributions or capital gain distributions.
Foreign Currency Translation
The books and records of the Funds are maintained in U.S. dollars. The market values of foreign currencies, foreign securities, and other assets and liabilities denominated in foreign currencies are translated into U.S. dollars at the mean of the buying and selling rates of such currencies against the U.S. dollar at the end of each business day. Purchases and sales of foreign securities and income and expense items are translated at the rates of exchange prevailing on the respective dates of such transactions. The Funds do not isolate that portion of the results of operations arising from changes in the exchange rates from that portion arising from changes in the market prices of securities. Net realized foreign currency gains and losses resulting from changes in exchange rates include foreign currency gains and losses between trade date and settlement date on investment securities transactions, foreign currency transactions, and the difference between the amounts of dividends or interest recorded on the books of the Funds and the amount actually received.
Allocation of Operating Activity
In maintaining the records for the Funds, the income and expense accounts are allocated to each class of shares. Investment income, unrealized and realized gains or losses are prorated among the classes of shares based on the relative net assets of each. Expenses are allocated to each class of shares depending on the nature of the expenditures. Administration and service fees, if any, which are directly attributable to a class of shares, are charged to that class’s operations. Expenses of the Fund not directly attributable to the operations of any class of shares or Fund are prorated among the Funds and classes to which the expense relates based on the relative net assets of each.
Foreign Securities
The Funds may invest in foreign securities, subject to certain percentage restrictions. Foreign securities, including ADRs, are subject to additional risks compared to securities of U.S. issuers, including international trade, currency, political, regulatory, and diplomatic risks. In addition, fluctuations in currency exchange rates may adversely affect the values of foreign securities and the price of a Fund’s shares. Emerging markets securities are subject to greater risks than securities issued in developed foreign markets, including less liquidity, greater price volatility, higher relative rates of inflation, greater political and economic instability, and greater volatility in currency exchange rates.
Credit Risk
The Funds may invest a portion of their assets, directly or indirectly, in securities backed by mortgage loans, credit card receivables, and automotive loans. The values and related income of these securities are sensitive to changes in economic conditions, including delinquencies and/or defaults. Continuing shifts in the market’s perception of credit quality on such securities have resulted in increased volatility of market price and periods of decreased market activity that have adversely impacted the valuation and liquidity of such securities.
Federal Income Tax
It is each Fund’s intent to continue to comply with the provisions of subchapter M of the Internal Revenue Code of 1986, as amended (the “Code”), applicable to a regulated investment company. Under such provisions, the Funds would not be subject to federal income taxes on their ordinary income and net realized capital gains to the extent they are distributed or deemed to have been distributed to their shareholders. Therefore, the Funds have not made any provision for federal income tax.
74
Notes to Financial Statements (Continued)
Dividends and Distributions to Shareholders
Dividends from net investment income of each Fund are declared and paid annually and at other times as may be required to satisfy tax or regulatory requirements. Distributions of any net realized capital gains of each Fund are declared and paid annually and at other times as may be required to satisfy tax or regulatory requirements.
Distributions to shareholders are recorded on the ex-dividend date. Income and capital gain distributions are determined in accordance with income tax regulations, which may differ from generally accepted accounting principles. As a result, net investment income and net realized capital gains on investment transactions for a reporting period may differ significantly from distributions during such period.
| 3. | | Management Fees and Other Transactions |
Investment Management Fees
Under agreements between MassMutual and the Trust on behalf of each Fund, MassMutual is responsible for providing investment management services for each Fund. In return for these services, MassMutual receives advisory fees, based upon each Fund’s average daily net assets, at the following annual rates:
| | |
Blue Chip Growth Fund | | 0.75% |
Emerging Growth Fund | | 1.05% of the first $200 million, |
| | 1.00% of the next $200 million, |
| | 0.95% of any excess over $400 million |
Equity Index Fund | | 0.10% |
Large Cap Value Fund | | 0.80% of the first $100 million, |
| | 0.75% of the next $400 million, |
| | 0.70% of any excess over $500 million |
NASDAQ-100 Fund | | 0.45% of the first $200 million, |
| | 0.44% of the next $200 million, |
| | 0.42% of any excess over $400 million |
Small Cap Growth Equity Fund | | 1.075% of the first $200 million, |
| | 1.05% of the next $200 million, |
| | 1.025% of the next $600 million, |
| | 1.00% of any excess over $1 billion |
MassMutual has entered into investment subadvisory agreements with the following unaffiliated investment subadvisers: Davis Selected Advisers, L.P. for the Large Cap Value Fund; Essex Investment Management Company, LLC for the Emerging Growth Fund; Northern Trust Investments, Inc. for the Equity Index Fund and NASDAQ-100 Fund; T. Rowe Price Associates, Inc. for the Blue Chip Growth Fund; Waddell & Reed Investment Management Company for a portion of the Small Cap Growth Equity Fund; and Wellington Management Company, LLP for a portion of the Small Cap Growth Equity Fund. Prior to August 20, 2010, Insight Capital Research & Management, Inc. was the investment subadviser for a portion of the Emerging Growth Fund. MassMutual pays a subadvisory fee to each of these subadvisers based upon the aggregate net assets under management which include (1) the average daily net assets of the specified Fund which it manages, and (2) the average daily net assets of all other funds or accounts of MassMutual or its affiliates for which the subadviser provides subadvisory services and which have substantially the same investment objectives, policies and investment strategies.
The Funds’ subadvisory fees are paid by MassMutual out of the management fees previously disclosed above.
75
Notes to Financial Statements (Continued)
Administration Fees
For the Equity Index Fund, under a separate administrative and shareholder services agreement between the Fund and MassMutual, MassMutual provides certain administrative and shareholder services and bears some class specific administrative expenses. In return for these services, MassMutual receives an administrative services fee, based upon the average daily net assets of the applicable class of shares of the Fund, at the following annual rates:
| | |
Class I | | 0.30% of the first $100 million, |
| | 0.28% of the next $150 million, |
| | 0.26% of any excess over $250 million |
Class II | | 0.19% |
Class III | | 0.05% |
Service Class I | | 0.30% of the first $100 million, |
| | 0.28% of the next $150 million, |
| | 0.26% of any excess over $250 million |
Service Fees
MML Distributors, LLC (the “Distributor”) acts as distributor to the Funds. Pursuant to a Distribution and Services Plan adopted by the Funds pursuant to Rule 12b-1 under the 1940 Act, Service Class shares and Service Class I shares of the Funds pay an annual fee of 0.25% of the average daily net asset value of Service Class shares and Service Class I shares. This fee, or a portion thereof, is paid to: (i) the Distributor for services provided and expenses incurred by it in connection with the distribution of Service Class shares or Service Class I shares, as applicable, of each Fund; and/or (ii) MassMutual for services provided and expenses incurred by it for purposes of maintaining or providing personal services to Service Class and Service Class I shareholders.
Expense Caps and Waivers
MassMutual agreed to bear the expenses of the Funds noted below (other than the management, Rule 12b-1, and administrative fees, interest, taxes, brokerage commissions, extraordinary litigation and legal expenses, Acquired Fund fees and expenses#, or other non-recurring or unusual expenses such as, for example, organizational expenses and shareholder meeting expenses) based upon the average daily net assets of the applicable class of shares of the Funds, as follows:
| | |
Emerging Growth Fund* | | |
Initial Class | | 0.20% |
Service Class | | 0.20% |
Equity Index Fund* | | |
Class I | | 0.05% |
Class II | | 0.05% |
Class III | | 0.05% |
Service Class I | | 0.05% |
NASDAQ-100 Fund* | | |
Initial Class | | 0.11% |
Service Class | | 0.11% |
| # | Acquired Fund fees and expenses are expenses borne indirectly by a Fund through investments in other pooled investment vehicles. |
| * | Expense caps in effect through May 1, 2011. |
MassMutual has agreed to voluntarily waive, through May 1, 2011, 0.05% of the administrative and shareholder service fee for Class II and Class III shares of the Equity Index Fund.
Expense caps and waiver amounts are reflected as a reduction of expenses on the Statements of Operations.
76
Notes to Financial Statements (Continued)
Rebated Brokerage Commissions
The Funds listed below have entered into agreements with certain brokers whereby the brokers will rebate to the Funds, in cash, a portion of brokerage commissions. Rebated brokerage commissions are amounts earned by the Funds and are included with realized gain or loss on investment transactions presented in the Statements of Operations. For the year ended December 31, 2010, brokerage commissions rebated under these agreements were as follows:
| | | | |
| | | Rebated
Commissions | |
Emerging Growth Fund | | $ | 1,588 | |
Large Cap Value Fund | | | 5,442 | |
Small Cap Growth Equity Fund | | | 87,051 | |
Deferred Compensation
Trustees of the Funds who are not employees of MassMutual or its subsidiaries may elect to defer receipt of their annual fees in accordance with terms of a Non-Qualified Deferred Compensation Plan. Amounts deferred shall accrue interest or earnings and shall be recorded on the Funds’ books as other liabilities. Deferred compensation is included within Trustees’ fees and expenses in the Statements of Assets and Liabilities.
Other
Certain officers and trustees of the Funds are also employees of MassMutual. The compensation of each trustee who is not an employee of MassMutual is borne by the Funds.
| 4. | | Purchases and Sales of Investments |
Cost of purchases and proceeds from sales of investment securities (excluding short-term investments) for the year ended December 31, 2010, were as follows:
| | | | | | | | | | | | | | | | |
| | | Purchases | | | Sales | |
| | | Long-Term U.S.
Government
Securities | | | Other
Long-Term
Securities | | | Long-Term U.S.
Government
Securities | | | Other
Long-Term
Securities | |
Blue Chip Growth Fund | | $ | - | | | $ | 201,824,417 | | | $ | - | | | $ | 95,035,925 | |
Emerging Growth Fund | | | - | | | | 19,480,845 | | | | - | | | | 19,498,781 | |
Equity Index Fund | | | - | | | | 15,116,379 | | | | - | | | | 42,015,659 | |
Large Cap Value Fund | | | - | | | | 34,496,778 | | | | - | | | | 50,173,258 | |
NASDAQ-100 Fund | | | - | | | | 1,232,397 | | | | - | | | | 516,197 | |
Small Cap Growth Equity Fund | | | - | | | | 225,408,058 | | | | - | | | | 256,812,178 | |
77
Notes to Financial Statements (Continued)
| 5. | | Capital Share Transactions |
Changes in shares outstanding for each Fund were as follows:
| | | | | | | | | | | | | | | | |
| | | Year ended December 31, 2010 | | | Year ended December 31, 2009 | |
| | | | |
| | | Shares | | | Amount | | | Shares | | | Amount | |
| | | | | | | | | | | | | | | | |
Blue Chip Growth Fund Initial Class | | | | | | | | | | | | | | | | |
Sold | | | 13,136,463 | | | $ | 127,254,431 | | | | 9,778,384 | | | $ | 71,995,023 | |
Issued — merger | | | - | | | | - | | | | 1,492,512 | | | | 11,119,214 | |
Issued as reinvestment of dividends | | | 25,498 | | | | 233,055 | | | | 27,790 | | | | 241,496 | |
Redeemed | | | (2,182,296 | ) | | | (22,066,171 | ) | | | (17,122,163 | ) | | | (137,267,841 | ) |
| | | | | | | | | | | | | | | | |
Net increase (decrease) | | | 10,979,665 | | | $ | 105,421,315 | | | | (5,823,477 | ) | | $ | (53,912,108 | ) |
| | | | | | | | | | | | | | | | |
Blue Chip Growth Fund Service Class | | | | | | | | | | | | | | | | |
Sold | | | 204,177 | | | $ | 2,017,782 | | | | 335,372 | | | $ | 2,483,134 | |
Issued — merger | | | - | | | | - | | | | 74,903 | | | | 557,277 | |
Issued as reinvestment of dividends | | | - | | | | - | | | | 813 | | | | 7,049 | |
Redeemed | | | (84,068 | ) | | | (862,242 | ) | | | (98,559 | ) | | | (860,536 | ) |
| | | | | | | | | | | | | | | | |
Net increase (decrease) | | | 120,109 | | | $ | 1,155,540 | | | | 312,529 | | | $ | 2,186,924 | |
| | | | | | | | | | | | | | | | |
Emerging Growth Fund Initial Class | | | | | | | | | | | | | | | | |
Sold | | | 451,088 | | | $ | 2,377,566 | | | | 391,600 | | | $ | 1,633,368 | |
Issued as reinvestment of dividends | | | - | | | | - | | | | - | | | | - | |
Redeemed | | | (466,379 | ) | | | (2,388,331 | ) | | | (496,737 | ) | | | (2,091,342 | ) |
| | | | | | | | | | | | | | | | |
Net increase (decrease) | | | (15,291 | ) | | $ | (10,765 | ) | | | (105,137 | ) | | $ | (457,974 | ) |
| | | | | | | | | | | | | | | | |
Emerging Growth Fund Service Class | | | | | | | | | | | | | | | | |
Sold | | | 87,705 | | | $ | 454,285 | | | | 72,568 | | | $ | 310,589 | |
Issued as reinvestment of dividends | | | - | | | | - | | | | - | | | | - | |
Redeemed | | | (32,562 | ) | | | (169,722 | ) | | | (11,209 | ) | | | (49,668 | ) |
| | | | | | | | | | | | | | | | |
Net increase (decrease) | | | 55,143 | | | $ | 284,563 | | | | 61,359 | | | $ | 260,921 | |
| | | | | | | | | | | | | | | | |
Equity Index Fund Class I | | | | | | | | | | | | | | | | |
Sold | | | 555,751 | | | $ | 7,978,978 | | | | 1,679,713 | | | $ | 20,860,662 | |
Issued as reinvestment of dividends | | | 90,430 | | | | 1,198,204 | | | | 109,278 | | | | 1,403,134 | |
Redeemed | | | (850,483 | ) | | | (12,229,078 | ) | | | (685,782 | ) | | | (8,187,164 | ) |
| | | | | | | | | | | | | | | | |
Net increase (decrease) | | | (204,302 | ) | | $ | (3,051,896 | ) | | | 1,103,209 | | | $ | 14,076,632 | |
| | | | | | | | | | | | | | | | |
Equity Index Fund Class II | | | | | | | | | | | | | | | | |
Sold | | | 643,856 | | | $ | 9,271,328 | | | | 782,496 | | | $ | 8,993,982 | |
Issued as reinvestment of dividends | | | 169,340 | | | | 2,245,451 | | | | 242,909 | | | | 3,118,953 | |
Redeemed | | | (3,287,313 | ) | | | (47,202,173 | ) | | | (1,563,639 | ) | | | (18,287,630 | ) |
| | | | | | | | | | | | | | | | |
Net increase (decrease) | | | (2,474,117 | ) | | $ | (35,685,394 | ) | | | (538,234 | ) | | $ | (6,174,695 | ) |
| | | | | | | | | | | | | | | | |
Equity Index Fund Class III | | | | | | | | | | | | | | | | |
Sold | | | 314,574 | | | $ | 4,250,665 | | | | 3,875 | | | $ | 44,944 | |
Issued as reinvestment of dividends | | | 128,578 | | | | 1,702,367 | | | | 168,593 | | | | 2,163,050 | |
Redeemed | | | (122,031 | ) | | | (1,734,847 | ) | | | (492,124 | ) | | | (5,441,972 | ) |
| | | | | | | | | | | | | | | | |
Net increase (decrease) | | | 321,121 | | | $ | 4,218,185 | | | | (319,656 | ) | | $ | (3,233,978 | ) |
| | | | | | | | | | | | | | | | |
78
Notes to Financial Statements (Continued)
| | | | | | | | | | | | | | | | |
| | | Year ended December 31, 2010 | | | Year ended December 31, 2009 | |
| | | | |
| | | Shares | | | Amount | | | Shares | | | Amount | |
| | | | | | | | | | | | | | | | |
Equity Index Fund Service Class I | | | | | | | | | | | | | | | | |
Sold | | | 147,473 | | | $ | 2,133,875 | | | | 53,932 | | | $ | 602,130 | |
Issued as reinvestment of dividends | | | 2,188 | | | | 28,744 | | | | 1,841 | | | | 23,510 | |
Redeemed | | | (23,405 | ) | | | (342,945 | ) | | | (13,684 | ) | | | (172,454 | ) |
| | | | | | | | | | | | | | | | |
Net increase (decrease) | | | 126,256 | | | $ | 1,819,674 | | | | 42,089 | | | $ | 453,186 | |
| | | | | | | | | | | | | | | | |
Large Cap Value Fund Initial Class | | | | | | | | | | | | | | | | |
Sold | | | 1,052,046 | | | $ | 10,794,704 | | | | 1,509,799 | | | $ | 11,572,069 | |
Issued as reinvestment of dividends | | | 173,168 | | | | 1,687,136 | | | | 224,534 | | | | 2,119,042 | |
Redeemed | | | (2,721,801 | ) | | | (28,738,298 | ) | | | (3,158,576 | ) | | | (27,151,611 | ) |
| | | | | | | | | | | | | | | | |
Net increase (decrease) | | | (1,496,587 | ) | | $ | (16,256,458 | ) | | | (1,424,243 | ) | | $ | (13,460,500 | ) |
| | | | | | | | | | | | | | | | |
Large Cap Value Fund Service Class | | | | | | | | | | | | | | | | |
Sold | | | 514,070 | | | $ | 5,429,658 | | | | 559,858 | | | $ | 4,444,148 | |
Issued as reinvestment of dividends | | | 9,271 | | | | 90,042 | | | | 10,731 | | | | 101,036 | |
Redeemed | | | (132,025 | ) | | | (1,405,405 | ) | | | (126,363 | ) | | | (1,175,515 | ) |
| | | | | | | | | | | | | | | | |
Net increase (decrease) | | | 391,316 | | | $ | 4,114,295 | | | | 444,226 | | | $ | 3,369,669 | |
| | | | | | | | | | | | | | | | |
NASDAQ-100 Fund Initial Class | | | | | | | | | | | | | | | | |
Sold | | | 523,673 | | | $ | 2,605,385 | | | | 625,885 | | | $ | 2,401,929 | |
Issued as reinvestment of dividends | | | 2,744 | | | | 12,546 | | | | 44 | | | | 184 | |
Redeemed | | | (520,378 | ) | | | (2,578,714 | ) | | | (431,828 | ) | | | (1,596,188 | ) |
| | | | | | | | | | | | | | | | |
Net increase (decrease) | | | 6,039 | | | $ | 39,217 | | | | 194,101 | | | $ | 805,925 | |
| | | | | | | | | | | | | | | | |
NASDAQ-100 Fund Service Class | | | | | | | | | | | | | | | | |
Sold | | | 128,758 | | | $ | 652,842 | | | | 111,948 | | | $ | 431,446 | |
Issued as reinvestment of dividends | | | 38 | | | | 172 | | | | - | | | | - | |
Redeemed | | | (41,151 | ) | | | (211,039 | ) | | | (49,889 | ) | | | (208,220 | ) |
| | | | | | | | | | | | | | | | |
Net increase (decrease) | | | 87,645 | | | $ | 441,975 | | | | 62,059 | | | $ | 223,226 | |
| | | | | | | | | | | | | | | | |
Small Cap Growth Equity Fund Initial Class | | | | | | | | | | | | | | | | |
Sold | | | 1,755,645 | | | $ | 27,023,059 | | | | 3,609,392 | | | $ | 41,061,675 | |
Issued as reinvestment of dividends | | | - | | | | - | | | | - | | | | - | |
Redeemed | | | (4,402,124 | ) | | | (70,756,713 | ) | | | (2,718,125 | ) | | | (32,401,500 | ) |
| | | | | | | | | | | | | | | | |
Net increase (decrease) | | | (2,646,479 | ) | | $ | (43,733,654 | ) | | | 891,267 | | | $ | 8,660,175 | |
| | | | | | | | | | | | | | | | |
Small Cap Growth Equity Fund Service Class | | | | | | | | | | | | | | | | |
Sold | | | 110,439 | | | $ | 1,742,737 | | | | 139,663 | | | $ | 1,601,993 | |
Issued as reinvestment of dividends | | | - | | | | - | | | | - | | | | - | |
Redeemed | | | (39,404 | ) | | | (637,313 | ) | | | (37,862 | ) | | | (472,962 | ) |
| | | | | | | | | | | | | | | | |
Net increase (decrease) | | | 71,035 | | | $ | 1,105,424 | | | | 101,801 | | | $ | 1,129,031 | |
| | | | | | | | | | | | | | | | |
79
Notes to Financial Statements (Continued)
| 6. | | Federal Income Tax Information |
At December 31, 2010, the cost of securities and the unrealized appreciation (depreciation) in the value of investments owned by the Funds, as computed on a federal income tax basis, were as follows:
| | | | | | | | | | | | | | | | |
| | | Federal Income
Tax Cost | | | Tax Basis
Unrealized
Appreciation | | | Tax Basis
Unrealized
(Depreciation) | | | Net Unrealized
Appreciation
(Depreciation) | |
Blue Chip Growth Fund | | $ | 263,330,235 | | | $ | 82,347,287 | | | $ | (717,880 | ) | | $ | 81,629,407 | |
Emerging Growth Fund | | | 11,712,286 | | | | 2,874,643 | | | | (294,085 | ) | | | 2,580,558 | |
Equity Index Fund | | | 270,485,387 | | | | 74,149,769 | | | | (38,656,822 | ) | | | 35,492,947 | |
Large Cap Value Fund | | | 195,297,603 | | | | 46,700,873 | | | | (4,514,914 | ) | | | 42,185,959 | |
NASDAQ-100 Fund | | | 8,765,572 | | | | 4,024,691 | | | | (493,286 | ) | | | 3,531,405 | |
Small Cap Growth Equity Fund | | | 220,578,784 | | | | 56,378,456 | | | | (8,375,208 | ) | | | 48,003,248 | |
Net capital loss carryforwards may be applied against any net realized taxable gains in succeeding years, subject to the carryforward period limitations, where applicable. On December 22, 2010, the Regulated Investment Company Modernization Act of 2010 (the “Modernization Act”) was signed by The President. The Modernization Act changed the capital loss carryforward rules as they relate to regulated investment companies. Capital losses generated in tax years beginning after the date of enactment may now be carried forward indefinitely, and retain the character of the original loss. Under pre-enactment law, capital losses could be carried forward for up to eight tax years as short-term capital losses. The provisions affecting the utilization of capital loss carryforwards under the Modernization Act also require the utilization of post-enactment losses prior to the utilization of pre-enactment losses. Certain positions of capital loss carryovers of the Blue Chip Growth Fund were assumed as a result of acquisitions. These losses are subject to certain limitations prescribed by Internal Revenue Code Sections 382/383.
At December 31, 2010, the following Fund(s) had available, for federal income tax purposes, unused capital losses:
| | | | | | | | | | | | | | | | | | | | | | | | |
| | | Expiring
2011 | | | Expiring
2012 | | | Expiring
2015 | | | Expiring
2016 | | | Expiring
2017 | | | Expiring
2018 | |
Blue Chip Growth Fund | | $ | - | | | $ | - | | | $ | 1,968,870 | | | $ | 799,760 | | | $ | 22,428,962 | | | $ | | |
Emerging Growth Fund | | | - | | | | - | | | | - | | | | 3,006,900 | | | | 2,730,804 | | | | - | |
Equity Index Fund | | | - | | | | - | | | | - | | | | 1,597,593 | | | | 2,895,529 | | | | - | |
Large Cap Value Fund | | | - | | | | - | | | | - | | | | 7,547,813 | | | | 24,296,867 | | | | 722,962 | |
NASDAQ-100 Fund | | | 2,362,711 | | | | 1,300,985 | | | | - | | | | - | | | | 335,825 | | | | - | |
Net capital loss carryforwards for the Funds shown in the above table are from pre-enactment years and are, therefore, subject to the eight-year carryforward period and possible expiration.
The NASDAQ-100 Fund elected to defer to the fiscal year beginning January 1, 2011, post-October capital losses in the amount of $37,342.
The Small Cap Growth Equity Fund elected to defer to the fiscal year beginning January 1, 2011, post-October currency losses in the amount of $14,548.
Accounting principles generally accepted in the United States of America require that only distributions in excess of tax basis earnings and profits be reported in the financial statements as a return of capital.
The tax character of distributions (including capital gain dividends, if any, designated pursuant to Section 852 of the Code) paid during the year ended December 31, 2010, was as follows:
| | | | | | | | | | | | |
| | | Ordinary
Income | | | Long Term
Capital Gain | | | Return of
Capital | |
Blue Chip Growth Fund | | $ | 233,055 | | | $ | - | | | $ | - | |
Equity Index Fund | | | 5,174,766 | | | | - | | | | - | |
Large Cap Value Fund | | | 1,777,178 | | | | - | | | | - | |
NASDAQ-100 Fund | | | 12,718 | | | | - | | | | - | |
80
Notes to Financial Statements (Continued)
The tax character of distributions (including capital gain dividends, if any, designated pursuant to Section 852 of the Code) paid during the year ended December 31, 2009, was as follows:
| | | | | | | | | | | | |
| | | Ordinary
Income | | | Long Term
Capital Gain | | | Return of
Capital | |
Blue Chip Growth Fund | | $ | 248,545 | | | $ | - | | | $ | - | |
Equity Index Fund | | | 6,708,647 | | | | - | | | | - | |
Large Cap Value Fund | | | 2,220,078 | | | | - | | | | - | |
NASDAQ-100 Fund | | | 184 | | | | - | | | | - | |
Capital accounts within financial statements are periodically adjusted for permanent differences between book and tax accounting. These adjustments have no impact on net assets or the results of operations. Temporary book and tax accounting differences will reverse in subsequent periods. At December 31, 2010, temporary book and tax accounting differences were primarily attributable to investments in forward contracts, futures contracts, Real Estate Investment Trusts, passive foreign investment companies, the deferral of wash sale losses, and deferred Trustee compensation.
At December 31, 2010, the components of distributable earnings on a tax basis were as follows:
| | | | | | | | | | | | | | | | |
| | | Undistributed
Ordinary
Income | | | Undistributed
Long Term
Capital Gain
(Capital Loss
Carryover) | | | Other
Temporary
Differences | | | Unrealized
Appreciation
(Depreciation) | |
Blue Chip Growth Fund | | $ | 151,004 | | | $ | (25,197,592 | ) | | $ | (31,590 | ) | | $ | 81,630,800 | |
Emerging Growth Fund | | | - | | | | (5,737,704 | ) | | | (6,287 | ) | | | 2,580,558 | |
Equity Index Fund | | | 5,316,291 | | | | (4,493,122 | ) | | | (145,949 | ) | | | 35,492,963 | |
Large Cap Value Fund | | | 1,960,129 | | | | (32,567,642 | ) | | | (62,152 | ) | | | 42,190,964 | |
NASDAQ-100 Fund | | | 35,658 | | | | (3,999,521 | ) | | | (42,252 | ) | | | 3,531,406 | |
Small Cap Growth Equity Fund | | | 57,760 | | | | 10,111,862 | | | | (69,105 | ) | | | 48,003,316 | |
During the year ended December 31, 2010, the following amounts were reclassified due to permanent differences between book and tax accounting:
| | | | | | | | | | | | |
| | | Paid-in
Capital | | | Accumulated
Net Realized
Gain (Loss) on
Investments | | | Undistributed
Net Investment
Income (Loss) | |
Blue Chip Growth Fund | | $ | (1,086,094 | ) | | $ | 1,086,495 | | | $ | (401 | ) |
Emerging Growth Fund | | | (2,193,984 | ) | | | 2,086,220 | | | | 107,764 | |
Equity Index Fund | | | 158 | | | | (8,817 | ) | | | 8,659 | |
Large Cap Value Fund | | | - | | | | 1,538 | | | | (1,538 | ) |
NASDAQ-100 Fund | | | (4,438,016 | ) | | | 4,438,016 | | | | - | |
Small Cap Growth Equity Fund | | | (43,819 | ) | | | (1,526,095 | ) | | | 1,569,914 | |
The Funds did not have any unrecognized tax benefits at December 31, 2010, nor were there any increases or decreases in unrecognized tax benefits for the year then ended. The Funds recognize interest and penalties, if any, related to unrecognized tax benefits as an income tax expense in the Statements of Operations. During the year ended December 31, 2010, the Funds did not incur any such interest or penalties. The Funds are subject to examination by U.S. federal and state tax authorities for returns filed for the prior three fiscal years. Foreign taxes are provided for based on the Funds’ understanding of the tax rules and rates that exist in the foreign markets in which they invest.
Under the Funds’ organizational documents, current and former Trustees and Officers are provided with specified rights to indemnification against liabilities arising in connection with the performance of their duties to the Funds, and shareholders are
81
Notes to Financial Statements (Continued)
indemnified against personal liability for obligations of the Funds. In the normal course of business, the Funds may also enter into contracts that provide general indemnifications. The Funds’ maximum exposure under these arrangements is unknown as this would be dependent on future claims that may be made against the Funds. The risk of material loss from such claims is considered remote.
| 8. | | New Accounting Pronouncements |
In January 2010, the Financial Accounting Standards Board issued Accounting Standards Updated No. 2010-06, “Improving Disclosures About Fair Value Measurements” (“ASU”). The ASU requires enhanced disclosures about purchases, sales, issuances, and settlements on a gross basis relating to Level 3 measurements. The disclosure will be effective for fiscal years beginning after December 15, 2010, and for interim periods within those fiscal years. Management is currently evaluating the impact the adoption of the ASU will have on the Funds’ financial statement disclosures.
On December 7, 2010, the Trust was named as a defendant and putative member of the proposed defendant class of shareholders named in an adversary proceeding brought by The Official Committee of Unsecured Creditors of Tribune Company (the “Official Committee”) in the U.S. Bankruptcy Court for the District of Delaware, in connection with Tribune Company’s Chapter 11 bankruptcy proceeding (In re Tribune Company). The proceeding relates to a leveraged buyout transaction by which Tribune Company converted to a privately-held company in 2007, and the putative defendant class is comprised of beneficial owners of shares of Tribune Company who received proceeds of the leveraged buy-out. The Official Committee seeks to recover payments of those proceeds.
The potential amounts sought to be recovered from the Equity Index Fund, plus interest and the Official Committee’s court costs, is approximately $207,706. The Fund cannot predict the outcome of this proceeding. If the proceeding were to be decided in a manner adverse to the Fund, or if the Fund was to enter into a settlement agreement with the Official Committee, the payment of such judgment or settlement could have a material adverse effect on the Fund’s net asset values.
Management has evaluated the events and transactions subsequent to December 31, 2010 through the date when the financial statements were issued, and determined that there are no material events or transactions that would require adjustments to or disclosures in the Funds’ financial statements.
82
Report of Independent Registered Public Accounting Firm
To the Board of Trustees of MML Series Investment Fund and Shareholders of MML Blue Chip Growth Fund, MML Emerging Growth Fund, MML Equity Index Fund, MML Large Cap Value Fund, MML NASDAQ-100 Fund, and MML Small Cap Growth Equity Fund:
We have audited the accompanying statements of assets and liabilities, including the portfolios of investments, of MML Blue Chip Growth Fund, MML Emerging Growth Fund, MML Equity Index Fund, MML Large Cap Value Fund, MML NASDAQ-100 Fund, and MML Small Cap Growth Equity Fund (collectively the “Funds”), six of the funds comprising the MML Series Investment Fund (the “Trust”) as of December 31, 2010, and the related statements of operations for the year then ended, the statements of changes in net assets for each of the two years in the period then ended, and the financial highlights for each of the periods presented. These financial statements and financial highlights are the responsibility of the Funds’ management. Our responsibility is to express an opinion on these financial statements and financial highlights based on our audits.
We conducted our audits in accordance with the standards of the Public Company Accounting Oversight Board (United States). Those standards require that we plan and perform the audits to obtain reasonable assurance about whether the financial statements and financial highlights are free of material misstatement. The Funds are not required to have, nor were we engaged to perform, an audit of their internal control over financial reporting. Our audits included consideration of internal control over financial reporting as a basis for designing audit procedures that are appropriate in the circumstances, but not for the purpose of expressing an opinion on the effectiveness of the Funds’ internal control over financial reporting. Accordingly, we express no such opinion. An audit also includes examining, on a test basis, evidence supporting the amounts and disclosures in the financial statements, assessing the accounting principles used and significant estimates made by management, as well as evaluating the overall financial statement presentation. Our procedures included confirmation of securities owned as of December 31, 2010, by correspondence with the custodian and brokers; where replies were not received from brokers, we performed other auditing procedures. We believe that our audits provide a reasonable basis for our opinion.
In our opinion, the financial statements and financial highlights referred to above present fairly, in all material respects, the financial position of each of the Funds as of December 31, 2010, the results of their operations for the year then ended, the changes in their net assets for each of the two years in the period then ended, and the financial highlights for each of the periods presented, in conformity with accounting principles generally accepted in the United States of America.
Deloitte & Touche LLP
Boston, Massachusetts
February 18, 2011
83
Trustees and Officers (Unaudited)
The following table lists the Trust’s Trustees and Officers as of December 31, 2010; their address and age; their position with the Trust; the length of time holding that position with the Trust; their principal occupation(s) during the past five years; the number of portfolios in the fund complex they oversee; and other directorships they hold in companies subject to registration or reporting requirements of the Securities Exchange Act of 1934 (generally called “public companies”) or in registered investment companies. The Trust’s Statement of Additional Information includes additional information about the Trust’s Trustees and is available, without charge, upon request by calling 1-888-309-3539 or by writing MML Series Investment Fund, c/o Massachusetts Mutual Life Insurance Company, 1295 State Street, Springfield, Massachusetts 01111-0001, Attention: Retirement Services Marketing.
Disinterested Trustees
| | | | | | | | | | |
Name, Address*, and Age | | Position(s)
Held with
Trust | | Term of
Office** and
Length of
Time Served | | Principal Occupation(s)
During Past 5 Years | | Number of
Portfolios in
Fund Complex
Overseen by Trustee | | Other Directorships Held by Trustee |
Richard H. Ayers
Age: 68 | | Chairman Trustee | | Since 2010 Since 1999 | | Retired. | | 63 | | Director (since 2008), Celera Corporation; Director (1996-2008), Applera Corporation; Director (2002-2006), Instron Corporation; Chairman (since 2010), Trustee (since 1996), MassMutual Select Funds (open-end investment company). |
| | | | | |
Allan W. Blair
Age: 62 | | Trustee | | Since 2003 | | President and Chief Executive Officer (since 1996), Economic Development Council of Western Massachusetts; President and Chief Executive Officer (1993-2006), Westmass Area Development Corporation; President and Chief Executive Officer (since 1984), Westover Metropolitan Development Corporation. | | 63 | | Director (2001-2007), Future Works, Inc.; Trustee (since 2003), MassMutual Select Funds (open-end investment company). |
| | | | | |
Mary E. Boland
Age: 71 | | Trustee | | Since 1973 | | Attorney-at-Law (since 2004). | | 63 | | Director (1999-2007), BankNorth Massachusetts; Trustee (since 1994), MassMutual Select Funds (open-end investment company). |
| | | | | |
R. Alan Hunter, Jr.
Age: 64 | | Trustee | | Since
2003 | | Retired. | | 63 | | Director (since 2007), Actuant Corporation; Trustee (since 2003), MassMutual Select Funds (open-end investment company). |
| | | | | |
F. William Marshall, Jr. Age: 68 | | Trustee | | Since
1996 | | Retired. Consultant (1999-2009). | | 99*** | | Trustee (since 2000), Denver Board – Oppenheimer Funds; Trustee (since 1996), MassMutual Select Funds (open-end investment company). |
| | | | | |
Susan B. Sweeney Age: 58 | | Trustee | | Since 2009 | | Senior Vice President and Chief Investment Officer (since 2010), Selective Insurance Group (property and casualty company); Senior Managing Director (2008-2010), Ironwood Capital (private equity firm); Chief Investment Officer, Pension Fund (2002-2007), Office of the Treasurer of the State of Connecticut . | | 63 | | Trustee (since 2009), MassMutual Select Funds (open-end investment company). |
84
Trustees and Officers (Unaudited) (Continued)
Interested Trustees
| | | | | | | | | | |
Name, Address*, and Age | | Position(s)
Held with
Trust | | Term of
Office** and
Length of
Time Served | | Principal Occupation(s)
During Past 5 Years | | Number of
Portfolios in
Fund Complex
Overseen by Trustee | | Other Directorships Held by Trustee |
Robert E. Joyal^
Age: 65 | | Trustee | | Since
2003 | | Retired. | | 65^^ | | Director (since 2007), Scottish Re Group Ltd.; Director (since 2006), Jefferies Group, Inc. (investment bank); Director (1996-2005), Antares Capital Corporation (bank loan syndication); Director (since 2003), Alabama Aircraft Industries, Inc.; Trustee (since 2003), President (1999-2003), MassMutual Corporate Investors (closed-end investment company); Trustee (since 2003), President (1999-2003), MassMutual Participation Investors (closed-end investment company); Director (2005-2006), York Enhanced Strategies Fund (closed-end investment company); Trustee (since 2003), Vice Chairman (2005-2007), MassMutual Select Funds (open-end investment company). |
| | | | | |
Elaine A. Sarsynski^^^ Age: 55 | | Trustee | | Since
2008 | | Executive Vice President (since 2006), Senior Vice President and Chief Administrative Officer (2005-2006), MassMutual; Managing Director (2005), Babson Capital Management LLC; Chief Executive Officer (2001-2005), Town of Suffield, Connecticut. | | 63 | | Trustee (since 2008), MassMutual Select Funds (open-end investment company). |
85
Trustees and Officers (Unaudited) (Continued)
Principal Officers who are Not Trustees
| | | | | | | | |
Name, Address*, and Age | | Position(s) Held
with Trust | | Term of
Office# and
Length of
Time Served | | Principal Occupation(s) During Past 5 Years | | Number of
Portfolios in
Fund Complex
Overseen by Officer |
Richard J. Byrne
Age: 48 | | President | | Since
2007 | | Vice President (since 2007), Assistant Vice President (2003-2007), MassMutual; President (since 2007), MML Series Investment Fund II (open-end investment company). | | 40 |
| | | | |
Michael C. Eldredge Age: 46 | | Vice President | | Since
2009 | | Vice President (since 2008), MassMutual; Vice President (2005-2008), Manager (1998-2005), ING; Vice President (since 2009), MassMutual Select Funds (open-end investment company); Vice President (since 2009), MassMutual Premier Funds (open-end investment company); Vice President (since 2009), MML Series Investment Fund II (open-end investment company). | | 95 |
| | | | |
Andrew M. Goldberg Age: 44 | | Vice President, Secretary and Chief Legal Officer Assistant Secretary | | Since
2008
(2001-
2008) | | Assistant Vice President and Counsel (since 2004), Counsel (2001-2004), MassMutual; Vice President, Secretary and Chief Legal Officer (since 2008), Assistant Secretary (2001-2008), MassMutual Select Funds (open-end investment company); Vice President, Clerk and Chief Legal Officer (since 2008), Assistant Clerk (2004-2008), MassMutual Premier Funds (open-end investment company); Vice President, Clerk and Chief Legal Officer (since 2008), Assistant Clerk (2005-2008), MML Series Investment Fund II (open-end investment company). | | 95 |
| | | | |
Nicholas H. Palmerino
Age: 45 | | Chief Financial Officer and Treasurer | | Since
2006 | | Assistant Vice President (since 2006), MassMutual; Vice President (2006), Consultant (2005-2006), JP Morgan Chase Worldwide Securities Services; Chief Financial Officer and Treasurer (since 2006), MassMutual Select Funds (open-end investment company); Chief Financial Officer and Treasurer (since 2006), MassMutual Premier Funds (open-end investment company); Chief Financial Officer and Treasurer (since 2006), MML Series Investment Fund II (open-end investment company). | | 95 |
| | | | |
Philip S. Wellman
Age: 46 | | Vice President and Chief Compliance Officer | | Since
2007 | | Vice President, Associate General Counsel and Chief Compliance Officer (Mutual Funds and Investment Advisory) (since 2008), Vice President, Associate General Counsel and Chief Compliance Officer (Mutual Funds) (2007-2008), Assistant Vice President and Associate General Counsel (2006-2007), MassMutual; Director, Office of General Counsel (2005-2006), Merrill Lynch, Pierce, Fenner & Smith Incorporated; Senior Vice President and Assistant General Counsel (2000-2006), Advest, Inc.; Vice President and Chief Compliance Officer (since 2007), MassMutual Select Funds (open-end investment company); Vice President and Chief Compliance Officer (since 2007), MassMutual Premier Funds (open-end investment company); Vice President and Chief Compliance Officer (since 2007), MML Series Investment Fund II (open-end investment company). | | 95 |
| | | | |
Eric H. Wietsma
Age: 44 | | Vice President | | Since
2006 | | Senior Vice President (since 2010), Corporate Vice President (2007-2010), Vice President (2005-2007), MassMutual; Vice President (1999-2005), Hartford Life Insurance Company; President (since 2008), Vice President (2006-2008), MassMutual Select Funds (open-end investment company); President (since 2008), Vice President (2006-2008), MassMutual Premier Funds (open-end investment company); Vice President (since 2006), MML Series Investment Fund II (open-end investment company). | | 95 |
86
Trustees and Officers (Unaudited) (Continued)
| * | The address of each Trustee and Principal Officer is the same as that for the Trust; 1295 State Street, Springfield, Massachusetts 01111. |
| ** | Each Trustee of the Trust serves until the next meeting of shareholders called for the purpose of electing Trustees and until the election and qualification of his or her successor or until he or she dies, resigns or is removed. Notwithstanding the foregoing, unless the Trustees determine that it is desirable and in the best interest of the Trust that an exception to the retirement policy of the Trust be made, a Trustee shall retire and cease to serve as a Trustee upon the conclusion of the calendar year in which such Trustee attains the age of seventy-two years. |
| | The Chairperson is elected to hold such office for a term of three years or until his or her successor is elected and qualified to carry out the duties and responsibilities of his or her office, or until he or she retires, dies, resigns, is removed or becomes disqualified. |
| *** | Denver Board – Oppenheimer Funds is deemed to be part of the Fund Complex because it is managed by OppenheimerFunds, Inc., an indirect subsidiary of MassMutual. |
| ^ | Mr. Joyal is an “Interested Person,” as that term is defined in the 1940 Act, through his position as a director of Jefferies Group, Inc., a broker-dealer that may execute portfolio transactions and/or engage in principal transactions with the Funds, other investment companies advised by MassMutual or holding themselves out to investors as related companies for purposes of investment or investor services, or any other advisory accounts over which MassMutual has brokerage placement discretion. |
| ^^ | MassMutual Participation Investors and MassMutual Corporate Investors are deemed to be a part of the Fund Complex because they are managed by Babson Capital Management LLC, an indirect subsidiary of MassMutual. |
| ^^^ | Ms. Sarsynski is an Interested Person through her employment with MassMutual. |
| # | The President, Treasurer and Secretary are elected to hold such office until their successor is elected and qualified to carry out the duties and responsibilities of their office, or until he or she dies, resigns, is removed or becomes disqualified. Each other officer shall hold office at the pleasure of the Trustees. |
87
Federal Tax Information (Unaudited)
For corporate shareholders, a portion of the ordinary dividends paid during the Fund(s)’ year ended December 31, 2010, qualified for the dividends received deduction, as follows:
| | | | |
| |
| | | Dividends Received
Deductions | |
Blue Chip Growth Fund | | | 100.00% | |
Equity Index Fund | | | 100.00% | |
Large Cap Value Fund | | | 100.00% | |
NASDAQ-100 Fund | | | 100.00% | |
88
Other Information (Unaudited)
Proxy Voting
A description of the policies and procedures that each Fund’s investment adviser and subadvisers use to vote proxies relating to the Fund’s portfolio securities is available, without charge, upon request, by calling 1-888-309-3539, and on the Securities and Exchange Commission’s (“SEC”) website at http://www.sec.gov.
Information regarding how the Funds voted proxies relating to portfolio securities during the most recent 12-month period ended June 30 is available, without charge, upon request, on the MassMutual website at http://www.massmutual.com/funds and on the SEC’s website at http://www.sec.gov.
Quarterly Reporting
The Funds file their complete schedule of portfolio holdings with the SEC for the first and third quarters of each fiscal year on Form N-Q. The Funds’ Forms N-Q are available on the SEC website at http://www.sec.gov. The Funds’ Forms N-Q may be reviewed and copied at the SEC’s Public Reference Room in Washington D.C. Information on the operation of the SEC’s Public Reference Room may be obtained by calling 1-800-SEC-0330.
89
Other Information (Unaudited) (Continued)
Fund Expenses December 31, 2010
Expense Examples:
The following information is in regards to expenses for the six months ended December 31, 2010:
As a shareholder of the Funds, you incur ongoing costs, including management fees, distribution and/or service (12b-1) fees, and other Fund expenses. These examples are intended to help you understand your ongoing costs (in dollars) of investing in the Funds and to compare these costs with the ongoing costs of investing in other mutual funds. These examples are based on an investment of $1,000 invested for the six months ended December 31, 2010.
Actual Expenses:
The first four columns of the table below provide information about actual account values and actual expenses. You may use this information, together with the amount you invested, to estimate the expenses that you paid over the period. Simply divide your account value by $1,000 (for example, an $8,600 account value divided by $1,000 = 8.6), then multiply the result by the number under the heading entitled “Operating Expenses Incurred” to estimate the expenses you paid on your account during this period.
Hypothetical Example for Comparison Purposes:
The last two columns of the table below provide information about hypothetical account values and hypothetical expenses based on the Fund’s actual expense ratio and an assumed rate of return of 5% per year before expenses, which is not the Fund’s actual return. The hypothetical account values and expenses may not be used to estimate the actual ending account balance or expenses you paid for the period. You may use this information to compare the ongoing costs of investing in the Fund and other funds. To do so, compare this 5% hypothetical example with the 5% hypothetical examples that appear in the shareholder reports of the other funds.
Please note that the expenses shown in the table are meant to highlight your ongoing costs only and do not reflect any transactional costs. Therefore, the last two columns of the table are useful in comparing ongoing costs only, and will not help you determine the relative total costs of owning different funds. In addition, if these transactional costs were included, your costs would have been higher.
| | | | | | | | | | | | | | | | | | | | | | | | |
| | | Beginning
Value | | | Annualized
Expense
Ratio | | | Ending
Value (Based
on Actual
Returns and
Expenses) | | | Operating
Expenses
Incurred* | | | Ending
Value (Based
on
Hypothetical
Returns and
Expenses) | | | Operating
Expenses
Incurred* | |
| Blue Chip Growth Fund | | | | | | | | | | | | | | | | | | | | | | | | |
Initial Class | | $ | 1,000 | | | | 0.79 | % | | $ | 1,270.20 | | | $ | 4.52 | | | $ | 1,021.20 | | | $ | 4.02 | |
Service Class | | | 1,000 | | | | 1.04 | % | | | 1,269.20 | | | | 5.95 | | | | 1,020.00 | | | | 5.30 | |
| Emerging Growth Fund | | | | | | | | | | | | | | | | | | | | | | | | |
Initial Class | | | 1,000 | | | | 1.25 | % | | | 1,309.50 | | | | 7.28 | | | | 1,018.90 | | | | 6.36 | |
Service Class | | | 1,000 | | | | 1.50 | % | | | 1,306.50 | | | | 8.72 | | | | 1,017.60 | | | | 7.63 | |
| Equity Index Fund | | | | | | | | | | | | | | | | | | | | | | | | |
Class I | | | 1,000 | | | | 0.45 | % | | | 1,229.60 | | | | 2.53 | | | | 1,022.90 | | | | 2.29 | |
Class II | | | 1,000 | | | | 0.29 | % | | | 1,231.30 | | | | 1.63 | | | | 1,023.70 | | | | 1.48 | |
Class III | | | 1,000 | | | | 0.15 | % | | | 1,232.20 | | | | 0.84 | | | | 1,024.40 | | | | 0.77 | |
Service Class I | | | 1,000 | | | | 0.70 | % | | | 1,228.10 | | | | 3.93 | | | | 1,021.70 | | | | 3.57 | |
| Large Cap Value Fund | | | | | | | | | | | | | | | | | | | | | | | | |
Initial Class | | | 1,000 | | | | 0.83 | % | | | 1,209.00 | | | | 4.62 | | | | 1,021.00 | | | | 4.23 | |
Service Class | | | 1,000 | | | | 1.08 | % | | | 1,208.10 | | | | 6.01 | | | | 1,019.80 | | | | 5.50 | |
90
Other Information (Unaudited) (Continued)
| | | | | | | | | | | | | | | | | | | | | | | | |
| | | Beginning
Value | | | Annualized
Expense
Ratio | | | Ending
Value (Based
on Actual
Returns and
Expenses) | | | Operating
Expenses
Incurred* | | | Ending
Value (Based
on
Hypothetical
Returns and
Expenses) | | | Operating
Expenses
Incurred* | |
| NASDAQ-100 Fund | | | | | | | | | | | | | | | | | | | | | | | | |
Initial Class | | $ | 1,000 | | | | 0.56 | % | | $ | 1,276.60 | | | $ | 3.21 | | | $ | 1,022.40 | | | $ | 2.85 | |
Service Class | | | 1,000 | | | | 0.81 | % | | | 1,276.30 | | | | 4.65 | | | | 1,021.10 | | | | 4.13 | |
| Small Cap Growth Equity Fund | | | | | | | | | | | | | | | | | | | | | | | | |
Initial Class | | | 1,000 | | | | 1.13 | % | | | 1,265.20 | | | | 6.45 | | | | 1,019.50 | | | | 5.75 | |
Service Class | | | 1,000 | | | | 1.38 | % | | | 1,263.60 | | | | 7.87 | | | | 1,018.20 | | | | 7.02 | |
| * | Expenses are calculated using the annualized expense ratio for the six months ended December 31, 2010, multiplied by the average account value over the period, multiplied by the number of days in the period, divided by the number of days in the year, unless stated otherwise. |
91

Table of Contents
This material must be preceded or accompanied by a current prospectus (or summary prospectus, if available) for the MML Series Investment Fund. Investors should consider a Fund’s investment objective, risks and charges and expenses carefully before investing. This and other information about the investment company is available in the prospectus (or summary prospectus, if available). Read it carefully before investing.
MML Series Investment Fund – President’s Letter to Shareholders
To Our Shareholders

Richard J. Byrne
“MassMutual’s view is that a retirement investment plan tailored to your time horizon and your tolerance for risk can help you navigate short-term gyrations in the markets. By monitoring your plan regularly and adjusting your retirement planning strategy when appropriate, you can help yourself as you pursue your long-term financial objectives.”
December 31, 2010
Cautious optimism emerges as recovery continues
I am pleased to present you with the MML Series Investment Fund Annual Report, covering the year ended December 31, 2010. Equity markets worldwide advanced during this period (some in the double digits), yet volatility continued to be a factor. Investors in the U.S. and abroad repeatedly demonstrated how connected we all are to the global economy in this modern era, driving U.S. and foreign markets up and down in reaction to the latest news events and economic data from around the world. Despite generally improving market conditions, economic challenges remained for most of the countries where markets advanced. But investors in the U.S. found reason for optimism, as several economic indicators in December pointed to possible signs of sustained recovery.
Retirement investing is a long-term proposition
If you work with a financial professional, you may wish to consider contacting him or her to help you evaluate and fine-tune your overall investment strategy. This can be an effective way to help ensure that you are on the right path toward your long-term investment objectives.
The market environment we witnessed in 2010 should remind us that investing for retirement is a long-term proposition – despite whatever changes or events may occur in the short term. The markets are cyclical, and investors who realized this and stayed the course over the past few years were rewarded in 2010. The major equity markets in the U.S. advanced in 2010, with a similar scenario playing out in many markets abroad.
One reason why financial professionals typically believe it is important to stay invested through all market conditions can be seen in the five-year performance history of the S&P 500® Index1 (the “S&P 500”), a widely used measure of large-cap stock performance in the U.S. On January 3, 2006, the S&P 500 closed at 1268.80. As you may recall, stock prices dropped significantly, beginning in late 2007 and through early 2009. On March 9, 2009, the S&P 500 closed at 676.53, its lowest level over the five years. Yet, by market close on December 31, 2010, the S&P 500 was back up to 1257.64. Consequently, investors in large-cap U.S. stocks who remained invested throughout this period likely benefited from the market recovery that began in March 2009. Conversely, those who “cashed out” of these stocks during the market downturn locked in their losses and did not participate in the recovery rally.
Keep these basic ideas in mind
| • | | Retirement investing is different. Investing for retirement is not like saving or investing for short-term needs, such as a vacation or a new car. The longer time that many retirement investors have to invest may give them an advantage over individuals with a shorter time frame to work with. |
| • | | Invest regularly and boost your contribution rate. Contributing to your retirement account on a regular basis can help you to buy more shares or units of an investment when its price is lower and fewer shares or units when its price is higher.2 Boosting your contribution rate periodically (even by a small amount), over time, may help you increase the amount of money in your account as retirement approaches. |
| 1 | Indexes are unmanaged, do not incur fees or expenses and cannot be purchased directly for investment. |
| 2 | Systematic investing and asset allocation do not ensure a profit or protect against loss in a declining market. Systematic investing involves continuous investment in securities regardless of fluctuating price levels. Investors should consider their ability to continue investing through periods of low price levels. |
1
MML Series Investment Fund – President’s Letter to Shareholders (Continued)
| • | | Choose investments that work for you and monitor your account regularly. No one knows your financial goals and objectives better than you. So be sure to select the stock, bond and short-term/money market investments that you feel will help you reach your goals. One of the greatest advantages you have when you diversify your investment choices is that these three distinct investment types tend to behave differently under various economic conditions. Consequently, many financial professionals hold the view that individuals can help reduce their risk of overexposure to one or two poorly performing investment types by diversifying across multiple types. |
Keep your eye on the future and stay current with your plan
We believe doing business with MassMutual is the sign of a good decision – as is focusing on the long term when it comes to planning for retirement. As you can see from the S&P 500 example noted above, short-term changes in the markets don’t necessarily have to result in a long-term impact on your retirement account. MassMutual’s view is that a retirement investment plan tailored to your time horizon and your tolerance for risk can help you navigate short-term gyrations in the markets. By monitoring your plan regularly and adjusting your retirement planning strategy when appropriate, you can help yourself as you pursue your long-term financial objectives.
As always, thank you for your confidence and trust in MassMutual.
Sincerely,

Richard J. Byrne
President
The information provided is the opinion of MassMutual Retirement Services Investment Services as of 1/1/11 and is subject to change without notice. It is not to be construed as tax, legal or investment advice. Of course, past performance does not guarantee future results.
2
MML Series Investment Fund – Economic and Market Review
December 31, 2010
A challenging year, with emerging signs of recovery
The turnaround in the financial markets that began in March 2009 continued during the year ended December 31, 2010, although there were numerous – and some significant – bumps along the way. The stock market in the United States was largely positive throughout the year, despite notable periods of underperformance. Foreign equity markets also overcame difficulties and did well overall, despite generally lagging their U.S. counterparts. Many of the debt-related problems that had plagued some of the more highly leveraged countries in the euro zone (particularly Greece and Ireland) underwent short-term resolution through government intervention, but European debt issues continued to hinder the investing environment as the period ended.
The U.S. dollar remained strong throughout much of the year, although late in the period, investor fears over the Federal Reserve’s (the “Fed”) announced purchase of U.S. Treasury bonds caused the dollar to weaken – against the backdrop of an ongoing run-up in commodity (specifically, gold and oil) prices, which commonly occurs when the dollar declines in value. Crude oil finished the year at roughly $91 per barrel (versus $79 on December 31, 2009) and gold continued to trade higher, closing the year at approximately $1,422 per ounce (versus $1,096 on December 31, 2009).
Key pieces of legislation passed in the year included health care reform (March), which did not have much of an immediate impact on the markets, and the extension of the Bush-era income-tax cuts (December), which linked a two-year extension of the Bush tax cuts (initially signed into law in 2001, but slated to expire without Congressional action on December 31, 2010) to a one-year extension of unemployment benefits and other aid to middle-income earners. Also in politics, the mid-term elections delivered a Republican majority in the U.S. House of Representatives, but the U.S. Senate continued to hold a Democratic majority.
The Fed kept interest rates low, holding the federal funds rate at 0.0% to 0.25%, in its continued focus on stimulating the economy. The federal funds rate is the interest rate that banks and other financial institutions charge each other for borrowing funds overnight.
Certain economic indicators were troubling during the period and seemed mainly to show more bad news than good until the end of the year, when some bright spots appeared on the horizon. Indeed, December economic reports indicated that consumer confidence rose, initial jobless claims fell, and Gross Domestic Product (“GDP”) for the third quarter of the year was revised to reflect a gain of 2.6%, after an initial estimated advance of 2.0%. GDP reflects the total value of goods and services produced in the United States.
Market performance
Both bonds and equities advanced for the 12-month period ended December 31, 2010, although stocks generally outperformed their fixed-income counterparts. The Dow Jones Industrial AverageSM (the “Dow”), a well-known measure of blue-chip stock performance, advanced 11.02%. In a similar fashion, the S&P 500® Index of U.S. large-cap stocks returned 15.06%. The small-cap Russell 2000® Index outpaced both of the aforementioned indexes, with a return of 26.85% for the period. The barometer for technology stocks, the NASDAQ Composite® Index, posted a 16.91% return for the period. Performance was also positive in worldwide equity markets. The MSCI® EAFE® Index, a benchmark for foreign stocks in developed markets, advanced 7.75%. The foreign market winner, however, was the MSCI Emerging Markets Index, a benchmark that represents the performance of emerging stock markets throughout the world, which advanced 18.88%.
Fixed-income investments generally trailed their equity counterparts during the 12-month period. The Barclays Capital U.S. Aggregate Bond Index, a broad measure of the U.S. investment-grade bond markets, gained 6.54%. Treasury bills gained just 0.13%. The outstanding performer in the fixed-income arena was the Barclays Capital U.S. Corporate High Yield Index, a measure of the performance of fixed-rate, non-investment-grade debt from corporate sectors, which advanced 15.12%. Conversely, the Barclays Capital U.S. 1-3 Year Government Bond Index, which measures the performance of short-term U.S. government bonds, returned 2.40%.*
| * | Indexes are unmanaged, do not incur fees or expenses and cannot be purchased directly for investment. |
3
MML Series Investment Fund – Economic and Market Review (Continued)
First quarter of 2010: A ‘mixed’ start to the year
Despite struggling in January and into the early part of February, the U.S. stock market turned in a solid performance during the first three months of 2010. In the bond market, yields of U.S. Treasury securities were lower, and prices higher, for most of the first quarter. Bond prices move in the opposite direction of interest rates (or yields); when yields rise, the prices of existing bonds fall – and vice versa.
Concerns over the sovereign debt problems of Greece, Portugal, Italy, Ireland, and Spain hindered U.S. and foreign stock performance early in the quarter, but efforts by the European Union to find a sustainable solution helped the markets rally in February and March. These debt concerns increased the attractiveness of the U.S. dollar, which rose against the euro and other key foreign currencies.
Financial news for the quarter was decidedly mixed. On the positive side, the final estimate for fourth-quarter 2009 GDP came in at a healthy 5.6%, and fourth-quarter 2009 corporate earnings benefited from aggressive cost-cutting and favorable comparisons with the weak fourth quarter of 2008. Unemployment, at 9.7% for February, remained stubbornly high, and the residential real estate market remained hampered by a large supply of homes for sale, weak demand and widespread borrower defaults. On the bright side, U.S. corporate earnings reports were generally strong.
Second quarter of 2010 marred by stock market downturn, mixed economic indicators
U.S. and foreign stock markets pulled back sharply during the second quarter of 2010 – after a vigorous rally that had lasted more than 13 months. This selloff was largely due to deepening fears about the European debt crisis as well as growing concerns about a possible double-dip recession in the United States. The April 20 explosion of the BP-licensed Deepwater Horizon oil-drilling rig and the resulting oil spill contributed to the uncertainty of the economic environment and held the media’s attention until the spill was stopped and the well capped later in the summer. May was especially challenging, with most of the major indexes giving up substantial ground. May 6 was particularly memorable, when the Dow, down more than 300 points already for the day, dropped more than 600 additional points and recovered most of the additional loss in about 20 minutes in what was subsequently termed a “flash crash” by market pundits (due to the market’s quick descent and recovery). The flash crash set a Dow record for the largest-ever intraday decline: almost 1,000 points.
During this period, bonds responded well to signs that the U.S. economy might be facing slower growth than previously expected. Treasury yields dropped sharply and prices posted healthy advances, with the largest gains occurring in longer maturities. The U.S. dollar continued to appreciate, and emerging markets equities suffered shallower declines than most developed markets. Economic data releases pointed to a still-expanding, but fragile, U.S. economy. In June, the third and final estimate of GDP growth for the first quarter was revised downward to 2.7% from 3.0%. Also noteworthy was the unemployment rate, which remained at 9.7%.
Third quarter of 2010: Stocks rebound; recession officially ‘ends’
U.S. stocks delivered solid gains in the third quarter of 2010, although the up-down-up pattern of the major indexes left many investors perplexed. Solid second-quarter earnings and economic reports that were not as bad as expected helped fuel the advance. Bond prices rose, and yields of U.S. Treasury securities continued the precipitous decline that began in April, taking the yield of the bellwether 10-year note from 2.97% at the end of the second quarter down to 2.53% at the end of the third quarter. The yield of the 10-year note is an important factor in determining mortgage rates, so the historically low rates drove significant mortgage refinancing activity.
The U.S. economy had expanded in the second quarter of 2010, but at a slower pace than in the first quarter, so the Commerce Department’s final estimate of second-quarter GDP released in the third quarter was a tepid 1.7% on an annualized basis. The third quarter’s report on unemployment, released at the beginning of September, revealed a jobless rate of 9.6%. Concern about the euro zone’s sovereign debt crisis eased further, as Spain’s issuance of 6 billion euros of debt at the beginning of July met strong demand and offered better-than-expected pricing. The U.S. dollar weakened against most key developed market currencies. Finally, in September, the National Bureau of Economic Research issued a statement identifying June 2009 as the end of the Great Recession (which began in December 2007) – a conclusion that was questioned by many, since so many economic problems remained unresolved.
4
MML Series Investment Fund – Economic and Market Review (Continued)
Fourth quarter of 2010: Signs of recovery continue
The stock market continued its upward march in the final quarter of the year – although November proved challenging for most domestic equities. Equity markets regained momentum in December; all broad domestic stock indexes advanced for the quarter and turned in double-digit returns for the full year. Conversely, bonds struggled during the fourth quarter of 2010. After falling precipitously for much of the year, yields in the Treasury market reversed course and surged higher from early October through mid-December, pressuring bond prices. For example, the yield of the bellwether 10-year Treasury note rose from 2.52% to 3.31% during the quarter. As a result, most bond indexes finished the quarter with losses, with the longer maturities suffering the most. Losses in corporate bonds were cushioned somewhat by growing optimism about the U.S. economy and corporate profits. High-yield bonds, which tend to correlate more with the fortunes of the issuing company or the issuer’s industry, rather than interest rates, managed solid gains for the quarter.
Although the extension of the Bush-era tax cuts passed by Congress in December – a legislative package estimated to be worth $858 billion – undoubtedly helped the stock market to finish the year on a positive note, it may also be that the Fed’s decision to engage in another round of quantitative easing – referred to as “QE2” – was the main driver of the financial markets during the second half of 2010.
Formally announced on November 3, 2010, QE2 included plans for the Fed to purchase $600 billion of longer-term Treasuries, at a pace of roughly $75 billion per month, by the end of the second quarter of 2011. The plan also called for the reinvestment of $250 billion to $300 billion of proceeds from earlier investments. The stated goal of QE2, as characterized in the Fed’s minutes released on November 3, was to “promote a stronger pace of economic recovery and to help insure that inflation, over time, is at levels consistent with [the Fed’s] mandate.”
While 2010 ended on a positive note, the U.S. economy must still prove itself in 2011. Specifically, investors will be watching to see if the economy can generate enough momentum to meaningfully reduce unemployment and begin to heal the battered residential real estate market. For long-term investors, as always, the challenge is staying disciplined amid constantly shifting markets and avoiding the temptation to buy or sell based on short-term developments.
The information provided is the opinion of MassMutual Retirement Services Investment Services as of 1/1/11 and is subject to change without notice. It is not to be construed as tax, legal or investment advice. Of course, past performance does not guarantee future results.
5
MML Allocation Fund Series – Portfolio Manager Report
What are the investment approaches of the Funds that constitute the MML Allocation Series (the “Series”), and who is the Series’ investment adviser?
The MML Allocation Series comprises five Funds – each of which has a “fund of funds” structure. The five Funds in the Series are MML Aggressive Allocation Fund, MML Balanced Allocation Fund, MML Conservative Allocation Fund, MML Growth Allocation Fund, and MML Moderate Allocation Fund.
Each Fund seeks to achieve as high a total rate of return on an annual basis as is considered consistent with prudent investment risk and the preservation of capital. Each Fund invests in a combination of domestic and international mutual funds (“Underlying Funds”) using an asset allocation strategy. Underlying Funds can include series of the MML Series Investment Fund, MML Series Investment Fund II, OppenheimerFunds, which are advised by OppenheimerFunds, Inc. (OFI), and non-affiliated funds.
Through their investment in Underlying Funds, the Funds may be exposed to a wide range of securities and other instruments with differing characteristics, including, but not limited to, equity securities of small-, mid-, or large-capitalization U.S. or non-U.S. issuers, fixed income securities of U.S. or non-U.S. private or governmental issuers, inflation-protected securities, and short-term investments of any kind.
Each Fund’s assets are allocated to its Underlying Funds according to an asset allocation strategy, as follows:
| • | | MML Aggressive Allocation Fund: Approximately 90% in equity funds and 10% in fixed income funds, including money market funds. |
| • | | MML Balanced Allocation Fund: Approximately 50% in equity funds and 50% in fixed income funds, including money market funds. |
| • | | MML Conservative Allocation Fund: Approximately 40% in equity funds and 60% in fixed income funds, including money market funds. |
| • | | MML Growth Allocation Fund: Approximately 75% in equity funds and 25% in fixed income funds, including money market funds. |
| • | | MML Moderate Allocation Fund: Approximately 60% in equity funds and 40% in fixed income funds, including money market funds. |
The Series’ investment adviser is MassMutual.
How did each Fund perform during the 12 months ended December 31, 2010?
The return of each Fund’s Initial Class shares is shown below. Also shown are the returns of each Fund’s Custom Index; the Russell 3000® Index, a widely recognized, unmanaged index that measures the performance of the 3,000 largest U.S. companies based on market capitalization; the Morgan Stanley Capital International All Country World Index (MSCI® ACWI) ex-U.S., an unmanaged index representative of stocks domiciled in global developed and emerging markets, excluding the United States; and the Barclays Capital U.S. Aggregate Bond Index, an unmanaged index of fixed-rate investment-grade securities with at least one year to maturity, combining the Barclays Capital U.S. Treasury Bond Index, the Barclays Capital U.S. Government-Related Bond Index, the Barclays Capital U.S. Corporate Bond Index, and the Barclays Capital U.S. Securitized Bond Index.
| | | | | | | | |
| | | Custom Index | | Russell 3000 Index | | MSCI ACWI ex-U.S. Index | | Barclays Capital U.S. Aggregate Bond Index |
| MML Aggressive Allocation Fund | | | | | | | | |
16.05% | | 14.81% | | 16.93%* | | 11.15% | | 6.54% |
| | | | |
| MML Balanced Allocation Fund | | | | | | | | |
12.73% | | 11.34% | | 16.93%* | | 11.15% | | 6.54% |
| | | | |
| MML Conservative Allocation Fund | | | | | | | | |
11.91% | | 10.42% | | 16.93% | | 11.15% | | 6.54%* |
6
MML Allocation Fund Series – Portfolio Manager Report (Continued)
| | | | | | | | |
| | | Custom Index | | Russell 3000 Index | | MSCI ACWI ex-U.S. Index | | Barclays Capital U.S. Aggregate Bond Index |
| | | | |
| MML Growth Allocation Fund | | | | | | | | |
14.92% | | 13.54% | | 16.93%* | | 11.15% | | 6.54% |
| | | | |
| MML Moderate Allocation Fund | | | | | | | | |
13.48% | | 12.23% | | 16.93%* | | 11.15% | | 6.54% |
* Benchmark return
All of the MML Allocation Series Funds outperformed their respective Custom Index for the full year – and all five Funds (each of which has a stock component) also outpaced the Barclays Capital U.S. Aggregate Bond Index, as well as the MSCI ACWI ex-U.S. Index. Conversely, all of the Series Funds underperformed the Russell 3000 Index.
MML Allocation Fund Series Custom Indexes
| • | | The Custom MML Aggressive Allocation Index comprises the Barclays Capital U.S. Aggregate Bond Index, the Russell 3000 Index, and the MSCI ACWI ex-U.S. Index. The weightings of each index are 10%, 67.5% and 22.5%, respectively. |
| • | | The Custom MML Balanced Allocation Index comprises the Barclays Capital U.S. Aggregate Bond Index, the Russell 3000 Index, and the MSCI ACWI ex-U.S. Index. The weightings of each index are 50%, 37.5% and 12.5%, respectively. |
| • | | The Custom MML Conservative Allocation Index comprises the Barclays Capital U.S. Aggregate Bond Index, the Russell 3000 Index, and the MSCI ACWI ex-U.S. Index. The weightings of each index are 60%, 30% and 10%, respectively. |
| • | | The Custom MML Growth Allocation Index comprises the Barclays Capital U.S. Aggregate Bond Index, the Russell 3000 Index, and the MSCI ACWI ex-U.S. Index. The weightings of each index are 25%, 56.25% and 18.75%, respectively. |
| • | | The Custom MML Moderate Allocation Index comprises the Barclays Capital U.S. Aggregate Bond Index, the Russell 3000 Index, and the MSCI ACWI ex-U.S. Index. The weightings of each index are 40%, 45% and 15%, respectively. |
For a discussion on the economic and market environment during the 12-month period ended December 31, 2010, please see the Economic and Market Review, beginning on page 3.
Investment adviser discussion of factors that contributed to the Funds’ performance
The first part of 2010 was challenging for active equity managers, as they struggled to keep up with a rising market (up over 5% in the quarter, as measured by the S&P 500® Index), yet tended to display more caution after a successful 2009. The main driver of the Funds’ outperformance in the first quarter was asset allocation – i.e., Underlying Fund positioning in specific investment types and styles – rather than active manager outperformance. Equity (stocks) positioning in the portfolio of value over growth, small-/mid-cap over large-cap, and U.S. over foreign equities all were beneficial to the portfolios. On the fixed-income (bonds) side, positioning outside of the Barclays Aggregate U.S. Investment Grade Index in high-yield and international bonds proved to be additive to results. Conversely, overweight U.S. Treasury Inflation-Protected Securities (“TIPS”) exposure was the only major asset allocation positioning detractor in the portfolios for the quarter.
During this time, we reduced the Series positioning in MML Income & Growth Fund in favor of other large-cap value strategies due to the retirement of the Fund’s lead portfolio manager and the resulting transition of the portfolio. The reduction is notable because MML Income & Growth Fund had occupied a large position in the Series.
Later in 2010, we expanded the allocation to fixed-income investments through three new funds: MML High Yield Fund, MML Short-Duration Bond Fund, and MML PIMCO Total Return Fund. One of the goals of adding MML High Yield Fund to the Series portfolios is to become more targeted to opportunities in the below-investment-grade bond universe. Previously, the Series offered high-yield exposure through the multi-sector bond fund, Oppenheimer Global Strategic Income Fund, which groups high-yield exposure with international bonds and U.S. investment-grade bonds.
7
MML Allocation Fund Series – Portfolio Manager Report (Continued)
The addition of MML Short-Duration Bond Fund to the Series portfolios allows for a greater yield for the portfolios relative to holding a money market fund, given today’s extremely low-yield environment, and reduces the overall duration exposure by allocating some of the intermediate investment-grade exposure to MML Short-Duration Bond Fund. (Duration is a measure of a bond fund’s sensitivity to interest rates, with each year of duration indicating greater vulnerability to interest rate movements.) This may help limit the negative impact of an unexpected increase in interest rates on the fixed-income allocations and further diversify the portfolio.
Lastly, diversification in intermediate investment-grade funds allowed us the ability to add to returns with a different approach to the portfolio management of investment-grade bonds, while potentially mitigating the risk of single-manager underperformance in fixed-income investment-grade. MML PIMCO Total Return Fund brings a well-known brand to the Series portfolios.
During this time, we added MML Large Cap Growth Fund – to provide the portfolios with further diversification in large-cap growth stocks – and reduced exposure in other large-cap growth strategies undergoing manager changes.
In large-cap value positioning, we also introduced a new fund to the Series: MML Fundamental Value Fund, which is subadvised by Wellington Management. Given our experience with this Wellington strategy in other businesses at MassMutual, we allocated Series assets to this Fund and removed MML Income & Growth Fund from the Series portfolios following the Fund’s manager change in the third quarter from American Century to BlackRock. MML Income & Growth Fund will remain an option for inclusion back into the Series portfolios as we gain better understanding and experience with the new BlackRock strategy.
Investment adviser outlook
Economic indicators were generally trending positive at the start of 2011. Strength in consumer spending and factory activity indicate improvement from the sluggish early stages of the recovery. Growth in employment has improved on the margin, though inconsistently. With consumer demand improving and post-meltdown fears subsiding, we believe it is likely that firms will increase hiring in a more meaningful manner. While a quick return to pre-crisis employment levels is highly unlikely, any improvement could set in motion the virtuous cycle as newly employed consumers stoke further improvements in growth, which in turn, pushes up hiring.
The U.S. Federal Reserve (the “Fed”), fearful of repeating the mistakes of the Great Depression era, appears committed to stimulative monetary policies. This should support economic growth, corporate revenues, and cash flows and with it, improving fundamentals for equities and corporate bonds. Given current valuations, we believe attractive returns for equities and corporate bonds are possible. On the other hand, given the yields currently available for U.S. Treasury securities investors, attractive long-term returns will be harder to come by. Accommodating Fed policies do present a risk of inflation, which generally pushes bond prices lower, which would be a challenging scenario for both the equity market and future economic growth.
The struggle to resolve the European debt crisis is likely to hang over the global equity and bond markets for some time. Also, China and other emerging-market countries risk missteps as they seek to rein in inflation while maintaining a reasonable level of economic growth. While these are real concerns, they are well known and, in our opinion, are likely to undergo resolution over time.
8
MML Allocation Fund Series – Portfolio Manager Report (Continued)
| | | | |
MML Aggressive Allocation Fund
Asset Allocation
(% of Net Assets) on 12/31/10
(Unaudited) | |
| | |
Equity Funds | | | 87.9 | % |
Fixed Income Funds | | | 12.2 | % |
| | | | | |
Total Long-Term Investments | | | 100.1 | % |
Other Assets and Liabilities | | | (0.1 | )% |
| | | | | |
Net Assets | | | 100.0 | % |
| | | | | |
| | | | |
MML Balanced Allocation Fund
Asset Allocation
(% of Net Assets) on 12/31/10
(Unaudited) | |
| | |
Equity Funds | | | 52.1 | % |
Fixed Income Funds | | | 48.0 | % |
| | | | | |
Total Long-Term Investments | | | 100.1 | % |
Other Assets and Liabilities | | | (0.1 | )% |
| | | | | |
Net Assets | | | 100.0 | % |
| | | | | |
| | | | |
MML Conservative Allocation Fund
Asset Allocation
(% of Net Assets) on 12/31/10
(Unaudited) | |
| | |
Equity Funds | | | 42.5 | % |
Fixed Income Funds | | | 57.6 | % |
| | | | | |
Total Long-Term Investments | | | 100.1 | % |
Other Assets and Liabilities | | | (0.1 | )% |
| | | | | |
Net Assets | | | 100.0 | % |
| | | | | |
| | | | |
MML Growth Allocation Fund
Asset Allocation
(% of Net Assets) on 12/31/10
(Unaudited) | |
| | |
Equity Funds | | | 76.1 | % |
Fixed Income Funds | | | 24.0 | % |
| | | | | |
Total Long-Term Investments | | | 100.1 | % |
Other Assets and Liabilities | | | (0.1 | )% |
| | | | | |
Net Assets | | | 100.0 | % |
| | | | | |
| | | | |
MML Moderate Allocation Fund
Asset Allocation
(% of Net Assets) on 12/31/10
(Unaudited) | |
| | |
Equity Funds | | | 61.6 | % |
Fixed Income Funds | | | 38.5 | % |
| | | | | |
Total Long-Term Investments | | | 100.1 | % |
Other Assets and Liabilities | | | (0.1 | )% |
| | | | | |
Net Assets | | | 100.0 | % |
| | | | | |
9
MML Aggressive Allocation Fund – Portfolio Manager Report (Continued)
Growth of a $10,000 Investment
Hypothetical Investments in MML Aggressive Allocation Fund Initial Class, the Russell 3000 Index, the Barclays Capital U.S. Aggregate Bond Index, the MSCI ACWI ex-U.S. and the Custom MML Aggressive Allocation Index.
| | | | | | | | |
| | | |
| TOTAL RETURN | | One Year
1/1/10 -
12/31/10 | | | Since
Inception
Average
Annual
8/31/07 -
12/31/10 | |
| Initial Class | | | 16.05% | | | | -0.66% | |
| Russell 3000 Index* | | | 16.93% | | | | -1.76%+ | |
| Barclays Capital U.S. Aggregate Bond Index | | | 6.54% | | | | 6.48%+ | |
| MSCI ACWI ex-U.S. | | | 11.15% | | | | -2.89%+ | |
| Custom MML Aggressive Allocation Index | | | 14.81% | | | | -0.66%+ | |
Hypothetical Investments in MML Aggressive Allocation Fund Service Class, the Russell 3000 Index, the Barclays Capital U.S. Aggregate Bond Index, the MSCI ACWI ex-U.S. and the Custom MML Aggressive Allocation Index.
| | | | | | | | |
| | | |
| TOTAL RETURN | | One Year
1/1/10 -
12/31/10 | | | Since
Inception
Average
Annual
8/15/08 -
12/31/10 | |
| Service Class | | | 15.83% | | | | 2.40% | |
| Russell 3000 Index* | | | 16.93% | | | | 2.11%++ | |
| Barclays Capital U.S. Aggregate Bond Index | | | 6.54% | | | | 6.74%++ | |
| MSCI ACWI ex-U.S. | | | 11.15% | | | | 1.59%++ | |
| Custom MML Aggressive Allocation Index | | | 14.81% | | | | 3.17%++ | |
GROWTH OF $10,000 INVESTMENT SINCE INCEPTION
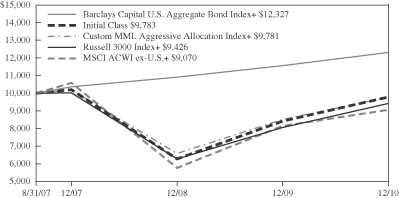
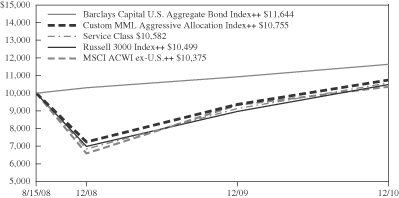
* Benchmark
+ From 9/3/07.
++ From 9/2/08.
Performance data quoted represents past performance; past performance is not predictive of future results. The investment return and principal value of shares of the Fund will fluctuate with market conditions so that shares of the Fund, when redeemed, may be worth more or less than their original cost. Current performance of the Fund may be lower or higher than the performance quoted. Performance data current to the most recent month end may be obtained by accessing the website www.massmutual.com.
Investors should note that the Fund is a professionally managed mutual fund, while the Russell 3000 Index, the Barclays Capital U.S. Aggregate Bond Index, the MSCI ACWI ex-U.S. and the Custom MML Aggressive Allocation Index are unmanaged, do not incur expenses, and cannot be purchased directly by investors. Investors should read the Fund’s prospectus with regard to the Fund’s investment objective, risks and charges and expenses in conjunction with these financial statements. The Fund’s return reflects changes in the net asset value per share without the deduction of any product charges (e.g., cost of insurance, mortality and expense risk charges, administrative fees, and CDSL). The inclusion of these charges would have reduced the performance shown here.
10
MML Balanced Allocation Fund – Portfolio Manager Report (Continued)
Growth of a $10,000 Investment
Hypothetical Investments in MML Balanced Allocation Fund Initial Class, the Russell 3000 Index, the Barclays Capital U.S. Aggregate Bond Index, the MSCI ACWI ex-U.S. and the Custom MML Balanced Allocation Index.
| | | | | | | | |
| | | |
| TOTAL RETURN | | One Year
1/1/10 -
12/31/10 | | | Since
Inception
Average
Annual
8/31/07 -
12/31/10 | |
| Initial Class | | | 12.73% | | | | 2.32% | |
| Russell 3000 Index* | | | 16.93% | | | | -1.76%+ | |
| Barclays Capital U.S. Aggregate Bond Index | | | 6.54% | | | | 6.48%+ | |
| MSCI ACWI ex-U.S. | | | 11.15% | | | | -2.89%+ | |
| Custom MML Balanced Allocation Index | | | 11.34% | | | | 3.40%+ | |
Hypothetical Investments in MML Balanced Allocation Fund Service Class, the Russell 3000 Index, the Barclays Capital U.S. Aggregate Bond Index, the MSCI ACWI ex-U.S. and the Custom MML Balanced Allocation Index.
| | | | | | | | |
| | | |
| TOTAL RETURN | | One Year
1/1/10 -
12/31/10 | | | Since
Inception
Average
Annual
8/15/08 -
12/31/10 | |
| Service Class | | | 12.49% | | | | 3.88% | |
| Russell 3000 Index* | | | 16.93% | | | | 2.11%++ | |
| Barclays Capital U.S. Aggregate Bond Index | | | 6.54% | | | | 6.74%++ | |
| MSCI ACWI ex-U.S. | | | 11.15% | | | | 1.59%++ | |
| Custom MML Balanced Allocation Index | | | 11.34% | | | | 5.99%++ | |
GROWTH OF $10,000 INVESTMENT SINCE INCEPTION
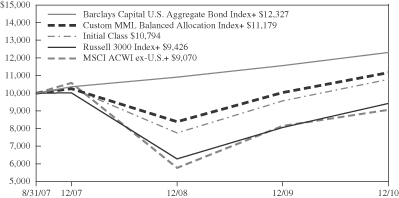
* Benchmark
+ From 9/3/07.
++ From 9/2/08.
Performance data quoted represents past performance; past performance is not predictive of future results. The investment return and principal value of shares of the Fund will fluctuate with market conditions so that shares of the Fund, when redeemed, may be worth more or less than their original cost. Current performance of the Fund may be lower or higher than the performance quoted. Performance data current to the most recent month end may be obtained by accessing the website www.massmutual.com.
Investors should note that the Fund is a professionally managed mutual fund, while the Russell 3000 Index, the Barclays Capital U.S. Aggregate Bond Index, the MSCI ACWI ex-U.S. and the Custom MML Balanced Allocation Index are unmanaged, do not incur expenses, and cannot be purchased directly by investors. Investors should read the Fund’s prospectus with regard to the Fund’s investment objective, risks and charges and expenses in conjunction with these financial statements. The Fund’s return reflects changes in the net asset value per share without the deduction of any product charges (e.g., cost of insurance, mortality and expense risk charges, administrative fees, and CDSL). The inclusion of these charges would have reduced the performance shown here.
11
MML Conservative Allocation Fund – Portfolio Manager Report (Continued)
Growth of a $10,000 Investment
Hypothetical Investments in MML Conservative Allocation Fund Initial Class, the Barclays Capital U.S. Aggregate Bond Index, the Russell 3000 Index, the MSCI ACWI ex-U.S. and the Custom MML Conservative Allocation Index.
| | | | | | | | |
| | | |
| TOTAL RETURN | | One Year
1/1/10 -
12/31/10 | | | Since
Inception
Average
Annual
8/31/07 -
12/31/10 | |
| Initial Class | | | 11.91% | | | | 3.64% | |
| Barclays Capital U.S Aggregate Bond Index* | | | 6.54% | | | | 6.48%+ | |
| Russell 3000 Index | | | 16.93% | | | | -1.76%+ | |
| MSCI ACWI ex-U.S. | | | 11.15% | | | | -2.89%+ | |
| Custom MML Conservative Allocation Index | | | 10.42% | | | | 4.19%+ | |
Hypothetical Investments in MML Conservative Allocation Fund Service Class, the Barclays Capital U.S. Aggregate Bond Index, the Russell 3000 Index, the MSCI ACWI ex-U.S. and the Custom MML Conservative Allocation Index.
| | | | | | | | |
| | | |
| TOTAL RETURN | | One Year
1/1/10 -
12/31/10 | | | Since
Inception
Average
Annual
8/15/08 -
12/31/10 | |
| Service Class | | | 11.59% | | | | 4.95% | |
| Barclays Capital U.S Aggregate Bond Index* | | | 6.54% | | | | 6.74%++ | |
| Russell 3000 Index | | | 16.93% | | | | 2.11%++ | |
| MSCI ACWI ex-U.S. | | | 11.15% | | | | 1.59%++ | |
| Custom MML Conservative Allocation Index | | | 10.42% | | | | 6.38%++ | |
GROWTH OF $10,000 INVESTMENT SINCE INCEPTION
* Benchmark
+ From 9/3/07.
++ From 9/2/08.
Performance data quoted represents past performance; past performance is not predictive of future results. The investment return and principal value of shares of the Fund will fluctuate with market conditions so that shares of the Fund, when redeemed, may be worth more or less than their original cost. Current performance of the Fund may be lower or higher than the performance quoted. Performance data current to the most recent month end may be obtained by accessing the website www.massmutual.com.
Investors should note that the Fund is a professionally managed mutual fund, the Barclays Capital U.S. Aggregate Bond Index, the Russell 3000 Index, the MSCI ACWI ex-U.S. and the Custom MML Conservative Allocation Index are unmanaged, do not incur expenses, and cannot be purchased directly by investors. Investors should read the Fund’s prospectus with regard to the Fund’s investment objective, risks and charges and expenses in conjunction with these financial statements. The Fund’s return reflects changes in the net asset value per share without the deduction of any product charges (e.g., cost of insurance, mortality and expense risk charges, administrative fees, and CDSL). The inclusion of these charges would have reduced the performance shown here.
12
MML Growth Allocation Fund – Portfolio Manager Report (Continued)
Growth of a $10,000 Investment
Hypothetical Investments in MML Growth Allocation Fund Initial Class, the Russell 3000 Index, the Barclays Capital U.S. Aggregate Bond Index, the MSCI ACWI ex-U.S. and the Custom MML Growth Allocation Index.
| | | | | | | | |
| | | |
| TOTAL RETURN | | One Year
1/1/10 -
12/31/10 | | | Since
Inception
Average
Annual
8/31/07 -
12/31/10 | |
| Initial Class | | | 14.92% | | | | 0.43% | |
| Russell 3000 Index* | | | 16.93% | | | | -1.76%+ | |
| Barclays Capital U.S. Aggregate Bond Index | | | 6.54% | | | | 6.48%+ | |
| MSCI ACWI ex-U.S. | | | 11.15% | | | | -2.89%+ | |
| Custom MML Growth Allocation Index | | | 13.54% | | | | 1.03%+ | |
Hypothetical Investments in MML Growth Allocation Fund Service Class, the Russell 3000 Index, the Barclays Capital U.S. Aggregate Bond Index, the MSCI ACWI ex-U.S. and the Custom MML Growth Allocation Index.
| | | | | | | | |
| | | |
| TOTAL RETURN | | One Year
1/1/10 -
12/31/10 | | | Since
Inception
Average
Annual
8/15/08 -
12/31/10 | |
| Service Class | | | 14.54% | | | | 2.97% | |
| Russell 3000 Index* | | | 16.93% | | | | 2.11%++ | |
| Barclays Capital U.S. Aggregate Bond Index | | | 6.54% | | | | 6.74%++ | |
| MSCI ACWI ex-U.S. | | | 11.15% | | | | 1.59%++ | |
| Custom MML Growth Allocation Index | | | 13.54% | | | | 4.47%++ | |
GROWTH OF $10,000 INVESTMENT SINCE INCEPTION
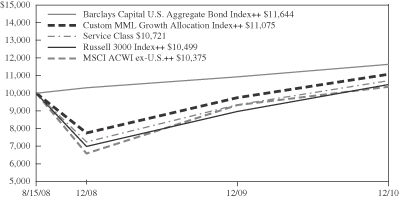
* Benchmark
+ From 9/3/07.
++ From 9/2/08.
Performance data quoted represents past performance; past performance is not predictive of future results. The investment return and principal value of shares of the Fund will fluctuate with market conditions so that shares of the Fund, when redeemed, may be worth more or less than their original cost. Current performance of the Fund may be lower or higher than the performance quoted. Performance data current to the most recent month end may be obtained by accessing the website www.massmutual.com.
Investors should note that the Fund is a professionally managed mutual fund, while the Russell 3000 Index, the Barclays Capital U.S. Aggregate Bond Index, the MSCI ACWI ex-U.S. and the Custom MML Growth Allocation Index are unmanaged, do not incur expenses, and cannot be purchased directly by investors. Investors should read the Fund’s prospectus with regard to the Fund’s investment objective, risks and charges and expenses in conjunction with these financial statements. The Fund’s return reflects changes in the net asset value per share without the deduction of any product charges (e.g., cost of insurance, mortality and expense risk charges, administrative fees, and CDSL). The inclusion of these charges would have reduced the performance shown here.
13
MML Moderate Allocation Fund – Portfolio Manager Report (Continued)
Growth of a $10,000 Investment
Hypothetical Investments in MML Moderate Allocation Fund Initial Class, the Russell 3000 Index, the Barclays Capital U.S. Aggregate Bond Index, the MSCI ACWI ex-U.S. and the Custom MML Moderate Allocation Index.
| | | | | | | | |
| | | |
| TOTAL RETURN | | One Year
1/1/10 -
12/31/10 | | | Since
Inception
Average
Annual
8/31/07 -
12/31/10 | |
| Initial Class | | | 13.48% | | | | 1.77% | |
| Russell 3000 Index* | | | 16.93% | | | | -1.76%+ | |
| Barclays Capital U.S. Aggregate Bond Index | | | 6.54% | | | | 6.48 %+ | |
| MSCI ACWI ex-U.S. | | | 11.15% | | | | -2.89%+ | |
| Custom MML Moderate Allocation Index | | | 12.23% | | | | 2.52%+ | |
Hypothetical Investments in MML Moderate Allocation Fund Service Class, the Russell 3000 Index, the Barclays Capital U.S. Aggregate Bond Index, the MSCI ACWI ex-U.S. and the Custom MML Moderate Allocation Index.
| | | | | | | | |
| | | |
| TOTAL RETURN | | One Year
1/1/10 -
12/31/10 | | | Since
Inception
Average
Annual
8/15/08 -
12/31/10 | |
| Service Class | | | 13.24% | | | | 3.80% | |
| Russell 3000 Index* | | | 16.93% | | | | 2.11%++ | |
| Barclays Capital U.S. Aggregate Bond Index | | | 6.54% | | | | 6.74%++ | |
| MSCI ACWI ex-U.S. | | | 11.15% | | | | 1.59%++ | |
| Custom MML Moderate Allocation Index | | | 12.23% | | | | 5.48%++ | |
GROWTH OF $10,000 INVESTMENT SINCE INCEPTION
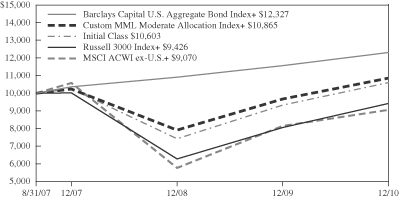
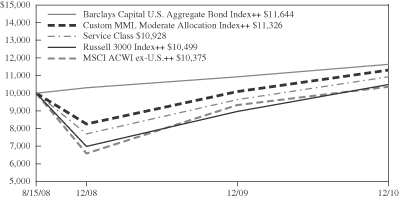
* Benchmark
+ From 9/3/07.
++ From 9/2/08.
Performance data quoted represents past performance; past performance is not predictive of future results. The investment return and principal value of shares of the Fund will fluctuate with market conditions so that shares of the Fund, when redeemed, may be worth more or less than their original cost. Current performance of the Fund may be lower or higher than the performance quoted. Performance data current to the most recent month end may be obtained by accessing the website www.massmutual.com.
Investors should note that the Fund is a professionally managed mutual fund, while the Russell 3000 Index, the Barclays Capital U.S. Aggregate Bond Index, the MSCI ACWI ex-U.S. and the Custom MML Moderate Allocation Index are unmanaged, do not incur expenses, and cannot be purchased directly by investors. Investors should read the Fund’s prospectus with regard to the Fund’s investment objective, risks and charges and expenses in conjunction with these financial statements. The Fund’s return reflects changes in the net asset value per share without the deduction of any product charges (e.g., cost of insurance, mortality and expense risk charges, administrative fees, and CDSL). The inclusion of these charges would have reduced the performance shown here.
14
MML American Funds Core Allocation Fund – Portfolio Manager Report
What is the investment approach of MML American Funds® Core Allocation Fund, and who is the Fund’s investment adviser?
The Fund seeks as high a total rate of return on an annual basis as is considered consistent with prudent investment risk and the preservation of capital. The Fund is a “fund of funds” and seeks to achieve its investment objective by principally investing in a combination of series of the American Funds Insurance Series® (the “Underlying Funds”), managed by Capital Research and Management Company (Capital Research), using a flexible asset allocation approach. As of the date of this report, it is expected that the Underlying Funds will include Class 1 shares of the American Funds Insurance Series – Bond Fund, the American Funds Insurance Series – Blue Chip Income and Growth Fund, the American Funds Insurance Series – Growth-Income Fund, and the American Funds Insurance Series – International Fund. The Fund’s investment adviser allocates the Fund’s assets among a variety of different asset classes through investing in Underlying Funds in response to changing market, economic, and investment conditions. The Fund’s adviser invests the Fund’s assets in a combination of domestic and international Underlying Funds. The Fund’s investment adviser is Massachusetts Mutual Life Insurance Company (MassMutual).
How did the Fund perform during the 12 months ended December 31, 2010?
The Fund returned 9.17%, trailing the 15.06% return of the S&P 500® Index (the “benchmark”), a widely recognized, unmanaged index representative of common stocks of larger capitalized U.S. companies. The Fund also underperformed the 11.15% return of the Morgan Stanley Capital International All Country World Index (“MSCI® ACWI”) ex-U.S., an unmanaged index representative of stocks domiciled in global developed and emerging markets, excluding the United States. The Fund outperformed the 6.54% return of the Barclays Capital U.S. Aggregate Bond Index, an unmanaged index of fixed-rate investment-grade securities with at least one year to maturity, combining the Barclays Capital U.S. Treasury Bond Index, the Barclays Capital U.S. Government-Related Bond Index, the Barclays Capital U.S. Corporate Bond Index, and the Barclays Capital U.S. Securitized Bond Index. The Fund also underperformed the 12.18% return of the Custom MML Core Allocation Index, which comprises the benchmark (55%), the Barclays Capital U.S. Aggregate Bond Index (35%), and the MSCI ACWI ex-U.S. (10%).
For a discussion on the economic and market environment during the 12-month period ended December 31, 2010, please see the Economic and Market Review, beginning on page 3.
American Funds’ discussion of factors that contributed to the Fund’s performance
The following paragraphs discuss the results of each of the Fund’s underlying portfolio components. Because the Fund invests in both stock- and bond-based portfolios, its overall performance may vary considerably from the broad market indexes listed above, which each measure the performance of a specific group of securities. These component-specific discussions focus on results and positioning versus each component’s main comparative index, not how the Fund as a whole performed or was positioned versus those indexes.
With respect to the American Funds Insurance Series – Bond Fund (the “Bond Fund”), the Bond Fund outperformed the Barclays Capital U.S. Aggregate Bond Index (the “Index”) for the year ended December 31, 2010. The Bond Fund’s ability to invest in bonds of lower credit quality was the primary driver of results for the year – a time frame when bonds that had the highest rankings returned the lowest yields. The Bond Fund’s exposure to corporate bonds (as opposed to Treasuries) was a positive for the year, since the portfolio emphasized investment-grade corporate bonds. An underweight position in Treasuries, relative to the Index, proved positive for the year as well. Conversely, detracting from full-year results was the portfolio’s stake (although not a large one) in non-U.S. bonds – particularly, those in Europe. European bonds returned significantly less than their U.S. counterparts for the year. The top three detractors were Greek bonds, Allied Irish Banks, and Irish government bonds, all attributable to sovereign debt concerns over those countries. At the sector level, commercial bank bonds (in the financials sector) and telecommunications bonds hindered the Bond Fund’s performance.
With respect to the three equity Underlying Funds: In 2010, small-capitalization stocks did better than their large-capitalization (“large-cap”) brethren. Consequently, all three equity Underlying Funds suffered, since they all have a large-cap bias. All of these Funds have the flexibility to invest outside the U.S. – and those foreign investments detracted from full-year returns. Further, each Underlying Fund’s emphasis on higher-quality companies (specifically, those that are considered good dividend payers) hampered the Funds’ performance for the year, as these were not generally the market winners in 2010. Compounding the equity Underlying Funds’ performance problems was the fact that their non-U.S. holdings were mainly in European companies, which underperformed. Finally, all of the equity Underlying Funds held strong cash positions, which muted equity returns somewhat in the favorable equity environment – although each American Fund does ordinarily maintain a higher cash position than many of its competitors.
15
MML American Funds Core Allocation Fund – Portfolio Manager Report (Continued)
The American Funds Insurance Series – Blue Chip Income and Growth Fund (the “Income and Growth Fund”) underperformed the benchmark for the year. On a sector level, technology was the largest detractor and represented 70% of the Fund’s underperformance. Not owning Apple, a non-dividend-paying company, hurt the portfolio’s performance relative to the benchmark, since Apple advanced 50% for the year. Portfolio holding Hewlett-Packard, which was down 17% for the year, also hampered the Income and Growth Fund’s returns. Conversely, portfolio holdings and an overweight position in the industrials sector provided the largest contribution to performance (by a meaningful amount), as industrials was one of the best-returning benchmark sectors for the year. Aerospace and defense also contributed to results, as did energy – despite the portfolio’s underweight position in that strong-performing sector. In energy, the portfolio’s larger integrated oil company holdings did extremely well.
The American Funds Insurance Series – Growth-Income Fund (the “Growth-Income Fund”) trailed its benchmark for the year, with the technology sector detracting the most from performance – for the same reasons (noted above) as the Income and Growth Fund. The Growth-Income Fund’s average cash level of just under 7% hampered results, as did less-than-favorable stock selection in the strong-performing consumer discretionary sector. The specialty-retail sector also held back the Growth-Income Fund’s progress in 2010, with weak performer Best Buy being the largest portfolio position within the sector. Conversely, the Fund’s underweight position in the lagging health care sector was the number-one contributor to the Fund’s relative performance in 2010. In particular, the Fund’s lack of emphasis on poor-performing pharmaceutical stocks also contributed.
The American Funds Insurance Series – International Fund (the “International Fund”) underperformed the MSCI ACWI ex-U.S. (the “Index”) for the year. The Fund’s emphasis on European companies hurt – as did its lower weight in Asian stocks, which did well for the year. On a sector level, the Fund’s underweight position in the strong-performing materials sector detracted from performance along with less-than-favorable stock selection within the sector. Metals and mining holdings were laggards for the year – specifically, Arcelor Mittal (France), the largest producer of iron ore in the world, which suffered on news that consumption levels of commodities would suffer as a result of China’s slowing growth rate. (China is the largest consumer of commodities in the world.) The International Fund’s overweight position in the struggling health care sector (specifically pharmaceuticals) also hampered portfolio performance. Conversely, the International Fund’s consumer discretionary holdings were a significant contributor for the year, benefiting from strong overall performance in the sector and an overweight position. Auto company holdings, including Fiat and Daimler, also contributed. Finally, avoiding the utilities sector had a positive impact, as the portfolio had an underweight position in this area, which was the only negative-returning sector for the year. Favorable stock selection in the struggling telecommunications sector proved positive, as wireless stocks MTN Group (South Africa) and America Movil (Mexico) turned in impressive returns for the year.
Outlook
The following outlook reflects common views held by many of Capital Research’s investment professionals:
Over the long term, drivers of world economic growth may lie outside of the United States. Consequently, when looking to invest in U.S. companies, how well they appear to be positioned to sell outside of the U.S. is an important factor – as is an assessment of their potential to succeed in emerging markets. In the short term, large-cap stocks – particularly high-quality companies that are better financed, with good balance sheets – may do well. Recovery often starts with highly leveraged small-cap stocks, which have tended to rebound the most quickly and highest after a market downturn, after which time a smart approach may be to rotate into other companies that may offer more opportunity to profit over time. In fact, at year-end 2010, it’s possible that we had entered that rotation period. Consequently, in 2011, it will be important to consider investing in firms that tend to pay better dividends. It’s possible that the market will be in a more subdued total return market environment for the near term – potentially with equity returns in the high single digits – an environment in which dividend returns become far more important relative to total returns.
16
MML American Funds Core Allocation Fund – Portfolio Manager Report (Continued)
| | | | |
MML American Funds
Core Allocation Fund
Asset Allocation
(% of Net Assets) on 12/31/10
(Unaudited) | |
| | |
Equity Funds | | | 67.4 | % |
Fixed Income Funds | | | 32.7 | % |
| | | | | |
Total Long-Term Investments | | | 100.1 | % |
Other Assets and Liabilities | | | (0.1 | )% |
| | | | | |
Net Assets | | | 100.0 | % |
| | | | | |
17
MML American Funds Core Allocation Fund – Portfolio Manager Report (Continued)
Growth of a $10,000 Investment
Hypothetical Investments in MML American Funds Core Allocation Fund Service Class I, the S&P 500 Index, the Barclays Capital U.S. Aggregate Bond Index, the MSCI ACWI ex-U.S. and the Custom MML Core Allocation Index.
| | | | | | | | |
| | | |
| TOTAL RETURN | | One Year
1/1/10 -
12/31/10 | | | Since
Inception
Average
Annual
8/15/08 -
12/31/10 | |
| Service Class I | | | 9.17% | | | | 2.21% | |
| S&P 500 Index* | | | 15.06% | | | | 1.47%+ | |
| Barclays Capital U.S. Aggregate Bond Index | | | 6.54% | | | | 6.74%+ | |
| MSCI ACWI ex-U.S. | | | 11.15% | | | | 1.59%+ | |
| Custom MML Core Allocation Index | | | 12.18% | | | | 4.02%+ | |
GROWTH OF $10,000 INVESTMENT SINCE INCEPTION
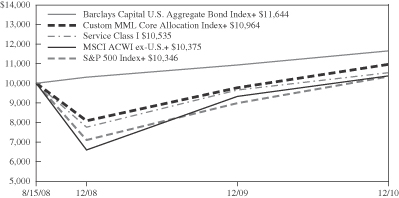
* Benchmark
+ From 9/2/08.
Performance data quoted represents past performance; past performance is not predictive of future results. The investment return and principal value of shares of the Fund will fluctuate with market conditions so that shares of the Fund, when redeemed, may be worth more or less than their original cost. Current performance of the Fund may be lower or higher than the performance quoted. Performance data current to the most recent month end may be obtained by accessing the website www.massmutual.com.
Investors should note that the Fund is a professionally managed mutual fund, while the S&P 500 Index, the Barclays Capital U.S. Aggregate Bond Index, the MSCI ACWI ex-U.S. and the Custom MML Core Allocation Index are unmanaged, do not incur expenses, and cannot be purchased directly by investors. Investors should read the Fund’s prospectus with regard to the Fund’s investment objective, risks and charges and expenses in conjunction with these financial statements. The Fund’s return reflects changes in the net asset value per share without the deduction of any product charges (e.g., cost of insurance, mortality and expense risk charges, administrative fees, and CDSL). The inclusion of these charges would have reduced the performance shown here.
18
MML American Funds Growth Fund – Portfolio Manager Report
What is the investment approach of MML American Funds® Growth Fund, and who is the Fund’s investment adviser?
The Fund seeks to provide investors with long-term capital growth through a “master feeder” relationship. (See page 52 of this report for information about the “master feeder” relationship.) The Fund invests all of its assets in Class 1 shares of the American Funds Insurance Series – Growth Fund (the “Master Growth Fund”), a series of the American Funds Insurance Series®, a registered open-end investment company, managed by Capital Research and Management Company (Capital Research) with the same investment objective. The Master Growth Fund may invest in the securities of issuers representing a broad range of market capitalizations. The Master Growth Fund may invest a portion of its assets in equity securities of issuers domiciled outside the United States. The Fund’s investment adviser is Massachusetts Mutual Life Insurance Company (MassMutual).
How did the Fund perform during the 12 months ended December 31, 2010?
The Fund returned 18.16%, outperforming the 15.06% return of the S&P 500® Index (the “benchmark”), a widely recognized, unmanaged index representative of common stocks of larger capitalized U.S. companies. The Fund also outpaced the 16.71% return of the Russell 1000® Growth Index, an unmanaged index consisting of those Russell 1000 securities (representing the 1,000 largest U.S. companies based on market capitalization) with greater than average growth orientation that tend to exhibit higher price-to-book ratios and higher forecasted growth rates than securities in the value universe.
For a discussion on the economic and market environment during the 12-month period ended December 31, 2010, please see the Economic and Market Review, beginning on page 3.
American Funds’ discussion of factors that contributed to the Fund’s performance
The Fund’s outperformance of its benchmark is largely attributable to its overweight position, relative to the benchmark, in the consumer discretionary sector, which was also the best-performing market segment. Gaming stocks (within the hotels, restaurants, and leisure industry) also played a large role in the Fund’s progress. On a company-specific basis, portfolio holdings Las Vegas Sands advanced 200% for the year; Wynn Resorts increased 90%; and the portfolio’s largest position within the industry – Wynn Macau – jumped 90%. Materials also contributed to Fund performance through overweight positioning and strong overall performance for the sector along with positive stock selection, particularly gold stocks. In the consumer staples sector (one of the lowest areas of representation in the portfolio), despite the Fund’s underweight position and the sector’s overall less-than-stellar performance, the portfolio did benefit from certain personal products companies – specifically, Estee Lauder, which advanced 68% for the year. The portfolio’s largest underweight was in ExxonMobil. Despite the energy sector’s impressive advance, this underweight stake proved beneficial, as ExxonMobil gained only 10% for the year (versus the average oil company return of 17.5%). In some respects, what the portfolio did not own was just as important as what it did. Indeed, Johnson & Johnson and Pfizer, which were both negative-returning stocks, were not portfolio holdings, which contributed to the Fund’s performance.
On the downside, the Fund’s cash position, although less than 5% of the portfolio, hampered performance in 2010’s strong equity environment. Other factors that dragged on Fund results included the industrials sector, a strong-performing market segment in which the portfolio was underweight. Stock selection also worked against the Fund in the electrical equipment segment of industrials. The portfolio also suffered from stock selection within health care, particularly within the equipment and supplies area. The companies the portfolio owned in the biotechnology industry (e.g., Gilead Sciences) hindered Fund performance, as Gilead was down 16% for the year.
Outlook
The following outlook reflects common views held by many of Capital Research’s investment professionals:
Over the long term, drivers of world economic growth may lie outside of the United States. Consequently, when looking to invest in U.S. companies, how well they appear to be positioned to sell outside of the U.S. is an important factor – as is an assessment of their potential to succeed in emerging markets. In the short term, large-cap stocks – particularly high-quality companies that are better financed, with good balance sheets – may do well. Recovery often starts with highly leveraged small-cap stocks, which have tended to rebound the most quickly and highest after a market downturn, after which time a smart approach may be to rotate into other companies that may offer more opportunity to profit over time. In fact, at year-end 2010, it’s possible that we had
19
MML American Funds Growth Fund – Portfolio Manager Report (Continued)
entered that rotation period. Consequently, in 2011, it will be important to consider investing in firms that tend to pay better dividends. It’s possible that the market will be in a more subdued total return market environment for the near term – potentially with equity returns in the high single digits – an environment in which dividend returns become far more important relative to total returns.
| | | | |
MML American Funds Growth Fund
Asset Allocation
(% of Net Assets) on 12/31/10
(Unaudited) | |
| | |
Equity Funds | | | 100.2 | % |
| | | | | |
Total Long-Term Investments | | | 100.2 | % |
Other Assets and Liabilities | | | (0.2 | )% |
| | | | | |
Net Assets | | | 100.0 | % |
| | | | | |
20
MML American Funds Growth Fund – Portfolio Manager Report (Continued)
Growth of a $10,000 Investment
Hypothetical Investments in MML American Funds Growth Fund Service Class I, the S&P 500 Index and the Russell 1000 Growth Index.
| | | | | | | | |
| | | |
| TOTAL RETURN | | One Year
1/1/10 -
12/31/10 | | | Since
Inception
Average
Annual
8/15/08 -
12/31/10 | |
| Service Class I | | | 18.16% | | | | 1.80% | |
| S&P 500 Index* | | | 15.06% | | | | 1.47%+ | |
| Russell 1000 Growth Index | | | 16.71% | | | | 3.90%+ | |
GROWTH OF $10,000 INVESTMENT SINCE INCEPTION
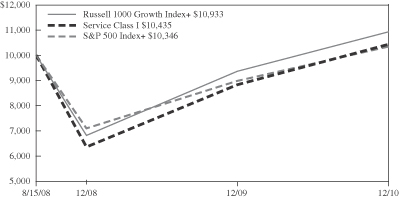
* Benchmark
+ From 9/2/08.
Performance data quoted represents past performance; past performance is not predictive of future results. The investment return and principal value of shares of the Fund will fluctuate with market conditions so that shares of the Fund, when redeemed, may be worth more or less than their original cost. Current performance of the Fund may be lower or higher than the performance quoted. Performance data current to the most recent month end may be obtained by accessing the website www.massmutual.com.
Investors should note that the Fund is a professionally managed mutual fund, while the S&P 500 Index and the Russell 1000 Growth Index are unmanaged, do not incur expenses, and cannot be purchased directly by investors. Investors should read the Fund’s prospectus with regard to the Fund’s investment objective, risks and charges and expenses in conjunction with these financial statements. The Fund’s return reflects changes in the net asset value per share without the deduction of any product charges (e.g., cost of insurance, mortality and expense risk charges, administrative fees, and CDSL). The inclusion of these charges would have reduced the performance shown here.
21
MML American Funds International Fund – Portfolio Manager Report
What is the investment approach of MML American Funds® International Fund, and who is the Fund’s investment adviser?
The Fund seeks long-term capital growth of assets through a “master-feeder” relationship. (See page 52 of this report for information about the “master feeder” relationship.) The Fund invests all of its assets in Class 1 shares of the American Funds Insurance Series – International Fund (the “Master International Fund”), a series of the American Funds Insurance Series®, a registered open-end investment company managed by Capital Research and Management Company (Capital Research) with the same investment objective. The Master International Fund invests primarily in common stocks of companies located outside the United States that Capital Research believes have the potential for growth, including emerging and developing markets. The Fund’s investment adviser is Massachusetts Mutual Life Insurance Company (MassMutual).
How did the Fund perform during the 12 months ended December 31, 2010?
The Fund returned 6.82%, trailing the 7.75% return of the Morgan Stanley Capital International (MSCI®) Europe, Australasia, Far East (EAFE®) Index (the “benchmark”), a widely recognized, unmanaged index representative of equity securities in developed markets, excluding the U.S. and Canada. Similarly, the Fund lagged the 11.15% return of the Morgan Stanley Capital International All Country World Index (MSCI® ACWI) ex-U.S., an unmanaged index representative of stocks domiciled in global developed and emerging markets, excluding the United States.
For a discussion on the economic and market environment during the 12-month period ended December 31, 2010, please see the Economic and Market Review, beginning on page 3.
American Funds’ discussion of factors that contributed to the Fund’s performance
In 2010, small-capitalization stocks did better than their large-capitalization (“large-cap”) brethren. Consequently, the Fund suffered, due to its large-cap bias. The Fund’s emphasis on higher-quality companies (specifically, those that are considered good dividend-payers) detracted from full-year returns, as these were not generally the market winners in 2010. Compounding the Fund’s performance problems was the fact that portfolio holdings were mainly in European companies, which underperformed. Finally, the Fund held a strong cash position, which muted equity returns somewhat in the favorable equity environment – although the Fund does ordinarily maintain a higher cash position than many of its competitors.
The Fund’s emphasis on European companies hurt performance – as did its lower weight in Asian stocks, which did well for the year. On a sector level, the Fund’s underweight position, relative to the benchmark, in the strong-performing materials sector detracted from performance along with less-than-favorable stock selection within the sector. Metals and mining holdings were laggards for the year – specifically, Arcelor Mittal (France), the largest producer of iron ore in the world, which suffered on news that consumption levels of commodities would suffer as a result of China’s slowing growth rate. (China is the largest consumer of commodities in the world.) The Fund’s significantly overweight position in the struggling health care sector (specifically pharmaceuticals) also hampered portfolio performance.
Conversely, the Fund’s consumer discretionary holdings were a significant contributor to full-year results, benefiting from strong overall performance in the sector and an overweight position. Auto company holdings, including Fiat and Daimler, also contributed. Finally, avoiding the utilities sector had a positive impact, as the portfolio had a significantly underweight position in this area, which was the only negative-returning sector for the year. Favorable stock selection in the struggling telecommunications sector proved positive, as wireless stocks MTN Group (South Africa) and America Movil (Mexico) turned in impressive returns for the year.
Outlook
The following outlook reflects common views held by many of Capital Research’s investment professionals:
Over the long term, drivers of world economic growth may lie outside of the United States. In the short term, large-cap stocks – particularly high-quality companies that are better financed, with good balance sheets – may do well. Recovery often starts with highly leveraged small-cap stocks, which have tended to rebound the most quickly and highest after a market downturn, after which time a smart approach may be to rotate into other companies that may offer more opportunity to profit over time. In fact, at year-end 2010, it’s possible that we had entered that rotation period. Consequently, in 2011, it will be important to consider
22
MML American Funds International Fund – Portfolio Manager Report (Continued)
investing in firms that tend to pay better dividends. It’s possible that the market will be in a more subdued total return market environment for the near term – potentially with equity returns in the high single digits – an environment in which dividend returns become far more important relative to total returns.
| | | | |
MML American Funds
International Fund
Asset Allocation
(% of Net Assets) on 12/31/10
(Unaudited) | |
| | |
Equity Funds | | | 100.2 | % |
| | | | | |
Total Long-Term Investments | | | 100.2 | % |
Other Assets and Liabilities | | | (0.2 | )% |
| | | | | |
Net Assets | | | 100.0 | % |
| | | | | |
23
MML American Funds International Fund – Portfolio Manager Report (Continued)
Growth of a $10,000 Investment
Hypothetical Investments in MML American Funds International Fund Service Class I, the MSCI EAFE Index and the MSCI ACWI ex-U.S.
| | | | | | | | |
| | | |
| TOTAL RETURN | | One Year
1/1/10 -
12/31/10 | | | Since
Inception
Average
Annual
8/15/08 -
12/31/10 | |
| Service Class I | | | 6.82% | | | | 2.24% | |
| MSCI EAFE Index* | | | 7.75% | | | | -1.20%+ | |
| MSCI ACWI ex-U.S. | | | 11.15% | | | | 1.59%+ | |
GROWTH OF $10,000 INVESTMENT SINCE INCEPTION
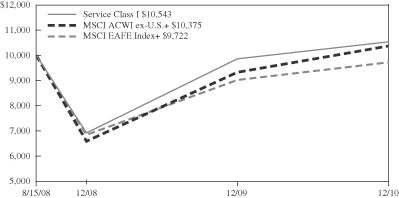
* Benchmark
+ From 9/2/08.
Performance data quoted represents past performance; past performance is not predictive of future results. The investment return and principal value of shares of the Fund will fluctuate with market conditions so that shares of the Fund, when redeemed, may be worth more or less than their original cost. Current performance of the Fund may be lower or higher than the performance quoted. Performance data current to the most recent month end may be obtained by accessing the website www.massmutual.com.
Investors should note that the Fund is a professionally managed mutual fund, while the MSCI EAFE Index and the MSCI ACWI ex-U.S. Index are unmanaged, do not incur expenses, and cannot be purchased directly by investors. Investors should read the Fund’s prospectus with regard to the Fund’s investment objective, risks and charges and expenses in conjunction with these financial statements. The Fund’s return reflects changes in the net asset value per share without the deduction of any product charges (e.g., cost of insurance, mortality and expense risk charges, administrative fees, and CDSL). The inclusion of these charges would have reduced the performance shown here.
24
MML Aggressive Allocation Fund – Portfolio of Investments
December 31, 2010
| | | | | | | | |
| | | Number of
Shares | | | Value | |
| MUTUAL FUNDS — 100.1% | | | | | | | | |
| Diversified Financial — 100.1% | | | | | | | | |
MML Blue Chip Growth Fund, Initial Class (a) | | | 659,236 | | | $ | 7,429,588 | |
MML Concentrated Growth Fund, Class I (a) | | | 260,525 | | | | 1,870,566 | |
MML Equity Fund, Initial Class (a) | | | 223,969 | | | | 4,384,126 | |
MML Equity Income Fund, Initial Class (a) | | | 717,373 | | | | 6,771,998 | |
MML Foreign Fund, Initial Class (a) | | | 277,653 | | | | 2,557,184 | |
MML Fundamental Value Fund, Class II (a) | | | 363,461 | | | | 4,027,145 | |
MML Global Fund, Class I (a) | | | 298,646 | | | | 2,526,548 | |
MML High Yield Fund, Class II (a) | | | 58,879 | | | | 599,391 | |
MML Inflation-Protected and Income Fund, Initial Class (a) | | | 122,223 | | | | 1,309,008 | |
MML Large Cap Growth Fund, Initial Class (a) | | | 365,902 | | | | 3,823,675 | |
MML Managed Bond Fund, Initial Class (a) | | | 122,881 | | | | 1,573,036 | |
MML Mid Cap Growth Fund, Initial Class (a) (b) | | | 382,936 | | | | 4,683,306 | |
MML Mid Cap Value Fund, Initial Class (a) | | | 378,963 | | | | 3,963,955 | |
MML PIMCO Total Return Fund, Class II (a) | | | 176,366 | | | | 1,746,027 | |
MML Short-Duration Bond Fund, Class II (a) | | | 169,625 | | | | 1,718,298 | |
MML Small Cap Equity Fund, Initial Class (a) | | | 69,330 | | | | 642,761 | |
MML Small Cap Growth Equity Fund, Initial Class (a) (b) | | | 140,215 | | | | 2,482,112 | |
MML Small Company Value Fund, Class II (a) | | | 190,180 | | | | 3,290,121 | |
Oppenheimer Capital Appreciation Fund, Non-Service Shares (a) | | | 47,734 | | | | 1,926,071 | |
Oppenheimer Global Securities Fund, Non-Service Shares (a) | | | 61,576 | | | | 1,865,752 | |
Oppenheimer International Growth Fund, Non-Service Shares (a) | | | 2,342,129 | | | | 4,379,782 | |
Oppenheimer Global Strategic Income Fund, Non-Service Shares (a) | | | 168,364 | | | | 939,472 | |
| | | | | | | | |
| | | | | | | 64,509,922 | |
| | | | | | | | |
| | |
TOTAL MUTUAL FUNDS
(Cost $52,599,632) | | | | | | | 64,509,922 | |
| | | | | | | | |
| | | | |
| | | Value | |
| |
TOTAL LONG-TERM INVESTMENTS
(Cost $52,599,632) | | $ | 64,509,922 | |
| | | | |
| |
TOTAL INVESTMENTS — 100.1%
(Cost $52,599,632) (c) | | | 64,509,922 | |
| |
| Other Assets/(Liabilities) — (0.1)% | | | (53,275 | ) |
| | | | |
| |
| NET ASSETS — 100.0% | | $ | 64,456,647 | |
| | | | |
Notes to Portfolio of Investments
| (a) | Affiliated issuer. (See Note 7 for a summary of transactions in the investments of affiliated issuers.) |
| (b) | Non-income producing security. |
| (c) | See Note 6 for aggregate cost for federal tax purposes. |
The accompanying notes are an integral part of the financial statements.
25
MML Balanced Allocation Fund – Portfolio of Investments
December 31, 2010
| | | | | | | | |
| | | Number of
Shares | | | Value | |
| MUTUAL FUNDS — 100.1% | | | | | | | | |
| Diversified Financial — 100.1% | | | | | | | | |
MML Blue Chip Growth Fund, Initial Class (a) | | | 2,279,412 | | | $ | 25,688,975 | |
MML Concentrated Growth Fund, Class I (a) | | | 682,376 | | | | 4,899,461 | |
MML Equity Fund, Initial Class (a) | | | 758,705 | | | | 14,851,454 | |
MML Equity Income Fund, Initial Class (a) | | | 2,820,690 | | | | 26,627,311 | |
MML Foreign Fund, Initial Class (a) | | | 799,940 | | | | 7,367,448 | |
MML Fundamental Value Fund, Class II (a) | | | 1,293,691 | | | | 14,334,097 | |
MML Global Fund, Class I (a) | | | 858,916 | | | | 7,266,425 | |
MML High Yield Fund, Class II (a) | | | 868,755 | | | | 8,843,929 | |
MML Inflation-Protected and Income Fund, Initial Class (a) | | | 1,326,606 | | | | 14,207,951 | |
MML Large Cap Growth Fund, Initial Class (a) | | | 1,064,023 | | | | 11,119,039 | |
MML Managed Bond Fund, Initial Class (a) | | | 5,580,370 | | | | 71,435,794 | |
MML Mid Cap Growth Fund, Initial Class (a) (b) | | | 967,953 | | | | 11,838,063 | |
MML Mid Cap Value Fund, Initial Class (a) | | | 1,087,098 | | | | 11,371,046 | |
MML Money Market Fund, Initial Class (a) | | | 50,684 | | | | 50,636 | |
MML PIMCO Total Return Fund, Class II (a) | | | 2,146,099 | | | | 21,246,383 | |
MML Short-Duration Bond Fund, Class II (a) | | | 2,936,140 | | | | 29,743,093 | |
MML Small Cap Equity Fund, Initial Class (a) | | | 406,497 | | | | 3,768,648 | |
MML Small Cap Growth Equity Fund, Initial Class (a) (b) | | | 414,702 | | | | 7,341,102 | |
MML Small Company Value Fund, Class II (a) | | | 446,052 | | | | 7,716,700 | |
Oppenheimer Capital Appreciation Fund, Non-Service Shares (a) | | | 170,819 | | | | 6,892,552 | |
Oppenheimer Global Securities Fund, Non-Service Shares (a) | | | 341,306 | | | | 10,341,559 | |
Oppenheimer International Growth Fund, Non-Service Shares (a) | | | 5,559,845 | | | | 10,396,910 | |
Oppenheimer Global Strategic Income Fund, Non-Service Shares (a) | | | 3,973,416 | | | | 22,171,662 | |
| | | | | | | | |
| | | | | | | 349,520,238 | |
| | | | | | | | |
| | |
TOTAL MUTUAL FUNDS
(Cost $302,300,381) | | | | | | | 349,520,238 | |
| | | | | | | | |
| | | | |
| | | Value | |
| |
TOTAL LONG-TERM INVESTMENTS
(Cost $302,300,381) | | $ | 349,520,238 | |
| | | | |
| |
TOTAL INVESTMENTS — 100.1%
(Cost $302,300,381) (c) | | | 349,520,238 | |
| |
| Other Assets/(Liabilities) — (0.1)% | | | (217,078 | ) |
| | | | |
| |
| NET ASSETS — 100.0% | | $ | 349,303,160 | |
| | | | |
Notes to Portfolio of Investments
| (a) | Affiliated issuer. (See Note 7 for a summary of transactions in the investments of affiliated issuers.) |
| (b) | Non-income producing security. |
| (c) | See Note 6 for aggregate cost for federal tax purposes. |
The accompanying notes are an integral part of the financial statements.
26
MML Conservative Allocation Fund – Portfolio of Investments
December 31, 2010
| | | | | | | | |
| | | Number of
Shares | | | Value | |
| MUTUAL FUNDS — 100.1% | | | | | | | | |
| Diversified Financial — 100.1% | | | | | | | | |
MML Blue Chip Growth Fund, Initial Class (a) | | | 1,568,488 | | | $ | 17,676,861 | |
MML Concentrated Growth Fund, Class I (a) | | | 472,301 | | | | 3,391,121 | |
MML Equity Fund, Initial Class (a) | | | 465,793 | | | | 9,117,770 | |
MML Equity Income Fund, Initial Class (a) | | | 2,116,781 | | | | 19,982,408 | |
MML Foreign Fund, Initial Class (a) | | | 672,297 | | | | 6,191,852 | |
MML Fundamental Value Fund, Class II (a) | | | 900,301 | | | | 9,975,338 | |
MML Global Fund, Class I (a) | | | 756,595 | | | | 6,400,794 | |
MML High Yield Fund, Class II (a) | | | 880,170 | | | | 8,960,129 | |
MML Inflation-Protected and Income Fund, Initial Class (a) | | | 1,356,296 | | | | 14,525,932 | |
MML Large Cap Growth Fund, Initial Class (a) | | | 765,936 | | | | 8,004,031 | |
MML Managed Bond Fund, Initial Class (a) | | | 5,944,671 | | | | 76,099,302 | |
MML Mid Cap Growth Fund, Initial Class (a) (b) | | | 552,436 | | | | 6,756,288 | |
MML Mid Cap Value Fund, Initial Class (a) | | | 935,750 | | | | 9,787,946 | |
MML Money Market Fund, Initial Class (a) | | | 67,158 | | | | 67,095 | |
MML PIMCO Total Return Fund, Class II (a) | | | 2,245,472 | | | | 22,230,173 | |
MML Short-Duration Bond Fund, Class II (a) | | | 2,729,666 | | | | 27,651,513 | |
MML Small Cap Equity Fund, Initial Class (a) | | | 331,325 | | | | 3,071,719 | |
MML Small Cap Growth Equity Fund, Initial Class (a) (b) | | | 173,810 | | | | 3,076,817 | |
MML Small Company Value Fund, Class II (a) | | | 367,303 | | | | 6,354,341 | |
Oppenheimer Capital Appreciation Fund, Non-Service Shares (a) | | | 104,974 | | | | 4,235,688 | |
Oppenheimer Global Securities Fund, Non-Service Shares (a) | | | 198,983 | | | | 6,029,170 | |
Oppenheimer International Growth Fund, Non-Service Shares (a) | | | 3,550,624 | | | | 6,639,666 | |
Oppenheimer Global Strategic Income Fund, Non-Service Shares (a) | | | 3,928,258 | | | | 21,919,682 | |
| | | | | | | | |
| | | | | | | 298,145,636 | |
| | | | | | | | |
| | |
TOTAL MUTUAL FUNDS
(Cost $269,591,808) | | | | | | | 298,145,636 | |
| | | | | | | | |
| | | | |
| | | Value | |
| |
TOTAL LONG-TERM INVESTMENTS
(Cost $269,591,808) | | $ | 298,145,636 | |
| | | | |
| |
TOTAL INVESTMENTS — 100.1%
(Cost $269,591,808) (c) | | | 298,145,636 | |
| |
| Other Assets/(Liabilities) — (0.1)% | | | (197,730 | ) |
| | | | |
| |
| NET ASSETS — 100.0% | | $ | 297,947,906 | |
| | | | |
Notes to Portfolio of Investments
| (a) | Affiliated issuer. (See Note 7 for a summary of transactions in the investments of affiliated issuers.) |
| (b) | Non-income producing security. |
| (c) | See Note 6 for aggregate cost for federal tax purposes. |
The accompanying notes are an integral part of the financial statements.
27
MML Growth Allocation Fund – Portfolio of Investments
December 31, 2010
| | | | | | | | |
| | | Number of
Shares | | | Value | |
| MUTUAL FUNDS — 100.1% | | | | | | | | |
| Diversified Financial — 100.1% | | | | | | | | |
MML Blue Chip Growth Fund, Initial Class (a) | | | 12,108,300 | | | $ | 136,460,540 | |
MML Concentrated Growth Fund, Class I (a) | | | 4,578,616 | | | | 32,874,465 | |
MML Equity Fund, Initial Class (a) | | | 4,223,305 | | | | 82,670,103 | |
MML Equity Income Fund, Initial Class (a) | | | 14,053,293 | | | | 132,663,084 | |
MML Foreign Fund, Initial Class (a) | | | 4,285,940 | | | | 39,473,505 | |
MML Fundamental Value Fund, Class II (a) | | | 5,376,391 | | | | 59,570,408 | |
MML Global Fund, Class I (a) | | | 4,644,460 | | | | 39,292,128 | |
MML High Yield Fund, Class II (a) | | | 2,124,287 | | | | 21,625,245 | |
MML Inflation-Protected and Income Fund, Initial Class (a) | | | 2,652,102 | | | | 28,404,009 | |
MML Large Cap Growth Fund, Initial Class (a) | | | 6,025,075 | | | | 62,962,031 | |
MML Managed Bond Fund, Initial Class (a) | | | 9,241,017 | | | | 118,296,699 | |
MML Mid Cap Growth Fund, Initial Class (a) (b) | | | 5,459,474 | | | | 66,769,370 | |
MML Mid Cap Value Fund, Initial Class (a) | | | 6,607,832 | | | | 69,117,922 | |
MML Money Market Fund, Initial Class (a) | | | 158,873 | | | | 158,722 | |
MML PIMCO Total Return Fund, Class II (a) | | | 3,920,769 | | | | 38,815,615 | |
MML Short-Duration Bond Fund, Class II (a) | | | 6,602,842 | | | | 66,886,790 | |
MML Small Cap Equity Fund, Initial Class (a) | | | 1,476,068 | | | | 13,684,664 | |
MML Small Cap Growth Equity Fund, Initial Class (a) (b) | | | 2,168,417 | | | | 38,385,606 | |
MML Small Company Value Fund, Class II (a) | | | 3,213,305 | | | | 55,590,170 | |
Oppenheimer Capital Appreciation Fund, Non-Service Shares (a) | | | 954,235 | | | | 38,503,388 | |
Oppenheimer Global Securities Fund, Non-Service Shares (a) | | | 1,269,361 | | | | 38,461,632 | |
Oppenheimer International Growth Fund, Non-Service Shares (a) | | | 41,402,584 | | | | 77,422,832 | |
Oppenheimer Global Strategic Income Fund, Non-Service Shares (a) | | | 6,463,298 | | | | 36,065,205 | |
| | | | | | | | |
| | | | | | | 1,294,154,133 | |
| | | | | | | | |
| | |
TOTAL MUTUAL FUNDS
(Cost $1,047,462,138) | | | | | | | 1,294,154,133 | |
| | | | | | | | |
| | | | |
| | | Value | |
| |
TOTAL LONG-TERM INVESTMENTS
(Cost $1,047,462,138) | | $ | 1,294,154,133 | |
| | | | |
| |
TOTAL INVESTMENTS — 100.1%
(Cost $1,047,462,138) (c) | | | 1,294,154,133 | |
| |
| Other Assets/(Liabilities) — (0.1)% | | | (690,332 | ) |
| | | | |
| |
| NET ASSETS — 100.0% | | $ | 1,293,463,801 | |
| | | | |
Notes to Portfolio of Investments
| (a) | Affiliated issuer. (See Note 7 for a summary of transactions in the investments of affiliated issuers.) |
| (b) | Non-income producing security. |
| (c) | See Note 6 for aggregate cost for federal tax purposes. |
The accompanying notes are an integral part of the financial statements.
28
MML Moderate Allocation Fund – Portfolio of Investments
December 31, 2010
| | | | | | | | |
| | | Number of
Shares | | | Value | |
| MUTUAL FUNDS — 100.1% | | | | | | | | |
| Diversified Financial — 100.1% | | | | | | | | |
MML Blue Chip Growth Fund, Initial Class (a) | | | 7,803,107 | | | $ | 87,941,017 | |
MML Concentrated Growth Fund, Class I (a) | | | 2,678,387 | | | | 19,230,820 | |
MML Equity Fund, Initial Class (a) | | | 3,103,730 | | | | 60,754,710 | |
MML Equity Income Fund, Initial Class (a) | | | 9,233,282 | | | | 87,162,180 | |
MML Foreign Fund, Initial Class (a) | | | 3,429,826 | | | | 31,588,695 | |
MML Fundamental Value Fund, Class II (a) | | | 3,499,114 | | | | 38,770,187 | |
MML Global Fund, Class I (a) | | | 2,549,705 | | | | 21,570,504 | |
MML High Yield Fund, Class II (a) | | | 2,160,608 | | | | 21,994,989 | |
MML Inflation-Protected and Income Fund, Initial Class (a) | | | 3,023,495 | | | | 32,381,633 | |
MML Large Cap Growth Fund, Initial Class (a) | | | 3,704,163 | | | | 38,708,505 | |
MML Managed Bond Fund, Initial Class (a) | | | 12,576,096 | | | | 160,989,930 | |
MML Mid Cap Growth Fund, Initial Class (a) (b) | | | 3,671,071 | | | | 44,897,199 | |
MML Mid Cap Value Fund, Initial Class (a) | | | 3,089,803 | | | | 32,319,343 | |
MML Money Market Fund, Initial Class (a) | | | 137,401 | | | | 137,270 | |
MML PIMCO Total Return Fund, Class II (a) | | | 4,929,287 | | | | 48,799,943 | |
MML Short-Duration Bond Fund, Class II (a) | | | 7,314,449 | | | | 74,095,366 | |
MML Small Cap Equity Fund, Initial Class (a) | | | 1,156,985 | | | | 10,726,436 | |
MML Small Cap Growth Equity Fund, Initial Class (a) (b) | | | 1,114,821 | | | | 19,734,713 | |
MML Small Company Value Fund, Class II (a) | | | 1,899,936 | | | | 32,868,896 | |
Oppenheimer Capital Appreciation Fund, Non-Service Shares (a) | | | 552,765 | | | | 22,304,072 | |
Oppenheimer Global Securities Fund, Non-Service Shares (a) | | | 981,811 | | | | 29,748,888 | |
Oppenheimer International Growth Fund, Non-Service Shares (a) | | | 21,349,832 | | | | 39,924,187 | |
Oppenheimer Global Strategic Income Fund, Non-Service Shares (a) | | | 8,700,187 | | | | 48,547,042 | |
| | | | | | | | |
| | | | | | | 1,005,196,525 | |
| | | | | | | | |
| | |
TOTAL MUTUAL FUNDS
(Cost $851,201,089) | | | | | | | 1,005,196,525 | |
| | | | | | | | |
| | | | |
| | | Value | |
| |
TOTAL LONG-TERM INVESTMENTS
(Cost $851,201,089) | | $ | 1,005,196,525 | |
| | | | |
| |
TOTAL INVESTMENTS — 100.1%
(Cost $851,201,089) (c) | | | 1,005,196,525 | |
| |
| Other Assets/(Liabilities) — (0.1)% | | | (552,647 | ) |
| | | | |
| |
| NET ASSETS — 100.0% | | $ | 1,004,643,878 | |
| | | | |
Notes to Portfolio of Investments
| (a) | Affiliated issuer. (See Note 7 for a summary of transactions in the investments of affiliated issuers.) |
| (b) | Non-income producing security. |
| (c) | See Note 6 for aggregate cost for federal tax purposes. |
The accompanying notes are an integral part of the financial statements.
29
MML American Funds Core Allocation Fund – Portfolio of Investments
December 31, 2010
| | | | | | | | |
| | | Number of
Shares | | | Value | |
| MUTUAL FUNDS — 100.1% | | | | | | | | |
| Diversified Financial — 100.1% | | | | | | | | |
American Funds Blue Chip Income and Growth Fund, Class 1 | | | 9,106,614 | | | $ | 84,236,176 | |
American Funds Bond Fund, Class 1 | | | 9,979,826 | | | | 106,484,743 | |
American Funds Growth-Income Fund, Class 1 | | | 2,957,654 | | | | 101,950,330 | |
American Funds International Fund, Class 1 | | | 1,829,175 | | | | 33,016,608 | |
| | | | | | | | |
| | | | | | | 325,687,857 | |
| | | | | | | | |
| | |
TOTAL MUTUAL FUNDS
(Cost $268,503,195) | | | | | | | 325,687,857 | |
| | | | | | | | |
| | |
TOTAL LONG-TERM INVESTMENTS
(Cost $268,503,195) | | | | | | | 325,687,857 | |
| | | | | | | | |
| | |
TOTAL INVESTMENTS — 100.1%
(Cost $268,503,195) (a) | | | | | | | 325,687,857 | |
| | |
| Other Assets/(Liabilities) — (0.1)% | | | | | | | (350,627 | ) |
| | | | | | | | |
| | |
| NET ASSETS — 100.0% | | | | | | $ | 325,337,230 | |
| | | | | | | | |
Notes to Portfolio of Investments
| (a) | See Note 6 for aggregate cost for federal tax purposes. |
The accompanying notes are an integral part of the financial statements.
30
MML American Funds Growth Fund – Portfolio of Investments
December 31, 2010
| | | | | | | | |
| | | Number of
Shares | | | Value | |
| MUTUAL FUNDS — 100.2% | | | | | | | | |
| Diversified Financial — 100.2% | | | | | | | | |
American Funds Growth Fund, Class 1 | | | 690,382 | | | $ | 37,819,128 | |
| | | | | | | | |
| | |
TOTAL MUTUAL FUNDS
(Cost $28,275,302) | | | | | | | 37,819,128 | |
| | | | | | | | |
| | |
TOTAL LONG-TERM INVESTMENTS
(Cost $28,275,302) | | | | | | | 37,819,128 | |
| | | | | | | | |
| | |
TOTAL INVESTMENTS — 100.2%
(Cost $28,275,302) (a) | | | | | | | 37,819,128 | |
| | |
| Other Assets/(Liabilities) — (0.2)% | | | | | | | (58,544 | ) |
| | | | | | | | |
| | |
| NET ASSETS — 100.0% | | | | | | $ | 37,760,584 | |
| | | | | | | | |
Notes to Portfolio of Investments
| (a) | See Note 6 for aggregate cost for federal tax purposes. |
The accompanying notes are an integral part of the financial statements.
31
MML American Funds International Fund – Portfolio of Investments
December 31, 2010
| | | | | | | | |
| | | Number of
Shares | | | Value | |
| MUTUAL FUNDS — 100.2% | | | | | | | | |
| Diversified Financial — 100.2% | | | | | | | | |
American Funds International Fund, Class 1 | | | 1,739,023 | | | $ | 31,389,373 | |
| | | | | | | | |
| | |
TOTAL MUTUAL FUNDS
(Cost $25,039,992) | | | | | | | 31,389,373 | |
| | | | | | | | |
| | |
TOTAL LONG-TERM INVESTMENTS
(Cost $25,039,992) | | | | | | | 31,389,373 | |
| | | | | | | | |
| | |
TOTAL INVESTMENTS — 100.2%
(Cost $25,039,992) (a) | | | | | | | 31,389,373 | |
| | |
| Other Assets/(Liabilities) — (0.2)% | | | | | | | (52,421 | ) |
| | | | | | | | |
| | |
| NET ASSETS — 100.0% | | | | | | $ | 31,336,952 | |
| | | | | | | | |
Notes to Portfolio of Investments
| (a) | See Note 6 for aggregate cost for federal tax purposes. |
The accompanying notes are an integral part of the financial statements.
32
THIS PAGE INTENTIONALLY LEFT BLANK
MML Series Investment Fund – Financial Statements
Statements of Assets and Liabilities
December 31, 2010
| | | | | | | | |
| | | MML
Aggressive
Allocation
Fund | | | MML
Balanced
Allocation
Fund | |
| Assets: | | | | | | | | |
Investments, at value - unaffiliated issuers (Note 2) (a) | | $ | - | | | $ | - | |
Investments, at value - affiliated issuers (Note 7) (b) | | | 64,509,922 | | | | 349,520,238 | |
| | | | | | | | |
Total investments | | | 64,509,922 | | | | 349,520,238 | |
| | | | | | | | |
Receivables from: | | | | | | | | |
Investments sold | | | 1,631 | | | | 10,248 | |
Investment adviser (Note 3) | | | - | | | | - | |
Fund shares sold | | | 145,454 | | | | 3,387 | |
| | | | | | | | |
Total assets | | | 64,657,007 | | | | 349,533,873 | |
| | | | | | | | |
| Liabilities: | | | | | | | | |
Payables for: | | | | | | | | |
Investments purchased | | | 145,454 | | | | 3,387 | |
Fund shares repurchased | | | 1,350 | | | | 8,602 | |
Investment advisory fees | | | 587 | | | | - | |
Trustees’ fees and expenses (Note 3) | | | 4,488 | | | | 23,709 | |
Affiliates (Note 3): | | | | | | | | |
Investment management fees | | | 5,254 | | | | 29,267 | |
Administration fees | | | - | | | | - | |
Service fees | | | 12,923 | | | | 130,926 | |
Accrued expense and other liabilities | | | 30,304 | | | | 34,822 | |
| | | | | | | | |
Total liabilities | | | 200,360 | | | | 230,713 | |
| | | | | | | | |
Net assets | | $ | 64,456,647 | | | $ | 349,303,160 | |
| | | | | | | | |
| Net assets consist of: | | | | | | | | |
Paid-in capital | | $ | 55,942,237 | | | $ | 290,819,538 | |
Undistributed (accumulated) net investment income (loss) | | | 724,566 | | | | 8,867,102 | |
Accumulated net realized gain (loss) on investments and foreign currency transactions | | | (4,120,446 | ) | | | 2,396,663 | |
Net unrealized appreciation (depreciation) on investments and foreign currency translations | | | 11,910,290 | | | | 47,219,857 | |
| | | | | | | | |
Net assets | | $ | 64,456,647 | | | $ | 349,303,160 | |
| | | | | | | | |
| | | | | | | | |
(a) Cost of investments - unaffiliated issuers: | | $ | - | | | $ | - | |
(b) Cost of investments - affiliated issuers: | | $ | 52,599,632 | | | $ | 302,300,381 | |
The accompanying notes are an integral part of the financial statements.
34
| | | | | | | | | | | | | | | | | | | | | | |
MML
Conservative
Allocation
Fund | | | MML
Growth
Allocation
Fund | | | MML
Moderate
Allocation
Fund | | | MML
American
Funds Core
Allocation
Fund | | | MML
American
Funds Growth
Fund | | | MML
American
Funds
International
Fund | |
| | | | | | | | | | | | | | | | | | | | | | |
| $ | - | | | $ | - | | | $ | - | | | $ | 325,687,857 | | | $ | 37,819,128 | | | $ | 31,389,373 | |
| | 298,145,636 | | | | 1,294,154,133 | | | | 1,005,196,525 | | | | - | | | | - | | | | - | |
| | | | | | | | | | | | | | | | | | | | | | | |
| | 298,145,636 | | | | 1,294,154,133 | | | | 1,005,196,525 | | | | 325,687,857 | | | | 37,819,128 | | | | 31,389,373 | |
| | | | | | | | | | | | | | | | | | | | | | | |
| | | | | | | | | | | | | | | | | | | | | | |
| | 7,237 | | | | 101,275 | | | | 161,446 | | | | - | | | | 977,253 | | | | - | |
| | - | | | | - | | | | - | | | | 18,110 | | | | 4,982 | | | | 5,088 | |
| | 535,022 | | | | 158,238 | | | | 1,260,288 | | | | 103,052 | | | | 176 | | | | 509,158 | |
| | | | | | | | | | | | | | | | | | | | | | | |
| | 298,687,895 | | | | 1,294,413,646 | | | | 1,006,618,259 | | | | 325,809,019 | | | | 38,801,539 | | | | 31,903,619 | |
| | | | | | | | | | | | | | | | | | �� | | | | | |
| | | | | | | | | | | | | | | | | | | | | | |
| | | | | | | | | | | | | | | | | | | | | | |
| | 535,023 | | | | 158,238 | | | | 1,260,288 | | | | 97,341 | | | | - | | | | 508,143 | |
| | 5,786 | | | | 95,265 | | | | 156,807 | | | | 4,202 | | | | 977,263 | | | | 873 | |
| | - | | | | - | | | | - | | | | - | | | | - | | | | - | |
| | 18,670 | | | | 89,339 | | | | 65,098 | | | | 18,165 | | | | 1,762 | | | | 1,668 | |
| | | | | | | | | | | | | | | | | | | | | | |
| | 25,197 | | | | 108,189 | | | | 83,637 | | | | 54,366 | | | | 4,733 | | | | 3,789 | |
| | - | | | | - | | | | - | | | | 67,958 | | | | 7,889 | | | | 6,316 | |
| | 121,205 | | | | 450,152 | | | | 365,196 | | | | 195,025 | | | | 21,703 | | | | 18,308 | |
| | 34,108 | | | | 48,662 | | | | 43,355 | | | | 34,732 | | | | 27,605 | | | | 27,570 | |
| | | | | | | | | | | | | | | | | | | | | | | |
| | 739,989 | | | | 949,845 | | | | 1,974,381 | | | | 471,789 | | | | 1,040,955 | | | | 566,667 | |
| | | | | | | | | | | | | | | | | | | | | | | |
| $ | 297,947,906 | | | $ | 1,293,463,801 | | | $ | 1,004,643,878 | | | $ | 325,337,230 | | | $ | 37,760,584 | | | $ | 31,336,952 | |
| | | | | | | | | | | | | | | | | | | | | | | |
| | | | | | | | | | | | | | | | | | | | | | |
| $ | 246,526,936 | | | $ | 1,061,597,657 | | | $ | 837,864,903 | | | $ | 262,459,578 | | | $ | 27,361,714 | | | $ | 24,015,326 | |
| | 8,640,621 | | | | 21,714,038 | | | | 21,333,514 | | | | 5,063,416 | | | | 118,315 | | | | 443,752 | |
| | 14,226,521 | | | | (36,539,889 | ) | | | (8,549,975 | ) | | | 629,574 | | | | 736,729 | | | | 528,493 | |
| | 28,553,828 | | | | 246,691,995 | | | | 153,995,436 | | | | 57,184,662 | | | | 9,543,826 | | | | 6,349,381 | |
| | | | | | | | | | | | | | | | | | | | | | | |
| $ | 297,947,906 | | | $ | 1,293,463,801 | | | $ | 1,004,643,878 | | | $ | 325,337,230 | | | $ | 37,760,584 | | | $ | 31,336,952 | |
| | | | | | | | | | | | | | | | | | | | | | | |
| | | | | | | | | | | | | | | | | | | | | | |
| $ | - | | | $ | - | | | $ | - | | | $ | 268,503,195 | | | $ | 28,275,302 | | | $ | 25,039,992 | |
| $ | 269,591,808 | | | $ | 1,047,462,138 | | | $ | 851,201,089 | | | $ | - | | | $ | - | | | $ | - | |
35
MML Series Investment Fund – Financial Statements (Continued)
Statements of Assets and Liabilities
December 31, 2010
| | | | | | | | |
| | | MML
Aggressive
Allocation
Fund | | | MML
Balanced
Allocation
Fund | |
| Initial Class shares: | | | | | | | | |
Net assets | | $ | 41,787,455 | | | $ | 130,142,382 | |
| | | | | | | | |
Shares outstanding (a) | | | 4,446,137 | | | | 12,585,449 | |
| | | | | | | | |
Net asset value, offering price and redemption price per share | | $ | 9.40 | | | $ | 10.34 | |
| | | | | | | | |
| Service Class shares: | | | | | | | | |
Net assets | | $ | 22,669,192 | | | $ | 219,160,778 | |
| | | | | | | | |
Shares outstanding (a) | | | 2,423,907 | | | | 21,271,016 | |
| | | | | | | | |
Net asset value, offering price and redemption price per share | | $ | 9.35 | | | $ | 10.30 | |
| | | | | | | | |
| Service Class I shares: | | | | | | | | |
Net assets | | $ | - | | | $ | - | |
| | | | | | | | |
Shares outstanding (a) | | | - | | | | - | |
| | | | | | | | |
Net asset value, offering price and redemption price per share | | $ | - | | | $ | - | |
| | | | | | | | |
| (a) | Authorized unlimited number of shares with no par value. |
The accompanying notes are an integral part of the financial statements.
36
| | | | | | | | | | | | | | | | | | | | | | |
MML
Conservative
Allocation
Fund | | | MML
Growth
Allocation
Fund | | | MML
Moderate
Allocation
Fund | | | MML
American
Funds Core
Allocation
Fund | | | MML
American
Funds
Growth
Fund | | | MML
American
Funds
International
Fund | |
| | | | | | | | | | | | | | | | | | | | | | |
| $ | 101,460,645 | | | $ | 538,363,068 | | | $ | 382,041,079 | | | $ | - | | | $ | - | | | $ | - | |
| | | | | | | | | | | | | | | | | | | | | | | |
| | 9,377,763 | | | | 55,243,700 | | | | 37,600,113 | | | | - | | | | - | | | | - | |
| | | | | | | | | | | | | | | | | | | | | | | |
| $ | 10.82 | | | $ | 9.75 | | | $ | 10.16 | | | $ | - | | | $ | - | | | $ | - | |
| | | | | | | | | | | | | | | | | | | | | | | |
| | | | | | | | | | | | | | | | | | | | | | |
| $ | 196,487,261 | | | $ | 755,100,733 | | | $ | 622,602,799 | | | $ | - | | | $ | - | | | $ | - | |
| | | | | | | | | | | | | | | | | | | | | | | |
| | 18,244,034 | | | | 77,774,529 | | | | 61,525,619 | | | | - | | | | - | | | | - | |
| | | | | | | | | | | | | | | | | | | | | | | |
| $ | 10.77 | | | $ | 9.71 | | | $ | 10.12 | | | $ | - | | | $ | - | | | $ | - | |
| | | | | | | | | | | | | | | | | | | | | | | |
| | | | | | | | | | | | | | | | | | | | | | |
| $ | - | | | $ | - | | | $ | - | | | $ | 325,337,230 | | | $ | 37,760,584 | | | $ | 31,336,952 | |
| | | | | | | | | | | | | | | | | | | | | | | |
| | - | | | | - | | | | - | | | | 31,864,035 | | | | 3,658,981 | | | | 3,067,128 | |
| | | | | | | | | | | | | | | | | | | | | | | |
| $ | - | | | $ | - | | | $ | - | | | $ | 10.21 | | | $ | 10.32 | | | $ | 10.22 | |
| | | | | | | | | | | | | | | | | | | | | | | |
37
MML Series Investment Fund – Financial Statements (Continued)
Statements of Operations
For the Year Ended December 31, 2010
| | | | | | | | |
| | | MML
Aggressive
Allocation Fund | | | MML Balanced
Allocation Fund | |
| Investment income (Note 2): | | | | | | | | |
Dividends - unaffiliated issuers | | $ | - | | | $ | - | |
Dividends - affiliated issuers (Note 7) | | | 675,349 | | | | 8,725,895 | |
| | | | | | | | |
Total investment income | | | 675,349 | | | | 8,725,895 | |
| | | | | | | | |
| Expenses (Note 3): | | | | | | | | |
Investment management fees | | | 52,333 | | | | 307,470 | |
Custody fees | | | 13,284 | | | | 13,271 | |
Audit fees | | | 29,078 | | | | 29,167 | |
Legal fees | | | 1,961 | | | | 5,174 | |
Proxy fees | | | 969 | | | | 969 | |
Shareholder reporting fees | | | 4,815 | | | | 15,763 | |
Trustees’ fees | | | 5,129 | | | | 29,918 | |
| | | | | | | | |
| | | 107,569 | | | | 401,732 | |
Administration fees: | | | | | | | | |
Service Class I | | | - | | | | - | |
Service fees: | | | | | | | | |
Service Class | | | 44,263 | | | | 458,781 | |
Service Class I | | | - | | | | - | |
| | | | | | | | |
Total expenses | | | 151,832 | | | | 860,513 | |
Expenses waived (Note 3): | | | | | | | | |
Initial Class fees waived by advisor | | | (1,926 | ) | | | - | |
Service Class fees waived by advisor | | | (977 | ) | | | - | |
Service Class fees I waived by advisor | | | - | | | | - | |
| | | | | | | | |
Net expenses | | | 148,929 | | | | 860,513 | |
| | | | | | | | |
Net investment income (loss) | | | 526,420 | | | | 7,865,382 | |
| | | | | | | | |
| Realized and unrealized gain (loss): | | | | | | | | |
Net realized gain (loss) on: | | | | | | | | |
Investment transactions - unaffiliated issuers | | | - | | | | - | |
Investment transactions - affiliated issuers (Note 7) | | | 1,445,245 | | | | 16,850,075 | |
Realized gain distributions - affiliated issuers (Note 7) | | | 289,482 | | | | 1,224,372 | |
| | | | | | | | |
Net realized gain (loss) | | | 1,734,727 | | | | 18,074,447 | |
| | | | | | | | |
Net change in unrealized appreciation (depreciation) on: | | | | | | | | |
Investment transactions — unaffiliated issuers | | | - | | | | - | |
Investment transactions — affiliated issuers | | | 5,932,252 | | | | 11,762,013 | |
| | | | | | | | |
Net change in unrealized appreciation (depreciation) | | | 5,932,252 | | | | 11,762,013 | |
| | | | | | | | |
Net realized gain (loss) and change in unrealized appreciation (depreciation) | | | 7,666,979 | | | | 29,836,460 | |
| | | | | | | | |
Net increase (decrease) in net assets resulting from operations | | $ | 8,193,399 | | | $ | 37,701,842 | |
| | | | | | | | |
The accompanying notes are an integral part of the financial statements.
38
| | | | | | | | | | | | | | | | | | | | | | |
MML
Conservative
Allocation Fund | | | MML
Growth
Allocation Fund | | | MML
Moderate
Allocation Fund | | | MML
American
Funds Core
Allocation Fund | | | MML
American
Funds
Growth Fund | | | MML
American
Funds
International Fund | |
| | | | | | | | | | | | | | | | | | | | | | |
| $ | - | | | $ | - | | | $ | - | | | $ | 7,082,615 | | | $ | 312,810 | | | $ | 619,452 | |
| | 8,492,811 | | | | 20,575,302 | | | | 20,503,008 | | | | - | | | | - | | | | - | |
| | | | | | | | | | | | | | | | | | | | | | | |
| | 8,492,811 | | | | 20,575,302 | | | | 20,503,008 | | | | 7,082,615 | | | | 312,810 | | | | 619,452 | |
| | | | | | | | | | | | | | | | | | | | | | | |
| | | | | | | | | | | | | | | | | | | | | | |
| | 261,285 | | | | 1,135,376 | | | | 843,626 | | | | 536,616 | | | | 41,545 | | | | 37,518 | |
| | 13,251 | | | | 13,283 | | | | 13,265 | | | | 5,886 | | | | 1,012 | | | | 1,012 | |
| | 29,149 | | | | 29,456 | | | | 29,350 | | | | 29,151 | | | | 29,069 | | | | 29,069 | |
| | 4,632 | | | | 15,714 | | | | 12,107 | | | | 48,829 | | | | 4,344 | | | | 4,073 | |
| | 969 | | | | 969 | | | | 969 | | | | 969 | | | | 969 | | | | 969 | |
| | 13,380 | | | | 51,518 | | | | 37,512 | | | | 42,003 | | | | 6,524 | | | | 6,316 | |
| | 24,781 | | | | 110,738 | | | | 81,005 | | | | 25,425 | | | | 2,514 | | | | 2,346 | |
| | | | | | | | | | | | | | | | | | | | | | | |
| | 347,447 | | | | 1,357,054 | | | | 1,017,834 | | | | 688,879 | | | | 85,977 | | | | 81,303 | |
| | | | | | | | | | | | | | | | | | | | | | |
| | - | | | | - | | | | - | | | | 670,770 | | | | 69,242 | | | | 62,531 | |
| | | | | | | | | | | | | | | | | | | | | | |
| | 417,406 | | | | 1,608,231 | | | | 1,230,087 | | | | - | | | | - | | | | - | |
| | - | | | | - | | | | - | | | | 670,770 | | | | 69,242 | | | | 62,531 | |
| | | | | | | | | | | | | | | | | | | | | | | |
| | 764,853 | | | | 2,965,285 | | | | 2,247,921 | | | | 2,030,419 | | | | 224,461 | | | | 206,365 | |
| | | | | | | | | | | | | | | | | | | | | | |
| | - | | | | - | | | | - | | | | - | | | | - | | | | - | |
| | - | | | | - | | | | - | | | | - | | | | - | | | | - | |
| | - | | | | - | | | | - | | | | (18,110 | ) | | | (30,583 | ) | | | (31,279 | ) |
| | | | | | | | | | | | | | | | | | | | | | | |
| | 764,853 | | | | 2,965,285 | | | | 2,247,921 | | | | 2,012,309 | | | | 193,878 | | | | 175,086 | |
| | | | | | | | | | | | | | | | | | | | | | | |
| | 7,727,958 | | | | 17,610,017 | | | | 18,255,087 | | | | 5,070,306 | | | | 118,932 | | | | 444,366 | |
| | | | | | | | | | | | | | | | | | | | | | | |
| | | | | | | | | | | | | | | | | | | | | | |
| | | | | | | | | | | | | | | | | | | | | | |
| | - | | | | - | | | | - | | | | 1,255,534 | | | | 897,169 | | | | 654,261 | |
| | 16,652,106 | | | | 45,861,133 | | | | 34,013,237 | | | | - | | | | - | | | | - | |
| | 1,097,051 | | | | 5,652,054 | | | | 4,003,695 | | | | - | | | | - | | | | - | |
| | | | | | | | | | | | | | | | | | | | | | | |
| | 17,749,157 | | | | 51,513,187 | | | | 38,016,932 | | | | 1,255,534 | | | | 897,169 | | | | 654,261 | |
| | | | | | | | | | | | | | | | | | | | | | | |
| | | | | | | | | | | | | | | | | | | | | | |
| | - | | | | - | | | | - | | | | 19,550,727 | | | | 4,417,905 | | | | 1,113,355 | |
| | 4,787,264 | | | | 90,642,751 | | | | 54,418,518 | | | | - | | | | - | | | | - | |
| | | | | | | | | | | | | | | | | | | | | | | |
| | 4,787,264 | | | | 90,642,751 | | | | 54,418,518 | | | | 19,550,727 | | | | 4,417,905 | | | | 1,113,355 | |
| | | | | | | | | | | | | | | | | | | | | | | |
| | 22,536,421 | | | | 142,155,938 | | | | 92,435,450 | | | | 20,806,261 | | | | 5,315,074 | | | | 1,767,616 | |
| | | | | | | | | | | | | | | | | | | | | | | |
| $ | 30,264,379 | | | $ | 159,765,955 | | | $ | 110,690,537 | | | $ | 25,876,567 | | | $ | 5,434,006 | | | $ | 2,211,982 | |
| | | | | | | | | | | | | | | | | | | | | | | |
39
MML Series Investment Fund – Financial Statements (Continued)
Statements of Changes in Net Assets
| | | | | | | | |
| | | MML Aggressive Allocation Fund | |
| | | Year
Ended
December 31, 2010 | | | Year
Ended
December 31, 2009 | |
Increase (Decrease) in Net Assets: | | | | | | | | |
Operations: | | | | | | | | |
Net investment income (loss) | | $ | 526,420 | | | $ | 491,336 | |
Net realized gain (loss) on investment transactions | | | 1,734,727 | | | | (4,997,125 | ) |
Net change in unrealized appreciation (depreciation) on investments | | | 5,932,252 | | | | 16,773,725 | |
| | | | | | | | |
Net increase (decrease) in net assets resulting from operations | | | 8,193,399 | | | | 12,267,936 | |
| | | | | | | | |
Distributions to shareholders (Note 2): | | | | | | | | |
From net investment income: | | | | | | | | |
Initial Class | | | (387,367 | ) | | | (73,956 | ) |
Service Class | | | (182,480 | ) | | | (27,035 | ) |
| | | | | | | | |
Total distributions from net investment income | | | (569,847 | ) | | | (100,991 | ) |
| | | | | | | | |
From net realized gains: | | | | | | | | |
Initial Class | | | - | | | | (93,482 | ) |
Service Class | | | - | | | | (35,493 | ) |
| | | | | | | | |
Total distributions from net realized gains | | | - | | | | (128,975 | ) |
| | | | | | | | |
Net fund share transactions (Note 5): | | | | | | | | |
Initial Class | | | 2,805,957 | | | | 1,024,449 | |
Service Class | | | 5,030,076 | | | | 7,504,641 | |
| | | | | | | | |
Increase (decrease) in net assets from fund share transactions | | | 7,836,033 | | | | 8,529,090 | |
| | | | | | | | |
Total increase (decrease) in net assets | | | 15,459,585 | | | | 20,567,060 | |
Net assets | | | | | | | | |
Beginning of year | | | 48,997,062 | | | | 28,430,002 | |
| | | | | | | | |
End of year | | $ | 64,456,647 | | | $ | 48,997,062 | |
| | | | | | | | |
Undistributed (accumulated) net investment income (loss) included in net assets at
end of year | | $ | 724,566 | | | $ | 567,545 | |
| | | | | | | | |
The accompanying notes are an integral part of the financial statements.
40
| | | | | | | | | | | | | | | | | | | | | | |
| MML Balanced Allocation Fund | | | MML Conservative Allocation Fund | | | MML Growth Allocation Fund | |
Year
Ended
December 31, 2010 | | | Year
Ended
December 31, 2009 | | | Year
Ended
December 31, 2010 | | | Year
Ended
December 31, 2009 | | | Year
Ended
December 31, 2010 | | | Year
Ended
December 31, 2009 | |
| | | | | | | | | | | | | | | | | | | | | | |
| | | | | | | | | | | | | | | | | | | | | | |
| $ | 7,865,382 | | | $ | 3,688,932 | | | $ | 7,727,958 | | | $ | 3,251,721 | | | $ | 17,610,017 | | | $ | 11,446,844 | |
| | 18,074,447 | | | | (12,393,899 | ) | | | 17,749,157 | | | | (1,183,186 | ) | | | 51,513,187 | | | | (77,544,556 | ) |
| | 11,762,013 | | | | 57,697,293 | | | | 4,787,264 | | | | 32,142,579 | | | | 90,642,751 | | | | 289,878,914 | |
| | | | | | | | | | | | | | | | | | | | | | | |
| | 37,701,842 | | | | 48,992,326 | | | | 30,264,379 | | | | 34,211,114 | | | | 159,765,955 | | | | 223,781,202 | |
| | | | | | | | | | | | | | | | | | | | | | | |
| | | | | | | | | | | | | | | | | | | | | | |
| | | | | | | | | | | | | | | | | | | | | | |
| | (1,767,853 | ) | | | (651,524 | ) | | | (1,404,894 | ) | | | (440,055 | ) | | | (5,749,187 | ) | | | (1,572,165 | ) |
| | (2,405,318 | ) | | | (778,602 | ) | | | (2,292,849 | ) | | | (585,099 | ) | | | (6,722,526 | ) | | | (1,654,924 | ) |
| | | | | | | | | | | | | | | | | | | | | | | |
| | (4,173,171 | ) | | | (1,430,126 | ) | | | (3,697,743 | ) | | | (1,025,154 | ) | | | (12,471,713 | ) | | | (3,227,089 | ) |
| | | | | | | | | | | | | | | | | | | | | | | |
| | | | | | | | | | | | | | | | | | | | | | |
| | - | | | | (94,907 | ) | | | - | | | | (60,928 | ) | | | - | | | | (546,541 | ) |
| | - | | | | (115,508 | ) | | | - | | | | (82,478 | ) | | | - | | | | (593,326 | ) |
| | | | | | | | | | | | | | | | | | | | | | | |
| | - | | | | (210,415 | ) | | | - | | | | (143,406 | ) | | | - | | | | (1,139,867 | ) |
| | | | | | | | | | | | | | | | | | | | | | | |
| | | | | | | | | | | | | | | | | | | | | | |
| | (4,294,838 | ) | | | 11,054,596 | | | | 8,104,290 | | | | 16,592,868 | | | | 4,415,589 | | | | 11,674,517 | |
| | 37,830,043 | | | | 85,964,149 | | | | 35,919,045 | | | | 86,452,720 | | | | 112,068,154 | | | | 259,601,068 | |
| | | | | | | | | | | | | | | | | | | | | | | |
| | 33,535,205 | | | | 97,018,745 | | | | 44,023,335 | | | | 103,045,588 | | | | 116,483,743 | | | | 271,275,585 | |
| | | | | | | | | | | | | | | | | | | | | | | |
| | 67,063,876 | | | | 144,370,530 | | | | 70,589,971 | | | | 136,088,142 | | | | 263,777,985 | | | | 490,689,831 | |
| | | | | | | | | | | | | | | | | | | | | | |
| | 282,239,284 | | | | 137,868,754 | | | | 227,357,935 | | | | 91,269,793 | | | | 1,029,685,816 | | | | 538,995,985 | |
| | | | | | | | | | | | | | | | | | | | | | | |
| $ | 349,303,160 | | | $ | 282,239,284 | | | $ | 297,947,906 | | | $ | 227,357,935 | | | $ | 1,293,463,801 | | | $ | 1,029,685,816 | |
| | | | | | | | | | | | | | | | | | | | | | | |
$ | 8,867,102 | | | $ | 4,162,389 | | | $ | 8,640,621 | | | $ | 3,690,114 | | | $ | 21,714,038 | | | $ | 12,430,188 | |
| | | | | | | | | | | | | | | | | | | | | | | |
41
MML Series Investment Fund – Financial Statements (Continued)
Statements of Changes in Net Assets
| | | | | | | | |
| | |
MML Moderate Allocation Fund | |
| | | Year
Ended
December 31, 2010 | | | Year
Ended
December 31, 2009 | |
Increase (Decrease) in Net Assets: | | | | | | | | |
Operations: | | | | | | | | |
Net investment income (loss) | | $ | 18,255,087 | | | $ | 9,470,167 | |
Net realized gain (loss) on investment transactions | | | 38,016,932 | | | | (37,606,218 | ) |
Net change in unrealized appreciation (depreciation) on investments | | | 54,418,518 | | | | 171,532,071 | |
| | | | | | | | |
Net increase (decrease) in net assets resulting from operations | | | 110,690,537 | | | | 143,396,020 | |
| | | | | | | | |
Distributions to shareholders (Note 2): | | | | | | | | |
From net investment income: | | | | | | | | |
Initial Class | | | (4,728,753 | ) | | | (1,734,059 | ) |
Service Class | | | (6,181,945 | ) | | | (1,905,319 | ) |
Service Class I | | | - | | | | - | |
| | | | | | | | |
Total distributions from net investment income | | | (10,910,698 | ) | | | (3,639,378 | ) |
| | | | | | | | |
From net realized gains: | | | | | | | | |
Initial Class | | | - | | | | (310,541 | ) |
Service Class | | | - | | | | (348,797 | ) |
Service Class I | | | - | | | | - | |
| | | | | | | | |
Total distributions from net realized gains | | | - | | | | (659,338 | ) |
| | | | | | | | |
Net fund share transactions (Note 5): | | | | | | | | |
Initial Class | | | 9,837,225 | | | | 15,015,228 | |
Service Class | | | 160,190,490 | | | | 182,266,054 | |
Service Class I | | | - | | | | - | |
| | | | | | | | |
Increase (decrease) in net assets from fund share transactions | | | 170,027,715 | | | | 197,281,282 | |
| | | | | | | | |
Total increase (decrease) in net assets | | | 269,807,554 | | | | 336,378,586 | |
Net assets | | | | | | | | |
Beginning of year | | | 734,836,324 | | | | 398,457,738 | |
| | | | | | | | |
End of year | | $ | 1,004,643,878 | | | $ | 734,836,324 | |
| | | | | | | | |
Undistributed (accumulated) net investment income (loss) included in net assets at
end of year | | $ | 21,333,514 | | | $ | 10,880,970 | |
| | | | | | | | |
The accompanying notes are an integral part of the financial statements.
42
| | | | | | | | | | | | | | | | | | | | | | |
MML American Funds
Core Allocation Fund | | | MML American Funds
Growth Fund | | | MML American Funds
International Fund | |
Year
Ended
December 31, 2010 | | | Year
Ended
December 31, 2009 | | | Year
Ended
December 31, 2010 | | | Year
Ended
December 31, 2009 | | | Year
Ended
December 31, 2010 | | | Year
Ended
December 31, 2009 | |
| | | | | | | | | | | | | | | | | | | | | | |
| | | | | | | | | | | | | | | | | | | | | | |
| $ | 5,070,306 | | | $ | 3,730,659 | | | $ | 118,932 | | | $ | 56,180 | | | $ | 444,366 | | | $ | 211,195 | |
| | 1,255,534 | | | | 1,470,818 | | | | 897,169 | | | | 51,156 | | | | 654,261 | | | | 309,253 | |
| | 19,550,727 | | | | 38,813,208 | | | | 4,417,905 | | | | 5,241,052 | | | | 1,113,355 | | | | 5,199,420 | |
| | | | | | | | | | | | | | | | | | | | | | | |
| | 25,876,567 | | | | 44,014,685 | | | | 5,434,006 | | | | 5,348,388 | | | | 2,211,982 | | | | 5,719,868 | |
| | | | | | | | | | | | | | | | | | | | | | | |
| | | | | | | | | | | | | | | | | | | | | | |
| | | | | | | | | | | | | | | | | | | | | | |
| | - | | | | - | | | | - | | | | - | | | | - | | | | - | |
| | - | | | | - | | | | - | | | | - | | | | - | | | | - | |
| | (3,737,015 | ) | | | (1,842,885 | ) | | | (56,747 | ) | | | (63,512 | ) | | | (211,760 | ) | | | (140,703 | ) |
| | | | | | | | | | | | | | | | | | | | | | | |
| | (3,737,015 | ) | | | (1,842,885 | ) | | | (56,747 | ) | | | (63,512 | ) | | | (211,760 | ) | | | (140,703 | ) |
| | | | | | | | | | | | | | | | | | | | | | | |
| | | | | | | | | | | | | | | | | | | | | | |
| | - | | | | - | | | | - | | | | - | | | | - | | | | - | |
| | - | | | | - | | | | - | | | | - | | | | - | | | | - | |
| | (2,035,695 | ) | | | - | | | | (148,992 | ) | | | - | | | | (361,073 | ) | | | - | |
| | | | | | | | | | | | | | | | | | | | | | | |
| | (2,035,695 | ) | | | - | | | | (148,992 | ) | | | - | | | | (361,073 | ) | | | - | |
| | | | | | | | | | | | | | | | | | | | | | | |
| | | | | | | | | | | | | | | | | | | | | | |
| | - | | | | - | | | | - | | | | - | | | | - | | | | - | |
| | - | | | | - | | | | - | | | | - | | | | - | | | | - | |
| | 74,225,408 | | | | 120,962,490 | | | | 10,401,961 | | | | 10,765,687 | | | | 8,390,278 | | | | 9,318,714 | |
| | | | | | | | | | | | | | | | | | | | | | | |
| | 74,225,408 | | | | 120,962,490 | | | | 10,401,961 | | | | 10,765,687 | | | | 8,390,278 | | | | 9,318,714 | |
| | | | | | | | | | | | | | | | | | | | | | | |
| | 94,329,265 | | | | 163,134,290 | | | | 15,630,228 | | | | 16,050,563 | | | | 10,029,427 | | | | 14,897,879 | |
| | | | | | | | | | | | | | | | | | | | | | |
| | 231,007,965 | | | | 67,873,675 | | | | 22,130,356 | | | | 6,079,793 | | | | 21,307,525 | | | | 6,409,646 | |
| | | | | | | | | | | | | | | | | | | | | | | |
| $ | 325,337,230 | | | $ | 231,007,965 | | | $ | 37,760,584 | | | $ | 22,130,356 | | | $ | 31,336,952 | | | $ | 21,307,525 | |
| | | | | | | | | | | | | | | | | | | | | | | |
$ | 5,063,416 | | | $ | 3,730,139 | | | $ | 118,315 | | | $ | 56,130 | | | $ | 443,752 | | | $ | 211,146 | |
| | | | | | | | | | | | | | | | | | | | | | | |
43
MML Series Investment Fund – Financial Highlights
(For a share outstanding throughout each period)
MML Aggressive Allocation Fund
| | | | | | | | | | | | | | | | |
| | | Initial Class | |
| | | Year
Ended
12/31/10 | | | Year
Ended
12/31/09 | | | Year
Ended
12/31/08 | | | Period
Ended
12/31/07 ++ | |
Net asset value, beginning of period | | $ | 8.20 | | | $ | 6.15 | | | $ | 9.99 | | | $ | 10.00 | |
| | | | | | | | | | | | | | | | |
Income (loss) from investment operations: | | | | | | | | | | | | | | | | |
Net investment income (loss) *** | | | 0.09 | | | | 0.09 | | | | 0.04 | | | | 0.06 | |
Net realized and unrealized gain (loss) on investments | | | 1.21 | | | | 2.00 | | | | (3.88 | ) | | | 0.16 | |
| | | | | | | | | | | | | | | | |
Total income (loss) from investment operations | | | 1.30 | | | | 2.09 | | | | (3.84 | ) | | | 0.22 | |
| | | | | | | | | | | | | | | | |
Less distributions to shareholders: | | | | | | | | | | | | | | | | |
From net investment income | | | (0.10 | ) | | | (0.02 | ) | | | - | | | | (0.23 | ) |
From net realized gains | | | - | | | | (0.02 | ) | | | (0.00 | ) † | | | - | |
| | | | | | | | | | | | | | | | |
Total distributions | | | (0.10 | ) | | | (0.04 | ) | | | (0.00 | ) † | | | (0.23 | ) |
| | | | | | | | | | | | | | | | |
Net asset value, end of period | | $ | 9.40 | | | $ | 8.20 | | | $ | 6.15 | | | $ | 9.99 | |
| | | | | | | | | | | | | | | | |
Total Return ^^ | | | 16.05% | | | | 34.04% | | | | (38.43% | ) | | | 2.15% | ** |
| | | | |
Ratios / Supplemental Data: | | | | | | | | | | | | | | | | |
Net assets, end of period (000’s) | | $ | 41,787 | | | $ | 33,931 | | | $ | 24,477 | | | $ | 153 | |
Ratio of expenses to average daily net assets: ! | | | | | | | | | | | | | | | | |
Before expense waiver | | | 0.21% | | | | 0.24% | | | | 0.40% | | | | 61.22% | * |
After expense waiver | | | 0.20% | # | | | 0.20% | # | | | 0.20% | # | | | 0.20% | *# |
Net investment income (loss) to average daily net assets | | | 1.08% | | | | 1.34% | | | | 0.46% | | | | 1.85% | * |
Portfolio turnover rate !! | | | 42% | | | | 38% | | | | 18% | | | | 0% | ** |
| | |
| | | Service Class | | | | |
| | | Year
Ended
12/31/10 | | | Year
Ended
12/31/09 | | | Period
Ended
12/31/08 +++ | | | | |
Net asset value, beginning of period | | $ | 8.16 | | | $ | 6.14 | | | $ | 8.98 | | | | | |
| | | | | | | | | | | | | | | | |
Income (loss) from investment operations: | | | | | | | | | | | | | | | | |
Net investment income (loss) *** | | | 0.07 | | | | 0.08 | | | | (0.01 | ) | | | | |
Net realized and unrealized gain (loss) on investments | | | 1.20 | | | | 1.98 | | | | (2.83 | ) | | | | |
| | | | | | | | | | | | | | | | |
Total income (loss) from investment operations | | | 1.27 | | | | 2.06 | | | | (2.84 | ) | | | | |
| | | | | | | | | | | | | | | | |
Less distributions to shareholders: | | | | | | | | | | | | | | | | |
From net investment income | | | (0.08 | ) | | | (0.02 | ) | | | - | | | | | |
From net realized gains | | | - | | | | (0.02 | ) | | | (0.00 | ) † | | | | |
| | | | | | | | | | | | | | | | |
Total distributions | | | (0.08 | ) | | | (0.04 | ) | | | (0.00 | ) † | | | | |
| | | | | | | | | | | | | | | | |
Net asset value, end of period | | $ | 9.35 | | | $ | 8.16 | | | $ | 6.14 | | | | | |
| | | | | | | | | | | | | | | | |
Total Return ^^ | | | 15.83% | | | | 33.60% | | | | (31.62% | ) ** | | | | |
| | | | |
Ratios / Supplemental Data: | | | | | | | | | | | | | | | | |
Net assets, end of period (000’s) | | $ | 22,669 | | | $ | 15,066 | | | $ | 3,953 | | | | | |
Ratio of expenses to average daily net assets: ! | | | | | | | | | | | | | | | | |
Before expense waiver | | | 0.46% | | | | 0.49% | | | | 0.63% | * | | | | |
After expense waiver | | | 0.45% | # | | | 0.45% | # | | | 0.45% | *# | | | | |
Net investment income (loss) to average daily net assets | | | 0.86% | | | | 1.11% | | | | (0.27% | ) * | | | | |
Portfolio turnover rate !! | | | 42% | | | | 38% | | | | 18% | ~ | | | | |
| ** | Percentage represents the results for the period and is not annualized. |
| *** | Per share amount calculated on the average shares method. |
| † | Amount is less than $0.005 per share. |
| ++ | For the period August 31, 2007 (commencement of operations) through December 31, 2007. |
| +++ | For the period August 15, 2008 (commencement of operations) through December 31, 2008. |
| # | Computed after giving effect to an agreement by MassMutual to waive certain fees and expenses of the Fund. |
| ^^ | Total return does not reflect expenses that apply at the separate account level or to related insurance products. Inclusion of these charges would reduce the total return figures for all periods shown. |
| ~ | The portfolio turnover rate results are for the Fund. |
| ! | Expenses of the underlying funds are not included in the Fund’s expense ratio. The Fund indirectly bears its proportionate share of the expenses of any underlying fund. |
| !! | Amount does not include the portfolio activity of any underlying fund. |
The accompanying notes are an integral part of the financial statements.
44
MML Series Investment Fund – Financial Highlights (Continued)
(For a share outstanding throughout each period)
MML Balanced Allocation Fund
| | | | | | | | | | | | | | | | |
| | | Initial Class | |
| | | Year
Ended
12/31/10 | | | Year
Ended
12/31/09 | | | Year
Ended
12/31/08 | | | Period
Ended
12/31/07 ++ | |
Net asset value, beginning of period | | $ | 9.31 | | | $ | 7.59 | | | $ | 10.08 | | | $ | 10.00 | |
| | | | | | | | | | | | | | | | |
Income (loss) from investment operations: | | | | | | | | | | | | | | | | |
Net investment income (loss) *** | | | 0.26 | | | | 0.15 | | | | 0.21 | | | | 0.11 | |
Net realized and unrealized gain (loss) on investments | | | 0.91 | | | | 1.63 | | | | (2.70 | ) | | | 0.19 | |
| | | | | | | | | | | | | | | | |
Total income (loss) from investment operations | | | 1.17 | | | | 1.78 | | | | (2.49 | ) | | | 0.30 | |
| | | | | | | | | | | | | | | | |
Less distributions to shareholders: | | | | | | | | | | | | | | | | |
From net investment income | | | (0.14 | ) | | | (0.05 | ) | | | - | | | | (0.22 | ) |
From net realized gains | | | - | | | | (0.01 | ) | | | (0.00 | ) † | | | - | |
| | | | | | | | | | | | | | | | |
Total distributions | | | (0.14 | ) | | | (0.06 | ) | | | (0.00 | ) † | | | (0.22 | ) |
| | | | | | | | | | | | | | | | |
Net asset value, end of period | | $ | 10.34 | | | $ | 9.31 | | | $ | 7.59 | | | $ | 10.08 | |
| | | | | | | | | | | | | | | | |
Total Return ^^ | | | 12.73% | | | | 23.50% | | | | (24.70% | ) | | | 2.96% | ** |
| | | | |
Ratios / Supplemental Data: | | | | | | | | | | | | | | | | |
Net assets, end of period (000’s) | | $ | 130,142 | | | $ | 120,940 | | | $ | 88,583 | | | $ | 154 | |
Ratio of expenses to average daily net assets: ! | | | | | | | | | | | | | | | | |
Before expense waiver | | | 0.13% | | | | 0.14% | | | | 0.20% | | | | 61.68% | * |
After expense waiver | | | N/A | | | | N/A | | | | 0.20% | ## | | | 0.20% | *# |
Net investment income (loss) to average daily net assets | | | 2.71% | | | | 1.83% | | | | 2.43% | | | | 3.23% | * |
Portfolio turnover rate !! | | | 39% | | | | 42% | | | | 21% | | | | 0% | ** |
| | |
| | | Service Class | | | | |
| | | Year
Ended
12/31/10 | | | Year
Ended
12/31/09 | | | Period
Ended
12/31/08 +++ | | | | |
Net asset value, beginning of period | | $ | 9.28 | | | $ | 7.59 | | | $ | 9.60 | | | | | |
| | | | | | | | | | | | | | | | |
Income (loss) from investment operations: | | | | | | | | | | | | | | | | |
Net investment income (loss) *** | | | 0.24 | | | | 0.14 | | | | 0.02 | | | | | |
Net realized and unrealized gain (loss) on investments | | | 0.91 | | | | 1.61 | | | | (2.03 | ) | | | | |
| | | | | | | | | | | | | | | | |
Total income (loss) from investment operations | | | 1.15 | | | | 1.75 | | | | (2.01 | ) | | | | |
| | | | | | | | | | | | | | | | |
Less distributions to shareholders: | | | | | | | | | | | | | | | | |
From net investment income | | | (0.13 | ) | | | (0.05 | ) | | | - | | | | | |
From net realized gains | | | - | | | | (0.01 | ) | | | (0.00 | ) † | | | | |
| | | | | | | | | | | | | | | | |
Total distributions | | | (0.13 | ) | | | (0.06 | ) | | | (0.00 | ) † | | | | |
| | | | | | | | | | | | | | | | |
Net asset value, end of period | | $ | 10.30 | | | $ | 9.28 | | | $ | 7.59 | | | | | |
| | | | | | | | | | | | | | | | |
Total Return ^^ | | | 12.49% | | | | 23.09% | | | | (20.94% | ) ** | | | | |
| | | | |
Ratios / Supplemental Data: | | | | | | | | | | | | | | | | |
Net assets, end of period (000’s) | | $ | 219,161 | | | $ | 161,300 | | | $ | 49,286 | | | | | |
Ratio of expenses to average daily net assets: ! | | | | | | | | | | | | | | | | |
Before expense waiver | | | 0.38% | | | | 0.39% | | | | 0.47% | * | | | | |
After expense waiver | | | N/A | | | | N/A | | | | 0.45% | *# | | | | |
Net investment income (loss) to average daily net assets | | | 2.46% | | | | 1.65% | | | | 0.87% | * | | | | |
Portfolio turnover rate !! | | | 39% | | | | 42% | | | | 21% | ~ | | | | |
| ** | Percentage represents the results for the period and is not annualized. |
| *** | Per share amount calculated on the average shares method. |
| † | Amount is less than $0.005 per share. |
| ++ | For the period August 31, 2007 (commencement of operations) through December 31, 2007. |
| +++ | For the period August 15, 2008 (commencement of operations) through December 31, 2008. |
| # | Computed after giving effect to an agreement by MassMutual to waive certain fees and expenses of the Fund. |
| ## | Amount waived had no impact on the ratio of expenses to average daily net assets. |
| ^^ | Total return does not reflect expenses that apply at the separate account level or to related insurance products. Inclusion of these charges would reduce the total return figures for all periods shown. |
| ~ | The portfolio turnover rate results are for the Fund. |
| ! | Expenses of the underlying funds are not included in the Fund’s expense ratio. The Fund indirectly bears its proportionate share of the expenses of any underlying fund. |
| !! | Amount does not include the portfolio activity of any underlying fund. |
The accompanying notes are an integral part of the financial statements.
45
MML Series Investment Fund – Financial Highlights (Continued)
(For a share outstanding throughout each period)
MML Conservative Allocation Fund
| | | | | | | | | | | | | | | | |
| | | Initial Class | |
| | | Year
Ended
12/31/10 | | | Year
Ended
12/31/09 | | | Year
Ended
12/31/08 | | | Period
Ended
12/31/07 ++ | |
Net asset value, beginning of period | | $ | 9.81 | | | $ | 8.15 | | | $ | 10.11 | | | $ | 10.00 | |
| | | | | | | | | | | | | | | | |
Income (loss) from investment operations: | | | | | | | | | | | | | | | | |
Net investment income (loss) *** | | | 0.32 | | | | 0.19 | | | | 0.28 | | | | 0.13 | |
Net realized and unrealized gain (loss) on investments | | | 0.84 | | | | 1.53 | | | | (2.24 | ) | | | 0.18 | |
| | | | | | | | | | | | | | | | |
Total income (loss) from investment operations | | | 1.16 | | | | 1.72 | | | | (1.96 | ) | | | 0.31 | |
| | | | | | | | | | | | | | | | |
Less distributions to shareholders: | | | | | | | | | | | | | | | | |
From net investment income | | | (0.15 | ) | | | (0.05 | ) | | | (0.00 | ) † | | | (0.20 | ) |
From net realized gains | | | - | | | | (0.01 | ) | | | (0.00 | ) † | | | - | |
| | | | | | | | | | | | | | | | |
Total distributions | | | (0.15 | ) | | | (0.06 | ) | | | (0.00 | ) † | | | (0.20 | ) |
| | | | | | | | | | | | | | | | |
Net asset value, end of period | | $ | 10.82 | | | $ | 9.81 | | | $ | 8.15 | | | $ | 10.11 | |
| | | | | | | | | | | | | | | | |
Total Return ^^ | | | 11.91% | | | | 21.15% | | | | (19.38% | ) | | | 3.09% | ** |
| | | | |
Ratios / Supplemental Data: | | | | | | | | | | | | | | | | |
Net assets, end of period (000’s) | | $ | 101,461 | | | $ | 83,810 | | | $ | 52,819 | | | $ | 155 | |
Ratio of expenses to average daily net assets: ! | | | | | | | | | | | | | | | | |
Before expense waiver | | | 0.13% | | | | 0.15% | | | | 0.27% | | | | 61.88% | * |
After expense waiver | | | N/A | | | | N/A | | | | 0.20% | # | | | 0.20% | *# |
Net investment income (loss) to average daily net assets | | | 3.12% | | | | 2.11% | | | | 3.06% | | | | 3.81% | * |
Portfolio turnover rate !! | | | 44% | | | | 47% | | | | 37% | | | | 0% | ** |
| | |
| | | Service Class | | | | |
| | | Year
Ended
12/31/10 | | | Year
Ended
12/31/09 | | | Period
Ended
12/31/08 +++ | | | | |
Net asset value, beginning of period | | $ | 9.78 | | | $ | 8.14 | | | $ | 9.79 | | | | | |
| | | | | | | | | | | | | | | | |
Income (loss) from investment operations: | | | | | | | | | | | | | | | | |
Net investment income (loss) *** | | | 0.29 | | | | 0.18 | | | | 0.05 | | | | | |
Net realized and unrealized gain (loss) on investments | | | 0.83 | | | | 1.52 | | | | (1.70 | ) | | | | |
| | | | | | | | | | | | | | | | |
Total income (loss) from investment operations | | | 1.12 | | | | 1.70 | | | | (1.65 | ) | | | | |
| | | | | | | | | | | | | | | | |
Less distributions to shareholders: | | | | | | | | | | | | | | | | |
From net investment income | | | (0.13 | ) | | | (0.05 | ) | | | (0.00 | ) † | | | | |
From net realized gains | | | - | | | | (0.01 | ) | | | (0.00 | ) † | | | | |
| | | | | | | | | | | | | | | | |
Total distributions | | | (0.13 | ) | | | (0.06 | ) | | | (0.00 | ) † | | | | |
| | | | | | | | | | | | | | | | |
Net asset value, end of period | | $ | 10.77 | | | $ | 9.78 | | | $ | 8.14 | | | | | |
| | | | | | | | | | | | | | | | |
Total Return ^^ | | | 11.59% | | | | 20.91% | | | | (16.85% | ) ** | | | | |
| | | | |
Ratios / Supplemental Data: | | | | | | | | | | | | | | | | |
Net assets, end of period (000’s) | | $ | 196,487 | | | $ | 143,548 | | | $ | 38,451 | | | | | |
Ratio of expenses to average daily net assets: ! | | | | | | | | | | | | | | | | |
Before expense waiver | | | 0.38% | | | | 0.40% | | | | 0.49% | * | | | | |
After expense waiver | | | N/A | | | | N/A | | | | 0.45% | *# | | | | |
Net investment income (loss) to average daily net assets | | | 2.87% | | | | 1.96% | | | | 1.62% | * | | | | |
Portfolio turnover rate !! | | | 44% | | | | 47% | | | | 37% | ~ | | | | |
| ** | Percentage represents the results for the period and is not annualized. |
| *** | Per share amount calculated on the average shares method. |
| † | Amount is less than $0.005 per share. |
| ++ | For the period August 31, 2007 (commencement of operations) through December 31, 2007. |
| +++ | For the period August 15, 2008 (commencement of operations) through December 31, 2008. |
| # | Computed after giving effect to an agreement by MassMutual to waive certain fees and expenses of the Fund. |
| ^^ | Total return does not reflect expenses that apply at the separate account level or to related insurance products. Inclusion of these charges would reduce the total return figures for all periods shown. |
| ~ | The portfolio turnover rate results are for the Fund. |
| ! | Expenses of the underlying funds are not included in the Fund’s expense ratio. The Fund indirectly bears its proportionate share of the expenses of any underlying fund. |
| !! | Amount does not include the portfolio activity of any underlying fund. |
The accompanying notes are an integral part of the financial statements.
46
MML Series Investment Fund – Financial Highlights (Continued)
(For a share outstanding throughout each period)
MML Growth Allocation Fund
| | | | | | | | | | | | | | | | |
| | | Initial Class | |
| | | Year
Ended
12/31/10 | | | Year
Ended
12/31/09 | | | Year Ended
12/31/08 | | | Period
Ended
12/31/07 ++ | |
Net asset value, beginning of period | | $ | 8.59 | | | $ | 6.66 | | | $ | 10.02 | | | $ | 10.00 | |
| | | | | | | | | | | | | | | | |
Income (loss) from investment operations: | | | | | | | | | | | | | | | | |
Net investment income (loss) *** | | | 0.15 | | | | 0.12 | | | | 0.10 | | | | 0.08 | |
Net realized and unrealized gain (loss) on investments | | | 1.11 | | | | 1.85 | | | | (3.46 | ) | | | 0.17 | |
| | | | | | | | | | | | | | | | |
Total income (loss) from investment operations | | | 1.26 | | | | 1.97 | | | | (3.36 | ) | | | 0.25 | |
| | | | | | | | | | | | | | | | |
Less distributions to shareholders: | | | | | | | | | | | | | | | | |
From net investment income | | | (0.10 | ) | | | (0.03 | ) | | | - | | | | (0.23 | ) |
From net realized gains | | | - | | | | (0.01 | ) | | | (0.00 | ) † | | | - | |
| | | | | | | | | | | | | | | | |
Total distributions | | | (0.10 | ) | | | (0.04 | ) | | | (0.00 | ) † | | | (0.23 | ) |
| | | | | | | | | | | | | | | | |
Net asset value, end of period | | $ | 9.75 | | | $ | 8.59 | | | $ | 6.66 | | | $ | 10.02 | |
| | | | | | | | | | | | | | | | |
Total Return ^^ | | | 14.92% | | | | 29.61% | | | | (33.53% | ) | | | 2.45% | ** |
| | | | |
Ratios / Supplemental Data: | | | | | | | | | | | | | | | | |
Net assets, end of period (000’s) | | $ | 538,363 | | | $ | 470,601 | | | $ | 354,595 | | | $ | 154 | |
Ratio of expenses to average daily net assets: ! | | | | | | | | | | | | | | | | |
Before expense waiver | | | 0.12% | | | | 0.12% | | �� | | 0.13% | | | | 61.40% | * |
After expense waiver | | | N/A | | | | N/A | | | | N/A | | | | 0.20% | *# |
Net investment income (loss) to average daily net assets | | | 1.68% | | | | 1.57% | | | | 1.24% | | | | 2.44% | * |
Portfolio turnover rate !! | | | 32% | | | | 40% | | | | 14% | | | | 0% | ** |
| | |
| | | Service Class | | | | |
| | | Year
Ended
12/31/10 | | | Year
Ended
12/31/09 | | | Period
Ended
12/31/08 +++ | | | | |
Net asset value, beginning of period | | $ | 8.57 | | | $ | 6.66 | | | $ | 9.20 | | | | | |
| | | | | | | | | | | | | | | | |
Income (loss) from investment operations: | | | | | | | | | | | | | | | | |
Net investment income (loss) *** | | | 0.13 | | | | 0.10 | | | | 0.01 | | | | | |
Net realized and unrealized gain (loss) on investments | | | 1.10 | | | | 1.85 | | | | (2.55 | ) | | | | |
| | | | | | | | | | | | | | | | |
Total income (loss) from investment operations | | | 1.23 | | | | 1.95 | | | | (2.54 | ) | | | | |
| | | | | | | | | | | | | | | | |
Less distributions to shareholders: | | | | | | | | | | | | | | | | |
From net investment income | | | (0.09 | ) | | | (0.03 | ) | | | - | | | | | |
From net realized gains | | | - | | | | (0.01 | ) | | | (0.00 | ) † | | | | |
| | | | | | | | | | | | | | | | |
Total distributions | | | (0.09 | ) | | | (0.04 | ) | | | (0.00 | ) † | | | | |
| | | | | | | | | | | | | | | | |
Net asset value, end of period | | $ | 9.71 | | | $ | 8.57 | | | $ | 6.66 | | | | | |
| | | | | | | | | | | | | | | | |
Total Return ^^ | | | 14.54% | | | | 29.29% | | | | (27.61% | ) ** | | | | |
| | | | |
Ratios / Supplemental Data: | | | | | | | | | | | | | | | | |
Net assets, end of period (000’s) | | $ | 755,101 | | | $ | 559,084 | | | $ | 184,401 | | | | | |
Ratio of expenses to average daily net assets ! | | | 0.37% | | | | 0.37% | | | | 0.39% | * | | | | |
Net investment income (loss) to average daily net assets | | | 1.45% | | | | 1.34% | | | | 0.24% | * | | | | |
Portfolio turnover rate !! | | | 32% | | | | 40% | | | | 14% | ~ | | | | |
| ** | Percentage represents the results for the period and is not annualized. |
| *** | Per share amount calculated on the average shares method. |
| † | Amount is less than $0.005 per share. |
| ++ | For the period August 31, 2007 (commencement of operations) through December 31, 2007. |
| +++ | For the period August 15, 2008 (commencement of operations) through December 31, 2008. |
| # | Computed after giving effect to an agreement by MassMutual to waive certain fees and expenses of the Fund. |
| ^^ | Total return does not reflect expenses that apply at the separate account level or to related insurance products. Inclusion of these charges would reduce the total return figures for all periods shown. |
| ~ | The portfolio turnover rate results are for the Fund. |
| ! | Expenses of the underlying funds are not included in the Fund’s expense ratio. The Fund indirectly bears its proportionate share of the expenses of any underlying fund. |
| !! | Amount does not include the portfolio activity of any underlying fund. |
The accompanying notes are an integral part of the financial statements.
47
MML Series Investment Fund – Financial Highlights (Continued)
(For a share outstanding throughout each period)
MML Moderate Allocation Fund
| | | | | | | | | | | | | | | | |
| | | Initial Class | |
| | | Year
Ended
12/31/10 | | | Year
Ended
12/31/09 | | | Year
Ended
12/31/08 | | | Period
Ended
12/31/07 ++ | |
Net asset value, beginning of period | | $ | 9.08 | | | $ | 7.26 | | | $ | 10.04 | | | $ | 10.00 | |
| | | | | | | | | | | | | | | | |
Income (loss) from investment operations: | | | | | | | | | | | | | | | | |
Net investment income (loss) *** | | | 0.22 | | | | 0.14 | | | | 0.18 | | | | 0.11 | |
Net realized and unrealized gain (loss) on investments | | | 0.99 | | | | 1.74 | | | | (2.96 | ) | | | 0.15 | |
| | | | | | | | | | | | | | | | |
Total income (loss) from investment operations | | | 1.21 | | | | 1.88 | | | | (2.78 | ) | | | 0.26 | |
| | | | | | | | | | | | | | | | |
Less distributions to shareholders: | | | | | | | | | | | | | | | | |
From net investment income | | | (0.13 | ) | | | (0.05 | ) | | | - | | | | (0.22 | ) |
From net realized gains | | | - | | | | (0.01 | ) | | | (0.00 | ) † | | | - | |
| | | | | | | | | | | | | | | | |
Total distributions | | | (0.13 | ) | | | (0.06 | ) | | | (0.00 | ) † | | | (0.22 | ) |
| | | | | | | | | | | | | | | | |
Net asset value, end of period | | $ | 10.16 | | | $ | 9.08 | | | $ | 7.26 | | | $ | 10.04 | |
| | | | | | | | | | | | | | | | |
Total Return ^^ | | | 13.48% | | | | 25.90% | | | | (27.69% | ) | | | 2.63% | ** |
| | | | |
Ratios / Supplemental Data: | | | | | | | | | | | | | | | | |
Net assets, end of period (000’s) | | $ | 382,041 | | | $ | 331,628 | | | $ | 251,682 | | | $ | 154 | |
Ratio of expenses to average daily net assets: ! | | | | | | | | | | | | | | | | |
Before expense waiver | | | 0.12% | | | | 0.13% | | | | 0.14% | | | | 61.59% | * |
After expense waiver | | | N/A | | | | N/A | | | | N/A | | | | 0.20% | *# |
Net investment income (loss) to average daily net assets | | | 2.30% | | | | 1.77% | | | | 2.09% | | | | 3.05% | * |
Portfolio turnover rate !! | | | 31% | | | | 39% | | | | 18% | | | | 0% | ** |
| | |
| | | Service Class | | | | |
| | | Year
Ended
12/31/10 | | | Year
Ended
12/31/09 | | | Period
Ended
12/31/08 +++ | | | | |
Net asset value, beginning of period | | $ | 9.05 | | | $ | 7.26 | | | $ | 9.44 | | | | | |
| | | | | | | | | | | | | | | | |
Income (loss) from investment operations: | | | | | | | | | | | | | | | | |
Net investment income (loss) *** | | | 0.19 | | | | 0.12 | | | | 0.02 | | | | | |
Net realized and unrealized gain (loss) on investments | | | 0.99 | | | | 1.73 | | | | (2.20 | ) | | | | |
| | | | | | | | | | | | | | | | |
Total income (loss) from investment operations | | | 1.18 | | | | 1.85 | | | | (2.18 | ) | | | | |
| | | | | | | | | | | | | | | | |
Less distributions to shareholders: | | | | | | | | | | | | | | | | |
From net investment income | | | (0.11 | ) | | | (0.05 | ) | | | - | | | | | |
From net realized gains | | | - | | | | (0.01 | ) | | | (0.00 | ) † | | | | |
| | | | | | | | | | | | | | | | |
Total distributions | | | (0.11 | ) | | | (0.06 | ) | | | (0.00 | ) † | | | | |
| | | | | | | | | | | | | | | | |
Net asset value, end of period | | $ | 10.12 | | | $ | 9.05 | | | $ | 7.26 | | | | | |
| | | | | | | | | | | | | | | | |
Total Return ^^ | | | 13.24% | | | | 25.48% | | | | (23.09% | ) ** | | | | |
| | | | |
Ratios / Supplemental Data: | | | | | | | | | | | | | | | | |
Net assets, end of period (000’s) | | $ | 622,603 | | | $ | 403,209 | | | $ | 146,775 | | | | | |
Ratio of expenses to average daily net assets ! | | | 0.37% | | | | 0.38% | | | | 0.39% | * | | | | |
Net investment income (loss) to average daily net assets | | | 2.07% | | | | 1.54% | | | | 0.86% | * | | | | |
Portfolio turnover rate !! | | | 31% | | | | 39% | | | | 18% | ~ | | | | |
| ** | Percentage represents the results for the period and is not annualized. |
| *** | Per share amount calculated on the average shares method. |
| † | Amount is less than $0.005 per share. |
| ++ | For the period August 31, 2007 (commencement of operations) through December 31, 2007. |
| +++ | For the period August 15, 2008 (commencement of operations) through December 31, 2008. |
| # | Computed after giving effect to an arrangement by MassMutual to waive certain fees and expenses of the Fund. |
| ^^ | Total return does not reflect expenses that apply at the separate account level or to related insurance products. Inclusion of these charges would reduce the total return figures for all periods shown. |
| ~ | The portfolio turnover rate results are for the Fund. |
| ! | Expenses of the underlying funds are not included in the Fund’s expense ratio. The Fund indirectly bears its proportionate share of the expenses of any underlying fund. |
| !! | Amount does not include the portfolio activity of any underlying fund. |
The accompanying notes are an integral part of the financial statements.
48
MML Series Investment Fund – Financial Highlights (Continued)
(For a share outstanding throughout each period)
MML American Funds Core Allocation Fund
| | | | | | | | | | | | |
| | | Service Class I | |
| | | Year
Ended
12/31/10 | | | Year
Ended
12/31/09 | | | Period
Ended
12/31/08 + | |
Net asset value, beginning of period | | $ | 9.56 | | | $ | 7.75 | | | $ | 10.00 | |
| | | | | | | | | | | | |
Income (loss) from investment operations: | | | | | | | | | | | | |
Net investment income (loss) *** | | | 0.18 | | | | 0.20 | | | | 0.72 | |
Net realized and unrealized gain (loss) on investments | | | 0.67 | | | | 1.69 | | | | (2.97 | ) |
| | | | | | | | | | | | |
Total income (loss) from investment operations | | | 0.85 | | | | 1.89 | | | | (2.25 | ) |
| | | | | | | | | | | | |
Less distributions to shareholders: | | | | | | | | | | | | |
From net investment income | | | (0.13 | ) | | | (0.08 | ) | | | - | |
From net realized gains | | | (0.07 | ) | | | - | | | | - | |
| | | | | | | | | | | | |
Total distributions | | | (0.20 | ) | | | (0.08 | ) | | | - | |
| | | | | | | | | | | | |
Net asset value, end of period | | $ | 10.21 | | | $ | 9.56 | | | $ | 7.75 | |
| | | | | | | | | | | | |
Total Return ^^ | | | 9.17% | | | | 24.52% | | | | (22.50% | ) ** |
| | | |
Ratios / Supplemental Data: | | | | | | | | | | | | |
Net assets, end of period (000’s) | | $ | 325,337 | | | $ | 231,008 | | | $ | 67,874 | |
Ratio of expenses to average daily net assets: ! | | | | | | | | | | | | |
Before expense waiver | | | 0.76% | | | | 0.77% | | | | 1.85% | * |
After expense waiver | | | 0.75% | # | | | 0.75% | # | | | 0.75% | *# |
Net investment income (loss) to average daily net assets | | | 1.89% | | | | 2.31% | | | | 25.06% | * |
Portfolio turnover rate !! | | | 3% | | | | 10% | | | | 1% | ** |
| ** | Percentage represents the results for the period and is not annualized. |
| *** | Per share amount calculated on the average shares method. |
| + | For the period August 15, 2008 (commencement of operations) through December 31, 2008. |
| # | Computed after giving effect to an agreement by MassMutual to waive certain fees and expenses of the Fund. |
| ^^ | Total return does not reflect expenses that apply at the separate account level or to related insurance products. Inclusion of these charges would reduce the total return figures for all periods shown. |
| ! | Expenses of the underlying funds are not included in the Fund’s expense ratio. The Fund indirectly bears its proportionate share of the expenses of any underlying fund. |
| !! | Amount does not include the portfolio activity of any underlying fund. |
The accompanying notes are an integral part of the financial statements.
49
MML Series Investment Fund – Financial Highlights (Continued)
(For a share outstanding throughout each period)
MML American Funds Growth Fund
| | | | | | | | | | | | |
| | | Service Class I | |
| | | Year
Ended
12/31/10 | | | Year
Ended
12/31/09 | | | Period
Ended
12/31/08 + | |
Net asset value, beginning of period | | $ | 8.80 | | | $ | 6.36 | | | $ | 10.00 | |
| | | | | | | | | | | | |
Income (loss) from investment operations: | | | | | | | | | | | | |
Net investment income (loss) *** | | | 0.04 | | | | 0.03 | | | | 0.22 | |
Net realized and unrealized gain (loss) on investments | | | 1.55 | | | | 2.44 | | | | (3.86 | ) |
| | | | | | | | | | | | |
Total income (loss) from investment operations | | | 1.59 | | | | 2.47 | | | | (3.64 | ) |
| | | | | | | | | | | | |
Less distributions to shareholders: | | | | | | | | | | | | |
From net investment income | | | (0.02 | ) | | | | | | | | |
From net realized gains | | | (0.05 | ) | | | (0.03 | ) | | | - | |
| | | | | | | | | | | | |
Total distributions | | | (0.07 | ) | | | (0.03 | ) | | | - | |
| | | | | | | | | | | | |
Net asset value, end of period | | $ | 10.32 | | | $ | 8.80 | | | $ | 6.36 | |
| | | | | | | | | | | | |
Total Return ^^ | | | 18.16% | | | | 38.86% | | | | (36.40% | ) ** |
| | | |
Ratios / Supplemental Data: | | | | | | | | | | | | |
Net assets, end of period (000’s) | | $ | 37,761 | | | $ | 22,130 | | | $ | 6,080 | |
Ratio of expenses to average daily net assets: ! | | | | | | | | | | | | |
Before expense waiver | | | 0.81% | | | | 0.90% | | | | 13.92% | * |
After expense waiver | | | 0.70% | # | | | 0.70% | # | | | 0.70% | *# |
Net investment income (loss) to average daily net assets | | | 0.43% | | | | 0.39% | | | | 9.23% | * |
Portfolio turnover rate !! | | | 10% | | | | 9% | | | | 5% | ** |
| ** | Percentage represents the results for the period and is not annualized. |
| *** | Per share amount calculated on the average shares method. |
| + | For the period August 15, 2008 (commencement of operations) through December 31, 2008. |
| # | Computed after giving effect to an agreement by MassMutual to waive certain fees and expenses of the Fund. |
| ^^ | Total return does not reflect expenses that apply at the separate account level or to related insurance products. Inclusion of these charges would reduce the total return figures for all periods shown. |
| ! | Expenses of the Master Fund are not included in the Fund’s expense ratio. The Fund indirectly bears its proportionate share of the expenses of the Master Fund. |
| !! | Amount does not include the portfolio activity of the Master Fund. |
The accompanying notes are an integral part of the financial statements.
50
MML Series Investment Fund – Financial Highlights (Continued)
(For a share outstanding throughout each period)
MML American Funds International Fund
| | | | | | | | | | | | |
| | | Service Class I | |
| | | Year
Ended
12/31/10 | | | Year
Ended
12/31/09 | | | Period
Ended
12/31/08 + | |
Net asset value, beginning of period | | $ | 9.79 | | | $ | 6.92 | | | $ | 10.00 | |
| | | | | | | | | | | | |
Income (loss) from investment operations: | | | | | | | | | | | | |
Net investment income (loss) *** | | | 0.17 | | | | 0.12 | | | | 0.51 | |
Net realized and unrealized gain (loss) on investments | | | 0.47 | | | | 2.82 | | | | (3.59 | ) |
| | | | | | | | | | | | |
Total income (loss) from investment operations | | | 0.64 | | | | 2.94 | | | | (3.08 | ) |
| | | | | | | | | | | | |
Less distributions to shareholders: | | | | | | | | | | | | |
From net investment income | | | (0.08 | ) | | | | | | | | |
From net realized gains | | | (0.13 | ) | | | (0.07 | ) | | | - | |
| | | | | | | | | | | | |
Total distributions | | | (0.21 | ) | | | (0.07 | ) | | | - | |
| | | | | | | | | | | | |
Net asset value, end of period | | $ | 10.22 | | | $ | 9.79 | | | $ | 6.92 | |
| | | | | | | | | | | | |
Total Return ^^ | | | 6.82% | | | | 42.63% | | | | (30.80% | ) ** |
| | | |
Ratios / Supplemental Data: | | | | | | | | | | | | |
Net assets, end of period (000’s) | | $ | 31,337 | | | $ | 21,308 | | | $ | 6,410 | |
Ratio of expenses to average daily net assets: ! | | | | | | | | | | | | |
Before expense waiver | | | 0.83% | | | | 0.91% | | | | 13.59% | * |
After expense waiver | | | 0.70% | # | | | 0.70% | # | | | 0.70% | *# |
Net investment income (loss) to average daily net assets | | | 1.78% | | | | 1.48% | | | | 19.94% | * |
Portfolio turnover rate !! | | | 9% | | | | 12% | | | | 7% | ** |
| ** | Percentage represents the results for the period and is not annualized. |
| *** | Per share amount calculated on the average shares method. |
| + | For the period August 15, 2008 (commencement of operations) through December 31, 2008. |
| ^^ | Total return does not reflect expenses that apply at the separate account level or to related insurance products. Inclusion of these charges would reduce the total return figures for all periods shown. |
| # | Computed after giving effect to an agreement by MassMutual to waive certain fees and expenses of the Fund. |
| ! | Expenses of the Master Fund are not included in the Fund’s expense ratio. The Fund indirectly bears its proportionate share of the expenses of the Master Fund. |
| !! | Amount does not include the portfolio activity of the Master Fund. |
The accompanying notes are an integral part of the financial statements.
51
Notes to Financial Statements
MML Series Investment Fund (the “Trust”) is registered under the Investment Company Act of 1940, as amended (the “1940 Act”), as a no-load, open-end, management investment company. The Trust is organized under the laws of the Commonwealth of Massachusetts as a Massachusetts business trust pursuant to an Agreement and Declaration of Trust dated May 14, 1993, as amended. The following are eight series of the Trust (each individually referred to as a “Fund” or collectively as the “Funds”): MML Aggressive Allocation Fund (“Aggressive Allocation Fund”), MML Balanced Allocation Fund (“Balanced Allocation Fund”), MML Conservative Allocation Fund (“Conservative Allocation Fund”), MML Growth Allocation Fund (“Growth Allocation Fund”), MML Moderate Allocation Fund (“Moderate Allocation Fund”), MML American Funds® Core Allocation Fund (“American Funds Core Allocation Fund”), MML American Funds® Growth Fund (“American Funds Growth Fund”), and MML American Funds® International Fund (“American Funds International Fund”).
The Trust makes shares of the Funds available for the investment of assets of various separate investment accounts established by Massachusetts Mutual Life Insurance Company (“MassMutual”) and by life insurance companies which are subsidiaries of MassMutual. Shares of the Trust are not offered to the general public. MassMutual, MML Bay State Life Insurance Company, and C.M. Life Insurance Company are the record owners of all of the outstanding shares of the Funds.
The Aggressive Allocation Fund, Balanced Allocation Fund, Conservative Allocation Fund, Growth Allocation Fund, and Moderate Allocation Fund (the “Allocation Funds”) invest their investable assets primarily in shares of various funds advised by MassMutual or a control affiliate of MassMutual. The Allocation Funds may also invest in non-affiliated funds. The financial statements of other series of the Trust, the applicable series of the MML Series Investment Fund II, Oppenheimer Funds which are advised by OppenheimerFunds, Inc., a majority-owned, indirect subsidiary of MassMutual, and non-affiliated funds are presented separately and can be obtained from the Securities and Exchange Commission’s (“SEC”) EDGAR database on its Internet site at www.sec.gov or by calling MassMutual at 1-888-309-3539. The assets of each of the five Allocation Funds listed above are diversified and a shareholder’s interest is limited to the series of the Trust, MML Series Investment Fund II, Oppenheimer Funds, or any non-affiliated funds in which the shares are invested.
The American Funds Core Allocation Fund invests all of its investable assets in shares of various series of American Funds Insurance Series, which are managed by Capital Research and Management Company. American Funds Growth Fund and American Funds International Fund (each a “Feeder Fund,” collectively the “Feeder Funds”) invest all of their assets in Class 1 shares of the Growth and International Funds, respectively, each a series of the American Funds Insurance Series (each a “Master Fund,” collectively the “Master Funds”). Each Master Fund is an open-end investment company and organized as a Massachusetts business trust. Each Feeder Fund has an investment objective that is consistent with its corresponding Master Fund. Each Master Fund intends to comply with the requirements under Subchapter M of the Internal Revenue Code applicable to mutual funds and intends to distribute substantially all of its taxable income and capital gains to shareholders, which includes the applicable Feeder Fund, to qualify as a regulated investment company. The performance of the Feeder Funds is directly affected by the performance of the Master Funds. The financial statements of the Master Funds, including the Summary Investment Portfolios, are provided separately and should be read in conjunction with the Feeder Funds’ financial statements. As of December 31, 2010, the American Funds Growth Fund and American Funds International Fund owned 0.13% and 0.31% of the Growth and International Master Funds, respectively.
Each Fund, other than the American Funds Core Allocation Fund, American Funds Growth Fund, and American Funds International Fund, offers the following two classes of shares: Initial Class and Service Class shares. The American Funds Core Allocation Fund, American Funds Growth Fund, and American Funds International Fund offer one class of shares: Service Class I shares. Each share class represents an interest in the same portfolio of assets. The principal difference among the classes is the level of service and administration fees, and shareholder and distribution service expenses borne by the classes. Because each class will have different fees and expenses, performance and share prices will vary between the classes. The classes of shares are offered to different types of investors, as outlined in the Funds’ Prospectus.
| 2. | | Significant Accounting Policies |
The following is a summary of significant accounting policies followed consistently by each Fund in the preparation of the financial statements in conformity with accounting principles generally accepted in the United States of America (“generally
52
Notes to Financial Statements (Continued)
accepted accounting principles”). The preparation of the financial statements in accordance with generally accepted accounting principles requires management to make estimates and assumptions that affect the reported amounts and disclosures in the financial statements. Actual results could differ from those estimates.
Investment Valuation
The net asset value of each Fund’s shares is determined once daily as of the close of regular trading on the New York Stock Exchange, on each day the New York Stock Exchange is open for trading. The New York Stock Exchange normally closes at 4:00 p.m. Eastern Time, but may close earlier on some days.
Equity securities are valued on the basis of information furnished by a pricing service, which provides the last reported sale price for securities listed on a national securities exchange or the official closing price on the NASDAQ National Market System, or in the case of over-the-counter (“OTC”) securities for which an official closing price is unavailable or not reported on the NASDAQ System, the last reported bid price. Debt securities (other than short-term obligations) are valued on the basis of valuations furnished by a pricing service, which determines valuations taking into account factors such as institutional-size trading in similar securities, yield, quality, coupon rate, maturity, type of issue, trading characteristics, and other market data. Short-term debt securities are valued at either amortized cost or at original cost plus accrued interest, whichever approximates current market value. Shares of other open-end mutual funds are valued at their closing net asset values as reported on each business day. Investments are marked to market daily based on values provided by third-party vendors or market makers to the extent available or based on model prices. Valuations provided by third-party vendors and representative bids provided by market makers may be determined on the basis of a variety of factors, such as broker quotations, financial modeling, and other market data, such as market indexes and yield curves, counterparty information, and foreign exchange rates.
Investments for which market quotations are not available or for which a pricing service or vendor does not provide a value, or for which such market quotations or values are considered by the investment adviser to be unreliable (including, for example, certain foreign securities, thinly-traded securities, initial public offerings, or securities whose values may have been affected by a significant event) are stated at fair valuations determined by the Funds’ Valuation Committee in accordance with procedures approved by the Board of Trustees (“Trustees”), and under the general oversight of the Trustees. It is possible that fair value prices will be used by the Funds to a significant extent. The value determined for an investment using the Funds’ fair value procedures may differ from recent market prices for the investment and may be significantly different from the value realized upon such asset’s sale.
Portfolio securities traded on more than one national securities exchange are valued at the last price on the business day at the close of the exchange representing the principal market for such securities. All assets and liabilities expressed in foreign currencies are converted into U.S. dollars at the mean between the buying and selling rates of such currencies against the U.S. dollar at the end of each business day.
The Funds may invest in securities that are traded principally in foreign markets and that trade on weekends and other days when the Funds do not price their shares. As a result, the values of the Funds’ portfolio securities may change on days when the prices of the Funds’ shares are not calculated. The prices of the Funds’ shares will reflect any such changes when the prices of the Funds’ shares are next calculated, which is the next day the New York Stock Exchange is open. The Funds may use fair value pricing more frequently for securities primarily traded in foreign markets because, among other things, most foreign markets close well before the Funds value their securities. The earlier close of these foreign markets gives rise to the possibility that significant events, including broad market moves, may have occurred in the interim. The Funds’ investments may be priced based on fair values provided by a third-party fair valuation vendor, based on certain factors and methodologies applied by such vendor, in the event that there is movement in the U.S. market that exceeds a specific threshold established by the Funds’ Valuation Committee pursuant to guidelines established by the Trustees, and under the general oversight of the Trustees.
Fair value is defined as the price that would be received to sell an asset or paid to transfer a liability in an orderly transaction between market participants at the measurement date. A three-tier hierarchy is utilized to maximize the use of observable market data inputs and minimize the use of unobservable inputs and to establish classification of fair value measurements for disclosure purposes. Inputs refer broadly to the assumptions that market participants would use in pricing the asset or liability, including
53
Notes to Financial Statements (Continued)
assumptions about risk, for example, the risk inherent in a particular valuation technique used to measure fair value (such as a pricing model) and/or the risk inherent in the inputs to the valuation technique. Inputs may be observable or unobservable. Observable inputs are inputs that reflect the assumptions market participants would use in pricing the asset or liability and are developed based on market data obtained from sources independent of the reporting entity. Unobservable inputs are inputs that reflect the reporting entity’s own assumptions about the assumptions market participants would use in pricing the asset or liability and are developed based on the best information available in the circumstances. The three-tier hierarchy of inputs is summarized in the three broad Levels listed below.
Level 1 – quoted prices (unadjusted) in active markets for identical investments
Level 2 – other significant observable inputs (including quoted prices for similar investments, interest rates, prepayment speeds, credit risk, etc.)
Level 3 – significant unobservable inputs (including the Fund’s own assumptions in determining the fair value of investments)
Changes in valuation techniques may result in transfers in or out of an investment’s assigned Level within the hierarchy. The inputs or methodology used for valuing investments are not necessarily an indication of the risk associated with investing in those investments and the determination of the significance of a particular input to the fair value measurement in its entirety requires judgment and consideration of factors specific to each security.
The availability of observable inputs can vary from security to security and is affected by a wide variety of factors, including, for example, the type of security, whether the security is new and not yet established in the marketplace, the liquidity of markets, and other characteristics particular to the security. To the extent that valuation is based on models or inputs that are less observable or unobservable in the market, the determination of fair value requires more judgment. Accordingly, the degree of judgment exercised in determining fair value is greatest for instruments categorized in Level 3.
In periods of market dislocation, the observability of prices and inputs may be reduced for many instruments. This condition, as well as changes related to liquidity of investments, could cause a security to be reclassified between Level 1, Level 2, or Level 3.
In certain cases, the inputs used to measure fair value may fall into different levels of the fair value hierarchy. In such cases, for disclosure purposes the level in the fair value hierarchy within which the fair value measurement falls is determined based on the lowest level input that is significant to the fair value measurement.
All Funds characterized all long-term investments at Level 1, as of December 31, 2010. For each Fund, the level classification by major category of investments is the same as the category presentation in the Portfolio of Investments.
The Funds had no transfers between Level 1 and Level 2 of the fair value hierarchy during the year ended December 31, 2010.
Accounting for Investment Transactions
Investment transactions are accounted for on the trade date. Realized gains and losses on sales of investments and unrealized appreciation and depreciation of investments are computed by the specific identification cost method. Proceeds received from litigation, if any, are included in realized gains on investment transactions for any investments that are no longer held in the portfolio and as a reduction in cost for investments that continue to be held in the portfolio. Interest income, adjusted for amortization of discounts and premiums on debt securities, is earned from the settlement date and is recorded on the accrual basis. Dividend income and distributions are recorded on the ex-dividend date. Withholding taxes on foreign interest, dividends, and capital gains have been provided for in accordance with the applicable country’s tax rules and rates. Foreign dividend income is recorded on the ex-dividend date or as soon as practicable after the Fund determines the existence of a dividend declaration after exercising reasonable due diligence. Distributions received on securities that represent a return of capital or capital gain are recorded as a reduction of cost of investments and/or as a realized gain. The Funds estimate the components of distributions received that may be considered return of capital distributions or capital gain distributions.
Allocation of Operating Activity
In maintaining the records for the Funds, the income and expense accounts are allocated to each class of shares. Investment income, unrealized and realized gains or losses are prorated among the classes of shares based on the relative net assets of each.
54
Notes to Financial Statements (Continued)
Expenses are allocated to each class of shares depending on the nature of the expenditures. Administration and service fees, if any, which are directly attributable to a class of shares, are charged to that class’s operations. Expenses of the Fund not directly attributable to the operations of any class of shares or Fund are prorated among the Funds and classes to which the expense relates based on the relative net assets of each.
In addition, each Fund will also incur certain fees and expenses indirectly as a shareholder in the underlying funds. Because the underlying funds have varied expense and fee levels and each Fund, except American Funds Growth Fund and American Funds International Fund, may own different proportions of underlying funds at different times, the amount of fees and expenses indirectly incurred by each Fund will vary.
Credit Risk
The Funds may invest a portion of their assets, directly or indirectly, in securities backed by mortgage loans, credit card receivables, and automotive loans. The values and related income of these securities are sensitive to changes in economic conditions, including delinquencies and/or defaults. Continuing shifts in the market’s perception of credit quality on such securities have resulted in increased volatility of market price and periods of decreased market activity that have adversely impacted the valuation and liquidity of such securities.
Federal Income Tax
It is each Fund’s intent to continue to comply with the provisions of subchapter M of the Internal Revenue Code of 1986, as amended (the “Code”), applicable to a regulated investment company. Under such provisions, the Funds would not be subject to federal income taxes on their ordinary income and net realized capital gains to the extent they are distributed or deemed to have been distributed to their shareholders. Therefore, the Funds have not made any provision for federal income tax.
Dividends and Distributions to Shareholders
Dividends from net investment income of each Fund are declared and paid annually and at other times as may be required to satisfy tax or regulatory requirements. Distributions of any net realized capital gains of each Fund are declared and paid annually and at other times as may be required to satisfy tax or regulatory requirements.
Distributions to shareholders are recorded on the ex-dividend date. Income and capital gain distributions are determined in accordance with income tax regulations, which may differ from generally accepted accounting principles. As a result, net investment income and net realized capital gains on investment transactions for a reporting period may differ significantly from distributions during such period.
| 3. | | Management Fees and Other Transactions |
Investment Management Fees
Under agreements between MassMutual and the Trust on behalf of each Fund, MassMutual is responsible for providing investment management services for each Fund. In return for these services, MassMutual receives advisory fees, based upon each Fund’s average daily net assets, at the following annual rates:
| | | | | | |
Aggressive Allocation Fund | | 0.10% | | Moderate Allocation Fund | | 0.10% |
Balanced Allocation Fund | | 0.10% | | American Funds Core Allocation Fund | | 0.20% |
Conservative Allocation Fund | | 0.10% | | American Funds Growth Fund | | 0.15% |
Growth Allocation Fund | | 0.10% | | American Funds International Fund | | 0.15% |
55
Notes to Financial Statements (Continued)
Administration Fees
For the American Funds Core Allocation Fund, American Funds Growth Fund, and American Funds International Fund, under separate administrative and shareholder services agreements between the Funds and MassMutual, MassMutual provides certain administrative and shareholder services and bears some of the class specific administrative expenses. In return for these services, MassMutual receives an administrative services fee based upon the average daily net assets of the applicable class of shares of the Funds, at the following annual rates:
| | | | |
| | | Service Class I | |
American Funds Core Allocation Fund | | | 0.25 | % |
American Funds Growth Fund | | | 0.25 | % |
American Funds International Fund | | | 0.25 | % |
Service Fees
MML Distributors, LLC (the “Distributor”) acts as distributor to the Funds. Pursuant to a Distribution and Services Plan adopted by the Funds pursuant to Rule 12b-1 under the 1940 Act, Service Class shares and Service Class I shares of the Funds pay an annual fee of 0.25% of the average daily net asset value of Service Class shares and Service Class I shares. This fee, or a portion thereof, is paid to: (i) the Distributor for services provided and expenses incurred by it in connection with the distribution of Service Class shares or Service Class I shares, as applicable, of each Fund; and/or (ii) MassMutual for services provided and expenses incurred by it for purposes of maintaining or providing personal services to Service Class and Service Class I shareholders.
Expense Caps and Waivers
MassMutual agreed to cap the fees and expenses of the Funds (other than extraordinary litigation and legal expenses, Acquired Fund fees and expenses#, Master Fund fees and expenses, or other non-recurring or unusual expenses such as, for example, organizational expenses and shareholder meeting expenses) based upon the average daily net assets of the applicable class of shares of the Funds, as follows:
| | | | | | | | | | |
Aggressive Allocation Fund* | | | | | | Moderate Allocation Fund** | | | | |
Initial Class | | | 0.20% | | | Initial Class | | | 0.20% | |
Service Class | | | 0.45% | | | Service Class | | | 0.45% | |
Balanced Allocation Fund** | | | | | | American Funds Core Allocation Fund* | | | | |
Initial Class | | | 0.20% | | | Service Class I | | | 0.75% | |
Service Class | | | 0.45% | | | American Funds Growth Fund* | | | | |
Conservative Allocation Fund** | | | | | | Service Class I | | | 0.70% | |
Initial Class | | | 0.20% | | | American Funds International Fund* | | | | |
Service Class | | | 0.45% | | �� | Service Class I | | | 0.70% | |
Growth Allocation Fund** | | | | | | | | | | |
Initial Class | | | 0.20% | | | | | | | |
Service Class | | | 0.45% | | | | | | | |
| # | Acquired Fund fees and expenses are expenses borne indirectly by a Fund through investments in other pooled investment vehicles. |
| * | Expense cap in effect through May 2, 2011. |
| ** | Expense cap in effect through May 2, 2010. |
Expense caps and waiver amounts are reflected as a reduction of expenses on the Statements of Operations.
Deferred Compensation
Trustees of the Funds who are not employees of MassMutual or its subsidiaries may elect to defer receipt of their annual fees in accordance with terms of a Non-Qualified Deferred Compensation Plan. Amounts deferred shall accrue interest or earnings and shall be recorded on the Funds’ books as other liabilities. Deferred compensation is included within Trustees’ fees and expenses in the Statements of Assets and Liabilities.
56
Notes to Financial Statements (Continued)
Other
Certain officers and trustees of the Funds are also employees of MassMutual. The compensation of each trustee who is not an employee of MassMutual is borne by the Funds.
| 4. | | Purchases and Sales of Investments |
Cost of purchases and proceeds from sales of investment securities (excluding short-term investments) for the year ended December 31, 2010, were as follows:
| | | | | | | | | | | | | | | | |
| | | Purchases | | | Sales | |
| | | Long-Term U.S.
Government
Securities | | | Other
Long-Term
Securities | | | Long-Term U.S.
Government
Securities | | | Other
Long-Term
Securities | |
Aggressive Allocation Fund | | $ | - | | | $ | 29,755,029 | | | $ | - | | | $ | 21,657,507 | |
Balanced Allocation Fund | | | - | | | | 159,365,660 | | | | - | | | | 120,857,674 | |
Conservative Allocation Fund | | | - | | | | 163,257,927 | | | | - | | | | 114,050,526 | |
Growth Allocation Fund | | | - | | | | 488,920,257 | | | | - | | | | 361,457,262 | |
Moderate Allocation Fund | | | - | | | | 444,786,372 | | | | - | | | | 263,226,711 | |
American Funds Core Allocation Fund | | | - | | | | 81,114,175 | | | | - | | | | 7,495,391 | |
American Funds Growth Fund | | | - | | | | 12,992,971 | | | | - | | | | 2,662,548 | |
American Funds International Fund | | | - | | | | 10,392,146 | | | | - | | | | 2,120,658 | |
| 5. | | Capital Share Transactions |
Changes in shares outstanding for each Fund were as follows:
| | | | | | | | | | | | | | | | |
| | | Year ended December 31, 2010 | | | Year ended December 31, 2009 | |
| | | | |
| | | Shares | | | Amount | | | Shares | | | Amount | |
| | | | | | | | | | | | | | | | |
Aggressive Allocation Fund Initial Class | | | | | | | | | | | | | | | | |
Sold | | | 859,130 | | | $ | 7,497,970 | | | | 507,428 | | | $ | 3,537,373 | |
Issued as reinvestment of dividends | | | 49,472 | | | | 387,367 | | | | 22,177 | | | | 167,438 | |
Redeemed | | | (602,156 | ) | | | (5,079,380 | ) | | | (368,978 | ) | | | (2,680,362 | ) |
| | | | | | | | | | | | | | | | |
Net increase (decrease) | | | 306,446 | | | $ | 2,805,957 | | | | 160,627 | | | $ | 1,024,449 | |
| | | | | | | | | | | | | | | | |
Aggressive Allocation Fund Service Class | | | | | | | | | | | | | | | | |
Sold | | | 854,757 | | | $ | 7,278,925 | | | | 1,308,234 | | | $ | 8,168,607 | |
Issued as reinvestment of dividends | | | 23,425 | | | | 182,480 | | | | 8,304 | | | | 62,527 | |
Redeemed | | | (299,563 | ) | | | (2,431,329 | ) | | | (114,862 | ) | | | (726,493 | ) |
| | | | | | | | | | | | | | | | |
Net increase (decrease) | | | 578,619 | | | $ | 5,030,076 | | | | 1,201,676 | | | $ | 7,504,641 | |
| | | | | | | | | | | | | | | | |
Balanced Allocation Fund Initial Class | | | | | | | | | | | | | | | | |
Sold | | | 2,258,139 | | | $ | 21,604,154 | | | | 2,755,854 | | | $ | 22,826,549 | |
Issued as reinvestment of dividends | | | 189,684 | | | | 1,767,853 | | | | 85,015 | | | | 746,431 | |
Redeemed | | | (2,857,408 | ) | | | (27,666,845 | ) | | | (1,520,617 | ) | | | (12,518,384 | ) |
| | | | | | | | | | | | | | | | |
Net increase (decrease) | | | (409,585 | ) | | $ | (4,294,838 | ) | | | 1,320,252 | | | $ | 11,054,596 | |
| | | | | | | | | | | | | | | | |
Balanced Allocation Fund Service Class | | | | | | | | | | | | | | | | |
Sold | | | 5,594,036 | | | $ | 54,243,658 | | | | 11,491,581 | | | $ | 91,151,113 | |
Issued as reinvestment of dividends | | | 258,636 | | | | 2,405,318 | | | | 102,067 | | | | 894,111 | |
Redeemed | | | (1,958,928 | ) | | | (18,818,933 | ) | | | (713,174 | ) | | | (6,081,075 | ) |
| | | | | | | | | | | | | | | | |
Net increase (decrease) | | | 3,893,744 | | | $ | 37,830,043 | | | | 10,880,474 | | | $ | 85,964,149 | |
| | | | | | | | | | | | | | | | |
57
Notes to Financial Statements (Continued)
| | | | | | | | | | | | | | | | |
| | | Year ended December 31, 2010 | | | Year ended December 31, 2009 | |
| | | | |
| | | Shares | | | Amount | | | Shares | | | Amount | |
| | | | | | | | | | | | | | | | |
Conservative Allocation Fund Initial Class | | | | | | | | | | | | | | | | |
Sold | | | 3,159,189 | | | $ | 32,003,547 | | | | 4,068,117 | | | $ | 34,653,159 | |
Issued as reinvestment of dividends | | | 141,195 | | | | 1,404,894 | | | | 53,869 | | | | 500,983 | |
Redeemed | | | (2,462,426 | ) | | | (25,304,151 | ) | | | (2,065,952 | ) | | | (18,561,274 | ) |
| | | | | | | | | | | | | | | | |
Net increase (decrease) | | | 837,958 | | | $ | 8,104,290 | | | | 2,056,034 | | | $ | 16,592,868 | |
| | | | | | | | | | | | | | | | |
Conservative Allocation Fund Service Class | | | | | | | | | | | | | | | | |
Sold | | | 6,089,128 | | | $ | 61,753,280 | | | | 11,176,989 | | | $ | 97,578,744 | |
Issued as reinvestment of dividends | | | 231,134 | | | | 2,292,849 | | | | 71,937 | | | | 667,577 | |
Redeemed | | | (2,751,385 | ) | | | (28,127,084 | ) | | | (1,298,330 | ) | | | (11,793,601 | ) |
| | | | | | | | | | | | | | | | |
Net increase (decrease) | | | 3,568,877 | | | $ | 35,919,045 | | | | 9,950,596 | | | $ | 86,452,720 | |
| | | | | | | | | | | | | | | | |
Growth Allocation Fund Initial Class | | | | | | | | | | | | | | | | |
Sold | | | 4,146,533 | | | $ | 37,142,450 | | | | 5,369,261 | | | $ | 39,792,900 | |
Issued as reinvestment of dividends | | | 687,702 | | | | 5,749,187 | | | | 265,170 | | | | 2,118,708 | |
Redeemed | | | (4,347,560 | ) | | | (38,476,048 | ) | | | (4,134,189 | ) | | | (30,237,091 | ) |
| | | | | | | | | | | | | | | | |
Net increase (decrease) | | | 486,675 | | | $ | 4,415,589 | | | | 1,500,242 | | | $ | 11,674,517 | |
| | | | | | | | | | | | | | | | |
Growth Allocation Fund Service Class | | | | | | | | | | | | | | | | |
Sold | | | 14,092,974 | | | $ | 126,073,741 | | | | 39,214,962 | | | $ | 272,922,097 | |
Issued as reinvestment of dividends | | | 806,058 | | | | 6,722,526 | | | | 281,735 | | | | 2,248,248 | |
Redeemed | | | (2,358,135 | ) | | | (20,728,113 | ) | | | (1,967,542 | ) | | | (15,569,277 | ) |
| | | | | | | | | | | | | | | | |
Net increase (decrease) | | | 12,540,897 | | | $ | 112,068,154 | | | | 37,529,155 | | | $ | 259,601,068 | |
| | | | | | | | | | | | | | | | |
Moderate Allocation Fund Initial Class | | | | | | | | | | | | | | | | |
Sold | | | 4,591,611 | | | $ | 43,175,094 | | | | 4,921,477 | | | $ | 38,992,944 | |
Issued as reinvestment of dividends | | | 526,587 | | | | 4,728,753 | | | | 240,258 | | | | 2,044,599 | |
Redeemed | | | (4,050,713 | ) | | | (38,066,622 | ) | | | (3,292,868 | ) | | | (26,022,315 | ) |
| | | | | | | | | | | | | | | | |
Net increase (decrease) | | | 1,067,485 | | | $ | 9,837,225 | | | | 1,868,867 | | | $ | 15,015,228 | |
| | | | | | | | | | | | | | | | |
Moderate Allocation Fund Service Class | | | | | | | | | | | | | | | | |
Sold | | | 17,750,127 | | | $ | 167,787,253 | | | | 26,769,575 | | | $ | 202,976,229 | |
Issued as reinvestment of dividends | | | 690,720 | | | | 6,181,945 | | | | 265,502 | | | | 2,254,116 | |
Redeemed | | | (1,466,561 | ) | | | (13,778,708 | ) | | | (2,710,904 | ) | | | (22,964,291 | ) |
| | | | | | | | | | | | | | | | |
Net increase (decrease) | | | 16,974,286 | | | $ | 160,190,490 | | | | 24,324,173 | | | $ | 182,266,054 | |
| | | | | | | | | | | | | | | | |
American Funds Core Allocation Fund Service Class I | | | | | | | | | | | | | | | | |
Sold | | | 8,363,908 | | | $ | 81,109,567 | | | | 16,641,191 | | | $ | 131,873,715 | |
Issued as reinvestment of dividends | | | 626,787 | | | | 5,772,710 | | | | 206,139 | | | | 1,842,885 | |
Redeemed | | | (1,288,220 | ) | | | (12,656,869 | ) | | | (1,446,034 | ) | | | (12,754,110 | ) |
| | | | | | | | | | | | | | | | |
Net increase (decrease) | | | 7,702,475 | | | $ | 74,225,408 | | | | 15,401,296 | | | $ | 120,962,490 | |
| | | | | | | | | | | | | | | | |
American Funds Growth Fund Service Class I | | | | | | | | | | | | | | | | |
Sold | | | 1,547,098 | | | $ | 14,219,777 | | | | 1,822,448 | | | $ | 12,797,555 | |
Issued as reinvestment of dividends | | | 24,205 | | | | 205,739 | | | | 7,949 | | | | 63,512 | |
Redeemed | | | (428,395 | ) | | | (4,023,555 | ) | | | (270,438 | ) | | | (2,095,380 | ) |
| | | | | | | | | | | | | | | | |
Net increase (decrease) | | | 1,142,908 | | | $ | 10,401,961 | | | | 1,559,959 | | | $ | 10,765,687 | |
| | | | | | | | | | | | | | | | |
American Funds International Fund Service Class I | | | | | | | | | | | | | | | | |
Sold | | | 1,193,527 | | | $ | 11,337,503 | | | | 1,483,639 | | | $ | 11,380,441 | |
Issued as reinvestment of dividends | | | 64,508 | | | | 572,833 | | | | 15,721 | | | | 140,703 | |
Redeemed | | | (367,611 | ) | | | (3,520,058 | ) | | | (248,657 | ) | | | (2,202,430 | ) |
| | | | | | | | | | | | | | | | |
Net increase (decrease) | | | 890,424 | | | $ | 8,390,278 | | | | 1,250,703 | | | $ | 9,318,714 | |
| | | | | | | | | | | | | | | | |
58
Notes to Financial Statements (Continued)
| 6. | | Federal Income Tax Information |
At December 31, 2010, the cost of securities and the unrealized appreciation (depreciation) in the value of investments owned by the Funds, as computed on a federal income tax basis, were as follows:
| | | | | | | | | | | | | | | | |
| | | Federal Income
Tax Cost | | | Tax Basis
Unrealized
Appreciation | | | Tax Basis
Unrealized
(Depreciation) | | | Net Unrealized
Appreciation
(Depreciation) | |
Aggressive Allocation Fund | | $ | 54,246,270 | | | $ | 10,269,388 | | | $ | (5,736 | ) | | $ | 10,263,652 | |
Balanced Allocation Fund | | | 306,398,679 | | | | 43,487,361 | | | | (365,802 | ) | | | 43,121,559 | |
Conservative Allocation Fund | | | 271,399,318 | | | | 27,142,236 | | | | (395,918 | ) | | | 26,746,318 | |
Growth Allocation Fund | | | 1,061,798,177 | | | | 232,822,952 | | | | (466,996 | ) | | | 232,355,956 | |
Moderate Allocation Fund | | | 860,588,712 | | | | 145,452,967 | | | | (845,154 | ) | | | 144,607,813 | |
American Funds Core Allocation Fund | | | 269,128,540 | | | | 56,559,317 | | | | - | | | | 56,559,317 | |
American Funds Growth Fund | | | 28,415,492 | | | | 9,403,636 | | | | - | | | | 9,403,636 | |
American Funds International Fund | | | 25,157,729 | | | | 6,231,644 | | | | - | | | | 6,231,644 | |
Net capital loss carryforwards may be applied against any net realized taxable gains in succeeding years, subject to the carryforward period limitations, where applicable. On December 22, 2010, the Regulated Investment Company Modernization Act of 2010 (the “Modernization Act”) was signed by The President. The Modernization Act changed the capital loss carryforward rules as they relate to regulated investment companies. Capital losses generated in tax years beginning after the date of enactment may now be carried forward indefinitely, and retain the character of the original loss. Under pre-enactment law, capital losses could be carried forward for up to eight tax years as short-term capital losses. The provisions affecting the utilization of capital loss carryforwards under the Modernization Act also require the utilization of post-enactment losses prior to the utilization of pre-enactment losses.
At December 31, 2010, the following Fund(s) had available, for federal income tax purposes, unused capital losses:
| | | | |
| | | Expiring
2017 | |
Aggressive Allocation Fund | | $ | 2,473,808 | |
Growth Allocation Fund | | | 22,203,850 | |
Net capital loss carryforwards for the Funds shown in the above table are from pre-enactment years and are, therefore, subject to the eight-year carryforward period and possible expiration.
Accounting principles generally accepted in the United States of America require that only distributions in excess of tax basis earnings and profits be reported in the financial statements as a return of capital.
The tax character of distributions (including capital gain dividends, if any, designated pursuant to Section 852 of the Code) paid during the year ended December 31, 2010, was as follows:
| | | | | | | | | | | | |
| | | Ordinary
Income | | | Long Term
Capital Gain | | | Return of
Capital | |
Aggressive Allocation Fund | | $ | 569,847 | | | $ | - | | | $ | - | |
Balanced Allocation Fund | | | 4,173,171 | | | | - | | | | - | |
Conservative Allocation Fund | | | 3,697,743 | | | | - | | | | - | |
Growth Allocation Fund | | | 12,471,713 | | | | - | | | | - | |
Moderate Allocation Fund | | | 10,910,698 | | | | - | | | | - | |
American Funds Core Allocation Fund | | | 5,366,103 | | | | 406,607 | | | | - | |
American Funds Growth Fund | | | 94,245 | | | | 111,494 | | | | - | |
American Funds International Fund | | | 306,729 | | | | 266,104 | | | | - | |
59
Notes to Financial Statements (Continued)
The tax character of distributions (including capital gain dividends, if any, designated pursuant to Section 852 of the Code) paid during the year ended December 31, 2009, was as follows:
| | | | | | | | | | | | |
| | | Ordinary
Income | | | Long Term
Capital Gain | | | Return of
Capital | |
Aggressive Allocation Fund | | $ | 118,245 | | | $ | 111,721 | | | $ | - | |
Balanced Allocation Fund | | | 1,435,833 | | | | 204,708 | | | | - | |
Conservative Allocation Fund | | | 1,052,280 | | | | 116,280 | | | | - | |
Growth Allocation Fund | | | 3,236,265 | | | | 1,130,691 | | | | - | |
Moderate Allocation Fund | | | 3,695,558 | | | | 603,158 | | | | - | |
American Funds Core Allocation Fund | | | 1,842,885 | | | | - | | | | - | |
American Funds Growth Fund | | | 63,512 | | | | - | | | | - | |
American Funds International Fund | | | 140,703 | | | | - | | | | - | |
Capital accounts within financial statements are periodically adjusted for permanent differences between book and tax accounting. These adjustments have no impact on net assets or the results of operations. Temporary book and tax accounting differences will reverse in subsequent periods. At December 31, 2010, temporary book and tax accounting differences were primarily attributable to the deferral of wash sale losses and deferred Trustee compensation.
At December 31, 2010, the components of distributable earnings on a tax basis were as follows:
| | | | | | | | | | | | | | | | |
| | | Undistributed
Ordinary
Income | | | Undistributed
Long Term
Capital Gain
(Capital Loss
Carryover) | | | Other
Temporary
Differences | | | Unrealized
Appreciation
(Depreciation) | |
Aggressive Allocation Fund | | $ | 728,639 | | | $ | (2,473,808 | ) | | $ | (4,073 | ) | | $ | 10,263,652 | |
Balanced Allocation Fund | | | 8,922,393 | | | | 6,460,940 | | | | (21,270 | ) | | | 43,121,559 | |
Conservative Allocation Fund | | | 12,804,755 | | | | 11,886,380 | | | | (16,483 | ) | | | 26,746,318 | |
Growth Allocation Fund | | | 21,794,435 | | | | (22,203,850 | ) | | | (80,397 | ) | | | 232,355,956 | |
Moderate Allocation Fund | | | 21,391,737 | | | | 837,648 | | | | (58,223 | ) | | | 144,607,813 | |
American Funds Core Allocation Fund | | | 5,079,333 | | | | 1,254,919 | | | | (15,917 | ) | | | 56,559,317 | |
American Funds Growth Fund | | | 119,836 | | | | 876,919 | | | | (1,521 | ) | | | 9,403,636 | |
American Funds International Fund | | | 445,207 | | | | 646,231 | | | | (1,455 | ) | | | 6,231,643 | |
During the year ended December 31, 2010, the following amounts were reclassified due to permanent differences between book and tax accounting:
| | | | | | | | | | | | |
| | | Paid-in
Capital | | | Accumulated
Net Realized
Gain (Loss) on
Investments | | | Undistributed
Net Investment
Income (Loss) | |
Aggressive Allocation Fund | | $ | - | | | $ | (200,448 | ) | | $ | 200,448 | |
Balanced Allocation Fund | | | - | | | | (1,012,502 | ) | | | 1,012,502 | |
Conservative Allocation Fund | | | - | | | | (920,292 | ) | | | 920,292 | |
Growth Allocation Fund | | | - | | | | (4,145,546 | ) | | | 4,145,546 | |
Moderate Allocation Fund | | | - | | | | (3,108,155 | ) | | | 3,108,155 | |
American Funds Core Allocation Fund | | | - | | | | 14 | | | | (14 | ) |
The Funds did not have any unrecognized tax benefits at December 31, 2010, nor were there any increases or decreases in unrecognized tax benefits for the year then ended. The Funds recognize interest and penalties, if any, related to unrecognized tax
60
Notes to Financial Statements (Continued)
benefits as an income tax expense in the Statements of Operations. During the year ended December 31, 2010, the Funds did not incur any such interest or penalties. The Funds are subject to examination by U.S. federal and state tax authorities for returns filed for the prior three fiscal years. Foreign taxes are provided for based on the Funds’ understanding of the tax rules and rates that exist in the foreign markets in which they invest.
| 7. | | Investment in Affiliated Issuers |
A summary of the Funds’ transactions in the securities of affiliated issuers during the year ended December 31, 2010, was as follows:
| | | | | | | | | | | | | | | | | | | | | | | | | | | | | | | | |
| | | Number of
Shares
Held as of
12/31/09 | | | Purchases | | | Sales | | | Number of
Shares
Held as of
12/31/10 | | | Value as of
12/31/10 | | | Dividend
Income | | | Realized
Gains
Distributions | | | Net
Realized
Gain (Loss) | |
Aggressive Allocation Fund | | | | | | | | | | | | | | | | | | | | | | | | | | | | | | | | |
MML Blue Chip Growth Fund, Initial Class | | | 364,545 | | | | 382,021 | | | | 87,330 | | | | 659,236 | | | $ | 7,429,588 | | | $ | 5,392 | | | $ | - | | | $ | (7,438 | ) |
MML Concentrated Growth Fund, Class I | | | 322,662 | | | | 86,596 | | | | 148,733 | | | | 260,525 | | | | 1,870,566 | | | | 6,074 | | | | - | | | | (432,342 | ) |
MML Equity Fund, Initial Class | | | 219,709 | | | | 62,506 | | | | 58,246 | | | | 223,969 | | | | 4,384,126 | | | | 68,467 | | | | - | | | | (277,841 | ) |
MML Equity Income Fund, Initial Class | | | 523,006 | | | | 379,279 | | | | 184,912 | | | | 717,373 | | | | 6,771,998 | | | | 108,065 | | | | - | | | | (233,617 | ) |
MML Foreign Fund, Initial Class | | | 160,993 | | | | 137,465 | | | | 20,805 | | | | 277,653 | | | | 2,557,184 | | | | 35,989 | | | | - | | | | 24,281 | |
MML Fundamental Value Fund, Class II | | | - | | | | 367,378 | | | | 3,917 | | | | 363,461 | | | | 4,027,145 | | | | 18,662 | | | | 9,285 | | | | 1,656 | |
MML Global Fund, Class I | | | 262,400 | | | | 67,882 | | | | 31,636 | | | | 298,646 | | | | 2,526,548 | | | | 12,920 | | | | - | | | | 47,671 | |
MML High Yield Fund, Class II | | | - | | | | 62,365 | | | | 3,486 | | | | 58,879 | | | | 599,391 | | | | 19,344 | | | | - | | | | 1,704 | |
MML Income & Growth Fund, Initial Class | | | 751,028 | | | | 19,763 | | | | 770,791 | | | | - | | | | - | | | | - | | | | - | | | | 760,060 | |
MML Inflation-Protected and Income Fund, Initial Class | | | 93,347 | | | | 94,933 | | | | 66,057 | | | | 122,223 | | | | 1,309,008 | | | | 26,734 | | | | - | | | | 60,858 | |
MML Large Cap Growth Fund, Initial Class | | | - | | | | 369,288 | | | | 3,386 | | | | 365,902 | | | | 3,823,675 | | | | 2,966 | | | | - | | | | (18 | ) |
MML Managed Bond Fund, Initial Class | | | 192,054 | | | | 70,275 | | | | 139,448 | | | | 122,881 | | | | 1,573,036 | | | | 73,332 | | | | 13,672 | | | | 96,728 | |
MML Mid Cap Growth Fund, Initial Class | | | 360,350 | | | | 73,241 | | | | 50,655 | | | | 382,936 | | | | 4,683,306 | | | | - | | | | - | | | | 22,535 | |
MML Mid Cap Value Fund, Initial Class | | | 341,400 | | | | 76,044 | | | | 38,481 | | | | 378,963 | | | | 3,963,955 | | | | 50,011 | | | | - | | | | 15,810 | |
MML PIMCO Total Return Fund, Class II | | | - | | | | 177,055 | | | | 689 | | | | 176,366 | | | | 1,746,027 | | | | 2,767 | | | | 4,596 | | | | 7 | |
MML Short-Duration Bond Fund, Class II | | | - | | | | 173,864 | | | | 4,239 | | | | 169,625 | | | | 1,718,298 | | | | 19,195 | | | | - | | | | 532 | |
MML Small Cap Equity Fund, Initial Class | | | 192,747 | | | | 31,323 | | | | 154,740 | | | | 69,330 | | | | 642,761 | | | | 4,008 | | | | - | | | | 403,151 | |
MML Small Cap Growth Equity Fund, Initial Class | | | 169,888 | | | | 37,038 | | | | 66,711 | | | | 140,215 | | | | 2,482,112 | | | | - | | | | - | | | | 58,358 | |
MML Small Company Value Fund, Class II | | | 184,956 | | | | 49,191 | | | | 43,967 | | | | 190,180 | | | | 3,290,121 | | | | 24,758 | | | | 261,929 | | | | 205,242 | |
Oppenheimer Capital Appreciation Fund, Non-Service Shares | | | 82,052 | | | | 36,125 | | | | 70,443 | | | | 47,734 | | | | 1,926,071 | | | | 5,214 | | | | - | | | | 557,832 | |
Oppenheimer Global Securities Fund, Non-Service Shares | | | 55,388 | | | | 12,914 | | | | 6,726 | | | | 61,576 | | | | 1,865,752 | | | | 21,106 | | | | - | | | | 51,900 | |
Oppenheimer International Growth Fund, Non-Service Shares | | | 2,031,270 | | | | 584,028 | | | | 273,169 | | | | 2,342,129 | | | | 4,379,782 | | | | 41,942 | | | | - | | | | 28,766 | |
Oppenheimer Global Strategic Income Fund, Non-Service Shares | | | 276,105 | | | | 93,951 | | | | 201,692 | | | | 168,364 | | | | 939,472 | | | | 128,403 | | | | - | | | | 59,410 | |
| | | | | | | | | | | | | | | | | | | | | | | | | | | | | | | | |
| | | | | | | | | | | | | | | | | | $ | 64,509,922 | | | $ | 675,349 | | | $ | 289,482 | | | $ | 1,445,245 | |
| | | | | | | | | | | | | | | | | | | | | | | | | | | | | | | | |
Balanced Allocation Fund | | | | | | | | | | | | | | | | | | | | | | | | | | | | | | | | |
MML Blue Chip Growth Fund, Initial Class | | | 1,209,335 | | | | 1,162,779 | | | | 92,702 | | | | 2,279,412 | | | $ | 25,688,975 | | | $ | 17,320 | | | $ | - | | | $ | 346,494 | |
MML Concentrated Growth Fund, Class I | | | 936,488 | | | | 114,462 | | | | 368,574 | | | | 682,376 | | | | 4,899,461 | | | | 18,805 | | | | - | | | | 326,337 | |
MML Equity Fund, Initial Class | | | 797,742 | | | | 196,361 | | | | 235,398 | | | | 758,705 | | | | 14,851,454 | | | | 231,944 | | | | - | | | | 916,998 | |
MML Equity Income Fund, Initial Class | | | 2,025,761 | | | | 1,121,934 | | | | 327,005 | | | | 2,820,690 | | | | 26,627,311 | | | | 389,966 | | | | - | | | | 496,994 | |
MML Foreign Fund, Initial Class | | | 311,525 | | | | 527,133 | | | | 38,718 | | | | 799,940 | | | | 7,367,448 | | | | 106,606 | | | | - | | | | 53,905 | |
MML Fundamental Value Fund, Class II | | | - | | | | 1,323,637 | | | | 29,946 | | | | 1,293,691 | | | | 14,334,097 | | | | 66,423 | | | | 33,048 | | | | 17,525 | |
MML Global Fund, Class I | | | 761,738 | | | | 166,734 | | | | 69,556 | | | | 858,916 | | | | 7,266,425 | | | | 38,185 | | | | - | | | | 120,468 | |
MML High Yield Fund, Class II | | | - | | | | 881,648 | | | | 12,893 | | | | 868,755 | | | | 8,843,929 | | | | 389,359 | | | | - | | | | 7,697 | |
MML Income & Growth Fund, Initial Class | | | 2,544,618 | | | | 41,801 | | | | 2,586,419 | | | | - | | | | - | | | | - | | | | - | | | | 3,004,704 | |
MML Inflation-Protected and Income Fund, Initial Class | | | 2,166,049 | | | | 302,498 | | | | 1,141,941 | | | | 1,326,606 | | | | 14,207,951 | | | | 606,572 | | | | - | | | | 1,448,538 | |
MML Large Cap Growth Fund, Initial Class | | | - | | | | 1,089,078 | | | | 25,055 | | | | 1,064,023 | | | | 11,119,039 | | | | 8,735 | | | | - | | | | 5,905 | |
61
Notes to Financial Statements (Continued)
| | | | | | | | | | | | | | | | | | | | | | | | | | | | | | | | |
| | | Number of
Shares
Held as of
12/31/09 | | | Purchases | | | Sales | | | Number of
Shares
Held as of
12/31/10 | | | Value as of
12/31/10 | | | Dividend
Income | | | Realized
Gains
Distributions | | | Net
Realized
Gain (Loss) | |
Balanced Allocation Fund (Continued) | | | | | | | | | | | | | | | | | | | | | | | | | | | | | | | | |
MML Managed Bond Fund, Initial Class | | | 6,671,754 | | | | 1,385,830 | | | | 2,477,214 | | | | 5,580,370 | | | $ | 71,435,794 | | | $ | 2,859,733 | | | $ | 430,322 | | | $ | 1,976,268 | |
MML Mid Cap Growth Fund, Initial Class | | | 897,696 | | | | 146,324 | | | | 76,067 | | | | 967,953 | | | | 11,838,063 | | | | - | | | | - | | | | 18,462 | |
MML Mid Cap Value Fund, Initial Class | | | 991,321 | | | | 179,272 | | | | 83,495 | | | | 1,087,098 | | | | 11,371,046 | | | | 147,038 | | | | - | | | | 25,672 | |
MML Money Market Fund, Initial Class | | | 50,667 | | | | 17 | | | | - | | | | 50,684 | | | | 50,636 | | | | 17 | | | | - | | | | - | |
MML PIMCO Total Return Fund, Class II | | | - | | | | 2,179,810 | | | | 33,711 | | | | 2,146,099 | | | | 21,246,383 | | | | 85,493 | | | | 141,952 | | | | 2,581 | |
MML Short-Duration Bond Fund, Class II | | | - | | | | 3,063,391 | | | | 127,251 | | | | 2,936,140 | | | | 29,743,093 | | | | 401,873 | | | | - | | | | 24,118 | |
MML Small Cap Equity Fund, Initial Class | | | 1,121,137 | | | | 148,998 | | | | 863,638 | | | | 406,497 | | | | 3,768,648 | | | | 24,065 | | | | - | | | | 2,162,653 | |
MML Small Cap Growth Equity Fund, Initial Class | | | 395,255 | | | | 113,520 | | | | 94,073 | | | | 414,702 | | | | 7,341,102 | | | | - | | | | - | | | | 424,983 | |
MML Small Company Value Fund, Class II | | | 538,107 | | | | 98,875 | | | | 190,930 | | | | 446,052 | | | | 7,716,700 | | | | 58,455 | | | | 619,050 | | | | 936,362 | |
Oppenheimer Capital Appreciation Fund, Non-Service Shares | | | 238,296 | | | | 95,579 | | | | 163,056 | | | | 170,819 | | | | 6,892,552 | | | | 15,382 | | | | - | | | | 1,753,175 | |
Oppenheimer Global Securities Fund, Non-Service Shares | | | 321,620 | | | | 63,608 | | | | 43,922 | | | | 341,306 | | | | 10,341,559 | | | | 124,415 | | | | - | | | | 359,063 | |
Oppenheimer International Growth Fund, Non-Service Shares | | | 5,055,280 | | | | 1,424,931 | | | | 920,366 | | | | 5,559,845 | | | | 10,396,910 | | | | 105,991 | | | | - | | | | 637,942 | |
Oppenheimer Global Strategic Income Fund, Non-Service Shares | | | 6,406,610 | | | | 1,448,906 | | | | 3,882,100 | | | | 3,973,416 | | | | 22,171,662 | | | | 3,029,518 | | | | - | | | | 1,783,231 | |
| | | | | | | | | | | | | | | | | | | | | | | | | | | | | | | | |
| | | | | | | | | | | | | | | | | | $ | 349,520,238 | | | $ | 8,725,895 | | | $ | 1,224,372 | | | $ | 16,850,075 | |
| | | | | | | | | | | | | | | | | | | | | | | | | | | | | | | | |
Conservative Allocation Fund | | | | | | | | | | | | | | | | | | | | | | | | | | | | | | | | |
MML Blue Chip Growth Fund, Initial Class | | | 731,733 | | | | 967,684 | | | | 130,929 | | | | 1,568,488 | | | $ | 17,676,861 | | | $ | 12,582 | | | $ | - | | | $ | 591,414 | |
MML Concentrated Growth Fund, Class I | | | 755,187 | | | | 154,029 | | | | 436,915 | | | | 472,301 | | | | 3,391,121 | | | | 14,343 | | | | - | | | | 514,356 | |
MML Equity Fund, Initial Class | | | 515,200 | | | | 183,290 | | | | 232,697 | | | | 465,793 | | | | 9,117,770 | | | | 155,814 | | | | - | | | | 1,092,227 | |
MML Equity Income Fund, Initial Class | | | 1,363,103 | | | | 1,094,300 | | | | 340,622 | | | | 2,116,781 | | | | 19,982,408 | | | | 302,983 | | | | - | | | | 796,777 | |
MML Foreign Fund, Initial Class | | | 251,327 | | | | 479,543 | | | | 58,573 | | | | 672,297 | | | | 6,191,852 | | | | 93,165 | | | | - | | | | 86,102 | |
MML Fundamental Value Fund, Class II | | | - | | | | 923,648 | | | | 23,347 | | | | 900,301 | | | | 9,975,338 | | | | 46,225 | | | | 22,998 | | | | 20,805 | |
MML Global Fund, Class I | | | 614,680 | | | | 226,903 | | | | 84,988 | | | | 756,595 | | | | 6,400,794 | | | | 35,000 | | | | - | | | | 164,987 | |
MML High Yield Fund, Class II | | | - | | | | 933,155 | | | | 52,985 | | | | 880,170 | | | | 8,960,129 | | | | 399,681 | | | | - | | | | 31,040 | |
MML Income & Growth Fund, Initial Class | | | 1,760,353 | | | | 79,925 | | | | 1,840,278 | | | | - | | | | - | | | | - | | | | - | | | | 2,158,654 | |
MML Inflation-Protected and Income Fund, Initial Class | | | 2,183,672 | | | | 414,793 | | | | 1,242,169 | | | | 1,356,296 | | | | 14,525,932 | | | | 628,667 | | | | - | | | | 1,459,893 | |
MML Large Cap Growth Fund, Initial Class | | | - | | | | 825,688 | | | | 59,752 | | | | 765,936 | | | | 8,004,031 | | | | 6,701 | | | | - | | | | 17,671 | |
MML Managed Bond Fund, Initial Class | | | 6,277,928 | | | | 2,158,265 | | | | 2,491,522 | | | | 5,944,671 | | | | 76,099,302 | | | | 2,928,201 | | | | 407,153 | | | | 2,220,556 | |
MML Mid Cap Growth Fund, Initial Class | | | 483,092 | | | | 138,098 | | | | 68,754 | | | | 552,436 | | | | 6,756,288 | | | | - | | | | - | | | | 324,144 | |
MML Mid Cap Value Fund, Initial Class | | | 800,250 | | | | 243,153 | | | | 107,653 | | | | 935,750 | | | | 9,787,946 | | | | 131,380 | | | | - | | | | 242,810 | |
MML Money Market Fund, Initial Class | | | 67,136 | | | | 22 | | | | - | | | | 67,158 | | | | 67,095 | | | | 22 | | | | - | | | | - | |
MML PIMCO Total Return Fund, Class II | | | - | | | | 2,350,474 | | | | 105,002 | | | | 2,245,472 | | | | 22,230,173 | | | | 92,438 | | | | 153,482 | | | | 9,125 | |
MML Short-Duration Bond Fund, Class II | | | - | | | | 2,891,419 | | | | 161,753 | | | | 2,729,666 | | | | 27,651,513 | | | | 386,104 | | | | - | | | | 31,766 | |
MML Small Cap Equity Fund, Initial Class | | | 603,478 | | | | 113,232 | | | | 385,385 | | | | 331,325 | | | | 3,071,719 | | | | 20,857 | | | | - | | | | 1,350,406 | |
MML Small Cap Growth Equity Fund, Initial Class | | | 319,099 | | | | 69,053 | | | | 214,342 | | | | 173,810 | | | | 3,076,817 | | | | - | | | | - | | | | 955,550 | |
MML Small Company Value Fund, Class II | | | 289,773 | | | | 146,594 | | | | 69,064 | | | | 367,303 | | | | 6,354,341 | | | | 48,656 | | | | 513,418 | | | | 300,847 | |
Oppenheimer Capital Appreciation Fund, Non-Service Shares | | | 128,193 | | | | 78,849 | | | | 102,068 | | | | 104,974 | | | | 4,235,688 | | | | 8,363 | | | | - | | | | 650,462 | |
Oppenheimer Global Securities Fund, Non-Service Shares | | | 173,029 | | | | 57,000 | | | | 31,046 | | | | 198,983 | | | | 6,029,170 | | | | 67,440 | | | | - | | | | 328,393 | |
Oppenheimer International Growth Fund, Non-Service Shares | | | 2,719,930 | | | | 1,468,631 | | | | 637,937 | | | | 3,550,624 | | | | 6,639,666 | | | | 57,457 | | | | - | | | | 446,475 | |
Oppenheimer Global Strategic Income Fund,
Non-Service Shares | | | 6,456,684 | | | | 1,676,231 | | | | 4,204,657 | | | | 3,928,258 | | | | 21,919,682 | | | | 3,056,732 | | | | - | | | | 2,857,646 | |
| | | | | | | | | | | | | | | | | | | | | | | | | | | | | | | | |
| | | | | | | | | | | | | | | | | | $ | 298,145,636 | | | $ | 8,492,811 | | | $ | 1,097,051 | | | $ | 16,652,106 | |
| | | | | | | | | | | | | | | | | | | | | | | | | | | | | | | | |
62
Notes to Financial Statements (Continued)
| | | | | | | | | | | | | | | | | | | | | | | | | | | | | | | | |
| | | Number of
Shares
Held as of
12/31/09 | | | Purchases | | | Sales | | | Number of
Shares
Held as of
12/31/10 | | | Value as of
12/31/10 | | | Dividend
Income | | | Realized
Gains
Distributions | | | Net
Realized
Gain (Loss) | |
Growth Allocation Fund | | | | | | | | | | | | | | | | | | | | | | | | | | | | | | | | |
MML Blue Chip Growth Fund, Initial Class | | | 6,587,287 | | | | 5,629,876 | | | | 108,863 | | | | 12,108,300 | | | $ | 136,460,540 | | | $ | 93,441 | | | $ | - | | | $ | 300,088 | |
MML Concentrated Growth Fund, Class I | | | 5,101,520 | | | | 676,397 | | | | 1,199,301 | | | | 4,578,616 | | | | 32,874,465 | | | | 125,528 | | | | - | | | | (2,296,374 | ) |
MML Equity Fund, Initial Class | | | 4,053,802 | | | | 640,673 | | | | 471,170 | | | | 4,223,305 | | | | 82,670,103 | | | | 1,491,041 | | | | - | | | | (1,215,913 | ) |
MML Equity Income Fund, Initial Class | | | 9,803,903 | | | | 5,140,917 | | | | 891,527 | | | | 14,053,293 | | | | 132,663,084 | | | | 1,931,411 | | | | - | | | | (597,572 | ) |
MML Foreign Fund, Initial Class | | | 2,262,522 | | | | 2,094,156 | | | | 70,738 | | | | 4,285,940 | | | | 39,473,505 | | | | 581,337 | | | | - | | | | 76,144 | |
MML Fundamental Value Fund, Class II | | | - | | | | 5,419,910 | | | | 43,519 | | | | 5,376,391 | | | | 59,570,408 | | | | 276,045 | | | | 137,342 | | | | 19,331 | |
MML Global Fund, Class I | | | 4,149,203 | | | | 606,107 | | | | 110,850 | | | | 4,644,460 | | | | 39,292,128 | | | | 210,478 | | | | - | | | | 165,234 | |
MML High Yield Fund, Class II | | | - | | | | 2,201,801 | | | | 77,514 | | | | 2,124,287 | | | | 21,625,245 | | | | 966,074 | | | | - | | | | 35,978 | |
MML Income & Growth Fund, Initial Class | | | 13,197,032 | | | | 244,314 | | | | 13,441,346 | | | | - | | | | - | | | | - | | | | - | | | | 14,020,659 | |
MML Inflation-Protected and Income Fund, Initial Class | | | 3,934,339 | | | | 545,453 | | | | 1,827,690 | | | | 2,652,102 | | | | 28,404,009 | | | | 1,160,973 | | | | - | | | | 2,911,522 | |
MML Large Cap Growth Fund, Initial Class | | | - | | | | 6,068,429 | | | | 43,354 | | | | 6,025,075 | | | | 62,962,031 | | | | 50,701 | | | | - | | | | 4,535 | |
MML Managed Bond Fund, Initial Class | | | 12,907,605 | | | | 2,656,623 | | | | 6,323,211 | | | | 9,241,017 | | | | 118,296,699 | | | | 5,166,069 | | | | 873,383 | | | | 4,876,357 | |
MML Mid Cap Growth Fund, Initial Class | | | 5,429,783 | | | | 587,030 | | | | 557,339 | | | | 5,459,474 | | | | 66,769,370 | | | | - | | | | - | | | | 761,533 | |
MML Mid Cap Value Fund, Initial Class | | | 5,999,531 | | | | 754,128 | | | | 145,827 | | | | 6,607,832 | | | | 69,117,922 | | | | 912,085 | | | | - | | | | 69,192 | |
MML Money Market Fund, Initial Class | | | 158,820 | | | | 53 | | | | - | | | | 158,873 | | | | 158,722 | | | | 53 | | | | - | | | | - | |
MML PIMCO Total Return Fund, Class II | | | - | | | | 3,931,215 | | | | 10,446 | | | | 3,920,769 | | | | 38,815,615 | | | | 123,291 | | | | 204,711 | | | | 971 | |
MML Short-Duration Bond Fund, Class II | | | - | | | | 6,707,663 | | | | 104,821 | | | | 6,602,842 | | | | 66,886,790 | | | | 980,234 | | | | - | | | | 16,532 | |
MML Small Cap Equity Fund, Initial Class | | | 4,067,372 | | | | 231,919 | | | | 2,823,223 | | | | 1,476,068 | | | | 13,684,664 | | | | 93,124 | | | | - | | | | 7,639,463 | |
MML Small Cap Growth Equity Fund, Initial Class | | | 2,868,054 | | | | 432,672 | | | | 1,132,309 | | | | 2,168,417 | | | | 38,385,606 | | | | - | | | | - | | | | 3,149,555 | |
MML Small Company Value Fund, Class II | | | 3,253,184 | | | | 598,364 | | | | 638,243 | | | | 3,213,305 | | | | 55,590,170 | | | | 418,432 | | | | 4,436,618 | | | | 3,333,773 | |
Oppenheimer Capital Appreciation Fund, Non-Service Shares | | | 1,441,894 | | | | 464,863 | | | | 952,522 | | | | 954,235 | | | | 38,503,388 | | | | 93,850 | | | | - | | | | 9,268,405 | |
Oppenheimer Global Securities Fund, Non-Service Shares | | | 1,167,811 | | | | 151,275 | | | | 49,725 | | | | 1,269,361 | | | | 38,461,632 | | | | 455,711 | | | | - | | | | 505,888 | |
Oppenheimer International Growth Fund, Non-Service Shares | | | 36,709,196 | | | | 5,740,645 | | | | 1,047,257 | | | | 41,402,584 | | | | 77,422,832 | | | | 776,495 | | | | - | | | | 447,584 | |
Oppenheimer Global Strategic Income Fund, Non-Service Shares | | | 9,698,680 | | | | 2,033,691 | | | | 5,269,073 | | | | 6,463,298 | | | | 36,065,205 | | | | 4,668,929 | | | | - | | | | 2,368,248 | |
| | | | | | | | | | | | | | | | | | | | | | | | | | | | | | | | |
| | | | | | | | | | | | | | | | | | $ | 1,294,154,133 | | | $ | 20,575,302 | | | $ | 5,652,054 | | | $ | 45,861,133 | |
| | | | | | | | | | | | | | | | | | | | | | | | | | | | | | | | |
Moderate Allocation Fund | | | | | | | | | | | | | | | | | | | | | | | | | | | | | | | | |
MML Blue Chip Growth Fund, Initial Class | | | 3,928,425 | | | | 3,938,697 | | | | 64,015 | | | | 7,803,107 | | | $ | 87,941,017 | | | $ | 59,180 | | | $ | - | | | $ | 243,010 | |
MML Concentrated Growth Fund, Class I | | | 3,650,862 | | | | 595,123 | | | | 1,567,598 | | | | 2,678,387 | | | | 19,230,820 | | | | 84,710 | | | | - | | | | (280,127 | ) |
MML Equity Fund, Initial Class | | | 2,486,549 | | | | 650,943 | | | | 33,762 | | | | 3,103,730 | | | | 60,754,710 | | | | 969,493 | | | | - | | | | (55,743 | ) |
MML Equity Income Fund, Initial Class | | | 6,138,315 | | | | 3,721,745 | | | | 626,778 | | | | 9,233,282 | | | | 87,162,180 | | | | 1,249,478 | | | | - | | | | (251,356 | ) |
MML Foreign Fund, Initial Class | | | 1,619,241 | | | | 1,844,375 | | | | 33,790 | | | | 3,429,826 | | | | 31,588,695 | | | | 449,125 | | | | - | | | | 49,292 | |
MML Fundamental Value Fund, Class II | | | - | | | | 3,515,773 | | | | 16,659 | | | | 3,499,114 | | | | 38,770,187 | | | | 179,658 | | | | 89,386 | | | | 7,039 | |
MML Global Fund, Class I | | | 1,979,604 | | | | 610,041 | | | | 39,940 | | | | 2,549,705 | | | | 21,570,504 | | | | 108,917 | | | | - | | | | 76,540 | |
MML High Yield Fund, Class II | | | - | | | | 2,214,719 | | | | 54,111 | | | | 2,160,608 | | | | 21,994,989 | | | | 955,006 | | | | - | | | | 27,758 | |
MML Income & Growth Fund, Initial Class | | | 6,610,952 | | | | 136,835 | | | | 6,747,787 | | | | - | | | | - | | | | - | | | | - | | | | 7,941,700 | |
MML Inflation-Protected and Income Fund, Initial Class | | | 4,224,035 | | | | 778,285 | | | | 1,978,825 | | | | 3,023,495 | | | | 32,381,633 | | | | 1,273,729 | | | | - | | | | 2,883,113 | |
MML Large Cap Growth Fund, Initial Class | | | - | | | | 3,726,780 | | | | 22,617 | | | | 3,704,163 | | | | 38,708,505 | | | | 30,227 | | | | - | | | | 9,179 | |
MML Managed Bond Fund, Initial Class | | | 14,449,442 | | | | 3,462,791 | | | | 5,336,137 | | | | 12,576,096 | | | | 160,989,930 | | | | 6,429,849 | | | | 967,622 | | | | 4,331,198 | |
MML Mid Cap Growth Fund, Initial Class | | | 3,109,018 | | | | 608,779 | | | | 46,726 | | | | 3,671,071 | | | | 44,897,199 | | | | - | | | | - | | | | 23,056 | |
MML Mid Cap Value Fund, Initial Class | | | 2,575,847 | | | | 555,428 | | | | 41,472 | | | | 3,089,803 | | | | 32,319,343 | | | | 411,619 | | | | - | | | | 37,067 | |
MML Money Market Fund, Initial Class | | | 137,355 | | | | 46 | | | | - | | | | 137,401 | | | | 137,270 | | | | 45 | | | | - | | | | - | |
MML PIMCO Total Return Fund, Class II | | | - | | | | 4,936,231 | | | | 6,944 | | | | 4,929,287 | | | | 48,799,943 | | | | 193,514 | | | | 321,307 | | | | 1,040 | |
MML Short-Duration Bond Fund, Class II | | | - | | | | 7,359,737 | | | | 45,288 | | | | 7,314,449 | | | | 74,095,366 | | | | 973,680 | | | | - | | | | 8,133 | |
MML Small Cap Equity Fund, Initial Class | | | 2,911,569 | | | | 340,800 | | | | 2,095,384 | | | | 1,156,985 | | | | 10,726,436 | | | | 70,388 | | | | - | | | | 4,497,583 | |
MML Small Cap Growth Equity Fund, Initial Class | | | 1,539,832 | | | | 348,660 | | | | 773,671 | | | | 1,114,821 | | | | 19,734,713 | | | | - | | | | - | | | | 2,963,610 | |
MML Small Company Value Fund, Class II | | | 1,862,799 | | | | 465,358 | | | | 428,221 | | | | 1,899,936 | | | | 32,868,896 | | | | 248,065 | | | | 2,625,380 | | | | 2,291,009 | |
63
Notes to Financial Statements (Continued)
| | | | | | | | | | | | | | | | | | | | | | | | | | | | | | | | |
| | | Number of
Shares
Held as of
12/31/09 | | | Purchases | | | Sales | | | Number of
Shares
Held as of
12/31/10 | | | Value as of
12/31/10 | | | Dividend
Income | | | Realized
Gains
Distributions | | | Net
Realized
Gain (Loss) | |
Moderate Allocation Fund (Continued) | | | | | | | | | | | | | | | | | | | | | | | | | | | | | | | | |
Oppenheimer Capital Appreciation Fund, Non-Service Shares | | | 825,521 | | | | 299,104 | | | | 571,860 | | | | 552,765 | | | $ | 22,304,072 | | | $ | 54,085 | | | $ | - | | | $ | 5,490,364 | |
Oppenheimer Global Securities Fund,
Non-Service Shares | | | 835,722 | | | | 191,520 | | | | 45,431 | | | | 981,811 | | | | 29,748,888 | | | | 328,467 | | | | - | | | | 491,439 | |
Oppenheimer International Growth Fund, Non-Service Shares | | | 17,512,056 | | | | 5,797,170 | | | | 1,959,394 | | | | 21,349,832 | | | | 39,924,187 | | | | 373,184 | | | | - | | | | 1,464,084 | |
Oppenheimer Global Strategic Income Fund,
Non-Service Shares | | | 12,496,195 | | | | 3,227,142 | | | | 7,023,150 | | | | 8,700,187 | | | | 48,547,042 | | | | 6,060,589 | | | | - | | | | 1,764,249 | |
| | | | | | | | | | | | | | | | | | | | | | | | | | | | | | | | |
| | | | | | | | | | | | | | | | | | $ | 1,005,196,525 | | | $ | 20,503,008 | | | $ | 4,003,695 | | | $ | 34,013,237 | |
| | | | | | | | | | | | | | | | | | | | | | | | | | | | | | | | |
Under the Funds’ organizational documents, current and former Trustees and Officers are provided with specified rights to indemnification against liabilities arising in connection with the performance of their duties to the Funds, and shareholders are indemnified against personal liability for obligations of the Funds. In the normal course of business, the Funds may also enter into contracts that provide general indemnifications. The Funds’ maximum exposure under these arrangements is unknown as this would be dependent on future claims that may be made against the Funds. The risk of material loss from such claims is considered remote.
| 9. | | New Accounting Pronouncements |
In January 2010, the Financial Accounting Standards Board issued Accounting Standards Updated No. 2010-06, “Improving Disclosures About Fair Value Measurements” (“ASU”). The ASU requires enhanced disclosures about purchases, sales, issuances, and settlements on a gross basis relating to Level 3 measurements. The disclosure will be effective for fiscal years beginning after December 15, 2010, and for interim periods within those fiscal years. Management is currently evaluating the impact the adoption of this ASU will have on the Funds’ financial statement disclosures.
Management has evaluated the events and transactions subsequent to December 31, 2010 through the date when the financial statements were issued, and determined that there are no material events or transactions that would require adjustments to or disclosures in the Funds’ financial statements.
64
Report of Independent Registered Public Accounting Firm
To the Board of Trustees of MML Series Investment Fund and Shareholders of MML Aggressive Allocation Fund, MML Balanced Allocation Fund, MML Conservative Allocation Fund, MML Growth Allocation Fund, MML Moderate Allocation Fund, MML American Funds Core Allocation Fund, MML American Funds Growth Fund, and MML American Funds International Fund:
We have audited the accompanying statements of assets and liabilities, including the portfolios of investments, of MML Aggressive Allocation Fund, MML Balanced Allocation Fund, MML Conservative Allocation Fund, MML Growth Allocation Fund, MML Moderate Allocation Fund, MML American Funds Core Allocation Fund, MML American Funds Growth Fund, and MML American Funds International Fund (collectively the “Funds”), eight of the funds comprising the MML Series Investment Fund (the “Trust”) as of December 31, 2010, and the related statements of operations for the year then ended, the statements of changes in net assets for each of the two years in the period then ended, and the financial highlights for each of the periods presented. These financial statements and financial highlights are the responsibility of the Funds’ management. Our responsibility is to express an opinion on these financial statements and financial highlights based on our audits.
We conducted our audits in accordance with the standards of the Public Company Accounting Oversight Board (United States). Those standards require that we plan and perform the audits to obtain reasonable assurance about whether the financial statements and financial highlights are free of material misstatement. The Funds are not required to have, nor were we engaged to perform, an audit of their internal control over financial reporting. Our audits included consideration of internal control over financial reporting as a basis for designing audit procedures that are appropriate in the circumstances, but not for the purpose of expressing an opinion on the effectiveness of the Funds’ internal control over financial reporting. Accordingly, we express no such opinion. An audit also includes examining, on a test basis, evidence supporting the amounts and disclosures in the financial statements, assessing the accounting principles used and significant estimates made by management, as well as evaluating the overall financial statement presentation. Our procedures included confirmation of securities owned as of December 31, 2010, by correspondence with the custodian and brokers; where replies were not received from brokers, we performed other auditing procedures. We believe that our audits provide a reasonable basis for our opinion.
In our opinion, the financial statements and financial highlights referred to above present fairly, in all material respects, the financial position of each of Funds as of December 31, 2010, the results of their operations for the year then ended, the changes in their net assets for each of the two years in the period then ended, and the financial highlights for each of the periods presented, in conformity with accounting principles generally accepted in the United States of America.
Deloitte & Touche LLP
Boston, Massachusetts
February 18, 2011
65
Trustees and Officers (Unaudited)
The following table lists the Trust’s Trustees and Officers as of December 31, 2010; their address and age; their position with the Trust; the length of time holding that position with the Trust; their principal occupation(s) during the past five years; the number of portfolios in the fund complex they oversee; and other directorships they hold in companies subject to registration or reporting requirements of the Securities Exchange Act of 1934 (generally called “public companies”) or in registered investment companies. The Trust’s Statement of Additional Information includes additional information about the Trust’s Trustees and is available, without charge, upon request by calling 1-888-309-3539 or by writing MML Series Investment Fund, c/o Massachusetts Mutual Life Insurance Company, 1295 State Street, Springfield, Massachusetts 01111-0001, Attention: Retirement Services Marketing.
Disinterested Trustees
| | | | | | | | | | |
Name, Address*, and Age | | Position(s)
Held with
Trust | | Term of
Office** and
Length of
Time Served | | Principal Occupation(s) During Past 5 Years | | Number of
Portfolios in
Fund Complex
Overseen by Trustee | | Other Directorships Held by Trustee |
Richard H. Ayers Age: 68 | | Chairman Trustee | | Since 2010 Since 1999 | | Retired. | | 63 | | Director (since 2008), Celera Corporation; Director (1996-2008), Applera Corporation; Director (2002-2006), Instron Corporation; Chairman (since 2010), Trustee (since 1996), MassMutual Select Funds (open-end investment company). |
| | | | | |
Allan W. Blair Age: 62 | | Trustee | | Since 2003 | | President and Chief Executive Officer (since 1996), Economic Development Council of Western Massachusetts; President and Chief Executive Officer (1993-2006), Westmass Area Development Corporation; President and Chief Executive Officer (since 1984), Westover Metropolitan Development Corporation. | | 63 | | Director (2001-2007), Future Works, Inc.; Trustee (since 2003), MassMutual Select Funds (open-end investment company). |
| | | | | |
Mary E. Boland Age: 71 | | Trustee | | Since 1973 | | Attorney-at-Law (since 2004). | | 63 | | Director (1999-2007), BankNorth Massachusetts; Trustee (since 1994), MassMutual Select Funds (open-end investment company). |
| | | | | |
R. Alan Hunter, Jr. Age: 64 | | Trustee | | Since 2003 | | Retired. | | 63 | | Director (since 2007), Actuant Corporation; Trustee (since 2003), MassMutual Select Funds (open-end investment company). |
| | | | | |
F. William Marshall, Jr. Age: 68 | | Trustee | | Since 1996 | | Retired. Consultant (1999-2009). | | 99*** | | Trustee (since 2000), Denver Board – Oppenheimer Funds; Trustee (since 1996), MassMutual Select Funds (open-end investment company). |
| | | | | |
Susan B. Sweeney Age: 58 | | Trustee | | Since 2009 | | Senior Vice President and Chief Investment Officer (since 2010), Selective Insurance Group (property and casualty company); Senior Managing Director (2008-2010), Ironwood Capital (private equity firm); Chief Investment Officer, Pension Fund (2002-2007), Office of the Treasurer of the State of Connecticut. | | 63 | | Trustee (since 2009), MassMutual Select Funds (open-end investment company). |
66
Trustees and Officers (Unaudited) (Continued)
Interested Trustees
| | | | | | | | | | |
Name, Address*, and Age | | Position(s)
Held with
Trust | | Term of
Office** and
Length of
Time Served | | Principal Occupation(s) During Past 5 Years | | Number of
Portfolios in
Fund Complex
Overseen by Trustee | | Other Directorships Held by Trustee |
Robert E. Joyal^ Age: 65 | | Trustee | | Since 2003 | | Retired. | | 65^^ | | Director (since 2007), Scottish Re Group Ltd.; Director (since 2006), Jefferies Group, Inc. (investment bank); Director (1996-2005), Antares Capital Corporation (bank loan syndication); Director (since 2003), Alabama Aircraft Industries, Inc.; Trustee (since 2003), President (1999-2003), MassMutual Corporate Investors (closed-end investment company); Trustee (since 2003), President (1999-2003), MassMutual Participation Investors (closed-end investment company); Director (2005-2006), York Enhanced Strategies Fund (closed-end investment company); Trustee (since 2003), Vice Chairman (2005-2007), MassMutual Select Funds (open-end investment company). |
| | | | | |
Elaine A. Sarsynski^^^ Age: 55 | | Trustee | | Since 2008 | | Executive Vice President (since 2006), Senior Vice President and Chief Administrative Officer (2005-2006), MassMutual; Managing Director (2005), Babson Capital Management LLC; Chief Executive Officer (2001-2005), Town of Suffield, Connecticut. | | 63 | | Trustee (since 2008), MassMutual Select Funds (open-end investment company). |
67
Trustees and Officers (Unaudited) (Continued)
Principal Officers who are Not Trustees
| | | | | | | | |
Name, Address*, and Age | | Position(s) Held
with Trust | | Term of
Office# and
Length of
Time Served | | Principal Occupation(s) During Past 5 Years | | Number of
Portfolios in
Fund Complex
Overseen by Officer |
Richard J. Byrne Age: 48 | | President | | Since
2007 | | Vice President (since 2007), Assistant Vice President (2003-2007), MassMutual; President (since 2007), MML Series Investment Fund II (open-end investment company). | | 40 |
| | | | |
Michael C. Eldredge Age: 46 | | Vice President | | Since
2009 | | Vice President (since 2008), MassMutual; Vice President (2005-2008), Manager (1998-2005), ING; Vice President (since 2009), MassMutual Select Funds (open-end investment company); Vice President (since 2009), MassMutual Premier Funds (open-end investment company); Vice President (since 2009), MML Series Investment Fund II (open-end investment company). | | 95 |
| | | | |
Andrew M. Goldberg Age: 44 | | Vice President, Secretary and Chief Legal Officer Assistant Secretary | | Since
2008 (2001- 2008) | | Assistant Vice President and Counsel (since 2004), Counsel (2001-2004), MassMutual; Vice President, Secretary and Chief Legal Officer (since 2008), Assistant Secretary (2001-2008), MassMutual Select Funds (open-end investment company); Vice President, Clerk and Chief Legal Officer (since 2008), Assistant Clerk (2004-2008), MassMutual Premier Funds (open-end investment company); Vice President, Clerk and Chief Legal Officer (since 2008), Assistant Clerk (2005-2008), MML Series Investment Fund II (open-end investment company). | | 95 |
| | | | |
Nicholas H. Palmerino Age: 45 | | Chief Financial Officer and Treasurer | | Since
2006 | | Assistant Vice President (since 2006), MassMutual; Vice President (2006), Consultant (2005-2006), JP Morgan Chase Worldwide Securities Services; Chief Financial Officer and Treasurer (since 2006), MassMutual Select Funds (open-end investment company); Chief Financial Officer and Treasurer (since 2006), MassMutual Premier Funds (open-end investment company); Chief Financial Officer and Treasurer (since 2006), MML Series Investment Fund II (open-end investment company). | | 95 |
| | | | |
Philip S. Wellman Age: 46 | | Vice President and Chief Compliance Officer | | Since
2007 | | Vice President, Associate General Counsel and Chief Compliance Officer (Mutual Funds and Investment Advisory) (since 2008), Vice President, Associate General Counsel and Chief Compliance Officer (Mutual Funds) (2007-2008), Assistant Vice President and Associate General Counsel (2006-2007), MassMutual; Director, Office of General Counsel (2005-2006), Merrill Lynch, Pierce, Fenner & Smith Incorporated; Senior Vice President and Assistant General Counsel (2000-2006), Advest, Inc.; Vice President and Chief Compliance Officer (since 2007), MassMutual Select Funds (open-end investment company); Vice President and Chief Compliance Officer (since 2007), MassMutual Premier Funds (open-end investment company); Vice President and Chief Compliance Officer (since 2007), MML Series Investment Fund II (open-end investment company). | | 95 |
| | | | |
Eric H. Wietsma Age: 44 | | Vice President | | Since
2006 | | Senior Vice President (since 2010), Corporate Vice President (2007-2010), Vice President (2005-2007), MassMutual; Vice President (1999-2005), Hartford Life Insurance Company; President (since 2008), Vice President (2006-2008), MassMutual Select Funds (open-end investment company); President (since 2008), Vice President (2006-2008), MassMutual Premier Funds (open-end investment company); Vice President (since 2006), MML Series Investment Fund II (open-end investment company). | | 95 |
68
Trustees and Officers (Unaudited) (Continued)
| * | The address of each Trustee and Principal Officer is the same as that for the Trust; 1295 State Street, Springfield, Massachusetts 01111. |
| ** | Each Trustee of the Trust serves until the next meeting of shareholders called for the purpose of electing Trustees and until the election and qualification of his or her successor or until he or she dies, resigns or is removed. Notwithstanding the foregoing, unless the Trustees determine that it is desirable and in the best interest of the Trust that an exception to the retirement policy of the Trust be made, a Trustee shall retire and cease to serve as a Trustee upon the conclusion of the calendar year in which such Trustee attains the age of seventy-two years. |
| | The Chairperson is elected to hold such office for a term of three years or until his or her successor is elected and qualified to carry out the duties and responsibilities of his or her office, or until he or she retires, dies, resigns, is removed or becomes disqualified. |
| *** | Denver Board – Oppenheimer Funds is deemed to be part of the Fund Complex because it is managed by OppenheimerFunds, Inc., an indirect subsidiary of MassMutual. |
| ^ | Mr. Joyal is an “Interested Person,” as that term is defined in the 1940 Act, through his position as a director of Jefferies Group, Inc., a broker-dealer that may execute portfolio transactions and/or engage in principal transactions with the Funds, other investment companies advised by MassMutual or holding themselves out to investors as related companies for purposes of investment or investor services, or any other advisory accounts over which MassMutual has brokerage placement discretion. |
| ^^ | MassMutual Participation Investors and MassMutual Corporate Investors are deemed to be a part of the Fund Complex because they are managed by Babson Capital Management LLC, an indirect subsidiary of MassMutual. |
| ^^^ | Ms. Sarsynski is an Interested Person through her employment with MassMutual. |
| # | The President, Treasurer and Secretary are elected to hold such office until their successor is elected and qualified to carry out the duties and responsibilities of their office, or until he or she dies, resigns, is removed or becomes disqualified. Each other officer shall hold office at the pleasure of the Trustees. |
69
Federal Tax Information (Unaudited)
For corporate shareholders, a portion of the ordinary dividends paid during the Fund(s)’ year ended December 31, 2010, qualified for the dividends received deduction, as follows:
| | | | |
| |
| | | Dividends Received
Deductions | |
| Aggressive Allocation Fund | | | 52.24% | |
| Balanced Allocation Fund | | | 24.20% | |
| Conservative Allocation Fund | | | 17.26% | |
| Growth Allocation Fund | | | 42.56% | |
| Moderate Allocation Fund | | | 28.70% | |
| American Funds Core Allocation Fund | | | 41.90% | |
| American Funds Growth Fund | | | 100.00% | |
70
Other Information (Unaudited)
Proxy Voting
A description of the policies and procedures that each Fund’s investment adviser uses to vote proxies relating to the Fund’s portfolio securities is available, without charge, upon request, by calling 1-888-309-3539, and on the SEC’s website at http://www.sec.gov.
Information regarding how the Funds voted proxies relating to portfolio securities during the most recent 12-month period ended June 30 is available, without charge, upon request, on the MassMutual website at http://www.massmutual.com/funds and on the SEC’s website at http://www.sec.gov.
Quarterly Reporting
The Funds file their complete schedule of portfolio holdings with the SEC for the first and third quarters of each fiscal year on Form N-Q. The Funds’ Forms N-Q are available on the SEC website at http://www.sec.gov. The Funds’ Forms N-Q may be reviewed and copied at the SEC’s Public Reference Room in Washington D.C. Information on the operation of the SEC’s Public Reference Room may be obtained by calling 1-800-SEC-0330.
71
Other Information (Unaudited) (Continued)
Fund Expenses December 31, 2010
Expense Examples:
The following information is in regards to expenses for the six months ended December 31, 2010:
As a shareholder of the Funds, you incur ongoing costs, including management fees, distribution and/or service (12b-1) fees, and other Fund expenses. These examples are intended to help you understand your ongoing costs (in dollars) of investing in the Funds and to compare these costs with the ongoing costs of investing in other mutual funds. These examples are based on an investment of $1,000 invested for the six months ended December 31, 2010.
Actual Expenses:
The first four columns of the table below provide information about actual account values and actual expenses. You may use this information, together with the amount you invested, to estimate the expenses that you paid over the period. Simply divide your account value by $1,000 (for example, an $8,600 account value divided by $1,000 = 8.6), then multiply the result by the number under the heading entitled “Operating Expenses Incurred” to estimate the expenses you paid on your account during this period.
Hypothetical Example for Comparison Purposes:
The last two columns of the table below provide information about hypothetical account values and hypothetical expenses based on the Fund’s actual expense ratio and an assumed rate of return of 5% per year before expenses, which is not the Fund’s actual return. The hypothetical account values and expenses may not be used to estimate the actual ending account balance or expenses you paid for the period. You may use this information to compare the ongoing costs of investing in the Fund and other funds. To do so, compare this 5% hypothetical example with the 5% hypothetical examples that appear in the shareholder reports of the other funds.
Please note that the expenses shown in the table are meant to highlight your ongoing costs only and do not reflect any transactional costs. Therefore, the last two columns of the table are useful in comparing ongoing costs only, and will not help you determine the relative total costs of owning different funds. In addition, if these transactional costs were included, your costs would have been higher.
| | | | | | | | | | | | | | | | | | | | | | | | |
| | | Beginning
Value | | | Annualized
Expense
Ratio | | | Ending
Value (Based
on Actual
Returns and
Expenses) | | | Operating
Expenses
Incurred* | | | Ending
Value (Based
on
Hypothetical
Returns and
Expenses) | | | Operating
Expenses
Incurred* | |
| Aggressive Allocation Fund | | | | | | | | | | | | | | | | | | | | | | | | |
Initial Class | | $ | 1,000 | | | | 0.20 | % | | $ | 1,226.30 | | | $ | 1.12 | | | $ | 1,024.20 | | | $ | 1.02 | |
Service Class | | | 1,000 | | | | 0.45 | % | | | 1,224.30 | | | | 2.52 | | | | 1,022.90 | | | | 2.29 | |
| Balanced Allocation Fund | | | | | | | | | | | | | | | | | | | | | | | | |
Initial Class | | | 1,000 | | | | 0.13 | % | | | 1,134.60 | | | | 0.70 | | | | 1,024.60 | | | | 0.66 | |
Service Class | | | 1,000 | | | | 0.38 | % | | | 1,133.50 | | | | 2.04 | | | | 1,023.30 | | | | 1.94 | |
| Conservative Allocation Fund | | | | | | | | | | | | | | | | | | | | | | | | |
Initial Class | | | 1,000 | | | | 0.13 | % | | | 1,113.40 | | | | 0.69 | | | | 1,024.60 | | | | 0.66 | |
Service Class | | | 1,000 | | | | 0.38 | % | | | 1,111.40 | | | | 2.02 | | | | 1,023.30 | | | | 1.94 | |
| Growth Allocation Fund | | | | | | | | | | | | | | | | | | | | | | | | |
Initial Class | | | 1,000 | | | | 0.12 | % | | | 1,190.80 | | | | 0.66 | | | | 1,024.60 | | | | 0.61 | |
Service Class | | | 1,000 | | | | 0.37 | % | | | 1,188.40 | | | | 2.04 | | | | 1,023.30 | | | | 1.89 | |
| Moderate Allocation Fund | | | | | | | | | | | | | | | | | | | | | | | | |
Initial Class | | | 1,000 | | | | 0.12 | % | | | 1,156.40 | | | | 0.65 | | | | 1,024.60 | | | | 0.61 | |
Service Class | | | 1,000 | | | | 0.37 | % | | | 1,155.40 | | | | 2.01 | | | | 1,023.30 | | | | 1.89 | |
72
Other Information (Unaudited) (Continued)
| | | | | | | | | | | | | | | | | | | | | | | | |
| | | Beginning
Value | | | Annualized
Expense
Ratio | | | Ending
Value (Based
on Actual
Returns and
Expenses) | | | Operating
Expenses
Incurred* | | | Ending
Value (Based
on
Hypothetical
Returns and
Expenses) | | | Operating
Expenses
Incurred* | |
| American Funds Core Allocation Fund | | | | | | | | | | | | | | | | | | | | | | | | |
Service Class I | | $ | 1,000 | | | | 0.76 | % | | $ | 1,143.10 | | | $ | 4.11 | | | $ | 1,021.40 | | | $ | 3.87 | |
| American Funds Growth Fund | | | | | | | | | | | | | | | | | | | | | | | | |
Service Class I** | | | 1,000 | | | | 1.29 | % | | | 1,252.70 | | | | 7.32 | | | | 1,018.70 | | | | 6.56 | |
| American Funds International Fund | | | | | | | | | | | | | | | | | | | | | | | | |
Service Class I** | | | 1,000 | | | | 1.48 | % | | | 1,234.60 | | | | 8.34 | | | | 1,017.70 | | | | 7.53 | |
| * | Expenses are calculated using the annualized expense ratio for the six months ended December 31, 2010, multiplied by the average account value over the period, multiplied by the number of days in the period, divided by the number of days in the year, unless stated otherwise. |
| ** | The annualized expense ratio reflects the expenses of both the Feeder Fund and the Master Fund in which it invests. |
73

Table of Contents
This material must be preceded or accompanied by a current prospectus (or summary prospectus, if available) for the MML Series Investment Fund. Investors should consider a Fund’s investment objective, risks and charges and expenses carefully before investing. This and other information about the investment company is available in the prospectus (or summary prospectus, if available). Read it carefully before investing.
MML Series Investment Fund – President’s Letter to Shareholders
To Our Shareholders

Richard J. Byrne
“MassMutual’s view is that a retirement investment plan tailored to your time horizon and your tolerance for risk can help you navigate short-term gyrations in the markets. By monitoring your plan regularly and adjusting your retirement planning strategy when appropriate, you can help yourself as you pursue your long-term financial objectives.”
December 31, 2010
Cautious optimism emerges as recovery continues
I am pleased to present you with the MML Series Investment Fund Annual Report, covering the year ended December 31, 2010. Equity markets worldwide advanced during this period (some in the double digits), yet volatility continued to be a factor. Investors in the U.S. and abroad repeatedly demonstrated how connected we all are to the global economy in this modern era, driving U.S. and foreign markets up and down in reaction to the latest news events and economic data from around the world. Despite generally improving market conditions, economic challenges remained for most of the countries where markets advanced. But investors in the U.S. found reason for optimism, as several economic indicators in December pointed to possible signs of sustained recovery.
Retirement investing is a long-term proposition
If you work with a financial professional, you may wish to consider contacting him or her to help you evaluate and fine-tune your overall investment strategy. This can be an effective way to help ensure that you are on the right path toward your long-term investment objectives.
The market environment we witnessed in 2010 should remind us that investing for retirement is a long-term proposition – despite whatever changes or events may occur in the short term. The markets are cyclical, and investors who realized this and stayed the course over the past few years were rewarded in 2010. The major equity markets in the U.S. advanced in 2010, with a similar scenario playing out in many markets abroad.
One reason why financial professionals typically believe it is important to stay invested through all market conditions can be seen in the five-year performance history of the S&P 500® Index1 (the “S&P 500”), a widely used measure of large-cap stock performance in the U.S. On January 3, 2006, the S&P 500 closed at 1268.80. As you may recall, stock prices dropped significantly, beginning in late 2007 and through early 2009. On March 9, 2009, the S&P 500 closed at 676.53, its lowest level over the five years. Yet, by market close on December 31, 2010, the S&P 500 was back up to 1257.64. Consequently, investors in large-cap U.S. stocks who remained invested throughout this period likely benefited from the market recovery that began in March 2009. Conversely, those who “cashed out” of these stocks during the market downturn locked in their losses and did not participate in the recovery rally.
Keep these basic ideas in mind
| • | | Retirement investing is different. Investing for retirement is not like saving or investing for short-term needs, such as a vacation or a new car. The longer time that many retirement investors have to invest may give them an advantage over individuals with a shorter time frame to work with. |
| • | | Invest regularly and boost your contribution rate. Contributing to your retirement account on a regular basis can help you to buy more shares or units of an investment when its price is lower and fewer shares or units when its price is higher.2 Boosting your contribution rate periodically (even by a small amount), over time, may help you increase the amount of money in your account as retirement approaches. |
| 1 | Indexes are unmanaged, do not incur fees or expenses and cannot be purchased directly for investment. |
| 2 | Systematic investing and asset allocation do not ensure a profit or protect against loss in a declining market. Systematic investing involves continuous investment in securities regardless of fluctuating price levels. Investors should consider their ability to continue investing through periods of low price levels. |
1
MML Series Investment Fund – President’s Letter to Shareholders (Continued)
| • | | Choose investments that work for you and monitor your account regularly. No one knows your financial goals and objectives better than you. So be sure to select the stock, bond and short-term/money market investments that you feel will help you reach your goals. One of the greatest advantages you have when you diversify your investment choices is that these three distinct investment types tend to behave differently under various economic conditions. Consequently, many financial professionals hold the view that individuals can help reduce their risk of overexposure to one or two poorly performing investment types by diversifying across multiple types. |
Keep your eye on the future and stay current with your plan
We believe doing business with MassMutual is the sign of a good decision – as is focusing on the long term when it comes to planning for retirement. As you can see from the S&P 500 example noted above, short-term changes in the markets don’t necessarily have to result in a long-term impact on your retirement account. MassMutual’s view is that a retirement investment plan tailored to your time horizon and your tolerance for risk can help you navigate short-term gyrations in the markets. By monitoring your plan regularly and adjusting your retirement planning strategy when appropriate, you can help yourself as you pursue your long-term financial objectives.
As always, thank you for your confidence and trust in MassMutual.
Sincerely,

Richard J. Byrne
President
The information provided is the opinion of MassMutual Retirement Services Investment Services as of 1/1/11 and is subject to change without notice. It is not to be construed as tax, legal or investment advice. Of course, past performance does not guarantee future results.
2
MML Series Investment Fund – Economic and Market Review
December 31, 2010
A challenging year, with emerging signs of recovery
The turnaround in the financial markets that began in March 2009 continued during the year ended December 31, 2010, although there were numerous – and some significant – bumps along the way. The stock market in the United States was largely positive throughout the year, despite notable periods of underperformance. Foreign equity markets also overcame difficulties and did well overall, despite generally lagging their U.S. counterparts. Many of the debt-related problems that had plagued some of the more highly leveraged countries in the euro zone (particularly Greece and Ireland) underwent short-term resolution through government intervention, but European debt issues continued to hinder the investing environment as the period ended.
The U.S. dollar remained strong throughout much of the year, although late in the period, investor fears over the Federal Reserve’s (the “Fed”) announced purchase of U.S. Treasury bonds caused the dollar to weaken – against the backdrop of an ongoing run-up in commodity (specifically, gold and oil) prices, which commonly occurs when the dollar declines in value. Crude oil finished the year at roughly $91 per barrel (versus $79 on December 31, 2009) and gold continued to trade higher, closing the year at approximately $1,422 per ounce (versus $1,096 on December 31, 2009).
Key pieces of legislation passed in the year included health care reform (March), which did not have much of an immediate impact on the markets, and the extension of the Bush-era income-tax cuts (December), which linked a two-year extension of the Bush tax cuts (initially signed into law in 2001, but slated to expire without Congressional action on December 31, 2010) to a one-year extension of unemployment benefits and other aid to middle-income earners. Also in politics, the mid-term elections delivered a Republican majority in the U.S. House of Representatives, but the U.S. Senate continued to hold a Democratic majority.
The Fed kept interest rates low, holding the federal funds rate at 0.0% to 0.25%, in its continued focus on stimulating the economy. The federal funds rate is the interest rate that banks and other financial institutions charge each other for borrowing funds overnight.
Certain economic indicators were troubling during the period, and seemed mainly to show more bad news than good until the end of the year, when some bright spots appeared on the horizon. Indeed, December economic reports indicated that consumer confidence rose, initial jobless claims fell, and Gross Domestic Product (“GDP”) for the third quarter of the year was revised to reflect a gain of 2.6%, after an initial estimated advance of 2.0%. GDP reflects the total value of goods and services produced in the United States.
Market performance
Both bonds and equities advanced for the 12-month period ended December 31, 2010, although stocks generally outperformed their fixed-income counterparts. The Dow Jones Industrial AverageSM (the “Dow”), a well-known measure of blue-chip stock performance, advanced 11.02%. In a similar fashion, the S&P 500® Index of U.S. benchmarking large-cap stocks returned 15.06%. The small-cap Russell 2000® Index outpaced both of the aforementioned indexes, with a return of 26.85% for the period. The barometer for technology stocks, the NASDAQ Composite® Index, posted a 16.91% return for the period. Performance was also positive in worldwide equity markets. The MSCI® EAFE® Index, a benchmark for foreign stocks in developed markets, advanced 7.75%. The foreign market winner, however, was the MSCI Emerging Markets Index, a benchmark that represents the performance of emerging stock markets throughout the world, which advanced 18.88%.
Fixed-income investments generally trailed their equity counterparts during the 12-month period. The Barclays Capital U.S. Aggregate Bond Index, a broad measure of the U.S. investment-grade bond markets, gained 6.54%. Treasury bills gained just 0.13%. The outstanding performer in the fixed-income arena was the Barclays Capital U.S. Corporate High Yield Index, a measure of the performance of fixed-rate, non-investment-grade debt from corporate sectors, which advanced 15.12%. Conversely, the Barclays Capital U.S. 1-3 Year Government Bond Index, which measures the performance of short-term U.S. government bonds, returned 2.40%.*
| * | Indexes are unmanaged, do not incur fees or expenses and cannot be purchased directly for investment. |
3
MML Series Investment Fund – Economic and Market Review (Continued)
First quarter of 2010: A ‘mixed’ start to the year
Despite struggling in January and into the early part of February, the U.S. stock market turned in a solid performance during the first three months of 2010. In the bond market, yields of U.S. Treasury securities were lower, and prices higher, for most of the first quarter. Bond prices move in the opposite direction of interest rates (or yields); when yields rise, the prices of existing bonds fall – and vice versa.
Concerns over the sovereign debt problems of Greece, Portugal, Italy, Ireland, and Spain hindered U.S. and foreign stock performance early in the quarter, but efforts by the European Union to find a sustainable solution helped the markets rally in February and March. These debt concerns increased the attractiveness of the U.S. dollar, which rose against the euro and other key foreign currencies.
Financial news for the quarter was decidedly mixed. On the positive side, the final estimate for fourth-quarter 2009 GDP came in at a healthy 5.6%, and fourth-quarter 2009 corporate earnings benefited from aggressive cost-cutting and favorable comparisons with the weak fourth quarter of 2008. Unemployment, at 9.7% for February, remained stubbornly high, and the residential real estate market remained hampered by a large supply of homes for sale, weak demand and widespread borrower defaults. On the bright side, U.S. corporate earnings reports were generally strong.
Second quarter of 2010 marred by stock market downturn, mixed economic indicators
U.S. and foreign stock markets pulled back sharply during the second quarter of 2010 – after a vigorous rally that had lasted more than 13 months. This selloff was largely due to deepening fears about the European debt crisis as well as growing concerns about a possible double-dip recession in the United States. The April 20 explosion of the BP-licensed Deepwater Horizon oil-drilling rig and the resulting oil spill contributed to the uncertainty of the economic environment and held the media’s attention until the spill was stopped and the well capped later in the summer. May was especially challenging, with most of the major indexes giving up substantial ground. May 6 was particularly memorable, when the Dow, down more than 300 points already for the day, dropped more than 600 additional points and recovered most of the additional loss in about 20 minutes in what was subsequently termed a “flash crash” by market pundits (due to the market’s quick descent and recovery). The flash crash set a Dow record for the largest-ever intraday decline: almost 1,000 points.
During this period, bonds responded well to signs that the U.S. economy might be facing slower growth than previously expected. Treasury yields dropped sharply and prices posted healthy advances, with the largest gains occurring in longer maturities. The U.S. dollar continued to appreciate, and emerging markets equities suffered shallower declines than most developed markets. Economic data releases pointed to a still-expanding, but fragile, U.S. economy. In June, the third and final estimate of GDP growth for the first quarter was revised downward to 2.7% from 3.0%. Also noteworthy was the unemployment rate, which remained at 9.7%.
Third quarter of 2010: Stocks rebound; recession officially ‘ends’
U.S. stocks delivered solid gains in the third quarter of 2010, although the up-down-up pattern of the major indexes left many investors perplexed. Solid second-quarter earnings and economic reports that were not as bad as expected helped fuel the advance. Bond prices rose, and yields of U.S. Treasury securities continued the precipitous decline that began in April, taking the yield of the bellwether 10-year note from 2.97% at the end of the second quarter down to 2.53% at the end of the third quarter. The yield of the 10-year note is an important factor in determining mortgage rates, so the historically low rates drove significant mortgage refinancing activity.
The U.S. economy had expanded in the second quarter of 2010, but at a slower pace than in the first quarter, so the Commerce Department’s final estimate of second-quarter GDP released in the third quarter was a tepid 1.7% on an annualized basis. The third quarter’s report on unemployment, released at the beginning of September, revealed a jobless rate of 9.6%. Concern about the euro zone’s sovereign debt crisis eased further, as Spain’s issuance of 6 billion euros of debt at the beginning of July met strong demand and offered better-than-expected pricing. The U.S. dollar weakened against most key developed market currencies. Finally, in September, the National Bureau of Economic Research issued a statement identifying June 2009 as the end of the Great Recession (which began in December 2007) – a conclusion that was questioned by many, since so many economic problems remained unresolved.
4
MML Series Investment Fund – Economic and Market Review (Continued)
Fourth quarter of 2010: Signs of recovery continue
The stock market continued its upward march in the final quarter of the year – although November proved challenging for most domestic equities. Equity markets regained momentum in December; all broad domestic stock indexes advanced for the quarter and turned in double-digit returns for the full year. Conversely, bonds struggled during the fourth quarter of 2010. After falling precipitously for much of the year, yields in the Treasury market reversed course and surged higher from early October through mid-December, pressuring bond prices. For example, the yield of the bellwether 10-year Treasury note rose from 2.52% to 3.31% during the quarter. As a result, most bond indexes finished the quarter with losses, with the longer maturities suffering the most. Losses in corporate bonds were cushioned somewhat by growing optimism about the U.S. economy and corporate profits. High-yield bonds, which tend to correlate more with the fortunes of the issuing company or the issuer’s industry, rather than interest rates, managed solid gains for the quarter.
Although the extension of the Bush-era tax cuts passed by Congress in December – a legislative package estimated to be worth $858 billion – undoubtedly helped the stock market to finish the year on a positive note, it may also be that the Fed’s decision to engage in another round of quantitative easing – referred to as “QE2” – was the main driver of the financial markets during the second half of 2010.
Formally announced on November 3, 2010, QE2 included plans for the Fed to purchase $600 billion of longer-term Treasuries, at a pace of roughly $75 billion per month, by the end of the second quarter of 2011. The plan also called for the reinvestment of $250 billion to $300 billion of proceeds from earlier investments. The stated goal of QE2, as characterized in the Fed’s minutes released on November 3, was to “promote a stronger pace of economic recovery and to help insure that inflation, over time, is at levels consistent with [the Fed’s] mandate.”
While 2010 ended on a positive note, the U.S. economy must still prove itself in 2011. Specifically, investors will be watching to see if the economy can generate enough momentum to meaningfully reduce unemployment and begin to heal the battered residential real estate market. For long-term investors, as always, the challenge is staying disciplined amid constantly shifting markets and avoiding the temptation to buy or sell based on short-term developments.
The information provided is the opinion of MassMutual Retirement Services Investment Services as of 1/1/11 and is subject to change without notice. It is not to be construed as tax, legal or investment advice. Of course, past performance does not guarantee future results.
5
MML Asset Allocation Fund – Portfolio Manager Report
What is the investment approach of MML Asset Allocation Fund, and who is the Fund’s subadviser?
The Fund seeks to provide high total return consistent with preservation of capital over the long term by investing its assets in both equity and fixed income securities. The Fund’s subadviser has full discretion to determine the asset allocation between equity and fixed income securities and may allocate up to 80% of the Fund’s assets to equities and up to 60% to fixed income. In selecting investments for the Fund, the subadviser generally gives greater consideration to potential appreciation and future dividends than to current income. The Fund’s subadviser is Capital Guardian Trust Company (Capital Guardian).
How did the Fund perform during the 12 months ended December 31, 2010?
The Fund’s Initial Class shares returned 12.61% – underperforming the 15.06% return of the S&P 500® Index (the “stock benchmark”), a widely recognized, unmanaged index representative of common stocks of larger capitalized U.S. companies – but exceeding the 6.54% return of the Barclays Capital U.S. Aggregate Bond Index (the “bond benchmark”), an unmanaged index of fixed-rate investment-grade securities with at least one year to maturity, combining the Barclays Capital U.S. Treasury Bond Index, the Barclays Capital U.S. Government-Related Bond Index, the Barclays Capital U.S. Corporate Bond Index, and the Barclays Capital U.S. Securitized Bond Index. Similarly, the Fund outpaced the 11.90% return of the Lipper Balanced Fund Index, an unmanaged, equally weighted index of the 30 largest mutual funds within the Lipper Balanced Category.
For a discussion on the economic and market environment during the 12-month period ended December 31, 2010, please see the Economic and Market Review, beginning on page 3.
Subadviser discussion of factors that contributed to the Fund’s performance
Overall, for full-year 2010, the Fund’s emphasis on equities (at the expense of the Fund’s allocation to bonds) was beneficial to results during a year that proved to be a strong one for stocks.
Within the equity portion of the Fund, stock selection and a larger-than-stock-benchmark position in the energy sector, where the portfolio had an emphasis on equipment and services companies, contributed to full-year performance. For example, Weatherford International, Halliburton, and Schlumberger all benefited from increased spending on energy infrastructure. Stock selection in the consumer staples sector was also a positive. For example, Philip Morris International helped boost Fund returns, as the company continued to show incremental growth, mostly from Asia, and announced it would buy back shares. The Fund’s underweight position, relative to the benchmark, in the weak utilities sector was another positive factor for the year.
On the downside, the health care sector was a challenging one in 2010. Stock selection in health care proved positive, but the Fund’s overweight position in the sector was a negative. We decreased a number of key holdings in this area, including Davita, on concerns related to health care reform; and Baxter International, on concerns regarding its plasma business. Some of the largest individual contributors to and detractors from results were companies in the materials sector. For example, Cliff’s Natural Resources rose sharply on strong earnings; conversely, Vulcan Materials declined, due to delayed domestic construction spending.
Stock selection within the financials sector proved to be a negative factor for the Fund, as Charles Schwab and Goldman Sachs were among the largest individual detractors. The Fund’s cash position was also a drag on Fund results, particularly in the rising market environment that characterized most of 2010.
Within the bond portion of the Fund, positive performance was largely attributable to issuer selection. However, within Treasuries, Fund positioning along the yield curve, with a focus on intermediate-maturity bonds, detracted from results relative to the bond benchmark. The yield curve is a graphical representation of bond yields ranging from very short maturities to the longest available, with the curve indicating whether short-term rates are higher or lower than long-term rates. Maturity refers to the amount of time until a bond’s issuer is due to return the principal to the bond’s owner. The average maturity of a bond portfolio takes the maturities of all the underlying bonds into account.
Investors continued to show a preference for intermediate-maturity bonds throughout 2010, as most of the Federal Reserve’s (the “Fed”) buying has been in that part of the yield curve, which is also less prone to a sharper sell-off should inflationary pressures rise.
6
MML Asset Allocation Fund – Portfolio Manager Report (Continued)
Subadviser outlook
Overall, the Asset Allocation team has become incrementally more positive on equities. While the equity portion of the Fund is constructed company by company, a holistic view suggests it is positioned to benefit from an economy on the mend. In the aggregate, the energy, consumer discretionary, and information technology sectors constitute approximately half of the Fund’s stock portfolio. Also, while representing only a small part of the U.S. economy, materials stocks represent a significant part of the Fund’s stock component, relative to the stock benchmark.
On the fixed-income side, the outlook for interest rates has, in our view, become less certain, with an uptick in the economy and a backdrop of monetary policy that is effectively in uncharted territory. Europe’s unresolved sovereign debt crisis further complicates the picture. The Fund has a slightly shorter-than-benchmark duration with a focus on the intermediate part of the Treasury yield curve, which remains the focus of the Fed’s buyback program.
| | | | |
MML Asset Allocation Fund
Largest Holdings
(% of Net Assets) on 12/31/10
(Unaudited) | |
| | |
Philip Morris International, Inc. | | | 2.4 | % |
Google, Inc. Class A | | | 1.9 | % |
Schlumberger Ltd. | | | 1.9 | % |
The Allstate Corp. | | | 1.8 | % |
Weatherford International Ltd. | | | 1.7 | % |
Target Corp. | | | 1.7 | % |
U.S. Treasury Bond 4.625% 2/15/40 | | | 1.7 | % |
U.S. Treasury Note 2.750% 2/15/19 | | | 1.6 | % |
QUALCOMM, Inc. | | | 1.5 | % |
Federal National Mortgage Association 2.750% 3/13/14 | | | 1.5 | % |
| | | | | |
| | | | 17.7 | % |
| | | | | |
| | | | |
MML Asset Allocation Fund
Asset Allocation
(% of Net Assets) on 12/31/10
(Unaudited) | |
| | |
Equities | | | 66.1 | % |
Bonds & Notes | | | 29.1 | % |
| | | | | |
Total Long-Term Investments | | | 95.2 | % |
Total Short-Term Investments and Other Assets and Liabilities | | | 4.8 | % |
| | | | | |
Net Assets | | | 100.0 | % |
| | | | | |
7
MML Asset Allocation Fund – Portfolio Manager Report (Continued)
Growth of a $10,000 Investment
Hypothetical Investments in MML Asset Allocation Fund Initial Class, the S&P 500 Index, the Barclays Capital U.S. Aggregate Bond Index and the Lipper Balanced Fund Index.
| | | | | | | | |
| | | |
| TOTAL RETURN | | One Year
1/1/10 -
12/31/10 | | | Since
Inception
Average
Annual
5/1/06 -
12/31/10 | |
| Initial Class | | | 12.61% | | | | -0.59% | |
| S&P 500 Index* | | | 15.06% | | | | 1.27% | |
| Barclays Capital U.S. Aggregate Bond Index | | | 6.54% | | | | 6.41% | |
| Lipper Balanced Fund Index | | | 11.90% | | | | 3.24% | |
Hypothetical Investments in MML Asset Allocation Fund Service Class, the S&P 500 Index, the Barclays Capital U.S. Aggregate Bond Index and the Lipper Balanced Fund Index.
| | | | | | | | |
| | | |
| TOTAL RETURN | | One Year
1/1/10 -
12/31/10 | | | Since
Inception
Average
Annual
8/15/08 -
12/31/10 | |
| Service Class | | | 12.37% | | | | 0.30% | |
| S&P 500 Index* | | | 15.06% | | | | 1.47%+ | |
| Barclays Capital U.S. Aggregate Bond Index | | | 6.54% | | | | 6.74%+ | |
| Lipper Balanced Fund Index | | | 11.90% | | | | 4.06%+ | |
GROWTH OF $10,000 INVESTMENT SINCE INCEPTION
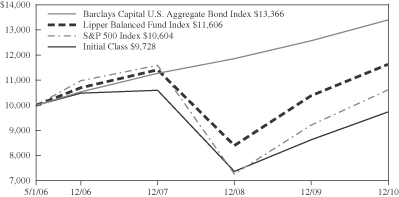
* Benchmark
+ From 9/2/08.
Performance data quoted represents past performance; past performance is not predictive of future results. The investment return and principal value of shares of the Fund will fluctuate with market conditions so that shares of the Fund, when redeemed, may be worth more or less than their original cost. Current performance of the Fund may be lower or higher than the performance quoted. Performance data current to the most recent month end may be obtained by accessing the website www.massmutual.com.
Investors should note that the Fund is a professionally managed mutual fund, while the S&P 500 Index, the Barclays Capital U.S. Aggregate Bond Index and the Lipper Balanced Fund Index are unmanaged, do not incur expenses, and cannot be purchased directly by investors. Investors should read the Fund’s prospectus with regard to the Fund’s investment objective, risks and charges and expenses in conjunction with these financial statements. The Fund’s return reflects changes in the net asset value per share without the deduction of any product charges (e.g., cost of insurance, mortality and expense risk charges, administrative fees, and CDSL). The inclusion of these charges would have reduced the performance shown here.
8
MML Concentrated Growth Fund – Portfolio Manager Report
What is the investment approach of MML Concentrated Growth Fund, and who is the Fund’s subadviser?
The Fund seeks long-term growth of capital by investing primarily in common stocks of companies that the Fund’s subadviser believes offer above-average growth potential and trade at a significant discount to the subadviser’s assessment of their intrinsic value. Any income realized will be incidental to the Fund’s objective. The Fund’s subadviser is Legg Mason Capital Management, Inc. (Legg Mason).
How did the Fund perform during the 12 months ended December 31, 2010?
The Fund’s Class I shares returned 14.14%, underperforming the 16.71% return of the Russell 1000® Growth Index (the “benchmark”), an unmanaged index consisting of those Russell 1000 securities (representing the 1,000 largest U.S. companies based on market capitalization) with greater than average growth orientation that tend to exhibit higher price-to-book ratios and higher forecasted growth rates than securities in the value universe.
For a discussion on the economic and market environment during the 12-month period ended December 31, 2010, please see the Economic and Market Review, beginning on page 3.
Subadviser discussion of factors that contributed to the Fund’s performance
Stocks carried their positive momentum from 2009 into 2010, despite rumblings early in the year from Europe regarding sovereign debt problems in Greece. Markets entered a correction phase in April, when the European Union and International Monetary Fund (IMF) announced they would collaborate to bail out Greece from its debt problems. However, investors were unconvinced that the trouble was over, and yields on other European sovereign debt – including Ireland, Spain and Portugal – rose as the summer began. The U.S. economy also hit a “soft patch” of negative economic data, while China’s government took steps to slow the red-hot pace of growth in that country, neither of which helped stocks during the summer. However, markets rebounded in the fall, posting two of the strongest months in recent memory – in September and once again in December. The announced plan to rescue Ireland from its debt burden, coupled with positive economic data in the U.S., helped boost equities in the final four months of the year.
The portfolio underperformed the benchmark for the year, as Cisco shares were twice hammered by lower-than-expected revenue growth forecasts in their quarterly earnings reports. While the company pledged to pay a dividend and approved a $10 billion share repurchase authorization, investors remained focused on the company’s revenue growth forecasts for the coming year. Nokia Oyj suffered several setbacks and continued to lose market share during the year, after delaying the release of its Symbian smartphone operating system. With pressure on its low-end handsets segment from new competitors, we exited the position mid-year.
Lingering manufacturing concerns weighed on Genzyme shares into the summer of 2010; however, rumors of a potential takeover, followed by a formal buyout offer at a significant premium, boosted shares in July. With the buyout pushing the stock close to our estimate of fair value, we sold the position.
Texas Instruments benefited during the year by management’s announcement that the company would hike its dividend and increase share repurchases to $7.5 billion, equivalent to about 30% of shares outstanding. The company also benefited from business mix changes that drove margins higher and accelerated gains in market share. Apple’s string of solid quarterly performance reports got an additional lift from consumer enthusiasm for its iPad tablet computer as well as the latest model of its iPhone smartphone (introduced earlier in the year).
Subadviser outlook
With the economy showing signs that the recovery is gaining traction, corporate earnings continuing to surprise on the upside, and equity valuation levels quite attractive, we think the burden of proof is now on the pessimistic bears as to why 2011 should not be a good year for U.S. stocks. That is not to say that we won’t have corrections along the way. Investors still have plenty of things to worry about. But, we believe the good will far outweigh the bad in 2011 and stocks will, in our judgment, make solid upward progress, with the S&P 500® Index having a good chance of closing the year above the 1,400 mark. On the other hand, the risks posed by rising interest rates, oil prices over $100 per barrel, a possible economic slowdown in China, or a re-escalation of the sovereign debt crisis in Europe could all cause stocks to fall in 2011.
9
MML Concentrated Growth Fund – Portfolio Manager Report (Continued)
| | | | |
MML Concentrated Growth Fund Largest Holdings (% of Net Assets) on 12/31/10 (Unaudited) | |
| | |
Cisco Systems, Inc. | | | 5.2 | % |
Microsoft Corp. | | | 5.2 | % |
Medtronic, Inc. | | | 5.1 | % |
QUALCOMM, Inc. | | | 5.1 | % |
United Technologies Corp. | | | 5.0 | % |
EMC Corp. | | | 5.0 | % |
3M Co. | | | 4.8 | % |
Texas Instruments, Inc. | | | 4.8 | % |
American Express Co. | | | 4.7 | % |
Abbott Laboratories | | | 4.5 | % |
| | | | | |
| | | | 49.4 | % |
| | | | | |
| | | | |
MML Concentrated Growth Fund Sector Table (% of Net Assets) on 12/31/10 (Unaudited) | |
| | |
Technology | | | 26.5 | % |
Consumer, Non-cyclical | | | 23.8 | % |
Industrial | | | 15.8 | % |
Communications | | | 14.6 | % |
Financial | | | 9.1 | % |
Consumer, Cyclical | | | 4.7 | % |
Basic Materials | | | 3.2 | % |
Energy | | | 2.1 | % |
| | | | | |
Total Long-Term Investments | | | 99.8 | % |
Short-Term Investments and Other Assets and Liabilities | | | 0.2 | % |
| | | | | |
Net Assets | | | 100.0 | % |
| | | | | |
10
MML Concentrated Growth Fund – Portfolio Manager Report (Continued)
Growth of a $10,000 Investment
Hypothetical Investments in MML Concentrated Growth Fund Class I, Class II and the Russell 1000 Growth Index.
| | | | | | | | |
| | | |
| TOTAL RETURN | | One Year
1/1/10 -
12/31/10 | | | Since
Inception
Average
Annual
5/1/06 -
12/31/10 | |
| Class I | | | 14.14% | | | | -5.50% | |
| Class II | | | 14.21% | | | | -5.39% | |
| Russell 1000 Growth Index | | | 16.71% | | | | 3.38% | |
Hypothetical Investments in MML Concentrated Growth Fund Service Class I and the Russell 1000 Growth Index.
| | | | | | | | |
| | | |
| TOTAL RETURN | | One Year
1/1/10 -
12/31/10 | | | Since
Inception
Average
Annual
8/15/08 -
12/31/10 | |
| Service Class I | | | 13.83% | | | | -8.00% | |
| Russell 1000 Growth Index | | | 16.71% | | | | 3.90%+ | |
GROWTH OF $10,000 INVESTMENT SINCE INCEPTION
+ From 9/2/08.
Performance data quoted represents past performance; past performance is not predictive of future results. The investment return and principal value of shares of the Fund will fluctuate with market conditions so that shares of the Fund, when redeemed, may be worth more or less than their original cost. Current performance of the Fund may be lower or higher than the performance quoted. Performance data current to the most recent month end may be obtained by accessing the website www.massmutual.com.
Investors should note that the Fund is a professionally managed mutual fund, while the Russell 1000 Growth Index is unmanaged, does not incur expenses, and cannot be purchased directly by investors. Investors should read the Fund’s prospectus with regard to the Fund’s investment objective, risks and charges and expenses in conjunction with these financial statements. The Fund’s return reflects changes in the net asset value per share without the deduction of any product charges (e.g., cost of insurance, mortality and expense risk charges, administrative fees, and CDSL). The inclusion of these charges would have reduced the performance shown here.
11
MML Equity Income Fund – Portfolio Manager Report
What is the investment approach of MML Equity Income Fund, and who is the Fund’s subadviser?
The Fund seeks dividend income and long-term capital growth by investing primarily in the common stocks of established companies. Under normal circumstances, the Fund invests at least 80% of its net assets in common stocks, with 65% in the common stocks of well-established companies paying above-average dividends. The Fund’s subadviser currently considers well-established companies to mean companies that it considers to be seasoned companies with relatively long operating histories. The Fund’s subadviser is T. Rowe Price Associates, Inc. (T. Rowe Price).
How did the Fund perform during the 12 months ended December 31, 2010?
The Fund’s Initial Class shares returned 14.95%, modestly trailing the 15.06% return of the S&P 500® Index (the “benchmark”), a widely recognized, unmanaged index representative of common stocks of larger capitalized U.S. companies. Similarly, the Fund underperformed the 15.51% return of the Russell 1000® Value Index, an unmanaged index consisting of those Russell 1000 securities (representing the 1,000 largest U.S. companies based on market capitalization) with greater than average value orientation that tend to exhibit lower price-to-book ratios and lower forecasted growth rates than securities in the growth universe.
For a discussion on the economic and market environment during the 12-month period ended December 31, 2010, please see the Economic and Market Review, beginning on page 3.
Subadviser discussion of factors that contributed to the Fund’s performance
The Fund’s performance in 2010 was driven by an underweight position, relative to the benchmark, in health care, the weakest-performing sector in the benchmark. Stock selection within the sector also contributed – as a lack of new products in the production pipeline caused the market to shift its focus to negative macroeconomic factors, such as health care reform, low utilization rates, and pricing pressures. Holding Beckman Coulter, a biomedical testing manufacturer, rose after it was announced in December that the company was up for sale at a premium price.
A sizable overweight position in consumer discretionary, the benchmark’s top-performing sector, also contributed to relative results for the year. Holding Fortune Brands rose on the announcement that it would focus on its distilled spirits business, which has a strong balance sheet and solid operating momentum, after splitting the company into three parts. Holding Cablevision rallied on its decision to spin off its Rainbow collection of cable networks as well as its share buyback. Holding Marriott was positioned to benefit from the hotel sector’s recovery because it gained market share and started to push price increases in select markets.
The consumer staples sector also contributed to relative performance, driven mainly by stock selection – particularly in food products. Leading contributors in the portfolio’s consumer staples holdings included Hershey Foods, McCormick & Co., and Archer Daniels Midland.
On the downside, portfolio holdings within the information technology sector detracted from results, relative to the benchmark. Shares of desktop software leader Microsoft fell amid worries about its long-term growth prospects. Stock selection in the materials sector also hampered Fund performance for the year. For example, Vulcan Materials faced weaker-than-expected volumes and prices, largely driven by weak construction markets. Packaging and paper company International Paper underperformed its peers. And Nucor’s earnings suffered from low utilization levels in the company’s steel mill due to weak construction activity.
The utilities sector was a relative detractor of Fund performance as a result of stock selection and market factors. Weak natural gas prices and sluggish residential and commercial power demand continued to weigh on this sector. Electric utilities stocks drove relative underperformance. Integrated utility companies PPL and Entergy detracted from Fund performance when utilities generally underperformed.
Subadviser outlook
Despite 2010’s volatility, we believe we are on the “long and winding road” toward both economic and equity market recovery. Many corporations are reporting strong earnings and free cash flow. Large companies are also showing sharp improvements in profitability. Additionally, there remains a lot of cash on the sidelines. As a result, corporations are beginning to participate in
12
MML Equity Income Fund – Portfolio Manager Report (Continued)
share repurchases and raising their dividends. Overall, most economic indicators, in our view, point to continued growth, albeit at a slightly slower rate than some had expected, given the magnitude of the downturn. We remain positive about the market’s direction over the medium term because equities are still attractively valued relative to many asset classes.
Our view is tempered by the many challenges that the global economy still faces. Our belief is that the recovery will be muted by highly indebted governments, elevated unemployment levels, and rising oil and food prices. Since the economic environment is likely to remain difficult for many companies, stock selection will remain critical as we enter 2011.
| | | | |
MML Equity Income Fund
Largest Holdings
(% of Net Assets) on 12/31/10
(Unaudited) | |
| | |
JP Morgan Chase & Co. | | | 2.9 | % |
Chevron Corp. | | | 2.7 | % |
General Electric Co. | | | 2.6 | % |
Exxon Mobil Corp. | | | 2.2 | % |
American Express Co. | | | 2.0 | % |
Royal Dutch Shell PLC A Shares Sponsored ADR (United Kingdom) | | | 1.9 | % |
AT&T, Inc. | | | 1.9 | % |
Wells Fargo & Co. | | | 1.9 | % |
The Home Depot, Inc. | | | 1.7 | % |
Bank of America Corp. | | | 1.6 | % |
| | | | | |
| | | | 21.4 | % |
| | | | | |
| | | | |
MML Equity Income Fund
Sector Table
(% of Net Assets) on 12/31/10
(Unaudited) | |
| | |
Financial | | | 19.1 | % |
Energy | | | 14.1 | % |
Industrial | | | 12.3 | % |
Consumer, Non-cyclical | | | 11.5 | % |
Communications | | | 10.8 | % |
Consumer, Cyclical | | | 8.9 | % |
Utilities | | | 8.2 | % |
Basic Materials | | | 6.9 | % |
Technology | | | 5.5 | % |
Mutual Funds | | | 1.2 | % |
| | | | | |
Total Long-Term Investments | | | 98.5 | % |
Short-Term Investments and Other Assets and Liabilities | | | 1.5 | % |
| | | | | |
Net Assets | | | 100.0 | % |
| | | | | |
13
MML Equity Income Fund – Portfolio Manager Report (Continued)
Growth of a $10,000 Investment
Hypothetical Investments in MML Equity Income Fund Initial Class, the S&P 500 Index and the Russell 1000 Value Index.
| | | | | | | | |
| | | |
| TOTAL RETURN | | One Year
1/1/10 -
12/31/10 | | | Since
Inception
Average
Annual
5/1/06 -
12/31/10 | |
| Initial Class | | | 14.95% | | | | 1.21% | |
| S&P 500 Index* | | | 15.06% | | | | 1.27% | |
| Russell 1000 Value Index | | | 15.51% | | | | -0.41% | |
Hypothetical Investments in MML Equity Income Fund Service Class, the S&P 500 Index and the Russell 1000 Value Index.
| | | | | | | | |
| | | |
| TOTAL RETURN | | One Year
1/1/10 -
12/31/10 | | | Since
Inception
Average
Annual
8/15/08 -
12/31/10 | |
| Service Class | | | 14.70% | | | | 1.27% | |
| S&P 500 Index* | | | 15.06% | | | | 1.47%+ | |
| Russell 1000 Value Index | | | 15.51% | | | | -0.13%+ | |
GROWTH OF $10,000 INVESTMENT SINCE INCEPTION
* Benchmark
+ From 9/2/08.
Performance data quoted represents past performance; past performance is not predictive of future results. The investment return and principal value of shares of the Fund will fluctuate with market conditions so that shares of the Fund, when redeemed, may be worth more or less than their original cost. Current performance of the Fund may be lower or higher than the performance quoted. Performance data current to the most recent month end may be obtained by accessing the website www.massmutual.com.
Investors should note that the Fund is a professionally managed mutual fund, while the S&P 500 Index and the Russell 1000 Value Index are unmanaged, do not incur expenses, and cannot be purchased directly by investors. Investors should read the Fund’s prospectus with regard to the Fund’s investment objective, risks and charges and expenses in conjunction with these financial statements. The Fund’s return reflects changes in the net asset value per share without the deduction of any product charges (e.g., cost of insurance, mortality and expense risk charges, administrative fees, and CDSL). The inclusion of these charges would have reduced the performance shown here.
14
MML Foreign Fund – Portfolio Manager Report
What is the investment approach of MML Foreign Fund, and who is the Fund’s subadviser?
The Fund seeks long-term capital growth by investing, under normal circumstances, at least 80% of its net assets in investments of issuers located outside of the U.S., including those in emerging markets. Under normal market conditions, the Fund invests predominantly in equity securities, and, while there are no set percentage targets, the Fund invests primarily to predominantly in large- to medium-capitalization companies with market capitalization values greater than $2 billion and may invest a portion to a significant amount in smaller companies. The Fund’s subadviser is Templeton Investment Counsel, LLC (Templeton).
How did the Fund perform during the 12 months ended December 31, 2010?
The Fund’s Initial Class shares returned 4.70%, trailing the 7.75% return of the Morgan Stanley Capital International (MSCI®) Europe, Australasia, Far East (EAFE®) Index (the “benchmark”), a widely recognized, unmanaged index representative of equity securities in developed markets, excluding the U.S. and Canada.
For a discussion on the economic and market environment during the 12-month period ended December 31, 2010, please see the Economic and Market Review, beginning on page 3.
Subadviser discussion of factors that contributed to the Fund’s performance
During the year ended December 31, 2010, the Fund faced numerous challenges and struggled somewhat relative to the benchmark. For example, stock selection in Europe was a key detractor – most notably in France, Sweden, Denmark, and Portugal, where sovereign debt concerns and austerity programs put substantial pressure on economic recovery. The portfolio’s underweight positions, relative to the benchmark, in Australia and Asia (particularly in Japan) also detracted.
Stock selection and an underweight stake in the materials sector weighed on relative returns as supply constraints, emerging-market demand increases, and inflation concerns bolstered commodity prices during the year. Stock selection in a nearly even-weighted industrials sector, where the portfolio had no holdings in the outperforming machinery industry, also hurt relative performance. In addition, an overweight position and stock selection in the health care sector detracted from performance during a period when European governments undertaking fiscal austerity measures considered reducing pharmaceutical industry reimbursements and American politicians debated sweeping health care reforms. French pharmaceuticals manufacturer Sanofi-Aventis lagged, despite delivering strong earnings, as investors focused on impending patent expirations and the company’s hostile bid for biotechnology firm Genzyme.
Other major detractors within the portfolio were E.ON (Germany) in utilities, Petrobras Petroleo Brasileiro (Brazil) in an underperforming energy sector, and Telefonica (Spain) in telecommunications services.
From a sector-specific standpoint, overweighting in information technology helped relative performance. German semiconductor manufacturer Infineon Technologies and non-benchmark holdings in Samsung Electronics (South Korea) and Check Point Software Technologies (Israel) were notably significant contributors. An underweight position in financial holdings also added to relative returns. In a sector pressured by European sovereign debt risk, capital adequacy concerns, and regulatory tightening, our non-benchmark holding in ICICI Bank (India) performed well. As the economy progressed, the consumer discretionary sector also boosted performance – particularly, automaker BMW (Germany) and fashion retailer Burberry Group (U.K.), which rallied on rising demand in the luxury goods market.
Subadviser outlook
As bottom-up, long-term, value investors, we continue to focus on stocks trading at significant discounts to the company’s longer-term business value based on earnings power, cash flow generation potential, and asset value. We remain favorable toward our holdings in Europe, which we see as the world’s cheapest major equity region and home to fundamentally strong corporate entities with globally diversified revenues. We also remain positive toward the health care sector in general, which offers compelling valuations in addition to strengthening corporate fundamentals, significant restructuring potential, and advantageous global demographics. Our belief, however, is that the materials sector’s current valuations leave little room for continued outperformance.
15
MML Foreign Fund – Portfolio Manager Report (Continued)
| | | | |
MML Foreign Fund
Largest Holdings
(% of Net Assets) on 12/31/10
(Unaudited) | |
| | |
Samsung Electronics Co. Ltd. | | | 2.5 | % |
Siemens AG | | | 2.0 | % |
Telenor ASA | | | 1.9 | % |
Telefonica SA Sponsored ADR (Spain) | | | 1.9 | % |
DBS Group Holdings, Ltd. | | | 1.9 | % |
Vodafone Group PLC Sponsored ADR (United Kingdom) | | | 1.8 | % |
Royal Dutch Shell PLC Class B | | | 1.8 | % |
Check Point Software Technologies Ltd. | | | 1.8 | % |
Sanofi-Aventis | | | 1.7 | % |
Vale SA Sponsored ADR (Brazil) | | | 1.7 | % |
| | | | | |
| | | | 19.0 | % |
| | | | | |
| | | | |
MML Foreign Fund
Country Weightings
(% of Net Assets) on 12/31/10
(Unaudited) | |
| | |
United Kingdom | | | 19.1 | % |
Germany | | | 11.1 | % |
France | | | 9.2 | % |
Switzerland | | | 8.3 | % |
Netherlands | | | 5.9 | % |
Japan | | | 5.2 | % |
Republic of Korea | | | 4.3 | % |
Singapore | | | 4.0 | % |
Brazil | | | 3.5 | % |
Spain | | | 3.1 | % |
Norway | | | 3.0 | % |
Taiwan | | | 2.8 | % |
Hong Kong | | | 2.8 | % |
Israel | | | 1.8 | % |
Italy | | | 1.8 | % |
Sweden | | | 1.4 | % |
South Africa | | | 1.3 | % |
India | | | 1.2 | % |
China | | | 1.2 | % |
Canada | | | 0.9 | % |
Ireland | | | 0.8 | % |
Russia | | | 0.7 | % |
Austria | | | 0.7 | % |
Portugal | | | 0.5 | % |
Denmark | | | 0.2 | % |
| | | | | |
Total Long-Term Investments | | | 94.8 | % |
Short-Term Investments and Other Assets and Liabilities | | | 5.2 | % |
| | | | | |
Net Assets | | | 100.0 | % |
| | | | | |
16
MML Foreign Fund – Portfolio Manager Report (Continued)
Growth of a $10,000 Investment
Hypothetical Investments in MML Foreign Fund Initial Class and the MSCI EAFE Index.
| | | | | | | | |
| | | |
| TOTAL RETURN | | One Year
1/1/10 -
12/31/10 | | | Since
Inception
Average
Annual
5/1/06 -
12/31/10 | |
| Initial Class | | | 4.70% | | | | 0.15% | |
| MSCI EAFE Index | | | 7.75% | | | | -0.32% | |
Hypothetical Investments in MML Foreign Fund Service Class and the MSCI EAFE Index.
| | | | | | | | |
| | | |
| TOTAL RETURN | | One Year
1/1/10 -
12/31/10 | | | Since
Inception
Average
Annual
8/15/08 -
12/31/10 | |
| Service Class | | | 4.54% | | | | -1.80% | |
| MSCI EAFE Index | | | 7.75% | | | | -1.20%+ | |
GROWTH OF $10,000 INVESTMENT SINCE INCEPTION
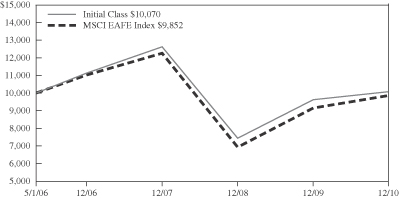
+ From 9/2/08.
Performance data quoted represents past performance; past performance is not predictive of future results. The investment return and principal value of shares of the Fund will fluctuate with market conditions so that shares of the Fund, when redeemed, may be worth more or less than their original cost. Current performance of the Fund may be lower or higher than the performance quoted. Performance data current to the most recent month end may be obtained by accessing the website www.massmutual.com.
Investors should note that the Fund is a professionally managed mutual fund, while the MSCI EAFE Index is unmanaged, does not incur expenses, and cannot be purchased directly by investors. Investors should read the Fund’s prospectus with regard to the Fund’s investment objective, risks and charges and expenses in conjunction with these financial statements. The Fund’s return reflects changes in the net asset value per share without the deduction of any product charges (e.g., cost of insurance, mortality and expense risk charges, administrative fees, and CDSL). The inclusion of these charges would have reduced the performance shown here.
17
MML Global Fund – Portfolio Manager Report
What is the investment approach of MML Global Fund, and who is the Fund’s subadviser?
The Fund seeks long-term capital appreciation by investing primarily in the equity securities (including over-the-counter securities) of U.S. and foreign companies, including companies in developed and emerging markets. The Fund’s subadviser is Massachusetts Financial Services Company (MFS).
How did the Fund perform during the 12 months ended December 31, 2010?
The Fund’s Class I shares returned 12.64%, outpacing the 11.76% return of the Morgan Stanley Capital International (MSCI®) World Index (the “benchmark”), an unmanaged index of issuers listed on the stock exchanges of 20 foreign countries and the U.S.
For a discussion on the economic and market environment during the 12-month period ended December 31, 2010, please see the Economic and Market Review, beginning on page 3.
Subadviser discussion of factors that contributed to the Fund’s performance
Stock selection in the retailing sector was a primary contributor to the Fund’s full-year performance relative to the benchmark. The portfolio’s overweight position, compared to the benchmark, in luxury goods companies LVMH Moët Hennessy Louis Vuitton (France), Cie Financ Richemont (Switzerland), and Burberry Group (United Kingdom) – as well as athletic shoes and apparel manufacturer NIKE – aided relative results, as all of these stocks outperformed the benchmark in 2010.
A combination of stock selection and an underweight position in the financial services sector benefited relative performance. No individual stocks within this sector were among the portfolio’s top relative contributors, however.
Stocks in other sectors that bolstered the Fund’s relative performance included oil and gas drilling equipment manufacturer National Oilwell Varco, industrial gas supplier Linde (Germany), wiring devices and cable systems manufacturer Legrand (France), global food company Nestle (Switzerland), and electrical distribution equipment manufacturer Schneider Electric (France). Not holding poor-performing integrated oil company BP PLC (United Kingdom) also proved beneficial.
Hampering relative Fund performance in 2010 was a combination of stock selection and an overweight position in the poorly performing health care sector. The portfolio’s overweight positions in medical device maker Medtronic, pharmaceutical and diagnostic company Roche Holding (Switzerland), and pharmaceutical company Merck KGaA held back results, as all of these stocks underperformed the benchmark during the year.
Stocks in other sectors were among the portfolio’s top detractors – including network equipment company Cisco Systems, oil and gas exploration company Inpex Corporation (Japan), insurance firm AXA (France), postal systems operator TNT (Netherlands), stock exchange Deutsche Boerse (Germany), and optical glass maker Hoya (Japan). Not holding strong-performing computer and personal electronics maker Apple hindered relative results, since the industry giant significantly outperformed the benchmark for the year.
During the reporting period, the portfolio’s currency exposure was another detractor from relative performance. All of MFS’s investment decisions are driven by the fundamentals of each individual opportunity – consequently, it is common for our portfolios to have currency exposure different than that of the benchmark.
Subadviser outlook
As of year-end 2010, the portfolio’s largest relative exposures versus the benchmark remained its significant underweight in the utilities and communications, energy, and financial services sectors; and overweight positions in the consumer staples, retailing, and health care sectors. The largest increase in sector weight was in industrial goods and services. Although the portfolio remains underweight in this sector, we increased the portfolio’s exposure to late-cycle companies that are attractively valued, high-quality franchises with strong balance sheets and good free cash-flow generation with the potential to continue to gain market share going forward.
18
MML Global Fund – Portfolio Manager Report (Continued)
| | | | |
MML Global Fund Largest Holdings (% of Net Assets) on 12/31/10 (Unaudited) | |
| | |
Nestle SA | | | 3.3 | % |
Linde AG | | | 3.0 | % |
Heineken NV | | | 2.5 | % |
Reckitt Benckiser Group PLC | | | 2.2 | % |
State Street Corp. | | | 2.0 | % |
The Walt Disney Co. | | | 2.0 | % |
Bank of New York Mellon Corp. | | | 2.0 | % |
Oracle Corp. | | | 1.9 | % |
Diageo PLC | | | 1.9 | % |
3M Co. | | | 1.9 | % |
| | | | | |
| | | | 22.7 | % |
| | | | | |
| | | | |
MML Global Fund Country Weightings (% of Net Assets) on 12/31/10 (Unaudited) | |
| | |
United States | | | 45.1 | % |
United Kingdom | | | 9.9 | % |
Switzerland | | | 9.8 | % |
France | | | 8.3 | % |
Germany | | | 6.8 | % |
Netherlands | | | 5.2 | % |
Japan | | | 5.0 | % |
Ireland | | | 1.6 | % |
Canada | | | 1.6 | % |
Sweden | | | 1.2 | % |
Republic of Korea | | | 1.2 | % |
Austria | | | 1.0 | % |
Netherlands Antilles | | | 0.6 | % |
Brazil | | | 0.6 | % |
India | | | 0.4 | % |
Czech Republic | | | 0.4 | % |
Singapore | | | 0.3 | % |
Spain | | | 0.2 | % |
| | | | | |
Total Long-Term Investments | | | 99.2 | % |
Short-Term Investments and Other Assets and Liabilities | | | 0.8 | % |
| | | | | |
Net Assets | | | 100.0 | % |
| | | | | |
19
MML Global Fund – Portfolio Manager Report (Continued)
Growth of a $10,000 Investment
Hypothetical Investments in MML Global Fund Class I, Class II and the MSCI World Index.
| | | | | | | | |
| | | |
| TOTAL RETURN | | One Year
1/1/10 -
12/31/10 | | | Since
Inception
Average
Annual
5/1/06 -
12/31/10 | |
| Class I | | | 12.64% | | | | -1.74% | |
| Class II | | | 12.83% | | | | -1.51% | |
| MSCI World Index | | | 11.76% | | | | 0.56% | |
Hypothetical Investments in MML Global Fund Service Class I and the MSCI World Index.
| | | | | | | | |
| | | |
| TOTAL RETURN | | One Year
1/1/10 -
12/31/10 | | | Since
Inception
Average
Annual
8/15/08 -
12/31/10 | |
| Service Class I | | | 12.46% | | | | -0.43% | |
| MSCI World Index | | | 11.76% | | | | 0.06%+ | |
GROWTH OF $10,000 INVESTMENT SINCE INCEPTION
+ From 9/2/08.
Performance data quoted represents past performance; past performance is not predictive of future results. The investment return and principal value of shares of the Fund will fluctuate with market conditions so that shares of the Fund, when redeemed, may be worth more or less than their original cost. Current performance of the Fund may be lower or higher than the performance quoted. Performance data current to the most recent month end may be obtained by accessing the website www.massmutual.com.
Investors should note that the Fund is a professionally managed mutual fund, while the MSCI World Index is unmanaged, does not incur expenses, and cannot be purchased directly by investors. Investors should read the Fund’s prospectus with regard to the Fund’s investment objective, risks and charges and expenses in conjunction with these financial statements. The Fund’s return reflects changes in the net asset value per share without the deduction of any product charges (e.g., cost of insurance, mortality and expense risk charges, administrative fees, and CDSL). The inclusion of these charges would have reduced the performance shown here.
20
MML Growth & Income Fund – Portfolio Manager Report
What is the investment approach of MML Growth & Income Fund, and who is the Fund’s subadviser?
The Fund seeks capital appreciation and income. Under normal circumstances, the Fund invests at least 80% of its net assets in equity securities and equity-related securities, including convertible securities, preferred stocks, options and warrants, of U.S. companies with market capitalizations at the time of purchase greater than $1 billion. Effective August 20, 2010, Massachusetts Financial Services Company (MFS) replaced Capital Guardian Trust Company (Capital Guardian) as the subadviser of the Fund.
How did the Fund perform during the 12 months ended December 31, 2010?
The Fund’s Initial Class shares returned 11.47%, underperforming the 15.06% return of the S&P 500® Index (the “benchmark”), a widely recognized, unmanaged index representative of common stocks of larger capitalized U.S. companies.
For a discussion on the economic and market environment during the 12-month period ended December 31, 2010, please see the Economic and Market Review, beginning on page 3.
Subadviser discussion of factors that contributed to the Fund’s performance
For the portion of the year when the Fund was subadvised by Capital Guardian (January 1 – August 19, 2010):
Stock selection within the financials sector was a negative factor for the Fund, with Charles Schwab and Goldman Sachs among the largest detractors. Within the consumer discretionary sector, specialty retailers hindered results. Less-than-favorable stock selection in information technology also hurt the Fund – particularly Google, which continues to dominate the fast-growing area of Internet advertising, but failed to meet Wall Street’s optimistic earnings expectations. Stock selection and the portfolio’s higher-than-benchmark weight in the materials sector were also negatives. Additionally, stock selection and an underweight position, relative to the benchmark, in the industrials sector hampered results.
Conversely, the Fund benefited from strong stock picks in the consumer staples sector. Philip Morris International helped boost returns, as the company continued to show incremental growth, mostly from Asia, and announced it would buy back shares. Stock selection in telecommunication services positively impacted results as well, particularly the portfolio’s emphasis on wireless telecommunications services.
For the remainder of the year, when the Fund was subadvised by MFS (August 20 – December 31, 2010):
Stock selection in the basic materials sector detracted from the Fund’s performance relative to the benchmark for the reporting period. The Fund’s overweight position in diversified technology company 3M Co. and not owning strong-performing precious metals company Freeport-McMoran hindered relative results. A combination of security selection and an overweight position in the consumer staples sector also held back the Fund’s relative performance.
Stock selection in the health care sector had a negative impact on relative returns. Top detractors within this sector included medical products maker Abbott Laboratories and generic drug manufacturer Teva Pharmaceutical Industries. An underweight position in the industrial goods and services industry was another negative factor for relative results. Individual securities in other sectors that held back relative performance included network equipment company Cisco Systems, energy exploration and production company EOG Resources, bank operator Bank of America, credit card company Visa, and electricity and natural gas provider Wisconsin Energy.
On the upside, contributors to relative performance included stock selection in the energy sector. The Fund’s overweight positions in strong-performing oil and gas drilling equipment manufacturer National Oilwell Varco, integrated energy company Hess, and oilfield services provider Halliburton boosted relative results.
Several individual contributors in other sectors that benefited performance included enterprise software products maker Oracle, German luxury auto maker BMW, industrial gas supplier Linde (Germany), and diversified industrial Danaher Corp. Elsewhere, the timing of the Fund’s purchase of project management provider Fluor Corp. also helped drive the Fund’s performance for the reporting period.
21
MML Growth & Income Fund – Portfolio Manager Report (Continued)
Subadviser outlook
Looking forward, we are optimistic for the prospects for the Fund, given that the environment for active stock pickers is showing signs of improving as correlations have been declining and the impact of macroeconomic trends has moderated. We believe that the Fund’s focus on higher-quality companies with attractive fundamentals, sustainable business models, and reasonable valuations puts it in a position to benefit as the environment changes and investment decisions return to being driven by fundamentals and valuations.
| | | | |
MML Growth & Income Fund
Largest Holdings
(% of Net Assets) on 12/31/10
(Unaudited) | |
| | |
Oracle Corp. | | | 2.8 | % |
Apple, Inc. | | | 2.7 | % |
JP Morgan Chase & Co. | | | 2.7 | % |
The Procter & Gamble Co. | | | 2.3 | % |
Danaher Corp. | | | 2.3 | % |
The Walt Disney Co. | | | 2.2 | % |
Cisco Systems, Inc. | | | 2.2 | % |
United Technologies Corp. | | | 2.1 | % |
Johnson & Johnson | | | 2.1 | % |
Wells Fargo & Co. | | | 2.0 | % |
| | | | | |
| | | | 23.4 | % |
| | | | | |
| | | | |
MML Growth & Income Fund
Sector Table
(% of Net Assets) on 12/31/10
(Unaudited) | |
| | |
Consumer, Non-cyclical | | | 23.6 | % |
Financial | | | 17.8 | % |
Technology | | | 12.5 | % |
Energy | | | 12.4 | % |
Industrial | | | 9.4 | % |
Communications | | | 8.7 | % |
Consumer, Cyclical | | | 8.1 | % |
Basic Materials | | | 4.6 | % |
Utilities | | | 2.1 | % |
| | | | | |
Total Long-Term Investments | | | 99.2 | % |
Short-Term Investments and Other Assets and Liabilities | | | 0.8 | % |
| | | | | |
Net Assets | | | 100.0 | % |
| | | | | |
22
MML Growth & Income Fund – Portfolio Manager Report (Continued)
Growth of a $10,000 Investment
Hypothetical Investments in MML Growth & Income Fund Initial Class and the S&P 500 Index.
| | | | | | | | |
| | | |
| TOTAL RETURN | | One Year
1/1/10 -
12/31/10 | | | Since
Inception
Average
Annual
5/1/06 -
12/31/10 | |
| Initial Class | | | 11.47% | | | | -2.55% | |
| S&P 500 Index | | | 15.06% | | | | 1.27% | |
Hypothetical Investments in MML Growth & Income Fund Service Class and the S&P 500 Index.
| | | | | | | | |
| | | |
| TOTAL RETURN | | One Year
1/1/10 -
12/31/10 | | | Since
Inception
Average
Annual
8/15/08 -
12/31/10 | |
| Service Class | | | 11.21% | | | | -1.43% | |
| S&P 500 Index | | | 15.06% | | | | 1.47%+ | |
GROWTH OF $10,000 INVESTMENT SINCE INCEPTION
+ From 9/2/08.
Performance data quoted represents past performance; past performance is not predictive of future results. The investment return and principal value of shares of the Fund will fluctuate with market conditions so that shares of the Fund, when redeemed, may be worth more or less than their original cost. Current performance of the Fund may be lower or higher than the performance quoted. Performance data current to the most recent month end may be obtained by accessing the website www.massmutual.com.
Investors should note that the Fund is a professionally managed mutual fund, while the S&P 500 Index is unmanaged, does not incur expenses, and cannot be purchased directly by investors. Investors should read the Fund’s prospectus with regard to the Fund’s investment objective, risks and charges and expenses in conjunction with these financial statements. The Fund’s return reflects changes in the net asset value per share without the deduction of any product charges (e.g., cost of insurance, mortality and expense risk charges, administrative fees, and CDSL). The inclusion of these charges would have reduced the performance shown here.
23
MML Income & Growth Fund – Portfolio Manager Report
What is the investment approach of MML Income & Growth Fund, and who is the Fund’s subadviser?
The Fund seeks growth of capital by investing primarily in equity securities of dividend paying companies that the Fund’s subadviser believes will both increase in value over the long term and provide current income. Equity securities may include common stocks, preferred stocks, securities convertible into common or preferred stock, rights and warrants. Effective August 20, 2010, BlackRock Investment Management, LLC (BlackRock) replaced American Century Investment Management, Inc. (American Century) as the subadviser of the Fund.
How did the Fund perform during the 12 months ended December 31, 2010?
The Fund’s Initial Class shares returned 11.70%, underperforming the 15.06% return of the S&P 500® Index (the “benchmark”), a widely recognized, unmanaged index representative of common stocks of larger capitalized U.S. companies.
For a discussion on the economic and market environment during the 12-month period ended December 31, 2010, please see the Economic and Market Review, beginning on page 3.
Subadviser discussion of factors that contributed to the Fund’s performance
For the portion of the year when the Fund was subadvised by American Century (January 1 – August 19, 2010):
Early in 2010, stock selection was most successful, relative to the benchmark, in the consumer discretionary and materials sectors of the portfolio. Stock selection among retailers, particularly specialty stores and multiline sellers, contributed the bulk of the outperformance in the consumer discretionary sector. In materials, virtually all of the outperformance came from stock selection among chemicals companies.
On the downside, portfolio holdings in the health care and information technology (“IT”) sectors underperformed their counterparts in the benchmark in the first quarter of 2010. Stock selection among biotechnology firms and health care equipment makers detracted the most in the health care sector. In IT, stock choices among computer hardware makers and an overweight position, relative to the benchmark, in IT services providers had the biggest negative impact when that component of the IT sector underperformed.
Later in 2010, portfolio holdings in the energy and consumer staples sectors had the most positive effects on the Fund’s performance, relative to the benchmark. Stock selection among oil and gas producers and an underweight position in energy equipment and services companies contributed the bulk of the outperformance in the energy sector. In consumer staples, virtually all of the outperformance resulted from an overweight position in food products makers.
Portfolio holdings in the financials and IT sectors hampered the Fund’s progress during this time. Stock selection among insurance firms and diversified financial services companies detracted the most in financials. In IT, stock choices among computer hardware makers detracted from results.
For the remainder of the year, when the Fund was subadvised by BlackRock (August 20 – December 31, 2010):
The most notable contributor to the Fund’s outperformance during the latter part of 2010 was an underweight in the financials sector, where the Fund’s conservative positioning, with its focus on healthier banks, proved beneficial. Other contributors to the Fund’s performance included an underweight position in the health care sector, followed by strategic overweight positions in the energy and materials sectors. Security selection in the telecommunication services sector also added to relative performance, as did the combination of an overweight position and stock selection within the industrials sector. Finally, security selection in the consumer discretionary sector added marginally to the Fund’s relative performance.
Conversely, the most significant detractor from the Fund’s relative performance during this time was stock selection in the energy sector, where exposure to deep-water drillers and European integrated stocks hurt returns. Stock selection in consumer staples also had a negative impact, followed by a significantly underweight position in the consumer discretionary sector. Security selection in the utilities and IT sectors proved a drag on performance.
24
MML Income & Growth Fund – Portfolio Manager Report (Continued)
Subadviser outlook
Given our expectations for economic growth in 2011, a temporary resolution of tax policy, a continued acceleration in dividends, and a predicted flow of funds into equities, it is our outlook that price appreciation among large-cap stocks could exceed the level of company earnings in the coming year. The Fund remains positioned to benefit from both domestic and global economic growth, stronger worldwide demand for raw materials, and increasing levels of free cash flow at the company level. Our focus continues to be on the balance between reliable dividend income and stable capital appreciation, and we see companies and markets progressively gaining structure and momentum in 2011.
| | | | |
MML Income & Growth Fund
Largest Holdings
(% of Net Assets) on 12/31/10
(Unaudited) | |
| | |
BHP Billiton Ltd. | | | 3.2 | % |
Chevron Corp. | | | 3.0 | % |
JP Morgan Chase & Co. | | | 2.8 | % |
Deere & Co. | | | 2.3 | % |
Caterpillar, Inc. | | | 2.3 | % |
Exxon Mobil Corp. | | | 2.2 | % |
Wells Fargo & Co. | | | 2.1 | % |
Total SA Sponsored ADR (France) | | | 1.8 | % |
E.I. du Pont de Nemours & Co. | | | 1.8 | % |
United Technologies Corp. | | | 1.8 | % |
| | | | | |
| | | | 23.3 | % |
| | | | | |
| | | | |
MML Income & Growth Fund
Sector Table
(% of Net Assets) on 12/31/10
(Unaudited) | |
| | |
Consumer, Non-cyclical | | | 18.9 | % |
Industrial | | | 16.7 | % |
Financial | | | 15.5 | % |
Energy | | | 14.0 | % |
Basic Materials | | | 10.3 | % |
Utilities | | | 7.3 | % |
Communications | | | 7.0 | % |
Consumer, Cyclical | | | 5.9 | % |
Technology | | | 4.2 | % |
| | | | | |
Total Long-Term Investments | | | 99.8 | % |
Short-Term Investments and Other Assets and Liabilities | | | 0.2 | % |
| | | | | |
Net Assets | | | 100.0 | % |
| | | | | |
25
MML Income & Growth Fund – Portfolio Manager Report (Continued)
Growth of a $10,000 Investment
Hypothetical Investments in MML Income & Growth Fund Initial Class and the S&P 500 Index.
| | | | | | | | |
| | | |
| TOTAL RETURN | | One Year
1/1/10 -
12/31/10 | | | Since
Inception
Average
Annual
5/1/06 -
12/31/10 | |
| Initial Class | | | 11.70% | | | | -1.02% | |
| S&P 500 Index | | | 15.06% | | | | 1.27% | |
Hypothetical Investments in MML Income & Growth Fund Service Class and the S&P 500 Index.
| | | | | | | | |
| | | |
| TOTAL RETURN | | One Year
1/1/10 -
12/31/10 | | | Since
Inception
Average
Annual
8/15/08 -
12/31/10 | |
| Service Class | | | 11.47% | | | | -1.55% | |
| S&P 500 Index | | | 15.06% | | | | 1.47%+ | |
GROWTH OF $10,000 INVESTMENT SINCE INCEPTION
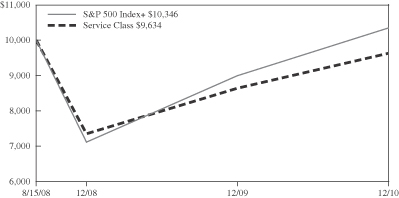
+ From 9/2/08.
Performance data quoted represents past performance; past performance is not predictive of future results. The investment return and principal value of shares of the Fund will fluctuate with market conditions so that shares of the Fund, when redeemed, may be worth more or less than their original cost. Current performance of the Fund may be lower or higher than the performance quoted. Performance data current to the most recent month end may be obtained by accessing the website www.massmutual.com.
Investors should note that the Fund is a professionally managed mutual fund, while the S&P 500 Index is unmanaged, does not incur expenses, and cannot be purchased directly by investors. Investors should read the Fund’s prospectus with regard to the Fund’s investment objective, risks and charges and expenses in conjunction with these financial statements. The Fund’s return reflects changes in the net asset value per share without the deduction of any product charges (e.g., cost of insurance, mortality and expense risk charges, administrative fees, and CDSL). The inclusion of these charges would have reduced the performance shown here.
26
MML Large Cap Growth Fund – Portfolio Manager Report
What is the investment approach of MML Large Cap Growth Fund, and who is the Fund’s subadviser?
The Fund seeks long-term capital appreciation by investing primarily in large-capitalization companies that the Fund’s subadviser believes offer the potential for long-term growth. Under normal circumstances, the Fund invests at least 80% of its net assets in the common stocks of companies whose market capitalizations at the time of purchase are within the market capitalization range of companies included in the Russell 1000® Growth Index. The Fund’s subadviser is Rainier Investment Management, Inc. (Rainier).
How did the Fund perform during the 12 months ended December 31, 2010?
The Fund’s Initial Class shares returned 18.87%, outpacing the 16.71% return of the Russell 1000® Growth Index (the “benchmark”), an unmanaged index consisting of those Russell 1000 securities (representing the 1,000 largest U.S. companies based on market capitalization) with greater than average growth orientation that tend to exhibit higher price-to-book ratios and higher forecasted growth rates than securities in the value universe.
For a discussion on the economic and market environment during the 12-month period ended December 31, 2010, please see the Economic and Market Review, beginning on page 3.
Subadviser discussion of factors that contributed to the Fund’s performance
The Fund’s outperformance of the benchmark in 2010 was due in large part to strength in the producer durables and technology sectors. The portfolio benefited from exposure to economically sensitive shares, as industrial and technology holdings rallied along with energy and consumer discretionary stocks.
Within producer durables, Cummins Inc. was the best-performing stock on a relative basis – not only within the sector, but also the entire portfolio. Deere & Co. and Expeditors International of Washington Inc. were also strong contributors to performance. Producer durables stocks – benefiting from exposure to high-growth emerging markets, lean cost structures, and profitability levels above historic norms – have been fertile ground for investment opportunity for several years.
Performance within the technology sector also contributed to the Fund’s full-year results, boosted largely by a timely sale of Hewlett-Packard Co. early in 2010. The stock ultimately lagged the benchmark by a wide margin for the 12-month period; consequently, the portfolio benefited from not owning it for a majority of the year. Notable contributors on a stock-specific basis included Citrix Systems Inc. and NetApp Inc., both of which benefited from increasing enterprise spending on technology.
On the downside, the Fund’s absolute returns in defensive sectors such as health care, utilities, and financial services lagged the overall market for the year, and all of these sectors registered negative relative returns for the portfolio in 2010. The portfolio’s financial services holdings suffered the most, with BlackRock Inc. and Visa Inc. the largest detractors. Within utilities, the Fund owned only one position during the year – AES Corp. – and its underperformance caused the portfolio sector to lag the benchmark sector.
Subadviser outlook
Although a continuation of the pattern of the second half of 2010 may be too much to hope for, the equity market is, nevertheless, generally giving encouraging signals. Recent outperformance of small-cap stocks typically correlates with an economic recovery and a strong market environment. Commodity prices, which are in an upward trend, are reinforcing that view. The fact that stocks experienced solid gains at a time when China began to tighten monetary policy and European sovereign debt issues remained challenging suggests that the global economy has regained a level of health to withstand potential economic shocks. Whether that turns out to be true remains to be seen, but it is encouraging nonetheless.
From a sector perspective, we believe a continuation of recent trends is likely to persist, with economically sensitive and capital markets-oriented shares leading the way, and defensive non-cyclical stocks likely underperforming.
27
MML Large Cap Growth Fund – Portfolio Manager Report (Continued)
| | | | |
MML Large Cap Growth Fund
Largest Holdings
(% of Net Assets) on 12/31/10
(Unaudited) | |
| | |
Apple, Inc. | | | 5.5 | % |
Amazon.com, Inc. | | | 3.1 | % |
Google, Inc. Class A | | | 2.9 | % |
Oracle Corp. | | | 2.8 | % |
Deere & Co. | | | 2.5 | % |
Cummins, Inc. | | | 2.2 | % |
Halliburton Co. | | | 2.1 | % |
Schlumberger Ltd. | | | 2.1 | % |
FedEx Corp. | | | 2.1 | % |
The Coca-Cola Co. | | | 2.0 | % |
| | | | | |
| | | | 27.3 | % |
| | | | | |
| | | | |
MML Large Cap Growth Fund Sector Table
(% of Net Assets) on 12/31/10
(Unaudited) | |
| | |
Technology | | | 20.6 | % |
Industrial | | | 16.4 | % |
Communications | | | 15.4 | % |
Consumer, Non-cyclical | | | 14.1 | % |
Consumer, Cyclical | | | 12.9 | % |
Energy | | | 8.8 | % |
Financial | | | 6.1 | % |
Basic Materials | | | 4.2 | % |
| | | | | |
Total Long-Term Investments | | | 98.5 | % |
Short-Term Investments and Other Assets and Liabilities | | | 1.5 | % |
| | | | | |
Net Assets | | | 100.0 | % |
| | | | | |
28
MML Large Cap Growth Fund – Portfolio Manager Report (Continued)
Growth of a $10,000 Investment
Hypothetical Investments in MML Large Cap Growth Fund Initial Class and the Russell 1000 Growth Index.
| | | | | | | | |
| | | |
| TOTAL RETURN | | One Year
1/1/10 -
12/31/10 | | | Since
Inception
Average
Annual
5/1/06 -
12/31/10 | |
| Initial Class | | | 18.87% | | | | 1.12% | |
| Russell 1000 Growth Index | | | 16.71% | | | | 3.38% | |
Hypothetical Investments in MML Large Cap Growth Fund Service Class and the Russell 1000 Growth Index.
| | | | | | | | |
| | | |
| TOTAL RETURN | | One Year
1/1/10 -
12/31/10 | | | Since
Inception
Average
Annual
8/15/08 -
12/31/10 | |
| Service Class | | | 18.45% | | | | 2.41% | |
| Russell 1000 Growth Index | | | 16.71% | | | | 3.90%+ | |
GROWTH OF $10,000 INVESTMENT SINCE INCEPTION
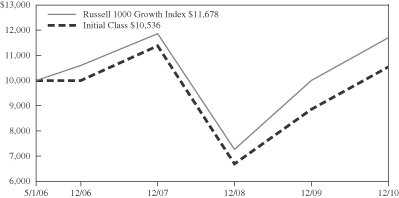
+ From 9/2/08.
Performance data quoted represents past performance; past performance is not predictive of future results. The investment return and principal value of shares of the Fund will fluctuate with market conditions so that shares of the Fund, when redeemed, may be worth more or less than their original cost. Current performance of the Fund may be lower or higher than the performance quoted. Performance data current to the most recent month end may be obtained by accessing the website www.massmutual.com.
Investors should note that the Fund is a professionally managed mutual fund, while the Russell 1000 Growth Index is unmanaged, does not incur expenses, and cannot be purchased directly by investors. Investors should read the Fund’s prospectus with regard to the Fund’s investment objective, risks and charges and expenses in conjunction with these financial statements. The Fund’s return reflects changes in the net asset value per share without the deduction of any product charges (e.g., cost of insurance, mortality and expense risk charges, administrative fees, and CDSL). The inclusion of these charges would have reduced the performance shown here.
29
MML Mid Cap Growth Fund – Portfolio Manager Report
What is the investment approach of MML Mid Cap Growth Fund, and who is the Fund’s subadviser?
The Fund seeks long-term capital appreciation by investing primarily in equity securities of mid-capitalization companies that the Fund’s subadviser believes offer the potential for long-term growth. Under normal circumstances, the Fund invests at least 80% of its net assets in a broadly diversified portfolio of common stocks of mid-cap companies whose earnings the subadviser expects to grow at a faster rate than the average company. The Fund’s subadviser is T. Rowe Price Associates, Inc. (T. Rowe Price).
How did the Fund perform during the 12 months ended December 31, 2010?
The Fund’s Initial Class shares returned 28.06%, outperforming the 26.38% return of the Russell Midcap® Growth Index (the “benchmark”), a widely recognized, unmanaged index that measures the performance of those Russell Midcap companies (representing mid-capitalization U.S. common stocks) with higher price-to-book ratios and higher forecasted growth rates than securities in the value universe. Similarly, the Fund’s 28.06% return outpaced the 26.64% return of the S&P MidCap 400® Index, a widely recognized, unmanaged index representative of common stocks of mid-capitalized U.S. companies.
For a discussion on the economic and market environment during the 12-month period ended December 31, 2010, please see the Economic and Market Review, beginning on page 3.
Subadviser discussion of factors that contributed to the Fund’s performance
In 2010, the energy sector boosted the Fund’s results, relative to the benchmark, due to favorable stock selection. Several leading holdings came from the energy equipment and services industry, including FMC Technologies, Trican Well Service, and Smith International. Elsewhere in the sector, the portfolio’s position in CNX Gas was rewarded when CONSOL Energy acquired the company at a significant premium. Peabody Energy also added value, as the firm benefited from cost containment and improved pricing power.
Health care was another area of outperformance for the Fund, also due to stock choices. Portfolio holding Valeant Pharmaceuticals proved beneficial; the company merged with Biovail, another pharmaceutical firm, and investors responded positively. Edwards Lifesciences helped as well, due to the news the company had received Food and Drug Administration (FDA) approval to start clinical trials on a new heart valve, a product for which we believe there will be significant demand.
In utilities, portfolio holdings outpaced their benchmark peers – particularly in the case of Calpine. This independent power producer, based in California and Texas, closed a deal to acquire plants from a competitor. (The portfolio tends to own relatively few utilities stocks because most do not meet the Fund’s growth criteria.)
Stock selection in consumer discretionary provided an additional boost to relative results, particularly within the hotels, restaurants, and leisure industry. Our holdings in Chipotle Mexican Grill, Wynn Resorts, and Marriott all proved helpful. Chipotle Mexican Grill benefited from increased consumer spending and low food inflation. Casino operator Wynn Resorts increased its market share in Las Vegas, and their casinos in Macau also performed well. Increased business and leisure travel helped Marriott, which enjoys strong brand loyalty and significant expansion opportunities. Despite the weak housing market and low consumer sentiment, consumer discretionary remains an important area of investment for the portfolio, as it has often been a source of good returns.
A primary detractor for the Fund in 2010 was the financials sector, where our stock holdings underperformed. Options exchange CBOE Holdings faltered as market volatility, which generates fees for the firm, decreased soon after its initial public offering (IPO). Puerto Rican bank Popular also proved detrimental, due to concerns with asset quality. Another underperforming holding was Janus Capital Group, which experienced higher-than-anticipated redemptions from its quantitative fund division.
Subadviser outlook
The economy continued its slow recovery during the fourth quarter of 2010. As consumers tried to shore up their balance sheets, the Federal Reserve (the “Fed”) attempted to compensate with a new round of quantitative easing (QE2); however, we question the effectiveness of the move as it contributes to currency volatility. We are mindful that the recent rally focused on a relatively narrow group of high-momentum stocks, but we believe that in the long run, mid-cap growth investors are better served by focusing on reasonably priced companies with enduring franchises. Equity valuations are attractive compared to bonds, particularly in light of the recent Fed action. Ultimately, we believe the only long-term path to economic growth for the U.S. is to produce more domestically, leading us to seek out high-value-added manufacturing firms that stand to benefit from a decrease in offshore production. Meanwhile, we are cautious on consumer discretionary, due to weak consumer spending.
30
MML Mid Cap Growth Fund – Portfolio Manager Report (Continued)
| | | | |
MML Mid Cap Growth Fund
Largest Holdings
(% of Net Assets) on 12/31/10
(Unaudited) | |
| | |
AMETEK, Inc. | | | 1.7 | % |
T. Rowe Price Government Reserve Investment Fund | | | 1.7 | % |
IHS, Inc. Class A | | | 1.4 | % |
Agnico-Eagle Mines Ltd. | | | 1.3 | % |
JDS Uniphase Corp. | | | 1.3 | % |
Roper Industries, Inc. | | | 1.3 | % |
McDermott International, Inc. | | | 1.3 | % |
Chipotle Mexican Grill, Inc. | | | 1.3 | % |
Marriott International, Inc. Class A | | | 1.2 | % |
Fiserv, Inc. | | | 1.2 | % |
| | | | | |
| | | | 13.7 | % |
| | | | | |
| | | | |
MML Mid Cap Growth Fund
Sector Table
(% of Net Assets) on 12/31/10
(Unaudited) | |
| | |
Consumer, Non-cyclical | | | 22.6 | % |
Technology | | | 16.5 | % |
Industrial | | | 14.5 | % |
Consumer, Cyclical | | | 13.0 | % |
Communications | | | 11.3 | % |
Energy | | | 8.4 | % |
Financial | | | 7.0 | % |
Basic Materials | | | 2.1 | % |
Mutual Funds | | | 1.7 | % |
Utilities | | | 1.1 | % |
| | | | | |
Total Long-Term Investments | | | 98.2 | % |
Short-Term Investments and Other Assets and Liabilities | | | 1.8 | % |
| | | | | |
Net Assets | | | 100.0 | % |
| | | | | |
| | | | |
MML Mid Cap Growth Fund
Country Weightings
(% of Net Assets) on 12/31/10
(Unaudited) | |
| | |
United States | | | 88.4 | % |
Canada | | | 5.9 | % |
Panama | | | 1.3 | % |
Netherlands | | | 0.6 | % |
British Virgin Islands | | | 0.6 | % |
Bermuda | | | 0.5 | % |
Switzerland | | | 0.4 | % |
Puerto Rico | | | 0.3 | % |
Ireland | | | 0.2 | % |
| | | | | |
Total Long-Term Investments | | | 98.2 | % |
Short-Term Investments and Other Assets and Liabilities | | | 1.8 | % |
| | | | | |
Net Assets | | | 100.0 | % |
| | | | | |
31
MML Mid Cap Growth Fund – Portfolio Manager Report (Continued)
Growth of a $10,000 Investment
Hypothetical Investments in MML Mid Cap Growth Fund Initial Class, the Russell Midcap Growth Index and the S&P MidCap 400 Index.
| | | | | | | | |
| | | |
| TOTAL RETURN | | One Year
1/1/10 -
12/31/10 | | | Since
Inception
Average
Annual
5/1/06 -
12/31/10 | |
| Initial Class | | | 28.06% | | | | 5.91% | |
| Russell Midcap Growth Index* | | | 26.38% | | | | 3.51% | |
| S&P MidCap 400 Index | | | 26.64% | | | | 4.19% | |
Hypothetical Investments in MML Mid Cap Growth Fund Service Class, the Russell Midcap Growth Index and the S&P MidCap 400 Index.
| | | | | | | | |
| | | |
| TOTAL RETURN | | One Year
1/1/10 -
12/31/10 | | | Since
Inception
Average
Annual
8/15/08 -
12/31/10 | |
| Service Class | | | 27.84% | | | | 7.35% | |
| Russell Midcap Growth Index* | | | 26.38% | | | | 5.69%+ | |
| S&P MidCap 400 Index | | | 26.64% | | | | 6.43%+ | |
GROWTH OF $10,000 INVESTMENT SINCE INCEPTION
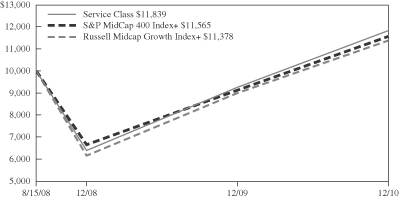
* Benchmark
+ From 9/2/08.
Performance data quoted represents past performance; past performance is not predictive of future results. The investment return and principal value of shares of the Fund will fluctuate with market conditions so that shares of the Fund, when redeemed, may be worth more or less than their original cost. Current performance of the Fund may be lower or higher than the performance quoted. Performance data current to the most recent month end may be obtained by accessing the website www.massmutual.com.
Investors should note that the Fund is a professionally managed mutual fund, while the Russell Midcap Growth Index and the S&P MidCap 400 Index are unmanaged, do not incur expenses, and cannot be purchased directly by investors. Investors should read the Fund’s prospectus with regard to the Fund’s investment objective, risks and charges and expenses in conjunction with these financial statements. The Fund’s return reflects changes in the net asset value per share without the deduction of any product charges (e.g., cost of insurance, mortality and expense risk charges, administrative fees, and CDSL). The inclusion of these charges would have reduced the performance shown here.
32
MML Mid Cap Value Fund – Portfolio Manager Report
What is the investment approach of MML Mid Cap Value Fund, and who is the Fund’s subadviser?
The Fund seeks long-term capital growth. Income is a secondary objective. The Fund invests primarily in equity securities of mid-capitalization companies that the Fund’s subadviser believes offer prospects for long-term capital growth. Under normal circumstances, the Fund invests at least 80% of its net assets in equity securities of medium-size companies. The Fund’s subadviser is American Century Investment Management, Inc. (American Century).
How did the Fund perform during the 12 months ended December 31, 2010?
The Fund’s Initial Class shares returned 20.09%, trailing the 24.75% return of Russell Midcap® Value Index (the “benchmark”), a widely recognized, unmanaged index that measures the performance of those Russell Midcap companies (representing mid-capitalization U.S. common stocks) with lower price-to-book ratios and lower forecasted growth rates than securities in the growth universe.
For a discussion on the economic and market environment during the 12-month period ended December 31, 2010, please see the Economic and Market Review, beginning on page 3.
Subadviser discussion of factors that contributed to the Fund’s performance
The Fund received positive results in absolute terms from all 10 of the sectors in which it was invested. Relative to the benchmark, the portfolio underperformed in the financials, energy, and consumer discretionary sectors. Conversely, portfolio holdings in the utilities and information technology (“IT”) sectors helped drive the Fund’s relative performance.
Within financials, less-than-favorable stock selection hindered the Fund’s relative performance. Additionally, the portfolio was hampered by its underweight position, relative to the benchmark, in commercial banks. The Fund’s lack of exposure to Fifth Third Bancorp, KeyCorp, and Huntingdon Bancshares proved to be a particular disadvantage, since all were up significantly for the year. In the capital markets segment, the portfolio’s mix of stocks hindered results. Two notable detractors were Northern Trust Corp. and State Street Corp. – both were negatively impacted by expectations of a prolonged period of historically low interest rates and concerns about the diminished profitability of the companies’ securities-lending and foreign-exchange businesses.
An underweight position in energy, the second-strongest sector in the benchmark, detracted as well in 2010. The portfolio’s oil and gas companies also dampened results. A key detractor was Imperial Oil Ltd., which is not represented in the benchmark. Despite the company’s high-quality business model and solid balance sheet, its shares lagged the equity market rally. Another notable detractor was EQT Corp., a low-cost producer of unconventional tight shale natural gas. EQT reported significant success with two of its experimental shale wells; however, our view is that weak natural gas prices temporarily pushed down the company’s share price. The stock rebounded in the fourth quarter on news that one of its competitors was being acquired by a larger integrated energy producer.
Stock selection within the strongly performing consumer discretionary sector weighed on the portfolio’s relative results. In particular, the Fund was hampered by investments among hotel, restaurant, and leisure stocks. A key detractor was Speedway Motorsports. The race track operator has been unable to cut costs enough to offset reduced attendance at NASCAR events and a decline in corporate sponsorship.
The specialty retailing segment provided both losers and winners for the year. A notable performance detractor, home improvement retailer Lowe’s Companies, had reported better comparable store sales and stabilizing trends in big-ticket item sales. Unfortunately, the company’s stock performed poorly on concerns about the drawn-out economic recovery, lackluster consumer spending, and renewed softening in the housing market. Conversely, PetSmart, also in the specialty retailing segment, was actually one of Fund’s top contributors for the year. Although the retail environment remains challenging, pet products seem relatively well insulated from economic conditions and the pet store operator continues to post strong profits.
In utilities, the weakest-performing sector in the benchmark, effective security selection enhanced full-year performance results. The Fund benefited from the portfolio’s bias toward regulated utilities, which have stable business models and held up well during the 2008-2009 market decline. The Fund also held no independent power producers – primarily because of their financial
33
MML Mid Cap Value Fund – Portfolio Manager Report (Continued)
and operating volatility – and this segment declined more than 10% in 2010. Finally, an underweight position in the IT sector contributed to relative performance, as portfolio holdings among IT services companies and semiconductor stocks were particularly advantageous. A notable contributor was Teradyne, a semiconductor test equipment maker not represented in the benchmark.
Subadviser outlook
We continue to follow our disciplined, bottom-up process, selecting companies one at a time for the portfolio. As of December 31, 2010, we saw the potential for opportunity in industrials, consumer staples, and health care – reflected by the portfolio’s overweight positions in these sectors relative to the benchmark. Conversely, our fundamental analysis and valuation work have led to smaller relative weightings in financial and utilities stocks.
| | | | |
MML Mid Cap Value Fund
Largest Holdings
(% of Net Assets) on 12/31/10
(Unaudited) | |
| | |
Republic Services, Inc. | | | 3.1 | % |
Imperial Oil Ltd. | | | 2.9 | % |
iShares Russell Midcap Value Index Fund | | | 2.8 | % |
Northern Trust Corp. | | | 2.5 | % |
Lowe’s Cos., Inc. | | | 2.3 | % |
Kimberly-Clark Corp. | | | 2.2 | % |
ConAgra Foods, Inc. | | | 1.9 | % |
Beckman Coulter, Inc. | | | 1.8 | % |
Zimmer Holdings, Inc. | | | 1.8 | % |
EQT Corp. | | | 1.7 | % |
| | | | | |
| | | | 23.0 | % |
| | | | | |
| | | | |
MML Mid Cap Value Fund
Sector Table
(% of Net Assets) on 12/31/10
(Unaudited) | |
| | |
Financial | | | 25.7 | % |
Consumer, Non-cyclical | | | 18.1 | % |
Industrial | | | 14.2 | % |
Consumer, Cyclical | | | 11.9 | % |
Utilities | | | 9.4 | % |
Energy | | | 9.1 | % |
Technology | | | 3.9 | % |
Basic Materials | | | 3.0 | % |
Mutual Funds | | | 2.8 | % |
Communications | | | 2.3 | % |
| | | | | |
Total Long-Term Investments | | | 100.4 | % |
Short-Term Investments and Other Assets and Liabilities | | | (0.4 | )% |
| | | | | |
Net Assets | | | 100.0 | % |
| | | | | |
34
MML Mid Cap Value Fund – Portfolio Manager Report (Continued)
Growth of a $10,000 Investment
Hypothetical Investments in MML Mid Cap Value Fund Initial Class and the Russell Midcap Value Index.
| | | | | | | | |
| | | |
| TOTAL RETURN | | One Year
1/1/10 -
12/31/10 | | | Since
Inception
Average
Annual
5/1/06 -
12/31/10 | |
| Initial Class | | | 20.09% | | | | 5.49% | |
| Russell Midcap Value Index | | | 24.75% | | | | 2.54% | |
Hypothetical Investments in MML Mid Cap Value Fund Service Class and the Russell Midcap Value Index.
| | | | | | | | |
| | | |
| TOTAL RETURN | | One Year
1/1/10 -
12/31/10 | | | Since
Inception
Average
Annual
8/15/08 -
12/31/10 | |
| Service Class | | | 19.62% | | | | 7.57% | |
| Russell Midcap Value Index | | | 24.75% | | | | 4.52%+ | |
GROWTH OF $10,000 INVESTMENT SINCE INCEPTION
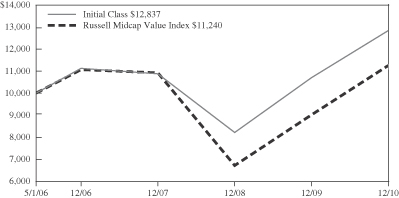
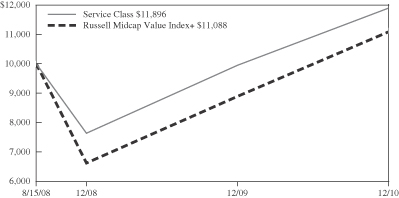
+ From 9/2/08.
Performance data quoted represents past performance; past performance is not predictive of future results. The investment return and principal value of shares of the Fund will fluctuate with market conditions so that shares of the Fund, when redeemed, may be worth more or less than their original cost. Current performance of the Fund may be lower or higher than the performance quoted. Performance data current to the most recent month end may be obtained by accessing the website www.massmutual.com.
Investors should note that the Fund is a professionally managed mutual fund, while the Russell Midcap Value Index is unmanaged, does not incur expenses, and cannot be purchased directly by investors. Investors should read the Fund’s prospectus with regard to the Fund’s investment objective, risks and charges and expenses in conjunction with these financial statements. The Fund’s return reflects changes in the net asset value per share without the deduction of any product charges (e.g., cost of insurance, mortality and expense risk charges, administrative fees, and CDSL). The inclusion of these charges would have reduced the performance shown here.
35
MML Small Cap Index Fund – Portfolio Manager Report
What is the investment approach of MML Small Cap Index Fund, and who is the Fund’s subadviser?
The Fund seeks to provide investment results approximating (before fees and expenses) the aggregate price and dividend performance of the securities in the Standard & Poor’s SmallCap 600 Index (the “index”). Under normal circumstances, the Fund invests at least 80% (and, typically, substantially all) of its net assets in the securities of companies that make up the index, in weightings that approximate the relative composition of the securities contained in the index, and in S&P SmallCap 600 Index futures contracts. The Fund’s subadviser is Northern Trust Investments, Inc. (NTI).
How did the Fund perform during the 12 months ended December 31, 2010?
The Fund’s Initial Class shares returned 25.61%, trailing the 26.31% return of the S&P SmallCap 600 Index (the “benchmark”), a widely recognized, capitalization-weighted unmanaged index of common stocks chosen by Standard & Poor’s for industry group representation, market size, liquidity, adequate float size and other trading requirements. The index tracks the performance of the small-cap portion of the U.S. equity market.
For a discussion on the economic and market environment during the 12-month period ended December 31, 2010, please see the Economic and Market Review, beginning on page 3.
Subadviser discussion of factors that contributed to the Fund’s performance
Sector performance was positive for the year ended December 31, 2010. Information technology, the largest sector in the benchmark, returned 24.60%. Energy continued to post the strongest performance for the year, with a return of 44.87%. Consumer discretionary gained 35.89% for the period. Conversely, telecommunication services and utilities were the worst-performing sectors for the year, returning 5.13% and 18.22%, respectively.
The year started in negative territory, as U.S. equity markets suffered losses in January, fueled by mixed corporate earnings and continued concerns around jobless data and consumer confidence levels. In February and March, the equity markets advanced, as many U.S. corporations posted unexpected positive earnings, in tandem with increased corporate activity.
The second quarter started with a better-than-expected earnings season and multiple merger and acquisition (“M&A”) announcements; however, disappointing macroeconomic data and Securities and Exchange Commission (SEC) fraud charges against Goldman Sachs in mid-April helped reverse the market. Multiple sovereign credit downgrades in Europe placed further downward pressure on performance. In mid-June, M&A activity and comments from the Federal Reserve (the “Fed”) provided a brief rally, but the market quickly reverted after disappointing U.S. home sales, Gross Domestic Product (GDP), and several lower-than-expected corporate earnings and guidance announcements.
U.S. markets rallied in the third quarter, driven by better-than-expected earnings reports, increased M&A activity, and speculation concerning the Fed’s quantitative easing efforts, which ultimately resulted in the announcement of further quantitative easing in the form of $600 billion in U.S. Treasury purchases. Share repurchases and/or dividend increases by Microsoft, MasterCard, and Termo Fisher were seen as positive news by the markets.
A better-than-anticipated start to the earnings season helped equity markets early in the fourth quarter, along with further M&A activity and better-than-expected macroeconomic data. The year ended on a positive note, as December provided positive performance on strong manufacturing data, both in the U.S. and internationally.
Subadviser outlook
In our view, growing new orders in the industrials sector, against a backdrop of falling inventories, bode well for 2011 growth, and many have embraced this more robust outlook. In addition to the economic check-up, policy discussions have focused on two key risks: the European credit crisis and U.S. state and local financial deterioration. With regard to the European credit crisis, while we expect a journey toward greater fiscal unity to be bumpy, we do expect the European Union to work its way through this crisis – predicated on an expectation for reluctant (but forthcoming) German support. Importantly, we see limited systemic risk in the U.S., as meaningful intervention by Fed authorities seems unlikely and potential losses will likely be immaterial to aggregate net worth.
36
MML Small Cap Index Fund – Portfolio Manager Report (Continued)
“Standard & Poor’s®,” “S&P®,” “Standard & Poor’s SmallCap 600” and “S&P SmallCap 600” are trademarks of The McGraw-Hill Companies and have been licensed for use by the Fund. The Fund is not sponsored, endorsed, sold or promoted by Standard & Poor’s and Standard & Poor’s makes no representation regarding the advisability of investing in the Fund.
| | | | |
MML Small Cap Index Fund
Largest Holdings
(% of Net Assets) on 12/31/10
(Unaudited) | |
| | |
Oil States International, Inc. | | | 0.7 | % |
Cypress Semiconductor Corp. | | | 0.6 | % |
Varian Semiconductor Equipment Associates, Inc. | | | 0.6 | % |
Salix Pharmaceuticals Ltd. | | | 0.6 | % |
The Cooper Cos., Inc. | | | 0.5 | % |
World Fuel Services Corp. | | | 0.5 | % |
BioMed Realty Trust, Inc. | | | 0.5 | % |
Regeneron Pharmaceuticals, Inc. | | | 0.5 | % |
National Retail Properties, Inc. | | | 0.5 | % |
Stifel Financial Corp. | | | 0.5 | % |
| | | | | |
| | | | 5.5 | % |
| | | | | |
| | | | |
MML Small Cap Index Fund
Sector Table
(% of Net Assets) on 12/31/10
(Unaudited) | |
| | |
Consumer, Non-cyclical | | | 19.3 | % |
Industrial | | | 18.4 | % |
Financial | | | 18.2 | % |
Consumer, Cyclical | | | 15.6 | % |
Technology | | | 11.4 | % |
Communications | | | 5.1 | % |
Energy | | | 4.6 | % |
Utilities | | | 3.8 | % |
Basic Materials | | | 3.5 | % |
Mutual Funds | | | 0.1 | % |
| | | | | |
Total Long-Term Investments | | | 100.0 | % |
Short-Term Investments and Other Assets and Liabilities | | | 0.0 | % |
| | | | | |
Net Assets | | | 100.0 | % |
| | | | | |
37
MML Small Cap Index Fund – Portfolio Manager Report (Continued)
Growth of a $10,000 Investment
Hypothetical Investments in MML Small Cap Index Fund Initial Class and the S&P SmallCap 600 Index.
| | | | | | | | |
| | | |
| TOTAL RETURN | | One Year
1/1/10 -
12/31/10 | | | Since
Inception
Average
Annual
5/1/06 -
12/31/10 | |
| Initial Class | | | 25.61% | | | | 1.76% | |
| S&P SmallCap 600 Index | | | 26.31% | | | | 2.30% | |
Hypothetical Investments in MML Small Cap Index Fund Service Class and the S&P SmallCap 600 Index.
| | | | | | | | |
| | | |
| TOTAL RETURN | | One Year
1/1/10 -
12/31/10 | | | Since
Inception
Average
Annual
8/15/08 -
12/31/10 | |
| Service Class | | | 25.36% | | | | 2.69% | |
| S&P SmallCap 600 Index | | | 26.31% | | | | 4.44%+ | |
GROWTH OF $10,000 INVESTMENT SINCE INCEPTION
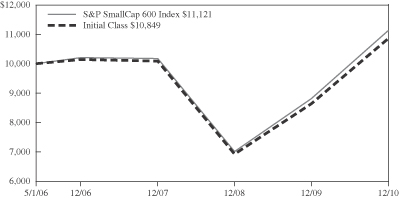
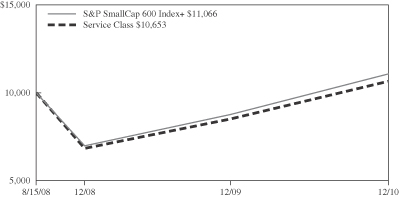
+ From 9/2/08.
Performance data quoted represents past performance; past performance is not predictive of future results. The investment return and principal value of shares of the Fund will fluctuate with market conditions so that shares of the Fund, when redeemed, may be worth more or less than their original cost. Current performance of the Fund may be lower or higher than the performance quoted. Performance data current to the most recent month end may be obtained by accessing the website www.massmutual.com.
Investors should note that the Fund is a professionally managed mutual fund, while the S&P SmallCap 600 Index is unmanaged, does not incur expenses, and cannot be purchased directly by investors. Investors should read the Fund’s prospectus with regard to the Fund’s investment objective, risks and charges and expenses in conjunction with these financial statements. The Fund’s return reflects changes in the net asset value per share without the deduction of any product charges (e.g., cost of insurance, mortality and expense risk charges, administrative fees, and CDSL). The inclusion of these charges would have reduced the performance shown here.
38
MML Small Company Value Fund – Portfolio Manager Report
What is the investment approach of MML Small Company Value Fund, and who is the Fund’s subadviser?
The Fund seeks long-term capital appreciation by investing primarily in equity securities that the subadviser believes are undervalued. Under normal circumstances, the Fund invests at least 80% of its net assets in the securities of companies whose market capitalizations, at the time of purchase, are within the market capitalization range of companies included in the Russell 2000® Index. The Fund’s subadviser is T. Rowe Price Associates, Inc. (T. Rowe Price).
How did the Fund perform during the 12 months ended December 31, 2010?
The Fund’s Class II shares returned 20.83%, underperforming the 24.50% return of the Russell 2000 Value Index (the “benchmark”), a widely recognized, unmanaged index that measures the performance of those Russell 2000 Index companies (representing small-capitalization U.S. common stocks) with lower price-to-book ratios and lower forecasted growth rates than securities in the growth universe. The Fund also lagged the 26.85% return of the Russell 2000 Index, a widely recognized, unmanaged index representative of common stocks of smaller capitalized U.S. companies.
For a discussion on the economic and market environment during the 12-month period ended December 31, 2010, please see the Economic and Market Review, beginning on page 3.
Subadviser discussion of factors that contributed to the Fund’s performance
Stock selection in the consumer discretionary sector detracted from the Fund’s performance, relative to the benchmark, for the 12-month period. In particular, portfolio holdings in the specialty retail and diversified consumer services industries lagged those in the benchmark. Despite improving sales and a double-digit positive return, specialty retailer Aarons was a notable laggard. Portfolio holding Matthews International, which sells products such as caskets and cremation equipment to the cemetery and funeral home industries, also underperformed as a result of the struggling economy and weak consumer demand. Eliminated from the portfolio near the end of 2010 was Corinthian Colleges, a holding that had detracted from performance for some time, as the company struggled to comply with regulations governing the for-profit education industry.
The portfolio’s health care investments did not keep pace with those in the benchmark in 2010. Hospital and surgical supplies distributor Owens & Minor was a detractor, hurt by weaker utilization of health care services and general pessimism surrounding the health care sector. Similarly, the Fund’s relative performance in the industrials and business services sector was hampered by stock selection. The portfolio’s overweight position in the sector helped offset some of the negative impact of stock selection, however. Stock selection detracted in the materials sector, but overweight positioning proved beneficial, as this was the strongest-performing sector in the benchmark for the one-year period. Conversely, on a stock-specific basis, Wausau Paper was a notable detractor.
On the plus side, the portfolio benefited from the strong performance of its energy holdings, which outperformed those in the benchmark by a wide margin. Whiting Petroleum and Mariner Energy were two top contributors. Financials also benefited the Fund’s relative performance, due to a substantially underweight position and stock selection. Of particular note was real estate investment trust holding CBL & Associates Properties, a regional mall operator that benefited from improved occupancy and leasing activity.
Subadviser outlook
The economic recovery appears to have entered a more secure phase in recent months. The only significant concern we have for the global economy is the potential for inflation. Consequently, we are maintaining significant weightings in the energy and materials sectors, with a particular emphasis in the latter on metals and mining firms.
Our view is that continued growth in the U.S. and abroad should provide a favorable backdrop for equity prices, but we are mindful that strong gains will be difficult to achieve following a year in which small-cap stock prices increased by more than 20%. We would not be surprised to see a correction in coming months, if only to consolidate gains and drain some of the exuberance from the market. On balance, we expect 2011 to be another favorable year for the equity markets, but not on the same scale as we have seen for the past two years.
39
MML Small Company Value Fund – Portfolio Manager Report (Continued)
| | | | |
MML Small Company
Value Fund
Largest Holdings
(% of Net Assets) on 12/31/10
(Unaudited) | |
| | |
Nordson Corp. | | | 1.9 | % |
Landstar System, Inc. | | | 1.8 | % |
Aaron’s, Inc. | | | 1.8 | % |
Stifel Financial Corp. | | | 1.8 | % |
ProAssurance Corp. | | | 1.7 | % |
Genesee & Wyoming, Inc. Class A | | | 1.7 | % |
Owens & Minor, Inc. | | | 1.5 | % |
CBL & Associates Properties, Inc. | | | 1.5 | % |
Woodward Governor Co. | | | 1.5 | % |
AptarGroup, Inc. | | | 1.4 | % |
| | | | | |
| | | | 16.6 | % |
| | | | | |
| | | | |
MML Small Company
Value Fund
Sector Table
(% of Net Assets) on 12/31/10
(Unaudited) | |
| | |
Industrial | | | 27.2 | % |
Financial | | | 21.3 | % |
Consumer, Cyclical | | | 11.4 | % |
Consumer, Non-cyclical | | | 10.4 | % |
Basic Materials | | | 8.5 | % |
Energy | | | 6.7 | % |
Technology | | | 4.5 | % |
Utilities | | | 4.0 | % |
Communications | | | 2.7 | % |
Mutual Funds | | | 0.4 | % |
| | | | | |
Total Long-Term Investments | | | 97.1 | % |
Short-Term Investments and Other Assets and Liabilities | | | 2.9 | % |
| | | | | |
Net Assets | | | 100.0 | % |
| | | | | |
40
MML Small Company Value Fund – Portfolio Manager Report (Continued)
Growth of a $10,000 Investment
Hypothetical Investments in MML Small Company Value Fund Class II, Service Class I, the Russell 2000 Value Index and the Russell 2000 Index.
| | | | | | | | |
| | | |
| TOTAL RETURN | | One Year
1/1/10 -
12/31/10 | | | Since
Inception
Average
Annual
2/27/09 -
12/31/10 | |
| Class II | | | 20.83% | | | | 43.59% | |
| Service Class I | | | 20.59% | | | | 43.23% | |
| Russell 2000 Value Index* | | | 24.50% | | | | 47.29%+ | |
| Russell 2000 Index | | | 26.85% | | | | 48.56%+ | |
GROWTH OF $10,000 INVESTMENT SINCE INCEPTION
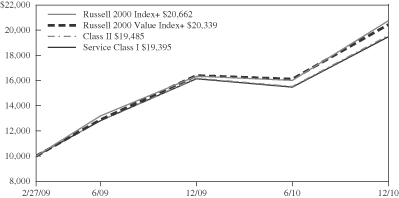
* Benchmark
+ From 3/2/09.
Performance data quoted represents past performance; past performance is not predictive of future results. The investment return and principal value of shares of the Fund will fluctuate with market conditions so that shares of the Fund, when redeemed, may be worth more or less than their original cost. Current performance of the Fund may be lower or higher than the performance quoted. Performance data current to the most recent month end may be obtained by accessing the website www.massmutual.com.
Investors should note that the Fund is a professionally managed mutual fund, while the Russell 2000 Value Index and the Russell 2000 Index are unmanaged, do not incur expenses, and cannot be purchased directly by investors. Investors should read the Fund’s prospectus with regard to the Fund’s investment objective, risks and charges and expenses in conjunction with these financial statements. The Fund’s return reflects changes in the net asset value per share without the deduction of any product charges (e.g., cost of insurance, mortality and expense risk charges, administrative fees, and CDSL). The inclusion of these charges would have reduced the performance shown here.
41
MML Small/Mid Cap Value Fund – Portfolio Manager Report
What is the investment approach of MML Small/Mid Cap Value Fund, and who is the Fund’s subadviser?
The Fund seeks long-term total return by investing primarily in securities that the subadviser believes to be undervalued. Under normal circumstances, the Fund invests at least 80% of its net assets in securities of small- and mid-cap companies. The Fund’s subadviser is AllianceBernstein L.P. (AllianceBernstein).
How did the Fund perform during the 12 months ended December 31, 2010?
The Fund’s Initial Class Shares returned 26.84%, modestly outperforming the 26.71% return of the Russell 2500TM Index (the “benchmark”), an unmanaged index that measures the performance of the 2,500 smallest companies in the Russell 3000® Index, which measures the performance of the 3,000 largest U.S. companies based on market capitalization. The Fund also outpaced the 24.82% return of the Russell 2500® Value Index, an unmanaged index representative of common stocks of small- and mid-capitalization U.S. companies with lower price-to-book ratios and lower forecasted growth rates than securities in the growth universe.
For a discussion on the economic and market environment during the 12-month period ended December 31, 2010, please see the Economic and Market Review, beginning on page 3.
Subadviser discussion of factors that contributed to the Fund’s performance
Equity markets ended 2010 strongly, as investor confidence improved due to strengthening economic data, robust corporate earnings growth, and anticipation of the extension of the Bush-era tax cuts.
The European sovereign bond crisis, possible regulatory reform and credit-tightening efforts in China had raised fears of a double-dip recession in the second quarter of 2010. Those fears eased in the third quarter, and seemed to evaporate in the fourth, especially in the U.S. Additional U.S. fiscal and monetary stimulus and continued strong emerging markets demand renewed hope for a more vibrant economic recovery, and propelled the market upward.
The Fund’s positive performance in 2010 was largely due to the selection of portfolio holdings that benefited from the economic recovery and corporate restructuring efforts – and because of a rotation to attractively valued, higher-quality stocks.
The portfolio’s strong full-year performance was primarily driven by favorable stock selection, particularly positive stock choices and an overweight position, relative to the benchmark, in consumer cyclicals. Stock selection in the energy and capital equipment sectors and an underweight position in the lagging utilities sector also contributed to the Fund’s progress for the year. The five top-performing stocks in 2010 were Mariner Energy, TRW Automotive, Ann Taylor Stores, Wesco International, and Royal Caribbean Cruises.
The factors that detracted the most from Fund performance were stock selection in the technology and construction/housing sectors. On a stock-specific basis, the worst-performing portfolio holdings in 2010 were Dean Foods, Office Depot, Washington Federal, Kinetic Concepts, and AU Optronics.
Subadviser outlook
Opportunities for large absolute and relative returns were smaller, as 2011 began, than they were when the market rally began in March 2009, but there is less economic and earnings risk and lower market volatility today. On a risk-adjusted basis, the opportunity that remains is quite attractive, in our view.
Equity markets globally have rallied, and U.S. markets have retraced much of the decline incurred in the credit crisis of 2007 and 2008. In our view, stock markets have remained reasonably valued when viewed in terms of their own historical performance and very attractive versus bonds.
U.S. smaller-capitalization stocks are somewhat higher priced than U.S. large-capitalization equities. But their valuation premium isn’t excessive, in our view, because smaller firms are stronger than usual. Smaller companies cut costs more than large companies during the recession, and, in our opinion, offer greater leverage to economic growth. Thus, we believe small stocks remain appealing, since valuation spreads are good and company fundamentals are strong.
42
MML Small/Mid Cap Value Fund – Portfolio Manager Report (Continued)
| | | | |
MML Small/Mid Cap
Value Fund
Largest Holdings
(% of Net Assets) on 12/31/10
(Unaudited) | |
| | |
Dana Holding Corp. | | | 1.4 | % |
Camden Property Trust | | | 1.3 | % |
Foot Locker, Inc. | | | 1.3 | % |
Health Net, Inc. | | | 1.3 | % |
AnnTaylor Stores Corp. | | | 1.3 | % |
General Cable Corp. | | | 1.3 | % |
American Greetings Corp. Class A | | | 1.3 | % |
Mueller Industries, Inc. | | | 1.3 | % |
Endurance Specialty Holdings Ltd. | | | 1.3 | % |
Constellation Brands, Inc. Class A | | | 1.2 | % |
| | | | | |
| | | | 13.0 | % |
| | | | | |
| | | | |
MML Small/Mid Cap
Value Fund
Sector Table
(% of Net Assets) on 12/31/10
(Unaudited) | |
| | |
Financial | | | 28.0 | % |
Consumer, Non-cyclical | | | 15.7 | % |
Consumer, Cyclical | | | 15.0 | % |
Industrial | | | 14.8 | % |
Utilities | | | 10.8 | % |
Basic Materials | | | 6.7 | % |
Energy | | | 5.9 | % |
Communications | | | 4.3 | % |
Technology | | | 1.4 | % |
| | | | | |
Total Long-Term Investments | | | 102.6 | % |
Short-Term Investments and Other Assets and Liabilities | | | (2.6 | )% |
| | | | | |
Net Assets | | | 100.0 | % |
| | | | | |
| | | | |
MML Small/Mid Cap
Value Fund
Country Weightings
(% of Net Assets) on 12/31/10
(Unaudited) | |
| | |
United States | | | 91.4 | % |
Bermuda | | | 5.8 | % |
Canada | | | 1.2 | % |
Liberia | | | 1.0 | % |
Puerto Rico | | | 1.0 | % |
Singapore | | | 0.9 | % |
Taiwan | | | 0.7 | % |
United Kingdom | | | 0.6 | % |
| | | | | |
Total Long-Term Investments | | | 102.6 | % |
Short-Term Investments and Other Assets and Liabilities | | | (2.6 | )% |
| | | | | |
Net Assets | | | 100.0 | % |
| | | | | |
43
MML Small/Mid Cap Value Fund – Portfolio Manager Report (Continued)
Growth of a $10,000 Investment
Hypothetical Investments in MML Small/Mid Cap Value Fund Initial Class, the Russell 2500 Index and the Russell 2500 Value Index.
| | | | | | | | |
| | | |
| TOTAL RETURN | | One Year
1/1/10 -
12/31/10 | | | Since
Inception
Average
Annual
5/1/06 -
12/31/10 | |
| Initial Class | | | 26.84% | | | | -0.89% | |
| Russell 2500 Index* | | | 26.71% | | | | 2.78% | |
| Russell 2500 Value Index | | | 24.82% | | | | 1.85% | |
Hypothetical Investments in MML Small/Mid Cap Value Fund Service Class, the Russell 2500 Index and the Russell 2500 Value Index.
| | | | | | | | |
| | | |
| TOTAL RETURN | | One Year
1/1/10 -
12/31/10 | | | Since
Inception
Average
Annual
8/15/08 -
12/31/10 | |
| Service Class | | | 26.44% | | | | 6.28% | |
| Russell 2500 Index* | | | 26.71% | | | | 5.42%+ | |
| Russell 2500 Value Index | | | 24.82% | | | | 4.86%+ | |
GROWTH OF $10,000 INVESTMENT SINCE INCEPTION
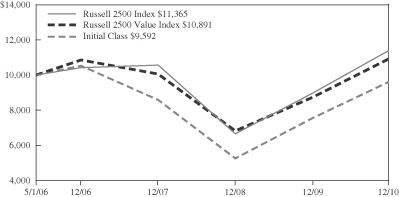
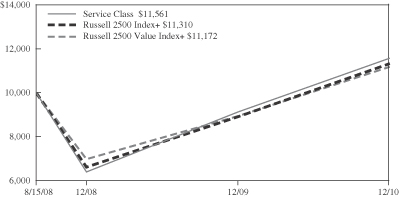
* Benchmark
+ From 9/2/08.
Performance data quoted represents past performance; past performance is not predictive of future results. The investment return and principal value of shares of the Fund will fluctuate with market conditions so that shares of the Fund, when redeemed, may be worth more or less than their original cost. Current performance of the Fund may be lower or higher than the performance quoted. Performance data current to the most recent month end may be obtained by accessing the website www.massmutual.com.
Investors should note that the Fund is a professionally managed mutual fund, while the Russell 2500 Index and the Russell 2500 Value Index are unmanaged, do not incur expenses, and cannot be purchased directly by investors. Investors should read the Fund’s prospectus with regard to the Fund’s investment objective, risks and charges and expenses in conjunction with these financial statements. The Fund’s return reflects changes in the net asset value per share without the deduction of any product charges (e.g., cost of insurance, mortality and expense risk charges, administrative fees, and CDSL). The inclusion of these charges would have reduced the performance shown here.
44
MML Asset Allocation Fund – Portfolio of Investments
December 31, 2010
| | | | | | | | |
| | | Number of
Shares | | | Value | |
| EQUITIES — 66.1% | | | | | | | | |
| | |
| COMMON STOCK — 66.1% | | | | | | | | |
| Aerospace & Defense — 1.2% | | | | | | | | |
The Boeing Co. | | | 7,500 | | | $ | 489,450 | |
Spirit AeroSystems Holdings, Inc. Class A (a) | | | 25,100 | | | | 522,331 | |
United Technologies Corp. | | | 8,300 | | | | 653,376 | |
| | | | | | | | |
| | | | | | | 1,665,157 | |
| | | | | | | | |
| Agriculture — 2.4% | | | | | | | | |
Philip Morris International, Inc. | | | 59,400 | | | | 3,476,682 | |
| | | | | | | | |
| Apparel — 0.2% | | | | | | | | |
Nike, Inc. Class B | | | 2,700 | | | | 230,634 | |
| | | | | | | | |
| Banks — 0.2% | | | | | | | | |
Bank of New York Mellon Corp. | | | 4,300 | | | | 129,860 | |
BB&T Corp. | | | 5,300 | | | | 139,337 | |
| | | | | | | | |
| | | | | | | 269,197 | |
| | | | | | | | |
| Beverages — 0.9% | | | | | | | | |
PepsiCo, Inc. | | | 20,400 | | | | 1,332,732 | |
| | | | | | | | |
| Biotechnology — 1.1% | | | | | | | | |
Celgene Corp. (a) | | | 26,800 | | | | 1,584,952 | |
| | | | | | | | |
| Chemicals — 1.4% | | | | | | | | |
Air Products & Chemicals, Inc. | | | 7,900 | | | | 718,505 | |
Monsanto Co. | | | 12,600 | | | | 877,464 | |
Potash Corporation of Saskatchewan, Inc. | | | 2,300 | | | | 356,109 | |
| | | | | | | | |
| | | | | | | 1,952,078 | |
| | | | | | | | |
| Commercial Services — 1.1% | | | | | | | | |
Alliance Data Systems Corp. (a) | | | 2,200 | | | | 156,266 | |
Iron Mountain, Inc. | | | 7,100 | | | | 177,571 | |
Visa, Inc. Class A | | | 16,900 | | | | 1,189,422 | |
| | | | | | | | |
| | | | | | | 1,523,259 | |
| | | | | | | | |
| Computers — 1.5% | | | | | | | | |
Apple, Inc. (a) | | | 2,700 | | | | 870,912 | |
International Business Machines Corp. | | | 8,400 | | | | 1,232,784 | |
| | | | | | | | |
| | | | | | | 2,103,696 | |
| | | | | | | | |
| Cosmetics & Personal Care — 1.3% | | | | | | | | |
Avon Products, Inc. | | | 12,600 | | | | 366,156 | |
Colgate-Palmolive Co. | | | 13,600 | | | | 1,093,032 | |
The Procter & Gamble Co. | | | 5,600 | | | | 360,248 | |
| | | | | | | | |
| | | | | | | 1,819,436 | |
| | | | | | | | |
| Diversified Financial — 3.0% | | | | | | | | |
The Charles Schwab Corp. | | | 113,900 | | | | 1,948,829 | |
CME Group, Inc. | | | 600 | | | | 193,050 | |
The Goldman Sachs Group, Inc. | | | 7,600 | | | | 1,278,016 | |
JP Morgan Chase & Co. | | | 17,600 | | | | 746,592 | |
T. Rowe Price Group, Inc. | | | 3,100 | | | | 200,074 | |
| | | | | | | | |
| | | | | | | 4,366,561 | |
| | | | | | | | |
| | | | | | | | |
| | | Number of
Shares | | | Value | |
| Electric — 0.4% | | | | | | | | |
Edison International | | | 7,200 | | | $ | 277,920 | |
PG&E Corp. | | | 3,900 | | | | 186,576 | |
PPL Corp. | | | 4,200 | | | | 110,544 | |
| | | | | | | | |
| | | | | | | 575,040 | |
| | | | | | | | |
| Electrical Components & Equipment — 0.6% | |
Emerson Electric Co. | | | 14,600 | | | | 834,682 | |
| | | | | | | | |
| Electronics — 0.8% | | | | | | | | |
Jabil Circuit, Inc. | | | 26,300 | | | | 528,367 | |
Mettler-Toledo International, Inc. (a) | | | 1,300 | | | | 196,573 | |
Tyco Electronics Ltd. | | | 14,100 | | | | 499,140 | |
| | | | | | | | |
| | | | | | | 1,224,080 | |
| | | | | | | | |
| Engineering & Construction — 0.1% | | | | | | | | |
Jacobs Engineering Group, Inc. (a) | | | 3,000 | | | | 137,550 | |
| | | | | | | | |
| Entertainment — 0.3% | | | | | | | | |
DreamWorks Animation SKG, Inc. Class A (a) | | | 12,800 | | | | 377,216 | |
| | | | | | | | |
| Foods — 1.0% | | | | | | | | |
General Mills, Inc. | | | 14,000 | | | | 498,260 | |
Kraft Foods, Inc. Class A | | | 28,444 | | | | 896,270 | |
| | | | | | | | |
| | | | | | | 1,394,530 | |
| | | | | | | | |
| Hand & Machine Tools — 0.1% | | | | | | | | |
Stanley Black & Decker, Inc. | | | 2,800 | | | | 187,236 | |
| | | | | | | | |
| Health Care – Products — 1.2% | | | | | | | | |
Boston Scientific Corp. (a) | | | 134,900 | | | | 1,021,193 | |
Medtronic, Inc. | | | 20,700 | | | | 767,763 | |
| | | | | | | | |
| | | | | | | 1,788,956 | |
| | | | | | | | |
| Health Care – Services — 0.5% | | | | | | | | |
Universal Health Services, Inc. Class B | | | 15,900 | | | | 690,378 | |
| | | | | | | | |
| Insurance — 2.7% | | | | | | | | |
ACE Ltd. | | | 5,400 | | | | 336,150 | |
The Allstate Corp. | | | 78,600 | | | | 2,505,768 | |
Aon Corp. | | | 11,100 | | | | 510,711 | |
The Progressive Corp. | | | 25,600 | | | | 508,672 | |
| | | | | | | | |
| | | | | | | 3,861,301 | |
| | | | | | | | |
| Internet — 2.2% | | | | | | | | |
Akamai Technologies, Inc. (a) | | | 10,900 | | | | 512,845 | |
Google, Inc. Class A (a) | | | 4,540 | | | | 2,696,624 | |
| | | | | | | | |
| | | | | | | 3,209,469 | |
| | | | | | | | |
| Iron & Steel — 1.8% | | | | | | | | |
Allegheny Technologies, Inc. | | | 21,500 | | | | 1,186,370 | |
Cliffs Natural Resources, Inc. | | | 11,400 | | | | 889,314 | |
Nucor Corp. | | | 10,000 | | | | 438,200 | |
| | | | | | | | |
| | | | | | | 2,513,884 | |
| | | | | | | | |
| Manufacturing — 1.5% | | | | | | | | |
Danaher Corp. | | | 15,400 | | | | 726,418 | |
The accompanying notes are an integral part of the financial statements.
45
MML Asset Allocation Fund – Portfolio of Investments (Continued)
| | | | | | | | |
| | | Number of
Shares | | | Value | |
General Electric Co. | | | 26,200 | | | $ | 479,198 | |
Illinois Tool Works, Inc. | | | 17,900 | | | | 955,860 | |
| | | | | | | | |
| | | | | | | 2,161,476 | |
| | | | | | | | |
| Media — 3.9% | | | | | | | | |
CBS Corp. Class B | | | 48,600 | | | | 925,830 | |
Comcast Corp. Class A | | | 66,000 | | | | 1,450,020 | |
Gannett Co., Inc. | | | 16,000 | | | | 241,440 | |
Scripps Networks Interactive Class A | | | 15,100 | | | | 781,425 | |
Time Warner Cable, Inc. | | | 16,800 | | | | 1,109,304 | |
Time Warner, Inc. | | | 10,300 | | | | 331,351 | |
Viacom, Inc. Class B | | | 13,700 | | | | 542,657 | |
The Walt Disney Co. | | | 6,200 | | | | 232,562 | |
| | | | | | | | |
| | | | | | | 5,614,589 | |
| | | | | | | | |
| Mining — 1.2% | | | | | | | | |
Barrick Gold Corp. | | | 22,500 | | | | 1,196,550 | |
Freeport-McMoRan Copper & Gold, Inc. | | | 4,900 | | | | 588,441 | |
| | | | | | | | |
| | | | | | | 1,784,991 | |
| | | | | | | | |
| Oil & Gas — 5.4% | | | | | | | | |
Anadarko Petroleum Corp. | | | 21,400 | | | | 1,629,824 | |
Cenovus Energy, Inc. | | | 42,000 | | | | 1,396,080 | |
Chevron Corp. | | | 13,800 | | | | 1,259,250 | |
Noble Energy, Inc. | | | 15,700 | | | | 1,351,456 | |
Royal Dutch Shell PLC A Shares Sponsored ADR (United Kingdom) | | | 20,600 | | | | 1,375,668 | |
Royal Dutch Shell PLC B Shares Sponsored ADR (United Kingdom) | | | 4,600 | | | | 306,682 | |
Ultra Petroleum Corp. (a) | | | 8,300 | | | | 396,491 | |
| | | | | | | | |
| | | | | | | 7,715,451 | |
| | | | | | | | |
| Oil & Gas Services — 5.9% | | | | | | | | |
Baker Hughes, Inc. | | | 9,300 | | | | 531,681 | |
Halliburton Co. | | | 50,100 | | | | 2,045,583 | |
Schlumberger Ltd. | | | 32,000 | | | | 2,672,000 | |
Transocean Ltd. (a) | | | 10,600 | | | | 736,806 | |
Weatherford International Ltd. (a) | | | 108,300 | | | | 2,469,240 | |
| | | | | | | | |
| | | | | | | 8,455,310 | |
| | | | | | | | |
| Pharmaceuticals — 3.1% | | | | | | | | |
Allergan, Inc. | | | 19,100 | | | | 1,311,597 | |
Bristol-Myers Squibb Co. | | | 11,800 | | | | 312,464 | |
Merck & Co., Inc. | | | 45,125 | | | | 1,626,305 | |
Shire PLC Sponsored ADR (United Kingdom) | | | 17,100 | | | | 1,237,698 | |
| | | | | | | | |
| | | | | | | 4,488,064 | |
| | | | | | | | |
| Real Estate Investment Trusts (REITS) — 0.2% | |
Ventas, Inc. | | | 4,500 | | | | 236,160 | |
| | | | | | | | |
| Retail — 4.8% | | | | | | | | |
Coach, Inc. | | | 19,300 | | | | 1,067,483 | |
Lowe’s Cos., Inc. | | | 15,000 | | | | 376,200 | |
McDonald’s Corp. | | | 3,200 | | | | 245,632 | |
| | | | | | | | |
| | | Number of
Shares | | | Value | |
Target Corp. | | | 40,600 | | | $ | 2,441,278 | |
Tiffany & Co. | | | 24,900 | | | | 1,550,523 | |
Urban Outfitters, Inc. (a) | | | 32,800 | | | | 1,174,568 | |
| | | | | | | | |
| | | | | | | 6,855,684 | |
| | | | | | | | |
| Semiconductors — 2.6% | | | | | | | | |
Broadcom Corp. Class A | | | 31,000 | | | | 1,350,050 | |
KLA-Tencor Corp. | | | 22,100 | | | | 853,944 | |
Maxim Integrated Products, Inc. | | | 44,100 | | | | 1,041,642 | |
Microchip Technology, Inc. | | | 13,200 | | | | 451,572 | |
| | | | | | | | |
| | | | | | | 3,697,208 | |
| | | | | | | | |
| Software — 2.6% | | | | | | | | |
Cerner Corp. (a) | | | 18,500 | | | | 1,752,690 | |
Microsoft Corp. | | | 26,400 | | | | 737,088 | |
Oracle Corp. | | | 37,600 | | | | 1,176,880 | |
| | | | | | | | |
| | | | | | | 3,666,658 | |
| | | | | | | | |
| Telecommunications — 5.5% | | | | | | | | |
American Tower Corp. Class A (a) | | | 38,500 | | | | 1,988,140 | |
Cisco Systems, Inc. (a) | | | 77,400 | | | | 1,565,802 | |
Juniper Networks, Inc. (a) | | | 55,800 | | | | 2,060,136 | |
QUALCOMM, Inc. | | | 44,300 | | | | 2,192,407 | |
| | | | | | | | |
| | | | | | | 7,806,485 | |
| | | | | | | | |
| Toys, Games & Hobbies — 0.9% | | | | | | | | |
Nintendo Co. Ltd. Sponsored ADR (Japan) | | | 35,500 | | | | 1,289,715 | |
| | | | | | | | |
| Transportation — 2.3% | | | | | | | | |
FedEx Corp. | | | 21,200 | | | | 1,971,812 | |
Norfolk Southern Corp. | | | 21,200 | | | | 1,331,784 | |
| | | | | | | | |
| | | | | | | 3,303,596 | |
| | | | | | | | |
| Water — 0.2% | | | | | | | | |
American Water Works Co., Inc. | | | 13,000 | | | | 328,770 | |
| | | | | | | | |
| | |
TOTAL COMMON STOCK
(Cost $75,173,464) | | | | | | | 94,522,863 | |
| | | | | | | | |
| | |
TOTAL EQUITIES
(Cost $75,173,464) | | | | | | | 94,522,863 | |
| | | | | | | | |
| | |
| | | Principal
Amount | | | | |
| BONDS & NOTES — 29.1% | | | | | | | | |
| | |
| CORPORATE DEBT — 10.3% | | | | | | | | |
| Aerospace & Defense — 0.5% | | | | | | | | |
Lockheed Martin Corp. (b)
5.720% 6/01/40 | | $ | 378,000 | | | | 394,558 | |
Raytheon Co.
6.400% 12/15/18 | | | 60,000 | | | | 70,184 | |
TransDigm, Inc. (b)
7.750% 12/15/18 | | | 200,000 | | | | 207,000 | |
| | | | | | | | |
| | | | | | | 671,742 | |
| | | | | | | | |
The accompanying notes are an integral part of the financial statements.
46
MML Asset Allocation Fund – Portfolio of Investments (Continued)
| | | | | | | | |
| | | Principal
Amount | | | Value | |
| Auto Manufacturers — 0.2% | | | | | | | | |
Volvo Treasury AB (b)
5.950% 4/01/15 | | $ | 230,000 | | | $ | 249,824 | |
| | | | | | | | |
| Banks — 0.9% | | | | | | | | |
Bank of America Corp.
6.500% 8/01/16 | | | 550,000 | | | | 596,801 | |
CoBank ACB FRN (b)
0.902% 6/15/22 | | | 295,000 | | | | 233,172 | |
HBOS PLC (b)
6.750% 5/21/18 | | | 100,000 | | | | 93,634 | |
Societe Generale (b)
5.750% 4/20/16 | | | 100,000 | | | | 105,912 | |
US AgBank FCB VRN (b)
6.110% 12/31/49 | | | 345,000 | | | | 229,056 | |
| | | | | | | | |
| | | | | | | 1,258,575 | |
| | | | | | | | |
| Biotechnology — 0.0% | | | | | | | | |
Biogen Idec, Inc.
6.000% 3/01/13 | | | 35,000 | | | | 37,804 | |
| | | | | | | | |
| Chemicals — 0.3% | | | | | | | | |
Georgia Gulf Corp. (b)
9.000% 1/15/17 | | | 200,000 | | | | 217,000 | |
Lyondell Chemical Co. (b)
8.000% 11/01/17 | | | 157,000 | | | | 173,681 | |
| | | | | | | | |
| | | | | | | 390,681 | |
| | | | | | | | |
| Commercial Services — 0.2% | | | | | | | | |
Altegrity, Inc. (Acquired 11/20/08,
Cost $74,054) (b) (c)
10.500% 11/01/15 | | | 100,000 | | | | 102,625 | |
Dartmouth College
4.750% 6/01/19 | | | 175,000 | | | | 188,821 | |
| | | | | | | | |
| | | | | | | 291,446 | |
| | | | | | | | |
| Diversified Financial — 3.2% | | | | | | | | |
Citigroup, Inc.
6.125% 11/21/17 | | | 475,000 | | | | 520,546 | |
Federal Home Loan Mortgage Corp. 1.500% 1/07/11 | | | 1,710,000 | | | | 1,710,378 | |
Federal National Mortgage Association 2.750% 3/13/14 | | | 2,075,000 | | | | 2,168,797 | |
Ford Motor Credit Co. LLC
8.000% 12/15/16 | | | 200,000 | | | | 223,492 | |
| | | | | | | | |
| | | | | | | 4,623,213 | |
| | | | | | | | |
| Electric — 0.9% | | | | | | | | |
The AES Corp.
7.750% 10/15/15 | | | 100,000 | | | | 106,750 | |
The Cleveland Electric Illuminating Co. 8.875% 11/15/18 | | | 110,000 | | | | 139,858 | |
Consumers Energy Co.
6.700% 9/15/19 | | | 250,000 | | | | 298,066 | |
Consumers Energy Co. Series M
5.500% 8/15/16 | | | 65,000 | | | | 73,043 | |
| | | | | | | | |
| | | Principal
Amount | | | Value | |
Edison Mission Energy
7.750% 6/15/16 | | $ | 175,000 | | | $ | 150,500 | |
Northern States Power Co.
4.850% 8/15/40 | | | 450,000 | | | | 428,202 | |
Ohio Edison Co.
6.400% 7/15/16 | | | 25,000 | | | | 28,506 | |
PacifiCorp
6.000% 1/15/39 | | | 30,000 | | | | 33,089 | |
| | | | | | | | |
| | | | | | | 1,258,014 | |
| | | | | | | | |
| Entertainment — 0.1% | | | | | | | | |
AMC Entertainment, Inc.
8.750% 6/01/19 | | | 175,000 | | | | 186,812 | |
| | | | | | | | |
| Foods — 0.2% | | | | | | | | |
Kraft Foods, Inc.
5.375% 2/10/20 | | | 250,000 | | | | 269,067 | |
| | | | | | | | |
| Health Care – Services — 0.2% | | | | | | | | |
HCA, Inc.
6.375% 1/15/15 | | | 100,000 | | | | 98,250 | |
HCA, Inc.
9.250% 11/15/16 | | | 150,000 | | | | 160,031 | |
| | | | | | | | |
| | | | | | | 258,281 | |
| | | | | | | | |
| Insurance — 0.3% | | | | | | | | |
Berkshire Hathaway Finance Corp.
4.600% 5/15/13 | | | 120,000 | | | | 129,077 | |
Liberty Mutual Group, Inc. (b)
7.500% 8/15/36 | | | 195,000 | | | | 193,879 | |
Monumental Global Funding III FRN (b)
0.489% 1/15/14 | | | 170,000 | | | | 163,267 | |
| | | | | | | | |
| | | | | | | 486,223 | |
| | | | | | | | |
| Machinery – Construction & Mining — 0.0% | |
Atlas Copco AB (b)
5.600% 5/22/17 | | | 50,000 | | | | 53,871 | |
| | | | | | | | |
| Media — 0.6% | | | | | | | | |
CCO Holdings LLC/CCO Holdings Capital Corp.
7.250% 10/30/17 | | | 150,000 | | | | 152,250 | |
Comcast Corp.
6.400% 3/01/40 | | | 500,000 | | | | 535,932 | |
News America, Inc.
6.650% 11/15/37 | | | 50,000 | | | | 55,380 | |
Time Warner, Inc.
5.875% 11/15/16 | | | 70,000 | | | | 79,010 | |
| | | | | | | | |
| | | | | | | 822,572 | |
| | | | | | | | |
| Oil & Gas — 0.3% | | | | | | | | |
Statoil ASA
2.900% 10/15/14 | | | 365,000 | | | | 377,415 | |
| | | | | | | | |
| Pharmaceuticals — 0.1% | | | | | | | | |
AstraZeneca PLC
5.400% 9/15/12 | | | 50,000 | | | | 53,917 | |
The accompanying notes are an integral part of the financial statements.
47
MML Asset Allocation Fund – Portfolio of Investments (Continued)
| | | | | | | | |
| | | Principal
Amount | | | Value | |
Express Scripts, Inc.
7.250% 6/15/19 | | $ | 95,000 | | | $ | 112,444 | |
| | | | | | | | |
| | | | | | | 166,361 | |
| | | | | | | | |
| Pipelines — 0.3% | | | | | | | | |
Kinder Morgan Energy Partners LP
5.125% 11/15/14 | | | 65,000 | | | | 70,523 | |
Kinder Morgan Energy Partners LP
5.950% 2/15/18 | | | 250,000 | | | | 275,328 | |
Rockies Express Pipeline LLC (b)
6.850% 7/15/18 | | | 70,000 | | | | 74,645 | |
TransCanada PipeLines Ltd.
6.200% 10/15/37 | | | 75,000 | | | | 82,294 | |
| | | | | | | | |
| | | | | | | 502,790 | |
| | | | | | | | |
| Real Estate Investment Trusts (REITS) — 0.3% | | | | | |
ProLogis
7.375% 10/30/19 | | | 375,000 | | | | 409,605 | |
| | | | | | | | |
| Retail — 0.4% | | | | | | | | |
CVS Pass-Through Trust (b)
5.789% 1/10/26 | | | 8,031 | | | | 8,120 | |
Michaels Stores, Inc. (b)
7.750% 11/01/18 | | | 150,000 | | | | 149,625 | |
New Albertsons, Inc.
7.250% 5/01/13 | | | 275,000 | | | | 275,687 | |
Wal-Mart Stores, Inc.
4.875% 7/08/40 | | | 225,000 | | | | 214,355 | |
| | | | | | | | |
| | | | | | | 647,787 | |
| | | | | | | | |
| Savings & Loans — 0.3% | | | | | | | | |
Teco Finance, Inc.
5.150% 3/15/20 | | | 425,000 | | | | 440,626 | |
| | | | | | | | |
| Software — 0.5% | | | | | | | | |
First Data Corp. (b)
8.250% 1/15/21 | | | 94,000 | | | | 90,240 | |
First Data Corp. (b)
8.750% 1/15/22 | | | 94,000 | | | | 90,579 | |
First Data Corp.
9.875% 9/24/15 | | | 22,000 | | | | 20,845 | |
First Data Corp. (b)
12.625% 1/15/21 | | | 189,000 | | | | 180,495 | |
Oracle Corp.
6.125% 7/08/39 | | | 250,000 | | | | 280,552 | |
| | | | | | | | |
| | | | | | | 662,711 | |
| | | | | | | | |
| Telecommunications — 0.3% | | | | | | | | |
Nextel Communications, Inc. Series D
7.375% 8/01/15 | | | 175,000 | | | | 175,219 | |
Telecom Italia Capital SA
5.250% 10/01/15 | | | 50,000 | | | | 51,193 | |
Telecom Italia Capital SA
7.721% 6/04/38 | | | 25,000 | | | | 24,772 | |
Windstream Corp.
7.000% 3/15/19 | | | 200,000 | | | | 197,000 | |
| | | | | | | | |
| | | | | | | 448,184 | |
| | | | | | | | |
| | | | | | | | |
| | | Principal
Amount | | | Value | |
| Transportation — 0.2% | | | | | | | | |
Norfolk Southern Corp.
5.750% 4/01/18 | | $ | 50,000 | | | $ | 56,461 | |
Norfolk Southern Corp.
7.050% 5/01/37 | | | 30,000 | | | | 35,851 | |
Union Pacific Corp.
5.700% 8/15/18 | | | 105,000 | | | | 117,860 | |
Union Pacific Corp.
5.750% 11/15/17 | | | 15,000 | | | | 16,842 | |
| | | | | | | | |
| | | | | | | 227,014 | |
| | | | | | | | |
| Water — 0.0% | | | | | | | | |
Veolia Environnement
5.250% 6/03/13 | | | 50,000 | | | | 54,014 | |
| | | | | | | | |
| | |
TOTAL CORPORATE DEBT
(Cost $14,274,077) | | | | | | | 14,794,632 | |
| | | | | | | | |
| |
| MUNICIPAL OBLIGATIONS — 0.4% | | | | | |
State of California
7.625% 3/01/40 | | | 500,000 | | | | 521,705 | |
| | | | | | | | |
| | |
TOTAL MUNICIPAL OBLIGATIONS
(Cost $518,480) | | | | | | | 521,705 | |
| | | | | | | | |
|
NON-U.S. GOVERNMENT
AGENCY OBLIGATIONS — 1.1% | |
| Commercial MBS — 1.0% | | | | | | | | |
Greenwich Capital Commercial Funding Corp., Series 2005-GG5, Class A5 VRN
5.224% 4/10/37 | | | 800,000 | | | | 845,613 | |
LB-UBS Commercial Mortgage Trust, Series 2005-C7, Class A4 VRN
5.197% 11/15/30 | | | 550,000 | | | | 593,297 | |
| | | | | | | | |
| | | | | | | 1,438,910 | |
| | | | | | | | |
| Credit Card ABS — 0.1% | | | | | | | | |
Washington Mutual Master Note Trust, Series 2006-A2A, Class A FRN (b)
0.310% 6/15/15 | | | 100,000 | | | | 99,751 | |
| | | | | | | | |
| | |
TOTAL NON-U.S. GOVERNMENT AGENCY OBLIGATIONS
(Cost $1,398,383) | | | | | | | 1,538,661 | |
| | | | | | | | |
| |
| SOVEREIGN DEBT OBLIGATIONS — 1.5% | | | | | |
Brazilian Government International Bond BRL (d)
12.500% 1/05/16 | | | 400,000 | | | | 279,036 | |
Croatia Government International Bond (e)
6.750% 11/05/19 | | | 100,000 | | | | 104,655 | |
The accompanying notes are an integral part of the financial statements.
48
MML Asset Allocation Fund – Portfolio of Investments (Continued)
| | | | | | | | |
| | | Principal
Amount | | | Value | |
Indonesia Government Bond IDR (d)
9.500% 6/15/15 | | | 950,000,000 | | | $ | 115,996 | |
Indonesia Government Bond IDR (d)
10.750% 5/15/16 | | | 85,000,000 | | | | 10,977 | |
Indonesia Government Bond IDR (d)
11.000% 10/15/14 | | | 75,000,000 | | | | 9,505 | |
Indonesia Government Bond IDR (d)
12.500% 3/15/13 | | | 80,000,000 | | | | 10,037 | |
Indonesia Government Bond IDR (d)
12.800% 6/15/21 | | | 95,000,000 | | | | 14,151 | |
Mexican Bonos MXN (d)
7.750% 12/14/17 | | | 1,400,000 | | | | 120,553 | |
Republic of Argentina VRN
0.000% 12/15/35 | | $ | 155,000 | | | | 23,483 | |
Republic of Argentina
8.280% 12/31/33 | | | 97,571 | | | | 90,498 | |
Republic of Colombia COP (d)
9.850% 6/28/27 | | | 52,000,000 | | | | 38,255 | |
Republic of Colombia COP (d)
12.000% 10/22/15 | | | 155,000,000 | | | | 107,547 | |
Republic of Hungary International Bond
6.250% 1/29/20 | | | 250,000 | | | | 241,889 | |
Republic of Iraq (e)
5.800% 1/15/28 | | | 250,000 | | | | 227,500 | |
Republic of Poland International Bond
3.875% 7/16/15 | | | 250,000 | | | | 254,093 | |
Republic of Venezuela
9.250% 9/15/27 | | | 75,000 | | | | 55,875 | |
Republic of Venezuela
9.375% 1/13/34 | | | 80,000 | | | | 54,200 | |
South Africa Government Bond ZAR (d)
8.250% 9/15/17 | | | 250,000 | | | | 38,543 | |
Thailand Government Bond THB (d)
3.625% 5/22/15 | | | 1,325,000 | | | | 44,670 | |
Thailand Government Bond THB (d)
5.250% 5/12/14 | | | 775,000 | | | | 27,439 | |
Turkey Government Bond TRY (d)
10.000% 2/15/12 | | | 169,496 | | | | 120,914 | |
Turkey Government International Bond
6.750% 5/30/40 | | | 100,000 | | | | 109,000 | |
United Mexican States MXN (d)
10.000% 12/05/24 | | | 300,000 | | | | 30,300 | |
| | | | | | | | |
| | |
TOTAL SOVEREIGN
DEBT OBLIGATIONS
(Cost $2,010,193) | | | | | | | 2,129,116 | |
| | | | | | | | |
| | | | | | | | |
| | | Principal
Amount | | | Value | |
| |
| U.S. GOVERNMENT AGENCY OBLIGATIONS AND INSTRUMENTALITIES — 10.5% | | | | | |
| Collateralized Mortgage Obligations — 0.4% | | | | | |
Federal Home Loan Mortgage Corp., Series 3233, Class PA
6.000% 10/15/36 | | $ | 76,704 | | | $ | 83,198 | |
Federal Home Loan Mortgage Corp., Series 3312, Class PA
5.500% 5/15/37 | | | 88,298 | | | | 93,904 | |
Federal National Mortgage Association, Series 2007-33, Class HE
5.500% 4/25/37 | | | 114,969 | | | | 122,971 | |
Federal National Mortgage Association, Series 2007-40, Class PT
5.500% 5/25/37 | | | 242,245 | | | | 257,439 | |
| | | | | | | | |
| | | | | | | 557,512 | |
| | | | | | | | |
| Pass-Through Securities — 10.1% | | | | | | | | |
Federal Home Loan Mortgage Corp.
Pool #A74199 5.000%
2/01/38 | | | 635,795 | | | | 666,517 | |
Pool #G03865 5.500%
12/01/37 | | | 353,432 | | | | 376,502 | |
Pool #G04553 6.500%
9/01/38 | | | 21,494 | | | | 23,784 | |
Federal National Mortgage Association
Pool #931195 4.500%
5/01/24 | | | 837,021 | | | | 877,139 | |
Pool #AB1068 4.500%
5/01/25 | | | 732,381 | | | | 767,484 | |
Pool #930871 5.000%
4/01/39 | | | 788,895 | | | | 829,079 | |
Pool #891908 5.500%
6/01/21 | | | 343,375 | | | | 370,657 | |
Pool #888352 5.500%
5/01/37 | | | 850,900 | | | | 914,552 | |
Pool #929318 5.500%
3/01/38 | | | 71,887 | | | | 76,860 | |
Pool #962553 5.500%
4/01/38 | | | 93,556 | | | | 100,029 | |
Pool #891436 6.000%
3/01/36 | | | 1,433,297 | | | | 1,561,062 | |
Pool #888408 6.000%
3/01/37 | | | 43,317 | | | | 46,501 | |
Pool #888637 6.000%
9/01/37 | | | 230,681 | | | | 250,559 | |
Pool #940664 6.000%
9/01/37 | | | 1,027,585 | | | | 1,115,653 | |
Pool #944066 6.500%
7/01/37 | | | 96,657 | | | | 106,066 | |
Pool #256860 6.500%
8/01/37 | | | 13,867 | | | | 15,217 | |
The accompanying notes are an integral part of the financial statements.
49
MML Asset Allocation Fund – Portfolio of Investments (Continued)
| | | | | | | | |
| | | Principal
Amount | | | Value | |
Pool #995230 6.500%
1/01/39 | | $ | 25,580 | | | $ | 28,390 | |
Pool #995231 6.500%
1/01/39 | | | 742,350 | | | | 823,893 | |
Pool #888373 7.000%
3/01/37 | | | 101,078 | | | | 111,202 | |
Pool #955210 7.000%
12/01/37 | | | 31,827 | | | | 35,015 | |
Pool #256975 7.000%
10/01/47 | | | 28,875 | | | | 31,767 | |
Government National Mortgage Association Pool #713469 4.500%
6/15/39 | | | 1,270,507 | | | | 1,320,880 | |
Pool #720160 4.500%
7/15/39 | | | 1,344,207 | | | | 1,397,503 | |
Pool #739377 4.500%
5/15/40 | | | 1,090,413 | | | | 1,133,647 | |
Pool #733737 4.500%
6/15/40 | | | 1,427,187 | | | | 1,483,772 | |
| | | | | | | | |
| | | | | | | 14,463,730 | |
| | | | | | | | |
| | |
TOTAL U.S. GOVERNMENT AGENCY OBLIGATIONS AND INSTRUMENTALITIES
(Cost $14,477,891) | | | | | | | 15,021,242 | |
| | | | | | | | |
|
| U.S. TREASURY OBLIGATIONS — 5.3% | |
| U.S. Treasury Bonds & Notes — 5.3% | | | | | |
U.S. Treasury Bond
4.625% 2/15/40 | | | 2,300,000 | | | | 2,410,223 | |
U.S. Treasury Note
0.875% 3/31/11 | | | 1,450,000 | | | | 1,452,464 | |
U.S. Treasury Note
2.750% 2/15/19 | | | 2,245,000 | | | | 2,216,499 | |
U.S. Treasury Note
3.125% 5/15/19 | | | 1,425,000 | | | | 1,440,308 | |
| | | | | | | | |
| | | | | | | 7,519,494 | |
| | | | | | | | |
| | |
TOTAL U.S. TREASURY OBLIGATIONS
(Cost $7,594,706) | | | | | | | 7,519,494 | |
| | | | | | | | |
| | |
TOTAL BONDS & NOTES
(Cost $40,273,730) | | | | | | | 41,524,850 | |
| | | | | | | | |
| | |
TOTAL LONG-TERM INVESTMENTS
(Cost $115,447,194) | | | | | | | 136,047,713 | |
| | | | | | | | |
|
| SHORT-TERM INVESTMENTS — 4.6% | |
| Repurchase Agreement — 4.6% | | | | | | | | |
State Street Bank & Trust Co. Repurchase Agreement, dated 12/31/10, 0.010%, due 1/03/11 (f) | | | 6,536,780 | | | | 6,536,780 | |
| | | | | | | | |
| | | | | | | | |
| | | Principal
Amount | | | Value | |
| Time Deposits — 0.0% | | | | | | | | |
Euro Time Deposit
0.010% 1/03/11 | | $ | 8,067 | | | $ | 8,067 | |
| | | | | | | | |
| | |
TOTAL SHORT-TERM INVESTMENTS
(Cost $6,544,847) | | | | | | | 6,544,847 | |
| | | | | | | | |
| | |
| TOTAL INVESTMENTS — 99.8% (Cost $121,992,041) (g) | | | | | | | 142,592,560 | |
| | |
| Other Assets/(Liabilities) — 0.2% | | | | | | | 350,997 | |
| | | | | | | | |
| | |
| NET ASSETS — 100.0% | | | | | | $ | 142,943,557 | |
| | | | | | | | |
Notes to Portfolio of Investments
| ADR | American Depositary Receipt |
| MBS | Mortgage-Backed Security |
| (a) | Non-income producing security. |
| (b) | Securities exempt from registration under rule 144A of the Securities Act of 1933. These securities may be resold in transactions exempt from registration, normally to qualified institutional buyers. At December 31, 2010, these securities amounted to a value of $3,110,934 or 2.18% of net assets. |
| (c) | Restricted security. Certain securities are restricted as to resale. At December 31, 2010, these securities amounted to a value of $102,625 or 0.07% of net assets. The Fund generally bears the costs, if any, associated with the disposition of restricted securities. |
| (d) | The principal amount of the security is in foreign currency. The market value is in U.S. dollars. |
| (e) | Security exempt from registration under Regulation S of the Securities Act of 1933, which exempts from registration securities offered and sold outside the United States. Security may not be offered or sold in the United States except pursuant to an exemption from, or in a transaction not subject to, the registration requirements of the Securities Act of 1933. At December 31, 2010, these securities amounted to a value of $332,155 or 0.23% of net assets. |
| (f) | Maturity value of $6,536,786. Collateralized by U.S. Government Agency obligations with a rate of 4.000%, maturity date of 5/15/39, and an aggregate market value, including accrued interest, of $6,668,827. |
| (g) | See Note 6 for aggregate cost for federal tax purposes. |
The accompanying notes are an integral part of the financial statements.
50
MML Concentrated Growth Fund – Portfolio of Investments
December 31, 2010
| | | | | | | | |
| | | Number of
Shares | | | Value | |
| EQUITIES — 99.8% | | | | | | | | |
| | |
| COMMON STOCK — 99.8% | | | | | | | | |
| Aerospace & Defense — 8.5% | | | | | | | | |
Goodrich Corp. | | | 39,900 | | | $ | 3,513,993 | |
United Technologies Corp. | | | 64,000 | | | | 5,038,080 | |
| | | | | | | | |
| | | | | | | 8,552,073 | |
| | | | | | | | |
| Apparel — 1.8% | | | | | | | | |
Nike, Inc. Class B | | | 21,400 | | | | 1,827,988 | |
| | | | | | | | |
| Banks — 4.4% | | | | | | | | |
Wells Fargo & Co. | | | 142,600 | | | | 4,419,174 | |
| | | | | | | | |
| Beverages — 5.6% | | | | | | | | |
Diageo PLC Sponsored ADR
(United Kingdom) | | | 36,700 | | | | 2,727,911 | |
PepsiCo, Inc. | | | 44,100 | | | | 2,881,053 | |
| | | | | | | | |
| | | | | | | 5,608,964 | |
| | | | | | | | |
| Chemicals — 3.2% | | | | | | | | |
Monsanto Co. | | | 45,600 | | | | 3,175,584 | |
| | | | | | | | |
| Commercial Services — 2.2% | | | | | | | | |
Quanta Services, Inc. (a) | | | 111,800 | | | | 2,227,056 | |
| | | | | | | | |
| Computers — 8.0% | | | | | | | | |
Apple, Inc. (a) | | | 9,600 | | | | 3,096,576 | |
EMC Corp. (a) | | | 217,400 | | | | 4,978,460 | |
| | | | | | | | |
| | | | | | | 8,075,036 | |
| | | | | | | | |
| Cosmetics & Personal Care — 3.2% | | | | | | | | |
The Procter & Gamble Co. | | | 49,400 | | | | 3,177,902 | |
| | | | | | | | |
| Diversified Financial — 4.7% | | | | | | | | |
American Express Co. | | | 109,800 | | | | 4,712,616 | |
| | | | | | | | |
| Environmental Controls — 2.5% | | | | | | | | |
Nalco Holding Co. | | | 78,000 | | | | 2,491,320 | |
| | | | | | | | |
| Health Care – Products — 8.3% | | | | | | | | |
Johnson & Johnson | | | 52,100 | | | | 3,222,385 | |
Medtronic, Inc. | | | 139,000 | | | | 5,155,510 | |
| | | | | | | | |
| | | | | | | 8,377,895 | |
| | | | | | | | |
| Internet — 4.3% | | | | | | | | |
Amazon.com, Inc. (a) | | | 16,550 | | | | 2,979,000 | |
Rackspace Hosting, Inc. (a) | | | 41,900 | | | | 1,316,079 | |
| | | | | | | | |
| | | | | | | 4,295,079 | |
| | | | | | | | |
| Manufacturing — 4.8% | | | | | | | | |
3M Co. | | | 56,100 | | | | 4,841,430 | |
| | | | | | | | |
| Oil & Gas Services — 2.1% | | | | | | | | |
Halliburton Co. | | | 39,900 | | | | 1,629,117 | |
Transocean Ltd. (a) | | | 7,600 | | | | 528,276 | |
| | | | | | | | |
| | | | | | | 2,157,393 | |
| | | | | | | | |
| Pharmaceuticals — 4.5% | | | | | | | | |
Abbott Laboratories | | | 94,300 | | | | 4,517,913 | |
| | | | | | | | |
| | | | | | | | |
| | | Number of
Shares | | | Value | |
| Retail — 2.9% | | | | | | | | |
Lowe’s Cos., Inc. | | | 114,100 | | | $ | 2,861,628 | |
| | | | | | | | |
| Semiconductors — 4.8% | | | | | | | | |
Texas Instruments, Inc. | | | 148,300 | | | | 4,819,750 | |
| | | | | | | | |
| Software — 13.7% | | | | | | | | |
Adobe Systems, Inc. (a) | | | 88,900 | | | | 2,736,342 | |
Autodesk, Inc. (a) | | | 51,400 | | | | 1,963,480 | |
Microsoft Corp. | | | 185,400 | | | | 5,176,368 | |
Nuance Communications, Inc. (a) | | | 141,900 | | | | 2,579,742 | |
Red Hat, Inc. (a) | | | 28,500 | | | | 1,301,025 | |
| | | | | | | | |
| | | | | | | 13,756,957 | |
| | | | | | | | |
| Telecommunications — 10.3% | | | | | | | | |
Cisco Systems, Inc. (a) | | | 259,100 | | | | 5,241,593 | |
QUALCOMM, Inc. | | | 102,700 | | | | 5,082,623 | |
| | | | | | | | |
| | | | | | | 10,324,216 | |
| | | | | | | | |
| | |
TOTAL COMMON STOCK
(Cost $81,341,310) | | | | | | | 100,219,974 | |
| | | | | | | | |
| | |
TOTAL EQUITIES
(Cost $81,341,310) | | | | | | | 100,219,974 | |
| | | | | | | | |
| | |
TOTAL LONG-TERM INVESTMENTS
(Cost $81,341,310) | | | | | | | 100,219,974 | |
| | | | | | | | |
| | |
| | | Principal
Amount | | | | |
| |
| SHORT-TERM INVESTMENTS — 0.4% | | | | | |
| Repurchase Agreement — 0.4% | | | | | | | | |
State Street Bank & Trust Co. Repurchase Agreement, dated 12/31/10, 0.010%, due 1/03/11 (b) | | $ | 381,690 | | | | 381,690 | |
| | | | | | | | |
| | |
TOTAL SHORT-TERM INVESTMENTS
(Cost $381,690) | | | | | | | 381,690 | |
| | | | | | | | |
| | |
TOTAL INVESTMENTS — 100.2%
(Cost $81,723,000) (c) | | | | | | | 100,601,664 | |
| | |
| Other Assets/(Liabilities) — (0.2)% | | | | | | | (184,508 | ) |
| | | | | | | | |
| | |
| NET ASSETS — 100.0% | | | | | | $ | 100,417,156 | |
| | | | | | | | |
Notes to Portfolio of Investments
| ADR | American Depositary Receipt |
| (a) | Non-income producing security. |
| (b) | Maturity value of $381,690. Collateralized by U.S. Government Agency obligations with a rate of 4.000%, maturity date of 5/15/39, and an aggregate market value, including accrued interest, of $392,025. |
| (c) | See Note 6 for aggregate cost for federal tax purposes. |
The accompanying notes are an integral part of the financial statements.
51
MML Equity Income Fund – Portfolio of Investments
December 31, 2010
| | | | | | | | |
| | | Number of
Shares | | | Value | |
| EQUITIES — 97.3% | | | | | | | | |
| | |
| COMMON STOCK — 96.7% | | | | | | | | |
| Aerospace & Defense — 1.3% | | | | | | | | |
The Boeing Co. | | | 71,500 | | | $ | 4,666,090 | |
Lockheed Martin Corp. | | | 42,800 | | | | 2,992,148 | |
| | | | | | | | |
| | | | | | | 7,658,238 | |
| | | | | | | | |
| Agriculture — 0.3% | | | | | | | | |
Archer-Daniels-Midland Co. | | | 51,000 | | | | 1,534,080 | |
| | | | | | | | |
| Auto Manufacturers — 0.4% | | | | | | | | |
General Motors Co. (a) | | | 54,400 | | | | 2,005,184 | |
| | | | | | | | |
| Banks — 8.4% | | | | | | | | |
Bank of America Corp. | | | 711,977 | | | | 9,497,773 | |
Bank of New York Mellon Corp. | | | 179,000 | | | | 5,405,800 | |
Capital One Financial Corp. | | | 81,500 | | | | 3,468,640 | |
KeyCorp | | | 277,200 | | | | 2,453,220 | |
Marshall & Ilsley Corp. | | | 170,000 | | | | 1,176,400 | |
Regions Financial Corp. | | | 305,900 | | | | 2,141,300 | |
SunTrust Banks, Inc. | | | 149,200 | | | | 4,402,892 | |
U.S. Bancorp | | | 335,900 | | | | 9,059,223 | |
Wells Fargo & Co. | | | 351,400 | | | | 10,889,886 | |
| | | | | | | | |
| | | | | | | 48,495,134 | |
| | | | | | | | |
| Biotechnology — 0.5% | | | | | | | | |
Amgen, Inc. (a) | | | 50,500 | | | | 2,772,450 | |
| | | | | | | | |
| Building Materials — 0.7% | | | | | | | | |
Masco Corp. | | | 235,500 | | | | 2,981,430 | |
USG Corp. (a) | | | 77,000 | | | | 1,295,910 | |
| | | | | | | | |
| | | | | | | 4,277,340 | |
| | | | | | | | |
| Chemicals — 3.0% | | | | | | | | |
E.I. du Pont de Nemours & Co. | | | 110,000 | | | | 5,486,800 | |
International Flavors & Fragrances, Inc. | | | 88,800 | | | | 4,936,392 | |
Monsanto Co. | | | 98,100 | | | | 6,831,684 | |
| | | | | | | | |
| | | | | | | 17,254,876 | |
| | | | | | | | |
| Commercial Services — 0.2% | | | | | | | | |
H&R Block, Inc. | | | 89,400 | | | | 1,064,754 | |
| | | | | | | | |
| Computers — 2.0% | | | | | | | | |
Computer Sciences Corp. | | | 88,900 | | | | 4,409,440 | |
Dell, Inc. (a) | | | 177,400 | | | | 2,403,770 | |
Hewlett-Packard Co. | | | 109,400 | | | | 4,605,740 | |
| | | | | | | | |
| | | | | | | 11,418,950 | |
| | | | | | | | |
| Distribution & Wholesale — 0.5% | | | | | | | | |
Genuine Parts Co. | | | 57,400 | | | | 2,946,916 | |
| | | | | | | | |
| Diversified Financial — 7.2% | | | | | | | | |
American Express Co. | | | 263,500 | | | | 11,309,420 | |
JP Morgan Chase & Co. | | | 391,500 | | | | 16,607,430 | |
Legg Mason, Inc. | | | 153,400 | | | | 5,563,818 | |
Morgan Stanley | | | 53,600 | | | | 1,458,456 | |
| | | | | | | | |
| | | Number of
Shares | | | Value | |
NYSE Euronext | | | 99,900 | | | $ | 2,995,002 | |
SLM Corp. (a) | | | 275,300 | | | | 3,466,027 | |
| | | | | | | | |
| | | | | | | 41,400,153 | |
| | | | | | | | |
| Electric — 7.3% | | | | | | | | |
CenterPoint Energy, Inc. | | | 95,800 | | | | 1,505,976 | |
Constellation Energy Group, Inc. | | | 90,700 | | | | 2,778,141 | |
Duke Energy Corp. | | | 202,800 | | | | 3,611,868 | |
Entergy Corp. | | | 84,600 | | | | 5,992,218 | |
Exelon Corp. | | | 145,400 | | | | 6,054,456 | |
FirstEnergy Corp. | | | 65,200 | | | | 2,413,704 | |
NRG Energy, Inc. (a) | | | 57,100 | | | | 1,115,734 | |
PG&E Corp. | | | 68,500 | | | | 3,277,040 | |
Pinnacle West Capital Corp. | | | 71,700 | | | | 2,971,965 | |
PPL Corp. | | | 107,800 | | | | 2,837,296 | |
Progress Energy, Inc. | | | 93,300 | | | | 4,056,684 | |
TECO Energy, Inc. | | | 71,600 | | | | 1,274,480 | |
Xcel Energy, Inc. | | | 172,100 | | | | 4,052,955 | |
| | | | | | | | |
| | | | | | | 41,942,517 | |
| | | | | | | | |
| Electrical Components & Equipment — 0.4% | | | | | |
Emerson Electric Co. | | | 44,300 | | | | 2,532,631 | |
| | | | | | | | |
| Entertainment — 0.2% | | | | | | | | |
Madison Square Garden, Inc. Class A (a) | | | 36,025 | | | | 928,725 | |
| | | | | | | | |
| Foods — 2.5% | | | | | | | | |
Campbell Soup Co. | | | 66,100 | | | | 2,296,975 | |
ConAgra Foods, Inc. | | | 84,900 | | | | 1,917,042 | |
The Hershey Co. | | | 167,600 | | | | 7,902,340 | |
McCormick & Co., Inc. | | | 53,300 | | | | 2,480,049 | |
| | | | | | | | |
| | | | | | | 14,596,406 | |
| | | | | | | | |
| Forest Products & Paper — 2.0% | | | | | | | | |
International Paper Co. | | | 250,500 | | | | 6,823,620 | |
MeadWestvaco Corp. | | | 116,800 | | | | 3,055,488 | |
Weyerhaeuser Co. | | | 99,842 | | | | 1,890,009 | |
| | | | | | | | |
| | | | | | | 11,769,117 | |
| | | | | | | | |
| Gas — 0.9% | | | | | | | | |
NiSource, Inc. | | | 294,900 | | | | 5,196,138 | |
| | | | | | | | |
| Health Care – Products — 1.5% | | | | | | | | |
Beckman Coulter, Inc. | | | 34,100 | | | | 2,565,343 | |
Johnson & Johnson | | | 97,600 | | | | 6,036,560 | |
| | | | | | | | |
| | | | | | | 8,601,903 | |
| | | | | | | | |
| Home Builders — 0.1% | | | | | | | | |
D.R. Horton, Inc. | | | 71,500 | | | | 852,995 | |
| | | | | | | | |
| Home Furnishing — 1.1% | | | | | | | | |
Whirlpool Corp. | | | 72,200 | | | | 6,413,526 | |
| | | | | | | | |
| Household Products — 3.1% | | | | | | | | |
Avery Dennison Corp. | | | 90,300 | | | | 3,823,302 | |
The Clorox Co. | | | 7,100 | | | | 449,288 | |
Fortune Brands, Inc. | | | 137,900 | | | | 8,308,475 | |
The accompanying notes are an integral part of the financial statements.
52
MML Equity Income Fund – Portfolio of Investments (Continued)
| | | | | | | | |
| | | Number of
Shares | | | Value | |
Kimberly-Clark Corp. | | | 85,000 | | | $ | 5,358,400 | |
| | | | | | | | |
| | | | | | | 17,939,465 | |
| | | | | | | | |
| Insurance — 3.5% | | | | | | | | |
The Allstate Corp. | | | 136,300 | | | | 4,345,244 | |
The Chubb Corp. | | | 41,600 | | | | 2,481,024 | |
Lincoln National Corp. | | | 146,300 | | | | 4,068,603 | |
Marsh & McLennan Cos., Inc. | | | 219,700 | | | | 6,006,598 | |
Sun Life Financial, Inc. | | | 116,400 | | | | 3,503,640 | |
| | | | | | | | |
| | | | | | | 20,405,109 | |
| | | | | | | | |
| Internet — 0.5% | | | | | | | | |
eBay, Inc. (a) | | | 111,100 | | | | 3,091,913 | |
| | | | | | | | |
| Iron & Steel — 1.0% | | | | | | | | |
Nucor Corp. | | | 137,600 | | | | 6,029,632 | |
| | | | | | | | |
| Leisure Time — 0.5% | | | | | | | | |
Harley-Davidson, Inc. | | | 80,500 | | | | 2,790,935 | |
| | | | | | | | |
| Lodging — 1.1% | | | | | | | | |
Marriott International, Inc. Class A | | | 117,464 | | | | 4,879,455 | |
MGM Resorts International (a) | | | 78,400 | | | | 1,164,240 | |
| | | | | | | | |
| | | | | | | 6,043,695 | |
| | | | | | | | |
| Machinery – Diversified — 0.5% | | | | | | | | |
Eaton Corp. | | | 25,800 | | | | 2,618,958 | |
| | | | | | | | |
| Manufacturing — 8.3% | | | | | | | | |
3M Co. | | | 106,300 | | | | 9,173,690 | |
Cooper Industries PLC Class A | | | 74,600 | | | | 4,348,434 | |
General Electric Co. | | | 818,500 | | | | 14,970,365 | |
Honeywell International, Inc. | | | 127,300 | | | | 6,767,268 | |
Illinois Tool Works, Inc. | | | 146,400 | | | | 7,817,760 | |
ITT Corp. | | | 85,900 | | | | 4,476,249 | |
| | | | | | | | |
| | | | | | | 47,553,766 | |
| | | | | | | | |
| Media — 5.6% | | | | | | | | |
Cablevision Systems Corp. Class A | | | 132,800 | | | | 4,493,952 | |
Comcast Corp. Class A | | | 138,600 | | | | 3,045,042 | |
The McGraw-Hill Cos., Inc. | | | 160,700 | | | | 5,851,087 | |
The New York Times Co. Class A (a) | | | 200,500 | | | | 1,964,900 | |
Time Warner, Inc. | | | 245,133 | | | | 7,885,929 | |
The Walt Disney Co. | | | 182,100 | | | | 6,830,571 | |
WPP PLC | | | 160,500 | | | | 1,984,000 | |
| | | | | | | | |
| | | | | | | 32,055,481 | |
| | | | | | | | |
| Mining — 0.8% | | | | | | | | |
Vulcan Materials Co. | | | 102,200 | | | | 4,533,592 | |
| | | | | | | | |
| Oil & Gas — 11.8% | | | | | | | | |
Anadarko Petroleum Corp. | | | 91,700 | | | | 6,983,872 | |
BP PLC Sponsored ADR (United Kingdom) | | | 113,400 | | | | 5,008,878 | |
Chevron Corp. | | | 169,100 | | | | 15,430,375 | |
ConocoPhillips | | | 54,600 | | | | 3,718,260 | |
Exxon Mobil Corp. | | | 175,800 | | | | 12,854,496 | |
Murphy Oil Corp. | | | 120,000 | | | | 8,946,000 | |
| | | | | | | | |
| | | Number of
Shares | | | Value | |
Royal Dutch Shell PLC A Shares Sponsored ADR (United Kingdom) | | | 167,700 | | | $ | 11,199,006 | |
Sunoco, Inc. | | | 87,900 | | | | 3,543,249 | |
| | | | | | | | |
| | | | | | | 67,684,136 | |
| | | | | | | | |
| Oil & Gas Services — 1.8% | | | | | | | | |
Baker Hughes, Inc. | | | 41,800 | | | | 2,389,706 | |
Schlumberger Ltd. | | | 98,700 | | | | 8,241,450 | |
| | | | | | | | |
| | | | | | | 10,631,156 | |
| | | | | | | | |
| Pharmaceuticals — 3.4% | | | | | | | | |
Bristol-Myers Squibb Co. | | | 172,100 | | | | 4,557,208 | |
Eli Lilly & Co. | | | 103,200 | | | | 3,616,128 | |
Merck & Co., Inc. | | | 160,700 | | | | 5,791,628 | |
Pfizer, Inc. | | | 335,954 | | | | 5,882,555 | |
| | | | | | | | |
| | | | | | | 19,847,519 | |
| | | | | | | | |
| Pipelines — 0.5% | | | | | | | | |
Spectra Energy Corp. | | | 107,650 | | | | 2,690,173 | |
| | | | | | | | |
| Retail — 3.6% | | | | | | | | |
Bed Bath & Beyond, Inc. (a) | | | 110,800 | | | | 5,445,820 | |
The Home Depot, Inc. | | | 274,800 | | | | 9,634,488 | |
Macy’s, Inc. | | | 99,300 | | | | 2,512,290 | |
Tiffany & Co. | | | 45,900 | | | | 2,858,193 | |
| | | | | | | | |
| | | | | | | 20,450,791 | |
| | | | | | | | |
| Semiconductors — 2.0% | | | | | | | | |
Analog Devices, Inc. | | | 150,800 | | | | 5,680,636 | |
Applied Materials, Inc. | | | 311,800 | | | | 4,380,790 | |
Texas Instruments, Inc. | | | 44,800 | | | | 1,456,000 | |
| | | | | | | | |
| | | | | | | 11,517,426 | |
| | | | | | | | |
| Software — 1.5% | | | | | | | | |
Electronic Arts, Inc. (a) | | | 109,900 | | | | 1,800,162 | |
Microsoft Corp. | | | 247,800 | | | | 6,918,576 | |
| | | | | | | | |
| | | | | | | 8,718,738 | |
| | | | | | | | |
| Telecommunications — 4.7% | | | | | | | | |
AT&T, Inc. | | | 378,900 | | | | 11,132,082 | |
Cisco Systems, Inc. (a) | | | 156,600 | | | | 3,168,018 | |
Qwest Communications International, Inc. | | | 659,000 | | | | 5,014,990 | |
Verizon Communications, Inc. | | | 147,000 | | | | 5,259,660 | |
Vodafone Group PLC | | | 933,400 | | | | 2,431,237 | |
| | | | | | | | |
| | | | | | | 27,005,987 | |
| | | | | | | | |
| Toys, Games & Hobbies — 0.9% | | | | | | | | |
Mattel, Inc. | | | 204,200 | | | | 5,192,806 | |
| | | | | | | | |
| Transportation — 1.1% | | | | | | | | |
United Parcel Service, Inc. Class B | | | 87,400 | | | | 6,343,492 | |
| | | | | | | | |
| | |
TOTAL COMMON STOCK
(Cost $489,678,979) | | | | | | | 556,806,803 | |
| | | | | | | | |
The accompanying notes are an integral part of the financial statements.
53
MML Equity Income Fund – Portfolio of Investments (Continued)
| | | | | | | | |
| | | Number of
Shares | | | Value | |
| PREFERRED STOCK — 0.6% | | | | | | | | |
| Auto Manufacturers — 0.6% | | | | | | | | |
General Motors Co. 4.750% | | | 63,150 | | | $ | 3,417,046 | |
| | | | | | | | |
| | |
TOTAL PREFERRED STOCK
(Cost $3,204,378) | | | | | | | 3,417,046 | |
| | | | | | | | |
| | |
TOTAL EQUITIES
(Cost $492,883,357) | | | | | | | 560,223,849 | |
| | | | | | | | |
| | |
| MUTUAL FUNDS — 1.2% | | | | | | | | |
| Diversified Financial — 1.2% | | | | | | | | |
T. Rowe Price Reserve Investment Fund | | | 6,806,231 | | | | 6,806,231 | |
| | | | | | | | |
| | |
TOTAL MUTUAL FUNDS
(Cost $6,806,231) | | | | | | | 6,806,231 | |
| | | | | | | | |
| | |
TOTAL LONG-TERM INVESTMENTS
(Cost $499,689,588) | | | | | | | 567,030,080 | |
| | | | | | | | |
| | |
| | | Principal
Amount | | | | |
| |
| SHORT-TERM INVESTMENTS — 2.2% | | | | | |
| Repurchase Agreement — 2.2% | | | | | | | | |
State Street Bank & Trust Co. Repurchase Agreement, dated 12/31/10, 0.010%, due 1/03/11 (b) | | $ | 12,847,764 | | | | 12,847,764 | |
| | | | | | | | |
| Time Deposits — 0.0% | | | | | | | | |
Euro Time Deposit
0.010% 1/03/11 | | | 35,650 | | | | 35,650 | |
| | | | | | | | |
| | |
TOTAL SHORT-TERM INVESTMENTS
(Cost $12,883,414) | | | | | | | 12,883,414 | |
| | | | | | | | |
| | |
TOTAL INVESTMENTS — 100.7%
(Cost $512,573,002) (c) | | | | | | | 579,913,494 | |
| | |
| Other Assets/(Liabilities) — (0.7)% | | | | | | | (4,158,236 | ) |
| | | | | | | | |
| | |
| NET ASSETS — 100.0% | | | | | | $ | 575,755,258 | |
| | | | | | | | |
Notes to Portfolio of Investments
| ADR | American Depositary Receipt |
| (a) | Non-income producing security. |
| (b) | Maturity value of $12,847,774. Collateralized by U.S. Government Agency obligations with a rate of 4.000%, maturity dates ranging from 8/15/39-9/25/39, and an aggregate market value, including accrued interest, of $13,105,602. |
| (c) | See Note 6 for aggregate cost for federal tax purposes. |
The accompanying notes are an integral part of the financial statements.
54
MML Foreign Fund – Portfolio of Investments
December 31, 2010
| | | | | | | | |
| | | Number of
Shares | | | Value | |
| EQUITIES — 94.8% | | | | | | | | |
| | |
| COMMON STOCK — 93.1% | | | | | | | | |
| Aerospace & Defense — 1.8% | | | | | | | | |
BAE Systems PLC | | | 609,590 | | | $ | 3,138,233 | |
Embraer SA Sponsored ADR (Brazil) | | | 74,920 | | | | 2,202,648 | |
Rolls-Royce Group PLC (a) | | | 101,011 | | | | 981,701 | |
| | | | | | | | |
| | | | | | | 6,322,582 | |
| | | | | | | | |
| Apparel — 0.5% | | | | | | | | |
Burberry Group PLC | | | 101,072 | | | | 1,773,299 | |
| | | | | | | | |
| Auto Manufacturers — 1.4% | | | | | | | | |
Bayerische Motoren Werke AG | | | 23,221 | | | | 1,829,010 | |
Toyota Motor Corp. Sponsored ADR (Japan) | | | 37,300 | | | | 2,932,899 | |
| | | | | | | | |
| | | | | | | 4,761,909 | |
| | | | | | | | |
| Automotive & Parts — 1.0% | | | | | | | | |
Cie Generale des Etablissements Michelin Class B | | | 49,970 | | | | 3,602,239 | |
| | | | | | | | |
| Banks — 8.4% | | | | | | | | |
Banco Espirito Santo SA | | | 472,526 | | | | 1,824,281 | |
Banco Santander SA | | | 104,831 | | | | 1,116,362 | |
Credit Agricole SA | | | 207,090 | | | | 2,640,827 | |
DBS Group Holdings, Ltd. | | | 573,479 | | | | 6,398,485 | |
HSBC Holdings PLC | | | 237,600 | | | | 2,431,562 | |
ICICI Bank Ltd. Sponsored ADR (India) | | | 84,850 | | | | 4,296,804 | |
Intesa Sanpaolo | | | 507,836 | | | | 1,380,294 | |
KB Financial Group, Inc. Sponsored ADR (Republic of Korea) | | | 80,670 | | | | 4,266,636 | |
Mitsubishi UFJ Financial Group, Inc. | | | 228,100 | | | | 1,233,448 | |
Nordea Bank AB | | | 116,605 | | | | 1,275,083 | |
UniCredit SpA | | | 1,062,833 | | | | 2,202,994 | |
| | | | | | | | |
| | | | | | | 29,066,776 | |
| | | | | | | | |
| Building Materials — 0.8% | | | | | | | | |
CRH PLC | | | 138,562 | | | | 2,879,923 | |
| | | | | | | | |
| Chemicals — 1.6% | | | | | | | | |
Akzo Nobel NV | | | 39,800 | | | | 2,482,780 | |
Lonza Group AG Registered | | | 36,480 | | | | 2,928,760 | |
| | | | | | | | |
| | | | | | | 5,411,540 | |
| | | | | | | | |
| Commercial Services — 2.9% | | | | | | | | |
Adecco SA | | | 51,300 | | | | 3,359,052 | |
G4S PLC | | | 750,040 | | | | 2,980,916 | |
Randstad Holding NV (a) | | | 58,153 | | | | 3,077,512 | |
Rentokil Initial PLC (a) | | | 428,422 | | | | 647,610 | |
| | | | | | | | |
| | | | | | | 10,065,090 | |
| | | | | | | | |
| Computers — 1.2% | | | | | | | | |
Compal Electronics, Inc. | | | 2,144,605 | | | | 2,834,936 | |
Lite On Technology Corp. | | | 1,038,239 | | | | 1,427,551 | |
| | | | | | | | |
| | | | | | | 4,262,487 | |
| | | | | | | | |
| | | | | | | | |
| | | Number of
Shares | | | Value | |
| Distribution & Wholesale — 1.4% | | | | | | | | |
ITOCHU Corp. | | | 293,800 | | | $ | 2,973,663 | |
Wolseley PLC (a) | | | 61,409 | | | | 1,960,517 | |
| | | | | | | | |
| | | | | | | 4,934,180 | |
| | | | | | | | |
| Electric — 2.3% | | | | | | | | |
E.ON AG | | | 119,450 | | | | 3,671,789 | |
Iberdrola SA | | | 382,467 | | | | 2,953,232 | |
National Grid PLC | | | 138,282 | | | | 1,206,109 | |
| | | | | | | | |
| | | | | | | 7,831,130 | |
| | | | | | | | |
| Electronics — 1.9% | | | | | | | | |
Flextronics International Ltd. (a) | | | 315,340 | | | | 2,475,419 | |
Koninklijke Philips Electronics NV | | | 135,910 | | | | 4,170,680 | |
| | | | | | | | |
| | | | | | | 6,646,099 | |
| | | | | | | | |
| Energy – Alternate Sources — 0.3% | | | | | | | | |
Vestas Wind Systems A/S (a) | | | 26,952 | | | | 853,058 | |
| | | | | | | | |
| Food Services — 0.9% | | | | | | | | |
Compass Group PLC | | | 354,702 | | | | 3,216,813 | |
| | | | | | | | |
| Foods — 3.9% | | | | | | | | |
Nestle SA | | | 73,770 | | | | 4,324,733 | |
Tesco PLC | | | 580,210 | | | | 3,848,771 | |
Unilever PLC | | | 169,667 | | | | 5,190,429 | |
| | | | | | | | |
| | | | | | | 13,363,933 | |
| | | | | | | | |
| Gas — 0.8% | | | | | | | | |
Gaz De France | | | 75,588 | | | | 2,724,302 | |
| | | | | | | | |
| Health Care – Services — 0.8% | | | | | | | | |
Rhoen-Klinikum AG | | | 118,083 | | | | 2,605,271 | |
| | | | | | | | |
| Holding Company – Diversified — 0.7% | | | | | |
Hutchison Whampoa Ltd. | | | 224,291 | | | | 2,313,307 | |
| | | | | | | | |
| Home Furnishing — 0.5% | | | | | | | | |
Sony Corp. | | | 44,235 | | | | 1,594,352 | |
| | | | | | | | |
| Insurance — 7.6% | | | | | | | | |
ACE Ltd. | | | 59,484 | | | | 3,702,879 | |
AIA Group Ltd. (a) | | | 1,336,400 | | | | 3,756,516 | |
Aviva PLC | | | 518,615 | | | | 3,191,781 | |
AXA SA | | | 185,687 | | | | 3,105,606 | |
ING Groep NV (a) | | | 464,460 | | | | 4,542,674 | |
Muenchener Rueckversicherungs AG | | | 25,570 | | | | 3,887,123 | |
Swiss Reinsurance Co. Ltd. | | | 73,840 | | | | 4,024,837 | |
| | | | | | | | |
| | | | | | | 26,211,416 | |
| | | | | | | | |
| Internet — 1.8% | | | | | | | | |
Check Point Software Technologies Ltd. (a) | | | 134,429 | | | | 6,218,686 | |
| | | | | | | | |
| Iron & Steel — 0.5% | | | | | | | | |
POSCO ADR (Republic of Korea) | | | 17,281 | | | | 1,860,991 | |
| | | | | | | | |
| Machinery – Diversified — 0.4% | | | | | | | | |
Alstom SA | | | 30,530 | | | | 1,464,580 | |
| | | | | | | | |
The accompanying notes are an integral part of the financial statements.
55
MML Foreign Fund – Portfolio of Investments (Continued)
| | | | | | | | |
| | | Number of
Shares | | | Value | |
| Manufacturing — 3.7% | | | | | | | | |
FUJIFILM Holdings Corp. | | | 51,226 | | | $ | 1,852,029 | |
Konica Minolta Holdings, Inc. | | | 239,500 | | | | 2,488,028 | |
Olympus Corp. | | | 44,610 | | | | 1,350,029 | |
Siemens AG | | | 56,176 | | | | 6,970,468 | |
| | | | | | | | |
| | | | | | | 12,660,554 | |
| | | | | | | | |
| Media — 4.2% | | | | | | | | |
British Sky Broadcasting Group PLC | | | 290,384 | | | | 3,334,812 | |
Pearson PLC | | | 249,124 | | | | 3,937,202 | |
Reed Elsevier NV | | | 277,543 | | | | 3,444,514 | |
Vivendi SA | | | 134,470 | | | | 3,644,283 | |
| | | | | | | | |
| | | | | | | 14,360,811 | |
| | | | | | | | |
| Oil & Gas — 9.5% | | | | | | | | |
BP PLC | | | 468,264 | | | | 3,432,356 | |
ENI SpA | | | 118,312 | | | | 2,591,043 | |
Petroleo Brasileiro SA Sponsored ADR (Brazil) | | | 122,780 | | | | 4,195,393 | |
Royal Dutch Shell PLC Class B | | | 188,304 | | | | 6,232,559 | |
Sasol Ltd. Sponsored ADR (South Africa) | | | 86,770 | | | | 4,516,378 | |
StatoilHydro ASA | | | 159,320 | | | | 3,792,683 | |
Talisman Energy, Inc. | | | 147,000 | | | | 3,268,965 | |
Total SA | | | 84,772 | | | | 4,511,755 | |
| | | | | | | | |
| | | | | | | 32,541,132 | |
| | | | | | | | |
| Oil & Gas Services — 0.8% | | | | | | | | |
SBM Offshore NV | | | 116,456 | | | | 2,618,951 | |
| | | | | | | | |
| Pharmaceuticals — 7.2% | | | | | | | | |
Bayer AG | | | 24,730 | | | | 1,831,581 | |
Celesio AG | | | 71,790 | | | | 1,789,222 | |
GlaxoSmithKline PLC | | | 226,254 | | | | 4,396,574 | |
Merck KGaA | | | 35,150 | | | | 2,819,550 | |
Novartis AG | | | 73,150 | | | | 4,307,936 | |
Roche Holding AG | | | 26,670 | | | | 3,912,760 | |
Sanofi-Aventis | | | 90,688 | | | | 5,836,536 | |
| | | | | | | | |
| | | | | | | 24,894,159 | |
| | | | | | | | |
| Real Estate — 1.0% | | | | | | | | |
Cheung Kong Holdings | | | 221,215 | | | | 3,401,797 | |
| | | | | | | | |
| Retail — 2.0% | | | | | | | | |
Kingfisher PLC | | | 1,084,774 | | | | 4,461,860 | |
Marks & Spencer Group PLC | | | 434,140 | | | | 2,500,409 | |
| | | | | | | | |
| | | | | | | 6,962,269 | |
| | | | | | | | |
| Semiconductors — 5.5% | | | | | | | | |
Infineon Technologies AG (a) | | | 509,387 | | | | 4,746,462 | |
Samsung Electronics Co. Ltd. | | | 10,502 | | | | 8,776,173 | |
Taiwan Semiconductor Manufacturing Co. Ltd. | | | 2,213,275 | | | | 5,387,526 | |
| | | | | | | | |
| | | | | | | 18,910,161 | |
| | | | | | | | |
| | | | | | | | |
| | | Number of
Shares | | | Value | |
| Software — 2.0% | | | | | | | | |
SAP AG Sponsored ADR (Germany) | | | 95,360 | | | $ | 4,826,170 | |
The Sage Group PLC | | | 442,850 | | | | 1,890,099 | |
| | | | | | | | |
| | | | | | | 6,716,269 | |
| | | | | | | | |
| Telecommunications — 11.9% | | | | | | | | |
China Telecom Corp. Ltd. Class H | | | 8,147,643 | | | | 4,229,810 | |
France Telecom SA | | | 198,787 | | | | 4,159,388 | |
Mobile TeleSystems Sponsored ADR (Russia) | | | 114,225 | | | | 2,383,876 | |
Singapore Telecommunications Ltd. | | | 1,849,000 | | | | 4,393,730 | |
Singapore Telecommunications Ltd. | | | 239,000 | | | | 574,852 | |
Telefonaktiebolaget LM Ericsson Sponsored ADR (Sweden) | | | 309,690 | | | | 3,570,726 | |
Telefonica SA Sponsored ADR (Spain) | | | 94,025 | | | | 6,433,191 | |
Telekom Austria AG | | | 163,910 | | | | 2,310,322 | |
Telenor ASA | | | 399,566 | | | | 6,506,633 | |
Vodafone Group PLC Sponsored ADR (United Kingdom) | | | 240,423 | | | | 6,354,380 | |
| | | | | | | | |
| | | | | | | 40,916,908 | |
| | | | | | | | |
| Toys, Games & Hobbies — 1.0% | | | | | | | | |
Nintendo Co. Ltd. | | | 12,000 | | | | 3,523,418 | |
| | | | | | | | |
| Transportation — 0.9% | | | | | | | | |
Deutsche Post AG | | | 172,271 | | | | 2,928,385 | |
| | | | | | | | |
| | |
| TOTAL COMMON STOCK (Cost $331,215,897) | | | | | | | 320,418,777 | |
| | | | | | | | |
| | |
| PREFERRED STOCK — 1.7% | | | | | | | | |
| Mining — 1.7% | | | | | | | | |
Vale SA Sponsored ADR (Brazil) 1.770% | | | 191,752 | | | | 5,794,745 | |
| | | | | | | | |
| | |
| TOTAL PREFERRED STOCK (Cost $2,736,273) | | | | | | | 5,794,745 | |
| | | | | | | | |
| | |
TOTAL EQUITIES
(Cost $333,952,170) | | | | | | | 326,213,522 | |
| | | | | | | | |
| | |
TOTAL LONG-TERM INVESTMENTS
(Cost $333,952,170) | | | | | | | 326,213,522 | |
| | | | | | | | |
The accompanying notes are an integral part of the financial statements.
56
MML Foreign Fund – Portfolio of Investments (Continued)
| | | | | | | | |
| | | Principal
Amount | | | Value | |
| SHORT-TERM INVESTMENTS — 3.0% | |
| Repurchase Agreement — 3.0% | | | | | | | | |
State Street Bank & Trust Co. Repurchase Agreement, dated 12/31/10, 0.010%, due 1/03/11 (b) | | $ | 10,432,495 | | | $ | 10,432,495 | |
| | | | | | | | |
| | |
TOTAL SHORT-TERM INVESTMENTS
(Cost $10,432,495) | | | | | | | 10,432,495 | |
| | | | | | | | |
| | |
| TOTAL INVESTMENTS — 97.8% (Cost $344,384,665) (c) | | | | | | | 336,646,017 | |
| | |
| Other Assets/(Liabilities) — 2.2% | | | | | | | 7,705,622 | |
| | | | | | | | |
| | |
| NET ASSETS — 100.0% | | | | | | $ | 344,351,639 | |
| | | | | | | | |
Notes to Portfolio of Investments
| ADR | American Depositary Receipt |
| (a) | Non-income producing security. |
| (b) | Maturity value of $10,432,504. Collateralized by U.S. Government Agency obligations with a rate of 4.000%, maturity date of 9/25/39, and an aggregate market value, including accrued interest, of $10,642,709. |
| (c) | See Note 6 for aggregate cost for federal tax purposes. |
The accompanying notes are an integral part of the financial statements.
57
MML Global Fund – Portfolio of Investments
December 31, 2010
| | | | | | | | |
| | | Number of
Shares | | | Value | |
| EQUITIES — 99.2% | | | | | | | | |
| | |
| COMMON STOCK — 99.2% | | | | | | | | |
| Advertising — 1.4% | | | | | | | | |
Omnicom Group, Inc. | | | 31,480 | | | $ | 1,441,784 | |
| | | | | | | | |
| Aerospace & Defense — 0.9% | | | | | | | | |
United Technologies Corp. | | | 11,830 | | | | 931,258 | |
| | | | | | | | |
| Apparel — 1.9% | | | | | | | | |
Burberry Group PLC | | | 31,861 | | | | 558,998 | |
Nike, Inc. Class B | | | 17,230 | | | | 1,471,787 | |
| | | | | | | | |
| | | | | | | 2,030,785 | |
| | | | | | | | |
| Banks — 8.8% | | | | | | | | |
Banco Santander SA ADS (Brazil) | | | 46,580 | | | | 633,488 | |
Bank of New York Mellon Corp. | | | 67,800 | | | | 2,047,560 | |
Erste Group Bank AG | | | 22,595 | | | | 1,064,231 | |
ICICI Bank Ltd. Sponsored ADR (India) | | | 9,020 | | | | 456,773 | |
Julius Baer Group Ltd. | | | 27,323 | | | | 1,280,714 | |
Komercni Banka AS | | | 1,658 | | | | 393,234 | |
Standard Chartered PLC | | | 41,974 | | | | 1,130,545 | |
State Street Corp. | | | 46,090 | | | | 2,135,811 | |
| | | | | | | | |
| | | | | | | 9,142,356 | |
| | | | | | | | |
| Beverages — 6.6% | | | | | | | | |
Diageo PLC | | | 108,248 | | | | 2,005,705 | |
Dr. Pepper Snapple Group, Inc. | | | 14,130 | | | | 496,811 | |
Heineken NV | | | 52,367 | | | | 2,572,345 | |
PepsiCo, Inc. | | | 11,460 | | | | 748,682 | |
Pernod-Ricard SA | | | 11,270 | | | | 1,063,149 | |
| | | | | | | | |
| | | | | | | 6,886,692 | |
| | | | | | | | |
| Chemicals — 9.6% | | | | | | | | |
Air Liquide | | | 8,064 | | | | 1,022,278 | |
Akzo Nobel NV | | | 26,977 | | | | 1,682,863 | |
Givaudan SA Registered | | | 709 | | | | 766,150 | |
Linde AG | | | 20,722 | | | | 3,152,405 | |
Monsanto Co. | | | 7,820 | | | | 544,585 | |
Praxair, Inc. | | | 10,060 | | | | 960,428 | |
The Sherwin-Williams Co. | | | 10,650 | | | | 891,938 | |
Shin-Etsu Chemical Co. Ltd. | | | 17,900 | | | | 969,828 | |
| | | | | | | | |
| | | | | | | 9,990,475 | |
| | | | | | | | |
| Commercial Services — 0.8% | | | | | | | | |
Visa, Inc. Class A | | | 11,590 | | | | 815,704 | |
| | | | | | | | |
| Computers — 1.6% | | | | | | | | |
Accenture PLC Class A | | | 34,790 | | | | 1,686,967 | |
| | | | | | | | |
| Cosmetics & Personal Care — 3.5% | | | | | | | | |
Beiersdorf AG | | | 8,635 | | | | 480,202 | |
Colgate-Palmolive Co. | | | 15,780 | | | | 1,268,239 | |
Kao Corp. | | | 25,700 | | | | 692,673 | |
The Procter & Gamble Co. | | | 19,050 | | | | 1,225,486 | |
| | | | | | | | |
| | | | | | | 3,666,600 | |
| | | | | | | | |
| | | | | | | | |
| | | Number of
Shares | | | Value | |
| Diversified Financial — 4.2% | | | | | | | | |
Aeon Credit Service Co. Ltd. | | | 21,300 | | | $ | 301,239 | |
American Express Co. | | | 19,610 | | | | 841,661 | |
Deutsche Boerse AG | | | 12,069 | | | | 837,220 | |
The Goldman Sachs Group, Inc. | | | 7,910 | | | | 1,330,146 | |
UBS AG (a) | | | 66,572 | | | | 1,093,475 | |
| | | | | | | | |
| | | | | | | 4,403,741 | |
| | | | | | | | |
| Electric — 0.2% | | | | | | | | |
Red Electrica Corp. SA | | | 5,384 | | | | 253,709 | |
| | | | | | | | |
| Electrical Components & Equipment — 3.0% | | | | | |
Legrand SA | | | 31,662 | | | | 1,293,381 | |
Schneider Electric SA | | | 12,084 | | | | 1,813,219 | |
| | | | | | | | |
| | | | | | | 3,106,600 | |
| | | | | | | | |
| Electronics — 2.3% | | | | | | | | |
Hoya Corp. | | | 41,800 | | | | 1,015,102 | |
Waters Corp. (a) | | | 17,410 | | | | 1,352,931 | |
| | | | | | | | |
| | | | | | | 2,368,033 | |
| | | | | | | | |
| Entertainment — 0.7% | | | | | | | | |
Ladbrokes PLC | | | 140,230 | | | | 268,558 | |
William Hill PLC | | | 183,772 | | | | 489,670 | |
| | | | | | | | |
| | | | | | | 758,228 | |
| | | | | | | | |
| Food Services — 0.4% | | | | | | | | |
Compass Group PLC | | | 46,310 | | | | 419,988 | |
| | | | | | | | |
| Foods — 6.9% | | | | | | | | |
Danone SA | | | 16,183 | | | | 1,018,767 | |
General Mills, Inc. | | | 22,860 | | | | 813,587 | |
The J.M. Smucker Co. | | | 17,770 | | | | 1,166,600 | |
Nestle SA | | | 58,889 | | | | 3,452,341 | |
Tesco PLC | | | 115,276 | | | | 764,673 | |
| | | | | | | | |
| | | | | | | 7,215,968 | |
| | | | | | | | |
| Forest Products & Paper — 1.2% | | | | | | | | |
Svenska Cellulosa AB Class B | | | 81,142 | | | | 1,280,152 | |
| | | | | | | | |
| Health Care – Products — 5.7% | | | | | | | | |
Johnson & Johnson | | | 15,440 | | | | 954,964 | |
Medtronic, Inc. | | | 44,320 | | | | 1,643,829 | |
Sonova Holding AG | | | 2,575 | | | | 333,767 | |
St. Jude Medical, Inc. (a) | | | 37,410 | | | | 1,599,277 | |
Synthes, Inc. | | | 6,973 | | | | 948,076 | |
Zimmer Holdings, Inc. (a) | | | 8,570 | | | | 460,038 | |
| | | | | | | | |
| | | | | | | 5,939,951 | |
| | | | | | | | |
| Health Care – Services — 1.3% | | | | | | | | |
Thermo Fisher Scientific, Inc. (a) | | | 23,680 | | | | 1,310,925 | |
| | | | | | | | |
| Holding Company – Diversified — 1.7% | | | | | |
LVMH Moet Hennessy Louis Vuitton SA | | | 10,731 | | | | 1,768,538 | |
| | | | | | | | |
| Household Products — 2.2% | | | | | | | | |
Reckitt Benckiser Group PLC | | | 42,395 | | | | 2,332,498 | |
| | | | | | | | |
The accompanying notes are an integral part of the financial statements.
58
MML Global Fund – Portfolio of Investments (Continued)
| | | | | | | | |
| | | Number of
Shares | | | Value | |
| Insurance — 1.3% | | | | | | | | |
AXA SA | | | 39,226 | | | $ | 656,053 | |
Swiss Reinsurance Co. Ltd. | | | 13,373 | | | | 728,929 | |
| | | | | | | | |
| | | | | | | 1,384,982 | |
| | | | | | | | |
| Leisure Time — 0.4% | | | | | | | | |
Harley-Davidson, Inc. | | | 11,600 | | | | 402,172 | |
| | | | | | | | |
| Machinery – Diversified — 0.4% | | | | | | | | |
Rockwell Automation, Inc. | | | 5,490 | | | | 393,688 | |
| | | | | | | | |
| Manufacturing — 3.9% | | | | | | | | |
3M Co. | | | 22,520 | | | | 1,943,476 | |
Honeywell International, Inc. | | | 29,880 | | | | 1,588,421 | |
Smiths Group PLC | | | 26,498 | | | | 514,960 | |
| | | | | | | | |
| | | | | | | 4,046,857 | |
| | | | | | | | |
| Media — 3.6% | | | | | | | | |
The Walt Disney Co. | | | 56,470 | | | | 2,118,190 | |
Wolters Kluwer NV | | | 13,350 | | | | 293,323 | |
WPP PLC | | | 106,872 | | | | 1,321,084 | |
| | | | | | | | |
| | | | | | | 3,732,597 | |
| | | | | | | | |
| Office Equipment/Supplies — 1.1% | | | | | | | | |
Canon, Inc. | | | 22,400 | | | | 1,149,249 | |
| | | | | | | | |
| Oil & Gas — 1.8% | | | | | | | | |
Chevron Corp. | | | 7,330 | | | | 668,863 | |
Inpex Corp. | | | 143 | | | | 837,129 | |
Royal Dutch Shell PLC Class A | | | 12,914 | | | | 427,723 | |
| | | | | | | | |
| | | | | | | 1,933,715 | |
| | | | | | | | |
| Oil & Gas Services — 2.1% | | | | | | | | |
National Oilwell Varco, Inc. | | | 22,760 | | | | 1,530,610 | |
Schlumberger Ltd. | | | 7,890 | | | | 658,815 | |
| | | | | | | | |
| | | | | | | 2,189,425 | |
| | | | | | | | |
| Pharmaceuticals — 4.6% | | | | | | | | |
Bayer AG | | | 22,517 | | | | 1,667,679 | |
DENTSPLY International, Inc. | | | 25,310 | | | | 864,843 | |
Merck KGaA | | | 12,296 | | | | 986,321 | |
Roche Holding AG | | | 8,683 | | | | 1,273,884 | |
| | | | | | | | |
| | | | | | | 4,792,727 | |
| | | | | | | | |
| Retail — 4.7% | | | | | | | | |
Abercrombie & Fitch Co. Class A | | | 7,380 | | | | 425,310 | |
Cie Financiere Richemont SA | | | 21,698 | | | | 1,277,542 | |
Lawson, Inc. | | | 5,200 | | | | 257,336 | |
Sally Beauty Holdings, Inc. (a) | | | 22,340 | | | | 324,600 | |
Target Corp. | | | 13,270 | | | | 797,925 | |
Walgreen Co. | | | 45,900 | | | | 1,788,264 | |
| | | | | | | | |
| | | | | | | 4,870,977 | |
| | | | | | | | |
| Semiconductors — 1.8% | | | | | | | | |
Intel Corp. | | | 34,080 | | | | 716,702 | |
Samsung Electronics Co. Ltd. | | | 1,456 | | | | 1,216,731 | |
| | | | | | | | |
| | | | | | | 1,933,433 | |
| | | | | | | | |
| | | | | | | | |
| | | Number of
Shares | | | Value | |
| Software — 2.7% | | | | | | | | |
Autodesk, Inc. (a) | | | 19,300 | | | $ | 737,260 | |
Oracle Corp. | | | 64,920 | | | | 2,031,996 | |
| | | | | | | | |
| | | | | | | 2,769,256 | |
| | | | | | | | |
| Telecommunications — 2.2% | | | | | | | | |
Cisco Systems, Inc. (a) | | | 94,060 | | | | 1,902,834 | |
Singapore Telecommunications Ltd. | | | 149,000 | | | | 354,065 | |
| | | | | | | | |
| | | | | | | 2,256,899 | |
| | | | | | | | |
| Transportation — 3.7% | | | | | | | | |
Canadian National Railway Co. | | | 25,240 | | | | 1,677,703 | |
TNT NV | | | 32,899 | | | | 871,630 | |
United Parcel Service, Inc. Class B | | | 18,350 | | | | 1,331,842 | |
| | | | | | | | |
| | | | | | | 3,881,175 | |
| | | | | | | | |
| | |
TOTAL COMMON STOCK
(Cost $79,850,301) | | | | | | | 103,488,104 | |
| | | | | | | | |
| | |
TOTAL EQUITIES
(Cost $79,850,301) | | | | | | | 103,488,104 | |
| | | | | | | | |
| | |
TOTAL LONG-TERM INVESTMENTS
(Cost $79,850,301) | | | | | | | 103,488,104 | |
| | | | | | | | |
| | |
| | | Principal
Amount | | | | |
| |
| SHORT-TERM INVESTMENTS — 0.8% | | | | | |
| Repurchase Agreement — 0.8% | | | | | | | | |
State Street Bank & Trust Co. Repurchase Agreement, dated 12/31/10, 0.010%, due 1/03/11 (b) | | $ | 782,015 | | | | 782,015 | |
| | | | | | | | |
| Time Deposits — 0.0% | | | | | | | | |
Euro Time Deposit
0.010% 1/03/11 | | | 5,754 | | | | 5,754 | |
| | | | | | | | |
| | |
TOTAL SHORT-TERM INVESTMENTS
(Cost $787,769) | | | | | | | 787,769 | |
| | | | | | | | |
| | |
TOTAL INVESTMENTS — 100.0%
(Cost $80,638,070) (c) | | | | | | | 104,275,873 | |
| | |
| Other Assets/(Liabilities) — 0.0% | | | | | | | 4,171 | |
| | | | | | | | |
| | |
| NET ASSETS — 100.0% | | | | | | $ | 104,280,044 | |
| | | | | | | | |
Notes to Portfolio of Investments
| ADR | American Depositary Receipt |
| ADS | American Depositary Share |
| (a) | Non-income producing security. |
| (b) | Maturity value of $782,016. Collateralized by U.S. Government Agency obligations with a rate of 2.498%, maturity date of 3/01/34, and an aggregate market value, including accrued interest, of $797,859. |
| (c) | See Note 6 for aggregate cost for federal tax purposes. |
The accompanying notes are an integral part of the financial statements.
59
MML Growth & Income Fund – Portfolio of Investments
December 31, 2010
| | | | | | | | |
| | | Number of
Shares | | | Value | |
| EQUITIES — 99.2% | | | | | | | | |
| | |
| COMMON STOCK — 99.2% | | | | | | | | |
| Aerospace & Defense — 2.6% | | | | | | | | |
Lockheed Martin Corp. | | | 10,998 | | | $ | 768,870 | |
United Technologies Corp. | | | 41,382 | | | | 3,257,591 | |
| | | | | | | | |
| | | | | | | 4,026,461 | |
| | | | | | | | |
| Agriculture — 1.6% | | | | | | | | |
Philip Morris International, Inc. | | | 43,803 | | | | 2,563,789 | |
| | | | | | | | |
| Apparel — 1.3% | | | | | | | | |
Nike, Inc. Class B | | | 23,623 | | | | 2,017,877 | |
| | | | | | | | |
| Auto Manufacturers — 0.8% | | | | | | | | |
Bayerische Motoren Werke AG | | | 15,813 | | | | 1,245,517 | |
| | | | | | | | |
| Banks — 7.2% | | | | | | | | |
Bank of America Corp. | | | 234,163 | | | | 3,123,734 | |
Bank of New York Mellon Corp. | | | 75,346 | | | | 2,275,449 | |
State Street Corp. | | | 41,152 | | | | 1,906,984 | |
SunTrust Banks, Inc. | | | 29,178 | | | | 861,043 | |
Wells Fargo & Co. | | | 101,480 | | | | 3,144,865 | |
| | | | | | | | |
| | | | | | | 11,312,075 | |
| | | | | | | | |
| Beverages — 3.3% | | | | | | | | |
Diageo PLC | | | 72,359 | | | | 1,340,725 | |
Heineken NV | | | 38,767 | | | | 1,904,293 | |
PepsiCo, Inc. | | | 29,594 | | | | 1,933,376 | |
| | | | | | | | |
| | | | | | | 5,178,394 | |
| | | | | | | | |
| Biotechnology — 0.4% | | | | | | | | |
Genzyme Corp. (a) | | | 8,079 | | | | 575,225 | |
| | | | | | | | |
| Chemicals — 4.6% | | | | | | | | |
Linde AG | | | 15,585 | | | | 2,370,921 | |
Monsanto Co. | | | 17,480 | | | | 1,217,307 | |
Praxair, Inc. | | | 19,627 | | | | 1,873,790 | |
The Sherwin-Williams Co. | | | 20,087 | | | | 1,682,286 | |
| | | | | | | | |
| | | | | | | 7,144,304 | |
| | | | | | | | |
| Commercial Services — 1.9% | | | | | | | | |
MasterCard, Inc. Class A | | | 7,882 | | | | 1,766,435 | |
Visa, Inc. Class A | | | 17,620 | | | | 1,240,096 | |
| | | | | | | | |
| | | | | | | 3,006,531 | |
| | | | | | | | |
| Computers — 7.3% | | | | | | | | |
Accenture PLC Class A | | | 43,550 | | | | 2,111,740 | |
Apple, Inc. (a) | | | 13,347 | | | | 4,305,208 | |
EMC Corp. (a) | | | 134,709 | | | | 3,084,836 | |
Hewlett-Packard Co. | | | 17,252 | | | | 726,309 | |
International Business Machines Corp. | | | 8,562 | | | | 1,256,559 | |
| | | | | | | | |
| | | | | | | 11,484,652 | |
| | | | | | | | |
| Cosmetics & Personal Care — 3.4% | | | | | | | | |
Colgate-Palmolive Co. | | | 20,154 | | | | 1,619,777 | |
The Procter & Gamble Co. | | | 57,208 | | | | 3,680,191 | |
| | | | | | | | |
| | | | | | | 5,299,968 | |
| | | | | | | | |
| | | | | | | | |
| | | Number of
Shares | | | Value | |
| Diversified Financial — 8.2% | | | | | | | | |
American Express Co. | | | 39,068 | | | $ | 1,676,799 | |
BlackRock, Inc. | | | 8,869 | | | | 1,690,254 | |
The Charles Schwab Corp. | | | 67,033 | | | | 1,146,935 | |
Franklin Resources, Inc. | | | 13,673 | | | | 1,520,574 | |
The Goldman Sachs Group, Inc. | | | 15,469 | | | | 2,601,267 | |
JP Morgan Chase & Co. | | | 99,532 | | | | 4,222,147 | |
| | | | | | | | |
| | | | | | | 12,857,976 | |
| | | | | | | | |
| Electric — 2.1% | | | | | | | | |
Alliant Energy Corp. | | | 27,140 | | | | 997,938 | |
American Electric Power Co., Inc. | | | 29,483 | | | | 1,060,798 | |
Wisconsin Energy Corp. | | | 22,040 | | | | 1,297,274 | |
| | | | | | | | |
| | | | | | | 3,356,010 | |
| | | | | | | | |
| Engineering & Construction — 1.0% | | | | | | | | |
Fluor Corp. | | | 22,810 | | | | 1,511,391 | |
| | | | | | | | |
| Entertainment — 0.6% | | | | | | | | |
International Game Technology | | | 34,677 | | | | 613,436 | |
Ladbrokes PLC | | | 161,205 | | | | 308,728 | |
| | | | | | | | |
| | | | | | | 922,164 | |
| | | | | | | | |
| Foods — 1.5% | | | | | | | | |
General Mills, Inc. | | | 37,178 | | | | 1,323,165 | |
Nestle SA | | | 17,423 | | | | 1,021,415 | |
| | | | | | | | |
| | | | | | | 2,344,580 | |
| | | | | | | | |
| Health Care – Products — 6.8% | | | | | | | | |
Baxter International, Inc. | | | 19,617 | | | | 993,013 | |
Becton, Dickinson & Co. | | | 23,134 | | | | 1,955,286 | |
Johnson & Johnson | | | 52,538 | | | | 3,249,475 | |
Medtronic, Inc. | | | 66,048 | | | | 2,449,720 | |
St. Jude Medical, Inc. (a) | | | 46,658 | | | | 1,994,629 | |
| | | | | | | | |
| | | | | | | 10,642,123 | |
| | | | | | | | |
| Health Care – Services — 0.8% | | | | | | | | |
Thermo Fisher Scientific, Inc. (a) | | | 22,500 | | | | 1,245,600 | |
| | | | | | | | |
| Household Products — 1.1% | | | | | | | | |
Reckitt Benckiser Group PLC | | | 32,111 | | | | 1,766,690 | |
| | | | | | | | |
| Insurance — 2.4% | | | | | | | | |
Aflac, Inc. | | | 29,138 | | | | 1,644,257 | |
Aon Corp. | | | 30,353 | | | | 1,396,542 | |
The Travelers Cos., Inc. | | | 13,666 | | | | 761,333 | |
| | | | | | | | |
| | | | | | | 3,802,132 | |
| | | | | | | | |
| Internet — 2.3% | | | | | | | | |
Google, Inc. Class A (a) | | | 4,585 | | | | 2,723,353 | |
VeriSign, Inc. | | | 27,772 | | | | 907,311 | |
| | | | | | | | |
| | | | | | | 3,630,664 | |
| | | | | | | | |
| Leisure Time — 0.4% | | | | | | | | |
Carnival Corp. | | | 14,461 | | | | 666,797 | |
| | | | | | | | |
| Lodging — 0.3% | | | | | | | | |
Starwood Hotels & Resorts Worldwide, Inc. | | | 8,515 | | | | 517,542 | |
| | | | | | | | |
The accompanying notes are an integral part of the financial statements.
60
MML Growth & Income Fund – Portfolio of Investments (Continued)
| | | | | | | | |
| | | Number of
Shares | | | Value | |
| Manufacturing — 3.7% | | | | | | | | |
3M Co. | | | 26,173 | | | $ | 2,258,730 | |
Danaher Corp. | | | 75,552 | | | | 3,563,788 | |
| | | | | | | | |
| | | | | | | 5,822,518 | |
| | | | | | | | |
| Media — 2.2% | | | | | | | | |
The Walt Disney Co. | | | 92,217 | | | | 3,459,060 | |
| | | | | | | | |
| Oil & Gas — 8.7% | | | | | | | | |
Chevron Corp. | | | 30,241 | | | | 2,759,491 | |
EOG Resources, Inc. | | | 15,140 | | | | 1,383,948 | |
Exxon Mobil Corp. | | | 19,309 | | | | 1,411,874 | |
Hess Corp. | | | 25,432 | | | | 1,946,565 | |
Noble Corp. | | | 27,850 | | | | 996,195 | |
Noble Energy, Inc. | | | 17,259 | | | | 1,485,655 | |
Occidental Petroleum Corp. | | | 20,591 | | | | 2,019,977 | |
QEP Resources, Inc. | | | 29,991 | | | | 1,088,973 | |
Questar Corp. | | | 30,281 | | | | 527,192 | |
| | | | | | | | |
| | | | | | | 13,619,870 | |
| | | | | | | | |
| Oil & Gas Services — 3.7% | | | | | | | | |
Halliburton Co. | | | 46,059 | | | | 1,880,589 | |
National Oilwell Varco, Inc. | | | 26,906 | | | | 1,809,429 | |
Schlumberger Ltd. | | | 25,327 | | | | 2,114,804 | |
| | | | | | | | |
| | | | | | | 5,804,822 | |
| | | | | | | | |
| Pharmaceuticals — 3.6% | | | | | | | | |
Abbott Laboratories | | | 59,315 | | | | 2,841,782 | |
Gilead Sciences, Inc. (a) | | | 38,634 | | | | 1,400,096 | |
Teva Pharmaceutical Industries Ltd. Sponsored ADR (Israel) | | | 27,408 | | | | 1,428,779 | |
| | | | | | | | |
| | | | | | | 5,670,657 | |
| | | | | | | | |
| Retail — 4.7% | | | | | | | | |
Kohl’s Corp. (a) | | | 33,983 | | | | 1,846,636 | |
Nordstrom, Inc. | | | 17,361 | | | | 735,759 | |
Staples, Inc. | | | 72,263 | | | | 1,645,429 | |
Target Corp. | | | 50,988 | | | | 3,065,908 | |
| | | | | | | | |
| | | | | | | 7,293,732 | |
| | | | | | | | |
| Semiconductors — 2.4% | | | | | | | | |
Intel Corp. | | | 65,541 | | | | 1,378,327 | |
Microchip Technology, Inc. | | | 51,089 | | | | 1,747,755 | |
Samsung Electronics Co. Ltd. (b) | | | 1,486 | | | | 625,945 | |
| | | | | | | | |
| | | | | | | 3,752,027 | |
| | | | | | | | |
| Software — 2.8% | | | | | | | | |
Oracle Corp. | | | 140,300 | | | | 4,391,390 | |
| | | | | | | | |
| Telecommunications — 4.1% | | | | | | | | |
American Tower Corp. Class A (a) | | | 30,082 | | | | 1,553,435 | |
AT&T, Inc. | | | 52,394 | | | | 1,539,336 | |
Cisco Systems, Inc. (a) | | | 168,715 | | | | 3,413,104 | |
| | | | | | | | |
| | | | | | | 6,505,875 | |
| | | | | | | | |
| | | | | | | | |
| | | Number of
Shares | | | Value | |
| Transportation — 1.4% | | | | | | | | |
Canadian National Railway Co. | | | 23,189 | | | $ | 1,541,373 | |
Expeditors International of Washington, Inc. | | | 11,993 | | | | 654,818 | |
| | | | | | | | |
| | | | | | | 2,196,191 | |
| | | | | | | | |
| | |
TOTAL COMMON STOCK
(Cost $131,927,780) | | | | | | | 155,634,604 | |
| | | | | | | | |
| | |
TOTAL EQUITIES
(Cost $131,927,780) | | | | | | | 155,634,604 | |
| | | | | | | | |
| | |
TOTAL LONG-TERM INVESTMENTS
(Cost $131,927,780) | | | | | | | 155,634,604 | |
| | | | | | | | |
| | |
| | | Principal
Amount | | | | |
| |
| SHORT-TERM INVESTMENTS — 0.9% | | | | | |
| Repurchase Agreement — 0.9% | | | | | | | | |
State Street Bank & Trust Co. Repurchase Agreement, dated 12/31/10, 0.010%, due 1/03/11 (c) | | $ | 1,367,913 | | | | 1,367,913 | |
| | | | | | | | |
| Time Deposits — 0.0% | | | | | | | | |
Euro Time Deposit
0.010% 1/03/11 | | | 4,886 | | | | 4,886 | |
| | | | | | | | |
| | |
TOTAL SHORT-TERM INVESTMENTS
(Cost $1,372,799) | | | | | | | 1,372,799 | |
| | | | | | | | |
| | |
TOTAL INVESTMENTS — 100.1%
(Cost $133,300,579) (d) | | | | | | | 157,007,403 | |
| | |
| Other Assets/(Liabilities) — (0.1)% | | | | | | | (156,815 | ) |
| | | | | | | | |
| | |
| NET ASSETS — 100.0% | | | | | | $ | 156,850,588 | |
| | | | | | | | |
Notes to Portfolio of Investments
| ADR | American Depositary Receipt |
| (a) | Non-income producing security. |
| (b) | Security exempt from registration under Regulation S of the Securities Act of 1933, which exempts from registration securities offered and sold outside the United States. Security may not be offered or sold in the United States except pursuant to an exemption from, or in a transaction not subject to, the registration requirements of the Securities Act of 1933. At December 31, 2010, these securities amounted to a value of $625,945 or 0.40% of net assets. |
| (c) | Maturity value of $1,367,915. Collateralized by U.S. Government Agency obligations with a rate of 2.486%, maturity date of 3/01/34, and an aggregate market value, including accrued interest, of $1,395,375. |
| (d) | See Note 6 for aggregate cost for federal tax purposes. |
The accompanying notes are an integral part of the financial statements.
61
MML Income & Growth Fund – Portfolio of Investments
December 31, 2010
| | | | | | | | |
| | | Number of
Shares | | | Value | |
| EQUITIES — 99.8% | | | | | | | | |
| | |
| COMMON STOCK — 99.8% | | | | | | | | |
| Aerospace & Defense — 5.8% | | | | | | | | |
General Dynamics Corp. | | | 12,600 | | | $ | 894,096 | |
Northrop Grumman Corp. | | | 13,500 | | | | 874,530 | |
Raytheon Co. | | | 23,500 | | | | 1,088,990 | |
Rockwell Collins, Inc. | | | 3,900 | | | | 227,214 | |
United Technologies Corp. | | | 17,300 | | | | 1,361,856 | |
| | | | | | | | |
| | | | | | | 4,446,686 | |
| | | | | | | | |
| Agriculture — 2.5% | | | | | | | | |
Altria Group, Inc. | | | 14,100 | | | | 347,142 | |
Lorillard, Inc. | | | 3,900 | | | | 320,034 | |
Philip Morris International, Inc. | | | 21,900 | | | | 1,281,807 | |
| | | | | | | | |
| | | | | | | 1,948,983 | |
| | | | | | | | |
| Apparel — 1.0% | | | | | | | | |
VF Corp. | | | 8,500 | | | | 732,530 | |
| | | | | | | | |
| Automotive & Parts — 0.3% | | | | | | | | |
Johnson Controls, Inc. | | | 7,000 | | | | 267,400 | |
| | | | | | | | |
| Banks — 8.5% | | | | | | | | |
Bank of America Corp. | | | 64,600 | | | | 861,764 | |
Bank of New York Mellon Corp. | | | 9,100 | | | | 274,820 | |
Bank of Nova Scotia | | | 17,900 | | | | 1,027,536 | |
National Bank of Canada | | | 13,700 | | | | 943,725 | |
Royal Bank of Canada | | | 6,600 | | | | 347,152 | |
The Toronto-Dominion Bank | | | 7,800 | | | | 582,236 | |
U.S. Bancorp | | | 32,400 | | | | 873,828 | |
Wells Fargo & Co. | | | 51,000 | | | | 1,580,490 | |
| | | | | | | | |
| | | | | | | 6,491,551 | |
| | | | | | | | |
| Beverages — 2.5% | | | | | | | | |
The Coca-Cola Co. | | | 16,600 | | | | 1,091,782 | |
Diageo PLC | | | 43,500 | | | | 806,003 | |
| | | | | | | | |
| | | | | | | 1,897,785 | |
| | | | | | | | |
| Chemicals — 3.4% | | | | | | | | |
The Dow Chemical Co. | | | 7,900 | | | | 269,706 | |
E.I. du Pont de Nemours & Co. | | | 27,400 | | | | 1,366,712 | |
Olin Corp. | | | 18,700 | | | | 383,724 | |
Praxair, Inc. | | | 6,500 | | | | 620,555 | |
| | | | | | | | |
| | | | | | | 2,640,697 | |
| | | | | | | | |
| Coal — 0.6% | | | | | | | | |
CONSOL Energy, Inc. | | | 4,300 | | | | 209,582 | |
Peabody Energy Corp. | | | 3,700 | | | | 236,726 | |
| | | | | | | | |
| | | | | | | 446,308 | |
| | | | | | | | |
| Computers — 2.6% | | | | | | | | |
Hewlett-Packard Co. | | | 16,000 | | | | 673,600 | |
International Business Machines Corp. | | | 8,900 | | | | 1,306,164 | |
| | | | | | | | |
| | | | | | | 1,979,764 | |
| | | | | | | | |
| | | | | | | | |
| | | Number of
Shares | | | Value | |
| Cosmetics & Personal Care — 1.9% | | | | | | | | |
Avon Products, Inc. | | | 11,700 | | | $ | 340,002 | |
The Procter & Gamble Co. | | | 17,000 | | | | 1,093,610 | |
| | | | | | | | |
| | | | | | | 1,433,612 | |
| | | | | | | | |
| Diversified Financial — 3.5% | | | | | | | | |
American Express Co. | | | 12,300 | | | | 527,916 | |
JP Morgan Chase & Co. | | | 50,200 | | | | 2,129,484 | |
| | | | | | | | |
| | | | | | | 2,657,400 | |
| | | | | | | | |
| Electric — 6.3% | | | | | | | | |
American Electric Power Co., Inc. | | | 11,100 | | | | 399,378 | |
Consolidated Edison, Inc. | | | 4,300 | | | | 213,151 | |
Dominion Resources, Inc. | | | 16,000 | | | | 683,520 | |
Duke Energy Corp. | | | 19,200 | | | | 341,952 | |
Entergy Corp. | | | 6,100 | | | | 432,063 | |
FirstEnergy Corp. | | | 5,000 | | | | 185,100 | |
ITC Holdings Corp. | | | 3,100 | | | | 192,138 | |
NextEra Energy, Inc. | | | 9,000 | | | | 467,910 | |
Northeast Utilities | | | 6,000 | | | | 191,280 | |
PG&E Corp. | | | 4,900 | | | | 234,416 | |
PPL Corp. | | | 9,600 | | | | 252,672 | |
Public Service Enterprise Group, Inc. | | | 17,000 | | | | 540,770 | |
The Southern Co. | | | 13,400 | | | | 512,282 | |
Wisconsin Energy Corp. | | | 3,800 | | | | 223,668 | |
| | | | | | | | |
| | | | | | | 4,870,300 | |
| | | | | | | | |
| Foods — 3.7% | | | | | | | | |
General Mills, Inc. | | | 20,400 | | | | 726,036 | |
H.J. Heinz Co. | | | 10,800 | | | | 534,168 | |
Kraft Foods, Inc. Class A | | | 18,500 | | | | 582,935 | |
Unilever NV NY Shares | | | 32,900 | | | | 1,033,060 | |
| | | | | | | | |
| | | | | | | 2,876,199 | |
| | | | | | | | |
| Forest Products & Paper — 1.1% | | | | | | | | |
MeadWestvaco Corp. | | | 14,800 | | | | 387,168 | |
Temple-Inland, Inc. | | | 13,000 | | | | 276,120 | |
Weyerhaeuser Co. | | | 8,400 | | | | 159,012 | |
| | | | | | | | |
| | | | | | | 822,300 | |
| | | | | | | | |
| Gas — 0.4% | | | | | | | | |
Sempra Energy | | | 5,700 | | | | 299,136 | |
| | | | | | | | |
| Health Care – Products — 0.9% | | | | | | | | |
Johnson & Johnson | | | 11,800 | | | | 729,830 | |
| | | | | | | | |
| Household Products — 1.7% | | | | | | | | |
The Clorox Co. | | | 10,700 | | | | 677,096 | |
Kimberly-Clark Corp. | | | 9,700 | | | | 611,488 | |
| | | | | | | | |
| | | | | | | 1,288,584 | |
| | | | | | | | |
| Insurance — 3.5% | | | | | | | | |
The Chubb Corp. | | | 14,800 | | | | 882,672 | |
Prudential Financial, Inc. | | | 11,200 | | | | 657,552 | |
The Travelers Cos., Inc. | | | 21,300 | | | | 1,186,623 | |
| | | | | | | | |
| | | | | | | 2,726,847 | |
| | | | | | | | |
The accompanying notes are an integral part of the financial statements.
62
MML Income & Growth Fund – Portfolio of Investments (Continued)
| | | | | | | | |
| | | Number of
Shares | | | Value | |
| Machinery – Construction & Mining — 2.3% | | | | | |
Caterpillar, Inc. | | | 18,700 | | | $ | 1,751,442 | |
| | | | | | | | |
| Machinery – Diversified — 2.7% | | | | | | | | |
Deere & Co. | | | 21,300 | | | | 1,768,965 | |
Rockwell Automation, Inc. | | | 4,500 | | | | 322,695 | |
| | | | | | | | |
| | | | | | | 2,091,660 | |
| | | | | | | | |
| Manufacturing — 3.3% | | | | | | | | |
3M Co. | | | 9,500 | | | | 819,850 | |
General Electric Co. | | | 70,900 | | | | 1,296,761 | |
Honeywell International, Inc. | | | 7,900 | | | | 419,964 | |
| | | | | | | | |
| | | | | | | 2,536,575 | |
| | | | | | | | |
| Media — 0.7% | | | | | | | | |
Comcast Corp. Special Class A | | | 26,400 | | | | 549,384 | |
| | | | | | | | |
| Mining — 6.2% | | | | | | | | |
Barrick Gold Corp. | | | 11,400 | | | | 608,795 | |
BHP Billiton Ltd. | | | 52,200 | | | | 2,428,173 | |
Cameco Corp. | | | 8,500 | | | | 344,375 | |
Rio Tinto Ltd. | | | 9,600 | | | | 838,968 | |
Southern Copper Corp. | | | 10,800 | | | | 526,392 | |
| | | | | | | | |
| | | | | | | 4,746,703 | |
| | | | | | | | |
| Oil & Gas — 11.1% | | | | | | | | |
Chevron Corp. | | | 25,500 | | | | 2,326,875 | |
ConocoPhillips | | | 12,600 | | | | 858,060 | |
EQT Corp. | | | 11,800 | | | | 529,112 | |
Exxon Mobil Corp. | | | 23,500 | | | | 1,718,320 | |
Marathon Oil Corp. | | | 18,200 | | | | 673,946 | |
Murphy Oil Corp. | | | 2,100 | | | | 156,555 | |
Occidental Petroleum Corp. | | | 8,900 | | | | 873,090 | |
Total SA Sponsored ADR (France) | | | 26,500 | | | | 1,417,220 | |
| | | | | | | | |
| | | | | | | 8,553,178 | |
| | | | | | | | |
| Oil & Gas Services — 0.5% | | | | | | | | |
Schlumberger Ltd. | | | 4,700 | | | | 392,450 | |
| | | | | | | | |
| Packaging & Containers — 0.3% | | | | | | | | |
Packaging Corporation of America | | | 9,000 | | | | 232,560 | |
| | | | | | | | |
| Pharmaceuticals — 5.6% | | | | | | | | |
Abbott Laboratories | | | 12,800 | | | | 613,248 | |
Bristol-Myers Squibb Co. | | | 43,300 | | | | 1,146,584 | |
Mead Johnson Nutrition Co. | | | 11,200 | | | | 697,200 | |
Merck & Co., Inc. | | | 25,800 | | | | 929,832 | |
Pfizer, Inc. | | | 50,800 | | | | 889,508 | |
| | | | | | | | |
| | | | | | | 4,276,372 | |
| | | | | | | | |
| Pipelines — 1.8% | | | | | | | | |
Enbridge, Inc. | | | 16,900 | | | | 956,030 | |
Spectra Energy Corp. | | | 15,700 | | | | 392,343 | |
| | | | | | | | |
| | | | | | | 1,348,373 | |
| | | | | | | | |
| Retail — 4.1% | | | | | | | | |
The Home Depot, Inc. | | | 17,700 | | | | 620,562 | |
Limited Brands, Inc. | | | 17,400 | | | | 534,702 | |
| | | | | | | | |
| | | Number of
Shares | | | Value | |
McDonald’s Corp. | | | 16,500 | | | $ | 1,266,540 | |
Wal-Mart Stores, Inc. | | | 13,300 | | | | 717,269 | |
| | | | | | | | |
| | | | | | | 3,139,073 | |
| | | | | | | | |
| Semiconductors — 0.9% | | | | | | | | |
Intel Corp. | | | 31,200 | | | | 656,136 | |
| | | | | | | | |
| Software — 0.8% | | | | | | | | |
Microsoft Corp. | | | 21,300 | | | | 594,696 | |
| | | | | | | | |
| Telecommunications — 6.3% | | | | | | | | |
AT&T, Inc. | | | 43,600 | | | | 1,280,968 | |
BCE, Inc. | | | 8,700 | | | | 308,502 | |
CenturyLink, Inc. | | | 9,700 | | | | 447,849 | |
Qwest Communications International, Inc. | | | 150,100 | | | | 1,142,261 | |
Verizon Communications, Inc. | | | 25,900 | | | | 926,702 | |
Vodafone Group PLC Sponsored ADR (United Kingdom) | | | 15,200 | | | | 401,736 | |
Windstream Corp. | | | 23,900 | | | | 333,166 | |
| | | | | | | | |
| | | | | | | 4,841,184 | |
| | | | | | | | |
| Toys, Games & Hobbies — 0.5% | | | | | | | | |
Mattel, Inc. | | | 15,600 | | | | 396,708 | |
| | | | | | | | |
| Transportation — 1.9% | | | | | | | | |
Canadian National Railway Co. | | | 13,200 | | | | 877,404 | |
United Parcel Service, Inc. Class B | | | 8,500 | | | | 616,930 | |
| | | | | | | | |
| | | | | | | 1,494,334 | |
| | | | | | | | |
| Water — 0.6% | | | | | | | | |
American Water Works Co., Inc. | | | 18,300 | | | | 462,807 | |
| | | | | | | | |
| | |
TOTAL COMMON STOCK
(Cost $65,994,827) | | | | | | | 76,619,547 | |
| | | | | | | | |
| | |
TOTAL EQUITIES
(Cost $65,994,827) | | | | | | | 76,619,547 | |
| | | | | | | | |
| | |
| TOTAL LONG-TERM INVESTMENTS (Cost $65,994,827) | | | | | | | 76,619,547 | |
| | | | | | | | |
| | |
| | | Principal
Amount | | | | |
|
| SHORT-TERM INVESTMENTS — 0.1% | |
| Repurchase Agreement — 0.1% | | | | | | | | |
State Street Bank & Trust Co. Repurchase Agreement, dated 12/31/10, 0.010%, due 1/03/11 (a) | | $ | 47,384 | | | | 47,384 | |
| | | | | | | | |
The accompanying notes are an integral part of the financial statements.
63
MML Income & Growth Fund – Portfolio of Investments (Continued)
| | | | | | | | |
| | | Principal
Amount | | | Value | |
| Time Deposits — 0.0% | | | | | | | | |
Euro Time Deposit
0.010% 1/03/11 | | $ | 3,045 | | | $ | 3,045 | |
| | | | | | | | |
| | |
TOTAL SHORT-TERM INVESTMENTS
(Cost $50,429) | | | | | | | 50,429 | |
| | | | | | | | |
| | |
| TOTAL INVESTMENTS — 99.9% (Cost $66,045,256) (b) | | | | | | | 76,669,976 | |
| | | | | | | | |
| | |
| Other Assets/(Liabilities) — 0.1% | | | | | | | 72,044 | |
| | | | | | | | |
| | |
| NET ASSETS — 100.0% | | | | | | $ | 76,742,020 | |
| | | | | | | | |
Notes to Portfolio of Investments
| ADR | American Depositary Receipt |
| (a) | Maturity value of $47,384. Collateralized by U.S. Government Agency obligations with a rate of 4.000%, maturity date of 9/25/39, and an aggregate market value, including accrued interest, of $50,476. |
| (b) | See Note 6 for aggregate cost for federal tax purposes. |
The accompanying notes are an integral part of the financial statements.
64
MML Large Cap Growth Fund – Portfolio of Investments
December 31, 2010
| | | | | | | | |
| | | Number of
Shares | | | Value | |
| EQUITIES — 98.5% | | | | | | | | |
| |
| COMMON STOCK — 98.5% | | | | | |
| Apparel — 1.3% | | | | | | | | |
Nike, Inc. Class B | | | 26,010 | | | $ | 2,221,774 | |
| | | | | | | | |
| Auto Manufacturers — 2.8% | | | | | |
Ford Motor Co. (a) | | | 118,230 | | | | 1,985,082 | |
Paccar, Inc. | | | 47,430 | | | | 2,723,430 | |
| | | | | | | | |
| | | | | | | 4,708,512 | |
| | | | | | | | |
| Automotive & Parts — 0.9% | | | | | |
TRW Automotive Holdings Corp. (a) | | | 28,170 | | | | 1,484,559 | |
| | | | | | | | |
| Beverages — 4.3% | | | | | | | | |
Anheuser-Busch InBev NV Sponsored ADR (Belgium) | | | 39,290 | | | | 2,243,066 | |
The Coca-Cola Co. | | | 51,870 | | | | 3,411,490 | |
Coca-Cola Enterprises, Inc. | | | 63,830 | | | | 1,597,665 | |
| | | | | | | | |
| | | | | | | 7,252,221 | |
| | | | | | | | |
| Biotechnology — 2.0% | | | | | | | | |
Alexion Pharmaceuticals, Inc. (a) | | | 10,890 | | | | 877,189 | |
Celgene Corp. (a) | | | 40,990 | | | | 2,424,149 | |
| | | | | | | | |
| | | | | | | 3,301,338 | |
| | | | | | | | |
| Chemicals — 2.1% | | | | | | | | |
FMC Corp. | | | 18,500 | | | | 1,477,965 | |
Praxair, Inc. | | | 21,730 | | | | 2,074,563 | |
| | | | | | | | |
| | | | | | | 3,552,528 | |
| | | | | | | | |
| Coal — 0.8% | | | | | | | | |
Walter Energy, Inc. | | | 10,130 | | | | 1,295,019 | |
| | | | | | | | |
| Commercial Services — 1.0% | | | | | |
Visa, Inc. Class A | | | 23,630 | | | | 1,663,079 | |
| | | | | | | | |
| Computers — 11.2% | | | | | | | | |
Apple, Inc. (a) | | | 28,690 | | | | 9,254,247 | |
Cognizant Technology Solutions Corp. Class A (a) | | | 20,960 | | | | 1,536,158 | |
EMC Corp. (a) | | | 133,910 | | | | 3,066,539 | |
Hewlett-Packard Co. | | | 66,760 | | | | 2,810,596 | |
NetApp, Inc. (a) | | | 37,070 | | | | 2,037,367 | |
| | | | | | | | |
| | | | | | | 18,704,907 | |
| | | | | | | | |
| Diversified Financial — 6.1% | | | | | |
American Express Co. | | | 57,040 | | | | 2,448,157 | |
BlackRock, Inc. | | | 4,800 | | | | 914,784 | |
The Charles Schwab Corp. | | | 25,940 | | | | 443,833 | |
Franklin Resources, Inc. | | | 12,830 | | | | 1,426,824 | |
IntercontinentalExchange, Inc. (a) | | | 18,750 | | | | 2,234,063 | |
T. Rowe Price Group, Inc. | | | 42,870 | | | | 2,766,830 | |
| | | | | | | | |
| | | | | | | 10,234,491 | |
| | | | | | | | |
| Electrical Components & Equipment — 2.1% | |
AMETEK, Inc. | | | 47,430 | | | | 1,861,627 | |
Emerson Electric Co. | | | 28,050 | | | | 1,603,619 | |
| | | | | | | | |
| | | | | | | 3,465,246 | |
| | | | | | | | |
| | | | | | | | |
| | | Number of
Shares | | | Value | |
| Electronics — 0.7% | | | | | | | | |
Agilent Technologies, Inc. (a) | | | 27,960 | | | $ | 1,158,383 | |
| | | | | | | | |
| Health Care – Products — 1.3% | | | | | |
ResMed, Inc. (a) | | | 26,700 | | | | 924,888 | |
Varian Medical Systems, Inc. (a) | | | 17,380 | | | | 1,204,086 | |
| | | | | | | | |
| | | | | | | 2,128,974 | |
| | | | | | | | |
| Household Products — 0.5% | | | | | |
Church & Dwight Co., Inc. | | | 12,720 | | | | 877,934 | |
| | | | | | | | |
| Internet — 8.9% | | | | | | | | |
Amazon.com, Inc. (a) | | | 29,280 | | | | 5,270,400 | |
Check Point Software Technologies Ltd. (a) | | | 55,460 | | | | 2,565,580 | |
F5 Networks, Inc. (a) | | | 5,290 | | | | 688,546 | |
Google, Inc. Class A (a) | | | 8,260 | | | | 4,906,192 | |
Priceline.com, Inc. (a) | | | 3,510 | | | | 1,402,421 | |
| | | | | | | | |
| | | | | | | 14,833,139 | |
| | | | | | | | |
| Lodging — 1.7% | | | | | | | | |
Marriott International, Inc. Class A | | | 68,060 | | | | 2,827,212 | |
| | | | | | | | |
| Machinery – Diversified — 7.3% | | | | | |
Cummins, Inc. | | | 33,500 | | | | 3,685,335 | |
Deere & Co. | | | 50,770 | | | | 4,216,449 | |
Flowserve Corp. | | | 20,670 | | | | 2,464,277 | |
Rockwell Automation, Inc. | | | 25,120 | | | | 1,801,355 | |
| | | | | | | | |
| | | | | | | 12,167,416 | |
| | | | | | | | |
| Media — 2.6% | | | | | | | | |
Scripps Networks Interactive Class A | | | 41,050 | | | | 2,124,338 | |
The Walt Disney Co. | | | 61,240 | | | | 2,297,112 | |
| | | | | | | | |
| | | | | | | 4,421,450 | |
| | | | | | | | |
| Metal Fabricate & Hardware — 2.0% | | | | | |
Precision Castparts Corp. | | | 24,070 | | | | 3,350,785 | |
| | | | | | | | |
| Mining — 2.0% | | | | | | | | |
Freeport-McMoRan Copper & Gold, Inc. | | | 14,740 | | | | 1,770,127 | |
Goldcorp, Inc. | | | 35,430 | | | | 1,629,071 | |
| | | | | | | | |
| | | | | | | 3,399,198 | |
| | | | | | | | |
| Oil & Gas — 3.8% | | | | | | | | |
Concho Resources, Inc. (a) | | | 25,060 | | | | 2,197,010 | |
Noble Energy, Inc. | | | 13,120 | | | | 1,129,370 | |
Occidental Petroleum Corp. | | | 31,800 | | | | 3,119,580 | |
| | | | | | | | |
| | | | | | | 6,445,960 | |
| | | | | | | | |
| Oil & Gas Services — 4.2% | | | | | |
Halliburton Co. | | | 87,580 | | | | 3,575,891 | |
Schlumberger Ltd. | | | 41,340 | | | | 3,451,890 | |
| | | | | | | | |
| | | | | | | 7,027,781 | |
| | | | | | | | |
| Pharmaceuticals — 5.0% | | | | | | | | |
Allergan, Inc. | | | 25,820 | | | | 1,773,060 | |
AmerisourceBergen Corp. | | | 66,460 | | | | 2,267,615 | |
The accompanying notes are an integral part of the financial statements.
65
MML Large Cap Growth Fund – Portfolio of Investments (Continued)
| | | | | | | | |
| | | Number of
Shares | | | Value | |
Express Scripts, Inc. (a) | | | 27,290 | | | $ | 1,475,025 | |
Shire PLC Sponsored ADR (United Kingdom) | | | 19,680 | | | | 1,424,438 | |
Teva Pharmaceutical Industries Ltd. Sponsored ADR (Israel) | | | 28,230 | | | | 1,471,630 | |
| | | | | | | | |
| | | | | | | 8,411,768 | |
| | | | | | | | |
| Retail — 6.2% | | | | | | | | |
Costco Wholesale Corp. | | | 24,950 | | | | 1,801,639 | |
Kohl’s Corp. (a) | | | 30,800 | | | | 1,673,672 | |
Limited Brands, Inc. | | | 42,100 | | | | 1,293,733 | |
McDonald’s Corp. | | | 20,740 | | | | 1,592,002 | |
Target Corp. | | | 43,920 | | | | 2,640,910 | |
Tiffany & Co. | | | 22,080 | | | | 1,374,922 | |
| | | | | | | | |
| | | | | | | 10,376,878 | |
| | | | | | | | |
| Semiconductors — 2.2% | | | | | | | | |
Broadcom Corp. Class A | | | 46,440 | | | | 2,022,462 | |
Marvell Technology Group Ltd. (a) | | | 87,490 | | | | 1,622,940 | |
| | | | | | | | |
| | | | | | | 3,645,402 | |
| | | | | | | | |
| Software — 5.7% | | | | | | | | |
Autodesk, Inc. (a) | | | 59,090 | | | | 2,257,238 | |
Citrix Systems, Inc. (a) | | | 25,530 | | | | 1,746,507 | |
Intuit, Inc. (a) | | | 17,510 | | | | 863,243 | |
Oracle Corp. | | | 147,510 | | | | 4,617,063 | |
| | | | | | | | |
| | | | | | | 9,484,051 | |
| | | | | | | | |
| Telecommunications — 5.4% | | | | | |
American Tower Corp. Class A (a) | | | 50,770 | | | | 2,621,763 | |
Cisco Systems, Inc. (a) | | | 111,260 | | | | 2,250,790 | |
Juniper Networks, Inc. (a) | | | 68,630 | | | | 2,533,820 | |
QUALCOMM, Inc. | | | 33,170 | | | | 1,641,583 | |
| | | | | | | | |
| | | | | | | 9,047,956 | |
| | | | | | | | |
| Transportation — 4.4% | | | | | | | | |
CSX Corp. | | | 20,110 | | | | 1,299,307 | |
Expeditors International of Washington, Inc. | | | 28,510 | | | | 1,556,646 | |
FedEx Corp. | | | 36,950 | | | | 3,436,720 | |
United Continental Holdings, Inc. (a) | | | 45,320 | | | | 1,079,522 | |
| | | | | | | | |
| | | | | | | 7,372,195 | |
| | | | | | | | |
| | |
TOTAL COMMON STOCK
(Cost $140,118,107) | | | | | | | 164,860,156 | |
| | | | | | | | |
| | |
TOTAL EQUITIES
(Cost $140,118,107) | | | | | | | 164,860,156 | |
| | | | | | | | |
| | |
TOTAL LONG-TERM INVESTMENTS
(Cost $140,118,107) | | | | | | | 164,860,156 | |
| | | | | | | | |
| | | | | | | | |
| | | Principal
Amount | | | Value | |
|
| SHORT-TERM INVESTMENTS — 1.2% | |
| Repurchase Agreement — 1.2% | | | | | |
State Street Bank & Trust Co. Repurchase Agreement, dated 12/31/10, 0.010%, due 1/03/11 (b) | | $ | 1,930,204 | | | $ | 1,930,204 | |
| | | | | | | | |
| | |
TOTAL SHORT-TERM INVESTMENTS
(Cost $1,930,204) | | | | | | | 1,930,204 | |
| | | | | | | | |
| | |
TOTAL INVESTMENTS — 99.7%
(Cost $142,048,311) (c) | | | | | | | 166,790,360 | |
| | |
| Other Assets/(Liabilities) — 0.3% | | | | | | | 525,308 | |
| | | | | | | | |
| | |
| NET ASSETS — 100.0% | | | | | | $ | 167,315,668 | |
| | | | | | | | |
Notes to Portfolio of Investments
| ADR | American Depositary Receipt |
| (a) | Non-income producing security. |
| (b) | Maturity value of $1,930,205. Collateralized by U.S. Government Agency obligations with a rate of 4.000%, maturity date of 9/25/39, and an aggregate market value, including accrued interest, of $1,972,454. |
| (c) | See Note 6 for aggregate cost for federal tax purposes. |
The accompanying notes are an integral part of the financial statements.
66
MML Mid Cap Growth Fund – Portfolio of Investments
December 31, 2010
| | | | | | | | |
| | | Number of
Shares | | | Value | |
| EQUITIES — 96.5% | | | | | | | | |
| | |
| COMMON STOCK — 96.5% | | | | | | | | |
| Advertising — 1.2% | | | | | | | | |
Lamar Advertising Co. Class A (a) | | | 104,000 | | | $ | 4,143,360 | |
| | | | | | | | |
| Aerospace & Defense — 1.5% | | | | | |
Alliant Techsystems, Inc. (a) | | | 10,000 | | | | 744,300 | |
Goodrich Corp. | | | 24,000 | | | | 2,113,680 | |
Rockwell Collins, Inc. | | | 43,000 | | | | 2,505,180 | |
| | | | | | | | |
| | | | | | | 5,363,160 | |
| | | | | | | | |
| Automotive & Parts — 1.0% | | | | | |
WABCO Holdings, Inc. (a) | | | 57,000 | | | | 3,473,010 | |
| | | | | | | | |
| Banks — 1.6% | | | | | | | | |
Fifth Third Bancorp | | | 79,000 | | | | 1,159,720 | |
First Republic Bank/San Francisco CA (a) | | | 5,000 | | | | 145,600 | |
Popular, Inc. (a) | | | 377,000 | | | | 1,183,780 | |
SunTrust Banks, Inc. | | | 43,000 | | | | 1,268,930 | |
TCF Financial Corp. | | | 121,000 | | | | 1,792,010 | |
| | | | | | | | |
| | | | | | | 5,550,040 | |
| | | | | | | | |
| Biotechnology — 2.8% | | | | | | | | |
Alexion Pharmaceuticals, Inc. (a) | �� | | 22,000 | | | | 1,772,100 | |
Human Genome Sciences, Inc. (a) | | | 86,000 | | | | 2,054,540 | |
Illumina, Inc. (a) | | | 48,000 | | | | 3,040,320 | |
Regeneron Pharmaceuticals, Inc. (a) | | | 43,000 | | | | 1,411,690 | |
Vertex Pharmaceuticals, Inc. (a) | | | 44,000 | | | | 1,541,320 | |
| | | | | | | | |
| | | | | | | 9,819,970 | |
| | | | | | | | |
| Coal — 2.2% | | | | | | | | |
Alpha Natural Resources, Inc. (a) | | | 27,000 | | | | 1,620,810 | |
CONSOL Energy, Inc. | | | 82,000 | | | | 3,996,680 | |
Peabody Energy Corp. | | | 35,000 | | | | 2,239,300 | |
| | | | | | | | |
| | | | | | | 7,856,790 | |
| | | | | | | | |
| Commercial Services — 7.3% | | | | | |
Booz Allen Hamilton Holding Corp. (a) | | | 5,000 | | | | 97,150 | |
Gartner, Inc. (a) | | | 87,000 | | | | 2,888,400 | |
Global Payments, Inc. | | | 92,000 | | | | 4,251,320 | |
Hertz Global Holdings, Inc. (a) | | | 276,000 | | | | 3,999,240 | |
Manpower, Inc. | | | 36,000 | | | | 2,259,360 | |
Quanta Services, Inc. (a) | | | 172,000 | | | | 3,426,240 | |
Robert Half International, Inc. | | | 100,000 | | | | 3,060,000 | |
Verisk Analytics, Inc. Class A (a) | | | 54,000 | | | | 1,840,320 | |
Western Union Co. | | | 191,000 | | | | 3,546,870 | |
| | | | | | | | |
| | | | | | | 25,368,900 | |
| | | | | | | | |
| Computers — 2.0% | | | | | | | | |
IHS, Inc. Class A (a) | | | 60,000 | | | | 4,823,400 | |
MICROS Systems, Inc. (a) | | | 52,000 | | | | 2,280,720 | |
| | | | | | | | |
| | | | | | | 7,104,120 | |
| | | | | | | | |
| | | | | | | | |
| | | Number of
Shares | | | Value | |
| Distribution & Wholesale — 1.2% | | | | | |
Fastenal Co. | | | 67,000 | | | $ | 4,013,970 | |
| | | | | | | | |
| Diversified Financial — 3.2% | | | | | |
CBOE Holdings, Inc. | | | 41,100 | | | | 939,546 | |
Eaton Vance Corp. | | | 61,000 | | | | 1,844,030 | |
Interactive Brokers Group, Inc. Class A | | | 44,000 | | | | 784,080 | |
IntercontinentalExchange, Inc. (a) | | | 20,000 | | | | 2,383,000 | |
LPL Investment Holdings, Inc. (a) | | | 6,000 | | | | 218,220 | |
NYSE Euronext | | | 70,000 | | | | 2,098,600 | |
TD Ameritrade Holding Corp. | | | 154,000 | | | | 2,924,460 | |
| | | | | | | | |
| | | | | | | 11,191,936 | |
| | | | | | | | |
| Electric — 1.1% | | | | | | | | |
Calpine Corp. (a) | | | 277,000 | | | | 3,695,180 | |
| | | | | | | | |
| Electrical Components & Equipment — 1.8% | |
A123 Systems, Inc. (a) | | | 44,000 | | | | 419,760 | |
AMETEK, Inc. | | | 148,000 | | | | 5,809,000 | |
| | | | | | | | |
| | | | | | | 6,228,760 | |
| | | | | | | | |
| Electronics — 3.6% | | | | | | | | |
Dolby Laboratories, Inc. Class A (a) | | | 52,000 | | | | 3,468,400 | |
FLIR Systems, Inc. (a) | | | 89,000 | | | | 2,647,750 | |
Trimble Navigation Ltd. (a) | | | 78,000 | | | | 3,114,540 | |
Waters Corp. (a) | | | 43,000 | | | | 3,341,530 | |
| | | | | | | | |
| | | | | | | 12,572,220 | |
| | | | | | | | |
| Energy – Alternate Sources — 0.4% | | | | | | | | |
First Solar, Inc. (a) | | | 10,000 | | | | 1,301,400 | |
| | | | | | | | |
| Engineering & Construction — 1.6% | |
Foster Wheeler AG (a) | | | 36,000 | | | | 1,242,720 | |
McDermott International, Inc. (a) | | | 217,000 | | | | 4,489,730 | |
| | | | | | | | |
| | | | | | | 5,732,450 | |
| | | | | | | | |
| Entertainment — 0.2% | | | | | | | | |
Madison Square Garden, Inc. Class A (a) | | | 24,000 | | | | 618,720 | |
| | | | | | | | |
| Foods — 0.9% | | | | | | | | |
Whole Foods Market, Inc. (a) | | | 60,000 | | | | 3,035,400 | |
| | | | | | | | |
| Health Care – Products — 5.4% | |
Bruker Corp. (a) | | | 80,000 | | | | 1,328,000 | |
C.R. Bard, Inc. | | | 35,000 | | | | 3,211,950 | |
CareFusion Corp. (a) | | | 112,000 | | | | 2,878,400 | |
Edwards Lifesciences Corp. (a) | | | 43,000 | | | | 3,476,120 | |
Henry Schein, Inc. (a) | | | 56,000 | | | | 3,437,840 | |
IDEXX Laboratories, Inc. (a) | | | 35,000 | | | | 2,422,700 | |
QIAGEN NV (a) | | | 102,000 | | | | 1,994,100 | |
| | | | | | | | |
| | | | | | | 18,749,110 | |
| | | | | | | | |
| Health Care – Services — 2.6% | | | | | |
Community Health Systems, Inc. (a) | | | 96,000 | | | | 3,587,520 | |
Covance, Inc. (a) | | | 69,000 | | | | 3,547,290 | |
The accompanying notes are an integral part of the financial statements.
67
MML Mid Cap Growth Fund – Portfolio of Investments (Continued)
| | | | | | | | |
| | | Number of
Shares | | | Value | |
Laboratory Corporation of America Holdings (a) | | | 21,000 | | | $ | 1,846,320 | |
| | | | | | | | |
| | | | | | | 8,981,130 | |
| | | | | | | | |
| Insurance — 2.1% | | | | | | | | |
Aon Corp. | | | 61,000 | | | | 2,806,610 | |
HCC Insurance Holdings, Inc. | | | 4,300 | | | | 124,442 | |
Principal Financial Group, Inc. | | | 86,000 | | | | 2,800,160 | |
W.R. Berkley Corp. | | | 64,000 | | | | 1,752,320 | |
| | | | | | | | |
| | | | | | | 7,483,532 | |
| | | | | | | | |
| Internet — 3.7% | | | | | | | | |
Akamai Technologies, Inc. (a) | | | 26,000 | | | | 1,223,300 | |
Equinix, Inc. (a) | | | 20,000 | | | | 1,625,200 | |
Expedia, Inc. | | | 139,000 | | | | 3,487,510 | |
Liberty Media Corp. – Interactive Class A (a) | | | 154,000 | | | | 2,428,580 | |
McAfee, Inc. (a) | | | 52,000 | | | | 2,408,120 | |
Rackspace Hosting, Inc. (a) | | | 41,000 | | | | 1,287,810 | |
WebMD Health Corp. (a) | | | 6,700 | | | | 342,102 | |
| | | | | | | | |
| | | | | | | 12,802,622 | |
| | | | | | | | |
| Lodging — 2.3% | | | | | | | | |
Choice Hotels International, Inc. | | | 40,000 | | | | 1,530,800 | |
Gaylord Entertainment Co. (a) | | | 18,000 | | | | 646,920 | |
Marriott International, Inc. Class A | | | 104,000 | | | | 4,320,160 | |
Wynn Resorts Ltd. | | | 13,000 | | | | 1,349,920 | |
| | | | | | | | |
| | | | | | | 7,847,800 | |
| | | | | | | | |
| Machinery – Diversified — 4.4% | | | | | |
Babcock & Wilcox Co. (a) | | | 114,000 | | | | 2,917,260 | |
Gardner Denver, Inc. | | | 60,000 | | | | 4,129,200 | |
IDEX Corp. | | | 77,000 | | | | 3,012,240 | |
Roper Industries, Inc. | | | 60,000 | | | | 4,585,800 | |
Wabtec Corp. | | | 10,000 | | | | 528,900 | |
| | | | | | | | |
| | | | | | | 15,173,400 | |
| | | | | | | | |
| Manufacturing — 1.0% | | | | | | | | |
Danaher Corp. | | | 18,000 | | | | 849,060 | |
Textron, Inc. | | | 114,000 | | | | 2,694,960 | |
| | | | | | | | |
| | | | | | | 3,544,020 | |
| | | | | | | | |
| Media — 3.7% | | | | | | | | |
Cablevision Systems Corp. Class A | | | 102,000 | | | | 3,451,680 | |
Discovery Communications, Inc. Series A (a) | | | 52,000 | | | | 2,168,400 | |
Discovery Communications, Inc. Series C (a) | | | 61,000 | | | | 2,238,090 | |
FactSet Research Systems, Inc. | | | 35,000 | | | | 3,281,600 | |
Liberty Media Corp. – Starz Series A (a) | | | 26,000 | | | | 1,728,480 | |
| | | | | | | | |
| | | | | | | 12,868,250 | |
| | | | | | | | |
| Mining — 2.1% | | | | | | | | |
Agnico-Eagle Mines Ltd. | | | 60,000 | | | | 4,602,000 | |
Franco-Nevada Corp. | | | 59,000 | | | | 1,972,796 | |
| | | | | | | | |
| | | Number of
Shares | | | Value | |
HudBay Minerals, Inc. | | | 46,000 | | | $ | 839,500 | |
| | | | | | | | |
| | | | | | | 7,414,296 | |
| | | | | | | | |
| Oil & Gas — 4.2% | | | | | | | | |
Atlas Energy, Inc. (a) | | | 56,000 | | | | 2,462,320 | |
Continental Resources, Inc. (a) | | | 31,000 | | | | 1,824,350 | |
EQT Corp. | | | 44,200 | | | | 1,981,928 | |
Range Resources Corp. | | | 77,000 | | | | 3,463,460 | |
SM Energy Co. | | | 35,000 | | | | 2,062,550 | |
Ultra Petroleum Corp. (a) | | | 62,000 | | | | 2,961,740 | |
| | | | | | | | |
| | | | | | | 14,756,348 | |
| | | | | | | | |
| Oil & Gas Services — 1.6% | | | | | |
FMC Technologies, Inc. (a) | | | 39,000 | | | | 3,467,490 | |
Trican Well Service Ltd. | | | 87,500 | | | | 1,771,640 | |
Trican Well Service Ltd. (a) (b) | | | 16,500 | | | | 334,080 | |
| | | | | | | | |
| | | | | | | 5,573,210 | |
| | | | | | | | |
| Pharmaceuticals — 3.7% | | | | | | | | |
BioMarin Pharmaceutical, Inc. (a) | | | 43,000 | | | | 1,157,990 | |
Cephalon, Inc. (a) | | | 52,000 | | | | 3,209,440 | |
DENTSPLY International, Inc. | | | 86,000 | | | | 2,938,620 | |
Elan Corp. PLC Sponsored ADR (Ireland) (a) | | | 131,000 | | | | 750,630 | |
SXC Health Solutions Corp. (a) | | | 14,000 | | | | 600,040 | |
Theravance, Inc. (a) | | | 51,000 | | | | 1,278,570 | |
Valeant Pharmaceuticals International, Inc. | | | 100,000 | | | | 2,829,000 | |
| | | | | | | | |
| | | | | | | 12,764,290 | |
| | | | | | | | |
| Retail — 8.4% | | | | | | | | |
Bed Bath & Beyond, Inc. (a) | | | 36,000 | | | | 1,769,400 | |
CarMax, Inc. (a) | | | 127,000 | | | | 4,048,760 | |
Chipotle Mexican Grill, Inc. (a) | | | 21,000 | | | | 4,465,860 | |
Coach, Inc. | | | 35,000 | | | | 1,935,850 | |
Dollar General Corp. (a) | | | 137,000 | | | | 4,201,790 | |
MSC Industrial Direct Co., Inc. Class A | | | 30,000 | | | | 1,940,700 | |
O’Reilly Automotive, Inc. (a) | | | 55,000 | | | | 3,323,100 | |
Panera Bread Co. Class A (a) | | | 13,000 | | | | 1,315,730 | |
Shoppers Drug Mart Corp. | | | 78,000 | | | | 3,099,769 | |
Starbucks Corp. | | | 51,000 | | | | 1,638,630 | |
Tim Hortons, Inc. | | | 38,000 | | | | 1,566,740 | |
| | | | | | | | |
| | | | | | | 29,306,329 | |
| | | | | | | | |
| Semiconductors — 8.2% | | | | | | | | |
Altera Corp. | | | 86,000 | | | | 3,059,880 | |
Cree, Inc. (a) | | | 28,000 | | | | 1,844,920 | |
Intersil Corp. Class A | | | 93,000 | | | | 1,420,110 | |
Marvell Technology Group Ltd. (a) | | | 92,000 | | | | 1,706,600 | |
MEMC Electronic Materials, Inc. (a) | | | 151,000 | | | | 1,700,260 | |
Microchip Technology, Inc. | | | 83,000 | | | | 2,839,430 | |
National Semiconductor Corp. | | | 175,000 | | | | 2,408,000 | |
NVIDIA Corp. (a) | | | 110,000 | | | | 1,694,000 | |
PMC-Sierra, Inc. (a) | | | 80,000 | | | | 687,200 | |
The accompanying notes are an integral part of the financial statements.
68
MML Mid Cap Growth Fund – Portfolio of Investments (Continued)
| | | | | | | | |
| | | Number of
Shares | | | Value | |
Rovi Corp. (a) | | | 61,000 | | | $ | 3,782,610 | |
Silicon Laboratories, Inc. (a) | | | 43,000 | | | | 1,978,860 | |
Varian Semiconductor Equipment Associates, Inc. (a) | | | 60,000 | | | | 2,218,200 | |
Xilinx, Inc. | | | 109,000 | | | | 3,158,820 | |
| | | | | | | | |
| | | | | | | 28,498,890 | |
| | | | | | | | |
| Software — 6.2% | | | | | | | | |
Autodesk, Inc. (a) | | | 36,000 | | | | 1,375,200 | |
Cerner Corp. (a) | | | 11,000 | | | | 1,042,140 | |
Electronic Arts, Inc. (a) | | | 89,000 | | | | 1,457,820 | |
Fiserv, Inc. (a) | | | 73,000 | | | | 4,274,880 | |
MSCI, Inc. Class A (a) | | | 82,000 | | | | 3,194,720 | |
Nuance Communications, Inc. (a) | | | 175,000 | | | | 3,181,500 | |
Red Hat, Inc. (a) | | | 79,000 | | | | 3,606,350 | |
Solera Holdings, Inc. | | | 69,000 | | | | 3,541,080 | |
| | | | | | | | |
| | | | | | | 21,673,690 | |
| | | | | | | | |
| Telecommunications — 2.7% | | | | | |
Atheros Communications, Inc. (a) | | | 41,000 | | | | 1,472,720 | |
JDS Uniphase Corp. (a) | | | 317,000 | | | | 4,590,160 | |
Juniper Networks, Inc. (a) | | | 95,000 | | | | 3,507,400 | |
| | | | | | | | |
| | | | | | | 9,570,280 | |
| | | | | | | | |
| Transportation — 0.6% | | | | | | | | |
UTI Worldwide, Inc. | | | 93,000 | | | | 1,971,600 | |
| | | | | | | | |
| | |
TOTAL COMMON STOCK
(Cost $240,640,752) | | | | | | | 336,048,183 | |
| | | | | | | | |
| | |
TOTAL EQUITIES
(Cost $240,640,752) | | | | | | | 336,048,183 | |
| | | | | | | | |
| |
| MUTUAL FUNDS — 1.7% | | | | | |
| Diversified Financial — 1.7% | | | | | |
T. Rowe Price Government Reserve Investment Fund | | | 5,781,127 | | | | 5,781,127 | |
| | | | | | | | |
| | |
TOTAL MUTUAL FUNDS
(Cost $5,781,127) | | | | | | | 5,781,127 | |
| | | | | | | | |
| | |
TOTAL LONG-TERM INVESTMENTS
(Cost $246,421,879) | | | | | | | 341,829,310 | |
| | | | | | | | |
| | |
| | | Principal
Amount | | | | |
| SHORT-TERM INVESTMENTS — 2.5% | |
| Repurchase Agreement — 2.5% | | | | | |
State Street Bank & Trust Co. Repurchase Agreement, dated 12/31/10, 0.010%, due 1/03/11 (c) | | $ | 8,637,312 | | | | 8,637,312 | |
| | | | | | | | |
| | |
TOTAL SHORT-TERM INVESTMENTS
(Cost $8,637,312) | | | | | | | 8,637,312 | |
| | | | | | | | |
| | | | | | | | |
| | | | | | Value | |
TOTAL INVESTMENTS — 100.7%
(Cost $255,059,191) (d) | | | | | | $ | 350,466,622 | |
| | |
| Other Assets/(Liabilities) — (0.7)% | | | | | | | (2,519,670 | ) |
| | | | | | | | |
| | |
| NET ASSETS — 100.0% | | | | | | $ | 347,946,952 | |
| | | | | | | | |
Notes to Portfolio of Investments
| ADR | American Depositary Receipt |
| (a) | Non-income producing security. |
| (b) | Securities exempt from registration under rule 144A of the Securities Act of 1933. These securities may be resold in transactions exempt from registration, normally to qualified institutional buyers. At December 31, 2010, these securities amounted to a value of $334,080 or 0.10% of net assets. |
| (c) | Maturity value of $8,637,318. Collateralized by U.S. Government Agency obligations with a rate of 4.000%, maturity date of 5/15/39, and an aggregate market value, including accrued interest, of $8,813,952. |
| (d) | See Note 6 for aggregate cost for federal tax purposes. |
The accompanying notes are an integral part of the financial statements.
69
MML Mid Cap Value Fund – Portfolio of Investments
December 31, 2010
| | | | | | | | |
| | | Number of
Shares | | | Value | |
| EQUITIES — 97.6% | | | | | | | | |
| |
| COMMON STOCK — 97.6% | | | | | |
| Airlines — 0.4% | | | | | | | | |
Southwest Airlines Co. | | | 140,100 | | | $ | 1,818,497 | |
| | | | | | | | |
| Banks — 6.4% | | | | | | | | |
Comerica, Inc. | | | 146,162 | | | | 6,173,883 | |
Commerce Bancshares, Inc. | | | 153,189 | | | | 6,086,211 | |
Northern Trust Corp. | | | 193,902 | | | | 10,744,110 | |
State Street Corp. | | | 39,100 | | | | 1,811,894 | |
SunTrust Banks, Inc. | | | 89,500 | | | | 2,641,145 | |
| | | | | | | | |
| | | | | | | 27,457,243 | |
| | | | | | | | |
| Chemicals — 0.7% | | | | | | | | |
Minerals Technologies, Inc. | | | 43,081 | | | | 2,817,928 | |
| | | | | | | | |
| Commercial Services — 0.6% | | | | | |
Automatic Data Processing, Inc. | | | 29,400 | | | | 1,360,632 | |
Booz Allen Hamilton Holding Corp. (a) | | | 56,253 | | | | 1,092,996 | |
| | | | | | | | |
| | | | | | | 2,453,628 | |
| | | | | | | | |
| Computers — 0.5% | | | | | | | | |
Cadence Design Systems, Inc. (a) | | | 262,300 | | | | 2,166,598 | |
| | | | | | | | |
| Distribution & Wholesale — 1.1% | | | | | |
Beacon Roofing Supply, Inc. (a) | | | 170,700 | | | | 3,050,409 | |
Genuine Parts Co. | | | 31,118 | | | | 1,597,598 | |
| | | | | | | | |
| | | | | | | 4,648,007 | |
| | | | | | | | |
| Diversified Financial — 1.3% | | | | | |
BlackRock, Inc. | | | 5,736 | | | | 1,093,167 | |
The Charles Schwab Corp. | | | 121,800 | | | | 2,083,998 | |
Franklin Resources, Inc. | | | 19,800 | | | | 2,201,958 | |
| | | | | | | | |
| | | | | | | 5,379,123 | |
| | | | | | | | |
| Electric — 8.5% | | | | | | | | |
American Electric Power Co., Inc. | | | 72,248 | | | | 2,599,483 | |
Consolidated Edison, Inc. | | | 29,100 | | | | 1,442,487 | |
Great Plains Energy, Inc. | | | 30,357 | | | | 588,622 | |
IDACORP, Inc. | | | 26,473 | | | | 978,972 | |
Northeast Utilities | | | 129,271 | | | | 4,121,159 | |
NV Energy, Inc. | | | 442,200 | | | | 6,212,910 | |
PG&E Corp. | | | 124,700 | | | | 5,965,648 | |
Portland General Electric Co. | | | 118,181 | | | | 2,564,528 | |
Westar Energy, Inc. | | | 252,914 | | | | 6,363,316 | |
Wisconsin Energy Corp. | | | 27,039 | | | | 1,591,516 | |
Xcel Energy, Inc. | | | 182,173 | | | | 4,290,174 | |
| | | | | | | | |
| | | | | | | 36,718,815 | |
| | | | | | | | |
| Electrical Components & Equipment — 1.8% | |
Hubbell, Inc. Class B | | | 83,966 | | | | 5,048,875 | |
Molex, Inc. | | | 122,580 | | | | 2,785,018 | |
| | | | | | | | |
| | | | | | | 7,833,893 | |
| | | | | | | | |
| | | | | | | | |
| | | Number of
Shares | | | Value | |
| Electronics — 1.5% | | | | | | | | |
Thomas & Betts Corp. (a) | | | 135,000 | | | $ | 6,520,500 | |
| | | | | | | | |
| Entertainment — 0.9% | | | | | | | | |
International Speedway Corp. Class A | | | 87,521 | | | | 2,290,425 | |
Speedway Motorsports, Inc. | | | 97,654 | | | | 1,496,059 | |
| | | | | | | | |
| | | | | | | 3,786,484 | |
| | | | | | | | |
| Environmental Controls — 3.9% | | | | | |
Republic Services, Inc. | | | 452,628 | | | | 13,515,472 | |
Waste Management, Inc. | | | 89,512 | | | | 3,300,307 | |
| | | | | | | | |
| | | | | | | 16,815,779 | |
| | | | | | | | |
| Foods — 6.0% | | | | | | | | |
ConAgra Foods, Inc. | | | 358,409 | | | | 8,092,875 | |
General Mills, Inc. | | | 100,800 | | | | 3,587,472 | |
H.J. Heinz Co. | | | 110,000 | | | | 5,440,600 | |
Kellogg Co. | | | 140,900 | | | | 7,197,172 | |
Sysco Corp. | | | 51,700 | �� | | | 1,519,980 | |
| | | | | | | | |
| | | | | | | 25,838,099 | |
| | | | | | | | |
| Forest Products & Paper — 1.4% | | | | | |
MeadWestvaco Corp. | | | 101,000 | | | | 2,642,160 | |
Weyerhaeuser Co. | | | 168,893 | | | | 3,197,144 | |
| | | | | | | | |
| | | | | | | 5,839,304 | |
| | | | | | | | |
| Gas — 0.9% | | | | | | | | |
AGL Resources, Inc. | | | 94,000 | | | | 3,369,900 | |
Southwest Gas Corp. | | | 8,249 | | | | 302,491 | |
| | | | | | | | |
| | | | | | | 3,672,391 | |
| | | | | | | | |
| Hand & Machine Tools — 0.5% | | | | | |
Stanley Black & Decker, Inc. | | | 32,600 | | | | 2,179,962 | |
| | | | | | | | |
| Health Care – Products — 5.7% | | | | | |
Beckman Coulter, Inc. | | | 103,381 | | | | 7,777,352 | |
Boston Scientific Corp. (a) | | | 300,000 | | | | 2,271,000 | |
CareFusion Corp. (a) | | | 151,821 | | | | 3,901,800 | |
Covidien PLC | | | 47,600 | | | | 2,173,416 | |
Symmetry Medical, Inc. (a) | | | 70,863 | | | | 655,483 | |
Zimmer Holdings, Inc. (a) | | | 140,900 | | | | 7,563,512 | |
| | | | | | | | |
| | | | | | | 24,342,563 | |
| | | | | | | | |
| Health Care – Services — 1.5% | | | | | |
LifePoint Hospitals, Inc. (a) | | | 152,100 | | | | 5,589,675 | |
Select Medical Holdings Corp. (a) | | | 146,805 | | | | 1,073,145 | |
| | | | | | | | |
| | | | | | | 6,662,820 | |
| | | | | | | | |
| Home Builders — 0.4% | | | | | | | | |
Toll Brothers, Inc. (a) | | | 100,300 | | | | 1,905,700 | |
| | | | | | | | |
| Home Furnishing — 0.8% | | | | | | | | |
Whirlpool Corp. | | | 40,700 | | | | 3,615,381 | |
| | | | | | | | |
| Household Products — 2.8% | | | | | |
The Clorox Co. | | | 45,200 | | | | 2,860,256 | |
Kimberly-Clark Corp. | | | 148,494 | | | | 9,361,062 | |
| | | | | | | | |
| | | | | | | 12,221,318 | |
| | | | | | | | |
The accompanying notes are an integral part of the financial statements.
70
MML Mid Cap Value Fund – Portfolio of Investments (Continued)
| | | | | | | | |
| | | Number of
Shares | | | Value | |
| Insurance — 11.4% | | | | | | | | |
ACE Ltd. | | | 89,600 | | | $ | 5,577,600 | |
The Allstate Corp. | | | 138,600 | | | | 4,418,568 | |
Aon Corp. | | | 156,200 | | | | 7,186,762 | |
The Chubb Corp. | | | 56,000 | | | | 3,339,840 | |
HCC Insurance Holdings, Inc. | | | 207,520 | | | | 6,005,629 | |
Marsh & McLennan Cos., Inc. | | | 244,711 | | | | 6,690,399 | |
Symetra Financial Corp. | | | 210,932 | | | | 2,889,768 | |
Transatlantic Holdings, Inc. | | | 108,064 | | | | 5,578,264 | |
The Travelers Cos., Inc. | | | 101,500 | | | | 5,654,565 | |
Unum Group | | | 73,600 | | | | 1,782,592 | |
| | | | | | | | |
| | | | | | | 49,123,987 | |
| | | | | | | | |
| Machinery – Diversified — 0.5% | | | | | |
Altra Holdings, Inc. (a) | | | 102,478 | | | | 2,035,213 | |
| | | | | | | | |
| Manufacturing — 3.1% | | | | | | | | |
Harsco Corp. | | | 123,800 | | | | 3,506,016 | |
ITT Corp. | | | 83,600 | | | | 4,356,396 | |
Tyco International Ltd. | | | 128,600 | | | | 5,329,184 | |
| | | | | | | | |
| | | | | | | 13,191,596 | |
| | | | | | | | |
| Metal Fabricate & Hardware — 1.4% | | | | | |
Kaydon Corp. | | | 146,210 | | | | 5,953,671 | |
| | | | | | | | |
| Mining — 1.0% | | | | | | | | |
Newmont Mining Corp. | | | 68,089 | | | | 4,182,707 | |
| | | | | | | | |
| Office Equipment/Supplies — 0.5% | | | | | |
Pitney Bowes, Inc. | | | 89,800 | | | | 2,171,364 | |
| | | | | | | | |
| Oil & Gas — 8.0% | | | | | | | | |
Devon Energy Corp. | | | 55,700 | | | | 4,373,007 | |
EOG Resources, Inc. | | | 14,500 | | | | 1,325,445 | |
EQT Corp. | | | 166,899 | | | | 7,483,751 | |
Imperial Oil Ltd. | | | 308,700 | | | | 12,593,793 | |
Murphy Oil Corp. | | | 60,200 | | | | 4,487,910 | |
Noble Energy, Inc. | | | 19,900 | | | | 1,712,992 | |
Southwestern Energy Co. (a) | | | 64,700 | | | | 2,421,721 | |
| | | | | | | | |
| | | | | | | 34,398,619 | |
| | | | | | | | |
| Oil & Gas Services — 0.5% | | | | | |
Baker Hughes, Inc. | | | 37,600 | | | | 2,149,592 | |
| | | | | | | | |
| Packaging & Containers — 1.5% | | | | | |
Bemis Co., Inc. | | | 195,366 | | | | 6,380,654 | |
| | | | | | | | |
| Pharmaceuticals — 1.4% | | | | | | | | |
Patterson Cos., Inc. | | | 200,600 | | | | 6,144,378 | |
| | | | | | | | |
| Pipelines — 0.5% | | | | | | | | |
Spectra Energy Partners LP | | | 71,400 | | | | 2,345,490 | |
| | | | | | | | |
| Real Estate Investment Trusts (REITS) — 3.5% | |
Annaly Capital Management, Inc. | | | 76,231 | | | | 1,366,060 | |
Capstead Mortgage Corp. | | | 124,400 | | | | 1,566,196 | |
Government Properties Income Trust | | | 170,610 | | | | 4,570,642 | |
Host Hotels & Resorts, Inc. | | | 69,238 | | | | 1,237,283 | |
National Health Investors, Inc. | | | 4,800 | | | | 216,096 | |
Piedmont Office Realty Trust, Inc. Class A | | | 299,288 | | | | 6,027,660 | |
| | | | | | | | |
| | | | | | | 14,983,937 | |
| | | | | | | | |
| | | | | | | | |
| | | Number of
Shares | | | Value | |
| Retail — 7.3% | | | | | | | | |
Best Buy Co., Inc. | | | 87,700 | | | $ | 3,007,233 | |
CEC Entertainment, Inc. (a) | | | 140,400 | | | | 5,451,732 | |
CVS Caremark Corp. | | | 157,400 | | | | 5,472,798 | |
Lowe’s Cos., Inc. | | | 390,400 | | | | 9,791,232 | |
Staples, Inc. | | | 262,900 | | | | 5,986,233 | |
Target Corp. | | | 30,800 | | | | 1,852,004 | |
| | | | | | | | |
| | | | | | | 31,561,232 | |
| | | | | | | | |
| Savings & Loans �� 3.3% | | | | | |
Capitol Federal Financial, Inc. | | | 142,178 | | | | 1,693,340 | |
Hudson City Bancorp, Inc. | | | 461,600 | | | | 5,880,784 | |
People’s United Financial, Inc. | | | 464,112 | | | | 6,502,209 | |
| | | | | | | | |
| | | | | | | 14,076,333 | |
| | | | | | | | |
| Semiconductors — 2.9% | | | | | | | | |
Applied Materials, Inc. | | | 452,900 | | | | 6,363,245 | |
Emulex Corp. (a) | | | 226,700 | | | | 2,643,322 | |
Teradyne, Inc. (a) | | | 231,900 | | | | 3,255,876 | |
| | | | | | | | |
| | | | | | | 12,262,443 | |
| | | | | | | | |
| Telecommunications — 2.3% | | | | | |
Consolidated Communications Holdings, Inc. | | | 88,700 | | | | 1,711,910 | |
Qwest Communications International, Inc. | | | 727,700 | | | | 5,537,797 | |
Rogers Communications, Inc. Class B | | | 47,800 | | | | 1,662,692 | |
Windstream Corp. | | | 65,174 | | | | 908,526 | |
| | | | | | | | |
| | | | | | | 9,820,925 | |
| | | | | | | | |
| Textiles — 0.7% | | | | | | | | |
Cintas Corp. | | | 102,400 | | | | 2,863,104 | |
| | | | | | | | |
| Toys, Games & Hobbies — 0.2% | | | | | |
Mattel, Inc. | | | 36,800 | | | | 935,824 | |
| | | | | | | | |
| | |
TOTAL COMMON STOCK
(Cost $374,144,199) | | | | | | | 419,275,102 | |
| | | | | | | | |
| | |
TOTAL EQUITIES
(Cost $374,144,199) | | | | | | | 419,275,102 | |
| | | | | | | | |
| |
| MUTUAL FUNDS — 2.8% | | | | | |
| Diversified Financial — 2.8% | | | | | |
iShares Russell Midcap Value Index Fund | | | 266,800 | | | | 12,008,668 | |
| | | | | | | | |
| | |
TOTAL MUTUAL FUNDS
(Cost $11,319,802) | | | | | | | 12,008,668 | |
| | | | | | | | |
| | |
TOTAL LONG-TERM INVESTMENTS
(Cost $385,464,001) | | | | | | | 431,283,770 | |
| | | | | | | | |
The accompanying notes are an integral part of the financial statements.
71
MML Mid Cap Value Fund – Portfolio of Investments (Continued)
| | | | | | | | |
| | | Principal
Amount | | | Value | |
| SHORT-TERM INVESTMENTS — 1.2% | | | | | |
| Repurchase Agreement — 1.2% | | | | | | | | |
State Street Bank & Trust Co. Repurchase Agreement, dated 12/31/10, 0.010%, due 1/03/11 (b) | | $ | 5,047,007 | | | $ | 5,047,007 | |
| | | | | | | | |
| | |
TOTAL SHORT-TERM INVESTMENTS
(Cost $5,047,007) | | | | | | | 5,047,007 | |
| | | | | | | | |
| | |
TOTAL INVESTMENTS — 101.6%
(Cost $390,511,008) (c) | | | | | | | 436,330,777 | |
| | |
| Other Assets/(Liabilities) — (1.6)% | | | | | | | (6,782,176 | ) |
| | | | | | | | |
| | |
| NET ASSETS — 100.0% | | | | | | $ | 429,548,601 | |
| | | | | | | | |
Notes to Portfolio of Investments
| (a) | Non-income producing security. |
| (b) | Maturity value of $5,047,011. Collateralized by U.S. Government Agency obligations with a rate of 4.000%, maturity date of 9/25/39, and an aggregate market value, including accrued interest, of $5,148,571. |
| (c) | See Note 6 for aggregate cost for federal tax purposes. |
The accompanying notes are an integral part of the financial statements.
72
MML Small Cap Index Fund – Portfolio of Investments
December 31, 2010
| | | | | | | | |
| | | Number of
Shares | | | Value | |
| EQUITIES — 99.9% | | | | | | | | |
| |
| COMMON STOCK — 99.9% | | | | | |
| Aerospace & Defense — 2.6% | | | | | |
AAR Corp. (a) | | | 3,760 | | | $ | 103,287 | |
Aerovironment, Inc. (a) | | | 1,416 | | | | 37,991 | |
Cubic Corp. | | | 1,500 | | | | 70,725 | |
Curtiss-Wright Corp. | | | 4,350 | | | | 144,420 | |
Esterline Technologies Corp. (a) | | | 2,879 | | | | 197,471 | |
GenCorp, Inc. (a) | | | 5,606 | | | | 28,983 | |
Kaman Corp. | | | 2,422 | | | | 70,408 | |
Moog, Inc. Class A (a) | | | 4,359 | | | | 173,488 | |
Orbital Sciences Corp. (a) | | | 5,591 | | | | 95,774 | |
Teledyne Technologies, Inc. (a) | | | 3,484 | | | | 153,192 | |
Triumph Group, Inc. | | | 1,579 | | | | 141,178 | |
| | | | | | | | |
| | | | | | | 1,216,917 | |
| | | | | | | | |
| Agriculture — 0.2% | | | | | | | | |
Alliance One International, Inc. (a) | | | 8,605 | | | | 36,485 | |
The Andersons, Inc. | | | 1,772 | | | | 64,412 | |
| | | | | | | | |
| | | | | | | 100,897 | |
| | | | | | | | |
| Airlines — 0.3% | | | | | | | | |
Allegiant Travel Co. | | | 1,451 | | | | 71,447 | |
SkyWest, Inc. | | | 5,208 | | | | 81,349 | |
| | | | | | | | |
| | | | | | | 152,796 | |
| | | | | | | | |
| Apparel — 2.2% | | | | | | | | |
Carter’s, Inc. (a) | | | 5,449 | | | | 160,800 | |
Crocs, Inc. (a) | | | 8,371 | | | | 143,312 | |
Iconix Brand Group, Inc. (a) | | | 6,975 | | | | 134,687 | |
K-Swiss, Inc. Class A (a) | | | 2,579 | | | | 32,160 | |
Maidenform Brands, Inc. (a) | | | 2,210 | | | | 52,532 | |
Oxford Industries, Inc. | | | 1,289 | | | | 33,011 | |
Perry Ellis International, Inc. (a) | | | 949 | | | | 26,069 | |
Quiksilver, Inc. (a) | | | 12,461 | | | | 63,177 | |
Skechers U.S.A., Inc. Class A (a) | | | 3,205 | | | | 64,100 | |
Steven Madden Ltd. (a) | | | 2,213 | | | | 92,327 | |
True Religion Apparel, Inc. (a) | | | 2,423 | | | | 53,936 | |
Volcom, Inc. | | | 1,638 | | | | 30,909 | |
Wolverine World Wide, Inc. | | | 4,690 | | | | 149,517 | |
| | | | | | | | |
| | | | | | | 1,036,537 | |
| | | | | | | | |
| Automotive & Parts — 0.2% | | | | | |
Spartan Motors, Inc. | | | 3,010 | | | | 18,331 | |
Standard Motor Products, Inc. | | | 1,882 | | | | 25,783 | |
Superior Industries International, Inc. | | | 2,228 | | | | 47,278 | |
| | | | | | | | |
| | | | | | | 91,392 | |
| | | | | | | | |
| Banks — 6.1% | | | | | | | | |
Bank Mutual Corp. | | | 4,500 | | | | 21,510 | |
Bank of the Ozarks, Inc. | | | 1,243 | | | | 53,884 | |
Boston Private Financial Holdings, Inc. | | | 7,279 | | | | 47,677 | |
City Holding Co. | | | 1,471 | | | | 53,294 | |
| | | | | | | | |
| | | Number of
Shares | | | Value | |
Columbia Banking System, Inc. | | | 3,785 | | | $ | 79,712 | |
Community Bank System, Inc. | | | 3,198 | | | | 88,808 | |
First BanCorp (a) | | | 30,713 | | | | 14,128 | |
First Commonwealth Financial Corp. | | | 9,148 | | | | 64,768 | |
First Financial Bancorp | | | 5,590 | | | | 103,303 | |
First Financial Bankshares, Inc. | | | 1,977 | | | | 101,183 | |
First Midwest Bancorp, Inc. | | | 7,156 | | | | 82,437 | |
Glacier Bancorp, Inc. | | | 6,816 | | | | 102,990 | |
Hancock Holding Co. | | | 2,825 | | | | 98,480 | |
Hanmi Financial Corp. (a) | | | 14,576 | | | | 16,762 | |
Home Bancshares, Inc. | | | 2,083 | | | | 45,889 | |
Independent Bank Corp. | | | 2,029 | | | | 54,884 | |
Nara Bancorp, Inc. (a) | | | 3,625 | | | | 35,598 | |
National Penn Bancshares, Inc. | | | 11,898 | | | | 95,541 | |
NBT Bancorp, Inc. | | | 3,302 | | | | 79,743 | |
Old National Bancorp | | | 9,053 | | | | 107,640 | |
Pinnacle Financial Partners, Inc. (a) | | | 3,168 | | | | 43,021 | |
PrivateBancorp, Inc. | | | 5,620 | | | | 80,816 | |
S&T Bancorp, Inc. | | | 2,416 | | | | 54,577 | |
Signature Bank (a) | | | 3,848 | | | | 192,400 | |
Simmons First National Corp. Class A | | | 1,653 | | | | 47,111 | |
Sterling Bancorp | | | 2,631 | | | | 27,547 | |
Sterling Bancshares, Inc. | | | 9,772 | | | | 68,599 | |
Susquehanna Bancshares, Inc. | | | 12,261 | | | | 118,687 | |
Texas Capital Bancshares, Inc. (a) | | | 3,475 | | | | 73,913 | |
Tompkins Financial Corp. | | | 768 | | | | 30,075 | |
Trustco Bank Corp. NY | | | 7,300 | | | | 46,282 | |
UMB Financial Corp. | | | 2,863 | | | | 118,586 | |
Umpqua Holdings Corp. | | | 10,992 | | | | 133,883 | |
United Bankshares, Inc. | | | 3,694 | | | | 107,865 | |
United Community Banks, Inc. (a) | | | 9,016 | | | | 17,581 | |
Whitney Holding Corp. | | | 9,107 | | | | 128,864 | |
Wilmington Trust Corp. | | | 8,830 | | | | 38,322 | |
Wilshire Bancorp, Inc. | | | 1,857 | | | | 14,150 | |
Wintrust Financial Corp. | | | 3,244 | | | | 107,149 | |
| | | | | | | | |
| | | | | | | 2,797,659 | |
| | | | | | | | |
| Beverages — 0.3% | | | | | | | | |
Boston Beer Co., Inc. Class A (a) | | | 870 | | | | 82,728 | |
Peet’s Coffee & Tea, Inc. (a) | | | 1,223 | | | | 51,048 | |
| | | | | | | | |
| | | | | | | 133,776 | |
| | | | | | | | |
| Biotechnology — 1.1% | | | | | | | | |
Affymetrix, Inc. (a) | | | 6,866 | | | | 34,536 | |
Arqule, Inc. (a) | | | 3,537 | | | | 20,762 | |
Cambrex Corp. (a) | | | 3,000 | | | | 15,510 | |
CryoLife, Inc. (a) | | | 2,593 | | | | 14,054 | |
Enzo Biochem, Inc. (a) | | | 3,341 | | | | 17,640 | |
Integra LifeSciences Holdings (a) | | | 1,937 | | | | 91,620 | |
Martek Biosciences Corp. (a) | | | 3,195 | | | | 100,004 | |
Regeneron Pharmaceuticals, Inc. (a) | | | 6,965 | | | | 228,661 | |
| | | | | | | | |
| | | | | | | 522,787 | |
| | | | | | | | |
The accompanying notes are an integral part of the financial statements.
73
MML Small Cap Index Fund – Portfolio of Investments (Continued)
| | | | | | | | |
| | | Number of
Shares | | | Value | |
Building Materials — 1.6% | | | | | | | | |
AAON, Inc. | | | 1,122 | | | $ | 31,652 | |
Apogee Enterprises, Inc. | | | 2,625 | | | | 35,359 | |
Comfort Systems USA, Inc. | | | 3,672 | | | | 48,360 | |
Drew Industries, Inc. | | | 1,866 | | | | 42,396 | |
Eagle Materials, Inc. | | | 4,234 | | | | 119,610 | |
Gibraltar Industries, Inc. (a) | | | 2,947 | | | | 39,991 | |
NCI Building Systems, Inc. (a) | | | 1,640 | | | | 22,944 | |
Quanex Building Products Corp. | | | 3,557 | | | | 67,476 | |
Simpson Manufacturing Co., Inc. | | | 3,797 | | | | 117,365 | |
Texas Industries, Inc. | | | 2,667 | | | | 122,095 | |
Universal Forest Products, Inc. | | | 1,851 | | | | 72,004 | |
| | | | | | | | |
| | | | | | | 719,252 | |
| | | | | | | | |
Chemicals — 1.6% | | | | | | | | |
A. Schulman, Inc. | | | 2,948 | | | | 67,480 | |
American Vanguard Corp. | | | 2,100 | | | | 17,934 | |
Arch Chemicals, Inc. | | | 2,411 | | | | 91,449 | |
Balchem Corp. | | | 2,748 | | | | 92,910 | |
H.B. Fuller Co. | | | 4,706 | | | | 96,567 | |
OM Group, Inc. (a) | | | 2,962 | | | | 114,067 | |
Penford Corp. (a) | | | 1,200 | | | | 7,332 | |
PolyOne Corp. (a) | | | 8,967 | | | | 111,998 | |
Quaker Chemical Corp. | | | 1,097 | | | | 45,712 | |
Stepan Co. | | | 738 | | | | 56,287 | |
Zep, Inc. | | | 2,100 | | | | 41,748 | |
| | | | | | | | |
| | | | | | | 743,484 | |
| | | | | | | | |
Commercial Services — 6.6% | | | | | |
ABM Industries, Inc. | | | 4,435 | | | | 116,640 | |
Administaff, Inc. | | | 2,168 | | | | 63,522 | |
American Public Education, Inc. (a) | | | 1,692 | | | | 63,010 | |
AMN Healthcare Services, Inc. (a) | | | 3,768 | | | | 23,136 | |
Arbitron, Inc. | | | 2,543 | | | | 105,585 | |
Capella Education Co. (a) | | | 1,565 | | | | 104,198 | |
CDI Corp. | | | 1,201 | | | | 22,327 | |
Chemed Corp. | | | 2,194 | | | | 139,341 | |
Coinstar, Inc. (a) | | | 3,027 | | | | 170,844 | |
Consolidated Graphics, Inc. (a) | | | 969 | | | | 46,929 | |
Corinthian Colleges, Inc. (a) | | | 8,099 | | | | 42,196 | |
Corvel Corp. (a) | | | 616 | | | | 29,784 | |
Cross Country Healthcare, Inc. (a) | | | 2,900 | | | | 24,563 | |
Exponent, Inc. (a) | | | 1,341 | | | | 50,328 | |
Forrester Research, Inc. | | | 1,403 | | | | 49,512 | |
The Geo Group, Inc. (a) | | | 6,177 | | | | 152,325 | |
Healthcare Services Group, Inc. | | | 6,320 | | | | 102,826 | |
Healthspring, Inc. (a) | | | 5,484 | | | | 145,490 | |
Heartland Payment Systems, Inc. | | | 3,600 | | | | 55,512 | |
Heidrick & Struggles International, Inc. | | | 1,701 | | | | 48,734 | |
Hillenbrand, Inc. | | | 5,978 | | | | 124,402 | |
HMS Holdings Corp. (a) | | | 2,646 | | | | 171,381 | |
Kelly Services, Inc. Class A (a) | | | 2,700 | | | | 50,760 | |
Kendle International, Inc. (a) | | | 1,352 | | | | 14,723 | |
Landauer, Inc. | | | 900 | | | | 53,973 | |
| | | | | | | | |
| | | Number of
Shares | | | Value | |
Live Nation Entertainment Inc (a) | | | 14,321 | | | $ | 163,546 | |
MAXIMUS, Inc. | | | 1,626 | | | | 106,633 | |
Medifast, Inc. (a) | | | 1,294 | | | | 37,371 | |
Midas, Inc. (a) | | | 1,311 | | | | 10,632 | |
Monro Muffler Brake, Inc. | | | 2,869 | | | | 99,239 | |
On Assignment, Inc. (a) | | | 3,593 | | | | 29,283 | |
PAREXEL International Corp. (a) | | | 5,562 | | | | 118,081 | |
Pre-Paid Legal Services, Inc. (a) | | | 949 | | | | 57,177 | |
SFN Group, Inc. (a) | | | 5,094 | | | | 49,717 | |
Startek, Inc. (a) | | | 1,300 | | | | 6,591 | |
TeleTech Holdings, Inc. (a) | | | 2,696 | | | | 55,511 | |
TrueBlue, Inc. (a) | | | 4,185 | | | | 75,288 | |
Universal Technical Institute, Inc. | | | 1,980 | | | | 43,600 | |
Viad Corp. | | | 1,904 | | | | 48,495 | |
Volt Information Sciences, Inc. (a) | | | 1,117 | | | | 9,662 | |
Wright Express Corp. (a) | | | 3,670 | | | | 168,820 | |
| | | | | | | | |
| | | | | | | 3,051,687 | |
| | | | | | | | |
| Computers — 2.2% | | | | | | | | |
Agilysys, Inc. (a) | | | 1,842 | | | | 10,370 | |
CACI International, Inc. Class A (a) | | | 2,899 | | | | 154,806 | |
Ciber, Inc. (a) | | | 6,428 | | | | 30,083 | |
Compellent Technologies, Inc. (a) | | | 2,242 | | | | 61,857 | |
Hutchinson Technology, Inc. (a) | | | 2,421 | | | | 8,982 | |
iGate Corp. | | | 2,735 | | | | 53,907 | |
Integral Systems, Inc. (a) | | | 1,800 | | | | 17,838 | |
LogMeIn, Inc. (a) | | | 1,514 | | | | 67,131 | |
Manhattan Associates, Inc. (a) | | | 2,094 | | | | 63,951 | |
Mercury Computer Systems, Inc. (a) | | | 2,350 | | | | 43,193 | |
MTS Systems Corp. | | | 1,469 | | | | 55,029 | |
NCI, Inc. Class A (a) | | | 800 | | | | 18,392 | |
Netscout Systems, Inc. (a) | | | 3,326 | | | | 76,531 | |
Radiant Systems, Inc. (a) | | | 3,189 | | | | 62,409 | |
RadiSys Corp. (a) | | | 2,443 | | | | 21,743 | |
Stratasys, Inc. (a) | | | 1,992 | | | | 65,019 | |
Super Micro Computer, Inc. (a) | | | 2,327 | | | | 26,853 | |
SYKES Enterprises, Inc. (a) | | | 3,935 | | | | 79,723 | |
Synaptics, Inc. (a) | | | 3,269 | | | | 96,043 | |
| | | | | | | | |
| | | | | | | 1,013,860 | |
| | | | | | | | |
| Distribution & Wholesale — 1.0% | | | | | |
Brightpoint, Inc. (a) | | | 6,382 | | | | 55,715 | |
MWI Veterinary Supply, Inc. (a) | | | 1,201 | | | | 75,843 | |
Pool Corp. | | | 4,673 | | | | 105,330 | |
ScanSource, Inc. (a) | | | 2,548 | | | | 81,281 | |
United Stationers, Inc. (a) | | | 2,184 | | | | 139,361 | |
| | | | | | | | |
| | | | | | | 457,530 | |
| | | | | | | | |
| Diversified Financial — 1.7% | | | | | |
Interactive Brokers Group, Inc. Class A | | | 4,000 | | | | 71,280 | |
Investment Technology Group, Inc. (a) | | | 4,056 | | | | 66,397 | |
LaBranche & Co., Inc. (a) | | | 3,401 | | | | 12,244 | |
National Financial Partners Corp. (a) | | | 4,199 | | | | 56,266 | |
The accompanying notes are an integral part of the financial statements.
74
MML Small Cap Index Fund – Portfolio of Investments (Continued)
| | | | | | | | |
| | | Number of
Shares | | | Value | |
optionsXpress Holdings, Inc. | | | 4,072 | | | $ | 63,808 | |
Piper Jaffray Cos., Inc. (a) | | | 1,492 | | | | 52,235 | |
Portfolio Recovery Associates, Inc. (a) | | | 1,627 | | | | 122,350 | |
Stifel Financial Corp. (a) | | | 3,375 | | | | 209,385 | |
SWS Group, Inc. | | | 2,679 | | | | 13,529 | |
TradeStation Group, Inc. (a) | | | 3,865 | | | | 26,089 | |
World Acceptance Corp. (a) | | | 1,470 | | | | 77,616 | |
| | | | | | | | |
| | | | | | | 771,199 | |
| | | | | | | | |
| Electric — 1.8% | | | | | | | | |
Allete, Inc. | | | 2,978 | | | | 110,960 | |
Avista Corp. | | | 5,405 | | | | 121,721 | |
Central Vermont Public Service Corp. | | | 1,305 | | | | 28,527 | |
CH Energy Group, Inc. | | | 1,521 | | | | 74,362 | |
El Paso Electric Co. (a) | | | 4,076 | | | | 112,212 | |
NorthWestern Corp. | | | 3,468 | | | | 99,983 | |
UIL Holdings Corp. | | | 4,815 | | | | 144,257 | |
Unisource Energy Corp. | | | 3,442 | | | | 123,361 | |
| | | | | | | | |
| | | | | | | 815,383 | |
| | | | | | | | |
| Electrical Components & Equipment — 1.0% | |
Advanced Energy Industries, Inc. (a) | | | 3,678 | | | | 50,168 | |
Belden, Inc. | | | 4,508 | | | | 165,985 | |
Encore Wire Corp. | | | 1,781 | | | | 44,667 | |
Greatbatch, Inc. (a) | | | 2,200 | | | | 53,130 | |
Littelfuse, Inc. | | | 2,127 | | | | 100,097 | |
Powell Industries, Inc. (a) | | | 866 | | | | 28,474 | |
Vicor Corp. | | | 1,855 | | | | 30,422 | |
| | | | | | | | |
| | | | | | | 472,943 | |
| | | | | | | | |
| Electronics — 4.5% | | | | | | | | |
American Science & Engineering, Inc. | | | 853 | | | | 72,701 | |
Analogic Corp. | | | 1,243 | | | | 61,541 | |
Badger Meter, Inc. | | | 1,446 | | | | 63,942 | |
Bel Fuse, Inc. Class B | | | 1,100 | | | | 26,290 | |
Benchmark Electronics, Inc. (a) | | | 5,782 | | | | 105,001 | |
Brady Corp. Class A | | | 5,038 | | | | 164,289 | |
Checkpoint Systems, Inc. (a) | | | 3,821 | | | | 78,521 | |
CTS Corp. | | | 3,289 | | | | 36,376 | |
Cymer, Inc. (a) | | | 2,834 | | | | 127,728 | |
Daktronics, Inc. | | | 3,281 | | | | 52,233 | |
Dionex Corp. (a) | | | 1,671 | | | | 197,195 | |
Electro Scientific Industries, Inc. (a) | | | 2,260 | | | | 36,228 | |
Faro Technologies, Inc. (a) | | | 1,566 | | | | 51,427 | |
FEI Co. (a) | | | 3,670 | | | | 96,925 | |
II-VI, Inc. (a) | | | 2,435 | | | | 112,887 | |
Lo-Jack Corp. (a) | | | 1,645 | | | | 10,627 | |
Methode Electronics, Inc. | | | 3,575 | | | | 46,368 | |
Newport Corp. (a) | | | 3,561 | | | | 61,855 | |
OSI Systems, Inc. (a) | | | 1,799 | | | | 65,412 | |
Park Electrochemical Corp. | | | 1,968 | | | | 59,040 | |
Plexus Corp. (a) | | | 3,883 | | | | 120,140 | |
Pulse Electronics Corp. | | | 3,799 | | | | 20,211 | |
Rofin-Sinar Technologies, Inc. (a) | | | 2,741 | | | | 97,141 | |
| | | | | | | | |
| | | Number of
Shares | | | Value | |
Rogers Corp. (a) | | | 1,524 | | | $ | 58,293 | |
Sonic Solutions (a) | | | 4,727 | | | | 70,905 | |
TTM Technologies, Inc. (a) | | | 4,154 | | | | 61,936 | |
Watts Water Technologies, Inc. Class A | | | 2,812 | | | | 102,891 | |
| | | | | | | | |
| | | | | | | 2,058,103 | |
| | | | | | | | |
| Energy – Alternate Sources — 0.1% | |
Headwaters, Inc. (a) | | | 5,548 | | | | 25,410 | |
| | | | | | | | |
| Engineering & Construction — 0.8% | |
Dycom Industries, Inc. (a) | | | 3,378 | | | | 49,825 | |
Emcor Group, Inc. (a) | | | 6,369 | | | | 184,574 | |
Insituform Technologies, Inc. Class A (a) | | | 3,728 | | | | 98,829 | |
Orion Marine Group, Inc. (a) | | | 2,605 | | | | 30,218 | |
| | | | | | | | |
| | | | | | | 363,446 | |
| | | | | | | | |
| Entertainment — 0.3% | | | | | | | | |
Pinnacle Entertainment, Inc. (a) | | | 5,829 | | | | 81,723 | |
Shuffle Master, Inc. (a) | | | 5,201 | | | | 59,551 | |
| | | | | | | | |
| | | | | | | 141,274 | |
| | | | | | | | |
| Environmental Controls — 0.7% | | | | | |
Calgon Carbon Corp. (a) | | | 5,283 | | | | 79,879 | |
Darling International, Inc. (a) | | | 7,855 | | | | 104,315 | |
TETRA Technologies, Inc. (a) | | | 5,856 | | | | 146,751 | |
| | | | | | | | |
| | | | | | | 330,945 | |
| | | | | | | | |
| Foods — 2.1% | | | | | | | | |
Cal-Maine Foods, Inc. | | | 1,269 | | | | 40,075 | |
Calavo Growers, Inc. | | | 1,194 | | | | 27,522 | |
Diamond Foods, Inc. | | | 2,072 | | | | 110,189 | |
The Hain Celestial Group, Inc. (a) | | | 4,040 | | | | 109,322 | |
J&J Snack Foods Corp. | | | 1,353 | | | | 65,269 | |
Nash Finch Co. | | | 1,172 | | | | 49,822 | |
Sanderson Farms, Inc. | | | 1,847 | | | | 72,310 | |
Seneca Foods Corp. Class A (a) | | | 867 | | | | 23,392 | |
Snyders-Lance, Inc. | | | 4,440 | | | | 104,073 | |
Spartan Stores, Inc. | | | 2,153 | | | | 36,493 | |
TreeHouse Foods, Inc. (a) | | | 3,378 | | | | 172,582 | |
United Natural Foods, Inc. (a) | | | 4,568 | | | | 167,554 | |
| | | | | | | | |
| | | | | | | 978,603 | |
| | | | | | | | |
| Forest Products & Paper — 1.0% | | | | | |
Buckeye Technologies, Inc. | | | 3,811 | | | | 80,069 | |
Clearwater Paper Corp. (a) | | | 1,100 | | | | 86,130 | |
Deltic Timber Corp. | | | 1,018 | | | | 57,354 | |
KapStone Paper and Packaging Corp. (a) | | | 3,639 | | | | 55,677 | |
Neenah Paper, Inc. | | | 1,380 | | | | 27,158 | |
Schweitzer-Mauduit International, Inc. | | | 1,700 | | | | 106,964 | |
Wausau Paper Corp. | | | 4,750 | | | | 40,898 | |
| | | | | | | | |
| | | | | | | 454,250 | |
| | | | | | | | |
| Gas — 1.9% | | | | | | | | |
The Laclede Group, Inc. | | | 2,110 | | | | 77,099 | |
The accompanying notes are an integral part of the financial statements.
75
MML Small Cap Index Fund – Portfolio of Investments (Continued)
| | | | | | | | |
| | | Number of
Shares | | | Value | |
New Jersey Resources Corp. | | | 3,934 | | | $ | 169,595 | |
Northwest Natural Gas Co. | | | 2,531 | | | | 117,616 | |
Piedmont Natural Gas Co., Inc. | | | 6,891 | | | | 192,672 | |
South Jersey Industries, Inc. | | | 2,828 | | | | 149,375 | |
Southwest Gas Corp. | | | 4,351 | | | | 159,551 | |
| | | | | | | | |
| | | | | | | 865,908 | |
| | | | | | | | |
| Health Care – Products — 3.4% | | | | | |
Abaxis, Inc. (a) | | | 2,127 | | | | 57,110 | |
American Medical Systems Holdings, Inc. (a) | | | 7,329 | | | | 138,225 | |
Cantel Medical Corp. | | | 1,192 | | | | 27,893 | |
CONMED Corp. (a) | | | 2,662 | | | | 70,357 | |
The Cooper Cos., Inc. | | | 4,378 | | | | 246,657 | |
Cyberonics, Inc. (a) | | | 2,313 | | | | 71,749 | |
Haemonetics Corp. (a) | | | 2,369 | | | | 149,673 | |
Hanger Orthopedic Group, Inc. (a) | | | 3,100 | | | | 65,689 | |
ICU Medical, Inc. (a) | | | 1,136 | | | | 41,464 | |
Invacare Corp. | | | 3,102 | | | | 93,556 | |
Kensey Nash Corp. (a) | | | 785 | | | | 21,847 | |
LCA-Vision, Inc. (a) | | | 1,718 | | | | 9,879 | |
Meridian Bioscience, Inc. | | | 3,814 | | | | 88,332 | |
Merit Medical Systems, Inc. (a) | | | 2,712 | | | | 42,931 | |
Natus Medical, Inc. (a) | | | 2,686 | | | | 38,088 | |
Palomar Medical Technologies, Inc. (a) | | | 1,723 | | | | 24,484 | |
PSS World Medical, Inc. (a) | | | 5,312 | | | | 120,051 | |
SurModics, Inc. (a) | | | 1,714 | | | | 20,345 | |
Symmetry Medical, Inc. (a) | | | 3,456 | | | | 31,968 | |
West Pharmaceutical Services, Inc. | | | 3,157 | | | | 130,068 | |
Zoll Medical Corp. (a) | | | 2,049 | | | | 76,284 | |
| | | | | | | | |
| | | | | | | 1,566,650 | |
| | | | | | | | |
| Health Care – Services — 2.6% | | | | | |
Air Methods Corp. (a) | | | 1,049 | | | | 59,027 | |
Almost Family, Inc. (a) | | | 773 | | | | 29,699 | |
Amedisys, Inc. (a) | | | 2,780 | | | | 93,130 | |
AMERIGROUP Corp. (a) | | | 4,721 | | | | 207,346 | |
AmSurg Corp. (a) | | | 2,950 | | | | 61,802 | |
Bio-Reference Laboratories, Inc. (a) | | | 2,303 | | | | 51,081 | |
Centene Corp. (a) | | | 4,726 | | | | 119,757 | |
The Ensign Group, Inc. | | | 1,246 | | | | 30,988 | |
Genoptix, Inc. (a) | | | 1,700 | | | | 32,334 | |
Gentiva Health Services, Inc. (a) | | | 2,824 | | | | 75,118 | |
Healthways, Inc. (a) | | | 3,285 | | | | 36,661 | |
The IPC Hospitalist Co. (a) | | | 1,553 | | | | 60,583 | |
LHC Group, Inc. (a) | | | 1,477 | | | | 44,310 | |
Magellan Health Services, Inc. (a) | | | 3,197 | | | | 151,154 | |
Medcath Corp. (a) | | | 2,003 | | | | 27,942 | |
Molina Healthcare, Inc. (a) | | | 1,599 | | | | 44,532 | |
RehabCare Group, Inc. (a) | | | 2,369 | | | | 56,145 | |
| | | | | | | | |
| | | | | | | 1,181,609 | |
| | | | | | | | |
| Home Builders — 0.4% | | | | | | | | |
M/I Homes, Inc. (a) | | | 1,688 | | | | 25,962 | |
| | | | | | | | |
| | | Number of
Shares | | | Value | |
Meritage Home Corp. (a) | | | 3,012 | | | $ | 66,866 | |
Skyline Corp. | | | 700 | | | | 18,256 | |
Standard Pacific Corp. (a) | | | 9,241 | | | | 42,509 | |
Winnebago Industries, Inc. (a) | | | 2,827 | | | | 42,970 | |
| | | | | | | | |
| | | | | | | 196,563 | |
| | | | | | | | |
| Home Furnishing — 0.5% | | | | | |
Audiovox Corp. Class A (a) | | | 1,900 | | | | 16,397 | |
DTS, Inc. (a) | | | 1,635 | | | | 80,197 | |
Ethan Allen Interiors, Inc. | | | 2,743 | | | | 54,887 | |
La-Z-Boy, Inc. (a) | | | 5,000 | | | | 45,100 | |
Universal Electronics, Inc. (a) | | | 1,425 | | | | 40,427 | |
| | | | | | | | |
| | | | | | | 237,008 | |
| | | | | | | | |
| Household Products — 0.5% | | | | | |
Blyth, Inc. | | | 517 | | | | 17,826 | |
Central Garden & Pet Co. Class A (a) | | | 5,170 | | | | 51,080 | |
Helen of Troy Ltd. (a) | | | 2,921 | | | | 86,870 | |
Kid Brands, Inc. (a) | | | 1,983 | | | | 16,955 | |
The Standard Register Co. | | | 1,300 | | | | 4,433 | |
WD-40 Co. | | | 1,618 | | | | 65,173 | |
| | | | | | | | |
| | | | | | | 242,337 | |
| | | | | | | | |
| Housewares — 0.5% | | | | | | | | |
National Presto Industries, Inc. | | | 499 | | | | 64,875 | |
The Toro Co. | | | 2,993 | | | | 184,489 | |
| | | | | | | | |
| | | | | | | 249,364 | |
| | | | | | | | |
| Insurance — 2.4% | | | | | | | | |
AMERISAFE, Inc. (a) | | | 1,800 | | | | 31,500 | |
Delphi Financial Group, Inc. Class A | | | 5,199 | | | | 149,939 | |
eHealth, Inc. (a) | | | 2,063 | | | | 29,274 | |
Employers Holdings, Inc. | | | 3,783 | | | | 66,127 | |
Horace Mann Educators Corp. | | | 3,831 | | | | 69,111 | |
Infinity Property & Casualty Corp. | | | 1,207 | | | | 74,593 | |
The Navigators Group, Inc. (a) | | | 1,195 | | | | 60,168 | |
Presidential Life Corp. | | | 2,101 | | | | 20,863 | |
ProAssurance Corp. (a) | | | 2,944 | | | | 178,406 | |
RLI Corp. | | | 1,583 | | | | 83,218 | |
Safety Insurance Group, Inc. | | | 1,429 | | | | 67,978 | |
Selective Insurance Group, Inc. | | | 5,139 | | | | 93,273 | |
Stewart Information Services Corp. | | | 1,684 | | | | 19,416 | |
Tower Group, Inc. | | | 3,921 | | | | 100,299 | |
United Fire & Casualty Co. | | | 2,033 | | | | 45,377 | |
| | | | | | | | |
| | | | | | | 1,089,542 | |
| | | | | | | | |
| Internet — 1.9% | | | | | | | | |
Blue Coat Systems, Inc. (a) | | | 4,149 | | | | 123,931 | |
Blue Nile, Inc. (a) | | | 1,370 | | | | 78,172 | |
Comscore, Inc. (a) | | | 2,414 | | | | 53,856 | |
DealerTrack Holdings, Inc. (a) | | | 3,788 | | | | 76,025 | |
eResearch Technology, Inc. (a) | | | 4,118 | | | | 30,267 | |
InfoSpace, Inc. (a) | | | 3,386 | | | | 28,104 | |
j2 Global Communications, Inc. (a) | | | 4,388 | | | | 127,033 | |
The Knot, Inc. (a) | | | 3,006 | | | | 29,699 | |
The accompanying notes are an integral part of the financial statements.
76
MML Small Cap Index Fund – Portfolio of Investments (Continued)
| | | | | | | | |
| | | Number of
Shares | | | Value | |
Liquidity Services, Inc. (a) | | | 1,622 | | | $ | 22,789 | |
Nutrisystem, Inc. | | | 2,502 | | | | 52,617 | |
PC-Tel, Inc. (a) | | | 1,692 | | | | 10,152 | |
Perficient, Inc. (a) | | | 2,782 | | | | 34,775 | |
Sourcefire, Inc. (a) | | | 2,652 | | | | 68,766 | |
Stamps.com, Inc. | | | 1,162 | | | | 15,397 | |
United Online, Inc. | | | 8,003 | | | | 52,820 | |
Websense, Inc. (a) | | | 4,023 | | | | 81,466 | |
| | | | | | | | |
| | | | | | | 885,869 | |
| | | | | | | | |
| Iron & Steel — 0.1% | | | | | | | | |
Olympic Steel, Inc. | | | 902 | | | | 25,869 | |
| | | | | | | | |
| Leisure Time — 0.7% | | | | | | | | |
Arctic Cat, Inc. (a) | | | 1,149 | | | | 16,821 | |
Brunswick Corp. | | | 8,508 | | | | 159,440 | |
Callaway Golf Co. | | | 6,256 | | | | 50,486 | |
Interval Leisure Group, Inc. (a) | | | 3,935 | | | | 63,511 | |
Multimedia Games, Inc. (a) | | | 2,500 | | | | 13,950 | |
| | | | | | | | |
| | | | | | | 304,208 | |
| | | | | | | | |
| Lodging — 0.1% | | | | | | | | |
Marcus Corp. | | | 2,086 | | | | 27,681 | |
Monarch Casino & Resort, Inc. (a) | | | 1,016 | | | | 12,700 | |
| | | | | | | | |
| | | | | | | 40,381 | |
| | | | | | | | |
| Machinery – Construction & Mining — 0.1% | |
Astec Industries, Inc. (a) | | | 1,878 | | | | 60,866 | |
| | | | | | | | |
| Machinery – Diversified — 1.6% | | | | | |
Albany International Corp. Class A | | | 2,599 | | | | 61,570 | |
Applied Industrial Technologies, Inc. | | | 3,625 | | | | 117,740 | |
Briggs & Stratton Corp. | | | 4,852 | | | | 95,536 | |
Cascade Corp. | | | 888 | | | | 41,985 | |
Cognex Corp. | | | 3,852 | | | | 113,326 | |
Gerber Scientific, Inc. (a) | | | 2,500 | | | | 19,675 | |
Intermec, Inc. (a) | | | 4,517 | | | | 57,185 | |
Intevac, Inc. (a) | | | 2,105 | | | | 29,491 | |
Lindsay Corp. | | | 1,188 | | | | 70,603 | |
Robbins & Myers, Inc. | | | 3,133 | | | | 112,099 | |
| | | | | | | | |
| | | | | | | 719,210 | |
| | | | | | | | |
| Manufacturing — 2.8% | | | | | | | | |
A.O. Smith Corp. | | | 3,199 | | | | 121,818 | |
Actuant Corp. Class A | | | 6,540 | | | | 174,095 | |
AZZ, Inc. | | | 1,200 | | | | 48,012 | |
Barnes Group, Inc. | | | 4,377 | | | | 90,473 | |
Ceradyne, Inc. (a) | | | 2,360 | | | | 74,411 | |
CLARCOR, Inc. | | | 4,754 | | | | 203,899 | |
EnPro Industries, Inc. (a) | | | 1,920 | | | | 79,795 | |
ESCO Technologies, Inc. | | | 2,524 | | | | 95,508 | |
Federal Signal Corp. | | | 5,984 | | | | 41,050 | |
Griffon Corp. (a) | | | 4,412 | | | | 56,209 | |
John Bean Technologies Corp. | | | 2,700 | | | | 54,351 | |
LSB Industries, Inc. (a) | | | 1,537 | | | | 37,288 | |
Lydall, Inc. (a) | | | 1,558 | | | | 12,542 | |
Myers Industries, Inc. | | | 3,341 | | | | 32,541 | |
| | | | | | | | |
| | | Number of
Shares | | | Value | |
Standex International Corp. | | | 1,200 | | | $ | 35,892 | |
STR Holdings, Inc. (a) | | | 3,916 | | | | 78,320 | |
Sturm, Ruger & Co., Inc. | | | 1,865 | | | | 28,516 | |
Tredegar Corp. | | | 2,174 | | | | 42,132 | |
| | | | | | | | |
| | | | | | | 1,306,852 | |
| | | | | | | | |
| Media — 0.3% | | | | | | | | |
DG FastChannel, Inc. (a) | | | 2,296 | | | | 66,309 | |
The Dolan Co. (a) | | | 2,936 | | | | 40,869 | |
The E.W. Scripps Co. Class A (a) | | | 3,003 | | | | 30,480 | |
| | | | | | | | |
| | | | | | | 137,658 | |
| | | | | | | | |
| Metal Fabricate & Hardware — 0.8% | | | | | | | | |
A.M. Castle & Co. (a) | | | 1,583 | | | | 29,143 | |
Circor International, Inc. | | | 1,633 | | | | 69,043 | |
Kaydon Corp. | | | 3,212 | | | | 130,793 | |
Lawson Products, Inc. | | | 380 | | | | 9,458 | |
Mueller Industries, Inc. | | | 3,625 | | | | 118,538 | |
| | | | | | | | |
| | | | | | | 356,975 | |
| | | | | | | | |
| Mining — 0.8% | | | | | | | | |
AMCOL International Corp. | | | 2,389 | | | | 74,059 | |
Brush Engineered Materials, Inc. (a) | | | 1,943 | | | | 75,078 | |
Century Aluminum Co. (a) | | | 5,315 | | | | 82,542 | |
Kaiser Aluminum Corp. | | | 1,410 | | | | 70,627 | |
RTI International Metals, Inc. (a) | | | 2,890 | | | | 77,972 | |
| | | | | | | | |
| | | | | | | 380,278 | |
| | | | | | | | |
| Office Furnishings — 0.2% | | | | | |
Interface, Inc. Class A | | | 6,168 | | | | 96,529 | |
| | | | | | | | |
| Oil & Gas — 1.8% | | | | | | | | |
Contango Oil & Gas Co. (a) | | | 1,225 | | | | 70,964 | |
Gulfport Energy Corp. (a) | | | 3,025 | | | | 65,491 | |
Holly Corp. | | | 4,231 | | | | 172,498 | |
Penn Virginia Corp. | | | 4,377 | | | | 73,621 | |
Petroleum Development Corp. (a) | | | 2,253 | | | | 95,099 | |
PetroQuest Energy, Inc. (a) | | | 5,220 | | | | 39,307 | |
Pioneer Drilling Co. (a) | | | 5,213 | | | | 45,926 | |
Seahawk Drilling, Inc. (a) | | | 1,200 | | | | 10,740 | |
Stone Energy Corp. (a) | | | 4,621 | | | | 103,002 | |
Swift Energy Co. (a) | | | 3,997 | | | | 156,483 | |
| | | | | | | | |
| | | | | | | 833,131 | |
| | | | | | | | |
| Oil & Gas Services — 2.7% | | | | | |
Basic Energy Services, Inc. (a) | | | 2,254 | | | | 37,146 | |
CARBO Ceramics, Inc. | | | 1,810 | | | | 187,407 | |
Gulf Island Fabrication, Inc. | | | 1,332 | | | | 37,536 | |
Hornbeck Offshore Services, Inc. (a) | | | 2,212 | | | | 46,187 | |
ION Geophysical Corp. (a) | | | 14,553 | | | | 123,409 | |
Lufkin Industries, Inc. | | | 2,888 | | | | 180,182 | |
Matrix Service Co. (a) | | | 2,588 | | | | 31,522 | |
Oil States International, Inc. (a) | | | 4,816 | | | | 308,657 | |
SEACOR Holdings, Inc. | | | 2,020 | | | | 204,202 | |
TETRA Technologies, Inc. (a) | | | 7,216 | | | | 85,654 | |
| | | | | | | | |
| | | | | | | 1,241,902 | |
| | | | | | | | |
The accompanying notes are an integral part of the financial statements.
77
MML Small Cap Index Fund – Portfolio of Investments (Continued)
| | | | | | | | |
| | | Number of
Shares | | | Value | |
| Pharmaceuticals — 2.7% | | | | | | | | |
Align Technology, Inc. (a) | | | 6,514 | | | $ | 127,284 | |
Catalyst Health Solutions, Inc. (a) | | | 3,744 | | | | 174,058 | |
Cubist Pharmaceuticals, Inc. (a) | | | 5,679 | | | | 121,531 | |
Emergent Biosolutions, Inc. (a) | | | 2,076 | | | | 48,703 | |
Hi-Tech Pharmacal Co., Inc. (a) | | | 1,010 | | | | 25,199 | |
Neogen Corp. (a) | | | 2,165 | | | | 88,830 | |
Par Pharmaceutical Cos., Inc. (a) | | | 3,405 | | | | 131,126 | |
PetMed Express, Inc. | | | 2,200 | | | | 39,182 | |
PharMerica Corp. (a) | | | 2,786 | | | | 31,900 | |
Salix Pharmaceuticals Ltd. (a) | | | 5,507 | | | | 258,609 | |
Savient Pharmaceuticals, Inc. (a) | | | 6,729 | | | | 74,961 | |
ViroPharma, Inc. (a) | | | 7,494 | | | | 129,796 | |
| | | | | | | | |
| | | | | | | 1,251,179 | |
| | | | | | | | |
| Real Estate — 0.1% | | | | | | | | |
Forestar Real Esate Group, Inc. (a) | | | 3,423 | | | | 66,064 | |
| | | | | | | | |
| Real Estate Investment Trusts (REITS) — 7.6% | |
Acadia Realty Trust | | | 3,891 | | | | 70,972 | |
BioMed Realty Trust, Inc. | | | 12,534 | | | | 233,759 | |
Cedar Shopping Centers, Inc. | | | 4,426 | | | | 27,840 | |
Colonial Properties Trust | | | 7,939 | | | | 143,299 | |
DiamondRock Hospitality Co. (a) | | | 14,617 | | | | 175,404 | |
Eastgroup Properties | | | 2,578 | | | | 109,101 | |
Entertainment Properties Trust | | | 4,446 | | | | 205,627 | |
Extra Space Storage, Inc. | | | 8,254 | | | | 143,620 | |
Franklin Street Properties Corp. | | | 6,652 | | | | 94,791 | |
Healthcare Realty Trust, Inc. | | | 6,163 | | | | 130,471 | |
Home Properties, Inc. | | | 3,579 | | | | 198,599 | |
Inland Real Estate Corp. | | | 7,085 | | | | 62,348 | |
Kilroy Realty Corp. | | | 5,013 | | | | 182,824 | |
Kite Realty Group Trust | | | 5,878 | | | | 31,800 | |
LaSalle Hotel Properties | | | 7,001 | | | | 184,826 | |
Lexington Realty Trust | | | 11,888 | | | | 94,510 | |
LTC Properties, Inc. | | | 2,518 | | | | 70,705 | |
Medical Properties Trust, Inc. | | | 10,490 | | | | 113,607 | |
Mid-America Apartment Communities, Inc. | | | 3,270 | | | | 207,612 | |
National Retail Properties, Inc. | | | 7,988 | | | | 211,682 | |
Parkway Properties, Inc. | | | 2,092 | | | | 36,652 | |
Pennsylvania Real Estate Investment Trust | | | 5,280 | | | | 76,718 | |
Post Properties, Inc. | | | 4,666 | | | | 169,376 | |
PS Business Parks, Inc. | | | 1,791 | | | | 99,794 | |
Saul Centers, Inc. | | | 1,099 | | | | 52,038 | |
Sovran Self Storage, Inc. | | | 2,645 | | | | 97,362 | |
Tanger Factory Outlet Centers, Inc. | | | 3,875 | | | | 198,361 | |
Universal Health Realty Income Trust | | | 1,226 | | | | 44,786 | |
Urstadt Biddle Properties, Inc. Class A | | | 2,238 | | | | 43,529 | |
| | | | | | | | |
| | | | | | | 3,512,013 | |
| | | | | | | | |
| Retail — 8.7% | | | | | | | | |
Big 5 Sporting Goods Corp. | | | 2,071 | | | | 31,624 | |
Biglari Holdings, Inc. (a) | | | 137 | | | | 56,199 | |
| | | | | | | | |
| | | Number of
Shares | | | Value | |
BJ’s Restaurants, Inc. (a) | | | 2,154 | | | $ | 76,316 | |
Brown Shoe Co., Inc. | | | 4,135 | | | | 57,601 | |
The Buckle, Inc. | | | 2,504 | | | | 94,576 | |
Buffalo Wild Wings, Inc. (a) | | | 1,739 | | | | 76,255 | |
Cabela’s, Inc. (a) | | | 3,858 | | | | 83,912 | |
California Pizza Kitchen, Inc. (a) | | | 2,300 | | | | 39,744 | |
Casey’s General Stores, Inc. | | | 3,595 | | | | 152,823 | |
Cash America International, Inc. | | | 2,845 | | | | 105,066 | |
The Cato Corp. Class A | | | 2,833 | | | | 77,653 | |
CEC Entertainment, Inc. (a) | | | 1,960 | | | | 76,107 | |
The Children’s Place Retail Store, Inc. (a) | | | 2,493 | | | | 123,753 | |
Christopher & Banks Corp. | | | 3,400 | | | | 20,910 | |
Coldwater Creek, Inc. (a) | | | 5,802 | | | | 18,392 | |
Cracker Barrel Old Country Store, Inc. | | | 2,239 | | | | 122,630 | |
DineEquity, Inc. (a) | | | 1,489 | | | | 73,527 | |
EZCORP, Inc. Class A (a) | | | 4,787 | | | | 129,871 | |
The Finish Line, Inc. Class A | | | 5,119 | | | | 87,996 | |
First Cash Financial Services, Inc. (a) | | | 2,894 | | | | 89,685 | |
Fred’s, Inc. Class A | | | 3,767 | | | | 51,834 | |
Genesco, Inc. (a) | | | 2,254 | | | | 84,502 | |
Group 1 Automotive, Inc. | | | 2,278 | | | | 95,129 | |
Haverty Furniture Cos., Inc. | | | 1,800 | | | | 23,364 | |
Hibbett Sports, Inc. (a) | | | 2,635 | | | | 97,232 | |
Hot Topic, Inc. | | | 4,306 | | | | 26,999 | |
HSN, Inc. (a) | | | 3,705 | | | | 113,521 | |
Insight Enterprises, Inc. (a) | | | 4,370 | | | | 57,509 | |
Jack in the Box, Inc. (a) | | | 5,086 | | | | 107,467 | |
Jo-Ann Stores, Inc. (a) | | | 2,525 | | | | 152,055 | |
Jos. A. Bank Clothiers, Inc. (a) | | | 2,629 | | | | 106,001 | |
Kirkland’s, Inc. (a) | | | 1,494 | | | | 20,961 | |
Lithia Motors, Inc. Class A | | | 2,116 | | | | 30,238 | |
Liz Claiborne, Inc. (a) | | | 9,041 | | | | 64,734 | |
Lumber Liquidators Holdings, Inc. (a) | | | 2,228 | | | | 55,499 | |
MarineMax, Inc. (a) | | | 2,207 | | | | 20,635 | |
The Men’s Wearhouse, Inc. | | | 5,059 | | | | 126,374 | |
Movado Group, Inc. (a) | | | 1,620 | | | | 26,147 | |
O’Charley’s, Inc. (a) | | | 1,771 | | | | 12,751 | |
OfficeMax, Inc. (a) | | | 8,063 | | | | 142,715 | |
P.F. Chang’s China Bistro, Inc. | | | 2,194 | | | | 106,321 | |
Papa John’s International, Inc. (a) | | | 1,955 | | | | 54,154 | |
The Pep Boys-Manny, Moe & Jack | | | 5,010 | | | | 67,284 | |
Red Robin Gourmet Burgers, Inc. (a) | | | 1,497 | | | | 32,141 | |
Ruby Tuesday, Inc. (a) | | | 6,209 | | | | 81,090 | |
Ruth’s Hospitality Group, Inc. (a) | | | 3,192 | | | | 14,779 | |
School Specialty, Inc. (a) | | | 1,581 | | | | 22,023 | |
Sonic Automotive, Inc. Class A | | | 3,364 | | | | 44,539 | |
Sonic Corp. (a) | | | 5,872 | | | | 59,425 | |
Stage Stores, Inc. | | | 3,462 | | | | 60,031 | |
Stein Mart, Inc. | | | 2,464 | | | | 22,792 | |
Texas Roadhouse, Inc. (a) | | | 5,595 | | | | 96,066 | |
Tuesday Morning Corp. (a) | | | 3,640 | | | | 19,219 | |
World Fuel Services Corp. | | | 6,625 | | | | 239,560 | |
The accompanying notes are an integral part of the financial statements.
78
MML Small Cap Index Fund – Portfolio of Investments (Continued)
| | | | | | | | |
| | | Number of
Shares | | | Value | |
Zale Corp. (a) | | | 1,871 | | | $ | 7,970 | |
Zumiez, Inc. (a) | | | 1,999 | | | | 53,713 | |
| | | | | | | | |
| | | | | | | 3,991,414 | |
| | | | | | | | |
| Savings & Loans — 0.4% | | | | | | | | |
Brookline Bancorp, Inc. | | �� | 5,734 | | | | 62,214 | |
Dime Community Bancshares | | | 2,620 | | | | 38,226 | |
Provident Financial Services, Inc. | | | 4,917 | | | | 74,394 | |
| | | | | | | | |
| | | | | | | 174,834 | |
| | | | | | | | |
| Semiconductors — 5.3% | | | | | | | | |
ATMI, Inc. (a) | | | 2,955 | | | | 58,923 | |
Brooks Automation, Inc. (a) | | | 6,273 | | | | 56,896 | |
Cabot Microelectronics Corp. (a) | | | 2,202 | | | | 91,273 | |
Ceva, Inc. (a) | | | 2,123 | | | | 43,521 | |
Cohu, Inc. | | | 2,266 | | | | 37,570 | |
Cypress Semiconductor Corp. (a) | | | 15,888 | | | | 295,199 | |
Diodes, Inc. (a) | | | 3,469 | | | | 93,628 | |
DSP Group, Inc. (a) | | | 2,123 | | | | 17,281 | |
Exar Corp. (a) | | | 4,184 | | | | 29,204 | |
Hittite Microwave Corp. (a) | | | 2,279 | | | | 139,110 | |
Kopin Corp. (a) | | | 6,383 | | | | 26,553 | |
Kulicke & Soffa Industries, Inc. (a) | | | 6,541 | | | | 47,095 | |
Micrel, Inc. | | | 4,826 | | | | 62,690 | |
Microsemi Corp. (a) | | | 8,000 | | | | 183,200 | |
MKS Instruments, Inc. (a) | | | 4,748 | | | | 116,279 | |
Monolithic Power Systems, Inc. (a) | | | 3,290 | | | | 54,351 | |
Pericom Semiconductor Corp. (a) | | | 2,469 | | | | 27,110 | |
Power Integrations, Inc. | | | 2,697 | | | | 108,258 | |
Rudolph Technologies, Inc. (a) | | | 2,923 | | | | 24,056 | |
Sigma Designs, Inc. (a) | | | 2,600 | | | | 36,842 | |
Standard Microsystems Corp. (a) | | | 2,173 | | | | 62,648 | |
Supertex, Inc. (a) | | | 1,216 | | | | 29,403 | |
Tessera Technologies, Inc. (a) | | | 4,861 | | | | 107,671 | |
TriQuint Semiconductor, Inc. (a) | | | 15,237 | | | | 178,121 | |
Ultratech, Inc. (a) | | | 2,267 | | | | 45,068 | |
Varian Semiconductor Equipment Associates, Inc. (a) | | | 7,083 | | | | 261,859 | |
Veeco Instruments, Inc. (a) | | | 3,823 | | | | 164,236 | |
Volterra Semiconductor Corp. (a) | | | 2,595 | | | | 60,100 | |
| | | | | | | | |
| | | | | | | 2,458,145 | |
| | | | | | | | |
| Software — 3.8% | | | | | | | | |
Avid Technology, Inc. (a) | | | 2,749 | | | | 47,998 | |
Blackbaud, Inc. | | | 4,182 | | | | 108,314 | |
Bottomline Technologies, Inc. (a) | | | 3,114 | | | | 67,605 | |
CommVault Systems, Inc. (a) | | | 4,109 | | | | 117,600 | |
Computer Programs & Systems, Inc. | | | 1,046 | | | | 48,995 | |
CSG Systems International, Inc. (a) | | | 3,269 | | | | 61,915 | |
Digi International, Inc. (a) | | | 2,516 | | | | 27,928 | |
Ebix, Inc. (a) | | | 3,312 | | | | 78,395 | |
Epicor Software Corp. (a) | | | 4,401 | | | | 44,450 | |
EPIQ Systems, Inc. | | | 3,050 | | | | 41,877 | |
Interactive Intelligence, Inc. (a) | | | 1,284 | | | | 33,589 | |
| | | | | | | | |
| | | Number of
Shares | | | Value | |
JDA Software Group, Inc. (a) | | | 4,201 | | | $ | 117,628 | |
MicroStrategy, Inc. Class A (a) | | | 805 | | | | 68,803 | |
Omnicell, Inc. (a) | | | 3,094 | | | | 44,708 | |
Progress Software Corp. (a) | | | 4,153 | | | | 175,755 | |
Quality Systems, Inc. | | | 1,822 | | | | 127,212 | |
RightNow Technologies, Inc. (a) | | | 2,190 | | | | 51,837 | |
Smith Micro Software, Inc. (a) | | | 2,915 | | | | 45,882 | |
Synchronoss Technologies, Inc. (a) | | | 2,286 | | | | 61,059 | |
SYNNEX Corp. (a) | | | 2,245 | | | | 70,044 | |
Take-Two Interactive Software, Inc. (a) | | | 8,156 | | | | 99,829 | |
Taleo Corp. Class A (a) | | | 3,886 | | | | 107,448 | |
THQ, Inc. (a) | | | 6,555 | | | | 39,723 | |
Tyler Technologies, Inc. (a) | | | 2,417 | | | | 50,177 | |
| | | | | | | | |
| | | | | | | 1,738,771 | |
| | | | | | | | |
| Storage & Warehousing — 0.1% | | | | | |
Mobile Mini, Inc. (a) | | | 3,443 | | | | 67,793 | |
| | | | | | | | |
| Telecommunications — 2.9% | | | | | |
Anixter International, Inc. | | | 2,645 | | | | 157,986 | |
Applied Signal Technology, Inc. | | | 1,238 | | | | 46,908 | |
Arris Group, Inc. (a) | | | 11,761 | | | | 131,958 | |
Atlantic Tele-Network, Inc. | | | 857 | | | | 32,857 | |
Black Box Corp. | | | 1,680 | | | | 64,327 | |
Cbeyond, Inc. (a) | | | 2,941 | | | | 44,938 | |
Comtech Telecommunications Corp. | | | 2,645 | | | | 73,346 | |
EMS Technologies, Inc. (a) | | | 1,527 | | | | 30,204 | |
General Communication, Inc. Class A (a) | | | 3,733 | | | | 47,260 | |
Harmonic, Inc. (a) | | | 9,409 | | | | 80,635 | |
NETGEAR, Inc. (a) | | | 3,442 | | | | 115,927 | |
Network Equipment Technologies, Inc. (a) | | | 3,000 | | | | 13,890 | |
Neutral Tandem, Inc. (a) | | | 3,252 | | | | 46,959 | |
Novatel Wireless, Inc. (a) | | | 3,091 | | | | 29,519 | |
NTELOS Holdings Corp. | | | 2,806 | | | | 53,454 | |
Oplink Communications, Inc. (a) | | | 1,861 | | | | 34,373 | |
Symmetricom, Inc. (a) | | | 4,330 | | | | 30,700 | |
Tekelec (a) | | | 6,585 | | | | 78,427 | |
Tollgrade Communications, Inc. (a) | | | 939 | | | | 8,714 | |
USA Mobility, Inc. | | | 2,069 | | | | 36,766 | |
ViaSat, Inc. (a) | | | 3,943 | | | | 175,109 | |
| | | | | | | | |
| | | | | | | 1,334,257 | |
| | | | | | | | |
| Textiles — 0.3% | | | | | | | | |
G&K Services, Inc. Class A | | | 1,798 | | | | 55,576 | |
UniFirst Corp. | | | 1,420 | | | | 78,171 | |
| | | | | | | | |
| | | | | | | 133,747 | |
| | | | | | | | |
| Toys, Games & Hobbies — 0.2% | | | | | | | | |
JAKKS Pacific, Inc. (a) | | | 2,595 | | | | 47,281 | |
RC2 Corp. (a) | | | 2,061 | | | | 44,868 | |
| | | | | | | | |
| | | | | | | 92,149 | |
| | | | | | | | |
The accompanying notes are an integral part of the financial statements.
79
MML Small Cap Index Fund – Portfolio of Investments (Continued)
| | | | | | | | |
| | | Number of
Shares | | | Value | |
| Transportation — 1.6% | | | | | | | | |
Arkansas Best Corp. | | | 2,411 | | | $ | 66,110 | |
Bristow Group, Inc. (a) | | | 3,438 | | | | 162,789 | |
Forward Air Corp. | | | 2,789 | | | | 79,152 | |
Heartland Express, Inc. | | | 4,846 | | | | 77,633 | |
Hub Group, Inc. Class A (a) | | | 3,582 | | | | 125,871 | |
Knight Transportation, Inc. | | | 5,946 | | | | 112,974 | |
Old Dominion Freight Line, Inc. (a) | | | 4,027 | | | | 128,824 | |
| | | | | | | | |
| | | | | | | 753,353 | |
| | | | | | | | |
| Water — 0.1% | | | | | | | | |
American States Water Co. | | | 1,781 | | | | 61,391 | |
| | | | | | | | |
| | |
TOTAL COMMON STOCK
(Cost $45,669,649) | | | | | | | 46,103,949 | |
| | | | | | | | |
| | |
TOTAL EQUITIES
(Cost $45,669,649) | | | | | | | 46,103,949 | |
| | | | | | | | |
| | |
| MUTUAL FUNDS — 0.1% | | | | | | | | |
| Diversified Financial — 0.1% | | | | | |
iShares S&P SmallCap 600 Index Fund | | | 323 | | | | 22,116 | |
| | | | | | | | |
| | |
TOTAL MUTUAL FUNDS
(Cost $20,130) | | | | | | | 22,116 | |
| | | | | | | | |
| | |
TOTAL LONG-TERM INVESTMENTS
(Cost $45,689,779) | | | | | | | 46,126,065 | |
| | | | | | | | |
| | |
| | | Principal
Amount | | | | |
| SHORT-TERM INVESTMENTS — 0.8% | |
| Repurchase Agreement — 0.6% | | | | | |
State Street Bank & Trust Co. Repurchase Agreement, dated 12/31/10, 0.010%, due 1/03/11 (b) | | $ | 298,536 | | | | 298,536 | |
| | | | | | | | |
| U.S. Treasury Bills — 0.2% | | | | | |
U.S. Treasury Bill
0.170%, due 5/05/11 (c) | | | 70,000 | | | | 69,959 | |
| | | | | | | | |
| | |
TOTAL SHORT-TERM INVESTMENTS
(Cost $368,495) | | | | | | | 368,495 | |
| | | | | | | | |
| | |
TOTAL INVESTMENTS — 100.8%
(Cost $46,058,274) (d) | | | | | | | 46,494,560 | |
| | |
| Other Assets/(Liabilities) — (0.8)% | | | | | | | (360,511 | ) |
| | | | | | | | |
| | |
| NET ASSETS — 100.0% | | | | | | $ | 46,134,049 | |
| | | | | | | | |
Notes to Portfolio of Investments
| (a) | Non-income producing security. |
| (b) | Maturity value of $298,536. Collateralized by U.S. Government Agency obligations with a rate of 4.000%, maturity date of 5/15/39, and an aggregate market value, including accrued interest, of $308,334. |
| (c) | This security is held as collateral for open futures contracts. (Note 2). |
| (d) | See Note 6 for aggregate cost for federal tax purposes. |
The accompanying notes are an integral part of the financial statements.
80
MML Small Company Value Fund – Portfolio of Investments
December 31, 2010
| | | | | | | | |
| | | Number of
Shares | | | Value | |
| EQUITIES — 96.7% | | | | | | | | |
| | |
| COMMON STOCK — 96.1% | | | | | | | | |
| Aerospace & Defense — 0.7% | | | | | | | | |
Kaman Corp. | | | 18,800 | | | $ | 546,516 | |
Kratos Defense & Security Solutions, Inc. (a) | | | 13,800 | | | | 181,746 | |
| | | | | | | | |
| | | | | | | 728,262 | |
| | | | | | | | |
| Agriculture — 0.3% | | | | | | | | |
Alliance One International, Inc. (a) | | | 82,800 | | | | 351,072 | |
| | | | | | | | |
| Airlines — 1.2% | | | | | | | | |
Alaska Air Group, Inc. (a) | | | 23,100 | | | | 1,309,539 | |
| | | | | | | | |
| Banks — 6.1% | | | | | | | | |
Columbia Banking System, Inc. | | | 20,200 | | | | 425,412 | |
East West Bancorp, Inc. | | | 77,100 | | | | 1,507,305 | |
Glacier Bancorp, Inc. | | | 51,100 | | | | 772,121 | |
Home Bancshares, Inc. | | | 33,670 | | | | 741,750 | |
Signature Bank (a) | | | 14,400 | | | | 720,000 | |
SVB Financial Group (a) | | | 28,000 | | | | 1,485,400 | |
Wintrust Financial Corp. | | | 28,100 | | | | 928,143 | |
| | | | | | | | |
| | | | | | | 6,580,131 | |
| | | | | | | | |
| Biotechnology — 0.5% | | | | | | | | |
Exelixis, Inc. (a) | | | 67,000 | | | | 550,070 | |
| | | | | | | | |
| Building Materials — 2.4% | | | | | | | | |
Comfort Systems USA, Inc. | | | 34,800 | | | | 458,316 | |
Drew Industries, Inc. | | | 35,900 | | | | 815,648 | |
Gibraltar Industries, Inc. (a) | | | 40,000 | | | | 542,800 | |
Universal Forest Products, Inc. | | | 19,400 | | | | 754,660 | |
| | | | | | | | |
| | | | | | | 2,571,424 | |
| | | | | | | | |
| Chemicals — 2.4% | | | | | | | | |
American Vanguard Corp. | | | 34,800 | | | | 297,192 | |
Arch Chemicals, Inc. | | | 25,250 | | | | 957,733 | |
Innospec, Inc. (a) | | | 37,400 | | | | 762,960 | |
Minerals Technologies, Inc. | | | 9,000 | | | | 588,690 | |
| | | | | | | | |
| | | | | | | 2,606,575 | |
| | | | | | | | |
| Coal — 0.6% | | | | | | | | |
Cloud Peak Energy, Inc. (a) | | | 26,700 | | | | 620,241 | |
| | | | | | | | |
| Commercial Services — 5.8% | | | | | | | | |
Aaron’s, Inc. | | | 93,600 | | | | 1,908,504 | |
Electro Rent Corp. | | | 46,300 | | | | 748,208 | |
FTI Consulting, Inc. (a) | | | 18,570 | | | | 692,290 | |
Landauer, Inc. | | | 9,500 | | | | 569,715 | |
McGrath Rentcorp | | | 43,700 | | | | 1,145,814 | |
Navigant Consulting, Inc. (a) | | | 49,500 | | | | 455,400 | |
On Assignment, Inc. (a) | | | 66,100 | | | | 538,715 | |
Startek, Inc. (a) | | | 36,400 | | | | 184,548 | |
| | | | | | | | |
| | | | | | | 6,243,194 | |
| | | | | | | | |
| Computers — 0.4% | | | | | | | | |
Xyratex Ltd. (a) | | | 27,000 | | | | 440,370 | |
| | | | | | | | |
| | | | | | | | |
| | | Number of
Shares | | | Value | |
| Distribution & Wholesale — 3.4% | | | | | | | | |
Beacon Roofing Supply, Inc. (a) | | | 78,000 | | | $ | 1,393,860 | |
Owens & Minor, Inc. | | | 55,950 | | | | 1,646,608 | |
Pool Corp. | | | 29,600 | | | | 667,184 | |
| | | | | | | | |
| | | | | | | 3,707,652 | |
| | | | | | | | |
| Diversified Financial — 2.8% | | | | | | | | |
GFI Group, Inc. | | | 135,400 | | | | 635,026 | |
JMP Group, Inc. | | | 25,900 | | | | 197,617 | |
Piper Jaffray Cos., Inc. (a) | | | 10,100 | | | | 353,601 | |
Stifel Financial Corp. (a) | | | 30,650 | | | | 1,901,526 | |
| | | | | | | | |
| | | | | | | 3,087,770 | |
| | | | | | | | |
| Electric — 2.9% | | | | | | | | |
Black Hills Corp. | | | 15,200 | | | | 456,000 | |
Cleco Corp. | | | 31,650 | | | | 973,554 | |
El Paso Electric Co. (a) | | | 37,000 | | | | 1,018,610 | |
The Empire District Electric Co. | | | 9,300 | | | | 206,460 | |
NorthWestern Corp. | | | 16,700 | | | | 481,461 | |
| | | | | | | | |
| | | | | | | 3,136,085 | |
| | | | | | | | |
| Electrical Components & Equipment — 2.3% | | | | | |
Advanced Energy Industries, Inc. (a) | | | 41,600 | | | | 567,424 | |
Belden, Inc. | | | 27,100 | | | | 997,822 | |
Littelfuse, Inc. | | | 19,900 | | | | 936,494 | |
| | | | | | | | |
| | | | | | | 2,501,740 | |
| | | | | | | | |
| Electronics — 3.3% | | | | | | | | |
Analogic Corp. | | | 9,540 | | | | 472,325 | |
Cymer, Inc. (a) | | | 18,200 | | | | 820,274 | |
Methode Electronics, Inc. | | | 16,600 | | | | 215,302 | |
Newport Corp. (a) | | | 29,000 | | | | 503,730 | |
Woodward Governor Co. | | | 42,700 | | | | 1,603,812 | |
| | | | | | | | |
| | | | | | | 3,615,443 | |
| | | | | | | | |
| Engineering & Construction — 1.2% | | | | | | | | |
Insituform Technologies, Inc.
Class A (a) | | | 41,400 | | | | 1,097,514 | |
Sterling Construction Co., Inc. (a) | | | 12,400 | | | | 161,696 | |
| | | | | | | | |
| | | | | | | 1,259,210 | |
| | | | | | | | |
| Entertainment — 0.5% | | | | | | | | |
Ascent Media Corp. Series A (a) | | | 12,700 | | | | 492,252 | |
| | | | | | | | |
| Environmental Controls — 1.5% | | | | | | | | |
Mine Safety Appliances Co. | | | 17,000 | | | | 529,210 | |
Waste Connections, Inc. | | | 39,750 | | | | 1,094,318 | |
| | | | | | | | |
| | | | | | | 1,623,528 | |
| | | | | | | | |
| Foods — 0.7% | | | | | | | | |
Nash Finch Co. | | | 17,500 | | | | 743,925 | |
| | | | | | | | |
| Forest Products & Paper — 3.1% | | | | | | | | |
Clearwater Paper Corp. (a) | | | 12,100 | | | | 947,430 | |
Deltic Timber Corp. | | | 15,800 | | | | 890,172 | |
Potlatch Corp. | | | 35,250 | | | | 1,147,387 | |
Wausau Paper Corp. | | | 49,400 | | | | 425,334 | |
| | | | | | | | |
| | | | | | | 3,410,323 | |
| | | | | | | | |
The accompanying notes are an integral part of the financial statements.
81
MML Small Company Value Fund – Portfolio of Investments (Continued)
| | | | | | | | |
| | | Number of
Shares | | | Value | |
| Gas — 1.1% | | | | | | | | |
Southwest Gas Corp. | | | 21,800 | | | $ | 799,406 | |
Vectren Corp. | | | 15,200 | | | | 385,776 | |
| | | | | | | | |
| | | | | | | 1,185,182 | |
| | | | | | | | |
| Hand & Machine Tools — 0.2% | | | | | | | | |
Franklin Electric Co., Inc. | | | 7,000 | | | | 272,440 | |
| | | | | | | | |
| Health Care – Products — 1.6% | | | | | | | | |
AngioDynamics, Inc. (a) | | | 27,700 | | | | 425,749 | |
Quidel Corp. (a) | | | 27,000 | | | | 390,150 | |
West Pharmaceutical Services, Inc. | | | 22,500 | | | | 927,000 | |
| | | | | | | | |
| | | | | | | 1,742,899 | |
| | | | | | | | |
| Health Care – Services — 1.2% | | | | | | | | |
National Healthcare Corp. | | | 16,700 | | | | 772,709 | |
Triple-S Management Corp. Class B (a) | | | 25,300 | | | | 482,724 | |
| | | | | | | | |
| | | | | | | 1,255,433 | |
| | | | | | | | |
| Home Builders — 1.6% | | | | | | | | |
M/I Homes, Inc. (a) | | | 20,500 | | | | 315,290 | |
Meritage Home Corp. (a) | | | 33,100 | | | | 734,820 | |
Winnebago Industries, Inc. (a) | | | 44,900 | | | | 682,480 | |
| | | | | | | | |
| | | | | | | 1,732,590 | |
| | | | | | | | |
| Home Furnishing — 0.3% | | | | | | | | |
Ethan Allen Interiors, Inc. | | | 14,000 | | | | 280,140 | |
Stanley Furniture Co., Inc. (a) | | | 26,400 | | | | 82,104 | |
| | | | | | | | |
| | | | | | | 362,244 | |
| | | | | | | | |
| Household Products — 0.4% | | | | | | | | |
CSS Industries, Inc. | | | 19,500 | | | | 401,895 | |
| | | | | | | | |
| Insurance — 4.6% | | | | | | | | |
Alterra Capital Holdings Ltd. | | | 35,400 | | | | 766,056 | |
Employers Holdings, Inc. | | | 19,500 | | | | 340,860 | |
Fortegra Financial Corp. (a) | | | 8,300 | | | | 91,715 | |
Markel Corp. (a) | | | 1,720 | | | | 650,384 | |
National Interstate Corp. | | | 28,700 | | | | 614,180 | |
ProAssurance Corp. (a) | | | 30,500 | | | | 1,848,300 | |
Radian Group, Inc. | | | 80,100 | | | | 646,407 | |
| | | | | | | | |
| | | | | | | 4,957,902 | |
| | | | | | | | |
| Internet — 0.6% | | | | | | | | |
Websense, Inc. (a) | | | 31,250 | | | | 632,813 | |
| | | | | | | | |
| Investment Companies — 0.3% | | | | | | | | |
Ares Capital Corp. | | | 17,700 | | | | 291,696 | |
| | | | | | | | |
| Iron & Steel — 0.8% | | | | | | | | |
Carpenter Technology Corp. | | | 22,250 | | | | 895,340 | |
| | | | | | | | |
| Leisure Time — 0.2% | | | | | | | | |
Brunswick Corp. | | | 14,200 | | | | 266,108 | |
| | | | | | | | |
| Lodging — 0.8% | | | | | | | | |
Orient-Express Hotels Ltd. (a) | | | 70,200 | | | | 911,898 | |
| | | | | | | | |
| Machinery – Construction & Mining — 0.4% | | | | | |
Astec Industries, Inc. (a) | | | 12,600 | | | | 408,366 | |
| | | | | | | | |
| | | | | | | | |
| | | Number of
Shares | | | Value | |
| Machinery – Diversified — 4.4% | | | | | | | | |
Cascade Corp. | | | 13,200 | | | $ | 624,096 | |
IDEX Corp. | | | 28,600 | | | | 1,118,832 | |
Nordson Corp. | | | 22,000 | | | | 2,021,360 | |
Robbins & Myers, Inc. | | | 28,500 | | | | 1,019,730 | |
| | | | | | | | |
| | | | | | | 4,784,018 | |
| | | | | | | | |
| Manufacturing — 3.7% | | | | | | | | |
Ameron International Corp. | | | 11,400 | | | | 870,618 | |
AptarGroup, Inc. | | | 32,800 | | | | 1,560,296 | |
Matthews International Corp. Class A | | | 30,150 | | | | 1,054,647 | |
Myers Industries, Inc. | | | 52,900 | | | | 515,246 | |
| | | | | | | | |
| | | | | | | 4,000,807 | |
| | | | | | | | |
| Media — 0.5% | | | | | | | | |
The Dolan Co. (a) | | | 18,800 | | | | 261,696 | |
Saga Communications, Inc.
Class A (a) | | | 10,200 | | | | 268,464 | |
| | | | | | | | |
| | | | | | | 530,160 | |
| | | | | | | | |
| Metal Fabricate & Hardware — 1.5% | | | | | | | | |
Circor International, Inc. | | | 17,100 | | | | 722,988 | |
Sims Group Ltd. Sponsored ADR (Australia) | | | 40,000 | | | | 873,600 | |
| | | | | | | | |
| | | | | | | 1,596,588 | |
| | | | | | | | |
| Mining — 2.1% | | | | | | | | |
AMCOL International Corp. | | | 20,100 | | | | 623,100 | |
Franco-Nevada Corp. | | | 21,800 | | | | 728,931 | |
North American Palladium Ltd. (a) | | | 21,100 | | | | 146,434 | |
Royal Gold, Inc. | | | 14,560 | | | | 795,413 | |
| | | | | | | | |
| | | | | | | 2,293,878 | |
| | | | | | | | |
| Oil & Gas — 4.3% | | | | | | | | |
Atwood Oceanics, Inc. (a) | | | 12,800 | | | | 478,336 | |
Forest Oil Corp. (a) | | | 20,450 | | | | 776,486 | |
Hercules Offshore, Inc. (a) | | | 42,100 | | | | 145,666 | |
Northern Oil and Gas, Inc. (a) | | | 38,800 | | | | 1,055,748 | |
Oasis Petroleum, Inc. (a) | | | 41,800 | | | | 1,133,616 | |
Penn Virginia Corp. | | | 52,000 | | | | 874,640 | |
Whiting Petroleum Corp. (a) | | | 1,631 | | | | 191,137 | |
| | | | | | | | |
| | | | | | | 4,655,629 | |
| | | | | | | | |
| Oil & Gas Services — 1.8% | | | | | | | | |
CARBO Ceramics, Inc. | | | 10,750 | | | | 1,113,055 | |
TETRA Technologies, Inc. (a) | | | 58,700 | | | | 696,769 | |
Union Drilling, Inc. (a) | | | 19,400 | | | | 141,232 | |
| | | | | | | | |
| | | | | | | 1,951,056 | |
| | | | | | | | |
| Real Estate Investment Trusts (REITS) — 6.9% | | | | | |
Acadia Realty Trust | | | 34,000 | | | | 620,160 | |
CBL & Associates Properties, Inc. | | | 93,100 | | | | 1,629,250 | |
Cedar Shopping Centers, Inc. | | | 43,500 | | | | 273,615 | |
First Potomac Realty Trust | | | 51,700 | | | | 869,594 | |
Kilroy Realty Corp. | | | 32,300 | | | | 1,177,981 | |
LaSalle Hotel Properties | | | 38,150 | | | | 1,007,160 | |
The accompanying notes are an integral part of the financial statements.
82
MML Small Company Value Fund – Portfolio of Investments (Continued)
| | | | | | | | |
| | | Number of
Shares | | | Value | |
Parkway Properties, Inc. | | | 15,100 | | | $ | 264,552 | |
Pebblebrook Hotel Trust | | | 35,700 | | | | 725,424 | |
Washington Real Estate Investment Trust | | | 30,100 | | | | 932,799 | |
| | | | | | | | |
| | | | | | | 7,500,535 | |
| | | | | | | | |
| Retail — 2.5% | | | | | | | | |
Fred’s, Inc. Class A | | | 34,500 | | | | 474,720 | |
Haverty Furniture Cos., Inc. | | | 41,800 | | | | 542,564 | |
MarineMax, Inc. (a) | | | 35,100 | | | | 328,185 | |
The Men’s Wearhouse, Inc. | | | 29,300 | | | | 731,914 | |
Stein Mart, Inc. | | | 64,600 | | | | 597,550 | |
| | | | | | | | |
| | | | | | | 2,674,933 | |
| | | | | | | | |
| Semiconductors — 1.8% | | | | | | | | |
ATMI, Inc. (a) | | | 19,200 | | | | 382,848 | |
Brooks Automation, Inc. (a) | | | 48,000 | | | | 435,360 | |
Cabot Microelectronics Corp. (a) | | | 9,400 | | | | 389,630 | |
Teradyne, Inc. (a) | | | 54,600 | | | | 766,584 | |
| | | | | | | | |
| | | | | | | 1,974,422 | |
| | | | | | | | |
| Software — 2.3% | | | | | | | | |
Accelrys, Inc. (a) | | | 27,410 | | | | 227,503 | |
Progress Software Corp. (a) | | | 34,850 | | | | 1,474,852 | |
SYNNEX Corp. (a) | | | 24,500 | | | | 764,400 | |
| | | | | | | | |
| | | | | | | 2,466,755 | |
| | | | | | | | |
| Telecommunications — 1.6% | | | | | | | | |
Ixia (a) | | | 56,900 | | | | 954,782 | |
Premiere Global Services, Inc. (a) | | | 61,500 | | | | 418,200 | |
Sonus Networks, Inc. (a) | | | 135,100 | | | | 360,717 | |
| | | | | | | | |
| | | | | | | 1,733,699 | |
| | | | | | | | |
| Textiles — 0.8% | | | | | | | | |
Culp, Inc. (a) | | | 21,800 | | | | 225,848 | |
G&K Services, Inc. Class A | | | 22,400 | | | | 692,384 | |
| | | | | | | | |
| | | | | | | 918,232 | |
| | | | | | | | |
| Transportation — 5.7% | | | | | | | | |
Genesee & Wyoming, Inc. Class A (a) | | | 34,250 | | | | 1,813,537 | |
Kirby Corp. (a) | | | 33,950 | | | | 1,495,498 | |
Landstar System, Inc. | | | 46,750 | | | | 1,913,945 | |
UTI Worldwide, Inc. | | | 45,200 | | | | 958,240 | |
| | | | | | | | |
| | | | | | | 6,181,220 | |
| | | | | | | | |
| | |
TOTAL COMMON STOCK
(Cost $76,873,808) | | | | | | | 104,157,544 | |
| | | | | | | | |
|
| CONVERTIBLE PREFERRED STOCK — 0.6% | |
| Banks — 0.1% | | | | | | | | |
East West Bancorp, Inc., Series A 8.000% | | | 100 | | | | 146,841 | |
| | | | | | | | |
| | | | | | | | |
| | | Number of
Shares | | | Value | |
| Insurance — 0.5% | | | | | | | | |
Assured Guaranty Ltd. 8.500% | | | 7,400 | | | $ | 529,100 | |
| | | | | | | | |
| | |
TOTAL CONVERTIBLE PREFERRED STOCK
(Cost $522,016) | | | | | | | 675,941 | |
| | | | | | | | |
| | |
TOTAL EQUITIES
(Cost $77,395,824) | | | | | | | 104,833,485 | |
| | | | | | | | |
| | |
| MUTUAL FUNDS — 0.4% | | | | | | | | |
| Diversified Financial — 0.4% | | | | | | | | |
iShares Russell 2000 Value Index Fund | | | 7,000 | | | | 497,630 | |
T. Rowe Price Reserve Investment Fund | | | 1,140 | | | | 1,140 | |
| | | | | | | | |
| | | | | | | 498,770 | |
| | | | | | | | |
| | |
TOTAL MUTUAL FUNDS
(Cost $464,680) | | | | | | | 498,770 | |
| | | | | | | | |
| | |
TOTAL LONG-TERM INVESTMENTS
(Cost $77,860,504) | | | | | | | 105,332,255 | |
| | | | | | | | |
| | |
| | | Principal
Amount | | | | |
| |
| SHORT-TERM INVESTMENTS — 3.0% | | | | | |
| Repurchase Agreement — 3.0% | | | | | | | | |
State Street Bank & Trust Co. Repurchase Agreement, dated 12/31/10, 0.010%, due 1/03/11 (b) | | $ | 3,229,133 | | | | 3,229,133 | |
| | | | | | | | |
| | |
TOTAL SHORT-TERM INVESTMENTS
(Cost $3,229,133) | | | | | | | 3,229,133 | |
| | | | | | | | |
| | |
TOTAL INVESTMENTS — 100.1%
(Cost $81,089,637) (c) | | | | | | | 108,561,388 | |
| | |
| Other Assets/(Liabilities) — (0.1)% | | | | | | | (150,580 | ) |
| | | | | | | | |
| | |
| NET ASSETS — 100.0% | | | | | | $ | 108,410,808 | |
| | | | | | | | |
Notes to Portfolio of Investments
| ADR | American Depositary Receipt |
| (a) | Non-income producing security. |
| (b) | Maturity value of $3,229,136. Collateralized by U.S. Government Agency obligations with a rate of 4.000%, maturity date of 12/25/38, and an aggregate market value, including accrued interest, of $3,296,993. |
| (c) | See Note 6 for aggregate cost for federal tax purposes. |
The accompanying notes are an integral part of the financial statements.
83
MML Small/Mid Cap Value Fund – Portfolio of Investments
December 31, 2010
| | | | | | | | |
| | | Number of
Shares | | | Value | |
| EQUITIES — 102.6% | | | | | | | | |
| | |
| COMMON STOCK — 102.6% | | | | | | | | |
| Advertising — 1.1% | | | | | | | | |
The Interpublic Group of Companies, Inc. (a) | | | 205,300 | | | $ | 2,180,286 | |
| | | | | | | | |
| Agriculture — 0.9% | | | | | | | | |
Bunge Ltd. | | | 26,900 | | | | 1,762,488 | |
| | | | | | | | |
| Airlines — 0.6% | | | | | | | | |
Alaska Air Group, Inc. (a) | | | 21,550 | | | | 1,221,670 | |
| | | | | | | | |
| Apparel — 0.8% | | | | | | | | |
The Jones Group, Inc. | | | 95,800 | | | | 1,488,732 | |
| | | | | | | | |
| Automotive & Parts — 4.4% | | | | | | | | |
Cooper Tire & Rubber Co. | | | 76,400 | | | | 1,801,512 | |
Dana Holding Corp. (a) | | | 155,800 | | | | 2,681,318 | |
Federal-Mogul Corp. (a) | | | 106,700 | | | | 2,203,355 | |
TRW Automotive Holdings Corp. (a) | | | 37,200 | | | | 1,960,440 | |
| | | | | | | | |
| | | | | | | 8,646,625 | |
| | | | | | | | |
| Banks — 8.9% | | | | | | | | |
Associated Banc-Corp. | | | 130,200 | | | | 1,972,530 | |
CapitalSource, Inc. | | | 277,800 | | | | 1,972,380 | |
City National Corp. | | | 22,650 | | | | 1,389,804 | |
Comerica, Inc. | | | 57,900 | | | | 2,445,696 | |
Marshall & Ilsley Corp. | | | 243,100 | | | | 1,682,252 | |
Popular, Inc. (a) | | | 618,133 | | | | 1,940,938 | |
Susquehanna Bancshares, Inc. | | | 139,725 | | | | 1,352,538 | |
Umpqua Holdings Corp. | | | 101,700 | | | | 1,238,706 | |
Webster Financial Corp. | | | 83,700 | | | | 1,648,890 | |
Whitney Holding Corp. | | | 140,400 | | | | 1,986,660 | |
| | | | | | | | |
| | | | | | | 17,630,394 | |
| | | | | | | | |
| Beverages — 1.2% | | | | | | | | |
Constellation Brands, Inc. Class A (a) | | | 111,250 | | | | 2,464,188 | |
| | | | | | | | |
| Building Materials — 0.6% | | | | | | | | |
Masco Corp. | | | 97,100 | | | | 1,229,286 | |
| | | | | | | | |
| Chemicals — 4.8% | | | | | | | | |
Arch Chemicals, Inc. | | | 57,100 | | | | 2,165,803 | |
Cytec Industries, Inc. | | | 33,800 | | | | 1,793,428 | |
Huntsman Corp. | | | 123,550 | | | | 1,928,615 | |
PolyOne Corp. (a) | | | 126,800 | | | | 1,583,732 | |
Rockwood Holdings, Inc. (a) | | | 51,000 | | | | 1,995,120 | |
| | | | | | | | |
| | | | | | | 9,466,698 | |
| | | | | | | | |
| Commercial Services — 2.8% | | | | | | | | |
Convergys Corp. (a) | | | 179,000 | | | | 2,357,430 | |
Hertz Global Holdings, Inc. (a) | | | 125,100 | | | | 1,812,699 | |
Kelly Services, Inc. Class A (a) | | | 70,200 | | | | 1,319,760 | |
| | | | | | | | |
| | | | | | | 5,489,889 | |
| | | | | | | | |
| Computers — 0.7% | | | | | | | | |
NCR Corp. (a) | | | 91,700 | | | | 1,409,429 | |
| | | | | | | | |
| | | | | | | | |
| | | Number of
Shares | | | Value | |
| Distribution & Wholesale — 1.1% | | | | | | | | |
WESCO International, Inc. (a) | | | 43,000 | | | $ | 2,270,400 | |
| | | | | | | | |
| Diversified Financial — 0.6% | | | | | | | | |
MF Global (Holdings) Ltd. (a) | | | 144,600 | | | | 1,208,856 | |
| | | | | | | | |
| Electric — 5.9% | | | | | | | | |
CMS Energy Corp. | | | 128,100 | | | | 2,382,660 | |
NV Energy, Inc. | | | 170,000 | | | | 2,388,500 | |
Pepco Holdings, Inc. | | | 118,900 | | | | 2,169,925 | |
Portland General Electric Co. | | | 107,725 | | | | 2,337,632 | |
Unisource Energy Corp. | | | 65,000 | | | | 2,329,600 | |
| | | | | | | | |
| | | | | | | 11,608,317 | |
| | | | | | | | |
| Electrical Components & Equipment — 2.0% | | | | | |
EnerSys (a) | | | 43,100 | | | | 1,384,372 | |
General Cable Corp. (a) | | | 71,200 | | | | 2,498,408 | |
| | | | | | | | |
| | | | | | | 3,882,780 | |
| | | | | | | | |
| Electronics — 4.4% | | | | | | | | |
Arrow Electronics, Inc. (a) | | | 47,200 | | | | 1,616,600 | |
AU Optronics Corp. Sponsored ADR (Taiwan) (a) | | | 126,066 | | | | 1,313,608 | |
Avnet, Inc. (a) | | | 45,000 | | | | 1,486,350 | |
Flextronics International Ltd. (a) | | | 238,800 | | | | 1,874,580 | |
Thomas & Betts Corp. (a) | | | 50,800 | | | | 2,453,640 | |
| | | | | | | | |
| | | | | | | 8,744,778 | |
| | | | | | | | |
| Foods — 2.6% | | | | | | | | |
Dole Food Co., Inc. (a) | | | 22,207 | | | | 300,017 | |
Smithfield Foods, Inc. (a) | | | 117,800 | | | | 2,430,214 | |
SUPERVALU, Inc. | | | 105,600 | | | | 1,016,928 | |
Tyson Foods, Inc. Class A | | | 77,700 | | | | 1,337,994 | |
| | | | | | | | |
| | | | | | | 5,085,153 | |
| | | | | | | | |
| Gas — 4.9% | | | | | | | | |
Atmos Energy Corp. | | | 77,300 | | | | 2,411,760 | |
NiSource, Inc. | | | 139,125 | | | | 2,451,382 | |
Southern Union Co. | | | 98,000 | | | | 2,358,860 | |
UGI Corp. | | | 77,500 | | | | 2,447,450 | |
| | | | | | | | |
| | | | | | | 9,669,452 | |
| | | | | | | | |
| Health Care – Products — 1.1% | | | | | | | | |
Kinetic Concepts, Inc. (a) | | | 52,900 | | | | 2,215,452 | |
| | | | | | | | |
| Health Care – Services — 4.0% | | | | | | | | |
AMERIGROUP Corp. (a) | | | 42,500 | | | | 1,866,600 | |
Health Net, Inc. (a) | | | 92,800 | | | | 2,532,512 | |
LifePoint Hospitals, Inc. (a) | | | 58,200 | | | | 2,138,850 | |
Molina Healthcare, Inc. (a) | | | 46,600 | | | | 1,297,810 | |
| | | | | | | | |
| | | | | | | 7,835,772 | |
| | | | | | | | |
| Home Builders — 0.9% | | | | | | | | |
NVR, Inc. (a) | | | 2,725 | | | | 1,883,030 | |
| | | | | | | | |
| Household Products — 2.0% | | | | | | | | |
American Greetings Corp. Class A | | | 112,275 | | | | 2,488,014 | |
The accompanying notes are an integral part of the financial statements.
84
MML Small/Mid Cap Value Fund – Portfolio of Investments (Continued)
| | | | | | | | |
| | | Number of
Shares | | | Value | |
Avery Dennison Corp. | | | 33,500 | | | $ | 1,418,390 | |
| | | | | | | | |
| | | | | | | 3,906,404 | |
| | | | | | | | |
| Insurance — 6.3% | | | | | | | | |
AmTrust Financial Services, Inc. | | | 12,115 | | | | 212,012 | |
Aspen Insurance Holdings Ltd. | | | 80,200 | | | | 2,295,324 | |
Endurance Specialty Holdings Ltd. | | | 53,700 | | | | 2,473,959 | |
Fidelity National Financial, Inc. Class A | | | 78,700 | | | | 1,076,616 | |
Platinum Underwriters Holdings Ltd. | | | 53,000 | | | | 2,383,410 | |
Reinsurance Group of America, Inc. Class A | | | 43,600 | | | | 2,341,756 | |
Unum Group | | | 68,150 | | | | 1,650,593 | |
| | | | | | | | |
| | | | | | | 12,433,670 | |
| | | | | | | | |
| Iron & Steel — 1.9% | | | | | | | | |
Reliance Steel & Aluminum Co. | | | 45,800 | | | | 2,340,380 | |
Steel Dynamics, Inc. | | | 77,700 | | | | 1,421,910 | |
| | | | | | | | |
| | | | | | | 3,762,290 | |
| | | | | | | | |
| Leisure Time — 1.4% | | | | | | | | |
Callaway Golf Co. | | | 104,975 | | | | 847,148 | |
Royal Caribbean Cruises Ltd. (a) | | | 42,800 | | | | 2,011,600 | |
| | | | | | | | |
| | | | | | | 2,858,748 | |
| | | | | | | | |
| Lodging — 0.9% | | | | | | | | |
Wyndham Worldwide Corp. | | | 59,100 | | | | 1,770,636 | |
| | | | | | | | |
| Machinery – Construction & Mining — 1.1% | | | | | |
Terex Corp. (a) | | | 73,100 | | | | 2,269,024 | |
| | | | | | | | |
| Machinery – Diversified — 1.0% | | | | | | | | |
Briggs & Stratton Corp. | | | 96,400 | | | | 1,898,116 | |
| | | | | | | | |
| Manufacturing — 1.6% | | | | | | | | |
Teleflex, Inc. | | | 19,764 | | | | 1,063,501 | |
Trinity Industries, Inc. | | | 79,100 | | | | 2,104,851 | |
| | | | | | | | |
| | | | | | | 3,168,352 | |
| | | | | | | | |
| Media — 1.7% | | | | | | | | |
Gannett Co., Inc. | | | 101,600 | | | | 1,533,144 | |
Meredith Corp. | | | 50,900 | | | | 1,763,685 | |
| | | | | | | | |
| | | | | | | 3,296,829 | |
| | | | | | | | |
| Metal Fabricate & Hardware — 2.2% | |
Commercial Metals Co. | | | 111,100 | | | | 1,843,149 | |
Mueller Industries, Inc. | | | 75,828 | | | | 2,479,576 | |
| | | | | | | | |
| | | | | | | 4,322,725 | |
| | | | | | | | |
| Oil & Gas — 4.4% | | | | | | | | |
Forest Oil Corp. (a) | | | 64,750 | | | | 2,458,557 | |
Helmerich & Payne, Inc. | | | 39,800 | | | | 1,929,504 | |
Rowan Cos., Inc. (a) | | | 53,800 | | | | 1,878,158 | |
Swift Energy Co. (a) | | | 60,100 | | | | 2,352,915 | |
| | | | | | | | |
| | | | | | | 8,619,134 | |
| | | | | | | | |
| Oil & Gas Services — 1.5% | | | | | | | | |
Helix Energy Solutions Group, Inc. (a) | | | 129,200 | | | | 1,568,488 | |
| | | | | | | | |
| | | Number of
Shares | | | Value | |
Oil States International, Inc. (a) | | | 21,900 | | | $ | 1,403,571 | |
| | | | | | | | |
| | | | | | | 2,972,059 | |
| | | | | | | | |
| Pharmaceuticals — 1.1% | | | | | | | | |
Par Pharmaceutical Cos., Inc. (a) | | | 56,000 | | | | 2,156,560 | |
| | | | | | | | |
| Real Estate — 2.2% | | | | | | | | |
CB Richard Ellis Group, Inc.
Class A (a) | | | 87,800 | | | | 1,798,144 | |
Forest City Enterprises, Inc.
Class A (a) | | | 81,600 | | | | 1,361,904 | |
Jones Lang LaSalle, Inc. | | | 13,200 | | | | 1,107,744 | |
| | | | | | | | |
| | | | | | | 4,267,792 | |
| | | | | | | | |
| Real Estate Investment Trusts (REITS) — 7.6% | | | | | |
BioMed Realty Trust, Inc. | | | 99,900 | | | | 1,863,135 | |
BRE Properties, Inc. | | | 39,100 | | | | 1,700,850 | |
Camden Property Trust | | | 47,800 | | | | 2,580,244 | |
CBL & Associates Properties, Inc. | | | 85,800 | | | | 1,501,500 | |
DiamondRock Hospitality Co. (a) | | | 165,900 | | | | 1,990,800 | |
Entertainment Properties Trust | | | 37,600 | | | | 1,739,000 | |
Sunstone Hotel Investors, Inc. (a) | | | 163,004 | | | | 1,683,831 | |
Tanger Factory Outlet Centers, Inc. | | | 36,400 | | | | 1,863,316 | |
| | | | | | | | |
| | | | | | | 14,922,676 | |
| | | | | | | | |
| Retail — 5.5% | | | | | | | | |
AnnTaylor Stores Corp. (a) | | | 92,400 | | | | 2,530,836 | |
Foot Locker, Inc. | | | 129,600 | | | | 2,542,752 | |
Insight Enterprises, Inc. (a) | | | 108,500 | | | | 1,427,860 | |
Office Depot, Inc. (a) | | | 348,500 | | | | 1,881,900 | |
Signet Jewelers Ltd. (a) | | | 56,400 | | | | 2,447,760 | |
| | | | | | | | |
| | | | | | | 10,831,108 | |
| | | | | | | | |
| Savings & Loans — 2.6% | | | | | | | | |
First Niagara Financial Group, Inc. | | | 141,900 | | | | 1,983,762 | |
People’s United Financial, Inc. | | | 90,000 | | | | 1,260,900 | |
Washington Federal, Inc. | | | 109,600 | | | | 1,854,432 | |
| | | | | | | | |
| | | | | | | 5,099,094 | |
| | | | | | | | |
| Telecommunications — 1.5% | | | | | | | | |
Amdocs Ltd. (a) | | | 45,800 | | | | 1,258,126 | |
Anixter International, Inc. | | | 29,900 | | | | 1,785,927 | |
| | | | | | | | |
| | | | | | | 3,044,053 | |
| | | | | | | | |
| Transportation — 1.8% | | | | | | | | |
Con-way, Inc. | | | 37,200 | | | | 1,360,404 | |
Teekay Corp. | | | 69,400 | | | | 2,295,752 | |
| | | | | | | | |
| | | | | | | 3,656,156 | |
| | | | | | | | |
| | |
TOTAL COMMON STOCK
(Cost $163,807,508) | | | | | | | 202,649,101 | |
| | | | | | | | |
| | |
TOTAL EQUITIES
(Cost $163,807,508) | | | | | | | 202,649,101 | |
| | | | | | | | |
| | |
TOTAL LONG-TERM INVESTMENTS
(Cost $163,807,508) | | | | | | | 202,649,101 | |
| | | | | | | | |
The accompanying notes are an integral part of the financial statements.
85
MML Small/Mid Cap Value Fund – Portfolio of Investments (Continued)
| | | | | | | | |
| | |
| | | Principal
Amount | | | Value | |
| |
| SHORT-TERM INVESTMENTS — 1.1% | | | | | |
| Repurchase Agreement — 1.1% | | | | | | | | |
State Street Bank & Trust Co. Repurchase Agreement, dated 12/31/10, 0.010%, due 1/03/11 (b) | | $ | 2,139,702 | | | $ | 2,139,702 | |
| | | | | | | | |
| | |
TOTAL SHORT-TERM INVESTMENTS
(Cost $2,139,702) | | | | | | | 2,139,702 | |
| | | | | | | | |
| | |
TOTAL INVESTMENTS — 103.7%
(Cost $165,947,210) (c) | | | | | | | 204,788,803 | |
| | |
| Other Assets/(Liabilities) — (3.7)% | | | | | | | (7,260,134 | ) |
| | | | | | | | |
| | |
| NET ASSETS — 100.0% | | | | | | $ | 197,528,669 | |
| | | | | | | | |
Notes to Portfolio of Investments
| ADR | American Depositary Receipt |
| (a) | Non-income producing security. |
| (b) | Maturity value of $2,139,703. Collateralized by U.S. Government Agency obligations with a rate of 4.000%, maturity date of 8/15/39, and an aggregate market value, including accrued interest, of $2,185,636. |
| (c) | See Note 6 for aggregate cost for federal tax purposes. |
The accompanying notes are an integral part of the financial statements.
86
THIS PAGE INTENTIONALLY LEFT BLANK
MML Series Investment Fund – Financial Statements
Statements of Assets and Liabilities
December 31, 2010
| | | | | | | | |
| | | MML Asset
Allocation
Fund | | | MML
Concentrated
Growth Fund | |
| Assets: | | | | | | | | |
Investments, at value (Note 2) (a) | | $ | 136,047,713 | | | $ | 100,219,974 | |
Short-term investments, at value (Note 2) (b) | | | 6,544,847 | | | | 381,690 | |
| | | | | | | | |
Total investments | | | 142,592,560 | | | | 100,601,664 | |
| | | | | | | | |
Cash | | | - | | | | - | |
Foreign currency, at value (c) | | | - | | | | - | |
Receivables from: | | | | | | | | |
Investments sold | | | - | | | | - | |
Investment adviser (Note 3) | | | - | | | | - | |
Fund shares sold | | | 49,462 | | | | 1,546 | |
Interest and dividends | | | 529,963 | | | | 23,944 | |
Foreign taxes withheld | | | - | | | | - | |
| | | | | | | | |
Total assets | | | 143,171,985 | | | | 100,627,154 | |
| | | | | | | | |
| Liabilities: | | | | | | | | |
Payables for: | | | | | | | | |
Investments purchased | | | 8,693 | | | | - | |
Fund shares repurchased | | | 70,590 | | | | 88,231 | |
Trustees’ fees and expenses (Note 3) | | | 33,888 | | | | 16,391 | |
Affiliates (Note 3): | | | | | | | | |
Investment management fees | | | 66,421 | | | | 46,646 | |
Administration fees | | | - | | | | 18,397 | |
Service fees | | | 4,807 | | | | 1,027 | |
Accrued expense and other liabilities | | | 44,029 | | | | 39,306 | |
| | | | | | | | |
Total liabilities | | | 228,428 | | | | 209,998 | |
| | | | | | | | |
Net assets | | $ | 142,943,557 | | | $ | 100,417,156 | |
| | | | | | | | |
| Net assets consist of: | | | | | | | | |
Paid-in capital | | $ | 184,358,510 | | | $ | 133,330,941 | |
Undistributed (accumulated) net investment income (loss) | | | 2,692,343 | | | | 588,488 | |
Accumulated net realized gain (loss) on investments and foreign currency transactions | | | (64,708,138 | ) | | | (52,380,937 | ) |
Net unrealized appreciation (depreciation) on investments and foreign currency translations | | | 20,600,842 | | | | 18,878,664 | |
| | | | | | | | |
Net assets | | $ | 142,943,557 | | | $ | 100,417,156 | |
| | | | | | | | |
| | | | | | | | |
(a) Cost of investments: | | $ | 115,447,194 | | | $ | 81,341,310 | |
(b) Cost of short-term investments: | | $ | 6,544,847 | | | $ | 381,690 | |
(c) Cost of foreign currency: | | $ | - | | | $ | - | |
The accompanying notes are an integral part of the financial statements.
88
| | | | | | | | | | | | | | |
MML Equity
Income Fund | | | MML Foreign
Fund | | | MML Global
Fund | | | MML Growth
& Income
Fund | |
| | | | | | | | | | | | | | |
| $ | 567,030,080 | | | $ | 326,213,522 | | | $ | 103,488,104 | | | $ | 155,634,604 | |
| | 12,883,414 | | | | 10,432,495 | | | | 787,769 | | | | 1,372,799 | |
| | | | | | | | | | | | | | | |
| | 579,913,494 | | | | 336,646,017 | | | | 104,275,873 | | | | 157,007,403 | |
| | | | | | | | | | | | | | | |
| | 3,738 | | | | - | | | | - | | �� | | - | |
| | - | | | | 1,287,824 | | | | 6,142 | | | | - | |
| | | | | | | | | | | | | | |
| | - | | | | 10,083 | | | | 17,035 | | | | 17,743 | |
| | - | | | | - | | | | 7,009 | | | | - | |
| | - | | | | 5,953,420 | | | | 6,133 | | | | 2,483 | |
| | 842,711 | | | | 546,293 | | | | 80,680 | | | | 118,096 | |
| | - | | | | 361,400 | | | | 68,700 | | | | - | |
| | | | | | | | | | | | | | | |
| | 580,759,943 | | | | 344,805,037 | | | | 104,461,572 | | | | 157,145,725 | |
| | | | | | | | | | | | | | | |
| | | | | | | | | | | | | | |
| | | | | | | | | | | | | | |
| | - | | | | - | | | | 5,390 | | | | 77 | |
| | 4,481,263 | | | | 60,600 | | | | 42,534 | | | | 141,291 | |
| | 69,376 | | | | 49,113 | | | | 10,547 | | | | 36,510 | |
| | | | | | | | | | | | | | |
| | 362,462 | | | | 251,809 | | | | 52,460 | | | | 66,154 | |
| | - | | | | - | | | | 22,870 | | | | - | |
| | 14,396 | | | | 3,440 | | | | 762 | | | | 8,037 | |
| | 77,188 | | | | 88,436 | | | | 46,965 | | | | 43,068 | |
| | | | | | | | | | | | | | | |
| | 5,004,685 | | | | 453,398 | | | | 181,528 | | | | 295,137 | |
| | | | | | | | | | | | | | | |
| $ | 575,755,258 | | | $ | 344,351,639 | | | $ | 104,280,044 | | | $ | 156,850,588 | |
| | | | | | | | | | | | | | | |
| | | | | | | | | | | | | | |
| $ | 573,601,567 | | | $ | 377,372,425 | | | $ | 94,723,537 | | | $ | 211,518,651 | |
| | 9,513,385 | | | | 5,309,266 | | | | 945,503 | | | | 1,555,109 | |
| | (74,699,276 | ) | | | (30,710,588 | ) | | | (15,034,736 | ) | | | (79,930,054 | ) |
| | 67,339,582 | | | | (7,619,464 | ) | | | 23,645,740 | | | | 23,706,882 | |
| | | | | | | | | | | | | | | |
| $ | 575,755,258 | | | $ | 344,351,639 | | | $ | 104,280,044 | | | $ | 156,850,588 | |
| | | | | | | | | | | | | | | |
| | | | | | | | | | | | | | |
| $ | 499,689,588 | | | $ | 333,952,170 | | | $ | 79,850,301 | | | $ | 131,927,780 | |
| $ | 12,883,414 | | | $ | 10,432,495 | | | $ | 787,769 | | | $ | 1,372,799 | |
| $ | - | | | $ | 1,205,148 | | | $ | 6,087 | | | $ | - | |
89
MML Series Investment Fund – Financial Statements (Continued)
Statements of Assets and Liabilities
December 31, 2010
| | | | | | | | |
| | | MML Asset
Allocation
Fund | | | MML
Concentrated
Growth Fund | |
| Initial Class shares: | | | | | | | | |
Net assets | | $ | 134,949,287 | | | $ | - | |
| | | | | | | | |
Shares outstanding (a) | | | 15,883,214 | | | | - | |
| | | | | | | | |
Net asset value, offering price and redemption price per share | | $ | 8.50 | | | $ | - | |
| | | | | | | | |
| Class I shares: | | | | | | | | |
Net assets | | $ | - | | | $ | 75,480,358 | |
| | | | | | | | |
Shares outstanding (a) | | | - | | | | 10,508,226 | |
| | | | | | | | |
Net asset value, offering price and redemption price per share | | $ | - | | | $ | 7.18 | |
| | | | | | | | |
| Class II shares: | | | | | | | | |
Net assets | | $ | - | | | $ | 23,147,456 | |
| | | | | | | | |
Shares outstanding (a) | | | - | | | | 3,212,165 | |
| | | | | | | | |
Net asset value, offering price and redemption price per share | | $ | - | | | $ | 7.21 | |
| | | | | | | | |
| Service Class shares: | | | | | | | | |
Net assets | | $ | 7,994,270 | | | $ | - | |
| | | | | | | | |
Shares outstanding (a) | | | 945,214 | | | | - | |
| | | | | | | | |
Net asset value, offering price and redemption price per share | | $ | 8.46 | | | $ | - | |
| | | | | | | | |
| Service Class shares I: | | | | | | | | |
Net assets | | $ | - | | | $ | 1,789,342 | |
| | | | | | | | |
Shares outstanding (a) | | | - | | | | 250,854 | |
| | | | | | | | |
Net asset value, offering price and redemption price per share | | $ | - | | | $ | 7.13 | |
| | | | | | | | |
| (a) | Authorized unlimited number of shares with no par value. |
The accompanying notes are an integral part of the financial statements.
90
| | | | | | | | | | | | | | |
MML Equity
Income Fund | | | MML Foreign
Fund | | | MML Global
Fund | | | MML Growth
& Income
Fund | |
| | | | | | | | | | | | | | |
| $ | 550,834,266 | | | $ | 338,494,501 | | | $ | - | | | $ | 143,556,182 | |
| | | | | | | | | | | | | | | |
| | 58,336,732 | | | | 36,747,227 | | | | - | | | | 17,797,598 | |
| | | | | | | | | | | | | | | |
| $ | 9.44 | | | $ | 9.21 | | | $ | - | | | $ | 8.07 | |
| | | | | | | | | | | | | | | |
| | | | | | | | | | | | | | |
| $ | - | | | $ | - | | | $ | 83,761,673 | | | $ | - | |
| | | | | | | | | | | | | | | |
| | - | | | | - | | | | 9,897,043 | | | | - | |
| | | | | | | | | | | | | | | |
| $ | - | | | $ | - | | | $ | 8.46 | | | $ | - | |
| | | | | | | | | | | | | | | |
| | | | | | | | | | | | | | |
| $ | - | | | $ | - | | | $ | 19,094,589 | | | $ | - | |
| | | | | | | | | | | | | | | |
| | - | | | | - | | | | 2,227,676 | | | | - | |
| | | | | | | | | | | | | | | |
| $ | - | | | $ | - | | | $ | 8.57 | | | $ | - | |
| | | | | | | | | | | | | | | |
| | | | | | | | | | | | | | |
| $ | 24,920,992 | | | $ | 5,857,138 | | | $ | - | | | $ | 13,294,406 | |
| | | | | | | | | | | | | | | |
| | 2,649,988 | | | | 638,188 | | | | - | | | | 1,655,797 | |
| | | | | | | | | | | | | | | |
| $ | 9.40 | | | $ | 9.18 | | | $ | - | | | $ | 8.03 | |
| | | | | | | | | | | | | | | |
| | | | | | | | | | | | | | |
| $ | - | | | $ | - | | | $ | 1,423,782 | | | $ | - | |
| | | | | | | | | | | | | | | |
| | - | | | | - | | | | 168,183 | | | | - | |
| | | | | | | | | | | | | | | |
| $ | - | | | $ | - | | | $ | 8.47 | | | $ | - | |
| | | | | | | | | | | | | | | |
91
MML Series Investment Fund – Financial Statements (Continued)
Statements of Assets and Liabilities
December 31, 2010
| | | | | | | | |
| | | MML Income
& Growth
Fund | | | MML Large
Cap Growth
Fund | |
| Assets: | | | | | | | | |
Investments, at value (Note 2) (a) | | $ | 76,619,547 | | | $ | 164,860,156 | |
Short-term investments, at value (Note 2) (b) | | | 50,429 | | | | 1,930,204 | |
| | | | | | | | |
Total investments | | | 76,669,976 | | | | 166,790,360 | |
| | | | | | | | |
Receivables from: | | | | | | | | |
Investments sold | | | 75,274 | | | | 664,564 | |
Investment adviser (Note 3) | | | - | | | | - | |
Fund shares sold | | | 4,907 | | | | - | |
Interest and dividends | | | 126,303 | | | | 92,844 | |
Foreign taxes withheld | | | - | | | | 5,275 | |
| | | | | | | | |
Total assets | | | 76,876,460 | | | | 167,553,043 | |
| | | | | | | | |
| Liabilities: | | | | | | | | |
Payables for: | | | | | | | | |
Investments purchased | | | - | | | | 23,731 | |
Open forward foreign currency contracts (Note 2) | | | - | | | | - | |
Fund shares repurchased | | | 20,689 | | | | 69,064 | |
Variation margin on open futures contracts (Note 2) | | | - | | | | - | |
Trustees’ fees and expenses (Note 3) | | | 26,450 | | | | 12,431 | |
Affiliates (Note 3): | | | | | | | | |
Investment management fees | | | 41,832 | | | | 91,946 | |
Administration fees | | | - | | | | - | |
Service fees | | | 2,237 | | | | 419 | |
Accrued expense and other liabilities | | | 43,232 | | | | 39,784 | |
| | | | | | | | |
Total liabilities | | | 134,440 | | | | 237,375 | |
| | | | | | | | |
Net assets | | $ | 76,742,020 | | | $ | 167,315,668 | |
| | | | | | | | |
| Net assets consist of: | | | | | | | | |
Paid-in capital | | $ | 70,751,698 | | | $ | 153,129,015 | |
Undistributed (accumulated) net investment income (loss) | | | 2,304,911 | | | | 377,258 | |
Distributions in excess of net investment income | | | - | | | | - | |
Accumulated net realized gain (loss) on investments and foreign currency transactions | | | (6,940,039 | ) | | | (10,932,654 | ) |
Net unrealized appreciation (depreciation) on investments and foreign currency translations | | | 10,625,450 | | | | 24,742,049 | |
| | | | | | | | |
Net assets | | $ | 76,742,020 | | | $ | 167,315,668 | |
| | | | | | | | |
| | | | | | | | |
(a) Cost of investments: | | $ | 65,994,827 | | | $ | 140,118,107 | |
(b) Cost of short-term investments: | | $ | 50,429 | | | $ | 1,930,204 | |
The accompanying notes are an integral part of the financial statements.
92
| | | | | | | | | | | | | | | | | | |
MML Mid
Cap Growth
Fund | | | MML Mid
Cap Value
Fund | | | MML
Small Cap
Index Fund | | | MML Small
Company
Value Fund | | | MML Small/
Mid Cap
Value Fund | |
| | | | | | | | | | | | | | | | | | |
| $ | 341,829,310 | | | $ | 431,283,770 | | | $ | 46,126,065 | | | $ | 105,332,255 | | | $ | 202,649,101 | |
| | 8,637,312 | | | | 5,047,007 | | | | 368,495 | | | | 3,229,133 | | | | 2,139,702 | |
| | | | | | | | | | | | | | | | | | | |
| | 350,466,622 | | | | 436,330,777 | | | | 46,494,560 | | | | 108,561,388 | | | | 204,788,803 | |
| | | | | | | | | | | | | | | | | | | |
| | | | | | | | | | | | | | | | | | |
| | 64,962 | | | | 3,217,037 | | | | 12,375 | | | | 129,313 | | | | 399,689 | |
| | - | | | | - | | | | - | | | | 204 | | | | - | |
| | 10,377 | | | | 429 | | | | 11,240 | | | | 118 | | | | 1,298 | |
| | 68,929 | | | | 920,677 | | | | 35,643 | | | | 79,242 | | | | 195,561 | |
| | - | | | | - | | | | - | | | | - | | | | - | |
| | | | | | | | | | | | | | | | | | | |
| | 350,610,890 | | | | 440,468,920 | | | | 46,553,818 | | | | 108,770,265 | | | | 205,385,351 | |
| | | | | | | | | | | | | | | | | | | |
| | | | | | | | | | | | | | | | | | |
| | | | | | | | | | | | | | | | | | |
| | 679,163 | | | | 6,188,236 | | | | 18,947 | | | | 161,186 | | | | 93,192 | |
| | - | | | | 59,802 | | | | - | | | | - | | | | - | |
| | 1,638,116 | | | | 4,226,945 | | | | 339,514 | | | | 53,664 | | | | 7,551,531 | |
| | - | | | | - | | | | 2,092 | | | | - | | | | - | |
| | 47,685 | | | | 63,875 | | | | 8,758 | | | | 6,096 | | | | 33,825 | |
| | | | | | | | | | | | | | | | | | |
| | 229,966 | | | | 304,464 | | | | 13,716 | | | | 76,431 | | | | 128,480 | |
| | - | | | | - | | | | - | | | | 22,480 | | | | - | |
| | 9,912 | | | | 5,539 | | | | 2,356 | | | | 1,352 | | | | 3,610 | |
| | 59,096 | | | | 71,458 | | | | 34,386 | | | | 38,248 | | | | 46,044 | |
| | | | | | | | | | | | | | | | | | | |
| | 2,663,938 | | | | 10,920,319 | | | | 419,769 | | | | 359,457 | | | | 7,856,682 | |
| | | | | | | | | | | | | | | | | | | |
| $ | 347,946,952 | | | $ | 429,548,601 | | | $ | 46,134,049 | | | $ | 108,410,808 | | | $ | 197,528,669 | |
| | | | | | | | | | | | | | | | | | | |
| | | | | | | | | | | | | | | | | | |
| $ | 268,015,763 | | | $ | 411,183,683 | | | $ | 49,221,617 | | | $ | 79,640,850 | | | $ | 222,593,550 | |
| | (709,308 | ) | | | 8,831,980 | | | | 329,731 | | | | - | | | | 1,110,263 | |
| | - | | | | - | | | | - | | | | (171,220 | ) | | | - | |
| | (14,767,039 | ) | | | (36,227,301 | ) | | | (3,859,435 | ) | | | 1,469,427 | | | | (65,016,737 | ) |
| | 95,407,536 | | | | 45,760,239 | | | | 442,136 | | | | 27,471,751 | | | | 38,841,593 | |
| | | | | | | | | | | | | | | | | | | |
| $ | 347,946,952 | | | $ | 429,548,601 | | | $ | 46,134,049 | | | $ | 108,410,808 | | | $ | 197,528,669 | |
| | | | | | | | | | | | | | | | | | | |
| | | | | | | | | | | | | | | | | | |
| $ | 246,421,879 | | | $ | 385,464,001 | | | $ | 45,689,779 | | | $ | 77,860,504 | | | $ | 163,807,508 | |
| $ | 8,637,312 | | | $ | 5,047,007 | | | $ | 368,495 | | | $ | 3,229,133 | | | $ | 2,139,702 | |
93
MML Series Investment Fund – Financial Statements (Continued)
Statements of Assets and Liabilities
December 31, 2010
| | | | | | | | |
| | | MML Income
& Growth
Fund | | | MML Large
Cap Growth
Fund | |
| Initial Class shares: | | | | | | | | |
Net assets | | $ | 72,789,297 | | | $ | 166,552,260 | |
| | | | | | | | |
Shares outstanding (a) | | | 8,698,476 | | | | 15,941,407 | |
| | | | | | | | |
Net asset value, offering price and redemption price per share | | $ | 8.37 | | | $ | 10.45 | |
| | | | | | | | |
| Class II shares: | | | | | | | | |
Net assets | | $ | - | | | $ | - | |
| | | | | | | | |
Shares outstanding (a) | | | - | | | | - | |
| | | | | | | | |
Net asset value, offering price and redemption price per share | | $ | - | | | $ | - | |
| | | | | | | | |
| Service Class shares: | | | | | | | | |
Net assets | | $ | 3,952,723 | | | $ | 763,408 | |
| | | | | | | | |
Shares outstanding (a) | | | 474,372 | | | | 73,404 | |
| | | | | | | | |
Net asset value, offering price and redemption price per share | | $ | 8.33 | | | $ | 10.40 | |
| | | | | | | | |
| Service Class I shares: | | | | | | | | |
Net assets | | $ | - | | | $ | - | |
| | | | | | | | |
Shares outstanding (a) | | | - | | | | - | |
| | | | | | | | |
Net asset value, offering price and redemption price per share | | $ | - | | | $ | - | |
| | | | | | | | |
| (a) | Authorized unlimited number of shares with no par value. |
The accompanying notes are an integral part of the financial statements.
94
| | | | | | | | | | | | | | | | | | |
MML Mid
Cap Growth
Fund | | | MML Mid
Cap Value
Fund | | | MML Small
Cap Index
Fund | | | MML Small
Company
Value Fund | | | MML
Small/Mid
Cap Value
Fund | |
| | | | | | | | | | | | | | | | | | |
| $ | 330,711,008 | | | $ | 419,862,718 | | | $ | 42,037,112 | | | $ | - | | | $ | 191,140,765 | |
| | | | | | | | | | | | | | | | | | | |
| | 27,031,739 | | | | 40,147,068 | | | | 4,283,000 | | | | - | | | | 20,642,757 | |
| | | | | | | | | | | | | | | | | | | |
| $ | 12.23 | | | $ | 10.46 | | | $ | 9.81 | | | $ | - | | | $ | 9.26 | |
| | | | | | | | | | | | | | | | | | | |
| | | | | | | | | | | | | | | | | | |
| $ | - | | | $ | - | | | $ | - | | | $ | 105,829,428 | | | $ | - | |
| | | | | | | | | | | | | | | | | | | |
| | - | | | | - | | | | - | | | | 6,116,776 | | | | - | |
| | | | | | | | | | | | | | | | | | | |
| $ | - | | | $ | - | | | $ | - | | | $ | 17.30 | | | $ | - | |
| | | | | | | | | | | | | | | | | | | |
| | | | | | | | | | | | | | | | | | |
| $ | 17,235,944 | | | $ | 9,685,883 | | | $ | 4,096,937 | | | $ | - | | | $ | 6,387,904 | |
| | | | | | | | | | | | | | | | | | | |
| | 1,416,819 | | | | 930,226 | | | | 419,321 | | | | - | | | | 692,525 | |
| | | | | | | | | | | | | | | | | | | |
| $ | 12.17 | | | $ | 10.41 | | | $ | 9.77 | | | $ | - | | | $ | 9.22 | |
| | | | | | | | | | | | | | | | | | | |
| | | | | | | | | | | | | | | | | | |
| $ | - | | | $ | - | | | $ | - | | | $ | 2,581,380 | | | $ | - | |
| | | | | | | | | | | | | | | | | | | |
| | - | | | | - | | | | - | | | | 149,752 | | | | - | |
| | | | | | | | | | | | | | | | | | | |
| $ | - | | | $ | - | | | $ | - | | | $ | 17.24 | | | $ | - | |
| | | | | | | | | | | | | | | | | | | |
95
MML Series Investment Fund – Financial Statements (Continued)
Statements of Operations
For the Year Ended December 31, 2010
| | | | | | | | |
| | | MML Asset
Allocation
Fund | | | MML
Concentrated
Growth
Fund | |
| Investment income (Note 2): | | | | | | | | |
Dividends (a) | | $ | 1,489,219 | | | $ | 1,453,535 | |
Interest | | | 2,019,926 | | | | 114 | |
| | | | | | | | |
Total investment income | | | 3,509,145 | | | | 1,453,649 | |
| | | | | | | | |
| Expenses (Note 3): | | | | | | | | |
Investment management fees | | | 769,622 | | | | 602,649 | |
Custody fees | | | 21,243 | | | | 16,359 | |
Audit fees | | | 32,641 | | | | 31,697 | |
Legal fees | | | 4,423 | | | | 1,178 | |
Proxy fees | | | 968 | | | | 969 | |
Shareholder reporting fees | | | 22,968 | | | | 17,744 | |
Trustees’ fees | | | 14,588 | | | | 10,554 | |
| | | | | | | | |
| | | 866,453 | | | | 681,150 | |
Administration fees: | | | | | | | | |
Class I | | | - | | | | 183,455 | |
Class II | | | - | | | | 31,635 | |
Service Class I | | | - | | | | 3,374 | |
Service fees: | | | | | | | | |
Service Class | | | 16,285 | | | | - | |
Service Class I | | | - | | | | 3,515 | |
| | | | | | | | |
Total expenses | | | 882,738 | | | | 903,129 | |
Expenses waived (Note 3): | | | | | | | | |
Class I fees waived by advisor | | | - | | | | - | |
Class II fees waived by advisor | | | - | | | | - | |
Service Class I fees waived by advisor | | | - | | | | - | |
Class I management fees waived | | | - | | | | (38,218 | ) |
Class II management fees waived | | | - | | | | (11,299 | ) |
Service Class I management fees waived | | | - | | | | (704 | ) |
| | | | | | | | |
Net expenses | | | 882,738 | | | | 852,908 | |
| | | | | | | | |
Net investment income (loss) | | | 2,626,407 | | | | 600,741 | |
| | | | | | | | |
| Realized and unrealized gain (loss): | | | | | | | | |
Net realized gain (loss) on: | | | | | | | | |
Investment transactions | | | 4,104,241 | | | | 13,403,850 | |
Foreign currency transactions | | | (78,520 | ) | | | - | |
| | | | | | | | |
Net realized gain (loss) | | | 4,025,721 | | | | 13,403,850 | |
| | | | | | | | |
Net change in unrealized appreciation (depreciation) on: | | | | | | | | |
Investment transactions | | | 9,770,611 | | | | (2,308,534 | ) |
Translation of assets and liabilities in foreign currencies | | | 13,679 | | | | - | |
| | | | | | | | |
Net change in unrealized appreciation (depreciation) | | | 9,784,290 | | | | (2,308,534 | ) |
| | | | | | | | |
Net realized gain (loss) and change in unrealized appreciation (depreciation) | | | 13,810,011 | | | | 11,095,316 | |
| | | | | | | | |
Net increase (decrease) in net assets resulting from operations | | $ | 16,436,418 | | | $ | 11,696,057 | |
| | | | | | | | |
| | | | | | | | |
(a) Net of withholding tax of: | | $ | 23,829 | | | $ | - | |
The accompanying notes are an integral part of the financial statements.
96
| | | | | | | | | | | | | | |
MML Equity
Income Fund | | | MML Foreign
Fund | | | MML Global
Fund | | | MML
Growth &
Income Fund | |
| | | | | | | | | | | | | | |
| $ | 13,636,103 | | | $ | 8,732,173 | | | $ | 1,776,009 | | | $ | 2,471,938 | |
| | 46,287 | | | | 1,392 | | | | 122 | | | | 182 | |
| | | | | | | | | | | | | | | |
| | 13,682,390 | | | | 8,733,565 | | | | 1,776,131 | | | | 2,472,120 | |
| | | | | | | | | | | | | | | |
| | | | | | | | | | | | | | |
| | 3,859,130 | | | | 2,733,950 | | | | 543,601 | | | | 760,034 | |
| | 48,178 | | | | 185,288 | | | | 62,479 | | | | 19,973 | |
| | 31,280 | | | | 36,688 | | | | 31,498 | | | | 31,155 | |
| | 6,521 | | | | 3,875 | | | | 1,133 | | | | 2,075 | |
| | 969 | | | | 969 | | | | 968 | | | | 970 | |
| | 78,783 | | | | 47,808 | | | | 16,185 | | | | 25,010 | |
| | 50,597 | | | | 30,619 | | | | 8,740 | | | | 15,814 | |
| | | | | | | | | | | | | | | |
| | 4,075,458 | | | | 3,039,197 | | | | 664,604 | | | | 855,031 | |
| | | | | | | | | | | | | | |
| | - | | | | - | | | | 198,687 | | | | - | |
| | - | | | | - | | | | 33,837 | | | | - | |
| | - | | | | - | | | | 2,358 | | | | - | |
| | | | | | | | | | | | | | |
| | 48,379 | | | | 11,801 | | | | - | | | | 29,358 | |
| | - | | | | - | | | | 2,105 | | | | - | |
| | | | | | | | | | | | | | | |
| | 4,123,837 | | | | 3,050,998 | | | | 901,591 | | | | 884,389 | |
| | | | | | | | | | | | | | |
| | - | | | | - | | | | (80,559 | ) | | | - | |
| | - | | | | - | | | | (21,371 | ) | | | - | |
| | - | | | | - | | | | (953 | ) | | | - | |
| | - | | | | - | | | | - | | | | - | |
| | - | | | | - | | | | - | | | | - | |
| | - | | | | - | | | | - | | | | - | |
| | | | | | | | | | | | | | | |
| | 4,123,837 | | | | 3,050,998 | | | | 798,708 | | | | 884,389 | |
| | | | | | | | | | | | | | | |
| | 9,558,553 | | | | 5,682,567 | | | | 977,423 | | | | 1,587,731 | |
| | | | | | | | | | | | | | | |
| | | | | | | | | | | | | | |
| | | | | | | | | | | | | | |
| | 1,398,081 | | | | (2,203,374 | ) | | | 3,692,691 | | | | 7,261,075 | |
| | 2,741 | | | | (35,896 | ) | | | (32,468 | ) | | | (2,250 | ) |
| | | | | | | | | | | | | | | |
| | 1,400,822 | | | | (2,239,270 | ) | | | 3,660,223 | | | | 7,258,825 | |
| | | | | | | | | | | | | | | |
| | | | | | | | | | | | | | |
| | 63,627,987 | | | | 12,535,401 | | | | 7,217,114 | | | | 7,628,931 | |
| | 1,425 | | | | 72,700 | | | | 7,540 | | | | 58 | |
| | | | | | | | | | | | | | | |
| | 63,629,412 | | | | 12,608,101 | | | | 7,224,654 | | | | 7,628,989 | |
| | | | | | | | | | | | | | | |
| | 65,030,234 | | | | 10,368,831 | | | | 10,884,877 | | | | 14,887,814 | |
| | | | | | | | | | | | | | | |
| $ | 74,588,787 | | | $ | 16,051,398 | | | $ | 11,862,300 | | | $ | 16,475,545 | |
| | | | | | | | | | | | | | | |
| | | | | | | | | | | | | | |
| $ | 107,419 | | | $ | 957,732 | | | $ | 150,239 | | | $ | 34,068 | |
97
MML Series Investment Fund – Financial Statements (Continued)
Statements of Operations
For the Year Ended December 31, 2010
| | | | | | | | |
| | | MML
Income &
Growth
Fund | | | MML
Large Cap
Growth
Fund | |
| Investment income (Note 2): | | | | | | | | |
Dividends (a) | | $ | 3,502,296 | | | $ | 1,166,259 | |
Interest | | | 400 | | | | 409 | |
| | | | | | | | |
Total investment income | | | 3,502,696 | | | | 1,166,668 | |
| | | | | | | | |
| Expenses (Note 3): | | | | | | | | |
Investment management fees | | | 965,402 | | | | 706,806 | |
Custody fees | | | 42,189 | | | | 15,384 | |
Audit fees | | | 31,726 | | | | 31,131 | |
Legal fees | | | 1,289 | | | | 1,509 | |
Proxy fees | | | 969 | | | | 968 | |
Shareholder reporting fees | | | 29,980 | | | | 15,733 | |
Trustees’ fees | | | 18,800 | | | | 8,340 | |
| | | | | | | | |
| | | 1,090,355 | | | | 779,871 | |
Administration fees: | | | | | | | | |
Class II | | | - | | | | - | |
Service Class I | | | - | | | | - | |
Service fees: | | | | | | | | |
Service Class | | | 7,588 | | | | 1,526 | |
Service Class I | | | - | | | | - | |
| | | | | | | | |
Total expenses | | | 1,097,943 | | | | 781,397 | |
Expenses waived (Note 3): | | | | | | | | |
Class II fees waived by advisor | | | - | | | | - | |
Service Class I fees waived by advisor | | | - | | | | - | |
| | | | | | | | |
Net expenses | | | 1,097,943 | | | | 781,397 | |
| | | | | | | | |
Net investment income (loss) | | | 2,404,753 | | | | 385,271 | |
| | | | | | | | |
| Realized and unrealized gain (loss): | | | | | | | | |
Net realized gain (loss) on: | | | | | | | | |
Investment transactions | | | 24,484,129 | | | | 3,403,883 | |
Futures contracts | | | 1,157,391 | | | | - | |
Foreign currency transactions | | | (70,300 | ) | | | - | |
| | | | | | | | |
Net realized gain (loss) | | | 25,571,220 | | | | 3,403,883 | |
| | | | | | | | |
Net change in unrealized appreciation (depreciation) on: | | | | | | | | |
Investment transactions | | | (18,212,318 | ) | | | 18,363,328 | |
Futures contracts | | | - | | | | - | |
Translation of assets and liabilities in foreign currencies | | | 710 | | | | - | |
| | | | | | | | |
Net change in unrealized appreciation (depreciation) | | | (18,211,608 | ) | | | 18,363,328 | |
| | | | | | | | |
Net realized gain (loss) and change in unrealized appreciation (depreciation) | | | 7,359,612 | | | | 21,767,211 | |
| | | | | | | | |
Net increase (decrease) in net assets resulting from operations | | $ | 9,764,365 | | | $ | 22,152,482 | |
| | | | | | | | |
| | | | | | | | |
(a) Net of withholding tax of: | | $ | 25,680 | | | $ | 2,040 | |
The accompanying notes are an integral part of the financial statements.
98
| | | | | | | | | | | | | | | | | | |
MML
Mid Cap
Growth
Fund | | | MML
Mid Cap
Value
Fund | | | MML
Small Cap
Index
Fund | | | MML
Small Company
Value Fund | | | MML
Small/Mid
Cap Value
Fund | |
| | | | | | | | | | | | | | | | | | |
| $ | 1,887,218 | | | $ | 12,790,630 | | | $ | 528,496 | | | $ | 1,435,503 | | | $ | 2,661,182 | |
| | 12,795 | | | | 312 | | | | 150 | | | | 245 | | | | 189 | |
| | | | | | | | | | | | | | | | | | | |
| | 1,900,013 | | | | 12,790,942 | | | | 528,646 | | | | 1,435,748 | | | | 2,661,371 | |
| | | | | | | | | | | | | | | | | | | |
| | | | | | | | | | | | | | | | | | |
| | 2,358,592 | | | | 3,297,273 | | | | 146,371 | | | | 817,942 | | | | 1,397,587 | |
| | 42,150 | | | | 72,711 | | | | 15,264 | | | | 15,007 | | | | 21,438 | |
| | 31,767 | | | | 31,800 | | | | 31,115 | | | | 29,200 | | | | 31,167 | |
| | 3,825 | | | | 4,816 | | | | 527 | | | | 1,243 | | | | 2,343 | |
| | 969 | | | | 969 | | | | 969 | | | | 968 | | | | 968 | |
| | 47,599 | | | | 61,692 | | | | 8,703 | | | | 19,003 | | | | 30,160 | |
| | 30,208 | | | | 39,541 | | | | 4,255 | | | | 9,470 | | | | 19,035 | |
| | | | | | | | | | | | | | | | | | | |
| | 2,515,110 | | | | 3,508,802 | | | | 207,204 | | | | 892,833 | | | | 1,502,698 | |
| | | | | | | | | | | | | | | | | | |
| | - | | | | - | | | | - | | | | 236,819 | | | | - | |
| | - | | | | - | | | | - | | | | 3,753 | | | | - | |
| | | | | | | | | | | | | | | | | | |
| | 31,635 | | | | 18,448 | | | | 7,912 | | | | - | | | | 12,065 | |
| | - | | | | - | | | | - | | | | 3,753 | | | | - | |
| | | | | | | | | | | | | | | | | | | |
| | 2,546,745 | | | | 3,527,250 | | | | 215,116 | | | | 1,137,158 | | | | 1,514,763 | |
| | | | | | | | | | | | | | | | | | |
| | - | | | | - | | | | - | | | | (26,381 | ) | | | - | |
| | - | | | | - | | | | - | | | | (395 | ) | | | - | |
| | | | | | | | | | | | | | | | | | | |
| | 2,546,745 | | | | 3,527,250 | | | | 215,116 | | | | 1,110,382 | | | | 1,514,763 | |
| | | | | | | | | | | | | | | | | | | |
| | (646,732 | ) | | | 9,263,692 | | | | 313,530 | | | | 325,366 | | | | 1,146,608 | |
| | | | | | | | | | | | | | | | | | | |
| | | | | | | | | | | | | | | | | | |
| | | | | | | | | | | | | | | | | | |
| | 21,872,921 | | | | 65,920,967 | | | | (17,612 | ) | | | 10,205,174 | | | | 17,419,713 | |
| | - | | | | - | | | | 77,027 | | | | - | | | | - | |
| | (1,160 | ) | | | (234,144 | ) | | | - | | | | 121 | | | | - | |
| | | | | | | | | | | | | | | | | | | |
| | 21,871,761 | | | | 65,686,823 | | | | 59,415 | | | | 10,205,295 | | | | 17,419,713 | |
| | | | | | | | | | | | | | | | | | | |
| | | | | | | | | | | | | | | | | | |
| | 56,982,089 | | | | (1,533,682 | ) | | | 9,399,439 | | | | 10,266,951 | | | | 27,693,877 | |
| | - | | | | - | | | | 2,172 | | | | - | | | | - | |
| | (25 | ) | | | (196,124 | ) | | | - | | | | - | | | | - | |
| | | | | | | | | | | | | | | | | | | |
| | 56,982,064 | | | | (1,729,806 | ) | | | 9,401,611 | | | | 10,266,951 | | | | 27,693,877 | |
| | | | | | | | | | | | | | | | | | | |
| | 78,853,825 | | | | 63,957,017 | | | | 9,461,026 | | | | 20,472,246 | | | | 45,113,590 | |
| | | | | | | | | | | | | | | | | | | |
| $ | 78,207,093 | | | $ | 73,220,709 | | | $ | 9,774,556 | | | $ | 20,797,612 | | | $ | 46,260,198 | |
| | | | | | | | | | | | | | | | | | | |
| | | | | | | | | | | | | | | | | | |
| $ | 34,480 | | | $ | 22,610 | | | $ | - | | | $ | 1,860 | | | $ | 23,129 | |
99
MML Series Investment Fund – Financial Statements (Continued)
Statements of Changes in Net Assets
| | | | | | | | |
| | | MML Asset Allocation Fund | |
| | | Year
Ended
December 31, 2010 | | | Year
Ended
December 31, 2009 | |
Increase (Decrease) in Net Assets: | | | | | | | | |
Operations: | | | | | | | | |
Net investment income (loss) | | $ | 2,626,407 | | | $ | 3,260,613 | |
Net realized gain (loss) on investment transactions | | | 4,025,721 | | | | (26,416,227 | ) |
Net change in unrealized appreciation (depreciation) on investments | | | 9,784,290 | | | | 44,222,866 | |
| | | | | | | | |
Net increase (decrease) in net assets resulting from operations | | | 16,436,418 | | | | 21,067,252 | |
| | | | | | | | |
Distributions to shareholders (Note 2): | | | | | | | | |
From net investment income: | | | | | | | | |
Initial Class | | | (3,270,834 | ) | | | (5,404,123 | ) |
Class I | | | - | | | | - | |
Class II | | | - | | | | - | |
Service Class | | | (163,239 | ) | | | (168,250 | ) |
Service Class I | | | - | | | | - | |
| | | | | | | | |
Total distributions from net investment income | | | (3,434,073 | ) | | | (5,572,373 | ) |
| | | | | | | | |
Net fund share transactions (Note 5): | | | | | | | | |
Initial Class | | | (16,307,999 | ) | | | (12,329,765 | ) |
Class I | | | - | | | | - | |
Class II | | | - | | | | - | |
Service Class | | | 1,801,213 | | | | 3,200,454 | |
Service Class I | | | - | | | | - | |
| | | | | | | | |
Increase (decrease) in net assets from fund share transactions | | | (14,506,786 | ) | | | (9,129,311 | ) |
| | | | | | | | |
Total increase (decrease) in net assets | | | (1,504,441 | ) | | | 6,365,568 | |
Net assets | | | | | | | | |
Beginning of year | | | 144,447,998 | | | | 138,082,430 | |
| | | | | | | | |
End of year | | $ | 142,943,557 | | | $ | 144,447,998 | |
| | | | | �� | | | |
Undistributed (accumulated) net investment income (loss) included in net assets at end of year | | $ | 2,692,343 | | | $ | 3,405,921 | |
| | | | | | | | |
The accompanying notes are an integral part of the financial statements.
100
| | | | | | | | | | | | | | | | | | | | | | |
| MML Concentrated Growth Fund | | | MML Equity Income Fund | | | MML Foreign Fund | |
Year
Ended
December 31, 2010 | | | Year
Ended
December 31, 2009 | | | Year
Ended
December 31, 2010 | | | Year
Ended
December 31, 2009 | | | Year
Ended
December 31, 2010 | | | Year
Ended
December 31, 2009 | |
| | | | | | | | | | | | | | | | | | | | | | |
| | | | | | | | | | | | | | | | | | | | | | |
| $ | 600,741 | | | $ | 428,194 | | | $ | 9,558,553 | | | $ | 8,303,223 | | | $ | 5,682,567 | | | $ | 4,972,985 | |
| | 13,403,850 | | | | (14,043,481 | ) | | | 1,400,822 | | | | (51,942,386 | ) | | | (2,239,270 | ) | | | (20,778,291 | ) |
| | (2,308,534 | ) | | | 48,295,568 | | | | 63,629,412 | | | | 142,548,038 | | | | 12,608,101 | | | | 82,417,542 | |
| | | | | | | | | | | | | | | | | | | | | | | |
| | 11,696,057 | | | | 34,680,281 | | | | 74,588,787 | | | | 98,908,875 | | | | 16,051,398 | | | | 66,612,236 | |
| | | | | | | | | | | | | | | | | | | | | | | |
| | | | | | | | | | | | | | | | | | | | | | |
| | | | | | | | | | | | | | | | | | | | | | |
| | - | | | | - | | | | (8,032,215 | ) | | | (9,089,369 | ) | | | (5,183,884 | ) | | | (6,097,987 | ) |
| | (304,483 | ) | | | (273,859 | ) | | | - | | | | - | | | | - | | | | - | |
| | (121,782 | ) | | | (69,794 | ) | | | - | | | | - | | | | - | | | | - | |
| | - | | | | - | | | | (286,864 | ) | | | (323,441 | ) | | | (72,903 | ) | | | (83,617 | ) |
| | (5,743 | ) | | | (5,108 | ) | | | - | | | | - | | | | - | | | | - | |
| | | | | | | | | | | | | | | | | | | | | | | |
| | (432,008 | ) | | | (348,761 | ) | | | (8,319,079 | ) | | | (9,412,810 | ) | | | (5,256,787 | ) | | | (6,181,604 | ) |
| | | | | | | | | | | | | | | | | | | | | | | |
| | | | | | | | | | | | | | | | | | | | | | |
| | - | | | | - | | | | 57,033,237 | | | | (9,460,280 | ) | | | 39,114,873 | | | | 20,624,883 | |
| | (14,787,016 | ) | | | (3,984,483 | ) | | | - | | | | - | | | | - | | | | - | |
| | (3,787,283 | ) | | | (3,458,179 | ) | | | - | | | | - | | | | - | | | | - | |
| | - | | | | - | | | | 5,523,924 | | | | 6,728,535 | | | | 1,315,087 | | | | 1,687,192 | |
| | 386,949 | | | | 362,513 | | | | - | | | | - | | | | - | | | | - | |
| | | | | | | | | | | | | | | | | | | | | | | |
| | (18,187,350 | ) | | | (7,080,149 | ) | | | 62,557,161 | | | | (2,731,745 | ) | | | 40,429,960 | | | | 22,312,075 | |
| | | | | | | | | | | | | | | | | | | | | | | |
| | (6,923,301 | ) | | | 27,251,371 | | | | 128,826,869 | | | | 86,764,320 | | | | 51,224,571 | | | | 82,742,707 | |
| | | | | | | | | | | | | | | | | | | | | | |
| | 107,340,457 | | | | 80,089,086 | | | | 446,928,389 | | | | 360,164,069 | | | | 293,127,068 | | | | 210,384,361 | |
| | | | | | | | | | | | | | | | | | | | | | | |
| $ | 100,417,156 | | | $ | 107,340,457 | | | $ | 575,755,258 | | | $ | 446,928,389 | | | $ | 344,351,639 | | | $ | 293,127,068 | |
| | | | | | | | | | | | | | | | | | | | | | | |
| | | | | |
| $ | 588,488 | | | $ | 419,755 | | | $ | 9,513,385 | | | $ | 8,271,169 | | | $ | 5,309,266 | | | $ | 4,919,382 | |
| | | | | | | | | | | | | | | | | | | | | | | |
101
MML Series Investment Fund – Financial Statements (Continued)
Statements of Changes in Net Assets
| | | | | | | | |
| | | MML Global Fund | |
| | | Year
Ended
December 31, 2010 | | | Year
Ended
December 31, 2009 | |
Increase (Decrease) in Net Assets: | | | | | | | | |
Operations: | | | | | | | | |
Net investment income (loss) | | $ | 977,423 | | | $ | 540,201 | |
Net realized gain (loss) on investment transactions | | | 3,660,223 | | | | (6,864,185 | ) |
Net change in unrealized appreciation (depreciation) on investments | | | 7,224,654 | | | | 23,887,546 | |
| | | | | | | | |
Net increase (decrease) in net assets resulting from operations | | | 11,862,300 | | | | 17,563,562 | |
| | | | | | | | |
Distributions to shareholders (Note 2): | | | | | | | | |
From net investment income: | | | | | | | | |
Initial Class | | | - | | | | - | |
Class I | | | (443,725 | ) | | | (548,755 | ) |
Class II | | | (99,559 | ) | | | (133,588 | ) |
Service Class | | | - | | | | - | |
Service Class I | | | (4,481 | ) | | | (5,335 | ) |
| | | | | | | | |
Total distributions from net investment income | | | (547,765 | ) | | | (687,678 | ) |
| | | | | | | | |
Net fund share transactions (Note 5): | | | | | | | | |
Initial Class | | | - | | | | - | |
Class I | | | 9,390,192 | | | | 47,920,652 | |
Class II | | | (3,172,493 | ) | | | (3,367,089 | ) |
Service Class | | | - | | | | - | |
Service Class I | | | 721,200 | | | | 135,804 | |
| | | | | | | | |
Increase (decrease) in net assets from fund share transactions | | | 6,938,899 | | | | 44,689,367 | |
| | | | | | | | |
Total increase (decrease) in net assets | | | 18,253,434 | | | | 61,565,251 | |
Net assets | | | | | | | | |
Beginning of year | | | 86,026,610 | | | | 24,461,359 | |
| | | | | | | | |
End of year | | $ | 104,280,044 | | | $ | 86,026,610 | |
| | | | | | | | |
Undistributed (accumulated) net investment income (loss) included in net assets at end of year | | $ | 945,503 | | | $ | 491,191 | |
| | | | | | | | |
The accompanying notes are an integral part of the financial statements.
102
| | | | | | | | | | | | | | |
| MML Growth & Income Fund | | | MML Income & Growth Fund | |
Year
Ended
December 31, 2010 | | | Year
Ended
December 31, 2009 | | | Year
Ended
December 31, 2010 | | | Year
Ended
December 31, 2009 | |
| | | | | | | | | | | | | | |
| | | | | | | | | | | | | | |
| $ | 1,587,731 | | | $ | 2,071,894 | | | $ | 2,404,753 | | | $ | 2,851,928 | |
| | 7,258,825 | | | | (27,416,912 | ) | | | 25,571,220 | | | | (12,967,363 | ) |
| | 7,628,989 | | | | 60,520,917 | | | | (18,211,608 | ) | | | 50,695,566 | |
| | | | | | | | | | | | | | | |
| | 16,475,545 | | | | 35,175,899 | | | | 9,764,365 | | | | 40,580,131 | |
| | | | | | | | | | | | | | | |
| | | | | | | | | | | | | | |
| | | | | | | | | | | | | | |
| | (1,924,321 | ) | | | (2,675,505 | ) | | | (2,756,313 | ) | | | (2,061,951 | ) |
| | - | | | | - | | | | - | | | | - | |
| | - | | | | - | | | | - | | | | - | |
| | (153,086 | ) | | | (184,375 | ) | | | (121,024 | ) | | | (13,965 | ) |
| | - | | | | - | | | | - | | | | - | |
| | | | | | | | | | | | | | | |
| | (2,077,407 | ) | | | (2,859,880 | ) | | | (2,877,337 | ) | | | (2,075,916 | ) |
| | | | | | | | | | | | | | | |
| | | | | | | | | | | | | | |
| | (17,397,853 | ) | | | (15,696,871 | ) | | | (204,108,040 | ) | | | 155,681,017 | |
| | - | | | | - | | | | - | | | | - | |
| | - | | | | - | | | | - | | | | - | |
| | 865,578 | | | | 7,810,429 | | | | 1,293,934 | | | | 1,386,647 | |
| | - | | | | - | | | | - | | | | - | |
| | | | | | | | | | | | | | | |
| | (16,532,275 | ) | | | (7,886,442 | ) | | | (202,814,106 | ) | | | 157,067,664 | |
| | | | | | | | | | | | | | | |
| | (2,134,137 | ) | | | 24,429,577 | | | | (195,927,078 | ) | | | 195,571,879 | |
| | | | | | | | | | | | | | |
| | 158,984,725 | | | | 134,555,148 | | | | 272,669,098 | | | | 77,097,219 | |
| | | | | | | | | | | | | | | |
| $ | 156,850,588 | | | $ | 158,984,725 | | | $ | 76,742,020 | | | $ | 272,669,098 | |
| | | | | | | | | | | | | | | |
$ | 1,555,109 | | | $ | 2,050,709 | | | $ | 2,304,911 | | | $ | 2,869,415 | |
| | | | | | | | | | | | | | | |
103
MML Series Investment Fund – Financial Statements (Continued)
Statements of Changes in Net Assets
| | | | | | | | |
| | | MML Large Cap Growth Fund | |
| | | Year
Ended
December 31, 2010 | | | Year
Ended
December 31, 2009 | |
Increase (Decrease) in Net Assets: | | | | | | | | |
Operations: | | | | | | | | |
Net investment income (loss) | | $ | 385,271 | | | $ | 129,229 | |
Net realized gain (loss) on investment transactions | | | 3,403,883 | | | | (6,221,455 | ) |
Net change in unrealized appreciation (depreciation) on investments | | | 18,363,328 | | | | 16,548,652 | |
| | | | | | | | |
Net increase (decrease) in net assets resulting from operations | | | 22,152,482 | | | | 10,456,426 | |
| | | | | | | | |
Distributions to shareholders (Note 2): | | | | | | | | |
From net investment income: | | | | | | | | |
Initial Class | | | (135,692 | ) | | | (177,283 | ) |
Service Class | | | - | | | | (2,376 | ) |
| | | | | | | | |
Total distributions from net investment income | | | (135,692 | ) | | | (179,659 | ) |
| | | | | | | | |
Net fund share transactions (Note 5): | | | | | | | | |
Initial Class | | | 103,576,004 | | | | (5,262,576 | ) |
Service Class | | | 15,706 | | | | 260,471 | |
| | | | | | | | |
Increase (decrease) in net assets from fund share transactions | | | 103,591,710 | | | | (5,002,105 | ) |
| | | | | | | | |
Total increase (decrease) in net assets | | | 125,608,500 | | | | 5,274,662 | |
Net assets | | | | | | | | |
Beginning of year | | | 41,707,168 | | | | 36,432,506 | |
| | | | | | | | |
End of year | | $ | 167,315,668 | | | $ | 41,707,168 | |
| | | | | | | | |
Undistributed (accumulated) net investment income (loss) included in net assets at end of year | | $ | 377,258 | | | $ | 121,775 | |
| | | | | | | | |
The accompanying notes are an integral part of the financial statements.
104
| | | | | | | | | | | | | | |
| MML Mid Cap Growth Fund | | | MML Mid Cap Value Fund | |
Year
Ended
December 31, 2010 | | | Year
Ended
December 31, 2009 | | | Year
Ended
December 31, 2010 | | | Year
Ended
December 31, 2009 | |
| | | | | | | | | | | | | | |
| | | | | | | | | | | | | | |
| $ | (646,732 | ) | | $ | (584,866 | ) | | $ | 9,263,692 | | | $ | 6,340,285 | |
| | 21,871,761 | | | | (20,742,328 | ) | | | 65,686,823 | | | | (2,455,872 | ) |
| | 56,982,064 | | | | 110,156,837 | | | | (1,729,806 | ) | | | 88,742,094 | |
| | | | | | | | | | | | | | | |
| | 78,207,093 | | | | 88,829,643 | | | | 73,220,709 | | | | 92,626,507 | |
| | | | | | | | | | | | | | | |
| | | | | | | | | | | | | | |
| | | | | | | | | | | | | | |
| | - | | | | - | | | | (5,765,689 | ) | | | (7,031,877 | ) |
| | - | | | | - | | | | (106,830 | ) | | | (103,215 | ) |
| | | | | | | | | | | | | | | |
| | - | | | | - | | | | (5,872,519 | ) | | | (7,135,092 | ) |
| | | | | | | | | | | | | | | |
| | | | | | | | | | | | | | |
| | (19,052,242 | ) | | | 5,026,169 | | | | (21,520,432 | ) | | | (122,786 | ) |
| | 4,095,093 | | | | 3,198,019 | | | | 2,175,010 | | | | 2,465,079 | |
| | | | | | | | | | | | | | | |
| | (14,957,149 | ) | | | 8,224,188 | | | | (19,345,422 | ) | | | 2,342,293 | |
| | | | | | | | | | | | | | | |
| | 63,249,944 | | | | 97,053,831 | | | | 48,002,768 | | | | 87,833,708 | |
| | | | | | | | | | | | | | |
| | 284,697,008 | | | | 187,643,177 | | | | 381,545,833 | | | | 293,712,125 | |
| | | | | | | | | | | | | | | |
| $ | 347,946,952 | | | $ | 284,697,008 | | | $ | 429,548,601 | | | $ | 381,545,833 | |
| | | | | | | | | | | | | | | |
$ | (709,308 | ) | | $ | (35,230 | ) | | $ | 8,831,980 | | | $ | 5,790,597 | |
| | | | | | | | | | | | | | | |
105
MML Series Investment Fund – Financial Statements (Continued)
Statements of Changes in Net Assets
| | | | | | | | |
| | | MML Small Cap Index Fund | |
| | | Year
Ended
December 31, 2010 | | | Year
Ended
December 31, 2009 | |
Increase (Decrease) in Net Assets: | | | | | | | | |
Operations: | | | | | | | | |
Net investment income (loss) | | $ | 313,530 | | | $ | 224,286 | |
Net realized gain (loss) on investment transactions | | | 59,415 | | | | (2,401,056 | ) |
Net change in unrealized appreciation (depreciation) on investments | | | 9,401,611 | | | | 10,576,014 | |
| | | | | | | | |
Net increase (decrease) in net assets resulting from operations | | | 9,774,556 | | | | 8,399,244 | |
| | | | | | | | |
Distributions to shareholders (Note 2): | | | | | | | | |
From net investment income: | | | | | | | | |
Initial Class | | | (223,145 | ) | | | (417,813 | ) |
Class II | | | - | | | | - | |
Service Class | | | (13,744 | ) | | | (27,020 | ) |
Service Class I | | | - | | | | - | |
| | | | | | | | |
Total distributions from net investment income | | | (236,889 | ) | | | (444,833 | ) |
| | | | | | | | |
From net realized gains: | | | | | | | | |
Initial Class | | | - | | | | (675,436 | ) |
Class II | | | - | | | | - | |
Service Class | | | - | | | | (44,276 | ) |
Service Class I | | | - | | | | - | |
| | | | | | | | |
Total distributions from net realized gains | | | - | | | | (719,712 | ) |
| | | | | | | | |
Net fund share transactions (Note 5): | | | | | | | | |
Initial Class | | | (5,195,780 | ) | | | (2,154,683 | ) |
Class II | | | - | | | | - | |
Service Class | | | 595,008 | | | | 989,088 | |
Service Class I | | | - | | | | - | |
| | | | | | | | |
Increase (decrease) in net assets from fund share transactions | | | (4,600,772 | ) | | | (1,165,595 | ) |
| | | | | | | | |
Total increase (decrease) in net assets | | | 4,936,895 | | | | 6,069,104 | |
Net assets | | | | | | | | |
Beginning of year | | | 41,197,154 | | | | 35,128,050 | |
| | | | | | | | |
End of year | | $ | 46,134,049 | | | $ | 41,197,154 | |
| | | | | | | | |
Undistributed (accumulated) net investment income (loss) included in net assets at end of year | | $ | 329,731 | | | $ | 229,984 | |
| | | | | | | | |
Distributions in excess of net investment income included in net assets at end of year. | | $ | - | | | $ | - | |
| | | | | | | | |
| * | Fund commenced operations on February 27, 2009. |
The accompanying notes are an integral part of the financial statements.
106
| | | | | | | | | | | | | | |
| MML Small Company Value Fund | | | MML Small/Mid Cap Value Fund | |
Year
Ended
December 31, 2010 | | | Year
Ended
December 31, 2009* | | | Year
Ended
December 31, 2010 | | | Year
Ended
December 31, 2009 | |
| | | | | | | | | | | | | | |
| | | | | | | | | | | | | | |
| $ | 325,366 | | | $ | 184,351 | | | $ | 1,146,608 | | | $ | 1,083,547 | |
| | 10,205,295 | | | | 2,545,639 | | | | 17,419,713 | | | | (20,202,597 | ) |
| | 10,266,951 | | | | 17,204,800 | | | | 27,693,877 | | | | 78,767,432 | |
| | | | | | | | | | | | | | | |
| | 20,797,612 | | | | 19,934,790 | | | | 46,260,198 | | | | 59,648,382 | |
| | | | | | | | | | | | | | | |
| | | | | | | | | | | | | | |
| | | | | | | | | | | | | | |
| | - | | | | - | | | | (1,105,932 | ) | | | (2,007,657 | ) |
| | (798,366 | ) | | | (209,952 | ) | | | - | | | | - | |
| | - | | | | - | | | | (23,853 | ) | | | (38,998 | ) |
| | (17,102 | ) | | | (902 | ) | | | - | | | | - | |
| | | | | | | | | | | | | | | |
| | (815,468 | ) | | | (210,854 | ) | | | (1,129,785 | ) | | | (2,046,655 | ) |
| | | | | | | | | | | | | | | |
| | | | | | | | | | | | | | |
| | - | | | | - | | | | - | | | | - | |
| | (8,456,394 | ) | | | (2,265,082 | ) | | | - | | | | - | |
| | - | | | | - | | | | - | | | | - | |
| | (199,717 | ) | | | (14,929 | ) | | | - | | | | - | |
| | | | | | | | | | | | | | | |
| | (8,656,111 | ) | | | (2,280,011 | ) | | | - | | | | - | |
| | | | | | | | | | | | | | | |
| | | | | | | | | | | | | | |
| | - | | | | - | | | | (31,113,774 | ) | | | (23,196,315 | ) |
| | (1,584,805 | ) | | | 78,852,336 | | | | - | | | | - | |
| | - | | | | - | | | | 1,387,858 | | | | 1,055,440 | |
| | 1,789,392 | | | | 583,927 | | | | - | | | | - | |
| | | | | | | | | | | | | | | |
| | 204,587 | | | | 79,436,263 | | | | (29,725,916 | ) | | | (22,140,875 | ) |
| | | | | | | | | | | | | | | |
| | 11,530,620 | | | | 96,880,188 | | | | 15,404,497 | | | | 35,460,852 | |
| | | | | | | | | | | | | | |
| | 96,880,188 | | | | - | | | | 182,124,172 | | | | 146,663,320 | |
| | | | | | | | | | | | | | | |
| $ | 108,410,808 | | | $ | 96,880,188 | | | $ | 197,528,669 | | | $ | 182,124,172 | |
| | | | | | | | | | | | | | | |
$ |
- |
| | $ | - | | | $ | 1,110,263 | | | $ | 1,093,440 | |
| | | | | | | | | | | | | | | |
| $ | (171,220 | ) | | $ | (2,025 | ) | | $ | - | | | $ | - | |
| | | | | | | | | | | | | | | |
107
MML Series Investment Fund – Financial Highlights
(For a share outstanding throughout each period)
MML Asset Allocation Fund
| | | | | | | | | | | | | | | | | | | | |
| | | Initial Class | |
| | | Year
Ended
12/31/10 | | | Year
Ended
12/31/09 | | | Year
Ended
12/31/08 | | | Year
Ended
12/31/07 | | | Period
Ended
12/31/06 + | |
Net asset value, beginning of period | | $ | 7.75 | | | $ | 6.90 | | | $ | 9.91 | | | $ | 10.30 | | | $ | 10.00 | |
| | | | | | | | | | | | | | | | | | | | |
Income (loss) from investment operations: | | | | | | | | | | | | | | | | | | | | |
Net investment income (loss) *** | | | 0.15 | | | | 0.17 | | | | 0.23 | | | | 0.25 | | | | 0.16 | |
Net realized and unrealized gain (loss) on investments | | | 0.80 | | | | 0.98 | | | | (3.23 | ) | | | (0.13 | ) | | | 0.31 | |
| | | | | | | | | | | | | | | | | | | | |
Total income (loss) from investment operations | | | 0.95 | | | | 1.15 | | | | (3.00 | ) | | | 0.12 | | | | 0.47 | |
| | | | | | | | | | | | | | | | | | | | |
Less distributions to shareholders: | | | | | | | | | | | | | | | | | | | | |
From net investment income | | | (0.20 | ) | | | (0.30 | ) | | | (0.01 | ) | | | (0.25 | ) | | | (0.16 | ) |
From net realized gains | | | - | | | | - | | | | - | | | | (0.26 | ) | | | (0.01 | ) |
| | | | | | | | | | | | | | | | | | | | |
Total distributions | | | (0.20 | ) | | | (0.30 | ) | | | (0.01 | ) | | | (0.51 | ) | | | (0.17 | ) |
| | | | | | | | | | | | | | | | | | | | |
Net asset value, end of period | | $ | 8.50 | | | $ | 7.75 | | | $ | 6.90 | | | $ | 9.91 | | | $ | 10.30 | |
| | | | | | | | | | | | | | | | | | | | |
Total Return ^^ | | | 12.61% | | | | 17.02% | | | | (30.32% | ) | | | 1.14% | | | | 4.74% | ** |
| | | | | |
Ratios / Supplemental Data: | | | | | | | | | | | | | | | | | | | | |
Net assets, end of period (000’s) | | $ | 134,949 | | | $ | 138,938 | | | $ | 136,326 | | | $ | 255,294 | | | $ | 266,212 | |
Ratio of expenses to average daily net assets: | | | | | | | | | | | | | | | | | | | | |
Before expense waiver | | | 0.62% | | | | 0.63% | | | | 0.62% | | | | 0.59% | | | | 0.61% | * |
After expense waiver | | | N/A | | | | N/A | | | | 0.60% | # | | | 0.57% | # | | | 0.57% | *# |
Net investment income (loss) to average daily net assets | | | 1.89% | | | | 2.43% | | | | 2.63% | | | | 2.34% | | | | 2.40% | * |
Portfolio turnover rate | | | 60% | | | | 109% | | | | 67% | | | | 62% | | | | 38% | ** |
| | | |
| | | Service Class | | | | | | | |
| | | Year
Ended
12/31/10 | | | Year
Ended
12/31/09 | | | Period
Ended
12/31/08 +++ | | | | | | | |
Net asset value, beginning of period | | $ | 7.72 | | | $ | 6.90 | | | $ | 8.98 | | | | | | | | | |
| | | | | | | | | | | | | | | | | | | | |
Income (loss) from investment operations: | | | | | | | | | | | | | | | | | | | | |
Net investment income (loss) *** | | | 0.13 | | | | 0.15 | | | | 0.08 | | | | | | | | | |
Net realized and unrealized gain (loss) on investments | | | 0.80 | | | | 0.97 | | | | (2.15 | ) | | | | | | | | |
| | | | | | | | | | | | | | | | | | | | |
Total income (loss) from investment operations | | | 0.93 | | | | 1.12 | | | | (2.07 | ) | | | | | | | | |
| | | | | | | | | | | | | | | | | | | | |
Less distributions to shareholders: | | | | | | | | | | | | | | | | | | | | |
From net investment income | | | (0.19 | ) | | | (0.30 | ) | | | (0.01 | ) | | | | | | | | |
| | | | | | | | | | | | | | | | | | | | |
Total distributions | | | (0.19 | ) | | | (0.30 | ) | | | (0.01 | ) | | | | | | | | |
| | | | | | | | | | | | | | | | | | | | |
Net asset value, end of period | | $ | 8.46 | | | $ | 7.72 | | | $ | 6.90 | | | | | | | | | |
| | | | | | | | | | | | | | | | | | | | |
Total Return ^^ | | | 12.37% | | | | 16.56% | | | | (23.10% | ) ** | | | | | | | | |
| | | | | |
Ratios / Supplemental Data: | | | | | | | | | | | | | | | | | | | | |
Net assets, end of period (000’s) | | $ | 7,994 | | | $ | 5,510 | | | $ | 1,757 | | | | | | | | | |
Ratio of expenses to average daily net assets | | | 0.87% | | | | 0.88% | | | | 0.90% | * | | | | | | | | |
Net investment income (loss) to average daily net assets | | | 1.65% | | | | 2.09% | | | | 3.09% | * | | | | | | | | |
Portfolio turnover rate | | | 60% | | | | 109% | | | | 67% | ~ | | | | | | | | |
| ** | Percentage represents the results for the period and is not annualized. |
| *** | Per share amount calculated on the average shares method. |
| + | For the period May 1, 2006 (commencement of operations) through December 31, 2006. |
| +++ | For the period August 15, 2008 (commencement of operations) through December 31, 2008. |
| # | Computed after giving effect to an agreement by MassMutual to waive certain fees and expenses of the Fund. |
| ^^ | Total return does not reflect expenses that apply at the separate account level or to related insurance products. Inclusion of these charges would reduce the total return figures for all periods shown. |
| ~ | The portfolio turnover rate results are for the Fund. |
The accompanying notes are an integral part of the financial statements.
108
MML Series Investment Fund – Financial Highlights (Continued)
(For a share outstanding throughout each period)
MML Concentrated Growth Fund
| | | | | | | | | | | | | | | | | | | | |
| | | Class I | |
| | | Year
Ended
12/31/10 | | | Year
Ended
12/31/09 | | | Year
Ended
12/31/08 | | | Year
Ended
12/31/07 | | | Period
Ended
12/31/06 + | |
Net asset value, beginning of period | | $ | 6.32 | | | $ | 4.45 | | | $ | 11.09 | | | $ | 10.21 | | | $ | 10.00 | |
| | | | | | | | | | | | | | | | | | | | |
Income (loss) from investment operations: | | | | | | | | | | | | | | | | | | | | |
Net investment income (loss) *** | | | 0.04 | | | | 0.02 | | | | 0.03 | | | | 0.02 | | | | 0.01 | |
Net realized and unrealized gain (loss) on investments | | | 0.85 | | | | 1.87 | | | | (6.67 | ) | | | 1.54 | | | | 0.21 | |
| | | | | | | | | | | | | | | | | | | | |
Total income (loss) from investment
operations | | | 0.89 | | | | 1.89 | | | | (6.64 | ) | | | 1.56 | | | | 0.22 | |
| | | | | | | | | | | | | | | | | | | | |
Less distributions to shareholders: | | | | | | | | | | | | | | | | | | | | |
From net investment income | | | (0.03 | ) | | | (0.02 | ) | | | - | | | | (0.02 | ) | | | - | |
From net realized gains | | | - | | | | - | | | | - | | | | (0.66 | ) | | | (0.01 | ) |
| | | | | | | | | | | | | | | | | | | | |
Total distributions | | | (0.03 | ) | | | (0.02 | ) | | | - | | | | (0.68 | ) | | | (0.01 | ) |
| | | | | | | | | | | | | | | | | | | | |
Net asset value, end of period | | $ | 7.18 | | | $ | 6.32 | | | $ | 4.45 | | | $ | 11.09 | | | $ | 10.21 | |
| | | | | | | | | | | | | | | | | | | | |
Total Return ^^ | | | 14.14% | | | | 42.58% | | | | (59.87% | ) | | | 15.04% | | | | 2.19% | ** |
| | | | | |
Ratios / Supplemental Data: | | | | | | | | | | | | | | | | | | | | |
Net assets, end of period (000’s) | | $ | 75,480 | | | $ | 82,035 | | | $ | 59,617 | | | $ | 23,930 | | | $ | 18,032 | |
Ratio of expenses to average daily net assets: | | | | | | | | | | | | | | | | | | | | |
Before expense waiver | | | 0.92% | | | | 0.93% | | | | 0.93% | | | | 0.91% | | | | 0.94% | * |
After expense waiver | | | 0.87% | # | | | 0.90% | # | | | 0.90% | # | | | 0.76% | # | | | 0.76% | *# |
Net investment income (loss) to average daily net assets | | | 0.58% | | | | 0.44% | | | | 0.40% | | | | 0.16% | | | | 0.11% | * |
Portfolio turnover rate | | | 78% | | | | 69% | | | | 104% | | | | 59% | | | | 43% | ** |
| |
| | | Class II | |
| | | Year
Ended
12/31/10 | | | Year
Ended
12/31/09 | | | Year
Ended
12/31/08 | | | Year
Ended
12/31/07 | | | Period
Ended
12/31/06 + | |
Net asset value, beginning of period | | $ | 6.35 | | | $ | 4.46 | | | $ | 11.10 | | | $ | 10.21 | | | $ | 10.00 | |
| | | | | | | | | | | | | | | | | | | | |
Income (loss) from investment operations: | | | | | | | | | | | | | | | | | | | | |
Net investment income (loss) *** | | | 0.04 | | | | 0.03 | | | | 0.03 | | | | 0.03 | | | | 0.01 | |
Net realized and unrealized gain (loss) on investments | | | 0.86 | | | | 1.88 | | | | (6.67 | ) | | | 1.55 | | | | 0.22 | |
| | | | | | | | | | | | | | | | | | | | |
Total income (loss) from investment
operations | | | 0.90 | | | | 1.91 | | | | (6.64 | ) | | | 1.58 | | | | 0.23 | |
| | | | | | | | | | | | | | | | | | | | |
Less distributions to shareholders: | | | | | | | | | | | | | | | | | | | | |
From net investment income | | | (0.04 | ) | | | (0.02 | ) | | | - | | | | (0.03 | ) | | | - | |
From net realized gains | | | - | | | | - | | | | - | | | | (0.66 | ) | | | (0.02 | ) |
| | | | | | | | | | | | | | | | | | | | |
Total distributions | | | (0.04 | ) | | | (0.02 | ) | | | - | | | | (0.69 | ) | | | (0.02 | ) |
| | | | | | | | | | | | | | | | | | | | |
Net asset value, end of period | | $ | 7.21 | | | $ | 6.35 | | | $ | 4.46 | | | $ | 11.10 | | | $ | 10.21 | |
| | | | | | | | | | | | | | | | | | | | |
Total Return ^^ | | | 14.21% | | | | 42.82% | | | | (59.82% | ) | | | 15.20% | | | | 2.25% | ** |
| | | | | |
Ratios / Supplemental Data: | | | | | | | | | | | | | | | | | | | | |
Net assets, end of period (000’s) | | $ | 23,147 | | | $ | 24,102 | | | $ | 19,978 | | | $ | 61,686 | | | $ | 64,702 | |
Ratio of expenses to average daily net assets: | | | | | | | | | | | | | | | | | | | | |
Before expense waiver | | | 0.82% | | | | 0.83% | | | | 0.82% | | | | 0.81% | | | | 0.84% | * |
After expense waiver | | | 0.77% | # | | | 0.80% | # | | | 0.76% | # | | | 0.66% | # | | | 0.66% | *# |
Net investment income (loss) to average daily net assets | | | 0.68% | | | | 0.52% | | | | 0.40% | | | | 0.26% | | | | 0.21% | * |
Portfolio turnover rate | | | 78% | | | | 69% | | | | 104% | | | | 59% | | | | 43% | ** |
| ** | Percentage represents the results for the period and is not annualized. |
| *** | Per share amount calculated on the average shares method. |
| + | For the period May 1, 2006 (commencement of operations) through December 31, 2006. |
| # | Computed after giving effect to an agreement by MassMutual to waive certain fees and expenses of the Fund. |
| ^^ | Total return does not reflect expenses that apply at the separate account level or to related insurance products. Inclusion of these charges would reduce the total return figures for all periods shown. |
The accompanying notes are an integral part of the financial statements.
109
MML Series Investment Fund – Financial Highlights (Continued)
(For a share outstanding throughout each period)
MML Concentrated Growth Fund (Continued)
| | | | | | | | | | | | |
| | | Service Class I | |
| | | Year
Ended
12/31/10 | | | Year
Ended
12/31/09 | | | Period
Ended
12/31/08 +++ | |
Net asset value, beginning of period | | $ | 6.29 | | | $ | 4.45 | | | $ | 8.78 | |
| | | | | | | | | | | | |
Income (loss) from investment operations: | | | | | | | | | | | | |
Net investment income (loss) *** | | | 0.02 | | | | 0.01 | | | | 0.01 | |
Net realized and unrealized gain (loss) on
investments | | | 0.85 | | | | 1.86 | | | | (4.34 | ) |
| | | | | | | | | | | | |
Total income (loss) from investment
operations | | | 0.87 | | | | 1.87 | | | | (4.33 | ) |
| | | | | | | | | | | | |
Less distributions to shareholders: | | | | | | | | | | | | |
From net investment income | | | (0.03 | ) | | | (0.03 | ) | | | - | |
| | | | | | | | | | | | |
Total distributions | | | (0.03 | ) | | | (0.03 | ) | | | - | |
| | | | | | | | | | | | |
Net asset value, end of period | | $ | 7.13 | | | $ | 6.29 | | | $ | 4.45 | |
| | | | | | | | | | | | |
Total Return ^^ | | | 13.83% | | | | 42.11% | | | | (49.32% | ) ** |
| | | |
Ratios / Supplemental Data: | | | | | | | | | | | | |
Net assets, end of period (000’s) | | $ | 1,789 | | | $ | 1,203 | | | $ | 494 | |
Ratio of expenses to average daily net assets: | | | | | | | | | | | | |
Before expense waiver | | | 1.17% | | | | 1.18% | | | | 1.19% | * |
After expense waiver | | | 1.12% | # | | | 1.15% | # | | | N/A | |
Net investment income (loss) to average daily net
assets | | | 0.33% | | | | 0.15% | | | | 0.73% | * |
Portfolio turnover rate | | | 78% | | | | 69% | | | | 104% | ~ |
| ** | Percentage represents the results for the period and is not annualized. |
| *** | Per share amount calculated on the average shares method. |
| +++ | For the period August 15, 2008 (commencement of operations) through December 31, 2008. |
| # | Computed after giving effect to an agreement by MassMutual to waive certain fees and expenses of the Fund. |
| ^^ | Total return does not reflect expenses that apply at the separate account level or to related insurance products. Inclusion of these charges would reduce the total return figures for all periods shown. |
| ~ | The portfolio turnover rate results are for the Fund. |
The accompanying notes are an integral part of the financial statements.
110
MML Series Investment Fund – Financial Highlights (Continued)
(For a share outstanding throughout each period)
MML Equity Income Fund
| | | | | | | | | | | | | | | | | | | | |
| | | Initial Class | |
| | | Year
Ended
12/31/10 | | | Year
Ended
12/31/09 | | | Year
Ended
12/31/08 | | | Year
Ended
12/31/07 | | | Period
Ended
12/31/06 + | |
Net asset value, beginning of period | | $ | 8.35 | | | $ | 6.82 | | | $ | 10.77 | | | $ | 10.97 | | | $ | 10.00 | |
| | | | | | | | | | | | | | | | | | | | |
Income (loss) from investment operations: | | | | | | | | | | | | | | | | | | | | |
Net investment income (loss) *** | | | 0.16 | | | | 0.15 | | | | 0.22 | | | | 0.20 | | | | 0.11 | |
Net realized and unrealized gain (loss) on investments | | | 1.06 | | | | 1.56 | | | | (4.04 | ) | | | 0.15 | | | | 0.99 | |
| | | | | | | | | | | | | | | | | | | | |
Total income (loss) from investment operations | | | 1.22 | | | | 1.71 | | | | (3.82 | ) | | | 0.35 | | | | 1.10 | |
| | | | | | | | | | | | | | | | | | | | |
Less distributions to shareholders: | | | | | | | | | | | | | | | | | | | | |
From net investment income | | | (0.13 | ) | | | (0.18 | ) | | | - | | | | (0.17 | ) | | | (0.10 | ) |
From net realized gains | | | - | | | | - | | | | (0.13 | ) | | | (0.38 | ) | | | (0.03 | ) |
| | | | | | | | | | | | | | | | | | | | |
Total distributions | | | (0.13 | ) | | | (0.18 | ) | | | (0.13 | ) | | | (0.55 | ) | | | (0.13 | ) |
| | | | | | | | | | | | | | | | | | | | |
Net asset value, end of period | | $ | 9.44 | | | $ | 8.35 | | | $ | 6.82 | | | $ | 10.77 | | | $ | 10.97 | |
| | | | | | | | | | | | | | | | | | | | |
Total Return ^^ | | | 14.95% | | | | 25.19% | | | | (35.80% | ) | | | 3.13% | | | | 11.01% | ** |
| | | | | |
Ratios / Supplemental Data: | | | | | | | | | | | | | | | | | | | | |
Net assets, end of period (000’s) | | $ | 550,834 | | | $ | 430,300 | | | $ | 353,862 | | | $ | 378,616 | | | $ | 292,357 | |
Ratio of expenses to average daily net assets | | | 0.79% | | | | 0.81% | | | | 0.80% | | | | 0.78% | | | | 0.80% | * |
Net investment income (loss) to average daily net assets | | | 1.87% | | | | 2.13% | | | | 2.51% | | | | 1.76% | | | | 1.66% | * |
Portfolio turnover rate | | | 16% | | | | 31% | | | | 32% | | | | 27% | | | | 12% | ** |
| | | |
| | | Service Class | | | | | | | |
| | | Year
Ended
12/31/10 | | | Year
Ended
12/31/09 | | | Period
Ended
12/31/08 +++ | | | | | | | |
Net asset value, beginning of period | | $ | 8.32 | | | $ | 6.82 | | | $ | 9.60 | | | | | | | | | |
| | | | | | | | | | | | | | | | | | | | |
Income (loss) from investment operations: | | | | | | | | | | | | | | | | | | | | |
Net investment income (loss) *** | | | 0.14 | | | | 0.13 | | | | 0.09 | | | | | | | | | |
Net realized and unrealized gain (loss) on investments | | | 1.06 | | | | 1.54 | | | | (2.74 | ) | | | | | | | | |
| | | | | | | | | | | | | | | | | | | | |
Total income (loss) from investment operations | | | 1.20 | | | | 1.67 | | | | (2.65 | ) | | | | | | | | |
| | | | | | | | | | | | | | | | | | | | |
Less distributions to shareholders: | | | | | | | | | | | | | | | | | | | | |
From net investment income | | | (0.12 | ) | | | (0.17 | ) | | | - | | | | | | | | | |
From net realized gains | | | - | | | | - | | | | (0.13 | ) | | | | | | | | |
| | | | | | | | | | | | | | | | | | | | |
Total distributions | | | (0.12 | ) | | | (0.17 | ) | | | (0.13 | ) | | | | | | | | |
| | | | | | | | | | | | | | | | | | | | |
Net asset value, end of period | | $ | 9.40 | | | $ | 8.32 | | | $ | 6.82 | | | | | | | | | |
| | | | | | | | | | | | | | | | | | | | |
Total Return ^^ | | | 14.70% | | | | 24.74% | | | | (27.98% | ) ** | | | | | | | | |
| | | | | |
Ratios / Supplemental Data: | | | | | | | | | | | | | | | | | | | | |
Net assets, end of period (000’s) | | $ | 24,921 | | | $ | 16,629 | | | $ | 6,302 | | | | | | | | | |
Ratio of expenses to average daily net assets | | | 1.04% | | | | 1.06% | | | | 1.06% | * | | | | | | | | |
Net investment income (loss) to average daily net assets | | | 1.62% | | | | 1.77% | | | | 3.36% | * | | | | | | | | |
Portfolio turnover rate | | | 16% | | | | 31% | | | | 32% | ~ | | | | | | | | |
| ** | Percentage represents the results for the period and is not annualized. |
| *** | Per share amount calculated on the average shares method. |
| + | For the period May 1, 2006 (commencement of operations) through December 31, 2006. |
| +++ | For the period August 15, 2008 (commencement of operations) through December 31, 2008. |
| ^^ | Total return does not reflect expenses that apply at the separate account level or to related insurance products. Inclusion of these charges would reduce the total return figures for all periods shown. |
| ~ | The portfolio turnover rate results are for the Fund. |
The accompanying notes are an integral part of the financial statements.
111
MML Series Investment Fund – Financial Highlights (Continued)
(For a share outstanding throughout each period)
MML Foreign Fund
| | | | | | | | | | | | | | | | | | | | |
| | | Initial Class | |
| | | Year
Ended
12/31/10 | | | Year
Ended
12/31/09 | | | Year
Ended
12/31/08 | | | Year
Ended
12/31/07 | | | Period
Ended
12/31/06 + | |
Net asset value, beginning of period | | $ | 8.95 | | | $ | 7.08 | | | $ | 12.02 | | | $ | 11.00 | | | $ | 10.00 | |
| | | | | | | | | | | | | | | | | | | | |
Income (loss) from investment operations: | | | | | | | | | | | | | | | | | | | | |
Net investment income (loss) *** | | | 0.16 | | | | 0.16 | | | | 0.27 | | | | 0.24 | | | | 0.13 | |
Net realized and unrealized gain (loss) on investments | | | 0.24 | | | | 1.90 | | | | (5.21 | ) | | | 1.24 | | | | 1.00 | |
| | | | | | | | | | | | | | | | | | | | |
Total income (loss) from investment operations | | | 0.40 | | | | 2.06 | | | | (4.94 | ) | | | 1.48 | | | | 1.13 | |
| | | | | | | | | | | | | | | | | | | | |
Less distributions to shareholders: | | | | | | | | | | | | | | | | | | | | |
From net investment income | | | (0.14 | ) | | | (0.19 | ) | | | (0.00 | ) † | | | (0.27 | ) | | | (0.12 | ) |
From net realized gains | | | - | �� | | | - | | | | - | | | | (0.19 | ) | | | (0.01 | ) |
| | | | | | | | | | | | | | | | | | | | |
Total distributions | | | (0.14 | ) | | | (0.19 | ) | | | (0.00 | ) † | | | (0.46 | ) | | | (0.13 | ) |
| | | | | | | | | | | | | | | | | | | | |
Net asset value, end of period | | $ | 9.21 | | | $ | 8.95 | | | $ | 7.08 | | | $ | 12.02 | | | $ | 11.00 | |
| | | | | | | | | | | | | | | | | | | | |
Total Return ^^ | | | 4.70% | | | | 29.28% | | | | (41.07% | ) | | | 13.48% | | | | 11.26% | ** |
| | | | | |
Ratios / Supplemental Data: | | | | | | | | | | | | | | | | | | | | |
Net assets, end of period (000’s) | | $ | 338,495 | | | $ | 288,815 | | | $ | 208,709 | | | $ | 359,018 | | | $ | 253,512 | |
Ratio of expenses to average daily net assets: | | | | | | | | | | | | | | | | | | | | |
Before expense waiver | | | 0.99% | | | | 1.01% | | | | 1.00% | | | | 1.00% | | | | 1.03% | * |
After expense waiver | | | N/A | | | | N/A | | | | 0.98% | # | | | N/A | | | | 1.02% | *# |
Net investment income (loss) to average daily net assets | | | 1.85% | | | | 2.08% | | | | 2.74% | | | | 2.00% | | | | 1.90% | * |
Portfolio turnover rate | | | 8% | | | | 11% | | | | 10% | | | | 9% | | | | 9% | ** |
| | | |
| | | Service Class | | | | | | | |
| | | Year
Ended
12/31/10 | | | Year
Ended
12/31/09 | | | Period
Ended
12/31/08 +++ | | | | | | | |
Net asset value, beginning of period | | $ | 8.92 | | | $ | 7.07 | | | $ | 9.96 | | | | | | | | | |
| | | | | | | | | | | | | | | | | | | | |
Income (loss) from investment operations: | | | | | | | | | | | | | | | | | | | | |
Net investment income (loss) *** | | | 0.13 | | | | 0.15 | | | | 0.03 | | | | | | | | | |
Net realized and unrealized gain (loss) on investments | | | 0.26 | | | | 1.89 | | | | (2.92 | ) | | | | | | | | |
| | | | | | | | | | | | | | | | | | | | |
Total income (loss) from investment operations | | | 0.39 | | | | 2.04 | | | | (2.89 | ) | | | | | | | | |
| | | | | | | | | | | | | | | | | | | | |
Less distributions to shareholders: | | | | | | | | | | | | | | | | | | | | |
From net investment income | | | (0.13 | ) | | | (0.19 | ) | | | (0.00 | ) † | | | | | | | | |
| | | | | | | | | | | | | | | | | | | | |
Total distributions | | | (0.13 | ) | | | (0.19 | ) | | | (0.00 | ) † | | | | | | | | |
| | | | | | | | | | | | | | | | | | | | |
Net asset value, end of period | | $ | 9.18 | | | $ | 8.92 | | | $ | 7.07 | | | | | | | | | |
| | | | | | | | | | | | | | | | | | | | |
Total Return ^^ | | | 4.54% | | | | 29.01% | | | | (28.99% | ) ** | | | | | | | | |
| | | | | |
Ratios / Supplemental Data: | | | | | | | | | | | | | | | | | | | | |
Net assets, end of period (000’s) | | $ | 5,857 | | | $ | 4,313 | | | $ | 1,675 | | | | | | | | | |
Ratio of expenses to average daily net assets | | | 1.24% | | | | 1.26% | | | | 1.25% | * | | | | | | | | |
Net investment income (loss) to average daily net assets | | | 1.56% | | | | 1.88% | | | | 1.00% | * | | | | | | | | |
Portfolio turnover rate | | | 8% | | | | 11% | | | | 10% | ~ | | | | | | | | |
| ** | Percentage represents the results for the period and is not annualized. |
| *** | Per share amount calculated on the average shares method. |
| † | Amount is less than $0.005 per share. |
| + | For the period May 1, 2006 (commencement of operations) through December 31, 2006. |
| +++ | For the period August 15, 2008 (commencement of operations) through December 31, 2008. |
| # | Computed after giving effect to an agreement by MassMutual to waive certain fees and expenses of the Fund. |
| ^^ | Total return does not reflect expenses that apply at the separate account level or to related insurance products. Inclusion of these charges would reduce the total return figures for all periods shown. |
| ~ | The portfolio turnover rate results are for the Fund. |
The accompanying notes are an integral part of the financial statements.
112
MML Series Investment Fund – Financial Highlights (Continued)
(For a share outstanding throughout each period)
MML Global Fund
| | | | | | | | | | | | | | | | | | | | |
| | | Class I | |
| | | Year
Ended
12/31/10 | | | Year
Ended
12/31/09 | | | Year
Ended
12/31/08 | | | Year
Ended
12/31/07 | | | Period
Ended
12/31/06 + | |
Net asset value, beginning of period | | $ | 7.56 | | | $ | 5.78 | | | $ | 10.31 | | | $ | 10.52 | | | $ | 10.00 | |
| | | | | | | | | | | | | | | | | | | | |
Income (loss) from investment operations: | | | | | | | | | | | | | | | | | | | | |
Net investment income (loss) *** | | | 0.08 | | | | 0.05 | | | | 0.15 | | | | 0.16 | | | | 0.10 | |
Net realized and unrealized gain (loss) on
investments | | | 0.87 | | | | 1.80 | | | | (4.64 | ) | | | 0.22 | | | | 0.53 | |
| | | | | | | | | | | | | | | | | | | | |
Total income (loss) from investment
operations | | | 0.95 | | | | 1.85 | | | | (4.49 | ) | | | 0.38 | | | | 0.63 | |
| | | | | | | | | | | | | | | | | | | | |
Less distributions to shareholders: | | | | | | | | | | | | | | | | | | | | |
From net investment income | | | (0.05 | ) | | | (0.07 | ) | | | - | | | | (0.16 | ) | | | (0.11 | ) |
From net realized gains | | | - | | | | - | | | | (0.04 | ) | | | (0.43 | ) | | | - | |
| | | | | | | | | | | | | | | | | | | | |
Total distributions | | | (0.05 | ) | | | (0.07 | ) | | | (0.04 | ) | | | (0.59 | ) | | | (0.11 | ) |
| | | | | | | | | | | | | | | | | | | | |
Net asset value, end of period | | $ | 8.46 | | | $ | 7.56 | | | $ | 5.78 | | | $ | 10.31 | | | $ | 10.52 | |
| | | | | | | | | | | | | | | | | | | | |
Total Return ^^ | | | 12.64% | | | | 32.06% | | | | (43.70% | ) | | | 3.57% | | | | 6.25% | ** |
| | | | | |
Ratios / Supplemental Data: | | | | | | | | | | | | | | | | | | | | |
Net assets, end of period (000’s) | | $ | 83,762 | | | $ | 65,305 | | | $ | 5,589 | | | $ | 10,156 | | | $ | 9,698 | |
Ratio of expenses to average daily net assets: | | | | | | | | | | | | | | | | | | | | |
Before expense waiver | | | 1.01% | | | | 1.14% | | | | 1.27% | | | | 1.15% | | | | 1.15% | * |
After expense waiver | | | 0.90% | # | | | 0.90% | # | | | 0.83% | # | | | 0.71% | # | | | 0.71% | *# |
Net investment income (loss) to average daily net
assets | | | 1.05% | | | | 0.76% | | | | 1.82% | | | | 1.41% | | | | 1.47% | * |
Portfolio turnover rate | | | 18% | | | | 88% | | | | 65% | | | | 56% | | | | 41% | ** |
| |
| | | Class II | |
| | | Year
Ended
12/31/10 | | | Year
Ended
12/31/09 | | | Year
Ended
12/31/08 | | | Year
Ended
12/31/07 | | | Period
Ended
12/31/06 + | |
Net asset value, beginning of period | | $ | 7.64 | | | $ | 5.83 | | | $ | 10.31 | | | $ | 10.52 | | | $ | 10.00 | |
| | | | | | | | | | | | | | | | | | | | |
Income (loss) from investment operations: | | | | | | | | | | | | | | | | | | | | |
Net investment income (loss) *** | | | 0.09 | | | | 0.10 | | | | 0.17 | | | | 0.17 | | | | 0.10 | |
Net realized and unrealized gain (loss) on
investments | | | 0.88 | | | | 1.76 | | | | (4.61 | ) | | | 0.22 | | | | 0.53 | |
| | | | | | | | | | | | | | | | | | | | |
Total income (loss) from investment
operations | | | 0.97 | | | | 1.86 | | | | (4.44 | ) | | | 0.39 | | | | 0.63 | |
| | | | | | | | | | | | | | | | | | | | |
Less distributions to shareholders: | | | | | | | | | | | | | | | | | | | | |
From net investment income | | | (0.04 | ) | | | (0.05 | ) | | | - | | | | (0.17 | ) | | | (0.11 | ) |
From net realized gains | | | - | | | | - | | | | (0.04 | ) | | | (0.43 | ) | | | - | |
| | | | | | | | | | | | | | | | | | | | |
Total distributions | | | (0.04 | ) | | | (0.05 | ) | | | (0.04 | ) | | | (0.60 | ) | | | (0.11 | ) |
| | | | | | | | | | | | | | | | | | | | |
Net asset value, end of period | | $ | 8.57 | | | $ | 7.64 | | | $ | 5.83 | | | $ | 10.31 | | | $ | 10.52 | |
| | | | | | | | | | | | | | | | | | | | |
Total Return ^^ | | | 12.83% | | | | 31.96% | | | | (43.27% | ) | | | 3.75% | | | | 6.30% | ** |
| | | | | |
Ratios / Supplemental Data: | | | | | | | | | | | | | | | | | | | | |
Net assets, end of period (000’s) | | $ | 19,095 | | | $ | 20,163 | | | $ | 18,607 | | | $ | 43,429 | | | $ | 51,804 | |
Ratio of expenses to average daily net assets: | | | | | | | | | | | | | | | | | | | | |
Before expense waiver | | | 0.91% | | | | 1.04% | | | | 1.17% | | | | 1.05% | | | | 1.04% | * |
After expense waiver | | | 0.80% | # | | | 0.80% | # | | | 0.72% | # | | | 0.61% | # | | | 0.61% | *# |
Net investment income (loss) to average daily net
assets | | | 1.19% | | | | 1.63% | | | | 1.95% | | | | 1.51% | | | | 1.60% | * |
Portfolio turnover rate | | | 18% | | | | 88% | | | | 65% | | | | 56% | | | | 41% | ** |
| ** | Percentage represents the results for the period and is not annualized. |
| *** | Per share amount calculated on the average shares method. |
| + | For the period May 1, 2006 (commencement of operations) through December 31, 2006. |
| # | Computed after giving effect to an agreement by MassMutual to waive certain fees and expenses of the Fund. |
| ^^ | Total return does not reflect expenses that apply at the separate account level or to related insurance products. Inclusion of these charges would reduce the total return figures for all periods shown. |
The accompanying notes are an integral part of the financial statements.
113
MML Series Investment Fund – Financial Highlights (Continued)
(For a share outstanding throughout each period)
MML Global Fund (Continued)
| | | | | | | | | | | | |
| | | Service Class I | |
| | | Year
Ended
12/31/10 | | | Year
Ended
12/31/09 | | | Period
Ended
12/31/08 +++ | |
Net asset value, beginning of period | | $ | 7.57 | | | $ | 5.80 | | | $ | 8.72 | |
| | | | | | | | | | | | |
Income (loss) from investment operations: | | | | | | | | | | | | |
Net investment income (loss) *** | | | 0.05 | | | | 0.08 | | | | 0.01 | |
Net realized and unrealized gain (loss) on
investments | | | 0.89 | | | | 1.76 | | | | (2.89 | ) |
| | | | | | | | | | | | |
Total income (loss) from investment
operations | | | 0.94 | | | | 1.84 | | | | (2.88 | ) |
| | | | | | | | | | | | |
Less distributions to shareholders: | | | | | | | | | | | | |
From net investment income | | | (0.04 | ) | | | (0.07 | ) | | | - | |
From net realized gains | | | - | | | | - | | | | (0.04 | ) |
| | | | | | | | | | | | |
Total distributions | | | (0.04 | ) | | | (0.07 | ) | | | (0.04 | ) |
| | | | | | | | | | | | |
Net asset value, end of period | | $ | 8.47 | | | $ | 7.57 | | | $ | 5.80 | |
| | | | | | | | | | | | |
Total Return ^^ | | | 12.46% | | | | 31.77% | | | | (33.21% | ) ** |
| | | |
Ratios / Supplemental Data: | | | | | | | | | | | | |
Net assets, end of period (000’s) | | $ | 1,424 | | | $ | 559 | | | $ | 265 | |
Ratio of expenses to average daily net assets: | | | | | | | | | | | | |
Before expense waiver | | | 1.26% | | | | 1.39% | | | | 1.19% | * |
After expense waiver | | | 1.15% | # | | | 1.15% | # | | | 1.15% | *# |
Net investment income (loss) to average daily net
assets | | | 0.71% | | | | 1.20% | | | | 0.46% | * |
Portfolio turnover rate | | | 18% | | | | 88% | | | | 65% | ~ |
| ** | Percentage represents the results for the period and is not annualized. |
| *** | Per share amount calculated on the average shares method. |
| +++ | For the period August 15, 2008 (commencement of operations) through December 31, 2008. |
| # | Computed after giving effect to an agreement by MassMutual to waive certain fees and expenses of the Fund. |
| ^^ | Total return does not reflect expenses that apply at the separate account level or to related insurance products. Inclusion of these charges would reduce the total return figures for all periods shown. |
| ~ | The portfolio turnover rate results are for the Fund. |
The accompanying notes are an integral part of the financial statements.
114
MML Series Investment Fund – Financial Highlights (Continued)
(For a share outstanding throughout each period)
MML Growth & Income Fund
| | | | | | | | | | | | | | | | | | | | |
| | | Initial Class | |
| | | Year
Ended
12/31/10 | | | Year
Ended
12/31/09 | | | Year
Ended
12/31/08 | | | Year
Ended
12/31/07 | | | Period
Ended
12/31/06 + | |
Net asset value, beginning of period | | $ | 7.35 | | | $ | 5.87 | | | $ | 9.80 | | | $ | 10.36 | | | $ | 10.00 | |
| | | | | | | | | | | | | | | | | | | | |
Income (loss) from investment operations: | | | | | | | | | | | | | | | | | | | | |
Net investment income (loss) *** | | | 0.08 | | | | 0.09 | | | | 0.11 | | | | 0.12 | | | | 0.07 | |
Net realized and unrealized gain (loss) on investments | | | 0.74 | | | | 1.52 | | | | (4.04 | ) | | | (0.14 | ) | | | 0.37 | |
| | | | | | | | | | | | | | | | | | | | |
Total income (loss) from investment operations | | | 0.82 | | | | 1.61 | | | | (3.93 | ) | | | (0.02 | ) | | | 0.44 | |
| | | | | | | | | | | | | | | | | | | | |
Less distributions to shareholders: | | | | | | | | | | | | | | | | | | | | |
From net investment income | | | (0.10 | ) | | | (0.13 | ) | | | - | | | | (0.12 | ) | | | (0.08 | ) |
From net realized gains | | | - | | | | - | | | | - | | | | (0.42 | ) | | | - | |
Tax return of capital | | | - | | | | - | | | | - | | | | (0.00 | ) † | | | - | |
| | | | | | | | | | | | | | | | | | | | |
Total distributions | | | (0.10 | ) | | | (0.13 | ) | | | - | | | | (0.54 | ) | | | (0.08 | ) |
| | | | | | | | | | | | | | | | | | | | |
Net asset value, end of period | | $ | 8.07 | | | $ | 7.35 | | | $ | 5.87 | | | $ | 9.80 | | | $ | 10.36 | |
| | | | | | | | | | | | | | | | | | | | |
Total Return ^^ | | | 11.47% | | | | 27.66% | | | | (40.10% | ) | | | (0.33% | ) | | | 4.35% | ** |
| | | | | |
Ratios / Supplemental Data: | | | | | | | | | | | | | | | | | | | | |
Net assets, end of period (000’s) | | $ | 143,556 | | | $ | 147,773 | | | $ | 133,236 | | | $ | 269,803 | | | $ | 302,641 | |
Ratio of expenses to average daily net assets: | | | | | | | | | | | | | | | | | | | | |
Before expense waiver | | | 0.56% | | | | 0.58% | | | | 0.56% | | | | 0.54% | | | | 0.55% | * |
After expense waiver | | | N/A | | | | N/A | | | | 0.55% | # | | | 0.52% | # | | | 0.52% | *# |
Net investment income (loss) to average daily net assets | | | 1.06% | | | | 1.51% | | | | 1.39% | | | | 1.13% | | | | 1.11% | * |
Portfolio turnover rate | | | 95% | | | | 47% | | | | 48% | | | | 38% | | | | 22% | ** |
| | | |
| | | Service Class | | | | | | | |
| | | Year
Ended
12/31/10 | | | Year
Ended
12/31/09 | | | Period
Ended
12/31/08 +++ | | | | | | | |
Net asset value, beginning of period | | $ | 7.32 | | | $ | 5.86 | | | $ | 8.59 | | | | | | | | | |
| | | | | | | | | | | | | | | | | | | | |
Income (loss) from investment operations: | | | | | | | | | | | | | | | | | | | | |
Net investment income (loss) *** | | | 0.06 | | | | 0.07 | | | | 0.05 | | | | | | | | | |
Net realized and unrealized gain (loss) on investments | | | 0.74 | | | | 1.52 | | | | (2.78 | ) | | | | | | | | |
| | | | | | | | | | | | | | | | | | | | |
Total income (loss) from investment operations | | | 0.80 | | | | 1.59 | | | | (2.73 | ) | | | | | | | | |
| | | | | | | | | | | | | | | | | | | | |
Less distributions to shareholders: | | | | | | | | | | | | | | | | | | | | |
From net investment income | | | (0.09 | ) | | | (0.13 | ) | | | - | | | | | | | | | |
| | | | | | | | | | | | | | | | | | | | |
Total distributions | | | (0.09 | ) | | | (0.13 | ) | | | - | | | | | | | | | |
| | | | | | | | | | | | | | | | | | | | |
Net asset value, end of period | | $ | 8.03 | | | $ | 7.32 | | | $ | 5.86 | | | | | | | | | |
| | | | | | | | | | | | | | | | | | | | |
Total Return ^^ | | | 11.21% | | | | 27.35% | | | | (31.78% | ) ** | | | | | | | | |
| | | | | |
Ratios / Supplemental Data: | | | | | | | | | | | | | | | | | | | | |
Net assets, end of period (000’s) | | $ | 13,294 | | | $ | 11,212 | | | $ | 1,319 | | | | | | | | | |
Ratio of expenses to average daily net assets | | | 0.81% | | | | 0.83% | | | | 0.84% | * | | | | | | | | |
Net investment income (loss) to average daily net assets | | | 0.82% | | | | 1.05% | | | | 2.15% | * | | | | | | | | |
Portfolio turnover rate | | | 95% | | | | 47% | | | | 48% | ~ | | | | | | | | |
| ** | Percentage represents the results for the period and is not annualized. |
| *** | Per share amount calculated on the average shares method. |
| † | Amount is less than $0.005 per share. |
| + | For the period May 1, 2006 (commencement of operations) through December 31, 2006. |
| +++ | For the period August 15, 2008 (commencement of operations) through December 31, 2008. |
| # | Computed after giving effect to an agreement by MassMutual to waive certain fees and expenses of the Fund. |
| ^^ | Total return does not reflect expenses that apply at the separate account level or to related insurance products. Inclusion of these charges would reduce the total return figures for all periods shown. |
| ~ | The portfolio turnover rate results are for the Fund. |
The accompanying notes are an integral part of the financial statements.
115
MML Series Investment Fund – Financial Highlights (Continued)
(For a share outstanding throughout each period)
MML Income & Growth Fund
| | | | | | | | | | | | | | | | | | | | |
| | | Initial Class | |
| | | Year
Ended
12/31/10 | | | Year
Ended
12/31/09 | | | Year
Ended
12/31/08 | | | Year
Ended
12/31/07 | | | Period
Ended
12/31/06 + | |
Net asset value, beginning of period | | $ | 7.82 | | | $ | 6.68 | | | $ | 10.24 | | | $ | 11.03 | | | $ | 10.00 | |
| | | | | | | | | | | | | | | | | | | | |
Income (loss) from investment operations: | | | | | | | | | | | | | | | | | | | | |
Net investment income (loss) *** | | | 0.13 | | | | 0.13 | | | | 0.16 | | | | 0.17 | | | | 0.13 | |
Net realized and unrealized gain (loss) on investments | | | 0.73 | | | | 1.07 | | | | (3.72 | ) | | | (0.24 | ) | | | 1.04 | |
| | | | | | | | | | | | | | | | | | | | |
Total income (loss) from investment
operations | | | 0.86 | | | | 1.20 | | | | (3.56 | ) | | | (0.07 | ) | | | 1.17 | |
| | | | | | | | | | | | | | | | | | | | |
Less distributions to shareholders: | | | | | | | | | | | | | | | | | | | | |
From net investment income | | | (0.31 | ) | | | (0.06 | ) | | | (0.00 | ) † | | | (0.17 | ) | | | (0.14 | ) |
From net realized gains | | | - | | | | - | | | | (0.00 | ) † | | | (0.55 | ) | | | - | |
Tax return of capital | | | - | | | | - | | | | - | | | | (0.00 | ) † | | | - | |
| | | | | | | | | | | | | | | | | | | | |
Total distributions | | | (0.31 | ) | | | (0.06 | ) | | | (0.00 | ) † | | | (0.72 | ) | | | (0.14 | ) |
| | | | | | | | | | | | | | | | | | | | |
Net asset value, end of period | | $ | 8.37 | | | $ | 7.82 | | | $ | 6.68 | | | $ | 10.24 | | | $ | 11.03 | |
| | | | | | | | | | | | | | | | | | | | |
Total Return ^^ | | | 11.70% | | | | 18.06% | | | | (34.76% | ) | | | (0.77% | ) | | | 11.66% | ** |
| | | | | |
Ratios / Supplemental Data: | | | | | | | | | | | | | | | | | | | | |
Net assets, end of period (000’s) | | $ | 72,789 | | | $ | 270,263 | | | $ | 76,447 | | | $ | 150,272 | | | $ | 180,804 | |
Ratio of expenses to average daily net assets: | | | | | | | | | | | | | | | | | | | | |
Before expense waiver | | | 0.73% | | | | 0.72% | | | | 0.74% | | | | 0.70% | | | | 0.72% | * |
After expense waiver | | | N/A | | | | N/A | | | | 0.73% | # | | | 0.70% | ## | | | 0.70% | *# |
Net investment income (loss) to average daily net assets | | | 1.62% | | | | 1.79% | | | | 1.82% | | | | 1.48% | | | | 1.84% | * |
Portfolio turnover rate | | | 64% | | | | 52% | | | | 59% | | | | 57% | | | | 38% | ** |
| | | |
| | | Service Class | | | | | | | |
| | | Year
Ended
12/31/10 | | | Year
Ended
12/31/09 | | | Period
Ended
12/31/08 +++ | | | | | | | |
Net asset value, beginning of period | | $ | 7.79 | | | $ | 6.68 | | | $ | 9.09 | | | | | | | | | |
| | | | | | | | | | | | | | | | | | | | |
Income (loss) from investment operations: | | | | | | | | | | | | | | | | | | | | |
Net investment income (loss) *** | | | 0.13 | | | | 0.11 | | | | 0.06 | | | | | | | | | |
Net realized and unrealized gain (loss) on investments | | | 0.71 | | | | 1.06 | | | | (2.47 | ) | | | | | | | | |
| | | | | | | | | | | | | | | | | | | | |
Total income (loss) from investment
operations | | | 0.84 | | | | 1.17 | | | | (2.41 | ) | | | | | | | | |
| | | | | | | | | | | | | | | | | | | | |
Less distributions to shareholders: | | | | | | | | | | | | | | | | | | | | |
From net investment income | | | (0.30 | ) | | | (0.06 | ) | | | (0.00 | ) † | | | | | | | | |
From net realized gains | | | - | | | | - | | | | (0.00 | ) † | | | | | | | | |
| | | | | | | | | | | | | | | | | | | | |
Total distributions | | | (0.30 | ) | | | (0.06 | ) | | | (0.00 | ) † | | | | | | | | |
| | | | | | | | | | | | | | | | | | | | |
Net asset value, end of period | | $ | 8.33 | | | $ | 7.79 | | | $ | 6.68 | | | | | | | | | |
| | | | | | | | | | | | | | | | | | | | |
Total Return ^^ | | | 11.47% | | | | 17.59% | | | | (26.51% | ) ** | | | | | | | | |
| | | | | |
Ratios / Supplemental Data: | | | | | | | | | | | | | | | | | | | | |
Net assets, end of period (000’s) | | $ | 3,953 | | | $ | 2,406 | | | $ | 650 | | | | | | | | | |
Ratio of expenses to average daily net assets | | | 0.98% | | | | 0.97% | | | | 1.03% | * | | | | | | | | |
Net investment income (loss) to average daily net assets | | | 1.64% | | | | 1.59% | | | | 2.33% | * | | | | | | | | |
Portfolio turnover rate | | | 64% | | | | 52% | | | | 59% | ~ | | | | | | | | |
| ** | Percentage represents the results for the period and is not annualized. |
| *** | Per share amount calculated on the average shares method. |
| † | Amount is less than $0.005 per share. |
| + | For the period May 1, 2006 (commencement of operations) through December 31, 2006. |
| +++ | For the period August 15, 2008 (commencement of operations) through December 31, 2008. |
| # | Computed after giving effect to an agreement by MassMutual to waive certain fees and expenses of the Fund. |
| ## | Amount waived had no impact on the ratio of expenses to average daily net assets. |
| ^^ | Total return does not reflect expenses that apply at the separate account level or to related insurance products. Inclusion of these charges would reduce the total return figures for all periods shown. |
| ~ | The portfolio turnover rate results are for the Fund. |
The accompanying notes are an integral part of the financial statements.
116
MML Series Investment Fund – Financial Highlights (Continued)
(For a share outstanding throughout each period)
MML Large Cap Growth Fund
| | | | | | | | | | | | | | | | | | | | |
| | | Initial Class | |
| | | Year
Ended
12/31/10 | | | Year
Ended
12/31/09 | | | Year
Ended
12/31/08 | | | Year
Ended
12/31/07 | | | Period
Ended
12/31/06 + | |
Net asset value, beginning of period | | $ | 8.80 | | | $ | 6.71 | | | $ | 11.34 | | | $ | 10.00 | | | $ | 10.00 | |
| | | | | | | | | | | | | | | | | | | | |
Income (loss) from investment operations: | | | | | | | | | | | | | | | | | | | | |
Net investment income (loss) *** | | | 0.03 | | | | 0.03 | | | | 0.03 | | | | 0.01 | | | | 0.01 | |
Net realized and unrealized gain (loss) on investments | | | 1.63 | | | | 2.10 | | | | (4.66 | ) | | | 1.35 | | | | (0.00 | ) † |
| | | | | | | | | | | | | | | | | | | | |
Total income (loss) from investment
operations | | | 1.66 | | | | 2.13 | | | | (4.63 | ) | | | 1.36 | | | | 0.01 | |
| | | | | | | | | | | | | | | | | | | | |
Less distributions to shareholders: | | | | | | | | | | | | | | | | | | | | |
From net investment income | | | (0.01 | ) | | | (0.04 | ) | | | - | | | | (0.02 | ) | | | (0.01 | ) |
| | | | | | | | | | | | | | | | | | | | |
Total distributions | | | (0.01 | ) | | | (0.04 | ) | | | - | | | | (0.02 | ) | | | (0.01 | ) |
| | | | | | | | | | | | | | | | | | | | |
Net asset value, end of period | | $ | 10.45 | | | $ | 8.80 | | | $ | 6.71 | | | $ | 11.34 | | | $ | 10.00 | |
| | | | | | | | | | | | | | | | | | | | |
Total Return ^^ | | | 18.87% | | | | 31.75% | | | | (40.83% | ) | | | 13.57% | | | | 0.10% | ** |
| | | | | |
Ratios / Supplemental Data: | | | | | | | | | | | | | | | | | | | | |
Net assets, end of period (000’s) | | $ | 166,552 | | | $ | 41,071 | | | $ | 36,197 | | | $ | 74,225 | | | $ | 77,892 | |
Ratio of expenses to average daily net assets: | | | | | | | | | | | | | | | | | | | | |
Before expense waiver | | | 0.72% | | | | 0.81% | | | | 0.78% | | | | 0.72% | | | | 0.76% | * |
After expense waiver | | | N/A | | | | N/A | | | | 0.77% | # | | | N/A | | | | 0.73% | *# |
Net investment income (loss) to average daily net assets | | | 0.36% | | | | 0.35% | | | | 0.35% | | | | 0.12% | | | | 0.15% | * |
Portfolio turnover rate | | | 88% | | | | 151% | | | | 86% | | | | 85% | | | | 61% | ** |
| | | |
| | | Service Class | | | | | | | |
| | | Year
Ended
12/31/10 | | | Year
Ended
12/31/09 | | | Period
Ended
12/31/08 +++ | | | | | | | |
Net asset value, beginning of period | | $ | 8.78 | | | $ | 6.71 | | | $ | 9.87 | | | | | | | | | |
| | | | | | | | | | | | | | | | | | | | |
Income (loss) from investment operations: | | | | | | | | | | | | | | | | | | | | |
Net investment income (loss) *** | | | 0.01 | | | | 0.01 | | | | 0.01 | | | | | | | | | |
Net realized and unrealized gain (loss) on investments | | | 1.61 | | | | 2.09 | | | | (3.17 | ) | | | | | | | | |
| | | | | | | | | | | | | | | | | | | | |
Total income (loss) from investment
operations | | | 1.62 | | | | 2.10 | | | | (3.16 | ) | | | | | | | | |
| | | | | | | | | | | | | | | | | | | | |
Less distributions to shareholders: | | | | | | | | | | | | | | | | | | | | |
From net investment income | | | - | | | | (0.03 | ) | | | - | | | | | | | | | |
| | | | | | | | | | | | | | | | | | | | |
Total distributions | | | - | | | | (0.03 | ) | | | - | | | | | | | | | |
| | | | | | | | | | | | | | | | | | | | |
Net asset value, end of period | | $ | 10.40 | | | $ | 8.78 | | | $ | 6.71 | | | | | | | | | |
| | | | | | | | | | | | | | | | | | | | |
Total Return ^^ | | | 18.45% | | | | 31.43% | | | | (32.02% | ) ** | | | | | | | | |
| | | | | |
Ratios / Supplemental Data: | | | | | | | | | | | | | | | | | | | | |
Net assets, end of period (000’s) | | $ | 763 | | | $ | 636 | | | $ | 236 | | | | | | | | | |
Ratio of expenses to average daily net assets | | | 0.97% | | | | 1.06% | | | | 1.13% | * | | | | | | | | |
Net investment income (loss) to average daily net assets | | | 0.11% | | | | 0.08% | | | | 0.53% | * | | | | | | | | |
Portfolio turnover rate | | | 88% | | | | 151% | | | | 86% | ~ | | | | | | | | |
| ** | Percentage represents the results for the period and is not annualized. |
| *** | Per share amount calculated on the average shares method. |
| † | Amount is less than $0.005 per share. |
| + | For the period May 1, 2006 (commencement of operations) through December 31, 2006. |
| +++ | For the period August 15, 2008 (commencement of operations) through December 31, 2008. |
| # | Computed after giving effect to an agreement by MassMutual to waive certain fees and expenses of the Fund. |
| ^^ | Total return does not reflect expenses that apply at the separate account level or to related insurance products. Inclusion of these charges would reduce the total return figures for all periods shown. |
| ~ | The portfolio turnover rate results are for the Fund. |
The accompanying notes are an integral part of the financial statements.
117
MML Series Investment Fund – Financial Highlights (Continued)
(For a share outstanding throughout each period)
MML Mid Cap Growth Fund
| | | | | | | | | | | | | | | | | | | | |
| | | Initial Class | |
| | | Year
Ended
12/31/10 | | | Year
Ended
12/31/09 | | | Year
Ended
12/31/08 | | | Year
Ended
12/31/07 | | | Period
Ended
12/31/06 + | |
Net asset value, beginning of period | | $ | 9.55 | | | $ | 6.57 | | | $ | 11.18 | | | $ | 10.04 | | | $ | 10.00 | |
| | | | | | | | | | | | | | | | | | | | |
Income (loss) from investment operations: | | | | | | | | | | | | | | | | | | | | |
Net investment income (loss) *** | | | (0.02 | ) | | | (0.02 | ) | | | (0.02 | ) | | | 0.01 | | | | (0.01 | ) |
Net realized and unrealized gain (loss) on investments | | | 2.70 | | | | 3.00 | | | | (4.41 | ) | | | 1.71 | | | | 0.05 | |
| | | | | | | | | | | | | | | | | | | | |
Total income (loss) from investment operations | | | 2.68 | | | | 2.98 | | | | (4.43 | ) | | | 1.72 | | | | 0.04 | |
| | | | | | | | | | | | | | | | | | | | |
Less distributions to shareholders: | | | | | | | | | | | | | | | | | | | | |
From net investment income | | | - | | | | - | | | | - | | | | (0.01 | ) | | | - | |
From net realized gains | | | - | | | | - | | | | (0.18 | ) | | | (0.57 | ) | | | - | |
| | | | | | | | | | | | | | | | | | | | |
Total distributions | | | - | | | | - | | | | (0.18 | ) | | | (0.58 | ) | | | - | |
| | | | | | | | | | | | | | | | | | | | |
Net asset value, end of period | | $ | 12.23 | | | $ | 9.55 | | | $ | 6.57 | | | $ | 11.18 | | | $ | 10.04 | |
| | | | | | | | | | | | | | | | | | | | |
Total Return ^^ | | | 28.06% | | | | 45.36% | | | | (40.21% | ) | | | 16.89% | | | | 0.50% | ** |
| | | | | |
Ratios / Supplemental Data: | | | | | | | | | | | | | | | | | | | | |
Net assets, end of period (000’s) | | $ | 330,711 | | | $ | 274,954 | | �� | $ | 183,886 | | | $ | 285,701 | | | $ | 285,149 | |
Ratio of expenses to average daily net assets | | | 0.82% | | | | 0.84% | | | | 0.83% | | | | 0.81% | | | | 0.83% | * |
Net investment income (loss) to average daily net assets | | | (0.20% | ) | | | (0.25% | ) | | | (0.21% | ) | | | 0.08% | | | | (0.11% | ) * |
Portfolio turnover rate | | | 29% | | | | 52% | | | | 32% | | | | 31% | | | | 30% | ** |
| | | |
| | | Service Class | | | | | | | |
| | | Year
Ended
12/31/10 | | | Year
Ended
12/31/09 | | | Period
Ended
12/31/08 +++ | | | | | | | |
Net asset value, beginning of period | | $ | 9.52 | | | $ | 6.57 | | | $ | 10.46 | | | | | | | | | |
| | | | | | | | | | | | | | | | | | | | |
Income (loss) from investment operations: | | | | | | | | | | | | | | | | | | | | |
Net investment income (loss) *** | | | (0.04 | ) | | | (0.04 | ) | | | (0.01 | ) | | | | | | | | |
Net realized and unrealized gain (loss) on investments | | | 2.69 | | | | 2.99 | | | | (3.70 | ) | | | | | | | | |
| | | | | | | | | | | | | | | | | | | | |
Total income (loss) from investment operations | | | 2.65 | | | | 2.95 | | | | (3.71 | ) | | | | | | | | |
| | | | | | | | | | | | | | | | | | | | |
Less distributions to shareholders: | | | | | | | | | | | | | | | | | | | | |
From net realized gains | | | - | | | | - | | | | (0.18 | ) | | | | | | | | |
| | | | | | | | | | | | | | | | | | | | |
Total distributions | | | - | | | | - | | | | (0.18 | ) | | | | | | | | |
| | | | | | | | | | | | | | | | | | | | |
Net asset value, end of period | | $ | 12.17 | | | $ | 9.52 | | | $ | 6.57 | | | | | | | | | |
| | | | | | | | | | | | | | | | | | | | |
Total Return ^^ | | | 27.84% | | | | 44.90% | | | | (36.09% | ) ** | | | | | | | | |
| | | | | |
Ratios / Supplemental Data: | | | | | | | | | | | | | | | | | | | | |
Net assets, end of period (000’s) | | $ | 17,236 | | | $ | 9,743 | | | $ | 3,757 | | | | | | | | | |
Ratio of expenses to average daily net assets | | | 1.07% | | | | 1.09% | | | | 1.11% | * | | | | | | | | |
Net investment income (loss) to average daily net assets | | | (0.42% | ) | | | (0.50% | ) | | | (0.29% | ) * | | | | | | | | |
Portfolio turnover rate | | | 29% | | | | 52% | | | | 32% | ~ | | | | | | | | |
| ** | Percentage represents the results for the period and is not annualized. |
| *** | Per share amount calculated on the average shares method. |
| + | For the period May 1, 2006 (commencement of operations) through December 31, 2006. |
| +++ | For the period August 15, 2008 (commencement of operations) through December 31, 2008. |
| ^^ | Total return does not reflect expenses that apply at the separate account level or to related insurance products. Inclusion of these charges would reduce the total return figures for all periods shown. |
| ~ | The portfolio turnover rate results are for the Fund. |
The accompanying notes are an integral part of the financial statements.
118
MML Series Investment Fund – Financial Highlights (Continued)
(For a share outstanding throughout each period)
MML Mid Cap Value Fund
| | | | | | | | | | | | | | | | | | | | |
| | | Initial Class | |
| | | Year
Ended
12/31/10 | | | Year
Ended
12/31/09 | | | Year
Ended
12/31/08 | | | Year
Ended
12/31/07 | | | Period
Ended
12/31/06 + | |
Net asset value, beginning of period | | $ | 8.85 | | | $ | 6.93 | | | $ | 9.18 | | | $ | 10.81 | | | $ | 10.00 | |
| | | | | | | | | | | | | | | | | | | | |
Income (loss) from investment operations: | | | | | | | | | | | | | | | | | | | | |
Net investment income (loss) *** | | | 0.22 | | | | 0.15 | | | | 0.17 | | | | 0.15 | | | | 0.10 | |
Net realized and unrealized gain (loss) on investments | | | 1.53 | | | | 1.93 | | | | (2.42 | ) | | | (0.35 | ) | | | 1.03 | |
| | | | | | | | | | | | | | | | | | | | |
Total income (loss) from investment operations | | | 1.75 | | | | 2.08 | | | | (2.25 | ) | | | (0.20 | ) | | | 1.13 | |
| | | | | | | | | | | | | | | | | | | | |
Less distributions to shareholders: | | | | | | | | | | | | | | | | | | | | |
From net investment income | | | (0.14 | ) | | | (0.16 | ) | | | (0.00 | ) † | | | (0.10 | ) | | | (0.10 | ) |
From net realized gains | | | - | | | | - | | | | - | | | | (1.33 | ) | | | (0.22 | ) |
| | | | | | | | | | | | | | | | | | | | |
Total distributions | | | (0.14 | ) | | | (0.16 | ) | | | (0.00 | ) † | | | (1.43 | ) | | | (0.32 | ) |
| | | | | | | | | | | | | | | | | | | | |
Net asset value, end of period | | $ | 10.46 | | | $ | 8.85 | | | $ | 6.93 | | | $ | 9.18 | | | $ | 10.81 | |
| | | | | | | | | | | | | | | | | | | | |
Total Return ^^ | | | 20.09% | | | | 30.31% | | | | (24.51% | ) | | | (2.32% | ) | | | 11.23% | ** |
| | | | | |
Ratios / Supplemental Data: | | | | | | | | | | | | | | | | | | | | |
Net assets, end of period (000’s) | | $ | 419,863 | | | $ | 375,386 | | | $ | 291,433 | | | $ | 404,928 | | | $ | 358,906 | |
Ratio of expenses to average daily net assets | | | 0.89% | | | | 0.91% | | | | 0.90% | | | | 0.88% | | | | 0.90% | * |
Net investment income (loss) to average daily net assets | | | 2.36% | | | | 1.99% | | | | 2.09% | | | | 1.33% | | | | 1.44% | * |
Portfolio turnover rate | | | 125% | | | | 159% | | | | 189% | | | | 206% | | | | 173% | ** |
| | | |
| | | Service Class | | | | | | | |
| | | Year
Ended
12/31/10 | | | Year
Ended
12/31/09 | | | Period
Ended
12/31/08 +++ | | | | | | | |
Net asset value, beginning of period | | $ | 8.83 | | | $ | 6.92 | | | $ | 9.06 | | | | | | | | | |
| | | | | | | | | | | | | | | | | | | | |
Income (loss) from investment operations: | | | | | | | | | | | | | | | | | | | | |
Net investment income (loss) *** | | | 0.20 | | | | 0.13 | | | | 0.09 | | | | | | | | | |
Net realized and unrealized gain (loss) on investments | | | 1.51 | | | | 1.94 | | | | (2.23 | ) | | | | | | | | |
| | | | | | | | | | | | | | | | | | | | |
Total income (loss) from investment operations | | | 1.71 | | | | 2.07 | | | | (2.14 | ) | | | | | | | | |
| | | | | | | | | | | | | | | | | | | | |
Less distributions to shareholders: | | | | | | | | | | | | | | | | | | | | |
From net investment income | | | (0.13 | ) | | | (0.16 | ) | | | (0.00 | ) † | | | | | | | | |
| | | | | | | | | | | | | | | | | | | | |
Total distributions | | | (0.13 | ) | | | (0.16 | ) | | | (0.00 | ) † | | | | | | | | |
| | | | | | | | | | | | | | | | | | | | |
Net asset value, end of period | | $ | 10.41 | | | $ | 8.83 | | | $ | 6.92 | | | | | | | | | |
| | | | | | | | | | | | | | | | | | | | |
Total Return ^^ | | | 19.62% | | | | 30.20% | | | | (23.62% | ) ** | | | | | | | | |
| | | | | |
Ratios / Supplemental Data: | | | | | | | | | | | | | | | | | | | | |
Net assets, end of period (000’s) | | $ | 9,686 | | | $ | 6,160 | | | $ | 2,279 | | | | | | | | | |
Ratio of expenses to average daily net assets | | | 1.14% | | | | 1.16% | | | | 1.16% | * | | | | | | | | |
Net investment income (loss) to average daily net assets | | | 2.14% | | | | 1.76% | | | | 3.51% | * | | | | | | | | |
Portfolio turnover rate | | | 125% | | | | 159% | | | | 189% | ~ | | | | | | | | |
| ** | Percentage represents the results for the period and is not annualized. |
| *** | Per share amount calculated on the average shares method. |
| † | Amount is less than $0.005 per share. |
| + | For the period May 1, 2006 (commencement of operations) through December 31, 2006. |
| +++ | For the period August 15, 2008 (commencement of operations) through December 31, 2008. |
| ^^ | Total return does not reflect expenses that apply at the separate account level or to related insurance products. Inclusion of these charges would reduce the total return figures for all periods shown. |
| ~ | The portfolio turnover rate results are for the Fund. |
The accompanying notes are an integral part of the financial statements.
119
MML Series Investment Fund – Financial Highlights (Continued)
(For a share outstanding throughout each period)
MML Small Cap Index Fund
| | | | | | | | | | | | | | | | | | | | |
| | | Initial Class | |
| | | Year
Ended
12/31/10 | | | Year
Ended
12/31/09 | | | Year
Ended
12/31/08 | | | Year
Ended
12/31/07 | | | Period
Ended
12/31/06 + | |
Net asset value, beginning of period | | $ | 7.86 | | | $ | 6.49 | | | $ | 9.56 | | | $ | 10.10 | | | $ | 10.00 | |
| | | | | | | | | | | | | | | | | | | | |
Income (loss) from investment operations: | | | | | | | | | | | | | | | | | | | | |
Net investment income (loss) *** | | | 0.06 | | | | 0.04 | | | | 0.08 | | | | 0.09 | | | | 0.04 | |
Net realized and unrealized gain (loss) on investments | | | 1.94 | | | | 1.55 | | | | (3.05 | ) | | | (0.13 | ) | | | 0.10 | |
| | | | | | | | | | | | | | | | | | | | |
Total income (loss) from investment
operations | | | 2.00 | | | | 1.59 | | | | (2.97 | ) | | | (0.04 | ) | | | 0.14 | |
| | | | | | | | | | | | | | | | | | | | |
Less distributions to shareholders: | | | | | | | | | | | | | | | | | | | | |
From net investment income | | | (0.05 | ) | | | (0.08 | ) | | | - | | | | (0.09 | ) | | | (0.04 | ) |
From net realized gains | | | - | | | | (0.14 | ) | | | (0.10 | ) | | | (0.41 | ) | | | - | |
| | | | | | | | | | | | | | | | | | | | |
Total distributions | | | (0.05 | ) | | | (0.22 | ) | | | (0.10 | ) | | | (0.50 | ) | | | (0.04 | ) |
| | | | | | | | | | | | | | | | | | | | |
Net asset value, end of period | | $ | 9.81 | | | $ | 7.86 | | | $ | 6.49 | | | $ | 9.56 | | | $ | 10.10 | |
| | | | | | | | | | | | | | | | | | | | |
Total Return ^^ | | | 25.61% | | | | 24.80% | | | | (31.36% | ) | | | (0.57% | ) | | | 1.41% | ** |
| | | | | |
Ratios / Supplemental Data: | | | | | | | | | | | | | | | | | | | | |
Net assets, end of period (000’s) | | $ | 42,037 | | | $ | 38,456 | | | $ | 33,944 | | | $ | 58,893 | | | $ | 68,783 | |
Ratio of expenses to average daily net assets: | | | | | | | | | | | | | | | | | | | | |
Before expense waiver | | | 0.50% | | | | 0.53% | | | | 0.54% | | | | 0.44% | | | | 0.52% | * |
After expense waiver | | | N/A | | | | N/A | | | | 0.53% | # | | | N/A | | | | 0.45% | *# |
Net investment income (loss) to average daily net assets | | | 0.76% | | | | 0.65% | | | | 0.98% | | | | 0.90% | | | | 0.60% | * |
Portfolio turnover rate | | | 12% | | | | 16% | | | | 23% | | | | 15% | | | | 73% | ** |
| | | |
| | | Service Class | | | | | | | |
| | | Year
Ended
12/31/10 | | | Year
Ended
12/31/09 | | | Period
Ended
12/31/08 +++ | | | | | | | |
Net asset value, beginning of period | | $ | 7.83 | | | $ | 6.48 | | | $ | 9.60 | | | | | | | | | |
| | | | | | | | | | | | | | | | | | | | |
Income (loss) from investment operations: | | | | | | | | | | | | | | | | | | | | |
Net investment income (loss) *** | | | 0.05 | | | | 0.03 | | | | 0.03 | | | | | | | | | |
Net realized and unrealized gain (loss) on investments | | | 1.93 | | | | 1.54 | | | | (3.05 | ) | | | | | | | | |
| | | | | | | | | | | | | | | | | | | | |
Total income (loss) from investment
operations | | | 1.98 | | | | 1.57 | | | | (3.02 | ) | | | | | | | | |
| | | | | | | | | | | | | | | | | | | | |
Less distributions to shareholders: | | | | | | | | | | | | | | | | | | | | |
From net investment income | | | (0.04 | ) | | | (0.08 | ) | | | - | | | | | | | | | |
From net realized gains | | | - | | | | (0.14 | ) | | | (0.10 | ) | | | | | | | | |
| | | | | | | | | | | | | | | | | | | | |
Total distributions | | | (0.04 | ) | | | (0.22 | ) | | | (0.10 | ) | | | | | | | | |
| | | | | | | | | | | | | | | | | | | | |
Net asset value, end of period | | $ | 9.77 | | | $ | 7.83 | | | $ | 6.48 | | | | | | | | | |
| | | | | | | | | | | | | | | | | | | | |
Total Return ^^ | | | 25.36% | | | | 24.51% | | | | (31.75% | ) ** | | | | | | | | |
| | | | | |
Ratios / Supplemental Data: | | | | | | | | | | | | | | | | | | | | |
Net assets, end of period (000’s) | | $ | 4,097 | | | $ | 2,741 | | | $ | 1,184 | | | | | | | | | |
Ratio of expenses to average daily net assets | | | 0.75% | | | | 0.78% | | | | 0.91% | * | | | | | | | | |
Net investment income (loss) to average daily net assets | | | 0.57% | | | | 0.41% | | | | 1.33% | * | | | | | | | | |
Portfolio turnover rate | | | 12% | | | | 16% | | | | 23% | ~ | | | | | | | | |
| ** | Percentage represents the results for the period and is not annualized. |
| *** | Per share amount calculated on the average shares method. |
| + | For the period May 1, 2006 (commencement of operations) through December 31, 2006. |
| +++ | For the period August 15, 2008 (commencement of operations) through December 31, 2008. |
| # | Computed after giving effect to an agreement by MassMutual to waive certain fees and expenses of the Fund. |
| ^^ | Total return does not reflect expenses that apply at the separate account level or to related insurance products. Inclusion of these charges would reduce the total return figures for all periods shown. |
| ~ | The portfolio turnover rate results are for the Fund. |
The accompanying notes are an integral part of the financial statements.
120
MML Series Investment Fund – Financial Highlights (Continued)
(For a share outstanding throughout each period)
MML Small Company Value Fund
| | | | | | | | |
| | | Class II | |
| | | Year
Ended
12/31/10 | | | Period
Ended
12/31/09 + | |
Net asset value, beginning of period | | $ | 15.70 | | | $ | 10.00 | |
| | | | | | | | |
Income (loss) from investment operations: | | | | | | | | |
Net investment income (loss) *** | | | 0.06 | | | | 0.05 | |
Net realized and unrealized gain (loss) on
investments | | | 3.19 | | | | 6.07 | |
| | | | | | | | |
Total income (loss) from investment
operations | | | 3.25 | | | | 6.12 | |
| | | | | | | | |
Less distributions to shareholders: | | | | | | | | |
From net investment income | | | (0.14 | ) | | | (0.04 | ) |
From net realized gains | | | (1.51 | ) | | | (0.38 | ) |
| | | | | | | | |
Total distributions | | | (1.65 | ) | | | (0.42 | ) |
| | | | | | | | |
Net asset value, end of period | | $ | 17.30 | | | $ | 15.70 | |
| | | | | | | | |
Total Return ^^ | | | 20.83% | | | | 61.26% | ** |
| | |
Ratios / Supplemental Data: | | | | | | | | |
Net assets, end of period (000’s) | | $ | 105,829 | | | $ | 96,203 | |
Ratio of expenses to average daily net assets: | | | | | | | | |
Before expense waiver | | | 1.18% | | | | 1.26% | * |
After expense waiver | | | 1.15% | # | | | 1.15% | *# |
Net investment income (loss) to average daily net assets | | | 0.34% | | | | 0.41% | * |
Portfolio turnover rate | | | 29% | | | | 44% | ** |
| |
| | | Service Class I | |
| | | Year
Ended
12/31/10 | | | Period
Ended
12/31/09 + | |
Net asset value, beginning of period | | $ | 15.67 | | | $ | 10.00 | |
| | | | | | | | |
Income (loss) from investment operations: | | | | | | | | |
Net investment income (loss) *** | | | 0.03 | | | | 0.03 | |
Net realized and unrealized gain (loss) on
investments | | | 3.18 | | | | 6.04 | |
| | | | | | | | |
Total income (loss) from investment
operations | | | 3.21 | | | | 6.07 | |
| | | | | | | | |
Less distributions to shareholders: | | | | | | | | |
From net investment income | | | (0.13 | ) | | | (0.02 | ) |
From net realized gains | | | (1.51 | ) | | | (0.38 | ) |
| | | | | | | | |
Total distributions | | | (1.64 | ) | | | (0.40 | ) |
| | | | | | | | |
Net asset value, end of period | | $ | 17.24 | | | $ | 15.67 | |
| | | | | | | | |
Total Return ^^ | | | 20.59% | | | | 60.83% | ** |
| | |
Ratios / Supplemental Data: | | | | | | | | |
Net assets, end of period (000’s) | | $ | 2,581 | | | $ | 677 | |
Ratio of expenses to average daily net assets: | | | | | | | | |
Before expense waiver | | | 1.43% | | | | 1.51% | * |
After expense waiver | | | 1.40% | # | | | 1.40% | *# |
Net investment income (loss) to average daily net assets | | | 0.20% | | | | 0.25% | * |
Portfolio turnover rate | | | 29% | | | | 44% | ** |
| ** | Percentage represents the results for the period and is not annualized. |
| *** | Per share amount calculated on the average shares method. |
| + | For the period February 27, 2009 (commencement of operations) through December 31, 2009. |
| # | Computed after giving effect to an agreement by MassMutual to waive certain fees and expenses of the Fund. |
| ^^ | Total return does not reflect expenses that apply at the separate account level or to related insurance products. Inclusion of these charges would reduce the total return figures for all periods shown. |
The accompanying notes are an integral part of the financial statements.
121
MML Series Investment Fund – Financial Highlights (Continued)
(For a share outstanding throughout each period)
MML Small/Mid Cap Value Fund
| | | | | | | | | | | | | | | | | | | | |
| | | Initial Class | |
| | | Year
Ended
12/31/10 | | | Year
Ended
12/31/09 | | | Year
Ended
12/31/08 | | | Year
Ended
12/31/07 | | | Period
Ended
12/31/06 + | |
Net asset value, beginning of period | | $ | 7.35 | | | $ | 5.21 | | | $ | 8.45 | | | $ | 10.45 | | | $ | 10.00 | |
| | | | | | | | | | | | | | | | | | | | |
Income (loss) from investment operations: | | | | | | | | | | | | | | | | | | | | |
Net investment income (loss) *** | | | 0.05 | | | | 0.04 | | | | 0.08 | | | | 0.11 | | | | 0.08 | |
Net realized and unrealized gain (loss) on
investments | | | 1.91 | | | | 2.18 | | | | (3.32 | ) | | | (2.02 | ) | | | 0.44 | |
| | | | | | | | | | | | | | | | | | | | |
Total income (loss) from investment
operations | | | 1.96 | | | | 2.22 | | | | (3.24 | ) | | | (1.91 | ) | | | 0.52 | |
| | | | | | | | | | | | | | | | | | | | |
Less distributions to shareholders: | | | | | | | | | | | | | | | | | | | | |
From net investment income | | | (0.05 | ) | | | (0.08 | ) | | | - | | | | (0.09 | ) | | | (0.07 | ) |
Tax return of capital | | | - | | | | - | | | | - | | | | (0.00 | ) † | | | - | |
| | | | | | | | | | | | | | | | | | | | |
Total distributions | | | (0.05 | ) | | | (0.08 | ) | | | - | | | | (0.09 | ) | | | (0.07 | ) |
| | | | | | | | | | | | | | | | | | | | |
Net asset value, end of period | | $ | 9.26 | | | $ | 7.35 | | | $ | 5.21 | | | $ | 8.45 | | | $ | 10.45 | |
| | | | | | | | | | | | | | | | | | | | |
Total Return ^^ | | | 26.84% | | | | 42.73% | | | | (38.34% | ) | | | (18.31% | ) | | | 5.20% | ** |
| | | | | |
Ratios / Supplemental Data: | | | | | | | | | | | | | | | | | | | | |
Net assets, end of period (000’s) | | $ | 191,141 | | | $ | 178,318 | | | $ | 145,129 | | | $ | 248,583 | | | $ | 207,239 | |
Ratio of expenses to average daily net assets | | | 0.81% | | | | 0.82% | | | | 0.81% | | | | 0.79% | | | | 0.83% | * |
Net investment income (loss) to average daily net assets | | | 0.62% | | | | 0.69% | | | | 1.10% | | | | 1.14% | | | | 1.29% | * |
Portfolio turnover rate | | | 52% | | | | 65% | | | | 145% | | | | 152% | | | | 173% | ** |
| | | |
| | | Service Class | | | | | | | |
| | | Year
Ended
12/31/10 | | | Year
Ended
12/31/09 | | | Period
Ended
12/31/08 +++ | | | | | | | |
Net asset value, beginning of period | | $ | 7.33 | | | $ | 5.21 | | | $ | 8.11 | | | | | | | | | |
| | | | | | | | | | | | | | | | | | | | |
Income (loss) from investment operations: | | | | | | | | | | | | | | | | | | | | |
Net investment income (loss) *** | | | 0.03 | | | | 0.02 | | | | 0.03 | | | | | | | | | |
Net realized and unrealized gain (loss) on
investments | | | 1.90 | | | | 2.18 | | | | (2.93 | ) | | | | | | | | |
| | | | | | | | | | | | | | | | | | | | |
Total income (loss) from investment
operations | | | 1.93 | | | | 2.20 | | | | (2.90 | ) | | | | | | | | |
| | | | | | | | | | | | | | | | | | | | |
Less distributions to shareholders: | | | | | | | | | | | | | | | | | | | | |
From net investment income | | | (0.04 | ) | | | (0.08 | ) | | | - | | | | | | | | | |
| | | | | | | | | | | | | | | | | | | | |
Total distributions | | | (0.04 | ) | | | (0.08 | ) | | | - | | | | | | | | | |
| | | | | | | | | | | | | | | | | | | | |
Net asset value, end of period | | $ | 9.22 | | | $ | 7.33 | | | $ | 5.21 | | | | | | | | | |
| | | | | | | | | | | | | | | | | | | | |
Total Return ^^ | | | 26.44% | | | | 42.32% | | | | (35.76% | ) ** | | | | | | | | |
| | | | | |
Ratios / Supplemental Data: | | | | | | | | | | | | | | | | | | | | |
Net assets, end of period (000’s) | | $ | 6,388 | | | $ | 3,806 | | | $ | 1,535 | | | | | | | | | |
Ratio of expenses to average daily net assets | | | 1.06% | | | | 1.07% | | | | 1.07% | * | | | | | | | | |
Net investment income (loss) to average daily net assets | | | 0.40% | | | | 0.40% | | | | 1.79% | * | | | | | | | | |
Portfolio turnover rate | | | 52% | | | | 65% | | | | 145% | ~ | | | | | | | | |
| ** | Percentage represents the results for the period and is not annualized. |
| *** | Per share amount calculated on the average shares method. |
| † | Amount is less than 0.005 per share. |
| + | For the period May 1, 2006 (commencement of operations) through December 31, 2006. |
| +++ | For the period August 15, 2008 (commencement of operations) through December 31, 2008. |
| ^^ | Total return does not reflect expenses that apply at the separate account level or to related insurance products. Inclusion of these charges would reduce the total return figures for all periods shown. |
| ~ | The portfolio turnover rate results are for the Fund. |
The accompanying notes are an integral part of the financial statements.
122
Notes to Financial Statements
MML Series Investment Fund (the “Trust”) is registered under the Investment Company Act of 1940, as amended (the “1940 Act”), as a no-load, open-end, management investment company. The Trust is organized under the laws of the Commonwealth of Massachusetts as a Massachusetts business trust pursuant to an Agreement and Declaration of Trust dated May 14, 1993, as amended. The following are thirteen series of the Trust (each individually referred to as a “Fund” or collectively as the “Funds”): MML Asset Allocation Fund (“Asset Allocation Fund”), MML Concentrated Growth Fund (“Concentrated Growth Fund”), MML Equity Income Fund (“Equity Income Fund”), MML Foreign Fund (“Foreign Fund”), MML Global Fund (“Global Fund”), MML Growth & Income Fund (“Growth & Income Fund”), MML Income & Growth Fund (“Income & Growth Fund”), MML Large Cap Growth Fund (“Large Cap Growth Fund”), MML Mid Cap Growth Fund (“Mid Cap Growth Fund”), MML Mid Cap Value Fund (“Mid Cap Value Fund”), MML Small Cap Index Fund (“Small Cap Index Fund”), MML Small Company Value Fund (“Small Company Value Fund”), and MML Small/Mid Cap Value Fund (“Small/Mid Cap Value Fund”).
The Small Company Value Fund commenced operations on February 27, 2009.
The Trust makes shares of the Funds available for the investment of assets of various separate investment accounts established by Massachusetts Mutual Life Insurance Company (“MassMutual”) and by life insurance companies which are subsidiaries of MassMutual. Shares of the Trust are not offered to the general public. MassMutual, MML Bay State Life Insurance Company, and C.M. Life Insurance Company are the record owners of all of the outstanding shares of the Funds.
Each Fund, other than the Concentrated Growth Fund, Global Fund, and Small Company Value Fund, offers the following two classes of shares: Initial Class and Service Class shares. The Concentrated Growth Fund and Global Fund offer the following three classes of shares: Class I, Class II, and Service Class I shares. The Small Company Value Fund offers the following two classes of shares: Class II and Service Class I shares. Each share class represents an interest in the same portfolio of assets. The principal difference among the classes is the level of service and administration fees, and shareholder and distribution service expenses borne by the classes. Because each class will have different fees and expenses, performance and share prices will vary between the classes. The classes of shares are offered to different types of investors, as outlined in the Funds’ Prospectus.
| 2. | | Significant Accounting Policies |
The following is a summary of significant accounting policies followed consistently by each Fund in the preparation of the financial statements in conformity with accounting principles generally accepted in the United States of America (“generally accepted accounting principles”). The preparation of the financial statements in accordance with generally accepted accounting principles requires management to make estimates and assumptions that affect the reported amounts and disclosures in the financial statements. Actual results could differ from those estimates.
Investment Valuation
The net asset value of each Fund’s shares is determined once daily as of the close of regular trading on the New York Stock Exchange, on each day the New York Stock Exchange is open for trading. The New York Stock Exchange normally closes at 4:00 p.m. Eastern Time, but may close earlier on some days.
Equity securities are valued on the basis of information furnished by a pricing service, which provides the last reported sale price for securities listed on a national securities exchange or the official closing price on the NASDAQ National Market System, or in the case of over-the-counter (“OTC”) securities for which an official closing price is unavailable or not reported on the NASDAQ System, the last reported bid price. Debt securities (other than short-term obligations) are valued on the basis of valuations furnished by a pricing service, which determines valuations taking into account factors such as institutional-size trading in similar securities, yield, quality, coupon rate, maturity, type of issue, trading characteristics, and other market data. Short-term debt securities are valued at either amortized cost or at original cost plus accrued interest, whichever approximates current market value. Shares of other open-end mutual funds are valued at their closing net asset values as reported on each business day. Investments are marked to market daily based on values provided by third-party vendors or market makers to the extent available or based on model prices. Valuations provided by third-party vendors and representative bids provided by market makers may be determined on the basis of a variety of factors, such as broker quotations, financial modeling, and other market data, such as market indexes and yield curves, counterparty information, and foreign exchange rates.
123
Notes to Financial Statements (Continued)
Investments for which market quotations are not available or for which a pricing service or vendor does not provide a value, or for which such market quotations or values are considered by the investment adviser or subadviser to be unreliable (including, for example, certain foreign securities, thinly-traded securities, initial public offerings, or securities whose values may have been affected by a significant event) are stated at fair valuations determined by the Funds’ Valuation Committee in accordance with procedures approved by the Board of Trustees (“Trustees”), and under the general oversight of the Trustees. It is possible that fair value prices will be used by the Funds to a significant extent. The value determined for an investment using the Funds’ fair value procedures may differ from recent market prices for the investment and may be significantly different from the value realized upon such asset’s sale.
Portfolio securities traded on more than one national securities exchange are valued at the last price on the business day at the close of the exchange representing the principal market for such securities. All assets and liabilities expressed in foreign currencies are converted into U.S. dollars at the mean between the buying and selling rates of such currencies against the U.S. dollar at the end of each business day.
The Funds may invest in securities that are traded principally in foreign markets and that trade on weekends and other days when the Funds do not price their shares. As a result, the values of the Funds’ portfolio securities may change on days when the prices of the Funds’ shares are not calculated. The prices of the Funds’ shares will reflect any such changes when the prices of the Funds’ shares are next calculated, which is the next day the New York Stock Exchange is open. The Funds may use fair value pricing more frequently for securities primarily traded in foreign markets because, among other things, most foreign markets close well before the Funds value their securities. The earlier close of these foreign markets gives rise to the possibility that significant events, including broad market moves, may have occurred in the interim. The Funds’ investments may be priced based on fair values provided by a third-party fair valuation vendor, based on certain factors and methodologies applied by such vendor, in the event that there is movement in the U.S. market that exceeds a specific threshold established by the Funds’ Valuation Committee pursuant to guidelines established by the Trustees, and under the general oversight of the Trustees.
Fair value is defined as the price that would be received to sell an asset or paid to transfer a liability in an orderly transaction between market participants at the measurement date. A three-tier hierarchy is utilized to maximize the use of observable market data inputs and minimize the use of unobservable inputs and to establish classification of fair value measurements for disclosure purposes. Inputs refer broadly to the assumptions that market participants would use in pricing the asset or liability, including assumptions about risk, for example, the risk inherent in a particular valuation technique used to measure fair value (such as a pricing model) and/or the risk inherent in the inputs to the valuation technique. Inputs may be observable or unobservable. Observable inputs are inputs that reflect the assumptions market participants would use in pricing the asset or liability and are developed based on market data obtained from sources independent of the reporting entity. Unobservable inputs are inputs that reflect the reporting entity’s own assumptions about the assumptions market participants would use in pricing the asset or liability and are developed based on the best information available in the circumstances. The three-tier hierarchy of inputs is summarized in the three broad Levels listed below.
Level 1 – quoted prices (unadjusted) in active markets for identical investments
Level 2 – other significant observable inputs (including quoted prices for similar investments, interest rates, prepayment speeds, credit risk, etc.)
Level 3 – significant unobservable inputs (including the Fund’s own assumptions in determining the fair value of investments)
Changes in valuation techniques may result in transfers in or out of an investment’s assigned Level within the hierarchy. The inputs or methodology used for valuing investments are not necessarily an indication of the risk associated with investing in those investments and the determination of the significance of a particular input to the fair value measurement in its entirety requires judgment and consideration of factors specific to each security.
The availability of observable inputs can vary from security to security and is affected by a wide variety of factors, including, for example, the type of security, whether the security is new and not yet established in the marketplace, the liquidity of markets, and other characteristics particular to the security. To the extent that valuation is based on models or inputs that are less observable or unobservable in the market, the determination of fair value requires more judgment. Accordingly, the degree of judgment exercised in determining fair value is greatest for instruments categorized in Level 3.
124
Notes to Financial Statements (Continued)
In periods of market dislocation, the observability of prices and inputs may be reduced for many instruments. This condition, as well as changes related to liquidity of investments, could cause a security to be reclassified between Level 1, Level 2, or Level 3.
In certain cases, the inputs used to measure fair value may fall into different levels of the fair value hierarchy. In such cases, for disclosure purposes the level in the fair value hierarchy within which the fair value measurement falls is determined based on the lowest level input that is significant to the fair value measurement.
Fair Value Measurements
A description of the valuation techniques applied to the Funds’ major categories of assets and liabilities measured at fair value on a recurring basis follows.
Equity securities. Securities are generally valued based on quoted prices from the applicable exchange. To the extent these securities are actively traded, valuation adjustments are not applied and they are categorized in Level 1 of the fair value hierarchy. Certain foreign securities may be fair valued using a pricing service that considers the correlation of the trading patterns of the foreign security to the intraday trading in the U.S. markets for investments such as depositary receipts, futures, exchange-traded funds (“ETFs”), and the movement of certain indexes of securities based on a statistical analysis of the historical relationship and are categorized in Level 2 of the fair value hierarchy.
Corporate bonds. The fair value of corporate bonds is estimated using recently executed transactions, market price quotations (where observable), bond spreads, or credit default swap spreads adjusted for any basis difference between cash and derivative instruments. Corporate bonds are generally categorized in Level 2 of the fair value hierarchy; in instances where prices, spreads, or any of the other aforementioned key inputs are unobservable, they are categorized in Level 3 of the hierarchy.
Asset-backed securities and mortgage-backed securities. The fair value of asset-backed securities and mortgage-backed securities is estimated based on models that consider the estimated cash flows of each debt tranche of the issuer, establish a benchmark yield, and develop an estimated tranche specific spread to the benchmark yield based on the unique attributes of the tranche including, but not limited to, the prepayment speed assumptions and attributes of the collateral. To the extent the inputs are observable and timely, the values would be categorized in Level 2 of the fair value hierarchy, otherwise they would be categorized as Level 3.
U.S. Government and agency securities. U.S. government and agency securities are normally valued using a model that incorporates market observable data such as reported sales of similar securities, broker quotes, yields, bids, offers, quoted market prices, and reference data. Accordingly, U.S. government and agency securities are normally categorized in Level 2 of the fair value hierarchy.
Derivative contracts. Derivative contracts that are actively traded on an exchange are valued based on quoted prices from the exchange and are categorized in Level 1 of the fair value hierarchy. OTC derivative contracts include forward, swap, and option contracts related to interest rates, foreign currencies, credit standing of reference entities, equity prices, or commodity prices. Depending on the contract and the terms of the transaction, the fair value of the OTC derivative contracts can be modeled using a series of techniques, including simulation models. Many pricing models do not entail material subjectivity because the methodologies employed do not necessitate significant judgments and the pricing inputs are observed from actively quoted markets, as is the case of interest rate swap and option contracts. A majority of OTC derivative contracts valued by the Funds using pricing models fall into this category and are categorized within Level 2 of the fair value hierarchy.
Restricted securities. Restricted securities are valued at a discount to similar publicly traded securities and may be categorized as Level 2 of the fair value hierarchy to the extent that the discount is considered to be insignificant to the fair value measurement in its entirety; otherwise they may be categorized as Level 3. Any illiquid Rule 144A securities or restricted securities held in non-public entities are included in Level 3 of the fair value hierarchy because they trade infrequently and, therefore, the inputs are unobservable.
The Concentrated Growth Fund, Large Cap Growth Fund, Mid Cap Growth Fund, Mid Cap Value Fund, Small Cap Index Fund, and Small/Mid Cap Value Fund characterized all long-term investments at Level 1, and all short-term investments at Level 2, as of December 31, 2010. For each Fund noted above, the level classification by major category of investments is the same as the category presentation in the Portfolio of Investments.
125
Notes to Financial Statements (Continued)
The following is the aggregate value by input level as of December 31, 2010 for the remaining Funds’ investments:
Asset Valuation Inputs
| | | | | | | | | | | | | | | | |
| | | Investments in Securities | |
| | | Level 1 —
Quoted Prices | | | Level 2 —
Other
Significant
Observable
Inputs | | | Level 3 —
Significant
Unobservable
Inputs | | | Total | |
Asset Allocation Fund | | | | | | | | | | | | | | | | |
Equities | | | | | | | | | | | | | | | | |
Common Stock | | | | | | | | | | | | | | | | |
Basic Materials | | $ | 6,250,953 | | | $ | - | | | $ | - | | | $ | 6,250,953 | |
Communications | | | 16,630,543 | | | | - | | | | - | | | | 16,630,543 | |
Consumer, Cyclical | | | 7,463,534 | | | | 1,289,715 | | | | - | | | | 8,753,249 | |
Consumer, Non-cyclical | | | 18,098,989 | | | | - | | | | - | | | | 18,098,989 | |
Energy | | | 16,170,761 | | | | - | | | | - | | | | 16,170,761 | |
Financial | | | 8,733,219 | | | | - | | | | - | | | | 8,733,219 | |
Industrial | | | 9,014,637 | | | | - | | | | - | | | | 9,014,637 | |
Technology | | | 9,966,702 | | | | - | | | | - | | | | 9,966,702 | |
Utilities | | | 903,810 | | | | - | | | | - | | | | 903,810 | |
| | | | | | | | | | | | | | | | |
Total Common Stock | | | 93,233,148 | | | | 1,289,715 | | | | - | | | | 94,522,863 | |
| | | | | | | | | | | | | | | | |
Total Equities | | | 93,233,148 | | | | 1,289,715 | | | | - | | | | 94,522,863 | |
| | | | | | | | | | | | | | | | |
Bonds & Notes | | | | | | | | | | | | | | | | |
Total Corporate Debt | | | - | | | | 14,692,007 | | | | 102,625 | | | | 14,794,632 | |
| | | | | | | | | | | | | | | | |
Total Municipal Obligations | | | - | | | | 521,705 | | | | - | | | | 521,705 | |
| | | | | | | | | | | | | | | | |
Non-U.S. Government Agency Obligations | | | | | | | | | | | | | | | | |
Commercial MBS | | | - | | | | 1,438,910 | | | | - | | | | 1,438,910 | |
Credit Card ABS | | | - | | | | 99,751 | | | | - | | | | 99,751 | |
| | | | | | | | | | | | | | | | |
Total Non-U.S. Government Agency Obligations | | | - | | | | 1,538,661 | | | | - | | | | 1,538,661 | |
| | | | | | | | | | | | | | | | |
Total Sovereign Debt Obligations | | | - | | | | 2,129,116 | | | | - | | | | 2,129,116 | |
| | | | | | | | | | | | | | | | |
U.S. Government Agency Obligations and Instrumentalities | | | | | | | | | | | | | | | | |
Collateralized Mortgage Obligations | | | - | | | | 557,512 | | | | - | | | | 557,512 | |
Pass-Through Securities | | | - | | | | 14,463,730 | | | | - | | | | 14,463,730 | |
| | | | | | | | | | | | | | | | |
Total U.S. Government Agency Obligations and Instrumentalities | | | - | | | | 15,021,242 | | | | - | | | | 15,021,242 | |
| | | | | | | | | | | | | | | | |
U.S. Treasury Obligations | | | | | | | | | | | | | | | | |
U.S. Treasury Bonds & Notes | | | - | | | | 7,519,494 | | | | - | | | | 7,519,494 | |
| | | | | | | | | | | | | | | | |
Total U.S. Treasury Obligations | | | - | | | | 7,519,494 | | | | - | | | | 7,519,494 | |
| | | | | | | | | | | | | | | | |
Total Bonds & Notes | | | - | | | | 41,422,225 | | | | 102,625 | | | | 41,524,850 | |
| | | | | | | | | | | | | | | | |
| Total Long-Term Investments | | | 93,233,148 | | | | 42,711,940 | | | | 102,625 | | | | 136,047,713 | |
| | | | | | | | | | | | | | | | |
| Total Short-Term Investments | | | - | | | | 6,544,847 | | | | - | | | | 6,544,847 | |
| | | | | | | | | | | | | | | | |
| Total Investments | | $ | 93,233,148 | | | $ | 49,256,787 | | | $ | 102,625 | | | $ | 142,592,560 | |
| | | | | | | | | | | | | | | | |
126
Notes to Financial Statements (Continued)
| | | | | | | | | | | | | | | | |
| | | Investments in Securities | |
| | | Level 1 —
Quoted Prices | | | Level 2 —
Other
Significant
Observable
Inputs | | | Level 3 —
Significant
Unobservable
Inputs | | | Total | |
Equity Income Fund | | | | | | | | | | | | | | | | |
Equities | | | | | | | | | | | | | | | | |
Common Stock | | | | | | | | | | | | | | | | |
Basic Materials | | $ | 39,587,217 | | | $ | - | | | $ | - | | | $ | 39,587,217 | |
Communications | | | 57,738,144 | | | | 4,415,237 | | | | - | | | | 62,153,381 | |
Consumer, Cyclical | | | 47,625,572 | | | | - | | | | - | | | | 47,625,572 | |
Consumer, Non-cyclical | | | 66,356,577 | | | | - | | | | - | | | | 66,356,577 | |
Energy | | | 81,005,466 | | | | - | | | | - | | | | 81,005,466 | |
Financial | | | 110,300,396 | | | | - | | | | - | | | | 110,300,396 | |
Industrial | | | 70,984,425 | | | | - | | | | - | | | | 70,984,425 | |
Technology | | | 31,655,114 | | | | - | | | | - | | | | 31,655,114 | |
Utilities | | | 47,138,655 | | | | - | | | | - | | | | 47,138,655 | |
| | | | | | | | | | | | | | | | |
Total Common Stock | | | 552,391,566 | | | | 4,415,237 | | | | - | | | | 556,806,803 | |
| | | | | | | | | | | | | | | | |
Preferred Stock | | | | | | | | | | | | | | | | |
Consumer, Cyclical | | | 3,417,046 | | | | - | | | | - | | | | 3,417,046 | |
| | | | | | | | | | | | | | | | |
Total Preferred Stock | | | 3,417,046 | | | | - | | | | - | | | | 3,417,046 | |
| | | | | | | | | | | | | | | | |
Total Equities | | | 555,808,612 | | | | 4,415,237 | | | | - | | | | 560,223,849 | |
| | | | | | | | | | | | | | | | |
Total Mutual Funds | | | 6,806,231 | | | | - | | | | - | | | | 6,806,231 | |
| | | | | | | | | | | | | | | | |
| Total Long-Term Investments | | | 562,614,843 | | | | 4,415,237 | | | | - | | | | 567,030,080 | |
| | | | | | | | | | | | | | | | |
| Total Short-Term Investments | | | - | | | | 12,883,414 | | | | - | | | | 12,883,414 | |
| | | | | | | | | | | | | | | | |
| Total Investments | | $ | 562,614,843 | | | $ | 17,298,651 | | | $ | - | | | $ | 579,913,494 | |
| | | | | | | | | | | | | | | | |
| | | | |
Foreign Fund | | | | | | | | | | | | | | | | |
Equities | | | | | | | | | | | | | | | | |
Common Stock | | | | | | | | | | | | | | | | |
Basic Materials | | $ | 1,860,991 | | | $ | 7,243,121 | | | $ | - | | | $ | 9,104,112 | |
Communications | | | 18,742,173 | | | | 36,535,546 | | | | - | | | | 55,277,719 | |
Consumer, Cyclical | | | 2,932,899 | | | | 27,435,581 | | | | - | | | | 30,368,480 | |
Consumer, Non-cyclical | | | - | | | | 49,096,872 | | | | - | | | | 49,096,872 | |
Diversified | | | - | | | | 2,313,307 | | | | - | | | | 2,313,307 | |
Energy | | | 11,980,737 | | | | 23,179,347 | | | | - | | | | 35,160,084 | |
Financial | | | 12,266,319 | | | | 46,413,669 | | | | - | | | | 58,679,988 | |
Industrial | | | 4,678,067 | | | | 29,077,114 | | | | - | | | | 33,755,181 | |
Technology | | | 11,044,855 | | | | 25,062,747 | | | | - | | | | 36,107,602 | |
Utilities | | | - | | | | 10,555,432 | | | | - | | | | 10,555,432 | |
| | | | | | | | | | | | | | | | |
Total Common Stock | | | 63,506,041 | | | | 256,912,736 | | | | - | | | | 320,418,777 | |
| | | | | | | | | | | | | | | | |
Preferred Stock | | | | | | | | | | | | | | | | |
Basic Materials | | | 5,794,745 | | | | - | | | | - | | | | 5,794,745 | |
| | | | | | | | | | | | | | | | |
Total Preferred Stock | | | 5,794,745 | | | | - | | | | - | | | | 5,794,745 | |
| | | | | | | | | | | | | | | | |
Total Equities | | | 69,300,786 | | | | 256,912,736 | | | | - | | | | 326,213,522 | |
| | | | | | | | | | | | | | | | |
| Total Long-Term Investments | | | 69,300,786 | | | | 256,912,736 | | | | - | | | | 326,213,522 | |
| | | | | | | | | | | | | | | | |
| Total Short-Term Investments | | | - | | | | 10,432,495 | | | | - | | | | 10,432,495 | |
| | | | | | | | | | | | | | | | |
| Total Investments | | $ | 69,300,786 | | | $ | 267,345,231 | | | $ | - | | | $ | 336,646,017 | |
| | | | | | | | | | | | | | | | |
127
Notes to Financial Statements (Continued)
| | | | | | | | | | | | | | | | |
| | | Investments in Securities | |
| | | Level 1 —
Quoted Prices | | | Level 2 —
Other
Significant
Observable
Inputs | | | Level 3 —
Significant
Unobservable
Inputs | | | Total | |
Global Fund | | | | | | | | | | | | | | | | |
Equities | | | | | | | | | | | | | | | | |
Common Stock | | | | | | | | | | | | | | | | |
Basic Materials | | $ | 2,396,951 | | | $ | 10,541,355 | | | $ | - | | | $ | 12,938,306 | |
Communications | | | 5,462,808 | | | | 1,968,472 | | | | - | | | | 7,431,280 | |
Consumer, Cyclical | | | 5,210,058 | | | | 3,272,093 | | | | - | | | | 8,482,151 | |
Consumer, Non-cyclical | | | 12,058,059 | | | | 17,924,402 | | | | - | | | | 29,982,461 | |
Diversified | | | - | | | | 1,768,538 | | | | - | | | | 1,768,538 | |
Energy | | | 2,858,288 | | | | 1,264,852 | | | | - | | | | 4,123,140 | |
Financial | | | 7,445,439 | | | | 7,485,640 | | | | - | | | | 14,931,079 | |
Industrial | | | 10,530,244 | | | | 5,508,291 | | | | - | | | | 16,038,535 | |
Technology | | | 5,172,925 | | | | 2,365,980 | | | | - | | | | 7,538,905 | |
Utilities | | | - | | | | 253,709 | | | | - | | | | 253,709 | |
| | | | | | | | | | | | | | | | |
Total Common Stock | | | 51,134,772 | | | | 52,353,332 | | | | - | | | | 103,488,104 | |
| | | | | | | | | | | | | | | | |
Total Equities | | | 51,134,772 | | | | 52,353,332 | | | | - | | | | 103,488,104 | |
| | | | | | | | | | | | | | | | |
| Total Long-Term Investments | | | 51,134,772 | | | | 52,353,332 | | | | - | | | | 103,488,104 | |
| | | | | | | | | | | | | | | | |
| Total Short-Term Investments | | | - | | | | 787,769 | | | | - | | | | 787,769 | |
| | | | | | | | | | | | | | | | |
| Total Investments | | $ | 51,134,772 | | | $ | 53,141,101 | | | $ | - | | | $ | 104,275,873 | |
| | | | | | | | | | | | | | | | |
| | | | |
Growth & Income Fund | | | | | | | | | | | | | | | | |
Equities | | | | | | | | | | | | | | | | |
Common Stock | | | | | | | | | | | | | | | | |
Basic Materials | | $ | 4,773,383 | | | $ | 2,370,921 | | | $ | - | | | $ | 7,144,304 | |
Communications | | | 13,595,598 | | | | - | | | | - | | | | 13,595,598 | |
Consumer, Cyclical | | | 11,109,383 | | | | 1,554,245 | | | | - | | | | 12,663,628 | |
Consumer, Non-cyclical | | | 31,014,835 | | | | 6,033,123 | | | | - | | | | 37,047,958 | |
Energy | | | 19,424,692 | | | | - | | | | - | | | | 19,424,692 | |
Financial | | | 27,972,183 | | | | - | | | | - | | | | 27,972,183 | |
Industrial | | | 14,802,160 | | | | - | | | | - | | | | 14,802,160 | |
Technology | | | 19,002,125 | | | | 625,945 | | | | - | | | | 19,628,070 | |
Utilities | | | 3,356,011 | | | | - | | | | - | | | | 3,356,011 | |
| | | | | | | | | | | | | | | | |
Total Common Stock | | | 145,050,370 | | | | 10,584,234 | | | | - | | | | 155,634,604 | |
| | | | | | | | | | | | | | | | |
Total Equities | | | 145,050,370 | | | | 10,584,234 | | | | - | | | | 155,634,604 | |
| | | | | | | | | | | | | | | | |
| Total Long-Term Investments | | | 145,050,370 | | | | 10,584,234 | | | | - | | | | 155,634,604 | |
| | | | | | | | | | | | | | | | |
| Total Short-Term Investments | | | - | | | | 1,372,799 | | | | - | | | | 1,372,799 | |
| | | | | | | | | | | | | | | | |
| Total Investments | | $ | 145,050,370 | | | $ | 11,957,033 | | | $ | - | | | $ | 157,007,403 | |
| | | | | | | | | | | | | | | | |
128
Notes to Financial Statements (Continued)
| | | | | | | | | | | | | | | | |
| | | Investments in Securities | |
| | | Level 1 —
Quoted Prices | | | Level 2 —
Other
Significant
Observable
Inputs | | | Level 3 —
Significant
Unobservable
Inputs | | | Total | |
Income & Growth Fund | | | | | | | | | | | | | | | | |
Equities | | | | | | | | | | | | | | | | |
Common Stock | | | | | | | | | | | | | | | | |
Basic Materials | | $ | 4,666,439 | | | $ | 3,267,141 | | | $ | - | | | $ | 7,933,580 | |
Communications | | | 5,390,568 | | | | - | | | | - | | | | 5,390,568 | |
Consumer, Cyclical | | | 4,535,711 | | | | - | | | | - | | | | 4,535,711 | |
Consumer, Non-cyclical | | | 13,645,362 | | | | 806,003 | | | | - | | | | 14,451,365 | |
Energy | | | 10,740,309 | | | | - | | | | - | | | | 10,740,309 | |
Financial | | | 11,875,798 | | | | - | | | | - | | | | 11,875,798 | |
Industrial | | | 12,829,377 | | | | - | | | | - | | | | 12,829,377 | |
Technology | | | 3,230,596 | | | | - | | | | - | | | | 3,230,596 | |
Utilities | | | 5,632,243 | | | | - | | | | - | | | | 5,632,243 | |
| | | | | | | | | | | | | | | | |
Total Common Stock | | | 72,546,403 | | | | 4,073,144 | | | | - | | | | 76,619,547 | |
| | | | | | | | | | | | | | | | |
Total Equities | | | 72,546,403 | | | | 4,073,144 | | | | - | | | | 76,619,547 | |
| | | | | | | | | | | | | | | | |
| Total Long-Term Investments | | | 72,546,403 | | | | 4,073,144 | | | | - | | | | 76,619,547 | |
| | | | | | | | | | | | | | | | |
| Total Short-Term Investments | | | - | | | | 50,429 | | | | - | | | | 50,429 | |
| | | | | | | | | | | | | | | | |
| Total Investments | | $ | 72,546,403 | | | $ | 4,123,573 | | | $ | - | | | $ | 76,669,976 | |
| | | | | | | | | | | | | | | | |
| | | | |
Small Company Value Fund | | | | | | | | | | | | | | | | |
Equities | | | | | | | | | | | | | | | | |
Common Stock | | | | | | | | | | | | | | | | |
Basic Materials | | $ | 9,206,116 | | | $ | - | | | $ | - | | | $ | 9,206,116 | |
Communications | | | 2,896,672 | | | | - | | | | - | | | | 2,896,672 | |
Consumer, Cyclical | | | 12,375,448 | | | | - | | | | - | | | | 12,375,448 | |
Consumer, Non-cyclical | | | 11,288,488 | | | | - | | | | - | | | | 11,288,488 | |
Energy | | | 7,226,926 | | | | - | | | | - | | | | 7,226,926 | |
Financial | | | 22,418,034 | | | | - | | | | - | | | | 22,418,034 | |
Industrial | | | 29,543,046 | | | | - | | | | - | | | | 29,543,046 | |
Technology | | | 4,881,547 | | | | - | | | | - | | | | 4,881,547 | |
Utilities | | | 4,321,267 | | | | - | | | | - | | | | 4,321,267 | |
| | | | | | | | | | | | | | | | |
Total Common Stock | | | 104,157,544 | | | | - | | | | - | | | | 104,157,544 | |
| | | | | | | | | | | | | | | | |
Convertible Preferred Stock
Financial | | | - | | | | 675,941 | | | | - | | | | 675,941 | |
| | | | | | | | | | | | | | | | |
Total Convertible Preferred Stock | | | - | | | | 675,941 | | | | - | | | | 675,941 | |
| | | | | | | | | | | | | | | | |
Total Equities | | | 104,157,544 | | | | 675,941 | | | | - | | | | 104,833,485 | |
| | | | | | | | | | | | | | | | |
Total Mutual Funds | | | 498,770 | | | | - | | | | - | | | | 498,770 | |
| | | | | | | | | | | | | | | | |
| Total Long-Term Investments | | | 104,656,314 | | | | 675,941 | | | | - | | | | 105,332,255 | |
| | | | | | | | | | | | | | | | |
| Total Short-Term Investments | | | - | | | | 3,229,133 | | | | - | | | | 3,229,133 | |
| | | | | | | | | | | | | | | | |
| Total Investments | | $ | 104,656,314 | | | $ | 3,905,074 | | | $ | - | | | $ | 108,561,388 | |
| | | | | | | | | | | | | | | | |
129
Notes to Financial Statements (Continued)
The following is the aggregate value by input level as of December 31, 2010 for the Funds’ other financial instruments:
Asset Valuation Inputs
| | | | | | | | | | | | | | | | |
| | | Other Financial Instruments | |
| | | Level 1 —
Quoted Prices | | | Level 2 —
Other
Significant
Observable
Inputs | | | Level 3 —
Significant
Unobservable
Inputs | | | Total | |
Small Cap Index Fund | | | | | | | | | | | | | | | | |
Futures Contracts | | | | | | | | | | | | | | | | |
Equity Risk | | $ | 5,850 | | | $ | - | | | $ | - | | | $ | 5,850 | |
Liability Valuation Inputs
| | | | | | | | | | | | | | | | |
| | | Other Financial Instruments | |
| | | Level 1 —
Quoted Prices | | | Level 2 —
Other
Significant
Observable
Inputs | | | Level 3 —
Significant
Unobservable
Inputs | | | Total | |
Mid Cap Value Fund | | | | | | | | | | | | | | | | |
Forward Contracts | | | | | | | | | | | | | | | | |
Foreign Exchange Risk | | $ | - | | | $ | (59,802 | ) | | $ | - | | | $ | (59,802 | ) |
The following table shows transfers between Level 1 and Level 2 of the fair value hierarchy:
| | | | | | | | | | | | | | | | |
| | | Transfers In * | | | Transfers Out * | |
| | | Level 1 —
Quoted
Prices | | | Level 2 —
Other
Significant
Observable
Inputs | | | Level 1 —
Quoted
Prices | | | Level 2 —
Other
Significant
Observable
Inputs | |
| Asset Allocation Fund | | $ | - | | | $ | 483,084 | | | $ | (483,084 | ) | | $ | - | |
| * | The Fund(s) recognize transfers between the Levels as of the beginning of the year. Transfers occurred between Level 1 and Level 2 as a result of securities transitioning between exchange traded and non-exchange traded. |
Following is a reconciliation of investments for which significant unobservable inputs (Level 3) were used in determining value:
Asset Valuation Inputs
| | | | | | | | | | | | | | | | | | | | | | | | | | | | | | | | | | | | |
| | | Investments in Securities | |
| | | Balance
as of
12/31/09 | | | Accrued
Discounts
(Premiums) | | | Realized
Gain
(Loss) | | | Change in
Unrealized
Appreciation
(Depreciation) | | | Net
Purchases
(Sales) | | | Transfers
into
Level 3 * | | | Transfers
(out) of
Level 3 * | | | Balance
as of
12/31/10 | | | Net Change
in Unrealized
Appreciation
(Depreciation)
from
Investments
Still Held
as of
12/31/10 | |
Asset Allocation Fund | | | | | | | | | | | | | | | | | | | | | | | | | | | | | | | | | | | | |
Long-Term Investments | | | | | | | | | | | | | | | | | | | | | | | | | | | | | | | | | | | | |
Bonds & Notes | | | | | | | | | | | | | | | | | | | | | | | | | | | | | | | | | | | | |
Corporate Debt | | $ | 427,040 | | | $ | - | | | $ | - | | | $ | 13,375 | | | $ | - | | | $ | 89,250 | ** | | $ | (427,040 | ) *** | | $ | 102,625 | | | $ | 13,375 | |
| | | | | | | | | | | | | | | | | | | | | | | | | | | | | | | | | | | | |
| * | The Fund(s) recognize transfers between the Levels as of the beginning of the year. |
| ** | Transfer occurred between Levels as the security is deemed to be an illiquid Rule 144A security. |
| *** | Transfers occurred between Levels as a result of changes in liquidity. |
The Small Cap Index Fund held a right at Level 3 that expired during the period with a cost and value of $0.
130
Notes to Financial Statements (Continued)
Derivative Instruments
Derivatives are financial instruments whose values are based on the values of one or more indicators, such as a security, asset, currency, interest rate, or index. Derivative transactions can create investment leverage and may be highly volatile. It is possible that a derivative transaction will result in a loss greater than the principal amount invested. A Fund may not be able to close out a derivative transaction at a favorable time or price. For those Funds that held derivatives during the year ended December 31, 2010, the following table shows how the Fund used these derivatives during the period (marked with an “A”), as well as any additional uses it may have for them in the future (marked with an “M”).
| | | | | | | | | | | | | | | | |
| | | Type of Derivative and Objective for Use | | Asset
Allocation
Fund | | Foreign
Fund | | Global
Fund | | Income &
Growth
Fund | | Mid Cap
Value
Fund | | Small Cap
Index
Fund | | Small
Company
Value
Fund |
| | | Foreign Currency Exchange Transactions* | | | | | | | | | | | | | | |
| | | Hedging/Risk Management | | A | | | | | | | | A | | | | |
| | | Directional Exposures to Currencies | | A | | | | | | | | | | | | |
| | | | | | | | | |
| | | Futures Contracts** | | | | | | | | | | | | | | |
| | | Hedging/Risk Management | | | | | | | | A | | | | | | |
| | | Short-term Cash Deployment | | | | | | | | A | | | | | | |
| | | Substitution for Cash Investment | | | | | | | | A | | | | A | | |
| | | | | | | | | |
| | | Rights and Warrants | | | | | | | | | | | | | | |
| | | Result of Corporate Action | | | | A | | A | | | | | | A | | A |
| * | Includes any options, futures contracts, forward contracts, and swap agreements, if applicable. |
| ** | Includes any options on futures contracts, if applicable. |
At December 31, 2010, and during the year then ended, the Fund(s) had the following derivatives and transactions in derivatives, grouped into the indicated risk categories:
| | | | | | | | | | | | |
| | | Equity
Risk | | | Foreign
Exchange
Risk | | | Total | |
Asset Allocation Fund
Realized Gain (Loss)# | | | | | | | | | | | | |
Forward Contracts | | $ | - | | | $ | (65,143 | ) | | $ | (65,143 | ) |
| | | | | | | | | | | | |
Number of Contracts, Notional Amounts
or Shares/Units† | | | | | | | | | | | | |
Forward Contracts | | $ | - | | | $ | 1,053,571 | | | $ | 1,053,571 | |
| | | |
Foreign Fund
Realized Gain (Loss)# | | | | | | | | | | | | |
Rights | | $ | 144,532 | | | $ | - | | | $ | 144,532 | |
| | | | | | | | | | | | |
Number of Contracts, Notional Amounts
or Shares/Units†† | | | | | | | | | | | | |
Rights | | | 254,695 | | | | - | | | | 254,695 | |
131
Notes to Financial Statements (Continued)
| | | | | | | | | | | | |
| | | Equity
Risk | | | Foreign
Exchange
Risk | | | Total | |
| | | |
Global Fund
Realized Gain (Loss)# | | | | | | | | | | | | |
Rights | | $ | 28 | | | $ | - | | | $ | 28 | |
| | | | | | | | | | | | |
Number of Contracts, Notional Amounts
or Shares/Units†† | | | | | | | | | | | | |
Rights | | | 2,136 | | | | - | | | | 2,136 | |
| | | |
Income & Growth Fund
Realized Gain (Loss)# | | | | | | | | | | | | |
Futures Contracts | | $ | 1,157,391 | | | $ | - | | | $ | 1,157,391 | |
| | | | | | | | | | | | |
Number of Contracts, Notional Amounts
or Shares/Units† | | | | | | | | | | | | |
Futures Contracts | | | 156 | | | | - | | | | 156 | |
| | | |
Mid Cap Value Fund
Liability Derivatives | | | | | | | | | | | | |
Forward Contracts^ | | $ | - | | | $ | (59,802 | ) | | $ | (59,802 | ) |
| | | | | | | | | | | | |
| Realized Gain (Loss)# | | | | | | | | | | | | |
Forward Contracts | | $ | - | | | $ | (257,190 | ) | | $ | (257,190 | ) |
| | | | | | | | | | | | |
| Change in Appreciation (Depreciation)## | | | | | | | | | | | | |
Forward Contracts | | $ | - | | | $ | (195,793 | ) | | $ | (195,793 | ) |
| | | | | | | | | | | | |
Number of Contracts, Notional Amounts
or Shares/Units† | | | | | | | | | | | | |
Forward Contracts | | $ | - | | | $ | 9,953,551 | | | $ | 9,953,551 | |
| | | |
Small Cap Index Fund
Asset Derivatives | | | | | | | | | | | | |
Futures Contracts ^^ | | $ | 5,850 | | | $ | - | | | $ | 5,850 | |
| | | | | | | | | | | | |
| Realized Gain (Loss)# | | | | | | | | | | | | |
Futures Contracts | | $ | 77,027 | | | $ | - | | | $ | 77,027 | |
| | | | | | | | | | | | |
| Change in Appreciation (Depreciation)## | | | | | | | | | | | | |
Futures Contracts | | $ | 2,172 | | | $ | - | | | $ | 2,172 | |
| | | | | | | | | | | | |
Number of Contracts, Notional Amounts
or Shares/Units† | | | | | | | | | | | | |
Futures Contracts | | | 7 | | | | - | | | | 7 | |
Rights | | | 3,166 | | | | - | | | | 3,166 | |
| | | |
Small Company Value Fund
Realized Gain (Loss)# | | | | | | | | | | | | |
Rights | | $ | 633 | | | $ | - | | | $ | 633 | |
| | | | | | | | | | | | |
Number of Contracts, Notional Amounts
or Shares/Units† | | | | | | | | | | | | |
Rights | | | 26,000 | | | | - | | | | 26,000 | |
| ^ | Statements of Assets and Liabilities location: Payables for: open forward foreign currency contracts. |
| ^^ | Cumulative appreciation (depreciation) on futures contracts is reported in “Futures Contracts” below. Only current day’s variation margin, if any, is reported within the Statements of Assets and Liabilities. |
132
Notes to Financial Statements (Continued)
| # | Statements of Operations location: Amounts are included in net realized gain (loss) on: investment transactions, futures contracts, or foreign currency transactions, as applicable. |
| ## | Statements of Operations location: Amounts are included in net change in unrealized appreciation (depreciation) on: futures contracts or translation of assets and liabilities in foreign currencies, as applicable. |
| † | Amount(s) disclosed represent average number of contracts, notional amounts, or shares/units outstanding, which is indicative of the volume of this derivative type, for the months that the Fund held such derivatives during the year ended December 31, 2010. |
| †† | Contracts here represent activity that occurred within the month. |
Further details regarding the derivatives and other investments held by the Funds during the year ended December 31, 2010, are discussed below.
Foreign Currency Exchange Transactions
A Fund may engage in foreign currency exchange transactions for hedging purposes in order to protect against uncertainty in the level of future foreign currency exchange rates, or for other, non-hedging purposes.
A Fund may use foreign currency exchange transactions for hedging purposes to protect against two principal risks. First, if a Fund has assets or liabilities denominated in foreign (non-U.S. dollar) currencies, the Fund is exposed to the risk that the values of those assets or liabilities in U.S. dollars may fall or rise due to changes in currency exchange rates. Second, if the Fund agrees, or expects, to receive or deliver an asset denominated in a foreign currency, it is exposed to currency exchange risk until the date of receipt or delivery. In order to reduce those risks, a Fund may enter into foreign currency forward contracts, which call for the Fund to purchase or sell a foreign currency at a time in the future at a price determined at the time the contract is entered into. Forward contracts are private contractual arrangements and a Fund is subject to the risk that its counterparty will not, or will not be able to, perform its obligations. This type of arrangement may require the Fund to post margin.
Whenever a Fund enters into a foreign currency exchange transaction, it is subject to the risk that the value of the transaction will move in a direction unfavorable to it. When the Fund uses the transactions for hedging purposes, it is likely that the Fund will have an asset or liability that will offset any loss (or gain) on the transactions, at least in part. If a Fund enters into foreign currency exchange transactions other than for hedging purposes (for example, seeking to profit from an anticipated change in the values of currencies by creating directional exposures in the portfolio with respect to one or more currencies), it will generally be subject to the same risks, but is less likely to have assets or liabilities that will offset any losses on the transactions. There can be no assurance that a Fund will be able to terminate any foreign currency exchange transaction prior to its maturity in order to limit its loss on the transaction.
Forward foreign currency contracts are marked to market daily and the change in their value is recorded by the Funds as an unrealized gain or loss. Forward foreign currency contracts are valued at the settlement price established through dealers or other market sources on the day which they are traded. When a forward foreign currency contract is extinguished, through delivery or offset by entering into another forward foreign currency contract, the Funds record a realized gain or loss equal to the difference between the value of the contract at the time it was opened and the value of the contract at the time it was extinguished or offset. The notional or contractual amounts of these instruments do not necessarily represent the amounts potentially subject to risk. The measurement of the risk associated with these instruments is meaningful only when all related and offsetting transactions and counterparty risks are considered.
The Fund(s) listed in the following table had open forward foreign currency contracts at December 31, 2010. A Fund’s current exposure to a counterparty is typically the fair value of the contract.
| | | | | | | | | | | | | | | | | | | | | | |
| | | Counterparty | | Units of
Currency | | Contracts to
Deliver/Receive | | Settlement
Date | | | In Exchange
for U.S.
Dollars | | | Contracts at
Value | | | Unrealized
Appreciation
(Depreciation) | |
| Mid Cap Value Fund | | | | | | | | | | | | | | | | | | |
| SELLS | | | | | | | | | | | | | | | | | | |
| | Bank of America N.A. | | 10,236,800 | | Canadian Dollar | | | 1/31/11 | | | $ | 10,226,318 | | | $ | 10,286,120 | | | $ | (59,802 | ) |
| | | | | | | | | | | | | | | | | | | | | | |
133
Notes to Financial Statements (Continued)
Futures Contracts
A Fund may seek to manage a variety of different risks through the use of futures contracts, such as interest rate risk, equity price risk, and currency risk. A Fund may use interest rate futures contracts to adjust the interest rate sensitivity (duration) of its portfolio or the credit exposure of the portfolio. Interest rate futures contracts obligate the long or short holder to take or make delivery of a specified quantity of a financial instrument, such as a specific fixed-income security, during a specified future period at a specified price. A Fund may use index futures to hedge against broad market risks to its portfolio or to gain broad market exposure when it holds uninvested cash or as an inexpensive substitute for cash investments directly in securities or other assets. Securities index futures contracts are contracts to buy or sell units of a securities index at a specified future date at a price agreed upon when the contract is made and are settled in cash. Positions in futures may be closed out only on an exchange or board of trade which provides a secondary market for such futures. Because futures contracts are exchange-traded, they typically have minimal exposure to counterparty risk.
Parties to a futures contract are not required to post the entire notional amount of the contract, but rather a small percentage of that amount (by way of margin), both at the time they enter into futures transactions, and then on a daily basis if their positions decline in value; as a result, futures contracts are highly leveraged. Such payments are known as variation margin and are recorded by the Funds as unrealized gains or losses. Because futures markets are highly leveraged, they can be extremely volatile, and there can be no assurance that the pricing of a futures contract will correlate precisely with the pricing of the asset or index underlying it or the asset or liability of the Fund that is the subject of the hedge. It may not always be possible for a Fund to enter into a closing transaction with respect to a futures contract it has entered into, at a favorable time or price. When a Fund enters into a futures transaction, it is subject to the risk that the value of the futures contract will move in a direction unfavorable to it. When the Fund uses futures contracts for hedging purposes, it is likely that the Fund will have an asset or liability that will offset any loss (or gain) on the transactions, at least in part.
When a futures contract is closed, the Fund records a realized gain or loss equal to the difference between the value of the contract at the time it was opened and the value at the time it was closed. Futures contracts are valued at the settlement price established each day by the board of trade or exchange on which they are traded.
The Fund(s) listed in the following table had open futures contracts at December 31, 2010.
| | | | | | | | | | | | | | |
Number of
Contracts | | Type | | Expiration
Date | | | Notional
Contract
Value | | | Net Unrealized
Appreciation
(Depreciation) | |
| Small Cap Index Fund | | | | | | | | | | | | |
| BUYS | | | | | | | | | | | | | | |
| 4 | | Russell 2000 Mini Index | | | 3/18/11 | | | $ | 312,920 | | | $ | 5,850 | |
| | | | | | | | | | | | | | |
Options, Rights, and Warrants
A Fund may purchase and sell put and call options on securities or an index of securities to enhance investment performance or to protect against changes in market prices. A Fund that invests in debt securities may also purchase and sell put and call options to adjust the interest rate sensitivity of its portfolio or the credit exposure of the portfolio.
A call option gives the holder the right to purchase, and obligates the writer to sell, a security at the strike price at any time before the expiration date. A Fund may write call options on a security it owns, in a “directional” strategy hoping to realize a greater current return through the receipt of premiums. In return for the option premium, the Fund takes the risk that it will have to forego any increase in the value of the security over the strike price. When a Fund has written a call option on a security it does not own, its exposure on such an option is theoretically unlimited. A Fund may enter into closing purchase transactions in order to realize a profit or limit a loss on a previously written call option or, in the case of a call option on a security it owns, to free itself to sell the underlying security or to write another call on the security, or protect a security from being called in an unexpected market rise. Any profits from a closing purchase transaction in the case of a call option on a security a Fund owns may be offset by a decline in the value of the underlying security. Conversely, because increases in the market price of a call option will generally reflect
134
Notes to Financial Statements (Continued)
increases in the market price of the underlying security, any loss resulting from a closing purchase transaction relating to a call option on a security a Fund owns is likely to be offset in whole or in part by unrealized appreciation of the underlying security owned by the Fund. A Fund may not be able to close out a call option that it has previously written.
A put option gives the holder the right to sell, and obligates the writer to buy, a security at the exercise price at any time before the expiration date. A Fund may write put options in order to enhance its current return by taking a long directional position as to a security or index of securities. By writing a put option, the Fund assumes the risk that it may be required to purchase the underlying security for an exercise price higher than its then current market value, resulting in a potential capital loss unless the security later appreciates in value. A Fund may terminate a put option that it has written before it expires by entering into a closing purchase transaction. Any loss from this transaction may be partially or entirely offset by the premium received on the terminated option. A Fund may not be able to close out a put option that it has previously written.
When a Fund writes a call or put option, an amount equal to the premium received is recorded as a liability. Premiums received from writing options which expire are treated as realized gains. Premiums received from writing options which are exercised or closed are added to the proceeds or offset against the amount paid on the underlying investment to determine the realized gain or loss.
A Fund may purchase put options to protect portfolio holdings against a decline in market value of a security or securities held by it. A Fund may also purchase a put option hoping to profit from an anticipated decline in the value of the underlying security. If the Fund holds the security underlying the option, the option premium and any transaction costs will reduce any profit the Fund might have realized had it sold the underlying security instead of buying the put option. A Fund may purchase call options to hedge against an increase in the price of securities that the Fund wants ultimately to buy. A Fund may also purchase a call option as a long directional investment hoping to profit from an anticipated increase in the value of the underlying security. In order for a call option to be profitable, the market price of the underlying security must rise sufficiently above the exercise price to cover the premium and transaction costs. These costs will reduce any profit the Fund might have realized had it bought the underlying security at the time it purchased the call option.
When a Fund purchases an option, it runs the risk that it will lose its entire investment in the option in a relatively short period of time, unless the Fund exercises the option or enters into a closing sale transaction before the option’s expiration. If the price of the underlying security does not rise (in the case of a call) or fall (in the case of a put) to an extent sufficient to cover the option premium and transaction costs, the Fund will lose part or all of its investment in the option. This contrasts with an investment by a Fund in the underlying security, since the Fund will not realize a loss if the security’s price does not change. Premiums paid for purchasing options that expire are treated as realized losses.
Options purchased or sold by a Fund may be traded on a securities or options exchange or market. Such options typically have minimal exposure to counterparty risk. However, an exchange or market may at times find it necessary to impose restrictions on particular types of options transactions, such as opening transactions. If an underlying security ceases to meet qualifications imposed by the market or the Options Clearing Corporation, new series of options on that security will no longer be opened to replace expiring series, and opening transactions in existing series may be prohibited.
OTC options purchased or sold by a Fund are not traded on securities or options exchanges or backed by clearinghouses. Rather, they are entered into directly between a Fund and the counterparty to the option. In the case of an OTC option purchased by the Fund, the value of the option to the Fund will depend on the willingness and ability of the option writer to perform its obligations to the Fund. In addition, OTC options may not be transferable and there may be little or no secondary market for them, so they may be considered illiquid. It may not be possible to enter into closing transactions with respect to OTC options or otherwise to terminate such options, and as a result a Fund may be required to remain obligated on an unfavorable OTC option until its expiration.
Exchange traded options are valued at the last sale price, or if no sales are reported, the last bid price for purchased options and the last ask price for written options. OTC options are valued using prices supplied by a primary pricing source, selected pursuant to procedures approved by the Trustees.
A Fund may invest in rights and warrants to purchase securities. Rights or warrants generally give the holder the right to receive, upon exercise, a security at a stated price. Funds typically use rights and warrants in a manner similar to their use of options on securities, as described above. Risks associated with the use of rights or warrants are generally similar to risks associated with the use of options.
135
Notes to Financial Statements (Continued)
The Fund(s) had no rights, warrants, purchased options, or written options at December 31, 2010.
When-Issued, Delayed-Delivery, and Forward Commitment Transactions
A Fund may enter into when-issued, delayed-delivery, or forward commitment transactions in order to lock in the purchase price of the underlying security, or in order to adjust the interest rate exposure of the Fund’s existing portfolio. In when-issued, delayed-delivery, or forward commitment transactions, a Fund commits to purchase or sell particular securities, with payment and delivery to take place at a future date. Although a Fund does not typically pay for the securities until they are delivered, it immediately assumes the risks of ownership, including the risk of price fluctuation. If a Fund’s counterparty fails to deliver a security purchased on a when-issued, delayed-delivery, or forward commitment basis, there may be a loss, and the Fund may have missed an opportunity to make an alternative investment.
Prior to settlement of these transactions, the value of the subject securities will fluctuate, reflecting interest rate changes. In addition, because the Fund is not required to pay for when-issued, delayed-delivery, or forward commitment securities until the delivery date, they may result in a form of leverage to the extent the Fund does not maintain liquid assets equal to the face amount of the contract.
These securities are valued on the basis of valuations furnished by a pricing service, selected pursuant to procedures approved by the Trustees, which determines valuations taking into account appropriate factors such as institutional-size trading in similar groups of securities, yield, quality, coupon rate, maturity, type of issue, trading characteristics, and other market data. Securities for which no market quotation is available are valued at fair value in accordance with procedures approved by the Trustees. The Funds record on a daily basis the unrealized appreciation (depreciation) based upon changes in the values of these securities. When a when-issued, delayed-delivery, or forward commitment transaction is closed, the Funds record a realized gain or loss equal to the difference between the value of the transaction at the time it was opened and the value of the transaction at the time it was closed.
The Asset Allocation Fund had securities purchased on a when-issued, delayed-delivery, or forward commitment basis during the year ended December 31, 2010.
Dollar Roll Transactions
A Fund may enter into dollar roll transactions, in which the Fund sells mortgage-backed securities for delivery in the current month and simultaneously contracts to purchase substantially similar securities on a specified future date from the same party. A Fund may invest in dollar rolls in order to benefit from anticipated changes in pricing for the mortgage-backed securities during the term of the transaction, or for the purpose of creating investment leverage. In a dollar roll, the securities that are to be purchased will be of the same type as the securities sold, but will be supported by different pools of mortgages.
A Fund that engages in a dollar roll forgoes principal and interest paid on the sold securities during the roll period, but is compensated by the difference between the current sales price and the lower forward price for the future purchase. In addition, a Fund may benefit by investing the transaction proceeds during the roll period. Dollar roll transactions may have the effect of creating leverage in a Fund’s portfolio. Dollar rolls involve the risk that the Fund’s counterparty will be unable to deliver the mortgage-backed securities underlying the dollar roll at the fixed time. If the counterparty files for bankruptcy or becomes insolvent, the counterparty or its representative may ask for and receive an extension of time to decide whether to enforce the Fund’s repurchase obligation. A Fund’s use of the transaction proceeds may be restricted pending such decision. It is possible that the Fund will incur a loss on a dollar roll transaction (either because its counterparty fails to perform or because the value of the mortgages subject to the transaction declines) and on the investments made by the Fund with the proceeds of the dollar roll transaction.
A Fund accounts for a dollar roll transaction as a purchase and sale whereby the difference in the sales price and purchase price of the security sold is recorded as a realized gain (loss). If certain criteria are met, these dollar roll transactions may be considered financing transactions, whereby the difference in the sales price and the future purchase price is recorded as an adjustment to interest income.
The Asset Allocation Fund had dollar roll transactions during the year ended December 31, 2010, which were accounted for as purchase and sale transactions.
136
Notes to Financial Statements (Continued)
Inflation-Indexed Bonds
The Funds may invest in inflation-indexed bonds, which are fixed income securities whose principal value or coupon is periodically adjusted according to the rate of inflation. Any increase or decrease in the principal amount of an inflation-indexed bond will be included as interest income.
Inflation-indexed securities issued by the U.S. Treasury have maturities of five, ten, twenty, or thirty years, although it is possible that securities with other maturities will be issued in the future. The U.S. Treasury securities pay interest on a semi-annual basis, equal to a fixed percentage of the inflation-adjusted principal amount.
If the periodic adjustment rate measuring inflation falls, the principal value of inflation-indexed bonds will be adjusted downward, and consequently the interest payable on these securities (calculated with respect to a smaller principal amount) will be reduced. Repayment of the original bond principal upon maturity (as adjusted for inflation) is guaranteed in the case of U.S. Treasury inflation-indexed bonds, even during a period of deflation. However, the current market value of the bonds is not guaranteed, and will fluctuate. The Funds may also invest in other inflation related bonds which may or may not provide a similar guarantee. If a guarantee of principal is not provided, the adjusted principal value of the bond repaid at maturity may be less than the original principal.
The value of inflation-indexed bonds is expected to change in response to changes in real interest rates. Real interest rates in turn are tied to the relationship between nominal interest rates and the rate of inflation. Therefore, if inflation were to rise at a faster rate than nominal interest rates, real interest rates might decline, leading to an increase in value of inflation-indexed bonds. In contrast, if nominal interest rates increased at a faster rate than inflation, real interest rates might rise, leading to a decrease in value of inflation-indexed bonds.
While the values of these securities are expected to be protected from long-term inflationary trends, short-term increases in inflation may lead to a decline in value. If interest rates rise due to reasons other than inflation (for example, due to changes in currency exchange rates), investors in these securities may not be protected to the extent that the increase is not reflected in the bond’s inflation measure.
The periodic adjustment of U.S. Treasury inflation-indexed bonds is tied to the Consumer Price Index for Urban Consumers (“CPI-U”), which is calculated monthly by the U.S. Bureau of Labor Statistics. The CPI-U is a measurement of changes in the cost of living, made up of components such as housing, food, transportation, and energy. Inflation-indexed bonds issued by a foreign government are generally adjusted to reflect a comparable inflation index, calculated by that government. There can be no assurance that the CPI-U or any foreign inflation index will accurately measure the real rate of inflation in the prices of goods and services. Moreover, there can be no assurance that the rate of inflation in a foreign country will be correlated to the rate of inflation in the United States.
The Asset Allocation Fund held inflation-indexed bonds during the year ended December 31, 2010.
Repurchase Agreements
Each Fund may enter into repurchase agreements with certain banks and broker-dealers whereby a Fund acquires a security for cash and obtains a simultaneous commitment from the seller to repurchase the security at an agreed upon price and date. A Fund, through its custodian, takes possession of the securities collateralizing the repurchase agreement. Repurchase agreements must be fully collateralized at all times, but involve some risk to the Fund if the other party should default on its obligation and the Fund is delayed or prevented from recovering the collateral, or if the Fund is required to return collateral to a borrower at a time when it may realize a loss on the investment of that collateral. Collateral for certain tri-party repurchase agreements is held at the Fund’s custodian or sub-custodian in a segregated account for the benefit of the Fund and the counterparty.
The Fund(s) had repurchase agreements as shown in the Portfolio(s) of Investments at December 31, 2010.
Accounting for Investment Transactions
Investment transactions are accounted for on the trade date. Realized gains and losses on sales of investments and unrealized appreciation and depreciation of investments are computed by the specific identification cost method. Proceeds received from
137
Notes to Financial Statements (Continued)
litigation, if any, are included in realized gains on investment transactions for any investments that are no longer held in the: portfolio and as a reduction in cost for investments that continue to be held in the portfolio. Interest income, adjusted for amortization of discounts and premiums on debt securities, is earned from the settlement date and is recorded on the accrual basis. Dividend income and distributions are recorded on the ex-dividend date. Withholding taxes on foreign interest, dividends, and capital gains have been provided for in accordance with the applicable country’s tax rules and rates. Foreign dividend income is recorded on the ex-dividend date or as soon as practicable after the Fund determines the existence of a dividend declaration after exercising reasonable due diligence. Distributions received on securities that represent a return of capital or capital gain are recorded as a reduction of cost of investments and/or as a realized gain. The Funds estimate the components of distributions received that may be considered return of capital distributions or capital gain distributions.
Foreign Currency Translation
The books and records of the Funds are maintained in U.S. dollars. The market values of foreign currencies, foreign securities, and other assets and liabilities denominated in foreign currencies are translated into U.S. dollars at the mean of the buying and selling rates of such currencies against the U.S. dollar at the end of each business day. Purchases and sales of foreign securities and income and expense items are translated at the rates of exchange prevailing on the respective dates of such transactions. The Funds do not isolate that portion of the results of operations arising from changes in the exchange rates from that portion arising from changes in the market prices of securities. Net realized foreign currency gains and losses resulting from changes in exchange rates include foreign currency gains and losses between trade date and settlement date on investment securities transactions, foreign currency transactions, and the difference between the amounts of dividends or interest recorded on the books of the Funds and the amount actually received.
Allocation of Operating Activity
In maintaining the records for the Funds, the income and expense accounts are allocated to each class of shares. Investment income, unrealized and realized gains or losses are prorated among the classes of shares based on the relative net assets of each. Expenses are allocated to each class of shares depending on the nature of the expenditures. Administration and service fees, if any, which are directly attributable to a class of shares, are charged to that class’s operations. Expenses of the Fund not directly attributable to the operations of any class of shares or Fund are prorated among the Funds and classes to which the expense relates based on the relative net assets of each.
Foreign Securities
The Foreign Fund invests substantially all of its assets and the Global Fund invests a significant amount of its assets in foreign securities. The other Funds may also invest in foreign securities. Foreign securities, including ADRs, are subject to additional risks compared to securities of U.S. issuers, including international trade, currency, political, regulatory, and diplomatic risks. In addition, fluctuations in currency exchange rates may adversely affect the values of foreign securities and the price of a Fund’s shares. Emerging markets securities are subject to greater risks than securities issued in developed foreign markets, including less liquidity, greater price volatility, higher relative rates of inflation, greater political and economic instability, and greater volatility in currency exchange rates.
Credit Risk
The Funds may invest a portion of their assets, directly or indirectly, in securities backed by mortgage loans, credit card receivables, and automotive loans. The values and related income of these securities are sensitive to changes in economic conditions, including delinquencies and/or defaults. Continuing shifts in the market’s perception of credit quality on such securities have resulted in increased volatility of market price and periods of decreased market activity that have adversely impacted the valuation and liquidity of such securities.
Federal Income Tax
It is each Fund’s intent to continue to comply with the provisions of subchapter M of the Internal Revenue Code of 1986, as amended (the “Code”), applicable to a regulated investment company. Under such provisions, the Funds would not be subject to
138
Notes to Financial Statements (Continued)
federal income taxes on their ordinary income and net realized capital gains to the extent they are distributed or deemed to have been distributed to their shareholders. Therefore, the Funds have not made any provision for federal income tax.
Dividends and Distributions to Shareholders
Dividends from net investment income of each Fund are declared and paid annually and at other times as may be required to satisfy tax or regulatory requirements. Distributions of any net realized capital gains of each Fund are declared and paid annually and at other times as may be required to satisfy tax or regulatory requirements.
Distributions to shareholders are recorded on the ex-dividend date. Income and capital gain distributions are determined in accordance with income tax regulations, which may differ from generally accepted accounting principles. As a result, net investment income and net realized capital gains on investment transactions for a reporting period may differ significantly from distributions during such period.
| 3. | | Management Fees and Other Transactions |
Investment Management Fees
Under agreements between MassMutual and the Trust on behalf of each Fund, MassMutual is responsible for providing investment management services for each Fund. In return for these services, MassMutual receives advisory fees, based upon each Fund’s average daily net assets, at the following annual rates:
| | | | | | |
Asset Allocation Fund | | 0.55% | | Large Cap Growth Fund | | 0.65% |
Concentrated Growth Fund | | 0.60% | | Mid Cap Growth Fund | | 0.77% |
Equity Income Fund | | 0.75% | | Mid Cap Value Fund | | 0.84% |
Foreign Fund | | 0.89% | | Small Cap Index Fund | | 0.35% |
Global Fund | | 0.60% | | Small Company Value Fund | | 0.85% |
Growth & Income Fund | | 0.50% | | Small/Mid Cap Value Fund | | 0.75% |
Income & Growth Fund | | 0.65% | | | | |
MassMutual has entered into investment subadvisory agreements with the following unaffiliated investment subadvisers: AllianceBernstein L.P. for the Small/Mid Cap Value Fund; American Century Investment Management, Inc. for the Mid Cap Value Fund; BlackRock Investment Management, LLC for the Income & Growth Fund; Capital Guardian Trust Company for the Asset Allocation Fund; Legg Mason Capital Management, Inc. for the Concentrated Growth Fund; Massachusetts Financial Services Company for the Global Fund and Growth & Income Fund; Northern Trust Investments, Inc. for the Small Cap Index Fund; Rainier Investment Management, Inc. for the Large Cap Growth Fund, Templeton Investment Counsel, LLC for the Foreign Fund; and T. Rowe Price Associates, Inc. for the Equity Income Fund, Mid Cap Growth Fund, and Small Company Value Fund. Prior to August 20, 2010, American Century Investment Management, Inc. was the investment subadviser for the Income & Growth Fund and Capital Guardian Trust Company was the investment subadviser for the Growth & Income Fund. MassMutual pays a subadvisory fee to each of these subadvisers based upon the aggregate net assets under management which include (1) the average daily net assets of the specified Fund which it manages, and (2) the average daily net assets of all other funds or accounts of MassMutual or its affiliates for which the subadviser provides subadvisory services and which have substantially the same investment objectives, policies and investment strategies.
The Funds’ subadvisory fees are paid by MassMutual out of the management fees previously disclosed above.
Administration Fees
For the Concentrated Growth Fund, Global Fund, and Small Company Value Fund, under separate administrative and shareholder services agreements between the Funds and MassMutual, MassMutual provides certain administrative and shareholder services and
139
Notes to Financial Statements (Continued)
bears some of the class specific administrative expenses. In return for these services, MassMutual receives an administrative services fee based upon the average daily net assets of the applicable class of shares of the Funds, at the following annual rates:
| | | | | | | | | | | | |
| | | Class I | | | Class II | | | Service Class I | |
Concentrated Growth Fund | | | 0.24% | | | | 0.14% | | | | 0.24% | |
Global Fund | | | 0.28% | | | | 0.18% | | | | 0.28% | |
Small Company Value Fund | | | N/A | | | | 0.25% | | | | 0.25% | |
Service Fees
MML Distributors, LLC (the “Distributor”) acts as distributor to the Funds. Pursuant to a Distribution and Services Plan adopted by the Funds pursuant to Rule 12b-1 under the 1940 Act, Service Class shares and Service Class I shares of the Funds pay an annual fee of 0.25% of the average daily net asset value of Service Class shares and Service Class I shares. This fee, or a portion thereof, is paid to: (i) the Distributor for services provided and expenses incurred by it in connection with the distribution of Service Class shares or Service Class I shares, as applicable, of each Fund; and/or (ii) MassMutual for services provided and expenses incurred by it for purposes of maintaining or providing personal services to Service Class and Service Class I shareholders.
Expense Caps and Waivers
MassMutual agreed to cap the fees and expenses of the Funds noted below (other than extraordinary litigation and legal expenses, Acquired Fund fees and expenses#, or other non-recurring or unusual expenses such as, for example, organizational expenses and shareholder meeting expenses) based upon the average daily net assets of the applicable class of shares of the Funds, as follows:
| | | | | | | | | | |
Global Fund* | | | | | | Small Company Value Fund* | | | | |
Class I | | | 0.90% | | | Class II | | | 1.15% | |
Class II | | | 0.80% | | | Service Class I | | | 1.40% | |
Service Class I | | | 1.15% | | | | | | | |
| # | Acquired Fund fees and expenses are expenses borne indirectly by a Fund through investments in other pooled investment vehicles. |
| * | Expense caps in effect through May 1, 2011. |
For the Concentrated Growth Fund, MassMutual has voluntarily agreed to waive 0.05% of its management fees. MassMutual may amend or discontinue this waiver at any time without advance notice.
Expense caps and waiver amounts are reflected as a reduction of expenses on the Statements of Operations.
Rebated Brokerage Commissions
The Funds listed below have entered into agreements with certain brokers whereby the brokers will rebate to the Funds, in cash, a portion of brokerage commissions. Rebated brokerage commissions are amounts earned by the Funds and are included with realized gain or loss on investment transactions presented in the Statements of Operations. For the year ended December 31, 2010, brokerage commissions rebated under these agreements were as follows:
| | | | |
| | | Rebated
Commissions | |
Asset Allocation Fund | | $ | 1,694 | |
Concentrated Growth Fund | | | 17,014 | |
Foreign Fund | | | 512 | |
Growth & Income Fund | | | 3,284 | |
Large Cap Growth Fund | | | 4,026 | |
140
Notes to Financial Statements (Continued)
Deferred Compensation
Trustees of the Funds who are not employees of MassMutual or its subsidiaries may elect to defer receipt of their annual fees in accordance with terms of a Non-Qualified Deferred Compensation Plan. Amounts deferred shall accrue interest or earnings and shall be recorded on the Funds’ books as other liabilities. Deferred compensation is included within Trustees’ fees and expenses in the Statements of Assets and Liabilities.
Other
Certain officers and trustees of the Funds are also employees of MassMutual. The compensation of each trustee who is not an employee of MassMutual is borne by the Funds.
| 4. | | Purchases and Sales of Investments |
Cost of purchases and proceeds from sales of investment securities (excluding short-term investments) for the year ended December 31, 2010, were as follows:
| | | | | | | | | | | | | | | | |
| | | Purchases | | | Sales | |
| | | Long-Term U.S.
Government
Securities | | | Other
Long-Term
Securities | | | Long-Term U.S.
Government
Securities | | | Other
Long-Term
Securities | |
Asset Allocation Fund | | $ | 32,792,198 | | | $ | 48,143,053 | | | $ | 41,551,439 | | | $ | 58,082,193 | |
Concentrated Growth Fund | | | - | | | | 77,001,969 | | | | - | | | | 92,492,904 | |
Equity Income Fund | | | - | | | | 142,782,603 | | | | - | | | | 80,916,586 | |
Foreign Fund | | | - | | | | 60,594,528 | | | | - | | | | 24,503,251 | |
Global Fund | | | - | | | | 23,264,197 | | | | - | | | | 15,790,927 | |
Growth & Income Fund | | | - | | | | 141,825,261 | | | | - | | | | 157,716,854 | |
Income & Growth Fund | | | - | | | | 93,573,816 | | | | - | | | | 294,330,136 | |
Large Cap Growth Fund | | | - | | | | 193,524,060 | | | | - | | | | 91,815,742 | |
Mid Cap Growth Fund | | | - | | | | 86,075,998 | | | | - | | | | 104,629,350 | |
Mid Cap Value Fund | | | - | | | | 485,524,731 | | | | - | | | | 501,364,051 | |
Small Cap Index Fund | | | - | | | | 4,967,960 | | | | - | | | | 9,369,486 | |
Small Company Value Fund | | | - | | | | 27,447,665 | | | | - | | | | 36,549,012 | |
Small/Mid Cap Value Fund | | | - | | | | 95,725,392 | | | | - | | | | 120,568,249 | |
| 5. | | Capital Share Transactions |
Changes in shares outstanding for each Fund were as follows:
| | | | | | | | | | | | | | | | |
| | | Year ended December 31, 2010 | | | Year ended December 31, 2009 | |
| | | | |
| | | Shares | | | Amount | | | Shares | | | Amount | |
| | | | | | | | | | | | | | | | |
Asset Allocation Fund Initial Class | | | | | | | | | | | | | | | | |
Sold | | | 828,953 | | | $ | 6,544,560 | | | | 973,988 | | | $ | 6,907,351 | |
Issued as reinvestment of dividends | | | 436,693 | | | | 3,270,834 | | | | 747,458 | | | | 5,404,123 | |
Redeemed | | | (3,312,412 | ) | | | (26,123,393 | ) | | | (3,538,529 | ) | | | (24,641,239 | ) |
| | | | | | | | | | | | | | | | |
Net increase (decrease) | | | (2,046,766 | ) | | $ | (16,307,999 | ) | | | (1,817,083 | ) | | $ | (12,329,765 | ) |
| | | | | | | | | | | | | | | | |
Asset Allocation Fund Service Class | | | | | | | | | | | | | | | | |
Sold | | | 274,239 | | | $ | 2,148,173 | | | | 480,993 | | | $ | 3,356,944 | |
Issued as reinvestment of dividends | | | 21,853 | | | | 163,239 | | | | 23,336 | | | | 168,250 | |
Redeemed | | | (64,393 | ) | | | (510,199 | ) | | | (45,567 | ) | | | (324,740 | ) |
| | | | | | | | | | | | | | | | |
Net increase (decrease) | | | 231,699 | | | $ | 1,801,213 | | | | 458,762 | | | $ | 3,200,454 | |
| | | | | | | | | | | | | | | | |
141
Notes to Financial Statements (Continued)
| | | | | | | | | | | | | | | | |
| | | Year ended December 31, 2010 | | | Year ended December 31, 2009 | |
| | | | |
| | | Shares | | | Amount | | | Shares | | | Amount | |
| | | | | | | | | | | | | | | | |
Concentrated Growth Fund Class I | | | | | | | | | | | | | | | | |
Sold | | | 1,979,686 | | | $ | 12,874,786 | | | | 6,110,480 | | | $ | 29,466,103 | |
Issued as reinvestment of dividends | | | 50,162 | | | | 304,483 | | | | 49,344 | | | | 273,859 | |
Redeemed | | | (4,493,930 | ) | | | (27,966,285 | ) | | | (6,571,898 | ) | | | (33,724,445 | ) |
| | | | | | | | | | | | | | | | |
Net increase (decrease) | | | (2,464,082 | ) | | $ | (14,787,016 | ) | | | (412,074 | ) | | $ | (3,984,483 | ) |
| | | | | | | | | | | | | | | | |
Concentrated Growth Fund Class II | | | | | | | | | | | | | | | | |
Sold | | | 529,487 | | | $ | 3,420,987 | | | | 219,556 | | | $ | 1,097,091 | |
Issued as reinvestment of dividends | | | 19,997 | | | | 121,782 | | | | 12,530 | | | | 69,794 | |
Redeemed | | | (1,135,267 | ) | | | (7,330,052 | ) | | | (911,507 | ) | | | (4,625,064 | ) |
| | | | | | | | | | | | | | | | |
Net increase (decrease) | | | (585,783 | ) | | $ | (3,787,283 | ) | | | (679,421 | ) | | $ | (3,458,179 | ) |
| | | | | | | | | | | | | | | | |
Concentrated Growth Fund Service Class I | | | | | | | | | | | | | | | | |
Sold | | | 76,379 | | | $ | 495,136 | | | | 120,734 | | | $ | 577,837 | |
Issued as reinvestment of dividends | | | 951 | | | | 5,743 | | | | 924 | | | | 5,108 | |
Redeemed | | | (17,636 | ) | | | (113,930 | ) | | | (41,447 | ) | | | (220,432 | ) |
| | | | | | | | | | | | | | | | |
Net increase (decrease) | | | 59,694 | | | $ | 386,949 | | | | 80,211 | | | $ | 362,513 | |
| | | | | | | | | | | | | | | | |
Equity Income Fund Initial Class | | | | | | | | | | | | | | | | |
Sold | | | 13,321,282 | | | $ | 114,585,169 | | | | 12,798,802 | | | $ | 82,703,115 | |
Issued as reinvestment of dividends | | | 1,001,523 | | | | 8,032,215 | | | | 1,165,304 | | | | 9,089,369 | |
Redeemed | | | (7,540,678 | ) | | | (65,584,147 | ) | | | (14,298,842 | ) | | | (101,252,764 | ) |
| | | | | | | | | | | | | | | | |
Net increase (decrease) | | | 6,782,127 | | | $ | 57,033,237 | | | | (334,736 | ) | | $ | (9,460,280 | ) |
| | | | | | | | | | | | | | | | |
Equity Income Fund Service Class | | | | | | | | | | | | | | | | |
Sold | | | 923,566 | | | $ | 7,951,117 | | | | 1,231,303 | | | $ | 7,892,909 | |
Issued as reinvestment of dividends | | | 35,903 | | | | 286,864 | | | | 41,574 | | | | 323,441 | |
Redeemed | | | (307,906 | ) | | | (2,714,057 | ) | | | (199,173 | ) | | | (1,487,815 | ) |
| | | | | | | | | | | | | | | | |
Net increase (decrease) | | | 651,563 | | | $ | 5,523,924 | | | | 1,073,704 | | | $ | 6,728,535 | |
| | | | | | | | | | | | | | | | |
Foreign Fund Initial Class | | | | | | | | | | | | | | | | |
Sold | | | 8,672,737 | | | $ | 75,732,082 | | | | 7,181,806 | | | $ | 53,993,144 | |
Issued as reinvestment of dividends | | | 644,762 | | | | 5,183,884 | | | | 734,697 | | | | 6,097,987 | |
Redeemed | | | (4,854,138 | ) | | | (41,801,093 | ) | | | (5,130,232 | ) | | | (39,466,248 | ) |
| | | | | | | | | | | | | | | | |
Net increase (decrease) | | | 4,463,361 | | | $ | 39,114,873 | | | | 2,786,271 | | | $ | 20,624,883 | |
| | | | | | | | | | | | | | | | |
Foreign Fund Service Class | | | | | | | | | | | | | | | | |
Sold | | | 212,995 | | | $ | 1,827,398 | | | | 293,588 | | | $ | 2,058,641 | |
Issued as reinvestment of dividends | | | 9,090 | | | | 72,903 | | | | 10,086 | | | | 83,617 | |
Redeemed | | | (67,284 | ) | | | (585,214 | ) | | | (57,147 | ) | | | (455,066 | ) |
| | | | | | | | | | | | | | | | |
Net increase (decrease) | | | 154,801 | | | $ | 1,315,087 | | | | 246,527 | | | $ | 1,687,192 | |
| | | | | | | | | | | | | | | | |
Global Fund Class I | | | | | | | | | | | | | | | | |
Sold | | | 2,101,514 | | | $ | 15,865,764 | | | | 8,260,570 | | | $ | 51,985,363 | |
Issued as reinvestment of dividends | | | 62,496 | | | | 443,725 | | | | 80,227 | | | | 548,755 | |
Redeemed | | | (908,446 | ) | | | (6,919,297 | ) | | | (665,940 | ) | | | (4,613,466 | ) |
| | | | | | | | | | | | | | | | |
Net increase (decrease) | | | 1,255,564 | | | $ | 9,390,192 | | | | 7,674,857 | | | $ | 47,920,652 | |
| | | | | | | | | | | | | | | | |
Global Fund Class II | | | | | | | | | | | | | | | | |
Sold | | | 407,748 | | | $ | 3,108,431 | | | | 72,424 | | | $ | 465,437 | |
Issued as reinvestment of dividends | | | 13,847 | | | | 99,559 | | | | 19,305 | | | | 133,588 | |
Redeemed | | | (832,736 | ) | | | (6,380,483 | ) | | | (647,071 | ) | | | (3,966,114 | ) |
| | | | | | | | | | | | | | | | |
Net increase (decrease) | | | (411,141 | ) | | $ | (3,172,493 | ) | | | (555,342 | ) | | $ | (3,367,089 | ) |
| | | | | | | | | | | | | | | | |
142
Notes to Financial Statements (Continued)
| | | | | | | | | | | | | | | | |
| | | Year ended December 31, 2010 | | | Year ended December 31, 2009 | |
| | | | |
| | | Shares | | | Amount | | | Shares | | | Amount | |
| | | | | | | | | | | | | | | | |
Global Fund Service Class I | | | | | | | | | | | | | | | | |
Sold | | | 110,786 | | | $ | 851,572 | | | | 54,540 | | | $ | 319,752 | |
Issued as reinvestment of dividends | | | 629 | | | | 4,481 | | | | 778 | | | | 5,335 | |
Redeemed | | | (17,078 | ) | | | (134,853 | ) | | | (27,201 | ) | | | (189,283 | ) |
| | | | | | | | | | | | | | | | |
Net increase (decrease) | | | 94,337 | | | $ | 721,200 | | | | 28,117 | | | $ | 135,804 | |
| | | | | | | | | | | | | | | | |
Growth & Income Fund Initial Class | | | | | | | | | | | | | | | | |
Sold | | | 776,090 | | | $ | 5,717,289 | | | | 607,840 | | | $ | 3,603,814 | |
Issued as reinvestment of dividends | | | 281,745 | | | | 1,924,321 | | | | 402,937 | | | | 2,675,505 | |
Redeemed | | | (3,378,718 | ) | | | (25,039,463 | ) | | | (3,603,670 | ) | | | (21,976,190 | ) |
| | | | | | | | | | | | | | | | |
Net increase (decrease) | | | (2,320,883 | ) | | $ | (17,397,853 | ) | | | (2,592,893 | ) | | $ | (15,696,871 | ) |
| | | | | | | | | | | | | | | | |
Growth & Income Fund Service Class | | | | | | | | | | | | | | | | |
Sold | | | 214,795 | | | $ | 1,571,487 | | | | 1,346,394 | | | $ | 8,060,020 | |
Issued as reinvestment of dividends | | | 22,513 | | | | 153,086 | | | | 27,809 | | | | 184,375 | |
Redeemed | | | (113,339 | ) | | | (858,995 | ) | | | (67,394 | ) | | | (433,966 | ) |
| | | | | | | | | | | | | | | | |
Net increase (decrease) | | | 123,969 | | | $ | 865,578 | | | | 1,306,809 | | | $ | 7,810,429 | |
| | | | | | | | | | | | | | | | |
Income & Growth Fund Initial Class | | | | | | | | | | | | | | | | |
Sold | | | 1,362,036 | | | $ | 10,663,507 | | | | 26,139,636 | | | $ | 176,326,234 | |
Issued as reinvestment of dividends | | | 383,354 | | | | 2,756,313 | | | | 281,303 | | | | 2,061,951 | |
Redeemed | | | (27,617,404 | ) | | | (217,527,860 | ) | | | (3,287,411 | ) | | | (22,707,168 | ) |
| | | | | | | | | | | | | | | | |
Net increase (decrease) | | | (25,872,014 | ) | | $ | (204,108,040 | ) | | | 23,133,528 | | | $ | 155,681,017 | |
| | | | | | | | | | | | | | | | |
Income & Growth Fund Service Class | | | | | | | | | | | | | | | | |
Sold | | | 174,820 | | | $ | 1,375,208 | | | | 241,058 | | | $ | 1,596,826 | |
Issued as reinvestment of dividends | | | 16,903 | | | | 121,024 | | | | 1,908 | | | | 13,965 | |
Redeemed | | | (26,016 | ) | | | (202,298 | ) | | | (31,641 | ) | | | (224,144 | ) |
| | | | | | | | | | | | | | | | |
Net increase (decrease) | | | 165,707 | | | $ | 1,293,934 | | | | 211,325 | | | $ | 1,386,647 | |
| | | | | | | | | | | | | | | | |
Large Cap Growth Fund Initial Class | | | | | | | | | | | | | | | | |
Sold | | | 12,562,705 | | | $ | 115,481,857 | | | | 211,535 | | | $ | 1,555,903 | |
Issued as reinvestment of dividends | | | 15,926 | | | | 135,692 | | | | 22,584 | | | | 177,283 | |
Redeemed | | | (1,302,616 | ) | | | (12,041,545 | ) | | | (961,957 | ) | | | (6,995,762 | ) |
| | | | | | | | | | | | | | | | |
Net increase (decrease) | | | 11,276,015 | | | $ | 103,576,004 | | | | (727,838 | ) | | $ | (5,262,576 | ) |
| | | | | | | | | | | | | | | | |
Large Cap Growth Fund Service Class | | | | | | | | | | | | | | | | |
Sold | | | 22,317 | | | $ | 213,915 | | | | 48,165 | | | $ | 347,369 | |
Issued as reinvestment of dividends | | | - | | | | - | | | | 303 | | | | 2,376 | |
Redeemed | | | (21,421 | ) | | | (198,209 | ) | | | (11,087 | ) | | | (89,274 | ) |
| | | | | | | | | | | | | | | | |
Net increase (decrease) | | | 896 | | | $ | 15,706 | | | | 37,381 | | | $ | 260,471 | |
| | | | | | | | | | | | | | | | |
Mid Cap Growth Fund Initial Class | | | | | | | | | | | | | | | | |
Sold | | | 3,296,433 | | | $ | 34,259,480 | | | | 6,163,288 | | | $ | 46,612,334 | |
Issued as reinvestment of dividends | | | - | | | | - | | | | - | | | | - | |
Redeemed | | | (5,047,966 | ) | | | (53,311,722 | ) | | | (5,361,151 | ) | | | (41,586,165 | ) |
| | | | | | | | | | | | | | | | |
Net increase (decrease) | | | (1,751,533 | ) | | $ | (19,052,242 | ) | | | 802,137 | | | $ | 5,026,169 | |
| | | | | | | | | | | | | | | | |
Mid Cap Growth Fund Service Class | | | | | | | | | | | | | | | | |
Sold | | | 557,079 | | | $ | 5,906,122 | | | | 579,810 | | | $ | 4,315,604 | |
Issued as reinvestment of dividends | | | - | | | | - | | | | - | | | | - | |
Redeemed | | | (163,436 | ) | | | (1,811,029 | ) | | | (128,752 | ) | | | (1,117,585 | ) |
| | | | | | | | | | | | | | | | |
Net increase (decrease) | | | 393,643 | | | $ | 4,095,093 | | | | 451,058 | | | $ | 3,198,019 | |
| | | | | | | | | | | | | | | | |
143
Notes to Financial Statements (Continued)
| | | | | | | | | | | | | | | | |
| | | Year ended December 31, 2010 | | | Year ended December 31, 2009 | |
| | | | |
| | | Shares | | | Amount | | | Shares | | | Amount | |
| | | | | | | | | | | | | | | | |
Mid Cap Value Fund Initial Class | | | | | | | | | | | | | | | | |
Sold | | | 3,087,765 | | | $ | 28,849,418 | | | | 7,052,370 | | | $ | 49,158,706 | |
Issued as reinvestment of dividends | | | 651,490 | | | | 5,765,689 | | | | 883,402 | | | | 7,031,877 | |
Redeemed | | | (5,987,434 | ) | | | (56,135,539 | ) | | | (7,605,329 | ) | | | (56,313,369 | ) |
| | | | | | | | | | | | | | | | |
Net increase (decrease) | | | (2,248,179 | ) | | $ | (21,520,432 | ) | | | 330,443 | | | $ | (122,786 | ) |
| | | | | | | | | | | | | | | | |
Mid Cap Value Fund Service Class | | | | | | | | | | | | | | | | |
Sold | | | 333,270 | | | $ | 3,158,495 | | | | 428,327 | | | $ | 2,949,356 | |
Issued as reinvestment of dividends | | | 12,113 | | | | 106,830 | | | | 12,999 | | | | 103,215 | |
Redeemed | | | (113,151 | ) | | | (1,090,315 | ) | | | (72,536 | ) | | | (587,492 | ) |
| | | | | | | | | | | | | | | | |
Net increase (decrease) | | | 232,232 | | | $ | 2,175,010 | | | | 368,790 | | | $ | 2,465,079 | |
| | | | | | | | | | | | | | | | |
Small Cap Index Fund Initial Class | | | | | | | | | | | | | | | | |
Sold | | | 421,278 | | | $ | 3,575,418 | | | | 440,296 | | | $ | 2,852,092 | |
Issued as reinvestment of dividends | | | 28,682 | | | | 223,145 | | | | 150,585 | | | | 1,093,249 | |
Redeemed | | | (1,062,473 | ) | | | (8,994,343 | ) | | | (928,895 | ) | | | (6,100,024 | ) |
| | | | | | | | | | | | | | | | |
Net increase (decrease) | | | (612,513 | ) | | $ | (5,195,780 | ) | | | (338,014 | ) | | $ | (2,154,683 | ) |
| | | | | | | | | | | | | | | | |
Small Cap Index Fund Service Class | | | | | | | | | | | | | | | | |
Sold | | | 143,330 | | | $ | 1,254,190 | | | | 206,909 | | | $ | 1,268,058 | |
Issued as reinvestment of dividends | | | 1,773 | | | | 13,744 | | | | 9,848 | | | | 71,296 | |
Redeemed | | | (76,013 | ) | | | (672,926 | ) | | | (49,349 | ) | | | (350,266 | ) |
| | | | | | | | | | | | | | | | |
Net increase (decrease) | | | 69,090 | | | $ | 595,008 | | | | 167,408 | | | $ | 989,088 | |
| | | | | | | | | | | | | | | | |
Small Company Value Fund Class II* | | | | | | | | | | | | | | | | |
Sold | | | 988,370 | | | $ | 16,499,850 | | | | 6,992,020 | | | $ | 91,484,387 | |
Issued as reinvestment of dividends | | | 540,270 | | | | 9,254,760 | | | | 161,030 | | | | 2,475,034 | |
Redeemed | | | (1,540,682 | ) | | | (27,339,415 | ) | | | (1,024,232 | ) | | | (15,107,085 | ) |
| | | | | | | | | | | | | | | | |
Net increase (decrease) | | | (12,042 | ) | | $ | (1,584,805 | ) | | | 6,128,818 | | | $ | 78,852,336 | |
| | | | | | | | | | | | | | | | |
Small Company Value Fund Service Class I* | | | | | | | | | | | | | | | | |
Sold | | | 110,585 | | | $ | 1,849,302 | | | | 58,740 | | | $ | 807,508 | |
Issued as reinvestment of dividends | | | 12,695 | | | | 216,819 | | | | 1,031 | | | | 15,831 | |
Redeemed | | | (16,751 | ) | | | (276,729 | ) | | | (16,548 | ) | | | (239,412 | ) |
| | | | | | | | | | | | | | | | |
Net increase (decrease) | | | 106,529 | | | $ | 1,789,392 | | | | 43,223 | | | $ | 583,927 | |
| | | | | | | | | | | | | | | | |
Small/Mid Cap Value Fund Initial Class | | | | | | | | | | | | | | | | |
Sold | | | 1,263,083 | | | $ | 9,595,405 | | | | 1,581,486 | | | $ | 7,722,935 | |
Issued as reinvestment of dividends | | | 150,467 | | | | 1,105,932 | | | | 307,451 | | | | 2,007,657 | |
Redeemed | | | (5,044,925 | ) | | | (41,815,111 | ) | | | (5,448,397 | ) | | | (32,926,907 | ) |
| | | | | | | | | | | | | | | | |
Net increase (decrease) | | | (3,631,375 | ) | | $ | (31,113,774 | ) | | | (3,559,460 | ) | | $ | (23,196,315 | ) |
| | | | | | | | | | | | | | | | |
Small/Mid Cap Value Fund Service Class | | | | | | | | | | | | | | | | |
Sold | | | 278,802 | | | $ | 2,298,557 | | | | 350,241 | | | $ | 1,880,275 | |
Issued as reinvestment of dividends | | | 3,255 | | | | 23,853 | | | | 5,981 | | | | 38,998 | |
Redeemed | | | (109,177 | ) | | | (934,552 | ) | | | (131,024 | ) | | | (863,833 | ) |
| | | | | | | | | | | | | | | | |
Net increase (decrease) | | | 172,880 | | | $ | 1,387,858 | | | | 225,198 | | | $ | 1,055,440 | |
| | | | | | | | | | | | | | | | |
| * | Fund commenced operations on February 27, 2009. |
144
Notes to Financial Statements (Continued)
| 6. | | Federal Income Tax Information |
At December 31, 2010, the cost of securities and the unrealized appreciation (depreciation) in the value of investments owned by the Funds, as computed on a federal income tax basis, were as follows:
| | | | | | | | | | | | | | | | |
| | | Federal Income
Tax Cost | | | Tax Basis
Unrealized
Appreciation | | | Tax Basis
Unrealized
(Depreciation) | | | Net Unrealized
Appreciation
(Depreciation) | |
Asset Allocation Fund | | $ | 122,181,907 | | | $ | 21,509,683 | | | $ | (1,099,030 | ) | | $ | 20,410,653 | |
Concentrated Growth Fund | | | 83,329,260 | | | | 17,460,084 | | | | (187,680 | ) | | | 17,272,404 | |
Equity Income Fund | | | 520,470,526 | | | | 77,894,577 | | | | (18,451,609 | ) | | | 59,442,968 | |
Foreign Fund | | | 345,364,351 | | | | 38,253,442 | | | | (46,971,776 | ) | | | (8,718,334 | ) |
Global Fund | | | 80,789,766 | | | | 24,241,846 | | | | (755,739 | ) | | | 23,486,107 | |
Growth & Income Fund | | | 133,647,011 | | | | 23,961,997 | | | | (601,605 | ) | | | 23,360,392 | |
Income & Growth Fund | | | 66,773,409 | | | | 10,385,536 | | | | (488,969 | ) | | | 9,896,567 | |
Large Cap Growth Fund | | | 142,360,578 | | | | 26,033,000 | | | | (1,603,218 | ) | | | 24,429,782 | |
Mid Cap Growth Fund | | | 256,993,179 | | | | 96,921,935 | | | | (3,448,492 | ) | | | 93,473,443 | |
Mid Cap Value Fund | | | 401,662,232 | | | | 35,848,867 | | | | (1,180,322 | ) | | | 34,668,545 | |
Small Cap Index Fund | | | 46,675,446 | | | | 7,267,429 | | | | (7,448,315 | ) | | | (180,886 | ) |
Small Company Value Fund | | | 81,267,694 | | | | 28,599,362 | | | | (1,305,668 | ) | | | 27,293,694 | |
Small/Mid Cap Value Fund | | | 166,675,799 | | | | 40,996,449 | | | | (2,883,445 | ) | | | 38,113,004 | |
Net capital loss carryforwards may be applied against any net realized taxable gains in succeeding years, subject to the carryforward period limitations, where applicable. On December 22, 2010, the Regulated Investment Company Modernization Act of 2010 (the “Modernization Act”) was signed by The President. The Modernization Act changed the capital loss carryforward rules as they relate to regulated investment companies. Capital losses generated in tax years beginning after the date of enactment may now be carried forward indefinitely, and retain the character of the original loss. Under pre-enactment law, capital losses could be carried forward for up to eight tax years as short-term capital losses. The provisions affecting the utilization of capital loss carryforwards under the Modernization Act also require the utilization of post-enactment losses prior to the utilization of pre-enactment losses.
At December 31, 2010, the following Fund(s) had available, for federal income tax purposes, unused capital losses:
| | | | | | | | | | | | |
| | | Expiring
2016 | | | Expiring
2017 | | | Expiring
2018 | |
Asset Allocation Fund | | $ | 31,821,066 | | | $ | 32,697,206 | | | $ | - | |
Concentrated Growth Fund | | | 20,003,912 | | | | 30,770,765 | | | | - | |
Equity Income Fund | | | 12,678,938 | | | | 52,898,884 | | | | - | |
Foreign Fund | | | 1,308,609 | | | | 24,798,834 | | | | 4,482,917 | |
Global Fund | | | 3,859,139 | | | | 11,075,189 | | | | - | |
Growth & Income Fund | | | 46,458,136 | | | | 33,125,485 | | | | - | |
Income & Growth Fund | | | - | | | | 6,211,888 | | | | - | |
Large Cap Growth Fund | | | 2,509,119 | | | | 8,111,268 | | | | - | |
Mid Cap Growth Fund | | | - | | | | 13,497,052 | | | | - | |
Mid Cap Value Fund | | | - | | | | 25,076,077 | | | | - | |
Small Cap Index Fund | | | - | | | | 3,130,535 | | | | 84,190 | |
Small/Mid Cap Value Fund | | | 32,746,427 | | | | 31,541,721 | | | | - | |
Net capital loss carryforwards for the Funds shown in the above table are from pre-enactment years and are, therefore, subject to the eight-year carryforward period and possible expiration.
145
Notes to Financial Statements (Continued)
The Equity Income Fund elected to defer to the fiscal year beginning January 1, 2011, post-October capital losses in the amount of $1,223,931.
The Equity Income Fund elected to defer to the fiscal year beginning January 1, 2011, post-October currency losses in the amount of $717.
The Small Company Value Fund elected to defer to the fiscal year beginning January 1, 2011, post-October passive foreign investment company losses in the amount of $21,771.
Accounting principles generally accepted in the United States of America require that only distributions in excess of tax basis earnings and profits be reported in the financial statements as a return of capital.
The tax character of distributions (including capital gain dividends, if any, designated pursuant to Section 852 of the Code) paid during the year ended December 31, 2010, was as follows:
| | | | | | | | | | | | |
| | | Ordinary
Income | | | Long Term
Capital Gain | | | Return of
Capital | |
Asset Allocation Fund | | $ | 3,434,073 | | | $ | - | | | $ | - | |
Concentrated Growth Fund | | | 432,008 | | | | - | | | | - | |
Equity Income Fund | | | 8,319,079 | | | | - | | | | - | |
Foreign Fund | | | 5,256,787 | | | | - | | | | - | |
Global Fund | | | 547,765 | | | | - | | | | - | |
Growth & Income Fund | | | 2,077,407 | | | | - | | | | - | |
Income & Growth Fund | | | 2,877,337 | | | | - | | | | - | |
Large Cap Growth Fund | | | 135,692 | | | | - | | | | - | |
Mid Cap Value Fund | | | 5,872,519 | | | | - | | | | - | |
Small Cap Index Fund | | | 236,889 | | | | - | | | | - | |
Small Company Value Fund | | | 6,534,220 | | | | 2,937,359 | | | | - | |
Small/Mid Cap Value Fund | | | 1,129,785 | | | | - | | | | - | |
The tax character of distributions (including capital gain dividends, if any, designated pursuant to Section 852 of the Code) paid during the year ended December 31, 2009, was as follows:
| | | | | | | | | | | | |
| | | Ordinary
Income | | | Long Term
Capital Gain | | | Return of
Capital | |
Asset Allocation Fund | | $ | 5,572,373 | | | $ | - | | | $ | - | |
Concentrated Growth Fund | | | 348,761 | | | | - | | | | - | |
Equity Income Fund | | | 9,412,810 | | | | - | | | | - | |
Foreign Fund | | | 6,181,604 | | | | - | | | | - | |
Global Fund | | | 687,678 | | | | - | | | | - | |
Growth & Income Fund | | | 2,859,880 | | | | - | | | | - | |
Income & Growth Fund | | | 2,075,916 | | | | - | | | | - | |
Large Cap Growth Fund | | | 179,659 | | | | - | | | | - | |
Mid Cap Value Fund | | | 7,135,092 | | | | - | | | | - | |
Small Cap Index Fund | | | 575,545 | | | | 589,000 | | | | - | |
Small Company Value Fund | | | 2,466,104 | | | | 24,761 | | | | - | |
Small/Mid Cap Value Fund | | | 2,046,655 | | | | - | | | | - | |
146
Notes to Financial Statements (Continued)
The following Fund(s) have elected to pass through the foreign tax credit for the year ended December 31, 2010:
| | | | |
| | | Amount | |
Foreign Fund | | $ | 940,352 | |
Global Fund | | | 140,564 | |
Capital accounts within financial statements are periodically adjusted for permanent differences between book and tax accounting. These adjustments have no impact on net assets or the results of operations. Temporary book and tax accounting differences will reverse in subsequent periods. At December 31, 2010, temporary book and tax accounting differences were primarily attributable to investments in forward contracts, passive foreign investment companies, the deferral of wash sale losses, and deferred Trustee compensation.
At December 31, 2010, the components of distributable earnings on a tax basis were as follows:
| | | | | | | | | | | | | | | | |
| | | Undistributed
Ordinary
Income | | | Undistributed
Long Term
Capital Gain
(Capital Loss
Carryover) | | | Other
Temporary
Differences | | | Unrealized
Appreciation
(Depreciation) | |
Asset Allocation Fund | | $ | 2,725,198 | | | $ | (64,518,272 | ) | | $ | (32,855 | ) | | $ | 20,410,976 | |
Concentrated Growth Fund | | | 604,187 | | | | (50,774,677 | ) | | | (15,699 | ) | | | 17,272,404 | |
Equity Income Fund | | | 9,579,367 | | | | (65,577,822 | ) | | | (1,289,913 | ) | | | 59,442,059 | |
Foreign Fund | | | 6,215,336 | | | | (30,590,360 | ) | | | (46,612 | ) | | | (8,599,150 | ) |
Global Fund | | | 1,006,400 | | | | (14,934,328 | ) | | | (9,813 | ) | | | 23,494,248 | |
Growth & Income Fund | | | 1,590,417 | | | | (79,583,621 | ) | | | (35,385 | ) | | | 23,360,526 | |
Income & Growth Fund | | | 2,330,872 | | | | (6,211,888 | ) | | | (25,961 | ) | | | 9,897,299 | |
Large Cap Growth Fund | | | 388,535 | | | | (10,620,387 | ) | | | (11,277 | ) | | | 24,429,782 | |
Mid Cap Growth Fund | | | - | | | | (13,497,052 | ) | | | (45,307 | ) | | | 93,473,548 | |
Mid Cap Value Fund | | | 8,830,781 | | | | (25,076,077 | ) | | | (60,904 | ) | | | 34,671,118 | |
Small Cap Index Fund | | | 316,490 | | | | (3,214,725 | ) | | | (8,439 | ) | | | (180,894 | ) |
Small Company Value Fund | | | 74,609 | | | | 1,428,803 | | | | (27,148 | ) | | | 27,293,694 | |
Small/Mid Cap Value Fund | | | 1,142,684 | | | | (64,288,148 | ) | | | (32,421 | ) | | | 38,113,004 | |
During the year ended December 31, 2010, the following amounts were reclassified due to permanent differences between book and tax accounting:
| | | | | | | | | | | | |
| | | Paid-in
Capital | | | Accumulated
Net Realized
Gain (Loss) on
Investments | | | Undistributed
Net Investment
Income (Loss) | |
Asset Allocation Fund | | $ | - | | | $ | (94,088 | ) | | $ | 94,088 | |
Equity Income Fund | | | - | | | | (2,742 | ) | | | 2,742 | |
Foreign Fund | | | - | | | | 35,896 | | | | (35,896 | ) |
Global Fund | | | - | | | | (24,654 | ) | | | 24,654 | |
Growth & Income Fund | | | - | | | | 5,924 | | | | (5,924 | ) |
Income & Growth Fund | | | 21,820 | | | | 70,100 | | | | (91,920 | ) |
Large Cap Growth Fund | | | (970 | ) | | | (4,934 | ) | | | 5,904 | |
Mid Cap Growth Fund | | | 50,014 | | | | (22,668 | ) | | | (27,346 | ) |
Mid Cap Value Fund | | | (33,000 | ) | | | 382,790 | | | | (349,790 | ) |
Small Cap Index Fund | | | (6,539 | ) | | | (16,567 | ) | | | 23,106 | |
Small Company Value Fund | | | - | | | | (320,907 | ) | | | 320,907 | |
147
Notes to Financial Statements (Continued)
The Funds did not have any unrecognized tax benefits at December 31, 2010, nor were there any increases or decreases in unrecognized tax benefits for the year then ended. The Funds recognize interest and penalties, if any, related to unrecognized tax benefits as an income tax expense in the Statements of Operations. During the year ended December 31, 2010, the Funds did not incur any such interest or penalties. The Funds are subject to examination by U.S. federal and state tax authorities for returns filed for the prior three fiscal years, or the returns filed to date for Funds in existence less than three years. Foreign taxes are provided for based on the Funds’ understanding of the tax rules and rates that exist in the foreign markets in which they invest.
Under the Funds’ organizational documents, current and former Trustees and Officers are provided with specified rights to indemnification against liabilities arising in connection with the performance of their duties to the Funds, and shareholders are indemnified against personal liability for obligations of the Funds. In the normal course of business, the Funds may also enter into contracts that provide general indemnifications. The Funds’ maximum exposure under these arrangements is unknown as this would be dependent on future claims that may be made against the Funds. The risk of material loss from such claims is considered remote.
| 8. | | New Accounting Pronouncements |
In January 2010, the Financial Accounting Standards Board issued Accounting Standards Updated No. 2010-06, “Improving Disclosures About Fair Value Measurements” (“ASU”). The ASU requires enhanced disclosures about purchases, sales, issuances, and settlements on a gross basis relating to Level 3 measurements. The disclosure will be effective for fiscal years beginning after December 15, 2010, and for interim periods within those fiscal years. Management is currently evaluating the impact the adoption of this ASU will have on the Funds’ financial statement disclosures.
On December 7, 2010, the Trust was named as a defendant and putative member of the proposed defendant class of shareholders named in an adversary proceeding brought by The Official Committee of Unsecured Creditors of Tribune Company (the “Official Committee”) in the U.S. Bankruptcy Court for the District of Delaware, in connection with Tribune Company’s Chapter 11 bankruptcy proceeding (In re Tribune Company). The proceeding relates to a leveraged buyout transaction by which Tribune Company converted to a privately-held company in 2007, and the putative defendant class is comprised of beneficial owners of shares of Tribune Company who received proceeds of the leveraged buy-out. The Official Committee seeks to recover payments of those proceeds.
The potential amounts sought to be recovered from the Equity Income Fund, plus interest and the Official Committee’s court costs, is approximately $4,562,800. The Fund cannot predict the outcome of this proceeding. If the proceeding were to be decided in a manner adverse to the Fund, or if the Fund was to enter into a settlement agreement with the Official Committee, the payment of such judgment or settlement could have a material adverse effect on the Fund’s net asset values.
Management has evaluated the events and transactions subsequent to December 31, 2010 through the date when the financial statements were issued, and determined that there are no material events or transactions that would require adjustments to or disclosures in the Funds’ financial statements.
148
Report of Independent Registered Public Accounting Firm
To the Board of Trustees of MML Series Investment Fund and Shareholders of MML Asset Allocation Fund, MML Concentrated Growth Fund, MML Equity Income Fund, MML Foreign Fund, MML Global Fund, MML Growth & Income Fund, MML Income & Growth Fund, MML Large Cap Growth Fund, MML Mid Cap Growth Fund, MML Mid Cap Value Fund, MML Small Cap Index Fund, MML Small Company Value Fund, and MML Small/Mid Cap Value Fund:
We have audited the accompanying statements of assets and liabilities, including the portfolios of investments, of MML Asset Allocation Fund, MML Concentrated Growth Fund, MML Equity Income Fund, MML Foreign Fund, MML Global Fund, MML Growth & Income Fund, MML Income & Growth Fund, MML Large Cap Growth Fund, MML Mid Cap Growth Fund, MML Mid Cap Value Fund, MML Small Cap Index Fund, MML Small Company Value Fund, and MML Small/Mid Cap Value Fund (collectively the “Funds”), thirteen of the funds comprising the MML Series Investment Fund (the “Trust”) as of December 31, 2010, and the related statements of operations for the year then ended, the statements of changes in net assets for each of the two years in the period then ended, and the financial highlights for each of the periods presented. These financial statements and financial highlights are the responsibility of the Funds’ management. Our responsibility is to express an opinion on these financial statements and financial highlights based on our audits.
We conducted our audits in accordance with the standards of the Public Company Accounting Oversight Board (United States). Those standards require that we plan and perform the audits to obtain reasonable assurance about whether the financial statements and financial highlights are free of material misstatement. The Funds are not required to have, nor were we engaged to perform, an audit of their internal control over financial reporting. Our audits included consideration of internal control over financial reporting as a basis for designing audit procedures that are appropriate in the circumstances, but not for the purpose of expressing an opinion on the effectiveness of the Funds’ internal control over financial reporting. Accordingly, we express no such opinion. An audit also includes examining, on a test basis, evidence supporting the amounts and disclosures in the financial statements, assessing the accounting principles used and significant estimates made by management, as well as evaluating the overall financial statement presentation. Our procedures included confirmation of securities owned as of December 31, 2010, by correspondence with the custodian and brokers; where replies were not received from brokers, we performed other auditing procedures. We believe that our audits provide a reasonable basis for our opinion.
In our opinion, the financial statements and financial highlights referred to above present fairly, in all material respects, the financial position of each of the Funds as of December 31, 2010, the results of their operations for the year then ended, the changes in their net assets for each of the two years in the period then ended, and the financial highlights for each of the periods presented, in conformity with accounting principles generally accepted in the United States of America.
DELOITTE & TOUCHE LLP
Boston, Massachusetts
February 18, 2011
149
Trustees and Officers (Unaudited)
The following table lists the Trust’s Trustees and Officers as of December 31, 2010; their address and age; their position with the Trust; the length of time holding that position with the Trust; their principal occupation(s) during the past five years; the number of portfolios in the fund complex they oversee; and other directorships they hold in companies subject to registration or reporting requirements of the Securities Exchange Act of 1934 (generally called “public companies”) or in registered investment companies. The Trust’s Statement of Additional Information includes additional information about the Trust’s Trustees and is available, without charge, upon request by calling 1-888-309-3539 or by writing MML Series Investment Fund, c/o Massachusetts Mutual Life Insurance Company, 1295 State Street, Springfield, Massachusetts 01111-0001, Attention: Retirement Services Marketing.
Disinterested Trustees
| | | | | | | | | | |
Name, Address*, and Age | | Position(s)
Held with
Trust | | Term of
Office** and
Length of
Time Served | | Principal Occupation(s) During Past 5 Years | | Number of
Portfolios in
Fund Complex
Overseen by Trustee | | Other Directorships Held by Trustee |
Richard H. Ayers
Age: 68 | | Chairman Trustee | | Since 2010 Since 1999 | | Retired. | | 63 | | Director (since 2008), Celera Corporation; Director (1996-2008), Applera Corporation; Director (2002-2006), Instron Corporation; Chairman (since 2010), Trustee (since 1996), MassMutual Select Funds (open-end investment company). |
| | | | | |
Allan W. Blair
Age: 62 | | Trustee | | Since 2003 | | President and Chief Executive Officer (since 1996), Economic Development Council of Western Massachusetts; President and Chief Executive Officer (1993-2006), Westmass Area Development Corporation; President and Chief Executive Officer (since 1984), Westover Metropolitan Development Corporation. | | 63 | | Director (2001-2007), Future Works, Inc.; Trustee (since 2003), MassMutual Select Funds (open-end investment company). |
| | | | | |
Mary E. Boland
Age: 71 | | Trustee | | Since 1973 | | Attorney-at-Law (since 2004). | | 63 | | Director (1999-2007), BankNorth Massachusetts; Trustee (since 1994), MassMutual Select Funds (open-end investment company). |
| | | | | |
R. Alan Hunter, Jr.
Age: 64 | | Trustee | | Since 2003 | | Retired. | | 63 | | Director (since 2007), Actuant Corporation; Trustee (since 2003), MassMutual Select Funds (open-end investment company). |
| | | | | |
F. William Marshall, Jr.
Age: 68 | | Trustee | | Since 1996 | | Retired. Consultant (1999-2009). | | 99*** | | Trustee (since 2000), Denver Board – Oppenheimer Funds; Trustee (since 1996), MassMutual Select Funds (open-end investment company). |
| | | | | |
Susan B. Sweeney
Age: 58 | | Trustee | | Since 2009 | | Senior Vice President and Chief Investment Officer (since 2010), Selective Insurance Group (property and casualty company); Senior Managing Director (2008-2010), Ironwood Capital (private equity firm); Chief Investment Officer, Pension Fund (2002-2007), Office of the Treasurer of the State of Connecticut. | | 63 | | Trustee (since 2009), MassMutual Select Funds (open-end investment company). |
150
Trustees and Officers (Unaudited) (Continued)
Interested Trustees
| | | | | | | | | | |
Name, Address*, and Age | | Position(s)
Held with
Trust | | Term of
Office** and
Length of
Time Served | | Principal Occupation(s) During Past 5 Years | | Number of
Portfolios in
Fund Complex
Overseen by Trustee | | Other Directorships Held by Trustee |
Robert E. Joyal^
Age: 65 | | Trustee | | Since 2003 | | Retired. | | 65^^ | | Director (since 2007), Scottish Re Group Ltd.; Director (since 2006), Jefferies Group, Inc. (investment bank); Director (1996-2005), Antares Capital Corporation (bank loan syndication); Director (since 2003), Alabama Aircraft Industries, Inc.; Trustee (since 2003), President (1999-2003), MassMutual Corporate Investors (closed-end investment company); Trustee (since 2003), President (1999-2003), MassMutual Participation Investors (closed-end investment company); Director (2005-2006), York Enhanced Strategies Fund (closed-end investment company); Trustee (since 2003), Vice Chairman (2005-2007), MassMutual Select Funds (open-end investment company). |
| | | | | |
Elaine A. Sarsynski^^^ Age: 55 | | Trustee | | Since 2008 | | Executive Vice President (since 2006), Senior Vice President and Chief Administrative Officer (2005-2006), MassMutual; Managing Director (2005), Babson Capital Management LLC; Chief Executive Officer (2001-2005), Town of Suffield, Connecticut. | | 63 | | Trustee (since 2008), MassMutual Select Funds (open-end investment company). |
151
Trustees and Officers (Unaudited) (Continued)
Principal Officers who are Not Trustees
| | | | | | | | |
Name, Address*, and Age | | Position(s) Held
with Trust | | Term of
Office# and
Length of
Time Served | | Principal Occupation(s) During Past 5 Years | | Number of
Portfolios in
Fund Complex
Overseen by Officer |
Richard J. Byrne
Age: 48 | | President | | Since
2007 | | Vice President (since 2007), Assistant Vice President (2003-2007), MassMutual; President (since 2007), MML Series Investment Fund II (open-end investment company). | | 40 |
| | | | |
Michael C. Eldredge Age: 46 | | Vice President | | Since
2009 | | Vice President (since 2008), MassMutual; Vice President (2005-2008), Manager (1998-2005), ING; Vice President (since 2009), MassMutual Select Funds (open-end investment company); Vice President (since 2009), MassMutual Premier Funds (open-end investment company); Vice President (since 2009), MML Series Investment Fund II (open-end investment company). | | 95 |
| | | | |
Andrew M. Goldberg Age: 44 | | Vice President, Secretary and Chief Legal Officer
Assistant Secretary | | Since
2008 (2001- 2008) | | Assistant Vice President and Counsel (since 2004), Counsel (2001-2004), MassMutual; Vice President, Secretary and Chief Legal Officer (since 2008), Assistant Secretary (2001-2008), MassMutual Select Funds (open-end investment company); Vice President, Clerk and Chief Legal Officer (since 2008), Assistant Clerk (2004-2008), MassMutual Premier Funds (open-end investment company); Vice President, Clerk and Chief Legal Officer (since 2008), Assistant Clerk (2005-2008), MML Series Investment Fund II (open-end investment company). | | 95 |
| | | | |
Nicholas H. Palmerino
Age: 45 | | Chief Financial Officer and Treasurer | | Since
2006 | | Assistant Vice President (since 2006), MassMutual; Vice President (2006), Consultant (2005-2006), JP Morgan Chase Worldwide Securities Services; Chief Financial Officer and Treasurer (since 2006), MassMutual Select Funds (open-end investment company); Chief Financial Officer and Treasurer (since 2006), MassMutual Premier Funds (open-end investment company); Chief Financial Officer and Treasurer (since 2006), MML Series Investment Fund II (open-end investment company). | | 95 |
| | | | |
Philip S. Wellman
Age: 46 | | Vice President and Chief Compliance Officer | | Since
2007 | | Vice President, Associate General Counsel and Chief Compliance Officer (Mutual Funds and Investment Advisory) (since 2008), Vice President, Associate General Counsel and Chief Compliance Officer (Mutual Funds) (2007-2008), Assistant Vice President and Associate General Counsel (2006-2007), MassMutual; Director, Office of General Counsel (2005-2006), Merrill Lynch, Pierce, Fenner & Smith Incorporated; Senior Vice President and Assistant General Counsel (2000-2006), Advest, Inc.; Vice President and Chief Compliance Officer (since 2007), MassMutual Select Funds (open-end investment company); Vice President and Chief Compliance Officer (since 2007), MassMutual Premier Funds (open-end investment company); Vice President and Chief Compliance Officer (since 2007), MML Series Investment Fund II (open-end investment company). | | 95 |
| | | | |
Eric H. Wietsma
Age: 44 | | Vice President | | Since
2006 | | Senior Vice President (since 2010), Corporate Vice President (2007-2010), Vice President (2005-2007), MassMutual; Vice President (1999-2005), Hartford Life Insurance Company; President (since 2008), Vice President (2006-2008), MassMutual Select Funds (open-end investment company); President (since 2008), Vice President (2006-2008), MassMutual Premier Funds (open-end investment company); Vice President (since 2006), MML Series Investment Fund II (open-end investment company). | | 95 |
152
Trustees and Officers (Unaudited) (Continued)
| * | The address of each Trustee and Principal Officer is the same as that for the Trust; 1295 State Street, Springfield, Massachusetts 01111. |
| ** | Each Trustee of the Trust serves until the next meeting of shareholders called for the purpose of electing Trustees and until the election and qualification of his or her successor or until he or she dies, resigns or is removed. Notwithstanding the foregoing, unless the Trustees determine that it is desirable and in the best interest of the Trust that an exception to the retirement policy of the Trust be made, a Trustee shall retire and cease to serve as a Trustee upon the conclusion of the calendar year in which such Trustee attains the age of seventy-two years. |
| | The Chairperson is elected to hold such office for a term of three years or until his or her successor is elected and qualified to carry out the duties and responsibilities of his or her office, or until he or she retires, dies, resigns, is removed or becomes disqualified. |
| *** | Denver Board – Oppenheimer Funds is deemed to be part of the Fund Complex because it is managed by OppenheimerFunds, Inc., an indirect subsidiary of MassMutual. |
| ^ | Mr. Joyal is an “Interested Person,” as that term is defined in the 1940 Act, through his position as a director of Jefferies Group, Inc., a broker-dealer that may execute portfolio transactions and/or engage in principal transactions with the Funds, other investment companies advised by MassMutual or holding themselves out to investors as related companies for purposes of investment or investor services, or any other advisory accounts over which MassMutual has brokerage placement discretion. |
| ^^ | MassMutual Participation Investors and MassMutual Corporate Investors are deemed to be a part of the Fund Complex because they are managed by Babson Capital Management LLC, an indirect subsidiary of MassMutual. |
| ^^^ | Ms. Sarsynski is an Interested Person through her employment with MassMutual. |
| # | The President, Treasurer and Secretary are elected to hold such office until their successor is elected and qualified to carry out the duties and responsibilities of their office, or until he or she dies, resigns, is removed or becomes disqualified. Each other officer shall hold office at the pleasure of the Trustees. |
153
Federal Tax Information (Unaudited)
For corporate shareholders, a portion of the ordinary dividends paid during the Fund(s)’ year ended December 31, 2010, qualified for the dividends received deduction, as follows:
| | | | |
| |
| | | Dividends Received
Deductions | |
Asset Allocation Fund | | | 42.00% | |
Concentrated Growth Fund | | | 100.00% | |
Equity Income Fund | | | 100.00% | |
Global Fund | | | 52.04% | |
Growth & Income Fund | | | 100.00% | |
Income & Growth Fund | | | 100.00% | |
Large Cap Growth Fund | | | 100.00% | |
Mid Cap Value Fund | | | 100.00% | |
Small Cap Index Fund | | | 100.00% | |
Small Company Value Fund | | | 16.71% | |
Small/Mid Cap Value Fund | | | 100.00% | |
For the year ended December 31, 2010, the following Fund(s) earned the following foreign sources of income:
| | | | |
| |
| | | Foreign Sources
of Income | |
Foreign Fund | | $ | 9,689,904 | |
Global Fund | | | 1,926,247 | |
154
Other Information (Unaudited)
Proxy Voting
A description of the policies and procedures that each Fund’s investment adviser and subadvisers use to vote proxies relating to the Fund’s portfolio securities is available, without charge, upon request, by calling 1-888-309-3539, and on the Securities and Exchange Commission’s (“SEC”) website at http://www.sec.gov.
Information regarding how the Funds voted proxies relating to portfolio securities during the most recent 12-month period ended June 30 is available, without charge, upon request, on the MassMutual website at http://www.massmutual.com/funds and on the SEC’s website at http://www.sec.gov.
Quarterly Reporting
The Funds file their complete schedule of portfolio holdings with the SEC for the first and third quarters of each fiscal year on Form N-Q. The Funds’ Forms N-Q are available on the SEC website at http://www.sec.gov. The Funds’ Forms N-Q may be reviewed and copied at the SEC’s Public Reference Room in Washington D.C. Information on the operation of the SEC’s Public Reference Room may be obtained by calling 1-800-SEC-0330.
Trustees’ Approval of Investment Advisory Contracts
At their meeting in August 2010, the Trustees, including the Trustees who are not “interested persons” (as such term is defined in the 1940 Act) of the Trust, MassMutual, or subadvisers (the “Independent Trustees”), also approved the termination of the subadvisory agreement (“Prior Sub-Advisory Agreement”) with American Century Investment Management, Inc. (“American Century”) and the approval of a new subadvisory agreement (“New Subadvisory Agreement”) with BlackRock Investment Management, LLC (“BlackRock”) as subadviser for the Income & Growth Fund. In all of their deliberations, the Trustees were advised by independent counsel.
After arriving at the decision to replace American Century as subadviser of the Fund, the Trustees determined that they desired to continue to maintain a diversified large cap strategy with low volatility and an income focus, implemented by a subadviser with strong brand recognition, a tenured investment team, and a proven investment process. After careful consideration, the Trustees determined that this could best be accomplished through BlackRock, with its investment process of bottom-up fundamental analysis that seeks dividend paying stocks with low debt to capital and employing a consistent strategy by a strong management team.
In reviewing the New Subadvisory Agreement, the Trustees discussed with MassMutual and considered a wide range of information about, among other things: (i) BlackRock and its personnel with responsibilities for providing services to the Fund; (ii) the terms of the New Subadvisory Agreement; (iii) the scope and quality of services that BlackRock will provide under the New Subadvisory Agreement; (iv) the historical investment performance track record of BlackRock; and (v) the fees payable to BlackRock by MassMutual and the effect of such fees on the profitability to MassMutual.
Prior to the vote being taken to approve the New Subadvisory Agreement, the Independent Trustees met separately in executive session to discuss the appropriateness of the contract. The Independent Trustees weighed the foregoing matters in light of the advice given to them by their independent legal counsel as to the law applicable to the review of investment advisory contracts. In arriving at a decision, the Trustees, including the Independent Trustees, did not identify any single matter as all-important or controlling. The foregoing summary does not detail all of the matters considered.
Based on the foregoing, the Trustees concluded that: (i) overall, they were satisfied with the nature, extent, and quality of services expected to be provided under the New Subadvisory Agreement; (ii) MassMutual’s level of profitability from its relationship with the Fund was not excessive and the subadvisory fee amount under the New Subadvisory Agreement is fair and reasonable; (iii) the investment processes, research capabilities, and philosophies of BlackRock appear well suited to the Fund, given its investment objective and policies; and (iv) the terms of the New Subadvisory Agreement were fair and reasonable with respect to the Fund and were in the best interest of the Fund’s shareholders.
The New Subadvisory Agreement became effective on August 20, 2010.
155
Other Information (Unaudited) (Continued)
Fund Expenses December 31, 2010
Expense Examples:
The following information is in regards to expenses for the six months ended December 31, 2010:
As a shareholder of the Funds, you incur ongoing costs, including management fees, distribution and/or service (12b-1) fees, and other Fund expenses. These examples are intended to help you understand your ongoing costs (in dollars) of investing in the Funds and to compare these costs with the ongoing costs of investing in other mutual funds. These examples are based on an investment of $1,000 invested for the six months ended December 31, 2010.
Actual Expenses:
The first four columns of the table below provide information about actual account values and actual expenses. You may use this information, together with the amount you invested, to estimate the expenses that you paid over the period. Simply divide your account value by $1,000 (for example, an $8,600 account value divided by $1,000 = 8.6), then multiply the result by the number under the heading entitled “Operating Expenses Incurred” to estimate the expenses you paid on your account during this period.
Hypothetical Example for Comparison Purposes:
The last two columns of the table below provide information about hypothetical account values and hypothetical expenses based on the Fund’s actual expense ratio and an assumed rate of return of 5% per year before expenses, which is not the Fund’s actual return. The hypothetical account values and expenses may not be used to estimate the actual ending account balance or expenses you paid for the period. You may use this information to compare the ongoing costs of investing in the Fund and other funds. To do so, compare this 5% hypothetical example with the 5% hypothetical examples that appear in the shareholder reports of the other funds.
Please note that the expenses shown in the table are meant to highlight your ongoing costs only and do not reflect any transactional costs. Therefore, the last two columns of the table are useful in comparing ongoing costs only, and will not help you determine the relative total costs of owning different funds. In addition, if these transactional costs were included, your costs would have been higher.
| | | | | | | | | | | | | | | | | | | | | | | | |
| | | Beginning
Value | | | Annualized
Expense
Ratio | | | Ending
Value (Based
on Actual
Returns and
Expenses) | | | Operating
Expenses
Incurred* | | | Ending
Value (Based
on
Hypothetical
Returns and
Expenses) | | | Operating
Expenses
Incurred* | |
| Asset Allocation Fund | | | | | | | | | | | | | | | | | | | | | | | | |
Initial Class | | $ | 1,000 | | | | 0.62 | % | | $ | 1,171.50 | | | $ | 3.39 | | | $ | 1,022.10 | | | $ | 3.16 | |
Service Class | | | 1,000 | | | | 0.87 | % | | | 1,169.20 | | | | 4.76 | | | | 1,020.80 | | | | 4.43 | |
| Concentrated Growth Fund | | | | | | | | | | | | | | | | | | | | | | | | |
Class I | | | 1,000 | | | | 0.87 | % | | | 1,252.30 | | | | 4.94 | | | | 1,020.80 | | | | 4.43 | |
Class II | | | 1,000 | | | | 0.77 | % | | | 1,252.50 | | | | 4.37 | | | | 1,021.30 | | | | 3.92 | |
Service Class I | | | 1,000 | | | | 1.12 | % | | | 1,249.60 | | | | 6.35 | | | | 1,019.60 | | | | 5.70 | |
| Equity Income Fund | | | | | | | | | | | | | | | | | | | | | | | | |
Initial Class | | | 1,000 | | | | 0.79 | % | | | 1,221.10 | | | | 4.42 | | | | 1,021.20 | | | | 4.02 | |
Service Class | | | 1,000 | | | | 1.04 | % | | | 1,220.30 | | | | 5.82 | | | | 1,020.00 | | | | 5.30 | |
| Foreign Fund | | | | | | | | | | | | | | | | | | | | | | | | |
Initial Class | | | 1,000 | | | | 0.98 | % | | | 1,218.50 | | | | 5.48 | | | | 1,020.30 | | | | 4.99 | |
Service Class | | | 1,000 | | | | 1.23 | % | | | 1,218.90 | | | | 6.88 | | | | 1,019.00 | | | | 6.26 | |
| Global Fund | | | | | | | | | | | | | | | | | | | | | | | | |
Class I | | | 1,000 | | | | 0.90 | % | | | 1,246.70 | | | | 5.10 | | | | 1,020.70 | | | | 4.58 | |
Class II | | | 1,000 | | | | 0.80 | % | | | 1,247.50 | | | | 4.53 | | | | 1,021.20 | | | | 4.08 | |
Service Class I | | | 1,000 | | | | 1.15 | % | | | 1,246.40 | | | | 6.51 | | | | 1,019.40 | | | | 5.85 | |
156
Other Information (Unaudited) (Continued)
| | | | | | | | | | | | | | | | | | | | | | | | |
| | | Beginning
Value | | | Annualized
Expense
Ratio | | | Ending
Value (Based
on Actual
Returns and
Expenses) | | | Operating
Expenses
Incurred* | | | Ending
Value (Based
on
Hypothetical
Returns and
Expenses) | | | Operating
Expenses
Incurred* | |
| Growth & Income Fund | | | | | | | | | | | | | | | | | | | | | | | | |
Initial Class | | $ | 1,000 | | | | 0.56 | % | | $ | 1,224.70 | | | $ | 3.14 | | | $ | 1,022.40 | | | $ | 2.85 | |
Service Class | | | 1,000 | | | | 0.81 | % | | | 1,224.20 | | | | 4.54 | | | | 1,021.10 | | | | 4.13 | |
| Income & Growth Fund | | | | | | | | | | | | | | | | | | | | | | | | |
Initial Class | | | 1,000 | | | | 0.72 | % | | | 1,194.90 | | | | 3.98 | | | | 1,021.60 | | | | 3.67 | |
Service Class | | | 1,000 | | | | 0.98 | % | | | 1,192.80 | | | | 5.42 | | | | 1,020.30 | | | | 4.99 | |
| Large Cap Growth Fund | | | | | | | | | | | | | | | | | | | | | | | | |
Initial Class | | | 1,000 | | | | 0.71 | % | | | 1,294.60 | | | | 4.11 | | | | 1,021.60 | | | | 3.62 | |
Service Class | | | 1,000 | | | | 0.95 | % | | | 1,293.50 | | | | 5.49 | | | | 1,020.40 | | | | 4.84 | |
| Mid Cap Growth Fund | | | | | | | | | | | | | | | | | | | | | | | | |
Initial Class | | | 1,000 | | | | 0.81 | % | | | 1,287.40 | | | | 4.67 | | | | 1,021.10 | | | | 4.13 | |
Service Class | | | 1,000 | | | | 1.07 | % | | | 1,286.50 | | | | 6.17 | | | | 1,019.80 | | | | 5.45 | |
| Mid Cap Value Fund | | | | | | | | | | | | | | | | | | | | | | | | |
Initial Class | | | 1,000 | | | | 0.89 | % | | | 1,216.10 | | | | 4.97 | | | | 1,020.70 | | | | 4.53 | |
Service Class | | | 1,000 | | | | 1.14 | % | | | 1,214.10 | | | | 6.36 | | | | 1,019.50 | | | | 5.80 | |
| Small Cap Index Fund | | | | | | | | | | | | | | | | | | | | | | | | |
Initial Class | | | 1,000 | | | | 0.49 | % | | | 1,270.60 | | | | 2.80 | | | | 1,022.70 | | | | 2.50 | |
Service Class | | | 1,000 | | | | 0.74 | % | | | 1,269.90 | | | | 4.23 | | | | 1,021.50 | | | | 3.77 | |
| Small Company Value Fund | | | | | | | | | | | | | | | | | | | | | | | | |
Class II | | | 1,000 | | | | 1.15 | % | | | 1,259.60 | | | | 6.55 | | | | 1,019.40 | | | | 5.85 | |
Service Class I | | | 1,000 | | | | 1.40 | % | | | 1,258.10 | | | | 7.97 | | | | 1,018.10 | | | | 7.12 | |
| Small/Mid Cap Value Fund | | | | | | | | | | | | | | | | | | | | | | | | |
Initial Class | | | 1,000 | | | | 0.80 | % | | | 1,294.80 | | | | 4.63 | | | | 1,021.20 | | | | 4.08 | |
Service Class | | | 1,000 | | | | 1.05 | % | | | 1,292.70 | | | | 6.07 | | | | 1,019.90 | | | | 5.35 | |
| * | Expenses are calculated using the annualized expense ratio for the six months ended December 31, 2010, multiplied by the average account value over the period, multiplied by the number of days in the period, divided by the number of days in the year, unless stated otherwise. |
157

MML Series Investment Fund
Annual Report
MML Fundamental Value Fund
MML PIMCO Total Return Fund
This annual report pertains to certain funds offered through the Series.
Your variable product prospectus will list which of these funds are available through your variable product.
December 31, 2010
Table of Contents
This material must be preceded or accompanied by a current prospectus (or summary prospectus, if available) for the MML Series Investment Fund. Investors should consider a Fund’s investment objective, risks and charges and expenses carefully before investing. This and other information about the investment company is available in the prospectus (or summary prospectus, if available). Read it carefully before investing.
MML Series Investment Fund – President’s Letter to Shareholders
To Our Shareholders

Richard J. Byrne
“MassMutual’s view is that a retirement investment plan tailored to your time horizon and your tolerance for risk can help you navigate short-term gyrations in the markets. By monitoring your plan regularly and adjusting your retirement planning strategy when appropriate, you can help yourself as you pursue your long-term financial objectives.”
December 31, 2010
Cautious optimism emerges as recovery continues
I am pleased to present you with the MML Series Investment Fund Annual Report, covering the year ended December 31, 2010. Equity markets worldwide advanced during this period (some in the double digits), yet volatility continued to be a factor. Investors in the U.S. and abroad repeatedly demonstrated how connected we all are to the global economy in this modern era, driving U.S. and foreign markets up and down in reaction to the latest news events and economic data from around the world. Despite generally improving market conditions, economic challenges remained for most of the countries where markets advanced. But investors in the U.S. found reason for optimism, as several economic indicators in December pointed to possible signs of sustained recovery.
Retirement investing is a long-term proposition
If you work with a financial professional, you may wish to consider contacting him or her to help you evaluate and fine-tune your overall investment strategy. This can be an effective way to help ensure that you are on the right path toward your long-term investment objectives.
The market environment we witnessed in 2010 should remind us that investing for retirement is a long-term proposition – despite whatever changes or events may occur in the short term. The markets are cyclical, and investors who realized this and stayed the course over the past few years were rewarded in 2010. The major equity markets in the U.S. advanced in 2010, with a similar scenario playing out in many markets abroad.
One reason why financial professionals typically believe it is important to stay invested through all market conditions can be seen in the five-year performance history of the S&P 500® Index1 (the “S&P 500”), a widely used measure of large-cap stock performance in the U.S. On January 3, 2006, the S&P 500 closed at 1268.80. As you may recall, stock prices dropped significantly, beginning in late 2007 and through early 2009. On March 9, 2009, the S&P 500 closed at 676.53, its lowest level over the five years. Yet, by market close on December 31, 2010, the S&P 500 was back up to 1257.64. Consequently, investors in large-cap U.S. stocks who remained invested throughout this period likely benefited from the market recovery that began in March 2009. Conversely, those who “cashed out” of these stocks during the market downturn locked in their losses and did not participate in the recovery rally.
Keep these basic ideas in mind
| • | | Retirement investing is different. Investing for retirement is not like saving or investing for short-term needs, such as a vacation or a new car. The longer time that many retirement investors have to invest may give them an advantage over individuals with a shorter time frame to work with. |
| • | | Invest regularly and boost your contribution rate. Contributing to your retirement account on a regular basis can help you to buy more shares or units of an investment when its price is lower and fewer shares or units when its price is higher.2 Boosting your contribution rate periodically (even by a small amount), over time, may help you increase the amount of money in your account as retirement approaches. |
| 1 | Indexes are unmanaged, do not incur fees or expenses and cannot be purchased directly for investment. |
| 2 | Systematic investing and asset allocation do not ensure a profit or protect against loss in a declining market. Systematic investing involves continuous investment in securities regardless of fluctuating price levels. Investors should consider their ability to continue investing through periods of low price levels. |
1
MML Series Investment Fund – President’s Letter to Shareholders (Continued)
| • | | Choose investments that work for you and monitor your account regularly. No one knows your financial goals and objectives better than you. So be sure to select the stock, bond and short-term/money market investments that you feel will help you reach your goals. One of the greatest advantages you have when you diversify your investment choices is that these three distinct investment types tend to behave differently under various economic conditions. Consequently, many financial professionals hold the view that individuals can help reduce their risk of overexposure to one or two poorly performing investment types by diversifying across multiple types. |
Keep your eye on the future and stay current with your plan
We believe doing business with MassMutual is the sign of a good decision – as is focusing on the long term when it comes to planning for retirement. As you can see from the S&P 500 example noted above, short-term changes in the markets don’t necessarily have to result in a long-term impact on your retirement account. MassMutual’s view is that a retirement investment plan tailored to your time horizon and your tolerance for risk can help you navigate short-term gyrations in the markets. By monitoring your plan regularly and adjusting your retirement planning strategy when appropriate, you can help yourself as you pursue your long-term financial objectives.
As always, thank you for your confidence and trust in MassMutual.
Sincerely,

Richard J. Byrne
President
The information provided is the opinion of MassMutual Retirement Services Investment Services as of 1/1/11 and is subject to change without notice. It is not to be construed as tax, legal or investment advice. Of course, past performance does not guarantee future results.
2
MML Series Investment Fund – Economic and Market Review
December 31, 2010
A challenging year, with emerging signs of recovery
The turnaround in the financial markets that began in March 2009 continued during the year ended December 31, 2010, although there were numerous – and some significant – bumps along the way. The stock market in the United States was largely positive throughout the year, despite notable periods of underperformance. Foreign equity markets also overcame difficulties and did well overall, despite generally lagging their U.S. counterparts. Many of the debt-related problems that had plagued some of the more highly leveraged countries in the euro zone (particularly Greece and Ireland) underwent short-term resolution through government intervention, but European debt issues continued to hinder the investing environment as the period ended.
The U.S. dollar remained strong throughout much of the year, although late in the period, investor fears over the Federal Reserve’s (the “Fed”) announced purchase of U.S. Treasury bonds caused the dollar to weaken – against the backdrop of an ongoing run-up in commodity (specifically, gold and oil) prices, which commonly occurs when the dollar declines in value. Crude oil finished the year at roughly $91 per barrel (versus $79 on December 31, 2009) and gold continued to trade higher, closing the year at approximately $1,422 per ounce (versus $1,096 on December 31, 2009).
Key pieces of legislation passed in the year included health care reform (March), which did not have much of an immediate impact on the markets, and the extension of the Bush-era income-tax cuts (December), which linked a two-year extension of the Bush tax cuts (initially signed into law in 2001, but slated to expire without Congressional action on December 31, 2010) to a one-year extension of unemployment benefits and other aid to middle-income earners. Also in politics, the mid-term elections delivered a Republican majority in the U.S. House of Representatives, but the U.S. Senate continued to hold a Democratic majority.
The Fed kept interest rates low, holding the federal funds rate at 0.0% to 0.25%, in its continued focus on stimulating the economy. The federal funds rate is the interest rate that banks and other financial institutions charge each other for borrowing funds overnight.
Certain economic indicators were troubling during the period and seemed mainly to show more bad news than good until the end of the year, when some bright spots appeared on the horizon. Indeed, December economic reports indicated that consumer confidence rose, initial jobless claims fell, and Gross Domestic Product (“GDP”) for the third quarter of the year was revised to reflect a gain of 2.6%, after an initial estimated advance of 2.0%. GDP reflects the total value of goods and services produced in the United States.
Market performance
Both bonds and equities advanced for the 12-month period ended December 31, 2010, although stocks generally outperformed their fixed-income counterparts. The Dow Jones Industrial AverageSM (the “Dow”), a well-known measure of blue-chip stock performance, advanced 11.02%. In a similar fashion, the S&P 500® Index of U.S. large-cap stocks returned 15.06%. The small-cap Russell 2000® Index outpaced both of the aforementioned indexes, with a return of 26.85% for the period. The barometer for technology stocks, the NASDAQ Composite® Index, posted a 16.91% return for the period. Performance was also positive in worldwide equity markets. The MSCI® EAFE® Index, a benchmark for foreign stocks in developed markets, advanced 7.75%. The foreign market winner, however, was the MSCI Emerging Markets Index, a benchmark that represents the performance of emerging stock markets throughout the world, which advanced 18.88%.
Fixed-income investments generally trailed their equity counterparts during the 12-month period. The Barclays Capital U.S. Aggregate Bond Index, a broad measure of the U.S. investment-grade bond markets, gained 6.54%. Treasury bills gained just 0.13%. The outstanding performer in the fixed-income arena was the Barclays Capital U.S. Corporate High Yield Index, a measure of the performance of fixed-rate, non-investment-grade debt from corporate sectors, which advanced 15.12%. Conversely, the Barclays Capital U.S. 1-3 Year Government Bond Index, which measures the performance of short-term U.S. government bonds, returned 2.40%.*
| * | Indexes are unmanaged, do not incur fees or expenses and cannot be purchased directly for investment. |
3
MML Series Investment Fund – Economic and Market Review (Continued)
First quarter of 2010: A ‘mixed’ start to the year
Despite struggling in January and into the early part of February, the U.S. stock market turned in a solid performance during the first three months of 2010. In the bond market, yields of U.S. Treasury securities were lower, and prices higher, for most of the first quarter. Bond prices move in the opposite direction of interest rates (or yields); when yields rise, the prices of existing bonds fall – and vice versa.
Concerns over the sovereign debt problems of Greece, Portugal, Italy, Ireland, and Spain hindered U.S. and foreign stock performance early in the quarter, but efforts by the European Union to find a sustainable solution helped the markets rally in February and March. These debt concerns increased the attractiveness of the U.S. dollar, which rose against the euro and other key foreign currencies.
Financial news for the quarter was decidedly mixed. On the positive side, the final estimate for fourth-quarter 2009 GDP came in at a healthy 5.6%, and fourth-quarter 2009 corporate earnings benefited from aggressive cost-cutting and favorable comparisons with the weak fourth quarter of 2008. Unemployment, at 9.7% for February, remained stubbornly high, and the residential real estate market remained hampered by a large supply of homes for sale, weak demand and widespread borrower defaults. On the bright side, U.S. corporate earnings reports were generally strong.
Second quarter of 2010 marred by stock market downturn, mixed economic indicators
U.S. and foreign stock markets pulled back sharply during the second quarter of 2010 – after a vigorous rally that had lasted more than 13 months. This selloff was largely due to deepening fears about the European debt crisis as well as growing concerns about a possible double-dip recession in the United States. The April 20 explosion of the BP-licensed Deepwater Horizon oil-drilling rig and the resulting oil spill contributed to the uncertainty of the economic environment and held the media’s attention until the spill was stopped and the well capped later in the summer. May was especially challenging, with most of the major indexes giving up substantial ground. May 6 was particularly memorable, when the Dow, down more than 300 points already for the day, dropped more than 600 additional points and recovered most of the additional loss in about 20 minutes in what was subsequently termed a “flash crash” by market pundits (due to the market’s quick descent and recovery). The flash crash set a Dow record for the largest-ever intraday decline: almost 1,000 points.
During this period, bonds responded well to signs that the U.S. economy might be facing slower growth than previously expected. Treasury yields dropped sharply and prices posted healthy advances, with the largest gains occurring in longer maturities. The U.S. dollar continued to appreciate, and emerging markets equities suffered shallower declines than most developed markets. Economic data releases pointed to a still-expanding, but fragile, U.S. economy. In June, the third and final estimate of GDP growth for the first quarter was revised downward to 2.7% from 3.0%. Also noteworthy was the unemployment rate, which remained at 9.7%.
Third quarter of 2010: Stocks rebound; recession officially ‘ends’
U.S. stocks delivered solid gains in the third quarter of 2010, although the up-down-up pattern of the major indexes left many investors perplexed. Solid second-quarter earnings and economic reports that were not as bad as expected helped fuel the advance. Bond prices rose, and yields of U.S. Treasury securities continued the precipitous decline that began in April, taking the yield of the bellwether 10-year note from 2.97% at the end of the second quarter down to 2.53% at the end of the third quarter. The yield of the 10-year note is an important factor in determining mortgage rates, so the historically low rates drove significant mortgage refinancing activity.
The U.S. economy had expanded in the second quarter of 2010, but at a slower pace than in the first quarter, so the Commerce Department’s final estimate of second-quarter GDP released in the third quarter was a tepid 1.7% on an annualized basis. The third quarter’s report on unemployment, released at the beginning of September, revealed a jobless rate of 9.6%. Concern about the euro zone’s sovereign debt crisis eased further, as Spain’s issuance of 6 billion euros of debt at the beginning of July met strong demand and offered better-than-expected pricing. The U.S. dollar weakened against most key developed market currencies. Finally, in September, the National Bureau of Economic Research issued a statement identifying June 2009 as the end of the Great Recession (which began in December 2007) – a conclusion that was questioned by many, since so many economic problems remained unresolved.
4
MML Series Investment Fund – Economic and Market Review (Continued)
Fourth quarter of 2010: Signs of recovery continue
The stock market continued its upward march in the final quarter of the year – although November proved challenging for most domestic equities. Equity markets regained momentum in December; all broad domestic stock indexes advanced for the quarter and turned in double-digit returns for the full year. Conversely, bonds struggled during the fourth quarter of 2010. After falling precipitously for much of the year, yields in the Treasury market reversed course and surged higher from early October through mid-December, pressuring bond prices. For example, the yield of the bellwether 10-year Treasury note rose from 2.52% to 3.31% during the quarter. As a result, most bond indexes finished the quarter with losses, with the longer maturities suffering the most. Losses in corporate bonds were cushioned somewhat by growing optimism about the U.S. economy and corporate profits. High-yield bonds, which tend to correlate more with the fortunes of the issuing company or the issuer’s industry, rather than interest rates, managed solid gains for the quarter.
Although the extension of the Bush-era tax cuts passed by Congress in December – a legislative package estimated to be worth $858 billion – undoubtedly helped the stock market to finish the year on a positive note, it may also be that the Fed’s decision to engage in another round of quantitative easing – referred to as “QE2” – was the main driver of the financial markets during the second half of 2010.
Formally announced on November 3, 2010, QE2 included plans for the Fed to purchase $600 billion of longer-term Treasuries, at a pace of roughly $75 billion per month, by the end of the second quarter of 2011. The plan also called for the reinvestment of $250 billion to $300 billion of proceeds from earlier investments. The stated goal of QE2, as characterized in the Fed’s minutes released on November 3, was to “promote a stronger pace of economic recovery and to help insure that inflation, over time, is at levels consistent with [the Fed’s] mandate.”
While 2010 ended on a positive note, the U.S. economy must still prove itself in 2011. Specifically, investors will be watching to see if the economy can generate enough momentum to meaningfully reduce unemployment and begin to heal the battered residential real estate market. For long-term investors, as always, the challenge is staying disciplined amid constantly shifting markets and avoiding the temptation to buy or sell based on short-term developments.
The information provided is the opinion of MassMutual Retirement Services Investment Services as of 1/1/11 and is subject to change without notice. It is not to be construed as tax, legal or investment advice. Of course, past performance does not guarantee future results.
5
MML Fundamental Value Fund – Portfolio Manager Report
What is the investment approach of MML Fundamental Value Fund, and who is the Fund’s subadviser?
The Fund seeks long-term total return by investing primarily in equity securities of issuers that the Fund’s subadviser believes are undervalued. Under normal circumstances, the Fund invests at least 80% of its net assets in equity securities. The Fund’s subadviser is Wellington Management Company, LLP (Wellington Management).
How did the Fund perform since its inception on August 10, 2010?
The Fund’s Class II shares returned 11.59%, significantly underperforming the 19.12%* return of the Russell 1000® Value Index (the “benchmark”), an unmanaged index consisting of those Russell 1000 securities (representing the 1,000 largest U.S. companies, based on market capitalization) with greater than average value orientation that tend to exhibit lower price-to-book ratios and lower forecasted growth rates than securities in the growth universe.
For a discussion on the economic and market environment during the 12-month period ended December 31, 2010, please see the Economic and Market Review, beginning on page 3.
Subadviser discussion of factors that contributed to the Fund’s performance
Equities generally posted broad gains during the third quarter of 2010, as the prospect of further quantitative easing in the U.S., combined with surging Chinese factory orders and a strengthening German labor market, helped subdue concerns about a double-dip global recession. The Fund’s performance for the period was driven by both stock selection and allocation among sectors. The portfolio’s underweight position, relative to the benchmark, in financials and overweight stakes in the energy and materials sectors contributed to performance. Within materials, exposure to fertilizer companies Agrium and Mosaic as well as iron ore miner Cliffs Natural Resources contributed to relative results, while portfolio positions in capital goods companies Cummins, PACCAR, and Textron bolstered returns in the industrials sector. Toolmaker Stanley Black & Decker, media company CBS, and auto manufacturer Ford were performance drivers in the consumer discretionary sector. Conversely, within energy, independent exploration and production companies EOG Resources and Southwestern Energy – as well as energy and chemicals company Occidental Petroleum – detracted. Also hampering the Fund’s relative results in the third quarter were portfolio positions in the information technology sector – specifically, hardware companies Hewlett-Packard and Cisco Systems, as well as semiconductor manufacturer Intel.
The implementation of further quantitative easing in the U.S., strong corporate earnings, and improving economic news out of Germany and the U.S. all served to support stocks in the fourth quarter of 2010. The Fund’s performance during the period was driven, once again, by sector allocation, although stock selection was slightly positive for the quarter. The portfolio’s exposure to asset manager BlackRock and banking concern Wells Fargo, along with not owning the falling shares of Berkshire Hathaway, bolstered results in financials as the year wound down. In addition, fertilizer companies CF Industries and Mosaic and steel producer Steel Dynamics were additive in the materials sector – and positions in automotive companies Ford and General Motors, along with exposure to media firms Comcast and CBS, contributed to the portfolio’s performance within the consumer discretionary sector. On the downside, within energy, the Fund’s relative performance was hurt by independent oil and gas company EOG Resources and by an underweight position in Anadarko, shares of which rose during the quarter. Several benchmark names not held in the portfolio also posted sharp gains, further detracting from relative returns. Hampering the Fund’s results in the consumer staples sector were food and beverage producers and distributors – specifically, Dean Foods, PepsiCo, and Sysco.
Subadviser outlook
In our view, strong earnings growth is likely to continue and the private sector is primed to resume its economic leadership as government stimulus packages begin to wind down, thereby improving the overall quality of growth. Third-quarter earnings growth was robust globally, and despite the implementation of a second round of quantitative easing in the U.S., government stimulus spending will diminish somewhat in 2011. We believe U.S. growth could surprise to the upside in 2011, with a positive implication for profits, capital spending, and jobs. Global growth continues to recover, led by emerging markets, but with increasing contributions from developed economies. Emerging market growth still remains a key component of global economic
| * | For the reporting period from September 1 – December 31, 2010. |
6
MML Fundamental Value Fund – Portfolio Manager Report (Continued)
expansion and although emerging markets inflation is rising, our belief is that it does not appear to be out of control. Policy risk remains a key concern, particularly in three areas: Europe (the mechanism for crisis resolution), the U.S. (long-term debt reduction contrasted against potential further gridlock), and China (targeted tightening in the face of rising inflationary pressures). We will monitor developments in these areas closely as 2011 progresses.
While macroeconomic trends inform our process, buy and sell decisions ultimately are driven by company fundamentals. We continue to focus our efforts on maximizing the Fund’s overall growth and dividend yield while minimizing valuation metrics. Based on bottom-up stock decisions, as 2011 began, the portfolio’s largest overweight positions were in the IT, consumer discretionary, and materials sectors – with the largest underweight allocations in utilities, financials, and consumer staples.
| | | | |
MML Fundamental Value Fund
Largest Holdings
(% of Net Assets) on 12/31/10
(Unaudited) | |
| | |
Wells Fargo & Co. | | | 3.6 | % |
JP Morgan Chase & Co. | | | 3.1 | % |
Chevron Corp. | | | 3.0 | % |
AT&T, Inc. | | | 2.9 | % |
Pfizer, Inc. | | | 2.4 | % |
General Electric Co. | | | 2.4 | % |
Occidental Petroleum Corp. | | | 2.2 | % |
PNC Financial Services Group, Inc. | | | 2.1 | % |
ACE Ltd. | | | 2.0 | % |
Ingersoll-Rand PLC | | | 1.8 | % |
| | | | | |
| | | | 25.5 | % |
| | | | | |
| | | | |
MML Fundamental Value Fund
Sector Table
(% of Net Assets) on 12/31/10
(Unaudited) | |
| | |
Financial | | | 22.9 | % |
Consumer, Non-cyclical | | | 17.6 | % |
Energy | | | 12.9 | % |
Industrial | | | 12.6 | % |
Consumer, Cyclical | | | 9.0 | % |
Technology | | | 7.5 | % |
Communications | | | 7.4 | % |
Basic Materials | | | 6.0 | % |
Utilities | | | 3.0 | % |
| | | | | |
Total Long-Term Investments | | | 98.9 | % |
Short-Term Investments and Other Assets and Liabilities | | | 1.1 | % |
| | | | | |
Net Assets | | | 100.0 | % |
| | | | | |
7
MML Fundamental Value Fund – Portfolio Manager Report (Continued)
Growth of a $10,000 Investment
Hypothetical Investments in MML Fundamental Value Fund Class II and the Russell 1000 Value Index.
| | | | |
| | |
| TOTAL RETURN | | Since
Inception
8/10/10 -
12/31/10 | |
| Class II | | | 11.59% | |
| Russell 1000 Value Index | | | 19.12%+ | |
GROWTH OF $10,000 INVESTMENT SINCE INCEPTION
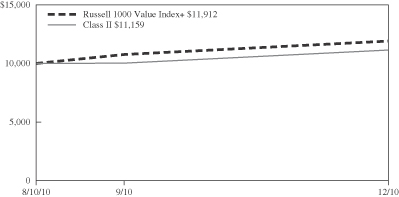
+ From 9/1/10.
Performance data quoted represents past performance; past performance is not predictive of future results. The investment return and principal value of shares of the Fund will fluctuate with market conditions so that shares of the Fund, when redeemed, may be worth more or less than their original cost. Current performance of the Fund may be lower or higher than the performance quoted. Performance data current to the most recent month end may be obtained by accessing the website www.massmutual.com.
Investors should note that the Fund is a professionally managed mutual fund, while the Russell 1000 Value Index is unmanaged, does not incur expenses, and cannot be purchased directly by investors. Investors should read the Fund’s prospectus with regard to the Fund’s investment objective, risks and charges and expenses in conjunction with these financial statements. The Fund’s return reflects changes in the net asset value per share without the deduction of any product charges (e.g., cost of insurance, mortality and expense risk charges, administrative fees, and CDSL). The inclusion of these charges would have reduced the performance shown here.
8
MML PIMCO Total Return Fund – Portfolio Manager Report
What is the investment approach of MML PIMCO Total Return Fund, and who is the Fund’s subadviser?
The Fund seeks maximum total return, consistent with preservation of capital and prudent investment management, by investing, under normal circumstances, at least 65% of its total assets in a diversified portfolio of fixed income securities and other debt instruments of domestic and foreign entities. The Fund’s subadviser is Pacific Investment Management Company LLC (PIMCO).
How did the Fund perform since its inception on August 10, 2010?
The Fund’s Class II shares returned 0.17%, outperforming the -1.19%* return of the Barclays Capital U.S. Aggregate Bond Index (the “benchmark”), an unmanaged index of fixed-rate investment-grade securities with at least one year to maturity, combining the Barclays Capital U.S. Treasury Bond Index, the Barclays Capital U.S. Government-Related Bond Index, the Barclays Capital U.S. Corporate Bond Index, and the Barclays Capital U.S. Securitized Bond Index.
For a discussion on the economic and market environment during the 12-month period ended December 31, 2010, please see the Economic and Market Review, beginning on page 3.
Subadviser discussion of factors that contributed to the Fund’s performance
An overweight position in agency mortgage-backed securities (“MBS”), which outperformed comparable Treasuries since the portfolio’s inception, was positive for performance, as higher mortgage rates later in the year tended to mute prepayment risk and helped mortgages’ relative returns. An underweight position, relative to the benchmark, in investment-grade corporate securities detracted from performance, as this sector outperformed comparable Treasuries as corporate credit fundamentals improved – although a focus on financials helped offset this negative contribution.
Tactical duration positioning in the U.S. hampered the Fund’s performance, as rates rose from August to December 2010. The portfolio’s exposure to euro dollar futures also hindered the Fund’s results, as prices fell across most money market futures contracts in the last quarter of the year. Duration is a measure of a bond or bond portfolio’s sensitivity to interest rates. The longer the duration, the greater the price impact to the bond or portfolio when interest rates rise or fall. Conversely, a curve steepening position in the U.S. added to returns, as the yield curve steepened during the last five months of 2010. The yield curve is a graphical representation of bond yields with very short maturities to the longest available, with the curve indicating whether short-term rates are higher or lower than long-term rates.
Beyond core sectors, an overweight in emerging-market local bonds, implemented via Brazilian zero coupon swaps, proved negative for returns, as rates rose during the last five months of 2010. Exposure to a variety of foreign currencies, with an emphasis on the Brazilian real and a basket of Asian currencies, appreciated relative to the U.S. dollar and contributed to the Fund’s progress during the period. Additionally, exposure to Treasury Inflation-Protected Securities (“TIPS”) was positive for returns, as breakeven inflation levels (the yield differential between nominal Treasuries and TIPS) for TIPS widened since the portfolio’s inception – a sign that the Federal Reserve’s (the “Fed”) QE2 (i.e., the second round of the Fed’s quantitative easing) was having some success. A modest exposure to Build America Bonds (BAB) issues detracted from returns, as taxable municipal supply spiked amid the rush by local governments to tap the federal government subsidy before it expires at the end of 2011.
Subadviser outlook
PIMCO’s global cyclical forecast calls for differentiated growth and inflation across regions in 2011. Strong growth and the potential for rising inflation in emerging economies will likely be offset by weaker growth in most developed economies, especially peripheral Europe. In our view, the tax compromise between the Obama administration and Congress – especially the payroll tax cut and business tax credit – should boost U.S. growth over a cyclical time frame. We believe that the potential failure of policy coordination in Europe poses significant risks to the entire global economy, as one or more sovereign defaults could give rise to a banking crisis with broad systemic consequences. In addition, our opinion is that China and most other emerging markets should enjoy faster growth than the developed world, as slowing exports are likely to be offset by continued growth in domestic demand.
| * | For the reporting period from September 1 – December 31, 2010. |
9
MML PIMCO Total Return Fund – Portfolio Manager Report (Continued)
| | | | |
MML PIMCO Total Return Fund Quality Structure
(% of Net Assets) on 12/31/10
(Unaudited) | |
| | |
U.S. Government, Aaa/AAA | | | 89.3 | % |
Aa/AA | | | 2.8 | % |
A/A | | | 4.0 | % |
Baa/BBB | | | 13.3 | % |
Ba/BB | | | 4.4 | % |
B and Below | | | 5.8 | % |
| | | | | |
Total Long-Term Investments | | | 119.6 | % |
Short-Term Investments and Other Assets and Liabilities | | | (19.6 | )% |
| | | | | |
Net Assets | | | 100.0 | % |
| | | | | |
Securities Sold Short | | | (3.7 | )% |
| | | | | |
10
MML PIMCO Total Return Fund – Portfolio Manager Report (Continued)
Growth of a $10,000 Investment
Hypothetical Investments in MML PIMCO Total Return Fund Class II and the Barclays Capital U.S. Aggregate Bond Index.
| | | | |
| | |
| TOTAL RETURN | | Since
Inception
8/10/10 -
12/31/10 | |
| Class II | | | 0.17% | |
| Barclays Capital U.S. Aggregate Bond Index | | | -1.19%+ | |
GROWTH OF $10,000 INVESTMENT SINCE INCEPTION
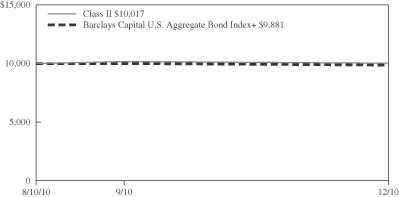
+ From 9/1/10.
Performance data quoted represents past performance; past performance is not predictive of future results. The investment return and principal value of shares of the Fund will fluctuate with market conditions so that shares of the Fund, when redeemed, may be worth more or less than their original cost. Current performance of the Fund may be lower or higher than the performance quoted. Performance data current to the most recent month end may be obtained by accessing the website www.massmutual.com.
Investors should note that the Fund is a professionally managed mutual fund, while the Barclays Capital U.S. Aggregate Bond Index is unmanaged, does not incur expenses, and cannot be purchased directly by investors. Investors should read the Fund’s prospectus with regard to the Fund’s investment objective, risks and charges and expenses in conjunction with these financial statements. The Fund’s return reflects changes in the net asset value per share without the deduction of any product charges (e.g., cost of insurance, mortality and expense risk charges, administrative fees, and CDSL). The inclusion of these charges would have reduced the performance shown here.
11
MML Fundamental Value Fund – Portfolio of Investments
December 31, 2010
| | | | | | | | |
| | | Number of
Shares | | | Value | |
| EQUITIES — 98.9% | | | | | | | | |
| |
| COMMON STOCK — 98.9% | | | | | |
| Aerospace & Defense — 1.0% | | | | | |
The Boeing Co. | | | 18,940 | | | $ | 1,236,024 | |
| | | | | | | | |
| Agriculture — 1.1% | | | | | | | | |
Philip Morris International, Inc. | | | 24,820 | | | | 1,452,715 | |
| | | | | | | | |
| Auto Manufacturers — 1.4% | | | | | |
General Motors Co. (a) | | | 16,400 | | | | 604,504 | |
Paccar, Inc. | | | 20,720 | | | | 1,189,742 | |
| | | | | | | | |
| | | | | | | 1,794,246 | |
| | | | | | | | |
| Banks — 9.4% | | | | | | | | |
Bank of America Corp. | | | 143,140 | | | | 1,909,488 | |
Bank of New York Mellon Corp. | | | 44,630 | | | | 1,347,826 | |
PNC Financial Services Group, Inc. | | | 43,800 | | | | 2,659,536 | |
U.S. Bancorp | | | 53,200 | | | | 1,434,804 | |
Wells Fargo & Co. | | | 147,670 | | | | 4,576,293 | |
| | | | | | | | |
| | | | | | | 11,927,947 | |
| | | | | | | | |
| Beverages — 2.1% | | | | | | | | |
Molson Coors Brewing Co. Class B | | | 24,520 | | | | 1,230,659 | |
PepsiCo, Inc. | | | 22,620 | | | | 1,477,764 | |
| | | | | | | | |
| | | | | | | 2,708,423 | |
| | | | | | | | |
| Biotechnology — 1.1% | | | | | | | | |
Amgen, Inc. (a) | | | 24,230 | | | | 1,330,227 | |
| | | | | | | | |
| Chemicals — 4.2% | | | | | | | | |
CF Industries Holdings, Inc. | | | 8,300 | | | | 1,121,745 | |
The Dow Chemical Co. | | | 45,090 | | | | 1,539,372 | |
E.I. du Pont de Nemours & Co. | | | 25,300 | | | | 1,261,964 | |
The Mosaic Co. | | | 18,560 | | | | 1,417,242 | |
| | | | | | | | |
| | | | | | | 5,340,323 | |
| | | | | | | | |
| Computers — 0.8% | | | | | | | | |
Hewlett-Packard Co. | | | 25,520 | | | | 1,074,392 | |
| | | | | | | | |
| Diversified Financial — 6.9% | | | | | |
BlackRock, Inc. | | | 7,500 | | | | 1,429,350 | |
Credit Suisse Group Sponsored ADR (Switzerland) | | | 28,950 | | | | 1,169,869 | |
The Goldman Sachs Group, Inc. | | | 13,080 | | | | 2,199,533 | |
JP Morgan Chase & Co. | | | 91,980 | | | | 3,901,792 | |
| | | | | | | | |
| | | | | | | 8,700,544 | |
| | | | | | | | |
| Electric — 3.0% | | | | | | | | |
Edison International | | | 28,370 | | | | 1,095,082 | |
Entergy Corp. | | | 17,220 | | | | 1,219,693 | |
NextEra Energy, Inc. | | | 8,890 | | | | 462,191 | |
Northeast Utilities | | | 33,860 | | | | 1,079,457 | |
| | | | | | | | |
| | | | | | | 3,856,423 | |
| | | | | | | | |
| Environmental Controls — 0.9% | | | | | |
Waste Management, Inc. | | | 32,440 | | | | 1,196,063 | |
| | | | | | | | |
| | | | | | | | |
| | | Number of
Shares | | | Value | |
| Foods — 2.8% | | | | | | | | |
General Mills, Inc. | | | 16,540 | | | $ | 588,659 | |
Kraft Foods, Inc. Class A | | | 46,710 | | | | 1,471,832 | |
Sysco Corp. | | | 50,340 | | | | 1,479,996 | |
| | | | | | | | |
| | | | | | | 3,540,487 | |
| | | | | | | | |
| Hand & Machine Tools — 1.8% | | | | | |
Stanley Black & Decker, Inc. | | | 33,380 | | | | 2,232,121 | |
| | | | | | | | |
| Health Care – Products — 3.7% | | | | | |
Baxter International, Inc. | | | 26,040 | | | | 1,318,145 | |
Covidien PLC | | | 29,360 | | | | 1,340,577 | |
Johnson & Johnson | | | 20,780 | | | | 1,285,243 | |
Zimmer Holdings, Inc. (a) | | | 13,250 | | | | 711,260 | |
| | | | | | | | |
| | | | | | | 4,655,225 | |
| | | | | | | | |
| Health Care – Services — 1.1% | | | | | |
UnitedHealth Group, Inc. | | | 39,860 | | | | 1,439,345 | |
| | | | | | | | |
| Insurance — 6.6% | | | | | | | | |
ACE Ltd. | | | 41,640 | | | | 2,592,090 | |
The Chubb Corp. | | | 26,320 | | | | 1,569,725 | |
Marsh & McLennan Cos., Inc. | | | 67,470 | | | | 1,844,630 | |
Principal Financial Group, Inc. | | | 36,640 | | | | 1,192,998 | |
Unum Group | | | 48,740 | | | | 1,180,483 | |
| | | | | | | | |
| | | | | | | 8,379,926 | |
| | | | | | | | |
| Iron & Steel — 1.8% | | | | | | | | |
Nucor Corp. | | | 13,300 | | | | 582,806 | |
Steel Dynamics, Inc. | | | 89,950 | | | | 1,646,085 | |
| | | | | | | | |
| | | | | | | 2,228,891 | |
| | | | | | | | |
| Machinery – Construction & Mining — 1.8% | |
Ingersoll-Rand PLC | | | 49,570 | | | | 2,334,251 | |
| | | | | | | | |
| Manufacturing — 6.7% | | | | | | | | |
3M Co. | | | 14,250 | | | | 1,229,775 | |
General Electric Co. | | | 168,180 | | | | 3,076,012 | |
Illinois Tool Works, Inc. | | | 18,960 | | | | 1,012,464 | |
Textron, Inc. | | | 54,010 | | | | 1,276,796 | |
Tyco International Ltd. | | | 44,670 | | | | 1,851,125 | |
| | | | | | | | |
| | | | | | | 8,446,172 | |
| | | | | | | | |
| Media — 2.6% | | | | | |
CBS Corp. Class B | | | 63,370 | | | | 1,207,198 | |
Comcast Corp. Class A | | | 93,910 | | | | 2,063,203 | |
| | | | | | | | |
| | | | | | | 3,270,401 | |
| | | | | | | | |
| Oil & Gas — 11.6% | | | | | |
Apache Corp. | | | 13,310 | | | | 1,586,951 | |
Chevron Corp. | | | 42,030 | | | | 3,835,238 | |
ConocoPhillips | | | 26,680 | | | | 1,816,908 | |
EOG Resources, Inc. | | | 8,310 | | | | 759,617 | |
Exxon Mobil Corp. | | | 22,960 | | | | 1,678,835 | |
Marathon Oil Corp. | | | 34,960 | | | | 1,294,569 | |
Occidental Petroleum Corp. | | | 28,410 | | | | 2,787,021 | |
The accompanying notes are an integral part of the financial statements.
12
MML Fundamental Value Fund – Portfolio of Investments (Continued)
| | | | | | | | |
| | | Number of
Shares | | | Value | |
Southwestern Energy Co. (a) | | | 24,210 | | | $ | 906,180 | |
| | | | | | | | |
| | | | | | | 14,665,319 | |
| | | | | | | | |
| Oil & Gas Services — 1.3% | | | | | |
Baker Hughes, Inc. | | | 29,120 | | | | 1,664,790 | |
| | | | | | | | |
| Packaging & Containers — 0.5% | | | | | |
Rexam PLC Sponsored ADR (United Kingdom) | | | 22,900 | | | | 591,049 | |
| | | | | | | | |
| Pharmaceuticals — 5.7% | | | | | |
Abbott Laboratories | | | 21,600 | | | | 1,034,856 | |
Merck & Co., Inc. | | | 39,640 | | | | 1,428,626 | |
Pfizer, Inc. | | | 175,750 | | | | 3,077,383 | |
Teva Pharmaceutical Industries Ltd. Sponsored ADR (Israel) | | | 30,980 | | | | 1,614,987 | |
| | | | | | | | |
| | | | | | | 7,155,852 | |
| | | | | | | | |
| Retail — 6.4% | | | | | |
CVS Caremark Corp. | | | 48,880 | | | | 1,699,558 | |
The Home Depot, Inc. | | | 40,490 | | | | 1,419,579 | |
Kohl’s Corp. (a) | | | 32,430 | | | | 1,762,246 | |
Nordstrom, Inc. | | | 13,400 | | | | 567,892 | |
Staples, Inc. | | | 48,560 | | | | 1,105,711 | |
Target Corp. | | | 26,680 | | | | 1,604,269 | |
| | | | | | | | |
| | | | | | | 8,159,255 | |
| | | | | | | | |
| Semiconductors — 5.2% | | | | | |
Analog Devices, Inc. | | | 37,100 | | | | 1,397,557 | |
Intel Corp. | | | 85,020 | | | | 1,787,970 | |
Maxim Integrated Products, Inc. | | | 38,230 | | | | 902,993 | |
Taiwan Semiconductor Manufacturing Co. Ltd. Sponsored ADR (Taiwan) | | | 76,750 | | | | 962,445 | |
Xilinx, Inc. | | | 51,500 | | | | 1,492,470 | |
| | | | | | | | |
| | | | | | | 6,543,435 | |
| | | | | | | | |
| Software — 1.5% | | | | | |
Microsoft Corp. | | | 66,800 | | | | 1,865,056 | |
| | | | | | | | |
| Telecommunications — 4.8% | | | | | |
AT&T, Inc. | | | 124,200 | | | | 3,648,996 | |
Cisco Systems, Inc. (a) | | | 67,780 | | | | 1,371,189 | |
QUALCOMM, Inc. | | | 21,230 | | | | 1,050,673 | |
| | | | | | | | |
| | | | | | | 6,070,858 | |
| | | | | | | | |
| Toys, Games & Hobbies — 1.1% | | | | | |
Mattel, Inc. | | | 55,430 | | | | 1,409,585 | |
| | | | | | | | |
| | |
TOTAL COMMON STOCK
(Cost $113,552,620) | | | | | | | 125,269,345 | |
| | | | | | | | |
| | |
TOTAL EQUITIES
(Cost $113,552,620) | | | | | | | 125,269,345 | |
| | | | | | | | |
| | |
TOTAL LONG-TERM INVESTMENTS
(Cost $113,552,620) | | | | | | | 125,269,345 | |
| | | | | | | | |
| | | | | | | | |
| | | Principal
Amount | | | Value | |
| SHORT-TERM INVESTMENTS — 1.0% | | | | | |
| Repurchase Agreement — 1.0% | | | | | |
State Street Bank & Trust Co. Repurchase Agreement, dated 12/31/10, 0.010%, due 1/03/11 (b) | | $ | 1,322,378 | | | $ | 1,322,378 | |
| | | | | | | | |
| | |
TOTAL SHORT-TERM INVESTMENTS
(Cost $1,322,378) | | | | | | | 1,322,378 | |
| | | | | | | | |
| | |
TOTAL INVESTMENTS — 99.9%
(Cost $114,874,998) (c) | | | | | | | 126,591,723 | |
| | |
| Other Assets/(Liabilities) — 0.1% | | | | | | | 98,874 | |
| | | | | | | | |
| | |
| NET ASSETS — 100.0% | | | | | | $ | 126,690,597 | |
| | | | | | | | |
Notes to Portfolio of Investments
| ADR | American Depositary Receipt |
| (a) | Non-income producing security. |
| (b) | Maturity value of $1,322,380. Collateralized by U.S. Government Agency obligations with a rate of 4.000%, maturity date of 12/25/38, and an aggregate market value, including accrued interest, of $1,352,162. |
| (c) | See Note 6 for aggregate cost for federal tax purposes. |
The accompanying notes are an integral part of the financial statements.
13
MML PIMCO Total Return Fund – Portfolio of Investments
December 31, 2010
| | | | | | | | |
| | | Principal
Amount | | | Value | |
| BONDS & NOTES — 119.6% | | | | | |
| |
| CORPORATE DEBT — 38.7% | | | | | |
| Agriculture — 0.1% | | | | | | | | |
Altria Group, Inc.
7.750% 2/06/14 | | $ | 100,000 | | | $ | 114,960 | |
| | | | | | | | |
| Banks — 3.3% | | | | | |
Bank of India
4.750% 9/30/15 | | | 200,000 | | | | 203,626 | |
Bank of Nova Scotia (a)
1.650% 10/29/15 | | | 100,000 | | | | 95,588 | |
Cie de Financement Foncier (a)
2.125% 4/22/13 | | | 1,000,000 | | | | 1,008,509 | |
Citibank NA
1.750% 12/28/12 | | | 100,000 | | | | 102,023 | |
GMAC, Inc.
7.500% 12/31/13 | | | 100,000 | | | | 107,250 | |
HBOS PLC FRN EUR (b)
1.189% 3/29/16 | | | 2,100,000 | | | | 2,416,947 | |
Santander US Debt SA Unipersonal (a)
2.991% 10/07/13 | | | 200,000 | | | | 194,294 | |
State Bank of India (a)
4.500% 7/27/15 | | | 300,000 | | | | 306,680 | |
| | | | | | | | |
| | | | | | | 4,434,917 | |
| | | | | | | | |
| Biotechnology — 0.5% | | | | | |
Amgen, Inc., Convertible
0.125% 2/01/11 | | | 700,000 | | | | 699,125 | |
| | | | | | | | |
| Building Materials — 0.2% | | | | | |
Corporacion GEO SAB de CV (a)
8.875% 9/25/14 | | | 200,000 | | | | 224,500 | |
| | | | | | | | |
| Chemicals — 0.1% | | | | | |
Lyondell Chemical Co. (a)
8.000% 11/01/17 | | | 179,000 | | | | 198,019 | |
| | | | | | | | |
| Coal — 0.2% | | | | | |
Arch Western Finance LLC
6.750% 7/01/13 | | | 200,000 | | | | 202,000 | |
| | | | | | | | |
| Diversified Financial — 26.4% | | | | | |
Ally Financial, Inc. (a)
7.500% 9/15/20 | | | 1,000,000 | | | | 1,048,750 | |
American Express Credit Corp.
5.875% 5/02/13 | | | 595,000 | | | | 647,085 | |
American General Finance Corp. EUR (b)
4.125% 11/29/13 | | | 1,500,000 | | | | 1,679,602 | |
CIT Group, Inc.
7.000% 5/01/15 | | | 200,000 | | | | 200,500 | |
Countrywide Financial Corp.
5.800% 6/07/12 | | | 700,000 | | | | 736,468 | |
Federal Home Loan Banks
0.875% 8/22/12 | | | 500,000 | | | | 503,360 | |
Federal Home Loan Banks
0.875% 12/27/13 | | | 100,000 | | | | 98,950 | |
| | | | | | | | |
| | | Principal
Amount | | | Value | |
Federal Home Loan Banks
3.125% 12/13/13 | | $ | 500,000 | | | $ | 527,974 | |
Federal Home Loan Mortgage Corp.
0.515% 11/26/12 | | | 100,000 | | | | 99,772 | |
Federal Home Loan Mortgage Corp.
0.875% 10/28/13 | | | 2,400,000 | | | | 2,384,154 | |
Federal Home Loan Mortgage Corp.
1.000% 8/28/12 | | | 400,000 | | | | 402,367 | |
Federal Home Loan Mortgage Corp.
1.750% 9/10/15 | | | 200,000 | | | | 196,568 | |
Federal Home Loan Mortgage Corp.
3.000% 7/28/14 | | | 100,000 | | | | 105,240 | |
Federal Home Loan Mortgage Corp.
3.500% 5/29/13 | | | 100,000 | | | | 106,216 | |
Federal Home Loan Mortgage Corp.
3.625% 10/18/13 | | | 200,000 | | | | 213,868 | |
Federal Home Loan Mortgage Corp.
4.125% 9/27/13 | | | 100,000 | | | | 108,165 | |
Federal Home Loan Mortgage Corp.
4.375% 7/17/15 | | | 2,200,000 | | | | 2,420,226 | |
Federal Home Loan Mortgage Corp.
4.500% 1/15/14 | | | 300,000 | | | | 329,191 | |
Federal Home Loan Mortgage Corp.
5.000% 7/15/14 | | | 100,000 | | | | 112,049 | |
Federal Home Loan Mortgage Corp.
5.000% 2/16/17 | | | 100,000 | | | | 112,732 | |
Federal Home Loan Mortgage Corp.
5.250% 4/18/16 | | | 200,000 | | | | 228,020 | |
Federal Home Loan Mortgage Corp.
5.500% 7/18/16 | | | 900,000 | | | | 1,037,745 | |
Federal National Mortgage Association
0.375% 12/28/12 | | | 300,000 | | | | 298,556 | |
Federal National Mortgage Association
0.500% 10/30/12 | | | 100,000 | | | | 99,696 | |
Federal National Mortgage Association
0.500% 10/30/12 | | | 400,000 | | | | 398,784 | |
Federal National Mortgage Association
0.750% 12/18/13 | | | 4,600,000 | | | | 4,545,470 | |
Federal National Mortgage Association
1.000% 12/27/12 | | | 1,600,000 | | | | 1,612,002 | |
Federal National Mortgage Association
1.000% 9/23/13 | | | 200,000 | | | | 199,694 | |
Federal National Mortgage Association
1.125% 9/30/13 | | | 100,000 | | | | 100,158 | |
Federal National Mortgage Association
1.250% 8/20/13 | | | 300,000 | | | | 301,984 | |
Federal National Mortgage Association (c)
1.625% 10/26/15 | | | 8,600,000 | | | | 8,380,344 | |
Federal National Mortgage Association
2.875% 12/11/13 | | | 100,000 | | | | 105,015 | |
Federal National Mortgage Association
3.000% 9/16/14 | | | 100,000 | | | | 105,132 | |
The accompanying notes are an integral part of the financial statements.
14
MML PIMCO Total Return Fund – Portfolio of Investments (Continued)
| | | | | | | | |
| | | Principal
Amount | | | Value | |
Federal National Mortgage Association
4.125% 4/15/14 | | $ | 200,000 | | | $ | 217,737 | |
Federal National Mortgage Association
4.375% 3/15/13 | | | 200,000 | | | | 215,606 | |
Federal National Mortgage Association
4.375% 10/15/15 | | | 500,000 | | | | 549,253 | |
Federal National Mortgage Association
5.000% 3/15/16 | | | 1,500,000 | | | | 1,690,055 | |
Federal National Mortgage Association
5.000% 2/13/17 | | | 100,000 | | | | 112,776 | |
Federal National Mortgage Association
5.375% 6/12/17 | | | 100,000 | | | | 114,848 | |
Ford Motor Credit Co. FRN
3.039% 1/13/12 | | | 200,000 | | | | 201,760 | |
Ford Motor Credit Co.
5.625% 9/15/15 | | | 1,200,000 | | | | 1,242,577 | |
Ford Motor Credit Co.
7.000% 10/01/13 | | | 100,000 | | | | 107,210 | |
Ford Motor Credit Co.
7.800% 6/01/12 | | | 100,000 | | | | 106,313 | |
General Electric Capital Corp.
2.000% 9/28/12 | | | 100,000 | | | | 102,145 | |
General Electric Capital Corp.
2.125% 12/21/12 | | | 100,000 | | | | 102,744 | |
International Lease Finance Corp.
5.750% 6/15/11 | | | 200,000 | | | | 201,000 | |
International Lease Finance Corp. (a)
6.750% 9/01/16 | | | 600,000 | | | | 640,500 | |
| | | | | | | | |
| | | | | | | 35,050,361 | |
| | | | | | | | |
| Electric — 0.7% | | | | | |
Duquesne Light Holdings, Inc. (a)
6.400% 9/15/20 | | | 100,000 | | | | 99,256 | |
Entergy Corp.
3.625% 9/15/15 | | | 100,000 | | | | 98,907 | |
Korea Electric Power Corp. (a)
3.000% 10/05/15 | | | 200,000 | | | | 193,163 | |
Korea Hydro & Nuclear Power Co. Ltd. (a)
3.125% 9/16/15 | | | 100,000 | | | | 96,946 | |
Majapahit Holdings BV (d)
7.250% 6/28/17 | | | 100,000 | | | | 113,236 | |
Majapahit Holdings BV (d)
7.750% 10/17/16 | | | 200,000 | | | | 231,358 | |
NRG Energy, Inc. (a)
8.250% 9/01/20 | | | 100,000 | | | | 102,500 | |
| | | | | | | | |
| | | | | | | 935,366 | |
| | | | | | | | |
| Forest Products & Paper — 1.1% | | | | | |
Celulosa Arauco y Constitucion SA (a)
5.000% 1/21/21 | | | 100,000 | | | | 98,271 | |
MeadWestvaco Corp.
6.850% 4/01/12 | | | 1,339,000 | | | | 1,416,476 | |
| | | | | | | | |
| | | | | | | 1,514,747 | |
| | | | | | | | |
| | | | | | | | |
| | | Principal
Amount | | | Value | |
| Health Care – Products — 0.4% | | | | | |
Medtronic, Inc., Convertible
1.500% 4/15/11 | | $ | 500,000 | | | $ | 500,000 | |
| | | | | | | | |
| Holding Company – Diversified — 1.3% | | | | | |
Hutchison Whampoa International Ltd. (a)
6.500% 2/13/13 | | | 1,000,000 | | | | 1,092,131 | |
Noble Group Ltd. (a)
6.625% 8/05/20 | | | 200,000 | | | | 209,472 | |
Noble Group Ltd. (d)
6.750% 1/29/20 | | | 100,000 | | | | 110,752 | |
Noble Group Ltd. (a)
6.750% 1/29/20 | | | 300,000 | | | | 332,257 | |
| | | | | | | | |
| | | | | | | 1,744,612 | |
| | | | | | | | |
| Insurance — 1.4% | | | | | |
American International Group, Inc.
6.400% 12/15/20 | | | 700,000 | | | | 734,446 | |
American International Group, Inc. VRN
8.175% 5/15/38 | | | 1,000,000 | | | | 1,064,809 | |
| | | | | | | | |
| | | | | | | 1,799,255 | |
| | | | | | | | |
| Iron & Steel — 0.2% | | | | | |
CSN Resources SA (a)
6.500% 7/21/20 | | | 200,000 | | | | 211,000 | |
| | | | | | | | |
| Media — 0.8% | | | | | |
COX Communications, Inc.
7.125% 10/01/12 | | | 1,000,000 | | | | 1,096,721 | |
| | | | | | | | |
| Oil & Gas — 1.6% | | | | | |
BP Capital Markets PLC
2.375% 12/14/11 | | | 800,000 | | | | 807,402 | |
Indian Oil Corp. Ltd.
4.750% 1/22/15 | | | 500,000 | | | | 514,587 | |
Petrobras International Finance Co.
5.750% 1/20/20 | | | 400,000 | | | | 415,027 | |
Petrobras International Finance Co.
8.375% 12/10/18 | | | 200,000 | | | | 243,253 | |
Transocean, Inc.
4.950% 11/15/15 | | | 100,000 | | | | 103,346 | |
| | | | | | | | |
| | | | | | | 2,083,615 | |
| | | | | | | | |
| Pipelines — 0.2% | | | | | |
NGPL PipeCo LLC (a)
6.514% 12/15/12 | | | 300,000 | | | | 323,793 | |
| | | | | | | | |
| Real Estate — 0.1% | | | | | |
Qatari Diar Finance QSC (d)
5.000% 7/21/20 | | | 200,000 | | | | 199,050 | |
| | | | | | | | |
| Telecommunications — 0.1% | | | | | |
Qwest Corp.
7.875% 9/01/11 | | | 100,000 | | | | 103,000 | |
| | | | | | | | |
| | |
TOTAL CORPORATE DEBT
(Cost $51,610,174) | | | | | | | 51,435,041 | |
| | | | | | | | |
The accompanying notes are an integral part of the financial statements.
15
MML PIMCO Total Return Fund – Portfolio of Investments (Continued)
| | | | | | | | |
| | | Principal
Amount | | | Value | |
| MUNICIPAL OBLIGATIONS — 2.4% | | | | | |
Bay Area Toll Authority BAB
6.793% 4/01/30 | | $ | 800,000 | | | $ | 802,272 | |
Buckeye Tobacco Settlement Financing Authority
5.875% 6/01/47 | | | 100,000 | | | | 65,720 | |
Los Angeles Community College District BAB
6.600% 8/01/42 | | | 1,000,000 | | | | 1,013,360 | |
Los Angeles Community College District BAB
6.750% 8/01/49 | | | 1,200,000 | | | | 1,238,388 | |
| | | | | | | | |
| | | | | | | 3,119,740 | |
| | | | | | | | |
| | |
TOTAL MUNICIPAL OBLIGATIONS
(Cost $3,288,276) | | | | | | | 3,119,740 | |
| | | | | | | | |
| |
| NON-U.S. GOVERNMENT AGENCY OBLIGATIONS — 2.5% | | | | | |
| Commercial MBS — 1.5% | | | | | | | | |
Extended Stay America Trust,
Series 2010-ESHA, Class A (a)
2.950% 11/05/27 | | | 299,519 | | | | 294,628 | |
JP Morgan Chase Commercial Mortgage Securities Corp., Series 2010-C2, Class A3 (a)
4.069% 11/15/43 | | | 100,000 | | | | 95,852 | |
Morgan Stanley Reremic Trust,
Series 2010-GG10, Class A4A VRN (a)
5.807% 8/15/45 | | | 1,500,000 | | | | 1,595,828 | |
| | | | | | | | |
| | | | | | | 1,986,308 | |
| | | | | | | | |
| WL Collateral CMO — 1.0% | | | | | |
Citigroup Mortgage Loan Trust, Inc.,
Series 2005-11, Class A2A FRN
2.680% 12/25/35 | | | 942,243 | | | | 910,067 | |
GSR Mortgage Loan Trust,
Series 2005-AR6, Class 1A1 FRN
2.864% 9/25/35 | | | 218,226 | | | | 204,725 | |
Thornburg Mortgage Securities Trust, Series 2007-2, Class A1 FRN
0.393% 6/25/37 | | | 196,486 | | | | 186,695 | |
| | | | | | | | |
| | | | | | | 1,301,487 | |
| | | | | | | | |
| | |
TOTAL NON-U.S. GOVERNMENT AGENCY OBLIGATIONS
(Cost $3,250,368) | | | | | | | 3,287,795 | |
| | | | | | | | |
|
| SOVEREIGN DEBT OBLIGATIONS — 2.0% | |
Banco Nacional de Desenvolvimento Economico e Social EUR (a) (b)
4.125% 9/15/17 | | | 100,000 | | | | 130,582 | |
| | | | | | | | |
| | | Principal
Amount | | | Value | |
Brazilian Government International Bond
7.875% 3/07/15 | | $ | 600,000 | | | $ | 717,000 | |
Canada Housing Trust No. 1 CAD (a) (b)
2.450% 12/15/15 | | | 1,200,000 | | | | 1,193,268 | |
Canada Housing Trust No. 1 CAD (b)
3.350% 12/15/20 | | | 100,000 | | | | 99,339 | |
Korea Finance Corp.
3.250% 9/20/16 | | | 100,000 | | | | 95,507 | |
Korea Housing Finance Corp. (d)
4.125% 12/15/15 | | | 400,000 | | | | 403,079 | |
Mexican Bonos MXN (b)
6.000% 6/18/15 | | | 800,000 | | | | 64,261 | |
| | | | | | | | |
| | | | | | | 2,703,036 | |
| | | | | | | | |
| | |
TOTAL SOVEREIGN DEBT OBLIGATIONS
(Cost $2,704,590) | | | | | | | 2,703,036 | |
| | | | | | | | |
|
| U.S. GOVERNMENT AGENCY OBLIGATIONS AND INSTRUMENTALITIES — 40.9% | |
| Pass-Through Securities — 40.9% | | | | | | | | |
Federal National Mortgage Association
Pool #AC1639 4.000%
9/01/39 | | | 298,040 | | | | 296,852 | |
Pool #AE2537 4.000%
10/01/40 | | | 198,663 | | | | 197,871 | |
Pool #931412 4.500%
6/01/24 | | | 951,132 | | | | 996,720 | |
Pool #AC5442 4.500%
11/01/39 | | | 213,307 | | | | 219,131 | |
Pool #932322 4.500%
12/01/39 | | | 999,900 | | | | 1,027,202 | |
Pool #AD3072 4.500%
4/01/40 | | | 3,422,140 | | | | 3,515,580 | |
Pool #AD6926 4.500%
6/01/40 | | | 918,011 | | | | 943,077 | |
Pool #889955 5.500%
10/01/38 | | | 934,903 | | | | 998,995 | |
Federal National Mortgage Association TBA
Pool #4992 4.000%
10/01/39 (e) | | | 5,100,000 | | | | 5,070,375 | |
Pool #11007 4.500%
12/01/20 (e) | | | 1,000,000 | | | | 1,048,203 | |
Pool #12651 4.500%
12/01/38 (e) | | | 23,800,000 | | | | 24,435,179 | |
Pool #26443 5.000%
4/01/36 (e) | | | 2,000,000 | | | | 2,102,656 | |
The accompanying notes are an integral part of the financial statements.
16
MML PIMCO Total Return Fund – Portfolio of Investments (Continued)
| | | | | | | | |
| | | Principal
Amount | | | Value | |
Pool #45488 5.500%
4/01/35 (e) | | $ | 6,000,000 | | | $ | 6,419,531 | |
Government National Mortgage Association TBA
Pool #2527 4.000%
3/01/40 (e) | | | 7,000,000 | | | | 7,020,782 | |
| | | | | | | | |
| | | | | | | 54,292,154 | |
| | | | | | | | |
| | |
TOTAL U.S. GOVERNMENT AGENCY OBLIGATIONS AND INSTRUMENTALITIES
(Cost $54,586,933) | | | | | | | 54,292,154 | |
| | | | | | | | |
|
| U.S. TREASURY OBLIGATIONS — 33.1% | |
| U.S. Treasury Bonds & Notes — 33.1% | | | | | |
U.S. Treasury Inflation Index
2.000% 1/15/26 | | | 110,190 | | | | 117,352 | |
U.S. Treasury Inflation Index
2.375% 1/15/25 | | | 116,024 | | | | 129,468 | |
U.S. Treasury Inflation Index
2.375% 1/15/27 | | | 1,952,082 | | | | 2,176,657 | |
U.S. Treasury Inflation Index
2.500% 1/15/29 | | | 305,592 | | | | 347,659 | |
U.S. Treasury Inflation Index
3.875% 4/15/29 | | | 399,108 | | | | 536,395 | |
U.S. Treasury Note (c)
0.500% 11/30/12 | | | 11,300,000 | | | | 11,286,758 | |
U.S. Treasury Note (c)
0.500% 10/15/13 | | | 8,500,000 | | | | 8,405,703 | |
U.S. Treasury Note (c)
0.500% 11/15/13 | | | 1,900,000 | | | | 1,875,656 | |
U.S. Treasury Note
0.625% 12/31/12 | | | 1,600,000 | | | | 1,601,063 | |
U.S. Treasury Note
0.750% 8/15/13 | | | 3,300,000 | | | | 3,293,555 | |
U.S. Treasury Note
0.750% 9/15/13 | | | 1,200,000 | | | | 1,196,250 | |
U.S. Treasury Note
0.750% 12/15/13 | | | 8,400,000 | | | | 8,340,609 | |
U.S. Treasury Note
1.000% 7/15/13 | | | 1,100,000 | | | | 1,105,500 | |
U.S. Treasury Note
1.125% 6/15/13 | | | 400,000 | | | | 403,328 | |
U.S. Treasury Note
1.875% 6/30/15 | | | 100,000 | | | | 100,410 | |
U.S. Treasury Note
2.125% 11/30/14 | | | 700,000 | | | | 717,199 | |
U.S. Treasury Note
2.125% 5/31/15 | | | 600,000 | | | | 609,656 | |
U.S. Treasury Note
2.375% 9/30/14 | | | 300,000 | | | | 310,793 | |
U.S. Treasury Note
2.375% 10/31/14 | | | 500,000 | | | | 517,637 | |
| | | | | | | | |
| | | Principal
Amount | | | Value | |
U.S. Treasury Note
2.500% 4/30/15 | | $ | 400,000 | | | $ | 413,578 | |
U.S. Treasury Note
2.625% 12/31/14 | | | 500,000 | | | | 521,445 | |
| | | | | | | | |
| | | | | | | 44,006,671 | |
| | | | | | | | |
| | |
TOTAL U.S. TREASURY OBLIGATIONS
(Cost $44,311,194) | | | | | | | 44,006,671 | |
| | | | | | | | |
| | |
TOTAL BONDS & NOTES
(Cost $159,751,535) | | | | | | | 158,844,437 | |
| | | | | | | | |
| | |
TOTAL LONG-TERM INVESTMENTS
(Cost $159,751,535) | | | | | | | 158,844,437 | |
| | | | | | | | |
|
| SHORT-TERM INVESTMENTS — 8.5% | |
| Repurchase Agreement — 2.2% | | | | | |
State Street Bank & Trust Co. Repurchase Agreement, dated 12/31/10, 0.010%,
due 1/03/11 (f) | | | 2,907,449 | | | | 2,907,449 | |
| | | | | | | | |
| U.S. Treasury Bills — 6.3% | | | | | |
U.S. Treasury Bill (c)
0.174% 6/02/11 | | | 8,400,000 | | | | 8,394,219 | |
| | | | | | | | |
| | |
TOTAL SHORT-TERM INVESTMENTS
(Cost $11,301,668) | | | | | | | 11,301,668 | |
| | | | | | | | |
| | |
TOTAL INVESTMENTS —128.1%
(Cost $171,053,203) (g) | | | | | | | 170,146,105 | |
| | |
| Other Assets/(Liabilities) — (28.1)% | | | | | | | (37,348,362 | ) |
| | | | | | | | |
| | |
| NET ASSETS — 100.0% | | | | | | $ | 132,797,743 | |
| | | | | | | | |
| | | | | | | | |
| |
| SECURITIES SOLD SHORT — (3.7)% | | | | | |
|
| U.S. GOVERNMENT AGENCY OBLIGATIONS AND INSTRUMENTALITIES SOLD SHORT — (3.7)% | |
| Pass-Through Securities — (3.7)% | | | | | | | | |
Federal National Mortgage Association TBA Pool#4992
4.000% 10/01/39 (e) | | | (5,000,000 | ) | | | (4,973,828 | ) |
| | | | | | | | |
| | |
TOTAL U.S. GOVERNMENT AGENCY OBLIGATIONS AND INSTRUMENTALITIES SOLD SHORT
(Cost $(4,913,672)) | | | | | | | (4,973,828 | ) |
| | | | | | | | |
| | |
TOTAL SECURITIES SOLD SHORT — (3.7)%
(Cost $(4,913,672)) | | | | | | | (4,973,828 | ) |
| | | | | | | | |
The accompanying notes are an integral part of the financial statements.
17
MML PIMCO Total Return Fund – Portfolio of Investments (Continued)
Notes to Portfolio of Investments
| CMO | Collateralized Mortgage Obligation |
| MBS | Mortgage-Backed Security |
| (a) | Securities exempt from registration under rule 144A of the Securities Act of 1933. These securities may be resold in transactions exempt from registration, normally to qualified institutional buyers. At December 31, 2010, these securities amounted to a value of $9,785,787 or 7.37% of net assets. |
| (b) | The principal amount of the security is in foreign currency. The market value is in U.S. dollars. |
| (c) | A portion of this security is held as collateral for open futures contracts and written options outstanding. (Note 2). |
| (d) | Security exempt from registration under Regulation S of the Securities Act of 1933, which exempts from registration securities offered and sold outside the United States. Security may not be offered or sold in the United States except pursuant to an exemption from, or in a transaction not subject to, the registration requirements of the Securities Act of 1933. At December 31, 2010, these securities amounted to a value of $1,057,475 or 0.80% of net assets. |
| (e) | A portion of this security is purchased on a when-issued, delayed-delivery or forward commitment basis. (Note 2). |
| (f) | Maturity value of $2,907,452. Collateralized by U.S. Government Agency obligations with a rate of 4.000%, maturity date of 12/25/38, and an aggregate market value, including accrued interest, of $2,967,732. |
| (g) | See Note 6 for aggregate cost for federal tax purposes. |
The accompanying notes are an integral part of the financial statements.
18
THIS PAGE INTENTIONALLY LEFT BLANK
MML Series Investment Fund – Financial Statements
Statements of Assets and Liabilities
December 31, 2010
| | | | | | | | |
| | | MML
Fundamental
Value Fund | | | MML PIMCO
Total Return
Fund | |
| Assets: | | | | | | | | |
Investments, at value (Note 2) (a) | | $ | 125,269,345 | | | $ | 158,844,437 | |
Short-term investments, at value (Note 2) (b) | | | 1,322,378 | | | | 11,301,668 | |
| | | | | | | | |
Total investments | | | 126,591,723 | | | | 170,146,105 | |
| | | | | | | | |
Foreign currency, at value (c) | | | - | | | | 131,623 | |
Receivables from: | | | | | | | | |
Investments sold | | | 39,520 | | | | 5,550,579 | |
Investments sold on a when-issued basis (Note 2) | | | - | | | | 17,646,137 | |
Open forward foreign currency contracts (Note 2) | | | - | | | | 182,107 | |
Investment adviser (Note 3) | | | 10,339 | | | | 22,777 | |
Fund shares sold | | | - | | | | 1,072,624 | |
Interest and dividends | | | 164,888 | | | | 657,375 | |
Broker for collateral held for open futures contracts (Note 2) | | | - | | | | 37,000 | |
Variation margin on open futures contracts (Note 2) | | | - | | | | 41,879 | |
Open swap agreements, at value (Note 2) | | | - | | | | 328,164 | |
| | | | | | | | |
Total assets | | | 126,806,470 | | | | 195,816,370 | |
| | | | | | | | |
| Liabilities: | | | | | | | | |
Payables for: | | | | | | | | |
Investments purchased | | | - | | | | 3,046,640 | |
Investments purchased on a when-issued basis (Note 2) | | | - | | | | 54,317,890 | |
Closed swap agreements, at value (f) | | | - | | | | 63,292 | |
Collateral held for open swap agreements (Note 2) | | | - | | | | 260,000 | |
Written options outstanding, at value (Note 2) (d) | | | - | | | | 147,256 | |
Open forward foreign currency contracts (Note 2) | | | - | | | | 26,760 | |
Payable for securities sold short, at value (Note 2) (e) | | | - | | | | 4,973,828 | |
Open swap agreements, at value (Note 2) | | | - | | | | 44,236 | |
Trustees’ fees and expenses (Note 3) | | | 1,893 | | | | 1,843 | |
Affiliates (Note 3): | | | | | | | | |
Investment management fees | | | 67,947 | | | | 48,662 | |
Administration fees | | | 10,453 | | | | 9,732 | |
Accrued expense and other liabilities | | | 35,580 | | | | 78,488 | |
| | | | | | | | |
Total liabilities | | | 115,873 | | | | 63,018,627 | |
| | | | | | | | |
Net assets | | $ | 126,690,597 | | | $ | 132,797,743 | |
| | | | | | | | |
| Net assets consist of: | | | | | | | | |
Paid-in capital | | $ | 114,794,154 | | | $ | 134,503,647 | |
Undistributed (accumulated) net investment income (loss) | | | 2,350 | | | | 126,165 | |
Accumulated net realized gain (loss) on investments and foreign currency transactions | | | 177,368 | | | | (805,268 | ) |
Net unrealized appreciation (depreciation) on investments and foreign currency translations | | | 11,716,725 | | | | (1,026,801 | ) |
| | | | | | | | |
Net assets | | $ | 126,690,597 | | | $ | 132,797,743 | |
| | | | | | | | |
| | | | | | | | |
(a) Cost of investments: | | $ | 113,552,620 | | | $ | 159,751,535 | |
(b) Cost of short-term investments: | | $ | 1,322,378 | | | $ | 11,301,668 | |
(c) Cost of foreign currency: | | $ | - | | | $ | 130,193 | |
(d) Premiums on written options: | | $ | - | | | $ | 85,451 | |
(e) Proceeds from securities sold short: | | $ | - | | | $ | (4,913,672 | ) |
(f) Swap agreements are scheduled to settle subsequent to year end. | | | | | | | | |
The accompanying notes are an integral part of the financial statements.
20
MML Series Investment Fund – Financial Statements (Continued)
Statements of Assets and Liabilities
December 31, 2010
| | | | | | | | |
| | | MML
Fundamental
Value Fund | | | MML PIMCO
Total Return
Fund | |
| Class II shares: | | | | | | | | |
Net assets | | $ | 126,690,597 | | | $ | 132,797,743 | |
| | | | | | | | |
Shares outstanding (a) | | | 11,432,958 | | | | 13,417,994 | |
| | | | | | | | |
Net asset value, offering price and redemption price per share | | $ | 11.08 | | | $ | 9.90 | |
| | | | | | | | |
| (a) | Authorized unlimited number of shares with no par value. |
The accompanying notes are an integral part of the financial statements.
21
MML Series Investment Fund – Financial Statements (Continued)
Statements of Operations
For the Period Ended December 31, 2010
| | | | | | | | |
| | | MML
Fundamental
Value Fund + | | | MML PIMCO
Total Return
Fund + | |
| Investment income (Note 2): | | | | | | | | |
Dividends (a) | | $ | 901,582 | | | $ | - | |
Interest | | | 157 | | | | 767,409 | |
| | | | | | | | |
Total investment income | | | 901,739 | | | | 767,409 | |
| | | | | | | | |
| Expenses (Note 3): | | | | | | | | |
Investment management fees | | | 253,806 | | | | 187,311 | |
Custody fees | | | 7,981 | | | | 12,031 | |
Interest expense | | | - | | | | 125 | |
Audit fees | | | 31,874 | | | | 84,124 | |
Legal fees | | | 2,410 | | | | 2,839 | |
Shareholder reporting fees | | | 15,208 | | | | 15,396 | |
Trustees’ fees | | | 2,304 | | | | 2,261 | |
| | | | | | | | |
| | | 313,583 | | | | 304,087 | |
Administration fees: | | | | | | | | |
Class II | | | 39,047 | | | | 37,462 | |
| | | | | | | | |
Total expenses | | | 352,630 | | | | 341,549 | |
Expenses waived (Note 3): | | | | | | | | |
Class II fees waived by advisor | | | (40,254 | ) | | | (97,920 | ) |
| | | | | | | | |
Net expenses | | | 312,376 | | | | 243,629 | |
| | | | | | | | |
Net investment income (loss) | | | 589,363 | | | | 523,780 | |
| | | | | | | | |
| Realized and unrealized gain (loss): | | | | | | | | |
Net realized gain (loss) on: | | | | | | | | |
Investment transactions | | | 469,427 | | | | 273,627 | |
Futures contracts | | | - | | | | (127,091 | ) |
Written options | | | - | | | | 24,511 | |
Swap agreements | | | - | | | | 40,013 | |
Foreign currency transactions | | | - | | | | (90,391 | ) |
| | | | | | | | |
Net realized gain (loss) | | | 469,427 | | | | 120,669 | |
| | | | | | | | |
Net change in unrealized appreciation (depreciation) on: | | | | | | | | |
Investment transactions | | | 11,716,725 | | | | (907,098 | ) |
Futures contracts | | | - | | | | (166,481 | ) |
Written options | | | - | | | | (61,805 | ) |
Securities sold short | | | - | | | | (60,156 | ) |
Swap agreements | | | - | | | | 12,013 | |
Translation of assets and liabilities in foreign currencies | | | - | | | | 156,726 | |
| | | | | | | | |
Net change in unrealized appreciation (depreciation) | | | 11,716,725 | | | | (1,026,801 | ) |
| | | | | | | | |
Net realized gain (loss) and change in unrealized appreciation (depreciation) | | | 12,186,152 | | | | (906,132 | ) |
| | | | | | | | |
Net increase (decrease) in net assets resulting from operations | | $ | 12,775,515 | | | $ | (382,352 | ) |
| | | | | | | | |
| | | | | | | | |
(a) Net of withholding tax of: | | $ | 511 | | | $ | - | |
| + | Fund commenced operations on August 10, 2010. |
The accompanying notes are an integral part of the financial statements.
22
MML Series Investment Fund – Financial Statements (Continued)
Statements of Changes in Net Assets
| | | | | | | | |
| | | MML Fundamental
Value Fund | | | MML PIMCO
Total Return Fund | |
| | | Period
Ended
December 31, 2010 + | | | Period
Ended
December 31, 2010 + | |
| Increase (Decrease) in Net Assets: | | | | | | | | |
| Operations: | | | | | | | | |
Net investment income (loss) | | $ | 589,363 | | | $ | 523,780 | |
Net realized gain (loss) on investment transactions | | | 469,427 | | | | 120,669 | |
Net change in unrealized appreciation (depreciation) on investments | | | 11,716,725 | | | | (1,026,801 | ) |
| | | | | | | | |
Net increase (decrease) in net assets resulting from operations | | | 12,775,515 | | | | (382,352 | ) |
| | | | | | | | |
| Distributions to shareholders (Note 2): | | | | | | | | |
From net investment income: | | | | | | | | |
Class II | | | (587,013 | ) | | | (497,504 | ) |
| | | | | | | | |
Total distributions from net investment income | | | (587,013 | ) | | | (497,504 | ) |
| | | | | | | | |
From net realized gains: | | | | | | | | |
Class II | | | (292,059 | ) | | | (826,048 | ) |
| | | | | | | | |
Total distributions from net realized gains | | | (292,059 | ) | | | (826,048 | ) |
| | | | | | | | |
| Net fund share transactions (Note 5): | | | | | | | | |
Class II | | | 114,794,154 | | | | 134,503,647 | |
| | | | | | | | |
Increase (decrease) in net assets from fund share transactions | | | 114,794,154 | | | | 134,503,647 | |
| | | | | | | | |
Total increase (decrease) in net assets | | | 126,690,597 | | | | 132,797,743 | |
| Net assets | | | | | | | | |
Beginning of period | | | - | | | | - | |
| | | | | | | | |
End of period | | $ | 126,690,597 | | | $ | 132,797,743 | |
| | | | | | | | |
Undistributed (accumulated) net investment income (loss) included in net assets at end of period | | $ | 2,350 | | | $ | 126,165 | |
| | | | | | | | |
| + | Fund commenced operations on August 10, 2010. |
The accompanying notes are an integral part of the financial statements.
23
MML Series Investment Fund – Financial Highlights
(For a share outstanding throughout each period)
MML Fundamental Value Fund
| | | | |
| | | Class II | |
| | | Period
Ended
12/31/10 + | |
Net asset value, beginning of period | | $ | 10.00 | |
| | | | |
Income (loss) from investment operations: | | | | |
Net investment income (loss) *** | | | 0.06 | |
Net realized and unrealized gain (loss) on investments | | | 1.10 | |
| | | | |
Total income (loss) from investment operations | | | 1.16 | |
| | | | |
Less distributions to shareholders: | | | | |
From net investment income | | | (0.05 | ) |
From net realized gains | | | (0.03 | ) |
| | | | |
Total distributions | | | (0.08 | ) |
| | | | |
Net asset value, end of period | | $ | 11.08 | |
| | | | |
Total Return ^^ | | | 11.59% | ** |
| |
Ratios / Supplemental Data: | | | | |
Net assets, end of period (000’s) | | $ | 126,691 | |
Ratio of expenses to average daily net assets: | | | | |
Before expense waiver | | | 0.90% | * |
After expense waiver | | | 0.80% | *# |
Net investment income (loss) to average daily net assets | | | 1.51% | * |
Portfolio turnover rate | | | 10% | ** |
| ** | Percentage represents the results for the period and is not annualized. |
| *** | Per share amount calculated on the average shares method. |
| + | For the period August 10, 2010 (commencement of operations) through December 31, 2010. |
| # | Computed after giving effect to an agreement by MassMutual to waive certain fees and expenses of the Fund. |
| ^^ | Total return does not reflect expenses that apply at the separate account level or to related insurance products. Inclusion of these charges would reduce the total return figures for all periods shown. |
The accompanying notes are an integral part of the financial statements.
24
MML Series Investment Fund – Financial Highlights (Continued)
(For a share outstanding throughout each period)
MML PIMCO Total Return Fund
| | | | |
| | | Class II | |
| | | Period
Ended
12/31/10 + | |
Net asset value, beginning of period | | $ | 10.00 | |
| | | | |
Income (loss) from investment operations: | | | | |
Net investment income (loss) *** | | | 0.06 | |
Net realized and unrealized gain (loss) on investments | | | (0.05 | ) |
| | | | |
Total income (loss) from investment operations | | | 0.01 | |
| | | | |
Less distributions to shareholders: | | | | |
From net investment income | | | (0.04 | ) |
From net realized gains | | | (0.07 | ) |
| | | | |
Total distributions | | | (0.11 | ) |
| | | | |
Net asset value, end of period | | $ | 9.90 | |
| | | | |
Total Return ^^ | | | 0.17% | ** |
| |
Ratios / Supplemental Data: | | | | |
Net assets, end of period (000’s) | | $ | 132,798 | |
Ratio of expenses to average daily net assets: | | | | |
Before expense waiver ‡‡ | | | 0.91% | * |
After expense waiver ‡‡ | | | 0.65% | *# |
Interest expense to average daily net assets ‡‡‡ | | | 0.00% | *† |
Ratio of expenses to average daily net assets: | | | | |
Before expense waiver ## | | | 0.91% | * |
After expense waiver ## | | | 0.65% | *# |
Net investment income (loss) to average daily net assets | | | 1.40% | * |
Portfolio turnover rate | | | 221% | ** |
| ** | Percentage represents the results for the period and is not annualized. |
| *** | Per share amount calculated on the average shares method. |
| † | Amount is less than 0.005%. |
| + | For the period August 10, 2010 (commencement of operations) through December 31, 2010. |
| # | Computed after giving effect to an agreement by MassMutual to waive certain fees and expenses of the Fund. |
| ## | Includes interest expense. |
| ^^ | Total return does not reflect expenses that apply at the separate account level or to related insurance products. Inclusion of these charges would reduce the total return figures for all periods shown. |
| ‡‡ | Excludes interest expense. |
| ‡‡‡ | Interest expense incurred as a result of entering into reverse repurchase agreements is included in the Fund’s net expenses in the Statements of Operations. Income earned on investing proceeds from reverse repurchase agreements is included in interest income in the Statements of Operations. |
The accompanying notes are an integral part of the financial statements.
25
Notes to Financial Statements
MML Series Investment Fund (the “Trust”) is registered under the Investment Company Act of 1940, as amended (the “1940 Act”), as a no-load, open-end, management investment company. The Trust is organized under the laws of the Commonwealth of Massachusetts as a Massachusetts business trust pursuant to an Agreement and Declaration of Trust dated May 14, 1993, as amended. The following are two series of the Trust (each individually referred to as a “Fund” or collectively as the “Funds”): MML Fundamental Value Fund (“Fundamental Value Fund”) and MML PIMCO Total Return Fund (“PIMCO Total Return Fund”).
The Funds commenced operations on August 10, 2010.
The Trust makes shares of the Funds available for the investment of assets of various separate investment accounts established by Massachusetts Mutual Life Insurance Company (“MassMutual”) and by life insurance companies which are subsidiaries of MassMutual. Shares of the Trust are not offered to the general public. MassMutual, MML Bay State Life Insurance Company, and C.M. Life Insurance Company are the record owners of all of the outstanding shares of the Funds.
Each Fund offers the following two classes of shares: Class II and Service Class I shares. Service Class I shares of the Funds are not currently available. Each share class represents an interest in the same portfolio of assets. The principal difference among the classes is the level of service and administration fees, and shareholder and distribution service expenses borne by the classes. Because each class will have different fees and expenses, performance and share prices will vary between the classes. The classes of shares are offered to different types of investors, as outlined in the Funds’ Prospectus.
| 2. | | Significant Accounting Policies |
The following is a summary of significant accounting policies followed consistently by each Fund in the preparation of the financial statements in conformity with accounting principles generally accepted in the United States of America (“generally accepted accounting principles”). The preparation of the financial statements in accordance with generally accepted accounting principles requires management to make estimates and assumptions that affect the reported amounts and disclosures in the financial statements. Actual results could differ from those estimates.
Investment Valuation
The net asset value of each Fund’s shares is determined once daily as of the close of regular trading on the New York Stock Exchange, on each day the New York Stock Exchange is open for trading. The New York Stock Exchange normally closes at 4:00 p.m. Eastern Time, but may close earlier on some days.
Equity securities are valued on the basis of information furnished by a pricing service, which provides the last reported sale price for securities listed on a national securities exchange or the official closing price on the NASDAQ National Market System, or in the case of over-the-counter (“OTC”) securities for which an official closing price is unavailable or not reported on the NASDAQ System, the last reported bid price. Debt securities (other than short-term obligations) are valued on the basis of valuations furnished by a pricing service, which determines valuations taking into account factors such as institutional-size trading in similar securities, yield, quality, coupon rate, maturity, type of issue, trading characteristics, and other market data. Short-term debt securities are valued at either amortized cost or at original cost plus accrued interest, whichever approximates current market value. Shares of other open-end mutual funds are valued at their closing net asset values as reported on each business day. Investments are marked to market daily based on values provided by third-party vendors or market makers to the extent available or based on model prices. Valuations provided by third-party vendors and representative bids provided by market makers may be determined on the basis of a variety of factors, such as broker quotations, financial modeling, and other market data, such as market indexes and yield curves, counterparty information, and foreign exchange rates.
Investments for which market quotations are not available or for which a pricing service or vendor does not provide a value, or for which such market quotations or values are considered by the investment adviser or subadviser to be unreliable (including, for example, certain foreign securities, thinly-traded securities, initial public offerings, or securities whose values may have been affected by a significant event) are stated at fair valuations determined by the Funds’ Valuation Committee in accordance with
26
Notes to Financial Statements (Continued)
procedures approved by the Board of Trustees (“Trustees”), and under the general oversight of the Trustees. It is possible that fair value prices will be used by the Funds to a significant extent. The value determined for an investment using the Funds’ fair value procedures may differ from recent market prices for the investment and may be significantly different from the value realized upon such asset’s sale.
Portfolio securities traded on more than one national securities exchange are valued at the last price on the business day at the close of the exchange representing the principal market for such securities. All assets and liabilities expressed in foreign currencies are converted into U.S. dollars at the mean between the buying and selling rates of such currencies against the U.S. dollar at the end of each business day.
The Funds may invest in securities that are traded principally in foreign markets and that trade on weekends and other days when the Funds do not price their shares. As a result, the values of the Funds’ portfolio securities may change on days when the prices of the Funds’ shares are not calculated. The prices of the Funds’ shares will reflect any such changes when the prices of the Funds’ shares are next calculated, which is the next day the New York Stock Exchange is open. The Funds may use fair value pricing more frequently for securities primarily traded in foreign markets because, among other things, most foreign markets close well before the Funds value their securities. The earlier close of these foreign markets gives rise to the possibility that significant events, including broad market moves, may have occurred in the interim. The Funds’ investments may be priced based on fair values provided by a third-party fair valuation vendor, based on certain factors and methodologies applied by such vendor, in the event that there is movement in the U.S. market that exceeds a specific threshold established by the Funds’ Valuation Committee pursuant to guidelines established by the Trustees, and under the general oversight of the Trustees.
Fair value is defined as the price that would be received to sell an asset or paid to transfer a liability in an orderly transaction between market participants at the measurement date. A three-tier hierarchy is utilized to maximize the use of observable market data inputs and minimize the use of unobservable inputs and to establish classification of fair value measurements for disclosure purposes. Inputs refer broadly to the assumptions that market participants would use in pricing the asset or liability, including assumptions about risk, for example, the risk inherent in a particular valuation technique used to measure fair value (such as a pricing model) and/or the risk inherent in the inputs to the valuation technique. Inputs may be observable or unobservable. Observable inputs are inputs that reflect the assumptions market participants would use in pricing the asset or liability and are developed based on market data obtained from sources independent of the reporting entity. Unobservable inputs are inputs that reflect the reporting entity’s own assumptions about the assumptions market participants would use in pricing the asset or liability and are developed based on the best information available in the circumstances. The three-tier hierarchy of inputs is summarized in the three broad Levels listed below.
Level 1 – quoted prices (unadjusted) in active markets for identical investments
Level 2 – other significant observable inputs (including quoted prices for similar investments, interest rates, prepayment speeds, credit risk, etc.)
Level 3 – significant unobservable inputs (including the Fund’s own assumptions in determining the fair value of investments)
Changes in valuation techniques may result in transfers in or out of an investment’s assigned Level within the hierarchy. The inputs or methodology used for valuing investments are not necessarily an indication of the risk associated with investing in those investments and the determination of the significance of a particular input to the fair value measurement in its entirety requires judgment and consideration of factors specific to each security.
The availability of observable inputs can vary from security to security and is affected by a wide variety of factors, including, for example, the type of security, whether the security is new and not yet established in the marketplace, the liquidity of markets, and other characteristics particular to the security. To the extent that valuation is based on models or inputs that are less observable or unobservable in the market, the determination of fair value requires more judgment. Accordingly, the degree of judgment exercised in determining fair value is greatest for instruments categorized in Level 3.
In periods of market dislocation, the observability of prices and inputs may be reduced for many instruments. This condition, as well as changes related to liquidity of investments, could cause a security to be reclassified between Level 1, Level 2, or Level 3.
27
Notes to Financial Statements (Continued)
In certain cases, the inputs used to measure fair value may fall into different levels of the fair value hierarchy. In such cases, for disclosure purposes the level in the fair value hierarchy within which the fair value measurement falls is determined based on the lowest level input that is significant to the fair value measurement.
Fair Value Measurements
A description of the valuation techniques applied to the Funds’ major categories of assets and liabilities measured at fair value on a recurring basis follows.
Equity securities. Securities are generally valued based on quoted prices from the applicable exchange. To the extent these securities are actively traded, valuation adjustments are not applied and they are categorized in Level 1 of the fair value hierarchy. Certain foreign securities may be fair valued using a pricing service that considers the correlation of the trading patterns of the foreign security to the intraday trading in the U.S. markets for investments such as depositary receipts, futures, exchange-traded funds (“ETFs”), and the movement of certain indexes of securities based on a statistical analysis of the historical relationship and are categorized in Level 2 of the fair value hierarchy.
Corporate bonds. The fair value of corporate bonds is estimated using recently executed transactions, market price quotations (where observable), bond spreads, or credit default swap spreads adjusted for any basis difference between cash and derivative instruments. Corporate bonds are generally categorized in Level 2 of the fair value hierarchy; in instances where prices, spreads, or any of the other aforementioned key inputs are unobservable, they are categorized in Level 3 of the hierarchy.
Asset-backed securities and mortgage-backed securities. The fair value of asset-backed securities and mortgage-backed securities is estimated based on models that consider the estimated cash flows of each debt tranche of the issuer, establish a benchmark yield, and develop an estimated tranche specific spread to the benchmark yield based on the unique attributes of the tranche including, but not limited to, the prepayment speed assumptions and attributes of the collateral. To the extent the inputs are observable and timely, the values would be categorized in Level 2 of the fair value hierarchy, otherwise they would be categorized as Level 3.
U.S. Government and agency securities. U.S. government and agency securities are normally valued using a model that incorporates market observable data such as reported sales of similar securities, broker quotes, yields, bids, offers, quoted market prices, and reference data. Accordingly, U.S. government and agency securities are normally categorized in Level 2 of the fair value hierarchy.
Derivative contracts. Derivative contracts that are actively traded on an exchange are valued based on quoted prices from the exchange and are categorized in Level 1 of the fair value hierarchy. OTC derivative contracts include forward, swap, and option contracts related to interest rates, foreign currencies, credit standing of reference entities, equity prices, or commodity prices. Depending on the contract and the terms of the transaction, the fair value of the OTC derivative contracts can be modeled using a series of techniques, including simulation models. Many pricing models do not entail material subjectivity because the methodologies employed do not necessitate significant judgments and the pricing inputs are observed from actively quoted markets, as is the case of interest rate swap and option contracts. A majority of OTC derivative contracts valued by the Funds using pricing models fall into this category and are categorized within Level 2 of the fair value hierarchy.
Restricted securities. Restricted securities are valued at a discount to similar publicly traded securities and may be categorized as Level 2 of the fair value hierarchy to the extent that the discount is considered to be insignificant to the fair value measurement in its entirety; otherwise they may be categorized as Level 3. Any illiquid Rule 144A securities or restricted securities held in non-public entities are included in Level 3 of the fair value hierarchy because they trade infrequently and, therefore, the inputs are unobservable.
The PIMCO Total Return Fund characterized all investments, other than financial instruments, at Level 2, as of December 31, 2010. The level classification by major category of investments is the same as the category presentation in the Portfolio of Investments.
28
Notes to Financial Statements (Continued)
The following is the aggregate value by input level as of December 31, 2010 for the Fundamental Value Fund’s investments:
Asset Valuation Inputs
| | | | | | | | | | | | | | | | |
| | | Investments in Securities | |
| | | Level 1 —
Quoted Prices | | | Level 2 —
Other
Significant
Observable
Inputs | | | Level 3 —
Significant
Unobservable
Inputs | | | Total | |
Fundamental Value Fund | | | | | | | | | | | | | | | | |
Equities | | | | | | | | | | | | | | | | |
Common Stock | | | | | | | | | | | | | | | | |
Basic Materials | | $ | 7,569,214 | | | $ | - | | | $ | - | | | $ | 7,569,214 | |
Communications | | | 9,341,260 | | | | - | | | | - | | | | 9,341,260 | |
Consumer, Cyclical | | | 11,363,086 | | | | - | | | | - | | | | 11,363,086 | |
Consumer, Non-cyclical | | | 22,282,273 | | | | - | | | | - | | | | 22,282,273 | |
Energy | | | 16,330,110 | | | | - | | | | - | | | | 16,330,110 | |
Financial | | | 29,008,417 | | | | - | | | | - | | | | 29,008,417 | |
Industrial | | | 15,444,631 | | | | 591,049 | | | | - | | | | 16,035,680 | |
Technology | | | 9,482,883 | | | | - | | | | - | | | | 9,482,883 | |
Utilities | | | 3,856,422 | | | | - | | | | - | | | | 3,856,422 | |
| | | | | | | | | | | | | | | | |
Total Common Stock | | | 124,678,296 | | | | 591,049 | | | | - | | | | 125,269,345 | |
| | | | | | | | | | | | | | | | |
Total Equities | | | 124,678,296 | | | | 591,049 | | | | - | | | | 125,269,345 | |
| | | | | | | | | | | | | | | | |
| Total Long-Term Investments | | | 124,678,296 | | | | 591,049 | | | | - | | | | 125,269,345 | |
| | | | | | | | | | | | | | | | |
| Total Short-Term Investments | | | - | | | | 1,322,378 | | | | - | | | | 1,322,378 | |
| | | | | | | | | | | | | | | | |
| Total Investments | | $ | 124,678,296 | | | $ | 1,913,427 | | | $ | - | | | $ | 126,591,723 | |
| | | | | | | | | | | | | | | | |
The following is the aggregate value by input level as of December 31, 2010 for the PIMCO Total Return Fund’s other financial instruments:
Asset Valuation Inputs
| | | | | | | | | | | | | | | | |
| | | Other Financial Instruments | |
| | | Level 1 —
Quoted Prices | | | Level 2 —
Other
Significant
Observable
Inputs | | | Level 3 —
Significant
Unobservable
Inputs | | | Total | |
PIMCO Total Return Fund | | | | | | | | | | | | | | | | |
Forward Contracts | | | | | | | | | | | | | | | | |
Foreign Exchange Risk | | $ | - | | | $ | 182,107 | | | $ | - | | | $ | 182,107 | |
Futures Contracts | | | | | | | | | | | | | | | | |
Interest Rate Risk | | | 22,670 | | | | - | | | | - | | | | 22,670 | |
Swap Agreements | | | | | | | | | | | | | | | | |
Credit Risk | | | - | | | | 328,164 | | | | - | | | | 328,164 | |
29
Notes to Financial Statements (Continued)
Liability Valuation Inputs
| | | | | | | | | | | | | | | | |
| | | Other Financial Instruments | |
| | | Level 1 —
Quoted Prices | | | Level 2 —
Other
Significant
Observable
Inputs | | | Level 3 —
Significant
Unobservable
Inputs | | | Total | |
| PIMCO Total Return Fund | | | | | | | | | | | | | | | | |
Forward Contracts | | | | | | | | | | | | | | | | |
Foreign Exchange Risk | | $ | - | | | $ | (26,760 | ) | | $ | - | | | $ | (26,760 | ) |
Futures Contracts | | | | | | | | | | | | | | | | |
Interest Rate Risk | | | (189,151 | ) | | | - | | | | - | | | | (189,151 | ) |
Swap Agreements | | | | | | | | | | | | | | | | |
Credit Risk | | | - | | | | (39,752 | ) | | | - | | | | (39,752 | ) |
Interest Rate Risk | | | - | | | | (4,484 | ) | | | - | | | | (4,484 | ) |
Written Options | | | | | | | | | | | | | | | | |
Interest Rate Risk | | | (22,000 | ) | | | (125,256 | ) | | | - | | | | (147,256 | ) |
The Funds had no transfers between Level 1 and Level 2 of the fair value hierarchy during the period ended December 31, 2010.
Following is a reconciliation of investments for which significant unobservable inputs (Level 3) were used in determining value:
Asset Valuation Inputs
| | | | | | | | | | | | | | | | | | | | | | | | | | | | | | | | | | | | |
| | | Investments in Securities | |
| | | Balance
as of
12/31/09 | | | Accrued
Discounts
(Premiums) | | | Realized
Gain
(Loss) | | | Change in
Unrealized
Appreciation
(Depreciation) | | | Net
Purchases
(Sales) | | | Transfers
into
Level 3* | | | Transfers
(out) of
Level 3* | | | Balance
as of
12/31/10 | | | Net Change
in Unrealized
Appreciation
(Depreciation)
from
Investments
Still Held
as of
12/31/10 | |
PIMCO Total Return Fund*** | | | | | | | | | | | | | | | | | | | | | | | | | | | | | | | | | | | | |
Long-Term Investments | | | | | | | | | | | | | | | | | | | | | | | | | | | | | | | | | | | | |
Bonds & Notes | | | | | | | | | | | | | | | | | | | | | | | | | | | | | | | | | | | | |
Corporate Debt | | $ | - | | | $ | - | | | $ | - | | | $ | - | | | $ | 597,175 | | | $ | - | | | $ | (597,175 | )** | | $ | - | | | $ | - | |
Sovereign Debt Obligations | | | - | | | | - | | | | - | | | | - | | | | 126,193 | | | | - | | | | (126,193 | )** | | | - | | | | - | |
| | | | | | | | | | | | | | | | | | | | | | | | | | | | | | | | | | | | |
| | $ | - | | | $ | - | | | $ | - | | | $ | - | | | $ | 723,368 | | | $ | - | | | $ | (723,368 | ) | | $ | - | | | $ | - | |
| | | | | | | | | | | | | | | | | | | | | | | | | | | | | | | | | | | | |
| * | The Fund(s) recognize transfers between the Levels as of the beginning of the period. |
| ** | Transferred from Level 3 to Level 2 as a result of changes in liquidity. |
| *** | Fund commenced operations on August 10, 2010. |
Derivative Instruments
Derivatives are financial instruments whose values are based on the values of one or more indicators, such as a security, asset, currency, interest rate, or index. Derivative transactions can create investment leverage and may be highly volatile. It is possible that a derivative transaction will result in a loss greater than the principal amount invested. A Fund may not be able to close out a derivative transaction at a favorable time or price. For those Funds that held derivatives during the period ended December 31, 2010, the following table shows how the Fund used these derivatives during the period (marked with an “A”), as well as any additional uses it may have for them in the future (marked with an “M”).
| | |
| Type of Derivative and Objective for Use | | PIMCO
Total
Return
Fund |
Foreign Currency Exchange Transactions* | | |
Hedging/Risk Management | | A |
Directional Exposures to Currencies | | A |
30
Notes to Financial Statements (Continued)
| | |
| Type of Derivative and Objective for Use | | PIMCO
Total
Return
Fund |
Futures Contracts** | | |
Hedging/Risk Management | | A |
Duration/Credit Quality Management | | A |
Substitution for Cash Investment | | A |
| | |
Interest Rate Swaps*** | | |
Hedging/Risk Management | | A |
Duration Management | | A |
Substitution for Cash Investment | | A |
| | |
Credit Default Swaps (Protection Seller) | | |
Hedging/Risk Management | | A |
Duration/Credit Quality Management | | A |
Directional Investment | | A |
| | |
Options (Sold) | | |
Hedging/Risk Management | | A |
| * | Includes any options, futures contracts, forward contracts, and swap agreements, if applicable. |
| ** | Includes any options on futures contracts, if applicable. |
| *** | Includes any caps, floors, and collars, and related options, if applicable. |
At December 31, 2010, and during the period then ended, the Fund(s) had the following derivatives and transactions in derivatives, grouped into the indicated risk categories:
| | | | | | | | | | | | | | | | |
| | | Credit
Risk | | | Foreign
Exchange
Risk | | | Interest
Rate
Risk | | | Total | |
| PIMCO Total Return Fund | | | | | | | | | | | | | | | | |
| Asset Derivatives | | | | | | | | | | | | | | | | |
Forward Contracts* | | $ | - | | | $ | 182,107 | | | $ | - | | | $ | 182,107 | |
Futures Contracts^^ | | | - | | | | - | | | | 22,670 | | | | 22,670 | |
Swap Agreements* | | | 328,164 | | | | - | | | | - | | | | 328,164 | |
| | | | | | | | | | | | | | | | |
Total Value | | $ | 328,164 | | | $ | 182,107 | | | $ | 22,670 | | | $ | 532,941 | |
| | | | | | | | | | | | | | | | |
| Liability Derivatives | | | | | | | | | | | | | | | | |
Forward Contracts^ | | $ | - | | | $ | (26,760 | ) | | $ | - | | | $ | (26,760 | ) |
Futures Contracts^^ | | | - | | | | - | | | | (189,151 | ) | | | (189,151 | ) |
Swap Agreements^ | | | (39,752 | ) | | | - | | | | (4,484 | ) | | | (44,236 | ) |
Written Options^ | | | - | | | | - | | | | (147,256 | ) | | | (147,256 | ) |
| | | | | | | | | | | | | | | | |
Total Value | | $ | (39,752 | ) | | $ | (26,760 | ) | | $ | (340,891 | ) | | $ | (407,403 | ) |
| | | | | | | | | | | | | | | | |
| Realized Gain (Loss)# | | | | | | | | | | | | | | | | |
Forward Contracts | | $ | - | | | $ | (264,378 | ) | | $ | - | | | $ | (264,378 | ) |
Futures Contracts | | | - | | | | - | | | | (127,091 | ) | | | (127,091 | ) |
Swap Agreements | | | 40,013 | | | | - | | | | - | | | | 40,013 | |
Written Options | | | - | | | | - | | | | 24,511 | | | | 24,511 | |
| | | | | | | | | | | | | | | | |
Total Realized Gain (Loss) | | $ | 40,013 | | | $ | (264,378 | ) | | $ | (102,580 | ) | | $ | (326,945 | ) |
| | | | | | | | | | | | | | | | |
31
Notes to Financial Statements (Continued)
| | | | | | | | | | | | | | | | |
| | | Credit
Risk | | | Foreign
Exchange
Risk | | | Interest
Rate
Risk | | | Total | |
| PIMCO Total Return Fund (Continued) | | | | | | | | | | | | | | | | |
| Change in Appreciation (Depreciation)## | | | | | | | | | | | | | | | | |
Forward Contracts | | $ | - | | | $ | 155,347 | | | $ | - | | | $ | 155,347 | |
Futures Contracts | | | - | | | | - | | | | (166,481 | ) | | | (166,481 | ) |
Swap Agreements | | | 16,522 | | | | - | | | | (4,509 | ) | | | 12,013 | |
Written Options | | | - | | | | - | | | | (61,805 | ) | | | (61,805 | ) |
| | | | | | | | | | | | | | | | |
Total Change in Appreciation (Depreciation) | | $ | 16,522 | | | $ | 155,347 | | | $ | (232,795 | ) | | $ | (60,926 | ) |
| | | | | | | | | | | | | | | | |
Number of Contracts, Notional Amounts
or Shares/Units† | | | | | | | | | | | | | | | | |
Forward Contracts | | $ | - | | | $ | 10,931,635 | | | $ | - | | | $ | 10,931,635 | |
Futures Contracts | | | - | | | | - | | | | 172 | | | | 172 | |
Swap Agreements | | $ | 4,880,000 | | | $ | - | | | $ | 500,000 | | | $ | 5,380,000 | |
Written Options | | | - | | | | - | | | | 6,996,000 | | | | 6,996,000 | |
| * | Statements of Assets and Liabilities location: Receivables from: open forward foreign currency contracts or open swap agreements, as applicable. |
| ^ | Statements of Assets and Liabilities location: Payables for: written options outstanding, open forward foreign currency contracts, or open swap agreements, at value, as applicable. |
| ^^ | Cumulative appreciation (depreciation) on futures contracts is reported in “Futures Contracts” below. Only current day’s variation margin, if any, is reported within the Statements of Assets and Liabilities. |
| # | Statements of Operations location: Amounts are included in net realized gain (loss) on: futures contracts, written options, swap agreements, or foreign currency transactions, as applicable. |
| ## | Statements of Operations location: Amounts are included in net change in unrealized appreciation (depreciation) on: futures contracts, written options, swap agreements, or translation of assets and liabilities in foreign currencies, as applicable. |
| † | Amount(s) disclosed represent average number of contracts, notional amounts, or shares/units outstanding, which is indicative of volume of this derivative type, for the months that the Fund held such derivatives during the period ended December 31, 2010. |
32
Notes to Financial Statements (Continued)
Further details regarding the derivatives and other investments held by the Funds during the period ended December 31, 2010, are discussed below.
Foreign Currency Exchange Transactions
A Fund may engage in foreign currency exchange transactions for hedging purposes in order to protect against uncertainty in the level of future foreign currency exchange rates, or for other, non-hedging purposes.
A Fund may use foreign currency exchange transactions for hedging purposes to protect against two principal risks. First, if a Fund has assets or liabilities denominated in foreign (non-U.S. dollar) currencies, the Fund is exposed to the risk that the values of those assets or liabilities in U.S. dollars may fall or rise due to changes in currency exchange rates. Second, if the Fund agrees, or expects, to receive or deliver an asset denominated in a foreign currency, it is exposed to currency exchange risk until the date of receipt or delivery. In order to reduce those risks, a Fund may enter into foreign currency futures or forward contracts, each of which calls for the Fund to purchase or sell a foreign currency at a time in the future at a price determined at the time the contract is entered into. Futures contracts are exchange-traded and typically have minimal exposure to counterparty risk; forward contracts are private contractual arrangements and a Fund is subject to the risk that its counterparty will not, or will not be able to, perform its obligations. Each type of arrangement may require the Fund to post margin.
Whenever a Fund enters into a foreign currency exchange transaction, it is subject to the risk that the value of the transaction will move in a direction unfavorable to it. When the Fund uses the transactions for hedging purposes, it is likely that the Fund will have an asset or liability that will offset any loss (or gain) on the transactions, at least in part. If a Fund enters into foreign currency exchange transactions other than for hedging purposes (for example, seeking to profit from an anticipated change in the values of currencies by creating directional exposures in the portfolio with respect to one or more currencies), it will generally be subject to the same risks, but is less likely to have assets or liabilities that will offset any losses on the transactions. There can be no assurance that a Fund will be able to terminate any foreign currency exchange transaction prior to its maturity in order to limit its loss on the transaction.
Forward foreign currency contracts are marked to market daily and the change in their value is recorded by the Funds as an unrealized gain or loss. Forward foreign currency contracts are valued at the settlement price established through dealers or other market sources on the day which they are traded. When a forward foreign currency contract is extinguished, through delivery or offset by entering into another forward foreign currency contract, the Funds record a realized gain or loss equal to the difference between the value of the contract at the time it was opened and the value of the contract at the time it was extinguished or offset. The notional or contractual amounts of these instruments do not necessarily represent the amounts potentially subject to risk. The measurement of the risk associated with these instruments is meaningful only when all related and offsetting transactions and counterparty risks are considered. See “Futures Contracts” below, for information regarding the accounting treatment of futures contracts.
The Fund(s) listed in the following table had open forward foreign currency contracts at December 31, 2010. A Fund’s current exposure to a counterparty is typically the fair value of the contract.
| | | | | | | | | | | | | | | | | | | | | | | | |
| | | Counterparty | | Units of
Currency | | | Contracts to
Deliver/Receive | | Settlement
Date | | | In Exchange
for U.S.
Dollars | | | Contracts at
Value | | | Unrealized
Appreciation
(Depreciation) | |
| PIMCO Total Return Fund | | | | | | | | | | | | | | | | | | | |
| BUYS | | | | | | | | | | | | | | | | | | | | | | | | |
| | Barclays Bank PLC | | | 200,000 | | | Australian Dollar | | | 1/28/11 | | | $ | 197,835 | | | $ | 204,118 | | | $ | 6,283 | |
| | Barclays Bank PLC | | | 202,000 | | | Canadian Dollar | | | 2/17/11 | | | | 198,266 | | | | 202,894 | | | | 4,628 | |
| | Barclays Bank PLC | | | 9,046,000 | | | Indian Rupee | | | 3/09/11 | | | | 200,177 | | | | 199,920 | | | | (257 | ) |
| | Barclays Bank PLC | | | 6,336,640 | | | Mexican Peso | | | 2/22/11 | | | | 500,000 | | | | 511,588 | | | | 11,588 | |
| | Barclays Bank PLC | | | 155,205 | | | New Turkish Lira | | | 1/27/11 | | | | 100,000 | | | | 100,456 | | | | 456 | |
| | Barclays Bank PLC | | | 728,400 | | | South African Rand | | | 1/28/11 | | | | 100,000 | | | | 110,179 | | | | 10,179 | |
| | Barclays Bank PLC | | | 111,900,000 | | | South Korean Won | | | 5/09/11 | | | | 100,000 | | | | 98,054 | | | | (1,946 | ) |
| | | | | | | | | | | | | | | | | | | | | | | | |
| | | | | | 1,396,278 | | | | 1,427,209 | | | | 30,931 | |
| | | | | | | | | | | | | | | | | | | | | | | | |
33
Notes to Financial Statements (Continued)
| | | | | | | | | | | | | | | | | | | | | | | | |
| | | Counterparty | | Units of
Currency | | | Contracts to
Deliver/Receive | | Settlement
Date | | | In Exchange
for U.S.
Dollars | | | Contracts at
Value | | | Unrealized
Appreciation
(Depreciation) | |
| PIMCO Total Return Fund (Continued) | | | | | | | | | | | | | | | | |
| BUYS | | | | | | | | | | | | | | | | | | | | | | | | |
| | Credit Suisse Securities LLC | | | 121,000 | | | Australian Dollar | | | 1/28/11 | | | $ | 115,047 | | | $ | 123,491 | | | $ | 8,444 | |
| | | | | | | | | | | | | | | | | | | | | | | | |
| | | | | | | |
| | Goldman Sachs & Co. | | | 6,598,500 | | | Philippine Peso | | | 11/15/11 | | | | 150,000 | | | | 149,802 | | | | (198 | ) |
| | Goldman Sachs & Co. | | | 64,790 | | | Singapore Dollar | | | 6/09/11 | | | | 50,000 | | | | 50,488 | | | | 488 | |
| | | | | | | | | | | | | | | | | | | | | | | | |
| | | | | | 200,000 | | | | 200,290 | | | | 290 | |
| | | | | | | | | | | | | | | | | | | | | | | | |
| | | | | | | |
| | JP Morgan Chase Bank | | | 1,777,900 | | | Brazilian Real | | | 3/02/11 | | | | 1,041,535 | | | | 1,057,411 | | | | 15,876 | |
| | JP Morgan Chase Bank | | | 1,555,000 | | | Canadian Dollar | | | 2/17/11 | | | | 1,542,016 | | | | 1,561,879 | | | | 19,863 | |
| | JP Morgan Chase Bank | |
| 1,959,750
|
| | Chinese Yuan Renminbi | |
| 11/15/11
|
| |
| 300,000
|
| |
| 298,839
|
| |
| (1,161
| )
|
| | JP Morgan Chase Bank | | | 310,250 | | | Malaysian Ringgit | | | 2/07/11 | | | | 100,000 | | | | 100,374 | | | | 374 | |
| | JP Morgan Chase Bank | | | 4,959,786 | | | Mexican Peso | | | 2/22/11 | | | | 400,000 | | | | 400,428 | | | | 428 | |
| | JP Morgan Chase Bank | | | 151,130 | | | New Turkish Lira | | | 1/27/11 | | | | 100,000 | | | | 97,818 | | | | (2,182 | ) |
| | JP Morgan Chase Bank | | | 13,168,000 | | | Philippine Peso | | | 6/15/11 | | | | 301,003 | | | | 299,886 | | | | (1,117 | ) |
| | JP Morgan Chase Bank | | | 6,585,000 | | | Philippine Peso | | | 11/15/11 | | | | 150,000 | | | | 149,495 | | | | (505 | ) |
| | JP Morgan Chase Bank | | | 129,640 | | | Singapore Dollar | | | 3/09/11 | | | | 100,000 | | | | 101,026 | | | | 1,026 | |
| | JP Morgan Chase Bank | | | 325,409 | | | Singapore Dollar | | | 6/09/11 | | | | 250,663 | | | | 253,576 | | | | 2,913 | |
| | JP Morgan Chase Bank | | | 736,590 | | | South African Rand | | | 1/28/11 | | | | 106,960 | | | | 111,418 | | | | 4,458 | |
| | JP Morgan Chase Bank | | | 696,950 | | | South African Rand | | | 4/28/11 | | | | 100,000 | | | | 104,088 | | | | 4,088 | |
| | JP Morgan Chase Bank | | | 454,212,181 | | | South Korean Won | | | 1/19/11 | | | | 399,999 | | | | 399,903 | | | | (96 | ) |
| | JP Morgan Chase Bank | | | 680,742,181 | | | South Korean Won | | | 5/09/11 | | | | 592,171 | | | | 596,508 | | | | 4,337 | |
| | | | | | | | | | | | | | | | | | | | | | | | |
| | | | | | 5,484,347 | | | | 5,532,649 | | | | 48,302 | |
| | | | | | | | | | | | | | | | | | | | | | | | |
| | | | | | | |
| | Royal Bank of Scotland PLC | | | 121,000 | | | Australian Dollar | | | 1/28/11 | | | | 115,181 | | | | 123,491 | | | | 8,310 | |
| | Royal Bank of Scotland PLC | | | 201,000 | | | Canadian Dollar | | | 2/17/11 | | | | 198,518 | | | | 201,889 | | | | 3,371 | |
| | | | | | | | | | | | | | | | | | | | | | | | |
| | | | | | 313,699 | | | | 325,380 | | | | 11,681 | |
| | | | | | | | | | | | | | | | | | | | | | | | |
| | | | | | | |
| | UBS AG | | | 2,485,750 | | | Mexican Peso | | | 2/22/11 | | | | 200,000 | | | | 200,686 | | | | 686 | |
| | UBS AG | | | 155,365 | | | New Turkish Lira | | | 1/27/11 | | | | 100,000 | | | | 100,559 | | | | 559 | |
| | | | | | | | | | | | | | | | | | | | | | | | |
| | | | | | 300,000 | | | | 301,245 | | | | 1,245 | |
| | | | | | | | | | | | | | | | | | | | | | | | |
| | | | | $ | 7,809,371 | | | $ | 7,910,264 | | | $ | 100,893 | |
| | | | | | | | | | | | | | | | | | | | | | | | |
34
Notes to Financial Statements (Continued)
| | | | | | | | | | | | | | | | | | | | | | | | |
| | | Counterparty | | Units of
Currency | | | Contracts to
Deliver/Receive | | Settlement
Date | | | In Exchange
for U.S.
Dollars | | | Contracts at
Value | | | Unrealized
Appreciation
(Depreciation) | |
| PIMCO Total Return Fund (Continued) | | | | | | | | | | | | | | | | |
| SELLS | | | | | | | | | | | | | | | | | | | | | | | | |
| | Barclays Bank PLC | | | 121,000 | | | Australian Dollar | | | 1/28/11 | | | $ | 117,239 | | | $ | 123,491 | | | $ | (6,252 | ) |
| | Barclays Bank PLC | | | 184,000 | | | Euro | | | 1/25/11 | | | | 241,233 | | | | 246,424 | | | | (5,191 | ) |
| | | | | | | | | | | | | | | | | | | | | | | | |
| | | | | | 358,472 | | | | 369,915 | | | | (11,443 | ) |
| | | | | | | | | | | | | | | | | | | | | | | | |
| | | | | | | |
| | JP Morgan Chase Bank | | | 3,234,000 | | | Euro | | | 1/06/11 | | | | 4,404,773 | | | | 4,331,282 | | | | 73,491 | |
| | JP Morgan Chase Bank | | | 100,000 | | | Euro | | | 1/25/11 | | | | 134,141 | | | | 133,925 | | | | 216 | |
| | JP Morgan Chase Bank | | | 454,212,181 | | | South Korean Won | | | 1/19/11 | | | | 393,359 | | | | 399,904 | | | | (6,545 | ) |
| | | | | | | | | | | | | | | | | | | | | | | | |
| | | | | | 4,932,273 | | | | 4,865,111 | | | | 67,162 | |
| | | | | | | | | | | | | | | | | | | | | | | | |
| | | | | | | |
| | Royal Bank of Scotland PLC | | | 10,000 | | | British Pound | | | 3/21/11 | | | | 15,633 | | | | 15,588 | | | | 45 | |
| | Royal Bank of Scotland PLC | | | 100,000 | | | Euro | | | 1/06/11 | | | | 132,984 | | | | 133,929 | | | | (945 | ) |
| | | | | | | | | | | | | | | | | | | | | | | | |
| | | | | | 148,617 | | | | 149,517 | | | | (900 | ) |
| | | | | | | | | | | | | | | | | | | | | | | | |
| | | | | | | |
| | UBS AG | | | 100,000 | | | Euro | | | 1/25/11 | | | | 133,561 | | | | 133,926 | | | | (365 | ) |
| | | | | | | | | | | | | | | | | | | | | | | | |
| | | | | $ | 5,572,923 | | | $ | 5,518,469 | | | $ | 54,454 | |
| | | | | | | | | | | | | | | | | | | | | | | | |
Futures Contracts
A Fund may seek to manage a variety of different risks through the use of futures contracts and related options, such as interest rate risk, equity price risk, and currency risk (see “Foreign Currency Exchange Transactions,” above, for a discussion of the use futures contracts in connection with currency risk). A Fund may use interest rate futures contracts to adjust the interest rate sensitivity (duration) of its portfolio or the credit exposure of the portfolio. Interest rate futures contracts obligate the long or short holder to take or make delivery of a specified quantity of a financial instrument, such as a specific fixed-income security, during a specified future period at a specified price. A Fund may use index futures to hedge against broad market risks to its portfolio or to gain broad market exposure when it holds uninvested cash or as an inexpensive substitute for cash investments directly in securities or other assets. Securities index futures contracts are contracts to buy or sell units of a securities index at a specified future date at a price agreed upon when the contract is made and are settled in cash. Positions in futures may be closed out only on an exchange or board of trade which provides a secondary market for such futures. Because futures contracts are exchange-traded, they typically have minimal exposure to counterparty risk.
Parties to a futures contract are not required to post the entire notional amount of the contract, but rather a small percentage of that amount (by way of margin), both at the time they enter into futures transactions, and then on a daily basis if their positions decline in value; as a result, futures contracts are highly leveraged. Such payments are known as variation margin and are recorded by the Funds as unrealized gains or losses. Because futures markets are highly leveraged, they can be extremely volatile, and there can be no assurance that the pricing of a futures contract will correlate precisely with the pricing of the asset or index underlying it or the asset or liability of the Fund that is the subject of the hedge. It may not always be possible for a Fund to enter into a closing transaction with respect to a futures contract it has entered into, at a favorable time or price. When a Fund enters into a futures transaction, it is subject to the risk that the value of the futures contract will move in a direction unfavorable to it. When the Fund uses futures contracts for hedging purposes, it is likely that the Fund will have an asset or liability that will offset any loss (or gain) on the transactions, at least in part.
35
Notes to Financial Statements (Continued)
If a Fund buys an option on a futures contract, it will have the right to assume a futures contract at a particular price during the course of the option. Its potential loss should generally be limited to the amount of the premium paid and any transaction costs. If a Fund sells an option on a futures contract, it is subject generally to the same risks as if it had entered into a futures contract underlying the option itself.
When a futures contract is closed, the Fund records a realized gain or loss equal to the difference between the value of the contract at the time it was opened and the value at the time it was closed. Futures contracts are valued at the settlement price established each day by the board of trade or exchange on which they are traded. See “Options, Rights, and Warrants,” below, for more information regarding the accounting treatment of options.
The Fund(s) listed in the following table had open futures contracts at December 31, 2010:
| | | | | | | | | | | | | | |
Number of
Contracts | | Type | | Expiration
Date | | | Notional
Contract
Value | | | Net Unrealized
Appreciation
(Depreciation) | |
| PIMCO Total Return Fund | | | | | | | | | | | | |
| BUYS | | | | | | | | | | | | | | |
| 61 | | 90 Day Eurodollar | | | 3/14/11 | | | $ | 15,194,337 | | | $ | 7,763 | |
| 15 | | U.S. Treasury Note 2 Year | | | 3/31/11 | | | | 3,283,594 | | | | 3,031 | |
| 63 | | 90 Day Eurodollar | | | 6/13/11 | | | | 15,680,700 | | | | 2,313 | |
| 57 | | 90 Day Eurodollar | | | 9/19/11 | | | | 14,170,912 | | | | 9,563 | |
| 13 | | 90 Day Eurodollar | | | 12/19/11 | | | | 3,226,275 | | | | (3,500 | ) |
| 32 | | 90 Day Eurodollar | | | 3/19/12 | | | | 7,924,000 | | | | (6,900 | ) |
| 3 | | 3 Month Sterling Interest Rate | | | 3/21/12 | | | | 576,173 | | | | (2,106 | ) |
| 12 | | 90 Day Eurodollar | | | 6/18/12 | | | | 2,963,400 | | | | (14,962 | ) |
| 1 | | 3 Month Sterling Interest Rate | | | 6/20/12 | | | | 191,531 | | | | (819 | ) |
| 19 | | 90 Day Eurodollar | | | 9/17/12 | | | | 4,678,988 | | | | (29,613 | ) |
| 24 | | 90 Day Eurodollar | | | 12/17/12 | | | | 5,892,900 | | | | (44,188 | ) |
| 20 | | 90 Day Eurodollar | | | 3/18/13 | | | | 4,896,750 | | | | (43,200 | ) |
| 3 | | 90 Day Eurodollar | | | 6/17/13 | | | | 732,375 | | | | (5,900 | ) |
| 15 | | 90 Day Eurodollar | | | 9/16/13 | | | | 3,651,750 | | | | (37,963 | ) |
| | | | | | | | | | | | | | |
| | | $ | (166,481 | ) |
| | | | | | | | | | | | | | |
Swap Agreements
Swap agreements are typically two-party contracts entered into primarily by institutional investors. In a standard “swap” transaction, two parties agree to exchange the returns (or differentials in rates of return) earned or realized on particular predetermined investments or instruments, which may be adjusted for an interest factor. The gross returns to be exchanged or “swapped” between the parties are generally calculated with respect to a “notional amount,” (i.e., the return on or increase in value of a particular dollar amount invested at a particular interest rate or in a “basket” of securities representing a particular index).
When a Fund enters into an interest rate swap, it typically agrees to make payments to its counterparty based on a specified long- or short-term interest rate, and will receive payments from its counterparty based on another interest rate. Other forms of interest rate swap agreements include interest rate caps, under which, in return for a specified payment stream, one party agrees to make payments to the other to the extent that interest rates exceed a specified rate, or “cap”; interest rate floors, under which, in return for a specified payment stream, one party agrees to make payments to the other to the extent that interest rates fall below a specified rate, or “floor”; and interest rate collars, under which a party sells a cap and purchases a floor or vice versa in an attempt to protect itself against interest rate movements exceeding given minimum or maximum levels. A Fund may enter into an interest rate swap in order, for example, to hedge against the effect of interest rate changes on the value of specific securities in its portfolio, or to adjust the interest rate sensitivity (duration) or the credit exposure of its portfolio overall, or otherwise as a substitute for a direct investment in debt securities.
36
Notes to Financial Statements (Continued)
A Fund also may enter into credit default swap transactions, as a “buyer” or “seller” of credit protection. In a credit default swap, one party provides what is in effect insurance against a default or other adverse credit event affecting an issuer of debt securities (typically referred to as a “reference entity”). In general, the buyer of credit protection is obligated to pay the protection seller an upfront amount or a periodic stream of payments over the term of the swap. If a “credit event” occurs, the buyer has the right to deliver to the seller bonds or other obligations of the reference entity (with a value up to the full notional value of the swap), and to receive a payment equal to the par value of the bonds or other obligations. Credit events that would trigger a request that the seller make payment are specific to each credit default swap agreement, but generally include bankruptcy, failure to pay, restructuring, obligation acceleration, obligation default, or repudiation/moratorium. When a Fund buys protection, it may or may not own securities of the reference entity. If it does own securities of the reference entity, the swap serves as a hedge against a decline in the value of the securities due to the occurrence of a credit event involving the issuer of the securities. If the Fund does not own securities of the reference entity, the credit default swap may be seen to create a short position in the reference entity. If a Fund is a buyer and no credit event occurs, the Fund will typically recover nothing under the swap, but will have had to pay the required upfront payment or stream of continuing payments under the swap. When a Fund sells protection under a credit default swap, the position may have the effect of creating leverage in the Fund’s portfolio through the Fund’s indirect long exposure to the issuer or securities on which the swap is written. When a Fund sells protection, it may do so either to earn additional income or to create such a “synthetic” long position.
During the period when a credit default swap is open, the transaction is marked to market in accordance with the terms of the agreement. Changes in the values of credit default swap agreements are recorded as unrealized gains or losses and periodic cash settlements are recorded as realized gains or losses.
Whenever a Fund enters into a swap agreement, it takes on counterparty risk — the risk that its counterparty will be unable or unwilling to meet its obligations under the swap agreement. The Fund also takes the risk that the market will move against its position in the swap agreement. In the case of an interest rate swap, the value of the swap may increase or decrease depending on changes in interest rates. In the case of a credit default swap, the swap will become more or less valuable depending on the credit of the issuer of the underlying security, and, if a credit event occurs under a swap where the Fund is the seller of credit protection, the Fund could be required to purchase the security at par value, resulting in a significant loss to the Fund. When the Fund enters into any type of swap for hedging purposes, it is likely that the Fund will have an asset or liability that will offset any loss (or gain) on the swap, at least in part. Swap agreements may be non-transferable or otherwise highly illiquid, and a Fund may not be able to terminate or transfer a swap agreement at any particular time or at an acceptable price.
A Fund may also enter into options on swap agreements (“swaptions”). A swaption is a contract that gives a counterparty the right (but not the obligation) to enter into a new swap agreement or to shorten, extend, cancel, or otherwise modify an existing swap agreement, at some designated future time on specified terms. A Fund may write (sell) and purchase put and call swaptions. Depending on the terms of the particular option agreement, a Fund will generally incur a greater degree of risk when it writes a swaption than it will incur when it purchases a swaption. When a Fund purchases a swaption, it risks losing only the amount of the premium it has paid should it decide to let the option expire unexercised. However, when a Fund writes a swaption, upon exercise of the option the Fund will become obligated according to the terms of the underlying agreement. A Fund may enter into swaptions for the same purposes as swaps. See “Options, Rights, and Warrants,” below, for information regarding the accounting treatment of options.
During the term of a swap transaction, changes in the value of the swap are recognized as unrealized gains or losses by marking to market to reflect the market value of the swap. When the swap is terminated, a Fund will record a realized gain or loss equal to the difference, if any, between the proceeds from (or cost of) the closing transaction and a Fund’s basis in the agreement. Upfront swap premium payments paid or received by a Fund, if any, are recorded within the value of the open swap agreement on the Fund’s Statement of Assets and Liabilities and represent payments paid or received upon entering into the swap agreement to compensate for differences between stated terms of the swap agreement and prevailing market conditions (credit spreads, currency exchange rates, and other relevant factors). These upfront payments are recorded as realized gain or loss on the Fund’s Statement of Operations upon termination or maturity of the swap agreement.
During the term of a swap transaction, the periodic net payments can be made for a set period of time or may be triggered by a predetermined credit event. The net periodic payments may be based on a fixed or variable interest rate, the change in market value of a specified security, basket of securities or index, or the return generated by a security. These periodic payments received or made by the Funds are recorded in the accompanying Statements of Operations as realized gains and losses, respectively.
37
Notes to Financial Statements (Continued)
The Fund(s) listed in the following table had open swap agreements at December 31, 2010. A Fund’s current exposure to a counterparty is typically the fair value of the agreement.
| | | | | | | | | | | | | | | | | | | | | | | | | | | | | | |
Notional
Amount | | | Currency | | Expiration
Date | | | Counterparty | | Buy/Sell
Protection | | Receive
(Pay)
Fixed
Rate | | | Deliverable on Default | | Unrealized
Appreciation
(Depreciation) | | | Premium
(Received)
Paid | | | Value | |
| PIMCO Total Return Fund* | | | | | | | | | |
| Credit Default Swaps | | | | | | | | | |
| | 1,400,000 | | | USD | | | 6/20/15 | | | Barclays Bank PLC | | Sell*** | | | 5.000% | | | CDX.EM.13 (PIMCO Rating: BA+)** | | $ | 4,629 | | | $ | 170,050 | | | $ | 174,679 | |
| | 400,000 | | | USD | | | 12/20/15 | | | Barclays Bank PLC | | Sell*** | | | 1.000% | | | Federative Republic of Brazil (PIMCO Rating: BAA-)** | | | 4,380 | | | | (2,308 | ) | | | 2,072 | |
| | 300,000 | | | USD | | | 12/20/15 | | | Barclays Bank PLC | | Sell*** | | | 5.000% | | | CDX.EM.14 (PIMCO Rating: BA+)** | | | 2,498 | | | | 38,250 | | | | 40,748 | |
| | 3,100,000 | | | USD | | | 12/20/15 | | | Barclays Bank PLC | | Sell*** | | | 5.000% | | | CDX.NA.HY.15 (PIMCO Rating: B-)** | | | 1,952 | | | | 83,625 | | | | 85,577 | |
| | | | | | | | | | | | | | | | | | | | | | | | | | | | | | |
| | | | | | | | | | | | | | | | | | | | | 13,459 | | | | 289,617 | | | | 303,076 | |
| | | | | | | | | | | | | | | | | | | | | | | | | | | | | | |
| | 1,300,000 | | | USD | | | 12/20/15 | | | Credit Suisse Securities LLC | | Sell*** | | | 1.000% | | | CDX.NA.IG.15 (PIMCO Rating: BAA+)** | | | 13,718 | | | | (4,950 | ) | | | 8,768 | |
| | | | | | | | | | | | | | | | | | | | | | | | | | | | | | |
| | 1,000,000 | | | USD | | | 12/20/15 | | | Goldman Sachs & Co. | | Sell*** | | | 0.250% | | | French Republic (PIMCO Rating: AAA)** | | | (18,417 | ) | | | (19,610 | ) | | | (38,027 | ) |
| | 100,000 | | | USD | | | 12/20/15 | | | Goldman Sachs & Co. | | Sell*** | | | 1.000% | | | CDX.NA.IG.15 (PIMCO Rating: BAA+)** | | | 1,147 | | | | (472 | ) | | | 675 | |
| | 100,000 | | | USD | | | 12/20/15 | | | Goldman Sachs & Co. | | Sell*** | | | 1.000% | | | United Kingdom of Great Britain and Northern Ireland (PIMCO Rating: AAA)** | | | (881 | ) | | | 2,301 | | | | 1,420 | |
| | 100,000 | | | USD | | | 3/20/16 | | | Goldman Sachs & Co. | | Sell*** | | | 1.000% | | | General Electric Capital Corp. (PIMCO Rating: AA+)** | | | (40 | ) | | | (1,685 | ) | | | (1,725 | ) |
| | | | | | | | | | | | | | | | | | | | | | | | | | | | | | |
| | | | | | | | | | | | | | | | | | | | | (18,191 | ) | | | (19,466 | ) | | | (37,657 | ) |
| | | | | | | | | | | | | | | | | | | | | | | | | | | | | | |
| | 800,000 | | | USD | | | 12/20/15 | | | JP Morgan Chase Bank | | Sell*** | | | 1.000% | | | CDX.NA.IG.15 (PIMCO Rating: BAA+)** | | | 4,135 | | | | 1,260 | | | | 5,395 | |
| | 100,000 | | | USD | | | 12/20/15 | | | JP Morgan Chase Bank | | Sell*** | | | 5.000% | | | CDX.NA.HY.15 (PIMCO Rating: B-)** | | | 2,823 | | | | (63 | ) | | | 2,760 | |
| | | | | | | | | | | | | | | | | | | | | | | | | | | | | | |
| | | | | | | | | | | | | | | | | | | | | 6,958 | | | | 1,197 | | | | 8,155 | |
| | | | | | | | | | | | | | | | | | | | | | | | | | | | | | |
| | | | | | | | | |
| | 900,000 | | | USD | | | 12/20/15 | | | UBS AG | | Sell*** | | | 1.000% | | | CDX.NA.IG.15 (PIMCO Rating: BAA+)** | | | 578 | | | | 5,492 | | | | 6,070 | |
| | | | | | | | | | | | | | | | | | | | | | | | | | | | | | |
| | | | | | | | |
Notional
Amount | | | Currency | | Expiration
Date | | | Counterparty | | Payments Made by Fund | | | Payments Received by
Fund | | Unrealized
Appreciation
(Depreciation) | | | Premium
(Received)
Paid | | | Value | |
| Interest Rate Swaps | | | | | | | | | |
| | 500,000 | | | USD | | | 12/19/13 | | | Goldman Sachs & Co. | | 3-Month USD-LIBOR-BBA | | | Fixed 1.250% | | $ | (4,509 | ) | | $ | 25 | | | $ | (4,484 | ) |
| | | | | | | | | | | | | | | | | | | | | | | | | | | | | | |
| * | Collateral for swap agreements received from Barclays Bank PLC amounted to $260,000 at December 31, 2010. |
| ** | Rating is determined by Pacific Investment Management Company LLC and represents a weighted average rating of all securities included in the underlying index for the credit default swap. The source of the ratings for the underlying securities are Moody’s Investor Service, Inc., Standard & Poor’s Ratings Group, and/or Fitch Ratings. All ratings are as of the report due date and do not reflect subsequent changes. |
| *** | For each credit derivative with sold protection, the credit ratings of the entities referenced, as rated by any rating organization, are included in the equivalent Pacific Investment Management Company LLC’s rating category. The reference entity rating represents the likelihood of a potential payment by the Fund if the referenced entity experiences a credit event as of period end. Notional amounts represent the maximum potential amount of future payments (undiscounted) the Fund could be required to make under the credit derivatives with sold protection. |
38
Notes to Financial Statements (Continued)
Options, Rights, and Warrants
A Fund may purchase and sell put and call options on securities or an index of securities to enhance investment performance or to protect against changes in market prices. A Fund that invests in debt securities may also purchase and sell put and call options to adjust the interest rate sensitivity of its portfolio or the credit exposure of the portfolio.
A call option gives the holder the right to purchase, and obligates the writer to sell, a security at the strike price at any time before the expiration date. A Fund may write call options on a security it owns, in a “directional” strategy hoping to realize a greater current return through the receipt of premiums. In return for the option premium, the Fund takes the risk that it will have to forego any increase in the value of the security over the strike price. When a Fund has written a call option on a security it does not own, its exposure on such an option is theoretically unlimited. A Fund may enter into closing purchase transactions in order to realize a profit or limit a loss on a previously written call option or, in the case of a call option on a security it owns, to free itself to sell the underlying security or to write another call on the security, or protect a security from being called in an unexpected market rise. Any profits from a closing purchase transaction in the case of a call option on a security a Fund owns may be offset by a decline in the value of the underlying security. Conversely, because increases in the market price of a call option will generally reflect increases in the market price of the underlying security, any loss resulting from a closing purchase transaction relating to a call option on a security a Fund owns is likely to be offset in whole or in part by unrealized appreciation of the underlying security owned by the Fund. A Fund may not be able to close out a call option that it has previously written.
A put option gives the holder the right to sell, and obligates the writer to buy, a security at the exercise price at any time before the expiration date. A Fund may write put options in order to enhance its current return by taking a long directional position as to a security or index of securities. By writing a put option, the Fund assumes the risk that it may be required to purchase the underlying security for an exercise price higher than its then current market value, resulting in a potential capital loss unless the security later appreciates in value. A Fund may terminate a put option that it has written before it expires by entering into a closing purchase transaction. Any loss from this transaction may be partially or entirely offset by the premium received on the terminated option. A Fund may not be able to close out a put option that it has previously written.
When a Fund writes a call or put option, an amount equal to the premium received is recorded as a liability. Premiums received from writing options which expire are treated as realized gains. Premiums received from writing options which are exercised or closed are added to the proceeds or offset against the amount paid on the underlying investment to determine the realized gain or loss.
A Fund may purchase put options to protect portfolio holdings against a decline in market value of a security or securities held by it. A Fund may also purchase a put option hoping to profit from an anticipated decline in the value of the underlying security. If the Fund holds the security underlying the option, the option premium and any transaction costs will reduce any profit the Fund might have realized had it sold the underlying security instead of buying the put option. A Fund may purchase call options to hedge against an increase in the price of securities that the Fund wants ultimately to buy. A Fund may also purchase a call option as a long directional investment hoping to profit from an anticipated increase in the value of the underlying security. In order for a call option to be profitable, the market price of the underlying security must rise sufficiently above the exercise price to cover the premium and transaction costs. These costs will reduce any profit the Fund might have realized had it bought the underlying security at the time it purchased the call option.
When a Fund purchases an option, it runs the risk that it will lose its entire investment in the option in a relatively short period of time, unless the Fund exercises the option or enters into a closing sale transaction before the option’s expiration. If the price of the underlying security does not rise (in the case of a call) or fall (in the case of a put) to an extent sufficient to cover the option premium and transaction costs, the Fund will lose part or all of its investment in the option. This contrasts with an investment by a Fund in the underlying security, since the Fund will not realize a loss if the security’s price does not change. Premiums paid for purchasing options that expire are treated as realized losses.
Options purchased or sold by a Fund may be traded on a securities or options exchange or market. Such options typically have minimal exposure to counterparty risk. However, an exchange or market may at times find it necessary to impose restrictions on particular types of options transactions, such as opening transactions. If an underlying security ceases to meet qualifications imposed by the market or the Options Clearing Corporation, new series of options on that security will no longer be opened to replace expiring series, and opening transactions in existing series may be prohibited.
39
Notes to Financial Statements (Continued)
OTC options purchased or sold by a Fund are not traded on securities or options exchanges or backed by clearinghouses. Rather, they are entered into directly between a Fund and the counterparty to the option. In the case of an OTC option purchased by the Fund, the value of the option to the Fund will depend on the willingness and ability of the option writer to perform its obligations to the Fund. In addition, OTC options may not be transferable and there may be little or no secondary market for them, so they may be considered illiquid. It may not be possible to enter into closing transactions with respect to OTC options or otherwise to terminate such options, and as a result a Fund may be required to remain obligated on an unfavorable OTC option until its expiration.
Exchange traded options are valued at the last sale price, or if no sales are reported, the last bid price for purchased options and the last ask price for written options. OTC options are valued using prices supplied by a primary pricing source, selected pursuant to procedures approved by the Trustees.
A Fund may invest in rights and warrants to purchase securities. Rights or warrants generally give the holder the right to receive, upon exercise, a security at a stated price. Funds typically use rights and warrants in a manner similar to their use of options on securities, as described above. Risks associated with the use of rights or warrants are generally similar to risks associated with the use of options.
The Fund(s) listed in the following table had open written option contracts at December 31, 2010. A Fund’s current exposure to a counterparty is typically the fair value of the contract.
| | | | | | | | | | | | | | | | |
Notional
Amount | | | Expiration
Date | | | Description | | Premiums
Received | | | Value | |
| PIMCO Total Return Fund | | | | | | |
| $ | 55,000 | | | | 9/19/11 | | | Eurodollar Futures Put, Strike 99.38 | | $ | 13,755 | | | $ | 9,075 | |
| | 55,000 | | | | 9/19/11 | | | Eurodollar Futures Call, Strike 99.38 | | | 9,398 | | | | 12,925 | |
| | 2,100,000 | | | | 10/11/12 | | | Interest Rate Swaption USD 1 Year Call, Strike TBD* | | | 11,088 | | | | 17,022 | |
| | 500,000 | | | | 10/11/12 | | | Interest Rate Swaption USD 1 Year Call, Strike TBD** | | | 2,540 | | | | 4,053 | |
| | 1,300,000 | | | | 11/14/11 | | | Interest Rate Swaption USD 1 Year Put, Strike 0.65* | | | 2,665 | | | | 6,544 | |
| | 1,000,000 | | | | 6/18/12 | | | Interest Rate Swaption USD 3 Year Put, Strike 3.00*** | | | 6,325 | | | | 12,707 | |
| | 4,100,000 | | | | 9/24/12 | | | Interest Rate Swaption USD 2 Year Put, Strike 2.25* | | | 24,327 | | | | 54,437 | |
| | 1,500,000 | | | | 11/19/12 | | | Interest Rate Swaption USD 1 Year Put, Strike 1.00* | | | 8,558 | | | | 17,234 | |
| | 1,800,000 | | | | 11/19/12 | | | Interest Rate Swaption USD 1 Year Put, Strike 1.75**** | | | 6,795 | | | | 13,259 | |
| | | | | | | | | | | | | | | | |
| | | | | | | | | | $ | 85,451 | | | $ | 147,256 | |
| | | | | | | | | | | | | | | | |
| * | OTC traded option counterparty Goldman Sachs & Co. |
| ** | OTC traded option counterparty JP Morgan Chase Bank. |
| *** | OTC traded option counterparty Credit Suisse Securities LLC. |
| **** | OTC traded option counterparty Royal Bank of Scotland PLC. |
Transactions in written option contracts during the period ended December 31, 2010, were as follows:
| | | | | | | | |
| | | Number of
Contracts | | | Premiums
Received | |
| PIMCO Total Return Fund | | | | | | | | |
Options outstanding at August 10, 2010 | | | - | | | $ | - | |
Options written | | | 12,300,103 | | | | 109,962 | |
Options terminated in closing purchase transactions | | | (59 | ) | | | (24,511 | ) |
Options expired | | | - | | | | - | |
Options exercised | | | - | | | | - | |
| | | | | | | | |
Options outstanding at December 31, 2010 | | | 12,300,044 | | | $ | 85,451 | |
| | | | | | | | |
The Fund(s) had no rights, warrants, or purchased options at December 31, 2010.
40
Notes to Financial Statements (Continued)
When-Issued, Delayed-Delivery, and Forward Commitment Transactions
A Fund may enter into when-issued, delayed-delivery, or forward commitment transactions in order to lock in the purchase price of the underlying security, or in order to adjust the interest rate exposure of the Fund’s existing portfolio. In when-issued, delayed-delivery, or forward commitment transactions, a Fund commits to purchase or sell particular securities, with payment and delivery to take place at a future date. Although a Fund does not typically pay for the securities until they are delivered, it immediately assumes the risks of ownership, including the risk of price fluctuation. If a Fund’s counterparty fails to deliver a security purchased on a when-issued, delayed-delivery, or forward commitment basis, there may be a loss, and the Fund may have missed an opportunity to make an alternative investment.
Prior to settlement of these transactions, the value of the subject securities will fluctuate, reflecting interest rate changes. In addition, because the Fund is not required to pay for when-issued, delayed-delivery, or forward commitment securities until the delivery date, they may result in a form of leverage to the extent the Fund does not maintain liquid assets equal to the face amount of the contract.
These securities are valued on the basis of valuations furnished by a pricing service, selected pursuant to procedures approved by the Trustees, which determines valuations taking into account appropriate factors such as institutional-size trading in similar groups of securities, yield, quality, coupon rate, maturity, type of issue, trading characteristics, and other market data. Securities for which no market quotation is available are valued at fair value in accordance with procedures approved by the Trustees. The Funds record on a daily basis the unrealized appreciation (depreciation) based upon changes in the values of these securities. When a when-issued, delayed-delivery, or forward commitment transaction is closed, the Funds record a realized gain or loss equal to the difference between the value of the transaction at the time it was opened and the value of the transaction at the time it was closed.
The Fund(s) had securities purchased on a when-issued, delayed-delivery, or forward commitment basis as shown in the Portfolio(s) of Investments at December 31, 2010.
Dollar Roll Transactions
A Fund may enter into dollar roll transactions, in which the Fund sells mortgage-backed securities for delivery in the current month and simultaneously contracts to purchase substantially similar securities on a specified future date from the same party. A Fund may invest in dollar rolls in order to benefit from anticipated changes in pricing for the mortgage-backed securities during the term of the transaction, or for the purpose of creating investment leverage. In a dollar roll, the securities that are to be purchased will be of the same type as the securities sold, but will be supported by different pools of mortgages.
A Fund that engages in a dollar roll forgoes principal and interest paid on the sold securities during the roll period, but is compensated by the difference between the current sales price and the lower forward price for the future purchase. In addition, a Fund may benefit by investing the transaction proceeds during the roll period. Dollar roll transactions may have the effect of creating leverage in a Fund’s portfolio. Dollar rolls involve the risk that the Fund’s counterparty will be unable to deliver the mortgage-backed securities underlying the dollar roll at the fixed time. If the counterparty files for bankruptcy or becomes insolvent, the counterparty or its representative may ask for and receive an extension of time to decide whether to enforce the Fund’s repurchase obligation. A Fund’s use of the transaction proceeds may be restricted pending such decision. It is possible that the Fund will incur a loss on a dollar roll transaction (either because its counterparty fails to perform or because the value of the mortgages subject to the transaction declines) and on the investments made by the Fund with the proceeds of the dollar roll transaction.
A Fund accounts for a dollar roll transaction as a purchase and sale whereby the difference in the sales price and purchase price of the security sold is recorded as a realized gain (loss). If certain criteria are met, these dollar roll transactions may be considered financing transactions, whereby the difference in the sales price and the future purchase price is recorded as an adjustment to interest income.
The PIMCO Total Return Fund had dollar roll transactions during the period ended December 31, 2010, which were accounted for as purchase and sale transactions.
41
Notes to Financial Statements (Continued)
Inflation-Indexed Bonds
The Funds may invest in inflation-indexed bonds, which are fixed income securities whose principal value or coupon is periodically adjusted according to the rate of inflation. Any increase or decrease in the principal amount of an inflation-indexed bond will be included as interest income.
Inflation-indexed securities issued by the U.S. Treasury have maturities of five, ten, twenty, or thirty years, although it is possible that securities with other maturities will be issued in the future. The U.S. Treasury securities pay interest on a semi-annual basis, equal to a fixed percentage of the inflation-adjusted principal amount.
If the periodic adjustment rate measuring inflation falls, the principal value of inflation-indexed bonds will be adjusted downward, and consequently the interest payable on these securities (calculated with respect to a smaller principal amount) will be reduced. Repayment of the original bond principal upon maturity (as adjusted for inflation) is guaranteed in the case of U.S. Treasury inflation-indexed bonds, even during a period of deflation. However, the current market value of the bonds is not guaranteed, and will fluctuate. The Funds may also invest in other inflation related bonds which may or may not provide a similar guarantee. If a guarantee of principal is not provided, the adjusted principal value of the bond repaid at maturity may be less than the original principal.
The value of inflation-indexed bonds is expected to change in response to changes in real interest rates. Real interest rates in turn are tied to the relationship between nominal interest rates and the rate of inflation. Therefore, if inflation were to rise at a faster rate than nominal interest rates, real interest rates might decline, leading to an increase in value of inflation-indexed bonds. In contrast, if nominal interest rates increased at a faster rate than inflation, real interest rates might rise, leading to a decrease in value of inflation-indexed bonds.
While the values of these securities are expected to be protected from long-term inflationary trends, short-term increases in inflation may lead to a decline in value. If interest rates rise due to reasons other than inflation (for example, due to changes in currency exchange rates), investors in these securities may not be protected to the extent that the increase is not reflected in the bond’s inflation measure.
The periodic adjustment of U.S. Treasury inflation-indexed bonds is tied to the Consumer Price Index for Urban Consumers (“CPI-U”), which is calculated monthly by the U.S. Bureau of Labor Statistics. The CPI-U is a measurement of changes in the cost of living, made up of components such as housing, food, transportation, and energy. Inflation-indexed bonds issued by a foreign government are generally adjusted to reflect a comparable inflation index, calculated by that government. There can be no assurance that the CPI-U or any foreign inflation index will accurately measure the real rate of inflation in the prices of goods and services. Moreover, there can be no assurance that the rate of inflation in a foreign country will be correlated to the rate of inflation in the United States.
The Fund(s) held inflation-indexed bonds as shown in the Portfolio(s) of Investments during the period ended December 31, 2010.
Short Sales
A short sale is a transaction in which a Fund sells a security it does not own in anticipation that the market price of that security will decline. When a Fund makes a short sale on a security, it must borrow the security sold short and deliver it to a broker dealer through which it made the short sale as collateral for its obligation to deliver the security upon the conclusion of the sale. A Fund may have to pay a fee to borrow particular securities and is often obligated to pay over any accrued interest and dividends on such borrowed securities. If the price of the security sold short increases between the time of the short sale and the time a Fund replaces the borrowed security, a Fund will incur a loss, which could be unlimited, in cases where a Fund is unable for whatever reason to close out its short position; conversely, if the price declines, a Fund will realize a capital gain. Any gain will be decreased, and any loss increased, by the transaction costs described above. The successful use of short selling may be adversely impacted by imperfect correlation between movements in the price of the security sold short and the securities being hedged.
The Fund(s) held securities sold short as shown in the Portfolio(s) of Investments at December 31, 2010.
42
Notes to Financial Statements (Continued)
Repurchase Agreements
Each Fund may enter into repurchase agreements with certain banks and broker-dealers whereby a Fund acquires a security for cash and obtains a simultaneous commitment from the seller to repurchase the security at an agreed upon price and date. A Fund, through its custodian, takes possession of the securities collateralizing the repurchase agreement. Repurchase agreements must be fully collateralized at all times, but involve some risk to the Fund if the other party should default on its obligation and the Fund is delayed or prevented from recovering the collateral, or if the Fund is required to return collateral to a borrower at a time when it may realize a loss on the investment of that collateral. Collateral for certain tri-party repurchase agreements is held at the Fund’s custodian or sub-custodian in a segregated account for the benefit of the Fund and the counterparty.
The Fund(s) had repurchase agreements as shown in the Portfolio(s) of Investments at December 31, 2010.
Reverse Repurchase Agreements
Each Fund may enter into reverse repurchase agreements with banks and broker-dealers to enhance return. Reverse repurchase agreements involve sales by a Fund of portfolio securities concurrently with an agreement by the Fund to repurchase the same securities at a later date at a fixed price. During the reverse repurchase agreement period, the Fund continues to receive principal and interest payments on the securities and also has the opportunity to earn a return on the collateral furnished by the counterparty to secure its obligation to redeliver the securities. A reverse repurchase agreement generally creates investment leverage. If the counterparty in a reverse repurchase agreement files for bankruptcy or becomes insolvent, a Fund’s use of proceeds from the sale of its securities may be restricted while the other party or its trustee or receiver determines whether to enforce the Fund’s obligation to repurchase the securities.
| | | | |
PIMCO Total Return Fund | | | | |
Average balance outstanding | | $ | 173,979 | |
Average interest rate | | | 0.18 | % |
Maximum balance outstanding | | $ | 1,193,000 | |
Weighted average maturity | | | 21 days | |
Average balance outstanding was calculated based on daily balances outstanding during the period that the Fund had entered into reverse repurchase agreements.
The Fund(s) had no open reverse repurchase agreements at December 31, 2010.
Accounting for Investment Transactions
Investment transactions are accounted for on the trade date. Realized gains and losses on sales of investments and unrealized appreciation and depreciation of investments are computed by the specific identification cost method. Proceeds received from litigation, if any, are included in realized gains on investment transactions for any investments that are no longer held in the portfolio and as a reduction in cost for investments that continue to be held in the portfolio. Interest income and interest expense, adjusted for amortization of discounts and premiums on debt securities, are earned from the settlement date and are recorded on the accrual basis. Dividend income, dividend expense and distributions are recorded on the ex-dividend date. Withholding taxes on foreign interest, dividends, and capital gains have been provided for in accordance with the applicable country’s tax rules and rates. Foreign dividend income is recorded on the ex-dividend date or as soon as practicable after the Fund determines the existence of a dividend declaration after exercising reasonable due diligence. Distributions received on securities that represent a return of capital or capital gain are recorded as a reduction of cost of investments and/or as a realized gain. The Funds estimate the components of distributions received that may be considered return of capital distributions or capital gain distributions.
Foreign Currency Translation
The books and records of the Funds are maintained in U.S. dollars. The market values of foreign currencies, foreign securities, and other assets and liabilities denominated in foreign currencies are translated into U.S. dollars at the mean of the buying and selling
43
Notes to Financial Statements (Continued)
rates of such currencies against the U.S. dollar at the end of each business day. Purchases and sales of foreign securities and income and expense items are translated at the rates of exchange prevailing on the respective dates of such transactions. The Funds do not isolate that portion of the results of operations arising from changes in the exchange rates from that portion arising from changes in the market prices of securities. Net realized foreign currency gains and losses resulting from changes in exchange rates include foreign currency gains and losses between trade date and settlement date on investment securities transactions, foreign currency transactions, and the difference between the amounts of dividends or interest recorded on the books of the Funds and the amount actually received.
Allocation of Operating Activity
In maintaining the records for the Funds, the income and expense accounts are allocated to each class of shares. Investment income, unrealized and realized gains or losses are prorated among the classes of shares based on the relative net assets of each. Expenses are allocated to each class of shares depending on the nature of the expenditures. Administration and service fees, if any, which are directly attributable to a class of shares, are changed to that class’s operations. Expenses of the Fund not directly attributable to the operations of any class of shares or Fund are prorated among the Funds and classes to which the expense relates based on the relative net assets of each.
Foreign Securities
The Funds may invest in foreign securities. Foreign securities, including ADRs, are subject to additional risks compared to securities of U.S. issuers, including international trade, currency, political, regulatory, and diplomatic risks. In addition, fluctuations in currency exchange rates may adversely affect the values of foreign securities and the price of a Fund’s shares. Emerging markets securities are subject to greater risks than securities issued in developed foreign markets, including less liquidity, greater price volatility, higher relative rates of inflation, greater political and economic instability, and greater volatility in currency exchange rates.
Credit Risk
The Funds may invest a portion of their assets, directly or indirectly, in securities backed by mortgage loans, credit card receivables, and automotive loans. The values and related income of these securities are sensitive to changes in economic conditions, including delinquencies and/or defaults. Continuing shifts in the market’s perception of credit quality on such securities have resulted in increased volatility of market price and periods of decreased market activity that have adversely impacted the valuation and liquidity of such securities.
Federal Income Tax
It is each Fund’s intent to continue to comply with the provisions of subchapter M of the Internal Revenue Code of 1986, as amended (the “Code”), applicable to a regulated investment company. Under such provisions, the Funds would not be subject to federal income taxes on their ordinary income and net realized capital gains to the extent they are distributed or deemed to have been distributed to their shareholders. Therefore, the Funds have not made any provision for federal income tax.
Dividends and Distributions to Shareholders
Dividends from net investment income of each Fund are declared and paid annually and at other times as may be required to satisfy tax or regulatory requirements. Distributions of any net realized capital gains of each Fund are declared and paid annually and at other times as may be required to satisfy tax or regulatory requirements.
Distributions to shareholders are recorded on the ex-dividend date. Income and capital gain distributions are determined in accordance with income tax regulations, which may differ from generally accepted accounting principles. As a result, net investment income and net realized capital gains on investment transactions for a reporting period may differ significantly from distributions during such period.
44
Notes to Financial Statements (Continued)
| 3. | | Management Fees and Other Transactions |
Investment Management Fees
Under agreements between MassMutual and the Trust on behalf of each Fund, MassMutual is responsible for providing investment management services for each Fund. In return for these services, MassMutual receives advisory fees, based upon each Fund’s average daily net assets, at the following annual rates:
| | |
Fundamental Value Fund | | 0.65% |
PIMCO Total Return Fund | | 0.50% |
MassMutual has entered into investment subadvisory agreements with the following unaffiliated investment subadvisers: Pacific Investment Management Company LLC for the PIMCO Total Return Fund and Wellington Management Company, LLP for the Fundamental Value Fund. MassMutual pays a subadvisory fee to each of these subadvisers based upon the aggregate net assets under management which include (1) the average daily net assets of the specified Fund which it manages, and (2) the average daily net assets of all other funds or accounts of MassMutual or its affiliates for which the subadviser provides subadvisory services and which have substantially the same investment objectives, policies and investment strategies.
The Funds’ subadvisory fees are paid by MassMutual out of the management fees previously disclosed above.
Administration Fees
Under separate administrative and shareholder services agreements between each Fund and MassMutual, MassMutual provides certain administrative and shareholder services and bears some class specific administrative expenses. In return for these services, MassMutual receives an administrative services fee, based upon the average daily net assets of the applicable class of shares of the Fund, at the following annual rates:
| | | | |
| | | Class II | |
Fundamental Value Fund | | | 0.10% | |
PIMCO Total Return Fund | | | 0.10% | |
Expense Caps and Waivers
MassMutual agreed to bear the expenses of the Funds (other than extraordinary litigation and legal expenses, Acquired Fund fees and expenses#, or other non-recurring or unusual expenses such as, for example, organizational expenses and shareholder meeting expenses) based upon the average daily net assets of the applicable class of shares of the Funds, as follows:
| | | | | | | | | | |
| Fundamental Value Fund* | | | PIMCO Total Return Fund*^ | |
Class II | | | 0.80% | | | Class II | | | 0.65% | |
| # | Acquired Fund fees and expenses are expenses borne indirectly by a Fund through investments in other pooled investment vehicles. |
| * | Expense caps in effect through April 30, 2012. |
| ^ | Expense caps also exclude interest expense. |
Expense caps and waiver amounts are reflected as a reduction of expenses on the Statements of Operations.
Rebated Brokerage Commissions
The Fundamental Value Fund has entered into agreements with certain brokers whereby the brokers will rebate to the Funds, in cash, a portion of brokerage commissions. Rebated brokerage commissions are amounts earned by the Fund and are included with realized gain or loss on investment transactions presented in the Statement of Operations. For the period ended December 31, 2010, brokerage commissions rebated under these agreements amounted to $885.
45
Notes to Financial Statements (Continued)
Deferred Compensation
Trustees of the Funds who are not employees of MassMutual or its subsidiaries may elect to defer receipt of their annual fees in accordance with terms of a Non-Qualified Deferred Compensation Plan. Amounts deferred shall accrue interest or earnings and shall be recorded on the Funds’ books as other liabilities. Deferred compensation is included within Trustees’ fees and expenses in the Statements of Assets and Liabilities.
Other
Certain officers and trustees of the Funds are also employees of MassMutual. The compensation of each trustee who is not an employee of MassMutual is borne by the Funds.
| 4. | | Purchases and Sales of Investments |
Cost of purchases and proceeds from sales of investment securities (excluding short-term investments) for the period ended December 31, 2010, were as follows:
| | | | | | | | | | | | | | | | |
| | | Purchases | | | Sales | |
| | | Long-Term U.S.
Government
Securities | | | Other
Long-Term
Securities | | | Long-Term U.S.
Government
Securities | | | Other
Long-Term
Securities | |
Fundamental Value Fund | | $ | - | | | $ | 122,696,207 | | | $ | - | | | $ | 9,612,129 | |
PIMCO Total Return Fund | | | 338,450,040 | | | | 32,414,839 | | | | 216,009,196 | | | | 145,660 | |
| 5. | | Capital Share Transactions |
Changes in shares outstanding for each Fund were as follows:
| | | | | | | | |
| | | Period ended December 31, 2010 | |
| | |
| | | Shares | | | Amount | |
Fundamental Value Fund Class II* | | | | | | | | |
Sold | | | 18,694,754 | | | $ | 183,678,881 | |
Issued as reinvestment of dividends | | | 80,723 | | | | 879,072 | |
Redeemed | | | (7,342,519 | ) | | | (69,763,799 | ) |
| | | | | | | | |
Net increase (decrease) | | | 11,432,958 | | | $ | 114,794,154 | |
| | | | | | | | |
PIMCO Total Return Fund Class II* | | | | | | | | |
Sold | | | 21,290,525 | | | $ | 213,715,026 | |
Issued as reinvestment of dividends | | | 134,507 | | | | 1,323,552 | |
Redeemed | | | (8,007,038 | ) | | | (80,534,931 | ) |
| | | | | | | | |
Net increase (decrease) | | | 13,417,994 | | | $ | 134,503,647 | |
| | | | | | | | |
| * | Fund commenced operations on August 10, 2010. |
46
Notes to Financial Statements (Continued)
| 6. | | Federal Income Tax Information |
At December 31, 2010, the cost of securities and the unrealized appreciation (depreciation) in the value of investments owned by the Funds, as computed on a federal income tax basis, were as follows:
| | | | | | | | | | | | | | | | |
| | | Federal Income
Tax Cost | | | Tax Basis
Unrealized
Appreciation | | | Tax Basis
Unrealized
(Depreciation) | | | Net
Unrealized
Appreciation
(Depreciation) | |
Fundamental Value Fund | | $ | 114,899,861 | | | $ | 12,495,557 | | | $ | (803,695 | ) | | $ | 11,691,862 | |
PIMCO Total Return Fund | | | 171,293,722 | | | | 721,755 | | | | (1,869,372 | ) | | | (1,147,617 | ) |
Net capital loss carryforwards may be applied against any net realized taxable gains in succeeding years, subject to the carryforward period limitations, where applicable. On December 22, 2010, the Regulated Investment Company Modernization Act of 2010 (the “Modernization Act”) was signed by The President. The Modernization Act changed the capital loss carryforward rules as they relate to regulated investment companies. Capital losses generated in tax years beginning after the date of enactment may now be carried forward indefinitely, and retain the character of the original loss. Under pre-enactment law, capital losses could be carried forward for up to eight tax years as short-term capital losses. The provisions affecting the utilization of capital loss carryforwards under the Modernization Act also require the utilization of post-enactment losses prior to the utilization of pre-enactment losses.
The PIMCO Total Return Fund elected to defer to the fiscal year beginning January 1, 2011, post-October capital losses in the amount of $730,076.
Accounting principles generally accepted in the United States of America require that only distributions in excess of tax basis earnings and profits be reported in the financial statements as a return of capital.
The tax character of distributions (including capital gain dividends, if any, designated pursuant to Section 852 of the Code) paid during the period ended December 31, 2010, was as follows:
| | | | | | | | | | | | |
| | | Ordinary
Income | | | Long Term
Capital Gain | | | Return of
Capital | |
Fundamental Value Fund | | $ | 879,072 | | | $ | - | | | $ | - | |
PIMCO Total Return Fund | | | 1,313,166 | | | | 10,386 | | | | - | |
Capital accounts within financial statements are periodically adjusted for permanent differences between book and tax accounting. These adjustments have no impact on net assets or the results of operations. Temporary book and tax accounting differences will reverse in subsequent periods. At December 31, 2010, temporary book and tax accounting differences were primarily attributable to investments in forward contracts, futures contracts, option contracts, swap agreements, premium amortization accruals, the deferral of wash sale losses, and deferred Trustee compensation.
At December 31, 2010, the components of distributable earnings on a tax basis were as follows:
| | | | | | | | | | | | | | | | |
| | | Undistributed
Ordinary
Income | | | Undistributed
Long Term
Capital Gain
(Capital Loss
Carryover) | | | Other
Temporary
Differences | | | Unrealized
Appreciation
(Depreciation) | |
Fundamental Value Fund | | $ | 205,689 | | | $ | - | | | $ | (1,108 | ) | | $ | 11,691,862 | |
PIMCO Total Return Fund | | | 267,048 | | | | - | | | | (701,815 | ) | | | (1,271,137 | ) |
47
Notes to Financial Statements (Continued)
During the period ended December 31, 2010, the following amounts were reclassified due to permanent differences between book and tax accounting:
| | | | | | | | | | | | |
| | | Paid-in
Capital | | | Accumulated
Net Realized
Gain (Loss) on
Investments | | | Undistributed
Net
Investment
Income (Loss) | |
PIMCO Total Return Fund | | $ | - | | | $ | (99,889 | ) | | $ | 99,889 | |
The Funds did not have any unrecognized tax benefits at December 31, 2010, nor were there any increases or decreases in unrecognized tax benefits for the period then ended. The Funds recognize interest and penalties, if any, related to unrecognized tax benefits as an income tax expense in the Statements of Operations. During the period ended December 31, 2010, the Funds did not incur any such interest or penalties. The Funds are subject to examination by U.S. federal and state tax authorities for returns filed for the prior three fiscal years or the returns filed to date for Funds in existence less than three years. Foreign taxes are provided for based on the Funds’ understanding of the tax rules and rates that exist in the foreign markets in which they invest.
Under the Funds’ organizational documents, current and former Trustees and Officers are provided with specified rights to indemnification against liabilities arising in connection with the performance of their duties to the Funds, and shareholders are indemnified against personal liability for obligations of the Funds. In the normal course of business, the Funds may also enter into contracts that provide general indemnifications. The Funds’ maximum exposure under these arrangements is unknown as this would be dependent on future claims that may be made against the Funds. The risk of material loss from such claims is considered remote.
| 8. | | New Accounting Pronouncements |
In January 2010, the Financial Accounting Standards Board issued Accounting Standards Updated No. 2010-06, “Improving Disclosures About Fair Value Measurements” (“ASU”). The ASU requires enhanced disclosures about purchases, sales, issuances, and settlements on a gross basis relating to Level 3 measurements. The disclosure will be effective for fiscal years beginning after December 15, 2010, and for interim periods within those fiscal years. Management is currently evaluating the impact the adoption of this ASU will have on the Fund’s financial statement disclosures.
Management has evaluated the events and transactions subsequent to December 31, 2010 through the date when the financial statements were issued, and determined that there are no material events or transactions that would require adjustments to or disclosures in the Funds’ financial statements.
48
Report of Independent Registered Public Accounting Firm
To the Board of Trustees of MML Series Investment Fund and Shareholders of MML Fundamental Value Fund and MML PIMCO Total Return Fund:
We have audited the accompanying statements of assets and liabilities, including the portfolios of investments, of MML Fundamental Value Fund and MML PIMCO Total Return Fund (collectively “the Funds”), two of the Funds comprising the MML Series Investment Fund (“the Trust”) as of December 31, 2010, and the related statements of operations, changes in net assets and the financial highlights for the periods presented. These financial statements and financial highlights are the responsibility of the Funds’ management. Our responsibility is to express an opinion on these financial statements and financial highlights based on our audits.
We conducted our audits in accordance with the standards of the Public Company Accounting Oversight Board (United States). Those standards require that we plan and perform the audits to obtain reasonable assurance about whether the financial statements and financial highlights are free of material misstatement. The Funds are not required to have, nor were we engaged to perform, an audit of their internal control over financial reporting. Our audits included consideration of internal control over financial reporting as a basis for designing audit procedures that are appropriate in the circumstances, but not for the purpose of expressing an opinion on the effectiveness of the Funds’ internal control over financial reporting. Accordingly, we express no such opinion. An audit also includes examining, on a test basis, evidence supporting the amounts and disclosures in the financial statements, assessing the accounting principles used and significant estimates made by management, as well as evaluating the overall financial statement presentation. Our procedures included confirmation of securities owned as of December 31, 2010, by correspondence with the custodian and brokers; where replies were not received from brokers, we performed other auditing procedures. We believe that our audits provide a reasonable basis for our opinion.
In our opinion, the financial statements and financial highlights referred to above present fairly, in all material respects, the financial position of each of the Funds as of December 31, 2010, and the results of their operations, the changes in their net assets and the financial highlights for the periods presented, in conformity with accounting principles generally accepted in the United States of America.
Deloitte & Touche LLP
Boston, Massachusetts
February 18, 2011
49
Trustees and Officers (Unaudited)
The following table lists the Trust’s Trustees and Officers as of December 31, 2010; their address and age; their position with the Trust; the length of time holding that position with the Trust; their principal occupation(s) during the past five years; the number of portfolios in the fund complex they oversee; and other directorships they hold in companies subject to registration or reporting requirements of the Securities Exchange Act of 1934 (generally called “public companies”) or in registered investment companies. The Trust’s Statement of Additional Information includes additional information about the Trust’s Trustees and is available, without charge, upon request by calling 1-888-309-3539 or by writing MML Series Investment Fund, c/o Massachusetts Mutual Life Insurance Company, 1295 State Street, Springfield, Massachusetts 01111-0001, Attention: Retirement Services Marketing.
Disinterested Trustees
| | | | | | | | | | |
Name, Address*, and Age | | Position(s)
Held with
Trust | | Term of
Office** and
Length of
Time Served | | Principal Occupation(s)
During Past 5 Years | | Number of
Portfolios in
Fund Complex
Overseen by Trustee | | Other Directorships Held by Trustee |
Richard H. Ayers
Age: 68 | | Chairman Trustee | | Since
2010 Since
1999 | | Retired. | | 63 | | Director (since 2008), Celera Corporation; Director (1996-2008), Applera Corporation; Director (2002-2006), Instron Corporation; Chairman (since 2010), Trustee (since 1996), MassMutual Select Funds (open-end investment company). |
| | | | | |
Allan W. Blair
Age: 62 | | Trustee | | Since
2003 | | President and Chief Executive Officer (since 1996), Economic Development Council of Western Massachusetts; President and Chief Executive Officer (1993-2006), Westmass Area Development Corporation; President and Chief Executive Officer (since 1984), Westover Metropolitan Development Corporation. | | 63 | | Director (2001-2007), Future Works, Inc.; Trustee (since 2003), MassMutual Select Funds (open-end investment company). |
| | | | | |
Mary E. Boland
Age: 71 | | Trustee | | Since
1973 | | Attorney-at-Law (since 2004). | | 63 | | Director (1999-2007), BankNorth Massachusetts; Trustee (since 1994), MassMutual Select Funds (open-end investment company). |
| | | | | |
R. Alan Hunter, Jr.
Age: 64 | | Trustee | | Since
2003 | | Retired. | | 63 | | Director (since 2007), Actuant Corporation; Trustee (since 2003), MassMutual Select Funds (open-end investment company). |
| | | | | |
F. William Marshall, Jr. Age: 68 | | Trustee | | Since
1996 | | Retired. Consultant (1999-2009). | | 99*** | | Trustee (since 2000), Denver Board – Oppenheimer Funds; Trustee (since 1996), MassMutual Select Funds (open-end investment company). |
| | | | | |
Susan B. Sweeney Age: 58 | | Trustee | | Since 2009 | | Senior Vice President and Chief Investment Officer (since 2010), Selective Insurance Group (property and casualty company); Senior Managing Director (2008-2010), Ironwood Capital (private equity firm); Chief Investment Officer, Pension Fund (2002-2007), Office of the Treasurer of the State of Connecticut. | | 63 | | Trustee (since 2009), MassMutual Select Funds (open-end investment company). |
50
Trustees and Officers (Unaudited) (Continued)
Interested Trustees
| | | | | | | | | | |
Name, Address*, and Age | | Position(s)
Held with
Trust | | Term of
Office** and
Length of
Time Served | | Principal Occupation(s)
During Past 5 Years | | Number of
Portfolios in
Fund Complex
Overseen by Trustee | | Other Directorships Held by Trustee |
Robert E. Joyal^
Age: 65 | | Trustee | | Since
2003 | | Retired. | | 65^^ | | Director (since 2007), Scottish Re Group Ltd.; Director (since 2006), Jefferies Group, Inc. (investment bank); Director (1996-2005), Antares Capital Corporation (bank loan syndication); Director (since 2003), Alabama Aircraft Industries, Inc.; Trustee (since 2003), President (1999-2003), MassMutual Corporate Investors (closed-end investment company); Trustee (since 2003), President (1999-2003), MassMutual Participation Investors (closed-end investment company); Director (2005-2006), York Enhanced Strategies Fund (closed-end investment company); Trustee (since 2003), Vice Chairman (2005-2007), MassMutual Select Funds (open-end investment company). |
| | | | | |
Elaine A. Sarsynski^^^ Age: 55 | | Trustee | | Since
2008 | | Executive Vice President (since 2006), Senior Vice President and Chief Administrative Officer (2005-2006), MassMutual; Managing Director (2005), Babson Capital Management LLC; Chief Executive Officer (2001-2005), Town of Suffield, Connecticut. | | 63 | | Trustee (since 2008), MassMutual Select Funds (open-end investment company). |
51
Trustees and Officers (Unaudited) (Continued)
Principal Officers who are Not Trustees
| | | | | | | | |
Name, Address*, and Age | | Position(s) Held
with Trust | | Term of
Office# and
Length of
Time Served | | Principal Occupation(s) During Past 5 Years | | Number of
Portfolios in
Fund Complex
Overseen by Officer |
Richard J. Byrne
Age: 48 | | President | | Since 2007 | | Vice President (since 2007), Assistant Vice President (2003-2007), MassMutual; President (since 2007), MML Series Investment Fund II (open-end investment company). | | 40 |
| | | | |
Michael C. Eldredge Age: 46 | | Vice President | | Since 2009 | | Vice President (since 2008), MassMutual; Vice President (2005-2008), Manager (1998-2005), ING; Vice President (since 2009), MassMutual Select Funds (open-end investment company); Vice President (since 2009), MassMutual Premier Funds (open-end investment company); Vice President (since 2009), MML Series Investment Fund II (open-end investment company). | | 95 |
| | | | |
Andrew M. Goldberg Age: 44 | | Vice President, Secretary and Chief Legal Officer Assistant Secretary | | Since 2008 (2001- 2008) | | Assistant Vice President and Counsel (since 2004), Counsel (2001-2004), MassMutual; Vice President, Secretary and Chief Legal Officer (since 2008), Assistant Secretary (2001-2008), MassMutual Select Funds (open-end investment company); Vice President, Clerk and Chief Legal Officer (since 2008), Assistant Clerk (2004-2008), MassMutual Premier Funds (open-end investment company); Vice President, Clerk and Chief Legal Officer (since 2008), Assistant Clerk (2005-2008), MML Series Investment Fund II (open-end investment company). | | 95 |
| | | | |
Nicholas H. Palmerino
Age: 45 | | Chief Financial Officer and Treasurer | | Since 2006 | | Assistant Vice President (since 2006), MassMutual; Vice President (2006), Consultant (2005-2006), JP Morgan Chase Worldwide Securities Services; Chief Financial Officer and Treasurer (since 2006), MassMutual Select Funds (open-end investment company); Chief Financial Officer and Treasurer (since 2006), MassMutual Premier Funds (open-end investment company); Chief Financial Officer and Treasurer (since 2006), MML Series Investment Fund II (open-end investment company). | | 95 |
| | | | |
Philip S. Wellman
Age: 46 | | Vice President and Chief Compliance Officer | | Since 2007 | | Vice President, Associate General Counsel and Chief Compliance Officer (Mutual Funds and Investment Advisory) (since 2008), Vice President, Associate General Counsel and Chief Compliance Officer (Mutual Funds) (2007-2008), Assistant Vice President and Associate General Counsel (2006-2007), MassMutual; Director, Office of General Counsel (2005-2006), Merrill Lynch, Pierce, Fenner & Smith Incorporated; Senior Vice President and Assistant General Counsel (2000-2006), Advest, Inc.; Vice President and Chief Compliance Officer (since 2007), MassMutual Select Funds (open-end investment company); Vice President and Chief Compliance Officer (since 2007), MassMutual Premier Funds (open-end investment company); Vice President and Chief Compliance Officer (since 2007), MML Series Investment Fund II (open-end investment company). | | 95 |
| | | | |
Eric H. Wietsma
Age: 44 | | Vice President | | Since 2006 | | Senior Vice President (since 2010), Corporate Vice President (2007-2010), Vice President (2005-2007), MassMutual; Vice President (1999-2005), Hartford Life Insurance Company; President (since 2008), Vice President (2006-2008), MassMutual Select Funds (open-end investment company); President (since 2008), Vice President (2006-2008), MassMutual Premier Funds (open-end investment company); Vice President (since 2006), MML Series Investment Fund II (open-end investment company). | | 95 |
52
Trustees and Officers (Unaudited) (Continued)
| * | The address of each Trustee and Principal Officer is the same as that for the Trust; 1295 State Street, Springfield, Massachusetts 01111. |
| ** | Each Trustee of the Trust serves until the next meeting of shareholders called for the purpose of electing Trustees and until the election and qualification of his or her successor or until he or she dies, resigns or is removed. Notwithstanding the foregoing, unless the Trustees determine that it is desirable and in the best interest of the Trust that an exception to the retirement policy of the Trust be made, a Trustee shall retire and cease to serve as a Trustee upon the conclusion of the calendar year in which such Trustee attains the age of seventy-two years. |
| | The Chairperson is elected to hold such office for a term of three years or until his or her successor is elected and qualified to carry out the duties and responsibilities of his or her office, or until he or she retires, dies, resigns, is removed or becomes disqualified. |
| *** | Denver Board – Oppenheimer Funds is deemed to be part of the Fund Complex because it is managed by OppenheimerFunds, Inc., an indirect subsidiary of MassMutual. |
| ^ | Mr. Joyal is an “Interested Person,” as that term is defined in the 1940 Act, through his position as a director of Jefferies Group, Inc., a broker-dealer that may execute portfolio transactions and/or engage in principal transactions with the Funds, other investment companies advised by MassMutual or holding themselves out to investors as related companies for purposes of investment or investor services, or any other advisory accounts over which MassMutual has brokerage placement discretion. |
| ^^ | MassMutual Participation Investors and MassMutual Corporate Investors are deemed to be a part of the Fund Complex because they are managed by Babson Capital Management LLC, an indirect subsidiary of MassMutual. |
| ^^^ | Ms. Sarsynski is an Interested Person through her employment with MassMutual. |
| # | The President, Treasurer and Secretary are elected to hold such office until their successor is elected and qualified to carry out the duties and responsibilities of their office, or until he or she dies, resigns, is removed or becomes disqualified. Each other officer shall hold office at the pleasure of the Trustees. |
53
Federal Tax Information (Unaudited)
For corporate shareholders, a portion of the ordinary dividends paid during the Fund(s)’ year ended December 31, 2010, qualified for the dividends received deduction, as follows:
| | | | |
| | | Dividends
Received
Deductions | |
Fundamental Value Fund | | | 77.54 | % |
54
Other Information (Unaudited)
Proxy Voting
A description of the policies and procedures that each Fund’s investment adviser and subadvisers use to vote proxies relating to the Fund’s portfolio securities is available, without charge, upon request, by calling 1-888-309-3539, and on the Securities and Exchange Commission’s (“SEC”) website at http://www.sec.gov.
Information regarding how the Funds voted proxies relating to portfolio securities during the most recent 12-month period ended June 30 will be available, without charge, upon request, on the MassMutual website at http://www.massmutual.com/funds and on the SEC’s website at http://www.sec.gov.
Quarterly Reporting
The Funds file their complete schedule of portfolio holdings with the SEC for the first and third quarters of each fiscal year on Form N-Q. The Funds’ Forms N-Q are available on the SEC website at http://www.sec.gov. The Funds’ Forms N-Q may be reviewed and copied at the SEC’s Public Reference Room in Washington D.C. Information on the operation of the SEC’s Public Reference Room may be obtained by calling 1-800-SEC-0330.
Trustees’ Approval of Investment Advisory Contracts
At their meeting in May 2010, the Trustees, including the Trustees who are not “interested persons” (as such term is defined in the 1940 Act) of the Trust, MassMutual, or subadvisers (the “Independent Trustees”), approved the advisory agreements for two new series of the Trust, the Fundamental Value Fund and the PIMCO Total Return Fund (“Advisory Agreements”), and the subadvisory agreement with Wellington Management Company, LLP (“Wellington Management”) and Pacific Investment Management Company LLC (“PIMCO”), respectively, for the Funds (“Subadvisory Agreements”), subject to approval by the shareholders of the Funds of the Advisory and Subadvisory Agreements. In preparation for the meeting, the Trustees requested, and MassMutual provided in advance, certain materials relevant to the consideration of the Advisory and Subadvisory Agreements (the “Materials”). In all of their deliberations, the Trustees were advised by independent counsel.
In approving the Advisory Agreements, the Trustees considered the Materials and information discussed with representatives of MassMutual at the meeting relating to MassMutual and the nature, scope, and quality of services MassMutual would provide to the Funds. In reviewing the contracts, the Trustees considered a number of factors they believed to be relevant to the interests of shareholders of the Funds, including: (i) the financial condition, stability, and business strategy of MassMutual; (ii) the ability of MassMutual with respect to regulatory compliance and its ability to monitor compliance with the investment policies of the Funds; (iii) MassMutual’s ability to provide investment oversight and administrative and shareholder services to the Funds; and (iv) the experience and qualifications of the personnel of MassMutual that perform, or oversee the performance of, the services provided to the Funds and the needs of the Funds for administrative and shareholder services.
The Trustees also reviewed and considered information included in the Materials (or discussed at the meeting) concerning possible economies of scale and potential profitability of MassMutual’s advisory relationship with the Funds. The discussions and consideration included the intangible benefits derived by MassMutual and its affiliates resulting from their relationships with the Funds and the so-called “fallout benefits” to MassMutual, such as any reputational value derived from serving as investment adviser to the Funds.
In approving the Subadvisory Agreements, the Trustees discussed with MassMutual and considered a wide range of information about, among other things: (i) Wellington Management and PIMCO and their personnel with responsibilities for providing services to the Funds; (ii) the terms of each Subadvisory Agreement; (iii) the scope and quality of services that Wellington Management and PIMCO will provide under each Subadvisory Agreement; (iv) the historical investment performance track record of Wellington Management and PIMCO; and (v) the fees payable to Wellington Management and PIMCO by MassMutual and the effect of such fees on the profitability to MassMutual.
Prior to the votes being taken to approve the Advisory and Subadvisory Agreements, the Independent Trustees met separately in executive session to discuss the appropriateness of such contracts. The Independent Trustees weighed the foregoing matters in light of the advice given to them by their independent legal counsel as to the law applicable to the review of investment advisory
55
Other Information (Unaudited) (Continued)
contracts. In arriving at a decision, the Trustees, including the Independent Trustees, did not identify any single matter as all-important or controlling. The foregoing summary does not detail all of the matters considered.
Based on the foregoing, the Trustees determined that: (i) overall, they were satisfied with the nature, extent, and quality of services expected to be provided under the Advisory Agreements, including the anticipated level of MassMutual’s oversight of the Funds and the subadvisory process; (ii) MassMutual’s projected level of profitability from its relationship with the Funds was not excessive and the advisory fee payable under the Advisory Agreements and the Funds’ total expenses were fair and reasonable; (iii) the investment processes, research capabilities, and philosophies of Wellington Management and PIMCO would be well suited to each Fund given its investment objective and policies; and (iv) the terms of the Advisory and Subadvisory Agreements were fair and reasonable with respect to each Fund and were in the best interest of each Fund’s’ shareholders. After carefully considering the information summarized above, the Trustees, including the Independent Trustees voting separately, unanimously voted to approve the Advisory and Subadvisory Agreements.
The Advisory and Subadvisory Agreements became effective on August 9, 2010.
56
Other Information (Unaudited) (Continued)
Fund Expenses December 31, 2010
Expense Examples:
The following information is in regards to expenses for the six months ended December 31, 2010:
As a shareholder of the Funds, you incur ongoing costs, including management fees, distribution and/or service (12b-1) fees, and other Fund expenses. These examples are intended to help you understand your ongoing costs (in dollars) of investing in the Funds and to compare these costs with the ongoing costs of investing in other mutual funds. These examples are based on an investment of $1,000 invested for the six months ended December 31, 2010.
Actual Expenses:
The first four columns of the table below provide information about actual account values and actual expenses. You may use this information, together with the amount you invested, to estimate the expenses that you paid over the period. Simply divide your account value by $1,000 (for example, an $8,600 account value divided by $1,000 = 8.6), then multiply the result by the number under the heading entitled “Operating Expenses Incurred” to estimate the expenses you paid on your account during this period.
Hypothetical Example for Comparison Purposes:
The last two columns of the table below provide information about hypothetical account values and hypothetical expenses based on the Fund’s actual expense ratio and an assumed rate of return of 5% per year before expenses, which is not the Fund’s actual return. The hypothetical account values and expenses may not be used to estimate the actual ending account balance or expenses you paid for the period. You may use this information to compare the ongoing costs of investing in the Fund and other funds. To do so, compare this 5% hypothetical example with the 5% hypothetical examples that appear in the shareholder reports of the other funds.
Please note that the expenses shown in the table are meant to highlight your ongoing costs only and do not reflect any transactional costs. Therefore, the last two columns of the table are useful in comparing ongoing costs only, and will not help you determine the relative total costs of owning different funds. In addition, if these transactional costs were included, your costs would have been higher.
| | | | | | | | | | | | | | | | | | | | | | | | |
| | | Beginning
Value | | | Annualized
Expense
Ratio | | | Ending
Value (Based
on Actual
Returns and
Expenses) | | | Operating
Expenses
Incurred* | | | Ending
Value (Based
on
Hypothetical
Returns and
Expenses) | | | Operating
Expenses
Incurred* | |
| Fundamental Value Fund | | | | | | | | | | | | | | | | | | | | | | | | |
Class II | | | 1,000 | | | | 0.80 | % | | $ | 1,115.90 | | | $ | 3.34 | | | $ | 1,021.20 | | | $ | 4.08 | |
| PIMCO Total Return Fund | | | | | | | | | | | | | | | | | | | | | | | | |
Class II | | | 1,000 | | | | 0.65 | % | | | 1,001.70 | | | | 2.57 | | | | 1,021.90 | | | | 3.31 | |
| * | Actual expenses are calculated using the annualized expense ratio, multiplied by the average account value over the period from inception of the Fund(s) on August 10, 2010, through December 31, 2010, multiplied by the number of days in the inception period divided by the number of days in the year. Hypothetical expenses are calculated using the annualized expense ratio for the six months ended December 31, 2010, multiplied by the average account value over the period, multiplied by the number of days in the period, divided by the number of days in the year. |
57

Distributor
MML Distributors, LLC
1295 State Street
Springfield, MA 01111-0001
© 2011 Massachusetts Mutual Life Insurance Company, Springfield, MA. All rights reserved. www.massmutual.com. MassMutual Financial Group is a marketing name for Massachusetts Mutual Life Insurance Company (MassMutual) and its affiliated companies and sales representatives.
L4540c 111
CRN201203-144024
Item 2. Code of Ethics.
As of December 31, 2010, the Registrant adopted a Code of Ethics that applies to the Principal Executive Officer and Principal Financial Officer pursuant to the Sarbanes-Oxley Act of 2002. For the year ended December 31, 2010, there were no amendments to a provision of the Code of Ethics. A copy of its Code of Ethics is filed with this Form N-CSR under Item 12(a)(1).
Item 3. Audit Committee Financial Expert.
The Registrant’s Board of Trustees has determined that R. Alan Hunter, Jr., a member of the Audit Committee, is an audit committee financial expert as defined by the Securities and Exchange Commission (the “SEC”). Mr. Hunter is “independent” as defined by the SEC for purposes of audit committee financial expert determinations.
Item 4. Principal Accountant Fees and Services.
References below to Deloitte & Touche LLP include its affiliates where applicable.
| | (a) | AUDIT FEES: The aggregate fees billed to the Registrant for professional services rendered by its independent auditors, Deloitte & Touche LLP, for the audit of the Registrant’s annual financial statements for 2010 and 2009 were $736,711 and $890,311, respectively. |
| | (b) | AUDIT RELATED FEES: No such fees were billed to the Registrant by Deloitte & Touche LLP for 2010 and 2009. The aggregate fees billed to the Registrant’s adviser and any entity controlling, controlled by, or under common control with the adviser that provides ongoing services to the Registrant by Deloitte & Touche LLP* for 2010 and 2009 were $117,100 and $0, respectively. The 2010 audit related fees were for work performed in connection with an internal control review. |
| | (c) | TAX FEES: The aggregate fees billed to the Registrant for professional services rendered by Deloitte & Touche LLP for the review of Form 1120-RIC, Form 8613, excise distribution projections, distribution calculation and reasonable out of pocket expenses for 2010 and 2009 were $85,913 and $112,050, respectively. No such fees were billed to the Registrant’s adviser and any entity controlling, controlled by, or under common control with the adviser that provides ongoing services to the Registrant by Deloitte & Touche LLP* for 2010 and 2009. |
| | (d) | ALL OTHER FEES: No such fees were billed to the Registrant by Deloitte & Touche LLP for 2010 and 2009. No such fees were billed to the Registrant’s adviser and any entity controlling, controlled by, or under common control with the adviser that provides ongoing services to the Registrant by Deloitte & Touche LLP* for 2010 and 2009. |
| | (e) | (1) AUDIT COMMITTEE PRE-APPOVAL POLICY: All services to be performed for the Registrant by Deloitte & Touche LLP must be pre-approved by the audit committee. All services performed during 2010 and 2009 were pre-approved by the committee. |
(2) Not applicable.
| | (g) | The aggregate non-audit fees billed by Deloitte & Touche LLP for services rendered to the Registrant, the Registrant’s adviser and any entity controlling, controlled by, or under common control with the adviser that provides ongoing services to the Registrant, for the fiscal years 2010 and 2009 were $710,669 and $519,679, respectively. |
| | (h) | The audit committee considers whether the provision of non-audit services by Deloitte & Touche LLP to the Registrant’s adviser and any entity controlling, controlled by, or under common control with the adviser that provides ongoing services to the Registrant that were not pre-approved pursuant to paragraph (c)(7)(ii) of Rule 2-01 of Regulation S-X is compatible with maintaining Deloitte & Touche LLP’s independence. |
| | * | Refers to fees that were required to be approved by the audit committee for services that relate directly to the operations and financial reporting of the Registrant. |
Item 5. Audit Committee of Listed Registrants.
Not applicable to this filing.
Item 6. Schedule of Investments.
Please see portfolio of investments contained in the Reports to Stockholders included under Item 1 of this form N-CSR.
Item 7. Disclosure of Proxy Voting Policies and Procedures for Closed-End Management Investment Companies.
Not applicable to this filing.
Item 8. Portfolio Managers of Closed-End Management Investment Companies.
Not applicable to this filing.
Item 9. Purchases of Equity Securities by Closed-End Management Investment Company and Affiliated Purchasers.
Not applicable to this filing.
Item 10. Submission of Matters to a Vote of Security Holders.
Not applicable to this filing.
Item 11. Controls and Procedures.
(a) The Registrant’s Principal Executive Officer and Principal Financial Officer have concluded that the Registrant’s disclosure controls and procedures (as defined in Rule 30a-3(c) under the Investment Company Act of 1940, as amended (the “1940 Act”) (17 CFR 270.30a-3(c))) are effective, as of a date within 90 days of the filing date of this Form N-CSR, to provide reasonable assurance that the information required to be disclosed by the Registrant on Form N-CSR is recorded, processed, summarized, and reported within the time periods specified in the SEC’s rules and forms, based on their evaluation of these disclosure controls and procedures required by Rule 30a-3(b) under the 1940 Act (17 CFR 270.30a-3(b)) and Rules 13a-15(b) or 15d-15(b) under the Securities Exchange Act of 1934 (17 CFR 240.13a-15(b) or 240.15d-15(b)).
(b) There were no changes in the Registrant’s internal control over financial reporting (as defined in Rule 30a-3(d) under the 1940 Act (17 CFR 270.30a-3(d))) that occurred during the Registrant’s most recent fiscal quarter that has materially affected, or is reasonably likely to materially affect, the Registrant’s internal control over financial reporting.
Item 12. Exhibits.
(a)(1) Code of Ethics (Item 2) is attached.
(a)(2) Certifications of the Principal Executive Officer and Principal Financial Officer of the Registrant as required by Rule 30a-2(a) under the 1940 Act (17 CFR 270.30a-2(a)) are attached hereto as Exhibit 99CERT.
(a)(3) Not applicable to this filing.
(b) Certifications pursuant to Section 906 of the Sarbanes-Oxley Act of 2002 as required by Rule 30a-2(b), under the 1940 Act (17 CFR 270.30a-2(b)), Rule 15d-14(b) under the Securities Exchange Act of 1934 (17 CFR 240.15d-14(b)) and Section 1350 of Chapter 63 of Title 18 of the United States Code (18 U.S.C. 1350) are attached hereto as Exhibit 99.906CERT.
SIGNATURES
Pursuant to the requirements of the Securities Exchange Act of 1934 and the Investment Company Act of 1940, the registrant has duly caused this report to be signed on its behalf by the undersigned, thereunto duly authorized.
| | |
| (Registrant) | | MML Series Investment Fund |
| | |
| |
| By (Signature and Title) | | /s/ Richard J. Byrne |
| | Richard J. Byrne, President and Principal Executive Officer |
Date 2/18/11
Pursuant to the requirements of the Securities Exchange Act of 1934 and the Investment Company Act of 1940, this report has been signed below by the following persons on behalf of the registrant and in the capacities and on the dates indicated.
| | |
| By (Signature and Title) | | /s/ Richard J. Byrne |
| | Richard J. Byrne, President and Principal Executive Officer |
Date 2/18/11
| | |
| By (Signature and Title) | | /s/ Nicholas H. Palmerino |
| | Nicholas H. Palmerino, Treasurer and Principal Financial Officer |
Date 2/18/11