UNITED STATES
SECURITIES AND EXCHANGE COMMISSION
Washington, D.C. 20549
FORM N-CSR
CERTIFIED SHAREHOLDER REPORT OF REGISTERED
MANAGEMENT INVESTMENT COMPANIES
Investment Company Act file number | 811-02224 |
|
MML Series Investment Fund |
(Exact name of registrant as specified in charter) |
|
1295 State Street, Springfield, MA | | 01111 |
(Address of principal executive offices) | | (Zip code) |
|
Richard J. Byrne 1295 State Street, Springfield, MA 01111 |
(Name and address of agent for service) |
|
Registrant’s telephone number, including area code: | 413-788-8411 | |
|
Date of fiscal year end: | 12/31/2008 | |
|
Date of reporting period: | 12/31/2008 | |
| | | | | | | | |
Item 1. Reports to Stockholders.

MML Series Investment Fund
Annual Report
MML Large Cap Value Fund
MML Equity Index Fund
MML Growth Equity Fund
MML NASDAQ-100® Fund
MML Small Cap Growth Equity Fund
MML Emerging Growth Fund
This annual report pertains to certain funds offered through the Series. Your variable product prospectus will list which of these funds are available through your variable product.
December 31, 2008

Table of Contents
| President's Letter to Shareholders | | | 1 | | |
|
| Economic and Market Review | | | 3 | | |
|
| Portfolio Manager Reports | | | 7 | | |
|
| Portfolio of Investments | |
|
| MML Large Cap Value Fund | | | 27 | | |
|
| MML Equity Index Fund | | | 29 | | |
|
| MML Growth Equity Fund | | | 35 | | |
|
| MML NASDAQ-100® Fund | | | 37 | | |
|
| MML Small Cap Growth Equity Fund | | | 39 | | |
|
| MML Emerging Growth Fund | | | 42 | | |
|
| Statements of Assets and Liabilities | | | 44 | | |
|
| Statements of Operations | | | 48 | | |
|
| Statements of Changes in Net Assets | | | 50 | | |
|
| Financial Highlights | | | 54 | | |
|
| Notes to Financial Statements | | | 61 | | |
|
| Report of Independent Registered Public Accounting Firm | | | 77 | | |
|
| Trustees and Officers (Unaudited) | | | 78 | | |
|
| Federal Tax Information (Unaudited) | | | 82 | | |
|
| Other Information (Unaudited) | | | 83 | | |
|
This material must be preceded or accompanied by a current prospectus for the MML Series Investment Fund. Investors should consider a Fund's investment objective, risks and charges and expenses carefully before investing. This and other information about the investment company is available in the prospectus. Read it carefully before investing.
MML Series Investment Fund – President's Letter to Shareholders
To Our Shareholders
December 31, 2008

Richard J. Byrne
"While today's headlines may, at times, be alarming, it's important for you to keep in mind that your overall focus with respect to your retirement planning should not be on today's issues, but on whether or not your portfolio is positioned appropriately, based on your risk tolerance level and the number of years you expect to remain invested."
The economic challenges of 2008 remain, but maintaining a long-term approach is still critical
Welcome to the MML Series Investment Fund Annual Report, covering the one-year period ended December 31, 2008. During 2008, one of the most difficult years in recent history, Americans struggled through a broad range of economic challenges – many of which had not been seen in decades. These difficulties forced many to adopt lifestyle changes that necessitated a closer look at all expenditures, including those associated with preparing for a more secure financial future.
Throughout it all, however, it's important to remember that investing for retirement is a long-term proposition. So while today's headlines may, at times, be alarming, it's important for you to keep in mind that your overall focus with respect to your retirement planning should not be on today's issues, but on whether or not your portfolio is positioned appropriately, based on your risk tolerance level and the number of years you expect to remain invested.
What retirement investors can do in today's challenging environment
• Stay calm. While it is important to stay abreast of what is going on in the financial markets today, it's more important to keep it all in the proper perspective. If you're like most retirement investors, you won't be looking to withdraw your retirement funds in 2009. And even if you do begin to withdraw money this year, the majority of your retirement account will likely remain invested for many years to come.
• Get professional help. If you work with a financial professional, today's economic environment provides you with an excellent reason to consult him or her to assess your overall retirement plan. Together, you can determine any adjustments that should be made to your portfolio or your contribution levels to help you reach your long-term financial goals.
• Dollar-cost-averaging may help investors in volatile markets.1 Making investments at regular intervals, regardless of market conditions, can help you to take advantage of market swings by buying more shares/units when prices are down, and fewer shares/units when prices are up.
• Try to avoid sudden or drastic changes. While you may intend to remain invested for a number of years, it's important that you implement any changes to your portfolio based on a thorough review of your long-term needs and objectives. Your financial professional can help you assess your situation – and help you avoid sudden moves that investors often come to regret over time.
Keep your eye on the future
As a reminder, the financial markets, like our economy, have always been cyclical, but historically have provided opportunities for growth over the long term. We believe investors should consider a portfolio that is designed to function properly under all market conditions, based on your risk tolerance and the number of years you have until retirement. This can help to eliminate the need for sudden changes in positioning during times of market volatility. Most financial professionals believe that investors who maintain their financial strategy over time have the potential to reach their long-term financial objectives.
1 Dollar-cost-averaging does not assure a profit or protect against loss in a declining market, and involves continuous investment in securities regardless of fluctuating prices. An investor should consider his/her ability to continue investing through periods of low price levels. See the MML Series Investment Fund prospectus for complete details.
(Continued)
1
MML Series Investment Fund – President's Letter to Shareholders (Continued)
I thank you for your continued confidence in MassMutual.
Sincerely,

Richard J. Byrne
President
The information provided is the opinion of MassMutual Retirement Services Investment Services as of 1/1/09 and is subject to change without notice. It is not to be construed as tax, legal or investment advice. Of course, past performance does not guarantee future results.
2
MML Series Investment Fund – Economic and Market Review
December 31, 2008
Financial markets roiled by critical problems; U.S. Government intervention attempts to avoid economic meltdown
During the year ended December 31, 2008, severe problems that had begun to challenge many Americans before the year even began continued to rock the financial world – the subprime mortgage crisis, the weak U.S. housing market and high commodity (particularly oil) prices – and served as a drag on the economy in 2008. Oil prices dropped in the second half of the year on lowered demand, reflecting a global economic slowdown. Key market events triggered aggressive interventions from the U.S. Government and governments worldwide, including revised monetary policies and corporate bailouts, which were intended to pull economies the world over out of their decline and stabilize financial markets. The credit crunch created by the subprime mortgage crisis took its toll on businesses of all sizes, and U.S. unemployment rose substantially over the course of the year. Investors will also remember 2008 as the year that changed the face of Wall S treet. Indeed, the year marked the failures (or takeovers) of multiple major American financial institutions, including Bear Stearns, IndyMac Bancorp, Fannie Mae, Freddie Mac, American International Group (AIG), Merrill Lynch, Lehman Brothers, Washington Mutual and Wachovia.
Market performance
For the 12 months ended December 31, 2008, bonds outpaced equities in an environment of continual market volatility. The Dow Jones Industrial AverageSM ("Dow"), a recognized measure of blue-chip stock performance, shed 33.84% of its value during what turned out to be its worst year since 1931. Similarly, the S&P 500® Index ("S&P 500"), a measure of U.S. large-cap stock performance, gave back 37.00% of its value. Small-cap and technology stocks, as measured by the Russell 2000® Index and the NASDAQ Composite® Index ("NASDAQ"), respectively, posted losses of 33.80% and 40.53%. A significant loser in the U.S. equity market, however, was the Russell Midcap Growth Index, a benchmark of the performance of mid-cap U.S. common stocks, which lost 44.32% for the year. In international equity markets, the Morgan Stanley Capital International Europe, Australasia, Far East Index ("MSCI& reg; EAFE®"), a benchmark for foreign stocks in developed markets, fell 43.39%. Of particular note in the international equity marketplace in 2008 was the Morgan Stanley Capital International Emerging Markets Index, which measures the performance of emerging stock markets throughout the world, but excludes certain market segments unavailable to U.S.-based investors. It lost 53.33% of its value.*
Investments in the fixed-income markets for the most part fared significantly better than their equity peers during 2008. A standout performer was the Barclays Capital 1-3 Year U.S. Government Bond Index (formerly known as the Lehman Brothers® 1-3 Year U.S. Government Bond Index), which measures the results of U.S. Government bonds with one to three years remaining to the scheduled payment of principal. It advanced 6.66%. Other closely watched benchmarks in the fixed-income market also gained ground in 2008. The Barclays Capital U.S. Aggregate Bond Index (formerly known as the Lehman Brothers U.S. Aggregate Bond Index), a broad measure of the U.S. investment-grade bond markets, returned 5.24%. Treasury bills also advanced, as measured by the Salomon Smith Barney 3-Month Treasury Bill Index, which returned 1.80%. Reflecting investor preference for higher-quality securities and aversion to risk in this environment, the Barclays Capital U.S. Corporate High-Yield Bond Index (formerly known as the Lehman Brothers U.S. Corporate High-Yield Bond Index) – which measures the performance of fixed rate, non-investment-grade debt – lost 26.16%, but still managed to outperform the S&P 500 and the Dow.*
* Indexes are unmanaged, do not incur fees or expenses and cannot be purchased directly for investment.
(Continued)
3
MML Series Investment Fund – Economic and Market Review (Continued)
2008 stumbles out of the gate in the first quarter
2008 began against a backdrop of a subprime mortgage crisis and blue-chip financial company writedowns (i.e., the reduction of the book value of an asset because it is overvalued compared to the current market value) – along with countless earnings disappointments. Headlines announced departures of well-known senior and top executives from some of Wall Street's giants in the wake of the ever-growing impact of the subprime crisis – in an indication of what was yet to come. In this environment, U.S. and international stocks struggled and higher-quality bonds advanced, benefiting from concerned investors' preference for lower-risk investments. While the MSCI EAFE was weaker than the S&P 500 in local currency terms, a weak U.S. dollar boosted the former's dollar-based value.
As conditions in the financial markets deteriorated, the Federal Reserve ("Fed") responded to the burgeoning economic crisis by dramatically stepping up the pace at which Fed officials lowered short-term interest rates. After federal funds rate reductions of only 0.25% in October and December 2007, the Fed responded to January's falling stock market with an unscheduled 0.75% reduction on January 22, 2008 – with another 0.50% cut at the end of the month. The federal funds rate is the interest rate at which banks and other financial institutions lend to one another overnight. A weakening labor market and softening consumer spending, together with ongoing crisis conditions in the financials sector, prompted the Fed to make another 0.75% cut in March. In addition, in a major departure from previous Fed policy, the central bank announced that it was permitting investment banks to borrow directly from it, a privilege formerly reserved for com mercial banks. This change of policy provides a source of short-term funds that can be accessed at the current discount rate (the interest rate that regional Fed banks charge banks and other financial institutions when they borrow funds on a short-term basis).
The Fed's most controversial move during the first quarter was its involvement in the takeover of Bear Stearns, then the nation's fifth-largest investment bank, by JPMorgan Chase. As its customers withdrew funds at an accelerating pace and lenders pulled back on financing, Bear Stearns found itself in critical condition by mid-March. The Federal Reserve Bank of New York subsequently agreed to cover up to $29 billion in losses if Bear Stearns' assets should go bad, with JPMorgan Chase covering the first $1 billion, a move that proved to foretell of a new era in U.S. Government economic intervention. On March 31, 2008, Treasury Secretary Henry Paulson unveiled a plan to revamp the federal government's oversight of the U.S. financial markets.
The second quarter brings further challenges
In the second quarter of 2008, many sectors of both the stock and bond markets declined, as surging energy prices, which created a stiff headwind for the auto and airline industries, continued to challenge the American consumer. The surprising strength of the U.S. dollar during the quarter muted the returns of the MSCI EAFE, which nevertheless outperformed both the Dow and the S&P 500 for the three-month period. Crude oil touched $140 a barrel by the end of June, pushing the average price of a gallon of regular gasoline to more than $4.00. The May employment report unnerved investors, as the nation's unemployment rate rose from 5.0% to 5.5% and fueled concerns that the U.S. economy might enter a recession. Also weighing on investor sentiment in June was a worsening inflation picture. Elsewhere, home prices continued their decline. All of these factors led to slumping consumer confidence. On a brighter note, the U.S. dollar, which had bee n struggling against major currencies for quite some time, showed renewed strength.
4
MML Series Investment Fund – Economic and Market Review (Continued)
Government intervention accelerates in the third quarter
Investors had hoped that the March 2008 takeover of Bear Stearns by JPMorgan Chase marked the turning point of the crisis in the financials sector. However, an extraordinary – and seemingly relentless – series of events in the third quarter of 2008 sent investors reeling and consequently, put downward pressure on stock prices:
• July 11: Federal regulators seized IndyMac Bank;
• Sept. 7: The U.S. Government rescued government-sponsored entities Fannie Mae and Freddie Mac;
• Sept. 14: Brokerage and investment bank Merrill Lynch arranged to be bought by Bank of America;
• Sept. 15: Lehman Brothers, the fourth-largest U.S. investment bank, filed for Chapter 11 bankruptcy protection in the largest corporate bankruptcy filing ever in the United States;
• Sept. 16: Insurer AIG received an emergency, U.S. Government-underwritten $85 billion loan after its stock plunged and its debt was downgraded by all three major credit-rating agencies;
• Sept. 19: U.S. Treasury Secretary Paulson unveiled a sweeping $700 billion proposal to purchase hard-to-sell mortgage assets from banks;
• Sept. 21: Federal regulators agreed to allow the last two surviving U.S. investment banks, Goldman Sachs and Morgan Stanley, to become bank holding companies, in a move intended to help these banks survive the financial crisis and give them easier access to credit;
• Sept. 25: Savings and loan Washington Mutual was seized by federal regulators, and its loan portfolio and retail branches were sold to JPMorgan Chase;
• Sept. 29: Citigroup agreed to acquire the banking assets of Wachovia, the nation's fourth-largest bank, in a deal that excluded Wachovia's brokerage and asset management businesses. (The agreement never came to fruition. In the first week of October, Wells Fargo upended the Citigroup deal with one that included the purchase of all of Wachovia, including the firm's banking, retail brokerage, asset management, insurance and retirement services businesses.); and
• Also on Sept. 29, the U.S. House of Representatives defeated the Bush administration's economic rescue plan, sending stocks sharply lower.
During the third quarter of 2008, the Dow declined 4.40%, while the S&P 500 lost 8.36%. Foreign equities struggled against slumping economic activity abroad and a sharp rally in the U.S. dollar, resulting in a decline of 20.56% for the MSCI EAFE.
Fourth quarter: U.S. Government passes bailout act; recession confirmed
In early October, President Bush signed the Emergency Economic Stabilization Act of 2008 (EESA) into law. EESA authorized the Troubled Asset Relief Program (TARP), which was originally expected to support financial institutions by buying their troubled assets. U.S. Treasury Secretary Henry Paulson later indicated that TARP's focus was shifting to companies providing consumer debt in an effort to improve the flow of funds for consumer loans. In late December, President Bush made $17.4 billion in loans (taken from TARP assets) available to General Motors Corp. and Chrysler after the U.S. Senate had rejected a proposal earlier in the month.
The Fed responded to the weak economy and low consumer confidence by cutting interest rates three times in the fourth quarter of 2008, bringing the target federal funds rate to a historic low of between zero and 0.25%, from its prior target of 1%. The Fed also cut the discount rate to 0.5%.
The widely anticipated official declaration of a U.S. recession finally occurred at the beginning of December, when the National Bureau of Economic Research (NBER) announced that the economy
5
MML Series Investment Fund – Economic and Market Review (Continued)
had been in recession since the previous December (2007). Other headlines in the fourth quarter of 2008 also underscored the dire state of our economy:
• November's unemployment report revealed a loss of 533,000 jobs, the biggest one-month decline since 1974.
• Home prices continued to fall. In October, the 20-city Case-Shiller Home Price Index dropped by 18% versus a year earlier, marking 27 consecutive monthly declines for that benchmark.
• The Institute for Supply Management's manufacturing index – in part, reflecting depressed auto sales – receded to 36.2 in November, its lowest reading since May 1982.
• The retail industry suffered one of the worst holiday shopping seasons in years.
• The broader economy, as measured by GDP (gross domestic product), fell by a revised 0.5% in the third quarter, its largest decline in seven years.
The Dow declined 19.12% for the quarter – similarly, the S&P 500 fell 21.96% and the NASDAQ lost 24.61%. Stocks of foreign developed markets also struggled, as the MSCI EAFE Index declined 19.96%. Oil prices continued their slide during December, closing out the year near $45 per barrel, as violence in the Middle East escalated. (Prices had dropped to the low $30 range earlier in the quarter.) Most other commodities also suffered from declining demand in the face of the global economic downturn. The U.S. dollar remained strong for most of the quarter. Fixed-income performance was mixed, as the continuing flight to quality that started at the end of 2007 benefited this market segment during the fourth quarter of 2008. The yield on the benchmark 10-year Treasury Note declined 1.60% to finish the year at 2.25% – spurring an increase in mortgage refinancings in the second half of the fourth quarter.
As 2008 drew to a close, investors were hopeful that the U.S. economy would emerge from recession and market performance would return to positive territory; however, many market watchers are cautious about the immediate future with so few encouraging signs on the horizon.
The information provided is the opinion of MassMutual Retirement Services Investment Services as of 1/1/09 and is subject to change without notice. It is not to be construed as tax, legal or investment advice. Of course, past performance does not guarantee future results.
6
MML Large Cap Value Fund – Portfolio Manager Report
What is the investment objective of MML Large Cap Value Fund – and who is the Fund's sub-adviser?
The Fund seeks both capital growth and income by selecting businesses that possess characteristics that the Fund's sub-adviser believes foster the creation of long-term value, such as proven management, a durable franchise and business model, and sustainable competitive advantages. The Fund's sub-adviser is Davis Selected Advisers, L.P. (Davis).
How did the Fund perform during the 12 months ended December 31, 2008?
The Fund's Initial Class shares returned -39.30%, trailing the -37.00% return of the S&P 500® Index (the "benchmark"), a widely recognized, unmanaged index representative of common stocks of larger capitalized U.S. companies. In addition, the Fund underperformed the -36.85% return of the Russell 1000® Value Index, an unmanaged index consisting of those Russell 1000 securities (representing the 1,000 largest U.S. companies based on market capitalization) with greater-than-average value orientation that tend to exhibit lower price-to-book ratios and forecasted growth values than securities in the growth universe.
For a discussion on the economic and market environment during the 12-month period ended December 31, 2008, please see the Economic and Market Review, beginning on page 3.
What factors contributed to the Fund's performance?
The sectors within the S&P 500 Index that turned in the weakest performance in 2008 were financials, materials and information technology. The sectors that turned in the strongest (but still negative) performance over the year were consumer staples and health care.
The Fund's holdings in the financials sector outperformed the corresponding sector within the benchmark, but were still the greatest detractors from performance. A higher relative average weighting in this sector detracted from both absolute and relative performance. American International Group (AIG), American Express, Merrill Lynch, Berkshire Hathaway, Loews and JPMorgan Chase substantially hampered performance. Conversely, Wells Fargo and Hartford Financial Services were among the top contributors to the Fund's performance.
Energy holdings also worked against the Fund's progress in 2008. The combination of an overweight position and the underperformance of the Fund's energy companies versus the benchmark was detrimental. ConocoPhillips and China Coal Energy were among the top detractors for the year.
The Fund's relative performance benefited from holding an overweight position in consumer staples companies. Unfortunately, the Fund's consumer staples holdings underperformed the corresponding sector within the benchmark. Walmart was among the most important contributors to performance, while Costco was among the most significant detractors. (The Fund no longer owned Walmart as of the end of 2008.)
The Fund's relative performance was harmed by having an underweight position in health care companies. The Fund's health care holdings underperformed the benchmark – despite the fact that Schering Plough was among the top contributors to overall performance for the year. H&R Block, a consumer discretionary company, was the most important contributor to the Fund's performance in 2008.
The Fund held approximately 9% of assets in foreign companies (including American Depositary Receipts) as of December 31, 2008. Overall, these companies underperformed the domestic companies held by the Fund during the year.
What is your outlook?
We do not overreact to past short-term performance from individual holdings on either the upside or the downside. We focus deliberately on the future, considering each company's long-term business fundamentals. As of December 31, 2008, four companies had dropped out of the Fund's top 10 holdings from December 31, 2007. Two of these holdings, Microsoft and American Express, were still among the Fund's top 20 holdings as 2009 began. Three new additions to the Fund's top 10 holdings at the end of 2008 included Wells Fargo, Comcast and EOG Resources – all of which were among the Fund's top 20 holdings at the end of 2007.
7
MML Large Cap Value Fund – Portfolio Manager Report (Continued)
MML Large Cap Value Fund
Largest Holdings
(% of Net Assets) on 12/31/08
(Unaudited) | |
| Costco Wholesale Corp. | | | 4.9 | % | |
Berkshire Hathaway, Inc.
Class A | | | 4.9 | % | |
| Wells Fargo & Co. | | | 4.3 | % | |
| JP Morgan Chase & Co. | | | 4.2 | % | |
| ConocoPhillips | | | 4.2 | % | |
| Occidental Petroleum Corp. | | | 4.1 | % | |
| Devon Energy Corp. | | | 3.4 | % | |
| Philip Morris International, Inc. | | | 3.3 | % | |
| EOG Resources, Inc. | | | 2.9 | % | |
| American Express Co. | | | 2.4 | % | |
| | | | 38.6 | % | |
MML Large Cap Value Fund
Sector Table
(% of Net Assets) on 12/31/08
(Unaudited) | |
| Financial | | | 26.6 | % | |
| Energy | | | 16.9 | % | |
| Consumer, Non-cyclical | | | 16.4 | % | |
| Consumer, Cyclical | | | 10.0 | % | |
| Industrial | | | 6.2 | % | |
| Communications | | | 6.0 | % | |
| Technology | | | 5.1 | % | |
| Basic Materials | | | 2.4 | % | |
| Diversified | | | 0.6 | % | |
| Utilities | | | 0.2 | % | |
| Total Long-Term Investments | | | 90.4 | % | |
Short-Term Investments and
Other Assets and Liabilities | | | 9.6 | % | |
| Net Assets | | | 100.0 | % | |
8
MML Large Cap Value Fund – Portfolio Manager Report (Continued)
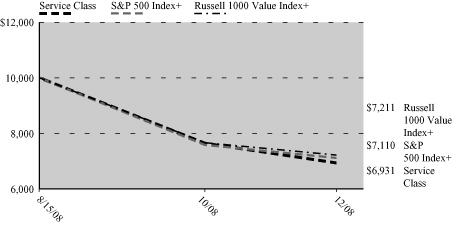
Growth of a $10,000 Investment
Hypothetical Investments in MML Large Cap Value Fund Initial Class, the S&P 500 Index and the Russell 1000 Value Index.
TOTAL RETURN
| | | One Year
1/1/08 -
12/31/08 | | Five Year
Average
Annual
1/1/04 -
12/31/08 | | Since
Inception
Average
Annual
5/1/00 -
12/31/08 | |
| Initial Class | | | (39.30 | )% | | | (2.45 | )% | | | (1.95 | )% | |
| S&P 500 Index* | | | (37.00 | )% | | | (2.19 | )% | | | (3.65 | )% | |
| Russell 1000 Value Index | | | (36.85 | )% | | | (0.79 | )% | | | 0.83 | % | |
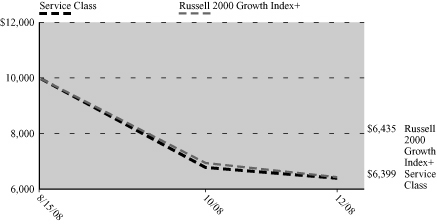
GROWTH OF $10,000 INVESTMENT SINCE INCEPTION

Hypothetical Investments in MML Large Cap Value Fund Service Class, the S&P 500 Index and the Russell 1000 Value Index.
TOTAL RETURN
| | | Since Inception
8/15/08 - 12/31/08 | |
| Service Class | | | (30.69 | )% | |
| S&P 500 Index* | | | (28.90 | )%+ | |
| Russell 1000 Value Index | | | (27.89 | )%+ | |
* Benchmark
+ From 9/1/08.
Performance data quoted represents past performance; past performance is not predictive of future results. The investment return and principal value of shares of the Fund will fluctuate with market conditions so that shares of the Fund, when redeemed, may be worth more or less than their original cost. Current performance of the Fund may be lower or higher than the performance quoted. Performance data current to the most recent month end may be obtained by accessing the website www.massmutual.com.
Investors should note that the Fund is a professionally managed mutual fund, while the S&P 500 Index and the Russell 1000 Value Index are unmanaged, do not incur expenses, and cannot be purchased directly by investors. Investors should read the Fund's prospectus with regard to the Fund's investment objective, risks and charges and expenses in conjunction with these financial statements. The Fund's return reflects changes in the net asset value per share without the deduction of any product charges (e.g., cost of insurance, mortality and expense risk charges, administrative fees, and CDSL). The inclusion of these charges would have reduced the performance shown here.
9
MML Equity Index Fund – Portfolio Manager Report
What is the investment objective of MML Equity Index Fund – and who is the Fund's sub-adviser?
The Fund's investment objective is to provide investment results that correspond to the price and yield performance of publicly traded common stocks in the aggregate as represented by the S&P 500® Index. The Fund pursues this objective by investing at least 80% of its net assets in the securities of companies that make up the S&P 500 Index. The Fund's sub-adviser is Northern Trust Investments, N.A. (NTI).
How did the Fund perform during the 12 months ended December 31, 2008?
The Fund's Class I shares returned -37.26%, modestly lagging the -37.00% return of the S&P 500 Index (the "benchmark"), a widely recognized, unmanaged index representative of common stocks of larger capitalized U.S. companies.
For a discussion on the economic and market environment during the 12-month period ended December 31, 2008, please see the Economic and Market Review, beginning on page 3.
What factors contributed to the Fund's performance?
All benchmark sectors posted negative returns for the time period. Information technology, which is the largest sector in the benchmark, returned -43.14%. Energy, health care and financials, the three next-largest sectors in the benchmark, which cumulatively accounted for 41.4% of the benchmark, returned -34.87%, -22.81% and -55.32%, respectively, for the year.
The year 2008 was marked by extreme volatility in equity markets around the world, as the effects of the subprime mortgage crisis ricocheted throughout the financial system, resulting in a global credit crunch and economic slowdown. The near collapse of Bear Stearns in March of 2008, and the subsequent U.S. Government-orchestrated purchase of the bank by J.P. Morgan marked the beginning of a series of bank failures and government interventions. Following the bailout of Fannie Mae and Freddie Mac, the bankruptcy filing of Lehman Brothers, the acquisition of Merrill Lynch by Bank of America, the provision of an $85 billion emergency rescue loan to insurance giant American International Group (AIG) and the failure of Washington Mutual, a comprehensive fiscal rescue plan was developed by U.S. Government officials and congressional lawmakers.
The election of Barack Obama as the 44th president of the United States sparked a brief rally in early November, but market volatility subsequently continued nearly unchecked, as grim economic news persisted – including the announcement that the U.S. officially slid into a recession in December of 2007.
Oil prices peaked in the third quarter of 2008 and fell throughout the fourth quarter, closing at $41.02 a barrel on December 31.
What is your outlook?
As we entered 2009, investors faced a wide array of challenges. These included the ongoing housing and subprime mortgage crises, rapidly escalating unemployment, and the new threat of deflation, to name just a few. Despite these uncertainties, we believe that the Fund continues to be positioned to pursue returns that are relatively in line with those of the benchmark during 2009.
"Standard & Poor's®", "S&P®", "S&P 500®", "Standard & Poor's 500" and "500" are trademarks of The McGraw-Hill Companies, Inc. and have been licensed for use by the Fund. The Fund is not sponsored, endorsed, sold or promoted by Standard & Poor's and Standard & Poor's makes no representation regarding the advisability of investing in the Fund.
10
MML Equity Index Fund – Portfolio Manager Report (Continued)
MML Equity Index Fund
Largest Holdings
(% of Net Assets) on 12/31/08
(Unaudited) | |
| Exxon Mobil Corp. | | | 5.1 | % | |
| The Procter & Gamble Co. | | | 2.3 | % | |
| General Electric Co. | | | 2.1 | % | |
| AT&T, Inc. | | | 2.1 | % | |
| Johnson & Johnson | | | 2.1 | % | |
| Chevron Corp. | | | 1.9 | % | |
| Microsoft Corp. | | | 1.8 | % | |
| Wal-Mart Stores, Inc. | | | 1.6 | % | |
| Pfizer, Inc. | | | 1.5 | % | |
| JP Morgan Chase & Co. | | | 1.5 | % | |
| | | | 22.0 | % | |
MML Equity Index Fund
Sector Table
(% of Net Assets) on 12/31/08
(Unaudited) | |
| Consumer, Non-cyclical | | | 25.3 | % | |
| Energy | | | 13.2 | % | |
| Financial | | | 12.8 | % | |
| Industrial | | | 11.1 | % | |
| Communications | | | 10.5 | % | |
| Technology | | | 10.1 | % | |
| Consumer, Cyclical | | | 8.0 | % | |
| Utilities | | | 4.0 | % | |
| Basic Materials | | | 2.9 | % | |
| Total Long-Term Investments | | | 97.9 | % | |
Short-Term Investments and
Other Assets and Liabilities | | | 2.1 | % | |
| Net Assets | | | 100.0 | % | |
11
MML Equity Index Fund – Portfolio Manager Report (Continued)
Growth of a $10,000 Investment
Hypothetical Investments in MML Equity Index Fund Class I and the S&P 500 Index.
TOTAL RETURN
| | | One Year
1/1/08 - 12/31/08 | | Five Year
Average Annual
1/1/04 - 12/31/08 | | Ten Year
Average Annual
1/1/99 - 12/31/08 | |
| Class I | | | (37.26 | )% | | | (2.57 | )% | | | (1.82 | )% | |
| S&P 500 Index | | | (37.00 | )% | | | (2.19 | )% | | | (1.38 | )% | |
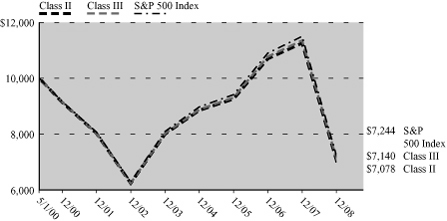
GROWTH OF $10,000 INVESTMENT FOR THE PAST TEN YEARS

Hypothetical Investments in MML Equity Index Fund Class II, Class III and the S&P 500 Index.
TOTAL RETURN
| | | One Year
1/1/08 - 12/31/08 | | Five Year
Average Annual
1/1/04 - 12/31/08 | | Since Inception
Average Annual
5/1/00 - 12/31/08 | |
| Class II | | | (37.14 | )% | | | (2.42 | )% | | | (3.91 | )% | |
| Class III | | | (37.09 | )% | | | (2.29 | )% | | | (3.81 | )% | |
| S&P 500 Index | | | (37.00 | )% | | | (2.19 | )% | | | (3.65 | )% | |
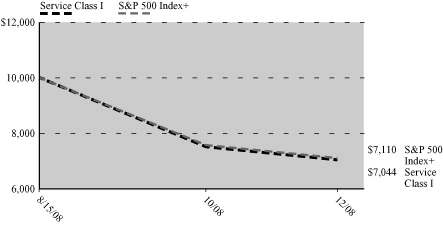
GROWTH OF $10,000 INVESTMENT SINCE INCEPTION
Hypothetical Investments in MML Equity Index Fund Service Class I and the S&P 500 Index.
TOTAL RETURN
| | | Since Inception
8/15/08 - 12/31/08 | |
| Service Class I | | | (29.56 | )% | |
| S&P 500 Index | | | (28.90 | )%+ | |
+ From 9/1/08.
Performance data quoted represents past performance; past performance is not predictive of future results. The investment return and principal value of shares of the Fund will fluctuate with market conditions so that shares of the Fund, when redeemed, may be worth more or less than their original cost. Current performance of the Fund may be lower or higher than the performance quoted. Performance data current to the most recent month end may be obtained by accessing the website www.massmutual.com.
Investors should note that the Fund is a professionally managed mutual fund, while the S&P 500 Index is unmanaged, does not incur expenses, and cannot be purchased directly by investors. Investors should read the Fund's prospectus with regard to the Fund's investment objective, risks and charges and expenses in conjunction with these financial statements. The Fund's return reflects changes in the net asset value per share without the deduction of any product charges (e.g., cost of insurance, mortality and expense risk charges, administrative fees, and CDSL). The inclusion of these charges would have reduced the performance shown here.
12
MML Growth Equity Fund – Portfolio Manager Report
What is the investment objective of MML Growth Equity Fund – and who is the Fund's sub-adviser?
The Fund seeks long-term growth of capital and future income by normally investing at least 80% of its net assets in the common stocks and securities convertible into common stocks of companies which the Fund's sub-adviser believes offer prospects for long-term growth. The Fund's sub-adviser is T. Rowe Price Associates, Inc. (T. Rowe Price).
How did the Fund perform during the 12 months ended December 31, 2008?
The Fund's Initial Class shares returned -42.69%, trailing the -38.44% return of the Russell 1000® Growth Index (the "benchmark"), an unmanaged index consisting of those Russell 1000 securities (representing the 1,000 largest U.S. companies based on market capitalization) with greater-than-average growth orientation that tend to exhibit higher price-to-book ratios and forecasted growth values than securities in the value universe.
For a discussion on the economic and market environment during the 12-month period ended December 31, 2008, please see the Economic and Market Review, beginning on page 3.
What factors contributed to the Fund's performance?
Health care contributed significantly to the Fund's performance, due to both its place as the second-best performer in the benchmark, and the portfolio's substantially overweight position relative to the benchmark in that sector. Within health care, biotechnology stocks performed strongly. Gilead Sciences continued to gain market share with an impressive HIV therapy franchise. Shares of Genentech were boosted by an acquisition bid from Swiss pharmaceutical maker Roche. Genentech also received Food and Drug Administration approval for Avastin, a drug used in the treatment of breast cancer. The portfolio also benefited from avoiding companies expected to be negatively affected by anticipated health care refo rm. The portfolio maintained a notably overweight position in this sector, on the belief that it offers some of the most attractive near-term growth opportunities. The Fund's underweight position in the energy sector also produced positive relative results. With falling energy prices in the second half of the year, the sector tumbled and was the second-worst performer in the benchmark for the year.
Consumer staples stocks were the primary detractor from the Fund's results relative to the benchmark, as the portfolio held an underweight position in this top-performing sector. A substantially overweight position in financials, the worst benchmark performer, was also a major detractor from the Fund's full-year performance. Stock selection in the capital markets industry had a negative impact. The high-margin business model of capital markets is expected to come under intensified scrutiny in the wake of U.S. Treasury bailouts for many companies in the financials sector. In order to receive government assistance, some traditional investment banks, such as portfolio holdings Morgan Stanley and Goldman Sachs, transformed into traditional deposit-accepting banks. With lower expectations, both of these companies drastically cut expenses, including staffing and compensation. Ameriprise Financial's stock fell on investor concerns about insurance c ompanies. As 2008 came to a close, the portfolio held an overweight position in the financials sector, almost exclusively in capital markets. While cautious, we believe selected capital markets companies are attractively priced.
Consumer discretionary underperformed on stock selection, notably in the hotels, restaurants and leisure industries. Gaming holdings, including Las Vegas Sands and MGM Mirage, notably disappointed. In past downturns, gaming stocks have generally been more defensive than others in the sector, but the current global credit crisis has severely limited access to financing and hampered development efforts. The portfolio has maintained its slightly overweight position in consumer discretionary, concentrated in Internet and catalog retail industry and hotels stocks.
What is your outlook?
While many hope that the worst of the market volatility has run its course, we believe it is very likely that markets will continue to be challenging. Our objective is to identify high-quality large-cap growth companies with strong fundamentals and attractive valuations. Amid tempered growth prospects, we see opportunities to invest in companies that we have been monitoring whose valuations and fundamentals are compelling. We believe that market fears and indiscriminate selling due to forced liquidations can lead to prices becoming disconnected from fundamentals, presenting significant buying opportunities.
13
MML Growth Equity Fund – Portfolio Manager Report (Continued)
MML Growth Equity Fund
Largest Holdings
(% of Net Assets) on 12/31/08
(Unaudited) | |
| Google, Inc. Class A | | | 3.4 | % | |
| Gilead Sciences, Inc. | | | 3.4 | % | |
| Genentech, Inc. | | | 3.1 | % | |
| Apple, Inc. | | | 3.1 | % | |
| Amazon.com, Inc. | | | 3.0 | % | |
| Danaher Corp. | | | 2.8 | % | |
| Microsoft Corp. | | | 2.5 | % | |
| Wal-Mart Stores, Inc. | | | 2.1 | % | |
| Exxon Mobil Corp. | | | 2.0 | % | |
| Celgene Corp. | | | 2.0 | % | |
| | | | 27.4 | % | |
MML Growth Equity Fund
Sector Table
(% of Net Assets) on 12/31/08
(Unaudited) | |
| Consumer, Non-cyclical | | | 29.1 | % | |
| Communications | | | 17.8 | % | |
| Technology | | | 14.7 | % | |
| Consumer, Cyclical | | | 11.0 | % | |
| Financial | | | 10.7 | % | |
| Energy | | | 7.0 | % | |
| Industrial | | | 4.5 | % | |
| Basic Materials | | | 3.5 | % | |
| Utilities | | | 0.6 | % | |
| Total Long-Term Investments | | | 98.9 | % | |
Short-Term Investments and
Other Assets and Liabilities | | | 1.1 | % | |
| Net Assets | | | 100.0 | % | |
14
MML Growth Equity Fund – Portfolio Manager Report (Continued)
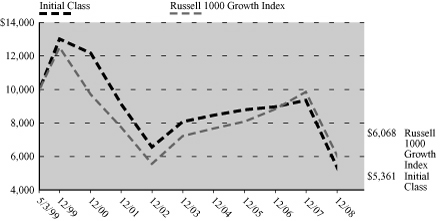
Growth of a $10,000 Investment
Hypothetical Investments in MML Growth Equity Fund Initial Class and the Russell 1000 Growth Index.
TOTAL RETURN
| | | One Year
1/1/08 - 12/31/08 | | Five Year
Average Annual
1/1/04 - 12/31/08 | | Since Inception
Average Annual
5/3/99 - 12/31/08 | |
| Initial Class | | | (42.69 | )% | | | (7.87 | )% | | | (6.25 | )% | |
Russell 1000
Growth Index | | | (38.44 | )% | | | (3.42 | )% | | | (5.04 | )% | |
GROWTH OF $10,000 INVESTMENT SINCE INCEPTION
Hypothetical Investments in MML Growth Equity Fund Service Class and the Russell 1000 Growth Index.
TOTAL RETURN
| | | Since Inception
8/15/08 - 12/31/08 | |
| Service Class | | | (36.56 | )% | |
| Russell 1000 Growth Index | | | (31.73 | )%+ | |
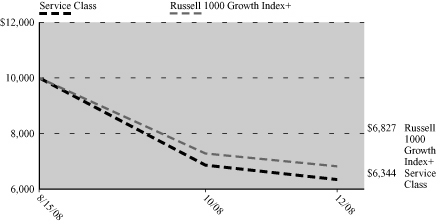
+ From 9/1/08.
Performance data quoted represents past performance; past performance is not predictive of future results. The investment return and principal value of shares of the Fund will fluctuate with market conditions so that shares of the Fund, when redeemed, may be worth more or less than their original cost. Current performance of the Fund may be lower or higher than the performance quoted. Performance data current to the most recent month end may be obtained by accessing the website www.massmutual.com.
Investors should note that the Fund is a professionally managed mutual fund, while the Russell 1000 Growth Index is unmanaged, do not incur expenses, and cannot be purchased directly by investors. Investors should read the Fund's prospectus with regard to the Fund's investment objective, risks and charges and expenses in conjunction with these financial statements. The Fund's return reflects changes in the net asset value per share without the deduction of any product charges (e.g., cost of insurance, mortality and expense risk charges, administrative fees, and CDSL). The inclusion of these charges would have reduced the performance shown here.
15
MML NASDAQ-100® Fund – Portfolio Manager Report
What is the investment objective of MML NASDAQ-100® Fund – and who is the Fund's sub-adviser?
The Fund seeks to approximate as closely as practicable (before fees and expenses) the total return of the NASDAQ-100 Index®. The Fund's sub-adviser is Northern Trust Investments, N.A. (NTI).
How did the Fund perform during the 12 months ended December 31, 2008?
The Fund's Initial Class shares returned -41.89%, matching the -41.89% return of the NASDAQ-100 Index (the "benchmark"). The NASDAQ-100 Index is a modified capitalization-weighted index composed of the 100 largest non-financial companies listed on the National Association of Securities Dealers Automated Quotations System (NASDAQ).
For a discussion on the economic and market environment during the 12-month period ended December 31, 2008, please see the Economic and Market Review, beginning on page 3.
What factors contributed to the Fund's performance?
All benchmark sectors posted negative returns for the time period. Information technology, the largest sector in the benchmark, returned -46.90% for the full year. The two next-largest sectors, consumer discretionary and health care, returned -46.09% and -8.66%, respectively, for the year.
The year 2008 was marked by extreme volatility in equity markets around the world, as the effects of the subprime mortgage crisis ricocheted throughout the financial system, resulting in a global credit crunch and economic slowdown. The near collapse of Bear Stearns in March of 2008, and the subsequent U.S. Government-orchestrated purchase of the bank by J.P. Morgan marked the beginning of a series of bank failures and government interventions. Following the bailout of Fannie Mae and Freddie Mac, the bankruptcy filing of Lehman Brothers, the acquisition of Merrill Lynch by Bank of America, the provision of an $85 billion emergency rescue loan to insurance giant American International Group (AIG) and the failure of Washington Mutual, a comprehensive fiscal rescue plan was developed by U.S. Government officials and congressional lawmakers.
The election of Barack Obama as the 44th president of the United States sparked a brief rally in early November, but market volatility subsequently continued nearly unchecked, as grim economic news persisted – including the announcement that the U.S. officially slid into a recession in December of 2007.
Oil prices peaked in the third quarter of 2008 and fell throughout the fourth quarter, closing at $41.02 a barrel on December 31.
What is your outlook?
As we entered 2009, investors faced a wide array of challenges. These included the ongoing housing and subprime mortgage crises, rapidly escalating unemployment, and the new threat of deflation, to name just a few. Despite these uncertainties, we believe that the Fund continues to be positioned to pursue returns that are relatively in line with those of the benchmark during 2009.
NASDAQ®, NASDAQ-100® and NASDAQ-100 Index® are trademarks of The NASDAQ Stock Market, Inc. (together with its affiliates, "NASDAQ") and are licensed for use by the Fund. The Fund has not been passed on by NASDAQ as to its legality or suitability. The Fund is not issued, endorsed, sold or promoted by NASDAQ. NASDAQ MAKES NO WARRANTIES AND BEARS NO LIABILITY WITH RESPECT TO THE FUND.
16
MML NASDAQ-100® Fund – Portfolio Manager Report (Continued)
MML NASDAQ-100 Fund
Largest Holdings
(% of Net Assets) on 12/31/08
(Unaudited) | |
| Apple, Inc. | | | 9.7 | % | |
| Qualcomm, Inc. | | | 6.5 | % | |
| Microsoft Corp. | | | 5.4 | % | |
| Gilead Sciences, Inc. | | | 4.2 | % | |
| Google, Inc. Class A | | | 4.1 | % | |
| Oracle Corp. | | | 3.5 | % | |
| Cisco Systems, Inc. | | | 3.1 | % | |
| Intel Corp. | | | 2.6 | % | |
| Amgen, Inc. | | | 2.6 | % | |
Teva Pharmaceutical Industries
Ltd. Sponsored ADR (Israel) | | | 2.5 | % | |
| | | | 44.2 | % | |
MML NASDAQ-100 Fund
Sector Table
(% of Net Assets) on 12/31/08
(Unaudited) | |
| Technology | | | 36.8 | % | |
| Communications | | | 25.1 | % | |
| Consumer, Non-cyclical | | | 23.4 | % | |
| Consumer, Cyclical | | | 7.7 | % | |
| Industrial | | | 3.7 | % | |
| Energy | | | 0.9 | % | |
| Basic Materials | | | 0.7 | % | |
| Total Long-Term Investments | | | 98.3 | % | |
Short-Term Investments and
Other Assets and Liabilities | | | 1.7 | % | |
| Net Assets | | | 100.0 | % | |
17
MML NASDAQ-100® Fund – Portfolio Manager Report (Continued)
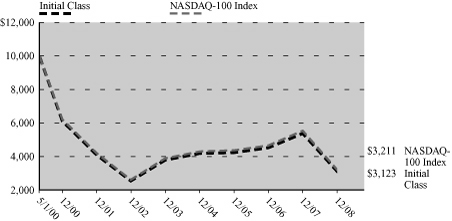
Growth of a $10,000 Investment
Hypothetical Investments in MML NASDAQ-100 Fund Initial Class and the NASDAQ-100 Index®.
TOTAL RETURN
| | | One Year
1/1/08 - 12/31/08 | | Five Year
Average Annual
1/1/04 - 12/31/08 | | Since Inception
Average Annual
5/1/00 - 12/31/08 | |
| Initial Class | | | (41.89 | )% | | | (3.78 | )% | | | (12.56 | )% | |
| NASDAQ-100 Index | | | (41.89 | )% | | | (3.76 | )% | | | (12.28 | )% | |
GROWTH OF $10,000 INVESTMENT SINCE INCEPTION
Hypothetical Investments in MML NASDAQ-100 Fund Service Class and the NASDAQ-100 Index.
TOTAL RETURN
| | | Since Inception
8/15/08 - 12/31/08 | |
| Service Class | | | (38.28 | )% | |
| NASDAQ-100 Index | | | (35.29 | )%+ | |

+ From 9/1/08.
Performance data quoted represents past performance; past performance is not predictive of future results. The investment return and principal value of shares of the Fund will fluctuate with market conditions so that shares of the Fund, when redeemed, may be worth more or less than their original cost. Current performance of the Fund may be lower or higher than the performance quoted. Performance data current to the most recent month end may be obtained by accessing the website www.massmutual.com.
Investors should note that the Fund is a professionally managed mutual fund, while the NASDAQ-100 Index is unmanaged, does not incur expenses, and cannot be purchased directly by investors. Investors should read the Fund's prospectus with regard to the Fund's investment objective, risks and charges and expenses in conjunction with these financial statements. The Fund's return reflects changes in the net asset value per share without the deduction of any product charges (e.g., cost of insurance, mortality and expense risk charges, administrative fees, and CDSL). The inclusion of these charges would have reduced the performance shown here.
18
MML Small Cap Growth Equity Fund – Portfolio Manager Report
What is the investment objective of MML Small Cap Growth Equity Fund – and who are the Fund's sub-advisers?
The Fund seeks long-term capital appreciation by investing primarily in common stocks and equity securities of smaller companies that the Fund's sub-advisers believe offer potential for long-term growth. The Fund's two sub-advisers are Waddell & Reed Investment Management Company (Waddell & Reed), which was responsible for approximately 52% of the Fund's portfolio; and Wellington Management Company, LLP (Wellington Management), which managed approximately 48% of the Fund's portfolio, as of December 31, 2008.
How did the Fund perform during the 12 months ended December 31, 2008?
The Fund's Initial Class shares returned -38.54%, matching the -38.54% return of the Russell 2000® Growth Index (the "benchmark"), a widely recognized, unmanaged index that measures the performance of those Russell 2000 Index companies (representing small-capitalization U.S. common stocks) with higher price-to-book ratios and forecasted growth rates. The Fund's -38.54% return, however, underperformed the -33.79% return of the Russell 2000 Index, a widely recognized, unmanaged index representative of common stocks of smaller capitalized U.S. companies.
For a discussion on the economic and market environment during the 12-month period ended December 31, 2008, please see the Economic and Market Review, beginning on page 3.
What factors contributed to the Fund's performance?
With respect to the Waddell & Reed component, during 2008, every sector that the portfolio had exposure to declined substantially. However, the portfolio's focus on quality helped throughout the year, as leveraged and unprofitable companies were especially hard hit by the credit freeze. The nature of the portfolio's investment process typically means that it tends to have lower weightings in commodity-related sectors, such as energy, materials and industrials. During the first half of 2008, commodities rose dramatically, causing the portfolio to underperform relative to the benchmark. As commodities plummeted in the second half of the year, however, the portfolio regained its ground – and then som e. October saw the credit freeze intensify and the Fund's higher-quality holdings (i.e., those with less debt, stronger cash flow) also helped the portfolio outperform the benchmark as the year drew to a close. Another contributor to the portfolio's relative performance was its favorable stock selection in the information technology sector.
On the other hand, detracting from performance were the portfolio's stock selections within the industrials sector. The portfolio's underweight position in the health care sector was a drag on performance for much of the year, but actually contributed to returns in the fourth quarter.
The Wellington Management portion of the Fund is managed by two fund managers, with each being responsible for their own portfolio.
One Wellington Management portfolio struggled due to stock selection within the financials, information technology and energy sectors. An underweight position in the health care sector also detracted from performance relative to the benchmark. Conversely, telecommunication services and industrials were positive contributors for the year. Low-cost wireless provider MetroPCS Communications performed well, as its attractive prepaid, unlimited calling plans allowed it to gain market share. Aecom Technology, a global planning, consulting, design and management services company for infrastructure projects, reported strong earnings, which boosted the portfolio's returns for the year.
The other Wellington Management portfolio was dragged down by less-than-favorable stock selection, led by investments within the health care, information technology and industrials sectors. An underweight position in financials, particularly small-cap banks, which performed well, was also a point of weakness. On the brighter side, the portfolio's stock selection in the consumer discretionary sector contributed to performance, led by DreamWorks Animation, Churchill Downs and Big Lots.
19
MML Small Cap Growth Equity Fund – Portfolio Manager Report (Continued)
What is your outlook?
As we entered 2009, last year's problems remained front and center. We are somewhat optimistic about the Fund's prospects going forward, given what we view as the sold-out position of the market and the enormous amount of stimulus in the economic system. However, economic data, such as the unemployment rate and corporate profits, are likely to get worse, in our opinion. Our hope, however, is that as upcoming data becomes more anticipated and understood, it will have the potential to create less volatility in the financial markets.
When and by how much stocks may turn upward will depend in large part on how successful policy makers are in stabilizing the economy and credit markets, while getting banks to lend again. But, with credit likely remaining relatively impaired for the foreseeable future, stable companies with strong cash positions are desirable.
20
MML Small Cap Growth Equity Fund – Portfolio Manager Report (Continued)
MML Small Cap Growth Equity Fund
Largest Holdings
(% of Net Assets) on 12/31/08
(Unaudited) | |
J.B. Hunt Transport
Services, Inc. | | | 2.1 | % | |
| Athenahealth, Inc. | | | 2.0 | % | |
| FactSet Research Systems, Inc. | | | 1.9 | % | |
| Alberto-Culver Co. | | | 1.8 | % | |
| Blackboard, Inc. | | | 1.8 | % | |
| Bankrate, Inc. | | | 1.6 | % | |
| Kansas City Southern | | | 1.4 | % | |
| O'Reilly Automotive, Inc. | | | 1.4 | % | |
| Blackbaud, Inc. | | | 1.4 | % | |
| LKQ Corp. | | | 1.4 | % | |
| | | | 16.8 | % | |
MML Small Cap Growth Equity Fund
Sector Table
(% of Net Assets) on 12/31/08
(Unaudited) | |
| Consumer, Non-cyclical | | | 20.4 | % | |
| Technology | | | 18.5 | % | |
| Consumer, Cyclical | | | 14.8 | % | |
| Industrial | | | 13.0 | % | |
| Financial | | | 8.4 | % | |
| Communications | | | 7.7 | % | |
| Energy | | | 3.7 | % | |
| Funds | | | 3.1 | % | |
| Utilities | | | 1.3 | % | |
| Basic Materials | | | 0.4 | % | |
| Diversified | | | 0.2 | % | |
| Total Long-Term Investments | | | 91.5 | % | |
Short-Term Investments and
Other Assets and Liabilities | | | 8.5 | % | |
| Net Assets | | | 100.0 | % | |
21
MML Small Cap Growth Equity Fund – Portfolio Manager Report (Continued)
Growth of a $10,000 Investment
Hypothetical Investments in MML Small Cap Growth Equity Fund Initial Class, the Russell 2000 Growth Index and Russell 2000 Index.
TOTAL RETURN
| | | One Year
1/1/08 - 12/31/08 | | Five Year
Average Annual
1/1/04 - 12/31/08 | | Since Inception
Average Annual
5/3/99 - 12/31/08 | |
| Initial Class | | | (38.54 | )% | | | (1.47 | )% | | | 2.53 | % | |
Russell 2000
Growth Index* | | | (38.54 | )% | | | (2.35 | )% | | | (1.48 | )% | |
| Russell 2000 Index | | | (33.79 | )% | | | (0.93 | )% | | | 2.81 | % | |
GROWTH OF $10,000 INVESTMENT SINCE INCEPTION

Hypothetical Investments in MML Small Cap Growth Equity Fund Service Class, the Russell 2000 Growth Index and Russell 2000 Index.
TOTAL RETURN
| | | Since Inception
8/15/08 - 12/31/08 | |
| Service Class | | | (33.82 | )% | |
| Russell 2000 Growth Index* | | | (35.65 | )%+ | |
| Russell 2000 Index | | | (32.00 | )%+ | |
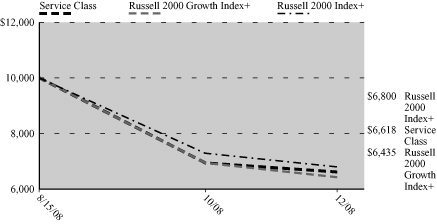
* Benchmark
+ From 9/1/08.
Performance data quoted represents past performance; past performance is not predictive of future results. The investment return and principal value of shares of the Fund will fluctuate with market conditions so that shares of the Fund, when redeemed, may be worth more or less than their original cost. Current performance of the Fund may be lower or higher than the performance quoted. Performance data current to the most recent month end may be obtained by accessing the website www.massmutual.com.
Investors should note that the Fund is a professionally managed mutual fund, while the Russell 2000 Growth Index and the Russell 2000 Index are unmanaged, do not incur expenses, and cannot be purchased directly by investors. Investors should read the Fund's prospectus with regard to the Fund's investment objective, risks and charges and expenses in conjunction with these financial statements. The Fund's return reflects changes in the net asset value per share without the deduction of any product charges (e.g., cost of insurance, mortality and expense risk charges, administrative fees, and CDSL). The inclusion of these charges would have reduced the performance shown here.
22
MML Emerging Growth Fund – Portfolio Manager Report
What is the investment objective of MML Emerging Growth Fund – and who are the Fund's sub-advisers?
The Fund seeks capital appreciation by investing primarily in smaller, rapidly growing emerging growth companies, which may include companies growing earnings per share and/or revenues at above-average rates. The Fund's sub-advisers are Insight Capital Research & Management, Inc. (Insight Capital), which oversaw approximately 57% of the Fund's portfolio; and Essex Investment Management Company, LLC (Essex), which was responsible for approximately 43% of the Fund's portfolio, as of December 31, 2008. Effective September 10, 2008, Essex replaced Delaware Management Company (DMC) as the Fund's co-sub-adviser.
How did the Fund perform during the 12 months ended December 31, 2008?
The Fund's Initial Class shares returned -41.97%, underperforming the -38.54% return of the Russell 2000® Growth Index (the "benchmark"), a widely recognized, unmanaged index that measures the performance of those Russell 2000 Index companies (representing small-capitalization U.S. common stocks) with higher price-to-book ratios and forecasted growth rates.
For a discussion on the economic and market environment during the 12-month period ended December 31, 2008, please see the Economic and Market Review, beginning on page 3.
What factors contributed to the Fund's performance?
With respect to the Insight Capital component of the Fund, stocks that had performed well in the portfolio for a long time began to lose strength in 2008, including consumer discretionary company Deckers Outdoors. In the second quarter, coal companies led the portfolio, with particularly strong performance from Alpha Natural Resources, Walters Industries and James River Coal. Unfortunately, the third quarter brought a break in energy prices, which fell hard and fast. By the end of July, Insight Capital had completely sold the coal companies in the portfolio. Elsewhere, after holding an underweight position relative to the benchmark for over two years, Insight Capital found compelling investment cases for h ealth care companies. An example of this was home health company Almost Family, which turned out to be a stable, growing addition to the portfolio. Finally, as the year wound down, one sector that worked well for the portfolio was the for profit education sector, where the biggest positive contributor to the portfolio was ITT Educational Services.
For the DMC component, less-than-favorable stock selection was the primary reason for the portfolio's underperformance for the reporting period from January 1 through September 9, 2008. Among the biggest detractors were online photo service Shutterfly Inc., which declined more than 40% as a result of increased pricing competition; Advanced Analogic Technologies Inc., a semiconductor company that was down 46% due to indications of weakness in one of their key markets; Under Armour Inc.; Taleo Corp. and Penwest Pharmaceuticals Co. – which lost over 35%, 30% and 55%, respectively. Other holdings with disappointing returns included Acadia Pharmaceuticals, Synchronoss Technologies and Chipotle Mexican Grill.
Conversely, top contributors to performance included Old Dominion Freight Line Inc.; Clean Harbors, Inc.; Gymboree Corp. and United Fire & Causalty Co. Finally, positive stock selection in the health care sector was unable to overcome weakness in the consumer services, basic industry and financial sectors.
With respect to the Essex component of the Fund, for the reporting period from September 10 through December 31, 2008, the portfolio's cautious stance on energy was validated, and its underweight position in traditional energy holdings benefited returns. Similar to commodities, capital goods-related groups, agricultural chemicals and basic materials holdings reversed course during the last half of the year, hurt by the slowing global economy. Additionally, the producer durables sector suffered from the economic slowdown, and portfolio holdings in that area were weighted toward emerging markets, which further depressed returns. Several detractors were sold, including L-1 Identity Solutions Inc. and EMCORE Corp. Consumer spending-related holdings also had a negative impact on returns, with sobering headlines of weak holiday sales, falling home prices and rising unemployment. On the other hand, education companies contributed positively, led by Corinthian Colleges Inc. However, these returns were more than offset by weakness in Central European Media Enterprises, which traded down due to its emerging markets exposure. In health care, investors embraced the sector's defensive characteristics, although the portfolio's returns were hurt by stock
23
MML Emerging Growth Fund – Portfolio Manager Report (Continued)
selection. In technology, many stocks remained under pressure due to concerns about the sector's exposure to macroeconomic weakness. However, favorable stock selection held performance significantly above the benchmark: Asiainfo Holdings Inc., Shanda Interactive Entertainment Ltd. and EPIQ Systems Inc. were top contributors.
What is your outlook?
The global financial crisis continues, with key U.S. indicators expected to remain weak for several more quarters. While there are some preliminary signs of easing credit conditions, further evidence is needed to confirm these policies are gaining traction – namely, narrowing corporate bond spreads, stabilizing employment and falling home inventories.
We are hopeful that the lowering of short-term interest rates to near zero by the Federal Reserve, coupled with the expected enactment of the new administration's stimulus package, may help to set the stage for an economic recovery in the second half of 2009. While it is our view that financial markets will likely remain in a volatile bottoming phase as the unwinding of the credit boom continues, stock prices approaching their true values and high levels of cash could help to establish a market bottom.
24
MML Emerging Growth Fund – Portfolio Manager Report (Continued)
MML Emerging Growth Fund
Largest Holdings
(% of Net Assets) on 12/31/08
(Unaudited) | |
| Thoratec Corp. | | | 3.1 | % | |
| Alexion Pharmaceuticals, Inc. | | | 2.6 | % | |
ManTech International Corp.
Class A | | | 2.6 | % | |
| ITT Educational Services, Inc. | | | 2.6 | % | |
| Corinthian Colleges, Inc. | | | 2.5 | % | |
| Myriad Genetics, Inc. | | | 2.4 | % | |
| Axsys Technologies, Inc. | | | 2.2 | % | |
| Nuvasive, Inc. | | | 2.1 | % | |
| Almost Family, Inc. | | | 1.9 | % | |
| Life Partners Holdings, Inc. | | | 1.9 | % | |
| | | | 23.9 | % | |
MML Emerging Growth Fund
Sector Table
(% of Net Assets) on 12/31/08
(Unaudited) | |
| Consumer, Non-cyclical | | | 46.1 | % | |
| Industrial | | | 15.4 | % | |
| Technology | | | 11.8 | % | |
| Consumer, Cyclical | | | 8.4 | % | |
| Communications | | | 8.4 | % | |
| Financial | | | 5.5 | % | |
| Energy | | | 1.1 | % | |
| Total Long-Term Investments | | | 96.7 | % | |
Short-Term Investments and
Other Assets and Liabilities | | | 3.3 | % | |
| Net Assets | | | 100.0 | % | |
25
MML Emerging Growth Fund – Portfolio Manager Report (Continued)
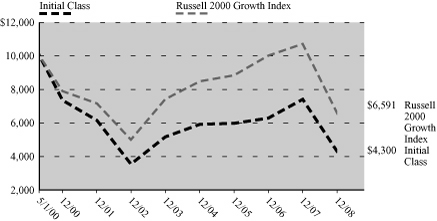
Growth of a $10,000 Investment
Hypothetical Investments in MML Emerging Growth Fund Initial Class and the Russell 2000 Growth Index.
TOTAL RETURN
| | | One Year
1/1/08 - 12/31/08 | | Five Year
Average Annual
1/1/04 - 12/31/08 | | Since Inception
Average Annual
5/1/00 - 12/31/08 | |
| Initial Class | | | (41.97 | )% | | | (3.58 | )% | | | (9.28 | )% | |
Russell 2000
Growth Index | | | (38.54 | )% | | | (2.35 | )% | | | (4.70 | )% | |
GROWTH OF $10,000 INVESTMENT SINCE INCEPTION
Hypothetical Investments in MML Emerging Growth Fund Service Class and the Russell 2000 Growth Index.
TOTAL RETURN
| | | Since Inception
8/15/08 - 12/31/08 | |
| Service Class | | | (36.01 | )% | |
| Russell 2000 Growth Index | | | (35.65 | )%+ | |
+ From 9/1/08.
Performance data quoted represents past performance; past performance is not predictive of future results. The investment return and principal value of shares of the Fund will fluctuate with market conditions so that shares of the Fund, when redeemed, may be worth more or less than their original cost. Current performance of the Fund may be lower or higher than the performance quoted. Performance data current to the most recent month end may be obtained by accessing the website www.massmutual.com.
Investors should note that the Fund is a professionally managed mutual fund, while the Russell 2000 Growth Index is unmanaged, does not incur expenses, and cannot be purchased directly by investors. Investors should read the Fund's prospectus with regard to the Fund's investment objective, risks and charges and expenses in conjunction with these financial statements. The Fund's return reflects changes in the net asset value per share without the deduction of any product charges (e.g., cost of insurance, mortality and expense risk charges, administrative fees, and CDSL). The inclusion of these charges would have reduced the performance shown here.
26
MML Large Cap Value Fund – Portfolio of Investments
December 31, 2008
| | | Number of
Shares | | Value | |
| EQUITIES — 90.3% | |
| COMMON STOCK — 90.3% | |
| Agriculture — 3.4% | |
| Altria Group, Inc. | | | 10,600 | | | $ | 159,636 | | |
Philip Morris
International, Inc. | | | 136,500 | | | | 5,939,115 | | |
| | | | 6,098,751 | | |
| Auto Manufacturers — 0.3% | |
| Paccar, Inc. | | | 19,720 | | | | 563,992 | | |
| Banks — 6.5% | |
The Bank of New York
Mellon Corp. | | | 119,900 | | | | 3,396,767 | | |
| State Street Corp. | | | 6,500 | | | | 255,645 | | |
| Wachovia Corp. | | | 58,479 | | | | 323,974 | | |
| Wells Fargo & Co. | | | 260,500 | | | | 7,679,540 | | |
| | | | 11,655,926 | | |
| Beverages — 2.1% | |
Diageo PLC Sponsored
ADR (United Kingdom) | | | 39,500 | | | | 2,241,230 | | |
Heineken Holding NV
Class A | | | 54,150 | | | | 1,550,246 | | |
| | | | 3,791,476 | | |
| Building Materials — 1.0% | |
| Martin Marietta Materials, Inc. | | | 17,700 | | | | 1,718,316 | | |
| Chemicals — 0.5% | |
| Monsanto Co. | | | 12,200 | | | | 858,270 | | |
| Coal — 0.4% | |
| China Coal Energy Co. | | | 806,700 | | | | 651,900 | | |
| Commercial Services — 4.3% | |
| Cosco Pacific Ltd. | | | 270,600 | | | | 278,593 | | |
| H&R Block, Inc. | | | 125,400 | | | | 2,849,088 | | |
| Iron Mountain, Inc.(a) | | | 129,699 | | | | 3,207,456 | | |
| Moody's Corp. | | | 56,200 | | | | 1,129,058 | | |
| Visa, Inc. Class A | | | 6,970 | | | | 365,577 | | |
| | | | 7,829,772 | | |
| Computers — 1.4% | |
| Dell, Inc.(a) | | | 55,200 | | | | 565,248 | | |
| Hewlett-Packard Co. | | | 55,600 | | | | 2,017,724 | | |
| | | | 2,582,972 | | |
| Cosmetics & Personal Care — 1.9% | |
| Avon Products, Inc. | | | 22,500 | | | | 540,675 | | |
| The Procter & Gamble Co. | | | 47,500 | | | | 2,936,450 | | |
| | | | 3,477,125 | | |
| | | Number of
Shares | | Value | |
| Diversified Financial — 8.2% | |
| American Express Co. | | | 233,300 | | | $ | 4,327,715 | | |
| Ameriprise Financial, Inc. | | | 40,780 | | | | 952,621 | | |
| Citigroup, Inc. | | | 57,100 | | | | 383,141 | | |
| Discover Financial Services | | | 12,400 | | | | 118,172 | | |
| E*Trade Financial Corp.(a) | | | 16,400 | | | | 18,860 | | |
The Goldman Sachs
Group, Inc. | | | 6,860 | | | | 578,915 | | |
| JP Morgan Chase & Co. | | | 238,216 | | | | 7,510,951 | | |
| Merrill Lynch & Co., Inc. | | | 64,428 | | | | 749,942 | | |
| Morgan Stanley | | | 8,300 | | | | 133,132 | | |
| | | | 14,773,449 | | |
| Electric — 0.2% | |
| The AES Corp.(a) | | | 44,600 | | | | 367,504 | | |
| Electronics — 1.3% | |
| Agilent Technologies, Inc.(a) | | | 85,400 | | | | 1,334,802 | | |
| Garmin Ltd. | | | 11,100 | | | | 212,787 | | |
| Tyco Electronics Ltd. | | | 49,680 | | | | 805,313 | | |
| | | | 2,352,902 | | |
| Engineering & Construction — 0.1% | |
ABB Ltd. Sponsored
ADR (Switzerland) | | | 16,340 | | | | 245,263 | | |
| Foods — 0.3% | |
| The Hershey Co. | | | 12,400 | | | | 430,776 | | |
| Whole Foods Market, Inc. | | | 16,500 | | | | 155,760 | | |
| | | | 586,536 | | |
| Forest Products & Paper — 0.4% | |
| Sino-Forest Corp.(a) | | | 97,000 | | | | 775,529 | | |
| Health Care – Products — 0.6% | |
| Johnson & Johnson | | | 18,700 | | | | 1,118,821 | | |
| Health Care – Services — 0.9% | |
| UnitedHealth Group, Inc. | | | 63,900 | | | | 1,699,740 | | |
| Holding Company – Diversified — 0.6% | |
China Merchants Holdings
International Co. Ltd. | | | 527,020 | | | | 1,038,525 | | |
| Housewares — 0.1% | |
| Hunter Douglas NV | | | 6,765 | | | | 222,536 | | |
| Insurance — 11.1% | |
American International
Group, Inc. | | | 203,150 | | | | 318,945 | | |
Berkshire Hathaway, Inc.
Class A(a) | | | 91 | | | | 8,790,600 | | |
The Hartford Financial
Services Group, Inc. | | | 36,200 | | | | 594,404 | | |
| Loews Corp. | | | 141,300 | | | | 3,991,725 | | |
| | | Number of
Shares | | Value | |
| Markel Corp.(a) | | | 495 | | | $ | 148,005 | | |
| MBIA, Inc.(a) | | | 13,600 | | | | 55,352 | | |
Nipponkoa
Insurance Co. Ltd. | | | 23,600 | | | | 183,464 | | |
Principal Financial
Group, Inc. | | | 16,200 | | | | 365,634 | | |
| The Progressive Corp. | | | 251,250 | | | | 3,721,012 | | |
| Sun Life Financial, Inc. | | | 9,840 | | | | 227,698 | | |
| Transatlantic Holdings, Inc. | | | 41,913 | | | | 1,679,035 | | |
| | | | 20,075,874 | | |
| Internet — 1.5% | |
| Amazon.com, Inc.(a) | | | 16,700 | | | | 856,376 | | |
| eBay, Inc.(a) | | | 24,800 | | | | 346,208 | | |
| Google, Inc. Class A(a) | | | 4,160 | | | | 1,279,824 | | |
Liberty Media Holding Corp.
Interactive Class A(a) | | | 40,700 | | | | 126,984 | | |
| | | | 2,609,392 | | |
| Leisure Time — 0.8% | |
| Harley-Davidson, Inc. | | | 81,100 | | | | 1,376,267 | | |
| Manufacturing — 1.1% | |
| Siemens AG | | | 10,600 | | | | 793,945 | | |
| Tyco International Ltd. | | | 52,200 | | | | 1,127,520 | | |
| | | | 1,921,465 | | |
| Media — 3.8% | |
Comcast Corp. Special
Class A | | | 259,850 | | | | 4,196,577 | | |
Liberty Media Corp.
Entertainment Class A(a) | | | 34,060 | | | | 595,369 | | |
| News Corp. Class A | | | 230,350 | | | | 2,093,882 | | |
WPP PLC Sponsored ADR
(United Kingdom) | | | 1,300 | | | | 38,467 | | |
| | | | 6,924,295 | | |
| Mining — 1.4% | |
| BHP Billiton PLC | | | 32,500 | | | | 612,199 | | |
| Rio Tinto PLC | | | 11,600 | | | | 251,335 | | |
| Vulcan Materials Co. | | | 22,700 | | | | 1,579,466 | | |
| | | | 2,443,000 | | |
| Oil & Gas — 16.5% | |
Canadian Natural
Resources Ltd. | | | 63,500 | | | | 2,538,730 | | |
| ConocoPhillips | | | 144,960 | | | | 7,508,928 | | |
| Devon Energy Corp. | | | 92,000 | | | | 6,045,320 | | |
| EOG Resources, Inc. | | | 78,400 | | | | 5,219,872 | | |
| Occidental Petroleum Corp. | | | 124,530 | | | | 7,470,554 | | |
| Transocean Ltd.(a) | | | 20,479 | | | | 967,633 | | |
| | | | 29,751,037 | | |
(Continued)
The accompanying notes are an integral part of the financial statements.
27
MML Large Cap Value Fund – Portfolio of Investments (Continued)
| | | Number of
Shares | | Value | |
| Packaging & Containers — 1.6% | |
| Sealed Air Corp. | | | 193,900 | | | $ | 2,896,866 | | |
| Pharmaceuticals — 2.8% | |
| Cardinal Health, Inc. | | | 37,800 | | | | 1,302,966 | | |
| Express Scripts, Inc.(a) | | | 29,600 | | | | 1,627,408 | | |
| Schering-Plough Corp. | | | 122,400 | | | | 2,084,472 | | |
| | | | 5,014,846 | | |
| Real Estate — 0.8% | |
Brookfield Asset
Management, Inc.
Class A | | | 57,700 | | | | 881,079 | | |
| Hang Lung Properties Ltd. | | | 163,000 | | | | 497,520 | | |
| | | | 1,378,599 | | |
| Retail — 8.8% | |
| Bed Bath & Beyond, Inc.(a) | | | 64,600 | | | | 1,642,132 | | |
| Carmax, Inc.(a) | | | 87,470 | | | | 689,264 | | |
| Costco Wholesale Corp. | | | 167,500 | | | | 8,793,750 | | |
| CVS Caremark Corp. | | | 127,698 | | | | 3,670,040 | | |
| Lowe's Cos., Inc. | | | 43,700 | | | | 940,424 | | |
| Sears Holdings Corp.(a) | | | 2,700 | | | | 104,949 | | |
| | | | 15,840,559 | | |
| Semiconductors — 1.3% | |
| Texas Instruments, Inc. | | | 153,600 | | | | 2,383,872 | | |
| Software — 2.4% | |
| Dun & Bradstreet Corp. | | | 11,450 | | | | 883,940 | | |
| Microsoft Corp. | | | 176,300 | | | | 3,427,272 | | |
| | | | 4,311,212 | | |
| Telecommunications — 0.7% | |
| Cisco Systems, Inc.(a) | | | 60,900 | | | | 992,670 | | |
| Sprint Nextel Corp.(a) | | | 161,700 | | | | 295,911 | | |
| | | | 1,288,581 | | |
| Transportation — 1.2% | |
China Shipping
Development Co. Ltd. | | | 262,000 | | | | 263,705 | | |
Kuehne & Nagel
International AG | | | 12,400 | | | | 803,968 | | |
United Parcel Service, Inc.
Class B | | | 18,200 | | | | 1,003,912 | | |
| | | | 2,071,585 | | |
TOTAL COMMON STOCK
(Cost $220,645,202) | | | 162,696,755 | | |
TOTAL EQUITIES
(Cost $220,645,202) | | | 162,696,755 | | |
| | | Principal
Amount | | Value | |
| BONDS & NOTES — 0.1% | |
| CORPORATE DEBT — 0.1% | |
| Forest Products & Paper — 0.1% | |
Sino-Forest Corp.
(Acquired 7/23/08,
Cost $350,424)(b) (c)
5.000% 8/01/13 | | $ | 359,000 | | | $ | 254,890 | | |
TOTAL CORPORATE DEBT
(Cost $351,087) | | | 254,890 | | |
TOTAL BONDS & NOTES
(Cost $351,087) | | | 254,890 | | |
TOTAL LONG-TERM
INVESTMENTS
(Cost $220,996,289) | | | 162,951,645 | | |
| SHORT-TERM INVESTMENTS — 5.7% | |
| Repurchase Agreement — 5.7% | |
State Street Bank & Trust Co.
Repurchase Agreement,
dated 12/31/08, 0.010%,
due 1/02/09(d) | | | 10,179,776 | | | | 10,179,776 | | |
TOTAL SHORT-TERM
INVESTMENTS
(Cost $10,179,776) | | | 10,179,776 | | |
TOTAL INVESTMENTS — 96.1%
(Cost $231,176,065)(e) | | | 173,131,421 | | |
Other Assets/
(Liabilities) — 3.9% | | | 7,004,761 | | |
| NET ASSETS — 100.0% | | $ | 180,136,182 | | |
Notes to Portfolio of Investments
Industry classifications are unaudited.
ADR - American Depositary Receipt
(a) Non-income producing security.
(b) Securities exempt from registration under rule 144A of the Securities Act of 1933. These securities may be resold in transactions exempt from registration, normally to qualified institutional buyers. At December 31, 2008, these securities amounted to a value of $254,890 or 0.14% of net assets.
(c) Restricted security. (Note 2).
(d) Maturity value of $10,179,782. Collateralized by U.S. Government Agency obligations with a rate of 4.834%, maturity date of 7/01/35, and an aggregate market value, including accrued interest, of $10,385,902.
(e) See Note 6 for aggregate cost for federal tax purposes.
The accompanying notes are an integral part of the financial statements.
28
MML Equity Index Fund – Portfolio of Investments
December 31, 2008
| | | Number of
Shares | | Value | |
| EQUITIES — 97.9% | |
| COMMON STOCK — 97.9% | |
| Advertising — 0.1% | |
Interpublic Group
of Cos., Inc.(a) | | | 13,919 | | | $ | 55,119 | | |
| Omnicom Group, Inc. | | | 9,412 | | | | 253,371 | | |
| | | | 308,490 | | |
| Aerospace & Defense — 2.3% | |
| Boeing Co. | | | 22,211 | | | | 947,743 | | |
| General Dynamics Corp. | | | 11,714 | | | | 674,609 | | |
| Goodrich Corp. | | | 3,839 | | | | 142,120 | | |
L-3 Communications
Holdings, Inc. | | | 3,600 | | | | 265,608 | | |
| Lockheed Martin Corp. | | | 10,040 | | | | 844,163 | | |
| Northrop Grumman Corp. | | | 9,890 | | | | 445,446 | | |
| Raytheon Co. | | | 12,588 | | | | 642,492 | | |
| Rockwell Collins, Inc. | | | 4,868 | | | | 190,290 | | |
| United Technologies Corp. | | | 28,722 | | | | 1,539,499 | | |
| | | | 5,691,970 | | |
| Agriculture — 2.0% | |
| Altria Group, Inc. | | | 61,754 | | | | 930,015 | | |
| Archer-Daniels-Midland Co. | | | 19,361 | | | | 558,178 | | |
| Lorillard, Inc. | | | 5,046 | | | | 284,342 | | |
Philip Morris
International, Inc. | | | 61,354 | | | | 2,669,513 | | |
| Reynolds American, Inc. | | | 5,200 | | | | 209,612 | | |
| UST, Inc. | | | 4,422 | | | | 306,798 | | |
| | | | 4,958,458 | | |
| Airlines — 0.1% | |
| Southwest Airlines Co. | | | 22,240 | | | | 191,709 | | |
| Apparel — 0.3% | |
| Nike, Inc. Class B | | | 11,562 | | | | 589,662 | | |
| VF Corp. | | | 2,651 | | | | 145,195 | | |
| | | | 734,857 | | |
| Auto Manufacturers — 0.2% | |
| Ford Motor Co.(a) | | | 73,077 | | | | 167,346 | | |
| General Motors Corp. | | | 17,030 | | | | 54,496 | | |
| Paccar, Inc. | | | 10,935 | | | | 312,741 | | |
| | | | 534,583 | | |
| Automotive & Parts — 0.2% | |
The Goodyear Tire &
Rubber Co.(a) | | | 7,165 | | | | 42,775 | | |
| Johnson Controls, Inc. | | | 18,050 | | | | 327,788 | | |
| | | | 370,563 | | |
| | | Number of
Shares | | Value | |
| Banks — 4.9% | |
| Bank of America Corp. | | | 151,899 | | | $ | 2,138,738 | | |
The Bank of New York
Mellon Corp. | | | 34,406 | | | | 974,722 | | |
| BB&T Corp. | | | 16,483 | | | | 452,623 | | |
| Capital One Financial Corp. | | | 11,534 | | | | 367,819 | | |
| Comerica, Inc. | | | 4,569 | | | | 90,695 | | |
| Fifth Third Bancorp | | | 16,522 | | | | 136,472 | | |
First Horizon
National Corp. | | | 5,420 | | | | 57,287 | | |
| Huntington Bancshares, Inc. | | | 11,334 | | | | 86,818 | | |
| KeyCorp | | | 14,910 | | | | 127,033 | | |
| M&T Bank Corp. | | | 2,300 | | | | 132,043 | | |
| Marshall & Ilsley Corp. | | | 7,800 | | | | 106,392 | | |
| National City Corp. | | | 63,498 | | | | 114,931 | | |
| Northern Trust Corp. | | | 6,671 | | | | 347,826 | | |
PNC Financial Services
Group, Inc. | | | 10,449 | | | | 512,001 | | |
| Regions Financial Corp. | | | 20,889 | | | | 166,277 | | |
| State Street Corp. | | | 13,022 | | | | 512,155 | | |
| SunTrust Banks, Inc. | | | 10,590 | | | | 312,829 | | |
| U.S. Bancorp | | | 53,432 | | | | 1,336,334 | | |
| Wachovia Corp. | | | 65,151 | | | | 360,937 | | |
| Wells Fargo & Co. | | | 114,158 | | | | 3,365,378 | | |
| Zions Bancorp | | | 3,293 | | | | 80,711 | | |
| | | | 11,780,021 | | |
| Beverages — 2.5% | |
Brown-Forman Corp.
Class B | | | 2,975 | | | | 153,183 | | |
| The Coca-Cola Co. | | | 60,291 | | | | 2,729,374 | | |
| Coca-Cola Enterprises, Inc. | | | 8,574 | | | | 103,145 | | |
Constellation Brands, Inc.
Class A(a) | | | 6,000 | | | | 94,620 | | |
Dr. Pepper Snapple
Group, Inc.(a) | | | 7,700 | | | | 125,125 | | |
Molson Coors
Brewing Co. Class B | | | 4,278 | | | | 209,280 | | |
The Pepsi Bottling
Group, Inc. | | | 4,038 | | | | 90,895 | | |
| PepsiCo, Inc. | | | 46,908 | | | | 2,569,151 | | |
| | | | 6,074,773 | | |
| Biotechnology — 1.6% | |
| Amgen, Inc.(a) | | | 32,169 | | | | 1,857,760 | | |
| Biogen Idec, Inc.(a) | | | 8,637 | | | | 411,380 | | |
| Celgene Corp.(a) | | | 14,078 | | | | 778,232 | | |
| Genzyme Corp.(a) | | | 8,100 | | | | 537,597 | | |
| Life Technologies Corp.(a) | | | 4,874 | | | | 113,613 | | |
| Millipore Corp.(a) | | | 1,715 | | | | 88,357 | | |
| | | | 3,786,939 | | |
| | | Number of
Shares | | Value | |
| Building Materials — 0.1% | |
| Masco Corp. | | | 11,167 | | | $ | 124,289 | | |
| Chemicals — 1.8% | |
Air Products &
Chemicals, Inc. | | | 6,358 | | | | 319,617 | | |
| CF Industries Holdings, Inc. | | | 1,700 | | | | 83,572 | | |
| The Dow Chemical Co. | | | 27,668 | | | | 417,510 | | |
Du Pont (E.I.) de
Nemours & Co. | | | 27,104 | | | | 685,731 | | |
| Eastman Chemical Co. | | | 2,300 | | | | 72,933 | | |
| Ecolab, Inc. | | | 5,216 | | | | 183,342 | | |
International Flavors &
Fragrances, Inc. | | | 2,346 | | | | 69,723 | | |
| Monsanto Co. | | | 16,470 | | | | 1,158,665 | | |
| PPG Industries, Inc. | | | 4,889 | | | | 207,440 | | |
| Praxair, Inc. | | | 9,364 | | | | 555,847 | | |
| Rohm & Haas Co. | | | 3,740 | | | | 231,095 | | |
| The Sherwin-Williams Co. | | | 3,029 | | | | 180,983 | | |
| Sigma-Aldrich Corp. | | | 3,868 | | | | 163,384 | | |
| | | | 4,329,842 | | |
| Coal — 0.2% | |
| CONSOL Energy, Inc. | | | 5,500 | | | | 157,190 | | |
| Massey Energy Co. | | | 2,500 | | | | 34,475 | | |
| Peabody Energy Corp. | | | 8,100 | | | | 184,275 | | |
| | | | 375,940 | | |
| Commercial Services — 1.2% | |
Apollo Group, Inc.
Class A(a) | | | 3,188 | | | | 244,264 | | |
Automatic Data
Processing, Inc. | | | 15,404 | | | | 605,993 | | |
| Convergys Corp.(a) | | | 3,716 | | | | 23,820 | | |
| Donnelley (R.R.) & Sons Co. | | | 6,522 | | | | 88,569 | | |
| Equifax, Inc. | | | 3,959 | | | | 104,993 | | |
| H&R Block, Inc. | | | 10,048 | | | | 228,291 | | |
| Mastercard, Inc. Class A | | | 2,200 | | | | 314,446 | | |
| McKesson Corp. | | | 8,387 | | | | 324,828 | | |
| Monster Worldwide, Inc.(a) | | | 3,776 | | | | 45,652 | | |
| Moody's Corp. | | | 5,992 | | | | 120,379 | | |
| Paychex, Inc. | | | 9,697 | | | | 254,837 | | |
Robert Half
International, Inc. | | | 4,680 | | | | 97,438 | | |
| Total System Services, Inc. | | | 5,714 | | | | 79,996 | | |
| Western Union Co. | | | 21,533 | | | | 308,783 | | |
| | | | 2,842,289 | | |
| Computers — 4.3% | |
Affiliated Computer Services,
Inc. Class A(a) | | | 2,900 | | | | 133,255 | | |
| Apple, Inc.(a) | | | 26,852 | | | | 2,291,818 | | |
(Continued)
The accompanying notes are an integral part of the financial statements.
29
MML Equity Index Fund – Portfolio of Investments (Continued)
| | | Number of
Shares | | Value | |
Cognizant Technology
Solutions Corp.
Class A(a) | | | 8,800 | | | $ | 158,928 | | |
Computer
Sciences Corp.(a) | | | 4,687 | | | | 164,701 | | |
| Dell, Inc.(a) | | | 52,347 | | | | 536,033 | | |
| EMC Corp.(a) | | | 61,632 | | | | 645,287 | | |
| Hewlett-Packard Co. | | | 73,415 | | | | 2,664,230 | | |
International Business
Machines Corp. | | | 40,565 | | | | 3,413,951 | | |
Lexmark International,
Inc. Class A(a) | | | 2,397 | | | | 64,479 | | |
| NetApp, Inc.(a) | | | 10,020 | | | | 139,979 | | |
| SanDisk Corp.(a) | | | 6,836 | | | | 65,626 | | |
| Sun Microsystems, Inc.(a) | | | 22,702 | | | | 86,722 | | |
| Teradata Corp.(a) | | | 5,600 | | | | 83,048 | | |
| | | | 10,448,057 | | |
| Cosmetics & Personal Care — 2.9% | |
| Avon Products, Inc. | | | 12,856 | | | | 308,930 | | |
| Colgate-Palmolive Co. | | | 15,177 | | | | 1,040,231 | | |
The Estee Lauder Cos.,
Inc. Class A | | | 3,400 | | | | 105,264 | | |
| The Procter & Gamble Co. | | | 89,880 | | | | 5,556,382 | | |
| | | | 7,010,807 | | |
| Distribution & Wholesale — 0.2% | |
| Fastenal Co. | | | 3,900 | | | | 135,915 | | |
| Genuine Parts Co. | | | 4,929 | | | | 186,612 | | |
| W.W. Grainger, Inc. | | | 1,979 | | | | 156,024 | | |
| | | | 478,551 | | |
| Diversified Financial — 4.2% | |
| American Express Co. | | | 34,908 | | | | 647,543 | | |
| Ameriprise Financial, Inc. | | | 6,521 | | | | 152,331 | | |
| The Charles Schwab Corp. | | | 28,195 | | | | 455,913 | | |
| CIT Group, Inc. | | | 8,800 | | | | 39,952 | | |
| Citigroup, Inc. | | | 165,390 | | | | 1,109,767 | | |
| CME Group, Inc. | | | 2,042 | | | | 424,961 | | |
| Discover Financial Services | | | 14,395 | | | | 137,184 | | |
| E*Trade Financial Corp.(a) | | | 13,200 | | | | 15,180 | | |
Federated Investors, Inc.
Class B | | | 2,700 | | | | 45,792 | | |
| Franklin Resources, Inc. | | | 4,628 | | | | 295,174 | | |
The Goldman Sachs
Group, Inc. | | | 13,213 | | | | 1,115,045 | | |
IntercontinentalExchange,
Inc.(a) | | | 2,200 | | | | 181,368 | | |
| Invesco Ltd. | | | 11,800 | | | | 170,392 | | |
| Janus Capital Group, Inc. | | | 4,450 | | | | 35,734 | | |
| JP Morgan Chase & Co. | | | 113,042 | | | | 3,564,214 | | |
| Legg Mason, Inc. | | | 4,085 | | | | 89,502 | | |
| Merrill Lynch & Co., Inc. | | | 48,869 | | | | 568,835 | | |
| Morgan Stanley | | | 32,091 | | | | 514,740 | | |
| | | Number of
Shares | | Value | |
The NASDAQ OMX
Group, Inc.(a) | | | 4,100 | | | $ | 101,311 | | |
| NYSE Euronext | | | 8,100 | | | | 221,778 | | |
| SLM Corp.(a) | | | 14,042 | | | | 124,974 | | |
| T. Rowe Price Group, Inc. | | | 7,700 | | | | 272,888 | | |
| | | | 10,284,578 | | |
| Electric — 3.8% | |
| The AES Corp.(a) | | | 20,549 | | | | 169,324 | | |
| Allegheny Energy, Inc. | | | 5,120 | | | | 173,363 | | |
| Ameren Corp. | | | 6,381 | | | | 212,232 | | |
American Electric
Power Co., Inc. | | | 12,057 | | | | 401,257 | | |
| CenterPoint Energy, Inc. | | | 10,263 | | | | 129,519 | | |
| CMS Energy Corp. | | | 7,038 | | | | 71,154 | | |
| Consolidated Edison, Inc. | | | 7,850 | | | | 305,600 | | |
Constellation Energy
Group, Inc. | | | 5,425 | | | | 136,113 | | |
| Dominion Resources, Inc. | | | 17,392 | | | | 623,329 | | |
| DTE Energy Co. | | | 4,937 | | | | 176,103 | | |
| Duke Energy Corp. | | | 38,673 | | | | 580,482 | | |
| Dynegy, Inc. Class A(a) | | | 15,809 | | | | 31,618 | | |
| Edison International | | | 9,830 | | | | 315,740 | | |
| Entergy Corp. | | | 5,760 | | | | 478,829 | | |
| Exelon Corp. | | | 20,136 | | | | 1,119,763 | | |
| FirstEnergy Corp. | | | 9,457 | | | | 459,421 | | |
| FPL Group, Inc. | | | 12,272 | | | | 617,650 | | |
| Integrys Energy Group, Inc. | | | 2,300 | | | | 98,854 | | |
| Pepco Holdings, Inc. | | | 6,100 | | | | 108,336 | | |
| PG&E Corp. | | | 10,821 | | | | 418,881 | | |
| Pinnacle West Capital Corp. | | | 3,000 | | | | 96,390 | | |
| PPL Corp. | | | 11,378 | | | | 349,191 | | |
| Progress Energy, Inc. | | | 7,872 | | | | 313,699 | | |
Public Service Enterprise
Group, Inc. | | | 15,296 | | | | 446,184 | | |
| SCANA Corp. | | | 3,500 | | | | 124,600 | | |
| Southern Co. | | | 23,787 | | | | 880,119 | | |
| TECO Energy, Inc. | | | 6,461 | | | | 79,793 | | |
| Wisconsin Energy Corp. | �� | | 3,500 | | | | 146,930 | | |
| Xcel Energy, Inc. | | | 12,772 | | | | 236,921 | | |
| | | | 9,301,395 | | |
| Electrical Components & Equipment — 0.4% | |
| Emerson Electric Co. | | | 23,114 | | | | 846,204 | | |
| Molex, Inc. | | | 4,390 | | | | 63,611 | | |
| | | | 909,815 | | |
| Electronics — 0.5% | |
Agilent
Technologies, Inc.(a) | | | 10,683 | | | | 166,975 | | |
| Amphenol Corp. Class A | | | 5,400 | | | | 129,492 | | |
| FLIR Systems, Inc.(a) | | | 4,200 | | | | 128,856 | | |
| Jabil Circuit, Inc. | | | 5,778 | | | | 39,002 | | |
| PerkinElmer, Inc. | | | 3,708 | | | | 51,578 | | |
| | | Number of
Shares | | Value | |
Thermo Fisher
Scientific, Inc.(a) | | | 12,554 | | | $ | 427,715 | | |
| Tyco Electronics Ltd. | | | 13,768 | | | | 223,179 | | |
| Waters Corp.(a) | | | 3,000 | | | | 109,950 | | |
| | | | 1,276,747 | | |
| Engineering & Construction — 0.2% | |
| Fluor Corp. | | | 5,454 | | | | 244,721 | | |
Jacobs Engineering
Group, Inc.(a) | | | 3,700 | | | | 177,970 | | |
| | | | 422,691 | | |
| Entertainment — 0.0% | |
International
Game Technology | | | 8,874 | | | | 105,512 | | |
| Environmental Controls — 0.4% | |
| Republic Services, Inc. | | | 9,600 | | | | 237,984 | | |
| Stericycle, Inc.(a) | | | 2,600 | | | | 135,408 | | |
| Waste Management, Inc. | | | 14,753 | | | | 488,914 | | |
| | | | 862,306 | | |
| Foods — 2.1% | |
| Campbell Soup Co. | | | 6,302 | | | | 189,123 | | |
| ConAgra Foods, Inc. | | | 13,672 | | | | 225,588 | | |
| Dean Foods Co.(a) | | | 4,200 | | | | 75,474 | | |
| General Mills, Inc. | | | 10,108 | | | | 614,061 | | |
| Heinz (H.J.) Co. | | | 9,422 | | | | 354,267 | | |
| The Hershey Co. | | | 5,044 | | | | 175,229 | | |
| The J.M. Smucker Co. | | | 3,539 | | | | 153,451 | | |
| Kellogg Co. | | | 7,564 | | | | 331,682 | | |
| Kraft Foods, Inc. Class A | | | 44,330 | | | | 1,190,261 | | |
| The Kroger Co. | | | 19,618 | | | | 518,111 | | |
| McCormick & Co., Inc. | | | 3,900 | | | | 124,254 | | |
| Safeway, Inc. | | | 13,060 | | | | 310,436 | | |
| Sara Lee Corp. | | | 21,265 | | | | 208,184 | | |
| SuperValu, Inc. | | | 6,595 | | | | 96,287 | | |
| Sysco Corp. | | | 18,230 | | | | 418,196 | | |
| Tyson Foods, Inc. Class A | | | 8,300 | | | | 72,708 | | |
| Whole Foods Market, Inc. | | | 4,400 | | | | 41,536 | | |
| | | | 5,098,848 | | |
| Forest Products & Paper — 0.2% | |
| International Paper Co. | | | 12,820 | | | | 151,276 | | |
| MeadWestvaco Corp. | | | 5,401 | | | | 60,437 | | |
Plum Creek
Timber Co., Inc. | | | 5,100 | | | | 177,174 | | |
| Weyerhaeuser Co. | | | 6,310 | | | | 193,149 | | |
| | | | 582,036 | | |
| Gas — 0.2% | |
| Nicor, Inc. | | | 1,289 | | | | 44,780 | | |
| NiSource, Inc. | | | 8,446 | | | | 92,652 | | |
| Sempra Energy | | | 7,517 | | | | 320,450 | | |
| | | | 457,882 | | |
(Continued)
The accompanying notes are an integral part of the financial statements.
30
MML Equity Index Fund – Portfolio of Investments (Continued)
| | | Number of
Shares | | Value | |
| Hand & Machine Tools — 0.1% | |
| The Black & Decker Corp. | | | 1,850 | | | $ | 77,349 | | |
| Snap-on, Inc. | | | 1,853 | | | | 72,971 | | |
| The Stanley Works | | | 2,305 | | | | 78,600 | | |
| | | | 228,920 | | |
| Health Care – Products — 4.1% | |
| Bard (C.R.), Inc. | | | 3,020 | | | | 254,465 | | |
| Baxter International, Inc. | | | 18,692 | | | | 1,001,704 | | |
| Becton, Dickinson & Co. | | | 7,348 | | | | 502,530 | | |
| Boston Scientific Corp.(a) | | | 44,572 | | | | 344,987 | | |
| Covidien Ltd. | | | 15,168 | | | | 549,689 | | |
| Intuitive Surgical, Inc.(a) | | | 1,200 | | | | 152,388 | | |
| Johnson & Johnson | | | 83,996 | | | | 5,025,481 | | |
| Medtronic, Inc. | | | 33,881 | | | | 1,064,541 | | |
| St. Jude Medical, Inc.(a) | | | 10,144 | | | | 334,346 | | |
| Stryker Corp. | | | 7,200 | | | | 287,640 | | |
Varian Medical
Systems, Inc.(a) | | | 3,700 | | | | 129,648 | | |
| Zimmer Holdings, Inc.(a) | | | 6,822 | | | | 275,745 | | |
| | | | 9,923,164 | | |
| Health Care – Services — 1.3% | |
| Aetna, Inc. | | | 13,944 | | | | 397,404 | | |
| Cigna Corp. | | | 8,420 | | | | 141,877 | | |
Coventry Health
Care, Inc.(a) | | | 4,485 | | | | 66,737 | | |
| DaVita, Inc.(a) | | | 3,200 | | | | 158,624 | | |
| Humana, Inc.(a) | | | 5,003 | | | | 186,512 | | |
Laboratory Corp. of
America Holdings(a) | | | 3,200 | | | | 206,112 | | |
| Quest Diagnostics, Inc. | | | 4,728 | | | | 245,430 | | |
| Tenet Healthcare Corp.(a) | | | 12,559 | | | | 14,443 | | |
| UnitedHealth Group, Inc. | | | 36,580 | | | | 973,028 | | |
| WellPoint, Inc.(a) | | | 15,453 | | | | 651,035 | | |
| | | | 3,041,202 | | |
| Holding Company – Diversified — 0.0% | |
| Leucadia National Corp.(a) | | | 5,100 | | | | 100,980 | | |
| Home Builders — 0.1% | |
| Centex Corp. | | | 3,846 | | | | 40,921 | | |
| D.R. Horton, Inc. | | | 8,500 | | | | 60,095 | | |
| KB Home | | | 2,442 | | | | 33,260 | | |
| Lennar Corp. Class A | | | 4,300 | | | | 37,281 | | |
| Pulte Homes, Inc. | | | 6,744 | | | | 73,712 | | |
| | | | 245,269 | | |
| Home Furnishing — 0.1% | |
Harman International
Industries, Inc. | | | 1,800 | | | | 30,114 | | |
| Whirlpool Corp. | | | 2,242 | | | | 92,707 | | |
| | | | 122,821 | | |
| | | Number of
Shares | | Value | |
| Household Products — 0.5% | |
| Avery Dennison Corp. | | | 2,928 | | | $ | 95,834 | | |
| The Clorox Co. | | | 4,470 | | | | 248,353 | | |
| Fortune Brands, Inc. | | | 4,580 | | | | 189,062 | | |
| Kimberly-Clark Corp. | | | 12,441 | | | | 656,138 | | |
| | | | 1,189,387 | | |
| Housewares — 0.0% | |
| Newell Rubbermaid, Inc. | | | 8,335 | | | | 81,516 | | |
| Insurance — 2.6% | |
| AFLAC, Inc. | | | 14,020 | | | | 642,677 | | |
| Allstate Corp. | | | 16,204 | | | | 530,843 | | |
American International
Group, Inc. | | | 81,032 | | | | 127,220 | | |
| Aon Corp. | | | 8,146 | | | | 372,109 | | |
| Assurant, Inc. | | | 3,200 | | | | 96,000 | | |
| Chubb Corp. | | | 10,746 | | | | 548,046 | | |
| Cincinnati Financial Corp. | | | 4,882 | | | | 141,920 | | |
Genworth Financial, Inc.
Class A | | | 13,400 | | | | 37,922 | | |
The Hartford Financial
Services Group, Inc. | | | 9,158 | | | | 150,374 | | |
| Lincoln National Corp. | | | 7,780 | | | | 146,575 | | |
| Loews Corp. | | | 11,010 | | | | 311,032 | | |
Marsh & McLennan
Cos., Inc. | | | 15,542 | | | | 377,204 | | |
| MBIA, Inc.(a) | | | 6,275 | | | | 25,539 | | |
| Metlife, Inc. | | | 23,932 | | | | 834,270 | | |
Principal Financial
Group, Inc. | | | 7,936 | | | | 179,116 | | |
| The Progressive Corp. | | | 20,592 | | | | 304,968 | | |
| Prudential Financial, Inc. | | | 12,900 | | | | 390,354 | | |
| Torchmark Corp. | | | 2,626 | | | | 117,382 | | |
| The Travelers Cos., Inc. | | | 17,663 | | | | 798,368 | | |
| Unum Group | | | 9,970 | | | | 185,442 | | |
| XL Capital Ltd. Class A | | | 9,227 | | | | 34,140 | | |
| | | | 6,351,501 | | |
| Internet — 1.8% | |
Akamai
Technologies, Inc.(a) | | | 5,200 | | | | 78,468 | | |
| Amazon.com, Inc.(a) | | | 9,533 | | | | 488,852 | | |
| eBay, Inc.(a) | | | 32,423 | | | | 452,625 | | |
| Expedia, Inc.(a) | | | 6,465 | | | | 53,272 | | |
| Google, Inc. Class A(a) | | | 7,226 | | | | 2,223,079 | | |
| McAfee, Inc.(a) | | | 4,600 | | | | 159,022 | | |
| Symantec Corp.(a) | | | 25,089 | | | | 339,203 | | |
| VeriSign, Inc.(a) | | | 6,000 | | | | 114,480 | | |
| Yahoo!, Inc.(a) | | | 41,416 | | | | 505,275 | | |
| | | | 4,414,276 | | |
| Investment Companies — 0.0% | |
American Capital
Strategies Ltd. | | | 5,500 | | | | 17,820 | | |
| | | Number of
Shares | | Value | |
| Iron & Steel — 0.3% | |
| AK Steel Holding Corp. | | | 3,500 | | | $ | 32,620 | | |
| Allegheny Technologies, Inc. | | | 3,044 | | | | 77,713 | | |
| Nucor Corp. | | | 9,536 | | | | 440,563 | | |
| United States Steel Corp. | | | 3,554 | | | | 132,209 | | |
| | | | 683,105 | | |
| Leisure Time — 0.2% | |
| Carnival Corp. | | | 13,285 | | | | 323,091 | | |
| Harley-Davidson, Inc. | | | 7,222 | | | | 122,558 | | |
| | | | 445,649 | | |
| Lodging — 0.2% | |
Marriott International, Inc.
Class A | | | 8,828 | | | | 171,705 | | |
Starwood Hotels & Resorts
Worldwide, Inc. | | | 5,640 | | | | 100,956 | | |
| Wyndham Worldwide Corp. | | | 5,488 | | | | 35,946 | | |
| Wynn Resorts Ltd.(a) | | | 1,790 | | | | 75,645 | | |
| | | | 384,252 | | |
| Machinery – Construction & Mining — 0.3% | |
| Caterpillar, Inc. | | | 18,304 | | | | 817,640 | | |
| Machinery – Diversified — 0.4% | |
| Cummins, Inc. | | | 6,156 | | | | 164,550 | | |
| Deere & Co. | | | 12,886 | | | | 493,792 | | |
| Flowserve Corp. | | | 1,700 | | | | 87,550 | | |
| The Manitowoc Co., Inc. | | | 3,900 | | | | 33,774 | | |
| Rockwell Automation, Inc. | | | 4,268 | | | | 137,600 | | |
| | | | 917,266 | | |
| Manufacturing — 4.0% | |
| 3M Co. | | | 20,972 | | | | 1,206,729 | | |
Cooper Industries Ltd.
Class A | | | 5,328 | | | | 155,737 | | |
| Danaher Corp. | | | 7,710 | | | | 436,463 | | |
| Dover Corp. | | | 5,735 | | | | 188,796 | | |
| Eastman Kodak Co. | | | 8,060 | | | | 53,035 | | |
| Eaton Corp. | | | 5,033 | | | | 250,190 | | |
| General Electric Co. | | | 316,235 | | | | 5,123,007 | | |
| Honeywell International, Inc. | | | 21,890 | | | | 718,649 | | |
| Illinois Tool Works, Inc. | | | 11,838 | | | | 414,922 | | |
Ingersoll-Rand Co. Ltd.
Class A | | | 9,685 | | | | 168,035 | | |
| ITT Corp. | | | 5,474 | | | | 251,749 | | |
| Leggett & Platt, Inc. | | | 4,850 | | | | 73,671 | | |
| Pall Corp. | | | 3,692 | | | | 104,964 | | |
| Parker Hannifin Corp. | | | 4,821 | | | | 205,085 | | |
| Textron, Inc. | | | 7,264 | | | | 100,752 | | |
| Tyco International Ltd. | | | 14,368 | | | | 310,349 | | |
| | | | 9,762,133 | | |
(Continued)
The accompanying notes are an integral part of the financial statements.
31
MML Equity Index Fund – Portfolio of Investments (Continued)
| | | Number of
Shares | | Value | |
| Media — 2.4% | |
| CBS Corp. Class B | | | 20,514 | | | $ | 168,010 | | |
| Comcast Corp. Class A | | | 86,877 | | | | 1,466,484 | | |
The DIRECTV
Group, Inc.(a) | | | 16,500 | | | | 378,015 | | |
| Gannett Co., Inc. | | | 6,970 | | | | 55,760 | | |
| The McGraw-Hill Cos., Inc. | | | 9,560 | | | | 221,696 | | |
| Meredith Corp. | | | 1,144 | | | | 19,585 | | |
| New York Times Co. Class A | | | 3,565 | | | | 26,131 | | |
| News Corp. Class A | | | 69,400 | | | | 630,846 | | |
Scripps Networks
Interactive Class A | | | 2,700 | | | | 59,400 | | |
| Time Warner, Inc. | | | 107,808 | | | | 1,084,548 | | |
| Viacom, Inc. Class B(a) | | | 18,514 | | | | 352,877 | | |
| The Walt Disney Co. | | | 55,832 | | | | 1,266,828 | | |
Washington Post Co.
Class B | | | 182 | | | | 71,026 | | |
| | | | 5,801,206 | | |
| Metal Fabricate & Hardware — 0.1% | |
| Precision Castparts Corp. | | | 4,200 | | | | 249,816 | | |
| Mining — 0.6% | |
| Alcoa, Inc. | | | 24,188 | | | | 272,357 | | |
Freeport-McMoRan
Copper & Gold, Inc. | | | 11,333 | | | | 276,979 | | |
| Newmont Mining Corp. | | | 13,709 | | | | 557,956 | | |
| Titanium Metals Corp. | | | 2,800 | | | | 24,668 | | |
| Vulcan Materials Co. | | | 3,310 | | | | 230,310 | | |
| | | | 1,362,270 | | |
| Office Equipment/Supplies — 0.2% | |
| Pitney Bowes, Inc. | | | 6,202 | | | | 158,027 | | |
| Xerox Corp. | | | 26,414 | | | | 210,520 | | |
| | | | 368,547 | | |
| Oil & Gas — 11.3% | |
| Anadarko Petroleum Corp. | | | 13,844 | | | | 533,686 | | |
| Apache Corp. | | | 10,000 | | | | 745,300 | | |
| Cabot Oil & Gas Corp. | | | 3,000 | | | | 78,000 | | |
| Chesapeake Energy Corp. | | | 15,659 | | | | 253,206 | | |
| Chevron Corp. | | | 61,366 | | | | 4,539,243 | | |
| ConocoPhillips | | | 45,090 | | | | 2,335,662 | | |
| Devon Energy Corp. | | | 13,270 | | | | 871,972 | | |
| ENSCO International, Inc. | | | 4,400 | | | | 124,916 | | |
| EOG Resources, Inc. | | | 7,500 | | | | 499,350 | | |
| Exxon Mobil Corp. | | | 153,536 | | | | 12,256,779 | | |
| Hess Corp. | | | 8,517 | | | | 456,852 | | |
| Marathon Oil Corp. | | | 21,180 | | | | 579,485 | | |
| Murphy Oil Corp. | | | 5,800 | | | | 257,230 | | |
| Nabors Industries Ltd.(a) | | | 8,630 | | | | 103,301 | | |
| Noble Corp. | | | 8,080 | | | | 178,487 | | |
| Noble Energy, Inc. | | | 5,200 | | | | 255,944 | | |
| Occidental Petroleum Corp. | | | 24,508 | | | | 1,470,235 | | |
| | | Number of
Shares | | Value | |
Pioneer Natural
Resources Co. | | | 3,600 | | | $ | 58,248 | | |
| Questar Corp. | | | 5,200 | | | | 169,988 | | |
| Range Resources Corp. | | | 4,700 | | | | 161,633 | | |
| Rowan Cos., Inc. | | | 3,521 | | | | 55,984 | | |
| Southwestern Energy Co.(a) | | | 10,600 | | | | 307,082 | | |
| Sunoco, Inc. | | | 3,586 | | | | 155,847 | | |
| Tesoro Corp. | | | 4,300 | | | | 56,631 | | |
| Valero Energy Corp. | | | 15,800 | | | | 341,912 | | |
| XTO Energy, Inc. | | | 17,451 | | | | 615,497 | | |
| | | | 27,462,470 | | |
| Oil & Gas Services — 1.3% | |
| Baker Hughes, Inc. | | | 9,198 | | | | 294,980 | | |
| BJ Services Co. | | | 9,100 | | | | 106,197 | | |
Cameron
International Corp.(a) | | | 6,600 | | | | 135,300 | | |
| Halliburton Co. | | | 26,213 | | | | 476,552 | | |
National Oilwell
Varco, Inc.(a) | | | 12,500 | | | | 305,500 | | |
| Schlumberger Ltd. | | | 36,378 | | | | 1,539,881 | | |
| Smith International, Inc. | | | 6,572 | | | | 150,433 | | |
Weatherford
International Ltd.(a) | | | 20,676 | | | | 223,714 | | |
| | | | 3,232,557 | | |
| Packaging & Containers — 0.2% | |
| Ball Corp. | | | 2,920 | | | | 121,443 | | |
| Bemis Co., Inc. | | | 3,066 | | | | 72,603 | | |
| Owens-IIlinois, Inc.(a) | | | 5,000 | | | | 136,650 | | |
| Pactiv Corp.(a) | | | 3,959 | | | | 98,500 | | |
| Sealed Air Corp. | | | 4,882 | | | | 72,937 | | |
| | | | 502,133 | | |
| Pharmaceuticals — 7.1% | |
| Abbott Laboratories | | | 47,098 | | | | 2,513,620 | | |
| Allergan, Inc. | | | 9,332 | | | | 376,266 | | |
| AmerisourceBergen Corp. | | | 4,852 | | | | 173,022 | | |
| Bristol-Myers Squibb Co. | | | 59,342 | | | | 1,379,702 | | |
| Cardinal Health, Inc. | | | 10,869 | | | | 374,654 | | |
| Cephalon, Inc.(a) | | | 2,000 | | | | 154,080 | | |
DENTSPLY
International, Inc. | | | 4,500 | | | | 127,080 | | |
| Eli Lilly & Co. | | | 29,995 | | | | 1,207,899 | | |
| Express Scripts, Inc.(a) | | | 7,466 | | | | 410,481 | | |
| Forest Laboratories, Inc.(a) | | | 9,280 | | | | 236,362 | | |
| Gilead Sciences, Inc.(a) | | | 27,688 | | | | 1,415,964 | | |
| Hospira, Inc.(a) | | | 4,839 | | | | 129,782 | | |
King
Pharmaceuticals, Inc.(a) | | | 7,567 | | | | 80,362 | | |
Medco Health
Solutions, Inc.(a) | | | 15,040 | | | | 630,326 | | |
| Merck & Co., Inc. | | | 63,815 | | | | 1,939,976 | | |
| Mylan, Inc.(a) | | | 8,624 | | | | 85,291 | | |
| | | Number of
Shares | | Value | |
| Patterson Cos., Inc.(a) | | | 2,700 | | | $ | 50,625 | | |
| Pfizer, Inc. | | | 202,641 | | | | 3,588,772 | | |
| Schering-Plough Corp. | | | 48,788 | | | | 830,860 | | |
Watson
Pharmaceuticals, Inc.(a) | | | 3,070 | | | | 81,570 | | |
| Wyeth | | | 40,356 | | | | 1,513,754 | | |
| | | | 17,300,448 | | |
| Pipelines — 0.3% | |
| El Paso Corp. | | | 21,146 | | | | 165,573 | | |
| Equitable Resources, Inc. | | | 3,900 | | | | 130,845 | | |
| Spectra Energy Corp. | | | 18,586 | | | | 292,543 | | |
| The Williams Cos., Inc. | | | 17,318 | | | | 250,765 | | |
| | | | 839,726 | | |
| Real Estate — 0.0% | |
CB Richard Ellis Group,
Inc. Class A(a) | | | 5,600 | | | | 24,192 | | |
| Real Estate Investment Trusts (REITS) — 0.9% | |
Apartment Investment &
Management Co. Class A | | | 3,080 | | | | 35,574 | | |
AvalonBay
Communities, Inc. | | | 2,300 | | | | 139,334 | | |
| Boston Properties, Inc. | | | 3,600 | | | | 198,000 | | |
Developers Diversified
Realty Corp. | | | 3,700 | | | | 18,056 | | |
| Equity Residential | | | 8,200 | | | | 244,524 | | |
| HCP, Inc. | | | 7,281 | | | | 202,193 | | |
| Host Hotels & Resorts, Inc. | | | 15,700 | | | | 118,849 | | |
| Kimco Realty Corp. | | | 6,800 | | | | 124,304 | | |
| Prologis | | | 7,800 | | | | 108,342 | | |
| Public Storage | | | 3,820 | | | | 303,690 | | |
| Simon Property Group, Inc. | | | 7,000 | | | | 371,910 | | |
| Vornado Realty Trust | | | 4,300 | | | | 259,505 | | |
| | | | 2,124,281 | | |
| Retail — 6.3% | |
Abercrombie & Fitch Co.
Class A | | | 2,700 | | | | 62,289 | | |
| AutoNation, Inc.(a) | | | 3,268 | | | | 32,288 | | |
| AutoZone, Inc.(a) | | | 1,154 | | | | 160,948 | | |
| Bed Bath & Beyond, Inc.(a) | | | 7,950 | | | | 202,089 | | |
| Best Buy Co., Inc. | | | 10,195 | | | | 286,581 | | |
| Big Lots, Inc.(a) | | | 2,474 | | | | 35,848 | | |
| Coach, Inc.(a) | | | 9,900 | | | | 205,623 | | |
| Costco Wholesale Corp. | | | 13,042 | | | | 684,705 | | |
| CVS Caremark Corp. | | | 43,083 | | | | 1,238,205 | | |
| Darden Restaurants, Inc. | | | 4,192 | | | | 118,131 | | |
| Family Dollar Stores, Inc. | | | 4,351 | | | | 113,431 | | |
| GameStop Corp. Class A(a) | | | 5,000 | | | | 108,300 | | |
| The Gap, Inc. | | | 13,545 | | | | 181,368 | | |
| The Home Depot, Inc. | | | 51,115 | | | | 1,176,667 | | |
| J.C. Penney Co., Inc. | | | 6,709 | | | | 132,167 | | |
| Jones Apparel Group, Inc. | | | 2,596 | | | | 15,213 | | |
(Continued)
The accompanying notes are an integral part of the financial statements.
32
MML Equity Index Fund – Portfolio of Investments (Continued)
| | | Number of
Shares | | Value | |
| Kohl's Corp.(a) | | | 9,123 | | | $ | 330,253 | | |
| Limited Brands, Inc. | | | 8,630 | | | | 86,645 | | |
| Lowe's Cos., Inc. | | | 44,064 | | | | 948,257 | | |
| Macy's, Inc. | | | 12,700 | | | | 131,445 | | |
| McDonald's Corp. | | | 33,677 | | | | 2,094,373 | | |
| Nordstrom, Inc. | | | 4,870 | | | | 64,820 | | |
| Office Depot, Inc.(a) | | | 8,565 | | | | 25,524 | | |
| Polo Ralph Lauren Corp. | | | 1,700 | | | | 77,197 | | |
| RadioShack Corp. | | | 3,781 | | | | 45,145 | | |
| Sears Holdings Corp.(a) | | | 1,708 | | | | 66,390 | | |
| Staples, Inc. | | | 21,359 | | | | 382,753 | | |
| Starbucks Corp.(a) | | | 21,898 | | | | 207,155 | | |
| Target Corp. | | | 22,668 | | | | 782,726 | | |
| Tiffany & Co. | | | 3,792 | | | | 89,605 | | |
| The TJX Cos., Inc. | | | 12,676 | | | | 260,745 | | |
| Wal-Mart Stores, Inc. | | | 67,234 | | | | 3,769,138 | | |
| Walgreen Co. | | | 29,804 | | | | 735,265 | | |
| Yum! Brands, Inc. | | | 13,896 | | | | 437,724 | | |
| | | | 15,289,013 | | |
| Savings & Loans — 0.2% | |
| Hudson City Bancorp, Inc. | | | 15,600 | | | | 248,976 | | |
People's United
Financial, Inc. | | | 10,400 | | | | 185,432 | | |
| Sovereign Bancorp, Inc.(a) | | | 14,855 | | | | 44,268 | | |
| | | | 478,676 | | |
| Semiconductors — 2.1% | |
Advanced Micro
Devices, Inc.(a) | | | 18,360 | | | | 39,658 | | |
| Altera Corp. | | | 9,120 | | | | 152,395 | | |
| Analog Devices, Inc. | | | 8,770 | | | | 166,805 | | |
| Applied Materials, Inc. | | | 40,206 | | | | 407,287 | | |
| Broadcom Corp. Class A(a) | | | 13,447 | | | | 228,196 | | |
| Intel Corp. | | | 167,887 | | | | 2,461,223 | | |
| KLA-Tencor Corp. | | | 5,306 | | | | 115,618 | | |
| Linear Technology Corp. | | | 6,730 | | | | 148,868 | | |
| LSI Corp.(a) | | | 19,428 | | | | 63,918 | | |
MEMC Electronic
Materials, Inc.(a) | | | 6,900 | | | | 98,532 | | |
| Microchip Technology, Inc. | | | 5,600 | | | | 109,368 | | |
| Micron Technology, Inc.(a) | | | 22,717 | | | | 59,973 | | |
National
Semiconductor Corp. | | | 5,896 | | | | 59,373 | | |
| Novellus Systems, Inc.(a) | | | 3,150 | | | | 38,871 | | |
| Nvidia Corp.(a) | | | 16,200 | | | | 130,734 | | |
| QLogic Corp.(a) | | | 3,800 | | | | 51,072 | | |
| Teradyne, Inc.(a) | | | 5,460 | | | | 23,041 | | |
| Texas Instruments, Inc. | | | 39,126 | | | | 607,235 | | |
| Xilinx, Inc. | | | 8,511 | | | | 151,666 | | |
| | | | 5,113,833 | | |
| Software — 3.6% | |
| Adobe Systems, Inc.(a) | | | 16,012 | | | | 340,895 | | |
| Autodesk, Inc.(a) | | | 6,780 | | | | 133,227 | | |
| | | Number of
Shares | | Value | |
| BMC Software, Inc.(a) | | | 5,765 | | | $ | 155,136 | | |
| CA, Inc. | | | 11,829 | | | | 219,191 | | |
| Citrix Systems, Inc.(a) | | | 5,592 | | | | 131,803 | | |
| Compuware Corp.(a) | | | 8,078 | | | | 54,526 | | |
| Dun & Bradstreet Corp. | | | 1,600 | | | | 123,520 | | |
| Electronic Arts, Inc.(a) | | | 9,700 | | | | 155,588 | | |
Fidelity National Information
Services, Inc. | | | 5,100 | | | | 82,977 | | |
| Fiserv, Inc.(a) | | | 4,921 | | | | 178,977 | | |
| IMS Health, Inc. | | | 5,724 | | | | 86,776 | | |
| Intuit, Inc.(a) | | | 9,720 | | | | 231,239 | | |
| Microsoft Corp. | | | 230,908 | | | | 4,488,852 | | |
| Novell, Inc.(a) | | | 11,076 | | | | 43,086 | | |
| Oracle Corp.(a) | | | 117,461 | | | | 2,082,584 | | |
| Salesforce.com, Inc.(a) | | | 3,100 | | | | 99,231 | | |
| | | | 8,607,608 | | |
| Telecommunications — 6.2% | |
American Tower Corp.
Class A(a) | | | 11,900 | | | | 348,908 | | |
| AT&T, Inc. | | | 177,995 | | | | 5,072,858 | | |
| CenturyTel, Inc. | | | 3,031 | | | | 82,837 | | |
| Ciena Corp.(a) | | | 2,748 | | | | 18,412 | | |
| Cisco Systems, Inc.(a) | | | 176,673 | | | | 2,879,770 | | |
| Corning, Inc. | | | 47,391 | | | | 451,636 | | |
| Embarq Corp. | | | 4,327 | | | | 155,599 | | |
Frontier
Communications Corp. | | | 9,501 | | | | 83,039 | | |
| Harris Corp. | | | 3,800 | | | | 144,590 | | |
| JDS Uniphase Corp.(a) | | | 7,098 | | | | 25,908 | | |
| Juniper Networks, Inc.(a) | | | 16,000 | | | | 280,160 | | |
| Motorola, Inc. | | | 68,609 | | | | 303,938 | | |
| Qualcomm, Inc. | | | 49,660 | | | | 1,779,318 | | |
Qwest Communications
International, Inc. | | | 44,158 | | | | 160,735 | | |
| Sprint Nextel Corp.(a) | | | 85,859 | | | | 157,122 | | |
| Tellabs, Inc.(a) | | | 12,312 | | | | 50,725 | | |
Verizon
Communications, Inc. | | | 85,316 | | | | 2,892,212 | | |
| Windstream Corp. | | | 13,431 | | | | 123,565 | | |
| | | | 15,011,332 | | |
| Textiles — 0.0% | |
| Cintas Corp. | | | 3,990 | | | | 92,688 | | |
| Toys, Games & Hobbies — 0.1% | |
| Hasbro, Inc. | | | 3,791 | | | | 110,584 | | |
| Mattel, Inc. | | | 10,889 | | | | 174,224 | | |
| | | | 284,808 | | |
| Transportation — 2.1% | |
Burlington Northern
Santa Fe Corp. | | | 8,493 | | | | 643,005 | | |
C.H. Robinson
Worldwide, Inc. | | | 5,100 | | | | 280,653 | | |
| | | Number of
Shares | | Value | |
| CSX Corp. | | | 11,930 | | | $ | 387,367 | | |
Expeditors International of
Washington, Inc. | | | 6,500 | | | | 216,255 | | |
| FedEx Corp. | | | 9,303 | | | | 596,788 | | |
| Norfolk Southern Corp. | | | 11,189 | | | | 526,442 | | |
| Ryder System, Inc. | | | 1,782 | | | | 69,106 | | |
| Union Pacific Corp. | | | 15,334 | | | | 732,965 | | |
United Parcel Service, Inc.
Class B | | | 30,000 | | | | 1,654,800 | | |
| | | | 5,107,381 | | |
TOTAL COMMON STOCK
(Cost $286,947,187) | | | 237,323,834 | | |
TOTAL EQUITIES
(Cost $286,947,187) | | | 237,323,834 | | |
TOTAL LONG-TERM
INVESTMENTS
(Cost $286,947,187) | | | 237,323,834 | | |
| | | Principal
Amount | | | |
| SHORT-TERM INVESTMENTS — 2.1% | |
| Repurchase Agreement — 1.8% | |
State Street Bank & Trust Co.
Repurchase Agreement,
dated 12/31/08, 0.010%,
due 1/02/09(b) | | $ | 4,315,706 | | | | 4,315,706 | | |
| U.S. Treasury Bills — 0.3% | |
U.S. Treasury Bill(c)
0.001% 5/14/09 | | | 40,000 | | | | 40,000 | | |
U.S. Treasury Bill(c)
0.002% 5/14/09 | | | 25,000 | | | | 25,000 | | |
U.S. Treasury Bill(c)
0.010% 5/14/09 | | | 50,000 | | | | 50,002 | | |
U.S. Treasury Bill(c)
0.027% 5/14/09 | | | 180,000 | | | | 180,018 | | |
U.S. Treasury Bill(c)
0.100% 5/14/09 | | | 345,000 | | | | 344,872 | | |
| | | | 639,892 | | |
TOTAL SHORT-TERM
INVESTMENTS
(Cost $4,955,598) | | | 4,955,598 | | |
TOTAL INVESTMENTS — 100.0%
(Cost $291,902,785)(d) | | | 242,279,432 | | |
Other Assets/
(Liabilities) — 0.0% | | | 38,872 | | |
| NET ASSETS — 100.0% | | $ | 242,318,304 | | |
(Continued)
The accompanying notes are an integral part of the financial statements.
33
MML Equity Index Fund – Portfolio of Investments (Continued)
Notes to Portfolio of Investments
Industry classifications are unaudited.
(a) Non-income producing security.
(b) Maturity value of $4,315,709. Collateralized by U.S. Government Agency obligations with a rate of 1.545%, maturity dates ranging from 2/15/36 - 5/15/36, and an aggregate market value, including accrued interest, of $4,404,175.
(c) This security is held as collateral for open futures contracts. (Note 2).
(d) See Note 6 for aggregate cost for federal tax purposes.
The remainder of this page is intentionally left blank.
The accompanying notes are an integral part of the financial statements.
34
MML Growth Equity Fund – Portfolio of Investments
December 31, 2008
| | | Number of
Shares | | Value | |
| EQUITIES — 98.9% | |
| COMMON STOCK — 98.9% | |
| Advertising — 0.1% | |
| Omnicom Group, Inc. | | | 450 | | | $ | 12,114 | | |
| Aerospace & Defense — 0.7% | |
| General Dynamics Corp. | | | 400 | | | | 23,036 | | |
| Lockheed Martin Corp. | | | 550 | | | | 46,244 | | |
| Rockwell Collins, Inc. | | | 50 | | | | 1,955 | | |
| | | | 71,235 | | |
| Apparel — 0.6% | |
| Nike, Inc. Class B | | | 1,200 | | | | 61,200 | | |
| Banks — 4.1% | |
The Bank of New York
Mellon Corp. | | | 2,300 | | | | 65,159 | | |
| Northern Trust Corp. | | | 2,400 | | | | 125,136 | | |
PNC Financial Services
Group, Inc. | | | 500 | | | | 24,500 | | |
| State Street Corp. | | | 3,600 | | | | 141,588 | | |
| Wells Fargo & Co. | | | 2,900 | | | | 85,492 | | |
| | | | 441,875 | | |
| Beverages — 1.4% | |
| The Coca-Cola Co. | | | 1,300 | | | | 58,851 | | |
| PepsiCo, Inc. | | | 1,650 | | | | 90,371 | | |
| | | | 149,222 | | |
| Biotechnology — 6.6% | |
| Amgen, Inc.(a) | | | 2,400 | | | | 138,600 | | |
| Celgene Corp.(a) | | | 3,950 | | | | 218,356 | | |
| Genentech, Inc.(a) | | | 4,100 | | | | 339,931 | | |
| Genzyme Corp.(a) | | | 300 | | | | 19,911 | | |
| | | | 716,798 | | |
| Chemicals — 2.9% | |
| Monsanto Co. | | | 1,600 | | | | 112,560 | | |
Potash Corp. of
Saskatchewan | | | 950 | | | | 69,559 | | |
| Praxair, Inc. | | | 2,300 | | | | 136,528 | | |
| | | | 318,647 | | |
| Commercial Services — 5.2% | |
| Accenture Ltd. Class A | | | 4,550 | | | | 149,194 | | |
| Apollo Group, Inc. Class A(a) | | | 850 | | | | 65,127 | | |
Automatic Data
Processing, Inc. | | | 1,850 | | | | 72,779 | | |
| Mastercard, Inc. Class A | | | 400 | | | | 57,172 | | |
| McKesson Corp. | | | 2,400 | | | | 92,952 | | |
| Visa, Inc. Class A | | | 1,300 | | | | 68,185 | | |
| | | Number of
Shares | | Value | |
| Western Union Co. | | | 3,900 | | | $ | 55,926 | | |
| | | | 561,335 | | |
| Computers — 5.4% | |
| Apple, Inc.(a) | | | 3,950 | | | | 337,132 | | |
| Dell, Inc.(a) | | | 50 | | | | 512 | | |
| EMC Corp.(a) | | | 3,200 | | | | 33,504 | | |
| Hewlett-Packard Co. | | | 4,000 | | | | 145,160 | | |
| Research In Motion Ltd.(a) | | | 1,600 | | | | 64,928 | | |
| | | | 581,236 | | |
| Cosmetics & Personal Care — 0.2% | |
| The Procter & Gamble Co. | | | 300 | | | | 18,546 | | |
| Distribution & Wholesale — 0.2% | |
| Fastenal Co. | | | 800 | | | | 27,880 | | |
| Diversified Financial — 6.3% | |
| American Express Co. | | | 750 | | | | 13,913 | | |
| Ameriprise Financial, Inc. | | | 100 | | | | 2,336 | | |
| BlackRock, Inc. | | | 250 | | | | 33,537 | | |
| The Charles Schwab Corp. | | | 4,300 | | | | 69,531 | | |
| CME Group, Inc. | | | 200 | | | | 41,622 | | |
| Credit Suisse Group | | | 14 | | | | 384 | | |
| Franklin Resources, Inc. | | | 2,550 | | | | 162,639 | | |
The Goldman Sachs
Group, Inc. | | | 1,500 | | | | 126,585 | | |
IntercontinentalExchange,
Inc.(a) | | | 1,250 | | | | 103,050 | | |
| JP Morgan Chase & Co. | | | 2,000 | | | | 63,060 | | |
| Morgan Stanley | | | 3,950 | | | | 63,358 | | |
| | | | 680,015 | | |
| Electric — 0.6% | |
| Entergy Corp. | | | 200 | | | | 16,626 | | |
| NRG Energy, Inc.(a) | | | 1,900 | | | | 44,327 | | |
| | | | 60,953 | | |
| Electrical Components & Equipment — 0.2% | |
| Sunpower Corp. Class B(a) | | | 700 | | | | 21,308 | | |
| Electronics — 0.0% | |
Thermo Fisher
Scientific, Inc.(a) | | | 50 | | | | 1,704 | | |
| Energy – Alternate Sources — 0.4% | |
| First Solar, Inc.(a) | | | 350 | | | | 48,286 | | |
| Entertainment — 0.0% | |
International Game
Technology | | | 100 | | | | 1,189 | | |
| Health Care – Products — 6.2% | |
| Alcon, Inc. | | | 700 | | | | 62,433 | | |
| Baxter International, Inc. | | | 2,600 | | | | 139,334 | | |
| | | Number of
Shares | | Value | |
| Becton, Dickinson & Co. | | | 1,000 | | | $ | 68,390 | | |
| Covidien Ltd. | | | 500 | | | | 18,120 | | |
| Intuitive Surgical, Inc.(a) | | | 200 | | | | 25,398 | | |
| Medtronic, Inc. | | | 4,350 | | | | 136,677 | | |
| St. Jude Medical, Inc.(a) | | | 4,350 | | | | 143,376 | | |
| Stryker Corp. | | | 1,800 | | | | 71,910 | | |
| | | | 665,638 | | |
| Health Care – Services — 0.9% | |
| Aetna, Inc. | | | 50 | | | | 1,425 | | |
| Humana, Inc.(a) | | | 750 | | | | 27,960 | | |
| WellPoint, Inc.(a) | | | 1,750 | | | | 73,728 | | |
| | | | 103,113 | | |
| Insurance — 0.4% | |
| Aon Corp. | | | 800 | | | | 36,544 | | |
| Prudential Financial, Inc. | | | 100 | | | | 3,026 | | |
| | | | 39,570 | | |
| Internet — 8.9% | |
| Amazon.com, Inc.(a) | | | 6,350 | | | | 325,628 | | |
| eBay, Inc.(a) | | | 100 | | | | 1,396 | | |
| Expedia, Inc.(a) | | | 2,700 | | | | 22,248 | | |
| Google, Inc. Class A(a) | | | 1,200 | | | | 369,180 | | |
| McAfee, Inc.(a) | | | 3,150 | | | | 108,895 | | |
| Priceline.com, Inc.(a) | | | 300 | | | | 22,095 | | |
| Tencent Holdings Ltd. | | | 7,200 | | | | 46,874 | | |
| VeriSign, Inc.(a) | | | 3,450 | | | | 65,826 | | |
| | | | 962,142 | | |
| Iron & Steel — 0.5% | |
| Nucor Corp. | | | 1,200 | | | | 55,440 | | |
| Lodging — 0.9% | |
Marriott International, Inc.
Class A | | | 1,400 | | | | 27,230 | | |
| MGM MIRAGE(a) | | | 1,149 | | | | 15,810 | | |
| Wynn Resorts Ltd.(a) | | | 1,200 | | | | 50,712 | | |
| | | | 93,752 | | |
| Machinery – Diversified — 0.1% | |
| Deere & Co. | | | 300 | | | | 11,496 | | |
| Manufacturing — 2.8% | |
| Danaher Corp. | | | 5,250 | | | | 297,203 | | |
| General Electric Co. | | | 100 | | | | 1,620 | | |
| | | | 298,823 | | |
| Media — 2.0% | |
Discovery Communications,
Inc., Series A(a) | | | 2,825 | | | | 40,002 | | |
Discovery Communications,
Inc., Series C(a) | | | 2,225 | | | | 29,793 | | |
| The McGraw-Hill Cos., Inc. | | | 5,350 | | | | 124,066 | | |
(Continued)
The accompanying notes are an integral part of the financial statements.
35
MML Growth Equity Fund – Portfolio of Investments (Continued)
| | | Number of
Shares | | Value | |
| Time Warner, Inc. | | | 2,300 | | | $ | 23,138 | | |
| | | | 216,999 | | |
| Mining — 0.0% | |
| BHP Billiton Ltd. | | | 14 | | | | 295 | | |
| Oil & Gas — 4.0% | |
| Chevron Corp. | | | 1,000 | | | | 73,970 | | |
| EOG Resources, Inc. | | | 2,150 | | | | 143,147 | | |
| Exxon Mobil Corp. | | | 2,750 | | | | 219,533 | | |
| | | | 436,650 | | |
| Oil & Gas Services — 2.5% | |
| Baker Hughes, Inc. | | | 100 | | | | 3,207 | | |
| FMC Technologies, Inc.(a) | | | 300 | | | | 7,149 | | |
| Schlumberger Ltd. | | | 3,300 | | | | 139,689 | | |
| Smith International, Inc. | | | 5,400 | | | | 123,606 | | |
| | | | 273,651 | | |
| Pharmaceuticals — 10.0% | |
| Allergan, Inc. | | | 2,700 | | | | 108,864 | | |
| Express Scripts, Inc.(a) | | | 2,150 | | | | 118,207 | | |
| Gilead Sciences, Inc.(a) | | | 7,200 | | | | 368,208 | | |
Medco Health
Solutions, Inc.(a) | | | 4,800 | | | | 201,168 | | |
| Novartis AG | | | 562 | | | | 28,159 | | |
| Roche Holding AG | | | 556 | | | | 85,587 | | |
| Schering-Plough Corp. | | | 350 | | | | 5,961 | | |
Teva Pharmaceutical
Industries Ltd. Sponsored
ADR (Israel) | | | 1,500 | | | | 63,855 | | |
| Wyeth | | | 2,650 | | | | 99,401 | | |
| | | | 1,079,410 | | |
| Retail — 7.9% | |
| Bed Bath & Beyond, Inc.(a) | | | 2,700 | | | | 68,634 | | |
| Coach, Inc.(a) | | | 1,200 | | | | 24,924 | | |
| Costco Wholesale Corp. | | | 1,050 | | | | 55,125 | | |
| CVS Caremark Corp. | | | 4,300 | | | | 123,582 | | |
| Kohl's Corp.(a) | | | 3,250 | | | | 117,650 | | |
| McDonald's Corp. | | | 2,150 | | | | 133,708 | | |
| Wal-Mart Stores, Inc. | | | 4,000 | | | | 224,240 | | |
| Yum! Brands, Inc. | | | 3,400 | | | | 107,100 | | |
| | | | 854,963 | | |
| Semiconductors — 2.6% | |
| Altera Corp. | | | 2,300 | | | | 38,433 | | |
| Broadcom Corp. Class A(a) | | | 2,550 | | | | 43,274 | | |
| Intel Corp. | | | 550 | | | | 8,063 | | |
Marvell Technology
Group Ltd.(a) | | | 12,550 | | | | 83,708 | | |
| Xilinx, Inc. | | | 5,900 | | | | 105,138 | | |
| | | | 278,616 | | |
| | | Number of
Shares | | Value | |
| Software — 5.4% | |
| Adobe Systems, Inc.(a) | | | 1,600 | | | $ | 34,064 | | |
| Autodesk, Inc.(a) | | | 3,100 | | | | 60,915 | | |
| Electronic Arts, Inc.(a) | | | 3,750 | | | | 60,150 | | |
| Fiserv, Inc.(a) | | | 2,500 | | | | 90,925 | | |
| Intuit, Inc.(a) | | | 1,200 | | | | 28,548 | | |
| Microsoft Corp. | | | 14,150 | | | | 275,076 | | |
| Oracle Corp.(a) | | | 1,850 | | | | 32,800 | | |
| | | | 582,478 | | |
| Telecommunications — 6.8% | |
America Movil SAB de C.V.
Sponsored ADR (Mexico) | | | 1,650 | | | | 51,134 | | |
American Tower Corp.
Class A(a) | | | 6,200 | | | | 181,784 | | |
| AT&T, Inc. | | | 100 | | | | 2,850 | | |
| Cisco Systems, Inc.(a) | | | 5,650 | | | | 92,095 | | |
| Juniper Networks, Inc.(a) | | | 9,150 | | | | 160,216 | | |
MetroPCS
Communications, Inc.(a) | | | 2,400 | | | | 35,640 | | |
| Qualcomm, Inc. | | | 5,850 | | | | 209,605 | | |
| | | | 733,324 | | |
| Toys, Games & Hobbies — 1.4% | |
| Nintendo Co. Ltd. | | | 400 | | | | 153,678 | | |
| Transportation — 0.7% | |
Expeditors International of
Washington, Inc. | | | 1,000 | | | | 33,270 | | |
| Union Pacific Corp. | | | 900 | | | | 43,020 | | |
| | | | 76,290 | | |
TOTAL COMMON STOCK
(Cost $14,808,920) | | | 10,689,871 | | |
TOTAL EQUITIES
(Cost $14,808,920) | | | 10,689,871 | | |
| RIGHTS — 0.0% | |
| Computers — 0.0% | |
| Seagate Technology(b) | | | 11,100 | | | | - | | |
TOTAL RIGHTS
(Cost $0) | | | - | | |
TOTAL LONG-TERM INVESTMENTS
(Cost $14,808,920) | | | 10,689,871 | | |
| | | Principal
Amount | | Value | |
| SHORT-TERM INVESTMENTS — 1.3% | |
| Repurchase Agreement — 1.3% | |
State Street Bank & Trust Co.
Repurchase Agreement,
dated 12/31/08, 0.010%,
due 1/02/09(c) | | $ | 142,506 | | | $ | 142,506 | | |
TOTAL SHORT-TERM INVESTMENTS
(Cost $142,506) | | | 142,506 | | |
TOTAL INVESTMENTS — 100.2%
(Cost $14,951,426)(d) | | | 10,832,377 | | |
Other Assets/
(Liabilities) — (0.2)% | | | (23,609 | ) | |
| NET ASSETS — 100.0% | | $ | 10,808,768 | | |
Notes to Portfolio of Investments
Industry classifications are unaudited.
ADR - American Depositary Receipt
(a) Non-income producing security.
(b) This security is valued in good faith under procedures established by the Board of Trustees.
(c) Maturity value of $142,506. Collateralized by U.S. Government Agency obligations with a rate of 1.772%, maturity date of 8/15/36, and an aggregate market value, including accrued interest, of $145,869.
(d) See Note 6 for aggregate cost for federal tax purposes.
The accompanying notes are an integral part of the financial statements.
36
MML NASDAQ-100 Fund – Portfolio of Investments
December 31, 2008
| | | Number of
Shares | | Value | |
| EQUITIES — 98.3% | |
| COMMON STOCK — 98.3% | |
| Advertising — 0.1% | |
Focus Media Holding Ltd.
ADR (Cayman
Islands)(a) | | | 583 | | | $ | 5,299 | | |
| Airlines — 0.3% | |
Ryanair Holdings PLC
Sponsored ADR
(Ireland)(a) | | | 592 | | | | 17,215 | | |
| Auto Manufacturers — 1.1% | |
| Paccar, Inc. | | | 2,081 | | | | 59,517 | | |
| Beverages — 0.3% | |
| Hansen Natural Corp.(a) | | | 466 | | | | 15,625 | | |
| Biotechnology — 9.4% | |
| Amgen, Inc.(a) | | | 2,512 | | | | 145,068 | | |
| Biogen Idec, Inc.(a) | | | 1,613 | | | | 76,827 | | |
| Celgene Corp.(a) | | | 2,311 | | | | 127,752 | | |
| Genzyme Corp.(a) | | | 1,725 | | | | 114,488 | | |
| Illumina, Inc.(a) | | | 603 | | | | 15,708 | | |
| Life Technologies Corp.(a) | | | 884 | | | | 20,606 | | |
Vertex
Pharmaceuticals, Inc.(a) | | | 809 | | | | 24,578 | | |
| | | | 525,027 | | |
| Chemicals — 0.5% | |
| Sigma-Aldrich Corp. | | | 613 | | | | 25,893 | | |
| Commercial Services — 3.5% | |
| Apollo Group, Inc. Class A(a) | | | 818 | | | | 62,675 | | |
Automatic Data
Processing, Inc. | | | 1,815 | | | | 71,402 | | |
| Paychex, Inc. | | | 1,741 | | | | 45,754 | | |
Pharmaceutical Product
Development, Inc. | | | 586 | | | | 17,000 | | |
| | | | 196,831 | | |
| Computers — 13.9% | |
| Apple, Inc.(a) | | | 6,306 | | | | 538,217 | | |
Cognizant Technology
Solutions Corp. Class A(a) | | | 1,444 | | | | 26,079 | | |
| Dell, Inc.(a) | | | 3,638 | | | | 37,253 | | |
| Logitech International SA(a) | | | 887 | | | | 13,820 | | |
| NetApp, Inc.(a) | | | 1,756 | | | | 24,531 | | |
| Research In Motion Ltd.(a) | | | 2,878 | | | | 116,789 | | |
| Seagate Technology | | | 2,477 | | | | 10,973 | | |
| Sun Microsystems, Inc.(a) | | | 1,634 | | | | 6,242 | | |
| | | | 773,904 | | |
| | | Number of
Shares | | Value | |
| Distribution & Wholesale — 0.5% | |
| Fastenal Co. | | | 742 | | | $ | 25,859 | | |
| Electronics — 0.9% | |
Flextronics
International Ltd.(a) | | | 4,466 | | | | 11,433 | | |
| FLIR Systems, Inc.(a) | | | 747 | | | | 22,918 | | |
| Garmin Ltd. | | | 961 | | | | 18,422 | | |
| | | | 52,773 | | |
| Energy – Alternate Sources — 0.9% | |
| First Solar, Inc.(a) | | | 362 | | | | 49,941 | | |
| Engineering & Construction — 0.3% | |
| Foster Wheeler Ltd.(a) | | | 671 | | | | 15,688 | | |
| Environmental Controls — 0.4% | |
| Stericycle, Inc.(a) | | | 462 | | | | 24,061 | | |
| Health Care – Products — 1.1% | |
| Henry Schein, Inc.(a) | | | 453 | | | | 16,620 | | |
| Hologic, Inc.(a) | | | 1,371 | | | | 17,919 | | |
| Intuitive Surgical, Inc.(a) | | | 199 | | | | 25,271 | | |
| | | | 59,810 | | |
| Internet — 10.2% | |
| Akamai Technologies, Inc.(a) | | | 825 | | | | 12,449 | | |
| Amazon.com, Inc.(a) | | | 1,448 | | | | 74,253 | | |
Baidu.com Sponsored ADR
(Cayman Islands)(a) | | | 135 | | | | 17,627 | | |
Check Point Software
Technologies Ltd.(a) | | | 1,077 | | | | 20,452 | | |
| eBay, Inc.(a) | | | 4,844 | | | | 67,622 | | |
| Expedia, Inc.(a) | | | 1,436 | | | | 11,833 | | |
| Google, Inc. Class A(a) | | | 741 | | | | 227,969 | | |
| IAC/InterActiveCorp(a) | | | 741 | | | | 11,656 | | |
Liberty Media Holding
Corp. Interactive
Class A(a) | | | 2,778 | | | | 8,667 | | |
| Symantec Corp.(a) | | | 4,446 | | | | 60,110 | | |
| VeriSign, Inc.(a) | | | 931 | | | | 17,764 | | |
| Yahoo!, Inc.(a) | | | 3,393 | | | | 41,395 | | |
| | | | 571,797 | | |
| Iron & Steel — 0.2% | |
| Steel Dynamics, Inc. | | | 956 | | | | 10,688 | | |
| Lodging — 0.5% | |
| Wynn Resorts Ltd.(a) | | | 622 | | | | 26,286 | | |
| Machinery – Construction & Mining — 0.2% | |
| Joy Global, Inc. | | | 539 | | | | 12,338 | | |
| Media — 4.3% | |
| Comcast Corp. Class A | | | 7,337 | | | | 123,848 | | |
| | | Number of
Shares | | Value | |
The DIRECTV
Group, Inc.(a) | | | 3,890 | | | $ | 89,120 | | |
DISH Network Corp.
Class A(a) | | | 1,096 | | | | 12,155 | | |
Liberty Global, Inc.
Class A(a) | | | 774 | | | | 12,322 | | |
| | | | 237,445 | | |
| Pharmaceuticals — 9.1% | |
| Cephalon, Inc.(a) | | | 339 | | | | 26,117 | | |
| DENTSPLY International, Inc. | | | 728 | | | | 20,559 | | |
| Express Scripts, Inc.(a) | | | 1,123 | | | | 61,742 | | |
| Gilead Sciences, Inc.(a) | | | 4,560 | | | | 233,198 | | |
| Patterson Cos., Inc.(a) | | | 593 | | | | 11,119 | | |
Teva Pharmaceutical
Industries Ltd. Sponsored
ADR (Israel) | | | 3,252 | | | | 138,438 | | |
Warner Chilcott Ltd.
Class A(a) | | | 1,233 | | | | 17,878 | | |
| | | | 509,051 | | |
| Retail — 5.0% | |
| Bed Bath & Beyond, Inc.(a) | | | 1,776 | | | | 45,146 | | |
| Costco Wholesale Corp. | | | 1,157 | | | | 60,742 | | |
| O'Reilly Automotive, Inc.(a) | | | 661 | | | | 20,319 | | |
| Ross Stores, Inc. | | | 683 | | | | 20,306 | | |
| Sears Holdings Corp.(a) | | | 658 | | | | 25,576 | | |
| Staples, Inc. | | | 2,437 | | | | 43,671 | | |
| Starbucks Corp.(a) | | | 5,186 | | | | 49,060 | | |
| Urban Outfitters, Inc.(a) | | | 817 | | | | 12,239 | | |
| | | | 277,059 | | |
| Semiconductors — 7.7% | |
| Altera Corp. | | | 2,127 | | | | 35,542 | | |
| Applied Materials, Inc. | | | 3,529 | | | | 35,749 | | |
Broadcom Corp.
Class A(a) | | | 2,073 | | | | 35,179 | | |
| Intel Corp. | | | 9,905 | | | | 145,207 | | |
| KLA-Tencor Corp. | | | 1,041 | | | | 22,684 | | |
| Lam Research Corp.(a) | | | 663 | | | | 14,109 | | |
| Linear Technology Corp. | | | 1,508 | | | | 33,357 | | |
Marvell Technology
Group Ltd.(a) | | | 2,975 | | | | 19,843 | | |
Maxim Integrated
Products, Inc. | | | 1,541 | | | | 17,598 | | |
| Microchip Technology, Inc. | | | 774 | | | | 15,116 | | |
| Nvidia Corp.(a) | | | 2,682 | | | | 21,644 | | |
| Xilinx, Inc. | | | 1,848 | | | | 32,931 | | |
| | | | 428,959 | | |
| Software — 14.8% | |
| Activision Blizzard, Inc.(a) | | | 6,015 | | | | 51,969 | | |
(Continued)
The accompanying notes are an integral part of the financial statements.
37
MML NASDAQ-100 Fund – Portfolio of Investments (Continued)
| | | Number of
Shares | | Value | |
| Adobe Systems, Inc.(a) | | | 2,647 | | | $ | 56,355 | | |
| Autodesk, Inc.(a) | | | 1,200 | | | | 23,580 | | |
| CA, Inc. | | | 2,532 | | | | 46,918 | | |
| Citrix Systems, Inc.(a) | | | 1,098 | | | | 25,880 | | |
| Electronic Arts, Inc.(a) | | | 1,645 | | | | 26,386 | | |
| Fiserv, Inc.(a) | | | 1,029 | | | | 37,425 | | |
Infosys Technologies Ltd.
Sponsored ADR (India) | | | 573 | | | | 14,078 | | |
| Intuit, Inc.(a) | | | 2,051 | | | | 48,793 | | |
| Microsoft Corp. | | | 15,570 | | | | 302,681 | | |
| Oracle Corp.(a) | | | 10,930 | | | | 193,789 | | |
| | | | 827,854 | | |
| Telecommunications — 10.9% | |
| Cisco Systems, Inc.(a) | | | 10,638 | | | | 173,399 | | |
| Juniper Networks, Inc.(a) | | | 1,765 | | | | 30,905 | | |
Millicom International
Cellular SA | | | 535 | | | | 24,027 | | |
| NII Holdings, Inc.(a) | | | 820 | | | | 14,908 | | |
| Qualcomm, Inc. | | | 10,154 | | | | 363,818 | | |
| | | | 607,057 | | |
| Textiles — 0.4% | |
| Cintas Corp. | | | 933 | | | | 21,674 | | |
| Transportation — 1.8% | |
C.H. Robinson
Worldwide, Inc. | | | 851 | | | | 46,830 | | |
Expeditors International of
Washington, Inc. | | | 1,067 | | | | 35,499 | | |
J.B. Hunt Transport
Services, Inc. | | | 614 | | | | 16,130 | | |
| | | | 98,459 | | |
TOTAL COMMON STOCK
(Cost $6,836,407) | | | 5,476,110 | | |
TOTAL EQUITIES
(Cost $6,836,407) | | | 5,476,110 | | |
TOTAL LONG-TERM INVESTMENTS
(Cost $6,836,407) | | | 5,476,110 | | |
| | | Principal
Amount | | Value | |
| SHORT-TERM INVESTMENTS — 1.9% | |
| Repurchase Agreement — 1.4% | |
State Street Bank & Trust Co.
Repurchase Agreement,
dated 12/31/08, 0.010%,
due 1/02/09(b) | | $ | 77,955 | | | $ | 77,955 | | |
| U.S. Treasury Bills — 0.5% | |
U.S. Treasury Bill(c)
0.100% 5/14/09 | | | 30,000 | | | | 29,989 | | |
TOTAL SHORT-TERM INVESTMENTS
(Cost $107,944) | | | 107,944 | | |
TOTAL INVESTMENTS — 100.2%
(Cost $6,944,351)(d) | | | 5,584,054 | | |
Other Assets/
(Liabilities) — (0.2)% | | | (11,382 | ) | |
| NET ASSETS — 100.0% | | $ | 5,572,672 | | |
Notes to Portfolio of Investments
Industry classifications are unaudited.
ADR - American Depositary Receipt
(a) Non-income producing security.
(b) Maturity value of $77,955. Collateralized by U.S. Government Agency obligations with a rate of 1.772%, maturity date of 8/15/36, and an aggregate market value, including accrued interest, of $79,881.
(c) This security is held as collateral for open futures contracts. (Note 2).
(d) See Note 6 for aggregate cost for federal tax purposes.
The accompanying notes are an integral part of the financial statements.
38
MML Small Cap Growth Equity Fund – Portfolio of Investments
December 31, 2008
| | | Number of
Shares | | Value | |
| EQUITIES — 88.4% | |
| COMMON STOCK — 88.4% | |
| Aerospace & Defense — 2.4% | |
| Aerovironment, Inc.(a) | | | 43,600 | | | $ | 1,604,916 | | |
| Cubic Corp. | | | 24,200 | | | | 658,240 | | |
Esterline
Technologies Corp.(a) | | | 16,600 | | | | 628,974 | | |
Teledyne
Technologies, Inc.(a) | | | 27,290 | | | | 1,215,770 | | |
| | | | 4,107,900 | | |
| Airlines — 0.7% | |
| Allegiant Travel Co.(a) | | | 6,790 | | | | 329,790 | | |
| JetBlue Airways Corp.(a) | | | 79,400 | | | | 563,740 | | |
| US Airways Group, Inc.(a) | | | 49,100 | | | | 379,543 | | |
| | | | 1,273,073 | | |
| Apparel — 0.1% | |
| Asics Corp. | | | 12,850 | | | | 103,616 | | |
| Automotive & Parts — 0.5% | |
| BorgWarner, Inc. | | | 19,300 | | | | 420,161 | | |
| Tenneco, Inc.(a) | | | 72,200 | | | | 212,990 | | |
TRW Automotive
Holdings Corp.(a) | | | 71,300 | | | | 256,680 | | |
| | | | 889,831 | | |
| Banks — 1.1% | |
International
Bancshares Corp. | | | 1,210 | | | | 26,414 | | |
| Signature Bank(a) | | | 16,060 | | | | 460,762 | | |
| UMB Financial Corp. | | | 17,100 | | | | 840,294 | | |
| Westamerica Bancorp | | | 11,800 | | | | 603,570 | | |
| | | | 1,931,040 | | |
| Biotechnology — 2.0% | |
Alexion
Pharmaceuticals, Inc.(a) | | | 4,500 | | | | 162,855 | | |
| Celera Corp.(a) | | | 91,070 | | | | 1,013,609 | | |
Cougar
Biotechnology, Inc.(a) | | | 25,150 | | | | 653,900 | | |
Human Genome
Sciences, Inc.(a) | | | 115,800 | | | | 245,496 | | |
| Incyte Corp.(a) | | | 65,000 | | | | 246,350 | | |
Regeneron
Pharmaceuticals, Inc.(a) | | | 51,740 | | | | 949,947 | | |
| Sequenom, Inc.(a) | | | 9,110 | | | | 180,742 | | |
| | | | 3,452,899 | | |
| Building Materials — 0.4% | |
| Lennox International, Inc. | | | 18,600 | | | | 600,594 | | |
| | | Number of
Shares | | Value | |
| USG Corp.(a) | | | 10,400 | | | $ | 83,616 | | |
| | | | 684,210 | | |
| Chemicals — 0.4% | |
| Albemarle Corp. | | | 10,780 | | | | 240,394 | | |
| FMC Corp. | | | 7,194 | | | | 321,788 | | |
| Solutia, Inc.(a) | | | 32,920 | | | | 148,140 | | |
| | | | 710,322 | | |
| Commercial Services — 7.9% | |
| AerCap Holdings NV(a) | | | 37,800 | | | | 113,778 | | |
American Public
Education, Inc.(a) | | | 46,300 | | | | 1,721,897 | | |
| Bankrate, Inc.(a) | | | 73,000 | | | | 2,774,000 | | |
| Bowne & Co., Inc. | | | 56,600 | | | | 332,808 | | |
| Capella Education Co.(a) | | | 28,800 | | | | 1,692,288 | | |
| CoStar Group, Inc.(a) | | | 47,400 | | | | 1,561,356 | | |
| Equifax, Inc. | | | 3,800 | | | | 100,776 | | |
| Interactive Data Corp. | | | 18,420 | | | | 454,237 | | |
ITT Educational
Services, Inc.(a) | | | 3,660 | | | | 347,627 | | |
Net 1 UEPS
Technologies, Inc.(a) | | | 16,080 | | | | 220,296 | | |
Pharmaceutical Product
Development, Inc. | | | 16,020 | | | | 464,740 | | |
| Riskmetrics Group, Inc.(a) | | | 82,900 | | | | 1,234,381 | | |
Robert Half
International, Inc. | | | 40,890 | | | | 851,330 | | |
| Service Corp. International | | | 69,600 | | | | 345,912 | | |
| VistaPrint Ltd.(a) | | | 72,150 | | | | 1,342,712 | | |
| | | | 13,558,138 | | |
| Computers — 3.2% | |
CACI International, Inc.
Class A(a) | | | 9,570 | | | | 431,511 | | |
| Diebold, Inc. | | | 16,400 | | | | 460,676 | | |
| MICROS Systems, Inc.(a) | | | 137,800 | | | | 2,248,896 | | |
| NCR Corp.(a) | | | 21,740 | | | | 307,404 | | |
Riverbed
Technology, Inc.(a) | | | 160,100 | | | | 1,823,539 | | |
| SYKES Enterprises, Inc.(a) | | | 10,460 | | | | 199,995 | | |
| | | | 5,472,021 | | |
| Cosmetics & Personal Care — 1.8% | |
| Alberto-Culver Co. | | | 126,700 | | | | 3,105,417 | | |
| Distribution & Wholesale — 2.9% | |
Beacon Roofing
Supply, Inc.(a) | | | 38,200 | | | | 530,216 | | |
Ingram Micro, Inc.
Class A(a) | | | 80,200 | | | | 1,073,878 | | |
| LKQ Corp.(a) | | | 205,158 | | | | 2,392,142 | | |
| | | Number of
Shares | | Value | |
| Pool Corp. | | | 48,580 | | | $ | 872,983 | | |
WESCO
International, Inc.(a) | | | 6,150 | | | | 118,264 | | |
| | | | 4,987,483 | | |
| Diversified Financial — 2.8% | |
| Advanta Corp. Class B | | | 28,800 | | | | 60,192 | | |
| Ameriprise Financial, Inc. | | | 3,900 | | | | 91,104 | | |
| CIT Group, Inc. | | | 187,400 | | | | 850,796 | | |
| Financial Federal Corp. | | | 86,387 | | | | 2,010,225 | | |
| JMP Group, Inc. | | | 83,600 | | | | 463,980 | | |
The NASDAQ OMX
Group, Inc.(a) | | | 41,260 | | | | 1,019,535 | | |
Waddell & Reed
Financial, Inc. Class A | | | 25,700 | | | | 397,322 | | |
| | | | 4,893,154 | | |
| Electric — 0.3% | |
| ITC Holdings Corp. | | | 12,800 | | | | 559,104 | | |
| Electrical Components & Equipment — 0.5% | |
| Ametek, Inc. | | | 9,650 | | | | 291,527 | | |
| Sunpower Corp. Class B(a) | | | 18,326 | | | | 557,843 | | |
| | | | 849,370 | | |
| Electronics — 0.7% | |
| Axsys Technologies, Inc.(a) | | | 4,070 | | | | 223,280 | | |
| FLIR Systems, Inc.(a) | | | 17,810 | | | | 546,411 | | |
| Itron, Inc.(a) | | | 5,697 | | | | 363,127 | | |
| | | | 1,132,818 | | |
| Energy – Alternate Sources — 1.0% | |
| Covanta Holding Corp.(a) | | | 76,100 | | | | 1,671,156 | | |
| Engineering & Construction — 1.1% | |
| Aecom Technology Corp.(a) | | | 28,320 | | | | 870,274 | | |
Chicago Bridge &
Iron Co. NV | | | 91,550 | | | | 920,077 | | |
Sterling Construction
Co., Inc.(a) | | | 8,580 | | | | 159,073 | | |
| | | | 1,949,424 | | |
| Entertainment — 2.8% | |
| Churchill Downs, Inc. | | | 19,900 | | | | 804,358 | | |
DreamWorks Animation
SKG, Inc. Class A(a) | | | 49,500 | | | | 1,250,370 | | |
Scientific Games Corp.
Class A(a) | | | 81,700 | | | | 1,433,018 | | |
| Vail Resorts, Inc.(a) | | | 51,400 | | | | 1,367,240 | | |
| | | | 4,854,986 | | |
| Environmental Controls — 1.2% | |
| American Ecology Corp. | | | 17,970 | | | | 363,533 | | |
(Continued)
The accompanying notes are an integral part of the financial statements.
39
MML Small Cap Growth Equity Fund – Portfolio of Investments (Continued)
| | | Number of
Shares | | Value | |
TETRA
Technologies, Inc.(a) | | | 18,130 | | | $ | 437,840 | | |
| Waste Connections, Inc.(a) | | | 37,590 | | | | 1,186,716 | | |
| | | | 1,988,089 | | |
| Foods — 0.8% | |
| Ralcorp Holdings, Inc.(a) | | | 12,360 | | | | 721,824 | | |
| Smithfield Foods, Inc.(a) | | | 41,500 | | | | 583,905 | | |
| | | | 1,305,729 | | |
| Gas — 0.6% | |
| Southern Union Co. | | | 4,000 | | | | 52,160 | | |
| UGI Corp. | | | 43,240 | | | | 1,055,921 | | |
| | | | 1,108,081 | | |
| Hand & Machine Tools — 0.3% | |
| Snap-on, Inc. | | | 11,730 | | | | 461,927 | | |
| Health Care – Products — 3.9% | |
| ABIOMED, Inc.(a) | | | 104,900 | | | | 1,722,458 | | |
| AngioDynamics, Inc.(a) | | | 15,820 | | | | 216,576 | | |
| Nuvasive, Inc.(a) | | | 48,600 | | | | 1,683,990 | | |
| Orthovita, Inc.(a) | | | 117,252 | | | | 397,484 | | |
| SSL International PLC | | | 30,005 | | | | 214,545 | | |
| Volcano Corp.(a) | | | 150,040 | | | | 2,250,600 | | |
| Zoll Medical Corp.(a) | | | 11,520 | | | | 217,613 | | |
| | | | 6,703,266 | | |
| Health Care – Services — 2.2% | |
Community Health
Systems, Inc.(a) | | | 37,000 | | | | 539,460 | | |
Coventry Health
Care, Inc.(a) | | | 7,500 | | | | 111,600 | | |
Health Management
Associates, Inc. Class A(a) | | | 120,600 | | | | 215,874 | | |
| Health Net, Inc.(a) | | | 62,400 | | | | 679,536 | | |
| Healthsouth Corp.(a) | | | 59,820 | | | | 655,627 | | |
| Healthways, Inc.(a) | | | 107,600 | | | | 1,235,248 | | |
Icon PLC Sponsored ADR
(Ireland)(a) | | | 20,454 | | | | 402,739 | | |
| | | | 3,840,084 | | |
| Holding Company – Diversified — 0.2% | |
Liberty Acquisition
Holdings Corp.(a) | | | 48,980 | | | | 408,983 | | |
| Home Furnishing — 1.2% | |
| DTS, Inc.(a) | | | 47,250 | | | | 867,038 | | |
| TiVo, Inc.(a) | | | 155,200 | | | | 1,111,232 | | |
| | | | 1,978,270 | | |
| Household Products — 0.2% | |
| Jarden Corp.(a) | | | 37,080 | | | | 426,420 | | |
| | | Number of
Shares | | Value | |
| Insurance — 3.4% | |
Allied World Assurance
Holdings Ltd. | | | 27,650 | | | $ | 1,122,590 | | |
| Arch Capital Group Ltd.(a) | | | 4,350 | | | | 304,935 | | |
| Axis Capital Holdings Ltd. | | | 10,110 | | | | 294,403 | | |
| Employers Holdings, Inc. | | | 49,300 | | | | 813,450 | | |
| First American Corp. | | | 22,600 | | | | 652,914 | | |
| Lancashire Holdings Ltd. | | | 34,601 | | | | 212,252 | | |
| Navigators Group, Inc.(a) | | | 8,700 | | | | 477,717 | | |
| PartnerRe Ltd. | | | 4,020 | | | | 286,505 | | |
Platinum Underwriters
Holdings Ltd. | | | 24,600 | | | | 887,568 | | |
| ProAssurance Corp.(a) | | | 8,100 | | | | 427,518 | | |
| W.R. Berkley Corp. | | | 9,880 | | | | 306,280 | | |
| | | | 5,786,132 | | |
| Internet — 4.9% | |
| Ariba, Inc.(a) | | | 42,560 | | | | 306,858 | | |
Art Technology
Group, Inc.(a) | | | 164,700 | | | | 317,871 | | |
| Constant Contact, Inc.(a) | | | 154,400 | | | | 2,045,800 | | |
DealerTrack
Holdings, Inc.(a) | | | 40,350 | | | | 479,762 | | |
| Equinix, Inc.(a) | | | 8,090 | | | | 430,307 | | |
| McAfee, Inc.(a) | | | 15,720 | | | | 543,440 | | |
Netease.com Sponsored
ADR (Cayman Islands)(a) | | | 24,200 | | | | 534,820 | | |
| S1 Corp.(a) | | | 108,000 | | | | 852,120 | | |
| Sapient Corp.(a) | | | 115,700 | | | | 513,708 | | |
| Sina Corp.(a) | | | 48,050 | | | | 1,112,357 | | |
| Vocus, Inc.(a) | | | 74,000 | | | | 1,347,540 | | |
| | | | 8,484,583 | | |
| Leisure Time — 0.5% | |
| Royal Caribbean Cruises Ltd. | | | 59,280 | | | | 815,100 | | |
| Lodging — 0.7% | |
Gaylord
Entertainment Co.(a) | | | 115,800 | | | | 1,255,272 | | |
| Machinery – Construction & Mining — 0.5% | |
Bucyrus International, Inc.
Class A | | | 43,400 | | | | 803,768 | | |
| Machinery – Diversified — 0.7% | |
| Flowserve Corp. | | | 3,940 | | | | 202,910 | | |
| Wabtec Corp. | | | 25,900 | | | | 1,029,525 | | |
| | | | 1,232,435 | | |
| Manufacturing — 0.4% | |
Hansen Transmissions
International NV(a) | | | 152,435 | | | | 257,061 | | |
| Hexcel Corp.(a) | | | 59,300 | | | | 438,227 | | |
| | | | 695,288 | | |
| | | Number of
Shares | | Value | |
| Media — 1.9% | |
FactSet Research
Systems, Inc. | | | 72,222 | | | $ | 3,195,101 | | |
| Gannett Co., Inc. | | | 8,000 | | | | 64,000 | | |
| | | | 3,259,101 | | |
| Metal Fabricate & Hardware — 0.1% | |
Mueller Water Products,
Inc. Class A | | | 12,100 | | | | 101,640 | | |
| Oil & Gas — 2.8% | |
| Arena Resources, Inc.(a) | | | 25,370 | | | | 712,643 | | |
| Atwood Oceanics, Inc.(a) | | | 20,500 | | | | 313,240 | | |
| Bill Barrett Corp.(a) | | | 88,550 | | | | 1,871,062 | | |
| Cabot Oil & Gas Corp. | | | 10,850 | | | | 282,100 | | |
Comstock
Resources, Inc.(a) | | | 5,500 | | | | 259,875 | | |
| Helmerich & Payne, Inc. | | | 3,580 | | | | 81,445 | | |
| Penn Virginia Corp. | | | 6,490 | | | | 168,610 | | |
St. Mary Land &
Exploration Co. | | | 10,220 | | | | 207,568 | | |
Whiting Petroleum
Corp.(a) | | | 25,760 | | | | 861,930 | | |
| | | | 4,758,473 | | |
| Pharmaceuticals — 1.5% | |
| Alkermes, Inc.(a) | | | 64,280 | | | | 684,582 | | |
Amylin
Pharmaceuticals, Inc.(a) | | | 39,100 | | | | 424,235 | | |
Auxilium
Pharmaceuticals, Inc.(a) | | | 13,470 | | | | 383,087 | | |
Cubist
Pharmaceuticals, Inc.(a) | | | 7,400 | | | | 178,784 | | |
| The Medicines Co.(a) | | | 23,880 | | | | 351,752 | | |
Onyx
Pharmaceuticals, Inc.(a) | | | 5,820 | | | | 198,811 | | |
| Perrigo Co. | | | 13,500 | | | | 436,185 | | |
| | | | 2,657,436 | | |
| Real Estate Investment Trusts (REITS) — 1.1% | |
American Campus
Communities, Inc. | | | 23,700 | | | | 485,376 | | |
| CapitalSource, Inc. | | | 79,900 | | | | 369,138 | | |
MFA Mortgage
Investments, Inc. | | | 88,700 | | | | 522,443 | | |
| Redwood Trust, Inc. | | | 30,700 | | | | 457,737 | | |
| | | | 1,834,694 | | |
| Retail — 5.0% | |
Abercrombie & Fitch Co.
Class A | | | 15,100 | | | | 348,357 | | |
| Advance Auto Parts, Inc. | | | 14,710 | | | | 494,991 | | |
| Big Lots, Inc.(a) | | | 8,670 | | | | 125,628 | | |
| BJ's Wholesale Club, Inc.(a) | | | 13,760 | | | | 471,418 | | |
| Burger King Holdings, Inc. | | | 17,810 | | | | 425,303 | | |
(Continued)
The accompanying notes are an integral part of the financial statements.
40
MML Small Cap Growth Equity Fund – Portfolio of Investments (Continued)
| | | Number of
Shares | | Value | |
| Denny's Corp.(a) | | | 300,800 | | | $ | 598,592 | | |
Dick's Sporting
Goods, Inc.(a) | | | 12,100 | | | | 170,731 | | |
| DSW, Inc. Class A(a) | | | 12,000 | | | | 149,520 | | |
| Dufry Group | | | 3,597 | | | | 100,015 | | |
FGX International
Holdings Ltd.(a) | | | 17,550 | | | | 241,137 | | |
| Foot Locker, Inc. | | | 75,290 | | | | 552,629 | | |
| GameStop Corp. Class A(a) | | | 14,490 | | | | 313,853 | | |
| Limited Brands, Inc. | | | 9,200 | | | | 92,368 | | |
Nu Skin Enterprises, Inc.
Class A | | | 59,300 | | | | 618,499 | | |
| O'Reilly Automotive, Inc.(a) | | | 78,890 | | | | 2,425,079 | | |
| OfficeMax, Inc. | | | 48,600 | | | | 371,304 | | |
Papa John's
International, Inc.(a) | | | 22,800 | | | | 420,204 | | |
| Penske Auto Group, Inc. | | | 46,000 | | | | 353,280 | | |
| Urban Outfitters, Inc.(a) | | | 19,300 | | | | 289,114 | | |
| | | | 8,562,022 | | |
| Semiconductors — 1.6% | |
Brooks
Automation, Inc.(a) | | | 42,300 | | | | 245,763 | | |
| Microsemi Corp.(a) | | | 20,930 | | | | 264,555 | | |
Netlogic
Microsystems, Inc.(a) | | | 14,200 | | | | 312,542 | | |
ON
Semiconductor Corp.(a) | | | 311,810 | | | | 1,060,154 | | |
| Semtech Corp.(a) | | | 31,700 | | | | 357,259 | | |
Skyworks
Solutions, Inc.(a) | | | 55,960 | | | | 310,019 | | |
| Verigy Ltd.(a) | | | 25,300 | | | | 243,386 | | |
| | | | 2,793,678 | | |
| Software — 13.6% | |
Allscripts Heathcare
Solutions, Inc. | | | 173,500 | | | | 1,721,120 | | |
| Athenahealth, Inc.(a) | | | 89,500 | | | | 3,366,990 | | |
| Autonomy Corp. PLC(a) | | | 21,990 | | | | 302,672 | | |
| Blackbaud, Inc. | | | 178,350 | | | | 2,407,725 | | |
| Blackboard, Inc.(a) | | | 118,100 | | | | 3,097,763 | | |
| Cerner Corp.(a) | | | 28,600 | | | | 1,099,670 | | |
Commvault
Systems, Inc.(a) | | | 165,000 | | | | 2,212,650 | | |
Concur
Technologies, Inc.(a) | | | 62,700 | | | | 2,057,814 | | |
| EPIQ Systems, Inc.(a) | | | 66,959 | | | | 1,118,885 | | |
| Informatica Corp.(a) | | | 20,400 | | | | 280,092 | | |
| Omnicell, Inc.(a) | | | 110,600 | | | | 1,350,426 | | |
| Omniture, Inc.(a) | | | 155,800 | | | | 1,657,712 | | |
| Red Hat, Inc.(a) | | | 93,170 | | | | 1,231,707 | | |
RightNow
Technologies, Inc.(a) | | | 56,850 | | | | 439,451 | | |
| Solera Holdings, Inc.(a) | | | 29,720 | | | | 716,252 | | |
| | | Number of
Shares | | Value | |
UBISOFT
Entertainment(a) | | | 14,566 | | | $ | 284,786 | | |
| | | | 23,345,715 | | |
| Storage & Warehousing — 0.1% | |
| Mobile Mini, Inc.(a) | | | 17,221 | | | | 248,327 | | |
| Telecommunications — 1.0% | |
Atheros
Communications, Inc.(a) | | | 52,970 | | | | 758,001 | | |
MetroPCS
Communications, Inc.(a) | | | 41,520 | | | | 616,572 | | |
NICE Systems Ltd.
ADR (Israel)(a) | | | 16,320 | | | | 366,710 | | |
| | | | 1,741,283 | | |
| Toys, Games & Hobbies — 0.2% | |
Marvel
Entertainment, Inc.(a) | | | 13,580 | | | | 417,585 | | |
| Transportation — 4.9% | |
| Con-way, Inc. | | | 25,200 | | | | 670,320 | | |
| Heartland Express, Inc. | | | 17,390 | | | | 274,067 | | |
| Hub Group, Inc. Class A(a) | | | 12,744 | | | | 338,098 | | |
J.B. Hunt Transport
Services, Inc. | | | 135,330 | | | | 3,555,119 | | |
| Kansas City Southern(a) | | | 130,025 | | | | 2,476,976 | | |
| Knight Transportation, Inc. | | | 64,600 | | | | 1,041,352 | | |
| | | | 8,355,932 | | |
| Water — 0.3% | |
Companhia de
Saneamento de
Minas Gerais | | | 64,700 | | | | 533,286 | | |
TOTAL COMMON STOCK
(Cost $197,126,615) | | | 152,088,561 | | |
TOTAL EQUITIES
(Cost $197,126,615) | | | 152,088,561 | | |
| MUTUAL FUNDS — 3.1% | |
| Investment Companies — 3.1% | |
iShares Russell 2000
Growth Index Fund | | | 87,800 | | | | 4,465,508 | | |
iShares Russell 2000
Index Fund | | | 19,300 | | | | 950,911 | | |
TOTAL MUTUAL FUNDS
(Cost $6,448,947) | | | 5,416,419 | | |
TOTAL MUTUAL FUNDS
(Cost $6,448,947) | | | 5,416,419 | | |
TOTAL LONG-TERM INVESTMENTS
(Cost $203,575,562) | | | 157,504,980 | | |
| | | Principal
Amount | | Value | |
| SHORT-TERM INVESTMENTS — 6.7% | |
| Repurchase Agreement — 6.7% | |
State Street Bank &
Trust Co. Repurchase
Agreement, dated
12/31/08, 0.010%,
due 1/02/09(b) | | $ | 11,463,391 | | | $ | 11,463,391 | | |
TOTAL SHORT-TERM INVESTMENTS
(Cost $11,463,391) | | | 11,463,391 | | |
TOTAL INVESTMENTS — 98.2%
(Cost $215,038,953)(c) | | | 168,968,371 | | |
Other Assets/
(Liabilities) — 1.8% | | | 3,165,049 | | |
| NET ASSETS — 100.0% | | $ | 172,133,420 | | |
Notes to Portfolio of Investments
Industry classifications are unaudited.
ADR - American Depositary Receipt
(a) Non-income producing security.
(b) Maturity value of $11,463,397. Collateralized by U.S. Government Agency obligations with rates ranging from 1.545% - 5.220%, maturity dates ranging from 7/01/34 - 8/15/36, and an aggregate market value, including accrued interest, of $11,697,833.
(c) See Note 6 for aggregate cost for federal tax purposes.
The accompanying notes are an integral part of the financial statements.
41
MML Emerging Growth Fund – Portfolio of Investments
December 31, 2008
| | | Number of
Shares | | Value | |
| EQUITIES — 96.7% | |
| COMMON STOCK — 96.7% | |
| Aerospace & Defense — 1.3% | |
| Aerovironment, Inc.(a) | | | 2,400 | | | $ | 88,344 | | |
| Kaman Corp. | | | 2,286 | | | | 41,445 | | |
| | | | 129,789 | | |
| Airlines — 2.6% | |
| Alaska Air Group, Inc.(a) | | | 3,500 | | | | 102,375 | | |
| Allegiant Travel Co.(a) | | | 3,200 | | | | 155,424 | | |
| | | | 257,799 | | |
| Apparel — 0.5% | |
Iconix Brand
Group, Inc.(a) | | | 5,205 | | | | 50,905 | | |
| Automotive & Parts — 0.3% | |
| Exide Technologies(a) | | | 5,174 | | | | 27,371 | | |
| Banks — 0.4% | |
| Bank of the Ozarks, Inc. | | | 1,500 | | | | 44,460 | | |
| Biotechnology — 6.8% | |
Alexion
Pharmaceuticals, Inc.(a) | | | 7,200 | | | | 260,568 | | |
Bio-Rad Laboratories, Inc.
Class A(a) | | | 756 | | | | 56,934 | | |
| Illumina, Inc.(a) | | | 4,770 | | | | 124,259 | | |
| Myriad Genetics, Inc.(a) | | | 3,600 | | | | 238,536 | | |
| | | | 680,297 | | |
| Commercial Services — 11.6% | |
American Public
Education, Inc.(a) | | | 3,068 | | | | 114,099 | | |
Corinthian
Colleges, Inc.(a) | | | 15,283 | | | | 250,183 | | |
| DeVry, Inc. | | | 3,100 | | | | 177,971 | | |
ITT Educational
Services, Inc.(a) | | | 2,700 | | | | 256,446 | | |
| K12, Inc.(a) | | | 2,730 | | | | 52,061 | | |
Kendle
International, Inc.(a) | | | 2,648 | | | | 68,106 | | |
| Kenexa Corp.(a) | | | 3,083 | | | | 24,602 | | |
PAREXEL
International Corp.(a) | | | 7,425 | | | | 72,097 | | |
| Strayer Education, Inc. | | | 700 | | | | 150,087 | | |
| | | | 1,165,652 | | |
| Computers — 2.3% | |
| Data Domain, Inc.(a) | | | 2,511 | | | | 47,207 | | |
| iGate Corp.(a) | | | 6,471 | | | | 42,126 | | |
| IHS, Inc. Class A(a) | | | 2,316 | | | | 86,665 | | |
| | | Number of
Shares | | Value | |
| MICROS Systems, Inc.(a) | | | 3,344 | | | $ | 54,574 | | |
| | | | 230,572 | | |
| Distribution & Wholesale — 0.3% | |
WESCO
International, Inc.(a) | | | 1,581 | | | | 30,403 | | |
| Diversified Financial — 1.7% | |
Portfolio Recovery
Associates, Inc.(a) | | | 2,383 | | | | 80,641 | | |
| Stifel Financial Corp.(a) | | | 2,000 | | | | 91,700 | | |
| | | | 172,341 | | |
| Electrical Components & Equipment — 2.1% | |
A-Power Energy Generation
Systems Ltd.(a) | | | 4,946 | | | | 21,268 | | |
American
Superconductor Corp.(a) | | | 3,656 | | | | 59,629 | | |
| Greatbatch, Inc.(a) | | | 2,613 | | | | 69,140 | | |
| Powell Industries, Inc.(a) | | | 2,100 | | | | 60,942 | | |
| | | | 210,979 | | |
| Electronics — 4.4% | |
American Science &
Engineering, Inc. | | | 1,300 | | | | 96,148 | | |
| Axsys Technologies, Inc.(a) | | | 4,000 | | | | 219,440 | | |
| Cogent, Inc.(a) | | | 6,100 | | | | 82,777 | | |
| Daktronics, Inc. | | | 3,265 | | | | 30,561 | | |
| Technitrol, Inc. | | | 4,498 | | | | 15,653 | | |
| | | | 444,579 | | |
| Energy – Alternate Sources — 0.9% | |
| FuelCell Energy, Inc.(a) | | | 9,705 | | | | 37,655 | | |
| Headwaters, Inc.(a) | | | 7,130 | | | | 48,128 | | |
| | | | 85,783 | | |
| Engineering & Construction — 2.2% | |
| Aecom Technology Corp.(a) | | | 1,900 | | | | 58,387 | | |
| Layne Christensen Co.(a) | | | 2,253 | | | | 54,094 | | |
| URS Corp.(a) | | | 2,714 | | | | 110,650 | | |
| | | | 223,131 | | |
| Environmental Controls — 0.2% | |
Darling
International, Inc.(a) | | | 3,923 | | | | 21,537 | | |
| Foods — 3.6% | |
American Italian Pasta Co.
Class A(a) | | | 4,900 | | | | 109,466 | | |
Corn Products
International, Inc. | | | 3,025 | | | | 87,271 | | |
| Ralcorp Holdings, Inc.(a) | | | 1,900 | | | | 110,960 | | |
| | | Number of
Shares | | Value | |
| Spartan Stores, Inc. | | | 2,300 | | | $ | 53,475 | | |
| | | | 361,172 | | |
| Forest Products & Paper — 0.9% | |
| Rock-Tenn Co. Class A | | | 2,600 | | | | 88,868 | | |
| Health Care – Products — 9.6% | |
| Bruker Corp.(a) | | | 5,753 | | | | 23,242 | | |
| Cyberonics, Inc.(a) | | | 3,640 | | | | 60,315 | | |
| ICU Medical, Inc.(a) | | | 2,900 | | | | 96,106 | | |
| Luminex Corp.(a) | | | 3,548 | | | | 75,785 | | |
| Nuvasive, Inc.(a) | | | 6,174 | | | | 213,929 | | |
| Thoratec Corp.(a) | | | 9,547 | | | | 310,182 | | |
| Volcano Corp.(a) | | | 6,903 | | | | 103,545 | | |
Wright Medical
Group, Inc.(a) | | | 4,194 | | | | 85,684 | | |
| | | | 968,788 | | |
| Health Care – Services — 8.0% | |
| Almost Family, Inc.(a) | | | 4,300 | | | | 193,414 | | |
| Amedisys, Inc.(a) | | | 4,000 | | | | 165,360 | | |
| Genoptix, Inc.(a) | | | 4,000 | | | | 136,320 | | |
Gentiva Health
Services, Inc.(a) | | | 4,625 | | | | 135,328 | | |
| LHC Group, Inc.(a) | | | 4,900 | | | | 176,400 | | |
| | | | 806,822 | | |
| Household Products — 0.6% | |
| Helen of Troy Ltd.(a) | | | 3,478 | | | | 60,378 | | |
| Insurance — 3.4% | |
Argo Group International
Holdings Ltd.(a) | | | 2,761 | | | | 93,653 | | |
| Life Partners Holdings, Inc. | | | 4,300 | | | | 187,652 | | |
| Validus Holdings Ltd. | | | 2,200 | | | | 57,552 | | |
| | | | 338,857 | | |
| Internet — 5.3% | |
1-800-Flowers.com, Inc.
Class A(a) | | | 9,200 | | | | 35,144 | | |
| Asiainfo Holdings, Inc.(a) | | | 8,775 | | | | 103,896 | | |
| Avocent Corp.(a) | | | 2,236 | | | | 40,047 | | |
| CyberSources Corp.(a) | | | 5,963 | | | | 71,496 | | |
| NIC, Inc. | | | 12,920 | | | | 59,432 | | |
Shanda Interactive
Entertainment Ltd.
Sponsored ADR
(Cayman Islands)(a) | | | 2,473 | | | | 80,026 | | |
TeleCommunication
Systems, Inc. Class A(a) | | | 16,300 | | | | 140,017 | | |
| | | | 530,058 | | |
(Continued)
The accompanying notes are an integral part of the financial statements.
42
MML Emerging Growth Fund – Portfolio of Investments (Continued)
| | | Number of
Shares | | Value | |
| Machinery – Construction & Mining — 0.4% | |
Bucyrus International, Inc.
Class A | | | 1,987 | | | $ | 36,799 | | |
| Machinery – Diversified — 1.7% | |
| Roper Industries, Inc. | | | 1,426 | | | | 61,902 | | |
| Wabtec Corp. | | | 2,777 | | | | 110,386 | | |
| | | | 172,288 | | |
| Manufacturing — 0.7% | |
American Railcar
Industries, Inc. | | | 1,763 | | | | 18,565 | | |
| Ameron International Corp. | | | 774 | | | | 48,700 | | |
| | | | 67,265 | | |
| Media — 0.5% | |
Central European Media
Enterprises Ltd.(a) | | | 2,214 | | | | 48,088 | | |
| Metal Fabricate & Hardware — 1.5% | |
| Circor International, Inc. | | | 1,173 | | | | 32,258 | | |
| Kaydon Corp. | | | 3,527 | | | | 121,152 | | |
| | | | 153,410 | | |
| Office Furnishings — 0.4% | |
| Herman Miller, Inc. | | | 3,270 | | | | 42,608 | | |
| Oil & Gas — 0.2% | |
| GMX Resources, Inc.(a) | | | 925 | | | | 23,421 | | |
| Pharmaceuticals — 6.5% | |
Cubist
Pharmaceuticals, Inc.(a) | | | 7,200 | | | | 173,952 | | |
Emergent
Biosolutions, Inc.(a) | | | 4,000 | | | | 104,440 | | |
| Mylan, Inc.(a) | | | 4,890 | | | | 48,362 | | |
| Neogen Corp.(a) | | | 1,768 | | | | 44,165 | | |
| Omnicare, Inc. | | | 5,800 | | | | 161,008 | | |
| PetMed Express, Inc.(a) | | | 3,700 | | | | 65,231 | | |
Questcor
Pharmaceuticals, Inc.(a) | | | 5,900 | | | | 54,929 | | |
| | | | 652,087 | | |
| Retail — 3.7% | |
| 99 Cents Only Stores(a) | | | 3,604 | | | | 39,392 | | |
| Dollar Tree, Inc.(a) | | | 1,400 | | | | 58,520 | | |
| Ezcorp, Inc.(a) | | | 7,500 | | | | 114,075 | | |
The Finish Line, Inc.
Class A | | | 9,231 | | | | 51,693 | | |
Ulta Salon Cosmetics &
Fragrance, Inc.(a) | | | 4,446 | | | | 36,813 | | |
The Wet Seal, Inc.
Class A(a) | | | 23,162 | | | | 68,791 | | |
| | | | 369,284 | | |
| | | Number of
Shares | | Value | |
| Semiconductors — 0.2% | |
Advanced Analogic
Technologies, Inc.(a) | | | 7,499 | | | $ | 22,647 | | |
| Software — 9.3% | |
| Blackboard, Inc.(a) | | | 3,886 | | | | 101,930 | | |
Concur
Technologies, Inc.(a) | | | 2,165 | | | | 71,055 | | |
| EPIQ Systems, Inc.(a) | | | 4,646 | | | | 77,635 | | |
| Informatica Corp.(a) | | | 6,133 | | | | 84,206 | | |
ManTech International
Corp. Class A(a) | | | 4,800 | | | | 260,112 | | |
SkillSoft PLC Sponsored
ADR (Ireland)(a) | | | 15,565 | | | | 111,134 | | |
| Sybase, Inc.(a) | | | 5,500 | | | | 136,235 | | |
The Ultimate Software
Group, Inc.(a) | | | 3,039 | | | | 44,369 | | |
| Wind River Systems, Inc.(a) | | | 5,097 | | | | 46,026 | | |
| | | | 932,702 | | |
| Telecommunications — 2.6% | |
Comtech
Telecommunications(a) | | | 2,500 | | | | 114,550 | | |
NICE Systems Ltd. ADR
(Israel)(a) | | | 4,069 | | | | 91,430 | | |
| Viasat, Inc.(a) | | | 2,400 | | | | 57,792 | | |
| | | | 263,772 | | |
TOTAL COMMON STOCK
(Cost $11,496,032) | | | 9,714,912 | | |
TOTAL EQUITIES
(Cost $11,496,032) | | | 9,714,912 | | |
| WARRANTS — 0.0% | |
| Internet — 0.0% | |
Lantronix, Inc.,
Expires 02/09/11,
Strike 4.68(b) | | | 99 | | | | - | | |
TOTAL WARRANTS
(Cost $0) | | | - | | |
TOTAL LONG-TERM INVESTMENTS
(Cost $11,496,032) | | | 9,714,912 | | |
| | | Principal
Amount | | Value | |
| SHORT-TERM INVESTMENTS — 2.9% | |
| Repurchase Agreement — 2.9% | |
State Street Bank & Trust Co.
Repurchase Agreement,
dated 12/31/08, 0.010%,
due 1/02/09(c) | | $ | 294,017 | | | $ | 294,017 | | |
TOTAL SHORT-TERM INVESTMENTS
(Cost $294,017) | | | 294,017 | | |
TOTAL INVESTMENTS — 99.6%
(Cost $11,790,049)(d) | | | 10,008,929 | | |
Other Assets/
(Liabilities) — 0.4% | | | 44,836 | | |
| NET ASSETS — 100.0% | | $ | 10,053,765 | | |
Notes to Portfolio of Investments
Industry classifications are unaudited.
ADR - American Depositary Receipt
(a) Non-income producing security.
(b) This security is valued in good faith under procedures established by the Board of Trustees.
(c) Maturity value of $294,018. Collateralized by U.S. Government Agency obligations with rates ranging from 1.545% - 4.725%, maturity dates ranging from 5/01/35 - 8/15/36, and an aggregate market value, including accrued interest, of $300,561.
(d) See Note 6 for aggregate cost for federal tax purposes.
The accompanying notes are an integral part of the financial statements.
43
MML Series Investment Fund – Financial Statements
Statements of Assets and Liabilities
December 31, 2008
| | | MML Large
Cap Value
Fund | | MML Equity
Index Fund | | MML Growth
Equity Fund | |
| Assets: | |
| Investments, at value (Note 2)(a) | | $ | 162,951,645 | | | $ | 237,323,834 | | | $ | 10,689,871 | | |
| Short-term investments, at value (Note 2)(b) | | | 10,179,776 | | | | 4,955,598 | | | | 142,506 | | |
| Total investments | | | 173,131,421 | | | | 242,279,432 | | | | 10,832,377 | | |
| Receivables from: | |
| Investments sold | | | 156,510 | | | | - | | | | 10,442 | | |
| Investment adviser (Note 3) | | | - | | | | 13,654 | | | | 21,732 | | |
| Fund shares sold | | | 6,904,449 | | | | 46,554 | | | | 68,105 | | |
| Interest and dividends | | | 176,286 | | | | 538,672 | | | | 11,834 | | |
| Variation margin on open futures contracts (Note 2) | | | - | | | | 72,632 | | | | - | | |
| Foreign taxes withheld | | | 12,278 | | | | - | | | | 391 | | |
| Total assets | | | 180,380,944 | | | | 242,950,944 | | | | 10,944,881 | �� | |
| Liabilities: | |
| Payables for: | |
| Investments purchased | | | - | | | | 390,056 | | | | 77,194 | | |
| Fund shares repurchased | | | 26,696 | | | | 16,956 | | | | 2,789 | | |
| Trustees' fees and expenses (Note 3) | | | 47,834 | | | | 127,286 | | | | 8,701 | | |
| Affiliates (Note 3): | |
| Investment management fees | | | 118,148 | | | | 21,094 | | | | 7,437 | | |
| Administration fees | | | - | | | | 27,168 | | | | - | | |
| Service fees | | | 1,443 | | | | 171 | | | | 117 | | |
| Accrued expense and other liabilities | | | 50,641 | | | | 49,909 | | | | 39,875 | | |
| Total liabilities | | | 244,762 | | | | 632,640 | | | | 136,113 | | |
| Net assets | | $ | 180,136,182 | | | $ | 242,318,304 | | | $ | 10,808,768 | | |
| Net assets consist of: | |
| Paid-in capital | | $ | 245,897,395 | | | $ | 297,426,932 | | | $ | 40,260,787 | | |
Undistributed (accumulated) net investment income (loss)
(distributions in excess of net investment income) | | | 2,172,646 | | | | 6,644,634 | | | | (242 | ) | |
| Accumulated net realized gain (loss) on investments | | | (9,889,962 | ) | | | (12,290,536 | ) | | | (25,332,728 | ) | |
| Net unrealized appreciation (depreciation) on investments | | | (58,043,897 | ) | | | (49,462,726 | ) | | | (4,119,049 | ) | |
| Net assets | | $ | 180,136,182 | | | $ | 242,318,304 | | | $ | 10,808,768 | | |
| (a) Cost of investments - unaffiliated issuers: | | $ | 220,996,289 | | | $ | 286,947,187 | | | $ | 14,808,920 | | |
| (b) Cost of short-term investments: | | $ | 10,179,776 | | | $ | 4,955,598 | | | $ | 142,506 | | |
The accompanying notes are an integral part of the financial statements.
44
| | | MML
NASDAQ-100
Fund | | MML Small
Cap Growth
Equity Fund | | MML
Emerging
Growth Fund | |
| Assets: | |
| Investments, at value (Note 2)(a) | | $ | 5,476,110 | | | $ | 157,504,980 | | | $ | 9,714,912 | | |
| Short-term investments, at value (Note 2)(b) | | | 107,944 | | | | 11,463,391 | | | | 294,017 | | |
| Total investments | | | 5,584,054 | | | | 168,968,371 | | | | 10,008,929 | | |
| Receivables from: | |
| Investments sold | | | 951 | | | | 2,109,705 | | | | 181,706 | | |
| Investment adviser (Note 3) | | | 18,109 | | | | - | | | | 21,315 | | |
| Fund shares sold | | | 14,397 | | | | 3,658,330 | | | | 40,934 | | |
| Interest and dividends | | | 2,268 | | | | 113,667 | | | | 1,849 | | |
| Variation margin on open futures contracts (Note 2) | | | 520 | | | | - | | | | - | | |
| Foreign taxes withheld | | | - | | | | 28 | | | | - | | |
| Total assets | | | 5,620,299 | | | | 174,850,101 | | | | 10,254,733 | | |
| Liabilities: | |
| Payables for: | |
| Investments purchased | | | - | | | | 2,460,044 | | | | 146,715 | | |
| Fund shares repurchased | | | 1,601 | | | | 13,881 | | | | 1,558 | | |
| Trustees' fees and expenses (Note 3) | | | 4,333 | | | | 38,819 | | | | 5,610 | | |
| Affiliates (Note 3): | |
| Investment management fees | | | 2,231 | | | | 152,084 | | | | 9,015 | | |
| Administration fees | | | - | | | | - | | | | - | | |
| Service fees | | | 107 | | | | 225 | | | | 84 | | |
| Accrued expense and other liabilities | | | 39,355 | | | | 51,628 | | | | 37,986 | | |
| Total liabilities | | | 47,627 | | | | 2,716,681 | | | | 200,968 | | |
| Net assets | | $ | 5,572,672 | | | $ | 172,133,420 | | | $ | 10,053,765 | | |
| Net assets consist of: | |
| Paid-in capital | | $ | 15,619,646 | | | $ | 239,469,350 | | | $ | 20,481,427 | | |
Undistributed (accumulated) net investment income (loss)
(distributions in excess of net investment income) | | | (3,130 | ) | | | (14,496 | ) | | | (5,568 | ) | |
| Accumulated net realized gain (loss) on investments | | | (8,683,156 | ) | | | (21,244,181 | ) | | | (8,640,974 | ) | |
| Net unrealized appreciation (depreciation) on investments | | | (1,360,688 | ) | | | (46,077,253 | ) | | | (1,781,120 | ) | |
| Net assets | | $ | 5,572,672 | | | $ | 172,133,420 | | | $ | 10,053,765 | | |
| (a) Cost of investments - unaffiliated issuers: | | $ | 6,836,407 | | | $ | 203,575,562 | | | $ | 11,496,032 | | |
| (b) Cost of short-term investments: | | $ | 107,944 | | | $ | 11,463,391 | | | $ | 294,017 | | |
45
MML Series Investment Fund – Financial Statements (Continued)
Statements of Assets and Liabilities
December 31, 2008
| | | MML Large
Cap Value
Fund | | MML Equity
Index Fund | | MML Growth
Equity Fund | |
| Initial Class shares: | |
| Net assets | | $ | 175,312,877 | | | $ | - | | | $ | 10,407,913 | | |
| Shares outstanding(a) | | | 21,877,367 | | | | - | | | | 2,370,575 | | |
| Net asset value,offering price and redemption price per share | | $ | 8.01 | | | $ | - | | | $ | 4.39 | | |
| Class I shares: | |
| Net assets | | $ | - | | | $ | 48,278,780 | | | $ | - | | |
| Shares outstanding(a) | | | - | | | | 4,262,064 | | | | - | | |
| Net asset value and redemption price per share | | $ | - | | | $ | 11.33 | | | $ | - | | |
| Class II shares: | |
| Net assets | | $ | - | | | $ | 117,274,180 | | | $ | - | | |
| Shares outstanding(a) | | | - | | | | 10,343,810 | | | | - | | |
| Net asset value, offering price and redemption price per share | | $ | - | | | $ | 11.34 | | | $ | - | | |
| Class III shares: | |
| Net assets | | $ | - | | | $ | 76,286,979 | | | $ | - | | |
| Shares outstanding(a) | | | - | | | | 6,731,056 | | | | - | | |
| Net asset value, offering price and redemption price per share | | $ | - | | | $ | 11.33 | | | $ | - | | |
| Service Class shares*: | |
| Net assets | | $ | 4,823,305 | | | $ | - | | | $ | 400,855 | | |
| Shares outstanding(a) | | | 602,401 | | | | - | | | | 91,381 | | |
| Net asset value, offering price and redemption price per share | | $ | 8.01 | | | $ | - | | | $ | 4.39 | | |
| Service Class I shares**: | |
| Net assets | | $ | - | | | $ | 478,365 | | | $ | - | | |
| Shares outstanding(a) | | | - | | | | 42,270 | | | | - | | |
| Net asset value, offering price and redemption price per share | | $ | - | | | $ | 11.32 | | | $ | - | | |
(a) Authorized unlimited number of shares with no par value.
* Service Class shares commenced operations on August 15, 2008.
** Service Class I shares commenced operations on August 15, 2008.
The accompanying notes are an integral part of the financial statements.
46
| | | MML
NASDAQ-100
Fund | | MML Small
Cap Growth
Equity Fund | | MML
Emerging
Growth Fund | |
| Initial Class shares: | |
| Net assets | | $ | 5,321,528 | | | $ | 171,302,453 | | | $ | 9,873,226 | | |
| Shares outstanding(a) | | | 1,726,466 | | | | 16,376,813 | | | | 2,294,822 | | |
| Net asset value,offering price and redemption price per share | | $ | 3.08 | | | $ | 10.46 | | | $ | 4.30 | | |
| Class I shares: | |
| Net assets | | $ | - | | | $ | - | | | $ | - | | |
| Shares outstanding(a) | | | - | | | | - | | | | - | | |
| Net asset value and redemption price per share | | $ | - | | | $ | - | | | $ | - | | |
| Class II shares: | |
| Net assets | | $ | - | | | $ | - | | | $ | - | | |
| Shares outstanding(a) | | | - | | | | - | | | | - | | |
| Net asset value, offering price and redemption price per share | | $ | - | | | $ | - | | | $ | - | | |
| Class III shares: | |
| Net assets | | $ | - | | | $ | - | | | $ | - | | |
| Shares outstanding(a) | | | - | | | | - | | | | - | | |
| Net asset value, offering price and redemption price per share | | $ | - | | | $ | - | | | $ | - | | |
| Service Class shares*: | |
| Net assets | | $ | 251,144 | | | $ | 830,967 | | | $ | 180,539 | | |
| Shares outstanding(a) | | | 81,556 | | | | 79,536 | | | | 42,000 | | |
| Net asset value, offering price and redemption price per share | | $ | 3.08 | | | $ | 10.45 | | | $ | 4.30 | | |
| Service Class I shares**: | |
| Net assets | | $ | - | | | $ | - | | | $ | - | | |
| Shares outstanding(a) | | | - | | | | - | | | | - | | |
| Net asset value, offering price and redemption price per share | | $ | - | | | $ | - | | | $ | - | | |
47
MML Series Investment Fund – Financial Statements (Continued)
Statements of Operations
For the Year Ended December 31, 2008
| | | MML Large
Cap Value
Fund | | MML Equity
Index Fund | | MML
Growth
Equity Fund | |
| Investment income (Note 2): | |
| Dividends(a) | | $ | 4,136,802 | | | $ | 7,678,938 | | | $ | 148,607 | | |
| Interest | | | 99,061 | | | | 29,879 | | | | 894 | | |
| Securities lending net income | | | 52,490 | | | | 22,491 | | | | 991 | | |
| Total investment income | | | 4,288,353 | | | | 7,731,308 | | | | 150,492 | | |
| Expenses (Note 3): | |
| Investment management fees | | | 1,877,101 | | | | 331,781 | | | | 118,888 | | |
| Custody fees | | | 46,075 | | | | 44,265 | | | | 16,019 | | |
| Audit and legal fees | | | 41,703 | | | | 44,230 | | | | 35,674 | | |
| Proxy fees | | | 995 | | | | 913 | | | | 1,029 | | |
| Shareholder reporting fees | | | 36,371 | | | | 37,593 | | | | 18,639 | | |
| Trustees' fees | | | 36,404 | | | | 52,388 | | | | 2,363 | | |
| | | | 2,038,649 | | | | 511,170 | | | | 192,612 | | |
| Administration fees: | |
| Class I | | | - | | | | 206,061 | | | | - | | |
| Class II | | | - | | | | 304,597 | | | | - | | |
| Class III | | | - | | | | 51,350 | | | | - | | |
| Service Class I** | | | - | | | | 242 | | | | - | | |
| Service fees: | |
| Service Class* | | | 1,494 | | | | - | | | | 148 | | |
| Service Class I** | | | - | | | | 202 | | | | - | | |
| Total expenses | | | 2,040,143 | | | | 1,073,622 | | | | 192,760 | | |
| Expenses waived (Note 3): | |
| Initial Class fees waived by advisor | | | - | | | | - | | | | (56,952 | ) | |
| Class I fees waived by advisor | | | - | | | | (2,614 | ) | | | - | | |
| Class II fees waived by advisor | | | - | | | | (6,350 | ) | | | - | | |
| Class III fees waived by advisor | | | - | | | | (4,520 | ) | | | - | | |
| Service Class fees waived by advisor* | | | - | | | | - | | | | (423 | ) | |
| Service Class I fees waived by advisor** | | | - | | | | (15 | ) | | | - | | |
| Class II administrative fees waived | | | - | | | | (80,157 | ) | | | - | | |
| Class III administrative fees waived | | | - | | | | (51,350 | ) | | | - | | |
| Net expenses | | | 2,040,143 | | | | 928,616 | | | | 135,385 | | |
| Net investment income (loss) | | | 2,248,210 | | | | 6,802,692 | | | | 15,107 | | |
| Realized and unrealized gain (loss): | |
| Net realized gain (loss) on: | |
| Investment transactions | | | (9,624,042 | ) | | | (2,620,841 | ) | | | (3,069,771 | ) | |
| Futures contracts | | | - | | | | (705,933 | ) | | | - | | |
| Written options | | | - | | | | - | | | | - | | |
| Foreign currency transactions | | | (29,650 | ) | | | - | | | | (1,678 | ) | |
| Net realized gain (loss) | | | (9,653,692 | ) | | | (3,326,774 | ) | | | (3,071,449 | ) | |
| Net change in unrealized appreciation (depreciation) on: | |
| Investment transactions | | | (105,968,173 | ) | | | (148,798,685 | ) | | | (4,748,594 | ) | |
| Futures contracts | | | - | | | | 148,305 | | | | - | | |
| Translation of assets and liabilities in foreign currencies | | | 354 | | | | - | | | | - | | |
| Net change in unrealized appreciation (depreciation) | | | (105,967,819 | ) | | | (148,650,380 | ) | | | (4,748,594 | ) | |
Net realized gain (loss) and change in
unrealized appreciation (depreciation) | | | (115,621,511 | ) | | | (151,977,154 | ) | | | (7,820,043 | ) | |
| Net increase (decrease) in net assets resulting from operations | | $ | (113,373,301 | ) | | $ | (145,174,462 | ) | | $ | (7,804,936 | ) | |
| (a) Net of withholding tax of: | | $ | 36,507 | | | $ | - | | | $ | 1,737 | | |
* Service Class shares commenced operations on August 15, 2008.
** Service Class I shares commenced operations on August 15, 2008.
The accompanying notes are an integral part of the financial statements.
48
| | | MML
NASDAQ-
100 Fund | | MML Small
Cap Growth
Equity Fund | | MML
Emerging
Growth
Fund | |
| Investment income (Note 2): | |
| Dividends(a) | | $ | 43,619 | | | $ | 1,953,060 | | | $ | 39,525 | | |
| Interest | | | 2,975 | | | | 178,632 | | | | 8,840 | | |
| Securities lending net income | | | - | | | | 149,671 | | | | - | | |
| Total investment income | | | 46,594 | | | | 2,281,363 | | | | 48,365 | | |
| Expenses (Note 3): | |
| Investment management fees | | | 36,706 | | | | 2,232,759 | | | | 155,276 | | |
| Custody fees | | | 9,631 | | | | 55,256 | | | | 10,514 | | |
| Audit and legal fees | | | 35,854 | | | | 46,628 | | | | 34,851 | | |
| Proxy fees | | | 912 | | | | 1,050 | | | | 1,349 | | |
| Shareholder reporting fees | | | 16,460 | | | | 32,712 | | | | 29,014 | | |
| Trustees' fees | | | 1,248 | | | | 30,097 | | | | 2,271 | | |
| | | | 100,811 | | | | 2,398,502 | | | | 233,275 | | |
| Administration fees: | |
| Class I | | | - | | | | - | | | | - | | |
| Class II | | | - | | | | - | | | | - | | |
| Class III | | | - | | | | - | | | | - | | |
| Service Class I** | | | - | | | | - | | | | - | | |
| Service fees: | |
| Service Class* | | | 137 | | | | 256 | | | | 116 | | |
| Service Class I** | | | - | | | | - | | | | - | | |
| Total expenses | | | 100,948 | | | | 2,398,758 | | | | 233,391 | | |
| Expenses waived (Note 3): | |
| Initial Class fees waived by advisor | | | (54,449 | ) | | | - | | | | (52,973 | ) | |
| Class I fees waived by advisor | | | - | | | | - | | | | - | | |
| Class II fees waived by advisor | | | - | | | | - | | | | - | | |
| Class III fees waived by advisor | | | - | | | | - | | | | - | | |
| Service Class fees waived by advisor* | | | (680 | ) | | | - | | | | (355 | ) | |
| Service Class I fees waived by advisor** | | | - | | | | - | | | | - | | |
| Class II administrative fees waived | | | - | | | | - | | | | - | | |
| Class III administrative fees waived | | | - | | | | - | | | | - | | |
| Net expenses | | | 45,819 | | | | 2,398,758 | | | | 180,063 | | |
| Net investment income (loss) | | | 775 | | | | (117,395 | ) | | | (131,698 | ) | |
| Realized and unrealized gain (loss): | |
| Net realized gain (loss) on: | |
| Investment transactions | | | (948 | ) | | | (19,865,215 | ) | | | (4,183,866 | ) | |
| Futures contracts | | | (130,033 | ) | | | - | | | | - | | |
| Written options | | | - | | | | 33,017 | | | | - | | |
| Foreign currency transactions | | | - | | | | (6,648 | ) | | | - | | |
| Net realized gain (loss) | | | (130,981 | ) | | | (19,838,846 | ) | | | (4,183,866 | ) | |
| Net change in unrealized appreciation (depreciation) on: | |
| Investment transactions | | | (4,057,906 | ) | | | (76,640,843 | ) | | | (3,235,257 | ) | |
| Futures contracts | | | (6,808 | ) | | | - | | | | - | | |
| Translation of assets and liabilities in foreign currencies | | | - | | | | (8,511 | ) | | | - | | |
| Net change in unrealized appreciation (depreciation) | | | (4,064,714 | ) | | | (76,649,354 | ) | | | (3,235,257 | ) | |
Net realized gain (loss) and change in
unrealized appreciation (depreciation) | | | (4,195,695 | ) | | | (96,488,200 | ) | | | (7,419,123 | ) | |
| Net increase (decrease) in net assets resulting from operations | | $ | (4,194,920 | ) | | $ | (96,605,595 | ) | | $ | (7,550,821 | ) | |
| (a) Net of withholding tax of: | | $ | 350 | | | $ | 10,804 | | | $ | - | | |
49
MML Series Investment Fund – Financial Statements (Continued)
Statements of Changes in Net Assets
| | | MML Large Cap Value Fund | | MML Equity Index Fund | |
| | | Year Ended
December 31, 2008 | | Year Ended
December 31, 2007 | | Year Ended
December 31, 2008 | | Year Ended
December 31, 2007 | |
| Increase (Decrease) in Net Assets: | |
| Operations: | |
| Net investment income (loss) | | $ | 2,248,210 | | | $ | 2,760,679 | | | $ | 6,802,692 | | | $ | 7,056,359 | | |
| Net realized gain (loss) on investment transactions | | | (9,653,692 | ) | | | 4,567,209 | | | | (3,326,774 | ) | | | 7,098,681 | | |
| Net change in unrealized appreciation (depreciation) on investments | | | (105,967,819 | ) | | | 1,866,532 | | | | (148,650,380 | ) | | | 7,264,093 | | |
| Net increase (decrease) in net assets resulting from operations | | | (113,373,301 | ) | | | 9,194,420 | | | | (145,174,462 | ) | | | 21,419,133 | | |
| Distributions to shareholders (Note 2): | |
| From net investment income: | |
| Initial Class | | | - | | | | (2,798,621 | ) | | | - | | | | - | | |
| Class I | | | - | | | | - | | | | - | | | | (1,366,698 | ) | |
| Class II | | | - | | | | - | | | | - | | | | (3,365,535 | ) | |
| Class III | | | - | | | | - | | | | - | | | | (2,269,397 | ) | |
| Total distributions from net investment income | | | - | | | | (2,798,621 | ) | | | - | | | | (7,001,630 | ) | |
| From net realized gains: | |
| Initial Class | | | (279,560 | ) | | | - | | | | - | | | | - | | |
| Service Class | | | (110 | ) | | | - | | | | - | | | | - | | |
| Total distributions from realized gains | | | (279,670 | ) | | | - | | | | - | | | | - | | |
| Net fund share transactions (Note 5): | |
| Initial Class | | | (2,155,783 | ) | | | 67,721,437 | | | | - | | | | - | | |
| Class I | | | - | | | | - | | | | (9,401,098 | ) | | | (255,367 | ) | |
| Class II | | | - | | | | - | | | | (11,006,042 | ) | | | 1,345,988 | | |
| Class III | | | - | | | | - | | | | (1,471,835 | ) | | | (9,170,458 | ) | |
| Service Class* | | | 5,006,980 | | | | - | | | | - | | | | - | | |
| Service Class I** | | | - | | | | - | | | | 509,391 | | | | - | | |
| Increase (decrease) in net assets from fund share transactions | | | 2,851,197 | | | | 67,721,437 | | | | (21,369,584 | ) | | | (8,079,837 | ) | |
| Total increase (decrease) in net assets | | | (110,801,774 | ) | | | 74,117,236 | | | | (166,544,046 | ) | | | 6,337,666 | | |
| Net assets | |
| Beginning of year | | | 290,937,956 | | | | 216,820,720 | | | | 408,862,350 | | | | 402,524,684 | | |
| End of year | | $ | 180,136,182 | | | $ | 290,937,956 | | | $ | 242,318,304 | | | $ | 408,862,350 | | |
Undistributed (accumulated) net investment income (loss) (distributions in
excess of net investment income) included in net assets at end of year | | $ | 2,172,646 | | | $ | (45,912 | ) | | $ | 6,644,634 | | | $ | (64,580 | ) | |
* Service Class shares commenced operations on August 15, 2008.
** Service Class I shares commenced operations on August 15, 2008.
The accompanying notes are an integral part of the financial statements.
50
| | | MML Growth Equity Fund | |
| | | Year Ended
December 31, 2008 | | Year Ended
December 31, 2007 | |
| Increase (Decrease) in Net Assets: | |
| Operations: | |
| Net investment income (loss) | | $ | 15,107 | | | $ | 86,044 | | |
| Net realized gain (loss) on investment transactions | | | (3,071,449 | ) | | | 1,164,903 | | |
| Net change in unrealized appreciation (depreciation) on investments | | | (4,748,594 | ) | | | (399,298 | ) | |
| Net increase (decrease) in net assets resulting from operations | | | (7,804,936 | ) | | | 851,649 | | |
| Distributions to shareholders (Note 2): | |
| From net investment income: | |
| Initial Class | | | - | | | | (95,117 | ) | |
| Class I | | | - | | | | - | | |
| Class II | | | - | | | | - | | |
| Class III | | | - | | | | - | | |
| Total distributions from net investment income | | | - | | | | (95,117 | ) | |
| From net realized gains: | |
| Initial Class | | | - | | | | - | | |
| Service Class | | | - | | | | - | | |
| Total distributions from realized gains | | | - | | | | - | | |
| Net fund share transactions (Note 5): | |
| Initial Class | | | (60,606 | ) | | | (2,691,248 | ) | |
| Class I | | | - | | | | - | | |
| Class II | | | - | | | | - | | |
| Class III | | | - | | | | - | | |
| Service Class* | | | 426,964 | | | | - | | |
| Service Class I** | | | - | | | | - | | |
| Increase (decrease) in net assets from fund share transactions | | | 366,358 | | | | (2,691,248 | ) | |
| Total increase (decrease) in net assets | | | (7,438,578 | ) | | | (1,934,716 | ) | |
| Net assets | |
| Beginning of year | | | 18,247,346 | | | | 20,182,062 | | |
| End of year | | $ | 10,808,768 | | | $ | 18,247,346 | | |
Undistributed (accumulated) net investment income (loss) (distributions in
excess of net investment income) included in net assets at end of year | | $ | (242 | ) | | $ | (9,936 | ) | |
51
MML Series Investment Fund – Financial Statements (Continued)
Statements of Changes in Net Assets
| | | MML NASDAQ-100 Fund | | MML Small Cap Growth Equity Fund | |
| | | Year Ended
December 31, 2008 | | Year Ended
December 31, 2007 | | Year Ended
December 31, 2008 | | Year Ended
December 31, 2007 | |
| Increase (Decrease) in Net Assets: | |
| Operations: | |
| Net investment income (loss) | | $ | 775 | | | $ | 2,189 | | | $ | (117,395 | ) | | $ | (794,505 | ) | |
| Net realized gain (loss) on investment transactions | | | (130,981 | ) | | | 274,896 | | | | (19,838,846 | ) | | | 9,340,029 | | |
| Net change in unrealized appreciation (depreciation) on investments | | | (4,064,714 | ) | | | 1,186,052 | | | | (76,649,354 | ) | | | 8,020,310 | | |
| Net increase (decrease) in net assets resulting from operations | | | (4,194,920 | ) | | | 1,463,137 | | | | (96,605,595 | ) | | | 16,565,834 | | |
| Distributions to shareholders (Note 2): | |
| From net investment income: | |
| Initial Class | | | (204 | ) | | | (2,524 | ) | | | - | | | | (272,404 | ) | |
| Service Class* | | | (2 | ) | | | - | | | | - | | | | - | | |
| Total distributions from net investment income | | | (206 | ) | | | (2,524 | ) | | | - | | | | (272,404 | ) | |
| From net realized gains: | |
| Initial Class | | | - | | | | - | | | | - | | | | (7,674,208 | ) | |
| Total distributions from net realized gains | | | - | | | | - | | | | - | | | | (7,674,208 | ) | |
| Net fund share transactions (Note 5): | |
| Initial Class | | | (897,493 | ) | | | 435,014 | | | | 29,715,094 | | | | 59,625,409 | | |
| Service Class* | | | 296,028 | | | | - | | | | 838,612 | | | | - | | |
| Increase (decrease) in net assets from fund share transactions | | | (601,465 | ) | | | 435,014 | | | | 30,553,706 | | | | 59,625,409 | | |
| Total increase (decrease) in net assets | | | (4,796,591 | ) | | | 1,895,627 | | | | (66,051,889 | ) | | | 68,244,631 | | |
| Net assets | |
| Beginning of year | | | 10,369,263 | | | | 8,473,636 | | | | 238,185,309 | | | | 169,940,678 | | |
| End of year | | $ | 5,572,672 | | | $ | 10,369,263 | | | $ | 172,133,420 | | | $ | 238,185,309 | | |
Undistributed (accumulated) net investment income (loss) (distributions in
excess of net investment income) included in net assets at end of year | | $ | (3,130 | ) | | $ | (3,203 | ) | | $ | (14,496 | ) | | $ | (35,397 | ) | |
* Service Class shares commenced operations on August 15, 2008.
The accompanying notes are an integral part of the financial statements.
52
| | | MML Emerging Growth Fund | |
| | | Year Ended
December 31, 2008 | | Year Ended
December 31, 2007 | |
| Increase (Decrease) in Net Assets: | |
| Operations: | |
| Net investment income (loss) | | $ | (131,698 | ) | | $ | (115,102 | ) | |
| Net realized gain (loss) on investment transactions | | | (4,183,866 | ) | | | 2,348,796 | | |
| Net change in unrealized appreciation (depreciation) on investments | | | (3,235,257 | ) | | | (3,816 | ) | |
| Net increase (decrease) in net assets resulting from operations | | | (7,550,821 | ) | | | 2,229,878 | | |
| Distributions to shareholders (Note 2): | |
| From net investment income: | |
| Initial Class | | | - | | | | - | | |
| Service Class* | | | - | | | | - | | |
| Total distributions from net investment income | | | - | | | | - | | |
| From net realized gains: | |
| Initial Class | | | - | | | | - | | |
| Total distributions from net realized gains | | | - | | | | - | | |
| Net fund share transactions (Note 5): | |
| Initial Class | | | (1,532,946 | ) | | | 1,978,597 | | |
| Service Class* | | | 226,319 | | | | - | | |
| Increase (decrease) in net assets from fund share transactions | | | (1,306,627 | ) | | | 1,978,597 | | |
| Total increase (decrease) in net assets | | | (8,857,448 | ) | | | 4,208,475 | | |
| Net assets | |
| Beginning of year | | | 18,911,213 | | | | 14,702,738 | | |
| End of year | | $ | 10,053,765 | | | $ | 18,911,213 | | |
Undistributed (accumulated) net investment income (loss) (distributions in
excess of net investment income) included in net assets at end of year | | $ | (5,568 | ) | | $ | (6,114 | ) | |
53
MML Series Investment Fund – Financial Highlights
(For a share outstanding throughout each period)
MML Large Cap Value Fund
| | | Initial Class | |
| | | Year Ended
12/31/08 | | Year Ended
12/31/07 | | Year Ended
12/31/06 | | Year Ended
12/31/05††† | | Year Ended
12/31/04 | |
| Net asset value, beginning of year | | $ | 13.21 | | | $ | 12.80 | | | $ | 11.27 | | | $ | 10.38 | | | $ | 9.35 | | |
| Income (loss) from investment operations: | |
| Net investment income (loss) | | | 0.10 | *** | | | 0.15 | *** | | | 0.09 | *** | | | 0.09 | *** | | | 0.06 | | |
| Net realized and unrealized gain (loss) on investments | | | (5.29 | ) | | | 0.39 | | | | 1.52 | | | | 0.87 | | | | 1.04 | | |
| Total income (loss) from investment operations | | | (5.19 | ) | | | 0.54 | | | | 1.61 | | | | 0.96 | | | | 1.10 | | |
| Less distributions to shareholders: | |
| From net investment income | | | - | | | | (0.13 | ) | | | (0.08 | ) | | | (0.07 | ) | | | (0.07 | ) | |
| From net realized gains | | | (0.01 | ) | | | - | | | | - | | | | - | | | | - | | |
| Tax return of capital | | | - | | | | - | | | | - | | | | (0.00 | )† | | | - | | |
| Total distributions | | | (0.01 | ) | | | (0.13 | ) | | | (0.08 | ) | | | (0.07 | ) | | | (0.07 | ) | |
| Net asset value, end of year | | $ | 8.01 | | | $ | 13.21 | | | $ | 12.80 | | | $ | 11.27 | | | $ | 10.38 | | |
| Total Return^^ | | | (39.30 | %) | | | 4.22 | % | | | 14.18 | % | | | 9.38 | % | | | 11.79 | % | |
| Ratios / Supplemental Data: | |
| Net assets, end of year (000's) | | $ | 175,313 | | | $ | 290,938 | | | $ | 216,821 | | | $ | 133,756 | | | $ | 82,898 | | |
| Ratio of expenses to average daily net assets: | |
| Before expense waiver | | | 0.84 | % | | | 0.82 | % | | | 0.85 | % | | | 0.89 | % | | | 0.87 | % | |
| After expense waiver | | | N/A | | | | N/A | | | | N/A | | | | N/A | | | | 0.87 | % #^^^ | |
| Net investment income (loss) to average daily net assets | | | 0.92 | % | | | 1.10 | % | | | 0.80 | % | | | 0.81 | % | | | 0.78 | % | |
| Portfolio turnover rate | | | 20 | % | | | 7 | % | | | 10 | % | | | 3 | % | | | 3 | % | |
| | | Service Class | |
| | | Period Ended
12/31/08+++ | |
| Net asset value, beginning of period | | $ | 11.57 | | |
| Income (loss) from investment operations: | |
| Net investment income (loss) | | | 0.01 | *** | |
| Net realized and unrealized gain (loss) on investments | | | (3.56 | ) | |
| Total income (loss) from investment operations | | | (3.55 | ) | |
| Less distributions to shareholders: | |
| From net realized gains | | | (0.01 | ) | |
| Total distributions | | | (0.01 | ) | |
| Net asset value, end of period | | $ | 8.01 | | |
| | | | | | |
| Total Return^^ | | | (30.69 | %)** | |
| Ratios / Supplemental Data: | |
| Net assets, end of period (000's) | | $ | 4,823 | | |
| Net expenses to average daily net assets | | | 1.12 | % * | |
| Net investment income (loss) to average daily net assets | | | 0.48 | % * | |
| Portfolio turnover rate | | | 20 | % | |
* Annualized.
** Percentage represents the results for the period and is not annualized.
*** Per share amount calculated on the average shares method.
† Amount is less than $0.005 per share.
††† Effective January 1, 2005, rebated brokerage commissions are included with realized gain or loss on investment transactions. Prior to January 1, 2005, these amounts were presented as a reduction of expenses. Prior year amounts have not been restated to reflect this change due to immateriality.
+++ For the period August 15, 2008 (commencement of operations) through December 31, 2008.
# Computed after giving effect to an agreement by MassMutual to waive certain fees and expenses of the Fund.
^^ Total return does not reflect expenses that apply at the separate account level or to related insurance products. Inclusion of these charges would reduce the total return figures for all periods shown.
^^^ The Fund has entered into agreements with certain brokers to rebate a portion of brokerage commissions. The rebated commissions were used to reduce operating expenses of the Fund.
The accompanying notes are an integral part of the financial statements.
54
MML Series Investment Fund – Financial Highlights (Continued)
(For a share outstanding throughout each period)
MML Equity Index Fund
| | | Class I | |
| | | Year Ended
12/31/08 | | Year Ended
12/31/07 | | Year Ended
12/31/06 | | Year Ended
12/31/05 | | Year Ended
12/31/04 | |
| Net asset value, beginning of year | | $ | 18.06 | | | $ | 17.45 | | | $ | 15.36 | | | $ | 14.90 | | | $ | 13.71 | | |
| Income (loss) from investment operations: | |
| Net investment income (loss) | | | 0.29 | *** | | | 0.28 | *** | | | 0.25 | *** | | | 0.21 | *** | | | 0.22 | *** | |
| Net realized and unrealized gain (loss) on investments | | | (7.02 | ) | | | 0.61 | | | | 2.10 | | | | 0.47 | | | | 1.21 | | |
| Total income (loss) from investment operations | | | (6.73 | ) | | | 0.89 | | | | 2.35 | | | | 0.68 | | | | 1.43 | | |
| Less distributions to shareholders: | |
| From net investment income | | | - | | | | (0.28 | ) | | | (0.26 | ) | | | (0.22 | ) | | | (0.24 | ) | |
| Tax return of capital | | | - | | | | - | | | | - | | | | (0.00 | )† | | | - | | |
| Total distributions | | | - | | | | (0.28 | ) | | | (0.26 | ) | | | (0.22 | ) | | | (0.24 | ) | |
| Net asset value, end of year | | $ | 11.33 | | | $ | 18.06 | | | $ | 17.45 | | | $ | 15.36 | | | $ | 14.90 | | |
| Total Return^^ | | | (37.26 | %) | | | 5.13 | % | | | 15.30 | % | | | 4.53 | % | | | 10.42 | % | |
| Ratios / Supplemental Data: | |
| Net assets, end of year (000's) | | $ | 48,279 | | | $ | 88,058 | | | $ | 85,288 | | | $ | 76,012 | | | $ | 85,138 | | |
| Ratio of expenses to average daily net assets: | |
| Before expense waiver | | | 0.45 | % | | | 0.45 | % | | | 0.46 | % | | | 0.48 | % | | | 0.44 | % | |
| After expense waiver | | | N/A ## | | | | N/A | | | | 0.45 | % # | | | 0.45 | % # | | | N/A | | |
| Net investment income (loss) to average daily net assets | | | 1.88 | % | | | 1.53 | % | | | 1.54 | % | | | 1.42 | % | | | 1.60 | % | |
| Portfolio turnover rate | | | 5 | % | | | 6 | % | | | 4 | % | | | 4 | % | | | 4 | % | |
| | | Class II | |
| | | Year Ended
12/31/08 | | Year Ended
12/31/07 | | Year Ended
12/31/06 | | Year Ended
12/31/05 | | Year Ended
12/31/04 | |
| Net asset value, beginning of year | | $ | 18.04 | | | $ | 17.44 | | | $ | 15.34 | | | $ | 14.89 | | | $ | 13.70 | | |
| Income (loss) from investment operations: | |
| Net investment income (loss) | | | 0.31 | *** | | | 0.31 | *** | | | 0.28 | *** | | | 0.24 | *** | | | 0.25 | *** | |
| Net realized and unrealized gain (loss) on investments | | | (7.01 | ) | | | 0.60 | | | | 2.10 | | | | 0.45 | | | | 1.20 | | |
| Total income (loss) from investment operations | | | (6.70 | ) | | | 0.91 | | | | 2.38 | | | | 0.69 | | | | 1.45 | | |
| Less distributions to shareholders: | |
| From net investment income | | | - | | | | (0.31 | ) | | | (0.28 | ) | | | (0.24 | ) | | | (0.26 | ) | |
| Tax return of capital | | | - | | | | - | | | | - | | | | (0.00 | )† | | | - | | |
| Total distributions | | | - | | | | (0.31 | ) | | | (0.28 | ) | | | (0.24 | ) | | | (0.26 | ) | |
| Net asset value, end of year | | $ | 11.34 | | | $ | 18.04 | | | $ | 17.44 | | | $ | 15.34 | | | $ | 14.89 | | |
| Total Return^^ | | | (37.14 | %) | | | 5.24 | % | | | 15.54 | % | | | 4.65 | % | | | 10.60 | % | |
| Ratios / Supplemental Data: | |
| Net assets, end of year (000's) | | $ | 117,274 | | | $ | 197,826 | | | $ | 189,688 | | | $ | 182,390 | | | $ | 184,271 | | |
| Ratio of expenses to average daily net assets: | |
| Before expense waiver | | | 0.34 | % | | | 0.34 | % | | | 0.35 | % | | | 0.37 | % | | | 0.33 | % | |
| After expense waiver | | | 0.29 | % # | | | 0.29 | % # | | | 0.29 | % # | | | 0.29 | % # | | | 0.27 | % # | |
| Net investment income (loss) to average daily net assets | | | 2.01 | % | | | 1.69 | % | | | 1.70 | % | | | 1.59 | % | | | 1.75 | % | |
| Portfolio turnover rate | | | 5 | % | | | 6 | % | | | 4 | % | | | 4 | % | | | 4 | % | |
*** Per share amount calculated on the average shares method.
† Amount is less than $0.005 per share.
# Computed after giving effect to an agreement by MassMutual to waive certain fees and expenses of the Fund.
## Amount waived had no impact on the ratio of expenses to average daily net assets.
^^ Total return does not reflect expenses that apply at the separate account level or to related insurance products. Inclusion of these charges would reduce the total return figures for all periods shown.
The accompanying notes are an integral part of the financial statements.
55
MML Series Investment Fund – Financial Highlights (Continued)
(For a share outstanding throughout each period)
MML Equity Index Fund
| | | Class III | |
| | | Year Ended
12/31/08 | | Year Ended
12/31/07 | | Year Ended
12/31/06 | | Year Ended
12/31/05 | | Year Ended
12/31/04 | |
| Net asset value, beginning of year | | $ | 18.01 | | | $ | 17.41 | | | $ | 15.31 | | | $ | 14.86 | | | $ | 13.67 | | |
| Income (loss) from investment operations: | |
| Net investment income (loss) | | | 0.34 | *** | | | 0.33 | *** | | | 0.30 | *** | | | 0.26 | *** | | | 0.26 | *** | |
| Net realized and unrealized gain (loss) on investments | | | (7.02 | ) | | | 0.61 | | | | 2.11 | | | | 0.46 | | | | 1.21 | | |
| Total income (loss) from investment operations | | | (6.68 | ) | | | 0.94 | | | | 2.41 | | | | 0.72 | | | | 1.47 | | |
| Less distributions to shareholders: | |
| From net investment income | | | - | | | | (0.34 | ) | | | (0.31 | ) | | | (0.27 | ) | | | (0.28 | ) | |
| Tax return of capital | | | - | | | | - | | | | - | | | | (0.00 | )† | | | - | | |
| Total distributions | | | - | | | | (0.34 | ) | | | (0.31 | ) | | | (0.27 | ) | | | (0.28 | ) | |
| Net asset value, end of year | | $ | 11.33 | | | $ | 18.01 | | | $ | 17.41 | | | $ | 15.31 | | | $ | 14.86 | | |
| Total Return^^ | | | (37.09 | %) | | | 5.40 | % | | | 15.72 | % | | | 4.80 | % | | | 10.77 | % | |
| Ratios / Supplemental Data: | |
| Net assets, end of year (000's) | | $ | 76,287 | | | $ | 122,979 | | | $ | 127,549 | | | $ | 137,295 | | | $ | 136,927 | | |
| Ratio of expenses to average daily net assets: | |
| Before expense waiver | | | 0.20 | % | | | 0.20 | % | | | 0.21 | % | | | 0.23 | % | | | 0.19 | % | |
| After expense waiver | | | 0.15 | % # | | | 0.15 | % # | | | 0.15 | % # | | | 0.15 | % # | | | 0.14 | % # | |
| Net investment income (loss) to average daily net assets | | | 2.23 | % | | | 1.83 | % | | | 1.83 | % | | | 1.72 | % | | | 1.88 | % | |
| Portfolio turnover rate | | | 5 | % | | | 6 | % | | | 4 | % | | | 4 | % | | | 4 | % | |
| | | Service Class I | |
| | | Period Ended
12/31/08+++ | |
| Net asset value, beginning of period | | $ | 16.07 | | |
| Income (loss) from investment operations: | |
| Net investment income (loss) | | | 0.10 | *** | |
| Net realized and unrealized gain (loss) on investments | | | (4.85 | ) | |
| Total income (loss) from investment operations | | | (4.75 | ) | |
| Net asset value, end of period | | $ | 11.32 | | |
| | | | | | |
| Total Return^^ | | | (29.56 | %)** | |
| Ratios / Supplemental Data: | |
| Net assets, end of period (000's) | | $ | 478 | | |
| Ratio of expenses to average daily net assets: | |
| Before expense waiver | | | 0.72 | % * | |
| After expense waiver | | | 0.70 | % *# | |
| Net investment income (loss) to average daily net assets | | | 2.33 | % * | |
| Portfolio turnover rate | | | 5 | % | |
* Annualized.
** Percentage represents the results for the period and is not annualized.
*** Per share amount calculated on the average shares method.
† Amount is less than $0.005 per share.
+++ For the period August 15, 2008 (commencement of operations) through December 31, 2008.
# Computed after giving effect to an agreement by MassMutual to waive certain fees and expenses of the Fund.
^^ Total return does not reflect expenses that apply at the separate account level or to related insurance products. Inclusion of these charges would reduce the total return figures for all periods shown.
The accompanying notes are an integral part of the financial statements.
56
MML Series Investment Fund – Financial Highlights (Continued)
(For a share outstanding throughout each period)
MML Growth Equity Fund
| | | Initial Class | |
| | | Year Ended
12/31/08 | | Year Ended
12/31/07 | | Year Ended
12/31/06 | | Year Ended
12/31/05††† | | Year Ended
12/31/04 | |
| Net asset value, beginning of year | | $ | 7.66 | | | $ | 7.38 | | | $ | 7.27 | | | $ | 7.03 | | | $ | 6.74 | | |
| Income (loss) from investment operations: | |
| Net investment income (loss) | | | 0.01 | *** | | | 0.03 | *** | | | 0.04 | *** | | | 0.03 | | | | 0.03 | | |
| Net realized and unrealized gain (loss) on investments | | | (3.28 | ) | | | 0.29 | | | | 0.10 | | | | 0.24 | | | | 0.29 | | |
| Total income (loss) from investment operations | | | (3.27 | ) | | | 0.32 | | | | 0.14 | | | | 0.27 | | | | 0.32 | | |
| Less distributions to shareholders: | |
| From net investment income | | | - | | | | (0.04 | ) | | | (0.03 | ) | | | (0.03 | ) | | | (0.03 | ) | |
| Total distributions | | | - | | | | (0.04 | ) | | | (0.03 | ) | | | (0.03 | ) | | | (0.03 | ) | |
| Net asset value, end of year | | $ | 4.39 | | | $ | 7.66 | | | $ | 7.38 | | | $ | 7.27 | | | $ | 7.03 | | |
| Total Return^^ | | | (42.69 | %) | | | 4.34 | % | | | 1.98 | % | | | 3.86 | % | | | 4.78 | % | |
| Ratios / Supplemental Data: | |
| Net assets, end of year (000's) | | $ | 10,408 | | | $ | 18,247 | | | $ | 20,182 | | | $ | 21,242 | | | $ | 22,894 | | |
| Ratio of expenses to average daily net assets: | |
| Before expense waiver | | | 1.29 | % | | | 1.10 | % | | | 1.15 | % | | | 1.05 | % | | | 1.00 | % | |
| After expense waiver | | | 0.91 | % # | | | 0.91 | % # | | | 0.91 | % # | | | 0.91 | % # | | | 0.89 | % #^^^ | |
| Net investment income (loss) to average daily net assets | | | 0.10 | % | | | 0.44 | % | | | 0.56 | % | | | 0.40 | % | | | 0.47 | % | |
| Portfolio turnover rate | | | 53 | % | | | 146 | % | | | 104 | % | | | 85 | % | | | 184 | % | |
| | | Service Class | |
| | | Period Ended
12/31/08+++ | |
| Net asset value, beginning of period | | $ | 6.92 | | |
| Income (loss) from investment operations: | |
| Net investment income (loss) | | | 0.00 | ***† | |
| Net realized and unrealized gain (loss) on investments | | | (2.53 | ) | |
| Total income (loss) from investment operations | | | (2.53 | ) | |
| Net asset value, end of period | | $ | 4.39 | | |
| | | | | | |
| Total Return^^ | | | (36.56 | %)** | |
| Ratios / Supplemental Data: | |
| Net assets, end of period (000's) | | $ | 401 | | |
| Ratio of expenses to average daily net assets: | |
| Before expense waiver | | | 1.87 | % * | |
| After expense waiver | | | 1.16 | % *# | |
| Net investment income (loss) to average daily net assets | | | 0.13 | % * | |
| Portfolio turnover rate | | | 53 | % | |
* Annualized.
** Percentage represents the results for the period and is not annualized.
*** Per share amount calculated on the average shares method.
† Amount is less than $0.005 per share.
††† Effective January 1, 2005, rebated brokerage commissions are included with realized gain or loss on investment transactions. Prior to January 1, 2005, these amounts were presented as a reduction of expenses. Prior year amounts have not been restated to reflect this change due to immateriality.
+++ For the period August 15, 2008 (commencement of operations) through December 31, 2008.
# Computed after giving effect to an agreement by MassMutual to waive certain fees and expenses of the Fund.
^^ Total return does not reflect expenses that apply at the separate account level or to related insurance products. Inclusion of these charges would reduce the total return figures for all periods shown.
^^^ The Fund has entered into agreements with certain brokers to rebate a portion of brokerage commissions. The rebated commissions were used to reduce operating expenses of the Fund.
The accompanying notes are an integral part of the financial statements.
57
MML Series Investment Fund – Financial Highlights (Continued)
(For a share outstanding throughout each period)
MML NASDAQ-100 Fund
| | | Initial Class | |
| | | Year Ended
12/31/08 | | Year Ended
12/31/07 | | Year Ended
12/31/06 | | Year Ended
12/31/05 | | Year Ended
12/31/04 | |
| Net asset value, beginning of year | | $ | 5.30 | | | $ | 4.46 | | | $ | 4.18 | | | $ | 4.13 | | | $ | 3.76 | | |
| Income (loss) from investment operations: | |
| Net investment income (loss) | | | 0.00 | ***† | | | 0.00 | ***† | | | 0.01 | *** | | | 0.00 | ***† | | | 0.02 | | |
| Net realized and unrealized gain (loss) on investments | | | (2.22 | ) | | | 0.84 | | | | 0.27 | | | | 0.05 | | | | 0.37 | | |
| Total income (loss) from investment operations | | | (2.22 | ) | | | 0.84 | | | | 0.28 | | | | 0.05 | | | | 0.39 | | |
| Less distributions to shareholders: | |
| From net investment income | | | (0.00 | )† | | | (0.00 | )† | | | (0.00 | )† | | | (0.00 | )† | | | (0.02 | ) | |
| Total distributions | | | (0.00 | )† | | | (0.00 | )† | | | (0.00 | )† | | | (0.00 | )† | | | (0.02 | ) | |
| Net asset value, end of year | | $ | 3.08 | | | $ | 5.30 | | | $ | 4.46 | | | $ | 4.18 | | | $ | 4.13 | | |
| Total Return^^ | | | (41.89 | %) | | | 18.86 | % | | | 6.75 | % | | | 1.26 | % | | | 10.48 | % | |
| Ratios / Supplemental Data: | |
| Net assets, end of year (000's) | | $ | 5,322 | | | $ | 10,369 | | | $ | 8,474 | | | $ | 9,496 | | | $ | 12,223 | | |
| Ratio of expenses to average daily net assets: | |
| Before expense waiver | | | 1.23 | % | | | 0.99 | % | | | 1.08 | % | | | 0.86 | % | | | 0.77 | % | |
| After expense waiver | | | 0.56 | % # | | | 0.56 | % # | | | 0.56 | % # | | | 0.56 | % # | | | 0.56 | % # | |
| Net investment income (loss) to average daily net assets | | | 0.01 | % | | | 0.02 | % | | | 0.13 | % | | | 0.03 | % | | | 0.63 | % | |
| Portfolio turnover rate | | | 18 | % | | | 17 | % | | | 9 | % | | | 23 | % | | | 35 | % | |
| | | Service Class | |
| | | Period Ended
12/31/08+++ | |
| Net asset value, beginning of period | | $ | 4.99 | | |
| Income (loss) from investment operations: | |
| Net investment income (loss) | | | (0.00 | )***† | |
| Net realized and unrealized gain (loss) on investments | | | (1.91 | ) | |
| Total income (loss) from investment operations | | | (1.91 | ) | |
| Less distributions to shareholders: | |
| From net investment income | | | (0.00 | )† | |
| Total distributions | | | (0.00 | )† | |
| Net asset value, end of period | | $ | 3.08 | | |
| | | | | | |
| Total Return^^ | | | (38.28 | %)** | |
| Ratios / Supplemental Data: | |
| Net assets, end of period (000's) | | $ | 251 | | |
| Ratio of expenses to average daily net assets: | |
| Before expense waiver | | | 2.05 | % * | |
| After expense waiver | | | 0.81 | % *# | |
| Net investment income (loss) to average daily net assets | | | (0.16 | %)* | |
| Portfolio turnover rate | | | 18 | % | |
* Annualized.
** Percentage represents the results for the period and is not annualized.
*** Per share amount calculated on the average shares method.
† Amount is less than $0.005 per share.
+++ For the period August 15, 2008 (commencement of operations) through December 31, 2008.
# Computed after giving effect to an agreement by MassMutual to waive certain fees and expenses of the Fund.
^^ Total return does not reflect expenses that apply at the separate account level or to related insurance products. Inclusion of these charges would reduce the total return figures for all periods shown.
The accompanying notes are an integral part of the financial statements.
58
MML Series Investment Fund – Financial Highlights (Continued)
(For a share outstanding throughout each period)
MML Small Cap Growth Equity Fund
| | | Initial Class | |
| | | Year Ended
12/31/08 | | Year Ended
12/31/07 | | Year Ended
12/31/06 | | Year Ended
12/31/05††† | | Year Ended
12/31/04 | |
| Net asset value, beginning of year | | $ | 17.02 | | | $ | 16.07 | | | $ | 14.73 | | | $ | 13.21 | | | $ | 11.66 | | |
| Income (loss) from investment operations: | |
| Net investment income (loss) | | | (0.01 | )*** | | | (0.07 | )*** | | | (0.06 | )*** | | | (0.05 | ) | | | (0.07 | ) | |
| Net realized and unrealized gain (loss) on investments | | | (6.55 | ) | | | 1.63 | | | | 1.40 | | | | 1.57 | | | | 1.62 | | |
| Total income (loss) from investment operations | | | (6.56 | ) | | | 1.56 | | | | 1.34 | | | | 1.52 | | | | 1.55 | | |
| Less distributions to shareholders: | |
| From net investment income | | | — | | | | (0.02 | ) | | | — | | | | — | | | | — | | |
| From net realized gains | | | — | | | | (0.59 | ) | | | — | | | | — | | | | — | | |
| Total distributions | | | — | | | | (0.61 | ) | | | — | | | | — | | | | — | | |
| Net asset value, end of year | | $ | 10.46 | | | $ | 17.02 | | | $ | 16.07 | | | $ | 14.73 | | | $ | 13.21 | | |
| Total Return^^ | | | (38.54 | %) | | | 9.66 | % | | | 9.10 | % | | | 11.58 | % | | | 13.29 | % | |
| Ratios / Supplemental Data: | |
| Net assets, end of year (000's) | | $ | 171,302 | | | $ | 238,185 | | | $ | 169,941 | | | $ | 105,008 | | | $ | 62,009 | | |
| Ratio of expenses to average daily net assets: | |
| Before expense waiver | | | 1.15 | % | | | 1.14 | % | | | 1.18 | % | | | 1.22 | % | | | 1.21 | % | |
| After expense waiver | | | N/A | | | | N/A | | | | N/A | | | | 1.18 | % # | | | 1.14 | % #^^^ | |
| Net investment income (loss) to average daily net assets | | | (0.06 | %) | | | (0.39 | %) | | | (0.41 | %) | | | (0.48 | %) | | | (0.63 | %) | |
| Portfolio turnover rate | | | 86 | % | | | 70 | % | | | 79 | % | | | 61 | % | | | 62 | % | |
| | | Service Class | |
| | | Period Ended
12/31/08+++ | |
| Net asset value, beginning of period | | $ | 15.79 | | |
| Income (loss) from investment operations: | |
| Net investment income (loss) | | | 0.01 | *** | |
| Net realized and unrealized gain (loss) on investments | | | (5.35 | ) | |
| Total income (loss) from investment operations | | | (5.34 | ) | |
| Net asset value, end of period | | $ | 10.45 | | |
| | | | | | |
| Total Return^^ | | | (33.82 | %)** | |
| Ratios / Supplemental Data: | |
| Net assets, end of period (000's) | | $ | 831 | | |
| Net expenses to average daily net assets | | | 1.43 | % * | |
| Net investment income (loss) to average daily net assets | | | 0.21 | % * | |
| Portfolio turnover rate | | | 86 | % | |
* Annualized.
** Percentage represents the results for the period and is not annualized.
*** Per share amount calculated on the average shares method.
††† Effective January 1, 2005, rebated brokerage commissions are included with realized gain or loss on investment transactions. Prior to January 1, 2005, these amounts were presented as a reduction of expenses. Prior year amounts have not been restated to reflect this change due to immateriality.
+++ For the period August 15, 2008 (commencement of operations) through December 31, 2008.
# Computed after giving effects to an agreement by MassMutual to waive certain fees and expenses of the Fund.
^^ Total return does not reflect expenses that apply at the separate account level or to related insurance products. Inclusion of these charges would reduce the total return figures for all periods shown.
^^^ The Fund has entered into agreements with certain brokers to rebate a portion of brokerage commissions. The rebated commissions were used to reduce operating expenses of the Fund.
The accompanying notes are an integral part of the financial statements.
59
MML Series Investment Fund – Financial Highlights (Continued)
(For a share outstanding throughout each period)
MML Emerging Growth Fund
| | | Initial Class | |
| | | Year Ended
12/31/08 | | Year Ended
12/31/07 | | Year Ended
12/31/06 | | Year Ended
12/31/05 | | Year Ended
12/31/04 | |
| Net asset value, beginning of year | | $ | 7.41 | | | $ | 6.29 | | | $ | 5.97 | | | $ | 5.92 | | | $ | 5.16 | | |
| Income (loss) from investment operations: | |
| Net investment income (loss) | | | (0.05 | )*** | | | (0.05 | )*** | | | (0.05 | )*** | | | (0.05 | ) | | | (0.05 | ) | |
| Net realized and unrealized gain (loss) on investments | | | (3.06 | ) | | | 1.17 | | | | 0.37 | | | | 0.10 | | | | 0.81 | | |
| Total income (loss) from investment operations | | | (3.11 | ) | | | 1.12 | | | | 0.32 | | | | 0.05 | | | | 0.76 | | |
| Net asset value, end of year | | $ | 4.30 | | | $ | 7.41 | | | $ | 6.29 | | | $ | 5.97 | | | $ | 5.92 | | |
| Total Return^^ | | | (41.97 | %) | | | 17.81 | % | | | 5.36 | % | | | 0.84 | % | | | 14.73 | % | |
| Ratios / Supplemental Data: | |
| Net assets, end of year (000's) | | $ | 9,873 | | | $ | 18,911 | | | $ | 14,703 | | | $ | 13,807 | | | $ | 14,136 | | |
| Ratio of expenses to average daily net assets: | |
| Before expense waiver | | | 1.58 | % | | | 1.44 | % | | | 1.55 | % | | | 1.51 | % | | | 1.62 | % | |
| After expense waiver | | | 1.22 | % # | | | 1.16 | % # | | | 1.16 | % # | | | 1.16 | % # | | | 1.16 | % # | |
| Net investment income (loss) to average daily net assets | | | (0.89 | %) | | | (0.72 | %) | | | (0.83 | %) | | | (0.91 | %) | | | (0.97 | %) | |
| Portfolio turnover rate | | | 280 | % | | | 195 | % | | | 291 | % | | | 127 | % | | | 184 | % | |
| | | Service Class | |
| | | Period Ended
12/31/08+++ | |
| Net asset value, beginning of period | | $ | 6.72 | | |
| Income (loss) from investment operations: | |
| Net investment income (loss) | | | (0.02 | )*** | |
| Net realized and unrealized gain (loss) on investments | | | (2.40 | ) | |
| Total income (loss) from investment operations | | | (2.42 | ) | |
| Net asset value, end of period | | $ | 4.30 | | |
| Total Return^^ | | | (36.01 | %)** | |
| Ratios / Supplemental Data: | |
| Net assets, end of period (000's) | | $ | 181 | | |
| Ratio of expenses to average daily net assets: | |
| Before expense waiver | | | 2.27 | % * | |
| After expense waiver | | | 1.50 | % *# | |
| Net investment income (loss) to average daily net assets | | | (1.10 | %)* | |
| Portfolio turnover rate | | | 280 | % | |
* Annualized.
** Percentage represents the results for the period and is not annualized.
*** Per share amount calculated on the average shares method.
+++ For the period August 15, 2008 (commencement of operations) through December 31, 2008.
# Computed after giving effect to an agreement by MassMutual to waive certain fees and expenses of the Fund.
^^ Total return does not reflect expenses that apply at the separate account level or to related insurance products. Inclusion of these charges would reduce the total return figures for all periods shown.
The accompanying notes are an integral part of the financial statements.
60
Notes to Financial Statements
1. The Fund
MML Series Investment Fund (the "Trust") is registered under the Investment Company Act of 1940, as amended (the "1940 Act"), as a no-load, open-end, management investment company. The Trust is organized under the laws of the Commonwealth of Massachusetts as a Massachusetts business trust pursuant to an Agreement and Declaration of Trust dated May 14, 1993, as amended. The following are six series of the Trust (each individually referred to as a "Fund" or collectively as the "Funds"): MML Large Cap Value Fund ("Large Cap Value Fund"), MML Equity Index Fund ("Equity Index Fund"), MML Growth Equity Fund ("Growth Equity Fund"), MML NASDAQ-100® Fund ("NASDAQ-100 Fund"), MML Small Cap Growth Equity Fund ("Small Cap Growth Equity Fund") an d MML Emerging Growth Fund ("Emerging Growth Fund").
The Trust was established by Massachusetts Mutual Life Insurance Company ("MassMutual") for the purpose of providing vehicles for the investment of assets of various separate investment accounts established by MassMutual and by life insurance companies which are subsidiaries of MassMutual. Shares of the Trust are not offered to the general public. MassMutual, MML Bay State Life Insurance Company and C.M. Life Insurance Company are the record owners of all outstanding shares of the Funds.
Each Fund, other than the Equity Index Fund, offers the following two classes of shares: Initial Class and Service Class shares. The Equity Index Fund offers the following four classes of shares: Class I, Class II, Class III and Service Class I shares. Service Class shares and Service Class I shares commenced operations on August 15, 2008. Each share class invests in the same portfolio of assets. The principal difference among the classes is the level of service and administration fees, and shareholder and distribution services borne by the classes. Because each class will have different fees and expenses, performance and share prices among the classes will vary. The classes of shares are offered to different types of investors, as outlined in the Funds' Prospectus.
2. Significant Accounting Policies
The following is a summary of significant accounting policies followed consistently by each Fund in the preparation of the financial statements in conformity with accounting principles generally accepted in the United States of America ("generally accepted accounting principles"). The preparation of the financial statements in accordance with generally accepted accounting principles requires management to make estimates and assumptions that affect the reported amounts and disclosures in the financial statements. Actual results could differ from those estimates.
Investment Valuation
Equity securities are valued on the basis of valuations furnished by a pricing service, authorized by the Board of Trustees ("Trustees"), which provides the last reported sale price for securities listed on a national securities exchange or the official closing price on the NASDAQ National Market System, or in the case of over-the-counter securities not so listed, the last reported bid price. Debt securities (other than short-term obligations) are valued on the basis of valuations furnished by a pricing service, authorized by the Trustees, which determines valuations taking into account appropriate factors such as institutional-size trading in similar groups of securities, yield, quality, coupon rate, maturity, type of issue, trading characteristics and other market data. Short-term securities are valued at either amortized cost or at original cost plus accrued interest, whichever approximates current market value. Shares of other funds are valued at their net asset value as reported on each business day. Swaps are marked to market daily based upon values from third party vendors or market makers to the extent available or model prices. Valuations received from third party vendors are determined using various valuation systems and models based on the type of instrument. The underlying inputs and market data used in such models may include broker quotes, market indices and yield curves, counterparty information, foreign exchange rates and other market data. All other securities and other assets, including futures, options, swaps and debt securities for which the prices supplied by a pricing agent, or as noted above, are deemed by the Trustees not to be representative of market values, including restricted securities and securities for which no market quo tation is available, are valued at fair value in accordance with procedures approved by the Trustees.
61
Notes to Financial Statements (Continued)
Securities are typically valued on the basis of their readily available market quotations furnished by pricing services authorized by the Trustees. However, in certain cases, market quotations for a specific portfolio security are readily available, but the authorized pricing service may not provide a price for that security, or the price provided by such authorized pricing service is deemed unreliable by the investment adviser or sub-adviser. In such cases, market quotations provided by an established market maker for that security (i.e. broker quotes) may be used to value the security if the investment adviser has reason to believe such quotations are reasonably likely to be reliable.
In addition, valuation methods approved by the Trustees which are intended to reflect fair value may be used when pricing service information is not readily available, or is not deemed reliable by the investment adviser, or when a security's value is believed to have been materially affected by a significant event, such as a natural disaster, an economic event like a bankruptcy filing, or a substantial fluctuation in domestic or foreign markets, that has occurred after the close of the exchange or market on which the security is principally traded (for example, a foreign exchange or market). In such a case, a Fund's value for a security is likely to be different from the last quoted market price or pricing service information. In addition, a fair value pricing service is used to assist in the pricing of foreign securities held by the Trust. Due to the subjective and variable nature of fair value pricing, it is possible that the value determi ned for a particular asset may be materially different from the value realized upon such asset's sale.
Portfolio securities traded on more than one national securities exchange are valued at the last price on the business day as of which such value is being determined at the close of the exchange representing the principal market for such securities. All assets and liabilities expressed in foreign currencies are converted into U.S. dollars at the mean between the buying and selling rates of such currencies against U.S. dollars last quoted by any major bank. If such quotations are not available, the rate of exchange is determined in accordance with policies established by the Trustees.
The Funds adopted Financial Accounting Standards Board ("FASB") Statement of Financial Accounting Standards No. 157, "Fair Value Measurements" ("FAS 157"), effective January 1, 2008. In accordance with FAS 157, fair value is defined as the price that would be received to sell an asset or paid to transfer a liability in an orderly transaction between market participants at the measurement date. FAS 157 established a three-tier hierarchy to maximize the use of observable market data inputs and minimize the use of unobservable inputs and to establish classification of fair value measurements for disclosure purposes. Inputs refer broadly to the assumptions that market participants would use in pricing the asset or liability, including assumptions about risk, for example, the risk inherent in a particular valuation technique used to measure fair value (such as a pricing model) and/or the risk inherent in the inputs to the valuation technique. Inp uts may be observable or unobservable. Observable inputs are inputs that reflect the assumptions market participants would use in pricing the asset or liability and are developed based on market data obtained from sources independent of the reporting entity. Unobservable inputs are inputs that reflect the reporting entity's own assumptions about the assumptions market participants would use in pricing the asset or liability and are developed based on the best information available in the circumstances. The three-tier hierarchy of inputs is summarized in the three broad Levels listed below.
Level 1 – quoted prices (unadjusted) in active markets for identical investments
Level 2 – other significant observable inputs (including quoted prices for similar investments, interest rates, prepayment speeds, credit risk, etc.)
Level 3 – significant unobservable inputs (including the Fund's own assumptions in determining the fair value of investments)
Changes in valuation techniques may result in transfers in or out of an investment's assigned level within the hierarchy. The inputs or methodology used for valuing investments are not necessarily an indication of the risk associated with investing in those investments.
62
Notes to Financial Statements (Continued)
The following is the aggregate value by input level as of December 31, 2008 for the Funds' investments:
Asset Valuation Inputs
| | | Investments in Securities | |
| | | Level 1 -
Quoted Prices | | Level 2 - Other
Significant
Observable
Inputs | | Level 3 -
Significant
Unobservable
Inputs | | Total | |
| Large Cap Value Fund | | $ | 155,548,818 | | | $ | 17,327,713 | | | $ | 254,890 | | | $ | 173,131,421 | | |
| Equity Index Fund | | | 237,323,834 | | | | 4,955,598 | | | | - | | | | 242,279,432 | | |
| Growth Equity Fund | | | 10,374,895 | | | | 457,482 | | | | - | | | | 10,832,377 | | |
| NASDAQ-100 Fund | | | 5,476,110 | | | | 107,944 | | | | - | | | | 5,584,054 | | |
| Small Cap Growth Equity Fund | | | 155,496,747 | | | | 13,471,624 | | | | - | | | | 168,968,371 | | |
| Emerging Growth Fund | | | 9,714,912 | | | | 294,017 | | | | - | | | | 10,008,929 | | |
| | | Other Financial Instruments* | |
| | | Level 1 -
Quoted Prices | | Level 2 - Other
Significant
Observable
Inputs | | Level 3 -
Significant
Unobservable
Inputs | | Total | |
| Equity Index Fund | | $ | 160,627 | | | $ | - | | | $ | - | | | $ | 160,627 | | |
| NASDAQ-100 Fund | | | (391 | ) | | | - | | | | - | | | | (391 | ) | |
* Other financial instruments include futures.
Following is a reconciliation of investments for which significant unobservable inputs (Level 3) were used in determining value:
| | Investments in Securities | |
| | | Balance
as of
12/31/07 | | Accrued
discounts/
premiums | | Realized
gain/loss and
change in
unrealized
appreciation
(depreciation) | | Net
purchases/
sales | | Net
transfers
in and/or
out of
Level 3 | | Balance
as of
12/31/08 | | Net change in
unrealized
appreciation
(depreciation)
from
investments
still held as
of 12/31/08 | |
Large Cap
Value Fund | | $ | - | | | $ | 663 | | | $ | (96,197 | ) | | $ | 350,424 | | | $ | - | | | $ | 254,890 | | | $ | (96,197 | ) | |
Securities Lending
Each Fund may lend its securities to qualified brokers; however, securities lending cannot exceed 33% of the total assets of the Fund taken at current value. The loans are collateralized at all times with cash or securities with a market value at least equal to 100% of the market value of the securities on loan. The market value of the loaned securities is determined at the close of business of a Fund and any additional collateral is delivered to the Fund the next business day. As with other extensions of credit, the Funds may bear the risk of delay in recovery or even loss of rights in the collateral should the borrower of the securities fail financially. The Funds receive compensation for lending their securities.
The Funds had no securities on loan at December 31, 2008.
63
Notes to Financial Statements (Continued)
The Funds receive, as fees, a share of the income earned on investment of the cash collateral received for the loan of securities. For the year ended December 31, 2008, the Funds earned securities lending net income as follows:
| | | Securities
Lending Gross
Income | | Securities
Lending Fees
and Expenses | | Securities
Lending Net
Income | |
| Large Cap Value Fund | | $ | 96,290 | | | $ | 43,800 | | | $ | 52,490 | | |
| Equity Index Fund | | | 109,070 | | | | 86,579 | | | | 22,491 | | |
| Growth Equity Fund | | | 8,942 | | | | 7,951 | | | | 991 | | |
| Small Cap Growth Equity Fund | | | 568,029 | | | | 418,358 | | | | 149,671 | | |
| | | $ | 782,331 | | | $ | 556,688 | | | $ | 225,643 | | |
Repurchase Agreements
Each Fund may enter into repurchase agreements with certain banks and broker/dealers whereby a Fund acquires a security for cash and obtains a simultaneous commitment from the seller to repurchase the security at an agreed upon price and date. The Funds, through their custodian, take possession of the securities collateralizing the repurchase agreement. The collateral is marked to market daily to ensure that the market value of the underlying assets remains sufficient to protect the Funds in the event of default by the seller. Collateral for certain tri-party repurchase agreements is held at the counterparty's custodian in a segregated account for the benefit of the Funds and the counterparty. In connection with transactions in repurchase agreements , if the seller defaults and the value of the collateral declines or if the seller enters insolvency proceedings, realization of collateral by the Funds may be delayed or limited.
The Fund(s) had repurchase agreements as shown in the Portfolios of Investments at December 31, 2008.
Accounting for Investments Transactions
Investment transactions are accounted for on the trade date. Realized gains and losses on sales of investments (which may include proceeds received from litigation) and unrealized appreciation and depreciation of investments are computed by the specific identification cost method. Interest income, adjusted for amortization of discounts and premiums on debt securities, is earned from the settlement date and is recorded on the accrual basis. Dividend income is recorded on the ex-dividend date. Withholding taxes on foreign interest, dividends, and capital gains have been provided for in accordance with the applicable country's tax rules and rates. Foreign dividend income is recorded on the ex-dividend date or as soon as practicable af ter the Fund determines the existence of a dividend declaration after exercising reasonable due diligence. Distributions received on securities that represent a return of capital or capital gain are recorded as a reduction of cost of investments and/or as a realized gain.
Federal Income Tax
It is each Fund's intent to continue to comply with the provisions of subchapter M of the Internal Revenue Code of 1986, as amended (the "Code"), applicable to a regulated investment company. Under such provisions, the Funds will not be subject to federal income taxes on their ordinary income and net realized capital gains to the extent they are distributed or deemed to have been distributed to their shareholders. Therefore, no federal income tax provision is required.
Dividends and Distributions to Shareholders
Dividends from net investment income and distributions of any net realized capital gains of each Fund are declared and paid annually and at other times as may be required to satisfy tax or regulatory requirements. Distributions to shareholders are recorded on the ex-dividend date. Income and capital gain distributions are determined in accordance with income tax regulations, which may differ from generally accepted accounting principles. As a result, net investment income and net realized gain on investment transactions for a reporting period may differ significantly from distributions during such period.
64
Notes to Financial Statements (Continued)
Foreign Currency Translation
The books and records of the Funds are maintained in U.S. dollars. The market values of foreign currencies, foreign securities and other assets and liabilities denominated in foreign currencies are translated into U.S. dollars at the mean of the buying and selling rates of such currencies against the U.S. dollar at the end of each business day. Purchases and sales of foreign securities and income and expense items are translated at the rates of exchange prevailing on the respective dates of such transactions. The Funds do not isolate that portion of the results of operations arising from changes in the exchange rates from that portion arising from changes in the market prices of securities. Net realized foreign currency gains and losses resul ting from changes in exchange rates include foreign currency gains and losses between trade date and settlement date on investment securities transactions, foreign currency transactions and the difference between the amounts of dividends recorded on the books of the Funds and the amount actually received.
Financial Futures Contracts
A Fund may enter into futures contracts, including commodity futures contracts, stock index futures contracts, foreign currency futures contracts and fixed income futures contracts. These transactions are hedging strategies. They are designed to protect a Fund's current or intended investments from the effects of changes in exchange rates or market declines. They may also be used for other purposes, such as an efficient means of adjusting a Fund's exposure to certain markets; in an effort to enhance income; and as a cash management tool. Futures contracts are contracts for delayed delivery of securities or commodities at a specific future date and at a specific price or yield. Upon entering into a contract, the Funds deposit and maintain as co llateral such initial margin as required by the exchange on which the transaction is effected. Pursuant to the contract, the Fund agrees to receive from or pay to the broker an amount of cash equal to the daily fluctuation in value of the contract. Such receipts or payments are known as variation margin and are recorded by the Funds as unrealized gains or losses. When the contract is closed, each Fund records a realized gain or loss equal to the difference between the value of the contract at the time it was opened and the value at the time it was closed. Futures contracts are valued at the settlement price established each day by the board of trade or exchange on which they are traded. A Fund will incur brokerage fees when it purchases and sells futures contracts. Futures contracts entail risk of loss in portfolio value if the sub-adviser is incorrect in anticipating the direction of exchange rates or the securities markets.
A Fund may also purchase and write options on these futures contracts. This strategy also is intended to protect against declines in the values of portfolio securities or against increases in the costs of securities to be acquired. Like other options, options on futures contracts constitute only a partial hedge up to the amount of the premium, and due to transaction costs.
While these strategies will generally be used by a Fund for hedging purposes, there are risks. For example, the sub-adviser may incorrectly forecast the direction of exchange rates or of the underlying securities index or markets. When these transactions are unsuccessful, the Fund may experience losses. When a Fund enters into these transactions to increase portfolio value (i.e., other than for hedging purposes), there is a liquidity risk that no market will arise for resale and the Fund could also experience losses.
The Fund(s) listed in the following table had open futures contracts at December 31, 2008:
Number of
Contracts | | Type | | Expiration Date | | Notional
Contract
Value | | Net Unrealized
Appreciation
(Depreciation) | |
| Equity Index Fund | |
BUYS
114 | | S&P 500 E Mini Index | | 3/20/09 | | $ | 5,130,570 | | | $ | 160,627 | | |
| NASDAQ-100 Fund | |
BUYS
4 | | NASDAQ 100 E Mini Index | | 3/20/09 | | | 97,000 | | | $ | (391 | ) | |
65
Notes to Financial Statements (Continued)
Options
The Funds may engage in options transactions, such as writing covered put and call options on securities and purchasing put and call options on securities. These strategies are designed to increase a Fund's portfolio return, or to protect the value of the portfolio, by offsetting a decline in portfolio value through the options purchased. Writing options, however, can only constitute a partial hedge, up to the amount of the premium, and due to transaction costs.
The Funds may also write covered call and put options and purchase call and put options on stock indexes in order to increase portfolio income or to protect the Fund against declines in the value of portfolio securities. In addition, the Funds may also purchase and write options on foreign currencies to protect against declines in the dollar value of portfolio securities and against increases in the dollar cost of securities to be acquired.
By purchasing a put option, a Fund obtains the right (but not the obligation) to sell the instrument underlying the option at a fixed strike price. In return for this right, a Fund pays the current market price for the option (known as the option premium). Options have various types of underlying instruments, including specific securities, indexes of securities, indexes of security prices, indexes of interest rates, futures contracts and swap agreements. A Fund may terminate its position in a put option it has purchased by allowing it to expire or by exercising the option. A Fund may also close out a put option position by entering into an offsetting transaction, if a liquid market exists. If the option is allowed to expire, a Fund will lose the entire premium it paid. Premiums paid for purchasing options which expire are treated as realized losses. If a Fund exercises a put option on a security, it will sell the instrument underlying the op tion at the strike price. If a Fund exercises an option on an index, settlement is in cash and does not involve the actual sale of securities.
The buyer of a typical put option can expect to realize a gain if the price of the underlying instrument falls substantially. However, if the price of the instrument underlying the option does not fall enough to offset the cost of purchasing the option, a put buyer can expect to suffer a loss (limited to the amount of the premium paid, plus related transaction costs).
The features of call options are essentially the same as those of put options, except that the purchaser of a call option obtains the right to purchase, rather than sell, the instrument underlying the option at the option's strike price. A call buyer typically attempts to participate in potential price increases of the instrument underlying the option with risk limited to the cost of the option if security prices fall. At the same time, the buyer can expect to suffer a loss if security prices do not rise sufficiently to offset the cost of the option.
The Funds may also "write" put and call options. When a Fund writes a put option, it takes the opposite side of the transaction from the option's purchaser. In return for receipt of the premium, a Fund assumes the obligation to pay the strike price for the instrument underlying the option if the other party to the option chooses to exercise it. A Fund may seek to terminate its position in a put option it writes before exercise by purchasing an offsetting option in the market at its current price. If the market is not liquid for a put option a Fund has written, however, a Fund must continue to be prepared to pay the strike price while the option is outstanding, regardless of price changes, and must continue to post margin as discussed below.
If the price of the underlying instrument rises, a put writer would generally expect to profit, although its gain would be limited to the amount of the premium it received. If security prices remain the same over time, it is likely that the writer will also profit, because it should be able to close out the option at a lower price. If security prices fall, the put writer would expect to suffer a loss. This loss should be less than the loss from purchasing and holding the underlying instrument directly, however, because the premium received for writing the option should offset a portion of the decline.
66
Notes to Financial Statements (Continued)
Writing a call option obligates a Fund to sell or deliver the option's underlying instrument in return for the strike price upon exercise of the option. The characteristics of writing call options are similar to those of writing put options, except that writing calls generally is a profitable strategy if prices remain the same or fall. Through receipt of the option premium a call writer offsets part of the effect of a price increase. At the same time, because a call writer must be prepared to deliver the underlying instrument in return for the strike price, even if its current value is greater, a call writer gives up some ability to participate in security price increases.
The writer of an exchange traded put or call option on a security, an index of securities or a futures contract is required to deposit cash or securities or a letter of credit as margin and to make mark to market payments of variation margin as the position becomes unprofitable. When a Fund writes a call or put option, an amount equal to the premium received is recorded as a liability. Premiums received from writing options which expire are treated as realized gains. Premiums received from writing options which are exercised or closed are added to the proceeds or offset against the amount paid on the underlying investment to determine the realized gain or loss.
Exchange traded options are valued at the last sale price, or if no sales are reported, the last bid price for purchased options and the last ask price for written options. Options traded over-the-counter are valued using prices supplied by a primary pricing source chosen by the Trust.
The Fund(s) no had open written option contracts at December 31, 2008:
Transactions in written option contracts during the year ended December 31, 2008, were as follows:
| | | Number of
Contracts | | Premiums
Received | |
| Small Cap Growth Equity Fund | | | | | | | | | |
| Options outstanding at December 31, 2007 | | | - | | | $ | - | | |
| Options written | | | 458 | | | | 56,360 | | |
| Options terminated in closing purchase transactions | | | (458 | ) | | | (56,360 | ) | |
| Options outstanding at December 31, 2008 | | | - | | | $ | - | | |
Allocation of Operating Activity
In maintaining the records for the Funds, the income and expense accounts are allocated to each class of shares. Investment income, unrealized and realized gains or losses are prorated among the classes of shares based on the relative net assets of each. Expenses are allocated to each class of shares depending on the nature of the expenditures. Administration and service fees, if any, which are directly attributable to a class of shares, are charged to that class's operations. Expenses of the Fund not directly attributable to the operations of any class of shares or Fund are prorated among the Funds and classes to which the expense relates based on the relative net assets of each.
Foreign Securities
The Funds may also invest in foreign securities, subject to certain percentage restrictions. Investing in securities of foreign companies and foreign governments involves special risks and considerations not typically associated with investing in securities of U.S. companies and the U.S. Government. These risks include revaluation of currencies and future adverse political and economic developments. Moreover, securities of many foreign companies and foreign governments and their markets may be less liquid and their prices more volatile than those of securities of comparable U.S. companies and the U.S. Government.
67
Notes to Financial Statements (Continued)
Restricted Securities
Certain securities are illiquid and restricted as to resale. They have been valued in good faith under procedures established by the Trustees, taking into consideration such factors as the Trustees deem appropriate. The Funds generally bear the costs, if any, associated with the disposition of restricted securities. Aggregate cost and fair value of these securities held at December 31, 2008 were as follows:
| | | Aggregate
Cost | | Aggregate
Value | | Value as
Percentage of
Fund's Net Assets | |
| Large Cap Value Fund | | $ | 351,087 | | | $ | 254,890 | | | | 0.1 | % | |
3. Management Fees and Other Transactions
Investment Management Fees
Under agreements between the Trust and MassMutual on behalf of each Fund, MassMutual is responsible for providing investment management services for each Fund. In return for this service, MassMutual receives advisory fees quarterly, based upon each Fund's average daily net assets, at the following annual rates:
| Large Cap Value Fund | | 0.80% of the first $100 million, | |
| | | 0.75% of the next $400 million, | |
| | | 0.70% of any excess over $500 million | |
| Equity Index Fund | | 0.10% | |
| Growth Equity Fund | | 0.80% of the first $300 million, | |
| | | 0.77% of the next $300 million, | |
| | | 0.75% of the next $300 million, | |
| | | 0.72% of the next $600 million, | |
| | | 0.65% of any excess over $1.5 billion | |
| NASDAQ-100 Fund | | 0.45% of the first $200 million, | |
| | | 0.44% of the next $200 million, | |
| | | 0.42% of any excess over $400 million | |
| Small Cap Growth Equity Fund | | 1.075% of the first $200 million, | |
| | | 1.05% of the next $200 million, | |
| | | 1.025% of the next $600 million, | |
| | | 1.00% of any excess over $1 billion | |
| Emerging Growth Fund | | 1.05% of the first $200 million, | |
| | | 1.00% of the next $200 million, | |
| | | 0.95% of any excess over $400 million | |
MassMutual has entered into investment sub-advisory agreements with the following unaffiliated investment sub-advisers: Davis Selected Advisers, L.P. for the Large Cap Value Fund, Northern Trust Investments, N.A. for the Equity Index Fund and the NASDAQ-100 Fund, T. Rowe Price Associates, Inc. for the Growth Equity Fund, Essex Investment Management Company, LLC ("Essex") for a portion of the Emerging Growth Fund, Insight Capital Research & Management, Inc. ("Insight Capital") for a portion of the Emerging Growth Fund, Waddell & Reed Investment Management Company for a portion of the Small Cap Growth Equity Fund, and Wellington Management Company, LLP for a portion of the Small Cap Growth Equity Fund. Essex replaced Delaware Management Company ("DMC") as sub-adviser to the Emerging Growth Fund on September 10, 2008. MassMutual pays a sub-advisory fee to each of these sub-advisers based upon the aggregate net assets under management wh ich include (1) the average daily net assets of the specified Fund which it manages, and (2) the average daily net assets of all other funds or accounts of MassMutual or its affiliates for which the sub-adviser provides sub-advisory services and which have substantially the same investment objectives, policies and investment strategies.
68
Notes to Financial Statements (Continued)
The Funds' sub-advisory fees are paid out of the management fees previously disclosed above.
Administration Fees
For the Equity Index Fund, under a separate administrative and shareholder services agreement between the Fund and MassMutual, MassMutual provides certain administrative and shareholder services and bears some class specific administrative expenses. In return for these services, MassMutual receives an administrative services fee monthly, based upon the average daily net assets of the applicable class of shares of the Fund, at the following annual rates:
| Class I | | 0.30% of the first $100 million, | |
| | | 0.28% of the next $150 million, | |
| | | 0.26% of any excess over $250 million | |
| Class II | | 0.19% | |
| Class III | | up to 0.05% | |
| Service Class I | | 0.30% of the first $100 million, | |
| | | 0.28% of the next $150 million, | |
| | | 0.26% of any excess over $250 million | |
Distribution and Service Fees
MML Distributors, LLC (the "Distributor") acts as distributor to the Funds. Pursuant to a 12b-1 Plan adopted by the Funds, Service Class shares and Service Class I shares of the Funds pay an annual fee of 0.25% of the average daily net asset value of Service Class shares and Service Class I shares. This fee, or a portion thereof, is paid to: (i) the Distributor for services provided and expenses incurred by its connection with the distribution of Service Class shares and Service Class I shares of each Fund; and (ii) MassMutual for services provided and expenses incurred by it for purposes of maintaining or providing personal services to Service Class and Service Class I shareholders.
Expense Caps and Waivers
MassMutual has agreed to bear the expenses of the Funds (other than the management and administrative fees, interest, taxes, brokerage commissions, extraordinary litigation expenses and legal expenses, or other non-recurring or unusual expenses), based upon each Fund's average daily net assets, in excess of the following amounts:
| Large Cap Value Fund | | | | | | NASDAQ-100 Fund | | | | | |
|
| Initial Class* | | | 0.11 | % | | Initial Class# | | | 0.11 | % | |
|
| Equity Index Fund | | | | | | Service Class## | | | 0.11 | % | |
|
| Class I# | | | 0.05 | % | | Small Cap Growth Equity Fund | | | | | |
|
| Class II# | | | 0.05 | % | | Initial Class* | | | 0.11 | % | |
|
| Class III# | | | 0.05 | % | | Emerging Growth Fund | | | | | |
|
| Service Class I## | | | 0.05 | % | | Initial Class**# | | | 0.20 | % | |
|
| Growth Equity Fund | | | | | | Service Class## | | | 0.20 | % | |
|
| Initial Class# | | | 0.11 | % | | | | | | | |
|
| Service Class## | | | 0.11 | % | | | | | | | |
|
* Expense cap in effect through April 30, 2008.
** Prior to May 1, 2008, the expense cap was 0.11%.
# Expense cap in effect through April 30, 2009.
## Expense cap in effect through May 2, 2010.
In addition, MassMutual has agreed to waive certain administrative and shareholder service fees payable by the Equity Index Fund on account of Class II and Class III shares.
69
Notes to Financial Statements (Continued)
Rebated Brokerage Commissions
The Funds listed below have entered into agreements with certain brokers whereby the brokers will rebate, in cash, a portion of brokerage commissions. Rebated brokerage commissions are amounts earned by the Funds and are included with realized gain or loss on investment transactions presented in the Statement of Operations. For the year ended December 31, 2008, brokerage commissions rebated under these agreements were as follows:
| | | Rebated Commissions | |
| Large Cap Value Fund | | $ | 555 | | |
| Small Cap Growth Equity Fund | | | 42,215 | | |
| Emerging Growth Fund | | | 3,696 | | |
Deferred Compensation
Trustees of the Funds who are not employees of MassMutual or its subsidiaries may elect to defer receipt of their annual fees in accordance with terms of a Non-Qualified Deferred Compensation Plan. Amounts deferred shall accrue interest or earnings and shall be recorded on the Funds' books as other liabilities. For the year ended December 31, 2008, no significant amounts have been deferred.
Other
Certain officers and trustees of the Funds are also employees of MassMutual. The compensation of each trustee who is not an employee of MassMutual is borne by the Funds.
4. Purchases and Sales of Investments
Cost of purchases and proceeds from sales of investment securities (excluding short-term investments) for the year ended December 31, 2008, were as follows:
| | | Purchases | | Sales | |
| | | Long-Term
U.S. Government
Securities | | Other
Long-Term
Securities | | Long-Term
U.S. Government
Securities | | Other
Long-Term
Securities | |
| Large Cap Value Fund | | $ | - | | | $ | 48,457,556 | | | $ | - | | | $ | 50,180,899 | | |
| Equity Index Fund | | | - | | | | 15,744,722 | | | | - | | | | 31,646,039 | | |
| Growth Equity Fund | | | - | | | | 8,252,983 | | | | - | | | | 7,878,951 | | |
| NASDAQ-100 Fund | | | - | | | | 1,447,121 | | | | - | | | | 2,033,093 | | |
| Small Cap Growth Equity Fund | | | - | | | | 197,585,348 | | | | - | | | | 166,774,654 | | |
| Emerging Growth Fund | | | - | | | | 39,880,738 | | | | - | | | | 40,248,923 | | |
5. Capital Share Transactions
Changes in shares outstanding for each Fund were as follows:
| | | Year ended December 31, 2008 | | Year ended December 31, 2007 | |
| | | Shares | | Amount | | Shares | | Amount | |
| Large Cap Value Fund Initial Class | |
| Sold | | | 2,822,935 | | | $ | 29,821,461 | | | | 6,497,381 | | | $ | 86,609,563 | | |
| Issued as reinvestment of dividends | | | 24,108 | | | | 279,560 | | | | 213,910 | | | | 2,798,621 | | |
| Redeemed | | | (2,986,721 | ) | | | (32,256,804 | ) | | | (1,629,776 | ) | | | (21,686,747 | ) | |
| Net increase (decrease) | | | (139,678 | ) | | $ | (2,155,783 | ) | | | 5,081,515 | | | $ | 67,721,437 | | |
| Large Cap Value Fund Service Class* | |
| Sold | | | 611,646 | | | $ | 5,079,716 | | | | | | | | | | |
| Issued as reinvestment of dividends | | | 9 | | | | 110 | | | | | | | | | | |
| Redeemed | | | (9,254 | ) | | | (72,846 | ) | | | | | | | | | |
| Net increase (decrease) | | | 602,401 | | | $ | 5,006,980 | | | | | | | | | | |
| Equity Index Fund Class I | |
| Sold | | | 381,022 | | | $ | 5,697,991 | | | | 850,720 | | | $ | 15,507,009 | | |
| Issued as reinvestment of dividends | | | - | | | | - | | | | 76,140 | | | | 1,366,698 | | |
| Redeemed | | | (995,513 | ) | | | (15,099,089 | ) | | | (937,656 | ) | | | (17,129,074 | ) | |
| Net increase (decrease) | | | (614,491 | ) | | $ | (9,401,098 | ) | | | (10,796 | ) | | $ | (255,367 | ) | |
| Equity Index Fund Class II | |
| Sold | | | 1,216,762 | | | $ | 17,244,773 | | | | 731,064 | | | $ | 13,234,324 | | |
| Issued as reinvestment of dividends | | | - | | | | - | | | | 187,600 | | | | 3,365,535 | | |
| Redeemed | | | (1,836,130 | ) | | | (28,250,815 | ) | | | (833,012 | ) | | | (15,253,871 | ) | |
| Net increase (decrease) | | | (619,368 | ) | | $ | (11,006,042 | ) | | | 85,652 | | | $ | 1,345,988 | | |
70
Notes to Financial Statements (Continued)
| | | Year ended December 31, 2008 | | Year ended December 31, 2007 | |
| | | Shares | | Amount | | Shares | | Amount | |
| Equity Index Fund Class III | |
| Sold | | | 2,439 | | | $ | 30,939 | | | | 73,099 | | | $ | 1,359,253 | | |
| Issued as reinvestment of dividends | | | - | | | | - | | | | 126,712 | | | | 2,269,397 | | |
| Redeemed | | | (98,689 | ) | | | (1,502,774 | ) | | | (699,262 | ) | | | (12,799,108 | ) | |
| Net increase (decrease) | | | (96,250 | ) | | $ | (1,471,835 | ) | | | (499,451 | ) | | $ | (9,170,458 | ) | |
| Equity Index Fund Service Class I** | |
| Sold | | | 42,334 | | | $ | 510,104 | | | | | | | | | | |
| Issued as reinvestment of dividends | | | - | | | | - | | | | | | | | | | |
| Redeemed | | | (64 | ) | | | (713 | ) | | | | | | | | | |
| Net increase (decrease) | | | 42,270 | | | $ | 509,391 | | | | | | | | | | |
| Growth Equity Fund Initial Class | |
| Sold | | | 462,092 | | | $ | 2,830,428 | | | | 249,222 | | | $ | 1,919,253 | | |
| Issued as reinvestment of dividends | | | - | | | | - | | | | 12,541 | | | | 95,117 | | |
| Redeemed | | | (472,489 | ) | | | (2,891,034 | ) | | | (615,787 | ) | | | (4,705,618 | ) | |
| Net increase (decrease) | | | (10,397 | ) | | $ | (60,606 | ) | | | (354,024 | ) | | $ | (2,691,248 | ) | |
| Growth Equity Fund Service Class* | |
| Sold | | | 92,580 | | | $ | 433,458 | | | | | | | | | | |
| Issued as reinvestment of dividends | | | - | | | | - | | | | | | | | | | |
| Redeemed | | | (1,199 | ) | | | (6,494 | ) | | | | | | | | | |
| Net increase (decrease) | | | 91,381 | | | $ | 426,964 | | | | | | | | | | |
| NASDAQ-100 Fund Initial Class | |
| Sold | | | 537,644 | | | $ | 2,306,228 | | | | 644,122 | | | $ | 3,325,858 | | |
| Issued as reinvestment of dividends | | | 42 | | | | 204 | | | | 482 | | | | 2,524 | | |
| Redeemed | | | (768,994 | ) | | | (3,203,925 | ) | | | (585,438 | ) | | | (2,893,368 | ) | |
| Net increase (decrease) | | | (231,308 | ) | | $ | (897,493 | ) | | | 59,166 | | | $ | 435,014 | | |
| NASDAQ-100 Fund Service Class* | |
| Sold | | | 81,629 | | | $ | 296,248 | | | | | | | | | | |
| Issued as reinvestment of dividends | | | -+ | | | | 2 | | | | | | | | | | |
| Redeemed | | | (73 | ) | | | (222 | ) | | | | | | | | | |
| Net increase (decrease) | | | 81,556 | | | $ | 296,028 | | | | | | | | | | |
| Small Cap Growth Equity Fund Initial Class | |
| Sold | | | 4,631,114 | | | $ | 60,700,254 | | | | 4,265,842 | | | $ | 74,214,652 | | |
| Issued as reinvestment of dividends | | | - | | | | - | | | | 461,758 | | | | 7,946,612 | | |
| Redeemed | | | (2,251,146 | ) | | | (30,985,160 | ) | | | (1,304,245 | ) | | | (22,535,855 | ) | |
| Net increase (decrease) | | | 2,379,968 | | | $ | 29,715,094 | | | | 3,423,355 | | | $ | 59,625,409 | | |
| Small Cap Growth Equity Fund Service Class* | |
| Sold | | | 81,253 | | | $ | 856,222 | | | | | | | | | | |
| Issued as reinvestment of dividends | | | - | | | | - | | | | | | | | | | |
| Redeemed | | | (1,717 | ) | | | (17,610 | ) | | | | | | | | | |
| Net increase (decrease) | | | 79,536 | | | $ | 838,612 | | | | | | | | | | |
| Emerging Growth Fund Initial Class | |
| Sold | | | 470,089 | | | $ | 2,909,978 | | | | 827,138 | | | $ | 6,254,056 | | |
| Issued as reinvestment of dividends | | | - | | | | - | | | | - | | | | - | | |
| Redeemed | | | (727,718 | ) | | | (4,442,924 | ) | | | (612,712 | ) | | | (4,275,459 | ) | |
| Net increase (decrease) | | | (257,629 | ) | | $ | (1,532,946 | ) | | | 214,426 | | | $ | 1,978,597 | | |
| Emerging Growth Fund Service Class* | |
| Sold | | | 42,413 | | | $ | 228,078 | | | | | | | | | | |
| Issued as reinvestment of dividends | | | - | | | | - | | | | | | | | | | |
| Redeemed | | | (413 | ) | | | (1,759 | ) | | | | | | | | | |
| Net increase (decrease) | | | 42,000 | | | $ | 226,319 | | | | | | | | | | |
* Service Class commenced operations on August 15, 2008.
** Service Class I commenced operations on August 15, 2008.
+ Amount rounds to less than 0.5 shares.
71
Notes to Financial Statements (Continued)
6. Federal Income Tax Information
At December 31, 2008, the cost of securities and the unrealized appreciation (depreciation) in the value of investments owned by the Funds, as computed on a federal income tax basis, were as follows:
| | | Federal
Income Tax
Cost | | Tax Basis
Unrealized
Appreciation | | Tax Basis
Unrealized
Depreciation | | Net Unrealized
Appreciation
(Depreciation) | |
| Large Cap Value Fund | | $ | 231,596,626 | | | $ | 9,909,678 | | | $ | (68,374,883 | ) | | $ | (58,465,205 | ) | |
| Equity Index Fund | | | 298,765,898 | | | | 38,509,492 | | | | (94,995,958 | ) | | | (56,486,466 | ) | |
| Growth Equity Fund | | | 15,198,855 | | | | 130,051 | | | | (4,496,529 | ) | | | (4,366,478 | ) | |
| NASDAQ-100 Fund | | | 7,097,548 | | | | 522,688 | | | | (2,036,182 | ) | | | (1,513,494 | ) | |
| Small Cap Growth Equity Fund | | | 217,595,459 | | | | 6,040,655 | | | | (54,667,743 | ) | | | (48,627,088 | ) | |
| Emerging Growth Fund | | | 11,869,902 | | | | 499,983 | | | | (2,360,956 | ) | | | (1,860,973 | ) | |
Net capital loss carryforwards may be applied against any net realized taxable gains in each succeeding year, or until their respective expiration dates, whichever occurs first. At December 31, 2008, the following Fund(s) had available, for federal income tax purposes, unused capital losses:
| | | Expiring
2009 | | Expiring
2010 | | Expiring
2011 | | Expiring
2012 | | Expiring
2013 | | Expiring
2016 | |
| Large Cap Value Fund | | $ | - | | | $ | - | | | $ | - | | | $ | - | | | $ | - | | | $ | 7,547,813 | | |
| Equity Index Fund | | | - | | | | - | | | | - | | | | - | | | | 2,636,392 | | | | 2,187,741 | | |
| Growth Equity Fund | | | 14,299,034 | | | | 7,953,799 | | | | - | | | | - | | | | - | | | | 1,968,810 | | |
| NASDAQ-100 Fund | | | - | | | | 4,489,822 | | | | 2,362,711 | | | | 1,300,985 | | | | - | | | | - | | |
| Small Cap Growth Equity Fund | | | - | | | | - | | | | - | | | | - | | | | - | | | | 6,781,090 | | |
| Emerging Growth Fund | | | 1,010,053 | | | | 3,402,428 | | | | - | | | | - | | | | - | | | | 3,006,901 | | |
The following Fund(s) elected to defer to January 1, 2009, post-October capital losses:
| | | Amount | |
| Large Cap Value Fund | | $ | 1,921,589 | | |
| Equity Index Fund | | | 383,874 | | |
| Growth Equity Fund | | | 864,112 | | |
| NASDAQ-100 Fund | | | 375,829 | | |
| Small Cap Growth Equity Fund | | | 41,366,078 | | |
| Emerging Growth Fund | | | 1,141,739 | | |
Accounting principles generally accepted in the United States of America require that only distributions in excess of tax basis earnings and profits be reported in the financial statements as a return of capital.
The tax character of distributions (including capital gain dividends, if any, designated pursuant to Section 852 of the Code) paid during the year ended December 31, 2008, was as follows:
| | | Ordinary
Income | | Long Term
Capital Gain | | Return of
Capital | |
| Large Cap Value Fund | | $ | 3 | | | $ | 279,667 | | | $ | - | | |
| NASDAQ-100 Fund | | | 206 | | | | - | | | | - | | |
72
Notes to Financial Statements (Continued)
The tax character of distributions (including capital gain dividends, if any, designated pursuant to Section 852 of the Code) paid during the year ended December 31, 2007, was as follows:
| | | Ordinary
Income | | Long Term
Capital Gain | | Return of
Capital | |
| Large Cap Value Fund | | $ | 2,777,747 | | | $ | 20,874 | | | $ | - | | |
| Equity Index Fund | | | 7,001,630 | | | | - | | | | - | | |
| Growth Equity Fund | | | 95,117 | | | | - | | | | - | | |
| NASDAQ-100 Fund | | | 2,524 | | | | - | | | | - | | |
| Small Cap Growth Equity Fund | | | 1,025,751 | | | | 6,920,861 | | | | - | | |
Capital accounts within financial statements are periodically adjusted for permanent differences between book and tax accounting. These adjustments have no impact on net assets or the results of operations. Temporary book and tax accounting differences will reverse in subsequent periods. At December 31, 2008, temporary book and tax accounting differences were primarily attributable to investments in passive foreign investment companies and the deferral of wash sale losses.
At December 31, 2008, the components of distributable earnings on a tax basis were as follows:
| | | Undistributed
Ordinary
Income | | Long Term
Capital Gain
(Capital Loss
Carryover) | | Other
Temporary
Differences | | Unrealized
Appreciation
(Depreciation) | |
| Large Cap Value Fund | | $ | 2,220,059 | | | $ | (7,547,813 | ) | | $ | (1,968,876 | ) | | $ | (58,464,583 | ) | |
| Equity Index Fund | | | 6,712,389 | | | | (4,824,133 | ) | | | (510,418 | ) | | | (56,486,466 | ) | |
| Growth Equity Fund | | | 8,882 | | | | (24,221,643 | ) | | | (872,780 | ) | | | (4,366,478 | ) | |
| NASDAQ-100 Fund | | | 184 | | | | (8,153,518 | ) | | | (379,753 | ) | | | (1,513,887 | ) | |
| Small Cap Growth Equity Fund | | | 14,742,778 | | | | 7,959,503 | | | | (41,404,452 | ) | | | (48,633,759 | ) | |
| Emerging Growth Fund | | | - | | | | (7,419,382 | ) | | | (1,147,307 | ) | | | (1,860,973 | ) | |
During the year ended December 31, 2008, the following amounts were reclassified due to permanent differences between book and tax accounting:
| | | Paid-in
Capital | | Accumulated
Net Realized
Gain (Loss) on
Investments | | Undistributed
Net Investment
Income (Loss) | |
| Large Cap Value Fund | | $ | 27 | | | $ | 29,625 | | | $ | (29,652 | ) | |
| Equity Index Fund | | | 10,080 | | | | 83,398 | | | | (93,478 | ) | |
| Growth Equity Fund | | | 74 | | | | 5,339 | | | | (5,413 | ) | |
| NASDAQ-100 Fund | | | (1 | ) | | | 497 | | | | (496 | ) | |
| Small Cap Growth Equity Fund | | | (128,465 | ) | | | (9,831 | ) | | | 138,296 | | |
| Emerging Growth Fund | | | (131,774 | ) | | | (470 | ) | | | 132,244 | | |
The Funds are subject to the provisions of FASB Interpretation No. 48 ("FIN 48") "Accounting for Uncertainty in Income Taxes – an interpretation of FASB Statement No. 109". FIN 48 sets forth a minimum threshold for financial statement recognition of the benefit of a tax position taken or expected to be taken in a tax return. The Funds did not have any unrecognized tax benefits at December 31, 2008, nor were there any increases or decreases in unrecognized tax benefits for the year then ended. The Funds recognize interest and penalties, if any, related to unrecognized tax benefits as an income tax expense in the Statements of Operations. During the year ended December 31, 2008, the Funds did not incur any such interest or penalties. The Funds are subject to examination by U.S. federal and state tax authorities for returns filed for the prior three fiscal years. Foreign taxes are provided for based on the Funds' understanding of the tax r ules and rates that exist in the foreign markets in which they invest.
73
Notes to Financial Statements (Continued)
7. Indemnifications
Under the Funds' organizational documents, current and former Trustees and Officers are provided with a limited indemnification against liabilities arising in connection with the performance of their duties to the Funds, and shareholders are indemnified against personal liability for obligations of the Funds. In the normal course of business, the Funds may also enter into contracts that provide general indemnifications. The Funds' maximum exposure under these arrangements is unknown as this would be dependent on future claims that may be made against the Funds. The risk of material loss from such claims is considered remote.
8. New Accounting Pronouncements
In March 2008, the FASB issued Statement of Financial Accounting Standards No. 161, "Disclosures about Derivative Instruments and Hedging Activities" ("SFAS 161"). SFAS 161 is effective for fiscal years and interim periods beginning after November 15, 2008. SFAS 161 requires enhanced disclosures about the Funds' use of, and accounting for, derivative instruments and the effect on the results of each Fund's operations and financial position. Management is currently evaluating the impact the adoption of SFAS 161 will have on the Funds' financial statement disclosures.
9. Proxy Voting (Unaudited)
A description of the policies and procedures that each Fund's investment adviser and sub-advisers use to vote proxies relating to the Fund's portfolio securities is available, without charge, upon request, by calling 1-888-309-3539, and on the Securities and Exchange Commission's website at http://www.sec.gov.
Information regarding how the Funds voted proxies relating to portfolio securities during the most recent 12-month period ended June 30 is available, without charge, upon request, on the MassMutual website at http://www.massmutual.com and on the Securities and Exchange Commission's website at http://www.sec.gov.
10. Quarterly Reporting (Unaudited)
The Funds file their complete schedule of portfolio holdings with the SEC for the first and third quarters of each fiscal year on Form N-Q. The Funds' Forms N-Q are available on the SEC website at http://www.sec.gov. The Funds' Forms N-Q may be reviewed and copied at the SEC's Public Reference Room in Washington D.C. Information on the operation of the SEC's Public Reference Room may be obtained by calling 1-800-SEC-0330.
11. Trustees' Approval of Investment Advisory Contracts (Unaudited)
At a meeting held on August 12, 2008, the Trustees, including the Trustees who are not "interested persons" (as such term is defined in the 1940 Act) of the Trust, MassMutual or Sub-Advisers (the "Independent Trustees"), approved the termination of the existing Sub-Advisory Agreement ("Prior Sub-Advisory Agreement") with Delaware Management Company ("DMC") as co-sub-adviser for the Emerging Growth Fund and voted to approve a new Sub-Advisory Agreement ("New Sub-Advisory Agreement") with Essex Investment Management Company, LLC ("Essex").
After arriving at a decision to replace DMC as co-sub-adviser for the Emerging Growth Fund, the Trustees determined that it would be appropriate to find another sub-adviser that could be expected to produce more consistent returns and better complement the Fund's other Sub-Adviser, Insight Capital Research & Management, Inc. After careful consideration, the Trustees determined that Essex's successful and consistent application of its approach to investing in emerging growth companies provided the best opportunity for the Fund.
In approving the New Sub-Advisory Agreement, the Trustees discussed with representatives of MassMutual ("Management") and considered a wide range of information about, among other things: (i) Essex and its personnel with responsibilities for providing services to the Fund; (ii) the terms of the New Sub-Advisory Agreement; (iii) the scope and quality of services that Essex will provide under the New Sub-Advisory Agreement; (iv) the historical investment performance track record of Essex; (v) the fees payable to Essex by MassMutual and the effect of such fees on the profitability to MassMutual; and (vi) Essex's practices regarding the selection and compensation of brokers and dealers that execute portfolio transactions for the Fund, and the broker's and dealer's provision of brokerage and research services to Essex.
74
Notes to Financial Statements (Continued)
Based on the foregoing, the Trustees concluded that (i) overall, the Trustees were satisfied with the nature, extent and quality of services expected to be provided under the New Sub-Advisory Agreement; (ii) MassMutual's level of profitability from its relationship to the Fund was not excessive and that the sub-advisory fee amount under the New Sub-Advisory Agreement was fair and reasonable; (iii) the investment processes, research capabilities and philosophies of Essex would be well suited to the Fund given its investment objectives and policies; and (iv) the terms of the New Sub-Advisory Agreement were fair and reasonable with respect to the Fund and were in the best interest of the Fund's shareholders. After carefully considering the information summarized above, the Trustees, including the Independent Trustees voting separately, unanimously voted to approve the New Sub-Advisory Agreement.
Prior to the vote being taken to approve the New Sub-Advisory Agreement, the Independent Trustees met separately in executive session to discuss the appropriateness of the contract. In their deliberations with respect to these matters, the Independent Trustees weighed the foregoing matters in light of the advice given to them by their independent legal counsel as to the law applicable to the review of investment advisory contracts. In arriving at a decision, the Trustees, including the Independent Trustees, did not identify any single matter as all-important or controlling. The foregoing summary does not detail all of the matters considered.
The New Sub-Advisory Agreement took effect on September 10, 2008.
At their meeting on August 12, 2008, the Trustees, including the Independent Trustees, also approved an amended Sub-Advisory Agreement ("Amended Sub-Advisory Agreement") with Waddell & Reed Investment Management Company ("Waddell & Reed") with respect to the portion of the Small Cap Growth Equity Fund managed by Waddell & Reed. Under the Amended Sub-Advisory Agreement, the investment sub-advisory fee paid to Waddell & Reed would be slightly reduced.
In approving the Amended Sub-Advisory Agreement, the Trustees discussed with Management and considered the fees payable to Waddell & Reed by MassMutual and the effect of such fees on the profitability to MassMutual. The Trustees concluded that MassMutual's level of profitability from its relationship to the Fund was not excessive and that the sub-advisory fee amount under the Amended Sub-Advisory Agreement was fair and reasonable. After carefully considering the information summarized above, the Trustees, including the Independent Trustees voting separately, unanimously voted to approve the Amended Sub-Advisory Agreement.
Prior to the vote being taken to approve the Amended Sub-Advisory Agreement, the Independent Trustees met separately in executive session to discuss the appropriateness of the contract. In their deliberations with respect to these matters, the Independent Trustees weighed the foregoing matters in light of the advice given to them by their independent legal counsel as to the law applicable to the review of investment advisory contracts. In arriving at a decision, the Trustees, including the Independent Trustees, did not identify any single matter as all-important or controlling. The foregoing summary does not detail all of the matters considered.
The Amended Sub-Advisory Agreement was effective retroactive to July 1, 2008.
12. Special Meeting of Shareholders (Unaudited)
A Special Meeting of Shareholders of the Trust was held on August 15, 2008. Notice of the meeting, and a Proxy Statement, were distributed on or about July 14, 2008 to shareholders of record as of June 10, 2008. The results of the vote on the matters submitted to shareholders at the Special Meeting are as follows:
(1) To elect Richard H. Ayers, Allan W. Blair, Mary E. Boland, Richard W. Greene, R. Alan Hunter, Jr., Robert E. Joyal, F. William Marshall, Jr. and Elaine A. Sarsynski as Trustees for an indefinite term of office.*
75
Notes to Financial Statements (Continued)
| Proposal 1, | | | | Shares | | Shares For | | % | | Withhold | | % | |
| Election of Trustees: | | Richard H. Ayers | | | 392,658,693.506 | | | | 375,395,173.010 | | | | 95.603 | | | | 17,263,520.496 | | | | 4.397 | | |
|
| | | Allan W. Blair | | | 392,658,693.506 | | | | 375,756,833.774 | | | | 95.696 | | | | 16,901,859.732 | | | | 4.304 | | |
|
| | | Mary E. Boland | | | 392,658,693.506 | | | | 374,877,132.116 | | | | 95.471 | | | | 17,781,561.390 | | | | 4.529 | | |
|
| | | Richard W. Greene | | | 392,658,693.506 | | | | 375,357,324.809 | | | | 95.594 | | | | 17,301,368.697 | | | | 4.406 | | |
|
| | | R. Alan Hunter, Jr. | | | 392,658,693.506 | | | | 375,640,324.701 | | | | 95.666 | | | | 17,018,368.805 | | | | 4.334 | | |
|
| | | Robert E. Joyal | | | 392,658,693.506 | | | | 375,863,032.236 | | | | 95.723 | | | | 16,795,661.270 | | | | 4.277 | | |
|
| | | F. William Marshall, Jr. | | | 392,658,693.506 | | | | 375,250,843.035 | | | | 95.567 | | | | 17,407,850.471 | | | | 4.433 | | |
|
| | | Elaine A. Sarsynski | | | 392,658,693.506 | | | | 375,505,430.568 | | | | 95.632 | | | | 17,153,262.938 | | | | 4.368 | | |
|
* Denotes Trust-wide proposal and voting results.
(2) To approve an Amendment to the Agreement and Declaration of Trust of the Trust to permit each Fund to issue additional classes of shares.
| | | Shares | | Shares For | | % | | Against | | % | | Abstain | | % | |
| Proposal 2: | | | | | | | | | | | | | | | |
| Large Cap Value Fund | | | 21,874,156.405 | | | | 19,657,347.125 | | | | 89.866 | | | | 1,636,680.932 | | | | 7.482 | | | | 580,128.348 | | | | 2.652 | | |
|
| Growth Equity Fund | | | 2,364,119.888 | | | | 2,105,762.485 | | | | 89.072 | | | | 237,787.531 | | | | 10.058 | | | | 20,569.872 | | | | 0.870 | | |
|
| NASDAQ-100 Fund | | | 1,888,793.524 | | | | 1,751,915.704 | | | | 92.753 | | | | 83,118.148 | | | | 4.401 | | | | 53,759.672 | | | | 2.846 | | |
|
Small Cap Growth
Equity Fund | | | 15,197,313.794 | | | | 13,990,303.897 | | | | 92.058 | | | | 872,312.801 | | | | 5.740 | | | | 334,697.096 | | | | 2.202 | | |
|
| Emerging Growth Fund | | | 2,455,548.324 | | | | 2,153,005.509 | | | | 87.679 | | | | 253,700.449 | | | | 10.332 | | | | 48,842.366 | | | | 1.989 | | |
|
(3) To approve an Amendment to the Agreement and Declaration of Trust of the Trust to allow the Board of Trustees to authorize fund mergers without shareholder approval.
| | | Shares | | Shares For | | % | | Against | | % | | Abstain | | % | |
| Proposal 3: | | | | | | | | | | | | | | | |
| Large Cap Value Fund | | | 21,874,156.405 | | | | 17,978,526.349 | | | | 82.191 | | | | 3,248,264.917 | | | | 14.850 | | | | 647,365.139 | | | | 2.959 | | |
|
| Equity Index Fund | | | 21,971,687.552 | | | | 18,288,294.282 | | | | 83.236 | | | | 2,986,191.322 | | | | 13.591 | | | | 697,201.948 | | | | 3.173 | | |
|
| Growth Equity Fund | | | 2,364,119.888 | | | | 1,868,027.333 | | | | 79.016 | | | | 445,202.585 | | | | 18.831 | | | | 50,889.970 | | | | 2.153 | | |
|
| NASDAQ-100 Fund | | | 1,888,793.524 | | | | 1,580,088.896 | | | | 83.656 | | | | 260,123.348 | | | | 13.772 | | | | 48,581.280 | | | | 2.572 | | |
|
Small Cap Growth
Equity Fund | | | 15,197,313.794 | | | | 12,918,905.089 | | | | 85.008 | | | | 1,886,009.360 | | | | 12.410 | | | | 392,399.345 | | | | 2.582 | | |
|
| Emerging Growth Fund | | | 2,455,548.324 | | | | 2,057,383.428 | | | | 83.785 | | | | 365,873.403 | | | | 14.900 | | | | 32,291.493 | | | | 1.315 | | |
|
76
Report of Independent Registered Public Accounting Firm
To the Board of Trustees of MML Series Investment Fund and Shareholders of MML Large Cap Value Fund, MML Equity Index Fund, MML Growth Equity Fund, MML NASDAQ-100 Fund, MML Small Cap Growth Equity Fund and MML Emerging Growth Fund:
We have audited the accompanying statements of assets and liabilities, including the portfolios of investments, of MML Large Cap Value Fund, MML Equity Index Fund, MML Growth Equity Fund, MML NASDAQ-100 Fund, MML Small Cap Growth Equity Fund and MML Emerging Growth Fund (collectively the "Funds"), six of the funds comprising the MML Series Investment Fund (the "MML Trust"), as of December 31, 2008, and the related statements of operations for the year then ended, the statements of changes in net assets for each of the two years in the period then ended, and the financial highlights for each of the five years in the period then ended. These financial statements and financial highlights are the responsibility of the MML Trust's management. Our responsibility is to express an opinion on these financial statements and financial highlights based on our audits.
We conducted our audits in accordance with the standards of the Public Company Accounting Oversight Board (United States). Those standards require that we plan and perform the audit to obtain reasonable assurance about whether the financial statements and financial highlights are free of material misstatement. The MML Trust is not required to have, nor were we engaged to perform, an audit of its internal control over financial reporting. Our audits include consideration of internal control over financial reporting as a basis for designing audit procedures that are appropriate in the circumstances, but not for the purpose of expressing an opinion of the effectiveness of the MML Trust's internal control over financial reporting. Accordingly, we express no such opinion. An audit also includes examining, on a test basis, evidence supporting the amounts and disclosures in the financial statements, assessing the accounting principles used and sign ificant estimates made by management, as well as evaluating the overall financial statement presentation. Our procedures include confirmation of securities owned as of December 31, 2008, by correspondence with the custodian and brokers; where replies were not received from brokers, we performed other auditing procedures. We believe that our audits provide a reasonable basis for our opinion.
In our opinion, the financial statements and financial highlights referred to above present fairly, in all material respects, the financial position of each of the Funds as of December 31, 2008, the results of their operations for the year then ended, the changes in their net assets for each of the two years in the period then ended, and the financial highlights for each of the five years in the period then ended, in conformity with accounting principles generally accepted in the United States of America.

Boston, Massachusetts
February 20, 2009
77
Trustees and Officers (Unaudited)
The following table lists the Trust's Trustees and Officers as of December 31, 2008; their address and age; their position with the Trust; the length of time holding that position with the Trust; their principal occupation(s) during the past five years; the number of portfolios in the fund complex they oversee; and other directorships they hold in companies subject to registration or reporting requirements of the Securities Exchange Act of 1934 (generally called "public companies") or in registered investment companies. The Trust's Statement of Additional Information includes additional information about the Trust's Trustees and is available, without charge, upon request by calling 1-888-309-3539 or by writing MML Funds, c/o Massachusetts Mutual Life Insurance Company, 1295 State Street, Springfield, Massachusetts 01111-0001, Attention: Retirement Services Marketing.
Disinterested
Trustees
| | Name, Address*,
and Age | | Position(s)
Held with
Trust | | Term
of Office**
and
Length
of Time
Served | | Principal
Occupation(s) During
Past 5 Years | | Number of
Portfolios in
Fund
Complex
Overseen
by Trustee | | Other
Directorships
Held by Trustee | |
| | | Richard W. Greene
Age: 73 | | Chairman
Trustee | | Since
2005
Since
1999 | | Retired. | | | 57 | | | Chairman (since 2005), Trustee (since 1996), MassMutual Select Funds (open-end investment company). | |
|
| | | Richard H. Ayers
Age: 66 | | Trustee | | Since
1999 | | Retired. | | | 57 | | | Director (since 2008), Celera Corporation; Trustee (since 1996), MassMutual Select Funds (open-end investment company). | |
|
| | | Allan W. Blair
Age: 60 | | Trustee | | Since
2003 | | President and Chief Executive Officer (since 1996), Economic Development Council of Western Massachusetts; President and Chief Executive Officer (1993-2006), Westmass Area Development Corporation; President and Chief Executive Officer (since 1984), Westover Metropolitan Development Corporation. | | | 57 | | | Trustee (since 2003), MassMutual Select Funds (open-end investment company). | |
|
| | | Mary E. Boland
Age: 69 | | Trustee | | Since
1973 | | Attorney-at-Law (since 2004); Attorney-at-Law (1965-2004), Egan, Flanagan and Cohen, P.C. (law firm), Springfield, MA. | | | 57 | | | Trustee (since 1994), MassMutual Select Funds (open-end investment company). | |
|
| | | R. Alan Hunter, Jr.
Age: 62 | | Trustee | | Since
2003 | | Retired. | | | 57 | | | Director (since 2007), Actuant Corporation; Trustee (since 2003), MassMutual Select Funds (open-end investment company). | |
|
| | | F. William Marshall, Jr.
Age: 66 | | Trustee | | Since
1996 | | Consultant (since 1999). | | | 98 | *** | | Trustee (since 2000), Board II Oppenheimer Funds; Trustee (since 1996), MassMutual Select Funds (open-end investment company). | |
|
78
Trustees and Officers (Unaudited) (Continued)
Interested
Trustees
| | Name, Address*,
and Age | | Position(s)
Held with
Trust | | Term
of Office**
and
Length
of Time
Served | | Principal
Occupation(s) During
Past 5 Years | | Number of
Portfolios in
Fund
Complex
Overseen
by Trustee | | Other Directorships
Held by Trustee | |
| | | Robert E. Joyal^
Age: 63 | | Trustee | | Since
2003 | | Retired; President (2001-2003), Managing Director (2000-2001) and Executive Director (1999-2000), David L. Babson & Company Inc. | | | 59 | ^^ | | Trustee (since 2003), President (1999-2003), MassMutual Corporate Investors (closed-end investment company); Director (since 2003), Pemco Aviation Group, Inc.; Trustee (since 2003), President (1999-2003), MassMutual Participation Investors (closed-end investment company); Vice Chairman (2005-2007), Trustee (since 2003), MassMutual Select Funds (open-end investment company); Director (since 2006), Jefferies Group, Inc. (investment bank); Director (since 2007), Scottish Re. Group Ltd. | |
|
| | | Elaine A. Sarsynski^^^
Age: 53 | | Trustee | | Since
2008 | | Executive Vice President (since 2005), MassMutual; Managing Director (2005), Babson Capital Management LLC; Chief Executive Officer (2001-2005), Town of Suffield, Connecticut. | | | 57 | | | Trustee (since 2008), MassMutual Select Funds (open-end investment company). | |
|
79
Trustees and Officers (Unaudited) (Continued)
Principal Officers
who are Not
Trustees
| | Name, Address*,
and Age | | Position(s)
Held with
Trust | | Term
of Office#
and
Length
of Time
Served | | Principal
Occupation(s) During
Past 5 Years | | Number of
Portfolios in
Fund
Complex
Overseen
by Officer | |
| | | Richard J. Byrne
Age: 46 | | President | | Since
2007 | | Vice President (since 2007), Assistant Vice President (2003-2007), MassMutual; President (since 2007), MML Series Investment Fund II (open-end investment company). | | | 37 | | |
|
| | | Nicholas H. Palmerino
Age: 43 | | Chief Financial Officer and Treasurer | | Since
2006 | | Assistant Vice President (since 2006), MassMutual; Vice President (2006), Consultant (2005-2006), JPMorgan Chase Worldwide Securities Services; Senior Vice President (2003-2004), CDC IXIS Asset Management Services, Inc. and CDC IXIS Asset Management Advisers, L.P.; Vice President (1996-2003), Loomis Sayles & Company, L.P.; Chief Financial Officer and Treasurer (since 2006), MassMutual Select Funds (open-end investment company); Chief Financial Officer and Treasurer (since 2006), MassMutual Premier Funds (open-end investment company); Chief Financial Officer and Treasurer (since 2006), MML Series Investment Fund II (open-end investment company). | | | 91 | | |
|
| | | Andrew M. Goldberg
Age: 42 | | Vice President, Secretary and Chief Legal Officer
Assistant Secretary | | Since
2008
(2001-
2008) | | Assistant Vice President and Counsel (since 2004), Counsel (2001-2004), MassMutual; Vice President, Secretary and Chief Legal Officer (since 2008), Assistant Secretary (2001-2008), MassMutual Select Funds (open-end investment company); Vice President, Clerk and Chief Legal Officer (since 2008), Assistant Clerk (2004-2008), MassMutual Premier Funds (open-end investment company); Vice President, Clerk and Chief Legal Officer (since 2008), Assistant Clerk (2005-2008), MML Series Investment Fund II (open-end investment company). | | | 91 | | |
|
| | | Philip S. Wellman
Age: 44 | | Vice President and Chief Compliance Officer | | Since
2007 | | Vice President, Compliance (since 2007), Assistant Vice President and Associate General Counsel (2006-2007), MassMutual; Director, Office of General Counsel (2005-2006), Merrill Lynch, Pierce, Fenner & Smith Incorporated; Senior Vice President and Assistant General Counsel (2000-2006), Advest, Inc.; Vice President and Chief Compliance Officer (since 2007), MassMutual Select Funds (open-end investment company); Vice President and Chief Compliance Officer (since 2007), MassMutual Premier Funds (open-end investment company); Vice President and Chief Compliance Officer (since 2007), MML Series Investment Fund II (open-end investment company). | | | 91 | | |
|
| | | Stephen J. Brunette
Age: 38 | | Vice President | | Since
2007 | | Assistant Vice President (since 2007), Director (2006-2007), Investment Consultant (2003-2006), MassMutual; Vice President (since 2007), MML Series Investment Fund II (open-end investment company). | | | 37 | | |
|
80
Trustees and Officers (Unaudited) (Continued)
| | Name, Address*,
and Age | | Position(s)
Held with
Trust | | Term
of Office#
and
Length
of Time
Served | | Principal
Occupation(s) During
Past 5 Years | | Number of
Portfolios in
Fund
Complex
Overseen
by Officer | |
| | | John E. Deitelbaum
Age: 40 | | Vice President
Secretary and Chief Legal Officer | | Since
2006
(2006-2008) | | Corporate Vice President and Associate General Counsel (since 2007), Vice President and Associate General Counsel (2006-2007), Second Vice President and Associate General Counsel (2000-2006), MassMutual; Vice President (since 2006), Secretary and Chief Legal Officer (2006-2008), MassMutual Select Funds (open-end investment company); Vice President (since 2006), Clerk and Chief Legal Officer (2006-2008), MassMutual Premier Funds (open-end investment company); Vice President (since 2006), Clerk and Chief Legal Officer (2006-2008), MML Series Investment Fund II (open-end investment company). | | | 91 | | |
|
| | | Eric H. Wietsma
Age: 42 | | Vice President | | Since
2006 | | Corporate Vice President (since 2007), Vice President (2005-2007), MassMutual; Vice President (1999-2005), Hartford Life Insurance Company; President (since 2008), Vice President (2006-2008), MassMutual Select Funds (open-end investment company); President (since 2008), Vice President (2006-2008), MassMutual Premier Funds (open-end investment company); Vice President (since 2006), MML Series Investment Fund II (open-end investment company). | | | 91 | | |
|
* The address of each Trustee and Principal Officer is the same as that for the Trust; 1295 State Street, Springfield, Massachusetts 01111.
** Each Trustee of the Trust serves until the next meeting of shareholders called for the purpose of electing Trustees and until the election and qualification of his successor or until he dies, resigns or is removed. Notwithstanding the foregoing, unless the Trustees determine that it is desirable and in the best interest of the Trust that an exception to the retirement policy of the Trust be made, a Trustee shall retire and cease to serve as a Trustee upon the conclusion of the calendar year in which such Trustee attains the age of seventy-two years. However, any Trustee who attained the age of seventy-two years during 2007 shall retire and cease to serve as a Trustee on or before December 31, 2009.
The Chairperson is elected to hold such office for a term of three years or until his or her successor is elected and qualified to carry out the duties and responsibilities of his or her office, or until he or she retires, dies, resigns, is removed or becomes disqualified.
*** Board II Oppenheimer Funds is deemed to be part of the Fund Complex because it is managed by OppenheimerFunds, Inc., an indirect subsidiary of MassMutual.
^ Mr. Joyal is an "Interested Person," as that term is defined in the 1940 Act, through his position as a director of Jefferies Group, Inc., a broker-dealer that may execute portfolio transactions and/or engage in principal transactions with the Funds, other investment companies advised by MassMutual or holding themselves out to investors as related companies for purposes of investment or investor services, or any other advisory accounts over which MassMutual has brokerage placement discretion.
^^ MassMutual Participation Investors and MassMutual Corporate Investors are deemed to be a part of the Fund Complex because they are managed by Babson Capital Management LLC, an indirect subsidiary of MassMutual.
^^^ Ms. Sarsynski is an Interested Person through her employment with MassMutual.
# The President, Treasurer and Secretary are elected to hold such office until their successor is elected and qualified to carry out the duties and responsibilities of their office, or until he or she dies, resigns, is removed or becomes disqualified. Each other officer shall hold office at the pleasure of the Trustees.
81
Federal Tax Information (Unaudited)
For corporate shareholders, a portion of the ordinary dividends paid during the Fund(s)' year ended December 31, 2008 qualified for the dividends received deduction, as follows:
| Fund Name | | Dividends Received
Deduction | |
| NASDAQ-100 Fund | | | 100.00 | % | |
Under Section 854(b)(2) of the Code, the Fund(s) hereby designate the following maximum amounts as qualified dividends for purposes of the maximum rate under Section 1(h)(11) of the Code for the year ended December 31, 2008:
| Fund Name | | Qualified Dividend
Income | |
| NASDAQ-100 Fund | | | 100.00 | % | |
82
Other Information (Unaudited)
Fund Expenses December 31, 2008
| Expense Examples: | | The following information is in regards to expenses for the six months ended December 31, 2008:
As a shareholder of the Funds, you incur ongoing costs, including management fees, distribution and/or service (12b-1) fees and other Fund expenses. These examples are intended to help you understand your ongoing costs (in dollars) of investing in the Funds and to compare these costs with the ongoing costs of investing in other mutual funds. These examples are based on an investment of $1,000 invested for the six months ended December 31, 2008. | |
|
| Actual Expenses: | | The first four columns of the table below provide information about actual account values and actual expenses. You may use this information, together with the amount you invested, to estimate the expenses that you paid over the period. Simply divide your account value by $1,000 (for example, an $8,600 account value divided by $1,000 = 8.6), then multiply the result by the number under the heading entitled "Operating Expenses Incurred" to estimate the expenses you paid on your account during this period. | |
|
Hypothetical
Example for
Comparison
Purposes: | | The last two columns of the table below provide information about hypothetical account values and hypothetical expenses based on the Fund's actual expense ratio and an assumed rate of return of 5% per year before expenses, which is not the Fund's actual return. The hypothetical account values and expenses may not be used to estimate the actual ending account balance or expenses you paid for the period. You may use this information to compare the ongoing costs of investing in the Fund and other funds. To do so, compare this 5% hypothetical example with the 5% hypothetical examples that appear in the shareholder reports of the other funds.
Please note that the expenses shown in the table are meant to highlight your ongoing costs only and do not reflect any transactional costs. Therefore, the last two columns of the table are useful in comparing ongoing costs only, and will not help you determine the relative total costs of owning different funds. In addition, if these transactional costs were included, your costs would have been higher. | |
|
| | | Beginning
Value | | Annualized
Expense Ratio | | Ending Value
(Based on Actual
Returns and
Expenses) | | Operating
Expenses
Incurred* | | Ending Value
(Based on Hypothetical
Returns and
Expenses) | | Operating
Expenses
Incurred* | |
| Large Cap Value Fund | |
| Initial Class | | $ | 1,000 | | | | 0.86 | % | | $ | 681.90 | | | $ | 3.64 | | | $ | 1,020.80 | | | $ | 4.37 | | |
| Service Class** | | | 1,000 | | | | 1.12 | % | | | 693.10 | | | | 3.60 | | | | 1,014.70 | | | | 5.67 | | |
| Equity Index Fund | |
| Class I | | | 1,000 | | | | 0.46 | % | | | 713.90 | | | | 1.98 | | | | 1,022.80 | | | | 2.34 | | |
| Class II | | | 1,000 | | | | 0.30 | % | | | 714.60 | | | | 1.29 | | | | 1,023.60 | | | | 1.53 | | |
| Class III | | | 1,000 | | | | 0.16 | % | | | 714.40 | | | | 0.69 | | | | 1,024.30 | | | | 0.81 | | |
| Service Class I** | | | 1,000 | | | | 0.70 | % | | | 704.40 | | | | 2.27 | | | | 1,016.30 | | | | 3.55 | | |
| Growth Equity Fund | |
| Initial Class | | | 1,000 | | | | 0.91 | % | | | 643.70 | | | | 3.76 | | | | 1,020.60 | | | | 4.62 | | |
| Service Class** | | | 1,000 | | | | 1.16 | % | | | 634.40 | | | | 3.60 | | | | 1,014.60 | | | | 5.87 | | |
| NASDAQ-100 Fund | |
| Initial Class | | | 1,000 | | | | 0.56 | % | | | 661.00 | | | | 2.34 | | | | 1,022.30 | | | | 2.85 | | |
| Service Class** | | | 1,000 | | | | 0.81 | % | | | 617.20 | | | | 2.49 | | | | 1,015.90 | | | | 4.10 | | |
83
Other Information (Unaudited) (Continued)
| | | Beginning
Value | | Annualized
Expense Ratio | | Ending Value
(Based on Actual
Returns and
Expenses) | | Operating
Expenses
Incurred* | | Ending Value
(Based on Hypothetical
Returns and
Expenses) | | Operating
Expenses
Incurred* | |
| Small Cap Growth Equity Fund | |
| Initial Class | | $ | 1,000 | | | | 1.17 | % | | $ | 697.80 | | | $ | 4.99 | | | $ | 1,019.30 | | | $ | 5.94 | | |
| Service Class** | | | 1,000 | | | | 1.43 | % | | | 661.80 | | | | 4.51 | | | | 1,013.60 | | | | 7.24 | | |
| Emerging Growth Fund | |
| Initial Class | | | 1,000 | | | | 1.25 | % | | | 605.60 | | | | 5.04 | | | | 1,018.90 | | | | 6.34 | | |
| Service Class** | | | 1,000 | | | | 1.50 | % | | | 639.90 | | | | 4.67 | | | | 1,013.30 | | | | 7.59 | | |
* Expenses are calculated using the annualized expense ratio for the six months ended December 31, 2008, multiplied by the average account value over the period, multiplied by the number of days in the period, divided by the number of days in the year, unless stated otherwise.
** Actual expenses are calculated using the annualized expense ratio, multiplied by the average account value over the period from inception of the Class on August 15, 2008, through December 31, 2008, multiplied by the number of days in the inception period and divided by the number of days in the year. Hypothetical expenses are calculated using the annualized expense ratio, multiplied by the average account value for the six months ended December 31, 2008, multiplied by the number of days in the six month period and divided by the number of days in the year.
84
[This page is intentionally left blank.]
Distributor
MML Distributors, LLC
1295 State Street
Springfield, MA 01111-0001

© 2009 Massachusetts Mutual Life Insurance Company, Springfield, MA. All rights reserved. www.massmutual.com. MassMutual Financial Group is a marketing name for Massachusetts Mutual Life Insurance Company (MassMutual) and its affiliated companies and sales representatives.
L4540 209 RI01829

MML Series Investment Fund
Annual Report
MML Asset Allocation Fund
MML Equity Income Fund
MML Income & Growth Fund
MML Growth & Income Fund
MML Blue Chip Growth Fund
MML Large Cap Growth Fund
MML Concentrated Growth Fund
MML Mid Cap Value Fund
MML Mid Cap Growth Fund
MML Small/Mid Cap Value Fund
(formerly known as MML Small Cap Value Fund)
MML Small Cap Index Fund
MML Global Fund
MML Foreign Fund
MML Conservative Allocation Fund
MML Balanced Allocation Fund
MML Moderate Allocation Fund
MML Growth Allocation Fund
MML Aggressive Allocation Fund
MML American Funds® Core Allocation Fund
MML American Funds® Growth Fund
MML American Funds® International Fund
This annual report pertains to certain funds offered through the Series. Your variable product prospectus will list which of these funds are available through your variable product.
December 31, 2008

Table of Contents
| President's Letter to Shareholders | | | 1 | | |
|
| Economic and Market Review | | | 3 | | |
|
| Portfolio Manager Reports | | | 7 | | |
|
| Portfolio of Investments | |
|
| MML Asset Allocation Fund | | | 71 | | |
|
| MML Equity Income Fund | | | 79 | | |
|
| MML Income & Growth Fund | | | 81 | | |
|
| MML Growth & Income Fund | | | 84 | | |
|
| MML Blue Chip Growth Fund | | | 86 | | |
|
| MML Large Cap Growth Fund | | | 88 | | |
|
| MML Concentrated Growth Fund | | | 89 | | |
|
| MML Mid Cap Value Fund | | | 90 | | |
|
| MML Mid Cap Growth Fund | | | 92 | | |
|
| MML Small/Mid Cap Value Fund (formerly known as MML Small Cap Value Fund) | | | 96 | | |
|
| MML Small Cap Index Fund | | | 98 | | |
|
| MML Global Fund | | | 105 | | |
|
| MML Foreign Fund | | | 108 | | |
|
| MML Conservative Allocation Fund | | | 110 | | |
|
| MML Balanced Allocation Fund | | | 111 | | |
|
| MML Moderate Allocation Fund | | | 112 | | |
|
| MML Growth Allocation Fund | | | 113 | | |
|
| MML Aggressive Allocation Fund | | | 114 | | |
|
| MML American Funds Core Allocation Fund | | | 115 | | |
|
| MML American Funds Growth Fund | | | 116 | | |
|
| MML American Funds International Fund | | | 117 | | |
|
| Statements of Assets and Liabilities | | | 118 | | |
|
| Statements of Operations | | | 130 | | |
|
| Statements of Changes in Net Assets | | | 136 | | |
|
| Financial Highlights | | | 146 | | |
|
| Notes to Financial Statements | | | 167 | | |
|
| Report of Independent Registered Public Accounting Firm | | | 195 | | |
|
| Trustees and Officers (Unaudited) | | | 196 | | |
|
| Federal Tax Information (Unaudited) | | | 200 | | |
|
| Other Information (Unaudited) | | | 201 | | |
|
This material must be preceded or accompanied by a current prospectus for the MML Series Investment Fund. Investors should consider a Fund's investment objective, risks and charges and expenses carefully before investing. This and other information about the investment company is available in the prospectus. Read it carefully before investing.
MML Series Investment Fund – President's Letter to Shareholders
To Our Shareholders
December 31, 2008

Richard J. Byrne
"While today's headlines may, at times, be alarming, it's important for you to keep in mind that your overall focus with respect to your retirement planning should not be on today's issues, but on whether or not your portfolio is positioned appropriately, based on your risk tolerance level and the number of years you expect to remain invested."
The economic challenges of 2008 remain, but maintaining a long-term approach is still critical
Welcome to the MML Series Investment Fund Annual Report, covering the one-year period ended December 31, 2008. During 2008, one of the most difficult years in recent history, Americans struggled through a broad range of economic challenges – many of which had not been seen in decades. These difficulties forced many to adopt lifestyle changes that necessitated a closer look at all expenditures, including those associated with preparing for a more secure financial future.
Throughout it all, however, it's important to remember that investing for retirement is a long-term proposition. So while today's headlines may, at times, be alarming, it's important for you to keep in mind that your overall focus with respect to your retirement planning should not be on today's issues, but on whether or not your portfolio is positioned appropriately, based on your risk tolerance level and the number of years you expect to remain invested.
What retirement investors can do in today's challenging environment
• Stay calm. While it is important to stay abreast of what is going on in the financial markets today, it's more important to keep it all in the proper perspective. If you're like most retirement investors, you won't be looking to withdraw your retirement funds in 2009. And even if you do begin to withdraw money this year, the majority of your retirement account will likely remain invested for many years to come.
• Get professional help. If you work with a financial professional, today's economic environment provides you with an excellent reason to consult him or her to assess your overall retirement plan. Together, you can determine any adjustments that should be made to your portfolio or your contribution levels to help you reach your long-term financial goals.
• Dollar-cost-averaging may help investors in volatile markets.1 Making investments at regular intervals, regardless of market conditions, can help you to take advantage of market swings by buying more shares/units when prices are down, and fewer shares/units when prices are up.
• Try to avoid sudden or drastic changes. While you may intend to remain invested for a number of years, it's important that you implement any changes to your portfolio based on a thorough review of your long-term needs and objectives. Your financial professional can help you assess your situation – and help you avoid sudden moves that investors often come to regret over time.
Keep your eye on the future
As a reminder, the financial markets, like our economy, have always been cyclical, but historically have provided opportunities for growth over the long term. We believe investors should consider a portfolio that is designed to function properly under all market conditions, based on your risk tolerance and the number of years you have until retirement. This can help to eliminate the need for sudden changes in positioning during times of market volatility. Most financial professionals believe that investors who maintain their financial strategy over time have the potential to reach their long-term financial objectives.
1 Dollar-cost-averaging does not assure a profit or protect against loss in a declining market, and involves continuous investment in securities regardless of fluctuating prices. An investor should consider his/her ability to continue investing through periods of low price levels. See the MML Series Investment Fund prospectus for complete details.
(Continued)
1
MML Series Investment Fund – President's Letter to Shareholders (Continued)
I thank you for your continued confidence in MassMutual.
Sincerely,

Richard J. Byrne
President
The information provided is the opinion of MassMutual Retirement Services Investment Services as of 1/1/09 and is subject to change without notice. It is not to be construed as tax, legal or investment advice. Of course, past performance does not guarantee future results.
2
MML Series Investment Fund – Economic and Market Review
December 31, 2008
Financial markets roiled by critical problems; U.S. Government intervention attempts to avoid economic meltdown
During the year ended December 31, 2008, severe problems that had begun to challenge many Americans before the year even began continued to rock the financial world – the subprime mortgage crisis, the weak U.S. housing market and high commodity (particularly oil) prices – and served as a drag on the economy in 2008. Oil prices dropped in the second half of the year on lowered demand, reflecting a global economic slowdown. Key market events triggered aggressive interventions from the U.S. Government and governments worldwide, including revised monetary policies and corporate bailouts, which were intended to pull economies the world over out of their decline and stabilize financial markets. The credit crunch created by the subprime mortgage crisis took its toll on businesses of all sizes, and U.S. unemployment rose substantially over the course of the year. Investors will also remember 2008 as the year that changed the face of Wall S treet. Indeed, the year marked the failures (or takeovers) of multiple major American financial institutions, including Bear Stearns, IndyMac Bancorp, Fannie Mae, Freddie Mac, American International Group (AIG), Merrill Lynch, Lehman Brothers, Washington Mutual and Wachovia.
Market performance
For the 12 months ended December 31, 2008, bonds outpaced equities in an environment of continual market volatility. The Dow Jones Industrial AverageSM ("Dow"), a recognized measure of blue-chip stock performance, shed 33.84% of its value during what turned out to be its worst year since 1931. Similarly, the S&P 500® Index ("S&P 500"), a measure of U.S. large-cap stock performance, gave back 37.00% of its value. Small-cap and technology stocks, as measured by the Russell 2000® Index and the NASDAQ Composite® Index ("NASDAQ"), respectively, posted losses of 33.80% and 40.53%. A significant loser in the U.S. equity market, however, was the Russell Midcap Growth Index, a benchmark of the performance of mid-cap U.S. common stocks, which lost 44.32% for the year. In international equity markets, the Morgan Stanley Capital International Europe, Australasia, Far East Index ("MSCI& reg; EAFE®"), a benchmark for foreign stocks in developed markets, fell 43.39%. Of particular note in the international equity marketplace in 2008 was the Morgan Stanley Capital International Emerging Markets Index, which measures the performance of emerging stock markets throughout the world, but excludes certain market segments unavailable to U.S.-based investors. It lost 53.33% of its value.*
Investments in the fixed-income markets for the most part fared significantly better than their equity peers during 2008. A standout performer was the Barclays Capital 1-3 Year U.S. Government Bond Index (formerly known as the Lehman Brothers® 1-3 Year U.S. Government Bond Index), which measures the results of U.S. Government bonds with one to three years remaining to the scheduled payment of principal. It advanced 6.66%. Other closely watched benchmarks in the fixed-income market also gained ground in 2008. The Barclays Capital U.S. Aggregate Bond Index (formerly known as the Lehman Brothers U.S. Aggregate Bond Index), a broad measure of the U.S. investment-grade bond markets, returned 5.24%. Treasury bills also advanced, as measured by the Salomon Smith Barney 3-Month Treasury Bill Index, which returned 1.80%. Reflecting investor preference for higher-quality securities and aversion to risk in this environment, the Barclays Capital U.S. Corporate High-Yield Bond Index (formerly known as the Lehman Brothers U.S. Corporate High-Yield Bond Index) – which measures the performance of fixed rate, non-investment-grade debt – lost 26.16%, but still managed to outperform the S&P 500 and the Dow.*
* Indexes are unmanaged, do not incur fees or expenses and cannot be purchased directly for investment.
(Continued)
3
MML Series Investment Fund – Economic and Market Review (Continued)
2008 stumbles out of the gate in the first quarter
2008 began against a backdrop of a subprime mortgage crisis and blue-chip financial company writedowns (i.e., the reduction of the book value of an asset because it is overvalued compared to the current market value) – along with countless earnings disappointments. Headlines announced departures of well-known senior and top executives from some of Wall Street's giants in the wake of the ever-growing impact of the subprime crisis – in an indication of what was yet to come. In this environment, U.S. and international stocks struggled and higher-quality bonds advanced, benefiting from concerned investors' preference for lower-risk investments. While the MSCI EAFE was weaker than the S&P 500 in local currency terms, a weak U.S. dollar boosted the former's dollar-based value.
As conditions in the financial markets deteriorated, the Federal Reserve ("Fed") responded to the burgeoning economic crisis by dramatically stepping up the pace at which Fed officials lowered short-term interest rates. After federal funds rate reductions of only 0.25% in October and December 2007, the Fed responded to January's falling stock market with an unscheduled 0.75% reduction on January 22, 2008 – with another 0.50% cut at the end of the month. The federal funds rate is the interest rate at which banks and other financial institutions lend to one another overnight. A weakening labor market and softening consumer spending, together with ongoing crisis conditions in the financials sector, prompted the Fed to make another 0.75% cut in March. In addition, in a major departure from previous Fed policy, the central bank announced that it was permitting investment banks to borrow directly from it, a privilege formerly reserved for com mercial banks. This change of policy provides a source of short-term funds that can be accessed at the current discount rate (the interest rate that regional Fed banks charge banks and other financial institutions when they borrow funds on a short-term basis).
The Fed's most controversial move during the first quarter was its involvement in the takeover of Bear Stearns, then the nation's fifth-largest investment bank, by JPMorgan Chase. As its customers withdrew funds at an accelerating pace and lenders pulled back on financing, Bear Stearns found itself in critical condition by mid-March. The Federal Reserve Bank of New York subsequently agreed to cover up to $29 billion in losses if Bear Stearns' assets should go bad, with JPMorgan Chase covering the first $1 billion, a move that proved to foretell of a new era in U.S. Government economic intervention. On March 31, 2008, Treasury Secretary Henry Paulson unveiled a plan to revamp the federal government's oversight of the U.S. financial markets.
The second quarter brings further challenges
In the second quarter of 2008, many sectors of both the stock and bond markets declined, as surging energy prices, which created a stiff headwind for the auto and airline industries, continued to challenge the American consumer. The surprising strength of the U.S. dollar during the quarter muted the returns of the MSCI EAFE, which nevertheless outperformed both the Dow and the S&P 500 for the three-month period. Crude oil touched $140 a barrel by the end of June, pushing the average price of a gallon of regular gasoline to more than $4.00. The May employment report unnerved investors, as the nation's unemployment rate rose from 5.0% to 5.5% and fueled concerns that the U.S. economy might enter a recession. Also weighing on investor sentiment in June was a worsening inflation picture. Elsewhere, home prices continued their decline. All of these factors led to slumping consumer confidence. On a brighter note, the U.S. dollar, which had bee n struggling against major currencies for quite some time, showed renewed strength.
4
MML Series Investment Fund – Economic and Market Review (Continued)
Government intervention accelerates in the third quarter
Investors had hoped that the March 2008 takeover of Bear Stearns by JPMorgan Chase marked the turning point of the crisis in the financials sector. However, an extraordinary – and seemingly relentless – series of events in the third quarter of 2008 sent investors reeling and consequently, put downward pressure on stock prices:
• July 11: Federal regulators seized IndyMac Bank;
• Sept. 7: The U.S. Government rescued government-sponsored entities Fannie Mae and Freddie Mac;
• Sept. 14: Brokerage and investment bank Merrill Lynch arranged to be bought by Bank of America;
• Sept. 15: Lehman Brothers, the fourth-largest U.S. investment bank, filed for Chapter 11 bankruptcy protection in the largest corporate bankruptcy filing ever in the United States;
• Sept. 16: Insurer AIG received an emergency, U.S. Government-underwritten $85 billion loan after its stock plunged and its debt was downgraded by all three major credit-rating agencies;
• Sept. 19: U.S. Treasury Secretary Paulson unveiled a sweeping $700 billion proposal to purchase hard-to-sell mortgage assets from banks;
• Sept. 21: Federal regulators agreed to allow the last two surviving U.S. investment banks, Goldman Sachs and Morgan Stanley, to become bank holding companies, in a move intended to help these banks survive the financial crisis and give them easier access to credit;
• Sept. 25: Savings and loan Washington Mutual was seized by federal regulators, and its loan portfolio and retail branches were sold to JPMorgan Chase;
• Sept. 29: Citigroup agreed to acquire the banking assets of Wachovia, the nation's fourth-largest bank, in a deal that excluded Wachovia's brokerage and asset management businesses. (The agreement never came to fruition. In the first week of October, Wells Fargo upended the Citigroup deal with one that included the purchase of all of Wachovia, including the firm's banking, retail brokerage, asset management, insurance and retirement services businesses.); and
• Also on Sept. 29, the U.S. House of Representatives defeated the Bush administration's economic rescue plan, sending stocks sharply lower.
During the third quarter of 2008, the Dow declined 4.40%, while the S&P 500 lost 8.36%. Foreign equities struggled against slumping economic activity abroad and a sharp rally in the U.S. dollar, resulting in a decline of 20.56% for the MSCI EAFE.
Fourth quarter: U.S. Government passes bailout act; recession confirmed
In early October, President Bush signed the Emergency Economic Stabilization Act of 2008 (EESA) into law. EESA authorized the Troubled Asset Relief Program (TARP), which was originally expected to support financial institutions by buying their troubled assets. U.S. Treasury Secretary Henry Paulson later indicated that TARP's focus was shifting to companies providing consumer debt in an effort to improve the flow of funds for consumer loans. In late December, President Bush made $17.4 billion in loans (taken from TARP assets) available to General Motors Corp. and Chrysler after the U.S. Senate had rejected a proposal earlier in the month.
The Fed responded to the weak economy and low consumer confidence by cutting interest rates three times in the fourth quarter of 2008, bringing the target federal funds rate to a historic low of between zero and 0.25%, from its prior target of 1%. The Fed also cut the discount rate to 0.5%.
The widely anticipated official declaration of a U.S. recession finally occurred at the beginning of December, when the National Bureau of Economic Research (NBER) announced that the economy
5
MML Series Investment Fund – Economic and Market Review (Continued)
had been in recession since the previous December (2007). Other headlines in the fourth quarter of 2008 also underscored the dire state of our economy:
• November's unemployment report revealed a loss of 533,000 jobs, the biggest one-month decline since 1974.
• Home prices continued to fall. In October, the 20-city Case-Shiller Home Price Index dropped by 18% versus a year earlier, marking 27 consecutive monthly declines for that benchmark.
• The Institute for Supply Management's manufacturing index – in part, reflecting depressed auto sales – receded to 36.2 in November, its lowest reading since May 1982.
• The retail industry suffered one of the worst holiday shopping seasons in years.
• The broader economy, as measured by GDP (gross domestic product), fell by a revised 0.5% in the third quarter, its largest decline in seven years.
The Dow declined 19.12% for the quarter – similarly, the S&P 500 fell 21.96% and the NASDAQ lost 24.61%. Stocks of foreign developed markets also struggled, as the MSCI EAFE Index declined 19.96%. Oil prices continued their slide during December, closing out the year near $45 per barrel, as violence in the Middle East escalated. (Prices had dropped to the low $30 range earlier in the quarter.) Most other commodities also suffered from declining demand in the face of the global economic downturn. The U.S. dollar remained strong for most of the quarter. Fixed-income performance was mixed, as the continuing flight to quality that started at the end of 2007 benefited this market segment during the fourth quarter of 2008. The yield on the benchmark 10-year Treasury Note declined 1.60% to finish the year at 2.25% – spurring an increase in mortgage refinancings in the second half of the fourth quarter.
As 2008 drew to a close, investors were hopeful that the U.S. economy would emerge from recession and market performance would return to positive territory; however, many market watchers are cautious about the immediate future with so few encouraging signs on the horizon.
The information provided is the opinion of MassMutual Retirement Services Investment Services as of 1/1/09 and is subject to change without notice. It is not to be construed as tax, legal or investment advice. Of course, past performance does not guarantee future results.
6
MML Asset Allocation Fund – Portfolio Manager Report
What is the investment objective of MML Asset Allocation Fund – and who is the Fund's sub-adviser?
The Fund seeks to provide high total return consistent with preservation of capital over the long term by investing its assets in both equity and fixed-income securities. The Fund's sub-adviser determines the asset allocation between equity and fixed-income securities. Up to 80% of the Fund's assets may be invested in equities; up to 60% in fixed income. The Fund's sub-adviser is Capital Guardian Trust Company (Capital Guardian).
How did the Fund perform during the 12 months ended December 31, 2008?
The Fund's Initial Class shares returned -30.32%, outperforming the -37.00% return of the S&P 500® Index (the "benchmark"), a widely recognized, unmanaged index representative of common stocks of larger capitalized U.S. companies, but trailing the 5.24% return of the Barclays Capital U.S. Aggregate Bond Index, an unmanaged index of fixed-rate investment-grade securities with at least one year to maturity, combining the Barclays Capital U.S. Government/Credit Bond Index and the Barclays Capital U.S. Mortgage-Backed Securities Index. In addition, the Fund underperformed the -26.18% return of the Lipper Balanced Fund Index, an unmanaged, equally weighted index of the 30 l argest mutual funds within the Lipper Balanced Category.
For a discussion on the economic and market environment during the 12-month period ended December 31, 2008, please see the Economic and Market Review, beginning on page 3.
What factors contributed to the Fund's performance?
The portfolio's overweight position in stocks during the year weighed on the Fund's results relative to the S&P 500 Index.
The equity portion of the portfolio underperformed the benchmark, mainly due to stock selection in several sectors. The Fund began the year with holdings in financials, which we believed would come through the credit crunch with the ability to grow and increase market share. However, we underestimated the severity of the credit crisis and the extent to which companies with strong balance sheets were vulnerable. Portfolio selections in information technology and consumer discretionary companies also detracted from the Fund's performance. Helping the portfolio's performance was its positioning and selection in health care (although UnitedHealth Group was a detractor). The Fund's investment in materials stocks also contributed to returns.
Freddie Mac and Fannie Mae were among the largest drags on relative results, along with Lehman Brothers and XL Capital. Yet other financial holdings, including Wells Fargo and JPMorgan Chase, were among the top contributors to the Fund's relative returns. The smaller-than-index weighting in ExxonMobil also hampered results. The portfolio benefited from not owning Citigroup. Elsewhere, Genentech, which received a bid from Roche, and ImClone Systems, purchased by Eli Lilly, also contributed to the Fund's returns.
The bond portfolio results lagged the Barclays Capital U.S. Aggregate Bond Index, primarily due to a smaller-than-index weighting in Treasuries and a larger-than-index weighting in U.S. corporate bonds. These positions hampered returns as investors fled to the safety of U.S. Government bonds. Our high-yield and emerging-markets debt positions also detracted from the Fund's performance.
What is your outlook?
Our individual stock selections in the equity portion of the portfolio say far more about our convictions than do the Fund's sector weightings. Across industries, we have taken advantage of lower stock prices to invest in companies with strong balance sheets and free cash flow – and those we believe will emerge from this challenging market environment with the ability to grow organically. These include biotechnology companies indicating strong pipelines, innovative technology companies with solid cash flows, and a selection of industrial companies with the potential for long-term cost advantages. We have been adding to the Fund's investments in high-quality companies, which we believe may provide further downside protection and po sition the portfolio for a long-term recovery.
7
MML Asset Allocation Fund – Portfolio Manager Report (Continued)
In the fixed-income portion, we added to Treasuries during the fourth quarter of 2008, but are shifting again to spread sectors (investment-grade corporates and other non-Treasuries), as government bond yields have declined substantially and are likely to remain low as the economy continues to weaken. We believe that investment-grade corporate bond spreads (i.e., the differences in yields between comparable Treasury and non-Treasury securities), which have only recently begun narrowing from historically wide levels, offer the potential for compelling risk-adjusted returns. In the extended sectors, we anticipate using periods of volatility to begin increasing our emerging-markets debt exposure.
8
MML Asset Allocation Fund – Portfolio Manager Report (Continued)
MML Asset Allocation Fund
Largest Holdings
(% of Net Assets) on 12/31/08
(Unaudited) | |
United Parcel Service, Inc.
Class B | | | 1.9 | % | |
| General Electric Co. | | | 1.9 | % | |
| Google, Inc. Class A | | | 1.9 | % | |
| JPMorgan Chase & Co. | | | 1.8 | % | |
| PepsiCo, Inc. | | | 1.7 | % | |
| Baxter International, Inc. | | | 1.6 | % | |
| Celgene Corp. | | | 1.6 | % | |
| Target Corp. | | | 1.6 | % | |
| Kraft Foods, Inc. Class A | | | 1.6 | % | |
| Genentech, Inc. | | | 1.5 | % | |
| | | | 17.1 | % | |
MML Asset Allocation Fund
Asset Allocation
(% of Net Assets) on 12/31/08
(Unaudited) | |
| Equities | | | 64.5 | % | |
| Bonds & Notes | | | 35.1 | % | |
| Total Long-Term Investments | | | 99.6 | % | |
Short-Term Investments and
Other Assets and Liabilities | | | 0.4 | % | |
| Net Assets | | | 100.0 | % | |
9
MML Asset Allocation Fund – Portfolio Manager Report (Continued)
Growth of a $10,000 Investment
Hypothetical Investments in MML Asset Allocation Fund Initial Class, the S&P 500 Index, the Barclays Capital U.S. Aggregate Bond Index and the Lipper Balanced Fund Index.
TOTAL RETURN
| | | One Year
1/1/08 - 12/31/08 | | Since Inception
Average Annual
5/1/06 - 12/31/08 | |
| Initial Class | | | (30.32 | )% | | | (10.75 | )% | |
| S&P 500 Index* | | | (37.00 | )% | | | (11.19 | )% | |
Barclays Capital U.S. Aggregate
Bond Index | | | 5.24 | % | | | 6.55 | % | |
| Lipper Balanced Fund Index | | | (26.18 | )% | | | (6.29 | )% | |
Hypothetical Investments in MML Asset Allocation Fund Service Class, the S&P 500 Index, the Barclays Capital U.S. Aggregate Bond Index and the Lipper Balanced Fund Index.
TOTAL RETURN
| | | Since Inception
8/15/08 - 12/31/08 | |
| Service Class | | | (23.10 | )% | |
| S&P 500 Index* | | | (28.90 | )%+ | |
| Barclays Capital U.S. Aggregate Bond Index | | | 3.17 | %+ | |
| Lipper Balanced Fund Index | | | (20.50 | )%+ | |
GROWTH OF $10,000 INVESTMENT SINCE INCEPTION
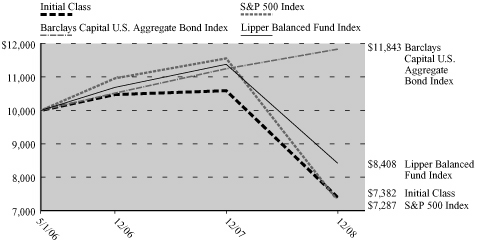

* Benchmark
+ From 9/1/08.
Performance data quoted represents past performance; past performance is not predictive of future results. The investment return and principal value of shares of the Fund will fluctuate with market conditions so that shares of the Fund, when redeemed, may be worth more or less than their original cost. Current performance of the Fund may be lower or higher than the performance quoted. Performance data current to the most recent month end may be obtained by accessing the website www.massmutual.com.
Investors should note that the Fund is a professionally managed mutual fund, while the S&P 500 Index, the Barclays Capital U.S. Aggregate Bond Index and the Lipper Balanced Fund Index are unmanaged, do not incur expenses, and cannot be purchased directly by investors. Investors should read the Fund's prospectus with regard to the Fund's investment objective, risks and charges and expenses in conjunction with these financial statements. The Fund's return reflects changes in the net asset value per share without the deduction of any product charges (e.g., cost of insurance, mortality and expense risk charges, administrative fees, and CDSL). The inclusion of these charges would have reduced the performance shown here.
10
MML Equity Income Fund – Portfolio Manager Report
What is the investment objective of MML Equity Income Fund – and who is the Fund's sub-adviser?
The Fund seeks dividend income and long-term capital growth by investing in the common stocks of established companies. The Fund's sub-adviser is T. Rowe Price Associates, Inc. (T. Rowe Price).
How did the Fund perform during the 12 months ended December 31, 2008?
The Fund's Initial Class shares returned -35.80%, outperforming the -37.00% return of the S&P 500® Index (the "benchmark"), a widely recognized, unmanaged index representative of common stocks of larger capitalized U.S. companies. The Fund also outpaced the -36.85% return of the Russell 1000® Value Index, an unmanaged index consisting of those Russell 1000 securities (representing the 1000 largest U.S. companies based on market capitalization) with greater-than-average value orientation that tend to exhibit lower price-to-book ratios and forecasted growth values than securities in the growth universe.
For a discussion on the economic and market environment during the 12-month period ended December 31, 2008, please see the Economic and Market Review, beginning on page 3.
What factors contributed to the Fund's performance?
Looking at positive contributors to the Fund's full-year return relative to the benchmark, the portfolio's outperformance was driven by an underweight position in the financials sector. Among individual contributors, insurance broker Marsh & McLennan stands out for having shown improvement in its brokerage business. Another key contribution came from positioning among the big diversified financial services firms, where it helped to hold a stake in JPMorgan Chase and to be under-represented in weak performer Citigroup.
In addition, stock selection made the consumer staples sector a leading source of relative strength. These traditionally defensive shares held up relatively well during an extremely volatile period, helped in part by mergers and acquisition activity. American brewer Anheuser-Busch agreed to be acquired by European beverage giant InBev, which contributed to Anheuser-Busch's strong performance. Names in the food products industry were also key contributors. General Mills raised prices, and Hershey benefited from talk of a potential buyout.
At the other end of the spectrum, stock selection made consumer discretionary shares the leading detractors from relative performance. Some of the greatest laggards were in media holdings, as the economic slowdown meant declining profits, writedowns (i.e., the reduction of the book value of an asset because it is overvalued compared to the market value), and layoffs at newspaper and broadcasting company Gannett. In addition, casino operator MGM Mirage saw fewer patrons and poorer revenues in tough economic times, while tight credit markets meant increased borrowing costs, limiting the gaming giant's ability to fund planned capital expenditures. Similarly, Newell Rubbermaid suffered from weak consumer spending and rising input costs.
It also hurt during part of 2008 to be under-represented in energy shares, which benefited from the big run-up in energy prices through July. A notable detractor was domestic oil company Murphy Oil, which suffered in the second half of the year due to tumbling prices for oil and gas, to which the stock is highly leveraged. In addition, the portfolio held an underweight position in ExxonMobil, which held up better than many energy names during 2008.
An overweight position made information technology stocks detractors from relative returns for the year, as these shares declined along with the outlook for growth and earnings. Telecommunication equipment maker Alcatel-Lucent was hurt by the global slowdown, even as the company continued to work on its turnaround under new management. Personal computer maker Dell was another victim of the sharp drop-off in consumer discretionary spending.
11
MML Equity Income Fund – Portfolio Manager Report (Continued)
What is your outlook?
As we emerge from one of the most challenging market environments in history, we expect some improvement in economic fundamentals in 2009 and an eventual easing of the crisis of confidence and liquidity in the system. While it is not clear when markets will recover, we are reasonably optimistic about the prospects for equity returns as we look out over the next few years. In the meantime, we will continue to pursue companies that have good business models and strong balance sheets trading at what we believe are depressed levels. It is our belief that this approach remains valid and that the market will ultimately reward those willing to make investments in fundamentally sound companies during times of uncertainty and stress.
12
MML Equity Income Fund – Portfolio Manager Report (Continued)
MML Equity Income Fund
Largest Holdings
(% of Net Assets) on 12/31/08
(Unaudited) | |
| Exxon Mobil Corp. | | | 3.4 | % | |
| JPMorgan Chase & Co. | | | 3.2 | % | |
| Chevron Corp. | | | 3.1 | % | |
| General Electric Co. | | | 2.9 | % | |
| AT&T, Inc. | | | 2.4 | % | |
Royal Dutch Shell PLC Sponsored
ADR (United Kingdom) | | | 2.2 | % | |
| Wells Fargo & Co. | | | 1.9 | % | |
| The Hershey Co. | | | 1.7 | % | |
| The Home Depot, Inc. | | | 1.6 | % | |
| 3M Co. | | | 1.6 | % | |
| | | | 24.0 | % | |
MML Equity Income Fund
Sector Table
(% of Net Assets) on 12/31/08
(Unaudited) | |
| Financial | | | 22.6 | % | |
| Consumer, Non-cyclical | | | 16.0 | % | |
| Energy | | | 14.3 | % | |
| Industrial | | | 11.5 | % | |
| Communications | | | 10.7 | % | |
| Consumer, Cyclical | | | 7.6 | % | |
| Utilities | | | 5.9 | % | |
| Basic Materials | | | 5.7 | % | |
| Technology | | | 4.0 | % | |
| Government | | | 0.0 | % | |
| Total Long-Term Investments | | | 98.3 | % | |
Short-Term Investments and
Other Assets and Liabilities | | | 1.7 | % | |
| Net Assets | | | 100.0 | % | |
13
MML Equity Income Fund – Portfolio Manager Report (Continued)
Growth of a $10,000 Investment
Hypothetical Investments in MML Equity Income Fund Initial Class, the S&P 500 Index and the Russell 1000 Value Index.
TOTAL RETURN
| | | One Year
1/1/08 - 12/31/08 | | Since Inception
Average Annual
5/1/06 - 12/31/08 | |
| Initial Class | | | (35.80 | )% | | | (10.90 | )% | |
| S&P 500 Index* | | | (37.00 | )% | | | (11.19 | )% | |
| Russell 1000 Value Index | | | (36.85 | )% | | | (12.08 | )% | |
Hypothetical Investments in MML Equity Income Fund Service Class, the S&P 500 Index and the Russell 1000 Value Index.
TOTAL RETURN
| | | Since Inception
8/15/08 - 12/31/08 | |
| Service Class | | | (27.98 | )% | |
| S&P 500 Index* | | | (28.90 | )%+ | |
| Russell 1000 Value Index | | | (27.89 | )%+ | |
GROWTH OF $10,000 INVESTMENT SINCE INCEPTION

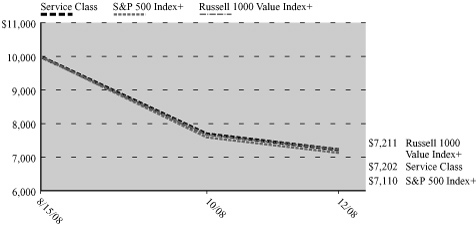
* Benchmark
+ From 9/1/08.
Performance data quoted represents past performance; past performance is not predictive of future results. The investment return and principal value of shares of the Fund will fluctuate with market conditions so that shares of the Fund, when redeemed, may be worth more or less than their original cost. Current performance of the Fund may be lower or higher than the performance quoted. Performance data current to the most recent month end may be obtained by accessing the website www.massmutual.com.
Investors should note that the Fund is a professionally managed mutual fund, while the S&P 500 Index and the Russell 1000 Value Index are unmanaged, do not incur expenses, and cannot be purchased directly by investors. Investors should read the Fund's prospectus with regard to the Fund's investment objective, risks and charges and expenses in conjunction with these financial statements. The Fund's return reflects changes in the net asset value per share without the deduction of any product charges (e.g., cost of insurance, mortality and expense risk charges, administrative fees, and CDSL). The inclusion of these charges would have reduced the performance shown here.
14
MML Income & Growth Fund – Portfolio Manager Report
What is the investment objective of MML Income & Growth Fund – and who is the Fund's sub-adviser?
The Fund seeks growth of capital by investing in common stocks of companies which the Fund's sub-adviser believes offer prospects for capital growth. Income is a secondary objective. The Fund's sub-adviser is American Century Investment Management, Inc. (American Century).
How did the Fund perform during the 12 months ended December 31, 2008?
The Fund's Initial Class shares returned -34.76%, outperforming the -37.00% return of the S&P 500® Index (the "benchmark"), a widely recognized, unmanaged index representative of common stocks of larger capitalized U.S. companies.
For a discussion on the economic and market environment during the 12-month period ended December 31, 2008, please see the Economic and Market Review, beginning on page 3.
What factors contributed to the Fund's performance?
During 2008, the Fund's tilt toward value contributed favorably to its performance, as value stocks outperformed their growth counterparts during the year. In addition, the portfolio's smaller market capitalization (than the benchmark) boosted results relative to the benchmark, as small-company shares held up best in the severe market decline. However, the most important contributing factor to the portfolio's outperformance of its benchmark was individual stock selection, which added value in six of 10 market sectors.
Stock selection was most successful in the financials sector, which was the worst-performing segment in the benchmark. Virtually all of the outperformance in the financials sector resulted from stock selection in the insurance industry. Here, our key decisions included avoiding insurance giant American International Group (AIG), which we eliminated from the portfolio in the first half of the year, and holding an overweight position relative to the benchmark in strong-performing property and casualty insurer ACE. Stock selection also proved favorable in the health care and energy sectors. Outperformance in the health care sector was driven by favorable stock selection among biotechnology companies, health care equipment makers and pharmaceutical firms. Finally, the portfolio's energy stocks fared particularly well in the second half of the year, as energy prices slumped. Outperformance was driven by an underweight position in energy services and equipment companies, which were hit hardest by the decline in the price of energy, and an overweight position in oil and gas producers. The top performance contributor in this sector was energy titan ExxonMobil, which reported record profits despite lower production volumes, thanks to effective cost controls.
On the downside, the consumer staples and utilities sectors underperformed their counterparts in the benchmark. Underweight positions in food and staples retailers and beverage makers detracted from results in the consumer staples sector. In particular, we maintained underweight positions in discount retailer Walmart, which benefited from a broad consumer shift toward lower-priced goods as the economy weakened, and beer maker Anheuser-Busch, which was acquired at a premium during the year. In the utilities sector, an overweight position in independent power producers generated the bulk of the underperformance. Texas-based power producer Reliant Energy was the biggest detractor in this sector, as shrinking profit margins and higher financing costs led to a sharp decline in the stock.
What is your outlook?
In our view, the current crisis – driven by frozen credit markets, a loss of confidence in the financial sector, and a consumer-led recession – is likely to remain in place as we move through the first half of 2009. Nonetheless, we are taking steps to position ourselves for an eventual turnaround in the equity market. Valuation spreads have widened to above-average levels, creating opportunities for our valuation factors to identify and exploit. As a result, we are moving slowly but deliberately to reduce underweight positions in industries and stocks that suffered the steepest declines in 2008. However, our enthusiasm for value remains tempered by balance-sheet factors, such as liquidity, debt and financial strength.
15
MML Income & Growth Fund – Portfolio Manager Report (Continued)
MML Income & Growth Fund
Largest Holdings
(% of Net Assets) on 12/31/08
(Unaudited) | |
| Exxon Mobil Corp. | | | 6.4 | % | |
| Chevron Corp. | | | 3.1 | % | |
| Johnson & Johnson | | | 2.9 | % | |
| Pfizer, Inc. | | | 2.8 | % | |
| Verizon Communications, Inc. | | | 2.4 | % | |
| AT&T, Inc. | | | 2.1 | % | |
| The Procter & Gamble Co. | | | 2.1 | % | |
| ConocoPhillips | | | 2.0 | % | |
| Amgen, Inc. | | | 2.0 | % | |
International Business
Machines Corp. | | | 2.0 | % | |
| | | | 27.8 | % | |
MML Income & Growth Fund
Sector Table
(% of Net Assets) on 12/31/08
(Unaudited) | |
| Consumer, Non-cyclical | | | 25.4 | % | |
| Energy | | | 15.2 | % | |
| Financial | | | 14.7 | % | |
| Technology | | | 12.1 | % | |
| Communications | | | 9.4 | % | |
| Industrial | | | 9.2 | % | |
| Consumer, Cyclical | | | 7.9 | % | |
| Utilities | | | 3.1 | % | |
| Basic Materials | | | 2.4 | % | |
| Total Long-Term Investments | | | 99.4 | % | |
Short-Term Investments and
Other Assets and Liabilities | | | 0.6 | % | |
| Net Assets | | | 100.0 | % | |
16
MML Income & Growth Fund – Portfolio Manager Report (Continued)
Growth of a $10,000 Investment
Hypothetical Investments in MML Income & Growth Fund Initial Class and the S&P 500 Index.
TOTAL RETURN
| | | One Year
1/1/08 - 12/31/08 | | Since Inception
Average Annual
5/1/06 - 12/31/08 | |
| Initial Class | | | (34.76 | )% | | | (11.45 | )% | |
| S&P 500 Index | | | (37.00 | )% | | | (11.19 | )% | |
Hypothetical Investments in MML Income & Growth Fund Service Class and the S&P 500 Index.
TOTAL RETURN
| | | Since Inception
8/15/08 - 12/31/08 | |
| Service Class | | | (26.51 | )% | |
| S&P 500 Index | | | (28.90 | )%+ | |
GROWTH OF $10,000 INVESTMENT SINCE INCEPTION
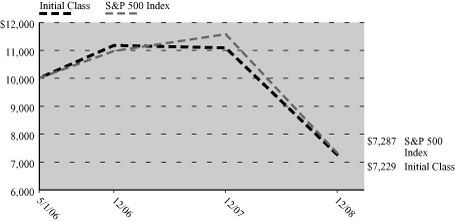
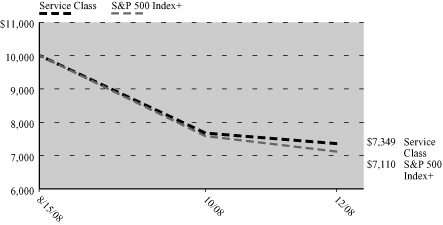
+ From 9/1/08.
Performance data quoted represents past performance; past performance is not predictive of future results. The investment return and principal value of shares of the Fund will fluctuate with market conditions so that shares of the Fund, when redeemed, may be worth more or less than their original cost. Current performance of the Fund may be lower or higher than the performance quoted. Performance data current to the most recent month end may be obtained by accessing the website www.massmutual.com.
Investors should note that the Fund is a professionally managed mutual fund, while the S&P 500 Index is unmanaged, does not incur expenses, and cannot be purchased directly by investors. Investors should read the Fund's prospectus with regard to the Fund's investment objective, risks and charges and expenses in conjunction with these financial statements. The Fund's return reflects changes in the net asset value per share without the deduction of any product charges (e.g., cost of insurance, mortality and expense risk charges, administrative fees, and CDSL). The inclusion of these charges would have reduced the performance shown here.
17
MML Growth & Income Fund – Portfolio Manager Report
What is the investment objective of MML Growth & Income Fund – and who is the Fund's sub-adviser?
The Fund seeks capital appreciation and income by investing at least 80% of its net assets, under normal market conditions, in equity securities and equity-related securities of companies domiciled in the United States with market capitalizations greater than $1 billion at the time of purchase. The Fund's sub-adviser is Capital Guardian Trust Company (Capital Guardian).
How did the Fund perform during the 12 months ended December 31, 2008?
The Fund's Initial Class shares returned -40.10%, underperforming the -37.00% return of the S&P 500® Index (the "benchmark"), a widely recognized, unmanaged index representative of common stocks of larger capitalized U.S. companies.
For a discussion on the economic and market environment during the 12-month period ended December 31, 2008, please see the Economic and Market Review, beginning on page 3.
What factors contributed to the Fund's performance?
The portfolio underperformed the benchmark mainly due to stock selection in several sectors. The Fund began the year with holdings in financials that we believed would come through the credit crunch with the ability to grow and increase market share. However, we underestimated the severity of the credit crisis and the extent to which companies with strong balance sheets were vulnerable. Portfolio selections in consumer discretionary and information technology companies also detracted from the Fund's performance. The portfolio's overweight position and selection in health care added to returns (although UnitedHealth Group was a detractor). The Fund's investment in materials stocks also contributed.
Freddie Mac and Fannie Mae were among the largest detractors from the Fund's returns relative to the benchmark, along with Lehman Brothers and Wachovia. Yet other financial holdings, including JPMorgan Chase and Wells Fargo, were among the top contributors to relative returns. The portfolio also benefited from not owning Citigroup. Elsewhere, ImClone Systems, purchased by Eli Lilly, and Genentech, which received a bid from Roche, were positive contributors to the Fund's performance. Barrick Gold also helped returns, as the price of that commodity rose in 2008.
What is your outlook?
Today, our individual stock selections say far more about our convictions than do the Fund's sector weightings. Across industries, we have taken advantage of lower stock prices to invest in companies with strong balance sheets and free cash flow – and those we believe will emerge from this challenging market environment with the ability to grow organically. These include biotechnology companies indicating strong pipelines, innovative technology companies with solid cash flows, and a selection of industrial companies with the potential for long-term cost advantages. We have been adding to the Fund's investments in high-quality companies that we think may provide further downside protection and position the portfolio for a long-term recovery.
18
MML Growth & Income Fund – Portfolio Manager Report (Continued)
MML Growth & Income Fund
Largest Holdings
(% of Net Assets) on 12/31/08
(Unaudited) | |
| Google, Inc. Class A | | | 3.0 | % | |
United Parcel Service, Inc.
Class B | | | 2.9 | % | |
| General Electric Co. | | | 2.9 | % | |
| JPMorgan Chase & Co. | | | 2.7 | % | |
| PepsiCo, Inc. | | | 2.7 | % | |
| Baxter International, Inc. | | | 2.4 | % | |
| Celgene Corp. | | | 2.4 | % | |
| Kraft Foods, Inc. Class A | | | 2.4 | % | |
| Target Corp. | | | 2.4 | % | |
| The Goldman Sachs Group, Inc. | | | 2.2 | % | |
| | | | 26.0 | % | |
MML Growth & Income Fund
Sector Table
(% of Net Assets) on 12/31/08
(Unaudited) | |
| Consumer, Non-cyclical | | | 30.1 | % | |
| Communications | | | 14.7 | % | |
| Financial | | | 12.2 | % | |
| Industrial | | | 12.1 | % | |
| Consumer, Cyclical | | | 8.8 | % | |
| Energy | | | 7.1 | % | |
| Technology | | | 6.0 | % | |
| Basic Materials | | | 5.3 | % | |
| Utilities | | | 1.2 | % | |
| Total Long-Term Investments | | | 97.5 | % | |
Short-Term Investments and
Other Assets and Liabilities | | | 2.5 | % | |
| Net Assets | | | 100.0 | % | |
19
MML Growth & Income Fund – Portfolio Manager Report (Continued)
Growth of a $10,000 Investment
Hypothetical Investments in MML Growth & Income Fund Initial Class and the S&P 500 Index.
TOTAL RETURN
| | | One Year
1/1/08 - 12/31/08 | | Since Inception
Average Annual
5/1/06 - 12/31/08 | |
| Initial Class | | | (40.10 | )% | | | (16.25 | )% | |
| S&P 500 Index | | | (37.00 | )% | | | (11.19 | )% | |
Hypothetical Investments in MML Growth & Income Fund Service Class and the S&P 500 Index.
TOTAL RETURN
| | | Since Inception
8/15/08 - 12/31/08 | |
| Service Class | | | (31.78 | )% | |
| S&P 500 Index | | | (28.90 | )%+ | |
GROWTH OF $10,000 INVESTMENT SINCE INCEPTION
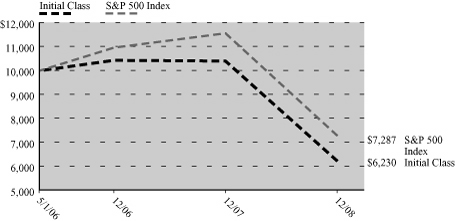
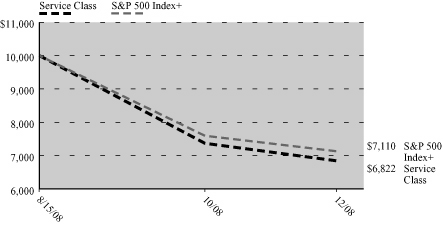
+ From 9/1/08.
Performance data quoted represents past performance; past performance is not predictive of future results. The investment return and principal value of shares of the Fund will fluctuate with market conditions so that shares of the Fund, when redeemed, may be worth more or less than their original cost. Current performance of the Fund may be lower or higher than the performance quoted. Performance data current to the most recent month end may be obtained by accessing the website www.massmutual.com.
Investors should note that the Fund is a professionally managed mutual fund, while the S&P 500 Index is unmanaged, does not incur expenses, and cannot be purchased directly by investors. Investors should read the Fund's prospectus with regard to the Fund's investment objective, risks and charges and expenses in conjunction with these financial statements. The Fund's return reflects changes in the net asset value per share without the deduction of any product charges (e.g., cost of insurance, mortality and expense risk charges, administrative fees, and CDSL). The inclusion of these charges would have reduced the performance shown here.
20
MML Blue Chip Growth Fund – Portfolio Manager Report
What is the investment objective of MML Blue Chip Growth Fund – and who is the Fund's sub-adviser?
The Fund seeks long-term capital growth by normally investing at least 80% of its net assets in the common stocks of large and medium-sized blue chip growth companies. Income is a secondary objective. The Fund's sub-adviser is T. Rowe Price Associates, Inc. (T. Rowe Price).
How did the Fund perform during the 12 months ended December 31, 2008?
The Fund's Initial Class shares returned -42.46%, trailing the -38.44% return of the Russell 1000® Growth Index (the "benchmark"), an unmanaged index consisting of those Russell 1000 securities (representing the 1,000 largest U.S. companies based on market capitalization) with greater-than-average growth orientation that tend to exhibit higher price-to-book ratios and forecasted growth values than securities in the value universe. The Fund also underperformed the -37.00% return of the S&P 500® Index, a widely recognized, unmanaged index representative of common stocks of larger capitalized U.S. companies.
For a discussion on the economic and market environment during the 12-month period ended December 31, 2008, please see the Economic and Market Review, beginning on page 3.
What factors contributed to the Fund's performance?
Health care contributed significantly to the Fund's performance, due to both its place as the second-best performer in the benchmark, and the portfolio's substantially overweight position relative to the benchmark in that sector. Within health care, biotechnology stocks performed strongly. Gilead Sciences continued to gain market share with an impressive HIV therapy franchise. Shares of Genentech were boosted by an acquisition bid from Swiss pharmaceutical maker Roche. Genentech also received Food and Drug Administration approval for Avastin, a drug used in the treatment of breast cancer. The portfolio also benefited from avoiding companies expected to be negatively affected by anticipated health care refo rm. The portfolio maintained a notably overweight position in this sector, on the belief that it offers some of the most attractive near-term growth opportunities. The Fund's underweight position in the energy sector also produced positive relative results. With falling energy prices in the second half of the year, the sector tumbled and was the second-worst performer in the benchmark for the year.
Consumer staples stocks were the primary detractor from the Fund's results relative to the benchmark, as the portfolio held an underweight position in this top-performing sector. A substantially overweight position in financials, the worst benchmark performer, was also a major detractor from the Fund's full-year performance. Stock selection in the capital markets industry had a negative impact. The high-margin business model of capital markets is expected to come under intensified scrutiny in the wake of U.S. Treasury bailouts for many companies in the financials sector. In order to receive government assistance, some traditional investment banks, such as portfolio holdings Morgan Stanley and Goldman Sachs, transformed into traditional deposit-accepting banks. With lower expectations, both of these companies drastically cut expenses, including staffing and compensation. Ameriprise Financial's stock fell on investor concerns about insurance c ompanies. As 2008 came to a close, the portfolio held an overweight position in the financials sector, almost exclusively in capital markets. While cautious, we believe selected capital markets companies are attractively priced.
Consumer discretionary underperformed on stock selection, notably in the hotels, restaurants and leisure industries. Gaming holdings, including Las Vegas Sands and MGM Mirage, notably disappointed. In past downturns, gaming stocks have generally been more defensive than others in the sector, but the current global credit crisis has severely limited access to financing and hampered development efforts. The portfolio has maintained its slightly overweight position in consumer discretionary, concentrated in Internet and catalog retail industry and hotels stocks.
21
MML Blue Chip Growth Fund – Portfolio Manager Report (Continued)
What is your outlook?
While many hope that the worst of the market volatility has run its course, we believe it is very likely that markets will continue to be challenging. Our objective is to identify high-quality large-cap growth companies with strong fundamentals and attractive valuations. Amid tempered growth prospects, we see opportunities to invest in companies that we have been monitoring whose valuations and fundamentals are compelling. We believe that market fears and indiscriminate selling due to forced liquidations can lead to prices becoming disconnected from fundamentals, presenting significant buying opportunities.
22
MML Blue Chip Growth Fund – Portfolio Manager Report (Continued)
MML Blue Chip Growth Fund
Largest Holdings
(% of Net Assets) on 12/31/08
(Unaudited) | |
| Gilead Sciences, Inc. | | | 3.4 | % | |
| Google, Inc. Class A | | | 3.3 | % | |
| Genentech, Inc. | | | 3.1 | % | |
| Apple, Inc. | | | 3.1 | % | |
| Amazon.com, Inc. | | | 3.0 | % | |
| Danaher Corp. | | | 2.8 | % | |
| Microsoft Corp. | | | 2.5 | % | |
| Wal-Mart Stores, Inc. | | | 2.0 | % | |
| Celgene Corp. | | | 2.0 | % | |
| Exxon Mobil Corp. | | | 2.0 | % | |
| | | | 27.2 | % | |
MML Blue Chip Growth Fund
Sector Table
(% of Net Assets) on 12/31/08
(Unaudited) | |
| Consumer, Non-cyclical | | | 28.8 | % | |
| Communications | | | 17.7 | % | |
| Technology | | | 14.7 | % | |
| Consumer, Cyclical | | | 11.0 | % | |
| Financial | | | 10.9 | % | |
| Energy | | | 7.0 | % | |
| Industrial | | | 4.8 | % | |
| Basic Materials | | | 3.6 | % | |
| Utilities | | | 0.6 | % | |
| Total Long-Term Investments | | | 99.1 | % | |
Short-Term Investments and
Other Assets and Liabilities | | | 0.9 | % | |
| Net Assets | | | 100.0 | % | |
23
MML Blue Chip Growth Fund – Portfolio Manager Report (Continued)
Growth of a $10,000 Investment
Hypothetical Investments in MML Blue Chip Growth Fund Initial Class, the Russell 1000 Growth Index and the S&P 500 Index.
TOTAL RETURN
| | | One Year
1/1/08 - 12/31/08 | | Since Inception
Average Annual
5/1/06 - 12/31/08 | |
| Initial Class | | | (42.46 | )% | | | (13.10 | )% | |
| Russell 1000 Growth Index* | | | (38.44 | )% | | | (11.16 | )% | |
| S&P 500 Index | | | (37.00 | )% | | | (11.19 | )% | |
Hypothetical Investments in MML Blue Chip Growth Fund Service Class, the Russell 1000 Growth Index and the S&P 500 Index.
TOTAL RETURN
| | | Since Inception
8/15/08 - 12/31/08 | |
| Service Class | | | (36.17 | )% | |
| Russell 1000 Growth Index* | | | (31.73 | )%+ | |
| S&P 500 Index | | | (28.90 | )%+ | |
GROWTH OF $10,000 INVESTMENT SINCE INCEPTION

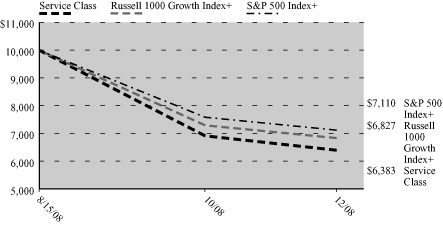
* Benchmark
+ From 9/1/08.
Performance data quoted represents past performance; past performance is not predictive of future results. The investment return and principal value of shares of the Fund will fluctuate with market conditions so that shares of the Fund, when redeemed, may be worth more or less than their original cost. Current performance of the Fund may be lower or higher than the performance quoted. Performance data current to the most recent month end may be obtained by accessing the website www.massmutual.com.
Investors should note that the Fund is a professionally managed mutual fund, while the Russell 1000 Growth Index and the S&P 500 Index are unmanaged, do not incur expenses, and cannot be purchased directly by investors. Investors should read the Fund's prospectus with regard to the Fund's investment objective, risks and charges and expenses in conjunction with these financial statements. The Fund's return reflects changes in the net asset value per share without the deduction of any product charges (e.g., cost of insurance, mortality and expense risk charges, administrative fees, and CDSL). The inclusion of these charges would have reduced the performance shown here.
24
MML Large Cap Growth Fund – Portfolio Manager Report
What is the investment objective of MML Large Cap Growth Fund – and who is the Fund's sub-adviser?
The Fund seeks long-term capital appreciation by normally investing at least 80% of its net assets in the common stocks and securities convertible into common stocks of companies which the Fund's sub-adviser believes offer prospects for long-term growth and which, at the time of purchase, have market capitalizations of at least approximately $10 billion. The Fund's sub-adviser is AllianceBernstein L.P. (AllianceBernstein).
How did the Fund perform during the 12 months ended December 31, 2008?
The Fund's Initial Class shares returned -40.83%, underperforming the -38.44% return of the Russell 1000® Growth Index (the "benchmark"), an unmanaged index consisting of those Russell 1000 securities (representing the 1,000 largest U.S. companies based on market capitalization) with greater-than-average growth orientation that tend to exhibit higher price-to-book ratios and forecasted growth values than securities in the value universe.
For a discussion on the economic and market environment during the 12-month period ended December 31, 2008, please see the Economic and Market Review, beginning on page 3.
What factors contributed to the Fund's performance?
During 2008, strong stock selection in the health care and consumer discretionary sectors could not overcome weak stock selection in the information technology and financials sectors. From an allocation perspective, the portfolio's overweight position in health care was a contributor to its performance relative to the benchmark, while an overweight position in the financials sector detracted.
Four of the top five contributors in 2008 were health care stocks. The best performer, Gilead, is a dominant force in developing genetic drugs for HIV treatments and other expanding segments. With no net debt, steadily expanding cash flow, low patent expiration risk and a strong pipeline of new drugs, Gilead is in an ideal position to continue boosting market share. Other contributors from the health care sector included Teva Pharmaceuticals, Genentech and Celgene. Rounding out the top five portfolio performers was Wrigley in consumer staples – reaffirming the defensive nature of stocks that outperformed. Detractors for the year included CME Group, Google, Nvidia, MEMC Electronic and Apple.
During the year, the wholesale "flight to safety" intensified, as evidence mounted that the global economy was entering a severe slowdown. No equity sector was spared from 2008's broad downturn, as every sector of the market declined. Consumer staples stocks plunged the least, while energy and financials fared worst. Not surprisingly given growth stocks' generally higher-risk profile, the benchmark Russell 1000 Growth Index finished slightly below the Russell 1000 Value Index for the year. Volatility and risk aversion intensified as panicky investors overwhelmingly based decisions on an urgent desire to flee any hint of risk.
What is your outlook?
Economies and financial markets are stuck in a vicious cycle. Fears of an economic depression are accelerating the deleveraging (i.e., debt reduction) in financial markets. As a result, credit is tightening and consumers, corporations and municipal governments are spending less, which slows the economy further. But the cycle can be broken. While the current crisis is as severe as any in modern history, the magnitude and global scope of the policy response in both developed and developing economies is unparalleled. Some market adjustments – such as major fiscal stimulus plans, aggressive monetary easing, government guarantees of bank deposits and liabilities, a plunge in oil prices and lower interbank lending rates – are helpi ng as well.
It is typical in extreme markets that once risk aversion gets broadly priced into stocks, investor selectivity starts to resurface, with investor sentiment typically favoring the higher-quality, more-resilient growth companies in which we've been well represented. History also illustrates that the most reliable investment strategy during turbulent periods is to maintain exposure to companies with the financial resources to prosper and those positioned to capture extraordinary upside opportunities in an eventual recovery. Therefore, our current strategy continues to stress exposure to companies that enjoy the dynamics of leadership in their basic area of business.
25
MML Large Cap Growth Fund – Portfolio Manager Report (Continued)
Looking ahead, there can be no guarantees of market behavior, but history suggests current pricing is unsustainable. We are balancing the need for short-term stability against our desire to remain poised to take advantage of stocks that may be rewarded.
26
MML Large Cap Growth Fund – Portfolio Manager Report (Continued)
MML Large Cap Growth Fund
Largest Holdings
(% of Net Assets) on 12/31/08
(Unaudited) | |
| Hewlett-Packard Co. | | | 6.1 | % | |
| Google, Inc. Class A | | | 5.8 | % | |
| Gilead Sciences, Inc. | | | 5.7 | % | |
| Genentech, Inc. | | | 4.7 | % | |
| Apple, Inc. | | | 4.3 | % | |
| Cisco Systems, Inc. | | | 3.7 | % | |
Teva Pharmaceutical Industries
Ltd. Sponsored ADR (Israel) | | | 3.2 | % | |
| Schlumberger Ltd. | | | 3.1 | % | |
| Celgene Corp. | | | 3.0 | % | |
| PepsiCo, Inc. | | | 2.9 | % | |
| | | | 42.5 | % | |
MML Large Cap Growth Fund
Sector Table
(% of Net Assets) on 12/31/08
(Unaudited) | |
| Consumer, Non-cyclical | | | 39.0 | % | |
| Technology | | | 15.8 | % | |
| Communications | | | 13.0 | % | |
| Financial | | | 9.6 | % | |
| Energy | | | 7.7 | % | |
| Consumer, Cyclical | | | 7.6 | % | |
| Basic Materials | | | 3.8 | % | |
| Industrial | | | 2.5 | % | |
| Total Long-Term Investments | | | 99.0 | % | |
Short-Term Investments and
Other Assets and Liabilities | | | 1.0 | % | |
| Net Assets | | | 100.0 | % | |
27
MML Large Cap Growth Fund – Portfolio Manager Report (Continued)
Growth of a $10,000 Investment
Hypothetical Investments in MML Large Cap Growth Fund Initial Class and the Russell 1000 Growth Index.
TOTAL RETURN
| | | One Year
1/1/08 - 12/31/08 | | Since Inception
Average Annual
5/1/06 - 12/31/08 | |
| Initial Class | | | (40.83 | )% | | | (13.80 | )% | |
| Russell 1000 Growth Index | | | (38.44 | )% | | | (11.16 | )% | |
Hypothetical Investments in MML Large Cap Growth Fund Service Class and the Russell 1000 Growth Index.
TOTAL RETURN
| | | Since Inception
8/15/08 - 12/31/08 | |
| Service Class | | | (32.02 | )% | |
| Russell 1000 Growth Index | | | (31.73 | )%+ | |
GROWTH OF $10,000 INVESTMENT SINCE INCEPTION
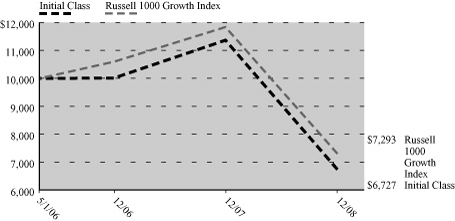
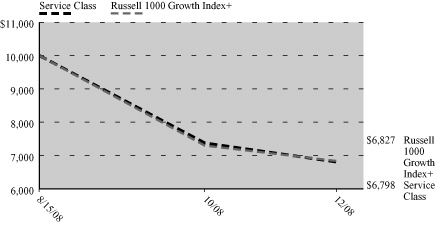
+ From 9/1/08.
Performance data quoted represents past performance; past performance is not predictive of future results. The investment return and principal value of shares of the Fund will fluctuate with market conditions so that shares of the Fund, when redeemed, may be worth more or less than their original cost. Current performance of the Fund may be lower or higher than the performance quoted. Performance data current to the most recent month end may be obtained by accessing the website www.massmutual.com.
Investors should note that the Fund is a professionally managed mutual fund, while the Russell 1000 Growth Index is unmanaged, does not incur expenses, and cannot be purchased directly by investors. Investors should read the Fund's prospectus with regard to the Fund's investment objective, risks and charges and expenses in conjunction with these financial statements. The Fund's return reflects changes in the net asset value per share without the deduction of any product charges (e.g., cost of insurance, mortality and expense risk charges, administrative fees, and CDSL). The inclusion of these charges would have reduced the performance shown here.
28
MML Concentrated Growth Fund – Portfolio Manager Report
What is the investment objective of MML Concentrated Growth Fund – and who is the Fund's sub-adviser?
The Fund seeks long-term growth of capital by investing primarily in common stocks of companies that the Fund's sub-adviser believes offer above-average growth potential and trade at a significant discount to the sub-adviser's assessment of their intrinsic value. Any income realized will be incidental to the Fund's objective. The Fund's sub-adviser is Legg Mason Capital Management, Inc. (Legg Mason).
How did the Fund perform during the 12 months ended December 31, 2008?
The Fund's Class I shares returned -59.87%, significantly underperforming the -38.44% return of the Russell 1000® Growth Index (the "benchmark"), an unmanaged index consisting of those Russell 1000 securities (representing the 1000 largest U.S. companies based on market capitalization) with greater-than-average growth orientation that tend to exhibit higher price-to-book ratios and forecasted growth values than securities in the value universe.
For a discussion on the economic and market environment during the 12-month period ended December 31, 2008, please see the Economic and Market Review, beginning on page 3.
What factors contributed to the Fund's performance?
Investors saw a historically difficult year in 2008. Asset classes around the world from Chinese equities to Spanish real estate saw sharp declines as troubles in the U.S. housing market spread, ultimately culminating in a global recession.
There was significant upheaval in domestic equity markets, particularly among financials, as erstwhile giants Bear Stearns and Lehman Brothers perished, government-sponsored enterprises (GSEs) Fannie Mae and Freddie Mac were put into conservatorship by the U.S. Government, and global insurance giant AIG required billions in government loans to survive. The year ended on a slight positive, with a modest rebound in stock prices in late November and December amid constructive policy developments and optimism about the new presidential administration, but losses were severe for the year.
During 2008, the Fund's losses in the financials sector were a primary culprit contributing to the Fund's significant underperformance relative to the benchmark, with primary detractors for the year including Citigroup, AIG, Freddie Mac and Merrill Lynch. Each of these companies suffered multi-billion-dollar writedowns (i.e., the reduction of the book value of an asset because it is overvalued compared to the market value) from mortgage-backed securities or credit default swaps and ended up either forced to accept government loans or getting taken over.
Specific holdings also hampered the Fund's performance throughout 2008: Reliant Energy tumbled after it was forced to seek more expensive financing for its retail power business and worries emerged that the company might have to find a partner. Mobile phone company Nokia hit a rough patch and saw its share price slide as worries emerged over both the size of the addressable market and Nokia's market share.
What is your outlook?
We see several factors that suggest the market could well move higher from here. First, money markets are experiencing some relief. Second, mortgage-backed security yields have fallen, and the 30-year mortgage rate is declining towards the government's implicit target of 4.5%. Third, we expect the narrowing of credit spreads (the differences in yields between comparable Treasury and non-Treasury securities), which has been slowly developing at the short end of the yield curve and in the highest-quality instruments, to gradually work its way to the longer end of the curve and more long-duration assets. (The yield curve is a graphical representation of bond yields with very short maturities to the longest available, with the curve indica ting whether short-term rates are higher or lower than long-term rates.)
We believe the market, and our portfolio in particular, is about as attractively valued as we have ever seen it.
29
MML Concentrated Growth Fund – Portfolio Manager Report (Continued)
While it is possible that the markets may retest the lows of the fall of 2008, we believe investors are being afforded one of the best buying opportunities in several generations. Since we believe much of the overall market is markedly underpriced, we have responded by broadening the portfolio and expanding the number of portfolio holdings. High-quality names are as cheap as lower-quality names in many cases, so we have moved up the quality spectrum without sacrificing expected returns.
30
MML Concentrated Growth Fund – Portfolio Manager Report (Continued)
MML Concentrated Growth Fund
Largest Holdings
(% of Net Assets) on 12/31/08
(Unaudited) | |
| Caterpillar, Inc. | | | 4.4 | % | |
| Yahoo!, Inc. | | | 4.2 | % | |
| Cisco Systems, Inc. | | | 4.1 | % | |
| Qualcomm, Inc. | | | 4.0 | % | |
Nokia Oyj Sponsored ADR
(Finland) | | | 4.0 | % | |
| Quanta Services, Inc. | | | 4.0 | % | |
| PepsiCo, Inc. | | | 3.8 | % | |
| State Street Corp. | | | 3.7 | % | |
| EMC Corp. | | | 3.7 | % | |
| Amazon.com, Inc. | | | 3.6 | % | |
| | | | 39.5 | % | |
MML Concentrated Growth Fund
Sector Table
(% of Net Assets) on 12/31/08
(Unaudited) | |
| Communications | | | 25.0 | % | |
| Consumer, Non-cyclical | | | 17.4 | % | |
| Industrial | | | 17.2 | % | |
| Financial | | | 10.0 | % | |
| Consumer, Cyclical | | | 9.5 | % | |
| Technology | | | 9.2 | % | |
| Energy | | | 7.6 | % | |
| Basic Materials | | | 2.2 | % | |
| Total Long-Term Investments | | | 98.1 | % | |
Short-Term Investments and
Other Assets and Liabilities | | | 1.9 | % | |
| Net Assets | | | 100.0 | % | |
31
MML Concentrated Growth Fund – Portfolio Manager Report (Continued)
Growth of a $10,000 Investment
Hypothetical Investments in MML Concentrated Growth Fund Class I, Class II and the Russell 1000 Growth Index.
TOTAL RETURN
| | | One Year
1/1/08 - 12/31/08 | | Since Inception
Average Annual
5/1/06 -12/31/08 | |
| Class I | | | (59.87 | )% | | | (24.53 | )% | |
| Class II | | | (59.82 | )% | | | (24.44 | )% | |
| Russell 1000 Growth Index | | | (38.44 | )% | | | (11.16 | )% | |
Hypothetical Investments in MML Concentrated Growth Fund Service Class and the Russell 1000 Growth Index.
TOTAL RETURN
| | | Since Inception
8/15/08 - 12/31/08 | |
| Service Class | | | (49.32 | )% | |
| Russell 1000 Growth Index | | | (31.73 | )%+ | |
GROWTH OF $10,000 INVESTMENT SINCE INCEPTION


+ From 9/1/08.
Performance data quoted represents past performance; past performance is not predictive of future results. The investment return and principal value of shares of the Fund will fluctuate with market conditions so that shares of the Fund, when redeemed, may be worth more or less than their original cost. Current performance of the Fund may be lower or higher than the performance quoted. Performance data current to the most recent month end may be obtained by accessing the website www.massmutual.com.
Investors should note that the Fund is a professionally managed mutual fund, while the Russell 1000 Growth Index is unmanaged, does not incur expenses, and cannot be purchased directly by investors. Investors should read the Fund's prospectus with regard to the Fund's investment objective, risks and charges and expenses in conjunction with these financial statements. The Fund's return reflects changes in the net asset value per share without the deduction of any product charges (e.g., cost of insurance, mortality and expense risk charges, administrative fees, and CDSL). The inclusion of these charges would have reduced the performance shown here.
32
MML Mid Cap Value Fund – Portfolio Manager Report
What is the investment objective of MML Mid Cap Value Fund – and who is the Fund's sub-adviser?
The Fund seeks long-term capital growth by investing in equity securities of companies which the Fund's sub-adviser believes offer prospects for long-term capital growth. Income is a secondary objective. The Fund's sub-adviser is American Century Investment Management, Inc. (American Century).
How did the Fund perform during the 12 months ended December 31, 2008?
The Fund's Initial Class shares returned -24.51%, significantly outperforming the -38.44% return of Russell Midcap® Value Index (the "benchmark"), a widely recognized, unmanaged index that measures the performance of those companies in the Russell Midcap Index with lower price-to-book ratios and lower forecasted growth values.
For a discussion on the economic and market environment during the 12-month period ended December 31, 2008, please see the Economic and Market Review, beginning on page 3.
What factors contributed to the Fund's performance?
Domestic equity indexes were universally down in 2008, with value and growth stocks generally providing similar returns. Nevertheless, the portfolio substantially outpaced its benchmark, largely because of its emphasis on less-risky businesses with sound balance sheets. The Fund benefited most from its mix of financials, consumer discretionary and utilities stocks. Detractors were scattered across various sectors.
Although the Fund began the period with an overweight position relative to the benchmark in the consumer discretionary sector, the portfolio management team gradually trimmed holdings there. Relative performance ultimately benefited from an underweight position, as investors shied away from consumer discretionary stocks in response to the housing downturn, slowing economic growth and mounting unemployment. Also advantageous was a lack of exposure to media companies and Internet and catalog retailers, as both industries were down significantly for the year.
Financial stocks suffered deep declines during the period, but the portfolio's focus on higher-quality companies with strong balance sheets and reliable funding sources benefited the Fund's performance relative to the benchmark. The financials sector provided two top holdings – People's United Financial and The Chubb Corp. Furthermore, security selection – particularly long-term investments in electric and gas utilities – boosted results. A notable position was IDACORP, an electric utility primarily operating in Idaho. Another contributor, Puget Energy, which delivers electricity and gas to customers in Washington State, agreed to be acquired by a private equity group.
The portfolio received positive relative contributions from all 10 sectors in which it was invested. Its detractors were broadly distributed. The financials sector, for example, held top detractor AllianceBernstein Holding LP. The asset manager experienced weak investment performance, compounding a decline in assets under management that accompanied the decline in the financial markets. The portfolio also held an underweight position in real estate investment trusts (REITs), due to the management team's concerns about this segment's access to funding and amount of leverage. Although a smaller-than-the-benchmark position added value for much of the year, it later detracted when REITs outperformed late in 2008.
The portfolio's position in health care added to relative results, but the sector also provided a key detractor. Beckman Coulter, a manufacturer of diagnostic testing instruments and supplies, performed well for much of the year. However, as biomedical laboratory capital expenditure budgets were reduced, its share price declined. The company also reported weaker-than-expected margins for the third quarter of 2008.
What is your outlook?
The portfolio management team continues to follow a disciplined, bottom-up process, selecting companies one at a time for the portfolio. As of December 31, 2008, the team saw opportunities in consumer staples, industrials and health care stocks – views which were reflected in the portfolio's overweight positions in these sectors relative to the benchmark. Conversely, fundamental analysis and valuation work led to smaller relative weightings in financials and consumer discretionary stocks.
33
MML Mid Cap Value Fund – Portfolio Manager Report (Continued)
MML Mid Cap Value Fund
Largest Holdings
(% of Net Assets) on 12/31/08
(Unaudited) | |
| Marsh & McLennan Cos., Inc. | | | 3.3 | % | |
| Kimberly-Clark Corp. | | | 2.6 | % | |
| Bce, Inc. | | | 2.3 | % | |
| Molex, Inc. | | | 2.2 | % | |
| Equitable Resources, Inc. | | | 2.1 | % | |
| Beckman Coulter, Inc. | | | 2.1 | % | |
| WGL Holdings, Inc. | | | 2.0 | % | |
| Wisconsin Energy Corp. | | | 2.0 | % | |
| Westar Energy, Inc. | | | 1.9 | % | |
| Portland General Electric Co. | | | 1.9 | % | |
| | | | 22.4 | % | |
MML Mid Cap Value Fund
Sector Table
(% of Net Assets) on 12/31/08
(Unaudited) | |
| Financial | | | 20.9 | % | |
| Consumer, Non-cyclical | | | 19.2 | % | |
| Utilities | | | 14.9 | % | |
| Industrial | | | 13.5 | % | |
| Consumer, Cyclical | | | 8.7 | % | |
| Technology | | | 5.7 | % | |
| Basic Materials | | | 5.5 | % | |
| Energy | | | 4.8 | % | |
| Communications | | | 3.5 | % | |
| Funds | | | 1.6 | % | |
| Total Long-Term Investments | | | 98.3 | % | |
Short-Term Investments and
Other Assets and Liabilities | | | 1.7 | % | |
| Net Assets | | | 100.0 | % | |
34
MML Mid Cap Value Fund – Portfolio Manager Report (Continued)
Growth of a $10,000 Investment
Hypothetical Investments in MML Mid Cap Value Fund Initial Class and the Russell Midcap Value Index.
TOTAL RETURN
| | | One Year
1/1/08 - 12/31/08 | | Since Inception
Average Annual
5/1/06 - 12/31/08 | |
| Initial Class | | | (24.51 | )% | | | (7.16 | )% | |
| Russell Midcap Value Index | | | (38.44 | )% | | | (13.88 | )% | |
Hypothetical Investments in MML Mid Cap Value Fund Service Class and the Russell Midcap Value Index.
TOTAL RETURN
| | | Since Inception
8/15/08 - 12/31/08 | |
| Service Class | | | (23.62 | )% | |
| Russell Midcap Value Index | | | (33.78 | )%+ | |
GROWTH OF $10,000 INVESTMENT SINCE INCEPTION
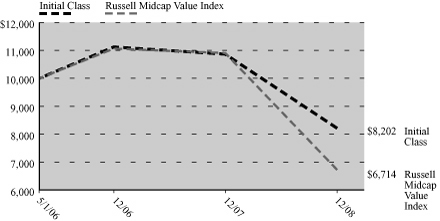
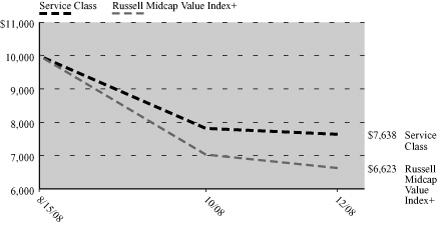
+ From 9/1/08.
Performance data quoted represents past performance; past performance is not predictive of future results. The investment return and principal value of shares of the Fund will fluctuate with market conditions so that shares of the Fund, when redeemed, may be worth more or less than their original cost. Current performance of the Fund may be lower or higher than the performance quoted. Performance data current to the most recent month end may be obtained by accessing the website www.massmutual.com.
Investors should note that the Fund is a professionally managed mutual fund, while the Russell Midcap Value Index is unmanaged, does not incur expenses, and cannot be purchased directly by investors. Investors should read the Fund's prospectus with regard to the Fund's investment objective, risks and charges and expenses in conjunction with these financial statements. The Fund's return reflects changes in the net asset value per share without the deduction of any product charges (e.g., cost of insurance, mortality and expense risk charges, administrative fees, and CDSL). The inclusion of these charges would have reduced the performance shown here.
35
MML Mid Cap Growth Fund – Portfolio Manager Report
What is the investment objective of MML Mid Cap Growth Fund – and who is the Fund's sub-adviser?
The Fund seeks long-term capital appreciation by investing, under normal conditions, at least 80% of its net assets in a broadly diversified portfolio of common stocks of mid-cap companies whose earnings the Fund's sub-adviser expects to grow at a faster rate than the average company. The Fund's sub-adviser is T. Rowe Price Associates, Inc. (T. Rowe Price).
How did the Fund perform during the 12 months ended December 31, 2008?
The Fund's Initial Class shares returned -40.21%, exceeding the -44.32% return of the Russell Midcap® Growth Index (the "benchmark"), a widely recognized, unmanaged index that measures the performance of those Russell Midcap companies with higher price-to-book ratios and higher forecasted growth values. Conversely, the Fund's -40.21% return trailed the -36.23% return of the S&P MidCap 400® Index, a widely recognized, unmanaged index representative of common stocks of mid-capitalized U.S. companies.
For a discussion on the economic and market environment during the 12-month period ended December 31, 2008, please see the Economic and Market Review, beginning on page 3.
What factors contributed to the Fund's performance?
Industrials and business services were the greatest contributors to the Fund's performance in 2008, due to favorable stock selection within those areas. Two key holdings here were Roper Industries and Alliant Techsystems. Industrials and business services remain important areas of investment for the portfolio – areas represented by a broad range of holdings. Aerospace and defense is a focus for the Fund, in light of the ongoing expansion of the armed forces as part of the global war on terror. We also invest in firms operating in machinery, industrial conglomerates and electrical equipment.
Stock selection made health care another significant contributor to the Fund's 2008 returns. An overweight position relative to the benchmark in the biotechnology industry proved beneficial, particularly our positions in Cephalon, Imclone Systems and Myriad Genetics. Biotechnology fell victim to the economic downturn that continued in the fourth quarter of 2008, with most firms showing absolute losses, though it held up better than the rest of the health care sector. Cephalon benefited due to their successful promotion of two major drugs in their development pipeline. Imclone proved a good choice when Eli Lilly announced that it would acquire the firm at a premium; the deal closed during the fourth quarter. Myriad Genetics announced it would spin off its drug development business in order to focus on its core competency of diagnostics. Other important holdings included Edwards Lifesciences and Valeant Pharmaceuticals. The Fund's overweight p osition in this sector boosted relative returns as well.
Our stock selection in information technology was another area of strength for the Fund. We did well to limit the Fund's exposure to firms involved with semiconductors, as they were particularly hard hit in 2008. On the positive side, FLIR Systems and SAIC both helped relative returns. Infrared vision equipment manufacturer FLIR Systems announced the largest contract in its history, agreeing to develop a sensor system for the U.S. Army and Missile Defense Command. Defense contractor SAIC also benefited from government contracts, allowing it to maintain its earnings forecast in a period when many peers had to revise expectations downward.
Energy was the leading detractor for the portfolio in 2008, due to weak stock selection. Energy prices plummeted from record highs in the second half of the year in response to the global economic slowdown. Poor performance here stemmed in part from our lack of exposure to natural gas-oriented firms, as natural gas prices held up better than other fuel sources. Coal was particularly hard hit, and coal-producing holdings like Peabody Energy and Massey Energy suffered.
Consumer staples stocks were another area of weakness, due to stock selection and a detrimental underweight position. A leading detractor here was Whole Foods Market, whose upscale offerings are a hard sell in tough economic times and whose recent acquisition of Wild Oats continued to be a drag on earnings.
36
MML Mid Cap Growth Fund – Portfolio Manager Report (Continued)
What is your outlook?
The hasty and panicked attempt at deleveraging in the second half of 2008 had profoundly negative consequences for stocks. Hedge funds were at the forefront of this meltdown, just as they were in the inflation of the bubble. In recent months, hedge funds have liquidated vast amounts of equity, a move that hit our investment universe especially hard, as mid-cap growth stocks have been one of their favored hunting grounds. Panic selling can create opportunities; consequently, we are looking to buy attractively valued companies. Though the length and severity of the current downturn are unclear, we believe that the majority of companies in our portfolio will emerge intact and in a stronger competitive position.
37
MML Mid Cap Growth Fund – Portfolio Manager Report (Continued)
MML Mid Cap Growth Fund
Largest Holdings
(% of Net Assets) on 12/31/08
(Unaudited) | |
| Roper Industries, Inc. | | | 1.9 | % | |
| Cephalon, Inc. | | | 1.9 | % | |
| FLIR Systems, Inc. | | | 1.9 | % | |
| Rockwell Collins, Inc. | | | 1.7 | % | |
| Ametek, Inc. | | | 1.6 | % | |
| SAIC, Inc. | | | 1.5 | % | |
| Agnico-Eagle Mines Ltd. | | | 1.5 | % | |
| Alliant Techsystems, Inc. | | | 1.4 | % | |
| Western Union Co. | | | 1.3 | % | |
| Juniper Networks, Inc. | | | 1.3 | % | |
| | | | 16.0 | % | |
MML Mid Cap Growth Fund
Sector Table
(% of Net Assets) on 12/31/08
(Unaudited) | |
| Consumer, Non-cyclical | | | 25.3 | % | |
| Industrial | | | 16.4 | % | |
| Communications | | | 13.8 | % | |
| Technology | | | 11.9 | % | |
| Consumer, Cyclical | | | 11.6 | % | |
| Energy | | | 8.0 | % | |
| Financial | | | 5.4 | % | |
| Basic Materials | | | 2.0 | % | |
| Utilities | | | 0.2 | % | |
| Unknown | | | 0.1 | % | |
| Total Long-Term Investments | | | 94.7 | % | |
Short-Term Investments and
Other Assets and Liabilities | | | 5.3 | % | |
| Net Assets | | | 100.0 | % | |
38
MML Mid Cap Growth Fund – Portfolio Manager Report (Continued)
Growth of a $10,000 Investment
Hypothetical Investments in MML Mid Cap Growth Fund Initial Class, the Russell Midcap Growth Index and the S&P MidCap 400 Index.
TOTAL RETURN
| | | One Year
1/1/08 - 12/31/08 | | Since Inception
Average Annual
5/1/06 - 12/31/08 | |
| Initial Class | | | (40.21 | )% | | | (12.39 | )% | |
| Russell Midcap Growth Index* | | | (44.32 | )% | | | (15.65 | )% | |
| S&P MidCap 400 Index | | | (36.23 | )% | | | (12.71 | )% | |
Hypothetical Investments in MML Mid Cap Growth Fund Service Class, the Russell Midcap Growth Index and the S&P MidCap 400 Index.
TOTAL RETURN
| | | Since Inception
8/15/08 - 12/31/08 | |
| Service Class | | | (36.09 | )% | |
| Russell Midcap Growth Index* | | | (38.46 | )%+ | |
| S&P MidCap 400 Index | | | (28.90 | )%+ | |
GROWTH OF $10,000 INVESTMENT SINCE INCEPTION
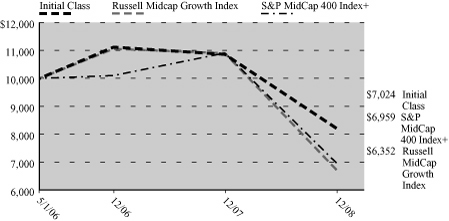

* Benchmark
+ From 9/1/08.
Performance data quoted represents past performance; past performance is not predictive of future results. The investment return and principal value of shares of the Fund will fluctuate with market conditions so that shares of the Fund, when redeemed, may be worth more or less than their original cost. Current performance of the Fund may be lower or higher than the performance quoted. Performance data current to the most recent month end may be obtained by accessing the website www.massmutual.com.
Investors should note that the Fund is a professionally managed mutual fund, while the Russell Midcap Growth Index and the S&P MidCap 400 Index are unmanaged, do not incur expenses, and cannot be purchased directly by investors. Investors should read the Fund's prospectus with regard to the Fund's investment objective, risks and charges and expenses in conjunction with these financial statements. The Fund's return reflects changes in the net asset value per share without the deduction of any product charges (e.g., cost of insurance, mortality and expense risk charges, administrative fees, and CDSL). The inclusion of these charges would have reduced the performance shown here.
39
MML Small/Mid Cap Value Fund – Portfolio Manager Report
What is the investment objective of MML Small/Mid Cap Value Fund (formerly known as MML Small Cap Value Fund) – and who is the Fund's sub-adviser?
The Fund seeks long-term total return by investing, under normal circumstances, at least 80% of its net assets in a broadly diversified portfolio of equity investments in small- and mid-cap U.S. issuers, including foreign issuers that are traded in the United States. The Fund's sub-adviser is AllianceBernstein L.P. (AllianceBernstein).
How did the Fund perform during the 12 months ended December 31, 2008?
The Fund's Initial Class shares returned -38.34%, underperforming the -36.79% return of the Russell 2500TM Index (the "benchmark"), an unmanaged index that measures the performance of the 2,500 smallest companies in the Russell 3000® Index, which measures the performance of the 3,000 largest U.S. companies based on total market capitalization. The Fund's -38.34% return also significantly trailed the -28.92% return of the Russell 2000® Value Index, a widely recognized, unmanaged index that measures the performance of those Russell 2000 Index Companies with lower price-to-book ratios and lower forecasted growth rates.
Going forward, the Fund's performance will be compared to the Russell 2500 Index rather than the Russell 2000 Value Index because the Russell 2500 Index more closely represents the Fund's new investment strategy.
For a discussion on the economic and market environment during the 12-month period ended December 31, 2008, please see the Economic and Market Review, beginning on page 3.
What factors contributed to the Fund's performance?
Equity markets around the world collapsed in 2008 as investor anxiety over global economic growth intensified. U.S. smaller-cap markets were no exception, with the Russell 2000 and Russell 2500 Indexes down 34% and 37%, respectively – returns that were roughly in line with the S&P 500® Index's loss of 37%. Within the Russell 2500, all sectors fell, with utilities (down 21%), and financials (down 29%) seeing the smallest declines. Sectors with exposure to the global economy, such as energy (down 54%), or consumers, such as consumer cyclicals (down 48%), saw indiscriminate sell-offs. Hedge fund deleveraging (i.e., debt reduction) was a distorting influence on returns, pushing up retur ns of smaller companies, primarily in the third quarter of 2008. Returns to value and quality factors were muted, and in some cases negative, as investor anxiety pushed up the price of companies with perceived defensive characteristics – regardless of valuation.
The majority of the Fund's underperformance came from adverse stock selection, which, while broadly based, was focused more in cyclical sectors, such as capital equipment and technology. Offsetting this somewhat was positive relative stock selection in financials, where a number of the portfolio's bank and insurance holdings enjoyed favorable performance relative to the benchmark. Also helping was solid stock selection in transportation, where lower fuel prices led to outperformance of some of the portfolio's airline and trucking holdings.
Sector selection was a more modest detractor for the year, with an underweight position in utilities (where stocks did well due to investor perceptions about their defensive characteristics) being the biggest detractor. An overweight position in transportation issues was the biggest relative contributor to the Fund's performance, driven by the perceived benefit of lower fuel prices. Specific stocks that outperformed the benchmark included Platinum Underwriters, Arkansas Best, Arch Capital Group, Amerigroup and Provident Financial. Specific stocks that underperformed included Reliant Energy, TRW Automotive, Brunswick, Rockwood Holdings and Cytec Industries.
What is your outlook?
Investor anxiety over depressed global economic growth and continued financial contagion has deepened the value opportunity in smaller-cap markets. Furthermore, the indiscriminate sell-off of any stock with perceived exposure to the global economy and the distortive impact of hedge fund deleveraging have created a higher-quality bias to this opportunity. We are seeking to capture a diverse array of compelling opportunities – including many in cyclical industries – while guarding against the
40
MML Small/Mid Cap Value Fund – Portfolio Manager Report (Continued)
risk of a prolonged economic downturn. Overall, we've traded up in quality, but we also favor some attractively valued leveraged firms that we deem less risky than they appear.
We remain sensitive to the fact that the causes of investor anxiety may continue for some time and the risks from this – that companies with perceived exposure to the consumer and the economy will underperform – are higher than average in the short term. Offsetting this risk somewhat, in our view, is the quality and business model strength of the companies we are adding to the portfolio. We believe this will allow them to navigate the current environment and in many cases, emerge stronger, as weaker competitors fall by the wayside. Further, given their current valuations, we feel that the longer-term return potential for these opportunities is compelling and we have begun adding them to the portfolio – when we believe that the risk is justified by the potential returns.
41
MML Small/Mid Cap Value Fund – Portfolio Manager Report (Continued)
MML Small/Mid Cap Value Fund
Largest Holdings
(% of Net Assets) on 12/31/08
(Unaudited) | |
| Aspen Insurance Holdings Ltd. | | | 1.8 | % | |
| AMERIGROUP Corp. | | | 1.7 | % | |
Platinum Underwriters Holdings
Ltd. | | | 1.7 | % | |
| Ruddick Corp. | | | 1.7 | % | |
| Northeast Utilities | | | 1.6 | % | |
| Del Monte Foods Co. | | | 1.5 | % | |
| Arch Capital Group Ltd. | | | 1.5 | % | |
| Atmos Energy Corp. | | | 1.4 | % | |
| Mueller Industries, Inc. | | | 1.4 | % | |
| Terex Corp. | | | 1.4 | % | |
| | | | 15.7 | % | |
MML Small/Mid Cap Value Fund
Sector Table
(% of Net Assets) on 12/31/08
(Unaudited) | |
| Financial | | | 21.9 | % | |
| Industrial | | | 17.6 | % | |
| Consumer, Non-cyclical | | | 17.4 | % | |
| Consumer, Cyclical | | | 13.5 | % | |
| Technology | | | 5.3 | % | |
| Basic Materials | | | 5.1 | % | |
| Energy | | | 5.0 | % | |
| Utilities | | | 4.1 | % | |
| Communications | | | 1.4 | % | |
| Total Long-Term Investments | | | 91.3 | % | |
Short-Term Investments and
Other Assets and Liabilities | | | 8.7 | % | |
| Net Assets | | | 100.0 | % | |
42
MML Small/Mid Cap Value Fund – Portfolio Manager Report (Continued)
Growth of a $10,000 Investment
Hypothetical Investments in MML Small/Mid Cap Value Fund Initial Class, the Russell 2500 Index and the Russell 2000 Value Index.
TOTAL RETURN
| | | One Year
1/1/08 - 12/31/08 | | Since Inception
Average Annual
5/1/06 - 12/31/08 | |
| Initial Class | | | (38.34 | )% | | | (21.18 | )% | |
| Russell 2500 Index* | | | (36.79 | )% | | | (14.07 | )% | |
| Russell 2000 Value Index | | | (28.92 | )% | | | (12.72 | )% | |
Hypothetical Investments in MML Small/Mid Cap Value Fund Service Class, the Russell 2500 Index and the Russell 2000 Value Index.
TOTAL RETURN
| | | Since Inception
8/15/08 - 12/31/08 | |
| Service Class | | | (35.76 | )% | |
| Russell 2500 Index* | | | (33.58 | )%+ | |
| Russell 2000 Value Index | | | (28.41 | )%+ | |
GROWTH OF $10,000 INVESTMENT SINCE INCEPTION


* Benchmark
+ From 9/1/08.
Performance data quoted represents past performance; past performance is not predictive of future results. The investment return and principal value of shares of the Fund will fluctuate with market conditions so that shares of the Fund, when redeemed, may be worth more or less than their original cost. Current performance of the Fund may be lower or higher than the performance quoted. Performance data current to the most recent month end may be obtained by accessing the website www.massmutual.com.
Investors should note that the Fund is a professionally managed mutual fund, while the Russell 2500 Index and the Russell 2000 Value Index are unmanaged, do not incur expenses, and cannot be purchased directly by investors. Investors should read the Fund's prospectus with regard to the Fund's investment objective, risks and charges and expenses in conjunction with these financial statements. The Fund's return reflects changes in the net asset value per share without the deduction of any product charges (e.g., cost of insurance, mortality and expense risk charges, administrative fees, and CDSL). The inclusion of these charges would have reduced the performance shown here.
43
MML Small Cap Index Fund – Portfolio Manager Report
What is the investment objective of MML Small Cap Index Fund – and who is the Fund's sub-adviser?
The Fund seeks to provide investment results approximating (before fees and expenses) the aggregate price and dividend performance of the securities in the Standard & Poor's SmallCap 600® Index (S&P SmallCap 600 Index). The Fund's sub-adviser is Northern Trust Investments, N.A. (NTI).
How did the Fund perform during the 12 months ended December 31, 2008?
The Fund's Initial Class shares returned -31.36%, moderately trailing the -31.08% return of the S&P SmallCap 600 Index (the "benchmark"), a widely recognized, capitalization-weighted unmanaged index of common stocks chosen by Standard & Poor's for industry group representation, market size, liquidity, adequate float size and other trading requirements. The Index tracks the performance of the small-cap portion of the U.S. equity market.
For a discussion on the economic and market environment during the 12-month period ended December 31, 2008, please see the Economic and Market Review, beginning on page 3.
What factors contributed to the Fund's performance?
Sector performance was uniformly negative for the year 2008. Financials, the largest sector in the benchmark, returned -25.08% for the year. Industrials and information technology, which cumulatively account for 34.9% of the benchmark, returned -27.01% and -40.37%, respectively. Telecommunication services, the weakest sector during the 12-month period, returned -52.35% for 2008.
The year was marked by extreme volatility in equity markets around the world, as the effects of the subprime mortgage crisis ricocheted throughout the financial system, resulting in a global credit crunch and economic slowdown. The near collapse of Bear Stearns in March of 2008, and the subsequent U.S. Government-orchestrated purchase of the bank by J.P. Morgan marked the beginning of a series of bank failures and government interventions. Following the bailout of Fannie Mae and Freddie Mac, the bankruptcy filing of Lehman Brothers, the acquisition of Merrill Lynch by Bank of America, the provision of an $85 billion emergency rescue loan to insurance giant American International Group (AIG) and the failure of Washington Mutual, a comprehensive fiscal rescue plan was developed by U.S. Government officials and congressional lawmakers.
The election of Barack Obama as the 44th president of the United States sparked a brief rally in early November, but market volatility subsequently continued nearly unchecked, as grim economic news persisted – including the announcement that the U.S. officially slid into a recession in December of 2007.
Oil prices peaked in the third quarter of 2008 and fell throughout the fourth quarter, closing at $41.02 a barrel on December 31.
What is your outlook?
As we entered 2009, investors faced a wide array of challenges. These included the ongoing housing and subprime mortgage crises, rapidly escalating unemployment, and the new threat of deflation, to name just a few. Despite these uncertainties, we believe that the Fund continues to be positioned to pursue returns that are relatively in line with those of the S&P SmallCap 600 Index during 2009.
"Standard & Poor's®", "S&P®", "Standard & Poor's SmallCap 600" and "S&P SmallCap 600" are trademarks of The McGraw-Hill Companies, Inc. and have been licensed for use by the Fund. The Fund is not sponsored, endorsed, sold or promoted by Standard & Poor's and Standard & Poor's makes no representation regarding the advisability of investing in the Fund.
44
MML Small Cap Index Fund – Portfolio Manager Report (Continued)
MML Small Cap Index Fund
Largest Holdings
(% of Net Assets) on 12/31/08
(Unaudited) | |
| Piedmont Natural Gas Co., Inc. | | | 0.7 | % | |
| Itron, Inc. | | | 0.7 | % | |
| Atmos Energy Corp. | | | 0.7 | % | |
| Senior Housing Properties Trust | | | 0.6 | % | |
| Landstar System, Inc. | | | 0.6 | % | |
Watson Wyatt Worldwide, Inc.
Class A | | | 0.6 | % | |
| Immucor, Inc. | | | 0.6 | % | |
| ProAssurance Corp. | | | 0.5 | % | |
| Clarcor, Inc. | | | 0.5 | % | |
| New Jersey Resources Corp. | | | 0.5 | % | |
| | | | 6.0 | % | |
MML Small Cap Index Fund
Sector Table
(% of Net Assets) on 12/31/08
(Unaudited) | |
| Financial | | | 20.4 | % | |
| Industrial | | | 20.1 | % | |
| Consumer, Non-cyclical | | | 19.5 | % | |
| Consumer, Cyclical | | | 13.9 | % | |
| Technology | | | 8.4 | % | |
| Utilities | | | 5.4 | % | |
| Communications | | | 4.3 | % | |
| Energy | | | 3.7 | % | |
| Basic Materials | | | 2.4 | % | |
| Total Long-Term Investments | | | 98.1 | % | |
Short-Term Investments and
Other Assets and Liabilities | | | 1.9 | % | |
| Net Assets | | | 100.0 | % | |
45
MML Small Cap Index Fund – Portfolio Manager Report (Continued)
Growth of a $10,000 Investment
Hypothetical Investments in MML Small Cap Index Fund Initial Class and the S&P SmallCap 600 Index.
TOTAL RETURN
| | | One Year
1/1/08 - 12/31/08 | | Since Inception
Average Annual
5/1/06 - 12/31/08 | |
| Initial Class | | | (31.36 | )% | | | (12.88 | )% | |
| S&P SmallCap 600 Index | | | (31.08 | )% | | | (12.47 | )% | |
Hypothetical Investments in MML Small Cap Index Fund Service Class and the S&P SmallCap 600 Index.
TOTAL RETURN
| | | Since Inception
8/15/08 - 12/31/08 | |
| Service Class | | | (31.75 | )% | |
| S&P SmallCap 600 Index | | | (30.23 | )%+ | |
GROWTH OF $10,000 INVESTMENT SINCE INCEPTION
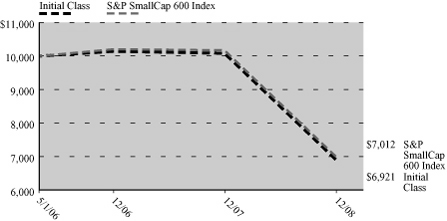
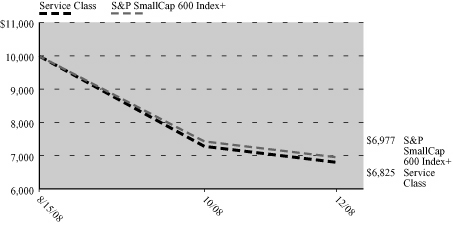
+ From 9/1/08.
Performance data quoted represents past performance; past performance is not predictive of future results. The investment return and principal value of shares of the Fund will fluctuate with market conditions so that shares of the Fund, when redeemed, may be worth more or less than their original cost. Current performance of the Fund may be lower or higher than the performance quoted. Performance data current to the most recent month end may be obtained by accessing the website www.massmutual.com.
Investors should note that the Fund is a professionally managed mutual fund, while the S&P SmallCap 600 Index is unmanaged, does not incur expenses, and cannot be purchased directly by investors. Investors should read the Fund's prospectus with regard to the Fund's investment objective, risks and charges and expenses in conjunction with these financial statements. The Fund's return reflects changes in the net asset value per share without the deduction of any product charges (e.g., cost of insurance, mortality and expense risk charges, administrative fees, and CDSL). The inclusion of these charges would have reduced the performance shown here.
46
MML Global Fund – Portfolio Manager Report
What is the investment objective of MML Global Fund – and who is the Fund's sub-adviser?
The Fund seeks long-term capital appreciation by mainly investing in the securities of U.S. and foreign companies, including companies in developed and emerging industrialized markets. The Fund's sub-adviser is Neuberger Berman Management, Inc. (Neuberger Berman).
How did the Fund perform during the 12 months ended December 31, 2008?
The Fund's Class I shares returned -43.70%, lagging the -40.71% return of the Morgan Stanley Capital International, Inc. ("MSCI®") World Index (the "benchmark"), an unmanaged index of issuers listed on the stock exchanges of 20 foreign countries and the U.S.
For a discussion on the economic and market environment during the 12-month period ended December 31, 2008, please see the Economic and Market Review, beginning on page 3.
What factors contributed to the Fund's performance?
With respect to the Fund's domestic component, the financials sector was the largest detractor from the portfolio's overall performance in 2008. The remaining nine sectors detracted from absolute performance as well, with the greatest harm coming from health care, industrials, energy and technology. As 2008 came to a close, we maintained the portfolio's underweight position in financials on the belief that credit conditions will likely worsen before government actions begin to bear fruit. We also shifted our focus towards names that we believe have enough capital to withstand further writedowns and to take advantage of changes in the industry. (A writedown is the reduction of the book value of an asset bec ause it is overvalued compared to the market value.)
Globally, there was simply no place to hide in the market, as evidenced by the fact that all 10 sectors, as well as all of the national stock markets represented in the MSCI World-ex U.S. Index declined for the year. During 2008, the portfolio's significantly underweight position relative to the benchmark in financials and materials benefited relative returns. Conversely, our investments in the energy and information technology sectors underperformed their corresponding benchmark sector components.
Over the course of the year, we substantially reduced our exposure to the energy sector in response to flagging global demand and falling energy prices – and the portfolio's allocation to energy is now in line with the benchmark. Finally, our tilt toward smaller companies and the poor performance of several of our largest positions were responsible for lagging returns in the information technology sector.
What is your outlook?
On the domestic front, we expect further economic contraction in 2009 and believe that stocks may continue to decline until investors see clear evidence that the economy is beginning to recover. Nevertheless, as the U.S. Government works aggressively to stabilize the financial system and help the consumer get back on track, we may see some positive change towards the end of the year. We have invested in companies that are in position to endure the difficult times, and in some cases, profit from the failure of their competitors. We continue to focus on companies that we believe have attractive valuations, solid balance sheets and high earnings quality.
With the credit crisis and turmoil in the financial markets obscuring the near-term outlook for the global economy and corporate profits, we remain cautious. We believe we have positioned the portfolio defensively, having added consumer staples and health care names, while decreasing our exposure to companies in the more economically sensitive energy, financials and materials sectors. Across all sectors, we are focusing on high-quality, more nimble companies with minimal near-term refinancing needs.
47
MML Global Fund – Portfolio Manager Report (Continued)
MML Global Fund
Largest Holdings
(% of Net Assets) on 12/31/08
(Unaudited) | |
| Exxon Mobil Corp. | | | 3.0 | % | |
| Occidental Petroleum Corp. | | | 2.5 | % | |
| JP Morgan Chase & Co. | | | 2.1 | % | |
| AT&T, Inc. | | | 1.8 | % | |
| Vodafone Group PLC | | | 1.6 | % | |
| Nihon Kohden Corp. | | | 1.5 | % | |
| CVS Caremark Corp. | | | 1.5 | % | |
| Johnson & Johnson | | | 1.4 | % | |
The Bank of New York
Mellon Corp. | | | 1.4 | % | |
| Merck & Co., Inc. | | | 1.2 | % | |
| | | | 18.0 | % | |
MML Global Fund
Country Weightings
(% of Net Assets) on 12/31/08
(Unaudited) | |
| United States | | | 46.0 | % | |
| Japan | | | 8.5 | % | |
| United Kingdom | | | 7.1 | % | |
| Germany | | | 5.0 | % | |
| France | | | 4.2 | % | |
| Netherlands | | | 3.6 | % | |
| Switzerland | | | 3.2 | % | |
| Canada | | | 2.2 | % | |
| Belgium | | | 2.0 | % | |
| Bermuda | | | 1.9 | % | |
| Brazil | | | 1.4 | % | |
| Spain | | | 1.1 | % | |
| Cayman Islands | | | 1.0 | % | |
| Italy | | | 0.8 | % | |
| Ireland | | | 0.7 | % | |
| Israel | | | 0.7 | % | |
| Sweden | | | 0.6 | % | |
| Hong Kong | | | 0.6 | % | |
| Norway | | | 0.5 | % | |
| Denmark | | | 0.5 | % | |
| Singapore | | | 0.5 | % | |
| Republic of Korea | | | 0.4 | % | |
| India | | | 0.4 | % | |
| Finland | | | 0.4 | % | |
| Cyprus | | | 0.4 | % | |
| Chile | | | 0.4 | % | |
| Total Long-Term Investments | | | 94.1 | % | |
Short-Term Investments and
Other Assets and Liabilities | | | 5.9 | % | |
| Net Assets | | | 100.0 | % | |
48
MML Global Fund – Portfolio Manager Report (Continued)
Growth of a $10,000 Investment
Hypothetical Investments in MML Global Fund Class I, Class II and the MSCI World Index.
TOTAL RETURN
| | | One Year
1/1/08 - 12/31/08 | | Since Inception
Average Annual
5/1/06 - 12/31/08 | |
| Class I | | | (43.70 | )% | | | (16.42 | )% | |
| Class II | | | (43.27 | )% | | | (16.11 | )% | |
| MSCI World Index | | | (40.71 | )% | | | (12.21 | )% | |
Hypothetical Investments in MML Global Fund Service Class and the MSCI World Index.
TOTAL RETURN
| | | Since Inception
8/15/08 - 12/31/08 | |
| Service Class | | | (33.21 | )% | |
| MSCI World Index | | | (31.08 | )%+ | |
GROWTH OF $10,000 INVESTMENT SINCE INCEPTION
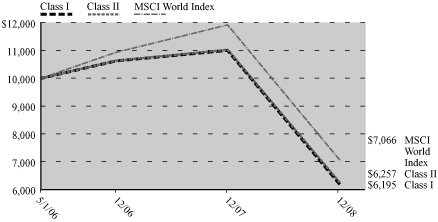
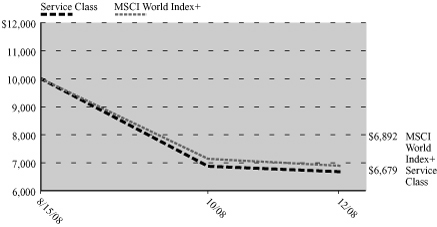
+ From 9/1/08.
Performance data quoted represents past performance; past performance is not predictive of future results. The investment return and principal value of shares of the Fund will fluctuate with market conditions so that shares of the Fund, when redeemed, may be worth more or less than their original cost. Current performance of the Fund may be lower or higher than the performance quoted. Performance data current to the most recent month end may be obtained by accessing the website www.massmutual.com.
Investors should note that the Fund is a professionally managed mutual fund, while the MSCI World Index is unmanaged, does not incur expenses, and cannot be purchased directly by investors. Investors should read the Fund's prospectus with regard to the Fund's investment objective, risks and charges and expenses in conjunction with these financial statements. The Fund's return reflects changes in the net asset value per share without the deduction of any product charges (e.g., cost of insurance, mortality and expense risk charges, administrative fees, and CDSL). The inclusion of these charges would have reduced the performance shown here.
49
MML Foreign Fund – Portfolio Manager Report
What is the investment objective of MML Foreign Fund – and who is the Fund's sub-adviser?
The Fund seeks long-term capital growth by investing, under normal market conditions, at least 80% of its net assets in investments of issuers located outside the U.S., including those in emerging markets. The Fund's sub-adviser is Templeton Investment Counsel, LLC (Templeton).
How did the Fund perform during the 12 months ended December 31, 2008?
The Fund's Initial Class shares returned -41.07%, outperforming the -43.38% return of the Morgan Stanley Capital International Europe, Australasia, Far East ("MSCI® EAFE®") Index (the "benchmark"), a widely recognized, unmanaged index representative of foreign securities in the major non-U.S. markets of Europe, Australia and the Far East.
For a discussion on the economic and market environment during the 12-month period ended December 31, 2008, please see the Economic and Market Review, beginning on page 3.
What factors contributed to the Fund's performance?
During 2008, Fund performance relative to the benchmark suffered from stock selection in the health care sector. In particular, sector holdings including Celesio, a German drug wholesaler, and Olympus, a Japanese manufacturer of medical imaging equipment, detracted from the Fund's results.
Stock selection and an underweight position relative to the benchmark in the utilities sector also hurt the Fund's relative performance – as did stock selection and an overweight position in the information technology sector. In particular, Germany's Infineon Technologies was a significant detractor. In the telecommunication services sector, Norway-based Telenor and Russia's Mobile TeleSystems2 hurt relative results.
The U.S. dollar appreciated versus most foreign currencies for the year, which also hampered the Fund's performance because investments in securities with non-U.S. currency exposure lost value as the dollar rose.
Contributors to relative performance included the Fund's underweight position and stock selection in the troubled financials sector. The Fund's investments in the insurance industry were particularly beneficial, and Swiss property and casualty insurance and reinsurance organization ACE2 and German reinsurance and primary insurance provider Muenchener Rueckversicherungs-Gesellschaft helped results. Promise, a Japanese consumer finance company, also contributed to relative returns.
The Fund's underweight position and stock selection in the materials sector benefited its relative results. In particular, portfolio holdings in Australian packaging company Amcor, Finnish printing paper producer UPM-Kymmene, and Irish building materials producer CRH benefited relative performance. A few individual holdings from the telecommunication services sector also aided relative results, as did the Fund's overweight position in the diversified telecommunications services industry, where key contributors included Spain-based telecommunications operator Telefonica2 and France-based France Telecom.
What is your outlook?
Our investment focus has always centered on individual companies and longer-term returns. Although it may take some time for markets to stabilize, we believe that recent market declines offer much potential. We are confident that we can find opportunities among the downtrodden sectors that have been overlooked by others, and we plan to leverage the opportunities available from the bargains we uncover.
50
MML Foreign Fund – Portfolio Manager Report (Continued)
MML Foreign Fund
Largest Holdings
(% of Net Assets) on 12/31/08
(Unaudited) | |
Telefonica SA Sponsored
ADR (Spain) | | | 2.5 | % | |
| France Telecom SA | | | 2.2 | % | |
| Novartis AG | | | 2.2 | % | |
| Nestle SA | | | 2.1 | % | |
| Sanofi-Aventis | | | 2.0 | % | |
| Total SA | | | 1.7 | % | |
| Royal Dutch Shell PLC Class B | | | 1.7 | % | |
| Siemens AG | | | 1.7 | % | |
| GlaxoSmithKline PLC | | | 1.7 | % | |
| E.ON AG | | | 1.6 | % | |
| | | | 19.4 | % | |
MML Foreign Fund
Country Weightings
(% of Net Assets) on 12/31/08
(Unaudited) | |
| United Kingdom | | | 21.0 | % | |
| France | | | 11.1 | % | |
| Germany | | | 10.5 | % | |
| Switzerland | | | 8.6 | % | |
| Japan | | | 6.4 | % | |
| Spain | | | 4.1 | % | |
| Republic of Korea | | | 3.4 | % | |
| Netherlands | | | 3.3 | % | |
| Italy | | | 2.8 | % | |
| Taiwan | | | 2.7 | % | |
| Singapore | | | 2.5 | % | |
| Brazil | | | 1.6 | % | |
| Canada | | | 1.4 | % | |
| Hong Kong | | | 1.4 | % | |
| Sweden | | | 1.3 | % | |
| South Africa | | | 1.2 | % | |
| Israel | | | 1.1 | % | |
| Austria | | | 1.1 | % | |
| Finland | | | 1.0 | % | |
| Mexico | | | 0.9 | % | |
| Australia | | | 0.9 | % | |
| China | | | 0.9 | % | |
| Portugal | | | 0.9 | % | |
| Norway | | | 0.8 | % | |
| Bermuda | | | 0.7 | % | |
| Denmark | | | 0.7 | % | |
| India | | | 0.5 | % | |
| Russia | | | 0.5 | % | |
| Ireland | | | 0.5 | % | |
| United States | | | 0.0 | % | |
| Total Long-Term Investments | | | 93.8 | % | |
Short-Term Investments and
Other Assets and Liabilities | | | 6.2 | % | |
| Net Assets | | | 100.0 | % | |
51
MML Foreign Fund – Portfolio Manager Report (Continued)
Growth of a $10,000 Investment
Hypothetical Investments in MML Foreign Fund Initial Class and the MSCI EAFE Index.
TOTAL RETURN
| | | One Year
1/1/08 - 12/31/08 | | Since Inception
Average Annual
5/1/06 - 12/31/08 | |
| Initial Class | | | (41.07 | )% | | | (10.49 | )% | |
| MSCI EAFE Index | | | (43.38 | )% | | | (12.81 | )% | |
Hypothetical Investments in MML Foreign Fund Service Class and the MSCI EAFE Index.
TOTAL RETURN
| | | Since Inception
8/15/08 - 12/31/08 | |
| Service Class | | | (28.99 | )% | |
| MSCI EAFE Index | | | (31.53 | )%+ | |
GROWTH OF $10,000 INVESTMENT SINCE INCEPTION
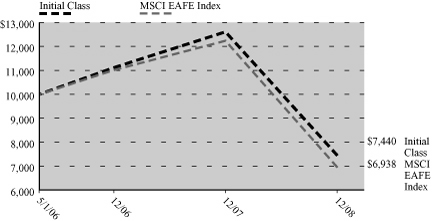
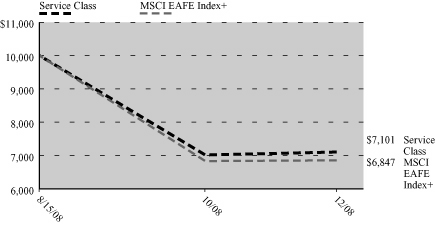
+ From 9/1/08.
Performance data quoted represents past performance; past performance is not predictive of future results. The investment return and principal value of shares of the Fund will fluctuate with market conditions so that shares of the Fund, when redeemed, may be worth more or less than their original cost. Current performance of the Fund may be lower or higher than the performance quoted. Performance data current to the most recent month end may be obtained by accessing the website www.massmutual.com.
Investors should note that the Fund is a professionally managed mutual fund, while the MSCI EAFE Index is unmanaged, does not incur expenses, and cannot be purchased directly by investors. Investors should read the Fund's prospectus with regard to the Fund's investment objective, risks and charges and expenses in conjunction with these financial statements. The Fund's return reflects changes in the net asset value per share without the deduction of any product charges (e.g., cost of insurance, mortality and expense risk charges, administrative fees, and CDSL). The inclusion of these charges would have reduced the performance shown here.
52
MML Allocation Fund Series – Portfolio Manager Report
What are the investment objectives of the Funds that comprise the MML Allocation Series – and who is the Series' investment adviser?
The MML Allocation Fund Series comprises five Funds – each of which has a "fund of funds" structure. The five Funds in the Series are MML Conservative Allocation Fund, MML Balanced Allocation Fund, MML Moderate Allocation Fund, MML Growth Allocation Fund and MML Aggressive Allocation Fund.
Each Fund seeks to achieve as high a total rate of return on an annual basis as is considered consistent with prudent investment risk and the preservation of capital. Each Fund invests in a combination of equity, fixed income and money market funds ("underlying funds") advised primarily by Massachusetts Mutual Life Insurance Company (MassMutual) or a control affiliate of MassMutual, as well as in nonaffiliated funds using a specific asset allocation strategy (which varies by Fund, as described below). Underlying funds can include series of the MML Series Investment Fund, MML Series Investment Fund II, OppenheimerFunds, which are advised by OppenheimerFunds, Inc. (OFI) and non-affiliated funds.
Each Fund's assets are allocated to its underlying funds according to an asset allocation strategy, as follows:
• MML Conservative Allocation Fund: Approximately 40% in equity funds and 60% in fixed-income funds, including money market funds.
• MML Balanced Allocation Fund: Approximately 50% in equity funds and 50% in fixed-income funds, including money market funds.
• MML Moderate Allocation Fund: Approximately 60% in equity funds and 40% in fixed-income funds, including money market funds.
• MML Growth Allocation Fund: Approximately 75% in equity funds and 25% in fixed-income funds, including money market funds.
• MML Aggressive Allocation Fund: Approximately 90% in equity funds and 10% in fixed-income funds, including money market funds.
The Series' investment adviser is MassMutual.
How did each Fund perform during the 12 months ended December 31, 2008?
The return of each Fund's Initial Class shares is shown below. Also shown are the returns of each Fund's custom index; the Russell 3000® Index, which measures the performance of the 3,000 largest U.S. companies based on total market capitalization; the Morgan Stanley Capital International ("MSCI®") World Ex-U.S. Index, an unmanaged index representative of stocks domiciled in global developed markets, excluding the United States; and the Barclays Capital U.S. Aggregate Bond Index, an unmanaged index of fixed-rate investment-grade securities with at least one year to maturity combining the Barclays Capital U.S. Government/Credit Bond Index and the Barclays Capital U.S. Mortgage-Backed Securities Index.
MML Conservative
Allocation Fund | | Custom
Index | | Russell 3000
Index | | MSCI World
Ex-U.S. Index | | Barclays Capital
U.S. Aggregate
Bond Index | |
| | -19.38 | % | | | -13.46 | % | | | -37.31 | % | | | -45.21 | % | | | 5.24 | %* | |
MML Balanced
Allocation Fund | | | |
| | -24.70 | % | | | -17.91 | % | | | -37.31 | %* | | | -45.21 | % | | | 5.24 | % | |
MML Moderate
Allocation Fund | | | |
| | -27.69 | % | | | -22.27 | % | | | -37.31 | %* | | | -45.21 | % | | | 5.24 | % | |
* Benchmark return
53
MML Allocation Fund Series – Portfolio Manager Report (Continued)
MML Growth
Allocation Fund | | Custom
Index | | Russell 3000
Index | | MSCI World
Ex-U.S. Index | | Barclays Capital
U.S. Aggregate
Bond Index | |
| | -33.53 | % | | | -28.64 | % | | | -37.31 | %* | | | -45.21 | % | | | 5.24 | % | |
MML Aggressive
Allocation Fund | |
| | -38.43 | % | | | -34.79 | % | | | -37.31 | %* | | | -45.21 | % | | | 5.24 | % | |
All of the MML Allocation Fund Series Funds underperformed their respective custom indexes for the full year – and all five Funds (each of which has a stock component) lagged the Barclays Capital U.S. Aggregate Bond Index by a significant margin. Conversely, all of the MML Allocation Series Funds, with the exception of the MML Aggressive Allocation Fund, outperformed the Russell 3000 Index. Finally, all five Funds outpaced the MSCI World Ex-U.S. Index.
MML Allocation Series Custom Indexes
• The Custom MML Conservative Allocation Index comprises the Russell 3000 Index, the MSCI World ex-U.S. Index and the Barclays Capital U.S. Aggregate Bond Index. The weightings of each Index can vary, depending on the weightings of the underlying mutual funds that comprise the MML Conservative Allocation Fund.
• The Custom MML Balanced Allocation Index comprises the Russell 3000 Index, the MSCI World ex-U.S. Index and the Barclays Capital U.S. Aggregate Bond Index. The weightings of each Index can vary, depending on the weightings of the underlying mutual funds that comprise the MML Balanced Allocation Fund.
• The Custom MML Moderate Allocation Index comprises the Russell 3000 Index, the MSCI World ex-U.S. Index and the Barclays Capital U.S. Aggregate Bond Index. The weightings of each Index can vary, depending on the weightings of the underlying mutual funds that comprise the MML Moderate Allocation Fund.
• The Custom MML Growth Allocation Index comprises the Russell 3000 Index, the MSCI World ex-U.S. Index and the Barclays Capital U.S. Aggregate Bond Index. The weightings of each Index can vary, depending on the weightings of the underlying mutual funds that comprise the MML Growth Allocation Fund.
• The Custom MML Aggressive Allocation Index comprises the Russell 3000 Index, the MSCI World ex-U.S. Index and the Barclays Capital U.S. Aggregate Bond Index. The weightings of each Index can vary, depending on the weightings of the underlying mutual funds that comprise the MML Aggressive Allocation Fund.
For a discussion on the economic and market environment during the 12-month period ended December 31, 2008, please see the Economic and Market Review, beginning on page 3.
What factors contributed to the Funds' performance?
For 2008, investors experienced a domino effect from the housing crisis that morphed into an economic crisis – providing few, if any, areas to find compelling investment opportunities. The year can be defined as "a flight to quality," as less-risky asset classes outperformed better ones. International developed equities topped emerging markets, domestic equities topped international equities. Within fixed-income, Treasuries were positive, while corporate high-yield bonds fell substantially. The demand for Treasuries pushed yields to near zero levels, as investors were willing to give up income in exchange for safety of principal.
* Benchmark return
54
MML Allocation Fund Series – Portfolio Manager Report (Continued)
Within the fixed-income components, exposure to Treasury inflation-protected securities ("TIPS") was beneficial, relative to Treasuries, until mid-year, when inflationary concerns relaxed and coincided with a drop in oil prices. High-yield bonds, which have higher correlations to equities, responded in a similar fashion to equities, declining markedly for the year. The flight to quality and fear that lower-quality companies would be more susceptible to defaults during a weakening economy placed downward pressure on pricing. Between TIPS' turning tide and exposure to Oppenheimer Strategic Bond Fund, which has approximately two-thirds of its multi-sector strategy exposed to high-yield and international bonds, performance of the Allocation Fund Series portfolios was negatively impacted by the fixed-income components.
On the equity side, a few factors that helped the Allocation Fund Series portfolios' performance included a well-diversified blend of investments, coupled with strategies performing well in their respective categories – mid-cap value and growth, small-cap growth and the international strategies. Large-cap growth funds were detractors from the portfolios' performance, as stock selection and exposure to financials weighed heavily. From an allocation perspective, an underweight position in international equities was beneficial.
What is your outlook?
Numerous forces will continue to influence the direction of the markets in the coming year: As 2009 began, the federal funds rate is at the lowest level in history, the Federal Reserve and U.S. Treasury were expected to continue to provide liquidity in the markets in attempts to support economic stabilization, businesses were under pressure with diminished earnings, and the consumer continued to be beleaguered. Furthermore, unemployment rates were on the rise and home prices continued to fall. Despite these uncertainties, however, we believe that the funds in the Allocation Fund Series are still appropriate for investors seeking a diversified portfolio across market sectors, market capitalizations, styles and managers.
55
MML Allocation Fund Series – Portfolio Manager Report (Continued)
MML Conservative Allocation Fund
Asset Allocation
(% of Net Assets) on 12/31/08
(Unaudited) | |
| Equity Funds | | | 41.9 | % | |
| Fixed Income Funds | | | 58.1 | % | |
| Total Long-Term Investments | | | 100.0 | % | |
| Other Assets and Liabilities | | | (0.0 | )% | |
| Net Assets | | | 100.0 | % | |
MML Balanced Allocation Fund
Asset Allocation
(% of Net Assets) on 12/31/08
(Unaudited) | |
| Equity Funds | | | 52.0 | % | |
| Fixed Income Funds | | | 48.0 | % | |
| Total Long-Term Investments | | | 100.0 | % | |
| Other Assets and Liabilities | | | (0.0 | )% | |
| Net Assets | | | 100.0 | % | |
MML Moderate Allocation Fund
Asset Allocation
(% of Net Assets) on 12/31/08
(Unaudited) | |
| Equity Funds | | | 62.1 | % | |
| Fixed Income Funds | | | 37.9 | % | |
| Total Long-Term Investments | | | 100.0 | % | |
| Other Assets and Liabilities | | | (0.0 | )% | |
| Net Assets | | | 100.0 | % | |
MML Growth Allocation Fund
Asset Allocation
(% of Net Assets) on 12/31/08
(Unaudited) | |
| Equity Funds | | | 76.6 | % | |
| Fixed Income Funds | | | 23.4 | % | |
| Total Long-Term Investments | | | 100.0 | % | |
| Other Assets and Liabilities | | | (0.0 | )% | |
| Net Assets | | | 100.0 | % | |
MML Aggressive Allocation Fund
Asset Allocation
(% of Net Assets) on 12/31/08
(Unaudited) | |
| Equity Funds | | | 91.0 | % | |
| Fixed Income Funds | | | 9.1 | % | |
| Total Long-Term Investments | | | 100.1 | % | |
| Other Assets and Liabilities | | | (0.1 | )% | |
| Net Assets | | | 100.0 | % | |
56
MML Conservative Allocation Fund – Portfolio Manager Report (Continued)
Growth of a $10,000 Investment
Hypothetical Investments in MML Conservative Allocation Fund Initial Class, the Barclays Capital U.S. Aggregate Bond Index, the Russell 3000 Index, the MSCI World Ex-U.S. Index and the Custom MML Conservative Allocation Index.
TOTAL RETURN
| | | One Year
1/1/08 - 12/31/08 | | Since Inception
Average Annual
8/31/07 - 12/31/08 | |
| Initial Class | | | (19.38 | )% | | | (12.93 | )% | |
Barclays Capital U.S. Aggregate
Bond Index* | | | 5.24 | % | | | 6.84 | %+ | |
| Russell 3000 Index | | | (37.31 | )% | | | (29.45 | )%+ | |
| MSCI World Ex-U.S. Index | | | (45.21 | )% | | | (32.95 | )%+ | |
Custom MML Conservative
Allocation Index | | | (13.46 | )% | | | (8.44 | )%+ | |
Hypothetical Investments in MML Conservative Allocation Fund Service Class, the Barclays Capital U.S. Aggregate Bond Index, the Russell 3000 Index, the MSCI World Ex-U.S. Index and the Custom MML Conservative Allocation Index.
TOTAL RETURN
| | | Since Inception
8/15/08 - 12/31/08 | |
| Service Class | | | (16.85 | )% | |
| Barclays Capital U.S. Aggregate Bond Index* | | | 3.17 | %++ | |
| Russell 3000 Index | | | (30.04 | )%++ | |
| MSCI World Ex-U.S. Index | | | (33.05 | )%++ | |
| Custom MML Conservative Allocation Index | | | (10.42 | )%++ | |
GROWTH OF $10,000 INVESTMENT SINCE INCEPTION

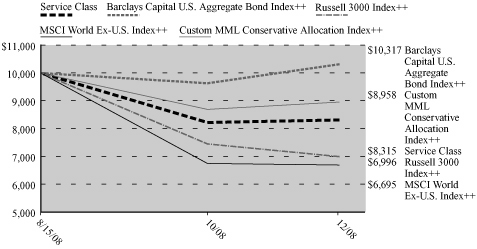
* Benchmark
+ From 9/3/07.
++ From 9/1/08.
Performance data quoted represents past performance; past performance is not predictive of future results. The investment return and principal value of shares of the Fund will fluctuate with market conditions so that shares of the Fund, when redeemed, may be worth more or less than their original cost. Current performance of the Fund may be lower or higher than the performance quoted. Performance data current to the most recent month end may be obtained by accessing the website www.massmutual.com.
Investors should note that the Fund is a professionally managed mutual fund, the Barclays Capital U.S. Aggregate Bond Index, the Russell 3000 Index, the MSCI World Ex-U.S. Index and the Custom MML Conservative Allocation Index are unmanaged, do not incur expenses, and cannot be purchased directly by investors. Investors should read the Fund's prospectus with regard to the Fund's investment objective, risks and charges and expenses in conjunction with these financial statements. The Fund's return reflects changes in the net asset value per share without the deduction of any product charges (e.g., cost of insurance, mortality and expense risk charges, administrative fees, and CDSL). The inclusion of these charges would have reduced the performance shown here.
57
MML Balanced Allocation Fund – Portfolio Manager Report (Continued)
Growth of a $10,000 Investment
Hypothetical Investments in MML Balanced Allocation Fund Initial Class, the Russell 3000 Index, the Barclays Capital U.S. Aggregate Bond Index, the MSCI World Ex-U.S. Index and the Custom MML Balanced Allocation Index.
TOTAL RETURN
| | | One Year
1/1/08 - 12/31/08 | | Since Inception
Average Annual
8/31/07 - 12/31/08 | |
| Initial Class | | | (24.70 | )% | | | (17.35 | )% | |
| Russell 3000 Index* | | | (37.31 | )% | | | (29.45 | )%+ | |
Barclays Capital U.S. Aggregate
Bond Index | | | 5.24 | % | | | 6.84 | %+ | |
| MSCI World Ex-U.S. Index | | | (45.21 | )% | | | (32.95 | )%+ | |
Custom MML Balanced
Allocation Index | | | (17.91 | )% | | | (12.17 | )%+ | |
Hypothetical Investments in MML Balanced Allocation Fund Service Class, the Russell 3000 Index, the Barclays Capital U.S. Aggregate Bond Index, the MSCI World Ex-U.S. Index and the Custom MML Balanced Allocation Index.
TOTAL RETURN
| | | Since Inception
8/15/08 - 12/31/08 | |
| Service Class | | | (20.94 | )% | |
| Russell 3000 Index* | | | (30.04 | )%++ | |
| Barclays Capital U.S. Aggregate Bond Index | | | 3.17 | %++ | |
| MSCI World Ex-U.S. Index | | | (33.05 | )%++ | |
| Custom MML Balanced Allocation Index | | | (13.80 | )%++ | |
GROWTH OF $10,000 INVESTMENT SINCE INCEPTION
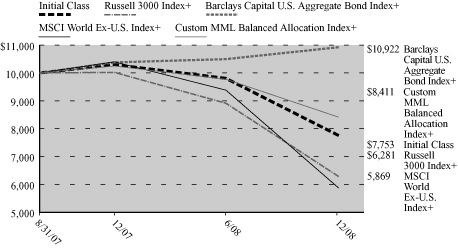
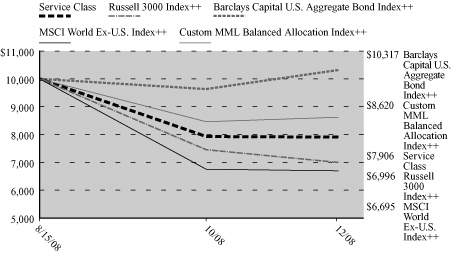
* Benchmark
+ From 9/3/07.
++ From 9/1/08.
Performance data quoted represents past performance; past performance is not predictive of future results. The investment return and principal value of shares of the Fund will fluctuate with market conditions so that shares of the Fund, when redeemed, may be worth more or less than their original cost. Current performance of the Fund may be lower or higher than the performance quoted. Performance data current to the most recent month end may be obtained by accessing the website www.massmutual.com.
Investors should note that the Fund is a professionally managed mutual fund, while the Russell 3000 Index, the Barclays Capital U.S. Aggregate Bond Index, the MSCI World Ex-U.S. Index and the Custom MML Balanced Allocation Index are unmanaged, do not incur expenses, and cannot be purchased directly by investors. Investors should read the Fund's prospectus with regard to the Fund's investment objective, risks and charges and expenses in conjunction with these financial statements. The Fund's return reflects changes in the net asset value per share without the deduction of any product charges (e.g., cost of insurance, mortality and expense risk charges, administrative fees, and CDSL). The inclusion of these charges would have reduced the performance shown here.
58
MML Moderate Allocation Fund – Portfolio Manager Report (Continued)
Growth of a $10,000 Investment
Hypothetical Investments in MML Moderate Allocation Fund Initial Class, the Russell 3000 Index, the Barclays Capital U.S. Aggregate Bond Index, the MSCI World Ex-U.S. Index and the Custom MML Moderate Allocation Index.
TOTAL RETURN
| | | One Year
1/1/08 - 12/31/08 | | Since Inception
Average Annual
8/31/07 - 12/31/08 | |
| Initial Class | | | (27.69 | )% | | | (20.00 | )% | |
| Russell 3000 Index* | | | (37.31 | )% | | | (29.45 | )%+ | |
Barclays Capital U.S. Aggregate
Bond Index | | | 5.24 | % | | | 6.84 | %+ | |
| MSCI World Ex-U.S. Index | | | (45.21 | )% | | | (32.95 | )%+ | |
Custom MML Moderate
Allocation Index | | | (22.27 | )% | | | (15.85 | )%+ | |
Hypothetical Investments in MML Moderate Allocation Fund Service Class, the Russell 3000 Index, the Barclays Capital U.S. Aggregate Bond Index, the MSCI World Ex-U.S. Index and the Custom MML Moderate Allocation Index.
TOTAL RETURN
| | | Since Inception
8/15/08 - 12/31/08 | |
| Service Class | | | (23.09 | )% | |
| Russell 3000 Index* | | | (30.04 | )%++ | |
| Barclays Capital U.S. Aggregate Bond Index | | | 3.17 | %++ | |
| MSCI World Ex-U.S. Index | | | (33.05 | )%++ | |
| Custom MML Moderate Allocation Index | | | (17.17 | )%++ | |
GROWTH OF $10,000 INVESTMENT SINCE INCEPTION


* Benchmark
+ From 9/3/07.
++ From 9/1/08.
Performance data quoted represents past performance; past performance is not predictive of future results. The investment return and principal value of shares of the Fund will fluctuate with market conditions so that shares of the Fund, when redeemed, may be worth more or less than their original cost. Current performance of the Fund may be lower or higher than the performance quoted. Performance data current to the most recent month end may be obtained by accessing the website www.massmutual.com.
Investors should note that the Fund is a professionally managed mutual fund, while the Russell 3000 Index, the Barclays Capital U.S. Aggregate Bond Index, the MSCI World Ex-U.S. Index and the Custom MML Moderate Allocation Index are unmanaged, do not incur expenses, and cannot be purchased directly by investors. Investors should read the Fund's prospectus with regard to the Fund's investment objective, risks and charges and expenses in conjunction with these financial statements. The Fund's return reflects changes in the net asset value per share without the deduction of any product charges (e.g., cost of insurance, mortality and expense risk charges, administrative fees, and CDSL). The inclusion of these charges would have reduced the performance shown here.
59
MML Growth Allocation Fund – Portfolio Manager Report (Continued)
Growth of a $10,000 Investment
Hypothetical Investments in MML Growth Allocation Fund Initial Class, the Russell 3000 Index, the Barclays Capital U.S. Aggregate Bond Index, the MSCI World Ex-U.S. Index and the Custom MML Growth Allocation Index.
TOTAL RETURN
| | | One Year
1/1/08 - 12/31/08 | | Since Inception
Average Annual
8/31/07 - 12/31/08 | |
| Initial Class | | | (33.53 | )% | | | (24.99 | )% | |
| Russell 3000 Index* | | | (37.31 | )% | | | (29.45 | )%+ | |
Barclays Capital U.S. Aggregate
Bond Index | | | 5.24 | % | | | 6.84 | %+ | |
| MSCI World Ex-U.S. Index | | | (45.21 | )% | | | (32.95 | )%+ | |
Custom MML Growth
Allocation Index | | | (28.64 | )% | | | (21.30 | )%+ | |
Hypothetical Investments in MML Growth Allocation Fund Service Class, the Russell 3000 Index, the Barclays Capital U.S. Aggregate Bond Index, the MSCI World Ex-U.S. Index and the Custom MML Growth Allocation Index.
TOTAL RETURN
| | | Since Inception
8/15/08 - 12/31/08 | |
| Service Class | | | (27.61 | )% | |
| Russell 3000 Index* | | | (30.04 | )%++ | |
| Barclays Capital U.S. Aggregate Bond Index | | | 3.17 | %++ | |
| MSCI World Ex-U.S. Index | | | (33.05 | )%++ | |
| Custom MML Growth Allocation Index | | | (22.23 | )%++ | |
GROWTH OF $10,000 INVESTMENT SINCE INCEPTION


* Benchmark
+ From 9/3/07.
++ From 9/1/08.
Performance data quoted represents past performance; past performance is not predictive of future results. The investment return and principal value of shares of the Fund will fluctuate with market conditions so that shares of the Fund, when redeemed, may be worth more or less than their original cost. Current performance of the Fund may be lower or higher than the performance quoted. Performance data current to the most recent month end may be obtained by accessing the website www.massmutual.com.
Investors should note that the Fund is a professionally managed mutual fund, while the Russell 3000 Index, the Barclays Capital U.S. Aggregate Bond Index, the MSCI World Ex-U.S. Index and the Custom MML Growth Allocation Index are unmanaged, do not incur expenses, and cannot be purchased directly by investors. Investors should read the Fund's prospectus with regard to the Fund's investment objective, risks and charges and expenses in conjunction with these financial statements. The Fund's return reflects changes in the net asset value per share without the deduction of any product charges (e.g., cost of insurance, mortality and expense risk charges, administrative fees, and CDSL). The inclusion of these charges would have reduced the performance shown here.
60
MML Aggressive Allocation Fund – Portfolio Manager Report (Continued)
Growth of a $10,000 Investment
Hypothetical Investments in MML Aggressive Allocation Fund Initial Class, the Russell 3000 Index, the Barclays Capital U.S. Aggregate Bond Index, the MSCI World Ex-U.S. Index and the Custom MML Aggressive Allocation Index.
TOTAL RETURN
| | | One Year
1/1/08 - 12/31/08 | | Since Inception
Average Annual
8/31/07 - 12/31/08 | |
| Initial Class | | | (38.43 | )% | | | (29.33 | )% | |
| Russell 3000 Index* | | | (37.31 | )% | | | (29.45 | )%+ | |
Barclays Capital U.S. Aggregate
Bond Index | | | 5.24 | % | | | 6.84 | %+ | |
| MSCI World Ex-U.S. Index | | | (45.21 | )% | | | (32.95 | )%+ | |
Custom MML Aggressive
Allocation Index | | | (34.79 | )% | | | (26.66 | )%+ | |
Hypothetical Investments in MML Aggressive Allocation Fund Service Class, the Russell 3000 Index, the Barclays Capital U.S. Aggregate Bond Index, the MSCI World Ex-U.S. Index and the Custom MML Aggressive Allocation Index.
TOTAL RETURN
| | | Since Inception
8/15/08 - 12/31/08 | |
| Service Class | | | (31.62 | )% | |
| Russell 3000 Index* | | | (30.04 | )%++ | |
| Barclays Capital U.S. Aggregate Bond Index | | | 3.17 | %++ | |
| MSCI World Ex-U.S. Index | | | (33.05 | )%++ | |
| Custom MML Aggressive Allocation Index | | | (27.26 | )%++ | |
GROWTH OF $10,000 INVESTMENT SINCE INCEPTION


* Benchmark
+ From 9/3/07.
++ From 9/1/08.
Performance data quoted represents past performance; past performance is not predictive of future results. The investment return and principal value of shares of the Fund will fluctuate with market conditions so that shares of the Fund, when redeemed, may be worth more or less than their original cost. Current performance of the Fund may be lower or higher than the performance quoted. Performance data current to the most recent month end may be obtained by accessing the website www.massmutual.com.
Investors should note that the Fund is a professionally managed mutual fund, while the Russell 3000 Index, the Barclays Capital U.S. Aggregate Bond Index, the MSCI World Ex-U.S. Index and the Custom MML Aggressive Allocation Index are unmanaged, do not incur expenses, and cannot be purchased directly by investors. Investors should read the Fund's prospectus with regard to the Fund's investment objective, risks and charges and expenses in conjunction with these financial statements. The Fund's return reflects changes in the net asset value per share without the deduction of any product charges (e.g., cost of insurance, mortality and expense risk charges, administrative fees, and CDSL). The inclusion of these charges would have reduced the performance shown here.
61
MML American Funds Core Allocation Fund – Portfolio Manager Report
What is the investment objective of MML American Funds® Core Allocation Fund – and who is the Fund's investment adviser?
The Fund seeks as high a total rate of return on an annual basis as is considered consistent with prudent investment risk and the preservation of capital. The Fund is a "fund of funds" and seeks to achieve its investment objective by investing in a combination of series of the American Funds Insurance Series® ("the Underlying Funds") using a flexible asset allocation approach. The Underlying Funds will include Class 1 shares of the American Funds Bond Fund, the American Funds Blue Chip Income and Growth Fund, the American Funds Growth-Income Fund and the American Funds Interna tional Fund. The Fund's investment adviser allocates the Fund's assets among a variety of different asset classes, including U.S. and foreign equity and fixed-income securities, through investing in Underlying Funds in response to changing market, economic and investment conditions. The Fund's investment adviser is Massachusetts Mutual Life Insurance Company (MassMutual).
How did the Fund perform since its inception on August 15, 2008?
The Fund returned -22.50%, outperforming the -28.90%* return of the S&P 500® Index (the "benchmark"), a widely recognized, unmanaged index representative of common stocks of larger capitalized U.S. companies. The Fund also significantly outpaced the -33.05%* return of the Morgan Stanley Capital International ("MSCI") World Ex-U.S. Index, an unmanaged index representative of stocks domiciled in global developed markets, excluding the United States. Finally, the Fund substantially underperformed the 3.17%* return of the Barclays Capital U.S. Aggregate Bond Index, an unmanaged index of fixed-rate investment-grade securities with at least one year to maturity combining the Barcl ays Capital U.S. Government/Credit Bond Index and the Barclays Capital U.S. Mortgage-Backed Securities Index.
* For the reporting period from September 1-December 31, 2008.
For a discussion on the economic and market environment during the 12-month period ended December 31, 2008, please see the Economic and Market Review, beginning on page 3.
What factors contributed to the Fund's performance?
The collapse of real estate prices and a sharp decline in the value of many mortgage-backed securities caused major financial institutions to suffer significant losses in 2008. A few large financial institutions failed. Several large investment banking firms and commercial banks required U.S. Government support or were acquired by stronger financial institutions. Credit markets tightened quite severely. Concern became so great that both the equity and bond markets lost considerable market value, particularly in September and October.
The federal government's response to this ongoing crisis has been strong. It has restored some stability to the short-term credit markets and reduced panic, which could have made matters much worse if unchecked. Nevertheless, for too many years, some financial institutions and individuals have used credit excessively. As this misuse of credit is addressed, tighter lending policies and a drop in consumer spending may further depress economic activity.
The Fund's fixed-income exposure was beneficial for the overall performance of the portfolio for the reporting period (August 15 through December 31, 2008). The underlying fixed-income strategy took on a more defensive position by increasing its exposure to U.S. Treasury securities. While small-capitalization stocks modestly outperformed their large-cap counterparts, the portfolio's allocation to the two large-cap strategies benefited the Fund's performance, as a dedicated exposure to dividend-paying stocks was helpful. While international equities underperformed domestic stocks, the underlying international strategy experienced a successful geographic allocation, which provided additional value to the portfolio's results during this time frame.
What is your outlook?
The U.S. economy continues to face numerous difficulties. In 2009 we could see higher inflation, greater unemployment and a steeper decline in housing prices – all of which could further temper returns in the equity markets. On the other hand, the market might have already factored in these fears, considering the recent significant declines in many stock prices.
We will continue to monitor conditions closely in an effort to position the Fund to withstand the numerous challenges that we expect to face throughout 2009.
62
MML American Funds Core Allocation Fund – Portfolio Manager Report (Continued)
MML American Funds Core Allocation Fund
Asset Allocation
(% of Net Assets) on 12/31/08
(Unaudited) | |
| Equity Funds | | | 64.6 | % | |
| Fixed Income Funds | | | 35.4 | % | |
| Total Long-Term Investments | | | 100.0 | % | |
| Other Assets and Liabilities | | | (0.0 | )% | |
| Net Assets | | | 100.0 | % | |
63
MML American Funds Core Allocation Fund – Portfolio Manager Report (Continued)
Growth of a $10,000 Investment
Hypothetical Investments in MML American Funds Core Allocation Fund Service Class I, the S&P 500 Index, the Barclays Capital U.S. Aggregate Bond Index and the MSCI World Ex-U.S. Index.
TOTAL RETURN
| | | Since Inception
8/15/08 - 12/31/08 | |
| Service Class I | | | (22.50 | )% | |
| S&P 500 Index* | | | (28.90 | )%+ | |
| Barclays Capital U.S. Aggregate Bond Index | | | 3.17 | %+ | |
| MSCI World Ex-U.S. Index | | | (33.05 | )%+ | |
GROWTH OF $10,000 INVESTMENT SINCE INCEPTION

* Benchmark
+ From 9/1/08.
Performance data quoted represents past performance; past performance is not predictive of future results. The investment return and principal value of shares of the Fund will fluctuate with market conditions so that shares of the Fund, when redeemed, may be worth more or less than their original cost. Current performance of the Fund may be lower or higher than the performance quoted. Performance data current to the most recent month end may be obtained by accessing the website www.massmutual.com.
Investors should note that the Fund is a professionally managed mutual fund, while the S&P 500 Index, the Barclays Capital U.S. Aggregate Bond Index, and the MSCI World Ex-U.S. Index are unmanaged, do not incur expenses, and cannot be purchased directly by investors. Investors should read the Fund's prospectus with regard to the Fund's investment objective, risks and charges and expenses in conjunction with these financial statements. The Fund's return reflects changes in the net asset value per share without the deduction of any product charges (e.g., cost of insurance, mortality and expense risk charges, administrative fees, and CDSL). The inclusion of these charges would have reduced the performance shown here.
64
MML American Funds Growth Fund – Portfolio Manager Report
What is the investment objective of MML American Funds® Growth Fund – and who is the Fund's investment adviser?
The Fund seeks to provide investors with long-term capital growth, through the use of a "master feeder" relationship. The Fund invests all of its assets in the Class 1 shares of the Growth Fund (the "Master Growth Fund"), a series of the American Funds Insurance Series®, a registered open-end investment company, managed by Capital Research and Management Company ("Capital Research") with the same investment objective. The Master Growth Fund may invest in the securities of issuers representing a broad range of market capitalizations. Capital Research seeks to invest in attractively pric ed securities that, in its opinion, represent above-average, long-term investment opportunities. The Master Growth Fund may invest up to 15% of its assets in equity securities of issuers domiciled outside the United States and Canada. The Fund's investment adviser is Massachusetts Mutual Life Insurance Company (MassMutual).
How did the Fund perform since its inception on August 15, 2008?
The Fund returned -36.40% – underperforming the -28.90%* return of the S&P 500® Index (the "benchmark"), a widely recognized, unmanaged index representative of common stocks of larger capitalized U.S. companies. In addition, the Fund underperformed the -31.73%* return of the Russell 1000® Growth Index, an unmanaged index consisting of those Russell 1000 securities (representing the 1,000 largest U.S. companies based on market capitalization) with greater-than-average growth orientation that tend to exhibit higher price-to-book ratios and forecasted growth values than securities in the value universe.
* For the reporting period from September 1-December 31, 2008.
For a discussion on the economic and market environment during the 12-month period ended December 31, 2008, please see the Economic and Market Review, beginning on page 3.
What factors contributed to the Fund's performance?
During the reporting period from August 15 through December 31, 2008, losses continued to mount for many large financial companies. The situation became dire for a handful of Wall Street's biggest names, some of which failed, were acquired or accepted U.S. Government intervention. The culprit was the ongoing impact of the subprime credit crisis and the housing downturn. The economy continued to slow throughout the period, while inflation concerns eased and unemployment rates rose.
The overall exposure in the portfolio is broad, but exposure to international markets, which suffered in response to the U.S collapse, and to smaller companies were not beneficial to the Fund's performance. Energy exploration and production, materials and metals, while beneficial in the recent past, placed a sizable drag on performance in the later part of the year. Adding to this underperformance were portfolio holdings in the financials, telecommunications and consumer discretionary sectors.
What is your outlook?
As 2009 began, we continued to see an environment where risk and credit were being repriced and financial markets remained in significant turmoil. It is not clear at this time when the housing industry will recover, but some sign of improvement would likely cheer the stock market when it eventually happens.
We will continue to monitor conditions closely in an effort to position the Fund to withstand the numerous challenges that we expect to face throughout 2009.
65
MML American Funds Growth Fund – Portfolio Manager Report (Continued)
MML American Funds Growth Fund
Asset Allocation
(% of Net Assets) on 12/31/08
(Unaudited) | |
| Equity Funds | | | 99.5 | % | |
| Total Long-Term Investments | | | 99.5 | % | |
| Other Assets and Liabilities | | | 0.5 | % | |
| Net Assets | | | 100.0 | % | |
66
MML American Funds Growth Fund – Portfolio Manager Report (Continued)
Growth of a $10,000 Investment
Hypothetical Investments in MML American Funds Growth Fund Service Class I, the S&P 500 Index and the Russell 1000 Growth Index.
TOTAL RETURN
| | | Since Inception
8/15/08 - 12/31/08 | |
| Service Class I | | | (36.40 | )% | |
| S&P 500 Index* | | | (28.90 | )%+ | |
| Russell 1000 Growth Index | | | (31.73 | )%+ | |
GROWTH OF $10,000 INVESTMENT SINCE INCEPTION
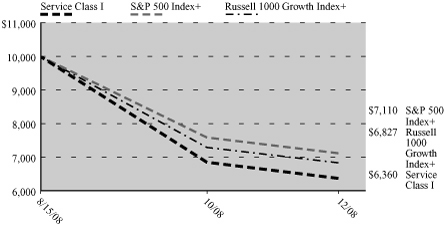
* Benchmark
+ From 9/1/08.
Performance data quoted represents past performance; past performance is not predictive of future results. The investment return and principal value of shares of the Fund will fluctuate with market conditions so that shares of the Fund, when redeemed, may be worth more or less than their original cost. Current performance of the Fund may be lower or higher than the performance quoted. Performance data current to the most recent month end may be obtained by accessing the website www.massmutual.com.
Investors should note that the Fund is a professionally managed mutual fund, while the S&P 500 Index and the Russell 1000 Growth Index are unmanaged, do not incur expenses, and cannot be purchased directly by investors. Investors should read the Fund's prospectus with regard to the Fund's investment objective, risks and charges and expenses in conjunction with these financial statements. The Fund's return reflects changes in the net asset value per share without the deduction of any product charges (e.g., cost of insurance, mortality and expense risk charges, administrative fees, and CDSL). The inclusion of these charges would have reduced the performance shown here.
67
MML American Funds International Fund – Portfolio Manager Report
What is the investment objective of MML American Funds® International Fund – and who is the Fund's investment adviser?
The Fund seeks long-term capital growth of assets, through the use of a "master feeder" relationship. The Fund invests all of its assets in the Class 1 shares of the International Fund (the "Master International Fund"), a series of the American Funds Insurance Series®, a registered open-end investment company, managed by Capital Research and Management Company ("Capital Research") with the same investment objective. The Master International Fund invests primarily in common stocks of companies located outside the United States, including emerging and developing markets. Capital R esearch seeks to invest in attractively priced securities that, in its opinion, represent above-average, long-term investment opportunities. The Fund's investment adviser is Massachusetts Mutual Life Insurance Company (MassMutual).
How did the Fund perform since its inception on August 15, 2008?
The Fund returned -30.80% – outperforming the -31.53%* return of the Morgan Stanley Capital International ("MSCI®") Europe, Australasia, Far East (EAFE®) Index (the "benchmark"), a widely recognized, unmanaged index representative of foreign securities in the major non-U.S. markets of Europe, Australia and the Far East. Similarly, the Fund outpaced the -34.01%* return of the MSCI All Country World Index ("ACWI") Ex-U.S. a free float-adjusted market capitalization index that is designed to measure equity market performance in the global developed and emerging markets, excluding the United States. The index consists of 47 developed and emerging market country i ndexes.
* For the reporting period from September 1-December 31, 2008.
For a discussion on the economic and market environment during the 12-month period ended December 31, 2008, please see the Economic and Market Review, beginning on page 3.
What factors contributed to the Fund's performance?
For the reporting period from August 15 through December 31, 2008, the Fund's European holdings held up well – despite volatility in western European markets (brought on by the decline in U.S. markets). During this time frame, from a geographical perspective, the portfolio's greatest exposure was to France and Germany. Asian markets and South American holdings also contributed to the Fund's returns during this period, although they occupied a much smaller portion of the portfolio.
Conversely, the Fund's performance during the reporting period was hindered most by portfolio holdings in Japan. Expectations of continued economic growth in that country failed to materialize as declines in the U.S. stock market shook investor confidence. Furthermore, despite favorable currency exchange rates, Japanese stocks suffered, particularly those in the financials sector. Finally, hampering the Fund's progress during the period were portfolio holdings in Austria, Ireland and the United Kingdom.
What is your outlook?
The global economy is in the midst of a period of uncertainty, particularly in the United States and a number of other countries in the developed world. Not only did various economic indicators suggest a slowdown in the U.S. as 2008 progressed, but in December, the U.S. was officially declared to be in the midst of a recession. While the Fund's strategy is not invested in U.S. stocks, the issue for the Fund's holdings is to what extent the U.S. problems will impact other nations, given how intertwined international economies have become.
We remain confident in our ability to find companies that have the potential to do well over time – and we continue to see encouraging signs for companies and economies around the world.
68
MML American Funds International Fund – Portfolio Manager Report (Continued)
MML American Funds International Fund
Asset Allocation
(% of Net Assets) on 12/31/08
(Unaudited) | |
| Equity Funds | | | 99.5 | % | |
| Total Long-Term Investments | | | 99.5 | % | |
| Other Assets and Liabilities | | | 0.5 | % | |
| Net Assets | | | 100.0 | % | |
69
MML American Funds International Fund – Portfolio Manager Report (Continued)
Growth of a $10,000 Investment
Hypothetical Investments in MML American Funds International Fund Service Class I, the MSCI EAFE Index and the MSCI ACWI Ex-U.S.
TOTAL RETURN
| | | Since Inception
8/15/08 - 12/31/08 | |
| Service Class I | | | (30.80 | )% | |
| MSCI EAFE Index* | | | (31.53 | )%+ | |
| MSCI ACWI Ex-U.S. | | | (34.01 | )%+ | |
GROWTH OF $10,000 INVESTMENT SINCE INCEPTION
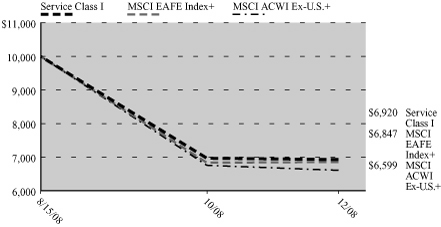
* Benchmark
+ From 9/1/08.
Performance data quoted represents past performance; past performance is not predictive of future results. The investment return and principal value of shares of the Fund will fluctuate with market conditions so that shares of the Fund, when redeemed, may be worth more or less than their original cost. Current performance of the Fund may be lower or higher than the performance quoted. Performance data current to the most recent month end may be obtained by accessing the website www.massmutual.com.
Investors should note that the Fund is a professionally managed mutual fund, while the MSCI EAFE Index and the MSCI ACWI Ex-U.S. are unmanaged, do not incur expenses, and cannot be purchased directly by investors. Investors should read the Fund's prospectus with regard to the Fund's investment objective, risks and charges and expenses in conjunction with these financial statements. The Fund's return reflects changes in the net asset value per share without the deduction of any product charges (e.g., cost of insurance, mortality and expense risk charges, administrative fees, and CDSL). The inclusion of these charges would have reduced the performance shown here.
70
MML Asset Allocation Fund – Portfolio of Investments
December 31, 2008
| | | Number of
Shares | | Value | |
| EQUITIES — 64.5% | |
| COMMON STOCK — 64.3% | |
| Advertising — 0.7% | |
| Omnicom Group, Inc. | | | 37,800 | | | $ | 1,017,576 | | |
| Aerospace & Defense — 0.7% | |
| United Technologies Corp. | | | 18,900 | | | | 1,013,040 | | |
| Agriculture — 2.0% | |
| Altria Group, Inc. | | | 50,700 | | | | 763,542 | | |
Philip Morris
International, Inc. | | | 46,200 | | | | 2,010,162 | | |
| | | | 2,773,704 | | |
| Airlines — 0.3% | |
| Southwest Airlines Co. | | | 44,300 | | | | 381,866 | | |
| Auto Manufacturers — 0.3% | |
Honda Motor Co. Ltd.
Sponsored ADR (Japan) | | | 21,000 | | | | 448,140 | | |
| Automotive & Parts — 0.2% | |
| Johnson Controls, Inc. | | | 11,400 | | | | 207,024 | | |
| Banks — 1.5% | |
| Bank of America Corp. | | | 8,500 | | | | 119,680 | | |
| SunTrust Banks, Inc. | | | 2,200 | | | | 64,988 | | |
| Wells Fargo & Co. | | | 66,100 | | | | 1,948,628 | | |
| | | | 2,133,296 | | |
| Beverages — 2.0% | |
| The Coca-Cola Co. | | | 9,500 | | | | 430,065 | | |
| PepsiCo, Inc. | | | 42,500 | | | | 2,327,725 | | |
| | | | 2,757,790 | | |
| Biotechnology — 3.1% | |
| Celgene Corp.(a) | | | 39,400 | | | | 2,178,032 | | |
| Genentech, Inc.(a) | | | 24,800 | | | | 2,056,168 | | |
| | | | 4,234,200 | | |
| Chemicals — 0.9% | |
| Celanese Corp. Class A | | | 6,300 | | | | 78,309 | | |
| Ecolab, Inc. | | | 4,600 | | | | 161,690 | | |
| Monsanto Co. | | | 8,300 | | | | 583,905 | | |
Potash Corp.
of Saskatchewan | | | 5,700 | | | | 417,354 | | |
| | | | 1,241,258 | | |
| Commercial Services — 1.5% | |
| Apollo Group, Inc. Class A(a) | | | 9,100 | | | | 697,242 | | |
| Iron Mountain, Inc.(a) | | | 8,800 | | | | 217,624 | | |
| Monster Worldwide, Inc.(a) | | | 23,700 | | | | 286,533 | | |
| Paychex, Inc. | | | 34,000 | | | | 893,520 | | |
| | | | 2,094,919 | | |
| | | Number of
Shares | | Value | |
| Computers — 1.8% | |
| Apple, Inc.(a) | | | 8,500 | | | $ | 725,475 | | |
Brocade Communications
Systems, Inc.(a) | | | 150,900 | | | | 422,520 | | |
Cognizant Technology
Solutions Corp. Class A(a) | | | 13,200 | | | | 238,392 | | |
| Dell, Inc.(a) | | | 23,000 | | | | 235,520 | | |
| Hewlett-Packard Co. | | | 8,700 | | | | 315,723 | | |
International Business
Machines Corp. | | | 3,800 | | | | 319,808 | | |
| NetApp, Inc.(a) | | | 18,700 | | | | 261,239 | | |
| | | | 2,518,677 | | |
| Diversified Financial — 3.4% | |
The Goldman Sachs
Group, Inc. | | | 24,200 | | | | 2,042,238 | | |
| JP Morgan Chase & Co. | | | 78,600 | | | | 2,478,258 | | |
| T. Rowe Price Group, Inc. | | | 4,200 | | | | 148,848 | | |
| | | | 4,669,344 | | |
| Electric — 0.4% | |
| Allegheny Energy, Inc. | | | 7,300 | | | | 247,178 | | |
| CMS Energy Corp. | | | 16,300 | | | | 164,793 | | |
| Edison International | | | 5,700 | | | | 183,084 | | |
| | | | 595,055 | | |
| Electrical Components & Equipment — 0.3% | |
| Emerson Electric Co. | | | 10,400 | | | | 380,744 | | |
| Electronics — 0.7% | |
| Agilent Technologies, Inc.(a) | | | 21,400 | | | | 334,482 | | |
Flextronics
International Ltd.(a) | | | 51,700 | | | | 132,352 | | |
| Jabil Circuit, Inc. | | | 66,900 | | | | 451,575 | | |
| | | | 918,409 | | |
| Energy – Alternate Sources — 0.4% | |
| First Solar, Inc.(a) | | | 3,600 | | | | 496,656 | | |
| Engineering & Construction — 1.1% | |
| Fluor Corp. | | | 30,100 | | | | 1,350,587 | | |
Jacobs Engineering
Group, Inc.(a) | | | 3,000 | | | | 144,300 | | |
| | | | 1,494,887 | | |
| Foods — 2.9% | |
| Kraft Foods, Inc. Class A | | | 80,544 | | | | 2,162,606 | | |
| Sara Lee Corp. | | | 148,700 | | | | 1,455,773 | | |
| Unilever NV NY Shares | | | 17,700 | | | | 434,535 | | |
| | | | 4,052,914 | | |
| | | Number of
Shares | | Value | |
| Health Care – Products — 2.0% | |
| Baxter International, Inc. | | | 41,000 | | | $ | 2,197,190 | | |
| Medtronic, Inc. | | | 15,800 | | | | 496,436 | | |
| | | | 2,693,626 | | |
| Health Care – Services — 1.6% | |
| Aetna, Inc. | | | 800 | | | | 22,800 | | |
| DaVita, Inc.(a) | | | 28,900 | | | | 1,432,573 | | |
| UnitedHealth Group, Inc. | | | 27,000 | | | | 718,200 | | |
| | | | 2,173,573 | | |
| Household Products — 0.1% | |
| Kimberly-Clark Corp. | | | 2,400 | | | | 126,576 | | |
| Insurance — 1.9% | |
| ACE Ltd. | | | 5,800 | | | | 306,936 | | |
| AFLAC, Inc. | | | 12,200 | | | | 559,248 | | |
Berkshire Hathaway, Inc.
Class A(a) | | | 7 | | | | 676,200 | | |
| Mercury General Corp. | | | 5,200 | | | | 239,148 | | |
| The Progressive Corp. | | | 49,100 | | | | 727,171 | | |
RenaissanceRe
Holdings Ltd. | | | 3,100 | | | | 159,836 | | |
| | | | 2,668,539 | | |
| Internet — 2.4% | |
| eBay, Inc.(a) | | | 14,500 | | | | 202,420 | | |
| Google, Inc. Class A(a) | | | 8,300 | | | | 2,553,495 | | |
| Yahoo!, Inc.(a) | | | 42,800 | | | | 522,160 | | |
| | | | 3,278,075 | | |
| Iron & Steel — 1.0% | |
Allegheny
Technologies, Inc. | | | 22,900 | | | | 584,637 | | |
Cliffs Natural
Resources, Inc. | | | 9,000 | | | | 230,490 | | |
| Nucor Corp. | | | 12,200 | | | | 563,640 | | |
| | | | 1,378,767 | | |
| Leisure Time — 0.3% | |
| Carnival Corp. | | | 19,600 | | | | 476,672 | | |
| Lodging — 0.3% | |
| Las Vegas Sands Corp.(a) | | | 37,900 | | | | 224,747 | | |
| Wynn Resorts Ltd.(a) | | | 5,800 | | | | 245,108 | | |
| | | | 469,855 | | |
| Manufacturing — 2.7% | |
| Danaher Corp. | | | 4,100 | | | | 232,101 | | |
| General Electric Co. | | | 162,400 | | | | 2,630,880 | | |
| Illinois Tool Works, Inc. | | | 26,000 | | | | 911,300 | | |
| | | | 3,774,281 | | |
(Continued)
The accompanying notes are an integral part of the financial statements.
71
MML Asset Allocation Fund – Portfolio of Investments (Continued)
| | | Number of
Shares | | Value | |
| Media — 2.3% | |
| CBS Corp. Class B | | | 54,800 | | | $ | 448,812 | | |
| Comcast Corp. Class A | | | 16,650 | | | | 281,052 | | |
| Gannett Co., Inc. | | | 22,800 | | | | 182,400 | | |
Time Warner Cable, Inc.
Class A(a) | | | 26,900 | | | | 577,005 | | |
| Time Warner, Inc. | | | 25,700 | | | | 258,542 | | |
| Viacom, Inc. Class B(a) | | | 16,800 | | | | 320,208 | | |
| The Walt Disney Co. | | | 51,600 | | | | 1,170,804 | | |
| | | | 3,238,823 | | |
| Mining — 1.5% | |
| Barrick Gold Corp. | | | 42,100 | | | | 1,548,017 | | |
| Vulcan Materials Co. | | | 7,400 | | | | 514,892 | | |
| | | | 2,062,909 | | |
| Oil & Gas — 3.4% | |
| Anadarko Petroleum Corp. | | | 8,400 | | | | 323,820 | | |
| Chevron Corp. | | | 12,900 | | | | 954,213 | | |
| ConocoPhillips | | | 9,300 | | | | 481,740 | | |
| EOG Resources, Inc. | | | 2,600 | | | | 173,108 | | |
| Exxon Mobil Corp. | | | 11,700 | | | | 934,011 | | |
| Marathon Oil Corp. | | | 40,400 | | | | 1,105,344 | | |
Royal Dutch Shell PLC
Sponsored ADR
(United Kingdom) | | | 9,800 | | | | 518,812 | | |
Royal Dutch Shell PLC
Sponsored ADR
(United Kingdom) | | | 4,600 | | | | 236,578 | | |
| | | | 4,727,626 | | |
| Oil & Gas Services — 0.9% | |
| Baker Hughes, Inc. | | | 4,400 | | | | 141,108 | | |
| Schlumberger Ltd. | | | 25,000 | | | | 1,058,250 | | |
| | | | 1,199,358 | | |
| Pharmaceuticals — 4.6% | |
| Abbott Laboratories | | | 30,200 | | | | 1,611,774 | | |
| Allergan, Inc. | | | 32,100 | | | | 1,294,272 | | |
AstraZeneca PLC
Sponsored ADR
(United Kingdom) | | | 13,100 | | | | 537,493 | | |
BioMarin
Pharmaceuticals, Inc.(a) | | | 9,700 | | | | 172,660 | | |
| Cardinal Health, Inc. | | | 26,400 | | | | 910,008 | | |
| Forest Laboratories, Inc.(a) | | | 15,800 | | | | 402,426 | | |
| Gilead Sciences, Inc.(a) | | | 6,700 | | | | 342,638 | | |
| Pfizer, Inc. | | | 11,000 | | | | 194,810 | | |
| Sanofi-Aventis ADR (France) | | | 9,100 | | | | 292,656 | | |
Teva Pharmaceutical
Industries Ltd.
Sponsored ADR (Israel) | | | 12,600 | | | | 536,382 | | |
| | | | 6,295,119 | | |
| | | Number of
Shares | | Value | |
| Pipelines — 0.3% | |
Kinder Morgan
Management LLC(a) | | | 4,903 | | | $ | 196,022 | | |
| The Williams Cos., Inc. | | | 10,200 | | | | 147,696 | | |
| | | | 343,718 | | |
| Real Estate Investment Trusts (REITS) — 0.1% | |
| Douglas Emmett, Inc. | | | 12,000 | | | | 156,720 | | |
| Retail — 4.0% | |
| Best Buy Co., Inc. | | | 10,400 | | | | 292,344 | | |
| Coach, Inc.(a) | | | 7,400 | | | | 153,698 | | |
| Costco Wholesale Corp. | | | 6,000 | | | | 315,000 | | |
| Hanesbrands, Inc.(a) | | | 22,450 | | | | 286,237 | | |
| The Home Depot, Inc. | | | 24,600 | | | | 566,292 | | |
| Lowe's Cos., Inc. | | | 25,700 | | | | 553,064 | | |
| Nordstrom, Inc. | | | 26,200 | | | | 348,722 | | |
| Target Corp. | | | 62,700 | | | | 2,165,031 | | |
| Urban Outfitters, Inc.(a) | | | 15,300 | | | | 229,194 | | |
| Wal-Mart Stores, Inc. | | | 12,000 | | | | 672,720 | | |
| | | | 5,582,302 | | |
| Savings & Loans — 1.2% | |
| Astoria Financial Corp. | | | 15,000 | | | | 247,200 | | |
| Hudson City Bancorp, Inc. | | | 85,900 | | | | 1,370,964 | | |
| | | | 1,618,164 | | |
| Semiconductors — 0.7% | |
| Intel Corp. | | | 15,400 | | | | 225,764 | | |
| KLA-Tencor Corp. | | | 22,900 | | | | 498,991 | | |
| Lam Research Corp.(a) | | | 5,000 | | | | 106,400 | | |
| Microchip Technology, Inc. | | | 8,000 | | | | 156,240 | | |
| | | | 987,395 | | |
| Software — 1.4% | |
| Adobe Systems, Inc.(a) | | | 18,300 | | | | 389,607 | | |
| Cerner Corp.(a) | | | 15,300 | | | | 588,285 | | |
| Microsoft Corp. | | | 43,600 | | | | 847,584 | | |
| Oracle Corp.(a) | | | 9,100 | | | | 161,343 | | |
| | | | 1,986,819 | | |
| Telecommunications — 4.3% | |
American Tower Corp.
Class A(a) | | | 33,700 | | | | 988,084 | | |
| AT&T, Inc. | | | 54,300 | | | | 1,547,550 | | |
| Ciena Corp.(a) | | | 8,700 | | | | 58,290 | | |
| Cisco Systems, Inc.(a) | | | 100,300 | | | | 1,634,890 | | |
| Polycom, Inc.(a) | | | 23,900 | | | | 322,889 | | |
| Qualcomm, Inc. | | | 32,800 | | | | 1,175,224 | | |
| TW Telecom, Inc.(a) | | | 21,500 | | | | 182,105 | | |
| | | | 5,909,032 | | |
| Toys, Games & Hobbies — 0.4% | |
Nintendo Co. Ltd.
Sponsored ADR (Japan) | | | 10,600 | | | | 506,150 | | |
| | | Number of
Shares | | Value | |
| Transportation — 2.4% | |
| FedEx Corp. | | | 5,500 | | | $ | 352,825 | | |
| Union Pacific Corp. | | | 6,300 | | | | 301,140 | | |
United Parcel Service, Inc.
Class B | | | 47,900 | | | | 2,642,164 | | |
| | | | 3,296,129 | | |
| Water — 0.3% | |
American Water
Works Co., Inc. | | | 19,900 | | | | 415,512 | | |
TOTAL COMMON STOCK
(Cost $118,399,907) | | | 88,795,239 | | |
| PREFERRED STOCK — 0.2% | |
| Pharmaceuticals — 0.2% | |
| Schering Plough Corp. | | | 1,500 | | | | 261,158 | | |
TOTAL PREFERRED STOCK
(Cost $375,000) | | | 261,158 | | |
TOTAL EQUITIES
(Cost $118,774,907) | | | 89,056,397 | | |
| | | Principal
Amount | | | |
| BONDS & NOTES — 35.1% | |
| CORPORATE DEBT — 9.5% | |
| Aerospace & Defense — 0.1% | |
Lockheed Martin Corp.
7.650% 5/01/16 | | $ | 60,000 | | | | 69,153 | | |
Northrop Grumman
Systems Corp.
7.125% 2/15/11 | | | 60,000 | | | | 62,386 | | |
Raytheon Co.
6.400% 12/15/18 | | | 60,000 | | | | 64,951 | | |
| | | | 196,490 | | |
| Agriculture — 0.3% | |
Altria Group, Inc.
8.500% 11/10/13 | | | 110,000 | | | | 113,932 | | |
Altria Group, Inc.
9.700% 11/10/18 | | | 120,000 | | | | 129,700 | | |
Altria Group, Inc.
9.950% 11/10/38 | | | 20,000 | | | | 21,776 | | |
Philip Morris
International, Inc.
6.875% 3/17/14 | | | 120,000 | | | | 126,106 | | |
| | | | 391,514 | | |
| Auto Manufacturers — 0.0% | |
Daimler Finance NA LLC
7.300% 1/15/12 | | | 70,000 | | | | 60,507 | | |
(Continued)
The accompanying notes are an integral part of the financial statements.
72
MML Asset Allocation Fund – Portfolio of Investments (Continued)
| | | Principal
Amount | | Value | |
| Banks — 2.0% | |
Banco Mercantil del
Norte SA VRN
(Acquired 12/13/06,
Cost $49,100)(b) (c)
6.862% 10/13/21 | | $ | 30,000 | | | $ | 18,000 | | |
Bank of America
Corp. VRN
8.000% 1/30/18 | | | 130,000 | | | | 93,507 | | |
Bank of America NA
5.300% 3/15/17 | | | 585,000 | | | | 555,473 | | |
Barclays Bank PLC
5.450% 9/12/12 | | | 100,000 | | | | 101,271 | | |
Capital One
Financial Corp.
6.250% 11/15/13 | | | 230,000 | | | | 197,156 | | |
CoBank ACB FRN
(Acquired 6/06/07,
Cost $250,000)(b) (c)
2.596% 6/15/22 | | | 295,000 | | | | 207,298 | | |
Depfa ACS Bank
(Acquired 1/28/08,
Cost $138,232)(b) (c)
5.125% 3/16/37 | | | 135,000 | | | | 97,757 | | |
HBOS PLC(b)
6.750% 5/21/18 | | | 100,000 | | | | 88,010 | | |
HSBK Europe BV(b)
7.750% 5/13/13 | | | 100,000 | | | | 71,000 | | |
JP Morgan Chase
Bank NA
6.000% 10/01/17 | | | 250,000 | | | | 252,170 | | |
Kazkommerts
International BV
Reg S(b) (d)
8.000% 11/03/15 | | | 100,000 | | | | 46,000 | | |
Northern Trust Corp.
5.500% 8/15/13 | | | 90,000 | | | | 92,409 | | |
Royal Bank of Scotland
Group PLC VRN
(Acquired 9/27/07-
10/05/07,
Cost $204,963)(b) (c)
6.990% 10/05/17 | | | 100,000 | | | | 46,754 | | |
Unicredit Luxembourg
Finance VRN(b)
5.584% 1/13/17 | | | 200,000 | | | | 174,885 | | |
US AgBank FCB VRN
(Acquired 5/10/07,
Cost $346,511)(b) (c)
6.110% 12/31/49 | | | 345,000 | | | | 221,390 | | |
Wachovia Corp.
5.750% 2/01/18 | | | 250,000 | | | | 250,497 | | |
Wells Fargo & Co.
5.625% 12/11/17 | | | 150,000 | | | | 156,491 | | |
| | | Principal
Amount | | Value | |
Zions Bancorporation
5.500% 11/16/15 | | $ | 75,000 | | | $ | 53,041 | | |
| | | | 2,723,109 | | |
| Beverages — 0.3% | |
Anheuser-Busch Cos., Inc.
5.500% 1/15/18 | | | 250,000 | | | | 227,239 | | |
Diageo Capital PLC
5.750% 10/23/17 | | | 110,000 | | | | 106,436 | | |
PepsiCo, Inc.
7.900% 11/01/18 | | | 70,000 | | | | 85,796 | | |
| | | | 419,471 | | |
| Biotechnology — 0.0% | |
Biogen Idec, Inc.
6.000% 3/01/13 | | | 35,000 | | | | 34,618 | | |
| Commercial Services — 0.1% | |
US Investigations
Services, Inc.(b)
10.500% 11/01/15 | | | 100,000 | | | | 73,000 | | |
| Computers — 0.1% | |
Hewlett-Packard Co.
5.500% 3/01/18 | | | 75,000 | | | | 75,692 | | |
| Cosmetics & Personal Care — 0.1% | |
Procter & Gamble Co.
4.600% 1/15/14 | | | 70,000 | | | | 73,353 | | |
| Diversified Financial — 1.2% | |
American Express Co.
8.150% 3/19/38 | | | 50,000 | | | | 57,337 | | |
The Bear Stearns Cos., Inc.
7.250% 2/01/18 | | | 130,000 | | | | 142,461 | | |
Caterpillar Financial
Services Corp. Series S
4.850% 12/07/12 | | | 35,000 | | | | 33,208 | | |
CIT Group, Inc.
7.625% 11/30/12 | | | 50,000 | | | | 42,208 | | |
Citigroup Capital XXI VRN
8.300% 12/21/37 | | | 50,000 | | | | 38,562 | | |
Citigroup, Inc.
6.125% 11/21/17 | | | 50,000 | | | | 50,527 | | |
Citigroup, Inc.
6.125% 5/15/18 | | | 290,000 | | | | 293,225 | | |
Countrywide Home
Loans, Inc.
4.125% 9/15/09 | | | 20,000 | | | | 19,766 | | |
Ford Motor Credit Co. LLC
8.625% 11/01/10 | | | 150,000 | | | | 113,554 | | |
General Electric
Capital Corp.
5.875% 1/14/38 | | | 210,000 | | | | 205,561 | | |
The Goldman Sachs
Group, Inc.
6.150% 4/01/18 | | | 305,000 | | | | 293,093 | | |
| | | Principal
Amount | | Value | |
International Lease
Finance Corp.
6.375% 3/25/13 | | $ | 100,000 | | | $ | 67,930 | | |
JP Morgan Chase
Capital XXV Series Y
6.800% 10/01/37 | | | 145,000 | | | | 133,601 | | |
National Rural Utilities
Cooperative
Finance Corp.
5.450% 2/01/18 | | | 100,000 | | | | 86,673 | | |
National Rural Utilities
Cooperative
Finance Corp.
5.500% 7/01/13 | | | 50,000 | | | | 48,463 | | |
National Rural Utilities
Cooperative
Finance Corp.
10.375% 11/01/18 | | | 40,000 | | | | 46,816 | | |
| | | | 1,672,985 | | |
| Electric — 1.0% | |
Abu Dhabi National
Energy Co.(b)
5.875% 10/27/16 | | | 100,000 | | | | 81,700 | | |
Abu Dhabi National
Energy Co.(b)
6.600% 8/01/13 | | | 125,000 | | | | 115,276 | | |
Alabama Power Co.
5.800% 11/15/13 | | | 90,000 | | | | 93,667 | | |
Appalachian Power Co.
5.550% 4/01/11 | | | 75,000 | | | | 74,300 | | |
The Cleveland Electric
Illuminating Co.
8.875% 11/15/18 | | | 110,000 | | | | 119,590 | | |
Consumers Energy Co.
5.650% 9/15/18 | | | 35,000 | | | | 33,610 | | |
Consumers Energy Co.
6.125% 3/15/19 | | | 35,000 | | | | 34,670 | | |
Consumers Energy Co.
Series M
5.500% 8/15/16 | | | 65,000 | | | | 62,459 | | |
Energy East Corp.
6.750% 7/15/36 | | | 125,000 | | | | 102,572 | | |
EON International
Finance BV(b)
5.800% 4/30/18 | | | 70,000 | | | | 65,448 | | |
Florida Power Corp.
5.650% 6/15/18 | | | 130,000 | | | | 134,807 | | |
Jersey Central Power &
Light Co.
6.150% 6/01/37 | | | 45,000 | | | | 36,186 | | |
National Grid PLC
6.300% 8/01/16 | | | 20,000 | | | | 17,427 | | |
Ohio Edison Co.
6.400% 7/15/16 | | | 25,000 | | | | 22,444 | | |
(Continued)
The accompanying notes are an integral part of the financial statements.
73
MML Asset Allocation Fund – Portfolio of Investments (Continued)
| | | Principal
Amount | | Value | |
Oncor Electric
Delivery Co.(b)
6.800% 9/01/18 | | $ | 60,000 | | | $ | 57,540 | | |
Pacific Gas & Electric Co.
4.200% 3/01/11 | | | 50,000 | | | | 49,394 | | |
Pacific Gas & Electric Co.
8.250% 10/15/18 | | | 110,000 | | | | 132,161 | | |
Public Service Co.
of Colorado
5.800% 8/01/18 | | | 70,000 | | | | 72,597 | | |
Public Service
Electric & Gas Co.
5.300% 5/01/18 | | | 25,000 | | | | 24,283 | | |
Texas Competitive Electric
Holdings Co. LLC(b)
10.250% 11/01/15 | | | 100,000 | | | | 71,000 | | |
Virginia Electric and
Power Co.
5.950% 9/15/17 | | | 25,000 | | | | 25,166 | | |
| | | | 1,426,297 | | |
| Electronics — 0.1% | |
Koninklijke Philips
Electronics NV
5.750% 3/11/18 | | | 75,000 | | | | 69,101 | | |
| Foods — 0.2% | |
Delhaize Group
6.500% 6/15/17 | | | 25,000 | | | | 22,700 | | |
Kraft Foods, Inc.
6.125% 8/23/18 | | | 100,000 | | | | 98,588 | | |
Kraft Foods, Inc.
6.875% 2/01/38 | | | 50,000 | | | | 49,965 | | |
The Kroger Co.
6.150% 1/15/20 | | | 50,000 | | | | 49,331 | | |
The Kroger Co.
7.500% 1/15/14 | | | 30,000 | | | | 31,536 | | |
Smithfield Foods, Inc.
8.000% 10/15/09 | | | 100,000 | | | | 95,000 | | |
| | | | 347,120 | | |
| Health Care – Services — 0.1% | |
Tenet Healthcare Corp.
9.875% 7/01/14 | | | 150,000 | | | | 120,750 | | |
WellPoint, Inc.
6.375% 6/15/37 | | | 20,000 | | | | 17,635 | | |
| | | | 138,385 | | |
| Holding Company – Diversified — 0.1% | |
Capmark Financial
Group, Inc.
5.875% 5/10/12 | | | 175,000 | | | | 59,673 | | |
Capmark Financial
Group, Inc.
6.300% 5/10/17 | | | 75,000 | | | | 20,630 | | |
| | | | 80,303 | | |
| | | Principal
Amount | | Value | |
| Insurance — 0.5% | |
Assured Guaranty US
Holdings, Inc.
Series A VRN
6.400% 12/15/16 | | $ | 30,000 | | | $ | 4,496 | | |
Berkshire Hathaway
Finance Corp.
4.600% 5/15/13 | | | 120,000 | | | | 119,998 | | |
CNA Financial Corp.
7.250% 11/15/23 | | | 75,000 | | | | 46,822 | | |
Liberty Mutual
Group, Inc.(b)
6.500% 3/15/35 | | | 205,000 | | | | 117,552 | | |
Liberty Mutual
Group, Inc.(b)
7.500% 8/15/36 | | | 195,000 | | | | 118,738 | | |
Lincoln National Corp.
6.200% 12/15/11 | | | 160,000 | | | | 140,252 | | |
Monumental Global
Funding III FRN(b)
4.953% 1/15/14 | | | 170,000 | | | | 138,213 | | |
Nationwide
Financial Services
6.750% 5/15/67 | | | 75,000 | | | | 33,625 | | |
| | | | 719,696 | | |
| Machinery – Construction & Mining — 0.0% | |
Atlas Copco AB(b)
5.600% 5/22/17 | | | 50,000 | | | | 46,970 | | |
| Media — 0.7% | |
Charter Communications
Operating LLC(b)
8.375% 4/30/14 | | | 100,000 | | | | 76,500 | | |
Comcast Cable
Communications LLC
7.125% 6/15/13 | | | 120,000 | | | | 117,890 | | |
Comcast Corp.
6.950% 8/15/37 | | | 50,000 | | | | 52,653 | | |
COX Communications, Inc.
7.750% 11/01/10 | | | 50,000 | | | | 49,076 | | |
News America, Inc.
6.400% 12/15/35 | | | 90,000 | | | | 83,183 | | |
News America, Inc.
6.650% 11/15/37 | | | 50,000 | | | | 49,488 | | |
Nielsen Finance LLC/Nielsen
Finance Co.
10.000% 8/01/14 | | | 200,000 | | | | 160,000 | | |
Thomson Reuters Corp.
5.950% 7/15/13 | | | 50,000 | | | | 46,551 | | |
Time Warner Cable, Inc.
6.750% 7/01/18 | | | 45,000 | | | | 43,326 | | |
Time Warner Cable, Inc.
8.750% 2/14/19 | | | 100,000 | | | | 108,733 | | |
Time Warner, Inc.
5.875% 11/15/16 | | | 70,000 | | | | 62,754 | | |
| | | Principal
Amount | | Value | |
Time Warner, Inc.
6.500% 11/15/36 | | $ | 25,000 | | | $ | 22,665 | | |
Time Warner, Inc.
7.625% 4/15/31 | | | 60,000 | | | | 58,969 | | |
Univision
Communications, Inc.(b)
9.750% 3/15/15 | | | 155,000 | | | | 19,375 | | |
| | | | 951,163 | | |
| Mining — 0.0% | |
Freeport-McMoRan
Copper & Gold, Inc.
6.875% 2/01/14 | | | 35,000 | | | | 31,500 | | |
| Pharmaceuticals — 0.3% | |
Abbott Laboratories
5.600% 11/30/17 | | | 30,000 | | | | 32,465 | | |
AstraZeneca PLC
5.400% 9/15/12 | | | 50,000 | | | | 52,804 | | |
Cardinal Health, Inc.
5.800% 10/15/16 | | | 100,000 | | | | 90,468 | | |
GlaxoSmithKline
Capital, Inc.
4.850% 5/15/13 | | | 75,000 | | | | 75,229 | | |
Hospira, Inc.
5.550% 3/30/12 | | | 40,000 | | | | 37,899 | | |
Schering-Plough Corp.
5.550% 12/01/13 | | | 60,000 | | | | 60,439 | | |
| | | | 349,304 | | |
| Pipelines — 0.7% | |
Enbridge Energy
Partners LP
6.500% 4/15/18 | | | 25,000 | | | | 20,573 | | |
Enterprise Products
Operating LP
5.600% 10/15/14 | | | 100,000 | | | | 84,844 | | |
Enterprise Products
Operating LP
6.875% 3/01/33 | | | 100,000 | | | | 76,656 | | |
Gulfstream Natural Gas
System LLC
(Acquired 6/01/06,
Cost $243,573)(b) (c)
6.190% 11/01/25 | | | 250,000 | | | | 186,407 | | |
Kinder Morgan Energy
Partners LP
5.125% 11/15/14 | | | 65,000 | | | | 56,628 | | |
Kinder Morgan Energy
Partners LP
6.000% 2/01/17 | | | 145,000 | | | | 125,885 | | |
Kinder Morgan Energy
Partners LP
6.500% 2/01/37 | | | 60,000 | | | | 45,811 | | |
(Continued)
The accompanying notes are an integral part of the financial statements.
74
MML Asset Allocation Fund – Portfolio of Investments (Continued)
| | | Principal
Amount | | Value | |
Rockies Express
Pipeline LLC(b)
6.850% 7/15/18 | | $ | 70,000 | | | $ | 64,614 | | |
Southern Natural
Gas Co.(b)
5.900% 4/01/17 | | | 160,000 | | | | 126,793 | | |
Trans-Canada Pipelines Ltd.
6.200% 10/15/37 | | | 75,000 | | | | 65,148 | | |
Trans-Canada Pipelines Ltd.
6.500% 8/15/18 | | | 40,000 | | | | 39,242 | | |
Williams Cos., Inc.
7.875% 9/01/21 | | | 45,000 | | | | 34,425 | | |
Williams Cos., Inc.
8.125% 3/15/12 | | | 80,000 | | | | 73,700 | | |
Williams Cos., Inc.
8.750% 3/15/32 | | | 45,000 | | | | 33,525 | | |
| | | | 1,034,251 | | |
| Real Estate — 0.0% | |
WEA Finance LLC/WCI
Finance LLC(b)
5.700% 10/01/16 | | | 50,000 | | | | 33,398 | | |
| Real Estate Investment Trusts (REITS) — 0.3% | |
Brandywine Operating
Partnership LP
5.400% 11/01/14 | | | 155,000 | | | | 96,001 | | |
Brandywine Operating
Partnership LP
6.000% 4/01/16 | | | 10,000 | | | | 5,455 | | |
Developers Diversified
Realty Corp.
5.000% 5/03/10 | | | 150,000 | | | | 108,680 | | |
Developers Diversified
Realty Corp.
5.500% 5/01/15 | | | 20,000 | | | | 8,401 | | |
Hospitality
Properties Trust
6.700% 1/15/18 | | | 75,000 | | | | 34,885 | | |
Kimco Realty Corp.
4.820% 6/01/14 | | | 50,000 | | | | 35,590 | | |
Prologis
5.625% 11/15/15 | | | 45,000 | | | | 22,395 | | |
Prologis
6.625% 5/15/18 | | | 65,000 | | | | 31,091 | | |
Simon Property Group LP
5.300% 5/30/13 | | | 50,000 | | | | 37,380 | | |
Simon Property Group LP
6.125% 5/30/18 | | | 105,000 | | | | 70,949 | | |
| | | | 450,827 | | |
| Retail — 0.3% | |
CVS Pass-Through Trust(b)
5.298% 1/11/27 | | | 20,055 | | | | 15,577 | | |
CVS Pass-Through Trust(b)
5.789% 1/10/26 | | | 8,684 | | | | 7,977 | | |
| | | Principal
Amount | | Value | |
Home Depot, Inc. FRN
2.046% 12/16/09 | | $ | 170,000 | | | $ | 160,604 | | |
Macy's Retail
Holdings, Inc.
6.375% 3/15/37 | | | 25,000 | | | | 14,078 | | |
New Albertsons, Inc.
7.250% 5/01/13 | | | 275,000 | | | | 232,375 | | |
Walgreen Co.
4.875% 8/01/13 | | | 25,000 | | | | 25,747 | | |
| | | | 456,358 | | |
| Savings & Loans — 0.1% | |
SMFG Preferred Capital
USD 1 Ltd. VRN
(Acquired 4/25/07,
Cost $241,142)(b) (c)
6.078% 1/29/49 | | | 120,000 | | | | 80,956 | | |
| Semiconductors — 0.0% | |
KLA-Tencor Corp.
6.900% 5/01/18 | | | 60,000 | | | | 45,380 | | |
| Telecommunications — 0.6% | |
AT&T, Inc.
5.500% 2/01/18 | | | 50,000 | | | | 50,531 | | |
AT&T, Inc.
5.625% 6/15/16 | | | 50,000 | | | | 50,224 | | |
AT&T, Inc.
6.300% 1/15/38 | | | 60,000 | | | | 63,427 | | |
AT&T, Inc.
6.700% 11/15/13 | | | 170,000 | | | | 180,085 | | |
Cellco Partnership(b)
8.500% 11/15/18 | | | 110,000 | | | | 128,884 | | |
Telecom Italia Capital SA
5.250% 10/01/15 | | | 50,000 | | | | 38,063 | | |
Telecom Italia Capital SA
6.999% 6/04/18 | | | 50,000 | | | | 40,562 | | |
Telecom Italia Capital SA
7.721% 6/04/38 | | | 25,000 | | | | 20,531 | | |
Telecom Italia Capital
SA, Series B
5.250% 11/15/13 | | | 100,000 | | | | 76,250 | | |
Verizon
Communications, Inc.
8.950% 3/01/39 | | | 55,000 | | | | 71,043 | | |
Vodafone Group PLC
6.150% 2/27/37 | | | 80,000 | | | | 79,075 | | |
| | | | 798,675 | | |
| Transportation — 0.2% | |
BNSF Funding Trust I VRN
6.613% 1/15/26 | | | 15,000 | | | | 9,450 | | |
Burlington Northern
Santa Fe Corp.
6.150% 5/01/37 | | | 60,000 | | | | 55,262 | | |
| | | Principal
Amount | | Value | |
Norfolk Southern Corp.
5.750% 4/01/18 | | $ | 50,000 | | | $ | 48,652 | | |
Norfolk Southern Corp.
7.050% 5/01/37 | | | 30,000 | | | | 31,372 | | |
Union Pacific Corp.
5.700% 8/15/18 | | | 105,000 | | | | 101,087 | | |
Union Pacific Corp.
5.750% 11/15/17 | | | 15,000 | | | | 14,223 | | |
| | | | 260,046 | | |
| Water — 0.1% | |
Veolia Environnement
5.250% 6/03/13 | | | 50,000 | | | | 46,369 | | |
Veolia Environnement
6.000% 6/01/18 | | | 70,000 | | | | 62,033 | | |
| | | | 108,402 | | |
TOTAL CORPORATE DEBT
(Cost $14,833,217) | | | 13,148,871 | | |
NON-U.S. GOVERNMENT AGENCY
OBLIGATIONS — 4.5% | |
| Airlines — 0.1% | |
Delta Air Lines, Inc.,
Series 2002-1, Class G2
6.417% 7/02/12 | | | 125,000 | | | | 85,000 | | |
| Automobile ABS — 0.7% | |
AmeriCredit Automobile
Receivables Trust,
Series 2007-DF,
Class A4A
5.560% 6/06/14 | | | 50,000 | | | | 33,094 | | |
Carmax Auto Owner Trust,
Series 2007-2, Class A3
5.230% 12/15/11 | | | 44,947 | | | | 42,734 | | |
CPS Auto Trust,
Series 2006-C, Class A4
(Acquired 9/22/06,
Cost $349,899)(b) (c)
5.140% 6/17/13 | | | 349,999 | | | | 315,765 | | |
Drive Auto Receivables
Trust, Series 2006-2,
Class A3 STEP
(Acquired 10/18/06,
Cost $174,998)(b) (c)
5.330% 4/15/14 | | | 175,000 | | | | 150,418 | | |
Prestige Auto Receivables
Trust, Series 2005-1A,
Class A2
(Acquired 5/23/06,
Cost $982,461)(b) (c)
4.370% 6/15/12 | | | 337,185 | | | | 312,317 | | |
(Continued)
The accompanying notes are an integral part of the financial statements.
75
MML Asset Allocation Fund – Portfolio of Investments (Continued)
| | | Principal
Amount | | Value | |
Rental Car Finance Corp.,
Series 2005-1A,
Class A2
(Acquired 5/22/06,
Cost $421,670)(b) (c)
4.590% 6/25/11 | | $ | 250,000 | | | $ | 202,656 | | |
| | | | 1,056,984 | | |
| Commercial MBS — 0.6% | |
Crown Castle Towers LLC,
Series 2006-1A,
Class E
(Acquired 11/15/06,
Cost $290,000)(b) (c)
6.065% 11/15/36 | | | 290,000 | | | | 172,086 | | |
CS First Boston Mortgage
Securities Corp.,
Series 2004-C5, Class A3
4.499% 11/15/37 | | | 180,000 | | | | 147,336 | | |
CS First Boston Mortgage
Securities Corp.,
Series 2004-C1,
Class E VRN
(Acquired 10/03/07,
Cost $213,021)(b) (c)
5.015% 1/15/37 | | | 225,000 | | | | 93,711 | | |
GMAC Commercial
Mortgage Securities,
Inc., Series 2001-C1,
Class A2
6.465% 4/15/34 | | | 239,929 | | | | 231,447 | | |
JP Morgan Chase
Commercial Mortgage
Securities Corp.,
Series 2006-LDP7,
Class A4 VRN
5.875% 4/15/45 | | | 50,000 | | | | 39,384 | | |
Merrill Lynch Mortgage
Trust, Series 2005-LC1,
Class A2 VRN
5.202% 1/12/44 | | | 118,623 | | | | 110,944 | | |
Salomon Brothers Mortgage
Securities VII, Inc.,
Series 2001-C2,
Class H VRN
7.445% 11/13/11 | | | 175,000 | | | | 130,040 | | |
| | | | 924,948 | | |
| Credit Card ABS — 0.8% | |
Advanta Business Card
Master Trust,
Series 2005-A2,
Class A2 FRN
0.638% 5/20/13 | | | 500,000 | | | | 400,000 | | |
| | | Principal
Amount | | Value | |
MBNA Credit Card Master
Note Trust,
Series 2002-C1, Class C1
6.800% 7/15/14 | | $ | 1,000,000 | | | $ | 562,344 | | |
Washington Mutual Master
Note Trust,
Series 2006-A2A,
Class A FRN
(Acquired 9/13/07,
Cost $96,828)(b) (c)
1.245% 6/15/15 | | | 100,000 | | | | 56,359 | | |
Washington Mutual Master
Note Trust,
Series 2007-A4A,
Class A4
(Acquired 10/30/07,
Cost $99,980)(b) (c)
5.200% 10/15/14 | | | 100,000 | | | | 73,219 | | |
| | | | 1,091,922 | | |
| Home Equity ABS — 0.1% | |
GMAC Mortgage Corp. Loan
Trust, Series 2007-HE2,
Class A3 VRN
6.193% 12/25/37 | | | 175,000 | | | | 42,297 | | |
GSAA Trust, Series 2006-7,
Class AF5A STEP
6.205% 3/25/46 | | | 50,000 | | | | 46,789 | | |
Residential Funding
Mortgage Securities II,
Inc., Series 2007-HSA2,
Class A1F VRN
8.470% 4/25/37 | | | 9,668 | | | | 9,286 | | |
| | | | 98,372 | | |
| Student Loans ABS — 0.0% | |
New Century Home Equity
Loan Trust,
Series 2006-2,
Class A2B FRN
0.631% 8/25/36 | | | 50,000 | | | | 25,084 | | |
| WL Collateral CMO — 2.2% | |
American Home Mortgage
Assets, Series 2007-3,
Class 22A1 STEP
6.250% 6/25/37 | | | 91,965 | | | | 40,960 | | |
Bear Stearns Asset Backed
Securities Trust,
Series 2005-AC3,
Class 2A1
5.250% 6/25/20 | | | 95,745 | | | | 81,976 | | |
Countrywide Alternative
Loan Trust,
Series 2007-2CB,
Class 1A9
5.750% 3/25/37 | | | 217,887 | | | | 113,267 | | |
| | | Principal
Amount | | Value | |
Countrywide Alternative
Loan Trust,
Series 2007-HY4,
Class 3A1 VRN
5.854% 6/25/47 | | $ | 149,306 | | | $ | 69,181 | | |
Countrywide Home Loan
Mortgage Pass
Through Trust,
Series 2006-HYB5,
Class 3A1B VRN
5.912% 9/20/36 | | | 34,337 | | | | 16,540 | | |
CS First Boston Mortgage
Securities Corp.,
Series 2005-7, Class 3A1
5.000% 8/25/20 | | | 37,589 | | | | 24,439 | | |
Indymac IMSC Mortgage
Loan Trust,
Series 2007-F3,
Class 2A1
6.500% 9/25/37 | | | 235,460 | | | | 105,801 | | |
Indymac Index Mortgage
Loan Trust,
Series 2006-AR5,
Class 2A1 VRN
5.762% 5/25/36 | | | 82,222 | | | | 40,414 | | |
Indymac Index Mortgage
Loan Trust,
Series 2005-AR35,
Class 2A1 VRN
5.940% 2/25/36 | | | 718,984 | | | | 389,166 | | |
JP Morgan Alternative Loan
Trust, Series 2006-S3,
Class A6 STEP
6.120% 8/25/36 | | | 375,000 | | | | 234,724 | | |
Lehman Mortgage Trust,
Series 2007-7, Class 6A4
7.000% 8/25/37 | | | 199 | | | | 105 | | |
Lehman Mortgage Trust,
Series 2007-8, Class 3A1
7.250% 9/25/37 | | | 266,615 | | | | 118,800 | | |
MASTR Alternative Loans
Trust, Series 2004-5,
Class 5A1
4.750% 6/25/19 | | | 232,934 | | | | 209,286 | | |
Residential Accredit
Loans, Inc.,
Series 2007-QS9,
Class A33
6.500% 7/25/37 | | | 65,139 | | | | 31,689 | | |
Residential Asset
Securitization Trust,
Series 2004-A6, Class A1
5.000% 8/25/19 | | | 495,198 | | | | 445,756 | | |
(Continued)
The accompanying notes are an integral part of the financial statements.
76
MML Asset Allocation Fund – Portfolio of Investments (Continued)
| | | Principal
Amount | | Value | |
Wells Fargo Mortgage
Backed Securities Trust,
Series 2003-16, Class 2A1
4.500% 12/25/18 | | $ | 56,918 | | | $ | 51,613 | | |
Wells Fargo Mortgage
Backed Securities Trust,
Series 2006-1, Class A3
5.000% 3/25/21 | | | 757,058 | | | | 583,053 | | |
Wells Fargo Mortgage
Backed Securities Trust,
Series 2006-AR15,
Class A1 FRN
5.665% 10/25/36 | | | 638,312 | | | | 448,427 | | |
| | | | 3,005,197 | | |
TOTAL NON-U.S. GOVERNMENT
AGENCY OBLIGATIONS
(Cost $9,114,874) | | | 6,287,507 | | |
| SOVEREIGN DEBT OBLIGATIONS — 0.6% | |
Bundesrepublik
Deutschland EUR(e)
4.250% 7/04/14 | | | 70,000 | | | | 106,169 | | |
Bundesrepublik
Deutschland EUR(e)
4.750% 7/04/34 | | | 25,000 | | | | 40,120 | | |
Canadian Government
Bond CAD(e)
4.500% 6/01/15 | | | 10,000 | | | | 9,242 | | |
Gabonese Republic(b)
8.200% 12/12/17 | | | 100,000 | | | | 66,500 | | |
Japan
Government JPY(e)
1.700% 9/20/17 | | | 10,000,000 | | | | 117,078 | | |
Japan Government
Ten Year Bond JPY(e)
1.500% 9/20/14 | | | 10,000,000 | | | | 115,000 | | |
Mexico Government
International Bond
6.625% 3/03/15 | | | 25,000 | | | | 26,367 | | |
Mexico Government
International Bond
10.375% 2/17/09 | | | 110,000 | | | | 110,550 | | |
Netherlands Government
Bond EUR(e)
3.250% 7/15/15 | | | 50,000 | | | | 69,655 | | |
Queensland Treasury
Corp. AUD(e)
6.000% 10/14/15 | | | 30,000 | | | | 22,284 | | |
Republic of Brazil
8.000% 1/15/18 | | | 25,000 | | | | 27,903 | | |
Republic of
Colombia COP(e)
9.850% 6/28/27 | | | 37,000,000 | | | | 16,367 | | |
| | | Principal
Amount | | Value | |
Republic of Turkey TRY(e)
16.000% 3/07/12 | | $ | 49,975 | | | $ | 31,730 | | |
Sweden Government
Bond SEK(e)
6.750% 5/05/14 | | | 40,000 | | | | 6,250 | | |
United Kingdom
Gilt GBP(e)
4.000% 9/07/16 | | | 20,000 | | | | 30,852 | | |
TOTAL SOVEREIGN DEBT
OBLIGATIONS
(Cost $805,077) | | | 796,067 | | |
U.S. GOVERNMENT AGENCY
OBLIGATIONS AND
INSTRUMENTALITIES — 15.4% | |
| Collateralized Mortgage Obligations — 0.5% | |
Federal Home Loan
Mortgage Corp. | |
Series 3312, Class PA
5.500% 5/15/37 | | | 113,080 | | | | 115,571 | | |
Series 3233, Class PA
6.000% 10/15/36 | | | 102,019 | | | | 105,635 | | |
Federal National
Mortgage Association | |
Series 2007-33, Class HE
5.500% 4/25/37 | | | 153,048 | | | | 156,611 | | |
Series 2007-40, Class PT
5.500% 5/25/37 | | | 312,297 | | | | 319,134 | | |
| | | | 696,951 | | |
| Pass-Through Securities — 14.9% | |
Farmer Mac Guaranteed
Notes Trust 2006-2(b)
5.500% 7/15/11 | | | 500,000 | | | | 536,891 | | |
Federal Home Loan
Bank of Chicago
5.625% 6/13/16 | | | 215,000 | | | | 227,115 | | |
Federal Home
Loan Banks
2.250% 10/02/09 | | | 845,000 | | | | 854,892 | | |
Federal Home Loan
Mortgage Corp. | |
Pool #A74199
5.000% 2/01/38 | | | 2,319,961 | | | | 2,367,992 | | |
| 5.250% 7/18/11 | | | 125,000 | | | | 136,158 | | |
Pool #G03865
5.500% 12/01/37 | | | 702,009 | | | | 719,367 | | |
Pool #1Q0357
5.724% 11/01/37 | | | 107,422 | | | | 109,892 | | |
Pool #1N0364
6.258% 2/01/37 | | | 115,332 | | | | 118,200 | | |
Pool #G04553
6.500% 8/01/38 | | | 47,273 | | | | 49,192 | | |
| 6.625% 9/15/09 | | | 1,500,000 | | | | 1,562,796 | | |
| | | Principal
Amount | | Value | |
Federal National
Mortgage Association | |
| 5.250% 8/01/12 | | $ | 100,000 | | | $ | 102,786 | | |
Pool #891908
5.500% 6/01/21 | | | 601,695 | | | | 621,085 | | |
Pool #888352
5.500% 5/01/37 | | | 1,426,501 | | | | 1,465,006 | | |
Pool #891436
6.000% 3/01/36 | | | 2,675,821 | | | | 2,759,963 | | |
Pool #888408
6.000% 3/01/37 | | | 87,566 | | | | 87,867 | | |
Pool #915678
6.000% 3/01/37 | | | 3,047,898 | | | | 3,143,741 | | |
| 6.077% 2/17/09 | | | 135,000 | | | | 134,831 | | |
| 6.250% 2/01/11 | | | 85,000 | | | | 89,687 | | |
| 6.250% 5/15/29 | | | 125,000 | | | | 170,109 | | |
Pool #897206
6.500% 8/01/36 | | | 46,679 | | | | 48,573 | | |
Pool #944066
6.500% 7/01/37 | | | 518,167 | | | | 529,806 | | |
Pool #256860
6.500% 8/01/37 | | | 42,908 | | | | 43,871 | | |
Pool #888373
7.000% 3/01/37 | | | 371,129 | | | | 376,696 | | |
Pool #955210
7.000% 12/01/37 | | | 125,529 | | | | 129,148 | | |
Pool #256975
7.000% 10/01/47 | | | 95,111 | | | | 97,496 | | |
Federal National Mortgage
Association TBA | |
Pool #3534
4.500% 6/01/34(f) | | | 435,000 | | | | 440,846 | | |
Pool #54347
6.000% 1/01/36(f) | | | 3,460,000 | | | | 3,561,637 | | |
| | | | 20,485,643 | | |
TOTAL U.S. GOVERNMENT
AGENCY OBLIGATIONS AND
INSTRUMENTALITIES
(Cost $20,671,761) | | | 21,182,594 | | |
| U.S. TREASURY OBLIGATIONS — 5.1% | |
| U.S. Treasury Bonds & Notes — 5.1% | |
U.S. Treasury Bond
4.375% 2/15/38 | | | 135,000 | | | | 180,953 | | |
U.S. Treasury Bond
5.500% 8/15/28 | | | 335,000 | | | | 453,087 | | |
U.S. Treasury Bond
6.250% 8/15/23 | | | 850,000 | | | | 1,160,250 | | |
U.S. Treasury Bond
7.250% 5/15/16 | | | 290,000 | | | | 388,419 | | |
U.S. Treasury
Inflation Index
1.875% 7/15/13 | | | 383,360 | | | | 360,927 | | |
(Continued)
The accompanying notes are an integral part of the financial statements.
77
MML Asset Allocation Fund – Portfolio of Investments (Continued)
| | | Principal
Amount | | Value | |
U.S. Treasury
Inflation Index
1.875% 7/15/15 | | $ | 139,225 | | | $ | 131,513 | | |
U.S. Treasury Note
1.125% 12/15/11 | | | 810,000 | | | | 813,607 | | |
U.S. Treasury Note
2.750% 10/31/13 | | | 1,535,000 | | | | 1,631,897 | | |
U.S. Treasury Note
3.500% 12/15/09 | | | 130,000 | | | | 133,880 | | |
U.S. Treasury Note
3.500% 2/15/18 | | | 945,000 | | | | 1,046,403 | | |
U.S. Treasury Note
3.625% 5/15/13 | | | 635,000 | | | | 697,706 | | |
U.S. Treasury Note
3.875% 2/15/13 | | | 30,000 | | | | 33,441 | | |
| | | | 7,032,083 | | |
TOTAL U.S. TREASURY
OBLIGATIONS
(Cost $6,697,337) | | | 7,032,083 | | |
TOTAL BONDS & NOTES
(Cost $52,122,266) | | | 48,447,122 | | |
TOTAL LONG-TERM
INVESTMENTS
(Cost $170,897,173) | | | 137,503,519 | | |
| SHORT-TERM INVESTMENTS — 3.3% | |
| Repurchase Agreement — 3.3% | |
State Street Bank &
Trust Co. Repurchase
Agreement, dated
12/31/08, 0.010%,
due 1/02/09(g) | | | 4,544,298 | | | | 4,544,298 | | |
TOTAL SHORT-TERM
INVESTMENTS
(Cost $4,544,298) | | | 4,544,298 | | |
TOTAL INVESTMENTS — 102.9%
(Cost $175,441,471)(h) | | | 142,047,817 | | |
Other Assets/
(Liabilities) — (2.9%) | | | (3,965,387 | ) | |
| NET ASSETS — 100.0% | | $ | 138,082,430 | | |
Notes to Portfolio of Investments
Industry classifications are unaudited.
ABS - Asset Backed Security
ADR - American Depositary Receipt
AUD - Australian Dollar
CAD - Canadian Dollar
CMO - Collateralized Mortgage Obligation
COP - Colombian Peso
EUR - Euro
FRN - Floating Rate Note
GBP - British Pound
JPY - Japanese Yen
MBS - Mortgage Backed Security
SEK - Swedish Krona
STEP - Step Up Bond
TBA - To Be Announced
TRY - New Turkish Lira
VRN - Variable Rate Note
WL - Whole Loan
(a) Non-income producing security.
(b) Securities exempt from registration under rule 144A of the Securities Act of 1933. These securities may be resold in transactions exempt from registration, normally to qualified institutional buyers. At December 31, 2008, these securities amounted to a value of $4,576,934 or 3.31% of net assets.
(c) Restricted security. (Note 2).
(d) Reg. S - Investments issued under Regulation S of the Securities Act of 1933, may not be offered, sold, or delivered within the United States except under special exemptions.
(e) The principal amount of the security is in foreign currency. The market value is in U.S. dollars.
(f) A portion of this security is purchased on a forward commitment basis. (Note 2).
(g) Maturity value of $4,544,300. Collateralized by U.S. Government Agency obligations with a rate of 0.000%, maturity date of 1/29/09, and an aggregate market value, including accrued interest, of $4,800,000.
(h) See Note 6 for aggregate cost for federal tax purposes.
The accompanying notes are an integral part of the financial statements.
78
MML Equity Income Fund – Portfolio of Investments
December 31, 2008
| | | Number of
Shares | | Value | |
| EQUITIES — 95.3% | |
| COMMON STOCK — 95.3% | |
| Aerospace & Defense — 0.9% | |
| Boeing Co. | | | 77,800 | | | $ | 3,319,726 | | |
| Banks — 8.5% | |
| Allied Irish Banks PLC | | | 183,900 | | | | 450,108 | | |
| Bank of America Corp. | | | 177,983 | | | | 2,506,001 | | |
The Bank of New York
Mellon Corp. | | | 162,600 | | | | 4,606,458 | | |
| Capital One Financial Corp. | | | 89,700 | | | | 2,860,533 | | |
| Fifth Third Bancorp | | | 189,500 | | | | 1,565,270 | | |
| KeyCorp | | | 172,100 | | | | 1,466,292 | | |
| Marshall & Ilsley Corp. | | | 75,300 | | | | 1,027,092 | | |
| SunTrust Banks, Inc. | | | 127,000 | | | | 3,751,580 | | |
| U.S. Bancorp | | | 215,900 | | | | 5,399,659 | | |
| Wells Fargo & Co. | | | 236,800 | | | | 6,980,864 | | |
| | | | 30,613,857 | | |
| Beverages — 0.5% | |
| InBev NV | | | 80,200 | | | | 1,859,383 | | |
| Biotechnology — 1.0% | |
| Amgen, Inc.(a) | | | 64,100 | | | | 3,701,775 | | |
| Building Materials — 0.8% | |
| Masco Corp. | | | 204,700 | | | | 2,278,311 | | |
| USG Corp.(a) | | | 73,800 | | | | 593,352 | | |
| | | | 2,871,663 | | |
| Chemicals — 1.5% | |
Du Pont (E.I.) de
Nemours & Co. | | | 116,000 | | | | 2,934,800 | | |
International Flavors &
Fragrances, Inc. | | | 85,200 | | | | 2,532,144 | | |
| | | | 5,466,944 | | |
| Coal — 0.3% | |
| CONSOL Energy, Inc. | | | 36,900 | | | | 1,054,602 | | |
| Commercial Services — 0.7% | |
| H&R Block, Inc. | | | 105,800 | | | | 2,403,776 | | |
| Computers — 1.3% | |
Computer
Sciences Corp.(a) | | | 74,200 | | | | 2,607,388 | | |
| Dell, Inc.(a) | | | 206,100 | | | | 2,110,464 | | |
| | | | 4,717,852 | | |
| Cosmetics & Personal Care — 0.2% | |
| Colgate-Palmolive Co. | | | 8,400 | | | | 575,736 | | |
The Estee Lauder Cos., Inc.
Class A | | | 6,200 | | | | 191,952 | | |
| | | | 767,688 | | |
| | | Number of
Shares | | Value | |
| Distribution & Wholesale — 0.6% | |
| Genuine Parts Co. | | | 58,400 | | | $ | 2,211,024 | | |
| Diversified Financial — 7.4% | |
| American Express Co. | | | 158,800 | | | | 2,945,740 | | |
| Citigroup, Inc. | | | 141,400 | | | | 948,794 | | |
The Goldman Sachs
Group, Inc. | | | 36,100 | | | | 3,046,479 | | |
| Janus Capital Group, Inc. | | | 70,600 | | | | 566,918 | | |
| JP Morgan Chase & Co. | | | 368,400 | | | | 11,615,652 | | |
| Legg Mason, Inc. | | | 25,400 | | | | 556,514 | | |
| Merrill Lynch & Co., Inc. | | | 207,037 | | | | 2,409,915 | | |
Merrill Lynch &
Co., Inc.(b) | | | 53,458 | | | | 591,134 | | |
| SLM Corp.(a) | | | 247,700 | | | | 2,204,530 | | |
| UBS AG(a) | | | 132,255 | | | | 1,891,247 | | |
| | | | 26,776,923 | | |
| Electric — 5.1% | |
| Duke Energy Corp. | | | 174,500 | | | | 2,619,245 | | |
| Entergy Corp. | | | 30,100 | | | | 2,502,213 | | |
| FirstEnergy Corp. | | | 29,800 | | | | 1,447,684 | | |
| NRG Energy, Inc.(a) | | | 27,000 | | | | 629,910 | | |
| PG&E Corp. | | | 62,700 | | | | 2,427,117 | | |
Pinnacle West
Capital Corp. | | | 67,400 | | | | 2,165,562 | | |
| Progress Energy, Inc. | | | 75,300 | | | | 3,000,705 | | |
| TECO Energy, Inc. | | | 55,700 | | | | 687,895 | | |
| Xcel Energy, Inc. | | | 157,800 | | | | 2,927,190 | | |
| | | | 18,407,521 | | |
| Electronics — 0.3% | |
| Tyco Electronics Ltd. | | | 70,500 | | | | 1,142,805 | | |
| Foods — 3.1% | |
| The Hershey Co. | | | 177,800 | | | | 6,176,772 | | |
| Kraft Foods, Inc. Class A | | | 112,600 | | | | 3,023,310 | | |
| McCormick & Co., Inc. | | | 50,300 | | | | 1,602,558 | | |
| Whole Foods Market, Inc. | | | 33,200 | | | | 313,408 | | |
| | | | 11,116,048 | | |
| Forest Products & Paper — 1.5% | |
| International Paper Co. | | | 256,000 | | | | 3,020,800 | | |
| MeadWestvaco Corp. | | | 112,200 | | | | 1,255,518 | | |
| Weyerhaeuser Co. | | | 30,700 | | | | 939,727 | | |
| | | | 5,216,045 | | |
| Gas — 0.8% | |
| NiSource, Inc. | | | 245,300 | | | | 2,690,941 | | |
| Hand & Machine Tools — 0.4% | |
| The Black & Decker Corp. | | | 31,100 | | | | 1,300,291 | | |
| | | Number of
Shares | | Value | |
| Health Care – Products — 1.1% | |
| Johnson & Johnson | | | 63,500 | | | $ | 3,799,205 | | |
| Health Care – Services — 0.5% | |
| WellPoint, Inc.(a) | | | 44,200 | | | | 1,862,146 | | |
| Home Builders — 0.1% | |
| D.R. Horton, Inc. | | | 68,900 | | | | 487,123 | | |
| Home Furnishing — 0.9% | |
Harman International
Industries, Inc. | | | 45,500 | | | | 761,215 | | |
| Whirlpool Corp. | | | 62,400 | | | | 2,580,240 | | |
| | | | 3,341,455 | | |
| Household Products — 2.9% | |
| Avery Dennison Corp. | | | 88,900 | | | | 2,909,697 | | |
| Fortune Brands, Inc. | | | 116,800 | | | | 4,821,504 | | |
| Kimberly-Clark Corp. | | | 50,800 | | | | 2,679,192 | | |
| | | | 10,410,393 | | |
| Housewares — 0.5% | |
| Newell Rubbermaid, Inc. | | | 177,300 | | | | 1,733,994 | | |
| Insurance — 3.8% | |
| Chubb Corp. | | | 38,800 | | | | 1,978,800 | | |
The Hartford Financial
Services Group, Inc. | | | 10,800 | | | | 177,336 | | |
| Lincoln National Corp. | | | 114,300 | | | | 2,153,412 | | |
Marsh &
McLennan Cos., Inc. | | | 221,700 | | | | 5,380,659 | | |
| The Progressive Corp. | | | 111,400 | | | | 1,649,834 | | |
| The Travelers Cos., Inc. | | | 52,200 | | | | 2,359,440 | | |
| | | | 13,699,481 | | |
| Internet — 1.1% | |
| eBay, Inc.(a) | | | 116,400 | | | | 1,624,944 | | |
| Yahoo!, Inc.(a) | | | 177,800 | | | | 2,169,160 | | |
| | | | 3,794,104 | | |
| Iron & Steel — 1.2% | |
| Nucor Corp. | | | 93,900 | | | | 4,338,180 | | |
| Leisure Time — 0.4% | |
| Harley-Davidson, Inc. | | | 82,700 | | | | 1,403,419 | | |
| Lodging — 0.8% | |
Marriott International, Inc.
Class A | | | 81,000 | | | | 1,575,450 | | |
| MGM MIRAGE(a) | | | 104,700 | | | | 1,440,672 | | |
| | | | 3,016,122 | | |
| Machinery – Diversified — 0.8% | |
| Deere & Co. | | | 78,800 | | | | 3,019,616 | | |
(Continued)
The accompanying notes are an integral part of the financial statements.
79
MML Equity Income Fund – Portfolio of Investments (Continued)
| | | Number of
Shares | | Value | |
| Manufacturing — 7.3% | |
| 3M Co. | | | 98,000 | | | $ | 5,638,920 | | |
Cooper Industries Ltd.
Class A | | | 63,800 | | | | 1,864,874 | | |
| Eaton Corp. | | | 25,400 | | | | 1,262,634 | | |
| General Electric Co. | | | 645,600 | | | | 10,458,720 | | |
Honeywell
International, Inc. | | | 81,200 | | | | 2,665,796 | | |
| Illinois Tool Works, Inc. | | | 120,700 | | | | 4,230,535 | | |
| | | | 26,121,479 | | |
| Media — 4.4% | |
Cablevision Systems Corp.
Class A | | | 110,900 | | | | 1,867,556 | | |
| CBS Corp. Class B | | | 73,800 | | | | 604,422 | | |
| Gannett Co., Inc. | | | 45,900 | | | | 367,200 | | |
| The McGraw-Hill Cos., Inc. | | | 149,300 | | | | 3,462,267 | | |
New York Times Co.
Class A | | | 177,800 | | | | 1,303,274 | | |
| Time Warner, Inc. | | | 395,900 | | | | 3,982,754 | | |
| The Walt Disney Co. | | | 158,800 | | | | 3,603,172 | | |
| WPP PLC | | | 95,400 | | | | 556,110 | | |
| | | | 15,746,755 | | |
| Mining — 1.5% | |
| Alcoa, Inc. | | | 122,900 | | | | 1,383,854 | | |
| Vulcan Materials Co. | | | 57,200 | | | | 3,979,976 | | |
| | | | 5,363,830 | | |
| Oil & Gas — 12.9% | |
| Anadarko Petroleum Corp. | | | 76,200 | | | | 2,937,510 | | |
BP PLC Sponsored ADR
(United Kingdom) | | | 94,200 | | | | 4,402,908 | | |
| Chevron Corp. | | | 152,200 | | | | 11,258,234 | | |
| Exxon Mobil Corp. | | | 152,200 | | | | 12,150,126 | | |
| Murphy Oil Corp. | | | 90,300 | | | | 4,004,805 | | |
Royal Dutch Shell PLC
Sponsored ADR
(United Kingdom) | | | 146,100 | | | | 7,734,534 | | |
| Sunoco, Inc. | | | 86,700 | | | | 3,767,982 | | |
| | | | 46,256,099 | | |
| Oil & Gas Services — 0.8% | |
| BJ Services Co. | | | 59,900 | | | | 699,033 | | |
| Schlumberger Ltd. | | | 49,700 | | | | 2,103,801 | | |
| | | | 2,802,834 | | |
| Pharmaceuticals — 6.0% | |
| Bristol-Myers Squibb Co. | | | 150,100 | | | | 3,489,825 | | |
| Eli Lilly & Co. | | | 101,600 | | | | 4,091,432 | | |
| Merck & Co., Inc. | | | 152,400 | | | | 4,632,960 | | |
| Pfizer, Inc. | | | 279,400 | | | | 4,948,174 | | |
| Wyeth | | | 119,500 | | | | 4,482,445 | | |
| | | | 21,644,836 | | |
| | | Number of
Shares | | Value | |
| Pipelines — 0.4% | |
| Spectra Energy Corp. | | | 93,550 | | | $ | 1,472,477 | | |
| Retail — 3.4% | |
Bed Bath &
Beyond, Inc.(a) | | | 155,500 | | | | 3,952,810 | | |
| The Home Depot, Inc. | | | 247,700 | | | | 5,702,054 | | |
| Macy's, Inc. | | | 86,100 | | | | 891,135 | | |
| Tiffany & Co. | | | 69,700 | | | | 1,647,011 | | |
| | | | 12,193,010 | | |
| Semiconductors — 1.5% | |
| Analog Devices, Inc. | | | 132,200 | | | | 2,514,444 | | |
| Applied Materials, Inc. | | | 104,500 | | | | 1,058,585 | | |
| Intel Corp. | | | 125,300 | | | | 1,836,898 | | |
| | | | 5,409,927 | | |
| Software — 1.2% | |
| Microsoft Corp. | | | 226,700 | | | | 4,407,048 | | |
| Telecommunications — 5.2% | |
Alcatel-Lucent Sponsored
ADR (France)(a) | | | 171,600 | | | | 368,940 | | |
| AT&T, Inc. | | | 309,100 | | | | 8,809,350 | | |
| Cisco Systems, Inc.(a) | | | 66,900 | | | | 1,090,470 | | |
Qwest Communications
International, Inc. | | | 623,600 | | | | 2,269,904 | | |
| Sprint Nextel Corp.(a) | | | 291,900 | | | | 534,177 | | |
Verizon
Communications, Inc. | | | 132,700 | | | | 4,498,530 | | |
| Vodafone Group PLC | | | 644,200 | | | | 1,296,848 | | |
| | | | 18,868,219 | | |
| Toys, Games & Hobbies — 0.7% | |
| Mattel, Inc. | | | 162,200 | | | | 2,595,200 | | |
| Transportation — 1.0% | |
United Parcel Service, Inc.
Class B | | | 65,300 | | | | 3,601,948 | | |
TOTAL COMMON STOCK
(Cost $479,104,015) | | | 343,027,764 | | |
| PREFERRED STOCK — 0.0% | |
| Diversified Financial — 0.0% | |
Federal National
Mortgage Association | | | 56,500 | | | | 59,325 | | |
TOTAL PREFERRED STOCK
(Cost $2,456,077) | | | 59,325 | | |
TOTAL EQUITIES
(Cost $481,560,092) | | | 343,087,089 | | |
| | | Number of
Shares | | Value | |
| MUTUAL FUNDS — 2.9% | |
| Diversified Financial — 2.9% | |
T. Rowe Price Resource
Investment Fund | | | 10,281,674 | | | $ | 10,281,674 | | |
TOTAL MUTUAL FUNDS
(Cost $10,281,674) | | | 10,281,674 | | |
| | | Principal
Amount | | | |
| BONDS & NOTES — 0.1% | |
| CORPORATE DEBT — 0.1% | |
| Auto Manufacturers — 0.1% | |
Ford Motor Co.
4.250% 12/15/36 | | $ | 1,826,000 | | | | 470,195 | | |
TOTAL CORPORATE DEBT
(Cost $833,200) | | | 470,195 | | |
TOTAL BONDS & NOTES
(Cost $833,200) | | | 470,195 | | |
TOTAL LONG-TERM
INVESTMENTS
(Cost $492,674,966) | | | 353,838,958 | | |
| SHORT-TERM INVESTMENTS — 1.6% | |
| Repurchase Agreement — 1.6% | |
State Street Bank &
Trust Co. Repurchase
Agreement, dated
12/31/08, 0.010%,
due 1/02/09(c) | | | 5,858,259 | | | | 5,858,259 | | |
TOTAL SHORT-TERM
INVESTMENTS
(Cost $5,858,259) | | | 5,858,259 | | |
TOTAL INVESTMENTS — 99.9%
(Cost $498,533,225)(d) | | | 359,697,217 | | |
Other Assets/
(Liabilities) — 0.1% | | | 466,852 | | |
| NET ASSETS — 100.0% | | $ | 360,164,069 | | |
Notes to Portfolio of Investments
Industry classifications are unaudited.
| ADR - American Depositary Receipt | |
(a) Non-income producing security.
(b) This security is valued in good faith under procedures established by the Board of Trustees.
(c) Maturity value of $5,858,263. Collateralized by U.S. Government Agency obligations with rates ranging from 4.573% - 4.592%, maturity date of 5/01/35, and an aggregate market value, including accrued interest, of $5,976,503.
(d) See Note 6 for aggregate cost for federal tax purposes.
The accompanying notes are an integral part of the financial statements.
80
MML Income & Growth Fund – Portfolio of Investments
December 31, 2008
| | | Number of
Shares | | Value | |
| EQUITIES — 99.4% | |
| COMMON STOCK — 99.4% | |
| Aerospace & Defense — 3.0% | |
| Boeing Co. | | | 11,494 | | | $ | 490,449 | | |
| General Dynamics Corp. | | | 3,031 | | | | 174,555 | | |
| Lockheed Martin Corp. | | | 7,004 | | | | 588,896 | | |
| Northrop Grumman Corp. | | | 20,712 | | | | 932,869 | | |
| Raytheon Co. | | | 2,218 | | | | 113,207 | | |
| | | | 2,299,976 | | |
| Agriculture — 2.9% | |
| Altria Group, Inc. | | | 35,688 | | | | 537,461 | | |
| Archer-Daniels-Midland Co. | | | 5,648 | | | | 162,832 | | |
| Bunge Ltd. | | | 11,803 | | | | 611,041 | | |
| Lorillard, Inc. | | | 4,357 | | | | 245,517 | | |
Philip Morris
International, Inc. | | | 3,801 | | | | 165,381 | | |
| Reynolds American, Inc. | | | 12,451 | | | | 501,900 | | |
| Universal Corp. | | | 48 | | | | 1,434 | | |
| | | | 2,225,566 | | |
| Airlines — 0.1% | |
| Southwest Airlines Co. | | | 6,974 | | | | 60,116 | | |
| Apparel — 0.0% | |
| VF Corp. | | | 701 | | | | 38,394 | | |
| Auto Manufacturers — 0.0% | |
| Ford Motor Co.(a) | | | 12,042 | | | | 27,576 | | |
| Automotive & Parts — 0.0% | |
Magna International, Inc.
Class A | | | 316 | | | | 9,458 | | |
| Banks — 5.3% | |
| Bank of America Corp. | | | 36,588 | | | | 515,159 | | |
| Bank of Montreal | | | 1,212 | | | | 31,136 | | |
The Bank of New York
Mellon Corp. | | | 15,662 | | | | 443,704 | | |
| BB&T Corp. | | | 2,368 | | | | 65,025 | | |
| Capital One Financial Corp. | | | 8,183 | | | | 260,956 | | |
| Cullen/Frost Bankers, Inc. | | | 876 | | | | 44,396 | | |
International
Bancshares Corp. | | | 6,456 | | | | 140,935 | | |
| Northern Trust Corp. | | | 4,142 | | | | 215,964 | | |
PNC Financial Services
Group, Inc. | | | 1,785 | | | | 87,465 | | |
| Regions Financial Corp. | | | 1,364 | | | | 10,857 | | |
| Royal Bank of Canada | | | 5,842 | | | | 173,274 | | |
| State Street Corp. | | | 2,748 | | | | 108,079 | | |
| SunTrust Banks, Inc. | | | 4,300 | | | | 127,022 | | |
| | | Number of
Shares | | Value | |
| U.S. Bancorp | | | 25,853 | | | $ | 646,584 | | |
| Wells Fargo & Co. | | | 36,472 | | | | 1,075,195 | | |
| Zions Bancorp | | | 5,048 | | | | 123,726 | | |
| | | | 4,069,477 | | |
| Beverages — 1.5% | |
| The Coca-Cola Co. | | | 4,392 | | | | 198,826 | | |
| Coca-Cola Enterprises, Inc. | | | 19,622 | | | | 236,053 | | |
Constellation Brands, Inc.
Class A(a) | | | 5,672 | | | | 89,447 | | |
Molson Coors Brewing Co.
Class B | | | 8,624 | | | | 421,886 | | |
The Pepsi Bottling
Group, Inc. | | | 7,888 | | | | 177,559 | | |
| PepsiCo, Inc. | | | 1,321 | | | | 72,351 | | |
| | | | 1,196,122 | | |
| Biotechnology — 2.0% | |
| Amgen, Inc.(a) | | | 26,214 | | | | 1,513,859 | | |
| Building Materials — 0.1% | |
| Masco Corp. | | | 6,066 | | | | 67,515 | | |
| Chemicals — 1.1% | |
CF Industries
Holdings, Inc. | | | 1,726 | | | | 84,850 | | |
| The Dow Chemical Co. | | | 4,988 | | | | 75,269 | | |
Du Pont (E.I.) de
Nemours & Co. | | | 17,734 | | | | 448,670 | | |
| Methanex Corp. | | | 3,571 | | | | 40,138 | | |
| Terra Industries, Inc. | | | 14,085 | | | | 234,797 | | |
| | | | 883,724 | | |
| Coal — 0.0% | |
| Walter Industries, Inc. | | | 57 | | | | 998 | | |
| Commercial Services — 1.9% | |
| Accenture Ltd. Class A | | | 29,396 | | | | 963,895 | | |
Donnelley (R.R.) &
Sons Co. | | | 20,241 | | | | 274,873 | | |
| Mastercard, Inc. Class A | | | 793 | | | | 113,343 | | |
| Rent-A-Center, Inc.(a) | | | 7,855 | | | | 138,641 | | |
| | | | 1,490,752 | | |
| Computers — 6.1% | |
| Apple, Inc.(a) | | | 4,940 | | | | 421,629 | | |
Computer
Sciences Corp.(a) | | | 27,319 | | | | 959,990 | | |
| EMC Corp.(a) | | | 10,569 | | | | 110,657 | | |
| Hewlett-Packard Co. | | | 30,043 | | | | 1,090,260 | | |
International Business
Machines Corp. | | | 17,877 | | | | 1,504,528 | | |
| | | Number of
Shares | | Value | |
Lexmark International, Inc.
Class A(a) | | | 15,072 | | | $ | 405,437 | | |
| Western Digital Corp.(a) | | | 21,010 | | | | 240,565 | | |
| | | | 4,733,066 | | |
| Cosmetics & Personal Care — 2.2% | |
| Colgate-Palmolive Co. | | | 1,217 | | | | 83,413 | | |
| The Procter & Gamble Co. | | | 25,986 | | | | 1,606,455 | | |
| | | | 1,689,868 | | |
| Diversified Financial — 4.1% | |
| BlackRock, Inc. | | | 637 | | | | 85,454 | | |
| The Charles Schwab Corp. | | | 13,515 | | | | 218,538 | | |
| Citigroup, Inc. | | | 52,328 | | | | 351,121 | | |
Discover
Financial Services | | | 13,827 | | | | 131,771 | | |
Federated Investors, Inc.
Class B | | | 686 | | | | 11,635 | | |
The Goldman Sachs
Group, Inc. | | | 1,118 | | | | 94,348 | | |
| Janus Capital Group, Inc. | | | 6,810 | | | | 54,684 | | |
| JP Morgan Chase & Co. | | | 37,550 | | | | 1,183,951 | | |
| Merrill Lynch & Co., Inc. | | | 30,593 | | | | 356,103 | | |
| Morgan Stanley | | | 12,706 | | | | 203,804 | | |
| NYSE Euronext | | | 6,546 | | | | 179,229 | | |
Raymond James
Financial, Inc. | | | 12,382 | | | | 212,104 | | |
| T. Rowe Price Group, Inc. | | | 2,134 | | | | 75,629 | | |
| | | | 3,158,371 | | |
| Electric — 3.0% | |
| Duke Energy Corp. | | | 1,852 | | | | 27,799 | | |
| Edison International | | | 24,634 | | | | 791,244 | | |
| Entergy Corp. | | | 1,213 | | | | 100,837 | | |
| FPL Group, Inc. | | | 15,444 | | | | 777,297 | | |
| PG&E Corp. | | | 2,133 | | | | 82,568 | | |
| Progress Energy, Inc. | | | 3,711 | | | | 147,883 | | |
Public Service Enterprise
Group, Inc. | | | 5,178 | | | | 151,042 | | |
| Reliant Energy, Inc.(a) | | | 40,745 | | | | 235,506 | | |
| | | | 2,314,176 | | |
| Electrical Components & Equipment — 0.4% | |
| Emerson Electric Co. | | | 8,066 | | | | 295,296 | | |
| Electronics — 0.3% | |
| Celestica, Inc.(a) | | | 48,688 | | | | 224,452 | | |
| Engineering & Construction — 0.8% | |
| Emcor Group, Inc.(a) | | | 23,142 | | | | 519,075 | | |
| Fluor Corp. | | | 1,786 | | | | 80,138 | | |
| | | | 599,213 | | |
(Continued)
The accompanying notes are an integral part of the financial statements.
81
MML Income & Growth Fund – Portfolio of Investments (Continued)
| | | Number of
Shares | | Value | |
| Environmental Controls — 0.0% | |
| Republic Services, Inc. | | | 636 | | | $ | 15,766 | | |
| Foods — 3.1% | |
Corn Products
International, Inc. | | | 4,686 | | | | 135,191 | | |
| General Mills, Inc. | | | 17,196 | | | | 1,044,657 | | |
| Heinz (H.J.) Co. | | | 838 | | | | 31,509 | | |
| The J.M. Smucker Co. | | | 4,655 | | | | 201,841 | | |
| Kellogg Co. | | | 1,562 | | | | 68,494 | | |
| Kraft Foods, Inc. Class A | | | 8,412 | | | | 225,862 | | |
| The Kroger Co. | | | 12,517 | | | | 330,574 | | |
| Safeway, Inc. | | | 11,425 | | | | 271,572 | | |
| SuperValu, Inc. | | | 2,166 | | | | 31,623 | | |
| Tyson Foods, Inc. Class A | | | 7,833 | | | | 68,617 | | |
| | | | 2,409,940 | | |
| Forest Products & Paper — 0.0% | |
| International Paper Co. | | | 1,233 | | | | 14,549 | | |
| Gas — 0.1% | |
| Nicor, Inc. | | | 2,502 | | | | 86,919 | | |
| Hand & Machine Tools — 0.1% | |
| Snap-on, Inc. | | | 1,488 | | | | 58,597 | | |
| Health Care – Products — 4.5% | |
| Baxter International, Inc. | | | 9,278 | | | | 497,208 | | |
| Becton, Dickinson & Co. | | | 10,710 | | | | 732,457 | | |
| Johnson & Johnson | | | 36,833 | | | | 2,203,718 | | |
| | | | 3,433,383 | | |
| Health Care – Services — 0.7% | |
| AMERIGROUP Corp.(a) | | | 14,822 | | | | 437,546 | | |
| WellPoint, Inc.(a) | | | 2,064 | | | | 86,956 | | |
| | | | 524,502 | | |
| Home Builders — 0.5% | |
| NVR, Inc.(a) | | | 782 | | | | 356,788 | | |
| Home Furnishing — 0.0% | |
Harman International
Industries, Inc. | | | 1,359 | | | | 22,736 | | |
| Household Products — 1.7% | |
| The Clorox Co. | | | 3,884 | | | | 215,795 | | |
| Kimberly-Clark Corp. | | | 20,101 | | | | 1,060,127 | | |
| Tupperware Brands Corp. | | | 1,184 | | | | 26,877 | | |
| | | | 1,302,799 | | |
| Insurance — 4.0% | |
| ACE Ltd. | | | 17,093 | | | | 904,562 | | |
American Financial
Group, Inc. | | | 8,398 | | | | 192,146 | | |
| Arch Capital Group Ltd.(a) | | | 2,169 | | | | 152,047 | | |
Aspen Insurance
Holdings Ltd. | | | 28,998 | | | | 703,202 | | |
| | | Number of
Shares | | Value | |
| Axis Capital Holdings Ltd. | | | 8,343 | | | $ | 242,948 | | |
Endurance Specialty
Holdings Ltd. | | | 568 | | | | 17,341 | | |
Genworth Financial, Inc.
Class A | | | 5,731 | | | | 16,219 | | |
| Lincoln National Corp. | | | 541 | | | | 10,192 | | |
Principal Financial
Group, Inc. | | | 30,803 | | | | 695,224 | | |
| Sun Life Financial, Inc. | | | 1,010 | | | | 23,371 | | |
| The Travelers Cos., Inc. | | | 3,405 | | | | 153,906 | | |
| Unum Group | | | 607 | | | | 11,290 | | |
| | | | 3,122,448 | | |
| Internet — 0.8% | |
| Google, Inc. Class A(a) | | | 1,292 | | | | 397,484 | | |
| IAC/InterActiveCorp(a) | | | 9,794 | | | | 154,060 | | |
| Yahoo!, Inc.(a) | | | 8,323 | | | | 101,540 | | |
| | | | 653,084 | | |
| Investment Companies — 0.0% | |
American Capital
Strategies Ltd. | | | 2,068 | | | | 6,700 | | |
| Iron & Steel — 0.6% | |
| Nucor Corp. | | | 5,647 | | | | 260,892 | | |
Reliance Steel &
Aluminum Co. | | | 686 | | | | 13,679 | | |
| United States Steel Corp. | | | 4,262 | | | | 158,546 | | |
| | | | 433,117 | | |
| Leisure Time — 0.1% | |
| WMS Industries, Inc.(a) | | | 3,008 | | | | 80,915 | | |
| Machinery – Construction & Mining — 0.7% | |
| Caterpillar, Inc. | | | 12,769 | | | | 570,391 | | |
| Machinery – Diversified — 0.1% | |
| The Manitowoc Co., Inc. | | | 8,766 | | | | 75,914 | | |
| Manufacturing — 2.4% | |
| 3M Co. | | | 2,541 | | | | 146,209 | | |
| Dover Corp. | | | 1,949 | | | | 64,161 | | |
| Eastman Kodak Co. | | | 7,394 | | | | 48,653 | | |
| General Electric Co. | | | 81,995 | | | | 1,328,319 | | |
Honeywell
International, Inc. | | | 2,063 | | | | 67,728 | | |
| Parker Hannifin Corp. | | | 4,510 | | | | 191,855 | | |
| | | | 1,846,925 | | |
| Media — 2.5% | |
| CBS Corp. Class B | | | 50,562 | | | | 414,103 | | |
| Comcast Corp. Class A | | | 30,383 | | | | 512,865 | | |
| Gannett Co., Inc. | | | 6,639 | | | | 53,112 | | |
| The Walt Disney Co. | | | 40,949 | | | | 929,133 | | |
| | | | 1,909,213 | | |
| | | Number of
Shares | | Value | |
| Metal Fabricate & Hardware — 0.2% | |
Mueller Water Products, Inc.
Class A | | | 14,802 | | | $ | 124,337 | | |
| Mining — 0.6% | |
Freeport-McMoRan
Copper & Gold, Inc. | | | 9,742 | | | | 238,094 | | |
| Southern Copper Corp. | | | 15,762 | | | | 253,138 | | |
| | | | 491,232 | | |
| Office Equipment/Supplies — 0.4% | |
| Xerox Corp. | | | 34,192 | | | | 272,510 | | |
| Oil & Gas — 15.2% | |
| Apache Corp. | | | 2,752 | | | | 205,107 | | |
| Chevron Corp. | | | 31,798 | | | | 2,352,098 | | |
| ConocoPhillips | | | 30,440 | | | | 1,576,792 | | |
| Devon Energy Corp. | | | 3,226 | | | | 211,981 | | |
| Exxon Mobil Corp. | | | 61,480 | | | | 4,907,948 | | |
| Hess Corp. | | | 2,821 | | | | 151,318 | | |
McMoRan
Exploration Co.(a) | | | 9,476 | | | | 92,865 | | |
Occidental
Petroleum Corp. | | | 20,351 | | | | 1,220,857 | | |
| Patterson-UTI Energy, Inc. | | | 9,956 | | | | 114,594 | | |
| Stone Energy Corp.(a) | | | 5,653 | | | | 62,296 | | |
| Sunoco, Inc. | | | 2,505 | | | | 108,867 | | |
| Valero Energy Corp. | | | 20,160 | | | | 436,262 | | |
| W&T Offshore, Inc. | | | 17,666 | | | | 252,977 | | |
| | | | 11,693,962 | | |
| Oil & Gas Services — 0.1% | |
Oil States
International, Inc.(a) | | | 2,351 | | | | 43,940 | | |
| Pharmaceuticals — 6.2% | |
| Bristol-Myers Squibb Co. | | | 37,183 | | | | 864,505 | | |
| Cephalon, Inc.(a) | | | 4,261 | | | | 328,267 | | |
| Eli Lilly & Co. | | | 32,792 | | | | 1,320,534 | | |
| Express Scripts, Inc.(a) | | | 1,721 | | | | 94,620 | | |
King
Pharmaceuticals, Inc.(a) | | | 2,591 | | | | 27,516 | | |
| Pfizer, Inc. | | | 119,794 | | | | 2,121,552 | | |
| Wyeth | | | 660 | | | | 24,757 | | |
| | | | 4,781,751 | | |
| Real Estate Investment Trusts (REITS) — 1.1% | |
Apartment Investment &
Management Co. Class A | | | 26 | | | | 300 | | |
| Boston Properties, Inc. | | | 625 | | | | 34,375 | | |
CBL & Associates
Properties, Inc. | | | 1,775 | | | | 11,538 | | |
| Equity Residential | | | 1,028 | | | | 30,655 | | |
| Hospitality Properties Trust | | | 18,284 | | | | 271,883 | | |
| Host Hotels & Resorts, Inc. | | | 15,840 | | | | 119,909 | | |
| HRPT Properties Trust | | | 16,238 | | | | 54,722 | | |
(Continued)
The accompanying notes are an integral part of the financial statements.
82
MML Income & Growth Fund – Portfolio of Investments (Continued)
| | | Number of
Shares | | Value | |
| Public Storage | | | 659 | | | $ | 52,390 | | |
Simon Property
Group, Inc. | | | 5,184 | | | | 275,426 | | |
| Vornado Realty Trust | | | 622 | | | | 37,538 | | |
| | | | 888,736 | | |
| Retail — 6.0% | |
| AutoNation, Inc.(a) | | | 8,140 | | | | 80,423 | | |
| Best Buy Co., Inc. | | | 2,487 | | | | 69,910 | | |
BJ's Wholesale
Club, Inc.(a) | | | 2,391 | | | | 81,916 | | |
| Dollar Tree, Inc.(a) | | | 914 | | | | 38,205 | | |
| Family Dollar Stores, Inc. | | | 9,227 | | | | 240,548 | | |
| The Gap, Inc. | | | 57,371 | | | | 768,198 | | |
| Jones Apparel Group, Inc. | | | 31,564 | | | | 184,965 | | |
| Macy's, Inc. | | | 19,466 | | | | 201,473 | | |
| McDonald's Corp. | | | 20,523 | | | | 1,276,325 | | |
| Polo Ralph Lauren Corp. | | | 2,664 | | | | 120,972 | | |
| RadioShack Corp. | | | 25,750 | | | | 307,455 | | |
| Wal-Mart Stores, Inc. | | | 20,392 | | | | 1,143,175 | | |
| Walgreen Co. | | | 3,137 | | | | 77,390 | | |
| | | | 4,590,955 | | |
| Savings & Loans — 0.1% | |
New York Community
Bancorp, Inc. | | | 6,288 | | | | 75,204 | | |
| Semiconductors — 1.9% | |
| Amkor Technology, Inc.(a) | | | 52,419 | | | | 114,273 | | |
| Analog Devices, Inc. | | | 1,075 | | | | 20,446 | | |
| Applied Materials, Inc. | | | 6,059 | | | | 61,378 | | |
| Broadcom Corp. Class A(a) | | | 5,881 | | | | 99,801 | | |
| Intel Corp. | | | 52,762 | | | | 773,491 | | |
| Linear Technology Corp. | | | 1,063 | | | | 23,514 | | |
| LSI Corp.(a) | | | 76,467 | | | | 251,576 | | |
Maxim Integrated
Products, Inc. | | | 2,159 | | | | 24,656 | | |
| Microchip Technology, Inc. | | | 2,732 | | | | 53,356 | | |
| Xilinx, Inc. | | | 3,910 | | | | 69,676 | | |
| | | | 1,492,167 | | |
| Software — 2.4% | |
Broadridge Financial
Solutions LLC | | | 584 | | | | 7,323 | | |
| Microsoft Corp. | | | 69,621 | | | | 1,353,432 | | |
| Oracle Corp.(a) | | | 19,014 | | | | 337,118 | | |
| Sybase, Inc.(a) | | | 6,432 | | | | 159,321 | | |
| | | | 1,857,194 | | |
| Telecommunications — 6.1% | |
| AT&T, Inc. | | | 57,225 | | | | 1,630,912 | | |
| CenturyTel, Inc. | | | 1,299 | | | | 35,502 | | |
| | | Number of
Shares | | Value | |
| Cisco Systems, Inc.(a) | | | 38,783 | | | $ | 632,163 | | |
| Embarq Corp. | | | 1,876 | | | | 67,461 | | |
| Motorola, Inc. | | | 50,625 | | | | 224,269 | | |
Qwest Communications
International, Inc. | | | 62,406 | | | | 227,158 | | |
Verizon
Communications, Inc. | | | 55,451 | | | | 1,879,789 | | |
| | | | 4,697,254 | | |
| Toys, Games & Hobbies — 1.2% | |
| Hasbro, Inc. | | | 31,535 | | | | 919,876 | | |
| Transportation — 1.2% | |
| Con-way, Inc. | | | 575 | | | | 15,295 | | |
| CSX Corp. | | | 6,348 | | | | 206,119 | | |
Expeditors International
of Washington, Inc. | | | 775 | | | | 25,784 | | |
| FedEx Corp. | | | 1,432 | | | | 91,863 | | |
| Frontline Ltd. | | | 5,042 | | | | 149,294 | | |
| Norfolk Southern Corp. | | | 5,723 | | | | 269,267 | | |
| Union Pacific Corp. | | | 2,882 | | | | 137,760 | | |
| | | | 895,382 | | |
TOTAL COMMON STOCK
(Cost $98,505,669) | | | 76,647,161 | | |
TOTAL EQUITIES
(Cost $98,505,669) | | | 76,647,161 | | |
TOTAL LONG-TERM
INVESTMENTS
(Cost $98,505,669) | | | 76,647,161 | | |
| | | Principal
Amount | | | |
| SHORT-TERM INVESTMENTS — 0.2% | |
| Repurchase Agreement — 0.2% | |
State Street Bank &
Trust Co. Repurchase
Agreement, dated
12/31/08, 0.010%,
due 1/02/09(b) | | $ | 164,660 | | | | 164,660 | | |
TOTAL SHORT-TERM
INVESTMENTS
(Cost $164,660) | | | 164,660 | | |
TOTAL INVESTMENTS — 99.6%
(Cost $98,670,329)(c) | | | 76,811,821 | | |
Other Assets/
(Liabilities) — 0.4% | | | 285,398 | | |
| NET ASSETS — 100.0% | | $ | 77,097,219 | | |
Notes to Portfolio of Investments
Industry classifications are unaudited.
(a) Non-income producing security.
(b) Maturity value of $164,660. Collateralized by U.S. Government Agency obligations with a rate of 4.758%, maturity date of 7/01/34, and an aggregate market value, including accrued interest, of $168,345.
(c) See Note 6 for aggregate cost for federal tax purposes.
The accompanying notes are an integral part of the financial statements.
83
MML Growth & Income Fund – Portfolio of Investments
December 31, 2008
| | | Number of
Shares | | Value | |
| EQUITIES — 97.5% | |
| COMMON STOCK — 97.2% | |
| Advertising — 1.1% | |
| Omnicom Group, Inc. | | | 55,700 | | | $ | 1,499,444 | | |
| Aerospace & Defense — 1.1% | |
| United Technologies Corp. | | | 28,000 | | | | 1,500,800 | | |
| Agriculture — 3.1% | |
| Altria Group, Inc. | | | 75,000 | | | | 1,129,500 | | |
Philip Morris
International, Inc. | | | 68,300 | | | | 2,971,733 | | |
| | | | 4,101,233 | | |
| Airlines — 0.4% | |
| Southwest Airlines Co. | | | 63,100 | | | | 543,922 | | |
| Auto Manufacturers — 0.5% | |
Honda Motor Co. Ltd.
Sponsored ADR (Japan) | | | 31,100 | | | | 663,674 | | |
| Automotive & Parts — 0.2% | |
| Johnson Controls, Inc. | | | 17,100 | | | | 310,536 | | |
| Banks — 2.3% | |
| Bank of America Corp. | | | 12,700 | | | | 178,816 | | |
| SunTrust Banks, Inc. | | | 2,400 | | | | 70,896 | | |
| Wells Fargo & Co. | | | 97,300 | | | | 2,868,404 | | |
| | | | 3,118,116 | | |
| Beverages — 3.2% | |
| The Coca-Cola Co. | | | 14,000 | | | | 633,780 | | |
| PepsiCo, Inc. | | | 65,900 | | | | 3,609,343 | | |
| | | | 4,243,123 | | |
| Biotechnology — 4.6% | |
| Celgene Corp.(a) | | | 58,100 | | | | 3,211,768 | | |
| Genentech, Inc.(a) | | | 35,800 | | | | 2,968,178 | | |
| | | | 6,179,946 | | |
| Chemicals — 1.4% | |
| Celanese Corp. Class A | | | 9,000 | | | | 111,870 | | |
| Ecolab, Inc. | | | 6,900 | | | | 242,535 | | |
| Monsanto Co. | | | 12,800 | | | | 900,480 | | |
Potash Corp.
of Saskatchewan | | | 8,900 | | | | 651,658 | | |
| | | | 1,906,543 | | |
| Commercial Services — 2.4% | |
Apollo Group, Inc.
Class A(a) | | | 14,100 | | | | 1,080,342 | | |
| Iron Mountain, Inc.(a) | | | 13,300 | | | | 328,909 | | |
| | | Number of
Shares | | Value | |
| Monster Worldwide, Inc.(a) | | | 35,100 | | | $ | 424,359 | | |
| Paychex, Inc. | | | 50,900 | | | | 1,337,652 | | |
| | | | 3,171,262 | | |
| Computers — 2.9% | |
| Apple, Inc.(a) | | | 13,300 | | | | 1,135,155 | | |
Brocade Communications
Systems, Inc.(a) | | | 225,800 | | | | 632,240 | | |
Cognizant Technology
Solutions Corp. Class A(a) | | | 20,700 | | | | 373,842 | | |
| Dell, Inc.(a) | | | 33,900 | | | | 347,136 | | |
| Hewlett-Packard Co. | | | 12,900 | | | | 468,141 | | |
International Business
Machines Corp. | | | 5,900 | | | | 496,544 | | |
| NetApp, Inc.(a) | | | 28,200 | | | | 393,954 | | |
| | | | 3,847,012 | | |
| Diversified Financial — 5.1% | |
The Goldman Sachs
Group, Inc. | | | 35,700 | | | | 3,012,723 | | |
| JP Morgan Chase & Co. | | | 116,400 | | | | 3,670,092 | | |
| T. Rowe Price Group, Inc. | | | 6,400 | | | | 226,816 | | |
| | | | 6,909,631 | | |
| Electric — 0.7% | |
| Allegheny Energy, Inc. | | | 11,600 | | | | 392,776 | | |
| CMS Energy Corp. | | | 25,400 | | | | 256,794 | | |
| Edison International | | | 8,400 | | | | 269,808 | | |
| | | | 919,378 | | |
| Electrical Components & Equipment — 0.5% | |
| Emerson Electric Co. | | | 18,600 | | | | 680,946 | | |
| Electronics — 1.1% | |
Agilent
Technologies, Inc.(a) | | | 33,100 | | | | 517,353 | | |
Flextronics
International Ltd.(a) | | | 75,700 | | | | 193,792 | | |
| Jabil Circuit, Inc. | | | 103,500 | | | | 698,625 | | |
| | | | 1,409,770 | | |
| Energy – Alternate Sources — 0.5% | |
| First Solar, Inc.(a) | | | 5,300 | | | | 731,188 | | |
| Engineering & Construction — 1.6% | |
| Fluor Corp. | | | 44,500 | | | | 1,996,715 | | |
Jacobs Engineering
Group, Inc.(a) | | | 4,500 | | | | 216,450 | | |
| | | | 2,213,165 | | |
| Foods — 4.3% | |
| Kraft Foods, Inc. Class A | | | 119,301 | | | | 3,203,232 | | |
| Sara Lee Corp. | | | 219,900 | | | | 2,152,821 | | |
| Unilever NV NY Shares | | | 20,000 | | | | 491,000 | | |
| | | | 5,847,053 | | |
| | | Number of
Shares | | Value | |
| Health Care – Products — 2.9% | |
| Baxter International, Inc. | | | 60,000 | | | $ | 3,215,400 | | |
| Medtronic, Inc. | | | 23,300 | | | | 732,086 | | |
| | | | 3,947,486 | | |
| Health Care – Services — 2.3% | |
| Aetna, Inc. | | | 1,200 | | | | 34,200 | | |
| DaVita, Inc.(a) | | | 42,700 | | | | 2,116,639 | | |
| UnitedHealth Group, Inc. | | | 33,800 | | | | 899,080 | | |
| | | | 3,049,919 | | |
| Household Products — 0.2% | |
| Kimberly-Clark Corp. | | | 5,700 | | | | 300,618 | | |
| Insurance — 2.8% | |
| ACE Ltd. | | | 8,500 | | | | 449,820 | | |
| AFLAC, Inc. | | | 18,600 | | | | 852,624 | | |
Berkshire Hathaway, Inc.
Class A(a) | | | 10 | | | | 966,000 | | |
| Mercury General Corp. | | | 9,200 | | | | 423,108 | | |
| The Progressive Corp. | | | 72,500 | | | | 1,073,725 | | |
| | | | 3,765,277 | | |
| Internet — 3.8% | |
| eBay, Inc.(a) | | | 21,200 | | | | 295,952 | | |
| Google, Inc. Class A(a) | | | 13,000 | | | | 3,999,450 | | |
| Yahoo!, Inc.(a) | | | 61,400 | | | | 749,080 | | |
| | | | 5,044,482 | | |
| Iron & Steel — 1.6% | |
Allegheny
Technologies, Inc. | | | 35,700 | | | | 911,421 | | |
Cliffs Natural
Resources, Inc. | | | 13,900 | | | | 355,979 | | |
| Nucor Corp. | | | 18,100 | | | | 836,220 | | |
| | | | 2,103,620 | | |
| Leisure Time — 0.5% | |
| Carnival Corp. | | | 28,200 | | | | 685,824 | | |
| Lodging — 0.5% | |
Las Vegas
Sands Corp.(a) | | | 56,100 | | | | 332,673 | | |
| Wynn Resorts Ltd.(a) | | | 8,500 | | | | 359,210 | | |
| | | | 691,883 | | |
| Manufacturing — 4.1% | |
| Danaher Corp. | | | 6,000 | | | | 339,660 | | |
| General Electric Co. | | | 239,700 | | | | 3,883,140 | | |
| Illinois Tool Works, Inc. | | | 38,300 | | | | 1,342,415 | | |
| | | | 5,565,215 | | |
(Continued)
The accompanying notes are an integral part of the financial statements.
84
MML Growth & Income Fund – Portfolio of Investments (Continued)
| | | Number of
Shares | | Value | |
| Media — 3.6% | |
| CBS Corp. Class B | | | 79,400 | | | $ | 650,286 | | |
| Comcast Corp. Class A | | | 29,400 | | | | 496,272 | | |
| Gannett Co., Inc. | | | 34,100 | | | | 272,800 | | |
Time Warner Cable, Inc.
Class A(a) | | | 41,300 | | | | 885,885 | | |
| Time Warner, Inc. | | | 38,500 | | | | 387,310 | | |
| Viacom, Inc. Class B(a) | | | 24,800 | | | | 472,688 | | |
| The Walt Disney Co. | | | 75,500 | | | | 1,713,095 | | |
| | | | 4,878,336 | | |
| Mining — 2.3% | |
| Barrick Gold Corp. | | | 62,600 | | | | 2,301,802 | | |
| Vulcan Materials Co. | | | 11,400 | | | | 793,212 | | |
| | | | 3,095,014 | | |
| Oil & Gas — 5.0% | |
| Anadarko Petroleum Corp. | | | 11,500 | | | | 443,325 | | |
| Chevron Corp. | | | 19,100 | | | | 1,412,827 | | |
| ConocoPhillips | | | 13,500 | | | | 699,300 | | |
| Exxon Mobil Corp. | | | 17,600 | | | | 1,405,008 | | |
| Marathon Oil Corp. | | | 59,700 | | | | 1,633,392 | | |
Royal Dutch Shell PLC
Sponsored ADR
(United Kingdom) | | | 5,800 | | | | 298,294 | | |
Royal Dutch Shell PLC
Sponsored ADR
(United Kingdom) | | | 15,700 | | | | 831,158 | | |
| | | | 6,723,304 | | |
| Oil & Gas Services — 1.3% | |
| Baker Hughes, Inc. | | | 7,100 | | | | 227,697 | | |
| Schlumberger Ltd. | | | 37,000 | | | | 1,566,210 | | |
| | | | 1,793,907 | | |
| Pharmaceuticals — 6.9% | |
| Abbott Laboratories | | | 44,700 | | | | 2,385,639 | | |
| Allergan, Inc. | | | 47,600 | | | | 1,919,232 | | |
AstraZeneca PLC
Sponsored ADR
(United Kingdom) | | | 19,300 | | | | 791,879 | | |
BioMarin
Pharmaceuticals, Inc.(a) | | | 14,600 | | | | 259,880 | | |
| Cardinal Health, Inc. | | | 40,600 | | | | 1,399,482 | | |
Forest
Laboratories, Inc.(a) | | | 17,100 | | | | 435,537 | | |
| Gilead Sciences, Inc.(a) | | | 10,500 | | | | 536,970 | | |
| Pfizer, Inc. | | | 16,100 | | | | 285,131 | | |
Sanofi-Aventis
ADR (France) | | | 13,500 | | | | 434,160 | | |
Teva Pharmaceutical
Industries Ltd.
Sponsored ADR (Israel) | | | 19,400 | | | | 825,858 | | |
| | | | 9,273,768 | | |
| | | Number of
Shares | | Value | |
| Pipelines — 0.2% | |
Kinder Morgan
Management LLC(a) | | | 7,253 | | | $ | 289,975 | | |
| Real Estate Investment Trusts (REITS) — 0.2% | |
| Douglas Emmett, Inc. | | | 18,800 | | | | 245,528 | | |
| Retail — 6.1% | |
| Best Buy Co., Inc. | | | 13,500 | | | | 379,485 | | |
| Coach, Inc.(a) | | | 11,700 | | | | 243,009 | | |
| Costco Wholesale Corp. | | | 8,900 | | | | 467,250 | | |
| Hanesbrands, Inc.(a) | | | 31,375 | | | | 400,031 | | |
| The Home Depot, Inc. | | | 37,300 | | | | 858,646 | | |
| Lowe's Cos., Inc. | | | 34,900 | | | | 751,048 | | |
| Nordstrom, Inc. | | | 38,900 | | | | 517,759 | | |
| Target Corp. | | | 92,200 | | | | 3,183,666 | | |
| Urban Outfitters, Inc.(a) | | | 22,600 | | | | 338,548 | | |
| Wal-Mart Stores, Inc. | | | 18,500 | | | | 1,037,110 | | |
| | | | 8,176,552 | | |
| Savings & Loans — 1.8% | |
| Astoria Financial Corp. | | | 22,200 | | | | 365,856 | | |
| Hudson City Bancorp, Inc. | | | 126,500 | | | | 2,018,940 | | |
| | | | 2,384,796 | | |
| Semiconductors — 1.0% | |
| Intel Corp. | | | 23,900 | | | | 350,374 | | |
| KLA-Tencor Corp. | | | 34,700 | | | | 756,113 | | |
| Microchip Technology, Inc. | | | 12,300 | | | | 240,219 | | |
| | | | 1,346,706 | | |
| Software — 2.2% | |
| Adobe Systems, Inc.(a) | | | 28,200 | | | | 600,378 | | |
| Cerner Corp.(a) | | | 21,700 | | | | 834,365 | | |
| Microsoft Corp. | | | 64,500 | | | | 1,253,880 | | |
| Oracle Corp.(a) | | | 14,200 | | | | 251,766 | | |
| | | | 2,940,389 | | |
| Telecommunications — 6.2% | |
American Tower Corp.
Class A(a) | | | 49,800 | | | | 1,460,136 | | |
| AT&T, Inc. | | | 79,400 | | | | 2,262,900 | | |
| Ciena Corp.(a) | | | 13,300 | | | | 89,110 | | |
| Cisco Systems, Inc.(a) | | | 147,500 | | | | 2,404,250 | | |
| Polycom, Inc.(a) | | | 35,300 | | | | 476,903 | | |
| Qualcomm, Inc. | | | 46,900 | | | | 1,680,427 | | |
| | | | 8,373,726 | | |
| Toys, Games & Hobbies — 0.6% | |
Nintendo Co. Ltd.
Sponsored ADR (Japan) | | | 15,700 | | | | 749,675 | | |
| Transportation — 3.6% | |
| FedEx Corp. | | | 8,100 | | | | 519,615 | | |
| Union Pacific Corp. | | | 9,200 | | | | 439,760 | | |
| | | Number of
Shares | | Value | |
United Parcel Service, Inc.
Class B | | | 70,900 | | | $ | 3,910,844 | | |
| | | | 4,870,219 | | |
| Water — 0.5% | |
American Water
Works Co., Inc. | | | 30,700 | | | | 641,016 | | |
TOTAL COMMON STOCK
(Cost $174,994,853) | | | 130,733,977 | | |
| PREFERRED STOCK — 0.3% | |
| Pharmaceuticals — 0.3% | |
| Schering Plough Corp. | | | 2,400 | | | | 417,852 | | |
TOTAL PREFERRED STOCK
(Cost $600,000) | | | 417,852 | | |
TOTAL EQUITIES
(Cost $175,594,853) | | | 131,151,829 | | |
TOTAL LONG-TERM
INVESTMENTS
(Cost $175,594,853) | | | 131,151,829 | | |
| | | Principal
Amount | | | |
| SHORT-TERM INVESTMENTS — 2.3% | |
| Repurchase Agreement — 2.3% | |
State Street Bank &
Trust Co. Repurchase
Agreement, dated
12/31/08, 0.010%,
due 1/02/09(b) | | $ | 3,110,277 | | | | 3,110,277 | | |
TOTAL SHORT-TERM
INVESTMENTS
(Cost $3,110,277) | | | 3,110,277 | | |
TOTAL INVESTMENTS — 99.8%
(Cost $178,705,130)(c) | | | 134,262,106 | | |
Other Assets/
(Liabilities) — 0.2% | | | 293,042 | | |
| NET ASSETS — 100.0% | | $ | 134,555,148 | | |
Notes to Portfolio of Investments
Industry classifications are unaudited.
| ADR - American Depositary Receipt | |
(a) Non-income producing security.
(b) Maturity value of $3,110,279. Collateralized by U.S. Government Agency obligations with rates ranging from 4.540% - 4.573%, maturity date of 5/01/35, and an aggregate market value, including accrued interest, of $3,173,678.
(c) See Note 6 for aggregate cost for federal tax purposes.
The accompanying notes are an integral part of the financial statements.
85
MML Blue Chip Growth Fund – Portfolio of Investments
December 31, 2008
| | | Number of
Shares | | Value | |
| EQUITIES — 99.1% | |
| COMMON STOCK — 99.1% | |
| Advertising — 0.2% | |
| Omnicom Group, Inc. | | | 11,800 | | | $ | 317,656 | | |
| Aerospace & Defense — 0.8% | |
| General Dynamics Corp. | | | 8,000 | | | | 460,720 | | |
| Lockheed Martin Corp. | | | 9,000 | | | | 756,720 | | |
| Rockwell Collins, Inc. | | | 3,400 | | | | 132,906 | | |
| | | | 1,350,346 | | |
| Apparel — 0.6% | |
| Nike, Inc. Class B | | | 18,600 | | | | 948,600 | | |
| Banks — 4.1% | |
The Bank of New York
Mellon Corp. | | | 36,000 | | | | 1,019,880 | | |
| Northern Trust Corp. | | | 37,500 | | | | 1,955,250 | | |
PNC Financial Services
Group, Inc. | | | 7,900 | | | | 387,100 | | |
| State Street Corp. | | | 59,100 | | | | 2,324,403 | | |
| Wells Fargo & Co. | | | 45,500 | | | | 1,341,340 | | |
| | | | 7,027,973 | | |
| Beverages — 1.4% | |
| The Coca-Cola Co. | | | 20,300 | | | | 918,981 | | |
| PepsiCo, Inc. | | | 26,000 | | | | 1,424,020 | | |
| | | | 2,343,001 | | |
| Biotechnology — 6.5% | |
| Amgen, Inc.(a) | | | 37,100 | | | | 2,142,525 | | |
| Celgene Corp.(a) | | | 62,100 | | | | 3,432,888 | | |
| Genentech, Inc.(a) | | | 63,800 | | | | 5,289,658 | | |
| Genzyme Corp.(a) | | | 4,200 | | | | 278,754 | | |
| | | | 11,143,825 | | |
| Chemicals — 3.0% | |
| Monsanto Co. | | | 27,000 | | | | 1,899,450 | | |
Potash Corp.
of Saskatchewan | | | 14,600 | | | | 1,069,012 | | |
| Praxair, Inc. | | | 35,800 | | | | 2,125,088 | | |
| | | | 5,093,550 | | |
| Commercial Services — 5.1% | |
| Accenture Ltd. Class A | | | 71,700 | | | | 2,351,043 | | |
Apollo Group, Inc.
Class A(a) | | | 12,100 | | | | 927,102 | | |
Automatic Data
Processing, Inc. | | | 31,700 | | | | 1,247,078 | | |
| Mastercard, Inc. Class A | | | 6,300 | | | | 900,459 | | |
| McKesson Corp. | | | 34,900 | | | | 1,351,677 | | |
| | | Number of
Shares | | Value | |
| Visa, Inc. Class A | | | 19,300 | | | $ | 1,012,285 | | |
| Western Union Co. | | | 59,000 | | | | 846,060 | | |
| | | | 8,635,704 | | |
| Computers — 5.3% | |
| Apple, Inc.(a) | | | 61,300 | | | | 5,231,955 | | |
| Dell, Inc.(a) | | | 4,600 | | | | 47,104 | | |
| EMC Corp.(a) | | | 49,800 | | | | 521,406 | | |
| Hewlett-Packard Co. | | | 63,200 | | | | 2,293,528 | | |
| Research In Motion Ltd.(a) | | | 25,400 | | | | 1,030,732 | | |
| | | | 9,124,725 | | |
| Cosmetics & Personal Care — 0.2% | |
| The Procter & Gamble Co. | | | 5,100 | | | | 315,282 | | |
| Distribution & Wholesale — 0.2% | |
| Fastenal Co. | | | 12,500 | | | | 435,625 | | |
| Diversified Financial — 6.4% | |
| American Express Co. | | | 12,100 | | | | 224,455 | | |
| Ameriprise Financial, Inc. | | | 1,800 | | | | 42,048 | | |
| BlackRock, Inc. | | | 4,600 | | | | 617,090 | | |
| The Charles Schwab Corp. | | | 67,300 | | | | 1,088,241 | | |
| CME Group, Inc. | | | 3,500 | | | | 728,385 | | |
| Credit Suisse Group | | | 3,968 | | | | 108,760 | | |
| Franklin Resources, Inc. | | | 39,000 | | | | 2,487,420 | | |
The Goldman Sachs
Group, Inc. | | | 23,800 | | | | 2,008,482 | | |
IntercontinentalExchange,
Inc.(a) | | | 19,300 | | | | 1,591,092 | | |
| JP Morgan Chase & Co. | | | 31,800 | | | | 1,002,654 | | |
| Morgan Stanley | | | 61,800 | | | | 991,272 | | |
| | | | 10,889,899 | | |
| Electric — 0.6% | |
| Entergy Corp. | | | 3,900 | | | | 324,207 | | |
| NRG Energy, Inc.(a) | | | 29,200 | | | | 681,236 | | |
| | | | 1,005,443 | | |
| Electrical Components & Equipment — 0.2% | |
| Sunpower Corp. Class B(a) | | | 10,100 | | | | 307,444 | | |
| Electronics — 0.1% | |
Thermo Fisher
Scientific, Inc.(a) | | | 3,400 | | | | 115,838 | | |
| Energy – Alternate Sources — 0.4% | |
| First Solar, Inc.(a) | | | 4,800 | | | | 662,208 | | |
| Entertainment — 0.1% | |
International
Game Technology | | | 7,300 | | | | 86,797 | | |
| | | Number of
Shares | | Value | |
| Health Care – Products — 6.1% | |
| Alcon, Inc. | | | 11,000 | | | $ | 981,090 | | |
| Baxter International, Inc. | | | 41,200 | | | | 2,207,908 | | |
| Becton, Dickinson & Co. | | | 15,000 | | | | 1,025,850 | | |
| Covidien Ltd. | | | 9,300 | | | | 337,032 | | |
| Intuitive Surgical, Inc.(a) | | | 3,300 | | | | 419,067 | | |
| Medtronic, Inc. | | | 68,100 | | | | 2,139,702 | | |
| St. Jude Medical, Inc.(a) | | | 68,100 | | | | 2,244,576 | | |
| Stryker Corp. | | | 28,300 | | | | 1,130,585 | | |
| | | | 10,485,810 | | |
| Health Care – Services — 1.1% | |
| Aetna, Inc. | | | 5,600 | | | | 159,600 | | |
| Humana, Inc.(a) | | | 13,300 | | | | 495,824 | | |
| WellPoint, Inc.(a) | | | 27,800 | | | | 1,171,214 | | |
| | | | 1,826,638 | | |
| Insurance — 0.4% | |
| Aon Corp. | | | 12,500 | | | | 571,000 | | |
| Prudential Financial, Inc. | | | 3,000 | | | | 90,780 | | |
| | | | 661,780 | | |
| Internet — 8.8% | |
| Amazon.com, Inc.(a) | | | 99,900 | | | | 5,122,872 | | |
| eBay, Inc.(a) | | | 4,200 | | | | 58,632 | | |
| Expedia, Inc.(a) | | | 41,800 | | | | 344,432 | | |
| Google, Inc. Class A(a) | | | 18,400 | | | | 5,660,760 | | |
| McAfee, Inc.(a) | | | 48,400 | | | | 1,673,188 | | |
| Priceline.com, Inc.(a) | | | 4,900 | | | | 360,885 | | |
| Tencent Holdings Ltd. | | | 107,600 | | | | 700,501 | | |
| VeriSign, Inc.(a) | | | 53,700 | | | | 1,024,596 | | |
| | | | 14,945,866 | | |
| Iron & Steel — 0.5% | |
| Nucor Corp. | | | 18,900 | | | | 873,180 | | |
| Lodging — 0.9% | |
Marriott International, Inc.
Class A | | | 27,100 | | | | 527,095 | | |
| MGM MIRAGE(a) | | | 17,340 | | | | 238,598 | | |
| Wynn Resorts Ltd.(a) | | | 18,100 | | | | 764,906 | | |
| | | | 1,530,599 | | |
| Machinery – Diversified — 0.1% | |
| Deere & Co. | | | 5,800 | | | | 222,256 | | |
| Manufacturing — 2.9% | |
| Danaher Corp. | | | 84,700 | | | | 4,794,867 | | |
| General Electric Co. | | | 5,200 | | | | 84,240 | | |
| | | | 4,879,107 | | |
(Continued)
The accompanying notes are an integral part of the financial statements.
86
MML Blue Chip Growth Fund – Portfolio of Investments (Continued)
| | | Number of
Shares | | Value | |
| Media — 2.0% | |
Discovery Communications,
Inc., Series A(a) | | | 47,950 | | | $ | 678,972 | | |
Discovery Communications,
Inc., Series C(a) | | | 34,750 | | | | 465,302 | | |
| The McGraw-Hill Cos., Inc. | | | 85,100 | | | | 1,973,469 | | |
| Time Warner, Inc. | | | 33,300 | | | | 334,998 | | |
| | | | 3,452,741 | | |
| Mining — 0.0% | |
| BHP Billiton Ltd. | | | 2,475 | | | | 52,127 | | |
| Oil & Gas — 4.0% | |
| Chevron Corp. | | | 15,600 | | | | 1,153,932 | | |
| EOG Resources, Inc. | | | 33,300 | | | | 2,217,114 | | |
| Exxon Mobil Corp. | | | 42,500 | | | | 3,392,775 | | |
| | | | 6,763,821 | | |
| Oil & Gas Services — 2.7% | |
| Baker Hughes, Inc. | | | 3,300 | | | | 105,831 | | |
| FMC Technologies, Inc.(a) | | | 6,300 | | | | 150,129 | | |
| Schlumberger Ltd. | | | 55,200 | | | | 2,336,616 | | |
| Smith International, Inc. | | | 85,000 | | | | 1,945,650 | | |
| | | | 4,538,226 | | |
| Pharmaceuticals — 9.8% | |
| Allergan, Inc. | | | 41,600 | | | | 1,677,312 | | |
| Express Scripts, Inc.(a) | | | 33,900 | | | | 1,863,822 | | |
| Gilead Sciences, Inc.(a) | | | 112,000 | | | | 5,727,680 | | |
Medco Health
Solutions, Inc.(a) | | | 75,400 | | | | 3,160,014 | | |
| Novartis AG | | | 7,953 | | | | 398,481 | | |
| Roche Holding AG | | | 7,319 | | | | 1,126,641 | | |
| Schering-Plough Corp. | | | 7,800 | | | | 132,834 | | |
Teva Pharmaceutical
Industries Ltd.
Sponsored ADR (Israel) | | | 23,300 | | | | 991,881 | | |
| Wyeth | | | 42,200 | | | | 1,582,922 | | |
| | | | 16,661,587 | | |
| Retail — 7.8% | |
Bed Bath &
Beyond, Inc.(a) | | | 43,600 | | | | 1,108,312 | | |
| Coach, Inc.(a) | | | 19,500 | | | | 405,015 | | |
| Costco Wholesale Corp. | | | 17,700 | | | | 929,250 | | |
| CVS Caremark Corp. | | | 66,159 | | | | 1,901,410 | | |
| Kohl's Corp.(a) | | | 48,400 | | | | 1,752,080 | | |
| McDonald's Corp. | | | 32,900 | | | | 2,046,051 | | |
| Wal-Mart Stores, Inc. | | | 61,800 | | | | 3,464,508 | | |
| Yum! Brands, Inc. | | | 53,500 | | | | 1,685,250 | | |
| | | | 13,291,876 | | |
| | | Number of
Shares | | Value | |
| Semiconductors — 2.6% | |
| Altera Corp. | | | 34,800 | | | $ | 581,508 | | |
| Broadcom Corp. Class A(a) | | | 39,200 | | | | 665,224 | | |
| Intel Corp. | | | 17,800 | | | | 260,948 | | |
Marvell Technology
Group Ltd.(a) | | | 189,500 | | | | 1,263,965 | | |
| Xilinx, Inc. | | | 92,200 | | | | 1,643,004 | | |
| | | | 4,414,649 | | |
| Software — 5.3% | |
| Adobe Systems, Inc.(a) | | | 26,400 | | | | 562,056 | | |
| Autodesk, Inc.(a) | | | 47,600 | | | | 935,340 | | |
| Electronic Arts, Inc.(a) | | | 57,800 | | | | 927,112 | | |
| Fiserv, Inc.(a) | | | 39,900 | | | | 1,451,163 | | |
| Intuit, Inc.(a) | | | 19,900 | | | | 473,421 | | |
| Microsoft Corp. | | | 217,300 | | | | 4,224,312 | | |
| Oracle Corp.(a) | | | 30,100 | | | | 533,673 | | |
| | | | 9,107,077 | | |
| Telecommunications — 6.7% | |
America Movil SAB de C.V.
Sponsored ADR (Mexico) | | | 28,400 | | | | 880,116 | | |
American Tower Corp.
Class A(a) | | | 95,300 | | | | 2,794,196 | | |
| AT&T, Inc. | | | 3,300 | | | | 94,050 | | |
| Cisco Systems, Inc.(a) | | | 87,600 | | | | 1,427,880 | | |
| Juniper Networks, Inc.(a) | | | 140,000 | | | | 2,451,400 | | |
MetroPCS
Communications, Inc.(a) | | | 37,500 | | | | 556,875 | | |
| Qualcomm, Inc. | | | 91,200 | | | | 3,267,696 | | |
| | | | 11,472,213 | | |
| Toys, Games & Hobbies — 1.5% | |
| Nintendo Co. Ltd. | | | 6,500 | | | | 2,497,267 | | |
| Transportation — 0.7% | |
Expeditors International of
Washington, Inc. | | | 16,700 | | | | 555,609 | | |
| Union Pacific Corp. | | | 15,100 | | | | 721,780 | | |
| | | | 1,277,389 | | |
TOTAL COMMON STOCK
(Cost $208,000,722) | | | 168,758,125 | | |
TOTAL EQUITIES
(Cost $208,000,722) | | | 168,758,125 | | |
TOTAL LONG-TERM INVESTMENTS
(Cost $208,000,722) | | | 168,758,125 | | |
| | | Principal
Amount | | Value | |
| SHORT-TERM INVESTMENTS — 2.0% | |
| Repurchase Agreement — 2.0% | |
State Street Bank &
Trust Co. Repurchase
Agreement, dated
12/31/08, 0.010%,
due 1/02/09(b) | | $ | 3,406,896 | | | $ | 3,406,896 | | |
TOTAL SHORT-TERM
INVESTMENTS
(Cost $3,406,896) | | | 3,406,896 | | |
TOTAL INVESTMENTS — 101.1%
(Cost $211,407,618)(c) | | | 172,165,021 | | |
Other Assets/
(Liabilities) — (1.1%) | | | (1,790,616 | ) | |
| NET ASSETS — 100.0% | | $ | 170,374,405 | | |
Notes to Portfolio of Investments
Industry classifications are unaudited.
| ADR - American Depositary Receipt | |
(a) Non-income producing security.
(b) Maturity value of $3,406,898. Collateralized by U.S. Government Agency obligations with a rate of 4.755%, maturity date of 5/01/35, and an aggregate market value, including accrued interest, of $3,477,795.
(c) See Note 6 for aggregate cost for federal tax purposes.
The accompanying notes are an integral part of the financial statements.
87
MML Large Cap Growth Fund – Portfolio of Investments
December 31, 2008
| | | Number of
Shares | | Value | |
| EQUITIES — 99.0% | |
| COMMON STOCK — 99.0% | |
| Aerospace & Defense — 2.0% | |
| Lockheed Martin Corp. | | | 8,840 | | | $ | 743,267 | | |
| Agriculture — 2.1% | |
Philip Morris
International, Inc. | | | 17,810 | | | | 774,913 | | |
| Apparel — 0.8% | |
| Nike, Inc. Class B | | | 5,390 | | | | 274,890 | | |
| Beverages — 6.0% | |
| The Coca-Cola Co. | | | 16,305 | | | | 738,127 | | |
Molson Coors Brewing Co.
Class B | | | 8,500 | | | | 415,820 | | |
| PepsiCo, Inc. | | | 18,950 | | | | 1,037,892 | | |
| | | | 2,191,839 | | |
| Biotechnology — 7.7% | |
| Celgene Corp.(a) | | | 20,115 | | | | 1,111,957 | | |
| Genentech, Inc.(a) | | | 20,510 | | | | 1,700,484 | | |
| | | | 2,812,441 | | |
| Chemicals — 3.8% | |
Air Products &
Chemicals, Inc. | | | 8,935 | | | | 449,162 | | |
| Monsanto Co. | | | 13,090 | | | | 920,882 | | |
| | | | 1,370,044 | | |
| Computers — 10.4% | |
| Apple, Inc.(a) | | | 18,320 | | | | 1,563,612 | | |
| Hewlett-Packard Co. | | | 61,200 | | | | 2,220,948 | | |
| | | | 3,784,560 | | |
| Cosmetics & Personal Care — 3.9% | |
| Colgate-Palmolive Co. | | | 10,160 | | | | 696,367 | | |
| The Procter & Gamble Co. | | | 11,515 | | | | 711,857 | | |
| | | | 1,408,224 | | |
| Diversified Financial — 8.4% | |
| The Blackstone Group LP | | | 41,925 | | | | 273,770 | | |
| The Charles Schwab Corp. | | | 22,700 | | | | 367,059 | | |
| CME Group, Inc. | | | 4,945 | | | | 1,029,104 | | |
| Franklin Resources, Inc. | | | 4,310 | | | | 274,892 | | |
The Goldman Sachs
Group, Inc. | | | 7,040 | | | | 594,106 | | |
| JP Morgan Chase & Co. | | | 16,200 | | | | 510,786 | | |
| | | | 3,049,717 | | |
| Electrical Components & Equipment — 0.5% | |
| Emerson Electric Co. | | | 5,100 | | | | 186,711 | | |
| | | Number of
Shares | | Value | |
| Foods — 0.9% | |
| The Kroger Co. | | | 12,800 | | | $ | 338,048 | | |
| Health Care – Products — 5.2% | |
| Alcon, Inc. | | | 9,055 | | | | 807,615 | | |
| Baxter International, Inc. | | | 10,700 | | | | 573,413 | | |
| Becton, Dickinson & Co. | | | 7,720 | | | | 527,971 | | |
| | | | 1,908,999 | | |
| Insurance — 1.2% | |
| AFLAC, Inc. | | | 9,400 | | | | 430,896 | | |
| Internet — 5.8% | |
| Google, Inc. Class A(a) | | | 6,835 | | | | 2,102,788 | | |
| Media — 0.5% | |
| The Walt Disney Co. | | | 8,300 | | | | 188,327 | | |
| Oil & Gas — 2.9% | |
| EOG Resources, Inc. | | | 10,090 | | | | 671,792 | | |
| XTO Energy, Inc. | | | 11,400 | | | | 402,078 | | |
| | | | 1,073,870 | | |
| Oil & Gas Services — 4.8% | |
Cameron
International Corp.(a) | | | 15,350 | | | | 314,675 | | |
National Oilwell
Varco, Inc.(a) | | | 12,170 | | | | 297,435 | | |
| Schlumberger Ltd. | | | 26,870 | | | | 1,137,407 | | |
| | | | 1,749,517 | | |
| Pharmaceuticals — 13.1% | |
| Abbott Laboratories | | | 14,550 | | | | 776,534 | | |
| Gilead Sciences, Inc.(a) | | | 40,660 | | | | 2,079,352 | | |
Medco Health
Solutions, Inc.(a) | | | 17,840 | | | | 747,674 | | |
Teva Pharmaceutical
Industries Ltd.
Sponsored ADR (Israel) | | | 27,250 | | | | 1,160,033 | | |
| | | | 4,763,593 | | |
| Retail — 6.9% | |
| Costco Wholesale Corp. | | | 4,550 | | | | 238,875 | | |
| Kohl's Corp.(a) | | | 18,795 | | | | 680,379 | | |
| McDonald's Corp. | | | 12,425 | | | | 772,711 | | |
| Wal-Mart Stores, Inc. | | | 14,375 | | | | 805,862 | | |
| | | | 2,497,827 | | |
| Semiconductors — 2.7% | |
| Broadcom Corp. Class A(a) | | | 14,495 | | | | 245,980 | | |
| Intel Corp. | | | 42,600 | | | | 624,516 | | |
MEMC Electronic
Materials, Inc.(a) | | | 6,965 | | | | 99,460 | | |
| | | | 969,956 | | |
| | | Number of
Shares | | Value | |
| Software — 2.7% | |
| Activision Blizzard, Inc.(a) | | | 55,035 | | | $ | 475,503 | | |
| Microsoft Corp. | | | 27,100 | | | | 526,824 | | |
| | | | 1,002,327 | | |
| Telecommunications — 6.7% | |
| Cisco Systems, Inc.(a) | | | 82,200 | | | | 1,339,860 | | |
| Juniper Networks, Inc.(a) | | | 6,400 | | | | 112,064 | | |
| Qualcomm, Inc. | | | 27,465 | | | | 984,071 | | |
| | | | 2,435,995 | | |
TOTAL COMMON STOCK
(Cost $46,228,680) | | | 36,058,749 | | |
TOTAL EQUITIES
(Cost $46,228,680) | | | 36,058,749 | | |
TOTAL LONG-TERM INVESTMENTS
(Cost $46,228,680) | | | 36,058,749 | | |
| | | Principal
Amount | | | |
| SHORT-TERM INVESTMENTS — 1.5% | |
| Repurchase Agreement — 1.5% | |
State Street Bank &
Trust Co. Repurchase
Agreement, dated
12/31/08, 0.010%,
due 1/02/09(b) | | $ | 545,483 | | | | 545,483 | | |
TOTAL SHORT-TERM
INVESTMENTS
(Cost $545,483) | | | 545,483 | | |
TOTAL INVESTMENTS — 100.5%
(Cost $46,774,163)(c) | | | 36,604,232 | | |
Other Assets/
(Liabilities) — (0.5%) | | | (171,726 | ) | |
| NET ASSETS — 100.0% | | $ | 36,432,506 | | |
Notes to Portfolio of Investments
Industry classifications are unaudited.
| ADR - American Depositary Receipt | |
(a) Non-income producing security.
(b) Maturity value of $545,484. Collateralized by U.S. Government Agency obligations with a rate of 4.018%, maturity date of 10/01/41, and an aggregate market value, including accrued interest, of $556,602.
(c) See Note 6 for aggregate cost for federal tax purposes.
The accompanying notes are an integral part of the financial statements.
88
MML Concentrated Growth Fund – Portfolio of Investments
December 31, 2008
| | | Number of
Shares | | Value | |
| EQUITIES — 98.1% | |
| COMMON STOCK — 98.1% | |
| Aerospace & Defense — 2.3% | |
| Boeing Co. | | | 42,700 | | | $ | 1,822,009 | | |
| Apparel — 1.9% | |
| Nike, Inc. Class B | | | 29,900 | | | | 1,524,900 | | |
| Banks — 3.7% | |
| State Street Corp. | | | 75,800 | | | | 2,981,214 | | |
| Beverages — 3.8% | |
| PepsiCo, Inc. | | | 56,100 | | | | 3,072,597 | | |
| Chemicals — 2.2% | |
| The Mosaic Co. | | | 50,400 | | | | 1,743,840 | | |
| Commercial Services — 4.0% | |
| Quanta Services, Inc.(a) | | | 160,300 | | | | 3,173,940 | | |
| Computers — 3.7% | |
| EMC Corp.(a) | | | 283,500 | | | | 2,968,245 | | |
| Diversified Financial — 6.2% | |
| American Express Co. | | | 128,900 | | | | 2,391,095 | | |
| NYSE Euronext | | | 94,800 | | | | 2,595,624 | | |
| | | | 4,986,719 | | |
| Engineering & Construction — 4.9% | |
| Foster Wheeler Ltd.(a) | | | 73,700 | | | | 1,723,106 | | |
| The Shaw Group, Inc.(a) | | | 105,500 | | | | 2,159,585 | | |
| | | | 3,882,691 | | |
| Entertainment — 2.4% | |
International
Game Technology | | | 160,200 | | | | 1,904,778 | | |
| Health Care – Products — 4.1% | |
| Medtronic, Inc. | | | 51,700 | | | | 1,624,414 | | |
| Zimmer Holdings, Inc.(a) | | | 40,500 | | | | 1,637,010 | | |
| | | | 3,261,424 | | |
| Health Care – Services — 3.2% | |
| Aetna, Inc. | | | 89,500 | | | | 2,550,750 | | |
| Internet — 12.9% | |
| Amazon.com, Inc.(a) | | | 55,800 | | | | 2,861,424 | | |
| eBay, Inc.(a) | | | 126,700 | | | | 1,768,732 | | |
| Google, Inc. Class A(a) | | | 7,600 | | | | 2,338,140 | | |
| Yahoo!, Inc.(a) | | | 273,700 | | | | 3,339,140 | | |
| | | | 10,307,436 | | |
| Machinery – Construction & Mining — 4.4% | |
| Caterpillar, Inc. | | | 79,100 | | | | 3,533,397 | | |
| | | Number of
Shares | | Value | |
| Manufacturing — 2.8% | |
| General Electric Co. | | | 140,000 | | | $ | 2,268,000 | | |
| Oil & Gas — 4.9% | |
| Transocean Ltd.(a) | | | 31,700 | | | | 1,497,825 | | |
| XTO Energy, Inc. | | | 69,400 | | | | 2,447,738 | | |
| | | | 3,945,563 | | |
| Oil & Gas Services — 2.6% | |
| Halliburton Co. | | | 115,800 | | | | 2,105,244 | | |
| Pharmaceuticals — 2.4% | |
| Allergan, Inc. | | | 47,500 | | | | 1,915,200 | | |
| Retail — 5.2% | |
| CVS Caremark Corp. | | | 80,000 | | | | 2,299,200 | | |
| Yum! Brands, Inc. | | | 60,200 | | | | 1,896,300 | | |
| | | | 4,195,500 | | |
| Semiconductors — 2.0% | |
| Texas Instruments, Inc. | | | 105,400 | | | | 1,635,808 | | |
| Software — 3.5% | |
| Electronic Arts, Inc.(a) | | | 72,000 | | | | 1,154,880 | | |
| Microsoft Corp. | | | 84,300 | | | | 1,638,792 | | |
| | | | 2,793,672 | | |
| Telecommunications — 12.1% | |
| Cisco Systems, Inc.(a) | | | 202,200 | | | | 3,295,860 | | |
Nokia Oyj Sponsored
ADR (Finland) | | | 203,500 | | | | 3,174,600 | | |
| Qualcomm, Inc. | | | 90,300 | | | | 3,235,449 | | |
| | | | 9,705,909 | | |
| Transportation — 2.9% | |
United Parcel Service, Inc.
Class B | | | 41,300 | | | | 2,278,108 | | |
TOTAL COMMON STOCK
(Cost $105,665,314) | | | 78,556,944 | | |
TOTAL EQUITIES
(Cost $105,665,314) | | | 78,556,944 | | |
TOTAL LONG-TERM INVESTMENTS
(Cost $105,665,314) | | | 78,556,944 | | |
| | | Principal
Amount | | Value | |
| SHORT-TERM INVESTMENTS — 2.6% | |
| Repurchase Agreement — 2.6% | |
State Street Bank &
Trust Co. Repurchase
Agreement, dated
12/31/08, 0.010%,
due 1/02/09(b) | | $ | 2,093,089 | | | $ | 2,093,089 | | |
TOTAL SHORT-TERM
INVESTMENTS
(Cost $2,093,089) | | | 2,093,089 | | |
TOTAL INVESTMENTS — 100.7%
(Cost $107,758,403)(c) | | | 80,650,033 | | |
Other Assets/
(Liabilities) — (0.7%) | | | (560,947 | ) | |
| NET ASSETS — 100.0% | | $ | 80,089,086 | | |
Notes to Portfolio of Investments
Industry classifications are unaudited.
| ADR - American Depositary Receipt | |
(a) Non-income producing security.
(b) Maturity value of $2,093,090. Collateralized by U.S. Government Agency obligations with a rate of 5.219%, maturity date of 8/01/34, and an aggregate market value, including accrued interest, of $2,135,933.
(c) See Note 6 for aggregate cost for federal tax purposes.
The accompanying notes are an integral part of the financial statements.
89
MML Mid Cap Value Fund – Portfolio of Investments
December 31, 2008
| | | Number of
Shares | | Value | |
| EQUITIES — 96.8% | |
| COMMON STOCK — 96.8% | |
| Aerospace & Defense — 0.6% | |
| Northrop Grumman Corp. | | | 40,400 | | | $ | 1,819,616 | | |
| Airlines — 0.7% | |
| Southwest Airlines Co. | | | 240,140 | | | | 2,070,007 | | |
| Auto Manufacturers — 0.5% | |
Bayerische Motoren
Werke AG | | | 43,800 | | | | 1,346,361 | | |
| Banks — 3.6% | |
| Associated Banc-Corp. | | | 133,700 | | | | 2,798,341 | | |
| Bancorpsouth, Inc. | | | 48,700 | | | | 1,137,632 | | |
Commerce
Bancshares, Inc. | | | 52,463 | | | | 2,305,749 | | |
| Marshall & Ilsley Corp. | | | 109,436 | | | | 1,492,707 | | |
| Synovus Financial Corp. | | | 355,400 | | | | 2,949,820 | | |
| | | | 10,684,249 | | |
| Beverages — 1.7% | |
| Coca-Cola Enterprises, Inc. | | | 263,200 | | | | 3,166,296 | | |
The Pepsi Bottling
Group, Inc. | | | 84,400 | | | | 1,899,844 | | |
| | | | 5,066,140 | | |
| Chemicals — 1.6% | |
International Flavors &
Fragrances, Inc. | | | 118,552 | | | | 3,523,365 | | |
| Minerals Technologies, Inc. | | | 26,581 | | | | 1,087,163 | | |
| | | | 4,610,528 | | |
| Computers — 1.7% | |
| Diebold, Inc. | | | 105,607 | | | | 2,966,501 | | |
| Synopsys, Inc.(a) | | | 112,135 | | | | 2,076,740 | | |
| | | | 5,043,241 | | |
| Cosmetics & Personal Care — 0.5% | |
The Estee Lauder Cos., Inc.
Class A | | | 47,800 | | | | 1,479,888 | | |
| Distribution & Wholesale — 1.6% | |
| Genuine Parts Co. | | | 79,618 | | | | 3,014,338 | | |
| W.W. Grainger, Inc. | | | 21,000 | | | | 1,655,640 | | |
| | | | 4,669,978 | | |
| Diversified Financial — 3.1% | |
AllianceBernstein
Holding LP | | | 164,900 | | | | 3,428,271 | | |
| Ameriprise Financial, Inc. | | | 139,100 | | | | 3,249,376 | | |
| Legg Mason, Inc. | | | 111,200 | | | | 2,436,392 | | |
| | | | 9,114,039 | | |
| | | Number of
Shares | | Value | |
| Electric — 10.8% | |
| Ameren Corp. | | | 123,900 | | | $ | 4,120,914 | | |
The Empire District
Electric Co. | | | 47,129 | | | | 829,470 | | |
| Idacorp, Inc. | | | 154,288 | | | | 4,543,782 | | |
Portland General
Electric Co. | | | 288,578 | | | | 5,618,614 | | |
| Puget Energy, Inc. | | | 28,202 | | | | 769,068 | | |
| Westar Energy, Inc. | | | 273,977 | | | | 5,619,268 | | |
| Wisconsin Energy Corp. | | | 137,439 | | | | 5,769,689 | | |
| Xcel Energy, Inc. | | | 232,385 | | | | 4,310,742 | | |
| | | | 31,581,547 | | |
| Electrical Components & Equipment — 4.5% | |
| Emerson Electric Co. | | | 34,900 | | | | 1,277,689 | | |
| Hubbell, Inc. Class B | | | 123,100 | | | | 4,022,908 | | |
| Littelfuse, Inc.(a) | | | 98,242 | | | | 1,630,817 | | |
| Molex, Inc. | | | 440,680 | | | | 6,385,453 | | |
| | | | 13,316,867 | | |
| Electronics — 1.3% | |
| AVX Corp. | | | 297,637 | | | | 2,363,238 | | |
| Tyco Electronics Ltd. | | | 85,363 | | | | 1,383,734 | | |
| | | | 3,746,972 | | |
| Entertainment — 3.1% | |
International Speedway
Corp. Class A | | | 166,821 | | | | 4,792,767 | | |
Speedway
Motorsports, Inc. | | | 275,661 | | | | 4,440,899 | | |
| | | | 9,233,666 | | |
| Environmental Controls — 3.1% | |
| Republic Services, Inc. | | | 151,228 | | | | 3,748,942 | | |
| Waste Management, Inc. | | | 159,112 | | | | 5,272,972 | | |
| | | | 9,021,914 | | |
| Foods — 6.4% | |
| Campbell Soup Co. | | | 141,500 | | | | 4,246,415 | | |
| ConAgra Foods, Inc. | | | 328,509 | | | | 5,420,399 | | |
| Heinz (H.J.) Co. | | | 78,100 | | | | 2,936,560 | | |
| The Hershey Co. | | | 33,495 | | | | 1,163,616 | | �� |
| Hormel Foods Corp. | | | 90,800 | | | | 2,822,064 | | |
| Kellogg Co. | | | 33,700 | | | | 1,477,745 | | |
| Tyson Foods, Inc. Class A | | | 99,641 | | | | 872,855 | | |
| | | | 18,939,654 | | |
| Forest Products & Paper — 3.4% | |
| International Paper Co. | | | 106,800 | | | | 1,260,240 | | |
| MeadWestvaco Corp. | | | 184,508 | | | | 2,064,644 | | |
| Rayonier, Inc. | | | 120,246 | | | | 3,769,712 | | |
| Weyerhaeuser Co. | | | 91,255 | | | | 2,793,316 | | |
| | | | 9,887,912 | | |
| | | Number of
Shares | | Value | |
| Gas — 4.0% | |
| AGL Resources, Inc. | | | 80,400 | | | $ | 2,520,540 | | |
| Southwest Gas Corp. | | | 134,549 | | | | 3,393,326 | | |
| WGL Holdings, Inc. | | | 176,667 | | | | 5,775,244 | | |
| | | | 11,689,110 | | |
| Health Care – Products — 4.3% | |
| Beckman Coulter, Inc. | | | 138,213 | | | | 6,073,079 | | |
| Boston Scientific Corp.(a) | | | 158,000 | | | | 1,222,920 | | |
| Symmetry Medical, Inc.(a) | | | 273,375 | | | | 2,178,799 | | |
| Zimmer Holdings, Inc.(a) | | | 76,100 | | | | 3,075,962 | | |
| | | | 12,550,760 | | |
| Health Care – Services — 1.3% | |
| LifePoint Hospitals, Inc.(a) | | | 79,500 | | | | 1,815,780 | | |
Universal Health Services,
Inc. Class B | | | 53,712 | | | | 2,017,960 | | |
| | | | 3,833,740 | | |
| Home Furnishing — 0.9% | |
| Whirlpool Corp. | | | 62,700 | | | | 2,592,645 | | |
| Household Products — 3.4% | |
| Avery Dennison Corp. | | | 37,700 | | | | 1,233,921 | | |
| The Clorox Co. | | | 17,100 | | | | 950,076 | | |
| Kimberly-Clark Corp. | | | 145,594 | | | | 7,678,628 | | |
| | | | 9,862,625 | | |
| Insurance — 10.2% | |
| ACE Ltd. | | | 56,000 | | | | 2,963,520 | | |
| Allstate Corp. | | | 51,601 | | | | 1,690,449 | | |
| Aon Corp. | | | 94,500 | | | | 4,316,760 | | |
| Arthur J. Gallagher & Co. | | | 102,264 | | | | 2,649,660 | | |
| Chubb Corp. | | | 98,700 | | | | 5,033,700 | | |
HCC Insurance
Holdings, Inc. | | | 53,535 | | | | 1,432,061 | | |
Marsh &
McLennan Cos., Inc. | | | 398,067 | | | | 9,661,086 | | |
| Metlife, Inc. | | | 64,564 | | | | 2,250,701 | | |
| | | | 29,997,937 | | |
| Machinery – Diversified — 1.1% | |
| Altra Holdings, Inc.(a) | | | 390,083 | | | | 3,085,557 | | |
| Manufacturing — 0.7% | |
| Dover Corp. | | | 63,100 | | | | 2,077,252 | | |
| Metal Fabricate & Hardware — 1.1% | |
| Kaydon Corp. | | | 92,000 | | | | 3,160,200 | | |
| Mining — 0.6% | |
| Alcoa, Inc. | | | 40,400 | | | | 454,904 | | |
| Newmont Mining Corp. | | | 32,300 | | | | 1,314,610 | | |
| | | | 1,769,514 | | |
(Continued)
The accompanying notes are an integral part of the financial statements.
90
MML Mid Cap Value Fund – Portfolio of Investments (Continued)
| | | Number of
Shares | | Value | |
| Office Equipment/Supplies — 0.7% | |
| Pitney Bowes, Inc. | | | 85,801 | | | $ | 2,186,209 | | |
| Office Furnishings — 0.4% | |
| HNI Corp. | | | 67,023 | | | | 1,061,644 | | |
| Oil & Gas — 2.3% | |
| Apache Corp. | | | 38,194 | | | | 2,846,599 | | |
| Murphy Oil Corp. | | | 22,400 | | | | 993,440 | | |
| Noble Energy, Inc. | | | 38,800 | | | | 1,909,736 | | |
| Talisman Energy, Inc. | | | 92,700 | | | | 926,073 | | |
| | | | 6,675,848 | | |
| Oil & Gas Services — 0.5% | |
Cameron
International Corp.(a) | | | 65,600 | | | | 1,344,800 | | |
| Packaging & Containers — 1.1% | |
| Bemis Co., Inc. | | | 141,959 | | | | 3,361,589 | | |
| Pharmaceuticals — 1.6% | |
| Hospira, Inc.(a) | | | 39,800 | | | | 1,067,436 | | |
| Patterson Cos., Inc.(a) | | | 119,100 | | | | 2,233,125 | | |
Watson
Pharmaceuticals, Inc.(a) | | | 53,736 | | | | 1,427,766 | | |
| | | | 4,728,327 | | |
| Pipelines — 2.1% | |
| Equitable Resources, Inc. | | | 185,562 | | | | 6,225,605 | | |
| Real Estate Investment Trusts (REITS) — 1.6% | |
| Boston Properties, Inc. | | | 28,000 | | | | 1,540,000 | | |
| Host Hotels & Resorts, Inc. | | | 134,100 | | | | 1,015,137 | | |
| Public Storage | | | 27,100 | | | | 2,154,450 | | |
| | | | 4,709,587 | | |
| Retail — 0.6% | |
| Costco Wholesale Corp. | | | 33,600 | | | | 1,764,000 | | |
| Savings & Loans — 2.4% | |
People's United
Financial, Inc. | | | 175,112 | | | | 3,122,247 | | |
| Washington Federal, Inc. | | | 258,425 | | | | 3,866,038 | | |
| | | | 6,988,285 | | |
| Semiconductors — 2.7% | |
| Applied Materials, Inc. | | | 233,100 | | | | 2,361,303 | | |
| Emulex Corp.(a) | | | 226,800 | | | | 1,583,064 | | |
| KLA-Tencor Corp. | | | 100,800 | | | | 2,196,432 | | |
| Teradyne, Inc.(a) | | | 417,700 | | | | 1,762,694 | | |
| | | | 7,903,493 | | |
| Software — 0.5% | |
| IMS Health, Inc. | | | 102,400 | | | | 1,552,384 | | |
| Telecommunications — 3.5% | |
| Bce, Inc. | | | 327,877 | | | | 6,674,402 | | |
| CenturyTel, Inc. | | | 34,100 | | | | 931,953 | | |
| | | Number of
Shares | | Value | |
| Embarq Corp. | | | 49,100 | | | $ | 1,765,636 | | |
Frontier
Communications Corp. | | | 118,400 | | | | 1,034,816 | | |
| | | | 10,406,807 | | |
| Toys, Games & Hobbies — 0.9% | |
| Mattel, Inc. | | | 123,900 | | | | 1,982,400 | | |
| RC2 Corp.(a) | | | 69,148 | | | | 737,809 | | |
| | | | 2,720,209 | | |
| Water — 0.1% | |
American Water Works
Co., Inc. | | | 17,391 | | | | 363,124 | | |
TOTAL COMMON STOCK
(Cost $325,621,095) | | | 284,243,830 | | |
TOTAL EQUITIES
(Cost $325,621,095) | | | 284,243,830 | | |
| MUTUAL FUNDS — 1.5% | |
| Diversified Financial — 1.5% | |
iShares Russell Midcap
Value Index Fund | | | 161,600 | | | | 4,595,904 | | |
TOTAL MUTUAL FUNDS
(Cost $4,407,829) | | | 4,595,904 | | |
TOTAL LONG-TERM
INVESTMENTS
(Cost $330,028,924) | | | 288,839,734 | | |
| | | Principal
Amount | | | |
| SHORT-TERM INVESTMENTS — 0.7% | |
| Repurchase Agreement — 0.7% | |
State Street Bank &
Trust Co. Repurchase
Agreement, dated
12/31/08, 0.010%,
due 1/02/09(b) | | $ | 2,069,519 | | | | 2,069,519 | | |
TOTAL SHORT-TERM
INVESTMENTS
(Cost $2,069,519) | | | 2,069,519 | | |
TOTAL INVESTMENTS — 99.0%
(Cost $332,098,443)(c) | | | 290,909,253 | | |
Other Assets/
(Liabilities) — 1.0% | | | 2,802,872 | | |
| NET ASSETS — 100.0% | | $ | 293,712,125 | | |
Notes to Portfolio of Investments
Industry classifications are unaudited.
(a) Non-income producing security.
(b) Maturity value of $2,069,520. Collateralized by U.S. Government Agency obligations with a rate of 4.226%, maturity date of 5/01/35, and an aggregate market value, including accrued interest, of $2,111,882.
(c) See Note 6 for aggregate cost for federal tax purposes.
The accompanying notes are an integral part of the financial statements.
91
MML Mid Cap Growth Fund – Portfolio of Investments
December 31, 2008
| | | Number of
Shares | | Value | |
| EQUITIES — 94.7% | |
| COMMON STOCK — 94.7% | |
| Advertising — 0.9% | |
Clear Channel Outdoor
Holdings, Inc. Class A(a) | | | 78,900 | | | $ | 485,235 | | |
Lamar Advertising Co.
Class A(a) | | | 83,600 | | | | 1,050,016 | | |
| Omnicom Group, Inc. | | | 3,000 | | | | 80,760 | | |
| | | | 1,616,011 | | |
| Aerospace & Defense — 3.2% | |
| Alliant Techsystems, Inc.(a) | | | 29,300 | | | | 2,512,768 | | |
Empresa Brasileira de
Aeronautica SA
ADR (Brazil) | | | 4,300 | | | | 69,703 | | |
| Goodrich Corp. | | | 5,500 | | | | 203,610 | | |
| Rockwell Collins, Inc. | | | 82,600 | | | | 3,228,834 | | |
| | | | 6,014,915 | | |
| Agriculture — 0.1% | |
| Lorillard, Inc. | | | 3,000 | | | | 169,050 | | |
| Airlines — 0.7% | |
| SkyWest, Inc. | | | 3,800 | | | | 70,680 | | |
| Southwest Airlines Co. | | | 149,800 | | | | 1,291,276 | | |
| | | | 1,361,956 | | |
| Auto Manufacturers — 0.0% | |
| Paccar, Inc. | | | 2,700 | | | | 77,220 | | |
| Automotive & Parts — 0.5% | |
| WABCO Holdings, Inc. | | | 60,900 | | | | 961,611 | | |
| Banks — 0.2% | |
| Northern Trust Corp. | | | 4,800 | | | | 250,272 | | |
| SVB Financial Group(a) | | | 1,800 | | | | 47,214 | | |
| | | | 297,486 | | |
| Beverages — 0.1% | |
Brown-Forman Corp.
Class B | | | 3,875 | | | | 199,524 | | |
| Biotechnology — 3.6% | |
Alexion
Pharmaceuticals, Inc.(a) | | | 22,500 | | | | 814,275 | | |
| Biogen Idec, Inc.(a) | | | 1,700 | | | | 80,971 | | |
Charles River Laboratories
International, Inc.(a) | | | 3,400 | | | | 89,080 | | |
Human Genome
Sciences, Inc.(a) | | | 77,000 | | | | 163,240 | | |
| Illumina, Inc.(a) | | | 54,600 | | | | 1,422,330 | | |
| Life Technologies Corp.(a) | | | 3,000 | | | | 69,930 | | |
| | | Number of
Shares | | Value | |
| Martek Biosciences Corp. | | | 2,500 | | | $ | 75,775 | | |
| Millipore Corp.(a) | | | 29,500 | | | | 1,519,840 | | |
| Myriad Genetics, Inc.(a) | | | 14,300 | | | | 947,518 | | |
Vertex
Pharmaceuticals, Inc.(a) | | | 52,500 | | | | 1,594,950 | | |
| | | | 6,777,909 | | |
| Chemicals — 0.4% | |
Air Products &
Chemicals, Inc. | | | 1,600 | | | | 80,432 | | |
| Albemarle Corp. | | | 2,300 | | | | 51,290 | | |
CF Industries
Holdings, Inc. | | | 1,500 | | | | 73,740 | | |
| Ecolab, Inc. | | | 5,900 | | | | 207,385 | | |
| Intrepid Potash, Inc.(a) | | | 7,400 | | | | 153,698 | | |
| The Sherwin-Williams Co. | | | 1,900 | | | | 113,525 | | |
| Sigma-Aldrich Corp. | | | 1,600 | | | | 67,584 | | |
| | | | 747,654 | | |
| Coal — 1.2% | |
| Arch Coal, Inc. | | | 4,700 | | | | 76,563 | | |
| CONSOL Energy, Inc. | | | 51,200 | | | | 1,463,296 | | |
Foundation Coal
Holdings, Inc. | | | 4,800 | | | | 67,296 | | |
| Massey Energy Co. | | | 2,400 | | | | 33,096 | | |
| Peabody Energy Corp. | | | 27,300 | | | | 621,075 | | |
| | | | 2,261,326 | | |
| Commercial Services — 8.7% | |
Apollo Group, Inc.
Class A(a) | | | 3,200 | | | | 245,184 | | |
The Corporate
Executive Board Co. | | | 2,700 | | | | 59,562 | | |
| DeVry, Inc. | | | 2,800 | | | | 160,748 | | |
| Equifax, Inc. | | | 2,400 | | | | 63,648 | | |
| Global Payments, Inc. | | | 70,400 | | | | 2,308,416 | | |
| Iron Mountain, Inc.(a) | | | 76,950 | | | | 1,902,973 | | |
ITT Educational
Services, Inc.(a) | | | 1,800 | | | | 170,964 | | |
| Manpower, Inc. | | | 36,000 | | | | 1,223,640 | | |
| McKesson Corp. | | | 2,100 | | | | 81,333 | | |
Monster
Worldwide, Inc.(a) | | | 5,200 | | | | 62,868 | | |
| Moody's Corp. | | | 4,700 | | | | 94,423 | | |
New Oriental Education &
Technology Group, Inc.
Sponsored ADR
(Cayman Islands)(a) | | | 1,300 | | | | 71,383 | | |
| Paychex, Inc. | | | 7,300 | | | | 191,844 | | |
| Quanta Services, Inc.(a) | | | 104,200 | | | | 2,063,160 | | |
| | | Number of
Shares | | Value | |
Ritchie Bros.
Auctioneers, Inc. | | | 10,200 | | | $ | 218,484 | | |
Robert Half
International, Inc. | | | 93,900 | | | | 1,954,998 | | |
| SAIC, Inc.(a) | | | 147,000 | | | | 2,863,560 | | |
| VistaPrint Ltd.(a) | | | 2,500 | | | | 46,525 | | |
| Western Union Co. | | | 174,700 | | | | 2,505,198 | | |
| | | | 16,288,911 | | |
| Computers — 2.5% | |
Cognizant Technology
Solutions Corp. Class A(a) | | | 8,700 | | | | 157,122 | | |
| DST Systems, Inc.(a) | | | 49,000 | | | | 1,861,020 | | |
| IHS, Inc. Class A(a) | | | 24,000 | | | | 898,080 | | |
Jack Henry &
Associates, Inc. | | | 13,300 | | | | 258,153 | | |
Logitech
International SA(a) | | | 3,400 | | | | 52,972 | | |
| MICROS Systems, Inc.(a) | | | 52,000 | | | | 848,640 | | |
| NetApp, Inc.(a) | | | 8,700 | | | | 121,539 | | |
Perot Systems Corp.
Class A(a) | | | 6,100 | | | | 83,387 | | |
| Seagate Technology | | | 99,700 | | | | 441,671 | | |
| Synopsys, Inc.(a) | | | 3,400 | | | | 62,968 | | |
| | | | 4,785,552 | | |
| Cosmetics & Personal Care — 0.2% | |
| Avon Products, Inc. | | | 12,500 | | | | 300,375 | | |
| Distribution & Wholesale — 0.8% | |
| Fastenal Co. | | | 27,300 | | | | 951,405 | | |
| LKQ Corp.(a) | | | 31,000 | | | | 361,460 | | |
| W.W. Grainger, Inc. | | | 1,800 | | | | 141,912 | | |
| | | | 1,454,777 | | |
| Diversified Financial — 3.5% | |
| Ameriprise Financial, Inc. | | | 33,000 | | | | 770,880 | | |
| BlackRock, Inc. | | | 700 | | | | 93,905 | | |
| CME Group, Inc. | | | 300 | | | | 62,433 | | |
| Eaton Vance Corp. | | | 70,600 | | | | 1,483,306 | | |
Federated Investors, Inc.
Class B | | | 3,400 | | | | 57,664 | | |
| Franklin Resources, Inc. | | | 1,000 | | | | 63,780 | | |
Interactive Brokers
Group, Inc.(a) | | | 46,100 | | | | 824,729 | | |
IntercontinentalExchange,
Inc.(a) | | | 15,900 | | | | 1,310,796 | | |
| Janus Capital Group, Inc. | | | 4,700 | | | | 37,741 | | |
| Lazard Ltd. Class A | | | 3,900 | | | | 115,986 | | |
optionsXpress
Holdings, Inc. | | | 2,600 | | | | 34,736 | | |
(Continued)
The accompanying notes are an integral part of the financial statements.
92
MML Mid Cap Growth Fund – Portfolio of Investments (Continued)
| | | Number of
Shares | | Value | |
Raymond James
Financial, Inc. | | | 43,000 | | | $ | 736,590 | | |
TD Ameritrade
Holding Corp.(a) | | | 66,000 | | | | 940,500 | | |
| | | | 6,533,046 | | |
| Electric — 0.1% | |
| Dynegy, Inc. Class A(a) | | | 146,000 | | | | 292,000 | | |
| Electrical Components & Equipment — 1.9% | |
| Ametek, Inc. | | | 95,500 | | | | 2,885,055 | | |
| General Cable Corp.(a) | | | 1,700 | | | | 30,073 | | |
| Sunpower Corp. Class B(a) | | | 19,000 | | | | 578,360 | | |
| | | | 3,493,488 | | |
| Electronics — 4.6% | |
| Amphenol Corp. Class A | | | 3,200 | | | | 76,736 | | |
| Cogent, Inc.(a) | | | 4,600 | | | | 62,422 | | |
| Cymer, Inc.(a) | | | 1,400 | | | | 30,674 | | |
Dolby Laboratories, Inc.
Class A(a) | | | 52,500 | | | | 1,719,900 | | |
| FLIR Systems, Inc.(a) | | | 116,000 | | | | 3,558,880 | | |
| Gentex Corp. | | | 3,900 | | | | 34,437 | | |
| II-VI, Inc.(a) | | | 2,700 | | | | 51,543 | | |
| Itron, Inc.(a) | | | 20,900 | | | | 1,332,166 | | |
| Jabil Circuit, Inc. | | | 6,400 | | | | 43,200 | | |
Mettler Toledo
International, Inc.(a) | | | 800 | | | | 53,920 | | |
| National Instruments Corp. | | | 3,400 | | | | 82,824 | | |
| Trimble Navigation Ltd.(a) | | | 6,000 | | | | 129,660 | | |
| Waters Corp.(a) | | | 39,000 | | | | 1,429,350 | | |
| | | | 8,605,712 | | |
| Energy – Alternate Sources — 0.2% | |
| First Solar, Inc.(a) | | | 3,000 | | | | 413,880 | | |
GT Solar
International, Inc.(a) | | | 10,100 | | | | 29,189 | | |
| | | | 443,069 | | |
| Engineering & Construction — 0.6% | |
| Fluor Corp. | | | 3,800 | | | | 170,506 | | |
| Foster Wheeler Ltd.(a) | | | 4,900 | | | | 114,562 | | |
McDermott
International, Inc.(a) | | | 88,100 | | | | 870,428 | | |
| | | | 1,155,496 | | |
| Entertainment — 0.1% | |
Ascent Media
Corp. Series A(a) | | | 5,000 | | | | 109,200 | | |
DreamWorks Animation
SKG, Inc. Class A(a) | | | 2,800 | | | | 70,728 | | |
International
Game Technology | | | 6,700 | | | | 79,663 | | |
| | | | 259,591 | | |
| | | Number of
Shares | | Value | |
| Environmental Controls — 0.3% | |
| EnergySolutions, Inc. | | | 46,000 | | | $ | 259,900 | | |
| Republic Services, Inc. | | | 4,350 | | | | 107,837 | | |
| Stericycle, Inc.(a) | | | 2,300 | | | | 119,784 | | |
| | | | 487,521 | | |
| Foods — 0.6% | |
| The Hershey Co. | | | 2,900 | | | | 100,746 | | |
| The J.M. Smucker Co. | | | 2,700 | | | | 117,072 | | |
| McCormick & Co., Inc. | | | 6,400 | | | | 203,904 | | |
| Whole Foods Market, Inc. | | | 85,000 | | | | 802,400 | | |
| | | | 1,224,122 | | |
| Health Care – Products — 4.6% | |
American Medical Systems
Holdings, Inc.(a) | | | 3,800 | | | | 34,162 | | |
| ArthroCare Corp.(a) | | | 2,300 | | | | 10,971 | | |
| Bard (C.R.), Inc. | | | 22,600 | | | | 1,904,276 | | |
| Becton, Dickinson & Co. | | | 1,000 | | | | 68,390 | | |
Edwards
Lifesciences Corp.(a) | | | 34,100 | | | | 1,873,795 | | |
| Gen-Probe, Inc.(a) | | | 14,300 | | | | 612,612 | | |
| Henry Schein, Inc.(a) | | | 51,300 | | | | 1,882,197 | | |
| Hologic, Inc.(a) | | | 4,800 | | | | 62,736 | | |
| IDEXX Laboratories, Inc.(a) | | | 3,400 | | | | 122,672 | | |
| Intuitive Surgical, Inc.(a) | | | 900 | | | | 114,291 | | |
| Masimo Corp.(a) | | | 2,900 | | | | 86,507 | | |
| Qiagen N.V.(a) | | | 70,100 | | | | 1,230,956 | | |
| Resmed, Inc.(a) | | | 2,400 | | | | 89,952 | | |
| St. Jude Medical, Inc.(a) | | | 7,700 | | | | 253,792 | | |
| Techne Corp. | | | 2,100 | | | | 135,492 | | |
Varian Medical
Systems, Inc.(a) | | | 2,600 | | | | 91,104 | | |
| Zimmer Holdings, Inc.(a) | | | 1,900 | | | | 76,798 | | |
| | | | 8,650,703 | | |
| Health Care – Services — 1.2% | |
| Cigna Corp. | | | 2,500 | | | | 42,125 | | |
| Covance, Inc.(a) | | | 1,000 | | | | 46,030 | | |
Coventry Health
Care, Inc.(a) | | | 2,700 | | | | 40,176 | | |
| DaVita, Inc.(a) | | | 2,100 | | | | 104,097 | | |
| Health Net, Inc.(a) | | | 35,900 | | | | 390,951 | | |
| Humana, Inc.(a) | | | 31,900 | | | | 1,189,232 | | |
Laboratory Corp. of
America Holdings(a) | | | 2,400 | | | | 154,584 | | |
| Lincare Holdings, Inc.(a) | | | 3,600 | | | | 96,948 | | |
| Quest Diagnostics, Inc. | | | 2,600 | | | | 134,966 | | |
| | | | 2,199,109 | | |
| Home Builders — 0.1% | |
| Centex Corp. | | | 1,700 | | | | 18,088 | | |
| KB Home | | | 1,800 | | | | 24,516 | | |
| Lennar Corp. Class A | | | 2,300 | | | | 19,941 | | |
| | | Number of
Shares | | Value | |
| Pulte Homes, Inc. | | | 2,400 | | | $ | 26,232 | | |
| Toll Brothers, Inc.(a) | | | 2,300 | | | | 49,289 | | |
| | | | 138,066 | | |
| Household Products — 0.1% | |
| The Clorox Co. | | | 2,900 | | | | 161,124 | | |
| Insurance — 1.6% | |
| Aon Corp. | | | 1,900 | | | | 86,792 | | |
| Arch Capital Group Ltd.(a) | | | 1,400 | | | | 98,140 | | |
| Assurant, Inc. | | | 36,300 | | | | 1,089,000 | | |
| Axis Capital Holdings Ltd. | | | 34,900 | | | | 1,016,288 | | |
HCC Insurance
Holdings, Inc. | | | 3,200 | | | | 85,600 | | |
Principal Financial
Group, Inc. | | | 21,000 | | | | 473,970 | | |
RenaissanceRe
Holdings Ltd. | | | 1,500 | | | | 77,340 | | |
| | | | 2,927,130 | | |
| Internet — 4.4% | |
| Amazon.com, Inc.(a) | | | 44,000 | | | | 2,256,320 | | |
Baidu.com Sponsored ADR
(Cayman Islands)(a) | | | 400 | | | | 52,228 | | |
Check Point Software
Technologies Ltd.(a) | | | 3,800 | | | | 72,162 | | |
Ctrip.com International Ltd.
ADR (Cayman Islands) | | | 2,000 | | | | 47,600 | | |
| Digital River, Inc.(a) | | | 2,600 | | | | 64,480 | | |
| Expedia, Inc.(a) | | | 142,400 | | | | 1,173,376 | | |
| F5 Networks, Inc.(a) | | | 4,000 | | | | 91,440 | | |
| McAfee, Inc.(a) | | | 62,600 | | | | 2,164,082 | | |
| Priceline.com, Inc.(a) | | | 8,500 | | | | 626,025 | | |
| Sina Corp.(a) | | | 2,700 | | | | 62,505 | | |
| Symantec Corp.(a) | | | 5,900 | | | | 79,768 | | |
| VeriSign, Inc.(a) | | | 85,800 | | | | 1,637,064 | | |
| | | | 8,327,050 | | |
| Iron & Steel — 0.1% | |
| Carpenter Technology Corp. | | | 4,400 | | | | 90,376 | | |
Cliffs Natural
Resources, Inc. | | | 3,800 | | | | 97,318 | | |
| | | | 187,694 | | |
| Leisure Time — 0.1% | |
| Royal Caribbean Cruises Ltd. | | | 2,100 | | | | 28,875 | | |
| WMS Industries, Inc.(a) | | | 2,600 | | | | 69,940 | | |
| | | | 98,815 | | |
| Lodging — 1.9% | |
Choice Hotels
International, Inc. | | | 3,800 | | | | 114,228 | | |
Gaylord
Entertainment Co.(a) | | | 41,000 | | | | 444,440 | | |
(Continued)
The accompanying notes are an integral part of the financial statements.
93
MML Mid Cap Growth Fund – Portfolio of Investments (Continued)
| | | Number of
Shares | | Value | |
Marriott International,
Inc. Class A | | | 95,300 | | | $ | 1,853,585 | | |
Starwood Hotels & Resorts
Worldwide, Inc. | | | 3,200 | | | | 57,280 | | |
| Wynn Resorts Ltd.(a) | | | 28,100 | | | | 1,187,506 | | |
| | | | 3,657,039 | | |
| Machinery – Construction & Mining — 0.1% | |
| Joy Global, Inc. | | | 4,200 | | | | 96,138 | | |
| Terex Corp.(a) | | | 2,300 | | | | 39,836 | | |
| | | | 135,974 | | |
| Machinery – Diversified — 3.0% | |
| Cummins, Inc. | | | 3,400 | | | | 90,882 | | |
| Flowserve Corp. | | | 1,400 | | | | 72,100 | | |
| Graco, Inc. | | | 2,200 | | | | 52,206 | | |
| IDEX Corp. | | | 75,350 | | | | 1,819,703 | | |
| Roper Industries, Inc. | | | 82,800 | | | | 3,594,348 | | |
Zebra Technologies Corp.
Class A(a) | | | 1,900 | | | | 38,494 | | |
| | | | 5,667,733 | | |
| Manufacturing — 1.9% | |
| Danaher Corp. | | | 24,000 | | | | 1,358,640 | | |
| Donaldson Co., Inc. | | | 4,400 | | | | 148,060 | | |
| Harsco Corp. | | | 29,000 | | | | 802,720 | | |
| ITT Corp. | | | 27,400 | | | | 1,260,126 | | |
| Pall Corp. | | | 2,400 | | | | 68,232 | | |
| | | | 3,637,778 | | |
| Media — 2.7% | |
Cablevision Systems Corp.
Class A | | | 85,100 | | | | 1,433,084 | | |
Central European
Media Enterprises Ltd.(a) | | | 1,300 | | | | 28,236 | | |
| CTC Media, Inc.(a) | | | 4,400 | | | | 21,120 | | |
Discovery Communications,
Inc., Series A(a) | | | 48,000 | | | | 679,680 | | |
Discovery Communications,
Inc., Series C(a) | | | 58,900 | | | | 788,671 | | |
FactSet Research
Systems, Inc. | | | 30,600 | | | | 1,353,744 | | |
| The McGraw-Hill Cos., Inc. | | | 6,000 | | | | 139,140 | | |
Rogers Communications,
Inc. Class B | | | 10,000 | | | | 300,800 | | |
Shaw Communications,
Inc. Class B | | | 4,200 | | | | 74,256 | | |
Sirius Satellite
Radio, Inc.(a) | | | 651,000 | | | | 78,120 | | |
WPP PLC Sponsored
ADR (United Kingdom) | | | 3,100 | | | | 91,729 | | |
| | | | 4,988,580 | | |
| | | Number of
Shares | | Value | |
| Metal Fabricate & Hardware — 0.2% | |
| Precision Castparts Corp. | | | 3,700 | | | $ | 220,076 | | |
| Valmont Industries, Inc. | | | 1,600 | | | | 98,176 | | |
| | | | 318,252 | | |
| Mining — 1.6% | |
| Agnico-Eagle Mines Ltd.(b) | | | 4,400 | | | | 214,559 | | |
| Agnico-Eagle Mines Ltd. | | | 54,900 | | | | 2,818,017 | | |
| | | | 3,032,576 | | |
| Oil & Gas — 3.5% | |
| Bill Barrett Corp.(a) | | | 2,300 | | | | 48,599 | | |
| Cabot Oil & Gas Corp. | | | 4,000 | | | | 104,000 | | |
| CNX Gas Corp.(a) | | | 65,000 | | | | 1,774,500 | | |
| Concho Resources, Inc.(a) | | | 6,100 | | | | 139,202 | | |
Diamond Offshore
Drilling, Inc. | | | 1,800 | | | | 106,092 | | |
| EOG Resources, Inc. | | | 24,000 | | | | 1,597,920 | | |
| Forest Oil Corp.(a) | | | 5,500 | | | | 90,695 | | |
| Mariner Energy, Inc.(a) | | | 3,100 | | | | 31,620 | | |
| Murphy Oil Corp. | | | 32,200 | | | | 1,428,070 | | |
| Nabors Industries Ltd.(a) | | | 8,400 | | | | 100,548 | | |
| Newfield Exploration Co.(a) | | | 5,600 | | | | 110,600 | | |
| SandRidge Energy, Inc.(a) | | | 2,800 | | | | 17,220 | | |
| Sunoco, Inc. | | | 2,100 | | | | 91,266 | | |
| Ultra Petroleum Corp.(a) | | | 4,200 | | | | 144,942 | | |
| XTO Energy, Inc. | | | 20,000 | | | | 705,400 | | |
| | | | 6,490,674 | | |
| Oil & Gas Services — 3.1% | |
| Baker Hughes, Inc. | | | 1,700 | | | | 54,519 | | |
| BJ Services Co. | | | 120,000 | | | | 1,400,400 | | |
Cameron
International Corp.(a) | | | 27,500 | | | | 563,750 | | |
Complete Production
Services, Inc.(a) | | | 2,700 | | | | 22,005 | | |
| Core Laboratories NV | | | 2,300 | | | | 137,678 | | |
| FMC Technologies, Inc.(a) | | | 50,700 | | | | 1,208,181 | | |
| Smith International, Inc. | | | 89,100 | | | | 2,039,499 | | |
TETRA
Technologies, Inc.(a) | | | 12,900 | | | | 62,694 | | |
| Trican Well Service Ltd. | | | 50,000 | | | | 322,398 | | |
| | | | 5,811,124 | | |
| Pharmaceuticals — 6.1% | |
| Allergan, Inc. | | | 26,600 | | | | 1,072,512 | | |
Amylin
Pharmaceuticals, Inc.(a) | | | 42,200 | | | | 457,870 | | |
BioMarin
Pharmaceuticals, Inc.(a) | | | 39,100 | | | | 695,980 | | |
| Cephalon, Inc.(a) | | | 46,400 | | | | 3,574,656 | | |
DENTSPLY
International, Inc. | | | 51,500 | | | | 1,454,360 | | |
| | | Number of
Shares | | Value | |
Elan Corp. PLC Sponsored
ADR (Ireland)(a) | | | 119,200 | | | $ | 715,200 | | |
| Express Scripts, Inc.(a) | | | 4,600 | | | | 252,908 | | |
| Medarex, Inc.(a) | | | 26,000 | | | | 145,080 | | |
OSI
Pharmaceuticals, Inc.(a) | | | 12,000 | | | | 468,600 | | |
| Patterson Cos., Inc.(a) | | | 1,800 | | | | 33,750 | | |
| Theravance, Inc.(a) | | | 34,000 | | | | 421,260 | | |
Valeant Pharmaceuticals
International(a) | | | 62,000 | | | | 1,419,800 | | |
Warner Chilcott Ltd.
Class A(a) | | | 53,500 | | | | 775,750 | | |
| | | | 11,487,726 | | |
| Pipelines — 0.0% | |
| The Williams Cos., Inc. | | | 6,100 | | | | 88,328 | | |
| Real Estate — 0.2% | |
| The St. Joe Co.(a) | | | 14,000 | | | | 340,480 | | |
| Retail — 7.3% | |
| Advance Auto Parts, Inc. | | | 2,200 | | | | 74,030 | | |
| AnnTaylor Stores Corp.(a) | | | 2,100 | | | | 12,117 | | |
| Bed Bath & Beyond, Inc.(a) | | | 79,400 | | | | 2,018,348 | | |
| Best Buy Co., Inc. | | | 12,000 | | | | 337,320 | | |
| Carmax, Inc.(a) | | | 66,000 | | | | 520,080 | | |
Chipotle Mexican Grill, Inc.
Class B(a) | | | 31,900 | | | | 1,827,551 | | |
| Coach, Inc.(a) | | | 6,400 | | | | 132,928 | | |
| Copart, Inc.(a) | | | 2,200 | | | | 59,818 | | |
Dick's Sporting
Goods, Inc.(a) | | | 3,000 | | | | 42,330 | | |
| Family Dollar Stores, Inc. | | | 4,300 | | | | 112,101 | | |
| J. Crew Group, Inc.(a) | | | 41,000 | | | | 500,200 | | |
| Men's Wearhouse, Inc. | | | 2,100 | | | | 28,434 | | |
MSC Industrial Direct
Co., Inc. Class A | | | 28,000 | | | | 1,031,240 | | |
| O'Reilly Automotive, Inc.(a) | | | 52,600 | | | | 1,616,924 | | |
| Panera Bread Co. Class A(a) | | | 9,000 | | | | 470,160 | | |
| PetSmart, Inc. | | | 93,900 | | | | 1,732,455 | | |
| Ross Stores, Inc. | | | 4,900 | | | | 145,677 | | |
| Shoppers Drug Mart Corp. | | | 22,000 | | | | 856,298 | | |
| Staples, Inc. | | | 4,100 | | | | 73,472 | | |
| Starbucks Corp.(a) | | | 6,900 | | | | 65,274 | | |
| Tiffany & Co. | | | 5,200 | | | | 122,876 | | |
| Tim Hortons, Inc. | | | 41,900 | | | | 1,208,396 | | |
| The TJX Cos., Inc. | | | 10,900 | | | | 224,213 | | |
| Tractor Supply Co.(a) | | | 1,600 | | | | 57,824 | | |
| Urban Outfitters, Inc.(a) | | | 3,500 | | | | 52,430 | | |
| Williams-Sonoma, Inc. | | | 4,600 | | | | 36,156 | | |
| Yum! Brands, Inc. | | | 10,200 | | | | 321,300 | | |
| | | | 13,679,952 | | |
(Continued)
The accompanying notes are an integral part of the financial statements.
94
MML Mid Cap Growth Fund – Portfolio of Investments (Continued)
| | | Number of
Shares | | Value | |
| Semiconductors — 5.7% | |
| Altera Corp. | | | 124,900 | | | $ | 2,087,079 | | |
| Analog Devices, Inc. | | | 7,100 | | | | 135,042 | | |
| Broadcom Corp. Class A(a) | | | 11,600 | | | | 196,852 | | |
| Cree, Inc.(a) | | | 29,000 | | | | 460,230 | | |
Fairchild Semiconductor
International, Inc.(a) | | | 4,200 | | | | 20,538 | | |
Integrated Device
Technology, Inc.(a) | | | 6,100 | | | | 34,221 | | |
| Intersil Corp. Class A | | | 80,800 | | | | 742,552 | | |
| KLA-Tencor Corp. | | | 1,600 | | | | 34,864 | | |
| Lam Research Corp.(a) | | | 1,900 | | | | 40,432 | | |
| Linear Technology Corp. | | | 5,400 | | | | 119,448 | | |
Marvell Technology
Group Ltd.(a) | | | 186,100 | | | | 1,241,287 | | |
Maxim Integrated
Products, Inc. | | | 4,200 | | | | 47,964 | | |
MEMC Electronic
Materials, Inc.(a) | | | 4,400 | | | | 62,832 | | |
| Microchip Technology, Inc. | | | 66,400 | | | | 1,296,792 | | |
National
Semiconductor Corp. | | | 6,900 | | | | 69,483 | | |
| ON Semiconductor Corp.(a) | | | 177,000 | | | | 601,800 | | |
| PMC-Sierra, Inc.(a) | | | 125,000 | | | | 607,500 | | |
| QLogic Corp.(a) | | | 5,800 | | | | 77,952 | | |
| Silicon Laboratories, Inc.(a) | | | 3,200 | | | | 79,296 | | |
| Teradyne, Inc.(a) | | | 71,800 | | | | 302,996 | | |
Varian
Semiconductor Equipment
Associates, Inc.(a) | | | 43,600 | | | | 790,032 | | |
| Xilinx, Inc. | | | 95,200 | | | | 1,696,464 | | |
| | | | 10,745,656 | | |
| Software — 3.6% | |
| Activision Blizzard, Inc.(a) | | | 8,800 | | | | 76,032 | | |
| Adobe Systems, Inc.(a) | | | 4,400 | | | | 93,676 | | |
American
Reprographics Co.(a) | | | 5,400 | | | | 37,260 | | |
| Ansys, Inc.(a) | | | 2,400 | | | | 66,936 | | |
| Autodesk, Inc.(a) | | | 59,600 | | | | 1,171,140 | | |
| BMC Software, Inc.(a) | | | 3,600 | | | | 96,876 | | |
| Citrix Systems, Inc.(a) | | | 3,800 | | | | 89,566 | | |
| Dun & Bradstreet Corp. | | | 2,000 | | | | 154,400 | | |
| Electronic Arts, Inc.(a) | | | 6,500 | | | | 104,260 | | |
Fidelity National
Information Services, Inc. | | | 1,500 | | | | 24,405 | | |
| Fiserv, Inc.(a) | | | 50,700 | | | | 1,843,959 | | |
| Intuit, Inc.(a) | | | 7,100 | | | | 168,909 | | |
| MSCI, Inc. Class A(a) | | | 12,000 | | | | 213,120 | | |
| Red Hat, Inc.(a) | | | 109,400 | | | | 1,446,268 | | |
| Salesforce.com, Inc.(a) | | | 36,300 | | | | 1,161,963 | | |
| SEI Investments Co. | | | 3,600 | | | | 56,556 | | |
| | | | 6,805,326 | | |
| | | Number of
Shares | | Value | |
| Telecommunications — 5.9% | |
| Amdocs Ltd.(a) | | | 81,000 | | | $ | 1,481,490 | | |
American Tower Corp.
Class A(a) | | | 76,100 | | | | 2,231,252 | | |
Crown Castle
International Corp.(a) | | | 77,000 | | | | 1,353,660 | | |
| JDS Uniphase Corp.(a) | | | 250,900 | | | | 915,785 | | |
| Juniper Networks, Inc.(a) | | | 139,800 | | | | 2,447,898 | | |
Leap Wireless
International, Inc.(a) | | | 50,800 | | | | 1,366,012 | | |
MetroPCS
Communications, Inc.(a) | | | 63,100 | | | | 937,035 | | |
| NeuStar, Inc. Class A(a) | | | 3,800 | | | | 72,694 | | |
| NII Holdings, Inc.(a) | | | 4,300 | | | | 78,174 | | |
SBA Communications
Corp. Class A(a) | | | 10,200 | | | | 166,464 | | |
| | | | 11,050,464 | | |
| Toys, Games & Hobbies — 0.0% | |
| Mattel, Inc. | | | 4,200 | | | | 67,200 | | |
| Transportation — 0.7% | |
C.H. Robinson
Worldwide, Inc. | | | 4,500 | | | | 247,635 | | |
Expeditors International
of Washington, Inc. | | | 6,700 | | | | 222,909 | | |
| Landstar System, Inc. | | | 5,000 | | | | 192,150 | | |
| UTI Worldwide, Inc. | | | 40,000 | | | | 573,600 | | |
| | | | 1,236,294 | | |
TOTAL COMMON STOCK
(Cost $249,459,517) | | | 177,739,169 | | |
TOTAL EQUITIES
(Cost $249,459,517) | | | 177,739,169 | | |
| WARRANTS — 0.0% | |
| Mining — 0.0% | |
Agnico-Eagle Mines
Ltd., Warrants,
Expires 12/03/13,
Strike 47.25(b) | | | 2,200 | | | | 0 | | |
TOTAL WARRANTS
(Cost $11,000) | | | 0 | | |
TOTAL LONG-TERM
INVESTMENTS
(Cost $249,470,517) | | | 177,739,169 | | |
| | | Principal
Amount | | Value | |
| SHORT-TERM INVESTMENTS — 5.2% | |
| Repurchase Agreement — 5.2% | |
State Street Bank &
Trust Co. Repurchase
Agreement, dated
12/31/08, 0.010%,
due 1/02/09(c) | | $ | 9,665,202 | | | $ | 9,665,202 | | |
TOTAL SHORT-TERM
INVESTMENTS
(Cost $9,665,202) | | | 9,665,202 | | |
TOTAL INVESTMENTS — 99.9%
(Cost $259,135,719)(d) | | | 187,404,371 | | |
Other Assets/
(Liabilities) — 0.1% | | | 238,806 | | |
| NET ASSETS — 100.0% | | $ | 187,643,177 | | |
Notes to Portfolio of Investments
Industry classifications are unaudited.
| ADR - American Depositary Receipt | |
(a) Non-income producing security.
(b) This security is valued in good faith under procedures established by the Board of Trustees.
(c) Maturity value of $9,665,207. Collateralized by U.S. Government Agency obligations with rates ranging from 3.970% - 4.834%, maturity dates ranging from 7/01/35 - 10/01/41, and an aggregate market value, including accrued interest, of $9,861,243.
(d) See Note 6 for aggregate cost for federal tax purposes.
The accompanying notes are an integral part of the financial statements.
95
MML Small/Mid Cap Value Fund – Portfolio of Investments
December 31, 2008
| | | Number of
Shares | | Value | |
| EQUITIES — 91.3% | |
| COMMON STOCK — 91.3% | |
| Agriculture — 2.1% | |
| Bunge Ltd. | | | 25,600 | | | $ | 1,325,312 | | |
| Universal Corp. | | | 59,200 | | | | 1,768,304 | | |
| | | | 3,093,616 | | |
| Airlines — 2.4% | |
| Alaska Air Group, Inc.(a) | | | 50,085 | | | | 1,464,986 | | |
Continental Airlines, Inc.
Class B(a) | | | 65,400 | | | | 1,181,124 | | |
| SkyWest, Inc. | | | 51,100 | | | | 950,460 | | |
| | | | 3,596,570 | | |
| Automotive & Parts — 0.8% | |
| ArvinMeritor, Inc. | | | 198,945 | | | | 566,993 | | |
| Autoliv, Inc. | | | 19,000 | | | | 407,740 | | |
TRW Automotive
Holdings Corp.(a) | | | 48,700 | | | | 175,320 | | |
| | | | 1,150,053 | | |
| Banks — 4.5% | |
Central Pacific
Financial Corp. | | | 11,800 | | | | 118,472 | | |
| Popular, Inc. | | | 104,900 | | | | 541,284 | | |
The South Financial
Group, Inc. | | | 160,600 | | | | 693,792 | | |
Susquehanna
Bancshares, Inc. | | | 60,400 | | | | 960,964 | | |
| Synovus Financial Corp. | | | 69,200 | | | | 574,360 | | |
| Trustmark Corp. | | | 65,500 | | | | 1,414,145 | | |
| Webster Financial Corp. | | | 96,900 | | | | 1,335,282 | | |
| Whitney Holding Corp. | | | 58,300 | | | | 932,217 | | |
| | | | 6,570,516 | | |
| Beverages — 1.0% | |
The Pepsi Bottling
Group, Inc. | | | 62,400 | | | | 1,404,624 | | |
| Building Materials — 0.3% | |
Quanex Building
Products Corp. | | | 55,000 | | | | 515,350 | | |
| Chemicals — 4.0% | |
| Arch Chemicals, Inc. | | | 45,550 | | | | 1,187,489 | | |
| Ashland, Inc. | | | 28,400 | | | | 298,484 | | |
| Celanese Corp. Class A | | | 58,600 | | | | 728,398 | | |
| Chemtura Corp. | | | 336,200 | | | | 470,680 | | |
| Cytec Industries, Inc. | | | 55,800 | | | | 1,184,076 | | |
| Methanex Corp. | | | 20,500 | | | | 230,420 | | |
| | | Number of
Shares | | Value | |
Rockwood
Holdings, Inc.(a) | | | 110,100 | | | $ | 1,189,080 | | |
| Westlake Chemical Corp. | | | 35,800 | | | | 583,182 | | |
| | | | 5,871,809 | | |
| Commercial Services — 2.2% | |
| Convergys Corp.(a) | | | 127,100 | | | | 814,711 | | |
Hertz Global
Holdings, Inc.(a) | | | 143,000 | | | | 725,010 | | |
| Kelly Services, Inc. Class A | | | 130,700 | | | | 1,700,407 | | |
| | | | 3,240,128 | | |
| Computers — 1.9% | |
Lexmark International, Inc.
Class A(a) | | | 35,700 | | | | 960,330 | | |
| SanDisk Corp.(a) | | | 81,300 | | | | 780,480 | | |
| Western Digital Corp.(a) | | | 87,000 | | | | 996,150 | | |
| | | | 2,736,960 | | |
| Distribution & Wholesale — 3.2% | |
Ingram Micro, Inc.
Class A(a) | | | 123,500 | | | | 1,653,665 | | |
| Tech Data Corp.(a) | | | 68,000 | | | | 1,213,120 | | |
| United Stationers, Inc.(a) | | | 54,200 | | | | 1,815,158 | | |
| | | | 4,681,943 | | |
| Electric — 2.7% | |
| Northeast Utilities | | | 97,500 | | | | 2,345,850 | | |
Portland General
Electric Co. | | | 33,425 | | | | 650,785 | | |
| Reliant Energy, Inc.(a) | | | 156,700 | | | | 905,726 | | |
| | | | 3,902,361 | | |
| Electrical Components & Equipment — 0.8% | |
| EnerSys(a) | | | 105,300 | | | | 1,158,300 | | |
| Electronics — 3.4% | |
| Arrow Electronics, Inc.(a) | | | 88,500 | | | | 1,667,340 | | |
AU Optronics Corp.
Sponsored ADR (Taiwan) | | | 134,100 | | | | 1,029,888 | | |
| Avnet, Inc.(a) | | | 44,400 | | | | 808,524 | | |
Benchmark
Electronics, Inc.(a) | | | 75,187 | | | | 960,138 | | |
Vishay
Intertechnology, Inc.(a) | | | 142,400 | | | | 487,008 | | |
| | | | 4,952,898 | | |
| Foods — 6.3% | |
| Del Monte Foods Co. | | | 315,800 | | | | 2,254,812 | | |
| Ruddick Corp. | | | 89,300 | | | | 2,469,145 | | |
| Smithfield Foods, Inc.(a) | | | 140,100 | | | | 1,971,207 | | |
| | | Number of
Shares | | Value | |
| SuperValu, Inc. | | | 92,800 | | | $ | 1,354,880 | | |
| Tyson Foods, Inc. Class A | | | 139,200 | | | | 1,219,392 | | |
| | | | 9,269,436 | | |
| Gas — 1.4% | |
| Atmos Energy Corp. | | | 89,500 | | | | 2,121,150 | | |
| Hand & Machine Tools — 0.6% | |
| Regal-Beloit Corp. | | | 22,800 | | | | 866,172 | | |
| Health Care – Services — 4.7% | |
| AMERIGROUP Corp.(a) | | | 86,400 | | | | 2,550,528 | | |
| LifePoint Hospitals, Inc.(a) | | | 69,500 | | | | 1,587,380 | | |
| Molina Healthcare, Inc.(a) | | | 74,500 | | | | 1,311,945 | | |
Universal Health Services,
Inc. Class B | | | 37,000 | | | | 1,390,090 | | |
| | | | 6,839,943 | | |
| Home Builders — 1.1% | |
| KB Home | | | 12,472 | | | | 169,869 | | |
| Thor Industries, Inc. | | | 111,000 | | | | 1,462,980 | | |
| | | | 1,632,849 | | |
| Insurance — 9.5% | |
| Arch Capital Group Ltd.(a) | | | 31,300 | | | | 2,194,130 | | |
Aspen Insurance
Holdings Ltd. | | | 108,400 | | | | 2,628,700 | | |
Fidelity National Financial,
Inc. Class A | | | 47,800 | | | | 848,450 | | |
Old Republic
International Corp. | | | 128,600 | | | | 1,532,912 | | |
| PartnerRe Ltd. | | | 12,700 | | | | 905,129 | | |
Platinum Underwriters
Holdings Ltd. | | | 70,200 | | | | 2,532,816 | | |
Reinsurance Group of
America, Inc. | | | 19,900 | | | | 852,118 | | |
RenaissanceRe
Holdings Ltd. | | | 10,600 | | | | 546,536 | | |
StanCorp Financial
Group, Inc. | | | 45,800 | | | | 1,913,066 | | |
| | | | 13,953,857 | | |
| Iron & Steel — 1.1% | |
Reliance Steel &
Aluminum Co. | | | 51,900 | | | | 1,034,886 | | |
| Steel Dynamics, Inc. | | | 50,300 | | | | 562,354 | | |
| | | | 1,597,240 | | |
| Leisure Time — 1.1% | |
| Callaway Golf Co. | | | 172,000 | | | | 1,597,880 | | |
| Lodging — 0.5% | |
| Boyd Gaming Corp. | | | 148,900 | | | | 704,297 | | |
(Continued)
The accompanying notes are an integral part of the financial statements.
96
MML Small/Mid Cap Value Fund – Portfolio of Investments (Continued)
| | | Number of
Shares | | Value | |
| Machinery – Construction & Mining — 1.4% | |
| Terex Corp.(a) | | | 121,000 | | | $ | 2,095,720 | | |
| Machinery – Diversified — 1.8% | |
| Briggs & Stratton Corp. | | | 110,700 | | | | 1,947,213 | | |
| Gardner Denver, Inc.(a) | | | 28,600 | | | | 667,524 | | |
| | | | 2,614,737 | | |
| Manufacturing — 2.0% | |
| Acuity Brands, Inc. | | | 27,500 | | | | 960,025 | | |
| AptarGroup, Inc. | | | 47,500 | | | | 1,673,900 | | |
Cooper Industries Ltd.
Class A | | | 12,900 | | | | 377,067 | | |
| | | | 3,010,992 | | |
| Media — 0.3% | |
| Gannett Co., Inc. | | | 62,000 | | | | 496,000 | | |
| Metal Fabricate & Hardware — 2.5% | |
| Commercial Metals Co. | | | 129,300 | | | | 1,534,791 | | |
| Mueller Industries, Inc. | | | 84,028 | | | | 2,107,422 | | |
| | | | 3,642,213 | | |
| Oil & Gas — 4.3% | |
| Cimarex Energy Co. | | | 57,100 | | | | 1,529,138 | | |
| Denbury Resources, Inc.(a) | | | 68,700 | | | | 750,204 | | |
| Frontier Oil Corp. | | | 124,100 | | | | 1,567,383 | | |
| Helmerich & Payne, Inc. | | | 47,900 | | | | 1,089,725 | | |
| Whiting Petroleum Corp.(a) | | | 40,500 | | | | 1,355,130 | | |
| | | | 6,291,580 | | |
| Oil & Gas Services — 0.7% | |
Oil States
International, Inc.(a) | | | 53,100 | | | | 992,439 | | |
| Packaging & Containers — 1.5% | |
| Owens-IIlinois, Inc.(a) | | | 39,500 | | | | 1,079,535 | | |
| Sonoco Products Co. | | | 46,000 | | | | 1,065,360 | | |
| | | | 2,144,895 | | |
| Pharmaceuticals — 1.1% | |
| Omnicare, Inc. | | | 57,600 | | | | 1,598,976 | | |
| Real Estate Investment Trusts (REITS) — 5.3% | |
Alexandria Real Estate
Equities, Inc. | | | 15,900 | | | | 959,406 | | |
| Digital Realty Trust, Inc. | | | 51,400 | | | | 1,688,490 | | |
| Home Properties, Inc. | | | 39,000 | | | | 1,583,400 | | |
Mid-America Apartment
Communities, Inc. | | | 33,700 | | | | 1,252,292 | | |
Sunstone Hotel
Investors, Inc. | | | 87,300 | | | | 540,387 | | |
Tanger Factory Outlet
Centers, Inc. | | | 32,400 | | | | 1,218,888 | | |
| Taubman Centers, Inc. | | | 22,500 | | | | 572,850 | | |
| | | | 7,815,713 | | |
| | | Number of
Shares | | Value | |
| Retail — 4.3% | |
| AutoNation, Inc.(a) | | | 59,600 | | | $ | 588,848 | | |
| Foot Locker, Inc. | | | 167,000 | | | | 1,225,780 | | |
| Insight Enterprises, Inc.(a) | | | 116,700 | | | | 805,230 | | |
| J.C. Penney Co., Inc. | | | 65,400 | | | | 1,288,380 | | |
| Jones Apparel Group, Inc. | | | 29,500 | | | | 172,870 | | |
| Limited Brands, Inc. | | | 73,800 | | | | 740,952 | | |
| Men's Wearhouse, Inc. | | | 112,600 | | | | 1,524,604 | | |
| | | | 6,346,664 | | |
| Savings & Loans — 2.6% | |
| Astoria Financial Corp. | | | 34,100 | | | | 561,968 | | |
First Niagara Financial
Group, Inc. | | | 52,400 | | | | 847,308 | | |
Provident Financial
Services, Inc. | | | 39,000 | | | | 596,700 | | |
| Washington Federal, Inc. | | | 119,800 | | | | 1,792,208 | | |
| | | | 3,798,184 | | |
| Semiconductors — 2.9% | |
| Amkor Technology, Inc.(a) | | | 146,900 | | | | 320,242 | | |
Siliconware Precision
Industries Co. Sponsored
ADR (Taiwan) | | | 401,900 | | | | 1,792,474 | | |
| Teradyne, Inc.(a) | | | 250,500 | | | | 1,057,110 | | |
| Zoran Corp.(a) | | | 157,400 | | | | 1,075,042 | | |
| | | | 4,244,868 | | |
| Telecommunications — 1.1% | |
Anixter
International, Inc.(a) | | | 31,800 | | | | 957,816 | | |
| CommScope, Inc.(a) | | | 40,900 | | | | 635,586 | | |
| | | | 1,593,402 | | |
| Textiles — 0.6% | |
| Mohawk Industries, Inc.(a) | | | 21,300 | | | | 915,261 | | |
| Transportation — 2.0% | |
| Arkansas Best Corp. | | | 46,300 | | | | 1,394,093 | | |
| Con-way, Inc. | | | 37,900 | | | | 1,008,140 | | |
| Werner Enterprises, Inc. | | | 30,600 | | | | 530,604 | | |
| | | | 2,932,837 | | |
| Trucking & Leasing — 1.3% | |
| GATX Corp. | | | 60,600 | | | | 1,876,782 | | |
TOTAL COMMON STOCK
(Cost $201,488,931) | | | 133,869,215 | | |
TOTAL EQUITIES
(Cost $201,488,931) | | | 133,869,215 | | |
TOTAL LONG-TERM
INVESTMENTS
(Cost $201,488,931) | | | 133,869,215 | | |
| | | Principal
Amount | | Value | |
| SHORT-TERM INVESTMENTS — 1.6% | |
| Repurchase Agreement — 1.6% | |
State Street Bank &
Trust Co. Repurchase
Agreement, dated
12/31/08, 0.010%,
due 1/02/09(b) | | $ | 2,451,634 | | | $ | 2,451,634 | | |
TOTAL SHORT-TERM
INVESTMENTS
(Cost $2,451,634) | | | 2,451,634 | | |
TOTAL INVESTMENTS — 92.9%
(Cost $203,940,565)(c) | | | 136,320,849 | | |
Other Assets/
(Liabilities) — 7.1% | | | 10,342,471 | | |
| NET ASSETS — 100.0% | | $ | 146,663,320 | | |
Notes to Portfolio of Investments
Industry classifications are unaudited.
| ADR - American Depositary Receipt | |
(a) Non-income producing security.
(b) Maturity value of $2,451,635. Collateralized by U.S. Government Agency obligations with a rate of 4.755%, maturity date of 5/01/35, and an aggregate market value, including accrued interest, of $2,501,989.
(c) See Note 6 for aggregate cost for federal tax purposes.
The accompanying notes are an integral part of the financial statements.
97
MML Small Cap Index Fund – Portfolio of Investments
December 31, 2008
| | | Number of
Shares | | Value | |
| EQUITIES — 98.0% | |
| COMMON STOCK — 98.0% | |
| Advertising — 0.1% | |
| inVentiv Health, Inc.(a) | | | 3,471 | | | $ | 40,056 | | |
| Aerospace & Defense — 2.8% | |
| AAR Corp.(a) | | | 4,052 | | | | 74,597 | | |
| Cubic Corp. | | | 1,600 | | | | 43,520 | | |
| Curtiss-Wright Corp. | | | 4,740 | | | | 158,268 | | |
Esterline
Technologies Corp.(a) | | | 3,119 | | | | 118,179 | | |
| GenCorp, Inc.(a) | | | 5,204 | | | | 19,151 | | |
| Kaman Corp. | | | 2,631 | | | | 47,700 | | |
| Moog, Inc. Class A(a) | | | 4,491 | | | | 164,236 | | |
| Orbital Sciences Corp.(a) | | | 6,202 | | | | 121,125 | | |
Teledyne
Technologies, Inc.(a) | | | 3,711 | | | | 165,325 | | |
| Triumph Group, Inc. | | | 1,739 | | | | 73,838 | | |
| | | | 985,939 | | |
| Agriculture — 0.2% | |
Alliance One
International, Inc.(a) | | | 9,505 | | | | 27,945 | | |
| The Andersons, Inc. | | | 1,929 | | | | 31,790 | | |
| | | | 59,735 | | |
| Airlines — 0.3% | |
| SkyWest, Inc. | | | 6,000 | | | | 111,600 | | |
| Apparel — 1.7% | |
| Carter's, Inc.(a) | | | 5,900 | | | | 113,634 | | |
| Crocs, Inc.(a) | | | 8,789 | | | | 10,898 | | |
| Deckers Outdoor Corp.(a) | | | 1,313 | | | | 104,869 | | |
Iconix Brand
Group, Inc.(a) | | | 6,093 | | | | 59,590 | | |
| K-Swiss, Inc. Class A | | | 2,821 | | | | 32,159 | | |
Maidenform
Brands, Inc.(a) | | | 2,000 | | | | 20,300 | | |
| Oxford Industries, Inc. | | | 1,400 | | | | 12,278 | | |
Perry Ellis
International, Inc.(a) | | | 1,235 | | | | 7,830 | | |
| Quiksilver, Inc.(a) | | | 13,395 | | | | 24,647 | | |
Skechers U.S.A., Inc.
Class A(a) | | | 3,490 | | | | 44,742 | | |
True Religion
Apparel, Inc.(a) | | | 1,900 | | | | 23,636 | | |
| Volcom, Inc.(a) | | | 1,638 | | | | 17,854 | | |
Wolverine World
Wide, Inc. | | | 5,185 | | | | 109,093 | | |
| | | | 581,530 | | |
| | | Number of
Shares | | Value | |
| Auto Manufacturers — 0.0% | |
| Wabash National Corp. | | | 3,200 | | | $ | 14,400 | | |
| Automotive & Parts — 0.2% | |
| ATC Technology Corp.(a) | | | 2,187 | | | | 31,996 | | |
| Spartan Motors, Inc. | | | 3,400 | | | | 16,082 | | |
Standard Motor
Products, Inc. | | | 1,300 | | | | 4,498 | | |
Superior Industries
International, Inc. | | | 2,428 | | | | 25,542 | | |
| | | | 78,118 | | |
| Banks — 8.5% | |
| Bank Mutual Corp. | | | 5,100 | | | | 58,854 | | |
Boston Private
Financial Holdings, Inc. | | | 6,650 | | | | 45,486 | | |
| Cascade Bancorp | | | 2,900 | | | | 19,575 | | |
Central Pacific
Financial Corp. | | | 3,000 | | | | 30,120 | | |
Columbia Banking
System, Inc. | | | 1,900 | | | | 22,667 | | |
Community Bank
System, Inc. | | | 3,312 | | | | 80,780 | | |
| Corus Bankshares, Inc. | | | 3,283 | | | | 3,644 | | |
| East West Bancorp, Inc. | | | 6,642 | | | | 106,073 | | |
| First Bancorp | | | 7,996 | | | | 89,075 | | |
First Commonwealth
Financial Corp. | | | 7,700 | | | | 95,326 | | |
| First Financial Bancorp | | | 3,300 | | | | 40,887 | | |
First Financial
Bankshares, Inc. | | | 2,200 | | | | 121,462 | | |
First Midwest
Bancorp, Inc. | | | 5,036 | | | | 100,569 | | |
| Frontier Financial Corp. | | | 5,010 | | | | 21,844 | | |
| Glacier Bancorp, Inc. | | | 6,199 | | | | 117,905 | | |
| Hancock Holding Co. | | | 2,510 | | | | 114,105 | | |
| Hanmi Financial Corp. | | | 3,900 | | | | 8,034 | | |
| Home Bancshares, Inc. | | | 1,400 | | | | 37,730 | | |
| Independent Bank Corp. | | | 2,120 | | | | 4,579 | | |
| Independent Bank Corp. | | | 1,700 | | | | 44,472 | | |
| Irwin Financial Corp.(a) | | | 2,000 | | | | 2,580 | | |
| Nara Bancorp, Inc. | | | 2,300 | | | | 22,609 | | |
National Penn
Bancshares, Inc. | | | 8,353 | | | | 121,202 | | |
| Old National Bancorp | | | 6,898 | | | | 125,268 | | |
| PrivateBancorp, Inc. | | | 2,802 | | | | 90,953 | | |
| Prosperity Bancshares, Inc. | | | 4,409 | | | | 130,462 | | |
Provident
Bankshares Corp. | | | 3,511 | | | | 33,916 | | |
| S&T Bancorp, Inc. | | | 2,500 | | | | 88,750 | | |
| Signature Bank(a) | | | 3,662 | | | | 105,063 | | |
| | | Number of
Shares | | Value | |
The South Financial
Group, Inc. | | | 7,713 | | | $ | 33,320 | | |
| Sterling Bancorp | | | 1,900 | | | | 26,657 | | |
| Sterling Bancshares, Inc. | | | 7,641 | | | | 46,457 | | |
| Sterling Financial Corp. | | | 5,454 | | | | 47,995 | | |
Susquehanna
Bancshares, Inc. | | | 8,974 | | | | 142,776 | | |
| Tompkins Financial Corp. | | | 699 | | | | 40,507 | | |
| Trustco Bank Corp. NY | | | 7,900 | | | | 75,129 | | |
| UCBH Holdings, Inc. | | | 11,542 | | | | 79,409 | | |
| UMB Financial Corp. | | | 3,038 | | | | 149,287 | | |
| Umpqua Holdings Corp. | | | 6,354 | | | | 91,942 | | |
| United Bankshares, Inc. | | | 3,922 | | | | 130,289 | | |
| United Community Banks | | | 4,321 | | | | 58,679 | | |
| Whitney Holding Corp. | | | 6,826 | | | | 109,148 | | |
| Wilshire Bancorp, Inc. | | | 2,057 | | | | 18,678 | | |
| Wintrust Financial Corp. | | | 2,476 | | | | 50,931 | | |
| | | | 2,985,194 | | |
| Beverages — 0.4% | |
Boston Beer Co., Inc.
Class A(a) | | | 1,000 | | | | 28,400 | | |
Green Mountain
Coffee Roasters, Inc.(a) | | | 1,852 | | | | 71,672 | | |
| Peet's Coffee & Tea, Inc.(a) | | | 1,200 | | | | 27,900 | | |
| | | | 127,972 | | |
| Biotechnology — 1.1% | |
| Arqule, Inc.(a) | | | 3,000 | | | | 12,660 | | |
| Cambrex Corp.(a) | | | 3,000 | | | | 13,860 | | |
| CryoLife, Inc.(a) | | | 2,926 | | | | 28,411 | | |
| Enzo Biochem, Inc.(a) | | | 3,400 | | | | 16,626 | | |
Integra LifeSciences
Holdings Corp.(a) | | | 2,036 | | | | 72,421 | | |
| Martek Biosciences Corp. | | | 3,496 | | | | 105,964 | | |
Regeneron
Pharmaceuticals, Inc.(a) | | | 6,536 | | | | 120,001 | | |
| | | | 369,943 | | |
| Building Materials — 1.9% | |
| Apogee Enterprises, Inc. | | | 3,005 | | | | 31,132 | | |
| Drew Industries, Inc.(a) | | | 2,067 | | | | 24,804 | | |
| Eagle Materials, Inc. | | | 4,600 | | | | 84,686 | | |
| Gibraltar Industries, Inc. | | | 2,847 | | | | 33,993 | | |
| Lennox International, Inc. | | | 4,948 | | | | 159,771 | | |
NCI Building
Systems, Inc.(a) | | | 2,074 | | | | 33,806 | | |
Quanex Building
Products Corp. | | | 3,974 | | | | 37,236 | | |
Simpson Manufacturing
Co., Inc. | | | 3,906 | | | | 108,431 | | |
(Continued)
The accompanying notes are an integral part of the financial statements.
98
MML Small Cap Index Fund – Portfolio of Investments (Continued)
| | | Number of
Shares | | Value | |
| Texas Industries, Inc. | | | 2,875 | | | $ | 99,187 | | |
Universal Forest
Products, Inc. | | | 1,724 | | | | 46,393 | | |
| | | | 659,439 | | |
| Chemicals — 1.4% | |
| Arch Chemicals, Inc. | | | 2,617 | | | | 68,225 | | |
| Balchem Corp. | | | 1,900 | | | | 47,329 | | |
| Georgia Gulf Corp. | | | 3,188 | | | | 3,411 | | |
| H.B. Fuller Co. | | | 5,082 | | | | 81,871 | | |
| NewMarket Corp. | | | 1,325 | | | | 46,256 | | |
| OM Group, Inc.(a) | | | 3,172 | | | | 66,961 | | |
| Penford Corp. | | | 1,200 | | | | 12,144 | | |
| PolyOne Corp.(a) | | | 9,865 | | | | 31,075 | | |
| Quaker Chemical Corp. | | | 1,100 | | | | 18,095 | | |
| Schulman (A.), Inc. | | | 2,800 | | | | 47,600 | | |
| Stepan Co. | | | 775 | | | | 36,417 | | |
| Zep, Inc. | | | 2,200 | | | | 42,482 | | |
| | | | 501,866 | | |
| Commercial Services — 6.1% | |
| Aaron Rents, Inc. | | | 5,545 | | | | 147,608 | | |
| ABM Industries, Inc. | | | 4,641 | | | | 88,411 | | |
| Administaff, Inc. | | | 2,253 | | | | 48,845 | | |
AMN Healthcare
Services, Inc.(a) | | | 3,478 | | | | 29,424 | | |
| Arbitron, Inc. | | | 2,724 | | | | 36,175 | | |
| Bankrate, Inc.(a) | | | 1,518 | | | | 57,684 | | |
| Bowne & Co., Inc. | | | 2,838 | | | | 16,687 | | |
| Capella Education Co.(a) | | | 1,500 | | | | 88,140 | | |
| CDI Corp. | | | 1,326 | | | | 17,158 | | |
| Chemed Corp. | | | 2,335 | | | | 92,863 | | |
| Coinstar, Inc.(a) | | | 2,997 | | | | 58,472 | | |
Consolidated
Graphics, Inc.(a) | | | 1,142 | | | | 25,855 | | |
| Corvel Corp.(a) | | | 866 | | | | 19,035 | | |
Cross Country
Healthcare, Inc.(a) | | | 3,200 | | | | 28,128 | | |
Forrester
Research, Inc.(a) | | | 1,600 | | | | 45,136 | | |
| The Geo Group, Inc.(a) | | | 5,400 | | | | 97,362 | | |
| Gevity HR, Inc. | | | 2,500 | | | | 3,775 | | |
Healthcare Services
Group, Inc. | | | 4,496 | | | | 71,621 | | |
| Healthspring, Inc.(a) | | | 5,180 | | | | 103,445 | | |
Heartland Payment
Systems, Inc. | | | 2,600 | | | | 45,500 | | |
Heidrick & Struggles
International, Inc. | | | 1,723 | | | | 37,113 | | |
| Hillenbrand, Inc. | | | 6,556 | | | | 109,354 | | |
| HMS Holdings Corp.(a) | | | 2,688 | | | | 84,726 | | |
Kendle
International, Inc.(a) | | | 1,352 | | | | 34,774 | | |
| Landauer, Inc. | | | 1,000 | | | | 73,300 | | |
| Live Nation, Inc.(a) | | | 8,053 | | | | 46,224 | | |
| | | Number of
Shares | | Value | |
| Maximus, Inc. | | | 1,893 | | | $ | 66,463 | | |
| Midas, Inc.(a) | | | 1,500 | | | | 15,735 | | |
| On Assignment, Inc.(a) | | | 3,700 | | | | 20,979 | | |
PAREXEL
International Corp.(a) | | | 5,773 | | | | 56,056 | | |
Pre-Paid Legal
Services, Inc.(a) | | | 839 | | | | 31,286 | | |
| Rewards Network, Inc.(a) | | | 2,600 | | | | 6,734 | | |
| Spherion Corp.(a) | | | 5,600 | | | | 12,376 | | |
| Startek, Inc.(a) | | | 1,400 | | | | 6,230 | | |
| Ticketmaster(a) | | | 4,100 | | | | 26,322 | | |
| TrueBlue, Inc.(a) | | | 4,534 | | | | 43,390 | | |
Universal Technical
Institute, Inc.(a) | | | 2,270 | | | | 38,976 | | |
| Viad Corp. | | | 2,127 | | | | 52,622 | | |
Volt Information
Sciences, Inc.(a) | | | 1,400 | | | | 10,122 | | |
Watson Wyatt Worldwide,
Inc. Class A | | | 4,432 | | | | 211,938 | | |
| Wright Express Corp.(a) | | | 4,066 | | | | 51,232 | | |
| | | | 2,157,276 | | |
| Computers — 1.8% | |
| Agilysys, Inc. | | | 2,393 | | | | 10,266 | | |
CACI International, Inc.
Class A(a) | | | 3,144 | | | | 141,763 | | |
Catapult
Communications Corp.(a) | | | 982 | | | | 6,452 | | |
| Ciber, Inc.(a) | | | 5,600 | | | | 26,936 | | |
Hutchinson
Technology, Inc.(a) | | | 2,421 | | | | 8,425 | | |
| Integral Systems, Inc.(a) | | | 1,800 | | | | 21,690 | | |
Manhattan
Associates, Inc.(a) | | | 2,463 | | | | 38,940 | | |
Mercury Computer
Systems, Inc.(a) | | | 2,400 | | | | 15,144 | | |
| MICROS Systems, Inc.(a) | | | 8,365 | | | | 136,517 | | |
| MTS Systems Corp. | | | 1,769 | | | | 47,126 | | |
| Radiant Systems, Inc.(a) | | | 2,900 | | | | 9,773 | | |
| RadiSys Corp.(a) | | | 2,400 | | | | 13,272 | | |
| Stratasys, Inc.(a) | | | 2,200 | | | | 23,650 | | |
| SYKES Enterprises, Inc.(a) | | | 3,466 | | | | 66,270 | | |
| Synaptics, Inc.(a) | | | 3,550 | | | | 58,788 | | |
| | | | 625,012 | | |
| Cosmetics & Personal Care — 0.4% | |
| Chattem, Inc.(a) | | | 2,021 | | | | 144,562 | | |
| Distribution & Wholesale — 1.8% | |
| Brightpoint, Inc.(a) | | | 5,372 | | | | 23,368 | | |
| Fossil, Inc.(a) | | | 4,720 | | | | 78,824 | | |
MWI Veterinary
Supply, Inc.(a) | | | 1,300 | | | | 35,048 | | |
| Owens & Minor, Inc. | | | 4,394 | | | | 165,434 | | |
| Pool Corp. | | | 5,001 | | | | 89,868 | | |
| | | Number of
Shares | | Value | |
| ScanSource, Inc.(a) | | | 2,726 | | | $ | 52,530 | | |
| United Stationers, Inc.(a) | | | 2,407 | | | | 80,611 | | |
| Watsco, Inc. | | | 2,971 | | | | 114,086 | | |
| | | | 639,769 | | |
| Diversified Financial — 2.1% | |
| Financial Federal Corp. | | | 2,658 | | | | 61,852 | | |
| Greenhill & Co., Inc. | | | 1,900 | | | | 132,563 | | |
Investment Technology
Group, Inc.(a) | | | 4,625 | | | | 105,080 | | |
| LaBranche & Co., Inc.(a) | | | 5,513 | | | | 26,407 | | |
National Financial
Partners Corp. | | | 4,247 | | | | 12,911 | | |
| optionsXpress Holdings, Inc. | | | 4,400 | | | | 58,784 | | |
| Piper Jaffray Cos.(a) | | | 1,565 | | | | 62,224 | | |
Portfolio Recovery
Associates, Inc.(a) | | | 1,620 | | | | 54,821 | | |
| Stifel Financial Corp.(a) | | | 2,726 | | | | 124,987 | | |
| SWS Group, Inc. | | | 2,879 | | | | 54,557 | | |
TradeStation
Group, Inc.(a) | | | 3,333 | | | | 21,498 | | |
World
Acceptance Corp.(a) | | | 1,722 | | | | 34,027 | | |
| | | | 749,711 | | |
| Electric — 2.1% | |
| Allete, Inc. | | | 2,708 | | | | 87,387 | | |
| Avista Corp. | | | 5,657 | | | | 109,633 | | |
Central Vermont Public
Service Corp. | | | 1,200 | | | | 28,632 | | |
| CH Energy Group, Inc. | | | 1,700 | | | | 87,363 | | |
| Cleco Corp. | | | 6,372 | | | | 145,473 | | |
| El Paso Electric Co.(a) | | | 4,662 | | | | 84,335 | | |
| UIL Holdings Corp. | | | 2,666 | | | | 80,060 | | |
| Unisource Energy Corp. | | | 3,725 | | | | 109,366 | | |
| | | | 732,249 | | |
| Electrical Components & Equipment — 0.8% | |
Advanced Energy
Industries, Inc.(a) | | | 3,424 | | | | 34,069 | | |
| Belden, Inc. | | | 4,871 | | | | 101,707 | | |
| C&D Technologies, Inc.(a) | | | 2,741 | | | | 8,579 | | |
| Greatbatch, Inc.(a) | | | 2,400 | | | | 63,504 | | |
| Littelfuse, Inc.(a) | | | 2,300 | | | | 38,180 | | |
| Magnetek, Inc.(a) | | | 3,700 | | | | 8,880 | | |
| Vicor Corp. | | | 2,000 | | | | 13,220 | | |
| | | | 268,139 | | |
| Electronics — 3.8% | |
| Analogic Corp. | | | 1,389 | | | | 37,892 | | |
Axsys
Technologies, Inc.(a) | | | 971 | | | | 53,269 | | |
| Bel Fuse, Inc. Class B | | | 1,300 | | | | 27,560 | | |
Benchmark
Electronics, Inc.(a) | | | 6,850 | | | | 87,475 | | |
(Continued)
The accompanying notes are an integral part of the financial statements.
99
MML Small Cap Index Fund – Portfolio of Investments (Continued)
| | | Number of
Shares | | Value | |
| Brady Corp. Class A | | | 5,488 | | | $ | 131,438 | | |
Checkpoint
Systems, Inc.(a) | | | 4,021 | | | | 39,567 | | |
| CTS Corp. | | | 3,500 | | | | 19,285 | | |
| Cymer, Inc.(a) | | | 3,051 | | | | 66,847 | | |
| Daktronics, Inc. | | | 3,554 | | | | 33,265 | | |
| Dionex Corp.(a) | | | 1,836 | | | | 82,345 | | |
Electro Scientific
Industries, Inc.(a) | | | 2,800 | | | | 19,012 | | |
| Faro Technologies, Inc.(a) | | | 1,766 | | | | 29,775 | | |
| FEI Co.(a) | | | 3,854 | | | | 72,687 | | |
| II-VI, Inc.(a) | | | 2,516 | | | | 48,030 | | |
| Itron, Inc.(a) | | | 3,619 | | | | 230,675 | | |
| Keithley Instruments, Inc. | | | 1,600 | | | | 5,840 | | |
| Lo-Jack Corp.(a) | | | 2,000 | | | | 8,240 | | |
| Methode Electronics, Inc. | | | 4,000 | | | | 26,960 | | |
| Newport Corp.(a) | | | 3,800 | | | | 25,764 | | |
| Park Electrochemical Corp. | | | 2,144 | | | | 40,650 | | |
| Plexus Corp.(a) | | | 4,081 | | | | 69,173 | | |
| Rogers Corp.(a) | | | 1,901 | | | | 52,791 | | |
| Sonic Solutions, Inc.(a) | | | 2,800 | | | | 4,928 | | |
| Technitrol, Inc. | | | 4,378 | | | | 15,235 | | |
| TTM Technologies, Inc.(a) | | | 4,454 | | | | 23,205 | | |
Watts Water Technologies,
Inc. Class A | | | 3,055 | | | | 76,283 | | |
| | | | 1,328,191 | | |
| Energy – Alternate Sources — 0.1% | |
| Headwaters, Inc.(a) | | | 4,399 | | | | 29,693 | | |
| Engineering & Construction — 0.6% | |
| Emcor Group, Inc.(a) | | | 6,850 | | | | 153,645 | | |
Insituform Technologies, Inc.
Class A(a) | | | 2,920 | | | | 57,495 | | |
| | | | 211,140 | | |
| Entertainment — 0.2% | |
Pinnacle
Entertainment, Inc.(a) | | | 6,241 | | | | 47,931 | | |
| Shuffle Master, Inc.(a) | | | 5,894 | | | | 29,234 | | |
| | | | 77,165 | | |
| Environmental Controls — 0.8% | |
| Calgon Carbon Corp.(a) | | | 5,664 | | | | 86,999 | | |
Darling
International, Inc.(a) | | | 8,513 | | | | 46,736 | | |
TETRA
Technologies, Inc.(a) | | | 6,263 | | | | 151,252 | | |
| | | | 284,987 | | |
| Foods — 1.8% | |
| Cal-Maine Foods, Inc. | | | 1,300 | | | | 37,310 | | |
| Diamond Foods, Inc. | | | 1,700 | | | | 34,255 | | |
Great Atlantic &
Pacific Tea Co.(a) | | | 3,168 | | | | 19,863 | | |
| | | Number of
Shares | | Value | |
Hain Celestial
Group, Inc.(a) | | | 4,198 | | | $ | 80,140 | | |
| J&J Snack Foods Corp. | | | 1,500 | | | | 53,820 | | |
| Lance, Inc. | | | 3,332 | | | | 76,436 | | |
| Nash Finch Co. | | | 1,341 | | | | 60,198 | | |
| Sanderson Farms, Inc. | | | 1,823 | | | | 63,003 | | |
| Spartan Stores, Inc. | | | 2,253 | | | | 52,382 | | |
| TreeHouse Foods, Inc.(a) | | | 3,335 | | | | 90,845 | | |
United Natural
Foods, Inc.(a) | | | 4,453 | | | | 79,353 | | |
| | | | 647,605 | | |
| Forest Products & Paper — 0.9% | |
Buckeye
Technologies, Inc.(a) | | | 4,100 | | | | 14,924 | | |
| Clearwater Paper Corp.(a) | | | 1,200 | | | | 10,068 | | |
| Deltic Timber Corp. | | | 1,118 | | | | 51,149 | | |
| Neenah Paper, Inc. | | | 1,508 | | | | 13,331 | | |
| Rock-Tenn Co. Class A | | | 4,024 | | | | 137,540 | | |
Schweitzer-Mauduit
International, Inc. | | | 1,600 | | | | 32,032 | | |
| Wausau Paper Corp. | | | 5,100 | | | | 58,344 | | |
| | | | 317,388 | | |
| Gas — 3.2% | |
| Atmos Energy Corp. | | | 9,687 | | | | 229,582 | | |
| The Laclede Group, Inc. | | | 2,268 | | | | 106,233 | | |
New Jersey
Resources Corp. | | | 4,469 | | | | 175,855 | | |
| Northwest Natural Gas Co. | | | 2,738 | | | | 121,102 | | |
Piedmont Natural
Gas Co., Inc. | | | 7,750 | | | | 245,442 | | |
South Jersey
Industries, Inc. | | | 3,088 | | | | 123,057 | | |
| Southwest Gas Corp. | | | 4,514 | | | | 113,843 | | |
| | | | 1,115,114 | | |
| Hand & Machine Tools — 0.6% | |
| Baldor Electric Co. | | | 4,882 | | | | 87,144 | | |
| Regal-Beloit Corp. | | | 3,364 | | | | 127,798 | | |
| | | | 214,942 | | |
| Health Care – Products — 4.4% | |
| Abaxis, Inc.(a) | | | 2,315 | | | | 37,109 | | |
American Medical Systems
Holdings, Inc.(a) | | | 7,666 | | | | 68,917 | | |
| ArthroCare Corp.(a) | | | 2,778 | | | | 13,251 | | |
| CONMED Corp.(a) | | | 2,956 | | | | 70,767 | | |
| Cyberonics, Inc.(a) | | | 2,415 | | | | 40,017 | | |
| Datascope Corp. | | | 1,374 | | | | 71,778 | | |
| Haemonetics Corp.(a) | | | 2,665 | | | | 150,573 | | |
| ICU Medical, Inc.(a) | | | 1,317 | | | | 43,645 | | |
| Immucor, Inc.(a) | | | 7,394 | | | | 196,533 | | |
| Invacare Corp. | | | 3,295 | | | | 51,138 | | |
| Kensey Nash Corp.(a) | | | 1,200 | | | | 23,292 | | |
| | | Number of
Shares | | Value | |
| LCA-Vision, Inc. | | | 1,977 | | | $ | 8,125 | | |
| Mentor Corp. | | | 3,629 | | | | 112,245 | | |
| Meridian Bioscience, Inc. | | | 4,243 | | | | 108,069 | | |
Merit Medical
Systems, Inc.(a) | | | 2,912 | | | | 52,212 | | |
| Natus Medical, Inc.(a) | | | 2,900 | | | | 37,555 | | |
| Osteotech, Inc.(a) | | | 2,100 | | | | 3,549 | | |
Palomar Medical
Technologies, Inc.(a) | | | 1,900 | | | | 21,907 | | |
| PSS World Medical, Inc.(a) | | | 6,441 | | | | 121,220 | | |
| SurModics, Inc.(a) | | | 1,530 | | | | 38,663 | | |
| Symmetry Medical, Inc.(a) | | | 3,756 | | | | 29,935 | | |
| The Cooper Cos., Inc. | | | 4,665 | | | | 76,506 | | |
West Pharmaceutical
Services, Inc. | | | 3,384 | | | | 127,814 | | |
| Zoll Medical Corp.(a) | | | 2,225 | | | | 42,030 | | |
| | | | 1,546,850 | | |
| Health Care – Services — 3.2% | |
| Air Methods Corp.(a) | | | 1,118 | | | | 17,877 | | |
| Amedisys, Inc.(a) | | | 2,862 | | | | 118,315 | | |
| AMERIGROUP Corp.(a) | | | 5,574 | | | | 164,544 | | |
| AmSurg Corp.(a) | | | 3,256 | | | | 75,995 | | |
| Centene Corp.(a) | | | 4,473 | | | | 88,163 | | |
Gentiva Health
Services, Inc.(a) | | | 2,992 | | | | 87,546 | | |
| Healthways, Inc.(a) | | | 3,485 | | | | 40,008 | | |
| LHC Group, Inc.(a) | | | 1,542 | | | | 55,512 | | |
Magellan Health
Services, Inc.(a) | | | 4,190 | | | | 164,080 | | |
| Medcath Corp.(a) | | | 2,036 | | | | 21,256 | | |
| Molina Healthcare, Inc.(a) | | | 1,500 | | | | 26,415 | | |
Odyssey
Healthcare, Inc.(a) | | | 3,400 | | | | 31,450 | | |
Pediatrix Medical
Group, Inc.(a) | | | 4,779 | | | | 151,494 | | |
| RehabCare Group, Inc.(a) | | | 1,880 | | | | 28,501 | | |
| Res-Care, Inc.(a) | | | 2,700 | | | | 40,554 | | |
| | | | 1,111,710 | | |
| Home Builders — 0.3% | |
Champion
Enterprises, Inc.(a) | | | 8,313 | | | | 4,655 | | |
| M/I Homes, Inc. | | | 1,415 | | | | 14,914 | | |
| Meritage Home Corp.(a) | | | 3,215 | | | | 39,127 | | |
| Skyline Corp. | | | 700 | | | | 13,993 | | |
| Standard Pacific Corp.(a) | | | 9,680 | | | | 17,230 | | |
| Winnebago Industries, Inc. | | | 3,053 | | | | 18,410 | | |
| | | | 108,329 | | |
| Home Furnishing — 0.3% | |
| Audiovox Corp. Class A(a) | | | 1,900 | | | | 9,519 | | |
Bassett Furniture
Industries, Inc. | | | 1,300 | | | | 4,355 | | |
(Continued)
The accompanying notes are an integral part of the financial statements.
100
MML Small Cap Index Fund – Portfolio of Investments (Continued)
| | | Number of
Shares | | Value | |
| Ethan Allen Interiors, Inc. | | | 2,986 | | | $ | 42,909 | | |
| La-Z-Boy, Inc. | | | 5,500 | | | | 11,935 | | |
Universal
Electronics, Inc.(a) | | | 1,504 | | | | 24,395 | | |
| | | | 93,113 | | |
| Household Products — 0.3% | |
Central Garden & Pet Co.
Class A(a) | | | 7,500 | | | | 44,250 | | |
| Russ Berrie & Co., Inc.(a) | | | 1,700 | | | | 5,049 | | |
| The Standard Register Co. | | | 1,300 | | | | 11,609 | | |
| WD-40 Co. | | | 1,768 | | | | 50,017 | | |
| | | | 110,925 | | |
| Housewares — 0.5% | |
National Presto
Industries, Inc. | | | 545 | | | | 41,965 | | |
| The Toro Co. | | | 3,755 | | | | 123,915 | | |
| | | | 165,880 | | |
| Insurance — 3.2% | |
American Physicians
Capital, Inc. | | | 843 | | | | 40,549 | | |
| Amerisafe, Inc.(a) | | | 2,000 | | | | 41,060 | | |
Delphi Financial Group,
Inc. Class A | | | 4,332 | | | | 79,882 | | |
Infinity Property &
Casualty Corp. | | | 1,516 | | | | 70,843 | | |
| Navigators Group, Inc.(a) | | | 1,364 | | | | 74,897 | | |
| Presidential Life Corp. | | | 2,200 | | | | 21,758 | | |
| ProAssurance Corp.(a) | | | 3,549 | | | | 187,316 | | |
| RLI Corp. | | | 1,814 | | | | 110,944 | | |
Safety Insurance
Group, Inc. | | | 1,700 | | | | 64,702 | | |
| Selective Insurance Group | | | 5,542 | | | | 127,078 | | |
Stewart Information
Services Corp. | | | 1,863 | | | | 43,762 | | |
| Tower Group, Inc. | | | 2,143 | | | | 60,454 | | |
| United Fire & Casualty Co. | | | 2,398 | | | | 74,506 | | |
Zenith National
Insurance Corp. | | | 3,925 | | | | 123,912 | | |
| | | | 1,121,663 | | |
| Internet — 1.8% | |
Blue Coat
Systems, Inc.(a) | | | 4,119 | | | | 34,600 | | |
| Blue Nile, Inc.(a) | | | 1,479 | | | | 36,221 | | |
| CyberSources Corp.(a) | | | 7,299 | | | | 87,515 | | |
DealerTrack
Holdings, Inc.(a) | | | 4,178 | | | | 49,676 | | |
| InfoSpace, Inc. | | | 3,600 | | | | 27,180 | | |
| Interwoven, Inc.(a) | | | 4,800 | | | | 60,480 | | |
j2 Global
Communications, Inc.(a) | | | 4,606 | | | | 92,304 | | |
| The Knot, Inc.(a) | | | 3,053 | | | | 25,401 | | |
| | | Number of
Shares | | Value | |
| NutriSystem, Inc. | | | 3,116 | | | $ | 45,463 | | |
| PC-Tel, Inc. | | | 2,000 | | | | 13,140 | | |
| Perficient, Inc.(a) | | | 3,382 | | | | 16,166 | | |
| Stamps.com, Inc.(a) | | | 1,500 | | | | 14,745 | | |
| United Online, Inc. | | | 8,541 | | | | 51,844 | | |
| Websense, Inc.(a) | | | 4,721 | | | | 70,673 | | |
| | | | 625,408 | | |
| Iron & Steel — 0.1% | |
| Olympic Steel, Inc. | | | 902 | | | | 18,374 | | |
| Leisure Time — 0.9% | |
| Arctic Cat, Inc. | | | 1,300 | | | | 6,227 | | |
| Brunswick Corp. | | | 9,193 | | | | 38,703 | | |
Interval Leisure
Group, Inc.(a) | | | 4,100 | | | | 22,099 | | |
Multimedia
Games, Inc.(a) | | | 2,500 | | | | 5,950 | | |
| Nautilus, Inc.(a) | | | 2,500 | | | | 5,525 | | |
| Polaris Industries, Inc. | | | 3,342 | | | | 95,748 | | |
| WMS Industries, Inc.(a) | | | 5,229 | | | | 140,660 | | |
| | | | 314,912 | | |
| Lodging — 0.1% | |
| Marcus Corp. | | | 2,200 | | | | 35,706 | | |
Monarch Casino &
Resort, Inc.(a) | | | 1,200 | | | | 13,980 | | |
| | | | 49,686 | | |
| Machinery – Construction & Mining — 0.2% | |
| Astec Industries, Inc.(a) | | | 2,047 | | | | 64,132 | | |
| Machinery – Diversified — 1.7% | |
Albany International Corp.
Class A | | | 2,812 | | | | 36,106 | | |
Applied Industrial
Technologies, Inc. | | | 3,796 | | | | 71,820 | | |
| Briggs & Stratton Corp. | | | 5,232 | | | | 92,031 | | |
| Cascade Corp. | | | 900 | | | | 26,874 | | |
| Cognex Corp. | | | 4,088 | | | | 60,502 | | |
| Gardner Denver, Inc.(a) | | | 5,494 | | | | 128,230 | | |
| Gerber Scientific, Inc.(a) | | | 2,500 | | | | 12,775 | | |
| Intermec, Inc.(a) | | | 5,100 | | | | 67,728 | | |
| Intevac, Inc.(a) | | | 2,253 | | | | 11,423 | | |
| Lindsay Corp. | | | 1,288 | | | | 40,946 | | |
| Robbins & Myers, Inc. | | | 3,624 | | | | 58,600 | | |
| | | | 607,035 | | |
| Manufacturing — 2.4% | |
| A.O. Smith Corp. | | | 2,304 | | | | 68,014 | | |
| Actuant Corp. Class A | | | 5,900 | | | | 112,218 | | |
| Acuity Brands, Inc. | | | 4,200 | | | | 146,622 | | |
| Barnes Group, Inc. | | | 4,500 | | | | 65,250 | | |
| Ceradyne, Inc.(a) | | | 2,700 | | | | 54,837 | | |
| Clarcor, Inc. | | | 5,377 | | | | 178,409 | | |
| EnPro Industries, Inc.(a) | | | 2,149 | | | | 46,289 | | |
| | | Number of
Shares | | Value | |
| Griffon Corp.(a) | | | 4,976 | | | $ | 46,426 | | |
John Bean
Technologies Corp. | | | 2,900 | | | | 23,693 | | |
| Lydall, Inc.(a) | | | 1,800 | | | | 10,350 | | |
| Myers Industries, Inc. | | | 3,000 | | | | 24,000 | | |
| Standex International Corp. | | | 1,300 | | | | 25,792 | | |
Sturm, Ruger &
Co., Inc.(a) | | | 2,200 | | | | 13,134 | | |
| Tredegar Corp. | | | 2,000 | | | | 36,360 | | |
| | | | 851,394 | | |
| Media — 0.0% | |
4 Kids
Entertainment, Inc.(a) | | | 1,400 | | | | 2,744 | | |
| AH Belo Corp. Class A | | | 1,800 | | | | 3,924 | | |
The E.W.
Scripps Co. Class A | | | 3,166 | | | | 6,997 | | |
| | | | 13,665 | | |
| Metal Fabricate & Hardware — 1.2% | |
| A.M. Castle & Co. | | | 1,783 | | | | 19,310 | | |
| Circor International, Inc. | | | 1,800 | | | | 49,500 | | |
| Kaydon Corp. | | | 3,526 | | | | 121,118 | | |
| Lawson Products, Inc. | | | 480 | | | | 10,968 | | |
| Mueller Industries, Inc. | | | 3,922 | | | | 98,364 | | |
| Valmont Industries, Inc. | | | 1,786 | | | | 109,589 | | |
| | | | 408,849 | | |
| Mining — 0.4% | |
| Amcol International Corp. | | | 2,389 | | | | 50,049 | | |
Brush Engineered
Materials, Inc.(a) | | | 2,183 | | | | 27,768 | | |
| Century Aluminum Co.(a) | | | 3,819 | | | | 38,190 | | |
RTI International
Metals, Inc.(a) | | | 2,448 | | | | 35,031 | | |
| | | | 151,038 | | |
| Office Furnishings — 0.1% | |
| Interface, Inc. Class A | | | 5,950 | | | | 27,608 | | |
| Oil & Gas — 1.7% | |
| Atwood Oceanics, Inc.(a) | | | 5,836 | | | | 89,174 | | |
| Holly Corp. | | | 4,300 | | | | 78,389 | | |
| Penn Virginia Corp. | | | 4,365 | | | | 113,403 | | |
Petroleum
Development Corp.(a) | | | 1,546 | | | | 37,212 | | |
PetroQuest
Energy, Inc.(a) | | | 4,531 | | | | 30,629 | | |
| Pioneer Drilling Co.(a) | | | 5,213 | | | | 29,036 | | |
St. Mary Land &
Exploration Co. | | | 6,561 | | | | 133,254 | | |
| Stone Energy Corp.(a) | | | 3,644 | | | | 40,157 | | |
| Swift Energy Co.(a) | | | 3,196 | | | | 53,725 | | |
| | | | 604,979 | | |
(Continued)
The accompanying notes are an integral part of the financial statements.
101
MML Small Cap Index Fund – Portfolio of Investments (Continued)
| | | Number of
Shares | | Value | |
| Oil & Gas Services — 1.9% | |
Basic Energy
Services, Inc.(a) | | | 2,438 | | | $ | 31,792 | | |
| CARBO Ceramics, Inc. | | | 2,069 | | | | 73,512 | | |
| Dril-Quip, Inc.(a) | | | 3,151 | | | | 64,627 | | |
Gulf Island
Fabrication, Inc. | | | 1,432 | | | | 20,635 | | |
Hornbeck Offshore
Services, Inc.(a) | | | 2,422 | | | | 39,575 | | |
| ION Geophysical Corp.(a) | | | 9,040 | | | | 31,007 | | |
| Lufkin Industries, Inc. | | | 1,539 | | | | 53,096 | | |
| Matrix Service Co.(a) | | | 2,784 | | | | 21,353 | | |
NATCO Group, Inc.
Class A(a) | | | 2,117 | | | | 32,136 | | |
Oil States
International, Inc.(a) | | | 5,200 | | | | 97,188 | | |
SEACOR
Holdings, Inc.(a) | | | 2,075 | | | | 138,299 | | |
Superior Well
Services, Inc.(a) | | | 1,781 | | | | 17,810 | | |
TETRA
Technologies, Inc.(a) | | | 7,821 | | | | 38,010 | | |
| | | | 659,040 | | |
| Pharmaceuticals — 1.7% | |
Cubist
Pharmaceuticals, Inc.(a) | | | 6,054 | | | | 146,265 | | |
| HealthExtras, Inc.(a) | | | 3,946 | | | | 96,085 | | |
| Mannatech, Inc. | | | 1,700 | | | | 4,165 | | |
Noven
Pharmaceuticals, Inc.(a) | | | 2,600 | | | | 28,600 | | |
Par Pharmaceutical
Cos., Inc.(a) | | | 3,600 | | | | 48,276 | | |
| PetMed Express, Inc.(a) | | | 2,500 | | | | 44,075 | | |
| PharMerica Corp.(a) | | | 3,186 | | | | 49,925 | | |
Salix
Pharmaceuticals Ltd.(a) | | | 5,000 | | | | 44,150 | | |
Savient
Pharmaceuticals, Inc.(a) | | | 5,007 | | | | 28,990 | | |
| Theragenics Corp.(a) | | | 4,000 | | | | 4,680 | | |
| Viropharma, Inc.(a) | | | 8,331 | | | | 108,469 | | |
| | | | 603,680 | | |
| Real Estate — 0.1% | |
Forestar Real Estate
Group, Inc.(a) | | | 3,723 | | | | 35,443 | | |
| Real Estate Investment Trusts (REITS) — 6.0% | |
| Acadia Realty Trust | | | 3,434 | | | | 49,003 | | |
| BioMed Realty Trust, Inc. | | | 8,312 | | | | 97,417 | | |
Cedar Shopping
Centers, Inc. | | | 4,700 | | | | 33,276 | | |
| Colonial Properties Trust | | | 5,064 | | | | 42,183 | | |
DiamondRock
Hospitality Co. | | | 9,456 | | | | 47,942 | | |
| | | Number of
Shares | | Value | |
| Eastgroup Properties | | | 2,639 | | | $ | 93,896 | | |
Entertainment
Properties Trust | | | 3,451 | | | | 102,840 | | |
| Extra Space Storage, Inc. | | | 8,824 | | | | 91,064 | | |
Franklin Street
Properties Corp. | | | 6,200 | | | | 91,450 | | |
| Home Properties, Inc. | | | 3,419 | | | | 138,811 | | |
| Inland Real Estate Corp. | | | 6,019 | | | | 78,127 | | |
| Kilroy Realty Corp. | | | 3,422 | | | | 114,500 | | |
| Kite Realty Group Trust | | | 3,506 | | | | 19,493 | | |
| LaSalle Hotel Properties | | | 4,300 | | | | 47,515 | | |
| Lexington Realty Trust | | | 7,527 | | | | 37,635 | | |
| LTC Properties, Inc. | | | 2,406 | | | | 48,794 | | |
Medical Properties
Trust, Inc. | | | 6,948 | | | | 43,842 | | |
Mid-America Apartment
Communities, Inc. | | | 2,920 | | | | 108,507 | | |
National Retail
Properties, Inc. | | | 8,197 | | | | 140,906 | | |
| Parkway Properties, Inc. | | | 1,649 | | | | 29,682 | | |
Pennsylvania Real Estate
Investment Trust | | | 4,097 | | | | 30,523 | | |
| Post Properties, Inc. | | | 4,600 | | | | 75,900 | | |
| PS Business Parks, Inc. | | | 1,516 | | | | 67,704 | | |
Senior Housing
Properties Trust | | | 12,158 | | | | 217,871 | | |
| Sovran Self Storage, Inc. | | | 2,311 | | | | 83,196 | | |
Tanger Factory Outlet
Centers, Inc. | | | 3,414 | | | | 128,435 | | |
Urstadt Biddle Properties,
Inc. Class A | | | 2,200 | | | | 35,046 | | |
| | | | 2,095,558 | | |
| Retail — 7.0% | |
Big 5 Sporting
Goods Corp. | | | 2,300 | | | | 11,983 | | |
| Brown Shoe Co., Inc. | | | 4,450 | | | | 37,692 | | |
| The Buckle, Inc. | | | 2,400 | | | | 52,368 | | |
Buffalo Wild
Wings, Inc.(a) | | | 1,839 | | | | 47,170 | | |
| Cabelas, Inc.(a) | | | 4,079 | | | | 23,781 | | |
California Pizza
Kitchen, Inc.(a) | | | 2,591 | | | | 27,776 | | |
| Casey's General Stores, Inc. | | | 5,279 | | | | 120,203 | | |
Cash America
International, Inc. | | | 3,035 | | | | 83,007 | | |
| Cato Corp. Class A | | | 3,100 | | | | 46,810 | | |
CEC
Entertainment, Inc.(a) | | | 2,370 | | | | 57,473 | | |
Charlotte Russe
Holding, Inc.(a) | | | 2,162 | | | | 14,031 | | |
| Children's Place(a) | | | 2,508 | | | | 54,373 | | |
| Christopher & Banks Corp. | | | 3,800 | | | | 21,280 | | |
| CKE Restaurants, Inc. | | | 5,678 | | | | 49,285 | | |
| | | Number of
Shares | | Value | |
Cracker Barrel Old
Country Store, Inc. | | | 2,300 | | | $ | 47,357 | | |
| DineEquity, Inc. | | | 1,646 | | | | 19,028 | | |
| Dress Barn, Inc.(a) | | | 4,741 | | | | 50,918 | | |
The Finish Line, Inc.
Class A | | | 5,769 | | | | 32,306 | | |
First Cash Financial
Services, Inc.(a) | | | 2,700 | | | | 51,462 | | |
| Fred's, Inc. Class A | | | 4,187 | | | | 45,052 | | |
| Genesco, Inc.(a) | | | 1,948 | | | | 32,960 | | |
| Group 1 Automotive, Inc. | | | 2,453 | | | | 26,419 | | |
| The Gymboree Corp.(a) | | | 3,027 | | | | 78,974 | | |
Haverty Furniture
Cos., Inc. | | | 2,000 | | | | 18,660 | | |
| Hibbett Sports, Inc.(a) | | | 2,974 | | | | 46,722 | | |
| Hot Topic, Inc.(a) | | | 4,600 | | | | 42,642 | | |
| HSN, Inc.(a) | | | 4,100 | | | | 29,807 | | |
Insight
Enterprises, Inc.(a) | | | 4,800 | | | | 33,120 | | |
| Jack in the Box, Inc.(a) | | | 5,940 | | | | 131,215 | | |
| Jo-Ann Stores, Inc.(a) | | | 2,609 | | | | 40,413 | | |
Jos. A. Bank
Clothiers, Inc.(a) | | | 1,927 | | | | 50,391 | | |
| Landrys Restaurants, Inc. | | | 1,346 | | | | 15,614 | | |
| Lithia Motors, Inc. Class A | | | 1,967 | | | | 6,412 | | |
| Liz Claiborne, Inc. | | | 9,900 | | | | 25,740 | | |
| MarineMax, Inc.(a) | | | 1,960 | | | | 6,644 | | |
| Men's Wearhouse, Inc. | | | 5,352 | | | | 72,466 | | |
| Movado Group, Inc. | | | 1,900 | | | | 17,841 | | |
| O' Charley's, Inc. | | | 2,300 | | | | 4,600 | | |
| OfficeMax, Inc. | | | 7,996 | | | | 61,090 | | |
P.F. Chang's China
Bistro, Inc.(a) | | | 2,515 | | | | 52,664 | | |
Panera Bread Co.
Class A(a) | | | 3,267 | | | | 170,668 | | |
Papa John's
International, Inc.(a) | | | 2,222 | | | | 40,952 | | |
The PEP Boys-Manny
Moe & Jack | | | 4,600 | | | | 18,998 | | |
Red Robin Gourmet
Burgers, Inc.(a) | | | 1,587 | | | | 26,709 | | |
| Ruby Tuesday, Inc.(a) | | | 5,652 | | | | 8,817 | | |
Ruth's Chris
Steak House(a) | | | 2,000 | | | | 2,760 | | |
| School Specialty, Inc.(a) | | | 1,701 | | | | 32,523 | | |
Sonic Automotive, Inc.
Class A | | | 3,000 | | | | 11,940 | | |
| Sonic Corp.(a) | | | 6,272 | | | | 76,330 | | |
| Stage Stores, Inc. | | | 3,996 | | | | 32,967 | | |
| The Steak'n Shake Co.(a) | | | 3,000 | | | | 17,850 | | |
| Stein Mart, Inc.(a) | | | 2,700 | | | | 3,051 | | |
Texas Roadhouse, Inc.
Class A(a) | | | 5,373 | | | | 41,641 | | |
(Continued)
The accompanying notes are an integral part of the financial statements.
102
MML Small Cap Index Fund – Portfolio of Investments (Continued)
| | | Number of
Shares | | Value | |
| Tractor Supply Co.(a) | | | 3,390 | | | $ | 122,515 | | |
| Tuesday Morning Corp.(a) | | | 3,200 | | | | 5,216 | | |
| Tween Brands, Inc.(a) | | | 2,575 | | | | 11,124 | | |
| World Fuel Services Corp. | | | 3,101 | | | | 114,737 | | |
| Zale Corp.(a) | | | 3,389 | | | | 11,285 | | |
| Zumiez, Inc.(a) | | | 2,133 | | | | 15,891 | | |
| | | | 2,453,723 | | |
| Savings & Loans — 0.4% | |
Anchor Bancorp
Wisconsin, Inc. | | | 1,900 | | | | 5,244 | | |
| BankAtlantic Bancorp, Inc. | | | 860 | | | | 4,988 | | |
| Brookline Bancorp, Inc. | | | 6,100 | | | | 64,965 | | |
Dime
Community Bancshares | | | 2,700 | | | | 35,910 | | |
| Flagstar Bancorp, Inc.(a) | | | 5,200 | | | | 3,692 | | |
Guaranty Financial
Group, Inc.(a) | | | 11,400 | | | | 29,754 | | |
| | | | 144,553 | | |
| Semiconductors — 3.1% | |
| Actel Corp.(a) | | | 2,700 | | | | 31,644 | | |
| ATMI, Inc.(a) | | | 3,280 | | | | 50,610 | | |
Axcelis
Technologies, Inc.(a) | | | 10,914 | | | | 5,566 | | |
Brooks
Automation, Inc.(a) | | | 6,673 | | | | 38,770 | | |
Cabot
Microelectronics Corp.(a) | | | 2,432 | | | | 63,402 | | |
| Cohu, Inc. | | | 2,400 | | | | 29,160 | | |
Cypress
Semiconductor Corp.(a) | | | 15,200 | | | | 67,944 | | |
| Diodes, Inc.(a) | | | 3,391 | | | | 20,550 | | |
| DSP Group, Inc.(a) | | | 2,893 | | | | 23,202 | | |
| Exar Corp.(a) | | | 4,493 | | | | 29,968 | | |
| Hittite Microwave Corp.(a) | | | 2,000 | | | | 58,920 | | |
| Kopin Corp.(a) | | | 7,600 | | | | 15,504 | | |
Kulicke & Soffa
Industries, Inc.(a) | | | 5,716 | | | | 9,717 | | |
| Micrel, Inc. | | | 5,145 | | | | 37,610 | | |
| Microsemi Corp.(a) | | | 8,614 | | | | 108,881 | | |
| MKS Instruments, Inc.(a) | | | 5,167 | | | | 76,420 | | |
Pericom
Semiconductor Corp.(a) | | | 2,657 | | | | 14,560 | | |
Rudolph
Technologies, Inc.(a) | | | 3,166 | | | | 11,176 | | |
Skyworks
Solutions, Inc.(a) | | | 17,457 | | | | 96,712 | | |
Standard
Microsystems Corp.(a) | | | 2,300 | | | | 37,582 | | |
| Supertex, Inc.(a) | | | 1,400 | | | | 33,614 | | |
TriQuint
Semiconductor, Inc.(a) | | | 15,100 | | | | 51,944 | | |
| | | Number of
Shares | | Value | |
| Ultratech, Inc.(a) | | | 2,437 | | | $ | 29,147 | | |
Varian Semiconductor
Equipment
Associates, Inc.(a) | | | 7,550 | | | | 136,806 | | |
Veeco
Instruments, Inc.(a) | | | 3,353 | | | | 21,258 | | |
| | | | 1,100,667 | | |
| Software — 3.4% | |
| Avid Technology, Inc.(a) | | | 3,200 | | | | 34,912 | | |
| Blackbaud, Inc. | | | 4,576 | | | | 61,776 | | |
Concur
Technologies, Inc.(a) | | | 4,459 | | | | 146,344 | | |
CSG Systems
International, Inc.(a) | | | 3,691 | | | | 64,482 | | |
| Digi International, Inc.(a) | | | 2,700 | | | | 21,897 | | |
| Eclipsys Corp.(a) | | | 5,700 | | | | 80,883 | | |
| Epicor Software Corp.(a) | | | 6,255 | | | | 30,024 | | |
| EPIQ Systems, Inc.(a) | | | 3,749 | | | | 62,646 | | |
| Informatica Corp.(a) | | | 9,261 | | | | 127,154 | | |
JDA Software
Group, Inc.(a) | | | 2,854 | | | | 37,473 | | |
| Omnicell, Inc.(a) | | | 3,194 | | | | 38,999 | | |
| Phase Forward, Inc.(a) | | | 4,491 | | | | 56,227 | | |
Phoenix
Technologies Ltd.(a) | | | 2,928 | | | | 10,248 | | |
Progress
Software Corp.(a) | | | 4,142 | | | | 79,775 | | |
| Quality Systems, Inc. | | | 1,907 | | | | 83,183 | | |
Smith Micro
Software, Inc.(a) | | | 2,900 | | | | 16,124 | | |
| SPSS, Inc.(a) | | | 1,894 | | | | 51,062 | | |
| SYNNEX Corp.(a) | | | 1,913 | | | | 21,674 | | |
Take Two Interactive
Software, Inc. | | | 8,067 | | | | 60,987 | | |
| Taleo Corp. Class A(a) | | | 3,200 | | | | 25,056 | | |
| THQ, Inc.(a) | | | 7,053 | | | | 29,552 | | |
Tyler
Technologies, Inc.(a) | | | 3,100 | | | | 37,138 | | |
| | | | 1,177,616 | | |
| Storage & Warehousing — 0.1% | |
| Mobile Mini, Inc.(a) | | | 3,645 | | | | 52,561 | | |
| Telecommunications — 2.4% | |
| Adaptec, Inc.(a) | | | 12,600 | | | | 41,580 | | |
Anixter
International, Inc.(a) | | | 3,177 | | | | 95,691 | | |
Applied Signal
Technology, Inc. | | | 1,300 | | | | 23,322 | | |
| Arris Group, Inc.(a) | | | 12,857 | | | | 102,213 | | |
| Black Box Corp. | | | 1,851 | | | | 48,348 | | |
Comtech
Telecommunications(a) | | | 2,516 | | | | 115,283 | | |
| | | Number of
Shares | | Value | |
| EMS Technologies, Inc.(a) | | | 1,600 | | | $ | 41,392 | | |
Fairpoint
Communications, Inc. | | | 9,434 | | | | 30,944 | | |
General Communication,
Inc. Class A(a) | | | 4,600 | | | | 37,214 | | |
| Harmonic, Inc.(a) | | | 9,905 | | | | 55,567 | | |
| Netgear, Inc.(a) | | | 3,743 | | | | 42,708 | | |
Network Equipment
Technologies, Inc.(a) | | | 2,900 | | | | 8,352 | | |
| Novatel Wireless, Inc.(a) | | | 3,139 | | | | 14,565 | | |
| Symmetricom, Inc.(a) | | | 4,900 | | | | 19,355 | | |
| Tekelec(a) | | | 6,900 | | | | 92,046 | | |
Tollgrade
Communications, Inc.(a) | | | 1,600 | | | | 7,648 | | |
| Viasat, Inc.(a) | | | 2,800 | | | | 67,424 | | |
| | | | 843,652 | | |
| Textiles — 0.2% | |
| G&K Services, Inc. Class A | | | 2,019 | | | | 40,824 | | |
| UniFirst Corp. | | | 1,521 | | | | 45,159 | | |
| | | | 85,983 | | |
| Toys, Games & Hobbies — 0.2% | |
| JAKKS Pacific, Inc.(a) | | | 2,862 | | | | 59,043 | | |
| RC2 Corp.(a) | | | 1,764 | | | | 18,822 | | |
| | | | 77,865 | | |
| Transportation — 2.8% | |
| Arkansas Best Corp. | | | 2,594 | | | | 78,105 | | |
| Bristow Group, Inc.(a) | | | 3,027 | | | | 81,093 | | |
| Forward Air Corp. | | | 3,009 | | | | 73,028 | | |
| Heartland Express, Inc. | | | 5,852 | | | | 92,228 | | |
| Hub Group, Inc. Class A(a) | | | 3,953 | | | | 104,873 | | |
| Kirby Corp.(a) | | | 5,647 | | | | 154,502 | | |
| Knight Transportation, Inc. | | | 6,028 | | | | 97,171 | | |
| Landstar System, Inc. | | | 5,536 | | | | 212,749 | | |
Old Dominion Freight
Line, Inc.(a) | | | 2,858 | | | | 81,339 | | |
| | | | 975,088 | | |
| Water — 0.2% | |
| American States Water Co. | | | 1,800 | | | | 59,364 | | |
TOTAL COMMON STOCK
(Cost $53,977,572) | | | 34,419,078 | | |
TOTAL EQUITIES
(Cost $53,977,572) | | | 34,419,078 | | |
(Continued)
The accompanying notes are an integral part of the financial statements.
103
MML Small Cap Index Fund – Portfolio of Investments (Continued)
| | | Number of
Shares | | Value | |
| MUTUAL FUNDS — 0.1% | |
| Diversified Financial — 0.1% | |
iShares S&P SmallCap
600 Index Fund | | | 573 | | | $ | 25,212 | | |
TOTAL MUTUAL FUNDS
(Cost $35,710) | | | 25,212 | | |
TOTAL LONG-TERM
INVESTMENTS
(Cost $54,013,282) | | | 34,444,290 | | |
| | | Principal
Amount | | | |
| SHORT-TERM INVESTMENTS — 2.3% | |
| Repurchase Agreement — 2.0% | |
State Street Bank &
Trust Co. Repurchase
Agreement, dated
12/31/08, 0.010%,
due 1/02/09(b) | | $ | 704,622 | | | | 704,622 | | |
| U.S. Treasury Bills — 0.3% | |
U.S. Treasury Bill(c)
0.001% 5/14/09 | | | 10,000 | | | | 10,000 | | |
U.S. Treasury Bill(c)
0.100% 5/14/09 | | | 100,000 | | | | 99,963 | | |
| | | | 109,963 | | |
TOTAL SHORT-TERM
INVESTMENTS
(Cost $814,585) | | | 814,585 | | |
TOTAL INVESTMENTS — 100.4%
(Cost $54,827,867)(d) | | | 35,258,875 | | |
Other Assets/
(Liabilities) — (0.4%) | | | (130,825 | ) | |
| NET ASSETS — 100.0% | | $ | 35,128,050 | | |
Notes to Portfolio of Investments
Industry classifications are unaudited.
(a) Non-income producing security.
(b) Maturity value of $704,623. Collateralized by U.S. Government Agency obligations with a rate of 4.758%, maturity date of 7/01/34, and an aggregate market value, including accrued interest, of $718,917.
(c) This security is held as collateral for open futures contracts. (Note 2).
(d) See Note 6 for aggregate cost for federal tax purposes.
The remainder of this page is intentionally left blank.
The accompanying notes are an integral part of the financial statements.
104
MML Global Fund – Portfolio of Investments
December 31, 2008
| | | Number of
Shares | | Value | |
| EQUITIES — 94.1% | |
| COMMON STOCK — 94.1% | |
| Advertising — 1.4% | |
| Ipsos | | | 6,952 | | | $ | 187,059 | | |
| Teleperformance | | | 5,315 | | | | 148,208 | | |
| | | | 335,267 | | |
| Aerospace & Defense — 0.9% | |
| Raytheon Co. | | | 4,250 | | | | 216,920 | | |
| Auto Manufacturers — 0.5% | |
Toyota Motor Corp.
Sponsored ADR (Japan) | | | 1,900 | | | | 124,336 | | |
| Automotive & Parts — 0.8% | |
| Continental AG(a) | | | 973 | | | | 97,787 | | |
| Hyundai Mobis(a) | | | 2,010 | | | | 102,823 | | |
| | | | 200,610 | | |
| Banks — 6.4% | |
| Bank of America Corp. | | | 15,964 | | | | 224,773 | | |
The Bank of New York
Mellon Corp. | | | 12,300 | | | | 348,459 | | |
| DnB NOR ASA | | | 33,330 | | | | 133,140 | | |
PNC Financial Services
Group, Inc. | | | 2,400 | | | | 117,600 | | |
State Bank of India Ltd.
Sponsored GDR (India) | | | 1,770 | | | | 97,247 | | |
| State Street Corp. | | | 3,140 | | | | 123,496 | | |
| U.S. Bancorp | | | 7,450 | | | | 186,324 | | |
| UBI Banca | | | 5,950 | | | | 86,114 | | |
| United Overseas Bank Ltd. | | | 13,000 | | | | 117,352 | | |
| Wells Fargo & Co. | | | 4,790 | | | | 141,209 | | |
| | | | 1,575,714 | | |
| Beverages — 2.9% | |
Anheuser-Busch
InBev NV(a) | | | 5,416 | | | | 30 | | |
| Diageo PLC | | | 10,550 | | | | 146,756 | | |
| Heineken NV | | | 2,970 | | | | 91,249 | | |
| InBev NV | | | 8,704 | | | | 201,796 | | |
| PepsiCo, Inc. | | | 2,900 | | | | 158,833 | | |
| Pernod-Ricard SA | | | 1,460 | | | | 108,267 | | |
| | | | 706,931 | | |
| Biotechnology — 0.2% | |
| Genzyme Corp.(a) | | | 710 | | | | 47,123 | | |
| Chemicals — 2.4% | |
Makhteshim-Agan
Industries Ltd. | | | 15,255 | | | | 49,807 | | |
| Nitto Denko Corp. | | | 3,100 | | | | 59,558 | | |
| | | Number of
Shares | | Value | |
| Praxair, Inc. | | | 2,010 | | | $ | 119,314 | | |
Sociedad Quimica y
Minera de Chile SA
Sponsored ADR (Chile) | | | 3,700 | | | | 90,243 | | |
Ultrapar Participacoes SA
Sponsored ADR (Brazil) | | | 5,545 | | | | 124,707 | | |
| Wacker Chemie AG | | | 1,335 | | | | 141,973 | | |
| | | | 585,602 | | |
| Commercial Services — 2.1% | |
| De La Rue PLC | | | 4,500 | | | | 58,872 | | |
| Experian Group Ltd. | | | 25,467 | | | | 159,485 | | |
Macdonald Dettwiler &
Associates Ltd.(a) | | | 11,135 | | | | 196,633 | | |
| RPS Group PLC | | | 50,248 | | | | 101,981 | | |
| | | | 516,971 | | |
| Computers — 1.7% | |
International Business
Machines Corp. | | | 1,810 | | | | 152,330 | | |
Logitech
International SA(a) | | | 4,725 | | | | 73,765 | | |
| Wincor Nixdorf AG | | | 4,217 | | | | 201,058 | | |
| | | | 427,153 | | |
| Cosmetics & Personal Care — 1.4% | |
| The Procter & Gamble Co. | | | 4,020 | | | | 248,516 | | |
| Shiseido Co. Ltd. | | | 4,000 | | | | 81,884 | | |
| | | | 330,400 | | |
| Diversified Financial — 2.3% | |
| Deutsche Boerse AG | | | 765 | | | | 55,717 | | |
| JP Morgan Chase & Co. | | | 16,080 | | | | 507,002 | | |
| | | | 562,719 | | |
| Electric — 2.9% | |
| Exelon Corp. | | | 1,340 | | | | 74,517 | | |
| FirstEnergy Corp. | | | 4,100 | | | | 199,178 | | |
| FPL Group, Inc. | | | 4,880 | | | | 245,611 | | |
| NRG Energy, Inc.(a) | | | 7,880 | | | | 183,840 | | |
| | | | 703,146 | | |
| Electronics — 2.6% | |
| Chemring Group PLC | | | 7,085 | | | | 199,486 | | |
| Fanuc Ltd. | | | 1,900 | | | | 135,126 | | |
| Halma PLC | | | 25,464 | | | | 74,622 | | |
| Laird PLC | | | 29,900 | | | | 60,187 | | |
Thermo Fisher
Scientific, Inc.(a) | | | 4,970 | | | | 169,328 | | |
| | | | 638,749 | | |
| | | Number of
Shares | | Value | |
| Foods — 4.4% | |
| Barry Callebaut AG(a) | | | 220 | | | $ | 143,678 | | |
| Colruyt SA | | | 815 | | | | 174,540 | | |
| Nestle SA | | | 6,145 | | | | 242,190 | | |
| Nutreco Holding NV | | | 3,940 | | | | 129,449 | | |
| Sligro Food Group | | | 5,775 | | | | 119,882 | | |
| Unilever NV | | | 7,510 | | | | 181,968 | | |
Want Want China
Holdings Ltd. | | | 194,100 | | | | 80,877 | | |
| | | | 1,072,584 | | |
| Gas — 0.3% | |
| Sempra Energy | | | 1,800 | | | | 76,734 | | |
| Health Care – Products — 8.8% | |
| Baxter International, Inc. | | | 5,140 | | | | 275,452 | | |
| Covidien Ltd. | | | 7,230 | | | | 262,015 | | |
| Getinge AB | | | 11,775 | | | | 141,114 | | |
Hengan International
Group Co. Ltd. | | | 49,000 | | | | 157,994 | | |
| Hogy Medical Co. | | | 2,400 | | | | 165,353 | | |
| Johnson & Johnson | | | 5,875 | | | | 351,501 | | |
| Nihon Kohden Corp. | | | 15,800 | | | | 375,832 | | |
| SSL International PLC | | | 19,660 | | | | 140,575 | | |
| Terumo Corp. | | | 2,700 | | | | 126,444 | | |
| Zimmer Holdings, Inc.(a) | | | 3,830 | | | | 154,809 | | |
| | | | 2,151,089 | | |
| Health Care – Services — 1.0% | |
| Aetna, Inc. | | | 1,700 | | | | 48,450 | | |
| Amil Participacoes SA | | | 22,180 | | | | 69,469 | | |
Fresenius Medical Care
AG & Co. KGaA | | | 2,940 | | | | 137,866 | | |
| | | | 255,785 | | |
| Holding Company – Diversified — 1.0% | |
| DCC PLC | | | 7,160 | | | | 104,182 | | |
| GEA Group AG | | | 7,735 | | | | 132,629 | | |
| | | | 236,811 | | |
| Insurance — 5.1% | |
| Amlin PLC | | | 32,745 | | | | 170,296 | | |
Berkshire Hathaway, Inc.
Class B(a) | | | 18 | | | | 57,852 | | |
| Euler Hermes | | | 1,915 | | | | 93,793 | | |
Marsh & McLennan
Cos., Inc. | | | 5,900 | | | | 143,193 | | |
| Metlife, Inc. | | | 8,037 | | | | 280,170 | | |
| Milano Assicurazio SpA | | | 35,118 | | | | 109,391 | | |
| Swiss Reinsurance | | | 4,005 | | | | 194,568 | | |
| Willis Group Holdings Ltd. | | | 7,500 | | | | 186,600 | | |
| | | | 1,235,863 | | |
(Continued)
The accompanying notes are an integral part of the financial statements.
105
MML Global Fund – Portfolio of Investments (Continued)
| | | Number of
Shares | | Value | |
| Leisure Time — 0.6% | |
| Sankyo Co. Ltd. | | | 3,000 | | | $ | 151,523 | | |
| Machinery – Construction & Mining — 0.5% | |
| Terex Corp.(a) | �� | | 6,595 | | | | 114,225 | | |
| Machinery – Diversified — 1.8% | |
| Deere & Co. | | | 1,710 | | | | 65,527 | | |
Pfeiffer Vacuum
Technology AG | | | 220 | | | | 14,568 | | |
| Rockwell Automation, Inc. | | | 7,600 | | | | 245,024 | | |
| Tognum AG | | | 9,300 | | | | 118,793 | | |
| | | | 443,912 | | |
| Manufacturing — 1.8% | |
| Eaton Corp. | | | 5,100 | | | | 253,521 | | |
| General Electric Co. | | | 10,900 | | | | 176,580 | | |
| | | | 430,101 | | |
| Media — 1.2% | |
Comcast Corp. Special
Class A | | | 8,650 | | | | 139,697 | | |
| Informa PLC | | | 28,671 | | | | 101,727 | | |
| Viacom, Inc. Class B(a) | | | 2,150 | | | | 40,979 | | |
| | | | 282,403 | | |
| Metal Fabricate & Hardware — 0.6% | |
| Vallourec SA | | | 1,343 | | | | 152,747 | | |
| Mining — 1.6% | |
| Barrick Gold Corp. | | | 2,500 | | | | 90,543 | | |
| Cameco Corp. | | | 5,155 | | | | 87,900 | | |
Cia Vale do Rio Doce
Sponsored ADR (Brazil) | | | 6,525 | | | | 69,491 | | |
Freeport-McMoRan
Copper & Gold, Inc. | | | 5,831 | | | | 142,510 | | |
| | | | 390,444 | | |
| Oil & Gas — 11.3% | |
| Addax Petroleum Corp. | | | 5,465 | | | | 93,363 | | |
| Apache Corp. | | | 3,615 | | | | 269,426 | | |
| ConocoPhillips | | | 4,550 | | | | 235,690 | | |
| DCC PLC | | | 890 | | | | 12,770 | | |
| Dragon Oil PLC(a) | | | 22,663 | | | | 52,279 | | |
| EOG Resources, Inc. | | | 980 | | | | 65,248 | | |
| Exxon Mobil Corp. | | | 9,105 | | | | 726,852 | | |
| Occidental Petroleum Corp. | | | 10,060 | | | | 603,500 | | |
Petroleo Brasileiro SA
Sponsored ADR (Brazil) | | | 4,198 | | | | 85,681 | | |
| Talisman Energy, Inc. | | | 7,505 | | | | 74,047 | | |
Total SA Sponsored
ADR (France) | | | 3,335 | | | | 184,426 | | |
| Tullow Oil PLC | | | 7,449 | | | | 71,282 | | |
| XTO Energy, Inc. | | | 8,500 | | | | 299,795 | | |
| | | | 2,774,359 | | |
| | | Number of
Shares | | Value | |
| Oil & Gas Services — 0.9% | |
| Fugro NV | | | 4,150 | | | $ | 119,144 | | |
| Prosafe SE(a) | | | 24,295 | | | | 92,625 | | |
| | | | 211,769 | | |
| Packaging & Containers — 1.4% | |
| Gerresheimer Group | | | 6,885 | | | | 188,758 | | |
| Pactiv Corp.(a) | | | 6,536 | | | | 162,616 | | |
| | | | 351,374 | | |
| Pharmaceuticals — 5.8% | |
| Alfresa Holdings Corp. | | | 3,400 | | | | 162,392 | | |
| GlaxoSmithKline PLC | | | 4,188 | | | | 77,748 | | |
Hisamitsu Pharmaceutical
Co., Inc. | | | 4,300 | | | | 175,556 | | |
| Ipsen SA | | | 4,530 | | | | 176,876 | | |
| Merck & Co., Inc. | | | 10,030 | | | | 304,912 | | |
| Novo Nordisk A/S Class B | | | 2,375 | | | | 120,862 | | |
| Roche Holding AG | | | 835 | | | | 128,535 | | |
Takeda
Pharmaceutical Co. Ltd. | | | 3,100 | | | | 160,804 | | |
Teva Pharmaceutical
Industries Ltd.
Sponsored ADR (Israel) | | | 2,700 | | | | 114,939 | | |
| | | | 1,422,624 | | |
| Retail — 5.9% | |
| CVS Caremark Corp. | | | 12,325 | | | | 354,220 | | |
| Darden Restaurants, Inc. | | | 8,150 | | | | 229,667 | | |
| Macy's, Inc. | | | 20,800 | | | | 215,280 | | |
| McDonald's Corp. | | | 1,620 | | | | 100,748 | | |
| PetSmart, Inc. | | | 4,200 | | | | 77,490 | | |
| Tiffany & Co. | | | 5,450 | | | | 128,784 | | |
| The TJX Cos., Inc. | | | 4,620 | | | | 95,033 | | |
| Wal-Mart Stores, Inc. | | | 4,450 | | | | 249,467 | | |
| | | | 1,450,689 | | |
| Savings & Loans — 0.4% | |
New York Community
Bancorp, Inc. | | | 7,345 | | | | 87,846 | | |
| Semiconductors — 0.5% | |
| ASML Holding NV | | | 3,582 | | | | 63,921 | | |
| Intel Corp. | | | 4,420 | | | | 64,797 | | |
| | | | 128,718 | | |
| Software — 0.8% | |
| Oracle Corp.(a) | | | 3,850 | | | | 68,261 | | |
SAP AG Sponsored
ADR (Germany) | | | 3,300 | | | | 119,526 | | |
| | | | 187,787 | | |
| Telecommunications — 7.8% | |
| AT&T, Inc. | | | 15,484 | | | | 441,294 | | |
China Mobile Ltd.
Sponsored ADR
(Hong Kong) | | | 2,745 | | | | 139,583 | | |
| | | Number of
Shares | | Value | |
| Cisco Systems, Inc.(a) | | | 11,360 | | | $ | 185,168 | | |
| Nokia Oyj | | | 6,215 | | | | 96,351 | | |
| Option NV(a) | | | 9,800 | | | | 26,003 | | |
| Sepura Ltd. | | | 23,570 | | | | 11,636 | | |
| Telefonica SA | | | 12,310 | | | | 275,934 | | |
Telenet Group
Holding NV(a) | | | 5,875 | | | | 100,942 | | |
Verizon
Communications, Inc. | | | 7,345 | | | | 248,996 | | |
| Vodafone Group PLC | | | 194,834 | | | | 392,223 | | |
| | | | 1,918,130 | | |
| Toys, Games & Hobbies — 0.8% | |
Nintendo Co. Ltd.
Sponsored ADR (Japan) | | | 3,935 | | | | 183,131 | | |
| Transportation — 1.3% | |
| East Japan Railway | | | 20 | | | | 156,196 | | |
| TNT NV | | | 8,785 | | | | 168,727 | | |
| | | | 324,923 | | |
TOTAL COMMON STOCK
(Cost $30,471,384) | | | 23,007,212 | | |
TOTAL EQUITIES
(Cost $30,471,384) | | | 23,007,212 | | |
| RIGHTS — 0.0% | |
| Beverages — 0.0% | |
| Anheuser-Busch InBev NV | | | 3 | | | | 54 | | |
TOTAL RIGHTS
(Cost $61) | | | 54 | | |
TOTAL LONG-TERM
INVESTMENTS
(Cost $30,471,445) | | | 23,007,266 | | |
| | | Principal
Amount | | | |
| SHORT-TERM INVESTMENTS — 5.1% | |
| Repurchase Agreement — 5.1% | |
State Street Bank &
Trust Co.Repurchase
Agreement, dated
12/31/08, 0.010%,
due 1/02/09(b) | | $ | 1,260,048 | | | | 1,260,048 | | |
TOTAL SHORT-TERM
INVESTMENTS
(Cost $1,260,048) | | | 1,260,048 | | |
(Continued)
The accompanying notes are an integral part of the financial statements.
106
MML Global Fund – Portfolio of Investments (Continued)
| | Value | |
TOTAL INVESTMENTS — 99.2%
(Cost $31,731,493)(c) | | $ | 24,267,314 | | |
Other Assets/
(Liabilities) — 0.8% | | | 194,045 | | |
| NET ASSETS — 100.0% | | $ | 24,461,359 | | |
Notes to Portfolio of Investments
Industry classifications are unaudited.
ADR - American Depositary Receipt
GDR - Global Depositary Receipt
(a) Non-income producing security.
(b) Maturity value of $1,260,049. Collateralized by U.S. Government Agency obligations with rates ranging from 4.939% - 5.219%, maturity dates ranging from 7/01/34 - 8/01/34, and an aggregate market value, including accrued interest, of $1,287,337.
(c) See Note 6 for aggregate cost for federal tax purposes.
The remainder of this page is intentionally left blank.
The accompanying notes are an integral part of the financial statements.
107
MML Foreign Fund – Portfolio of Investments
December 31, 2008
| | | Number of
Shares | | Value | |
| EQUITIES — 93.7% | |
| COMMON STOCK — 93.7% | |
| Aerospace & Defense — 2.0% | |
| BAE Systems PLC | | | 468,220 | | | $ | 2,551,918 | | |
Empresa Brasileira de
Aeronautica SA
ADR (Brazil) | | | 70,250 | | | | 1,138,752 | | |
| Rolls-Royce Group PLC(a) | | | 96,481 | | | | 472,650 | | |
| | | | 4,163,320 | | |
| Apparel — 0.2% | |
| Burberry Group PLC | | | 148,462 | | | | 476,149 | | |
| Auto Manufacturers — 1.7% | |
Bayerische Motoren
Werke AG | | | 67,981 | | | | 2,089,657 | | |
Toyota Motor Corp.
Sponsored ADR (Japan) | | | 23,270 | | | | 1,522,789 | | |
| | | | 3,612,446 | | |
| Automotive & Parts — 1.3% | |
Compagnie Generale des
Etablissements Michelin
Class B | | | 38,110 | | | | 1,998,267 | | |
| NGK Spark Plug Co., Ltd. | | | 102,000 | | | | 817,459 | | |
| | | | 2,815,726 | | |
| Banks — 6.2% | |
| Banco Espirito Santo SA | | | 193,430 | | | | 1,818,216 | | |
| Banco Santander SA | | | 104,831 | | | | 1,011,737 | | |
| DBS Group Holdings, Ltd. | | | 167,653 | | | | 994,559 | | |
| HSBC Holdings PLC | | | 158,400 | | | | 1,520,529 | | |
ICICI Bank Ltd. Sponsored
ADR (India) | | | 38,320 | | | | 737,660 | | |
| Intesa Sanpaolo | | | 429,442 | | | | 1,546,821 | | |
KB Financial Group, Inc.
Sponsored ADR
(Republic of Korea)(a) | | | 62,431 | | | | 1,635,692 | | |
Mitsubishi UFJ Financial
Group, Inc. | | | 193,000 | | | | 1,197,550 | | |
| Nordea Bank AB | | | 116,605 | | | | 846,439 | | |
Royal Bank of Scotland
Group PLC | | | 656,766 | | | | 474,782 | | |
| UniCredit Italiano SpA | | | 510,306 | | | | 1,270,430 | | |
| | | | 13,054,415 | | |
| Beverages — 0.0% | |
Dr. Pepper Snapple
Group, Inc.(a) | | | 1 | | | | 16 | | |
| Building Materials — 0.5% | |
| CRH PLC | | | 38,040 | | | | 962,614 | | |
| | | Number of
Shares | | Value | |
| Chemicals — 1.4% | |
| Lonza Group AG Registered | | | 32,250 | | | $ | 2,981,350 | | |
| Commercial Services — 2.8% | |
| Adecco SA | | | 29,110 | | | | 988,052 | | |
| G4S PLC | | | 983,650 | | | | 2,919,322 | | |
| Loomis AB(a) | | | 14,768 | | | | 91,509 | | |
| Randstad Holding NV | | | 51,493 | | | | 1,045,386 | | |
| Rentokil Initial PLC | | | 362,302 | | | | 231,852 | | |
| Securitas AB Class B | | | 73,842 | | | | 606,110 | | |
| | | | 5,882,231 | | |
| Computers — 0.5% | |
| Compal Electronics, Inc. | | | 828,642 | | | | 440,683 | | |
| Lite On Technology Corp. | | | 1,027,936 | | | | 678,824 | | |
| | | | 1,119,507 | | |
| Distribution & Wholesale — 0.4% | |
| Wolseley PLC | | | 162,280 | | | | 904,804 | | |
| Diversified Financial — 1.1% | |
Mega Financial Holding
Co. Ltd. | | | 1,577,000 | | | | 556,759 | | |
| Nomura Holdings, Inc. | | | 12 | | | | 99 | | |
| Promise Co. Ltd. | | | 68,150 | | | | 1,727,373 | | |
| | | | 2,284,231 | | |
| Electric — 2.0% | |
| E.ON AG | | | 85,080 | | | | 3,440,393 | | |
| National Grid PLC | | | 83,533 | | | | 825,529 | | |
| | | | 4,265,922 | | |
| Electrical Components & Equipment — 0.6% | |
Gamesa Corporacion
Tecnologica SA | | | 31,198 | | | | 565,885 | | |
| Hitachi Ltd. | | | 183,604 | | | | 712,035 | | |
| | | | 1,277,920 | | |
| Electronics — 1.8% | |
Flextronics
International Ltd.(a) | | | 168,720 | | | | 431,923 | | |
Koninklijke Philips
Electronics NV | | | 91,150 | | | | 1,772,774 | | |
| Mabuchi Motor Co. Ltd. | | | 26,653 | | | | 1,106,965 | | |
| Venture Corp. Ltd. | | | 159,387 | | | | 487,537 | | |
| | | | 3,799,199 | | |
| Energy – Alternate Sources — 0.7% | |
| Vestas Wind Systems A/S(a) | | | 23,872 | | | | 1,418,806 | | |
| Food Services — 1.5% | |
| Compass Group PLC | | | 627,302 | | | | 3,112,932 | | |
| | | Number of
Shares | | Value | |
| Foods — 6.8% | |
| Cadbury Schweppes PLC | | | 188,901 | | | $ | 1,653,654 | | |
| George Weston Ltd. | | | 62,000 | | | | 3,010,855 | | |
| Nestle SA | | | 111,890 | | | | 4,409,873 | | |
| Tesco PLC | | | 390,880 | | | | 2,036,450 | | |
| Unilever PLC | | | 143,497 | | | | 3,261,042 | | |
| | | | 14,371,874 | | |
| Forest Products & Paper — 1.0% | |
| Stora Enso Oyj | | | 154,009 | | | | 1,196,106 | | |
| UPM Kymmene Oyj | | | 74,550 | | | | 945,254 | | |
| | | | 2,141,360 | | |
| Gas — 1.4% | |
| Centrica PLC | | | 160,139 | | | | 615,364 | | |
| Gaz De France | | | 44,898 | | | | 2,223,664 | | |
| | | | 2,839,028 | | |
| Holding Company – Diversified — 0.5% | |
| Hutchison Whampoa Ltd. | | | 189,291 | | | | 954,840 | | |
| Home Furnishing — 0.5% | |
| Sony Corp. | | | 52,235 | | | | 1,135,538 | | |
| Insurance — 7.4% | |
| ACE Ltd. | | | 52,664 | | | | 2,786,979 | | |
| Aviva PLC | | | 344,580 | | | | 1,950,480 | | |
| AXA SA | | | 79,743 | | | | 1,777,846 | | |
| ING Groep NV | | | 131,242 | | | | 1,371,896 | | |
| Investco Ltd. | | | 104,963 | | | | 1,515,666 | | |
Muenchener
Rueckversicherungs AG | | | 18,160 | | | | 2,853,790 | | |
| Old Mutual PLC | | | 1,311,736 | | | | 1,047,980 | | |
| Swiss Reinsurance | | | 47,940 | | | | 2,328,989 | | |
| | | | 15,633,626 | | |
| Internet — 1.1% | |
Check Point Software
Technologies Ltd.(a) | | | 126,059 | | | | 2,393,860 | | |
| Iron & Steel — 0.5% | |
| POSCO ADR (South Korea) | | | 15,301 | | | | 1,151,400 | | |
| Lodging — 0.8% | |
| Accor SA | | | 33,370 | | | | 1,642,131 | | |
| Machinery – Diversified — 0.3% | |
| Ebara Corp. | | | 281,000 | | | | 649,521 | | |
| Manufacturing — 3.7% | |
| FUJIFILM Holdings Corp. | | | 73,526 | | | | 1,618,157 | | |
| Olympus Corp. | | | 96,210 | | | | 1,931,975 | | |
| Siemens AG | | | 47,516 | | | | 3,558,970 | | |
| Smiths Group PLC | | | 47,106 | | | | 606,498 | | |
| | | | 7,715,600 | | |
(Continued)
The accompanying notes are an integral part of the financial statements.
108
MML Foreign Fund – Portfolio of Investments (Continued)
| | | Number of
Shares | | Value | |
| Media — 4.3% | |
British Sky Broadcasting
Group PLC | | | 297,224 | | | $ | 2,067,988 | | |
| Pearson PLC | | | 251,304 | | | | 2,332,239 | | |
| Reed Elsevier NV | | | 114,633 | | | | 1,350,615 | | |
| Vivendi SA | | | 95,940 | | | | 3,123,581 | | |
| Yell Group PLC | | | 300,297 | | | | 184,790 | | |
| | | | 9,059,213 | | |
| Mining — 0.6% | |
| Alumina Ltd. | | | 469,994 | | | | 460,102 | | |
Cia Vale do Rio Doce
Sponsored ADR (Brazil) | | | 74,872 | | | | 797,387 | | |
| | | | 1,257,489 | | |
| Oil & Gas — 9.0% | |
| BP PLC | | | 417,384 | | | | 3,198,116 | | |
| ENI SpA | | | 136,630 | | | | 3,237,568 | | |
Petroleo Brasileiro SA
Sponsored ADR (Brazil) | | | 58,290 | | | | 1,189,699 | | |
| Repsol YPF SA | | | 76,421 | | | | 1,627,659 | | |
Royal Dutch Shell PLC
Class B | | | 141,894 | | | | 3,571,122 | | |
Sasol Ltd., Sponsored
ADR (South Africa) | | | 81,380 | | | | 2,468,255 | | |
| Total SA | | | 67,712 | | | | 3,691,501 | | |
| | | | 18,983,920 | | |
| Oil & Gas Services — 0.6% | |
| SBM Offshore NV | | | 100,212 | | | | 1,313,193 | | |
| Packaging & Containers — 0.7% | |
| Amcor Ltd. | | | 362,922 | | | | 1,475,045 | | |
| Pharmaceuticals — 8.6% | |
| Celesio AG | | | 63,560 | | | | 1,735,885 | | |
| GlaxoSmithKline PLC | | | 191,344 | | | | 3,552,187 | | |
| Merck KGaA | | | 29,740 | | | | 2,703,887 | | |
| Novartis AG | | | 92,030 | | | | 4,611,116 | | |
| Sanofi-Aventis | | | 65,458 | | | | 4,157,493 | | |
Takeda
Pharmaceutical Co. Ltd. | | | 24,346 | | | | 1,262,886 | | |
| | | | 18,023,454 | | |
| Real Estate — 0.9% | |
| Cheung Kong Holdings | | | 187,215 | | | | 1,784,900 | | |
| Retail — 0.9% | |
| Kingfisher PLC | | | 960,424 | | | | 1,878,327 | | |
| Semiconductors — 3.0% | |
Infineon
Technologies AG(a) | | | 336,827 | | | | 463,616 | | |
| | | Number of
Shares | | Value | |
Samsung Electronics
Co. Ltd. | | | 8,883 | | | $ | 3,225,575 | | |
Taiwan Semiconductor
Manufacturing Co. Ltd. | | | 1,861,966 | | | | 2,548,529 | | |
| | | | 6,237,720 | | |
| Software — 1.5% | |
SAP AG Sponsored
ADR (Germany) | | | 73,930 | | | | 2,677,744 | | |
Satyam Computer
Services Ltd. | | | 105,069 | | | | 380,494 | | |
| | | | 3,058,238 | | |
| Telecommunications — 13.6% | |
China Telecom Corp. Ltd.
Class H | | | 4,991,643 | | | | 1,892,529 | | |
Chunghwa Telecom Co. Ltd.
ADR (Taiwan) | | | 95,733 | | | | 1,493,435 | | |
| France Telecom SA | | | 168,107 | | | | 4,702,150 | | |
Mobile TeleSystems
Sponsored ADR (Russia) | | | 37,930 | | | | 1,011,972 | | |
Singapore
Telecommunications Ltd. | | | 1,766,000 | | | | 3,144,398 | | |
SK Telecom Co. Ltd.
ADR (South Korea) | | | 55,680 | | | | 1,012,263 | | |
Telefonaktiebolaget LM
Ericsson Sponsored
ADR (Sweden) | | | 146,620 | | | | 1,145,102 | | |
Telefonica SA Sponsored
ADR (Spain) | | | 78,065 | | | | 5,260,800 | | |
Telefonos de Mexico
SAB de CV Class L
Sponsored ADR (Mexico) | | | 62,603 | | | | 1,310,907 | | |
| Telekom Austria AG | | | 156,560 | | | | 2,262,929 | | |
Telemex Internacional
SAB de CV Sponsored
ADR (Mexico) | | | 62,603 | | | | 711,170 | | |
| Telenor ASA | | | 253,576 | | | | 1,696,897 | | |
Vodafone Group PLC
Sponsored ADR
(United Kingdom) | | | 147,973 | | | | 3,024,568 | | |
| | | | 28,669,120 | | |
| Transportation — 1.2% | |
| Deutsche Post AG | | | 145,681 | | | | 2,464,631 | | |
| Water — 0.1% | |
| Suez Environnement SA(a) | | | 11,761 | | | | 198,312 | | |
TOTAL COMMON STOCK
(Cost $299,950,506) | | | 197,163,928 | | |
TOTAL EQUITIES
(Cost $299,950,506) | | | 197,163,928 | | |
| | | Number of
Shares | | Value | |
| RIGHTS — 0.1% | |
| Commercial Services — 0.1% | |
DBS Group
Holdings Ltd.(a) (b) | | | 83,826 | | | $ | 174,547 | | |
| TOTAL RIGHTS (Cost $0) | | | 174,547 | | |
TOTAL LONG-TERM
INVESTMENTS
(Cost $299,950,506) | | | 197,338,475 | | |
| | | Principal
Amount | | | |
| SHORT-TERM INVESTMENTS — 6.2% | |
| Repurchase Agreement — 6.2% | |
State Street Bank &
Trust Co. Repurchase
Agreement, dated
12/31/08, 0.010%,
due 1/02/09(c) | | $ | 13,009,067 | | | | 13,009,067 | | |
TOTAL SHORT-TERM
INVESTMENTS
(Cost $13,009,067) | | | 13,009,067 | | |
TOTAL INVESTMENTS — 100.0%
(Cost $312,959,573)(d) | | | 210,347,542 | | |
Other Assets/
(Liabilities) — 0.0% | | | 36,819 | | |
| NET ASSETS — 100.0% | | $ | 210,384,361 | | |
Notes to Portfolio of Investments
Industry classifications are unaudited.
ADR - American Depositary Receipt
(a) Non-income producing security.
(b) This security is valued in good faith under procedures established by the Board of Trustees.
(c) Maturity value of $13,009,074. Collateralized by U.S. Government Agency obligations with rates ranging from 1.495% - 4.834%, maturity dates ranging from 5/01/35 - 7/01/35, and an aggregate market value, including accrued interest, of $13,270,072.
(d) See Note 6 for aggregate cost for federal tax purposes.
The accompanying notes are an integral part of the financial statements.
109
MML Conservative Allocation Fund – Portfolio of Investments
December 31, 2008
| | | Number of
Shares | | Value | |
| MUTUAL FUNDS — 100.0% | |
| Diversified Financial — 100.0% | |
MML Blue Chip Growth
Fund, Initial Class(a) (b) | | | 1,368,103 | | | $ | 9,344,143 | | |
MML Equity Fund,
Initial Class(a) (b) | | | 487,414 | | | | 6,652,590 | | |
MML Equity Income Fund,
Initial Class(b) | | | 970,528 | | | | 6,619,004 | | |
MML Inflation-Protected
and Income Fund,
Initial Class(b) | | | 1,844,789 | | | | 17,562,392 | | |
MML Managed Bond Fund,
Initial Class(b) | | | 1,843,356 | | | | 22,084,926 | | |
MML Mid Cap Growth
Fund, Initial Class(b) | | | 447,406 | | | | 2,939,460 | | |
MML Mid Cap Value Fund,
Initial Class(b) | | | 277,856 | | | | 1,925,539 | | |
MML Small Cap Equity
Fund, Initial Class(b) | | | 548,366 | | | | 3,053,577 | | |
Oppenheimer Global
Securities Fund,
Non-Service Shares(b) | | | 192,387 | | | | 3,888,148 | | |
Oppenheimer
International Fund,
Non-Service Shares(b) | | | 3,206,078 | | | | 3,879,354 | | |
Oppenheimer Strategic
Bond Fund,
Non-Service Shares(b) | | | 2,976,558 | | | | 13,364,746 | | |
TOTAL MUTUAL FUNDS
(Cost $99,689,894) | | | 91,313,879 | | |
TOTAL LONG-TERM
INVESTMENTS
(Cost $99,689,894) | | | 91,313,879 | | |
TOTAL INVESTMENTS — 100.0%
(Cost $99,689,894)(c) | | | 91,313,879 | | |
Other Assets/
(Liabilities) — (0.0)% | | | (44,086 | ) | |
| NET ASSETS — 100.0% | | $ | 91,269,793 | | |
Notes to Portfolio of Investments
Industry classifications are unaudited.
(a) Non-income producing security.
(b) Affiliated issuer. (Note 7).
(c) See Note 6 for aggregate cost for federal tax purposes.
The remainder of this page is intentionally left blank.
The accompanying notes are an integral part of the financial statements.
110
MML Balanced Allocation Fund – Portfolio of Investments
December 31, 2008
| | | Number of
Shares | | Value | |
| MUTUAL FUNDS — 100.0% | |
| Diversified Financial — 100.0% | |
MML Blue Chip Growth
Fund, Initial Class(a) (b) | | | 1,848,430 | | | $ | 12,624,774 | | |
MML Concentrated
Growth Fund,
Class I(a) (b) | | | 952,713 | | | | 4,239,574 | | |
MML Equity Fund,
Initial Class(a) (b) | | | 836,101 | | | | 11,411,740 | | |
MML Equity Income Fund,
Initial Class(b) | | | 1,875,893 | | | | 12,793,591 | | |
MML Inflation-Protected and
Income Fund,
Initial Class(b) | | | 2,762,788 | | | | 26,301,740 | | |
MML Managed Bond Fund,
Initial Class(b) | | | 1,657,199 | | | | 19,854,616 | | |
MML Mid Cap Growth
Fund, Initial Class(b) | | | 671,697 | | | | 4,413,052 | | |
MML Mid Cap Value Fund,
Initial Class(b) | | | 625,830 | | | | 4,337,005 | | |
MML Small Cap Equity
Fund, Initial Class(a) (b) | | | 823,962 | | | | 4,588,237 | | |
Oppenheimer Capital
Appreciation Fund,
Non-Service Shares(a) (b) | | | 165,242 | | | | 4,241,763 | | |
Oppenheimer Global
Securities Fund,
Non-Service Shares(b) | | | 288,927 | | | | 5,839,220 | | |
Oppenheimer
International Fund,
Non-Service Shares(b) | | | 6,015,167 | | | | 7,278,352 | | |
Oppenheimer Strategic
Bond Fund,
Non-Service Shares(b) | | | 4,455,668 | | | | 20,005,948 | | |
| | | | 137,929,612 | | |
TOTAL MUTUAL FUNDS
(Cost $160,169,061) | | | 137,929,612 | | |
TOTAL LONG-TERM
INVESTMENTS
(Cost $160,169,061) | | | 137,929,612 | | |
TOTAL INVESTMENTS — 100.0%
(Cost $160,169,061)(c) | | | 137,929,612 | | |
Other Assets/
(Liabilities) — (0.0)% | | | (60,858 | ) | |
| NET ASSETS — 100.0% | | $ | 137,868,754 | | |
Notes to Portfolio of Investments
Industry classifications are unaudited.
(a) Non-income producing security.
(b) Affiliated issuer. (Note 7).
(c) See Note 6 for aggregate cost for federal tax purposes.
The accompanying notes are an integral part of the financial statements.
111
MML Moderate Allocation Fund – Portfolio of Investments
December 31, 2008
| | | Number of
Shares | | Value | |
| MUTUAL FUNDS — 100.0% | |
| Diversified Financial — 100.0% | |
MML Blue Chip Growth
Fund, Initial Class(a) (b) | | | 5,884,091 | | | $ | 40,188,344 | | |
MML Concentrated
Growth Fund,
Class I(a) (b) | | | 3,611,295 | | | | 16,070,264 | | |
MML Equity Fund,
Initial Class(a) (b) | | | 2,395,838 | | | | 32,700,202 | | |
MML Equity Income Fund,
Initial Class(b) | | | 5,970,364 | | | | 40,717,880 | | |
MML Inflation-Protected and
Income Fund,
Initial Class(b) | | | 5,918,451 | | | | 56,343,650 | | |
MML Managed Bond Fund,
Initial Class(b) | | | 4,738,435 | | | | 56,770,372 | | |
MML Mid Cap Growth
Fund, Initial Class(b) | | | 1,924,060 | | | | 12,641,077 | | |
MML Mid Cap Value Fund,
Initial Class(b) | | | 2,390,286 | | | | 16,564,683 | | |
MML Small Cap Equity
Fund, Initial Class(b) | | | 2,360,069 | | | | 13,142,058 | | |
MML Small Cap Growth
Equity Fund,
Initial Class(a) (b) | | | 1,230,182 | | | | 12,868,431 | | |
Oppenheimer Capital
Appreciation Fund,
Non-Service Shares(a) (b) | | | 478,872 | | | | 12,292,655 | | |
Oppenheimer Global
Securities Fund,
Non-Service Shares(b) | | | 1,035,133 | | | | 20,920,047 | | |
Oppenheimer
International Fund,
Non-Service Shares(b) | | | 24,139,724 | | | | 29,209,066 | | |
Oppenheimer Strategic
Bond Fund,
Non-Service Shares(b) | | | 8,496,375 | | | | 38,148,725 | | |
| | | | 398,577,454 | | |
TOTAL MUTUAL FUNDS
(Cost $470,532,607) | | | 398,577,454 | | |
| | | Value | |
TOTAL LONG-TERM
INVESTMENTS
(Cost $470,532,607) | | $ | 398,577,454 | | |
TOTAL INVESTMENTS — 100.0%
(Cost $470,532,607)(c) | | | 398,577,454 | | |
Other Assets/
(Liabilities) — (0.0)% | | | (119,716 | ) | |
| NET ASSETS — 100.0% | | $ | 398,457,738 | | |
Notes to Portfolio of Investments
Industry classifications are unaudited.
(a) Non-income producing security.
(b) Affiliated issuer. (Note 7).
(c) See Note 6 for aggregate cost for federal tax purposes.
The accompanying notes are an integral part of the financial statements.
112
MML Growth Allocation Fund – Portfolio of Investments
December 31, 2008
| | | Number of
Shares | | Value | |
| MUTUAL FUNDS — 100.0% | |
| Diversified Financial — 100.0% | |
MML Blue Chip Growth
Fund, Initial Class(a) (b) | | | 10,219,700 | | | $ | 69,800,549 | | |
MML Concentrated
Growth Fund,
Class I(a) (b) | | | 6,071,620 | | | | 27,018,709 | | |
MML Equity Fund,
Initial Class(a) (b) | | | 4,001,022 | | | | 54,608,969 | | |
MML Equity Income Fund,
Initial Class(b) | | | 9,576,843 | | | | 65,314,072 | | |
MML Inflation-Protected and
Income Fund,
Initial Class(b) | | | 4,730,038 | | | | 45,029,959 | | |
MML Managed Bond Fund,
Initial Class(b) | | | 3,370,337 | | | | 40,379,427 | | |
MML Mid Cap Growth
Fund, Initial Class(b) | | | 3,427,382 | | | | 22,517,900 | | |
MML Mid Cap Value Fund,
Initial Class(b) | | | 3,193,408 | | | | 22,130,318 | | |
MML Small Cap Equity
Fund, Initial Class(b) | | | 4,205,152 | | | | 23,416,409 | | |
MML Small Cap Growth
Equity Fund,
Initial Class(a) (b) | | | 1,643,634 | | | | 17,193,387 | | |
Oppenheimer Capital
Appreciation Fund,
Non-Service Shares(a) (b) | | | 846,394 | | | | 21,726,933 | | |
Oppenheimer Global
Securities Fund,
Non-Service Shares(b) | | | 1,660,514 | | | | 33,558,979 | | |
Oppenheimer
International Fund,
Non-Service Shares(b) | | | 46,087,125 | | | | 55,765,421 | | |
Oppenheimer Strategic
Bond Fund,
Non-Service Shares(b) | | | 9,059,104 | | | | 40,675,376 | | |
| | | | 539,136,408 | | |
TOTAL MUTUAL FUNDS
(Cost $672,966,078) | | | 539,136,408 | | |
| | | Value | |
TOTAL LONG-TERM
INVESTMENTS
(Cost $672,966,078) | | $ | 539,136,408 | | |
TOTAL INVESTMENTS — 100.0%
(Cost $672,966,078)(c) | | | 539,136,408 | | |
Other Assets/
(Liabilities) — (0.0)% | | | (140,423 | ) | |
| NET ASSETS — 100.0% | | $ | 538,995,985 | | |
Notes to Portfolio of Investments
Industry classifications are unaudited.
(a) Non-income producing security.
(b) Affiliated issuer. (Note 7).
(c) See Note 6 for aggregate cost for federal tax purposes.
The accompanying notes are an integral part of the financial statements.
113
MML Aggressive Allocation Fund – Portfolio of Investments
December 31, 2008
| | | Number of
Shares | | Value | |
| MUTUAL FUNDS — 100.1% | |
| Diversified Financial — 100.1% | |
MML Blue Chip Growth
Fund, Initial Class(a) (b) | | | 571,679 | | | $ | 3,904,568 | | |
MML Concentrated
Growth Fund,
Class I(a) (b) | | | 378,129 | | | | 1,682,676 | | |
MML Equity Fund,
Initial Class(a) (b) | | | 208,054 | | | | 2,839,685 | | |
MML Equity Income Fund,
Initial Class(b) | | | 498,757 | | | | 3,401,521 | | |
MML Inflation-Protected
and Income Fund,
Initial Class(b) | | | 108,023 | | | | 1,028,382 | | |
MML Managed Bond Fund,
Initial Class(b) | | | 65,142 | | | | 780,449 | | |
MML Mid Cap Growth
Fund, Initial Class(b) | | | 267,423 | | | | 1,756,967 | | |
MML Mid Cap Value Fund,
Initial Class(b) | | | 207,336 | | | | 1,436,839 | | |
MML Small Cap Equity
Fund, Initial Class(b) | | | 273,989 | | | | 1,525,710 | | |
MML Small Cap Growth
Equity Fund,
Initial Class(a) (b) | | | 142,574 | | | | 1,491,412 | | |
Oppenheimer Capital
Appreciation Fund,
Non-Service Shares(a) (b) | | | 44,352 | | | | 1,138,528 | | |
Oppenheimer Global
Securities Fund,
Non-Service Shares(b) | | | 129,715 | | | | 2,621,547 | | |
Oppenheimer
International Fund,
Non-Service Shares(b) | | | 3,356,784 | | | | 4,061,709 | | |
Oppenheimer Strategic
Bond Fund,
Non-Service Shares(b) | | | 174,891 | | | | 785,261 | | |
| | | | 28,455,254 | | |
TOTAL MUTUAL FUNDS
(Cost $39,250,941) | | | 28,455,254 | | |
| | | Value | |
TOTAL LONG-TERM
INVESTMENTS
(Cost $39,250,941) | | $ | 28,455,254 | | |
TOTAL INVESTMENTS — 100.1%
(Cost $39,250,941)(c) | | | 28,455,254 | | |
Other Assets/
(Liabilities) — (0.1)% | | | (25,252 | ) | |
| NET ASSETS — 100.0% | | $ | 28,430,002 | | |
Notes to Portfolio of Investments
Industry classifications are unaudited.
(a) Non-income producing security.
(b) Affiliated issuer. (Note 7).
(c) See Note 6 for aggregate cost for federal tax purposes.
The accompanying notes are an integral part of the financial statements.
114
MML American Funds Core Allocation Fund – Portfolio of Investments
December 31, 2008
| | | Number of
Shares | | Value | |
| MUTUAL FUNDS — 100.0% | |
| Diversified Financial — 100.0% | |
American Funds Blue Chip
Income and
Growth Fund | | | 2,522,853 | | | $ | 16,827,429 | | |
American Funds
Bond Fund | | | 2,537,375 | | | | 24,003,567 | | |
American Funds
Growth-Income Fund | | | 830,432 | | | | 20,137,971 | | |
American Funds
International Fund | | | 566,196 | | | | 6,918,916 | | |
TOTAL MUTUAL FUNDS
(Cost $69,067,156) | | | 67,887,883 | | |
TOTAL LONG-TERM
INVESTMENTS
(Cost $69,067,156) | | | 67,887,883 | | |
TOTAL INVESTMENTS — 100.0%
(Cost $69,067,156)(a) | | | 67,887,883 | | |
Other Assets/
(Liabilities) — (0.0)% | | | (14,208 | ) | |
| NET ASSETS — 100.0% | | $ | 67,873,675 | | |
Notes to Portfolio of Investments
Industry classifications are unaudited.
(a) See Note 6 for aggregate cost for federal tax purposes.
The remainder of this page is intentionally left blank.
The accompanying notes are an integral part of the financial statements.
115
MML American Funds Growth Fund – Portfolio of Investments
December 31, 2008
| | | Number of
Shares | | Value | |
| MUTUAL FUNDS — 99.5% | |
| Diversified Financial — 99.5% | |
American Funds
Insurance Series Funds | | | 180,516 | | | $ | 6,049,081 | | |
TOTAL MUTUAL FUNDS
(Cost $6,164,212) | | | 6,049,081 | | |
TOTAL INVESTMENTS — 99.5%
(Cost $6,164,212)(a) | | | 6,049,081 | | |
Other Assets/
(Liabilities) — 0.5% | | | 30,712 | | |
| NET ASSETS — 100.0% | | $ | 6,079,793 | | |
Notes to Portfolio of Investments
Industry classifications are unaudited.
(a) See Note 6 for aggregate cost for federal tax purposes.
The remainder of this page is intentionally left blank.
The accompanying notes are an integral part of the financial statements.
116
MML American Funds International Fund – Portfolio of Investments
December 31, 2008
| | | Number of
Shares | | Value | |
| MUTUAL FUNDS — 99.5% | |
| Diversified Financial — 99.5% | |
American Funds
International Fund | | | 522,016 | | | $ | 6,379,032 | | |
TOTAL MUTUAL FUNDS
(Cost $6,342,426) | | | 6,379,032 | | |
TOTAL INVESTMENTS — 99.5%
(Cost $6,342,426)(a) | | | 6,379,032 | | |
Other Assets/
(Liabilities) — 0.5% | | | 30,614 | | |
| NET ASSETS — 100.0% | | $ | 6,409,646 | | |
Notes to Portfolio of Investments
Industry classifications are unaudited.
(a) See Note 6 for aggregate cost for federal tax purposes.
The remainder of this page is intentionally left blank.
The accompanying notes are an integral part of the financial statements.
117
MML Series Investment Fund – Financial Statements
Statements of Assets and Liabilities
December 31, 2008
| | | MML
Asset
Allocation
Fund | | MML
Equity
Income
Fund | | MML
Income &
Growth
Fund | | MML
Growth &
Income
Fund | |
| Assets: | |
| Investments, at value (Note 2) (a) | | $ | 137,503,519 | | | $ | 353,838,958 | | | $ | 76,647,161 | | | $ | 131,151,829 | | |
| Short-term investments, at value (Note 2) (b) | | | 4,544,298 | | | | 5,858,259 | | | | 164,660 | | | | 3,110,277 | | |
| Total investments | | | 142,047,817 | | | | 359,697,217 | | | | 76,811,821 | | | | 134,262,106 | | |
| Foreign currency, at value (c) | | | 16,485 | | | | - | | | | - | | | | - | | |
| Receivables from: | |
| Investments sold | | | 699,299 | | | | - | | | | 1,477,969 | | | | - | | |
| Open forward foreign currency contracts (Note 2) | | | 2,171 | | | | - | | | | - | | | | - | | |
| Fund shares sold | | | 40,798 | | | | 4,325,161 | | | | 40,563 | | | | 233,305 | | |
| Interest and dividends | | | 741,133 | | | | 867,558 | | | | 168,556 | | | | 382,020 | | |
| Foreign taxes withheld | | | 6,923 | | | | 19,275 | | | | - | | | | 12,297 | | |
| Total assets | | | 143,554,626 | | | | 364,909,211 | | | | 78,498,909 | | | | 134,889,728 | | |
| Liabilities: | |
| Payables for: | |
| Investments purchased | | | 1,082,011 | | | | 4,410,571 | | | | 1,275,644 | | | | 56,288 | | |
| Open forward foreign currency contracts (Note 2) | | | 2,485 | | | | - | | | | - | | | | - | | |
| Fund shares repurchased | | | 243,982 | | | | 21,397 | | | | 25,627 | | | | 150,592 | | |
| Settlement of investments purchased on a when-issued basis (Note 2) | | | 4,005,403 | | | | - | | | | - | | | | - | | |
| Trustees' fees and expenses (Note 3) | | | 23,187 | | | | 32,697 | | | | 14,402 | | | | 25,206 | | |
| Affiliates (Note 3): | |
| Investment management fees | | | 67,243 | | | | 227,448 | | | | 43,795 | | | | 58,977 | | |
| Administration fees | | | - | | | | - | | | | - | | | | - | | |
| Service fees | | | 488 | | | | 1,690 | | | | 157 | | | | 363 | | |
| Accrued expense and other liabilities | | | 47,397 | | | | 51,339 | | | | 42,065 | | | | 43,154 | | |
| Total liabilities | | | 5,472,196 | | | | 4,745,142 | | | | 1,401,690 | | | | 334,580 | | |
| Net assets | | $ | 138,082,430 | | | $ | 360,164,069 | | | $ | 77,097,219 | | | $ | 134,555,148 | | |
| Net assets consist of: | |
| Paid-in capital | | $ | 207,996,858 | | | $ | 513,776,151 | | | $ | 116,509,081 | | | $ | 235,937,368 | | |
Undistributed (accumulated) net investment income (loss) (distributions in
excess of net investment income) | | | 5,552,206 | | | | 9,380,732 | | | | 2,062,917 | | | | 2,842,220 | | |
| Accumulated net realized gain (loss) on investments | | | (42,060,320 | ) | | | (24,154,946 | ) | | | (19,616,271 | ) | | | (59,781,416 | ) | |
| Net unrealized appreciation (depreciation) on investments | | | (33,406,314 | ) | | | (138,837,868 | ) | | | (21,858,508 | ) | | | (44,443,024 | ) | |
| Net assets | | $ | 138,082,430 | | | $ | 360,164,069 | | | $ | 77,097,219 | | | $ | 134,555,148 | | |
| (a) Cost of investments - unaffiliated issuers: | | $ | 170,897,173 | | | $ | 492,674,966 | | | $ | 98,505,669 | | | $ | 175,594,853 | | |
| (b) Cost of short-term investments: | | $ | 4,544,298 | | | $ | 5,858,259 | | | $ | 164,660 | | | $ | 3,110,277 | | |
| (c) Cost of foreign currency: | | $ | 28,305 | | | $ | - | | | $ | - | | | $ | - | | |
The accompanying notes are an integral part of the financial statements.
118
| | | MML
Blue Chip
Growth
Fund | | MML
Large Cap
Growth
Fund | | MML
Concentrated
Growth
Fund | |
| Assets: | |
| Investments, at value (Note 2) (a) | | $ | 168,758,125 | | | $ | 36,058,749 | | | $ | 78,556,944 | | |
| Short-term investments, at value (Note 2) (b) | | | 3,406,896 | | | | 545,483 | | | | 2,093,089 | | |
| Total investments | | | 172,165,021 | | | | 36,604,232 | | | | 80,650,033 | | |
| Foreign currency, at value (c) | | | - | | | | - | | | | - | | |
| Receivables from: | |
| Investments sold | | | 334,788 | | | | - | | | | 517,687 | | |
| Open forward foreign currency contracts (Note 2) | | | - | | | | - | | | | - | | |
| Fund shares sold | | | 660,250 | | | | 19,443 | | | | 712,665 | | |
| Interest and dividends | | | 174,679 | | | | 52,734 | | | | 149,805 | | |
| Foreign taxes withheld | | | 7,923 | | | | 6,286 | | | | - | | |
| Total assets | | | 173,342,661 | | | | 36,682,695 | | | | 82,030,190 | | |
| Liabilities: | |
| Payables for: | |
| Investments purchased | | | 2,807,910 | | | | 181,287 | | | | 1,833,419 | | |
| Open forward foreign currency contracts (Note 2) | | | - | | | | - | | | | - | | |
| Fund shares repurchased | | | 1,965 | | | | 3,204 | | | | 1,675 | | |
| Settlement of investments purchased on a when-issued basis (Note 2) | | | - | | | | - | | | | - | | |
| Trustees' fees and expenses (Note 3) | | | 6,583 | | | | 6,615 | | | | 8,618 | | |
| Affiliates (Note 3): | |
| Investment management fees | | | 104,470 | | | | 20,928 | | | | 39,958 | | |
| Administration fees | | | - | | | | - | | | | 14,220 | | |
| Service fees | | | 479 | | | | 78 | | | | 150 | | |
| Accrued expense and other liabilities | | | 46,849 | | | | 38,077 | | | | 43,064 | | |
| Total liabilities | | | 2,968,256 | | | | 250,189 | | | | 1,941,104 | | |
| Net assets | | $ | 170,374,405 | | | $ | 36,432,506 | | | $ | 80,089,086 | | |
| Net assets consist of: | |
| Paid-in capital | | $ | 227,529,531 | | | $ | 54,540,380 | | | $ | 158,598,438 | | |
Undistributed (accumulated) net investment income (loss) (distributions in
excess of net investment income) | | | 234,816 | | | | 188,557 | | | | 340,322 | | |
| Accumulated net realized gain (loss) on investments | | | (18,147,669 | ) | | | (8,126,500 | ) | | | (51,741,304 | ) | |
| Net unrealized appreciation (depreciation) on investments | | | (39,242,273 | ) | | | (10,169,931 | ) | | | (27,108,370 | ) | |
| Net assets | | $ | 170,374,405 | | | $ | 36,432,506 | | | $ | 80,089,086 | | |
| (a) Cost of investments - unaffiliated issuers: | | $ | 208,000,722 | | | $ | 46,228,680 | | | $ | 105,665,314 | | |
| (b) Cost of short-term investments: | | $ | 3,406,896 | | | $ | 545,483 | | | $ | 2,093,089 | | |
| (c) Cost of foreign currency: | | $ | - | | | $ | - | | | $ | - | | |
119
MML Series Investment Fund – Financial Statements (Continued)
Statements of Assets and Liabilities
December 31, 2008
| | | MML
Asset
Allocation
Fund | | MML
Equity
Income
Fund | | MML
Income &
Growth
Fund | | MML
Growth &
Income
Fund | |
| Initial Class shares: | |
| Net assets | | $ | 136,325,537 | | | $ | 353,861,933 | | | $ | 76,446,955 | | | $ | 133,236,216 | | |
| Shares outstanding(a) | | | 19,747,063 | | | | 51,889,341 | | | | 11,436,962 | | | | 22,711,374 | | |
| Net asset value, offering price and redemption price per share | | $ | 6.90 | | | $ | 6.82 | | | $ | 6.68 | | | $ | 5.87 | | |
| Class I shares: | |
| Net assets | | $ | - | | | $ | - | | | $ | - | | | $ | - | | |
| Shares outstanding(a) | | | - | | | | - | | | | - | | | | - | | |
| Net asset value and redemption price per share | | $ | - | | | $ | - | | | $ | - | | | $ | - | | |
| Class II shares: | |
| Net assets | | $ | - | | | $ | - | | | $ | - | | | $ | - | | |
| Shares outstanding(a) | | | - | | | | - | | | | - | | | | - | | |
| Net asset value, offering price and redemption price per share | | $ | - | | | $ | - | | | $ | - | | | $ | - | | |
| Service Class shares*: | |
| Net assets | | $ | 1,756,893 | | | $ | 6,302,136 | | | $ | 650,264 | | | $ | 1,318,932 | | |
| Shares outstanding(a) | | | 254,753 | | | | 924,721 | | | | 97,340 | | | | 225,019 | | |
| Net asset value, offering price and redemption price per share | | $ | 6.90 | | | $ | 6.82 | | | $ | 6.68 | | | $ | 5.86 | | |
| Service Class I shares**: | |
| Net assets | | $ | - | | | $ | - | | | $ | - | | | $ | - | | |
| Shares outstanding(a) | | | - | | | | - | | | | - | | | | - | | |
| Net asset value, offering price and redemption price per share | | $ | - | | | $ | - | | | $ | - | | | $ | - | | |
(a) Authorized unlimited number of shares with no par value.
* Service Class shares commenced operations on August 15, 2008.
** Service Class I shares commenced operations on August 15, 2008.
The accompanying notes are an integral part of the financial statements.
120
| | | MML
Blue Chip
Growth
Fund | | MML
Large Cap
Growth
Fund | | MML
Concentrated
Growth
Fund | |
| Initial Class shares: | |
| Net assets | | $ | 168,558,394 | | | $ | 36,196,926 | | | $ | - | | |
| Shares outstanding(a) | | | 24,665,078 | | | | 5,393,230 | | | | - | | |
| Net asset value, offering price and redemption price per share | | $ | 6.83 | | | $ | 6.71 | | | $ | - | | |
| Class I shares: | |
| Net assets | | $ | - | | | $ | - | | | $ | 59,616,994 | | |
| Shares outstanding(a) | | | - | | | | - | | | | 13,384,382 | | |
| Net asset value and redemption price per share | | $ | - | | | $ | - | | | $ | 4.45 | | |
| Class II shares: | |
| Net assets | | $ | - | | | $ | - | | | $ | 19,978,306 | | |
| Shares outstanding(a) | | | - | | | | - | | | | 4,477,369 | | |
| Net asset value, offering price and redemption price per share | | $ | - | | | $ | - | | | $ | 4.46 | | |
| Service Class shares*: | |
| Net assets | | $ | 1,816,011 | | | $ | 235,580 | | | $ | - | | |
| Shares outstanding(a) | | | 265,922 | | | | 35,127 | | | | - | | |
| Net asset value, offering price and redemption price per share | | $ | 6.83 | | | $ | 6.71 | | | $ | - | | |
| Service Class I shares**: | |
| Net assets | | $ | - | | | $ | - | | | $ | 493,786 | | |
| Shares outstanding(a) | | | - | | | | - | | | | 110,949 | | |
| Net asset value, offering price and redemption price per share | | $ | - | | | $ | - | | | $ | 4.45 | | |
121
MML Series Investment Fund – Financial Statements (Continued)
Statements of Assets and Liabilities
December 31, 2008
| | | MML
Mid Cap
Value
Fund | | MML
Mid Cap
Growth
Fund | | MML
Small/Mid
Cap Value
Fund | | MML
Small Cap
Index
Fund | |
| Assets: | |
| Investments, at value (Note 2) (a) | | $ | 288,839,734 | | | $ | 177,739,169 | | | $ | 133,869,215 | | | $ | 34,444,290 | | |
| Investments, at value - affiliated issuers (Note 2) (b) | | | - | | | | - | | | | - | | | | - | | |
| Short-term investments, at value (Note 2) (c) | | | 2,069,519 | | | | 9,665,202 | | | | 2,451,634 | | | | 814,585 | | |
| Total investments | | | 290,909,253 | | | | 187,404,371 | | | | 136,320,849 | | | | 35,258,875 | | |
| Foreign currency, at value (d) | | | 6,817 | | | | - | | | | - | | | | - | | |
| Receivables from: | |
| Investments sold | | | 10,603,561 | | | | 287,332 | | | | 923,088 | | | | 216,174 | | |
| Open forward foreign currency contracts (Note 2) | | | 1,263 | | | | - | | | | - | | | | - | | |
| Investment adviser (Note 3) | | | - | | | | - | | | | - | | | | - | | |
| Fund shares sold | | | 232,382 | | | | 678,628 | | | | 9,724,277 | | | | 44,063 | | |
| Interest and dividends | | | 876,224 | | | | 75,023 | | | | 231,088 | | | | 49,410 | | |
| Variation margin on open futures contracts (Note 2) | | | - | | | | - | | | | - | | | | 26,975 | | |
| Foreign taxes withheld | | | 4,629 | | | | - | | | | - | | | | - | | |
| Total assets | | | 302,634,129 | | | | 188,445,354 | | | | 147,199,302 | | | | 35,595,497 | | |
| Liabilities: | |
| Payables for: | |
| Investments purchased | | | 7,219,183 | | | | 550,398 | | | | 314,575 | | | | 397,303 | | |
| Open forward foreign currency contracts (Note 2) | | | 63,172 | | | | - | | | | - | | | | - | | |
| Fund shares repurchased | | | 1,338,673 | | | | 56,526 | | | | 72,226 | | | | 11,982 | | |
| Variation margin on open futures contracts (Note 2) | | | - | | | | - | | | | - | | | | - | | |
| Investment Advisory fees | | | - | | | | - | | | | - | | | | - | | |
| Trustees' fees and expenses (Note 3) | | | 35,604 | | | | 26,355 | | | | 20,272 | | | | 5,746 | | |
| Affiliates (Note 3): | |
| Investment management fees | | | 209,639 | | | | 121,156 | | | | 86,017 | | | | 10,306 | | |
| Administration fees | | | - | | | | - | | | | - | | | | - | | |
| Service fees | | | 652 | | | | 1,025 | | | | 367 | | | | 333 | | |
| Accrued expense and other liabilities | | | 55,081 | | | | 46,717 | | | | 42,525 | | | | 41,777 | | |
| Total liabilities | | | 8,922,004 | | | | 802,177 | | | | 535,982 | | | | 467,447 | | |
| Net assets | | $ | 293,712,125 | | | $ | 187,643,177 | | | $ | 146,663,320 | | | $ | 35,128,050 | | |
| Net assets consist of: | |
| Paid-in capital | | $ | 428,249,315 | | | $ | 275,280,096 | | | $ | 274,425,361 | | | $ | 54,987,986 | | |
Undistributed (accumulated) net investment income (loss) (distributions in
excess of net investment income) | | | 7,322,340 | | | | (31,930 | ) | | | 2,110,865 | | | | 470,282 | | |
| Accumulated net realized gain (loss) on investments | | | (100,607,481 | ) | | | (15,873,624 | ) | | | (62,253,190 | ) | | | (794,729 | ) | |
| Net unrealized appreciation (depreciation) on investments | | | (41,252,049 | ) | | | (71,731,365 | ) | | | (67,619,716 | ) | | | (19,535,489 | ) | |
| Net assets | | $ | 293,712,125 | | | $ | 187,643,177 | | | $ | 146,663,320 | | | $ | 35,128,050 | | |
| (a) Cost of investments - unaffiliated issuers: | | $ | 330,028,924 | | | $ | 249,470,517 | | | $ | 201,488,931 | | | $ | 54,013,282 | | |
| (b) Cost of investments - affiliated issuers: | | $ | - | | | $ | - | | | $ | - | | | $ | - | | |
| (c) Cost of short-term investments: | | $ | 2,069,519 | | | $ | 9,665,202 | | | $ | 2,451,634 | | | $ | 814,585 | | |
| (d) Cost of foreign currency: | | $ | 6,888 | | | $ | - | | | $ | - | | | $ | - | | |
The accompanying notes are an integral part of the financial statements.
122
| | | MML
Global
Fund | | MML
Foreign
Fund | | MML
Conservative
Allocation
Fund | |
| Assets: | |
| Investments, at value (Note 2) (a) | | $ | 23,007,266 | | | $ | 197,338,475 | | | $ | - | | |
| Investments, at value - affiliated issuers (Note 2) (b) | | | - | | | | - | | | | 91,313,879 | | |
| Short-term investments, at value (Note 2) (c) | | | 1,260,048 | | | | 13,009,067 | | | | - | | |
| Total investments | | | 24,267,314 | | | | 210,347,542 | | | | 91,313,879 | | |
| Foreign currency, at value (d) | | | 96,964 | | | | 827,332 | | | | - | | |
| Receivables from: | |
| Investments sold | | | 68,950 | | | | 7,934 | | | | - | | |
| Open forward foreign currency contracts (Note 2) | | | - | | | | - | | | | - | | |
| Investment adviser (Note 3) | | | - | | | | - | | | | 9,427 | | |
| Fund shares sold | | | 65,200 | | | | 107,545 | | | | 408,774 | | |
| Interest and dividends | | | 41,588 | | | | 369,906 | | | | - | | |
| Variation margin on open futures contracts (Note 2) | | | - | | | | - | | | | - | | |
| Foreign taxes withheld | | | 29,341 | | | | 190,900 | | | | - | | |
| Total assets | | | 24,569,357 | | | | 211,851,159 | | | | 91,732,080 | | |
| Liabilities: | |
| Payables for: | |
| Investments purchased | | | 5,678 | | | | - | | | | 398,075 | | |
| Open forward foreign currency contracts (Note 2) | | | - | | | | - | | | | - | | |
| Fund shares repurchased | | | 2,523 | | | | 1,207,957 | | | | 10,646 | | |
| Variation margin on open futures contracts (Note 2) | | | - | | | | - | | | | - | | |
| Investment Advisory fees | | | 22,932 | | | | - | | | | - | | |
| Trustees' fees and expenses (Note 3) | | | 4,965 | | | | 27,419 | | | | 1,246 | | |
| Affiliates (Note 3): | |
| Investment management fees | | | 12,716 | | | | 162,311 | | | | 7,286 | | |
| Administration fees | | | 4,315 | | | | - | | | | - | | |
| Service fees | | | 95 | | | | 496 | | | | 10,526 | | |
| Accrued expense and other liabilities | | | 54,774 | | | | 68,615 | | | | 34,508 | | |
| Total liabilities | | | 107,998 | | | | 1,466,798 | | | | 462,287 | | |
| Net assets | | $ | 24,461,359 | | | $ | 210,384,361 | | | $ | 91,269,793 | | |
| Net assets consist of: | |
| Paid-in capital | | $ | 43,095,272 | | | $ | 314,630,390 | | | $ | 99,458,013 | | |
Undistributed (accumulated) net investment income (loss) (distributions in
excess of net investment income) | | | 682,746 | | | | 6,154,845 | | | | 1,023,850 | | |
| Accumulated net realized gain (loss) on investments | | | (11,850,199 | ) | | | (7,755,767 | ) | | | (836,055 | ) | |
| Net unrealized appreciation (depreciation) on investments | | | (7,466,460 | ) | | | (102,645,107 | ) | | | (8,376,015 | ) | |
| Net assets | | $ | 24,461,359 | | | $ | 210,384,361 | | | $ | 91,269,793 | | |
| (a) Cost of investments - unaffiliated issuers: | | $ | 30,471,445 | | | $ | 299,950,506 | | | $ | - | | |
| (b) Cost of investments - affiliated issuers: | | $ | - | | | $ | - | | | $ | 99,689,894 | | |
| (c) Cost of short-term investments: | | $ | 1,260,048 | | | $ | 13,009,067 | | | $ | - | | |
| (d) Cost of foreign currency: | | $ | 97,659 | | | $ | 848,596 | | | $ | - | | |
123
MML Series Investment Fund – Financial Statements (Continued)
Statements of Assets and Liabilities
December 31, 2008
| | | MML
Mid Cap
Value
Fund | | MML
Mid Cap
Growth
Fund | | MML
Small/Mid
Cap Value
Fund | | MML
Small Cap
Index
Fund | |
| Initial Class shares: | |
| Net assets | | $ | 291,433,328 | | | $ | 183,886,111 | | | $ | 145,128,584 | | | $ | 33,943,812 | | |
| Shares outstanding(a) | | | 42,064,804 | | | | 27,981,135 | | | | 27,833,592 | | | | 5,233,527 | | |
| Net asset value, offering price and redemption price per share | | $ | 6.93 | | | $ | 6.57 | | | $ | 5.21 | | | $ | 6.49 | | |
| Class I shares: | |
| Net assets | | $ | - | | | $ | - | | | $ | - | | | $ | - | | |
| Shares outstanding(a) | | | - | | | | - | | | | - | | | | - | | |
| Net asset value and redemption price per share | | $ | - | | | $ | - | | | $ | - | | | $ | - | | |
| Class II shares: | |
| Net assets | | $ | - | | | $ | - | | | $ | - | | | $ | - | | |
| Shares outstanding(a) | | | - | | | | - | | | | - | | | | - | | |
| Net asset value, offering price and redemption price per share | | $ | - | | | $ | - | | | $ | - | | | $ | - | | |
| Service Class shares*: | |
| Net assets | | $ | 2,278,797 | | | $ | 3,757,066 | | | $ | 1,534,736 | | | $ | 1,184,238 | | |
| Shares outstanding(a) | | | 329,204 | | | | 572,118 | | | | 294,447 | | | | 182,823 | | |
| Net asset value, offering price and redemption price per share | | $ | 6.92 | | | $ | 6.57 | | | $ | 5.21 | | | $ | 6.48 | | |
| Service Class I shares**: | |
| Net assets | | $ | - | | | $ | - | | | $ | - | | | $ | - | | |
| Shares outstanding(a) | | | - | | | | - | | | | - | | | | - | | |
| Net asset value, offering price and redemption price per share | | $ | - | | | $ | - | | | $ | - | | | $ | - | | |
(a) Authorized unlimited number of shares with no par value.
* Service Class shares commenced operations on August 15, 2008.
** Service Class I shares commenced operations on August 15, 2008.
The accompanying notes are an integral part of the financial statements.
124
| | | MML
Global
Fund | | MML
Foreign
Fund | | MML
Conservative
Allocation
Fund | |
| Initial Class shares: | |
| Net assets | | $ | - | | | $ | 208,709,088 | | | $ | 52,818,815 | | |
| Shares outstanding(a) | | | - | | | | 29,497,595 | | | | 6,483,771 | | |
| Net asset value, offering price and redemption price per share | | $ | - | | | $ | 7.08 | | | $ | 8.15 | | |
| Class I shares: | |
| Net assets | | $ | 5,589,283 | | | $ | - | | | $ | - | | |
| Shares outstanding(a) | | | 966,622 | | | | - | | | | - | | |
| Net asset value and redemption price per share | | $ | 5.78 | | | $ | - | | | $ | - | | |
| Class II shares: | |
| Net assets | | $ | 18,606,649 | | | $ | - | | | $ | - | | |
| Shares outstanding(a) | | | 3,194,159 | | | | - | | | | - | | |
| Net asset value, offering price and redemption price per share | | $ | 5.83 | | | $ | - | | | $ | - | | |
| Service Class shares*: | |
| Net assets | | $ | - | | | $ | 1,675,273 | | | $ | 38,450,978 | | |
| Shares outstanding(a) | | | - | | | | 236,860 | | | | 4,724,561 | | |
| Net asset value, offering price and redemption price per share | | $ | - | | | $ | 7.07 | | | $ | 8.14 | | |
| Service Class I shares**: | |
| Net assets | | $ | 265,427 | | | $ | - | | | $ | - | | |
| Shares outstanding(a) | | | 45,729 | | | | - | | | | - | | |
| Net asset value, offering price and redemption price per share | | $ | 5.80 | | | $ | - | | | $ | - | | |
125
MML Series Investment Fund – Financial Statements (Continued)
Statements of Assets and Liabilities
December 31, 2008
| | | MML
Balanced
Allocation
Fund | | MML
Moderate
Allocation
Fund | | MML
Growth
Allocation
Fund | | MML
Aggressive
Allocation
Fund | |
| Assets: | |
| Investments, at value (Note 2) (a) | | $ | - | | | $ | - | | | $ | - | | | $ | - | | |
| Investments, at value - affiliated issuers (Note 2) (b) | | | 137,929,612 | | | | 398,577,454 | | | | 539,136,408 | | | | 28,455,254 | | |
| Total investments | | | 137,929,612 | | | | 398,577,454 | | | | 539,136,408 | | | | 28,455,254 | | |
| Receivables from: | |
| Investments sold | | | - | | | | - | | | | - | | | | - | | |
| Investment adviser (Note 3) | | | 1,977 | | | | - | | | | 5,060 | | | | 12,933 | | |
| Fund shares sold | | | 401,275 | | | | 775,216 | | | | 2,037,650 | | | | 7,634 | | |
| Total assets | | | 138,332,864 | | | | 399,352,670 | | | | 541,179,118 | | | | 28,475,821 | | |
| Liabilities: | |
| Payables for: | |
| Investments purchased | | | 397,979 | | | | 758,616 | | | | 2,034,713 | | | | 6,759 | | |
| Fund shares repurchased | | | 3,207 | | | | 16,347 | | | | 2,586 | | | | 854 | | |
| Trustees' fees and expenses (Note 3) | | | 2,255 | | | | 6,678 | | | | 10,022 | | | | 771 | | |
| Affiliates (Note 3): | |
| Investment management fees | | | 11,070 | | | | 32,009 | | | | 43,311 | | | | 2,352 | | |
| Administration fees | | | - | | | | - | | | | - | | | | - | | |
| Service fees | | | 14,249 | | | | 42,065 | | | | 51,223 | | | | 1,012 | | |
| Accrued expense and other liabilities | | | 35,350 | | | | 39,217 | | | | 41,278 | | | | 34,071 | | |
| Total liabilities | | | 464,110 | | | | 894,932 | | | | 2,183,133 | | | | 45,819 | | |
| Net assets | | $ | 137,868,754 | | | $ | 398,457,738 | | | $ | 538,995,985 | | | $ | 28,430,002 | | |
| Net assets consist of: | |
| Paid-in capital | | $ | 160,265,588 | | | $ | 470,555,905 | | | $ | 673,838,329 | | | $ | 39,577,113 | | |
Undistributed (accumulated) net investment income (loss) (distributions in
excess of net investment income) | | | 1,427,794 | | | | 3,632,522 | | | | 3,227,041 | | | | 99,528 | | |
| Accumulated net realized gain (loss) on investments | | | (1,585,179 | ) | | | (3,775,536 | ) | | | (4,239,715 | ) | | | (450,952 | ) | |
| Net unrealized appreciation (depreciation) on investments | | | (22,239,449 | ) | | | (71,955,153 | ) | | | (133,829,670 | ) | | | (10,795,687 | ) | |
| Net assets | | $ | 137,868,754 | | | $ | 398,457,738 | | | $ | 538,995,985 | | | $ | 28,430,002 | | |
| (a) Cost of investments - unaffiliated issuers: | | $ | - | | | $ | - | | | $ | - | | | $ | - | | |
| (b) Cost of investments - affiliated issuers: | | $ | 160,169,061 | | | $ | 470,532,607 | | | $ | 672,966,078 | | | $ | 39,250,941 | | |
The accompanying notes are an integral part of the financial statements.
126
| | | MML
American
Funds Core
Allocation
Fund | | MML
American
Funds
Growth
Fund | | MML
American
Funds
International
Fund | |
| Assets: | |
| Investments, at value (Note 2) (a) | | $ | 67,887,883 | | | $ | 6,049,081 | | | $ | 6,379,032 | | |
| Investments, at value - affiliated issuers (Note 2) (b) | | | - | | | | - | | | | - | | |
| Total investments | | | 67,887,883 | | | | 6,049,081 | | | | 6,379,032 | | |
| Receivables from: | |
| Investments sold | | | 157 | | | | 2 | | | | 73,586 | | |
| Investment adviser (Note 3) | | | 50,108 | | | | 56,531 | | | | 56,534 | | |
| Fund shares sold | | | 165,217 | | | | 71,958 | | | | 20 | | |
| Total assets | | | 68,103,365 | | | | 6,177,572 | | | | 6,509,172 | | |
| Liabilities: | |
| Payables for: | |
| Investments purchased | | | 165,217 | | | | 71,958 | | | | 20 | | |
| Fund shares repurchased | | | 134 | | | | - | | | | 73,583 | | |
| Trustees' fees and expenses (Note 3) | | | 494 | | | | 48 | | | | 48 | | |
| Affiliates (Note 3): | |
| Investment management fees | | | 9,059 | | | | 608 | | | | 631 | | |
| Administration fees | | | 11,323 | | | | 1,013 | | | | 1,051 | | |
| Service fees | | | 18,380 | | | | 1,720 | | | | 1,764 | | |
| Accrued expense and other liabilities | | | 25,083 | | | | 22,432 | | | | 22,429 | | |
| Total liabilities | | | 229,690 | | | | 97,779 | | | | 99,526 | | |
| Net assets | | $ | 67,873,675 | | | $ | 6,079,793 | | | $ | 6,409,646 | | |
| Net assets consist of: | |
| Paid-in capital | | $ | 67,271,679 | | | $ | 6,194,066 | | | $ | 6,306,334 | | |
Undistributed (accumulated) net investment income (loss) (distributions in
excess of net investment income) | | | 1,842,366 | | | | 63,462 | | | | 140,654 | | |
| Accumulated net realized gain (loss) on investments | | | (61,097 | ) | | | (62,604 | ) | | | (73,948 | ) | |
| Net unrealized appreciation (depreciation) on investments | | | (1,179,273 | ) | | | (115,131 | ) | | | 36,606 | | |
| Net assets | | $ | 67,873,675 | | | $ | 6,079,793 | | | $ | 6,409,646 | | |
| (a) Cost of investments - unaffiliated issuers: | | $ | 69,067,156 | | | $ | 6,164,212 | | | $ | 6,342,426 | | |
| (b) Cost of investments - affiliated issuers: | | $ | - | | | $ | - | | | $ | - | | |
127
MML Series Investment Fund – Financial Statements (Continued)
Statements of Assets and Liabilities
December 31, 2008
| | | MML
Balanced
Allocation
Fund | | MML
Moderate
Allocation
Fund | | MML
Growth
Allocation
Fund | | MML
Aggressive
Allocation
Fund | |
| Initial Class shares: | |
| Net assets | | $ | 88,582,882 | | | $ | 251,682,248 | | | $ | 354,595,298 | | | $ | 24,476,645 | | |
| Shares outstanding(a) | | | 11,674,782 | | | | 34,663,761 | | | | 53,256,783 | | | | 3,979,064 | | |
| Net asset value, offering price and redemption price per share | | $ | 7.59 | | | $ | 7.26 | | | $ | 6.66 | | | $ | 6.15 | | |
| Service Class shares*: | |
| Net assets | | $ | 49,285,872 | | | $ | 146,775,490 | | | $ | 184,400,687 | | | $ | 3,953,357 | | |
| Shares outstanding(a) | | | 6,496,798 | | | | 20,227,160 | | | | 27,704,477 | | | | 643,612 | | |
| Net asset value, offering price and redemption price per share | | $ | 7.59 | | | $ | 7.26 | | | $ | 6.66 | | | $ | 6.14 | | |
| Service Class I shares**: | |
| Net assets | | $ | - | | | $ | - | | | $ | - | | | $ | - | | |
| Shares outstanding(a) | | | - | | | | - | | | | - | | | | - | | |
| Net asset value, offering price and redemption price per share | | $ | - | | | $ | - | | | $ | - | | | $ | - | | |
(a) Authorized unlimited number of shares with no par value.
* Service Class shares commenced operations on August 15, 2008.
** Service Class I shares commenced operations on August 15, 2008.
The accompanying notes are an integral part of the financial statements.
128
| | | MML
American
Funds Core
Allocation
Fund | | MML
American
Funds
Growth
Fund | | MML
American
Funds
International
Fund | |
| Initial Class shares: | |
| Net assets | | $ | - | | | $ | - | | | $ | - | | |
| Shares outstanding(a) | | | - | | | | - | | | | - | | |
| Net asset value, offering price and redemption price per share | | $ | - | | | $ | - | | | $ | - | | |
| Service Class shares*: | |
| Net assets | | $ | - | | | $ | - | | | $ | - | | |
| Shares outstanding(a) | | | - | | | | - | | | | - | | |
| Net asset value, offering price and redemption price per share | | $ | - | | | $ | - | | | $ | - | | |
| Service Class I shares**: | |
| Net assets | | $ | 67,873,675 | | | $ | 6,079,793 | | | $ | 6,409,646 | | |
| Shares outstanding(a) | | | 8,760,264 | | | | 956,114 | | | | 926,001 | | |
| Net asset value, offering price and redemption price per share | | $ | 7.75 | | | $ | 6.36 | | | $ | 6.92 | | |
129
MML Series Investment Fund – Financial Statements (Continued)
Statements of Operations
For the Year Ended December 31, 2008
| | | MML
Asset
Allocation
Fund | | MML
Equity
Income
Fund | | MML
Income &
Growth
Fund | | MML
Growth &
Income
Fund | |
| Investment income (Note 2): | |
| Dividends (a) | | $ | 2,539,459 | | | $ | 11,891,022 | | | $ | 2,901,155 | | | $ | 3,894,968 | | |
| Interest | | | 3,902,517 | | | | 431,893 | | | | 2,234 | | | | 52,869 | | |
| Securities lending net income | | | 32,766 | | | | 55,021 | | | | 15,431 | | | | 41,727 | | |
| Total investment income | | | 6,474,742 | | | | 12,377,936 | | | | 2,918,820 | | | | 3,989,564 | | |
| Expenses (Note 3): | |
| Investment management fees | | | 1,099,651 | | | | 2,804,147 | | | | 743,634 | | | | 1,026,259 | | |
| Custody fees | | | 35,254 | | | | 41,968 | | | | 23,900 | | | | 22,514 | | |
| Audit and legal fees | | | 41,828 | | | | 46,365 | | | | 38,236 | | | | 40,368 | | |
| Proxy fees | | | 1,257 | | | | 892 | | | | 995 | | | | 1,257 | | |
| Shareholder reporting fees | | | 26,682 | | | | 33,008 | | | | 21,104 | | | | 27,049 | | |
| Trustees' fees | | | 29,491 | | | | 49,061 | | | | 17,093 | | | | 30,915 | | |
| | | | 1,234,163 | | | | 2,975,441 | | | | 844,962 | | | | 1,148,362 | | |
| Administration fees: | |
| Class I | | | - | | | | - | | | | - | | | | - | | |
| Class II | | | - | | | | - | | | | - | | | | - | | |
| Service Class I** | | | - | | | | - | | | | - | | | | - | | |
| Service fees: | |
| Service Class* | | | 523 | | | | 1,734 | | | | 188 | | | | 397 | | |
| Service Class I** | | | - | | | | - | | | | - | | | | - | | |
| Total expenses | | | 1,234,686 | | | | 2,977,175 | | | | 845,150 | | | | 1,148,759 | | |
| Expenses waived (Note 3): | |
| Initial Class fees waived by advisor | | | (24,722 | ) | | | - | | | | (9,853 | ) | | | (21,391 | ) | |
| Class I fees waived by advisor | | | - | | | | - | | | | - | | | | - | | |
| Class II fees waived by advisor | | | - | | | | - | | | | - | | | | - | | |
| Net expenses | | | 1,209,964 | | | | 2,977,175 | | | | 835,297 | | | | 1,127,368 | | |
| Net investment income (loss) | | | 5,264,778 | | | | 9,400,761 | | | | 2,083,523 | | | | 2,862,196 | | |
| Realized and unrealized gain (loss): | |
| Net realized gain (loss) on: | |
| Investment transactions | | | (40,989,390 | ) | | | (24,007,154 | ) | | | (16,109,727 | ) | | | (58,835,920 | ) | |
| Futures contracts | | | - | | | | - | | | | (18,128 | ) | | | - | | |
| Foreign currency transactions | | | 59,380 | | | | 716 | | | | (85 | ) | | | - | | |
| Net realized gain (loss) | | | (40,930,010 | ) | | | (24,006,438 | ) | | | (16,127,940 | ) | | | (58,835,920 | ) | |
| Net change in unrealized appreciation (depreciation) on: | |
| Investment transactions | | | (32,338,734 | ) | | | (147,470,359 | ) | | | (32,268,822 | ) | | | (42,058,219 | ) | |
| Translation of assets and liabilities in foreign currencies | | | (11,536 | ) | | | (6,069 | ) | | | - | | | | - | | |
| Net change in unrealized appreciation (depreciation) | | | (32,350,270 | ) | | | (147,476,428 | ) | | | (32,268,822 | ) | | | (42,058,219 | ) | |
Net realized gain (loss) and change in unrealized
appreciation (depreciation) | | | (73,280,280 | ) | | | (171,482,866 | ) | | | (48,396,762 | ) | | | (100,894,139 | ) | |
| Net increase (decrease) in net assets resulting from operations | | $ | (68,015,502 | ) | | $ | (162,082,105 | ) | | $ | (46,313,239 | ) | | $ | (98,031,943 | ) | |
| (a) Net of withholding tax of: | | $ | 24,925 | | | $ | 46,658 | | | $ | 8,280 | | | $ | 36,389 | | |
* Service Class shares commenced operations on August 15, 2008.
** Service Class I shares commenced operations on August 15, 2008.
The accompanying notes are an integral part of the financial statements.
130
| | | MML
Blue Chip
Growth
Fund | | MML
Large Cap
Growth
Fund | | MML
Concentrated
Growth
Fund | |
| Investment income (Note 2): | |
| Dividends (a) | | $ | 1,196,931 | | | $ | 614,011 | | | $ | 1,116,883 | | |
| Interest | | | 19,048 | | | | 3,580 | | | | 32,016 | | |
| Securities lending net income | | | 2,325 | | | | 4,017 | | | | 3,980 | | |
| Total investment income | | | 1,218,304 | | | | 621,608 | | | | 1,152,879 | | |
| Expenses (Note 3): | |
| Investment management fees | | | 850,007 | | | | 359,041 | | | | 560,092 | | |
| Custody fees | | | 37,080 | | | | 8,508 | | | | 22,926 | | |
| Audit and legal fees | | | 41,148 | | | | 35,860 | | | | 37,100 | | |
| Proxy fees | | | 892 | | | | 949 | | | | 995 | | |
| Shareholder reporting fees | | | 18,211 | | | | 16,967 | | | | 7,050 | | |
| Trustees' fees | | | 11,726 | | | | 8,237 | | | | 11,771 | | |
| | | | 959,064 | | | | 429,562 | | | | 639,934 | | |
| Administration fees: | |
| Class I | | | - | | | | - | | | | 124,503 | | |
| Class II | | | - | | | | - | | | | 57,962 | | |
| Service Class I** | | | - | | | | - | | | | 172 | | |
| Service fees: | |
| Service Class* | | | 514 | | | | 108 | | | | - | | |
| Service Class I** | | | - | | | | - | | | | 179 | | |
| Total expenses | | | 959,578 | | | | 429,670 | | | | 822,750 | | |
| Expenses waived (Note 3): | |
| Initial Class fees waived by advisor | | | (6,012 | ) | | | (1,792 | ) | | | - | | |
| Class I fees waived by advisor | | | - | | | | - | | | | (16,636 | ) | |
| Class II fees waived by advisor | | | - | | | | - | | | | (27,274 | ) | |
| Net expenses | | | 953,566 | | | | 427,878 | | | | 778,840 | | |
| Net investment income (loss) | | | 264,738 | | | | 193,730 | | | | 374,039 | | |
| Realized and unrealized gain (loss): | |
| Net realized gain (loss) on: | |
| Investment transactions | | | (17,796,059 | ) | | | (7,549,228 | ) | | | (49,070,407 | ) | |
| Futures contracts | | | - | | | | - | | | | - | | |
| Foreign currency transactions | | | (13,222 | ) | | | - | | | | (14,408 | ) | |
| Net realized gain (loss) | | | (17,809,281 | ) | | | (7,549,228 | ) | | | (49,084,815 | ) | |
| Net change in unrealized appreciation (depreciation) on: | |
| Investment transactions | | | (49,232,432 | ) | | | (20,022,748 | ) | | | (37,383,134 | ) | |
| Translation of assets and liabilities in foreign currencies | | | 93 | | | | - | | | | - | | |
| Net change in unrealized appreciation (depreciation) | | | (49,232,339 | ) | | | (20,022,748 | ) | | | (37,383,134 | ) | |
Net realized gain (loss) and change in unrealized
appreciation (depreciation) | | | (67,041,620 | ) | | | (27,571,976 | ) | | | (86,467,949 | ) | |
| Net increase (decrease) in net assets resulting from operations | | $ | (66,776,882 | ) | | $ | (27,378,246 | ) | | $ | (86,093,910 | ) | |
| (a) Net of withholding tax of: | | $ | 11,559 | | | $ | 8,862 | | | $ | 32,779 | | |
131
MML Series Investment Fund – Financial Statements (Continued)
Statements of Operations
For the Year Ended December 31, 2008
| | | MML
Mid Cap
Value
Fund | | MML
Mid Cap
Growth
Fund | | MML
Small/Mid
Cap Value
Fund | | MML
Small Cap
Index
Fund | |
| Investment income (Note 2): | |
| Dividends (a) | | $ | 10,579,887 | | | $ | 1,299,530 | | | $ | 3,734,829 | | | $ | 685,703 | | |
| Dividends from affiliated issuers | | | - | | | | - | | | | - | | | | - | | |
| Interest | | | 113,763 | | | | 98,046 | | | | 71,960 | | | | 7,327 | | |
| Securities lending net income | | | 92,114 | | | | 98,835 | | | | 102,647 | | | | 33,575 | | |
| Total investment income | | | 10,785,764 | | | | 1,496,411 | | | | 3,909,436 | | | | 726,605 | | |
| Expenses (Note 3): | |
| Investment management fees | | | 3,034,753 | | | | 1,856,223 | | | | 1,527,581 | | | | 169,008 | | |
| Custody fees | | | 78,194 | | | | 35,120 | | | | 34,413 | | | | 30,186 | | |
| Audit and legal fees | | | 45,955 | | | | 42,222 | | | | 40,323 | | | | 35,648 | | |
| Proxy fees | | | 995 | | | | 892 | | | | 897 | | | | 912 | | |
| Shareholder reporting fees | | | 33,995 | | | | 28,078 | | | | 26,633 | | | | 16,486 | | |
| Trustees' fees | | | 49,565 | | | | 34,177 | | | | 28,686 | | | | 6,970 | | |
| | | | 3,243,457 | | | | 1,996,712 | | | | 1,658,533 | | | | 259,210 | | |
| Administration fees: | |
| Class I | | | - | | | | - | | | | - | | | | - | | |
| Class II | | | - | | | | - | | | | - | | | | - | | |
| Service Class I** | | | - | | | | - | | | | - | | | | - | | |
| Service fees: | |
| Service Class* | | | 686 | | | | 1,064 | | | | 400 | | | | 369 | | |
| Service Class I** | | | - | | | | - | | | | - | | | | - | | |
| Total expenses | | | 3,244,143 | | | | 1,997,776 | | | | 1,658,933 | | | | 259,579 | | |
| Expenses waived (Note 3): | |
| Initial Class fees waived by advisor | | | - | | | | - | | | | - | | | | (4,562 | ) | |
| Class I fees waived by advisor | | | - | | | | - | | | | - | | | | - | | |
| Class II fees waived by advisor | | | - | | | | - | | | | - | | | | - | | |
| Service Class fees waived by advisor* | | | - | | | | - | | | | - | | | | - | | |
| Service Class I fees waived by advisor** | | | - | | | | - | | | | - | | | | - | | |
| Net expenses | | | 3,244,143 | | | | 1,997,776 | | | | 1,658,933 | | | | 255,017 | | |
| Net investment income (loss) | | | 7,541,621 | | | | (501,365 | ) | | | 2,250,503 | | | | 471,588 | | |
| Realized and unrealized gain (loss): | |
| Net realized gain (loss) on: | |
| Investment transactions | | | (81,395,117 | ) | | | (15,576,884 | ) | | | (45,768,409 | ) | | | (635,799 | ) | |
| Futures contracts | | | - | | | | - | | | | (220,669 | ) | | | (149,474 | ) | |
| Realized gain distributions from affiliated issuer (Note 7) | | | - | | | | - | | | | - | | | | - | | |
| Foreign currency transactions | | | 118,123 | | | | (3,069 | ) | | | - | | | | - | | |
| Net realized gain (loss) | | | (81,276,994 | ) | | | (15,579,953 | ) | | | (45,989,078 | ) | | | (785,273 | ) | |
| Net change in unrealized appreciation (depreciation) on: | |
| Investment transactions | | | (21,174,275 | ) | | | (99,067,952 | ) | | | (44,783,455 | ) | | | (16,613,545 | ) | |
| Futures contracts | | | - | | | | - | | | | (9,420 | ) | | | 23,543 | | |
| Translation of assets and liabilities in foreign currencies | | | (64,777 | ) | | | (432 | ) | | | - | | | | - | | |
| Net change in unrealized appreciation (depreciation) | | | (21,239,052 | ) | | | (99,068,384 | ) | | | (44,792,875 | ) | | | (16,590,002 | ) | |
Net realized gain (loss) and change in unrealized
appreciation (depreciation) | | | (102,516,046 | ) | | | (114,648,337 | ) | | | (90,781,953 | ) | | | (17,375,275 | ) | |
| Net increase (decrease) in net assets resulting from operations | | $ | (94,974,425 | ) | | $ | (115,149,702 | ) | | $ | (88,531,450 | ) | | $ | (16,903,687 | ) | |
| (a) Net of withholding tax of: | | $ | 31,184 | | | $ | 8,075 | | | $ | 2,409 | | | $ | 116 | | |
* Service Class shares commenced operations on August 15, 2008.
** Service Class I shares commenced operations on August 15, 2008.
The accompanying notes are an integral part of the financial statements.
132
| | | MML
Global
Fund | | MML
Foreign
Fund | | MML
Conservative
Allocation
Fund | |
| Investment income (Note 2): | |
| Dividends (a) | | $ | 1,036,253 | | | $ | 10,602,594 | | | $ | - | | |
| Dividends from affiliated issuers | | | - | | | | - | | | | 1,091,286 | | |
| Interest | | | 15,457 | | | | 165,436 | | | | - | | |
| Securities lending net income | | | 6,232 | | | | 39,617 | | | | - | | |
| Total investment income | | | 1,057,942 | | | | 10,807,647 | | | | 1,091,286 | | |
| Expenses (Note 3): | |
| Investment management fees | | | 237,838 | | | | 2,582,378 | | | | 34,984 | | |
| Custody fees | | | 102,707 | | | | 183,789 | | | | 10,884 | | |
| Audit and legal fees | | | 39,740 | | | | 48,038 | | | | 32,070 | | |
| Proxy fees | | | 1,132 | | | | 1,132 | | | | 858 | | |
| Shareholder reporting fees | | | 4,959 | | | | 29,838 | | | | 12,756 | | |
| Trustees' fees | | | 6,066 | | | | 41,924 | | | | 2,493 | | |
| | | | 392,442 | | | | 2,887,099 | | | | 94,045 | | |
| Administration fees: | |
| Class I | | | 22,980 | | | | - | | | | - | | |
| Class II | | | 56,489 | | | | - | | | | - | | |
| Service Class I** | | | 140 | | | | - | | | | - | | |
| Service fees: | |
| Service Class* | | | - | | | | 536 | | | | 10,604 | | |
| Service Class I** | | | 125 | | | | - | | | | - | | |
| Total expenses | | | 472,176 | | | | 2,887,635 | | | | 104,649 | | |
| Expenses waived (Note 3): | |
| Initial Class fees waived by advisor | | | - | | | | (30,843 | ) | | | (22,280 | ) | |
| Class I fees waived by advisor | | | (36,286 | ) | | | - | | | | - | | |
| Class II fees waived by advisor | | | (140,427 | ) | | | - | | | | - | | |
| Service Class fees waived by advisor* | | | - | | | | - | | | | (1,793 | ) | |
| Service Class I fees waived by advisor** | | | (21 | ) | | | - | | | | - | | |
| Net expenses | | | 295,442 | | | | 2,856,792 | | | | 80,576 | | |
| Net investment income (loss) | | | 762,500 | | | | 7,950,855 | | | | 1,010,710 | | |
| Realized and unrealized gain (loss): | |
| Net realized gain (loss) on: | |
| Investment transactions | | | (11,754,490 | ) | | | (7,755,768 | ) | | | (936,650 | ) | |
| Futures contracts | | | - | | | | - | | | | - | | |
| Realized gain distributions from affiliated issuer (Note 7) | | | - | | | | - | | | | 113,739 | | |
| Foreign currency transactions | | | (75,630 | ) | | | (476,769 | ) | | | - | | |
| Net realized gain (loss) | | | (11,830,120 | ) | | | (8,232,537 | ) | | | (822,911 | ) | |
| Net change in unrealized appreciation (depreciation) on: | |
| Investment transactions | | | (9,411,018 | ) | | | (149,042,640 | ) | | | (8,376,464 | ) | |
| Futures contracts | | | - | | | | - | | | | - | | |
| Translation of assets and liabilities in foreign currencies | | | (3,058 | ) | | | 15,785 | | | | - | | |
| Net change in unrealized appreciation (depreciation) | | | (9,414,076 | ) | | | (149,026,855 | ) | | | (8,376,464 | ) | |
Net realized gain (loss) and change in unrealized
appreciation (depreciation) | | | (21,244,196 | ) | | | (157,259,392 | ) | | | (9,260,767 | ) | |
| Net increase (decrease) in net assets resulting from operations | | $ | (20,481,696 | ) | | $ | (149,308,537 | ) | | $ | (8,188,665 | ) | |
| (a) Net of withholding tax of: | | $ | 57,820 | | | $ | 1,074,627 | | | $ | - | | |
133
MML Series Investment Fund – Financial Statements (Continued)
Statements of Operations
For the Year Ended December 31, 2008
| | | MML
Balanced
Allocation
Fund | | MML
Moderate
Allocation
Fund | | MML
Growth
Allocation
Fund | | MML
Aggressive
Allocation
Fund | |
| Investment income (Note 2): | |
| Dividends | | $ | - | | | $ | - | | | $ | - | | | $ | - | | |
| Dividends from affiliated issuers | | | 1,537,873 | | | | 3,856,353 | | | | 3,489,025 | | | | 126,262 | | |
| Total investment income | | | 1,537,873 | | | | 3,856,353 | | | | 3,489,025 | | | | 126,262 | | |
| Expenses (Note 3): | |
| Investment management fees | | | 61,261 | | | | 180,263 | | | | 265,296 | | | | 19,295 | | |
| Custody fees | | | 11,431 | | | | 12,119 | | | | 12,298 | | | | 11,942 | | |
| Audit and legal fees | | | 33,026 | | | | 37,937 | | | | 41,075 | | | | 31,232 | | |
| Proxy fees | | | 858 | | | | 858 | | | | 858 | | | | 857 | | |
| Shareholder reporting fees | | | 13,550 | | | | 16,996 | | | | 19,613 | | | | 12,385 | | |
| Trustees' fees | | | 4,374 | | | | 12,821 | | | | 19,019 | | | | 1,462 | | |
| | | | 124,500 | | | | 260,994 | | | | 358,159 | | | | 77,173 | | |
| Administration fees: | |
| Initial Class | | | - | | | | - | | | | - | | | | - | | |
| Service Class I | | | - | | | | - | | | | - | | | | - | | |
| Service fees: | |
| Service Class* | | | 14,349 | | | | 42,362 | | | | 51,784 | | | | 1,045 | | |
| Service Class I | | | - | | | | - | | | | - | | | | - | | |
| Total expenses | | | 138,849 | | | | 303,356 | | | | 409,943 | | | | 78,218 | | |
| Expenses waived (Note 3): | |
| Initial Class fees waived by advisor | | | (915 | ) | | | - | | | | - | | | | (37,814 | ) | |
| Service Class fees waived by advisor* | | | (1,063 | ) | | | - | | | | - | | | | (770 | ) | |
| Service Class I fees waived by advisor | | | - | | | | - | | | | - | | | | - | | |
| Net expenses | | | 136,871 | | | | 303,356 | | | | 409,943 | | | | 39,634 | | |
| Net investment income (loss) | | | 1,401,002 | | | | 3,552,997 | | | | 3,079,082 | | | | 86,628 | | |
| Realized and unrealized gain (loss): | |
| Net realized gain (loss) on: | |
| Investment transactions | | | (1,778,212 | ) | | | (4,378,694 | ) | | | (5,370,405 | ) | | | (562,673 | ) | |
| Realized gain distributions from affiliated issuers (Note 7) | | | 219,829 | | | | 682,703 | | | | 1,278,693 | | | | 124,623 | | |
| Net realized gain (loss) | | | (1,558,383 | ) | | | (3,695,991 | ) | | | (4,091,712 | ) | | | (438,050 | ) | |
| Net change in unrealized appreciation (depreciation) on: | |
| Investment transactions | | | (22,239,085 | ) | | | (71,954,104 | ) | | | (133,827,837 | ) | | | (10,793,194 | ) | |
| Net change in unrealized appreciation (depreciation) | | | (22,239,085 | ) | | | (71,954,104 | ) | | | (133,827,837 | ) | | | (10,793,194 | ) | |
Net realized gain (loss) and change in unrealized
appreciation (depreciation) | | | (23,797,468 | ) | | | (76,650,095 | ) | | | (137,919,549 | ) | | | (11,231,244 | ) | |
| Net increase (decrease) in net assets resulting from operations | | $ | (22,396,466 | ) | | $ | (72,097,098 | ) | | $ | (134,840,467 | ) | | $ | (11,144,616 | ) | |
* Service Class shares commenced operations on August 15, 2008.
** Fund commenced operations on August 15, 2008.
The accompanying notes are an integral part of the financial statements.
134
| | | MML
American
Funds Core
Allocation
Fund** | | MML
American
Funds
Growth
Fund** | | MML
American
Funds
International
Fund** | |
| Investment income (Note 2): | |
| Dividends | | $ | 1,897,506 | | | $ | 68,277 | | | $ | 145,593 | | |
| Dividends from affiliated issuers | | | - | | | | - | | | | - | | |
| Total investment income | | | 1,897,506 | | | | 68,277 | | | | 145,593 | | |
| Expenses (Note 3): | |
| Investment management fees | | | 14,704 | | | | 1,032 | | | | 1,058 | | |
| Custody fees | | | 2,429 | | | | 426 | | | | 436 | | |
| Audit and legal fees | | | 65,172 | | | | 74,622 | | | | 74,622 | | |
| Proxy fees | | | - | | | | - | | | | - | | |
| Shareholder reporting fees | | | 16,292 | | | | 16,153 | | | | 16,153 | | |
| Trustees' fees | | | 732 | | | | 73 | | | | 74 | | |
| | | | 99,329 | | | | 92,306 | | | | 92,343 | | |
| Administration fees: | |
| Initial Class | | | - | | | | - | | | | - | | |
| Service Class I | | | 18,380 | | | | 1,720 | | | | 1,764 | | |
| Service fees: | |
| Service Class* | | | - | | | | - | | | | - | | |
| Service Class I | | | 18,380 | | | | 1,720 | | | | 1,764 | | |
| Total expenses | | | 136,089 | | | | 95,746 | | | | 95,871 | | |
| Expenses waived (Note 3): | |
| Initial Class fees waived by advisor | | | - | | | | - | | | | - | | |
| Service Class fees waived by advisor* | | | - | | | | - | | | | - | | |
| Service Class I fees waived by advisor | | | (80,949 | ) | | | (90,931 | ) | | | (90,932 | ) | |
| Net expenses | | | 55,140 | | | | 4,815 | | | | 4,939 | | |
| Net investment income (loss) | | | 1,842,366 | | | | 63,462 | | | | 140,654 | | |
| Realized and unrealized gain (loss): | |
| Net realized gain (loss) on: | |
| Investment transactions | | | (61,097 | ) | | | (62,604 | ) | | | (73,948 | ) | |
| Realized gain distributions from affiliated issuers (Note 7) | | | - | | | | - | | | | - | | |
| Net realized gain (loss) | | | (61,097 | ) | | | (62,604 | ) | | | (73,948 | ) | |
| Net change in unrealized appreciation (depreciation) on: | |
| Investment transactions | | | (1,179,273 | ) | | | (115,131 | ) | | | 36,606 | | |
| Net change in unrealized appreciation (depreciation) | | | (1,179,273 | ) | | | (115,131 | ) | | | 36,606 | | |
Net realized gain (loss) and change in unrealized
appreciation (depreciation) | | | (1,240,370 | ) | | | (177,735 | ) | | | (37,342 | ) | |
| Net increase (decrease) in net assets resulting from operations | | $ | 601,996 | | | $ | (114,273 | ) | | $ | 103,312 | | |
135
MML Series Investment Fund – Financial Statements (Continued)
Statements of Changes in Net Assets
| | | MML Asset Allocation Fund | | MML Equity Income Fund | |
| | | Year Ended
December 31,
2008 | | Year Ended
December 31,
2007 | | Year Ended
December 31,
2008 | | Year Ended
December 31,
2007 | |
| Increase (Decrease) in Net Assets: | |
| Operations: | |
| Net investment income (loss) | | $ | 5,264,778 | | | $ | 6,331,620 | | | $ | 9,400,761 | | | $ | 5,915,377 | | |
| Net realized gain (loss) on investment transactions | | | (40,930,010 | ) | | | 5,312,009 | | | | (24,006,438 | ) | | | 16,578,720 | | |
| Net change in unrealized appreciation (depreciation) on investments | | | (32,350,270 | ) | | | (8,082,157 | ) | | | (147,476,428 | ) | | | (14,644,997 | ) | |
| Net increase (decrease) in net assets resulting from operations | | | (68,015,502 | ) | | | 3,561,472 | | | | (162,082,105 | ) | | | 7,849,100 | | |
| Distributions to shareholders (Note 2): | |
| From net investment income: | |
| Initial Class | | | (160,237 | ) | | | (6,356,734 | ) | | | - | | | | (5,925,721 | ) | |
| Service Class* | | | (80 | ) | | | - | | | | - | | | | - | | |
| Total distributions from net investment income | | | (160,317 | ) | | | (6,356,734 | ) | | | - | | | | (5,925,721 | ) | |
| From net realized gains: | |
| Initial Class | | | - | | | | (6,419,732 | ) | | | (5,677,873 | ) | | | (12,156,321 | ) | |
| Service Class* | | | - | | | | - | | | | (1,337 | ) | | | - | | |
| Total distributions from net realized gains | | | - | | | | (6,419,732 | ) | | | (5,679,210 | ) | | | (12,156,321 | ) | |
| Tax return of capital: | |
| Initial Class | | | - | | | | - | | | | - | | | | - | | |
| Total tax return of capital | | | - | | | | - | | | | - | | | | - | | |
| Net fund share transactions (Note 5): | |
| Initial Class | | | (50,818,926 | ) | | | (1,703,229 | ) | | | 142,939,258 | | | | 96,491,751 | | |
| Service Class* | | | 1,782,991 | | | | - | | | | 6,370,283 | | | | - | | |
| Increase (decrease) in net assets from fund share transactions | | | (49,035,935 | ) | | | (1,703,229 | ) | | | 149,309,541 | | | | 96,491,751 | | |
| Total increase (decrease) in net assets | | | (117,211,754 | ) | | | (10,918,223 | ) | | | (18,451,774 | ) | | | 86,258,809 | | |
| Net assets | |
| Beginning of year | | | 255,294,184 | | | | 266,212,407 | | | | 378,615,843 | | | | 292,357,034 | | |
| End of year | | $ | 138,082,430 | | | $ | 255,294,184 | | | $ | 360,164,069 | | | $ | 378,615,843 | | |
Undistributed (accumulated) net investment income (loss) (distributions in
excess of net investment income) included in net assets at end of year | | $ | 5,552,206 | | | $ | 44,174 | | | $ | 9,380,732 | | | $ | (20,704 | ) | |
* Service Class shares commenced operations on August 15, 2008.
The accompanying notes are an integral part of the financial statements.
136
| | | MML Income & Growth Fund | | MML Growth & Income Fund | |
| | | Year Ended
December 31,
2008 | | Year Ended
December 31,
2007 | | Year Ended
December 31,
2008 | | Year Ended
December 31,
2007 | |
| Increase (Decrease) in Net Assets: | |
| Operations: | |
| Net investment income (loss) | | $ | 2,083,523 | | | $ | 2,523,375 | | | $ | 2,862,196 | | | $ | 3,365,337 | | |
| Net realized gain (loss) on investment transactions | | | (16,127,940 | ) | | | 5,053,719 | | | | (58,835,920 | ) | | | 9,569,964 | | |
| Net change in unrealized appreciation (depreciation) on investments | | | (32,268,822 | ) | | | (7,601,044 | ) | | | (42,058,219 | ) | | | (12,124,354 | ) | |
| Net increase (decrease) in net assets resulting from operations | | | (46,313,239 | ) | | | (23,950 | ) | | | (98,031,943 | ) | | | 810,947 | | |
| Distributions to shareholders (Note 2): | |
| From net investment income: | |
| Initial Class | | | (1,916 | ) | | | (2,509,147 | ) | | | - | | | | (3,372,953 | ) | |
| Service Class* | | | (2 | ) | | | - | | | | - | | | | - | | |
| Total distributions from net investment income | | | (1,918 | ) | | | (2,509,147 | ) | | | - | | | | (3,372,953 | ) | |
| From net realized gains: | |
| Initial Class | | | (6,864 | ) | | | (7,574,681 | ) | | | - | | | | (10,987,401 | ) | |
| Service Class* | | | (6 | ) | | | - | | | | - | | | | - | | |
| Total distributions from net realized gains | | | (6,870 | ) | | | (7,574,681 | ) | | | - | | | | (10,987,401 | ) | |
| Tax return of capital: | |
| Initial Class | | | - | | | | (5,314 | ) | | | - | | | | (9,050 | ) | |
| Total tax return of capital | | | - | | | | (5,314 | ) | | | - | | | | (9,050 | ) | |
| Net fund share transactions (Note 5): | |
| Initial Class | | | (27,512,765 | ) | | | (20,418,664 | ) | | | (38,573,821 | ) | | | (19,279,364 | ) | |
| Service Class* | | | 659,761 | | | | - | | | | 1,358,185 | | | | - | | |
| Increase (decrease) in net assets from fund share transactions | | | (26,853,004 | ) | | | (20,418,664 | ) | | | (37,215,636 | ) | | | (19,279,364 | ) | |
| Total increase (decrease) in net assets | | | (73,175,031 | ) | | | (30,531,756 | ) | | | (135,247,579 | ) | | | (32,837,821 | ) | |
| Net assets | |
| Beginning of year | | | 150,272,250 | | | | 180,804,006 | | | | 269,802,727 | | | | 302,640,548 | | |
| End of year | | $ | 77,097,219 | | | $ | 150,272,250 | | | $ | 134,555,148 | | | $ | 269,802,727 | | |
Undistributed (accumulated) net investment income (loss) (distributions in
excess of net investment income) included in net assets at end of year | | $ | 2,062,917 | | | $ | (1,403 | ) | | $ | 2,842,220 | | | $ | (19,976 | ) | |
137
MML Series Investment Fund – Financial Statements (Continued)
Statements of Changes in Net Assets
| | | MML Blue Chip Growth Fund | | MML Large Cap Growth Fund | |
| | | Year Ended
December 31,
2008 | | Year Ended
December 31,
2007 | | Year Ended
December 31,
2008 | | Year Ended
December 31,
2007 | |
| Increase (Decrease) in Net Assets: | |
| Operations: | |
| Net investment income (loss) | | $ | 264,738 | | | $ | 235,529 | | | $ | 193,730 | | | $ | 93,732 | | |
| Net realized gain (loss) on investment transactions | | | (17,809,281 | ) | | | 537,652 | | | | (7,549,228 | ) | | | 2,704,088 | | |
| Net change in unrealized appreciation (depreciation) on investments | | | (49,232,339 | ) | | | 6,094,469 | | | | (20,022,748 | ) | | | 7,006,576 | | |
| Net increase (decrease) in net assets resulting from operations | | | (66,776,882 | ) | | | 6,867,650 | | | | (27,378,246 | ) | | | 9,804,396 | | |
| Distributions to shareholders (Note 2): | |
| From net investment income: | |
| Initial Class | | | - | | | | (234,912 | ) | | | - | | | | (112,565 | ) | |
| Class I | | | - | | | | - | | | | - | | | | - | | |
| Class II | | | - | | | | - | | | | - | | | | - | | |
| Service Class* | | | - | | | | - | | | | - | | | | - | | |
| Total distributions from net investment income | | | - | | | | (234,912 | ) | | | - | | | | (112,565 | ) | |
| From net realized gains: | |
| Initial Class | | | - | | | | - | | | | - | | | | - | | |
| Class I | | | - | | | | - | | | | - | | | | - | | |
| Class II | | | - | | | | - | | | | - | | | | - | | |
| Total distributions from net realized gains | | | - | | | | - | | | | - | | | | - | | |
| Tax return of capital: | |
| Initial Class | | | - | | | | (20,962 | ) | | | - | | | | - | | |
| Total tax return of capital | | | - | | | | (20,962 | ) | | | - | | | | - | | |
| Net fund share transactions (Note 5): | |
| Initial Class | | | 173,567,610 | | | | 343,588 | | | | (10,678,299 | ) | | | (13,358,560 | ) | |
| Class I | | | - | | | | - | | | | - | | | | - | | |
| Class II | | | - | | | | - | | | | - | | | | - | | |
| Service Class* | | | 1,882,275 | | | | - | | | | 263,900 | | | | - | | |
| Service Class I** | | | - | | | | - | | | | - | | | | - | | |
| Increase (decrease) in net assets from fund share transactions | | | 175,449,885 | | | | 343,588 | | | | (10,414,399 | ) | | | (13,358,560 | ) | |
| Total increase (decrease) in net assets | | | 108,673,003 | | | | 6,955,364 | | | | (37,792,645 | ) | | | (3,666,729 | ) | |
| Net assets | |
| Beginning of year | | | 61,701,402 | | | | 54,746,038 | | | | 74,225,151 | | | | 77,891,880 | | |
| End of year | | $ | 170,374,405 | | | $ | 61,701,402 | | | $ | 36,432,506 | | | $ | 74,225,151 | | |
Undistributed (accumulated) net investment income (loss) (distributions in excess
of net investment income) included in net assets at end of year | | $ | 234,816 | | | $ | (4,247 | ) | | $ | 188,557 | | | $ | (5,173 | ) | |
* Service Class shares commenced operations on August 15, 2008.
** Service Class I shares commenced operations on August 15, 2008.
The accompanying notes are an integral part of the financial statements.
138
| | | MML Concentrated Growth Fund | | MML Mid Cap Value Fund | |
| | | Year Ended
December 31,
2008 | | Year Ended
December 31,
2007 | | Year Ended
December 31,
2008 | | Year Ended
December 31,
2007 | |
| Increase (Decrease) in Net Assets: | |
| Operations: | |
| Net investment income (loss) | | $ | 374,039 | | | $ | 200,682 | | | $ | 7,541,621 | | | $ | 5,173,680 | | |
| Net realized gain (loss) on investment transactions | | | (49,084,815 | ) | | | 2,579,859 | | | | (81,276,994 | ) | | | 22,165,203 | | |
| Net change in unrealized appreciation (depreciation) on investments | | | (37,383,134 | ) | | | 8,858,476 | | | | (21,239,052 | ) | | | (38,730,870 | ) | |
| Net increase (decrease) in net assets resulting from operations | | | (86,093,910 | ) | | | 11,639,017 | | | | (94,974,425 | ) | | | (11,391,987 | ) | |
| Distributions to shareholders (Note 2): | |
| From net investment income: | |
| Initial Class | | | - | | | | - | | | | (15,668 | ) | | | (4,364,411 | ) | |
| Class I | | | - | | | | (49,169 | ) | | | - | | | | - | | |
| Class II | | | - | | | | (165,443 | ) | | | - | | | | - | | |
| Service Class* | | | - | | | | - | | | | (4 | ) | | | - | | |
| Total distributions from net investment income | | | - | | | | (214,612 | ) | | | (15,672 | ) | | | (4,364,411 | ) | |
| From net realized gains: | |
| Initial Class | | | - | | | | - | | | | - | | | | (49,367,026 | ) | |
| Class I | | | - | | | | (1,287,876 | ) | | | - | | | | - | | |
| Class II | | | - | | | | (3,471,858 | ) | | | - | | | | - | | |
| Total distributions from net realized gains | | | - | | | | (4,759,734 | ) | | | - | | | | (49,367,026 | ) | |
| Tax return of capital: | |
| Initial Class | | | - | | | | - | | | | - | | | | - | | |
| Total tax return of capital | | | - | | | | - | | | | - | | | | - | | |
| Net fund share transactions (Note 5): | |
| Initial Class | | | - | | | | - | | | | (18,448,689 | ) | | | 111,145,799 | | |
| Class I | | | 89,139,781 | | | | 4,664,293 | | | | - | | | | - | | |
| Class II | | | (9,133,233 | ) | | | (8,447,474 | ) | | | - | | | | - | | |
| Service Class* | | | - | | | | - | | | | 2,222,528 | | | | - | | |
| Service Class I** | | | 561,093 | | | | - | | | | - | | | | - | | |
| Increase (decrease) in net assets from fund share transactions | | | 80,567,641 | | | | (3,783,181 | ) | | | (16,226,161 | ) | | | 111,145,799 | | |
| Total increase (decrease) in net assets | | | (5,526,269 | ) | | | 2,881,490 | | | | (111,216,258 | ) | | | 46,022,375 | | |
| Net assets | |
| Beginning of year | | | 85,615,355 | | | | 82,733,865 | | | | 404,928,383 | | | | 358,906,008 | | |
| End of year | | $ | 80,089,086 | | | $ | 85,615,355 | | | $ | 293,712,125 | | | $ | 404,928,383 | | |
Undistributed (accumulated) net investment income (loss) (distributions in excess
of net investment income) included in net assets at end of year | | $ | 340,322 | | | $ | (19,309 | ) | | $ | 7,322,340 | | | $ | 144,558 | | |
139
MML Series Investment Fund – Financial Statements (Continued)
Statements of Changes in Net Assets
| | | MML Mid Cap Growth Fund | | MML Small/Mid Cap Value Fund | |
| | | Year Ended
December 31,
2008 | | Year Ended
December 31,
2007 | | Year Ended
December 31,
2008 | | Year Ended
December 31,
2007 | |
| Increase (Decrease) in Net Assets: | |
| Operations: | |
| Net investment income (loss) | | $ | (501,365 | ) | | $ | 220,708 | | | $ | 2,250,503 | | | $ | 2,538,239 | | |
| Net realized gain (loss) on investment transactions | | | (15,579,953 | ) | | | 20,532,752 | | | | (45,989,078 | ) | | | (7,754,539 | ) | |
| Net change in unrealized appreciation (depreciation) on investments | | | (99,068,384 | ) | | | 24,971,098 | | | | (44,792,875 | ) | | | (41,879,232 | ) | |
| Net increase (decrease) in net assets resulting from operations | | | (115,149,702 | ) | | | 45,724,558 | | | | (88,531,450 | ) | | | (47,095,532 | ) | |
| Distributions to shareholders (Note 2): | |
| From net investment income: | |
| Initial Class | | | - | | | | (239,326 | ) | | | - | | | | (2,320,011 | ) | |
| Class I | | | - | | | | - | | | | - | | | | - | | |
| Class II | | | - | | | | - | | | | - | | | | - | | |
| Total distributions from net investment income | | | - | | | | (239,326 | ) | | | - | | | | (2,320,011 | ) | |
| From net realized gains: | |
| Initial Class | | | (4,530,895 | ) | | | (13,887,916 | ) | | | - | | | | - | | |
| Class I | | | - | | | | - | | | | - | | | | - | | |
| Class II | | | - | | | | - | | | | - | | | | - | | |
| Service Class* | | | (1,688 | ) | | | - | | | | - | | | | - | | |
| Service Class I** | | | - | | | | - | | | | - | | | | - | | |
| Total distributions from net realized gains | | | (4,532,583 | ) | | | (13,887,916 | ) | | | - | | | | - | | |
| Tax return of capital: | |
| Initial Class | | | - | | | | - | | | | - | | | | (48,275 | ) | |
| Total tax return of capital | | | - | | | | - | | | | - | | | | (48,275 | ) | |
| Net fund share transactions (Note 5): | |
| Initial Class | | | 17,861,147 | | | | (31,044,485 | ) | | | (14,887,144 | ) | | | 90,807,973 | | |
| Class I | | | - | | | | - | | | | - | | | | - | | |
| Class II | | | - | | | | - | | | | - | | | | - | | |
| Service Class* | | | 3,762,968 | | | | - | | | | 1,498,829 | | | | - | | |
| Service Class I** | | | - | | | | - | | | | - | | | | - | | |
| Increase (decrease) in net assets from fund share transactions | | | 21,624,115 | | | | (31,044,485 | ) | | | (13,388,315 | ) | | | 90,807,973 | | |
| Total increase (decrease) in net assets | | | (98,058,170 | ) | | | 552,831 | | | | (101,919,765 | ) | | | 41,344,155 | | |
| Net assets | |
| Beginning of year | | | 285,701,347 | | | | 285,148,516 | | | | 248,583,085 | | | | 207,238,930 | | |
| End of year | | $ | 187,643,177 | | | $ | 285,701,347 | | | $ | 146,663,320 | | | $ | 248,583,085 | | |
Undistributed (accumulated) net investment income (loss) (distributions in excess
of net investment income) included in net assets at end of year | | $ | (31,930 | ) | | $ | (19,583 | ) | | $ | 2,110,865 | | | $ | 70,325 | | |
* Service Class shares commenced operations on August 15, 2008.
** Service Class I shares commenced operations on August 15, 2008.
The accompanying notes are an integral part of the financial statements.
140
| | | MML Small Cap Index Fund | | MML Global Fund | |
| | | Year Ended
December 31,
2008 | | Year Ended
December 31,
2007 | | Year Ended
December 31,
2008 | | Year Ended
December 31,
2007 | |
| Increase (Decrease) in Net Assets: | |
| Operations: | |
| Net investment income (loss) | | $ | 471,588 | | | $ | 595,381 | | | $ | 762,500 | | | $ | 880,532 | | |
| Net realized gain (loss) on investment transactions | | | (785,273 | ) | | | 2,938,261 | | | | (11,830,120 | ) | | | 2,868,001 | | |
| Net change in unrealized appreciation (depreciation) on investments | | | (16,590,002 | ) | | | (3,445,297 | ) | | | (9,414,076 | ) | | | (1,420,361 | ) | |
| Net increase (decrease) in net assets resulting from operations | | | (16,903,687 | ) | | | 88,345 | | | | (20,481,696 | ) | | | 2,328,172 | | |
| Distributions to shareholders (Note 2): | |
| From net investment income: | |
| Initial Class | | | - | | | | (523,610 | ) | | | - | | | | - | | |
| Class I | | | - | | | | - | | | | - | | | | (153,417 | ) | |
| Class II | | | - | | | | - | | | | - | | | | (698,665 | ) | |
| Total distributions from net investment income | | | - | | | | (523,610 | ) | | | - | | | | (852,082 | ) | |
| From net realized gains: | |
| Initial Class | | | (576,998 | ) | | | (2,426,222 | ) | | | - | | | | - | | |
| Class I | | | - | | | | - | | | | (36,256 | ) | | | (396,384 | ) | |
| Class II | | | - | | | | - | | | | (126,609 | ) | | | (1,736,166 | ) | |
| Service Class* | | | (1,067 | ) | | | - | | | | - | | | | - | | |
| Service Class I** | | | - | | | | - | | | | (416 | ) | | | - | | |
| Total distributions from net realized gains | | | (578,065 | ) | | | (2,426,222 | ) | | | (163,281 | ) | | | (2,132,550 | ) | |
| Tax return of capital: | |
| Initial Class | | | - | | | | - | | | | - | | | | - | | |
| Total tax return of capital | | | - | | | | - | | | | - | | | | - | | |
| Net fund share transactions (Note 5): | |
| Initial Class | | | (7,489,602 | ) | | | (7,027,997 | ) | | | - | | | | - | | |
| Class I | | | - | | | | - | | | | (54,812 | ) | | | 662,959 | | |
| Class II | | | - | | | | - | | | | (8,718,882 | ) | | | (7,923,075 | ) | |
| Service Class* | | | 1,206,086 | | | | - | | | | - | | | | - | | |
| Service Class I** | | | - | | | | - | | | | 294,855 | | | | - | | |
| Increase (decrease) in net assets from fund share transactions | | | (6,283,516 | ) | | | (7,027,997 | ) | | | (8,478,839 | ) | | | (7,260,116 | ) | |
| Total increase (decrease) in net assets | | | (23,765,268 | ) | | | (9,889,484 | ) | | | (29,123,816 | ) | | | (7,916,576 | ) | |
| Net assets | |
| Beginning of year | | | 58,893,318 | | | | 68,782,802 | | | | 53,585,175 | | | | 61,501,751 | | |
| End of year | | $ | 35,128,050 | | | $ | 58,893,318 | | | $ | 24,461,359 | | | $ | 53,585,175 | | |
Undistributed (accumulated) net investment income (loss) (distributions in excess
of net investment income) included in net assets at end of year | | $ | 470,282 | | | $ | 20,638 | | | $ | 682,746 | | | $ | (3,966 | ) | |
141
MML Series Investment Fund – Financial Statements (Continued)
Statements of Changes in Net Assets
| | | MML Foreign Fund | | MML Conservative Allocation Fund | |
| | | Year Ended
December 31,
2008 | | Year Ended
December 31,
2007 | | Year Ended
December 31,
2008 | | Period Ended
December 31,
2007** | |
| Increase (Decrease) in Net Assets: | |
| Operations: | |
| Net investment income (loss) | | $ | 7,950,855 | | | $ | 6,075,733 | | | $ | 1,010,710 | | | $ | 1,976 | | |
| Net realized gain (loss) on investment transactions | | | (8,232,537 | ) | | | 6,187,162 | | | | (822,911 | ) | | | 2,157 | | |
| Net change in unrealized appreciation (depreciation) on investments | | | (149,026,855 | ) | | | 24,092,724 | | | | (8,376,464 | ) | | | 449 | | |
| Net increase (decrease) in net assets resulting from operations | | | (149,308,537 | ) | | | 36,355,619 | | | | (8,188,665 | ) | | | 4,582 | | |
| Distributions to shareholders (Note 2): | |
| From net investment income: | |
| Initial Class | | | (118,041 | ) | | | (7,983,780 | ) | | | (4 | ) | | | (2,986 | ) | |
| Service Class* | | | (40 | ) | | | - | | | | (0 | )† | | | - | | |
| Total distributions from net investment income | | | (118,081 | ) | | | (7,983,780 | ) | | | (4 | ) | | | (2,986 | ) | |
| From net realized gains: | |
| Initial Class | | | - | | | | (5,335,758 | ) | | | (1,144 | ) | | | - | | |
| Service Class* | | | - | | | | - | | | | (3 | ) | | | - | | |
| Total distributions from net realized gains | | | - | | | | (5,335,758 | ) | | | (1,147 | ) | | | - | | |
| Net fund share transactions (Note 5): | |
| Initial Class | | | (902,429 | ) | | | 82,470,020 | | | | 61,606,233 | | | | 152,986 | | |
| Service Class* | | | 1,695,188 | | | | - | | | | 37,698,794 | | | | - | | |
| Increase (decrease) in net assets from fund share transactions | | | 792,759 | | | | 82,470,020 | | | | 99,305,027 | | | | 152,986 | | |
| Total increase (decrease) in net assets | | | (148,633,859 | ) | | | 105,506,101 | | | | 91,115,211 | | | | 154,582 | | |
| Net assets | |
| Beginning of year | | | 359,018,220 | | | | 253,512,119 | | | | 154,582 | | | | - | | |
| End of year | | $ | 210,384,361 | | | $ | 359,018,220 | | | $ | 91,269,793 | | | $ | 154,582 | | |
Undistributed (accumulated) net investment income (loss) (distributions in excess
of net investment income) included in net assets at end of year | | $ | 6,154,845 | | | $ | (1,201,159 | ) | | $ | 1,023,850 | | | $ | 1 | | |
* Service Class shares commenced operations on August 15, 2008.
** Fund commenced operations on August 31, 2007.
† Amount is less than $0.50
The accompanying notes are an integral part of the financial statements.
142
| | | MML Balanced Allocation Fund | | MML Moderate Allocation Fund | |
| | | Year Ended
December 31,
2008 | | Period Ended
December 31,
2007** | | Year Ended
December 31,
2008 | | Period Ended
December 31,
2007** | |
| Increase (Decrease) in Net Assets: | |
| Operations: | |
| Net investment income (loss) | | $ | 1,401,002 | | | $ | 1,679 | | | $ | 3,552,997 | | | $ | 1,588 | | |
| Net realized gain (loss) on investment transactions | | | (1,558,383 | ) | | | 3,056 | | | | (3,695,991 | ) | | | 3,486 | | |
| Net change in unrealized appreciation (depreciation) on investments | | | (22,239,085 | ) | | | (364 | ) | | | (71,954,104 | ) | | | (1,049 | ) | |
| Net increase (decrease) in net assets resulting from operations | | | (22,396,466 | ) | | | 4,371 | | | | (72,097,098 | ) | | | 4,025 | | |
| Distributions to shareholders (Note 2): | |
| From net investment income: | |
| Initial Class | | | - | | | | (3,233 | ) | | | - | | | | (3,353 | ) | |
| Service Class* | | | - | | | | - | | | | - | | | | - | | |
| Total distributions from net investment income | | | - | | | | (3,233 | ) | | | - | | | | (3,353 | ) | |
| From net realized gains: | |
| Initial Class | | | (1,504 | ) | | | - | | | | (1,740 | ) | | | - | | |
| Service Class* | | | (2 | ) | | | - | | | | (1 | ) | | | - | | |
| Total distributions from net realized gains | | | (1,506 | ) | | | - | | | | (1,741 | ) | | | - | | |
| Net fund share transactions (Note 5): | |
| Initial Class | | | 111,190,822 | | | | 153,233 | | | | 325,397,547 | | | | 153,353 | | |
| Service Class* | | | 48,921,533 | | | | - | | | | 145,005,005 | | | | - | | |
| Increase (decrease) in net assets from fund share transactions | | | 160,112,355 | | | | 153,233 | | | | 470,402,552 | | | | 153,353 | | |
| Total increase (decrease) in net assets | | | 137,714,383 | | | | 154,371 | | | | 398,303,713 | | | | 154,025 | | |
| Net assets | |
| Beginning of year | | | 154,371 | | | | - | | | | 154,025 | | | | - | | |
| End of year | | $ | 137,868,754 | | | $ | 154,371 | | | $ | 398,457,738 | | | $ | 154,025 | | |
Undistributed (accumulated) net investment income (loss) (distributions in excess
of net investment income) included in net assets at end of year | | $ | 1,427,794 | | | $ | - | | | $ | 3,632,522 | | | $ | - | | |
143
MML Series Investment Fund – Financial Statements (Continued)
Statements of Changes in Net Assets
| | | MML Growth Allocation Fund | | MML Aggressive Allocation Fund | |
| | | Year Ended
December 31,
2008 | | Period Ended
December 31,
2007** | | Year Ended
December 31,
2008 | | Period Ended
December 31,
2007** | |
| Increase (Decrease) in Net Assets: | |
| Operations: | |
| Net investment income (loss) | | $ | 3,079,082 | | | $ | 1,275 | | | $ | 86,628 | | | $ | 972 | | |
| Net realized gain (loss) on investment transactions | | | (4,091,712 | ) | | | 4,222 | | | | (438,050 | ) | | | 4,817 | | |
| Net change in unrealized appreciation (depreciation) on investments | | | (133,827,837 | ) | | | (1,833 | ) | | | (10,793,194 | ) | | | (2,493 | ) | |
| Net increase (decrease) in net assets resulting from operations | | | (134,840,467 | ) | | | 3,664 | | | | (11,144,616 | ) | | | 3,296 | | |
| Distributions to shareholders (Note 2): | |
| From net investment income: | |
| Initial Class | | | - | | | | (3,383 | ) | | | - | | | | (3,387 | ) | |
| Total distributions from net investment income | | | - | | | | (3,383 | ) | | | - | | | | (3,387 | ) | |
| From net realized gains: | |
| Initial Class | | | (2,157 | ) | | | - | | | | (2,396 | ) | | | - | | |
| Service Class* | | | (1 | ) | | | - | | | | (8 | ) | | | - | | |
| Total distributions from net realized gains | | | (2,158 | ) | | | - | | | | (2,404 | ) | | | - | | |
| Net fund share transactions (Note 5): | |
| Initial Class | | | 490,160,771 | | | | 153,383 | | | | 35,507,397 | | | | 153,387 | | |
| Service Class* | | | 183,524,175 | | | | - | | | | 3,916,329 | | | | - | | |
| Service Class I | | | - | | | | - | | | | - | | | | - | | |
| Increase (decrease) in net assets from fund share transactions | | | 673,684,946 | | | | 153,383 | | | | 39,423,726 | | | | 153,387 | | |
| Total increase (decrease) in net assets | | | 538,842,321 | | | | 153,664 | | | | 28,276,706 | | | | 153,296 | | |
| Net assets | |
| Beginning of year | | | 153,664 | | | | - | | | | 153,296 | | | | - | | |
| End of year | | $ | 538,995,985 | | | $ | 153,664 | | | $ | 28,430,002 | | | $ | 153,296 | | |
Undistributed (accumulated) net investment income (loss) (distributions in excess
of net investment income) included in net assets at end of year | | $ | 3,227,041 | | | $ | - | | | $ | 99,528 | | | $ | - | | |
* Service Class shares commenced operations on August 15, 2008.
** Fund commenced operations on August 31, 2007.
The accompanying notes are an integral part of the financial statements.
144
| | | MML
American Funds
Core Allocation
Fund | | MML
American Funds
Growth Fund | | MML
American Funds
International
Fund | |
| | | Period Ended
December 31,
2008* | | Period Ended
December 31,
2008* | | Period Ended
December 31,
2008* | |
| Increase (Decrease) in Net Assets: | |
| Operations: | |
| Net investment income (loss) | | $ | 1,842,366 | | | $ | 63,462 | | | $ | 140,654 | | |
| Net realized gain (loss) on investment transactions | | | (61,097 | ) | | | (62,604 | ) | | | (73,948 | ) | |
| Net change in unrealized appreciation (depreciation) on investments | | | (1,179,273 | ) | | | (115,131 | ) | | | 36,606 | | |
| Net increase (decrease) in net assets resulting from operations | | | 601,996 | | | | (114,273 | ) | | | 103,312 | | |
| Distributions to shareholders (Note 2): | |
| From net investment income: | |
| Initial Class | | | - | | | | - | | | | - | | |
| Total distributions from net investment income | | | - | | | | - | | | | - | | |
| From net realized gains: | |
| Initial Class | | | - | | | | - | | | | - | | |
| Service Class* | | | - | | | | - | | | | - | | |
| Total distributions from net realized gains | | | - | | | | - | | | | - | | |
| Net fund share transactions (Note 5): | |
| Initial Class | | | - | | | | - | | | | - | | |
| Service Class* | | | - | | | | - | | | | - | | |
| Service Class I | | | 67,271,679 | | | | 6,194,066 | | | | 6,306,334 | | |
| Increase (decrease) in net assets from fund share transactions | | | 67,271,679 | | | | 6,194,066 | | | | 6,306,334 | | |
| Total increase (decrease) in net assets | | | 67,873,675 | | | | 6,079,793 | | | | 6,409,646 | | |
| Net assets | |
| Beginning of year | | | - | | | | - | | | | - | | |
| End of year | | $ | 67,873,675 | | | $ | 6,079,793 | | | $ | 6,409,646 | | |
Undistributed (accumulated) net investment income (loss) (distributions in excess
of net investment income) included in net assets at end of year | | $ | 1,842,366 | | | $ | 63,462 | | | $ | 140,654 | | |
145
MML Series Investment Fund – Financial Highlights
(For a share outstanding throughout each period)
MML Asset Allocation Fund
| | | Initial Class | |
| | | Year Ended
12/31/08 | | Year Ended
12/31/07 | | Period Ended
12/31/06+ | |
| Net asset value, beginning of period | | $ | 9.91 | | | $ | 10.30 | | | $ | 10.00 | | |
| Income (loss) from investment operations: | |
| Net investment income (loss) | | | 0.23 | *** | | | 0.25 | *** | | | 0.16 | *** | |
| Net realized and unrealized gain (loss) on investments | | | (3.23 | ) | | | (0.13 | ) | | | 0.31 | | |
| Total income (loss) from investment operations | | | (3.00 | ) | | | 0.12 | | | | 0.47 | | |
| Less distributions to shareholders: | |
| From net investment income | | | (0.01 | ) | | | (0.25 | ) | | | (0.16 | ) | |
| From net realized gains | | | - | | | | (0.26 | ) | | | (0.01 | ) | |
| Total distributions | | | (0.01 | ) | | | (0.51 | ) | | | (0.17 | ) | |
| Net asset value, end of period | | $ | 6.90 | | | $ | 9.91 | | | $ | 10.30 | | |
| Total Return^^ | | | (30.32 | )% | | | 1.14 | % | | | 4.74 | % ** | |
| Ratios / Supplemental Data: | |
| Net assets, end of period (000's) | | $ | 136,326 | | | $ | 255,294 | | | $ | 266,212 | | |
| Ratio of expenses to average daily net assets: | |
| Before expense waiver | | | 0.62 | % | | | 0.59 | % | | | 0.61 | % * | |
| After expense waiver | | | 0.60 | % # | | | 0.57 | % # | | | 0.57 | % *# | |
| Net investment income (loss) to average daily net assets | | | 2.63 | % | | | 2.34 | % | | | 2.40 | % * | |
| Portfolio turnover rate | | | 67 | % | | | 62 | % | | | 38 | % ** | |
| | | Service Class | | | | | |
| | | Period Ended
12/31/08+++ | |
| |
| |
| Net asset value, beginning of period | | $ | 8.98 | | | | | | | | | | |
| Income (loss) from investment operations: | |
| Net investment income (loss) | | | 0.08 | *** | | | | | | | | | |
| Net realized and unrealized gain (loss) on investments | | | (2.15 | ) | | | | | | | | | |
| Total income (loss) from investment operations | | | (2.07 | ) | | | | | | | | | |
| Less distributions to shareholders: | |
| From net investment income | | | (0.01 | ) | | | | | | | | | |
| Total distributions | | | (0.01 | ) | | | | | | | | | |
| Net asset value, end of period | | $ | 6.90 | | | | | | | | | | |
| Total Return^^ | | | (23.10 | )% ** | | | | | | | | | |
| Ratios / Supplemental Data: | |
| Net assets, end of period (000's) | | $ | 1,757 | | | | | | | | | | |
| Net expenses to average daily net assets | | | 0.90 | % * | | | | | | | | | |
| Net investment income (loss) to average daily net assets | | | 3.09 | % * | | | | | | | | | |
| Portfolio turnover rate | | | 67 | % | | | | | | | | | |
* Annualized.
** Percentage represents the results for the period and is not annualized.
*** Per share amount calculated on the average shares method.
+ For the period May 1, 2006 (commencement of operations) through December 31, 2006.
+++ For the period August 15, 2008 (commencement of operations) through December 31, 2008.
# Computed after giving effect to an agreement by MassMutual to waive certain fees and expenses of the Fund.
^^ Total return does not reflect expenses that apply at the separate account level or to related insurance products. Inclusion of these charges would reduce the total return figures for all periods shown.
The accompanying notes are an integral part of the financial statements.
146
MML Series Investment Fund – Financial Highlights (Continued)
(For a share outstanding throughout each period)
MML Equity Income Fund
| | | Initial Class | |
| | | Year Ended
12/31/08 | | Year Ended
12/31/07 | | Period Ended
12/31/06+ | |
| Net asset value, beginning of period | | $ | 10.77 | | | $ | 10.97 | | | $ | 10.00 | | |
| Income (loss) from investment operations: | |
| Net investment income (loss) | | | 0.22 | *** | | | 0.20 | *** | | | 0.11 | *** | |
| Net realized and unrealized gain (loss) on investments | | | (4.04 | ) | | | 0.15 | | | | 0.99 | | |
| Total income (loss) from investment operations | | | (3.82 | ) | | | 0.35 | | | | 1.10 | | |
| Less distributions to shareholders: | |
| From net investment income | | | - | | | | (0.17 | ) | | | (0.10 | ) | |
| From net realized gains | | | (0.13 | ) | | | (0.38 | ) | | | (0.03 | ) | |
| Total distributions | | | (0.13 | ) | | | (0.55 | ) | | | (0.13 | ) | |
| Net asset value, end of period | | $ | 6.82 | | | $ | 10.77 | | | $ | 10.97 | | |
| Total Return^^ | | | (35.80 | )% | | | 3.13 | % | | | 11.01 | % ** | |
| Ratios / Supplemental Data: | |
| Net assets, end of period (000's) | | $ | 353,862 | | | $ | 378,616 | | | $ | 292,357 | | |
| Net expenses to average daily net assets | | | 0.80 | % | | | 0.78 | % | | | 0.80 | % * | |
| Net investment income (loss) to average daily net assets | | | 2.51 | % | | | 1.76 | % | | | 1.66 | % * | |
| Portfolio turnover rate | | | 32 | % | | | 27 | % | | | 12 | % ** | |
| | | Service Class | | | | | |
| | | Year Ended
12/31/08+++ | |
| |
| |
| Net asset value, beginning of period | | $ | 9.60 | | | | | | | | | | |
| Income (loss) from investment operations: | |
| Net investment income (loss) | | | 0.09 | *** | | | | | | | | | |
| Net realized and unrealized gain (loss) on investments | | | (2.74 | ) | | | | | | | | | |
| Total income (loss) from investment operations | | | (2.65 | ) | | | | | | | | | |
| Less distributions to shareholders: | |
| From net realized gains | | | (0.13 | ) | | | | | | | | | |
| Total distributions | | | (0.13 | ) | | | | | | | | | |
| Net asset value, end of period | | $ | 6.82 | | | | | | | | | | |
| Total Return^^ | | | (27.98 | )% ** | | | | | | | | | |
| Ratios / Supplemental Data: | |
| Net assets, end of period (000's) | | $ | 6,302 | | | | | | | | | | |
| Net expenses to average daily net assets | | | 1.06 | % * | | | | | | | | | |
| Net investment income (loss) to average daily net assets | | | 3.36 | % * | | | | | | | | | |
| Portfolio turnover rate | | | 32 | % | | | | | | | | | |
* Annualized.
** Percentage represents the results for the period and is not annualized.
*** Per share amount calculated on the average shares method.
+ For the period May 1, 2006 (commencement of operations) through December 31, 2006.
+++ For the period August 15, 2008 (commencement of operations) through December 31, 2008.
^^ Total return does not reflect expenses that apply at the separate account level or to related insurance products. Inclusion of these charges would reduce the total return figures for all periods shown.
The accompanying notes are an integral part of the financial statements.
147
MML Series Investment Fund – Financial Highlights (Continued)
(For a share outstanding throughout each period)
MML Income & Growth Fund
| | | Initial Class | |
| | | Year Ended
12/31/08 | | Year Ended
12/31/07 | | Period Ended
12/31/06+ | |
| Net asset value, beginning of period | | $ | 10.24 | | | $ | 11.03 | | | $ | 10.00 | | |
| Income (loss) from investment operations: | |
| Net investment income (loss) | | | 0.16 | *** | | | 0.17 | *** | | | 0.13 | *** | |
| Net realized and unrealized gain (loss) on investments | | | (3.72 | ) | | | (0.24 | ) | | | 1.04 | | |
| Total income (loss) from investment operations | | | (3.56 | ) | | | (0.07 | ) | | | 1.17 | | |
| Less distributions to shareholders: | |
| From net investment income | | | (0.00 | )† | | | (0.17 | ) | | | (0.14 | ) | |
| From net realized gains | | | (0.00 | )† | | | (0.55 | ) | | | - | | |
| Tax return of capital | | | - | | | | (0.00 | )† | | | - | | |
| Total distributions | | | (0.00 | ) | | | (0.72 | ) | | | (0.14 | ) | |
| Net asset value, end of period | | $ | 6.68 | | | $ | 10.24 | | | $ | 11.03 | | |
| Total Return^^ | | | (34.76 | )% | | | (0.77 | )% | | | 11.66 | % ** | |
| Ratios / Supplemental Data: | |
| Net assets, end of period (000's) | | $ | 76,447 | | | $ | 150,272 | | | $ | 180,804 | | |
| Ratio of expenses to average daily net assets: | |
| Before expense waiver | | | 0.74 | % | | | 0.70 | % | | | 0.72 | % * | |
| After expense waiver | | | 0.73 | % # | | | N/A ## | | | | 0.70 | % *# | |
| Net investment income (loss) to average daily net assets | | | 1.82 | % | | | 1.48 | % | | | 1.84 | % * | |
| Portfolio turnover rate | | | 59 | % | | | 57 | % | | | 38 | % ** | |
| | | Service Class | | | | | |
| | | Period Ended
12/31/08+++ | |
| |
| |
| Net asset value, beginning of period | | $ | 9.09 | | | | | | | | | | |
| Income (loss) from investment operations: | |
| Net investment income (loss) | | | 0.06 | *** | | | | | | | | | |
| Net realized and unrealized gain (loss) on investments | | | (2.47 | ) | | | | | | | | | |
| Total income (loss) from investment operations | | | (2.41 | ) | | | | | | | | | |
| Less distributions to shareholders: | |
| From net investment income | | | (0.00 | )† | | | | | | | | | |
| From net realized gains | | | (0.00 | )† | | | | | | | | | |
| Total distributions | | | (0.00 | ) | | | | | | | | | |
| Net asset value, end of period | | $ | 6.68 | | | | | | | | | | |
| Total Return^^ | | | (26.51 | )% ** | | | | | | | | | |
| Ratios / Supplemental Data: | |
| Net assets, end of period (000's) | | $ | 650 | | | | | | | | | | |
| Net expenses to average daily net assets | | | 1.03 | % * | | | | | | | | | |
| Net investment income (loss) to average daily net assets | | | 2.33 | % * | | | | | | | | | |
| Portfolio turnover rate | | | 59 | % | | | | | | | | | |
* Annualized.
** Percentage represents the results for the period and is not annualized.
*** Per share amount calculated on the average shares method.
† Amount is less than $0.005 per share.
+ For the period May 1, 2006 (commencement of operations) through December 31, 2006.
+++ For the period August 15, 2008 (commencement of operations) through December 31, 2008.
# Computed after giving effect to an agreement by MassMutual to waive certain fees and expenses of the Fund.
## Amount waived had no impact on the ratio of expenses to average daily net assets.
^^ Total return does not reflect expenses that apply at the separate account level or to related insurance products. Inclusion of these charges would reduce the total return figures for all periods shown.
The accompanying notes are an integral part of the financial statements.
148
MML Series Investment Fund – Financial Highlights (Continued)
(For a share outstanding throughout each period)
MML Growth & Income Fund
| | | Initial Class | |
| | | Year Ended
12/31/08 | | Year Ended
12/31/07 | | Period Ended
12/31/06+ | |
| Net asset value, beginning of period | | $ | 9.80 | | | $ | 10.36 | | | $ | 10.00 | | |
| Income (loss) from investment operations: | |
| Net investment income (loss) | | | 0.11 | *** | | | 0.12 | *** | | | 0.07 | *** | |
| Net realized and unrealized gain (loss) on investments | | | (4.04 | ) | | | (0.14 | ) | | | 0.37 | | |
| Total income (loss) from investment operations | | | (3.93 | ) | | | (0.02 | ) | | | 0.44 | | |
| Less distributions to shareholders: | |
| From net investment income | | | - | | | | (0.12 | ) | | | (0.08 | ) | |
| From net realized gains | | | - | | | | (0.42 | ) | | | - | | |
| Tax return of capital | | | - | | | | (0.00 | )† | | | - | | |
| Total distributions | | | - | | | | (0.54 | ) | | | (0.08 | ) | |
| Net asset value, end of period | | $ | 5.87 | | | $ | 9.80 | | | $ | 10.36 | | |
| Total Return^^ | | | (40.10 | )% | | | (0.33 | )% | | | 4.35 | % ** | |
| Ratios / Supplemental Data: | |
| Net assets, end of period (000's) | | $ | 133,236 | | | $ | 269,803 | | | $ | 302,641 | | |
| Ratio of expenses to average daily net assets: | |
| Before expense waiver | | | 0.56 | % | | | 0.54 | % | | | 0.55 | % * | |
| After expense waiver | | | 0.55 | % # | | | 0.52 | % # | | | 0.52 | % *# | |
| Net investment income (loss) to average daily net assets | | | 1.39 | % | | | 1.13 | % | | | 1.11 | % * | |
| Portfolio turnover rate | | | 48 | % | | | 38 | % | | | 22 | % ** | |
| | | Service Class | | | | | |
| | | Period Ended
12/31/08+++ | |
| |
| |
| Net asset value, beginning of period | | $ | 8.59 | | | | | | | | | | |
| Income (loss) from investment operations: | |
| Net investment income (loss) | | | 0.05 | *** | | | | | | | | | |
| Net realized and unrealized gain (loss) on investments | | | (2.78 | ) | | | | | | | | | |
| Total income (loss) from investment operations | | | (2.73 | ) | | | | | | | | | |
| Net asset value, end of period | | $ | 5.86 | | | | | | | | | | |
| Total Return^^ | | | (31.78 | )% ** | | | | | | | | | |
| Ratios / Supplemental Data: | |
| Net assets, end of period (000's) | | $ | 1,319 | | | | | | | | | | |
| Net expenses to average daily net assets | | | 0.84 | % * | | | | | | | | | |
| Net investment income (loss) to average daily net assets | | | 2.15 | % * | | | | | | | | | |
| Portfolio turnover rate | | | 48 | % | | | | | | | | | |
* Annualized.
** Percentage represents the results for the period and is not annualized.
*** Per share amount calculated on the average shares method.
† Amount is less than $0.005 per share.
+ For the period May 1, 2006 (commencement of operations) through December 31, 2006.
+++ For the period August 15, 2008 (commencement of operations) through December 31, 2008.
# Computed after giving effect to an agreement by MassMutual to waive certain fees and expenses of the Fund.
^^ Total return does not reflect expenses that apply at the separate account level or to related insurance products. Inclusion of these charges would reduce the total return figures for all periods shown.
The accompanying notes are an integral part of the financial statements.
149
MML Series Investment Fund – Financial Highlights (Continued)
(For a share outstanding throughout each period)
MML Blue Chip Growth Fund
| | | Initial Class | |
| | | Year Ended
12/31/08 | | Year Ended
12/31/07 | | Period Ended
12/31/06+ | |
| Net asset value, beginning of period | | $ | 11.87 | | | $ | 10.58 | | | $ | 10.00 | | |
| Income (loss) from investment operations: | |
| Net investment income (loss) | | | 0.02 | *** | | | 0.05 | *** | | | 0.02 | *** | |
| Net realized and unrealized gain (loss) on investments | | | (5.06 | ) | | | 1.29 | | | | 0.58 | | |
| Total income (loss) from investment operations | | | (5.04 | ) | | | 1.34 | | | | 0.60 | | |
| Less distributions to shareholders: | |
| From net investment income | | | - | | | | (0.05 | ) | | | (0.02 | ) | |
| Tax return of capital | | | - | | | | (0.00 | )† | | | - | | |
| Total distributions | | | - | | | | (0.05 | ) | | | (0.02 | ) | |
| Net asset value, end of period | | $ | 6.83 | | | $ | 11.87 | | | $ | 10.58 | | |
| Total Return^^ | | | (42.46 | )% | | | 12.67 | % | | | 6.04 | % ** | |
| Ratios / Supplemental Data: | |
| Net assets, end of period (000's) | | $ | 168,558 | | | $ | 61,701 | | | $ | 54,746 | | |
| Ratio of expenses to average daily net assets: | |
| Before expense waiver | | | 0.85 | % | | | 0.84 | % | | | 0.90 | % * | |
| After expense waiver | | | 0.84 | % # | | | N/A | | | | 0.85 | % *# | |
| Net investment income (loss) to average daily net assets | | | 0.23 | % | | | 0.40 | % | | | 0.37 | % * | |
| Portfolio turnover rate | | | 33 | % | | | 35 | % | | | 24 | % ** | |
| | | Service Class | | | | | |
| | | Period Ended
12/31/08+++ | |
| |
| |
| Net asset value, beginning of period | | $ | 10.70 | | | | | | | | | | |
| Income (loss) from investment operations: | |
| Net investment income (loss) | | | 0.00 | ***† | | | | | | | | | |
| Net realized and unrealized gain (loss) on investments | | | (3.87 | ) | | | | | | | | | |
| Total income (loss) from investment operations | | | (3.87 | ) | | | | | | | | | |
| Net asset value, end of period | | $ | 6.83 | | | | | | | | | | |
| Total Return^^ | | | (36.17 | )% ** | | | | | | | | | |
| Ratios / Supplemental Data: | |
| Net assets, end of peirod (000's) | | $ | 1,816 | | | | | | | | | | |
| Net expenses to average daily net assets | | | 1.10 | % * | | | | | | | | | |
| Net investment income (loss) to average daily net assets | | | 0.17 | % * | | | | | | | | | |
| Portfolio turnover rate | | | 33 | % | | | | | | | | | |
* Annualized.
** Percentage represents the results for the period and is not annualized.
*** Per share amount calculated on the average shares method.
† Amount is less than $0.005 per share.
+ For the period May 1, 2006 (commencement of operations) through December 31, 2006.
+++ For the period August 15, 2008 (commencement of operations) through December 31, 2008.
# Computed after giving effect to an agreement by MassMutual to waive certain fees and expenses of the Fund.
^^ Total return does not reflect expenses that apply at the separate account level or to related insurance products. Inclusion of these charges would reduce the total return figures for all periods shown.
The accompanying notes are an integral part of the financial statements.
150
MML Series Investment Fund – Financial Highlights (Continued)
(For a share outstanding throughout each period)
MML Large Cap Growth Fund
| | | Initial Class | |
| | | Year Ended
12/31/08 | | Year Ended
12/31/07 | | Period Ended
12/31/06+ | |
| Net asset value, beginning of period | | $ | 11.34 | | | $ | 10.00 | | | $ | 10.00 | | |
| Income (loss) from investment operations: | |
| Net investment income (loss) | | | 0.03 | *** | | | 0.01 | *** | | | 0.01 | *** | |
| Net realized and unrealized gain (loss) on investments | | | (4.66 | ) | | | 1.35 | | | | (0.00 | )† | |
| Total income (loss) from investment operations | | | (4.63 | ) | | | 1.36 | | | | 0.01 | | |
| Less distributions to shareholders: | |
| From net investment income | | | - | | | | (0.02 | ) | | | (0.01 | ) | |
| Total distributions | | | - | | | | (0.02 | ) | | | (0.01 | ) | |
| Net asset value, end of period | | $ | 6.71 | | | $ | 11.34 | | | $ | 10.00 | | |
| Total Return^^ | | | (40.83 | )% | | | 13.57 | % | | | 0.10 | % ** | |
| Ratios / Supplemental Data: | |
| Net assets, end of period (000's) | | $ | 36,197 | | | $ | 74,225 | | | $ | 77,892 | | |
| Ratio of expenses to average daily net assets: | |
| Before expense waiver | | | 0.78 | % | | | 0.72 | % | | | 0.76 | % * | |
| After expense waiver | | | 0.77 | % # | | | N/A | | | | 0.73 | % *# | |
| Net investment income (loss) to average daily net assets | | | 0.35 | % | | | 0.12 | % | | | 0.15 | % * | |
| Portfolio turnover rate | | | 86 | % | | | 85 | % | | | 61 | % ** | |
| | | Service Class | | | | | |
| | | Period Ended
12/31/08+++ | |
| |
| |
| Net asset value, beginning of period | | $ | 9.87 | | | | | | | | | | |
| Income (loss) from investment operations: | |
| Net investment income (loss) | | | 0.01 | *** | | | | | | | | | |
| Net realized and unrealized gain (loss) on investments | | | (3.17 | ) | | | | | | | | | |
| Total income (loss) from investment operations | | | (3.16 | ) | | | | | | | | | |
| Net asset value, end of period | | $ | 6.71 | | | | | | | | | | |
| Total Return^^ | | | (32.02 | )% ** | | | | | | | | | |
| Ratios / Supplemental Data: | |
| Net assets, end of period (000's) | | $ | 236 | | | | | | | | | | |
| Net expenses to average daily net assets | | | 1.13 | % * | | | | | | | | | |
| Net investment income (loss) to average daily net assets | | | 0.53 | % * | | | | | | | | | |
| Portfolio turnover rate | | | 86 | % | | | | | | | | | |
* Annualized.
** Percentage represents the results for the period and is not annualized.
*** Per share amount calculated on the average shares method.
† Amount is less than $0.005 per share.
+ For the period May 1, 2006 (commencement of operations) through December 31, 2006.
+++ For the period August 15, 2008 (commencement of operations) through December 31, 2008.
# Computed after giving effect to an agreement by MassMutual to waive certain fees and expenses of the Fund.
^^ Total return does not reflect expenses that apply at the separate account level or to related insurance products. Inclusion of these charges would reduce the total return figures for all periods shown.
The accompanying notes are an integral part of the financial statements.
151
MML Series Investment Fund – Financial Highlights (Continued)
(For a share outstanding throughout each period)
MML Concentrated Growth Fund
| | | Class I | |
| | | Year Ended
12/31/08 | | Year Ended
12/31/07 | | Period Ended
12/31/06+ | |
| Net asset value, beginning of period | | $ | 11.09 | | | $ | 10.21 | | | $ | 10.00 | | |
| Income (loss) from investment operations: | |
| Net investment income (loss) | | | 0.03 | *** | | | 0.02 | *** | | | 0.01 | *** | |
| Net realized and unrealized gain (loss) on investments | | | (6.67 | ) | | | 1.54 | | | | 0.21 | | |
| Total income (loss) from investment operations | | | (6.64 | ) | | | 1.56 | | | | 0.22 | | |
| Less distributions to shareholders: | |
| From net investment income | | | - | | | | (0.02 | ) | | | - | | |
| From net realized gains | | | - | | | | (0.66 | ) | | | (0.01 | ) | |
| Total distributions | | | - | | | | (0.68 | ) | | | (0.01 | ) | |
| Net asset value, end of period | | $ | 4.45 | | | $ | 11.09 | | | $ | 10.21 | | |
| Total Return^^ | | | (59.87 | )% | | | 15.04 | % | | | 2.19 | % ** | |
| Ratios / Supplemental Data: | |
| Net assets, end of period (000's) | | $ | 59,617 | | | $ | 23,930 | | | $ | 18,032 | | |
| Ratio of expenses to average daily net assets: | |
| Before expense waiver | | | 0.93 | % | | | 0.91 | % | | | 0.94 | % * | |
| After expense waiver | | | 0.90 | % # | | | 0.76 | % # | | | 0.76 | % *# | |
| Net investment income (loss) to average daily net assets | | | 0.40 | % | | | 0.16 | % | | | 0.11 | % * | |
| Portfolio turnover rate | | | 104 | % | | | 59 | % | | | 43 | % ** | |
| | | Class II | |
| | | Year Ended
12/31/08 | | Year Ended
12/31/07 | | Period Ended
12/31/06+ | |
| Net asset value, beginning of period | | $ | 11.10 | | | $ | 10.21 | | | $ | 10.00 | | |
| Income (loss) from investment operations: | |
| Net investment income (loss) | | | 0.03 | *** | | | 0.03 | *** | | | 0.01 | *** | |
| Net realized and unrealized gain (loss) on investments | | | (6.67 | ) | | | 1.55 | | | | 0.22 | | |
| Total income (loss) from investment operations | | | (6.64 | ) | | | 1.58 | | | | 0.23 | | |
| Less distributions to shareholders: | |
| From net investment income | | | - | | | | (0.03 | ) | | | - | | |
| From net realized gains | | | - | | | | (0.66 | ) | | | (0.02 | ) | |
| Total distributions | | | - | | | | (0.69 | ) | | | (0.02 | ) | |
| Net asset value, end of period | | $ | 4.46 | | | $ | 11.10 | | | $ | 10.21 | | |
| Total Return^^ | | | (59.82 | )% | | | 15.20 | % | | | 2.25 | % ** | |
| Ratios / Supplemental Data: | |
| Net assets, end of period (000's) | | $ | 19,978 | | | $ | 61,686 | | | $ | 64,702 | | |
| Ratio of expenses to average daily net assets: | |
| Before expense waiver | | | 0.82 | % | | | 0.81 | % | | | 0.84 | % * | |
| After expense waiver | | | 0.76 | % # | | | 0.66 | % # | | | 0.66 | % *# | |
| Net investment income (loss) to average daily net assets | | | 0.40 | % | | | 0.26 | % | | | 0.21 | % * | |
| Portfolio turnover rate | | | 104 | % | | | 59 | % | | | 43 | % ** | |
* Annualized.
** Percentage represents the results for the period and is not annualized.
*** Per share amount calculated on the average shares method.
+ For the period May 1, 2006 (commencement of operations) through December 31, 2006.
# Computed after giving effect to an agreement by MassMutual to waive certain fees and expenses of the Fund.
^^ Total return does not reflect expenses that apply at the separate account level or to related insurance products. Inclusion of these charges would reduce the total return figures for all periods shown.
The accompanying notes are an integral part of the financial statements.
152
MML Series Investment Fund – Financial Highlights (Continued)
(For a share outstanding throughout each period)
MML Concentrated Growth Fund
| | | Service Class I | | | | | |
| | | Period Ended
12/31/08+++ | |
| |
| |
| Net asset value, beginning of period | | $ | 8.78 | | | | | | |
| Income (loss) from investment operations: | |
| Net investment income (loss) | | | 0.01 | *** | | | | | |
| Net realized and unrealized gain (loss) on investments | | | (4.34 | ) | | | | | |
| Total income (loss) from investment operations | | | (4.33 | ) | | | | | |
| Net asset value, end of period | | $ | 4.45 | | | | | | |
| Total Return^^ | | | (49.32 | )% ** | | | | | |
| Ratios / Supplemental Data: | |
| Net assets, end of period (000's) | | $ | 494 | | | | | | |
| Net expenses to average daily net assets | | | 1.19 | % * | | | | | |
| Net investment income (loss) to average daily net assets | | | 0.73 | % * | | | | | |
| Portfolio turnover rate | | | 104 | % | | | | | |
MML Mid Cap Value Fund
| | | Initial Class | |
| | | Year Ended
12/31/08 | | Year Ended
12/31/07 | | Period Ended
12/31/06+ | |
| Net asset value, beginning of period | | $ | 9.18 | | | $ | 10.81 | | | $ | 10.00 | | |
| Income (loss) from investment operations: | |
| Net investment income (loss) | | | 0.17 | *** | | | 0.15 | *** | | | 0.10 | *** | |
| Net realized and unrealized gain (loss) on investments | | | (2.42 | ) | | | (0.35 | ) | | | 1.03 | | |
| Total income (loss) from investment operations | | | (2.25 | ) | | | (0.20 | ) | | | 1.13 | | |
| Less distributions to shareholders: | |
| From net investment income | | | (0.00 | )† | | | (0.10 | ) | | | (0.10 | ) | |
| From net realized gains | | | - | | | | (1.33 | ) | | | (0.22 | ) | |
| Total distributions | | | - | | | | (1.43 | ) | | | (0.32 | ) | |
| Net asset value, end of period | | $ | 6.93 | | | $ | 9.18 | | | $ | 10.81 | | |
| Total Return^^ | | | (24.51 | )% | | | (2.32 | )% | | | 11.23 | % ** | |
| Ratios / Supplemental Data: | |
| Net assets, end of period (000's) | | $ | 291,433 | | | $ | 404,928 | | | $ | 358,906 | | |
| Net expenses to average daily net assets | | | 0.90 | % | | | 0.88 | % | | | 0.90 | % * | |
| Net investment income (loss) to average daily net assets | | | 2.09 | % | | | 1.33 | % | | | 1.44 | % * | |
| Portfolio turnover rate | | | 189 | % | | | 206 | % | | | 173 | % ** | |
* Annualized.
** Percentage represents the results for the period and is not annualized.
*** Per share amount calculated on the average shares method.
† Amount is less than $0.005 per share.
+ For the period May 1, 2006 (commencement of operations) through December 31, 2006.
+++ For the period August 15, 2008 (commencement of operations) through December 31, 2008.
^^ Total return does not reflect expenses that apply at the separate account level or to related insurance products. Inclusion of these charges would reduce the total return figures for all periods shown.
The accompanying notes are an integral part of the financial statements.
153
MML Series Investment Fund – Financial Highlights (Continued)
(For a share outstanding throughout each period)
MML Mid Cap Value Fund
| | | Service Class | | | | | |
| | | Period Ended
12/31/08+++ | |
| |
| |
| Net asset value, beginning of period | | $ | 9.06 | | | | | | |
| Income (loss) from investment operations: | |
| Net investment income (loss) | | | 0.09 | *** | | | | | |
| Net realized and unrealized gain (loss) on investments | | | (2.23 | ) | | | | | |
| Total income (loss) from investment operations | | | (2.14 | ) | | | | | |
| Less distributions to shareholders: | |
| From net investment income | | | (0.00 | )† | | | | | |
| Total distributions | | | (0.00 | ) | | | | | |
| Net asset value, end of period | | $ | 6.92 | | | | | | |
| Total Return^^ | | | (23.62 | )% ** | | | | | |
| Ratios / Supplemental Data: | |
| Net assets, end of period (000's) | | $ | 2,279 | | | | | | |
| Net expenses to average daily net assets | | | 1.16 | % * | | | | | |
| Net investment income (loss) to average daily net assets | | | 3.51 | % * | | | | | |
| Portfolio turnover rate | | | 189 | % | | | | | |
MML Mid Cap Growth Fund
| | | Initial Class | |
| | | Year Ended
12/31/08 | | Year Ended
12/31/07 | | Period Ended
12/31/06+ | |
| Net asset value, beginning of period | | $ | 11.18 | | | $ | 10.04 | | | $ | 10.00 | | |
| Income (loss) from investment operations: | |
| Net investment income (loss) | | | (0.02 | )*** | | | 0.01 | *** | | | (0.01 | )*** | |
| Net realized and unrealized gain (loss) on investments | | | (4.41 | ) | | | 1.71 | | | | 0.05 | | |
| Total income (loss) from investment operations | | | (4.43 | ) | | | 1.72 | | | | 0.04 | | |
| Less distributions to shareholders: | |
| From net investment income | | | - | | | | (0.01 | ) | | | - | | |
| From net realized gains | | | (0.18 | ) | | | (0.57 | ) | | | - | | |
| Total distributions | | | (0.18 | ) | | | (0.58 | ) | | | - | | |
| Net asset value, end of period | | $ | 6.57 | | | $ | 11.18 | | | $ | 10.04 | | |
| Total Return^^ | | | (40.21 | )% | | | 16.89 | % | | | 0.50 | % ** | |
| Ratios / Supplemental Data: | |
| Net assets, end of period (000's) | | $ | 183,886 | | | $ | 285,701 | | | $ | 285,149 | | |
| Net expenses to average daily net assets | | | 0.83 | % | | | 0.81 | % | | | 0.83 | % * | |
| Net investment income (loss) to average daily net assets | | | (0.21 | )% | | | 0.08 | % | | | (0.11 | )% * | |
| Portfolio turnover rate | | | 32 | % | | | 31 | % | | | 30 | % ** | |
* Annualized.
** Percentage represents the results for the period and is not annualized.
*** Per share amount calculated on the average shares method.
† Amount is less than $0.005 per share.
+ For the period May 1, 2006 (commencement of operations) through December 31, 2006.
+++ For the period August 15, 2008 (commencement of operations) through December 31, 2008.
^^ Total return does not reflect expenses that apply at the separate account level or to related insurance products. Inclusion of these charges would reduce the total return figures for all periods shown.
The accompanying notes are an integral part of the financial statements.
154
MML Series Investment Fund – Financial Highlights (Continued)
(For a share outstanding throughout each period)
MML Mid Cap Growth Fund
| | | Service Class | | | | | |
| | | Period Ended
12/31/08+++ | |
| |
| |
| Net asset value, beginning of period | | $ | 10.46 | | | | | | |
| Income (loss) from investment operations: | |
| Net investment income (loss) | | | (0.01 | )*** | | | | | |
| Net realized and unrealized gain (loss) on investments | | | (3.70 | ) | | | | | |
| Total income (loss) from investment operations | | | (3.71 | ) | | | | | |
| Less distributions to shareholders: | |
| From net realized gains | | | (0.18 | ) | | | | | |
| Total distributions | | | (0.18 | ) | | | | | |
| Net asset value, end of period | | $ | 6.57 | | | | | | |
| Total Return^^ | | | (36.09 | )% ** | | | | | |
| Ratios / Supplemental Data: | |
| Net assets, end of period (000's) | | $ | 3,757 | | | | | | |
| Net expenses to average daily net assets | | | 1.11 | % * | | | | | |
| Net investment income (loss) to average daily net assets | | | (0.29 | )% * | | | | | |
| Portfolio turnover rate | | | 32 | % | | | | | |
MML Small/Mid Cap Value Fund
| | | Initial Class | |
| | | Year Ended
12/31/08 | | Year Ended
12/31/07 | | Period Ended
12/31/06+ | |
| Net asset value, beginning of period | | $ | 8.45 | | | $ | 10.45 | | | $ | 10.00 | | |
| Income (loss) from investment operations: | |
| Net investment income (loss) | | | 0.08 | *** | | | 0.11 | *** | | | 0.08 | *** | |
| Net realized and unrealized gain (loss) on investments | | | (3.32 | ) | | | (2.02 | ) | | | 0.44 | | |
| Total income (loss) from investment operations | | | (3.24 | ) | | | (1.91 | ) | | | 0.52 | | |
| Less distributions to shareholders: | |
| From net investment income | | | - | | | | (0.09 | ) | | | (0.07 | ) | |
| Tax return of capital | | | - | | | | (0.00 | ) † | | | - | | |
| Total distributions | | | - | | | | (0.09 | ) | | | (0.07 | ) | |
| Net asset value, end of period | | $ | 5.21 | | | $ | 8.45 | | | $ | 10.45 | | |
| Total Return^^ | | | (38.34 | )% | | | (18.31 | )% | | | 5.20 | % ** | |
| Ratios / Supplemental Data: | |
| Net assets, end of period (000's) | | $ | 145,129 | | | $ | 248,583 | | | $ | 207,239 | | |
| Net expenses to average daily net assets | | | 0.81 | % | | | 0.79 | % | | | 0.83 | % * | |
| Net investment income (loss) to average daily net assets | | | 1.10 | % | | | 1.14 | % | | | 1.29 | % * | |
| Portfolio turnover rate | | | 145 | % | | | 152 | % | | | 173 | % ** | |
* Annualized.
** Percentage represents the results for the period and is not annualized.
*** Per share amount calculated on the average shares method.
+ For the period May 1, 2006 (commencement of operations) through December 31, 2006.
+++ For the period August 15, 2008 (commencement of operations) through December 31, 2008.
^^ Total return does not reflect expenses that apply at the separate account level or to related insurance products. Inclusion of these charges would reduce the total return figures for all periods shown.
The accompanying notes are an integral part of the financial statements.
155
MML Series Investment Fund – Financial Highlights (Continued)
(For a share outstanding throughout each period)
MML Small/Mid Cap Value Fund
| | | Service Class | | | | | |
| | | Period Ended
12/31/08+++ | |
| |
| |
| Net asset value, beginning of period | | $ | 8.11 | | | | | | |
| Income (loss) from investment operations: | |
| Net investment income (loss) | | | 0.03 | *** | | | | | |
| Net realized and unrealized gain (loss) on investments | | | (2.93 | ) | | | | | |
| Total income (loss) from investment operations | | | (2.90 | ) | | | | | |
| Net asset value, end of period | | $ | 5.21 | | | | | | |
| Total Return^^ | | | (35.76 | )% ** | | | | | |
| Ratios / Supplemental Data: | |
| Net assets, end of period (000's) | | $ | 1,535 | | | | | | |
| Net expenses to average daily net assets | | | 1.07 | % * | | | | | |
| Net investment income (loss) to average daily net assets | | | 1.79 | % * | | | | | |
| Portfolio turnover rate | | | 145 | % | | | | | |
MML Small Cap Index Fund
| | | Initial Class | |
| | | Year Ended
12/31/08 | | Year Ended
12/31/07 | | Period Ended
12/31/06+ | |
| Net asset value, beginning of period | | $ | 9.56 | | | $ | 10.10 | | | $ | 10.00 | | |
| Income (loss) from investment operations: | |
| Net investment income (loss) | | | 0.08 | *** | | | 0.09 | *** | | | 0.04 | *** | |
| Net realized and unrealized gain (loss) on investments | | | (3.05 | ) | | | (0.13 | ) | | | 0.10 | | |
| Total income (loss) from investment operations | | | (2.97 | ) | | | (0.04 | ) | | | 0.14 | | |
| Less distributions to shareholders: | |
| From net investment income | | | - | | | | (0.09 | ) | | | (0.04 | ) | |
| From net realized gains | | | (0.10 | ) | | | (0.41 | ) | | | - | | |
| Total distributions | | | (0.10 | ) | | | (0.50 | ) | | | (0.04 | ) | |
| Net asset value, end of period | | $ | 6.49 | | | $ | 9.56 | | | $ | 10.10 | | |
| Total Return^^ | | | (31.36 | )% | | | (0.57 | )% | | | 1.41 | % ** | |
| Ratios / Supplemental Data: | |
| Net assets, end of period (000's) | | $ | 33,944 | | | $ | 58,893 | | | $ | 68,783 | | |
| Ratio of expenses to average daily net assets: | |
| Before expense waiver | | | 0.54 | % | | | 0.44 | % | | | 0.52 | % * | |
| After expense waiver | | | 0.53 | % # | | | N/A | | | | 0.45 | % *# | |
| Net investment income (loss) to average daily net assets | | | 0.98 | % | | | 0.90 | % | | | 0.60 | % * | |
| Portfolio turnover rate | | | 23 | % | | | 15 | % | | | 73 | % ** | |
* Annualized.
** Percentage represents the results for the period and is not annualized.
*** Per share amount calculated on the average shares method.
+ For the period May 1, 2006 (commencement of operations) through December 31, 2006.
+++ For the period August 15, 2008 (commencement of operations) through December 31, 2008.
# Computed after giving effect to an agreement by MassMutual to waive certain fees and expenses of the Fund.
^^ Total return does not reflect expenses that apply at the separate account level or to related insurance products. Inclusion of these charges would reduce the total return figures for all periods shown.
The accompanying notes are an integral part of the financial statements.
156
MML Series Investment Fund – Financial Highlights (Continued)
(For a share outstanding throughout each period)
MML Small Cap Index Fund
| | | Service Class | | | | | |
| | | Period Ended
12/31/08+++ | |
| |
| |
| Net asset value, beginning of period | | $ | 9.60 | | | | | | |
| Income (loss) from investment operations: | |
| Net investment income (loss) | | | 0.03 | *** | | | | | |
| Net realized and unrealized gain (loss) on investments | | | (3.05 | ) | | | | | |
| Total income (loss) from investment operations | | | (3.02 | ) | | | | | |
| Less distributions to shareholders: | |
| From net realized gains | | | (0.10 | ) | | | | | |
| Total distributions | | | (0.10 | ) | | | | | |
| Net asset value, end of period | | $ | 6.48 | | | | | | |
| Total Return^^ | | | (31.75 | )% ** | | | | | |
| Ratios / Supplemental Data: | |
| Net assets, end of period (000's) | | $ | 1,184 | | | | | | |
| Net expenses to average daily net assets | | | 0.91 | % * | | | | | |
| Net investment income (loss) to average daily net assets | | | 1.33 | % * | | | | | |
| Portfolio turnover rate | | | 23 | % | | | | | |
MML Global Fund
| | | Class I | |
| | | Year Ended
12/31/08 | | Year Ended
12/31/07 | | Period Ended
12/31/06+ | |
| Net asset value, beginning of period | | $ | 10.31 | | | $ | 10.52 | | | $ | 10.00 | | |
| Income (loss) from investment operations: | |
| Net investment income (loss) | | | 0.15 | *** | | | 0.16 | *** | | | 0.10 | *** | |
| Net realized and unrealized gain (loss) on investments | | | (4.64 | ) | | | 0.22 | | | | 0.53 | | |
| Total income (loss) from investment operations | | | (4.49 | ) | | | 0.38 | | | | 0.63 | | |
| Less distributions to shareholders: | |
| From net investment income | | | - | | | | (0.16 | ) | | | (0.11 | ) | |
| From net realized gains | | | (0.04 | ) | | | (0.43 | ) | | | - | | |
| Total distributions | | | (0.04 | ) | | | (0.59 | ) | | | (0.11 | ) | |
| Net asset value, end of period | | $ | 5.78 | | | $ | 10.31 | | | $ | 10.52 | | |
| Total Return^^ | | | (43.70 | )% | | | 3.57 | % | | | 6.25 | % ** | |
| Ratios / Supplemental Data: | |
| Net assets, end of period (000's) | | $ | 5,589 | | | $ | 10,156 | | | $ | 9,698 | | |
| Ratio of expenses to average daily net assets: | |
| Before expense waiver | | | 1.27 | % | | | 1.15 | % | | | 1.15 | % * | |
| After expense waiver | | | 0.83 | % # | | | 0.71 | % # | | | 0.71 | % *# | |
| Net investment income (loss) to average daily net assets | | | 1.82 | % | | | 1.41 | % | | | 1.47 | % * | |
| Portfolio turnover rate | | | 65 | % | | | 56 | % | | | 41 | % ** | |
* Annualized.
** Percentage represents the results for the period and is not annualized.
*** Per share amount calculated on the average shares method.
+ For the period May 1, 2006 (commencement of operations) through December 31, 2006.
+++ For the period August 15, 2008 (commencement of operations) through December 31, 2008.
# Computed after giving effect to an agreement by MassMutual to waive certain fees and expenses of the Fund.
^^ Total return does not reflect expenses that apply at the separate account level or to related insurance products. Inclusion of these charges would reduce the total return figures for all periods shown.
The accompanying notes are an integral part of the financial statements.
157
MML Series Investment Fund – Financial Highlights (Continued)
(For a share outstanding throughout each period)
MML Global Fund
| | | Class II | |
| | | Year Ended
12/31/08 | | Year Ended
12/31/07 | | Year Ended
12/31/06+ | |
| Net asset value, beginning of period | | $ | 10.31 | | | $ | 10.52 | | | $ | 10.00 | | |
| Income (loss) from investment operations: | |
| Net investment income (loss) | | | 0.17 | *** | | | 0.17 | *** | | | 0.10 | *** | |
| Net realized and unrealized gain (loss) on investments | | | (4.61 | ) | | | 0.22 | | | | 0.53 | | |
| Total income (loss) from investment operations | | | (4.44 | ) | | | 0.39 | | | | 0.63 | | |
| Less distributions to shareholders: | |
| From net investment income | | | - | | | | (0.17 | ) | | | (0.11 | ) | |
| From net realized gains | | | (0.04 | ) | | | (0.43 | ) | | | - | | |
| Total distributions | | | (0.04 | ) | | | (0.60 | ) | | | (0.11 | ) | |
| Net asset value, end of period | | $ | 5.83 | | | $ | 10.31 | | | $ | 10.52 | | |
| Total Return^^ | | | (43.27 | )% | | | 3.75 | % | | | 6.30 | % ** | |
| Ratios / Supplemental Data: | |
| Net assets, end of period (000's) | | $ | 18,607 | | | $ | 43,429 | | | $ | 51,804 | | |
| Ratio of expenses to average daily net assets: | |
| Before expense waiver | | | 1.17 | % | | | 1.05 | % | | | 1.04 | % * | |
| After expense waiver | | | 0.72 | % # | | | 0.61 | % | | | 0.61 | % *# | |
| Net investment income (loss) to average daily net assets | | | 1.95 | % | | | 1.51 | % | | | 1.60 | % * | |
| Portfolio turnover rate | | | 65 | % | | | 56 | % | | | 41 | % ** | |
| | | Service Class I | | | | | |
| | | Period Ended
12/31/08+++ | |
| |
| |
| Net asset value, beginning of period | | $ | 8.72 | | | | | | | | | | |
| Income (loss) from investment operations: | |
| Net investment income (loss) | | | 0.01 | *** | | | | | | | | | |
| Net realized and unrealized gain (loss) on investments | | | (2.89 | ) | | | | | | | | | |
| Total income (loss) from investment operations | | | (2.88 | ) | | | | | | | | | |
| Less distributions to shareholders: | |
| From net realized gains | | | (0.04 | ) | | | | | | | | | |
| Total distributions | | | (0.04 | ) | | | | | | | | | |
| Net asset value, end of period | | $ | 5.80 | | | | | | | | | | |
| Total Return^^ | | | (33.21 | )% ** | | | | | | | | | |
| Ratios / Supplemental Data: | |
| Net assets, end of period (000's) | | $ | 265 | | | | | | | | | | |
| Ratio of expenses to average daily net assets: | |
| Before expense waiver | | | 1.19 | % * | | | | | | | | | |
| After expense waiver | | | 1.15 | % *# | | | | | | | | | |
| Net investment income (loss) to average daily net assets | | | 0.46 | % * | | | | | | | | | |
| Portfolio turnover rate | | | 65 | % | | | | | | | | | |
* Annualized.
** Percentage represents the results for the period and is not annualized.
*** Per share amount calculated on the average shares method.
+ For the period May 1, 2006 (commencement of operations) through December 31, 2006.
+++ For the period August 15, 2008 (commencement of operations) through December 31, 2008.
# Computed after giving effect to an agreement by MassMutual to waive certain fees and expenses of the Fund.
^^ Total return does not reflect expenses that apply at the separate account level or to related insurance products. Inclusion of these charges would reduce the total return figures for all periods shown.
The accompanying notes are an integral part of the financial statements.
158
MML Series Investment Fund – Financial Highlights (Continued)
(For a share outstanding throughout each period)
MML Foreign Fund
| | | Initial Class | |
| | | Year Ended
12/31/08 | | Year Ended
12/31/07 | | Period Ended
12/31/06+ | |
| Net asset value, beginning of period | | $ | 12.02 | | | $ | 11.00 | | | $ | 10.00 | | |
| Income (loss) from investment operations: | |
| Net investment income (loss) | | | 0.27 | *** | | | 0.24 | *** | | | 0.13 | *** | |
| Net realized and unrealized gain (loss) on investments | | | (5.21 | ) | | | 1.24 | | | | 1.00 | | |
| Total income (loss) from investment operations | | | (4.94 | ) | | | 1.48 | | | | 1.13 | | |
| Less distributions to shareholders: | |
| From net investment income | | | (0.00 | )† | | | (0.27 | ) | | | (0.12 | ) | |
| From net realized gains | | | - | | | | (0.19 | ) | | | (0.01 | ) | |
| Total distributions | | | (0.00 | ) | | | (0.46 | ) | | | (0.13 | ) | |
| Net asset value, end of period | | $ | 7.08 | | | $ | 12.02 | | | $ | 11.00 | | |
| Total Return^^ | | | (41.07 | )% | | | 13.48 | % | | | 11.26 | % ** | |
| Ratios / Supplemental Data: | |
| Net assets, end of period (000's) | | $ | 208,709 | | | $ | 359,018 | | | $ | 253,512 | | |
| Ratio of expenses to average daily net assets: | |
| Before expense waiver | | | 1.00 | % | | | 1.00 | % | | | 1.03 | % * | |
| After expense waiver | | | 0.98 | % # | | | N/A | | | | 1.02 | % *# | |
| Net investment income (loss) to average daily net assets | | | 2.74 | % | | | 2.00 | % | | | 1.90 | % * | |
| Portfolio turnover rate | | | 10 | % | | | 9 | % | | | 9 | % ** | |
| | | Service Class | | | | | |
| | | Period Ended
12/31/08+++ | |
| |
| |
| Net asset value, beginning of period | | $ | 9.96 | | | | | | | | | | |
| Income (loss) from investment operations: | |
| Net investment income (loss) | | | 0.03 | *** | | | | | | | | | |
| Net realized and unrealized gain (loss) on investments | | | (2.92 | ) | | | | | | | | | |
| Total income (loss) from investment operations | | | (2.89 | ) | | | | | | | | | |
| Less distributions to shareholders: | |
| From net investment income | | | (0.00 | )† | | | | | | | | | |
| Total distributions | | | (0.00 | ) | | | | | | | | | |
| Net asset value, end of period | | $ | 7.07 | | | | | | | | | | |
| Total Return^^ | | | (28.99 | )% ** | | | | | | | | | |
| Ratios / Supplemental Data: | |
| Net assets, end of period (000's) | | $ | 1,675 | | | | | | | | | | |
| Net expenses to average daily net assets | | | 1.25 | % * | | | | | | | | | |
| Net investment income (loss) to average daily net assets | | | 1.00 | % * | | | | | | | | | |
| Portfolio turnover rate | | | 10 | % | | | | | | | | | |
* Annualized.
** Percentage represents the results for the period and is not annualized.
*** Per share amount calculated on the average shares method.
† Amount is less than $0.005 per share.
+ For the period May 1, 2006 (commencement of operations) through December 31, 2006.
+++ For the period August 15, 2008 (commencement of operations) through December 31, 2008.
# Computed after giving effect to an agreement by MassMutual to waive certain fees and expenses of the Fund.
^^ Total return does not reflect expenses that apply at the separate account level or to related insurance products. Inclusion of these charges would reduce the total return figures for all periods shown.
The accompanying notes are an integral part of the financial statements.
159
MML Series Investment Fund – Financial Highlights (Continued)
(For a share outstanding throughout each period)
MML Conservative Allocation Fund
| | | Initial Class | |
| | | Year Ended
12/31/08 | | Period Ended
12/31/07++ | |
| Net asset value, beginning of period | | $ | 10.11 | | | $ | 10.00 | | |
| Income (loss) from investment operations: | |
| Net investment income (loss) | | | 0.28 | *** | | | 0.13 | *** | |
| Net realized and unrealized gain (loss) on investments | | | (2.24 | ) | | | 0.18 | | |
| Total income (loss) from investment operations | | | (1.96 | ) | | | 0.31 | | |
| Less distributions to shareholders: | |
| From net investment income | | | (0.00 | )† | | | (0.20 | ) | |
| From net realized gains | | | (0.00 | )† | | | - | | |
| Total distributions | | | (0.00 | )† | | | (0.20 | ) | |
| Net asset value, end of period | | $ | 8.15 | | | $ | 10.11 | | |
| Total Return^^ | | | (19.38 | )% | | | 3.09 | % ** | |
| Ratios / Supplemental Data: | |
| Net assets, end of period (000's) | | $ | 52,819 | | | $ | 155 | | |
| Ratio of expenses to average daily net assets: | |
| Before expense waiver | | | 0.27 | % | | | 61.88 | % * | |
| After expense waiver | | | 0.20 | % # | | | 0.20 | % *# | |
| Net investment income (loss) to average daily net assets | | | 3.06 | % | | | 3.81 | % * | |
| Portfolio turnover rate | | | 37 | % | | | 0 | % ** | |
| | | Service Class | | | |
| | | Period Ended
12/31/08+++ | |
| |
| Net asset value, beginning of period | | $ | 9.79 | | | | | | |
| Income (loss) from investment operations: | |
| Net investment income (loss) | | | 0.05 | *** | | | | | |
| Net realized and unrealized gain (loss) on investments | | | (1.70 | ) | | | | | |
| Total income (loss) from investment operations | | | (1.65 | ) | | | | | |
| Less distributions to shareholders: | |
| From net investment income | | | (0.00 | )† | | | | | |
| From net realized gains | | | (0.00 | )† | | | | | |
| Total distributions | | | (0.00 | )† | | | | | |
| Net asset value, end of period | | $ | 8.14 | | | | | | |
| Total Return^^ | | | (16.85 | )% ** | | | | | |
| Ratios / Supplemental Data: | |
| Net assets, end of period (000's) | | $ | 38,451 | | | | | | |
| Ratio of expenses to average daily net assets: | |
| Before expense waiver | | | 0.49 | % * | | | | | |
| After expense waiver | | | 0.45 | % *# | | | | | |
| Net investment income (loss) to average daily net assets | | | 1.62 | % * | | | | | |
| Portfolio turnover rate | | | 37 | % | | | | | |
* Annualized.
** Percentage represents the results for the period and is not annualized.
*** Per share amount calculated on the average shares method.
† Amount is less than $0.005 per share.
++ For the period August 31, 2007 (commencement of operations) through December 31, 2007.
+++ For the period August 15, 2008 (commencement of operations) through December 31, 2008.
# Computed after giving effect to an agreement by MassMutual to waive certain fees and expenses of the Fund.
^^ Total return does not reflect expenses that apply at the separate account level or to related insurance products. Inclusion of these charges would reduce the total return figures for all periods shown.
The accompanying notes are an integral part of the financial statements.
160
MML Series Investment Fund – Financial Highlights (Continued)
(For a share outstanding throughout each period)
MML Balanced Allocation Fund
| | | Initial Class | |
| | | Year Ended
12/31/08 | | Period Ended
12/31/07++ | |
| Net asset value, beginning of period | | $ | 10.08 | | | $ | 10.00 | | |
| Income (loss) from investment operations: | |
| Net investment income (loss) | | | 0.21 | *** | | | 0.11 | *** | |
| Net realized and unrealized gain (loss) on investments | | | (2.70 | ) | | | 0.19 | | |
| Total income (loss) from investment operations | | | (2.49 | ) | | | 0.30 | | |
| Less distributions to shareholders: | |
| From net investment income | | | - | | | | (0.22 | ) | |
| From net realized gains | | | (0.00 | )† | | | - | | |
| Total distributions | | | (0.00 | ) | | | (0.22 | ) | |
| Net asset value, end of period | | $ | 7.59 | | | $ | 10.08 | | |
| Total Return^^ | | | (24.70 | )% | | | 2.96 | % ** | |
| Ratios / Supplemental Data: | |
| Net assets, end of period (000's) | | $ | 88,583 | | | $ | 154 | | |
| Ratio of expenses to average daily net assets: | |
| Before expense waiver | | | 0.20 | % | | | 61.68 | % * | |
| After expense waiver | | | N/A ## | | | | 0.20 | % *# | |
| Net investment income (loss) to average daily net assets | | | 2.43 | % | | | 3.23 | % * | |
| Portfolio turnover rate | | | 21 | % | | | 0 | % ** | |
| | | Service Class | | | |
| | | Period Ended
12/31/08+++ | |
| |
| Net asset value, beginning of period | | $ | 9.60 | | | | | | |
| Income (loss) from investment operations: | |
| Net investment income (loss) | | | 0.02 | *** | | | | | |
| Net realized and unrealized gain (loss) on investments | | | (2.03 | ) | | | | | |
| Total income (loss) from investment operations | | | (2.01 | ) | | | | | |
| Less distributions to shareholders: | |
| From net realized gains | | | (0.00 | )† | | | | | |
| Total distributions | | | (0.00 | ) | | | | | |
| Net asset value, end of period | | $ | 7.59 | | | | | | |
| Total Return^^ | | | (20.94 | )% ** | | | | | |
| Ratios / Supplemental Data: | |
| Net assets, end of period (000's) | | $ | 49,286 | | | | | | |
| Ratio of expenses to average daily net assets: | |
| Before expense waiver | | | 0.47 | % * | | | | | |
| After expense waiver | | | 0.45 | % *# | | | | | |
| Net investment income (loss) to average daily net assets | | | 0.87 | % * | | | | | |
| Portfolio turnover rate | | | 21 | % | | | | | |
* Annualized.
** Percentage represents the results for the period and is not annualized.
*** Per share amount calculated on the average shares method.
† Amount is less than $0.005 per share.
++ For the period August 31, 2007 (commencement of operations) through December 31, 2007.
+++ For the period August 15, 2008 (commencement of operations) through December 31, 2008.
# Computed after giving effect to an agreement by MassMutual to waive certain fees and expenses of the Fund.
## Amount waived had no impact on the ratio of expenses to average daily net assets.
^^ Total return does not reflect expenses that apply at the separate account level or to related insurance products. Inclusion of these charges would reduce the total return figures for all periods shown.
The accompanying notes are an integral part of the financial statements.
161
MML Series Investment Fund – Financial Highlights (Continued)
(For a share outstanding throughout each period)
MML Moderate Allocation Fund
| | | Initial Class | |
| | | Year Ended
12/31/08 | | Period Ended
12/31/07++ | |
| Net asset value, beginning of period | | $ | 10.04 | | | $ | 10.00 | | |
| Income (loss) from investment operations: | |
| Net investment income (loss) | | | 0.18 | *** | | | 0.11 | *** | |
| Net realized and unrealized gain (loss) on investments | | | (2.96 | ) | | | 0.15 | | |
| Total income (loss) from investment operations | | | (2.78 | ) | | | 0.26 | | |
| Less distributions to shareholders: | |
| From net investment income | | | - | | | | (0.22 | ) | |
| From net realized gains | | | (0.00 | )† | | | - | | |
| Total distributions | | | (0.00 | )† | | | (0.22 | ) | |
| Net asset value, end of period | | $ | 7.26 | | | $ | 10.04 | | |
| Total Return^^ | | | (27.69 | )% | | | 2.63 | % ** | |
| Ratios / Supplemental Data: | |
| Net assets, end of period (000's) | | $ | 251,682 | | | $ | 154 | | |
| Ratio of expenses to average daily net assets: | |
| Before expense waiver | | | 0.14 | % | | | 61.59 | % * | |
| After expense waiver | | | N/A | | | | 0.20 | % *# | |
| Net investment income (loss) to average daily net assets | | | 2.09 | % | | | 3.05 | % * | |
| Portfolio turnover rate | | | 18 | % | | | 0 | % ** | |
| | | Service Class | | | |
| | | Period Ended
12/31/08+++ | |
| |
| Net asset value, beginning of period | | $ | 9.44 | | | | | | |
| Income (loss) from investment operations: | |
| Net investment income (loss) | | | 0.02 | *** | | | | | |
| Net realized and unrealized gain (loss) on investments | | | (2.20 | ) | | | | | |
| Total income (loss) from investment operations | | | (2.18 | ) | | | | | |
| Less distributions to shareholders: | |
| From net realized gains | | | (0.00 | )† | | | | | |
| Total distributions | | | (0.00 | )† | | | | | |
| Net asset value, end of period | | $ | 7.26 | | | | | | |
| Total Return^^ | | | (23.09 | )% ** | | | | | |
| Ratios / Supplemental Data: | |
| Net assets, end of period (000's) | | $ | 146,775 | | | | | | |
| Net expenses to average daily net assets | | | 0.39 | % * | | | | | |
| Net investment income (loss) to average daily net assets | | | 0.86 | % * | | | | | |
| Portfolio turnover rate | | | 18 | % | | | | | |
* Annualized.
** Percentage represents the results for the period and is not annualized.
*** Per share amount calculated on the average shares method.
† Amount is less than $0.005 per share.
++ For the period August 31, 2007 (commencement of operations) through December 31, 2007.
+++ For the period August 15, 2008 (commencement of operations) through December 31, 2008.
# Computed after giving effect to an agreement by MassMutual to waive certain fees and expenses of the Fund.
^^ Total return does not reflect expenses that apply at the separate account level or to related insurance products. Inclusion of these charges would reduce the total return figures for all periods shown.
The accompanying notes are an integral part of the financial statements.
162
MML Series Investment Fund – Financial Highlights (Continued)
(For a share outstanding throughout each period)
MML Growth Allocation Fund
| | | Initial Class | |
| | | Year Ended
12/31/08 | | Period Ended
12/31/07++ | |
| Net asset value, beginning of period | | $ | 10.02 | | | $ | 10.00 | | |
| Income (loss) from investment operations: | |
| Net investment income (loss) | | | 0.10 | *** | | | 0.08 | *** | |
| Net realized and unrealized gain (loss) on investments | | | (3.46 | ) | | | 0.17 | | |
| Total income (loss) from investment operations | | | (3.36 | ) | | | 0.25 | | |
| Less distributions to shareholders: | |
| From net investment income | | | - | | | | (0.23 | ) | |
| From net realized gains | | | (0.00 | )† | | | - | | |
| Total distributions | | | (0.00 | )† | | | (0.23 | ) | |
| Net asset value, end of period | | $ | 6.66 | | | $ | 10.02 | | |
| Total Return^^ | | | (33.53 | )% | | | 2.45 | % ** | |
| Ratios / Supplemental Data: | |
| Net assets, end of period (000's) | | $ | 354,595 | | | $ | 154 | | |
| Ratio of expenses to average daily net assets: | |
| Before expense waiver | | | 0.13 | % | | | 61.40 | % * | |
| After expense waiver | | | N/A | | | | 0.20 | % *# | |
| Net investment income (loss) to average daily net assets | | | 1.24 | % | | | 2.44 | % * | |
| Portfolio turnover rate | | | 14 | % | | | 0 | % ** | |
| | | Service Class | | | |
| | | Period Ended
12/31/08+++ | |
| |
| Net asset value, beginning of period | | $ | 9.20 | | | | | | |
| Income (loss) from investment operations: | |
| Net investment income (loss) | | | 0.01 | *** | | | | | |
| Net realized and unrealized gain (loss) on investments | | | (2.55 | ) | | | | | |
| Total income (loss) from investment operations | | | (2.54 | ) | | | | | |
| Less distributions to shareholders: | |
| From net realized gains | | | (0.00 | )† | | | | | |
| Total distributions | | | (0.00 | )† | | | | | |
| Net asset value, end of period | | $ | 6.66 | | | | | | |
| Total Return^^ | | | (27.61 | )% ** | | | | | |
| Ratios / Supplemental Data: | |
| Net assets, end of period (000's) | | $ | 184,401 | | | | | | |
| Net expenses to average daily net assets | | | 0.39 | % * | | | | | |
| Net investment income (loss) to average daily net assets | | | 0.24 | % * | | | | | |
| Portfolio turnover rate | | | 14 | % | | | | | |
* Annualized.
** Percentage represents the results for the period and is not annualized.
*** Per share amount calculated on the average shares method.
† Amount is less than $0.005 per share.
++ For the period August 31, 2007 (commencement of operations) through December 31, 2007.
+++ For the period August 15, 2008 (commencement of operations) through December 31, 2008.
# Computed after giving effect to an agreement by MassMutual to waive certain fees and expenses of the Fund.
^^ Total return does not reflect expenses that apply at the separate account level or to related insurance products. Inclusion of these charges would reduce the total return figures for all periods shown.
The accompanying notes are an integral part of the financial statements.
163
MML Series Investment Fund – Financial Highlights (Continued)
(For a share outstanding throughout each period)
MML Aggressive Allocation Fund
| | | Initial Class | |
| | | Year Ended
12/31/08 | | Period Ended
12/31/07++ | |
| Net asset value, beginning of period | | $ | 9.99 | | | $ | 10.00 | | |
| Income (loss) from investment operations: | |
| Net investment income (loss) | | | 0.04 | *** | | | 0.06 | *** | |
| Net realized and unrealized gain (loss) on investments | | | (3.88 | ) | | | 0.16 | | |
| Total income (loss) from investment operations | | | (3.84 | ) | | | 0.22 | | |
| Less distributions to shareholders: | |
| From net investment income | | | - | | | | (0.23 | ) | |
| From net realized gains | | | (0.00 | )† | | | - | | |
| Total distributions | | | (0.00 | )† | | | (0.23 | ) | |
| Net asset value, end of period | | $ | 6.15 | | | $ | 9.99 | | |
| Total Return^^ | | | (38.43 | )% | | | 2.15 | % ** | |
| Ratios / Supplemental Data: | |
| Net assets, end of period (000's) | | $ | 24,477 | | | $ | 153 | | |
| Ratio of expenses to average daily net assets: | |
| Before expense waiver | | | 0.40 | % | | | 61.22 | % * | |
| After expense waiver | | | 0.20 | % # | | | 0.20 | % *# | |
| Net investment income (loss) to average daily net assets | | | 0.46 | % | | | 1.85 | % * | |
| Portfolio turnover rate | | | 18 | % | | | 0 | % ** | |
| | | Service Class | | | |
| | | Period Ended
12/31/08+++ | |
| |
| Net asset value, beginning of period | | $ | 8.98 | | | | | | |
| Income (loss) from investment operations: | |
| Net investment income (loss) | | | (0.01 | )*** | | | | | |
| Net realized and unrealized gain (loss) on investments | | | (2.83 | ) | | | | | |
| Total income (loss) from investment operations | | | (2.84 | ) | | | | | |
| Less distributions to shareholders: | |
| From net realized gains | | | (0.00 | )† | | | | | |
| Total distributions | | | (0.00 | )† | | | | | |
| Net asset value, end of period | | $ | 6.14 | | | | | | |
| Total Return^^ | | | (31.62 | )% ** | | | | | |
| Ratios / Supplemental Data: | |
| Net assets, end of period (000's) | | $ | 3,953 | | | | | | |
| Ratio of expenses to average daily net assets: | |
| Before expense waiver | | | 0.63 | % * | | | | | |
| After expense waiver | | | 0.45 | % *# | | | | | |
| Net investment income (loss) to average daily net assets | | | (0.27 | )% * | | | | | |
| Portfolio turnover rate | | | 18 | % | | | | | |
* Annualized.
** Percentage represents the results for the period and is not annualized.
*** Per share amount calculated on the average shares method.
† Amount is less than $0.005 per share.
++ For the period August 31, 2007 (commencement of operations) through December 31, 2007.
+++ For the period August 15, 2008 (commencement of operations) through December 31, 2008.
# Computed after giving effect to an agreement by MassMutual to waive certain fees and expenses of the Fund.
^^ Total return does not reflect expenses that apply at the separate account level or to related insurance products. Inclusion of these charges would reduce the total return figures for all periods shown.
The accompanying notes are an integral part of the financial statements.
164
MML Series Investment Fund – Financial Highlights (Continued)
(For a share outstanding throughout each period)
MML American Funds Core Allocation Fund
| | | Service Class I | |
| | | Year Ended
12/31/08+ | |
| Net asset value, beginning of period | | $ | 10.00 | | |
| Income (loss) from investment operations: | |
| Net investment income (loss) | | | 0.72 | *** | |
| Net realized and unrealized gain (loss) on investments | | | (2.97 | ) | |
| Total income (loss) from investment operations | | | (2.25 | ) | |
| Net asset value, end of period | | $ | 7.75 | | |
| Total Return^^ | | | (22.50 | )% ** | |
| Ratios / Supplemental Data: | |
| Net assets, end of period (000's) | | $ | 67,874 | | |
| Ratio of expenses to average daily net assets: | | | | | |
| Before expense waiver | | | 1.85 | % * | |
| After expense waiver | | | 0.75 | % *# | |
| Net investment income (loss) to average daily net assets | | | 25.06 | % * | |
| Portfolio turnover rate | | | 1 | % ** | |
MML American Funds Growth Fund
| | | Service Class I | |
| | | Year Ended
12/31/08+ | |
| Net asset value, beginning of period | | $ | 10.00 | | |
| Income (loss) from investment operations: | |
| Net investment income (loss) | | | 0.22 | *** | |
| Net realized and unrealized gain (loss) on investments | | | (3.86 | ) | |
| Total income (loss) from investment operations | | | (3.64 | ) | |
| Net asset value, end of period | | $ | 6.36 | | |
| Total Return^^ | | | (36.40 | )% ** | |
| Ratios / Supplemental Data: | |
| Net assets, end of period (000's) | | $ | 6,080 | | |
| Ratio of expenses to average daily net assets: | | | | | |
| Before expense waiver | | | 13.92 | % * | |
| After expense waiver | | | 0.70 | % *# | |
| Net investment income (loss) to average daily net assets | | | 9.23 | % * | |
| Portfolio turnover rate | | | 5 | % ** | |
* Annualized.
** Percentage represents the results for the period and is not annualized.
*** Per share amount calculated on the average shares method.
+ For the period August 15, 2008 (Commencement of operations) through December 31, 2008.
# Computed after giving effect to an agreement by MassMutual to waive certain fees and expenses of the Fund.
^^ Total return does not reflect expenses that apply at the separate account level or to related insurance products. Inclusion of these charges would reduce the total return figures for all periods shown.
The accompanying notes are an integral part of the financial statements.
165
MML Series Investment Fund – Financial Highlights (Continued)
(For a share outstanding throughout each period)
MML American Funds International Fund
| | | Service Class I | |
| | | Year Ended
12/31/08+ | |
| Net asset value, beginning of period | | $ | 10.00 | | |
| Income (loss) from investment operations: | |
| Net investment income (loss) | | | 0.51 | *** | |
| Net realized and unrealized gain (loss) on investments | | | (3.59 | ) | |
| Total income (loss) from investment operations | | | 3.08 | | |
| Net asset value, end of period | | $ | 6.92 | | |
| Total Return^^ | | | (30.80 | )% ** | |
| Ratios / Supplemental Data: | |
| Net assets, end of period (000's) | | $ | 6,410 | | |
| Ratio of expenses to average daily net assets: | | | | | |
| Before expense waiver | | | 13.59 | % * | |
| After expense waiver | | | 0.70 | % *# | |
| Net investment income (loss) to average daily net assets | | | 19.94 | % * | |
| Portfolio turnover rate | | | 7 | % ** | |
* Annualized.
** Percentage represents the results for the period and is not annualized.
*** Per share amount calculated on the average shares method.
+ For the period August 15, 2008 (Commencement of operations) through December 31, 2008.
# Computed after giving effect to an agreement by MassMutual to waive certain fees and expenses of the Fund.
^^ Total return does not reflect expenses that apply at the separate account level or to related insurance products. Inclusion of these charges would reduce the total return figures for all periods shown.
The accompanying notes are an integral part of the financial statements.
166
Notes to Financial Statements
1. The Fund
MML Series Investment Fund (the "Trust") is registered under the Investment Company Act of 1940, as amended (the "1940 Act"), as a no-load, open-end, management investment company. The Trust is organized under the laws of the Commonwealth of Massachusetts as a Massachusetts business trust pursuant to an Agreement and Declaration of Trust dated May 14, 1993, as amended. The following are twenty-one series of the Trust (each individually referred to as a "Fund" or collectively as the "Funds"): MML Asset Allocation Fund ("Asset Allocation Fund"), MML Equity Income Fund ("Equity Income Fund"), MML Income & Growth Fund ("Income & Growth Fund"), MML Growth & Income Fund ("Growth & Income Fund"), MML Blue Chip Growth Fund ("Blue Chip Growt h Fund"), MML Large Cap Growth Fund ("Large Cap Growth Fund"), MML Concentrated Growth Fund ("Concentrated Growth Fund"), MML Mid Cap Value Fund ("Mid Cap Value Fund"), MML Mid Cap Growth Fund ("Mid Cap Growth Fund"), MML Small/Mid Cap Value Fund (formerly MML Small Cap Value Fund) ("Small/Mid Cap Value Fund"), MML Small Cap Index Fund ("Small Cap Index Fund"), MML Global Fund ("Global Fund"), MML Foreign Fund ("Foreign Fund"), MML Conservative Allocation Fund ("Conservative Allocation Fund"), MML Balanced Allocation Fund ("Balanced Allocation Fund"), MML Moderate Allocation Fund ("Moderate Allocation Fund"), MML Growth Allocation Fund ("Growth Allocation Fund"), MML Aggressive Allocation Fund ("Aggressive Allocation Fund"), MML American Funds Core Allocation Fund ("American Funds Core Allocation Fund"), MML American Funds Growth Fund ("American Funds Growth Fund") and MML American Funds International Fund ("American Funds International Fund").
The American Funds Core Allocation Fund, American Funds Growth Fund and American Funds International Fund commenced operations on August 15, 2008. The Conservative Allocation Fund, Balanced Allocation Fund, Moderate Allocation Fund, Growth Allocation Fund and Aggressive Allocation Fund commenced operations on August 31, 2007.
The Trust was established by Massachusetts Mutual Life Insurance Company ("MassMutual") for the purpose of providing vehicles for the investment of assets of various separate investment accounts established by MassMutual and by life insurance companies which are subsidiaries of MassMutual. Shares of the Trust are not offered to the general public. MassMutual, MML Bay State Life Insurance Company and C.M. Life Insurance Company are the record owners of all of the outstanding shares of the Funds.
The Conservative Allocation Fund, Balanced Allocation Fund, Moderate Allocation Fund, Growth Allocation Fund and Aggressive Allocation Fund invest all of their investable assets in shares of various funds advised by MassMutual or a control affiliate of MassMutual. The financial statements included herein are those of the Funds listed above and the applicable MML Series Investment Funds. The financial statements of the applicable MML Series Investment Funds II, or Oppenheimer Funds which are advised by OppenheimerFunds, Inc., a majority owned, indirect subsidiary of MassMutual, are presented separately and can be obtained from the SEC's EDGAR database on its Internet site at www.sec.gov or by calling MassMutual at 1-888-309-3539. The assets of each of the five listed above Allocation Funds are diversified and a shareholder's interest is limited to the MML Series Investment Funds, MML Series Investment Funds II or Oppenheimer Funds in which th e shares are invested. The American Funds Core Allocation Fund, American Funds Growth Fund and American Funds International Fund invest all of their investable assets in shares of various series of American Funds Insurance Series, which are managed by Capital Research and Management Company. The financial statements of the applicable American Funds Insurance Series are presented separately and can be obtained from the SEC's EDGAR database on its Internet site at www.sec.gov.
Each Fund, other than the Concentrated Growth Fund, Global Fund, American Funds Core Allocation Fund, American Funds Growth Fund and American Funds International Fund offers two classes of shares: Initial Class and Service Class shares. The Concentrated Growth Fund and Global Fund offer three classes of shares: Class I, Class II and Service Class I shares. The American Funds Core Allocation Fund, American Funds Growth Fund and American Funds International Fund offer one class of shares: Service Class I shares. Service Class shares and Service Class I shares commenced operations on August 15, 2008. Each share class invests in the same portfolio of assets. The principal
167
Notes to Financial Statements (Continued)
difference among the classes is the level of service and administration fees, and shareholder and distribution services borne by the classes. Because each class will have different fees and expenses, performance and share prices among the classes will vary. The classes of shares are offered to different types of investors, as outlined in the Funds' Prospectus.
2. Significant Accounting Policies
The following is a summary of significant accounting policies followed consistently by each Fund in the preparation of the financial statements in conformity with accounting principles generally accepted in the United States of America ("generally accepted accounting principles"). The preparation of the financial statements in accordance with generally accepted accounting principles requires management to make estimates and assumptions that affect the reported amounts and disclosures in the financial statements. Actual results could differ from those estimates.
Investment Valuation Equity securities are valued on the basis of valuations furnished by a pricing service, authorized by the Board of Trustees ("Trustees"), which provides the last reported sale price for securities listed on a national securities exchange or the official closing price on the NASDAQ National Market System, or in the case of over-the-counter securities not so listed, the last reported bid price. Debt securities (other than short-term obligations) are valued on the basis of valuations furnished by a pricing service, authorized by the Trustees, which determines valuations taking into account appropriate factors such as institutional-size trading in similar groups of securities, yield, quality, coupon rate, maturity, type of issue, trading characteristics and other market data. Short-term securities are valued at either amortized cost or at original cost plus accrued interest, whichever approximates current market value. Shares of other funds are valued at their net asset value as reported on each business day. Swaps are marked to market daily based upon values from third party vendors or market makers to the extent available or model prices. Valuations received from third party vendors are determined using various valuation systems and models based on the type of instrument. The underlying inputs and market data used in such models may include broker quotes, market indices and yield curves, counterparty information, foreign exchange rates and other market data. All other securities and other assets, including futures, options, swaps and debt securities for which the prices supplied by a pricing agent, or as noted above, are deemed by the Trustees not to be representative of market values, including restricted securities and securities for which no market quotation is available, are valued at fair value in accordance with procedures approved by the Trustees.
Securities are typically valued on the basis of their readily available market quotations furnished by pricing services authorized by the Trustees. However, in certain cases, market quotations for a specific portfolio security are readily available, but the authorized pricing service may not provide a price for that security, or the price provided by such authorized pricing service is deemed unreliable by the investment adviser or sub-adviser. In such cases, market quotations provided by an established market maker for that security (i.e. broker quotes) may be used to value the security if the investment adviser has reason to believe such quotations are reasonably likely to be reliable.
In addition, valuation methods approved by the Trustees which are intended to reflect fair value may be used when pricing service information is not readily available, or is not deemed reliable by the investment adviser, or when a security's value is believed to have been materially affected by a significant event, such as a natural disaster, an economic event like a bankruptcy filing, or a substantial fluctuation in domestic or foreign markets, that has occurred after the close of the exchange or market on which the security is principally traded (for example, a foreign exchange or market). In such a case, a Fund's value for a security is likely to be different from the last quoted market price or pricing service information. In addition, a fair value pricing service is used to assist in the pricing of foreign securities held by the Trust. Due to the subjective and variable nature of fair value pricing, it is possible that the value determi ned for a particular asset may be materially different from the value realized upon such asset's sale.
Portfolio securities traded on more than one national securities exchange are valued at the last price on the business day as of which such value is being determined at the close of the exchange representing the principal market for such securities. All assets and liabilities expressed in foreign currencies are converted into U.S. dollars at the mean between the buying and selling rates of such currencies against U.S. dollars last quoted by any major bank. If such quotations are not available, the rate of exchange is determined in accordance with policies established by the Trustees.
168
Notes to Financial Statements (Continued)
The Funds adopted Financial Accounting Standards Board ("FASB") Statement of Financial Accounting Standards No. 157, "Fair Value Measurements" ("FAS 157"), effective January 1, 2008. In accordance with FAS 157, fair value is defined as the price that would be received to sell an asset or paid to transfer a liability in an orderly transaction between market participants at the measurement date. FAS 157 established a three-tier hierarchy to maximize the use of observable market data inputs and minimize the use of unobservable inputs and to establish classification of fair value measurements for disclosure purposes. Inputs refer broadly to the assumptions that market participants would use in pricing the asset or liability, including assumptions about risk, for example, the risk inherent in a particular valuation technique used to measure fair value (such as a pricing model) and/or the risk inherent in the inputs to the valuation technique. Inp uts may be observable or unobservable. Observable inputs are inputs that reflect the assumptions market participants would use in pricing the asset or liability and are developed based on market data obtained from sources independent of the reporting entity. Unobservable inputs are inputs that reflect the reporting entity's own assumptions about the assumptions market participants would use in pricing the asset or liability and are developed based on the best information available in the circumstances. The three-tier hierarchy of inputs is summarized in the three broad Levels listed below.
Level 1 – quoted prices (unadjusted) in active markets for identical investments
Level 2 – other significant observable inputs (including quoted prices for similar investments, interest rates, prepayment speeds, credit risk, etc.)
Level 3 – significant unobservable inputs (including the Fund's own assumptions in determining the fair value of investments)
Changes in valuation techniques may result in transfers in or out of an investment's assigned level within the hierarchy. The inputs or methodology used for valuing investments are not necessarily an indication of the risk associated with investing in those investments.
The availability of observable inputs can vary from security to security and is affected by a wide variety of factors, including, for example, the type of security, whether the security is new and not yet established in the marketplace, the liquidity of markets and other characteristics particular to the security. To the extent that valuation is based on models or inputs that are less observable or unobservable in the market, the determination of fair value requires more judgment. Accordingly, the degree of judgment exercised in determining fair value is greatest for instruments categorized in Level 3.
In periods of market dislocation, such as those experienced in fiscal 2008, the observability of prices and inputs may be reduced for many instruments. This condition could cause a security to be reclassified from Level 1 to Level 2 or from Level 2 to Level 3.
In certain cases, the inputs used to measure fair value may fall into different levels of the fair value hierarchy. In such cases, for disclosure purposes the level in the fair value hierarchy within which the fair value measurement falls in its entirety is determined based on the lowest level input that is significant to the fair value measurement in its entirety.
Fair Value Measurements
A description of the valuation techniques applied to the Funds' major categories of assets and liabilities measured at fair value on a recurring basis follows.
Exchange traded equity securities, common and preferred stock. Securities are generally valued based on quoted prices from the exchange. To the extent these securities are actively traded, valuation adjustments are not applied and they are categorized in Level 1 of the fair value hierarchy. Restricted securities issued by publicly held companies are valued at a discount to the similar publicly traded securities and would be categorized as Level 2 of the fair value hierarchy. Restricted securities held in non-public entities are included in Level 3 of the fair value hierarchy because they trade infrequently, and, therefore, the fair value is unobservable. Certain foreign securities may be fair valued using a pricing service that considers the correlation of the trading patterns of the foreign security to the intraday trading in the U.S. markets for investments such as ADRs, financial futures, ETFs, and the
169
Notes to Financial Statements (Continued)
movement of certain indexes of securities based on a statistical analysis of the historical relationship and are categorized in Level 2 of the fair value hierarchy.
Corporate bonds. The fair value of corporate bonds is estimated using recently executed transactions, market price quotations (where observable), bond spreads or credit default swap spreads adjusted for any basis difference between cash and derivative instruments. Corporate bonds are generally categorized in Level 2 of the fair value hierarchy; in instances where prices, spreads or any of the other aforementioned key inputs are unobservable, they are categorized in Level 3 of the hierarchy.
Asset backed securities. The fair value of asset backed securities are estimated based on models that consider the estimated cash flows of each tranche of the entity, establish a benchmark yield , and develop an estimated tranche specific spread to the benchmark yield based on the unique attributes of the tranche. To the extent the inputs are observable and timely, the values would be categorized in Level 2 of the fair value hierarchy, otherwise they would be categorized as Level 3.
U.S. Government securities. U.S. government securities are normally valued using a model that incorporates market observable data such as reported sales of similar securities, broker quotes, yields, bids, offers and reference data. Accordingly, U.S. government securities are normally categorized in Level 2 of the fair value hierarchy.
U.S. agency securities. U.S. agency securities are comprised of two main categories consisting of agency issued debt and mortgage pass-throughs. Agency issued debt securities are generally valued using quoted market prices. Mortgage pass-throughs include To Be Announced ("TBA") securities and mortgage pass-through certificates. TBA securities are generally valued using quoted market prices.
Derivative contracts. Listed derivatives that are actively traded are valued based on quoted prices from the exchange and are categorized in Level 1 of the fair value hierarchy. Over-the-counter ("OTC") derivative contracts include forward, swap, and option contracts related to interest rates, foreign currencies, credit standing of reference entities, equity prices or commodity prices. Depending on the product and the terms of the transaction, the fair value of the OTC derivative products can be modeled using a series of techniques, including simulation models. Many pricing models do not entail material subjectivity because the methodologies employed do not necessitate significant judgments and the pricing inputs are observed from actively quoted markets, as is the case of interest rate swap and option contracts. A substantial majority of OTC derivative products v alued by the Funds using pricing models fall into this category and are categorized within the Level 2 of the fair value hierarchy.
The following is the aggregate value by input level as of December 31, 2008 for the Funds' investments:
Asset Valuation Inputs
| | | Investments in Securities | |
| | | Level 1 -
Quoted Prices | | Level 2 - Other
Significant
Observable
Inputs | | Level 3 -
Significant
Unobservable
Inputs | | Total | |
| Asset Allocation Fund | | $ | 88,795,224 | | | $ | 51,017,500 | | | $ | 2,235,093 | | | $ | 142,047,817 | | |
| Equity Income Fund | | | 338,333,506 | | | | 21,363,711 | | | | - | | | | 359,697,217 | | |
| Income & Growth Fund | | | 76,647,161 | | | | 164,660 | | | | - | | | | 76,811,821 | | |
| Growth & Income Fund | | | 130,733,977 | | | | 3,528,129 | | | | - | | | | 134,262,106 | | |
| Blue Chip Growth Fund | | | 163,874,348 | | | | 8,290,673 | | | | - | | | | 172,165,021 | | |
| Large Cap Growth Fund | | | 36,058,749 | | | | 545,483 | | | | - | | | | 36,604,232 | | |
| Concentrated Growth Fund | | | 78,556,944 | | | | 2,093,089 | | | | - | | | | 80,650,033 | | |
| Mid Cap Value Fund | | | 287,493,373 | | | | 3,415,880 | | | | - | | | | 290,909,253 | | |
| Mid Cap Growth Fund | | | 177,524,609 | | | | 9,879,762 | | | | - | | | | 187,404,371 | | |
| Small/Mid Cap Value Fund | | | 133,869,215 | | | | 2,451,634 | | | | - | | | | 136,320,849 | | |
| Small Cap Index Fund | | | 34,444,290 | | | | 814,585 | | | | - | | | | 35,258,875 | | |
| Global Fund | | | 13,387,563 | | | | 10,879,751 | | | | - | | | | 24,267,314 | | |
| Foreign Fund | | | 38,520,403 | | | | 171,827,139 | | | | - | | | | 210,347,542 | | |
170
Notes to Financial Statements (Continued)
| | | Investments in Securities | |
| | | Level 1 -
Quoted Prices | | Level 2 - Other
Significant
Observable
Inputs | | Level 3 -
Significant
Unobservable
Inputs | | Total | |
| Conservative Allocation Fund | | $ | 91,313,879 | | | $ | - | | | $ | - | | | $ | 91,313,879 | | |
| Balanced Allocation Fund | | | 137,929,612 | | | | - | | | | - | | | | 137,929,612 | | |
| Moderate Allocation Fund | | | 398,577,454 | | | | - | | | | - | | | | 398,577,454 | | |
| Growth Allocation Fund | | | 539,136,408 | | | | - | | | | - | | | | 539,136,408 | | |
| Aggressive Allocation Fund | | | 28,455,254 | | | | - | | | | - | | | | 28,455,254 | | |
American Funds
Core Allocation Fund | | | 67,887,883 | | | | - | | | | - | | | | 67,887,883 | | |
| American Funds Growth Fund | | | 6,049,081 | | | | - | | | | - | | | | 6,049,081 | | |
| American Funds International Fund | | | 6,379,032 | | | | - | | | | - | | | | 6,379,032 | | |
| | | Other Financial Instruments* | |
| | | Level 1 -
Quoted Prices | | Level 2 - Other
Significant
Observable
Inputs | | Level 3 -
Significant
Unobservable
Inputs | | Total | |
| Asset Allocation Fund | | $ | - | | | $ | (314 | ) | | $ | - | | | $ | (314 | ) | |
| Mid Cap Value Fund | | | - | | | | (61,909 | ) | | | - | | | | (61,909 | ) | |
| Small Cap Index Fund | | | 33,503 | | | | - | | | | - | | | | 33,503 | | |
* Other financial instruments include future and forwards.
Following is a reconciliation of investments for which significant unobservable inputs (Level 3) were used in determining value:
| | Investments in Securities | |
| | | Balance
as of
12/31/07 | | Accrued
discounts/
premiums | | Realized
gain/loss and
change in
unrealized
appreciation
(depreciation) | | Net
purchases/
sales | | Net
transfers
in and/or
out of
Level 3 | | Balance
as of
12/31/08 | | Net change in
unrealized
appreciation
(depreciation)
from
investments
still held as
of 12/31/08 | |
Asset
Allocation
Fund | | $ | 10,287,254 | | | $ | (25 | ) | | $ | (1,607,619 | ) | | $ | (4,179,449 | ) | | $ | (2,265,068 | ) | | $ | 2,235,093 | | | $ | (680,212 | ) | |
Mid Cap
Growth
Fund | | | 108,690 | | | | - | | | | (11,000 | ) | | | (97,690 | ) | | | - | | | | - | | | | (11,000 | ) | |
Securities Lending Each Fund may lend its securities to qualified brokers; however, securities lending cannot exceed 33% of the total assets of the Fund taken at current value. The loans are collateralized at all times with cash or securities with a market value at least equal to 100% of the market value of the securities on loan. The market value of the loaned securities is determined at the close of business of a Fund and any additional collateral is delivered to the Fund the next business day. As with other extensions of credit, the Funds may bear the risk of delay in recovery or even loss of rights in the collateral should the borrower of the securities fail financially. The Funds receive compensation for lending their securities.
The Funds had no securities on loan at December 31, 2008.
171
Notes to Financial Statements (Continued)
The Funds receive, as fees, a share of the income earned on investment of the cash collateral received for the loan of securities. For the year ended December 31, 2008, the Funds earned securities lending net income as follows:
| | | Securities
Lending
Gross Income | | Securities
Lending
Fees and
Expenses | | Securities
Lending
Net Income | |
| Asset Allocation Fund | | $ | 138,544 | | | $ | 105,778 | | | $ | 32,766 | | |
| Equity Income Fund | | | 246,397 | | | | 191,376 | | | | 55,021 | | |
| Income & Growth Fund | | | 103,909 | | | | 88,478 | | | | 15,431 | | |
| Growth & Income Fund | | | 174,543 | | | | 132,816 | | | | 41,727 | | |
| Blue Chip Growth Fund | | | 21,903 | | | | 19,578 | | | | 2,325 | | |
| Large Cap Growth Fund | | | 34,254 | | | | 30,237 | | | | 4,017 | | |
| Concentrated Growth Fund | | | 38,075 | | | | 34,095 | | | | 3,980 | | |
| Mid Cap Value Fund | | | 525,631 | | | | 433,517 | | | | 92,114 | | |
| Mid Cap Growth Fund | | | 477,267 | | | | 378,432 | | | | 98,835 | | |
| Small/Mid Cap Value Fund | | | 477,265 | | | | 374,618 | | | | 102,647 | | |
| Small Cap Index Fund | | | 106,415 | | | | 72,840 | | | | 33,575 | | |
| Global Fund | | | 21,658 | | | | 15,426 | | | | 6,232 | | |
| Foreign Fund | | | 153,028 | | | | 113,411 | | | | 39,617 | | |
| | | $ | 2,518,889 | | | $ | 1,990,602 | | | $ | 528,287 | | |
Repurchase Agreements Each Fund may enter into repurchase agreements with certain banks and broker/dealers whereby a Fund acquires a security for cash and obtains a simultaneous commitment from the seller to repurchase the security at an agreed upon price and date. The Funds, through their custodian, take possession of the securities collateralizing the repurchase agreement. The collateral is marked to market daily to ensure that the market value of the underlying assets remains sufficient to protect the Funds in the event of default by the seller. Collateral for certain tri-party repurchase agreements is held at the counterparty's custodian in a segregated account for the benefit of the Funds and the counterparty. In connection with transactions in repurchase agreements, if the seller defaults and the value of the collateral declines or if the seller e nters insolvency proceedings, realization of collateral by the Funds may be delayed or limited.
The Fund(s) had repurchase agreements as shown in the Portfolios of Investments at December 31, 2008.
Accounting for Investment Transactions Investment transactions are accounted for on the trade date. Realized gains and losses on sales of investments (which may include proceeds received from litigation) and unrealized appreciation and depreciation of investments are computed by the specific identification cost method. Interest income, adjusted for amortization of discounts and premiums on debt securities, is earned from the settlement date and is recorded on the accrual basis. Dividend income is recorded on the ex-dividend date. Withholding taxes on foreign interest, dividends, and capital gains have been provided for in accordance with the applicable country's tax rules and rates. Foreign dividend income is recorded on the ex-dividend date or as soon as practicable after the Fund determines the existence of a dividend declaration after exercising reas onable due diligence. Distributions received on securities that represent a return of capital or capital gain are recorded as a reduction of cost of investments and/or as a realized gain.
Federal Income Tax It is each Fund's intent to continue to comply with the provisions of subchapter M of the Internal Revenue Code of 1986, as amended (the "Code"), applicable to a regulated investment company. Under such provisions, the Funds will not be subject to federal income taxes on their ordinary income and net realized capital gains to the extent they are distributed or deemed to have been distributed to their shareholders. Therefore, no federal income tax provision is required.
172
Notes to Financial Statements (Continued)
Dividends and Distributions to Shareholders Dividends from net investment income and distributions of any net realized capital gains of each Fund are declared and paid annually and at other times as may be required to satisfy tax or regulatory requirements. Distributions to shareholders are recorded on the ex-dividend date. Income and capital gain distributions are determined in accordance with income tax regulations, which may differ from generally accepted accounting principles. As a result, net investment income and net realized gain on investment transactions for a reporting period may differ significantly from distributions during such period.
Foreign Currency Translation The books and records of the Funds are maintained in U.S. dollars. The market values of foreign currencies, foreign securities and other assets and liabilities denominated in foreign currencies are translated into U.S. dollars at the mean of the buying and selling rates of such currencies against the U.S. dollar at the end of each business day. Purchases and sales of foreign securities and income and expense items are translated at the rates of exchange prevailing on the respective dates of such transactions. The Funds do not isolate that portion of the results of operations arising from changes in the exchange rates from that portion arising from changes in the market prices of securities. Net realized foreign currency gains and losses resulting from changes in exchange rates include foreign currency gains and losses betwee n trade date and settlement date on investment securities transactions, foreign currency transactions and the difference between the amounts of dividends recorded on the books of the Funds and the amount actually received.
Forward Foreign Currency Contracts Each Fund may enter into forward foreign currency contracts in order to hedge the effect of currency movements of foreign denominated securities or obligations. A forward foreign currency contract is an agreement between two parties to buy and sell a currency at a set price on a future date. The market value of a forward foreign currency contract fluctuates with changes in foreign currency exchange and interest rates. Forward foreign currency contracts are marked to market daily and the change in their value is recorded by the Funds as an unrealized gain or loss. When a forward foreign currency contract is extinguished, through delivery or offset by entering into another forward foreign currency contract, the Funds record a reali zed gain or loss equal to the difference between the value of the contract at the time it was opened and the value of the contract at the time it was extinguished or offset. Forward foreign currency contracts involve a risk of loss from the potential inability of counterparties to meet the terms of their contracts and from unanticipated movements in foreign currency values and interest rates. The notional or contractual amounts of these instruments represent the investments the Funds have in particular classes of financial instruments and do not necessarily represent the amounts potentially subject to risk. The measurement of the risk associated with these instruments is meaningful only when all related and offsetting transactions and counterparty risk are considered.
The Fund(s) listed in the following table had open forward foreign currency contracts at December 31, 2008:
Settlement
Date | | Contracts to
Deliver/Receive | | Units of
Currency | | In Exchange
for U.S.
Dollars | | Contracts at
Value | | Unrealized
Appreciation
(Depreciation) | |
| Asset Allocation Fund | |
| BUYS | |
| 1/16/09 | | Japanese Yen | | | 3,939,075 | | | $ | 45,000 | | | $ | 43,464 | | | $ | (1,536 | ) | |
| 1/16/09 | | Japanese Yen | | | 2,716,100 | | | | 30,918 | | | | 29,969 | | | | (949 | ) | |
| | | $ | (2,485 | ) | |
| SELLS | |
| 1/16/09 | | British Pound | | | 20,000 | | | | 30,918 | | | | 28,747 | | | $ | 2,171 | | |
173
Notes to Financial Statements (Continued)
Settlement
Date | | Contracts to
Deliver/Receive | | Units of
Currency | | In Exchange
for U.S.
Dollars | | Contracts at
Value | | Unrealized
Appreciation
(Depreciation) | |
| Mid Cap Value Fund | |
| BUYS | |
| 1/30/09 | | Canadian Dollar | | | 11,996 | | | | 9,556 | | | | 9,713 | | | $ | 157 | | |
| 1/30/09 | | Euro | | | 57,825 | | | | 79,184 | | | | 80,290 | | | | 1,106 | | |
| | | $ | 1,263 | | |
| SELLS | |
| 1/30/09 | | Canadian Dollar | | | 7,131,066 | | | | 5,770,053 | | | | 5,773,778 | | | $ | (3,725 | ) | |
| 1/30/09 | | Euro | | | 657,119 | | | | 852,952 | | | | 912,399 | | | | (59,447 | ) | |
| | | $ | (63,172 | ) | |
Financial Futures Contracts A Fund may enter into futures contracts, including commodity futures contracts, stock index futures contracts, foreign currency futures contracts and fixed income futures contracts. These transactions are hedging strategies. They are designed to protect a Fund's current or intended investments from the effects of changes in exchange rates or market declines. They may also be used for other purposes, such as an efficient means of adjusting a Fund's exposure to certain markets; in an effort to enhance income; and as a cash management tool. Futures contracts are contracts for delayed delivery of securities or commodities at a specific future date and at a specific price or yield. Upon entering into a contract, the Funds deposit and maintain as collateral such initial margin as required by the exchange on which the transaction is effected. Pursuant to the contract, the Fund agrees to receive from or pay to the broker an amount of cash equal to the daily fluctuation in value of the contract. Such receipts or payments are known as variation margin and are recorded by the Funds as unrealized gains or losses. When the contract is closed, each Fund records a realized gain or loss equal to the difference between the value of the contract at the time it was opened and the value at the time it was closed. Futures contracts are valued at the settlement price established each day by the board of trade or exchange on which they are traded. A Fund will incur brokerage fees when it purchases and sells futures contracts. Futures contracts entail risk of loss in portfolio value if the sub-adviser is incorrect in anticipating the direction of exchange rates or the securities markets.
A Fund may also purchase and write options on these futures contracts. This strategy also is intended to protect against declines in the values of portfolio securities or against increases in the costs of securities to be acquired. Like other options, options on futures contracts constitute only a partial hedge up to the amount of the premium, and due to transaction costs.
While these strategies will generally be used by a Fund for hedging purposes, there are risks. For example, the sub-adviser may incorrectly forecast the direction of exchange rates or of the underlying securities index or markets. When these transactions are unsuccessful, the Fund may experience losses. When a Fund enters into these transactions to increase portfolio value (i.e., other than for hedging purposes), there is a liquidity risk that no market will arise for resale and the Fund could also experience losses.
The Fund(s) listed in the following table had open futures contracts at December 31, 2008:
Number of
Contracts | | Type | | Expiration Date | | Notional
Contract
Value | | Net Unrealized
Appreciation
(Depreciation) | |
| Small Cap Index Fund | |
BUYS
14 | | Russell E Mini 2000 Index | | | 3/20/09 | | | $ | 697,052 | | | $ | 33,503 | | |
174
Notes to Financial Statements (Continued)
Delayed Delivery Transactions, When-Issued Securities, and Forward Commitments Each Fund may purchase or sell securities on a "when-issued" or delayed delivery or on a forward commitment basis. Payment and delivery may take place after the customary settlement period for that security. The price of the underlying securities and the date when the securities will be delivered and paid for are fixed at the time the transaction is negotiated. These securities are valued on the basis of valuations furnished by a pricing service, authorized by the Trustees, which determines valuations taking into account appropriate factors such as institutional-size trading in similar groups of securities, yield, quality, coupon rate, maturity, type of issue, trading characteristics and other market data. Securities for which no market quotation is available are valued at fa ir value in accordance with procedures approved by the Trustees. The Funds record on a daily basis the unrealized appreciation (depreciation) based upon changes in the value of these securities. When a forward commitment contract is closed, the Funds record a realized gain or loss equal to the difference between the value of the contract at the time it was opened and the value of the contract at the time it was closed. Losses may arise due to changes in the value of the underlying securities or if the counterparty does not perform under the contract, or if the issuer does not issue the securities due to political, economic, or other factors. The Funds monitor exposure to ensure counterparties are creditworthy and concentration of exposure is minimized.
The Fund(s) had securities purchased on a forward commitment basis as shown in the Portfolios of Investments at December 31, 2008.
Dollar Roll Transactions The Funds may engage in dollar roll transactions. A dollar roll transaction involves a sale by a Fund of a GNMA certificate or other mortgage backed security to a financial institution, such as a bank or broker-dealer, concurrent with an agreement by the Fund to repurchase a similar security from the institution at a later date at an agreed upon price. The securities that are repurchased will bear the same interest rate as those sold, but generally will be collateralized by different pools of mortgages with different prepayment histories than those sold. During the period between the sale and repurchase, a Fund will not be entitled to receive the interest and principal payments on the securities sold. Proceeds of the sale will be invested in additional instruments for the Fund. A Fund is compensated for agreeing to repurchase th e security by the difference between the current sales price and the price for the future purchase (often referred to as the "drop") as well as by the interest earned on the cash proceeds of the initial sale. Dollar rolls may be renewed over a period of several months with a different repurchaser or repurchase price and a cash settlement made at each renewal without physical delivery of securities. Moreover, a Fund may enter into a dollar roll transaction involving a security not then in the Fund's portfolio. The Funds account for dollar roll transactions as purchases and sales. If certain criteria are met, these dollar roll transactions may be considered a financing transaction whereby the difference in the sales price and the future purchase price is recorded as an adjustment to interest income.
A Fund will segregate cash or other liquid securities in an amount sufficient to meet its obligations under dollar roll transactions or otherwise cover its obligations as permitted by applicable law. Dollar roll transactions involve potential risks of loss which are different from those related to the securities underlying the transaction. For example, if the counterparty were to become insolvent, the Fund's right to purchase from the counterparty may be restricted. Additionally, the market value of the securities sold by the Fund may decline below the repurchase price of those securities to be purchased.
Allocation of Operating Activity In maintaining the records for the Funds, the income and expense accounts are allocated to each class of shares. Investment income, unrealized and realized gains or losses are prorated among the classes of shares based on the relative net assets of each. Expenses are allocated to each class of shares depending on the nature of the expenditures. Administration and service fees, if any, which are directly attributable to a class of shares, are charged to that class's operations. Expenses of the Fund not directly attributable to the operations of any class of shares or Fund are prorated among the Funds and classes to which the expense relates based on the relative net assets of each.
In addition, the Conservative Allocation Fund, Balanced Allocation Fund, Moderate Allocation Fund, Growth Allocation Fund, Aggressive Allocation Fund, American Funds Core Allocation Fund, American Funds Growth Fund and American Funds International Fund will also incur certain fees and
175
Notes to Financial Statements (Continued)
expenses indirectly as a shareholder in the underlying funds. Because the underlying funds have varied expense and fee levels and each Fund, except American Funds Growth Fund and American Funds International Fund, may own different proportions of underlying funds at different times, the amount of fees and expenses indirectly incurred by each Fund will vary.
Foreign Securities The Global Fund invests a significant amount of its assets and the Foreign Fund invests substantially all of its assets in foreign securities. The other Funds may also invest in foreign securities, subject to certain percentage restrictions. Investing in securities of foreign companies and foreign governments involves special risks and considerations not typically associated with investing in securities of U.S. companies and the U.S. Government. These risks include revaluation of currencies and future adverse political and economic developments. Moreover, securities of many foreign companies and foreign governments and their markets may be less liquid and their prices more volatile than those of securities of comparable U.S. companies and the U.S. Government.
Restricted Securities Certain securities are illiquid and restricted as to resale. They have been valued in good faith under procedures established by the Trustees, taking into consideration such factors as the Trustees deem appropriate. The Funds generally bear the costs, if any, associated with the disposition of restricted securities. Aggregate cost and fair value of these securities held at December 31, 2008 were as follows:
| | | Aggregate Cost | | Aggregate Value | | Value as
Percentage of
Fund's Net Assets | |
| Asset Allocation Fund | | $ | 3,036,441 | | | $ | 2,235,093 | | | | 1.6 | % | |
3. Management Fees and Other Transactions
Investment Management Fees Under agreements between the Trust and MassMutual on behalf of each Fund, MassMutual is responsible for providing investment management services for each Fund. In return for this service, MassMutual receives advisory fees quarterly, based upon each Fund's average daily net assets, at the following annual rates:
| Asset Allocation Fund | | | 0.55 | % | | Global Fund | | | 0.60 | % | |
|
| Equity Income Fund | | | 0.75 | % | | Foreign Fund | | | 0.89 | % | |
|
| Income & Growth Fund | | | 0.65 | % | | Conservative Allocation Fund | | | 0.10 | % | |
|
| Growth & Income Fund | | | 0.50 | % | | Balanced Allocation Fund | | | 0.10 | % | |
|
| Blue Chip Growth Fund | | | 0.75 | % | | Moderate Allocation Fund | | | 0.10 | % | |
|
| Large Cap Growth Fund | | | 0.65 | % | | Growth Allocation Fund | | | 0.10 | % | |
|
| Concentrated Growth Fund | | | 0.60 | % | | Aggressive Allocation Fund | | | 0.10 | % | |
|
| Mid Cap Value Fund | | | 0.84 | % | | American Funds Core Allocation Fund | | | 0.20 | % | |
|
| Mid Cap Growth Fund | | | 0.77 | % | | American Funds Growth Fund | | | 0.15 | % | |
|
| Small/Mid Cap Value Fund | | | 0.75 | % | | American Funds International Fund | | | 0.15 | % | |
|
| Small Cap Index Fund | | | 0.35 | % | | | | | | | |
|
MassMutual has entered into investment sub-advisory agreements with the following unaffiliated investment sub-advisers: Capital Guardian Trust Company for the Asset Allocation Fund and Growth & Income Fund, T. Rowe Price Associates, Inc. for the Equity Income Fund, Blue Chip Growth Fund and Mid Cap Growth Fund, American Century Investment Management, Inc. for the Income & Growth Fund and Mid Cap Value Fund, AllianceBernstein L.P. for the Large Cap Growth Fund and Small/Mid Cap Value Fund, Legg Mason Capital Management, Inc. for the Concentrated Growth Fund, Northern Trust Investments, N.A. for the Small Cap Index Fund, Neuberger Berman Management, Inc. for the Global Fund, and Templeton Investment Counsel, LLC for the Foreign Fund. Prior to May 1, 2008,
176
Notes to Financial Statements (Continued)
Goldman Sachs Asset Management L.P. served as a co-sub-adviser to the Small/Mid Cap Value Fund. MassMutual pays a sub-advisory fee to each of these sub-advisers based upon the aggregate net assets under management which include (1) the average daily net assets of the specified Fund which it manages, and (2) the average daily net assets of all other funds or accounts of MassMutual or its affiliates for which the sub-adviser provides sub-advisory services and which have substantially the same investment objectives, policies and investment strategies.
The Funds' sub-advisory fees are paid out of the management fees previously disclosed above.
Administration Fees For the Concentrated Growth Fund and Global Fund, under a separate administrative and shareholder services agreement between the Funds and MassMutual, MassMutual provides certain administrative and shareholder services and bears some of the class specific administrative expenses. In return for these services, MassMutual receives an administrative services fee monthly based upon the average daily net assets of the applicable class of shares of the Funds, at the following annual rates:
| | | Class I | | Class II | | Service Class I | |
| Concentrated Growth Fund | | | 0.24 | % | | | 0.14 | % | | | 0.24 | % | |
| Global Fund | | | 0.28 | % | | | 0.18 | % | | | 0.28 | % | |
| American Funds Core Allocation Fund | | N/A | | N/A | | | 0.25 | % | |
| American Funds Growth Fund | | N/A | | N/A | | | 0.25 | % | |
| American Funds International Fund | | N/A | | N/A | | | 0.25 | % | |
Distribution and Service Fees MML Distributors, LLC (the "Distributor") acts as distributor to the Funds. Pursuant to a 12b-1 Plan adopted by the Funds, Service Class shares and Service Class I shares of the Funds pay an annual fee of 0.25% of the average daily net asset value of Service Class shares and Service Class I shares. This fee, or a portion thereof, is paid to: (i) the Distributor for services provided and expenses incurred by its connection with the distribution of Service Class shares and Service Class I shares of each Fund; and (ii) MassMutual for services provided and expenses incurred by it for purposes of maintaining or providing personal services to Service Class and Service Class I shareholders.
Expense Caps and Waivers MassMutual agreed to cap the fees and expenses of the Funds (other than extraordinary litigation and legal expenses, or other non-recurring or unusual expenses), based upon each Fund's average daily net assets, as follows:
| Asset Allocation Fund | | | | | | Global Fund | | | | | |
|
| Initial Class* | | | 0.57 | % | | Class I**# | | | 0.90 | % | |
|
| Equity Income Fund | | | | | | Class II*** # | | | 0.80 | % | |
|
| Initial Class* | | | 0.85 | % | | Service Class I## | | | 1.15 | % | |
|
| Income & Growth Fund | | | | | | Foreign Fund | | | | | |
|
| Initial Class* | | | 0.70 | % | | Initial Class* | | | 1.02 | % | |
|
| Growth & Income Fund | | | | | | Conservative Allocation Fund^^ | | | | | |
|
| Initial Class* | | | 0.52 | % | | Initial Class# | | | 0.20 | % | |
|
| Blue Chip Growth Fund | | | | | | Service Class## | | | 0.45 | % | |
|
| Initial Class* | | | 0.85 | % | | Balanced Allocation Fund^^ | | | | | |
|
| Large Cap Growth Fund | | | | | | Initial Class# | | | 0.20 | % | |
|
| Initial Class* | | | 0.73 | % | | Service Class## | | | 0.45 | % | |
|
| Concentrated Growth Fund | | | | | | Moderate Allocation Fund^^ | | | | | |
|
| Class I* | | | 0.76 | % | | Initial Class# | | | 0.20 | % | |
|
| Class II* | | | 0.66 | % | | Service Class## | | | 0.45 | % | |
|
177
Notes to Financial Statements (Continued)
| Mid Cap Value Fund | | | | | | Growth Allocation Fund^^ | | | | | |
|
| Initial Class* | | | 0.93 | % | | Initial Class# | | | 0.20 | % | |
|
| Mid Cap Growth Fund | | | | | | Service Class## | | | 0.45 | % | |
|
| Initial Class* | | | 0.85 | % | | Aggressive Allocation Fund^^ | | | | | |
|
| Small/Mid Cap Value Fund | | | | | | Initial Class# | | | 0.20 | % | |
|
| Initial Class* | | | 0.88 | % | | Service Class## | | | 0.45 | % | |
|
| Small Cap Index Fund | | | | | | American Funds Core Allocation Fund^^## | | | 0.75 | % | |
|
| Initial Class* | | | 0.45 | % | | American Funds Growth Fund^## | | | 0.70 | % | |
|
| | | | | | | American Funds International Fund^## | | | 0.70 | % | |
|
* Expense cap in effect through April 30, 2008.
** Prior to May 1, 2008, expense cap was 0.71%.
*** Prior to May 1, 2008, expense cap was 0.61%.
^ Expense cap excludes Master Fund fees and expenses.
^^ Expense cap excludes Acquired Fund fees and expenses. Acquired Fund fees and expenses are expenses borne indirectly by a Fund through investments in other pooled investment vehicles.
# Expense cap in effect through April 30, 2009.
## Expense cap in effect through May 2, 2010.
Indirect Expenses The Conservative Allocation Fund, Balanced Allocation Fund, Moderate Allocation Fund, Growth Allocation Fund, Aggressive Allocation Fund, American Funds Growth Fund, American Funds International Fund and American Funds Core Allocation Fund incur fees and expenses indirectly as shareholders in the underlying funds. For the year ended December 31, 2008, these expenses were as follows based upon each Fund's average daily net assets:
| | | Indirect Operating Expenses | |
| Aggressive Allocation Fund | | | 0.80 | % | |
| Balanced Allocation Fund | | | 0.66 | % | |
| Conservative Allocation Fund | | | 0.63 | % | |
| Growth Allocation Fund | | | 0.74 | % | |
| Moderate Allocation Fund | | | 0.70 | % | |
| American Funds Core Allocation | | | 0.35 | % | |
| American Funds Growth Fund | | | 0.31 | % | |
| American Funds International Fund | | | 0.48 | % | |
Rebated Brokerage Commissions The Funds listed below have entered into agreements with certain brokers whereby the brokers will rebate, in cash, a portion of brokerage commissions. Rebated brokerage commissions are amounts earned by the Funds and are included with realized gain or loss on investment transactions presented in the Statement of Operations. For the year ended December 31, 2008, brokerage commissions rebated under these agreements were as follows:
| | | Rebated Commissions | |
| Asset Allocation Fund | | $ | 8,184 | | |
| Growth & Income Fund | | | 12,990 | | |
| Blue Chip Growth Fund | | | 2,232 | | |
| Large Cap Growth Fund | | | 5,485 | | |
| Concentrated Growth Fund | | | 25,714 | | |
| Global Fund | | | 5,478 | | |
| Foreign Fund | | | 2,303 | | |
Deferred Compensation Trustees of the Funds who are not employees of MassMutual or its subsidiaries may elect to defer receipt of their annual fees in accordance with terms of a Non-Qualified Deferred Compensation Plan. Amounts deferred shall accrue interest or earnings and shall be recorded on the Funds' books as other liabilities. For the year ended December 31, 2008, no significant amounts have been deferred.
Other Certain officers and trustees of the Funds are also employees of MassMutual. The compensation of each trustee who is not an employee of MassMutual is borne by the Funds.
178
Notes to Financial Statements (Continued)
4. Purchases and Sales of Investments Cost of purchases and proceeds from sales of investment securities (excluding short-term investments) for the year ended December 31, 2008, were as follows:
| | | Purchases | | Sales | |
| | | Long-Term
U.S. Government
Securities | | Other
Long-Term
Securities | | Long-Term
U.S. Government
Securities | | Other
Long-Term
Securities | |
| Asset Allocation Fund | | $ | 43,482,932 | | | $ | 89,366,303 | | | $ | 53,139,033 | | | $ | 118,711,542 | | |
| Equity Income Fund | | | - | | | | 277,144,996 | | | | - | | | | 116,520,773 | | |
| Income & Growth Fund | | | - | | | | 67,983,302 | | | | - | | | | 92,588,690 | | |
| Growth & Income Fund | | | - | | | | 98,386,724 | | | | - | | | | 134,630,128 | | |
| Blue Chip Growth Fund | | | - | | | | 211,916,530 | | | | - | | | | 38,027,234 | | |
| Large Cap Growth Fund | | | - | | | | 47,336,241 | | | | - | | | | 57,702,096 | | |
| Concentrated Growth Fund | | | - | | | | 177,072,110 | | | | - | | | | 94,950,633 | | |
| Mid Cap Value Fund | | | - | | | | 679,489,044 | | | | - | | | | 675,127,027 | | |
| Mid Cap Growth Fund | | | - | | | | 92,924,496 | | | | - | | | | 75,115,729 | | |
| Small/Mid Cap Value Fund | | | - | | | | 287,052,590 | | | | - | | | | 293,183,981 | | |
| Small Cap Index Fund | | | - | | | | 11,170,927 | | | | - | | | | 17,807,417 | | |
| Global Fund | | | - | | | | 24,873,125 | | | | - | | | | 31,951,831 | | |
| Foreign Fund | | | - | | | | 39,372,902 | | | | - | | | | 27,423,211 | | |
| Conservative Allocation Fund | | | - | | | | 113,799,084 | | | | - | | | | 13,326,775 | | |
| Balanced Allocation Fund | | | - | | | | 174,853,324 | | | | - | | | | 13,060,982 | | |
| Moderate Allocation Fund | | | - | | | | 508,782,614 | | | | - | | | | 34,026,491 | | |
| Growth Allocation Fund | | | - | | | | 715,439,893 | | | | - | | | | 37,259,013 | | |
Aggressive Allocation Fund - 43,133,897 - 3,476,177 American Funds Core
Allocation Fund | | | - | | | | 69,162,344 | | | | - | | | | 184,092 | | |
| American Funds Growth Fund | | | - | | | | 6,185,421 | | | | - | | | | 108,605 | | |
American Funds International
Fund | | | - | | | | 6,431,159 | | | | - | | | | 164,784 | | |
5. Capital Share Transactions Changes in shares outstanding for each Fund were as follows:
| | | Year ended December 31, 2008 | | Year ended December 31, 2007 | |
| | | Shares | | Amount | | Shares | | Amount | |
| Asset Allocation Fund Initial Class | |
| Sold | | | 1,144,356 | | | $ | 10,158,461 | | | | 2,232,214 | | | $ | 23,609,649 | | |
| Issued as reinvestment of dividends | | | 18,085 | | | | 160,237 | | | | 1,257,964 | | | | 12,776,466 | | |
| Redeemed | | | (7,177,836 | ) | | | (61,137,624 | ) | | | (3,584,268 | ) | | | (38,089,344 | ) | |
| Net increase (decrease) | | | (6,015,395 | ) | | $ | (50,818,926 | ) | | | (94,090 | ) | | $ | (1,703,229 | ) | |
| Asset Allocation Fund Service Class* | |
| Sold | | | 266,060 | | | $ | 1,871,889 | | | | | | | | | | |
| Issued as reinvestment of dividends | | | 9 | | | | 80 | | | | | | | | | | |
| Redeemed | | | (11,316 | ) | | | (88,978 | ) | | | | | | | | | |
| Net increase (decrease) | | | 254,753 | | | $ | 1,782,991 | | | | | | | | | | |
| Equity Income Fund Initial Class | |
| Sold | | | 22,907,840 | | | $ | 196,839,206 | | | | 9,072,256 | | | $ | 103,484,328 | | |
| Issued as reinvestment of dividends | | | 609,214 | | | | 5,677,874 | | | | 1,639,765 | | | | 18,082,042 | | |
| Redeemed | | | (6,791,713 | ) | | | (59,577,822 | ) | | | (2,191,889 | ) | | | (25,074,619 | ) | |
| Net increase (decrease) | | | 16,725,341 | | | $ | 142,939,258 | | | | 8,520,132 | | | $ | 96,491,751 | | |
| Equity Income Fund Service Class* | |
| Sold | | | 926,625 | | | $ | 6,384,317 | | | | | | | | | | |
| Issued as reinvestment of dividends | | | 143 | | | | 1,337 | | | | | | | | | | |
| Redeemed | | | (2,047 | ) | | | (15,371 | ) | | | | | | | | | |
| Net increase (decrease) | | | 924,721 | | | $ | 6,370,283 | | | | | | | | | | |
179
Notes to Financial Statements (Continued)
| | | Year ended December 31, 2008 | | Year ended December 31, 2007 | |
| | | Shares | | Amount | | Shares | | Amount | |
| Income & Growth Fund Initial Class | |
| Sold | | | 460,852 | | | $ | 4,128,895 | | | | 603,651 | | | $ | 6,874,369 | | |
| Issued as reinvestment of dividends | | | 973 | | | | 8,780 | | | | 952,868 | | | | 10,089,142 | | |
| Redeemed | | | (3,694,949 | ) | | | (31,650,440 | ) | | | (3,284,420 | ) | | | (37,382,175 | ) | |
| Net increase (decrease) | | | (3,233,124 | ) | | $ | (27,512,765 | ) | | | (1,727,901 | ) | | $ | (20,418,664 | ) | |
| Income & Growth Fund Service Class* | |
| Sold | | | 99,575 | | | $ | 674,194 | | | | | | | | | | |
| Issued as reinvestment of dividends | | | 1 | | | | 8 | | | | | | | | | | |
| Redeemed | | | (2,236 | ) | | | (14,441 | ) | | | | | | | | | |
| Net increase (decrease) | | | 97,340 | | | $ | 659,761 | | | | | | | | | | |
| Growth & Income Fund Initial Class | |
| Sold | | | 1,302,080 | | | $ | 10,720,017 | | | | 1,194,894 | | | $ | 12,781,800 | | |
| Issued as reinvestment of dividends | | | – | | | | – | | | | 1,405,802 | | | | 14,369,404 | | |
| Redeemed | | | (6,109,870 | ) | | | (49,293,838 | ) | | | (4,303,289 | ) | | | (46,430,568 | ) | |
| Net increase (decrease) | | | (4,807,790 | ) | | $ | (38,573,821 | ) | | | (1,702,593 | ) | | $ | (19,279,364 | ) | |
| Growth & Income Fund Service Class* | |
| Sold | | | 234,898 | | | $ | 1,415,855 | | | | | | | | | | |
| Issued as reinvestment of dividends | | | - | | | | - | | | | | | | | | | |
| Redeemed | | | (9,879 | ) | | | (57,670 | ) | | | | | | | | | |
| Net increase (decrease) | | | 225,019 | | | $ | 1,358,185 | | | | | | | | | | |
| Blue Chip Growth Fund Initial Class | |
| Sold | | | 21,459,118 | | | $ | 191,946,833 | | | | 828,780 | | | $ | 9,563,460 | | |
| Issued as reinvestment of dividends | | | - | | | | - | | | | 21,776 | | | | 255,874 | | |
| Redeemed | | | (1,991,923 | ) | | | (18,379,223 | ) | | | (828,243 | ) | | | (9,475,746 | ) | |
| Net increase (decrease) | | | 19,467,195 | | | $ | 173,567,610 | | | | 22,313 | | | $ | 343,588 | | |
| Blue Chip Growth Fund Service Class* | |
| Sold | | | 268,784 | | | $ | 1,900,268 | | | | | | | | | | |
| Issued as reinvestment of dividends | | | - | | | | - | | | | | | | | | | |
| Redeemed | | | (2,862 | ) | | | (17,993 | ) | | | | | | | | | |
| Net increase (decrease) | | | 265,922 | | | $ | 1,882,275 | | | | | | | | | | |
| Large Cap Growth Fund Initial Class | |
| Sold | | | 333,972 | | | $ | 2,962,899 | | | | 337,150 | | | $ | 3,633,481 | | |
| Issued as reinvestment of dividends | | | - | | | | - | | | | 10,013 | | | | 112,565 | | |
| Redeemed | | | (1,485,277 | ) | | | (13,641,198 | ) | | | (1,588,675 | ) | | | (17,104,606 | ) | |
| Net increase (decrease) | | | (1,151,305 | ) | | $ | (10,678,299 | ) | | | (1,241,512 | ) | | $ | (13,358,560 | ) | |
| Large Cap Growth Fund Service Class* | |
| Sold | | | 35,202 | | | $ | 264,394 | | | | | | | | | | |
| Issued as reinvestment of dividends | | | - | | | | - | | | | | | | | | | |
| Redeemed | | | (75 | ) | | | (494 | ) | | | | | | | | | |
| Net increase (decrease) | | | 35,127 | | | $ | 263,900 | | | | | | | | | | |
| Concentrated Growth Fund Class I | |
| Sold | | | 12,217,456 | | | $ | 96,454,865 | | | | 583,231 | | | $ | 6,826,400 | | |
| Issued as reinvestment of dividends | | | - | | | | - | | | | 116,066 | | | | 1,337,045 | | |
| Redeemed | | | (990,047 | ) | | | (7,315,084 | ) | | | (308,206 | ) | | | (3,499,152 | ) | |
| Net increase (decrease) | | | 11,227,409 | | | $ | 89,139,781 | | | | 391,091 | | | $ | 4,664,293 | | |
| Concentrated Growth Fund Class II | |
| Sold | | | 274,234 | | | $ | 2,024,368 | | | | 343,761 | | | $ | 4,028,201 | | |
| Issued as reinvestment of dividends | | | - | | | | - | | | | 315,347 | | | | 3,637,301 | | |
| Redeemed | | | (1,353,916 | ) | | | (11,157,601 | ) | | | (1,438,130 | ) | | | (16,112,976 | ) | |
| Net increase (decrease) | | | (1,079,682 | ) | | $ | (9,133,233 | ) | | | (779,022 | ) | | $ | (8,447,474 | ) | |
| Concentrated Growth Fund Service Class I** | |
| Sold | | | 114,491 | | | $ | 575,717 | | | | | | | | | | |
| Issued as reinvestment of dividends | | | - | | | | - | | | | | | | | | | |
| Redeemed | | | (3,542 | ) | | | (14,624 | ) | | | | | | | | | |
| Net increase (decrease) | | | 110,949 | | | $ | 561,093 | | | | | | | | | | |
180
Notes to Financial Statements (Continued)
| | | Year ended December 31, 2008 | | Year ended December 31, 2007 | |
| | | Shares | | Amount | | Shares | | Amount | |
| Mid Cap Value Fund Initial Class | |
| Sold | | | 9,052,649 | | | $ | 73,016,405 | | | | 9,775,681 | | | $ | 105,220,314 | | |
| Issued as reinvestment of dividends | | | 1,756 | | | | 15,668 | | | | 5,460,605 | | | | 53,731,437 | | |
| Redeemed | | | (11,119,427 | ) | | | (91,480,762 | ) | | | (4,320,403 | ) | | | (47,805,952 | ) | |
| Net increase (decrease) | | | (2,065,022 | ) | | $ | (18,448,689 | ) | | | 10,915,883 | | | $ | 111,145,799 | | |
| Mid Cap Value Fund Service Class* | |
| Sold | | | 336,083 | | | $ | 2,269,205 | | | | | | | | | | |
| Issued as reinvestment of dividends | | | - | † | | | 4 | | | | | | | | | | |
| Redeemed | | | (6,879 | ) | | | (46,681 | ) | | | | | | | | | |
| Net increase (decrease) | | | 329,204 | | | $ | 2,222,528 | | | | | | | | | | |
| Mid Cap Growth Fund Initial Class | |
| Sold | | | 8,519,444 | | | $ | 73,210,199 | | | | 1,588,498 | | | $ | 18,019,237 | | |
| Issued as reinvestment of dividends | | | 449,493 | | | | 4,530,894 | | | | 1,241,882 | | | | 14,127,242 | | |
| Redeemed | | | (6,542,565 | ) | | | (59,879,946 | ) | | | (5,666,290 | ) | | | (63,190,964 | ) | |
| Net increase (decrease) | | | 2,426,372 | | | $ | 17,861,147 | | | | (2,835,910 | ) | | $ | (31,044,485 | ) | |
| Mid Cap Growth Fund Service Class* | |
| Sold | | | 592,720 | | | $ | 3,914,002 | | | | | | | | | | |
| Issued as reinvestment of dividends | | | 167 | | | | 1,688 | | | | | | | | | | |
| Redeemed | | | (20,769 | ) | | | (152,722 | ) | | | | | | | | | |
| Net increase (decrease) | | | 572,118 | | | $ | 3,762,968 | | | | | | | | | | |
| Small/Mid Cap Value Fund Initial Class | |
| Sold | | | 3,475,071 | | | $ | 21,619,591 | | | | 11,769,574 | | | $ | 112,506,376 | | |
| Issued as reinvestment of dividends | | | - | | | | - | | | | 280,603 | | | | 2,368,286 | | |
| Redeemed | | | (5,068,106 | ) | | | (36,506,735 | ) | | | (2,451,427 | ) | | | (24,066,689 | ) | |
| Net increase (decrease) | | | (1,593,035 | ) | | $ | (14,887,144 | ) | | | 9,598,750 | | | $ | 90,807,973 | | |
| Small/Mid Cap Value Fund Service Class* | |
| Sold | | | 304,116 | | | $ | 1,549,372 | | | | | | | | | | |
| Issued as reinvestment of dividends | | | - | | | | - | | | | | | | | | | |
| Redeemed | | | (9,669 | ) | | | (50,543 | ) | | | | | | | | | |
| Net increase (decrease) | | | 294,447 | | | $ | 1,498,829 | | | | | | | | | | |
| Small Cap Index Fund Initial Class | |
| Sold | | | 467,450 | | | $ | 3,859,193 | | | | 408,168 | | | $ | 4,273,953 | | |
| Issued as reinvestment of dividends | | | 62,378 | | | | 576,998 | | | | 298,903 | | | | 2,949,832 | | |
| Redeemed | | | (1,458,848 | ) | | | (11,925,793 | ) | | | (1,353,796 | ) | | | (14,251,782 | ) | |
| Net increase (decrease) | | | (929,020 | ) | | $ | (7,489,602 | ) | | | (646,725 | ) | | $ | (7,027,997 | ) | |
| Small Cap Index Fund Service Class* | |
| Sold | | | 195,727 | | | $ | 1,289,318 | | | | | | | | | | |
| Issued as reinvestment of dividends | | | 115 | | | | 1,067 | | | | | | | | | | |
| Redeemed | | | (13,019 | ) | | | (84,299 | ) | | | | | | | | | |
| Net increase (decrease) | | | 182,823 | | | $ | 1,206,086 | | | | | | | | | | |
| Global Fund Class I | |
| Sold | | | 209,151 | | | $ | 1,765,042 | | | | 113,374 | | | $ | 1,243,680 | | |
| Issued as reinvestment of dividends | | | 4,177 | | | | 36,256 | | | | 52,305 | | | | 549,801 | | |
| Redeemed | | | (231,855 | ) | | | (1,856,110 | ) | | | (102,763 | ) | | | (1,130,522 | ) | |
| Net increase (decrease) | | | (18,527 | ) | | $ | (54,812 | ) | | | 62,916 | | | $ | 662,959 | | |
| Global Fund Class II | |
| Sold | | | 76,846 | | | $ | 612,808 | | | | 204,860 | | | $ | 2,286,187 | | |
| Issued as reinvestment of dividends | | | 14,570 | | | | 126,610 | | | | 231,585 | | | | 2,434,831 | | |
| Redeemed | | | (1,108,406 | ) | | | (9,458,300 | ) | | | (1,150,601 | ) | | | (12,644,093 | ) | |
| Net increase (decrease) | | | (1,016,990 | ) | | $ | (8,718,882 | ) | | | (714,156 | ) | | $ | (7,923,075 | ) | |
| Global Fund Service Class I** | |
| Sold | | | 49,957 | | | $ | 318,346 | | | | | | | | | | |
| Issued as reinvestment of dividends | | | 48 | | | | 416 | | | | | | | | | | |
| Redeemed | | | (4,276 | ) | | | (23,907 | ) | | | | | | | | | |
| Net increase (decrease) | | | 45,729 | | | $ | 294,855 | | | | | | | | | | |
181
Notes to Financial Statements (Continued)
| | | Year ended December 31, 2008 | | Year ended December 31, 2007 | |
| | | Shares | | Amount | | Shares | | Amount | |
| Foreign Fund Initial Class | |
| Sold | | | 3,952,609 | | | $ | 39,001,328 | | | | 8,943,938 | | | $ | 107,366,916 | | |
| Issued as reinvestment of dividends | | | 12,070 | | | | 118,041 | | | | 1,107,873 | | | | 13,319,538 | | |
| Redeemed | | | (4,341,881 | ) | | | (40,021,798 | ) | | | (3,231,872 | ) | | | (38,216,434 | ) | |
| Net increase (decrease) | | | (377,202 | ) | | $ | (902,429 | ) | | | 6,819,939 | | | $ | 82,470,020 | | |
| Foreign Fund Service Class* | |
| Sold | | | 250,322 | | | $ | 1,802,105 | | | | | | | | | | |
| Issued as reinvestment of dividends | | | 4 | | | | 40 | | | | | | | | | | |
| Redeemed | | | (13,466 | ) | | | (106,957 | ) | | | | | | | | | |
| Net increase (decrease) | | | 236,860 | | | $ | 1,695,188 | | | | | | | | | | |
| Conservative Allocation Fund Initial Class | |
| Sold | | | 7,958,581 | | | $ | 75,250,754 | | | | 15,000 | | | $ | 150,000 | | |
| Issued as reinvestment of dividends | | | 117 | | | | 1,149 | | | | 296 | | | | 2,986 | | |
| Redeemed | | | (1,490,223 | ) | | | (13,645,670 | ) | | | - | | | | - | | |
| Net increase (decrease) | | | 6,468,475 | | | $ | 61,606,233 | | | | 15,296 | | | $ | 152,986 | | |
| Conservative Allocation Fund Service Class* | |
| Sold | | | 4,783,762 | | | $ | 38,171,073 | | | | | | | | | | |
| Issued as reinvestment of dividends | | | - | † | | | 3 | | | | | | | | | | |
| Redeemed | | | (59,201 | ) | | | (472,282 | ) | | | | | | | | | |
| Net increase (decrease) | | | 4,724,561 | | | $ | 37,698,794 | | | | | | | | | | |
| Balanced Allocation Fund Initial Class | |
| Sold | | | 12,840,812 | | | $ | 121,550,834 | | | | 15,000 | | | $ | 150,000 | | |
| Issued as reinvestment of dividends | | | 156 | | | | 1,504 | | | | 321 | | | | 3,233 | | |
| Redeemed | | | (1,181,507 | ) | | | (10,361,516 | ) | | | - | | | | - | | |
| Net increase (decrease) | | | 11,659,461 | | | $ | 111,190,822 | | | | 15,321 | | | $ | 153,233 | | |
| Balanced Allocation Fund Service Class* | |
| Sold | | | 6,510,353 | | | $ | 49,018,020 | | | | | | | | | | |
| Issued as reinvestment of dividends | | | - | † | | | 2 | | | | | | | | | | |
| Redeemed | | | (13,555 | ) | | | (96,489 | ) | | | | | | | | | |
| Net increase (decrease) | | | 6,496,798 | | | $ | 48,921,533 | | | | | | | | | | |
| Moderate Allocation Fund Initial Class | |
| Sold | | | 35,999,869 | | | $ | 336,634,207 | | | | 15,000 | | | $ | 150,000 | | |
| Issued as reinvestment of dividends | | | 184 | | | | 1,740 | | | | 334 | | | | 3,353 | | |
| Redeemed | | | (1,351,626 | ) | | | (11,238,400 | ) | | | - | | | | - | | |
| Net increase (decrease) | | | 34,648,427 | | | $ | 325,397,547 | | | | 15,334 | | | $ | 153,353 | | |
| Moderate Allocation Fund Service Class* | |
| Sold | | | 20,357,455 | | | $ | 145,932,433 | | | | | | | | | | |
| Issued as reinvestment of dividends | | | - | † | | | 1 | | | | | | | | | | |
| Redeemed | | | (130,295 | ) | | | (927,429 | ) | | | | | | | | | |
| Net increase (decrease) | | | 20,227,160 | | | $ | 145,005,005 | | | | | | | | | | |
| Growth Allocation Fund Initial Class | |
| Sold | | | 54,699,995 | | | $ | 501,919,743 | | | | 15,000 | | | $ | 150,000 | | |
| Issued as reinvestment of dividends | | | 235 | | | | 2,157 | | | | 337 | | | | 3,383 | | |
| Redeemed | | | (1,458,784 | ) | | | (11,761,129 | ) | | | - | | | | - | | |
| Net increase (decrease) | | | 53,241,446 | | | $ | 490,160,771 | | | | 15,337 | | | $ | 153,383 | | |
| Growth Allocation Fund Service Class* | |
| Sold | | | 27,726,524 | | | $ | 183,679,355 | | | | | | | | | | |
| Issued as reinvestment of dividends | | | - | † | | | 1 | | | | | | | | | | |
| Redeemed | | | (22,047 | ) | | | (155,181 | ) | | | | | | | | | |
| Net increase (decrease) | | | 27,704,477 | | | $ | 183,524,175 | | | | | | | | | | |
| Aggressive Allocation Fund Initial Class | |
| Sold | | | 4,235,589 | | | $ | 37,812,789 | | | | 15,000 | | | $ | 150,000 | | |
| Issued as reinvestment of dividends | | | 267 | | | | 2,396 | | | | 338 | | | | 3,387 | | |
| Redeemed | | | (272,130 | ) | | | (2,307,788 | ) | | | - | | | | - | | |
| Net increase (decrease) | | | 3,963,726 | | | $ | 35,507,397 | | | | 15,338 | | | $ | 153,387 | | |
182
Notes to Financial Statements (Continued)
| | | Year ended December 31, 2008 | | Year ended December 31, 2007 | |
| | | Shares | | Amount | | Shares | | Amount | |
| Aggressive Allocation Fund Service Class* | |
| Sold | | | 659,414 | | | $ | 4,017,427 | | | | | | |
| Issued as reinvestment of dividends | | | 1 | | | | 8 | | | | | | |
| Redeemed | | | (15,803 | ) | | | (101,106 | ) | | | | | |
| Net increase (decrease) | | | 643,612 | | | $ | 3,916,329 | | | | | | |
| American Funds Core Allocation Fund Service Class I** | |
| Sold | | | 8,776,525 | | | $ | 67,394,040 | | | | | | |
| Issued as reinvestment of dividends | | | - | | | | - | | | | | | |
| Redeemed | | | (16,261 | ) | | | (122,361 | ) | | | | | |
| Net increase (decrease) | | | 8,760,264 | | | $ | 67,271,679 | | | | | | |
| American Funds Growth Fund Service Class I** | |
| Sold | | | 962,569 | | | $ | 6,233,781 | | | | | | |
| Issued as reinvestment of dividends | | | - | | | | - | | | | | | |
| Redeemed | | | (6,455 | ) | | | (39,715 | ) | | | | | |
| Net increase (decrease) | | | 956,114 | | | $ | 6,194,066 | | | | | | |
| American Funds International Fund Service Class I** | |
| Sold | | | 939,832 | | | $ | 6,401,985 | | | | | | |
| Issued as reinvestment of dividends | | | - | | | | - | | | | | | |
| Redeemed | | | (13,831 | ) | | | (95,651 | ) | | | | | |
| Net increase (decrease) | | | 926,001 | | | $ | 6,306,334 | | | | | | |
† Amount rounds to less than 0.5 shares.
* Service Class commenced operations on August 15, 2008.
** Service Class I commenced operations on August 15, 2008.
6. Federal Income Tax Information At December 31, 2008, the cost of securities and the unrealized appreciation (depreciation) in the value of investments owned by the Funds, as computed on a federal income tax basis, were as follows:
| | | Federal
Income Tax
Cost | | Tax Basis
Unrealized
Appreciation | | Tax Basis
Unrealized
Depreciation | | Net Unrealized
Appreciation
(Depreciation) | |
| Asset Allocation Fund | | $ | 176,223,632 | | | $ | 2,996,488 | | | $ | (37,172,303 | ) | | $ | (34,175,815 | ) | |
| Equity Income Fund | | | 502,524,934 | | | | 4,119,370 | | | | (146,947,087 | ) | | | (142,827,717 | ) | |
| Income & Growth Fund | | | 100,193,752 | | | | 3,088,609 | | | | (26,470,540 | ) | | | (23,381,931 | ) | |
| Growth & Income Fund | | | 179,608,905 | | | | 2,286,480 | | | | (47,633,279 | ) | | | (45,346,799 | ) | |
| Blue Chip Growth Fund | | | 213,974,665 | | | | 1,771,916 | | | | (43,581,560 | ) | | | (41,809,644 | ) | |
| Large Cap Growth Fund | | | 47,613,774 | | | | 839,204 | | | | (11,848,746 | ) | | | (11,009,542 | ) | |
| Concentrated Growth Fund | | | 111,260,257 | | | | 811,813 | | | | 31,422,037 | | | | (30,610,224 | ) | |
| Mid Cap Value Fund | | | 374,701,098 | | | | 7,315,038 | | | | (91,106,883 | ) | | | (83,791,845 | ) | |
| Mid Cap Growth Fund | | | 260,146,271 | | | | 7,644,512 | | | | (80,386,412 | ) | | | (72,741,900 | ) | |
| Small/Mid Cap Value Fund | | | 204,177,305 | | | | 3,557,658 | | | | (71,414,114 | ) | | | (67,856,456 | ) | |
| Small Cap Index Fund | | | 55,193,731 | | | | 1,296,648 | | | | (21,231,504 | ) | | | (19,934,856 | ) | |
| Global Fund | | | 32,069,501 | | | | 674,592 | | | | (8,476,779 | ) | | | (7,802,187 | ) | |
| Foreign Fund | | | 312,959,573 | | | | 4,852,233 | | | | (107,464,264 | ) | | | (102,612,031 | ) | |
| Conservative Allocation Fund | | | 100,646,695 | | | | 162,055 | | | | (9,494,871 | ) | | | (9,332,816 | ) | |
| Balanced Allocation Fund | | | 161,964,610 | | | | 53,759 | | | | (24,088,757 | ) | | | (24,034,998 | ) | |
| Moderate Allocation Fund | | | 474,967,401 | | | | 149,633 | | | | (76,539,580 | ) | | | (76,389,947 | ) | |
| Growth Allocation Fund | | | 678,345,484 | | | | 64,756 | | | | (139,273,832 | ) | | | (139,209,076 | ) | |
| Aggressive Allocation Fund | | | 39,790,265 | | | | - | | | | (11,335,011 | ) | | | (11,335,011 | ) | |
| American Funds Core Allocation Fund | | | 69,127,770 | | | | 44,061 | | | | (1,283,948 | ) | | | (1,239,887 | ) | |
| American Funds Growth Fund | | | 6,221,658 | | | | - | | | | (172,577 | ) | | | (172,577 | ) | |
| American Funds International Fund | | | 6,407,466 | | | | - | | | | (28,434 | ) | | | (28,434 | ) | |
183
Notes to Financial Statements (Continued)
Net capital loss carryforwards may be applied against any net realized taxable gains in each succeeding year, or until their respective expiration dates, whichever occurs first. At December 31, 2008, the following Fund(s) had available, for federal income tax purposes, unused capital losses:
| | | Expiring
2014 | | Expiring
2015 | | Expiring
2016 | |
| Asset Allocation Fund | | $ | - | | | $ | - | | | $ | 35,566,452 | | |
| Equity Income Fund | | | - | | | | - | | | | 13,622,103 | | |
| Income & Growth Fund | | | - | | | | - | | | | 13,430,089 | | |
| Growth & Income Fund | | | - | | | | - | | | | 53,443,635 | | |
| Blue Chip Growth Fund | | | 216,675 | | | | - | | | | 8,050,709 | | |
| Large Cap Growth Fund | | | 527,453 | | | | - | | | | 5,338,597 | | |
| Concentrated Growth Fund | | | - | | | | - | | | | 31,910,748 | | |
| Mid Cap Value Fund | | | - | | | | - | | | | 46,532,382 | | |
| Mid Cap Growth Fund | | | - | | | | - | | | | 8,854,901 | | |
| Small/Mid Cap Value Fund | | | 4,049,171 | | | | 46,032,150 | | | | - | | |
| Global Fund | | | - | | | | - | | | | 7,420,704 | | |
| Foreign Fund | | | - | | | | - | | | | 1,308,609 | | |
| American Funds Core Allocation Fund | | | - | | | | - | | | | 483 | | |
| American Funds International Fund | | | - | | | | | | | | 8,908 | | |
The following Fund(s) elected to defer to January 1, 2009, post-October capital losses:
| Asset Allocation Fund | | $ | 5,711,707 | | |
| Equity Income Fund | | | 6,541,135 | | |
| Income & Growth Fund | | | 4,662,760 | | |
| Growth & Income Fund | | | 5,430,482 | | |
| Blue Chip Growth Fund | | | 7,320,459 | | |
| Large Cap Growth Fund | | | 1,420,839 | | |
| Concentrated Growth Fund | | | 16,328,702 | | |
| Mid Cap Value Fund | | | 11,472,444 | | |
| Mid Cap Growth Fund | | | 6,008,171 | | |
| Small/Mid Cap Value Fund | | | 11,934,115 | | |
| Small Cap Index Fund | | | 1,097,848 | | |
| Global Fund | | | 4,091,486 | | |
| Foreign Fund | | | 6,447,158 | | |
| Conservative Allocation Fund | | | 22,649 | | |
| Aggressive Allocation Fund | | | 40,592 | | |
| American Funds Growth Fund | | | 5,158 | | |
The Mid Cap Growth Fund has elected to defer to January 1, 2009, post-October currency losses in the amount of $6,114.
Accounting principles generally accepted in the United States of America require that only distributions in excess of tax basis earnings and profits be reported in the financial statements as a return of capital.
The tax character of distributions (including capital gain dividends, if any, designated pursuant to Section 852 of the Code) paid during the year ended December 31, 2008, was as follows:
| | | Ordinary
Income | | Long Term
Capital Gain | | Return of
Capital | |
| Asset Allocation Fund | | $ | 160,317 | | | $ | - | | | $ | - | | |
| Equity Income Fund | | | 673,052 | | | | 5,006,158 | | | | - | | |
| Income & Growth Fund | | | 1,918 | | | | 6,870 | | | | - | | |
| Mid Cap Value Fund | | | 15,672 | | | | - | | | | - | | |
| Mid Cap Growth Fund | | | 801,909 | | | | 3,730,673 | | | | - | | |
184
Notes to Financial Statements (Continued)
| | | Ordinary
Income | | Long Term
Capital Gain | | Return of
Capital | |
| Small Cap Index Fund | | | - | | | | 578,065 | | | | - | | |
| Global Fund | | | 2 | | | | 163,279 | | | | - | | |
| Foreign Fund | | | 118,081 | | | | - | | | | - | | |
| Conservative Allocation Fund | | | 4 | | | | 1,147 | | | | - | | |
| Balanced Allocation Fund | | | - | | | | 1,506 | | | | - | | |
| Moderate Allocation Fund | | | - | | | | 1,741 | | | | - | | |
| Growth Allocation Fund | | | - | | | | 2,158 | | | | - | | |
| Aggressive Allocation Fund | | | - | | | | 2,404 | | | | - | | |
The tax character of distributions (including capital gain dividends, if any, designated pursuant to Section 852 of the Code) paid during the year ended December 31, 2007, was as follows:
| | | Ordinary
Income | | Long Term
Capital Gain | | Return of
Capital | |
| Asset Allocation Fund | | $ | 8,838,949 | | | $ | 3,937,517 | | | $ | - | | |
| Equity Income Fund | | | 10,959,285 | | | | 7,122,757 | | | | - | | |
| Income & Growth Fund | | | 4,756,729 | | | | 5,327,099 | | | | 5,314 | | |
| Growth & Income Fund | | | 7,614,704 | | | | 6,745,650 | | | | 9,050 | | |
| Blue Chip Growth Fund | | | 234,912 | | | | - | | | | 20,962 | | |
| Large Cap Growth Fund | | | 112,565 | | | | - | | | | - | | |
| Concentrated Growth Fund | | | 3,244,044 | | | | 1,730,302 | | | | - | | |
| Mid Cap Value Fund | | | 49,295,888 | | | | 4,435,549 | | | | - | | |
| Mid Cap Growth Fund | | | 4,085,085 | | | | 10,042,157 | | | | - | | |
| Small/Mid Cap Value Fund | | | 2,320,011 | | | | - | | | | 48,275 | | |
| Small Cap Index Fund | | | 1,030,496 | | | | 1,919,336 | | | | - | | |
| Global Fund | | | 1,704,610 | | | | 1,280,022 | | | | - | | |
| Foreign Fund | | | 9,834,753 | | | | 3,484,785 | | | | - | | |
| Conservative Allocation Fund | | | 2,986 | | | | - | | | | - | | |
| Balanced Allocation Fund | | | 3,233 | | | | - | | | | - | | |
| Moderate Allocation Fund | | | 3,353 | | | | - | | | | - | | |
| Growth Allocation Fund | | | 3,383 | | | | - | | | | - | | |
| Aggressive Allocation Fund | | | 3,387 | | | | - | | | | - | | |
The following Fund(s) have elected to pass through foreign tax credit for the year ended December 31, 2008:
Capital accounts within financial statements are periodically adjusted for permanent differences between book and tax accounting. These adjustments have no impact on net assets or the results of operations. Temporary book and tax accounting differences will reverse in subsequent periods. At December 31, 2008, temporary book and tax accounting differences were primarily attributable to investments in passive foreign investment companies and the deferral of wash sale losses.
At December 31, 2008, the components of distributable earnings on a tax basis were as follows:
| | | Undistributed
Ordinary
Income | | Long Term
Capital Gain
(Capital Loss
Carryover) | | Other
Temporary
Differences | | Unrealized
Appreciation
(Depreciation) | |
| Asset Allocation Fund | | $ | 5,574,621 | | | $ | (35,566,452 | ) | | $ | (5,734,437 | ) | | $ | (34,188,160 | ) | |
| Equity Income Fund | | | 9,412,765 | | | | (13,622,103 | ) | | | (6,573,167 | ) | | | (142,829,577 | ) | |
| Income & Growth Fund | | | 2,077,047 | | | | (13,430,089 | ) | | | (4,676,889 | ) | | | (23,381,931 | | |
185
Notes to Financial Statements (Continued)
| | | Undistributed
Ordinary
Income | | Long Term
Capital Gain
(Capital Loss
Carryover) | | Other
Temporary
Differences | | Unrealized
Appreciation
(Depreciation) | |
| Growth & Income Fund | | | 2,863,404 | | | | (53,443,635 | ) | | | (5,455,190 | ) | | | (45,346,799 | ) | |
| Blue Chip Growth Fund | | | 248,540 | | | | (8,267,384 | ) | | | (7,326,962 | ) | | | (41,809,320 | ) | |
| Large Cap Growth Fund | | | 196,021 | | | | (5,866,050 | ) | | | (1,428,303 | ) | | | (11,009,542 | ) | |
| Concentrated Growth Fund | | | 348,748 | | | | (31,910,748 | ) | | | (16,337,128 | ) | | | (30,610,224 | ) | |
| Mid Cap Value Fund | | | 7,295,283 | | | | (46,532,382 | ) | | | (11,507,295 | ) | | | (83,792,796 | ) | |
| Mid Cap Growth Fund | | | - | | | | (8,854,901 | ) | | | (6,040,101 | ) | | | (72,741,917 | ) | |
| Small/Mid Cap Value Fund | | | 2,129,627 | | | | (50,081,321 | ) | | | (11,953,891 | ) | | | (67,856,456 | ) | |
| Small Cap Index Fund | | | 581,708 | | | | 597,555 | | | | (1,104,327 | ) | | | (19,934,872 | ) | |
| Global Fund | | | 687,673 | | | | (7,420,704 | ) | | | (4,096,350 | ) | | | (7,804,532 | ) | |
| Foreign Fund | | | 6,181,602 | | | | (1,308,609 | ) | | | (6,473,915 | ) | | | (102,645,107 | ) | |
| Conservative Allocation Fund | | | 1,052,253 | | | | 116,280 | | | | (23,937 | ) | | | (9,332,816 | ) | |
| Balanced Allocation Fund | | | 1,435,769 | | | | 204,708 | | | | (2,313 | ) | | | (24,034,998 | ) | |
| Moderate Allocation Fund | | | 3,695,440 | | | | 603,158 | | | | (6,818 | ) | | | (76,389,947 | ) | |
| Growth Allocation Fund | | | 3,236,041 | | | | 1,130,691 | | | | - | | | | (139,209,076 | ) | |
| Aggressive Allocation Fund | | | 118,233 | | | | 111,721 | | | | (42,054 | ) | | | (11,335,011 | ) | |
| American Funds Core Allocation Fund | | | 1,842,871 | | | | (483 | ) | | | (505 | ) | | | (1,239,887 | ) | |
| American Funds Growth Fund | | | 63,511 | | | | - | | | | (5,207 | ) | | | (172,577 | ) | |
| American Funds International Fund | | | 140,703 | | | | (8,908 | ) | | | (49 | ) | | | (28,434 | ) | |
During the year ended December 31, 2008, the following amounts were reclassified due to permanent differences between book and tax accounting:
| | | Paid-in
Capital | | Accumulated
Net Realized
Gain (Loss) on
Investments | | Undistributed
Investment
Income (Loss) | |
| Asset Allocation Fund | | $ | (1 | ) | | $ | (403,570 | ) | | $ | 403,571 | | |
| Equity Income Fund | | | - | | | | (675 | ) | | | 675 | | |
| Income & Growth Fund | | | 5,314 | | | | 11,971 | | | | (17,285 | ) | |
| Growth & Income Fund | | | (11,620 | ) | | | 11,620 | | | | - | | |
| Blue Chip Growth Fund | | | - | | | | 25,675 | | | | (25,675 | ) | |
| Concentrated Growth Fund | | | (1 | ) | | | 14,409 | | | | (14,408 | ) | |
| Mid Cap Value Fund | | | - | | | | 348,167 | | | | (348,167 | ) | |
| Mid Cap Growth Fund | | | (492,103 | ) | | | 3,085 | | | | 489,018 | | |
| Small/Mid Cap Value Fund | | | (179,065 | ) | | | 389,028 | | | | (209,963 | ) | |
| Small Cap Index Fund | | | 2 | | | | 21,942 | | | | (21,944 | ) | |
| Global Fund | | | (4,599 | ) | | | 80,387 | | | | (75,788 | ) | |
| Foreign Fund | | | - | | | | 476,770 | | | | (476,770 | ) | |
| Conservative Allocation Fund | | | - | | | | (13,143 | ) | | | 13,143 | | |
| Balanced Allocation Fund | | | - | | | | (26,792 | ) | | | 26,792 | | |
| Moderate Allocation Fund | | | - | | | | (79,525 | ) | | | 79,525 | | |
| Growth Allocation Fund | | | - | | | | (147,959 | ) | | | 147,959 | | |
| Aggressive Allocation Fund | | | - | | | | (12,900 | ) | | | 12,900 | | |
The Funds are subject to the provisions of FASB Interpretation No. 48 ("FIN 48") "Accounting for Uncertainty in Income Taxes — an interpretation of FASB Statement No. 109". FIN 48 sets forth a minimum threshold for financial statement recognition of the benefit of a tax position taken or expected to be taken in a tax return. The Funds did not have any unrecognized tax benefits at December 31, 2008, nor were there any increases or decreases in unrecognized tax benefits for the year then ended. The Funds recognize interest and penalties, if any, related to unrecognized tax benefits as an income tax expense in the Statements of Operations. During the year ended December 31, 2008, the Funds did not incur any such interest or penalties. The Funds are subject to examination by U.S. federal and state tax
186
Notes to Financial Statements (Continued)
authorities for returns filed for the prior three fiscal years. Foreign taxes are provided for based on the Funds' understanding of the tax rules and rates that exist in the foreign markets in which they invest.
7. Investment in Affiliated Issuers A summary of the Funds' transactions in the securities of these issuers during the year ended December 31, 2008, was as follows:
| | | Number of
Shares Held,
Beginning
of Period | | Purchases | | Sales | | Number of
Shares Held,
End
of Period | | Value,
End of
Period | | Dividend
Income | | Realized
Gains
Distributions | |
| Conservative Allocation Fund | |
MML Blue Chip
Growth Fund,
Initial Class | | | 1,329 | | | | 1,458,052 | | | | 91,278 | | | | 1,368,103 | | | $ | 9,344,143 | | | $ | - | | | $ | - | | |
MML Equity Fund,
Initial Class | | | 440 | | | | 519,313 | | | | 32,339 | | | | 487,414 | | | | 6,652,590 | | | | - | | | | - | | |
MML Equity
Income Fund,
Initial Class | | | 978 | | | | 1,037,604 | | | | 68,054 | | | | 970,528 | | | | 6,619,004 | | | | - | | | | 39,225 | | |
MML Inflation-
Protected and
Income Fund,
Initial Class | | | 2,971 | | | | 2,153,500 | | | | 311,682 | | | | 1,844,789 | | | | 17,562,392 | | | | 448,243 | | | | - | | |
MML Managed
Bond Fund,
Initial Class | | | 3,155 | | | | 2,251,467 | | | | 411,266 | | | | 1,843,356 | | | | 22,084,926 | | | | 539,564 | | | | - | | |
MML Mid Cap
Growth Fund,
Initial Class | | | 419 | | | | 475,355 | | | | 28,368 | | | | 447,406 | | | | 2,939,460 | | | | - | | | | 22,083 | | |
MML Mid Cap
Value Fund,
Initial Class | | | 309 | | | | 302,510 | | | | 24,963 | | | | 277,856 | | | | 1,925,539 | | | | 35 | | | | - | | |
MML Small Cap
Equity Fund,
Initial Class | | | 485 | | | | 582,859 | | | | 34,978 | | | | 548,366 | | | | 3,053,577 | | | | - | | | | 84 | | |
Oppenheimer
Global Securities
Fund, Non-
Service Shares | | | 168 | | | | 204,294 | | | | 12,075 | | | | 192,387 | | | | 3,888,148 | | | | 7,107 | | | | 31,228 | | |
Oppenheimer
International
Fund, Non-
Service Shares | | | 2,941 | | | | 3,406,585 | | | | 203,448 | | | | 3,206,078 | | | | 3,879,354 | | | | 4,944 | | | | - | | |
Oppenheimer
Strategic Bond
Fund, Non-
Service Shares | | | 4,253 | | | | 3,295,357 | | | | 323,052 | | | | 2,976,558 | | | | 13,364,746 | | | | 91,393 | | | | 21,119 | | |
| | | | | | | | | | | | | | | | | | | $ | 91,313,879 | | | $ | 1,091,286 | | | $ | 113,739 | | |
187
Notes to Financial Statements (Continued)
| | | Number of
Shares Held,
Beginning
of Period | | Purchases | | Sales | | Number of
Shares Held,
End
of Period | | Value,
End of
Period | | Dividend
Income | | Realized
Gains
Distributions | |
| Balanced Allocation Fund | |
MML Blue Chip
Growth Fund,
Initial Class | | | 1,197 | | | | 1,870,762 | | | | 23,529 | | | | 1,848,430 | | | $ | 12,624,774 | | | $ | - | | | $ | - | | |
MML
Concentrated
Growth Fund,
Class I | | | 848 | | | | 998,422 | | | | 46,557 | | | | 952,713 | | | | 4,239,574 | | | | - | | | | - | | |
MML Equity Fund,
Initial Class | | | 502 | | | | 846,181 | | | | 10,582 | | | | 836,101 | | | | 11,411,740 | | | | - | | | | - | | |
MML Equity
Income Fund,
Initial Class | | | 1,257 | | | | 1,899,956 | | | | 25,320 | | | | 1,875,893 | | | | 12,793,591 | | | | - | | | | 108,129 | | |
MML Inflation-
Protected and
Income Fund,
Initial Class | | | 2,971 | | | | 3,267,577 | | | | 507,760 | | | | 2,762,788 | | | | 26,301,740 | | | | 851,399 | | | | - | | |
MML Managed
Bond Fund,
Initial Class | | | 1,893 | | | | 2,068,407 | | | | 413,101 | | | | 1,657,199 | | | | 19,854,616 | | | | 557,341 | | | | - | | |
MML Mid Cap
Growth Fund,
Initial Class | | | 419 | | | | 679,348 | | | | 8,070 | | | | 671,697 | | | | 4,413,052 | | | | - | | | | 47,024 | | |
MML Mid Cap
Value Fund,
Initial Class | | | 464 | | | | 651,495 | | | | 26,129 | | | | 625,830 | | | | 4,337,005 | | | | 110 | | | | - | | |
MML Small
Cap Equity Fund,
Initial Class | | | 485 | | | | 833,429 | | | | 9,952 | | | | 823,962 | | | | 4,588,237 | | | | - | | | | 179 | | |
Oppenheimer
Capital
Appreciation
Fund, Non-
Service Shares | | | - | | | | 165,242 | | | | - | | | | 165,242 | | | | 4,241,763 | | | | - | | | | - | | |
Oppenheimer
Global Securities
Fund, Non-
Service Shares | | | 168 | | | | 292,439 | | | | 3,680 | | | | 288,927 | | | | 5,839,220 | | | | 8,754 | | | | 38,462 | | |
Oppenheimer
International
Fund, Non-
Service Shares | | | 3,676 | | | | 6,085,125 | | | | 73,634 | | | | 6,015,167 | | | | 7,278,352 | | | | 7,601 | | | | - | | |
Oppenheimer
Strategic Bond
Fund, Non-
Service Shares | | | 4,253 | | | | 4,862,342 | | | | 410,927 | | | | 4,455,668 | | | | 20,005,948 | | | | 112,668 | | | | 26,035 | | |
| | | | | | | | | | | | | | | | | | | $ | 137,929,612 | | | $ | 1,537,873 | | | $ | 219,829 | | |
188
Notes to Financial Statements (Continued)
| | | Number of
Shares Held,
Beginning
of Period | | Purchases | | Sales | | Number of
Shares Held,
End
of Period | | Value,
End of
Period | | Dividend
Income | | Realized
Gains
Distributions | |
| Moderate Allocation Fund | |
MML Blue Chip
Growth Fund,
Initial Class | | | 1,329 | | | | 5,916,500 | | | | 33,738 | | | | 5,884,091 | | | $ | 40,188,344 | | | $ | - | | | $ | - | | |
MML
Concentrated
Growth Fund,
Class I | | | 989 | | | | 3,694,650 | | | | 84,344 | | | | 3,611,295 | | | | 16,070,264 | | | | - | | | | - | | |
MML Equity Fund,
Initial Class | | | 502 | | | | 2,408,810 | | | | 13,474 | | | | 2,395,838 | | | | 32,700,202 | | | | - | | | | - | | |
MML Equity
Income Fund,
Initial Class | | | 1,397 | | | | 6,004,147 | | | | 35,180 | | | | 5,970,364 | | | | 40,717,880 | | | | - | | | | 355,221 | | |
MML Inflation-
Protected and
Income Fund,
Initial Class | | | 2,229 | | | | 7,130,670 | | | | 1,214,448 | | | | 5,918,451 | | | | 56,343,650 | | | | 1,927,006 | | | | - | | |
MML Managed
Bond Fund,
Initial Class | | | 1,893 | | | | 6,038,495 | | | | 1,301,953 | | | | 4,738,435 | | | | 56,770,372 | | | | 1,650,889 | | | | - | | |
MML Mid Cap
Growth Fund,
Initial Class | | | 419 | | | | 1,934,281 | | | | 10,640 | | | | 1,924,060 | | | | 12,641,077 | | | | - | | | | 138,936 | | |
MML Mid Cap
Value Fund,
Initial Class | | | 618 | | | | 2,492,702 | | | | 103,034 | | | | 2,390,286 | | | | 16,564,683 | | | | 436 | | | | - | | |
MML Small
Cap Equity Fund,
Initial Class | | | 485 | | | | 2,376,782 | | | | 17,198 | | | | 2,360,069 | | | | 13,142,058 | | | | - | | | | 528 | | |
MML Small Cap
Growth Equity
Fund, Initial Class | | | 273 | | | | 1,237,102 | | | | 7,193 | | | | 1,230,182 | | | | 12,868,431 | | | | - | | | | - | | |
Oppenheimer
Capital
Appreciation
Fund, Non-
Service Shares | | | - | | | | 478,872 | | | | - | | | | 478,872 | | | | 12,292,655 | | | | - | | | | - | | |
Oppenheimer
Global Securities
Fund, Non-
Service Shares | | | 210 | | | | 1,040,794 | | | | 5,871 | | | | 1,035,133 | | | | 20,920,047 | | | | 31,428 | | | | 138,092 | | |
Oppenheimer
International
Fund, Non-
Service Shares | | | 5,147 | | | | 24,265,961 | | | | 131,384 | | | | 24,139,724 | | | | 29,209,066 | | | | 30,537 | | | | - | | |
Oppenheimer
Strategic Bond
Fund, Non-
Service Shares | | | 2,836 | | | | 9,469,774 | | | | 976,235 | | | | 8,496,375 | | | | 38,148,725 | | | | 216,057 | | | | 49,926 | | |
| | | | | | | | | | | | | | | | | | | $ | 398,577,454 | | | $ | 3,856,353 | | | $ | 682,703 | | |
189
Notes to Financial Statements (Continued)
| | | Number of
Shares Held,
Beginning
of Period | | Purchases | | Sales | | Number of
Shares Held,
End
of Period | | Value,
End of
Period | | Dividend
Income | | Realized
Gains
Distributions | |
| Growth Allocation Fund | |
MML Blue Chip
Growth Fund,
Initial Class | | | 1,728 | | | | 10,221,992 | | | | 4,020 | | | | 10,219,700 | | | $ | 69,800,549 | | | $ | - | | | $ | - | | |
MML
Concentrated
Growth Fund,
Class I | | | 1,272 | | | | 6,119,948 | | | | 49,600 | | | | 6,071,620 | | | | 27,018,709 | | | | - | | | | - | | |
MML Equity Fund,
Initial Class | | | 628 | | | | 4,001,964 | | | | 1,570 | | | | 4,001,022 | | | | 54,608,969 | | | | - | | | | - | | |
MML Equity
Income Fund,
Initial Class | | | 1,677 | | | | 9,626,567 | | | | 51,401 | | | | 9,576,843 | | | | 65,314,072 | | | | - | | | | 657,878 | | |
MML Inflation-
Protected and
Income Fund,
Initial Class | | | 1,337 | | | | 6,080,439 | | | | 1,351,738 | | | | 4,730,038 | | | | 45,029,959 | | | | 1,779,505 | | | | - | | |
MML Managed
Bond Fund,
Initial Class | | | 1,010 | | | | 4,573,442 | | | | 1,204,115 | | | | 3,370,337 | | | | 40,379,427 | | | | 1,296,049 | | | | - | | |
MML Mid Cap
Growth Fund,
Initial Class | | | 558 | | | | 3,428,072 | | | | 1,248 | | | | 3,427,382 | | | | 22,517,900 | | | | - | | | | 285,472 | | |
MML Mid Cap
Value Fund,
Initial Class | | | 618 | | | | 3,402,443 | | | | 209,653 | | | | 3,193,408 | | | | 22,130,318 | | | | 673 | | | | - | | |
MML Small
Cap Equity Fund,
Initial Class | | | 646 | | | | 4,298,175 | | | | 93,669 | | | | 4,205,152 | | | | 23,416,409 | | | | - | | | | 1,087 | | |
MML Small Cap
Growth Equity
Fund, Initial Class | | | 273 | | | | 1,665,468 | | | | 22,107 | | | | 1,643,634 | | | | 17,193,387 | | | | - | | | | - | | |
Oppenheimer
Capital
Appreciation
Fund, Non-
Service Shares | | | - | | | | 846,394 | | | | - | | | | 846,394 | | | | 21,726,933 | | | | - | | | | - | | |
Oppenheimer
Global Securities
Fund, Non-
Service Shares | | | 252 | | | | 1,660,873 | | | | 611 | | | | 1,660,514 | | | | 33,558,979 | | | | 61,317 | | | | 269,418 | | |
Oppenheimer
International
Fund, Non-
Service Shares | | | 7,353 | | | | 46,096,215 | | | | 16,443 | | | | 46,087,125 | | | | 55,765,421 | | | | 70,890 | | | | - | | |
Oppenheimer
Strategic Bond
Fund, Non-
Service Shares | | | 2,268 | | | | 10,683,000 | | | | 1,626,164 | | | | 9,059,104 | | | | 40,675,376 | | | | 280,591 | | | | 64,838 | | |
| | | | | | | | | | | | | | | | | | | $ | 539,136,408 | | | $ | 3,489,025 | | | $ | 1,278,693 | | |
190
Notes to Financial Statements (Continued)
| | | Number of
Shares Held,
Beginning
of Period | | Purchases | | Sales | | Number of
Shares Held,
End
of Period | | Value,
End of
Period | | Dividend
Income | | Realized
Gains
Distributions | |
| Aggressive Allocation Fund | |
MML Blue Chip
Growth Fund,
Initial Class | | | 1,861 | | | | 597,531 | | | | 27,713 | | | | 571,679 | | | $ | 3,904,568 | | | $ | - | | | $ | - | | |
MML
Concentrated
Growth Fund,
Class I | | | 1,413 | | | | 413,622 | | | | 36,906 | | | | 378,129 | | | | 1,682,676 | | | | - | | | | - | | |
MML Equity Fund,
Initial Class | | | 628 | | | | 215,939 | | | | 8,513 | | | | 208,054 | | | | 2,839,685 | | | | - | | | | - | | |
MML Equity
Income Fund,
Initial Class | | | 1,677 | | | | 535,072 | | | | 37,992 | | | | 498,757 | | | | 3,401,521 | | | | - | | | | 47,179 | | |
MML Inflation-
Protected and
Income Fund,
Initial Class | | | 594 | | | | 161,504 | | | | 54,075 | | | | 108,023 | | | | 1,028,382 | | | | 60,151 | | | | - | | |
MML Managed
Bond Fund,
Initial Class | | | 379 | | | | 103,711 | | | | 38,948 | | | | 65,142 | | | | 780,449 | | | | 34,010 | | | | - | | |
MML Mid Cap
Growth Fund,
Initial Class | | | 838 | | | | 280,936 | | | | 14,351 | | | | 267,423 | | | | 1,756,967 | | | | - | | | | 31,120 | | |
MML Mid Cap
Value Fund,
Initial Class | | | 773 | | | | 243,595 | | | | 37,032 | | | | 207,336 | | | | 1,436,839 | | | | 61 | | | | - | | |
MML Small
Cap Equity Fund,
Initial Class | | | 808 | | | | 298,653 | | | | 25,472 | | | | 273,989 | | | | 1,525,710 | | | | - | | | | 98 | | |
MML Small Cap
Growth Equity
Fund, Initial Class | | | 455 | | | | 153,907 | | | | 11,788 | | | | 142,574 | | | | 1,491,412 | | | | - | | | | - | | |
Oppenheimer
Capital
Appreciation
Fund, Non-
Service Shares | | | - | | | | 44,352 | | | | - | | | | 44,352 | | | | 1,138,528 | | | | - | | | | - | | |
Oppenheimer
Global Securities
Fund, Non-
Service Shares | | | 378 | | | | 135,539 | | | | 6,202 | | | | 129,715 | | | | 2,621,547 | | | | 9,920 | | | | 43,588 | | |
Oppenheimer
International
Fund, Non-
Service Shares | | | 10,294 | | | | 3,500,937 | | | | 154,447 | | | | 3,356,784 | | | | 4,061,709 | | | | 10,703 | | | | - | | |
Oppenheimer
Strategic Bond
Fund, Non-
Service Shares | | | 851 | | | | 236,583 | | | | 62,543 | | | | 174,891 | | | | 785,261 | | | | 11,417 | | | | 2,638 | | |
| | | | | | | | | | | | | | | | | | | $ | 28,455,254 | | | $ | 126,262 | | | $ | 124,623 | | |
191
Notes to Financial Statements (Continued)
8. Indemnifications Under the Funds' organizational documents, current and former Trustees and Officers are provided with a limited indemnification against liabilities arising in connection with the performance of their duties to the Funds, and shareholders are indemnified against personal liability for obligations of the Funds. In the normal course of business, the Funds may also enter into contracts that provide general indemnifications. The Funds' maximum exposure under these arrangements is unknown as this would be dependent on future claims that may be made against the Funds. The risk of material loss from such claims is considered remote.
9. Credit Risk The Funds invest a portion of their assets, directly or indirectly, in structured securities of issuers backed by mortgage loans, credit card receivables and automotive loans. The value and related income of these securities is sensitive to changes in economic conditions, including delinquencies and/or defaults. Continuing shifts in the market's perception of credit quality on structured securities have resulted in increased volatility of market price and periods of decreased market activity that have adversely impacted the valuation of such securities.
10. New Accounting Pronouncements In March 2008, the FASB issued Statement of Financial Accounting Standards No. 161, "Disclosures about Derivative Instruments and Hedging Activities" ("SFAS 161"). SFAS 161 is effective for fiscal years and interim periods beginning after November 15, 2008. SFAS 161 requires enhanced disclosures about the Funds' use of, and accounting for, derivative instruments and the effect on the results of each Fund's operations and financial position. Management is currently evaluating the impact the adoption of SFAS 161 will have on the Funds' financial statement disclosures.
11. Proxy Voting (Unaudited) A description of the policies and procedures that each Fund's investment adviser and sub-advisers use to vote proxies relating to the Fund's portfolio securities is available, without charge, upon request, by calling 1-888-309-3539, and on the Securities and Exchange Commission's website at http://www.sec.gov.
Information regarding how the Funds voted proxies relating to portfolio securities during the most recent 12-month period ended June 30 is available, without charge, upon request, on the MassMutual website at http://www.massmutual.com and on the Securities and Exchange Commission's website at http://www.sec.gov.
12. Quarterly Reporting
(Unaudited) The Funds file their complete schedule of portfolio holdings with the SEC for the first and third quarters of each fiscal year on Form N-Q. The Funds' Forms N-Q are available on the SEC website at http://www.sec.gov. The Funds' Forms N-Q may be reviewed and copied at the SEC's Public Reference Room in Washington D.C. Information on the operation of the SEC's Public Reference Room may be obtained by calling 1-800-SEC-0330.
13. Trustees' Approval of Investment Advisory Contracts
(Unaudited) At a meeting held on August 12, 2008, the Trustees, including the Trustees who are not "interested persons" (as such term is defined in the 1940 Act) of the Trust or MassMutual (the "Independent Trustees"), approved the Advisory Agreements for three new series of the MML Series Investment Fund, consisting of two feeder funds (the American Funds Growth Fund and the American Funds International Fund) and a fund of funds (the American Funds Core Allocation Fund), each of which invests in one or more series of the American Funds Insurance Series®, which are managed by Capital Research and Management Company ("Capital Research"), subject to approval by the shareholders of each Fund of the respective Advisory Agreement. In preparation for the meeting, the Trustees requested, and MassMutual provided in advance, certain materials relevant to the consideration of the Advisory Agreements (the "Materials"). In all of their deliberations, the Trustees were advised by independent counsel.
In approving the Advisory Agreements, the Trustees considered the Materials and information discussed with representatives of MassMutual ("Management") at the meeting relating to MassMutual and the nature, scope and quality of services MassMutual would provide to the Funds. The Trustees noted the fact that since these were feeder funds and a fund of funds, Capital Research would be making investment decisions with respect to the Funds' assets, subject to MassMutual's oversight. The Trustees
192
Notes to Financial Statements (Continued)
examined MassMutual's ability to provide investment oversight, administrative and shareholders services to each Fund. The Trustees also considered the experience and qualifications of the personnel of MassMutual that would be performing, or overseeing the performance of, the services to be provided to each Fund and the needs of each Fund for administrative and shareholder services.
The Trustees considered a number of factors it believed would be relevant to the interest of the shareholders of the Funds. Such factors included: (i) the ability of MassMutual to monitor the operations and performance of Capital Guardian; (ii) the financial condition, stability and business strategy of MassMutual; (iii) the ability of MassMutual with respect to regulatory compliance and the ability to monitor compliance with the investment policies of the Funds; (iv) the profitability of MassMutual; (v) possible economies of scale; and (vi) any conditions affecting MassMutual's future provision of high quality services to the Funds.
Based on the foregoing, the Trustees determined that: (i) overall, they were satisfied with the nature, extent and quality of services expected to be provided under the Advisory Agreements, including the anticipated level of MassMutual's oversight of the Funds; (ii) MassMutual's projected levels of profitability from its relationship to the Funds were not excessive and the advisory fees payable under the Advisory Agreements and the Funds' total expenses were fair and reasonable; and (iii) the terms of the Advisory Agreements were fair and reasonable with respect to each Fund and were in the best interests of each Fund's shareholders. After carefully considering the information summarized above, the Trustees, including the Independent Trustees voting separately, unanimously voted to approve the Advisory Agreements.
Prior to the votes being taken to approve the Advisory Agreements, the Independent Trustees met separately in executive session to discuss the appropriateness of such contracts. The Independent Trustees weighed the foregoing matters in light of the advice given to them by their independent legal counsel as to the law applicable to the review of investment advisory contracts. In arriving at a decision, the Trustees, including the Independent Trustees, did not identify any single matter as all-important or controlling. The foregoing summary does not detail all of the matters considered.
The Advisory Agreements took effect on August 15, 2008.
14. Special Meeting of Shareholders (Unaudited) A Special Meeting of Shareholders of the Trust was held on August 15, 2008. Notice of the meeting, and a Proxy Statement, were distributed on or about July 14, 2008 to shareholders of record as of June 10, 2008. The results of the vote on the matters submitted to shareholders at the Special Meeting are as follows:
(1) To elect Richard H. Ayers, Allan W. Blair, Mary E. Boland, Richard W. Greene, R. Alan Hunter, Jr., Robert E. Joyal, F. William Marshall, Jr. and Elaine A. Sarsynski as Trustees for an indefinite term of office.*
| Proposal 1, | | | | Shares | | Shares For | | % | | Withhold | | % | |
| Election of Trustees: | | Richard H. Ayers | | | 392,658,693.506 | | | | 375,395,173.010 | | | | 95.603 | | | | 17,263,520.496 | | | | 4.397 | | |
|
| | Allan W. Blair | | | 392,658,693.506 | | | | 375,756,833.774 | | | | 95.696 | | | | 16,901,859.732 | | | | 4.304 | | |
|
| | Mary E. Boland | | | 392,658,693.506 | | | | 374,877,132.116 | | | | 95.471 | | | | 17,781,561.390 | | | | 4.529 | | |
|
| | Richard W. Greene | | | 392,658,693.506 | | | | 375,357,324.809 | | | | 95.594 | | | | 17,301,368.697 | | | | 4.406 | | |
|
| | R. Alan Hunter, Jr. | | | 392,658,693.506 | | | | 375,640,324.701 | | | | 95.666 | | | | 17,018,368.805 | | | | 4.334 | | |
|
| | Robert E. Joyal | | | 392,658,693.506 | | | | 375,863,032.236 | | | | 95.723 | | | | 16,795,661.270 | | | | 4.277 | | |
|
| | F. William Marshall, Jr. | | | 392,658,693.506 | | | | 375,250,843.035 | | | | 95.567 | | | | 17,407,850.471 | | | | 4.433 | | |
|
| | Elaine A. Sarsynski | | | 392,658,693.506 | | | | 375,505,430.568 | | | | 95.632 | | | | 17,153,262.938 | | | | 4.368 | | |
|
* Denotes Trust-wide proposal and voting results.
193
Notes to Financial Statements (Continued)
(2) To approve an Amendment to the Agreement and Declaration of Trust of the Trust to permit each Fund to issue additional classes of shares.
| Proposal 2: | | Shares | | Shares For | | % | | Against | | % | | Abstain | | % | |
| | | | | | | | | | | | | | | | |
| Asset Allocation Fund | | | 23,467,059.597 | | | | 21,551,185.576 | | | | 91.836 | | | | 1,236,604.216 | | | | 5.269 | | | | 679,269.805 | | | | 2.895 | | |
|
| Equity Income Fund | | | 40,416,589.667 | | | | 37,503,865.899 | | | | 92.793 | | | | 2,074,878.772 | | | | 5.134 | | | | 837,844.996 | | | | 2.073 | | |
|
| Income & Growth Fund | | | 13,259,288.423 | | | | 11,739,329.975 | | | | 88.537 | | | | 883,065.123 | | | | 6.660 | | | | 636,893.325 | | | | 4.803 | | |
|
| Growth & Income Fund | | | 25,380,577.699 | | | | 23,106,860.708 | | | | 91.042 | | | | 1,750,499.109 | | | | 6.897 | | | | 523,217.882 | | | | 2.061 | | |
|
| Blue Chip Growth Fund | | | 11,073,960.924 | | | | 10,778,554.096 | | | | 97.332 | | | | 232,934.985 | | | | 2.104 | | | | 62,471.843 | | | | 0.564 | | |
|
| Large Cap Growth Fund | | | 6,037,670.358 | | | | 5,318,359.072 | | | | 88.086 | | | | 515,223.609 | | | | 8.534 | | | | 204,087.677 | | | | 3.380 | | |
|
| Mid Cap Value Fund | | | 43,875,579.032 | | | | 40,520,403.287 | | | | 92.353 | | | | 2,515,193.333 | | | | 5.733 | | | | 839,982.412 | | | | 1.914 | | |
|
| Mid Cap Growth Fund | | | 25,578,329.048 | | | | 23,099,848.424 | | | | 90.310 | | | | 1,852,886.529 | | | | 7.244 | | | | 625,594.095 | | | | 2.446 | | |
|
| Small/Mid Cap Value Fund | | | 28,063,416.078 | | | | 25,592,540.934 | | | | 91.195 | | | | 1,851,866.401 | | | | 6.599 | | | | 619,008.743 | | | | 2.206 | | |
|
| Small Cap Index Fund | | | 5,710,504.801 | | | | 5,088,333.940 | | | | 89.105 | | | | 410,073.444 | | | | 7.181 | | | | 212,097.417 | | | | 3.714 | | |
|
| Foreign Fund | | | 29,838,823.439 | | | | 27,005,966.858 | | | | 90.506 | | | | 2,017,957.058 | | | | 6.763 | | | | 814,899.523 | | | | 2.731 | | |
|
| Conservative Allocation Fund | | | 2,933,303.904 | | | | 2,327,339.099 | | | | 79.342 | | | | 533,288.689 | | | | 18.180 | | | | 72,676.116 | | | | 2.478 | | |
|
| Balanced Allocation Fund | | | 5,922,567.952 | | | | 5,559,531.142 | | | | 93.870 | | | | 280,168.759 | | | | 4.731 | | | | 82,868.051 | | | | 1.399 | | |
|
| Moderate Allocation Fund | | | 18,083,042.665 | | | | 15,538,340.928 | | | | 85.928 | | | | 1,764,041.275 | | | | 9.755 | | | | 780,660.462 | | | | 4.317 | | |
|
| Growth Allocation Fund | | | 28,594,933.408 | | | | 26,221,225.901 | | | | 91.699 | | | | 1,885,900.832 | | | | 6.595 | | | | 487,806.675 | | | | 1.706 | | |
|
| Aggressive Allocation Fund | | | 2,504,750.163 | | | | 2,260,902.337 | | | | 90.265 | | | | 243,847.826 | | | | 9.735 | | | | 0.000 | | | | 0.000 | | |
|
(3) To approve an Amendment to the Agreement and Declaration of Trust of the Trust to allow the Board of Trustees to authorize fund mergers without shareholder approval.
| Proposal 2: | | Shares | | Shares For | | % | | Against | | % | | Abstain | | % | |
| | | | | | | | | | | | | | | | |
| Asset Allocation Fund | | | 23,467,059.597 | | | | 19,349,601.827 | | | | 82.454 | | | | 3,281,257.562 | | | | 13.983 | | | | 836,200.208 | | | | 3.563 | | |
|
| Equity Income Fund | | | 40,416,589.667 | | | | 34,677,658.513 | | | | 85.801 | | | | 4,714,212.622 | | | | 11.664 | | | | 1,024,718.532 | | | | 2.535 | | |
|
| Income & Growth Fund | | | 13,259,288.423 | | | | 10,436,197.211 | | | | 78.709 | | | | 2,078,400.695 | | | | 15.675 | | | | 744,690.517 | | | | 5.616 | | |
|
| Growth & Income Fund | | | 25,380,577.699 | | | | 20,515,316.376 | | | | 80.831 | | | | 3,980,824.451 | | | | 15.684 | | | | 884,436.872 | | | | 3.485 | | |
|
| Blue Chip Growth Fund | | | 11,073,960.924 | | | | 10,348,638.913 | | | | 93.450 | | | | 602,551.453 | | | | 5.441 | | | | 122,770.558 | | | | 1.109 | | |
|
| Large Cap Growth Fund | | | 6,037,670.358 | | | | 4,879,861.067 | | | | 80.824 | | | | 889,978.449 | | | | 14.740 | | | | 267,830.842 | | | | 4.436 | | |
|
| Concentrated Growth Fund | | | 11,554,520.815 | | | | 9,934,390.959 | | | | 86.053 | | | | 1,263,460.616 | | | | 10.944 | | | | 346,669.240 | | | | 3.003 | | |
|
| Mid Cap Value Fund | | | 43,875,579.032 | | | | 37,191,973.227 | | | | 84.767 | | | | 5,562,855.512 | | | | 12.679 | | | | 1,120,750.293 | | | | 2.554 | | |
|
| Mid Cap Growth Fund | | | 25,578,329.048 | | | | 21,375,157.861 | | | | 83.567 | | | | 3,360,180.978 | | | | 13.137 | | | | 842,990.209 | | | | 3.296 | | |
|
| Small/Mid Cap Value Fund | | | 28,063,416.078 | | | | 23,227,205.624 | | | | 82.767 | | | | 4,090,159.324 | | | | 14.575 | | | | 746,051.130 | | | | 2.658 | | |
|
| Small Cap Index Fund | | | 5,710,504.801 | | | | 4,514,104.220 | | | | 79.049 | | | | 903,110.394 | | | | 15.815 | | | | 293,290.187 | | | | 5.136 | | |
|
| Global Fund | | | 4,622,156.046 | | | | 3,842,358.528 | | | | 83.129 | | | | 655,982.095 | | | | 14.192 | | | | 123,815.423 | | | | 2.679 | | |
|
| Foreign Fund | | | 29,838,823.439 | | | | 24,464,144.125 | | | | 81.988 | | | | 4,454,838.390 | | | | 14.929 | | | | 919,840.924 | | | | 3.083 | | |
|
| Conservative Allocation Fund | | | 2,933,303.904 | | | | 2,027,741.187 | | | | 69.128 | | | | 905,562.717 | | | | 30.872 | | | | 0.000 | | | | 0.000 | | |
|
| Balanced Allocation Fund | | | 5,922,567.952 | | | | 5,104,409.256 | | | | 86.186 | | | | 792,328.224 | | | | 13.378 | | | | 25,830.472 | | | | 0.436 | | |
|
| Moderate Allocation Fund | | | 18,083,042.665 | | | | 13,469,244.074 | | | | 74.485 | | | | 3,585,911.173 | | | | 19.831 | | | | 1,027,887.418 | | | | 5.684 | | |
|
| Growth Allocation Fund | | | 28,594,933.408 | | | | 22,592,899.954 | | | | 79.010 | | | | 5,640,642.472 | | | | 19.726 | | | | 361,390.982 | | | | 1.264 | | |
|
| Aggressive Allocation Fund | | | 2,504,750.163 | | | | 1,538,218.909 | | | | 61.412 | | | | 777,916.544 | | | | 31.058 | | | | 188,614.710 | | | | 7.530 | | |
|
194
Report of Independent Registered Public Accounting Firm
To the Board of Trustees of MML Series Investment Fund and Shareholders of MML Asset Allocation Fund, MML Equity Income Fund, MML Income & Growth Fund, MML Growth & Income Fund, MML Blue Chip Growth Fund, MML Large Cap Growth Fund, MML Concentrated Growth Fund, MML Mid Cap Value Fund, MML Mid Cap Growth Fund, MML Small/Mid Cap Value Fund, MML Small Cap Index Fund, MML Global Fund, MML Foreign Fund, MML Conservative Allocation Fund, MML Balanced Allocation Fund, MML Moderate Allocation Fund, MML Growth Allocation Fund, MML Aggressive Allocation Fund, MML American Funds Core Allocation Fund, MML American Funds Growth Fund and MML American Funds International Fund:
We have audited the accompanying statements of assets and liabilities, including the portfolios of investments, of MML Asset Allocation Fund, MML Equity Income Fund, MML Income & Growth Fund, MML Growth & Income Fund, MML Blue Chip Growth Fund, MML Large Cap Growth Fund, MML Concentrated Growth Fund, MML Mid Cap Value Fund, MML Mid Cap Growth Fund, MML Small/Mid Cap Value Fund (formerly MML Small Cap Value Fund), MML Small Cap Index Fund, MML Global Fund, MML Foreign Fund, MML Conservative Allocation Fund, MML Balanced Allocation Fund, MML Moderate Allocation Fund, MML Growth Allocation Fund, MML Aggressive Allocation Fund, MML American Funds Core Allocation Fund, MML American Funds Growth Fund and MML American Funds International Fund (collectively the "Funds"), twenty-one of the funds comprising the MML Series Investment Fund (the "MML Trust"), as of December 31, 2008, and the related statements of operations for the year then ende d, the statements of changes in net assets of the two years in the period then ended, and the financial highlights for each of the two years in the period then ended and for the period from May 1, 2006 (commencement of operations) to December 31, 2006 (except for MML Conservative Allocation Fund, MML Balanced Allocation Fund, MML Moderate Allocation Fund, MML Growth Allocation Fund and MML Aggressive Allocation Fund for which the period is the year ended December 31, 2008 and from the start of business August 31, 2007 through December 31, 2007 and MML American Funds Core Allocation Fund, MML American Funds Growth Fund and MML American Funds International Fund for which the period is from the start of business August 15, 2008 through December 31, 2008). These financial statements and financial highlights are the responsibility of the MML Trust's management. Our responsibility is to express an opinion on these financial statements and financial highlights based on our audits.
We conducted our audits in accordance with the standards of the Public Company Accounting Oversight Board (United States). Those standards require that we plan and perform the audit to obtain reasonable assurance about whether the financial statements and financial highlights are free of material misstatement. The MML Trust is not required to have, nor were we engaged to perform, an audit of its internal control over financial reporting. Our audits include consideration of internal control over financial reporting as a basis for designing audit procedures that are appropriate in the circumstances, but not for the purpose of expressing an opinion of the effectiveness of the MML Trust's internal control over financial reporting. Accordingly, we express no such opinion. An audit also includes examining, on a test basis, evidence supporting the amounts and disclosures in the financial statements, assessing the accounting principles used and sign ificant estimates made by management, as well as evaluating the overall financial statement presentation. Our procedures include confirmation of securities owned as of December 31, 2008, by correspondence with the custodian and brokers; where replies were not received from brokers, we performed other auditing procedures. We believe that our audits provide a reasonable basis for our opinion.
In our opinion, the financial statements and financial highlights referred to above present fairly, in all material respects, the financial position of each of the Funds as of December 31, 2008, the results of their operations for the year then ended, the changes in their net assets for each of the two years in the period then ended, and the financial highlights for each of the two years in the period then ended and for the period from May 1, 2006 (commencement of operations) to December 31, 2006 (except for MML Conservative Allocation Fund, MML Balanced Allocation Fund, MML Moderate Allocation Fund, MML Growth Allocation Fund and MML Aggressive Allocation Fund for which the period is the year ended December 31, 2008 and from the start of business August 31, 2007 through December 31, 2007 and MML American Funds Core Allocation Fund, MML American Funds Growth Fund and MML American Funds International Fund for which the period is from the star t of business August 15, 2008 through December 31, 2008), in conformity with accounting principles generally accepted in the United States of America.

Boston, Massachusetts
February 20, 2009
195
Trustees and Officers (Unaudited)
The following table lists the Trust's Trustees and Officers as of December 31, 2008; their address and age; their position with the Trust; the length of time holding that position with the Trust; their principal occupation(s) during the past five years; the number of portfolios in the fund complex they oversee; and other directorships they hold in companies subject to registration or reporting requirements of the Securities Exchange Act of 1934 (generally called "public companies") or in registered investment companies. The Trust's Statement of Additional Information includes additional information about the Trust's Trustees and is available, without charge, upon request by calling 1-888-309-3539 or by writing MML Funds, c/o Massachusetts Mutual Life Insurance Company, 1295 State Street, Springfield, Massachusetts 01111-0001, Attention: Retirement Services Marketing.
Disinterested
Trustees
| | Name, Address*,
and Age | | Position(s)
Held with
Fund | | Term
of Office**
and
Length
of Time
Served | | Principal
Occupation(s) During
Past 5 Years | | Number of
Portfolios in
Fund
Complex
Overseen by
Trustee | | Other
Directorships
Held by Trustee | |
| | | Richard W. Greene
Age: 73 | | Chairman
Trustee | | Since
2005
Since
1999 | | Retired. | | | 57 | | | Chairman (since 2005), Trustee (since 1996), MassMutual Select Funds (open-end investment company). | |
|
| | | Richard H. Ayers
Age: 66 | | Trustee | | Since
1999 | | Retired. | | | 57 | | | Director (since 2008), Celera Corporation; Trustee (since 1996), MassMutual Select Funds (open-end investment company). | |
|
| | | Allan W. Blair
Age: 60 | | Trustee | | Since
2003 | | President and Chief Executive Officer
(since 1996), Economic Development Council of Western Massachusetts; President and Chief Executive Officer (1993-2006), Westmass Area Development Corporation; President and Chief Executive Officer
(since 1984), Westover Metropolitan Development Corporation. | | | 57 | | | Trustee (since 2003), MassMutual Select Funds (open-end investment company). | |
|
| | | Mary E. Boland
Age: 69 | | Trustee | | Since
1973 | | Attorney-at-Law
(since 2004); Attorney-at-Law (1965-2004), Egan, Flanagan and Cohen, P.C. (law firm), Springfield, MA. | | | 57 | | | Trustee (since 1994), MassMutual Select Funds (open-end investment company). | |
|
196
Trustees and Officers (Unaudited) (Continued)
| | Name, Address*,
and Age | | Position(s)
Held with
Fund | | Term
of Office**
and
Length
of Time
Served | | Principal
Occupation(s) During
Past 5 Years | | Number of
Portfolios in
Fund
Complex
Overseen by
Trustee | | Other
Directorships
Held by Trustee | |
| | | R. Alan Hunter, Jr.
Age: 62 | | Trustee | | Since
2003 | | Retired. | | | 57 | | | Director (since 2007), Actuant Corporation; Trustee (since 2003), MassMutual Select Funds (open-end investment company). | |
|
| | | F. William Marshall, Jr.
Age: 66 | | Trustee | | Since
1996 | | Consultant (since 1999). | | | 98 | *** | | Trustee (since 2000), Board II Oppenheimer Funds; Trustee
(since 1996), MassMutual Select Funds (open-end investment company). | |
|
Interested
Trustees
| | Name, Address*,
and Age | | Position(s)
Held with
Fund | | Term
of Office**
and
Length
of Time
Served | | Principal
Occupation(s) During
Past 5 Years | | Number of
Portfolios in
Fund
Complex
Overseen by
Trustee | | Other
Directorships
Held by Trustee | |
| | | Robert E. Joyal^
Age: 63 | | Trustee | | Since
2003 | | Retired; President (2001-2003), Managing Director (2000-2001) and Executive Director (1999-2000), David L. Babson & Company Inc. | | | 59 | ^^ | | Trustee (since 2003), President (1999-2003), MassMutual Corporate Investors (closed-end investment company); Director (since 2003), Pemco Aviation Group, Inc.; Trustee (since 2003), President (1999-2003), MassMutual Participation Investors (closed-end investment company); Vice Chairman (2005-2007), Trustee (since 2003), MassMutual Select Funds (open-end investment company); Director (since 2006),
Jefferies Group, Inc. (investment bank); Director (since 2007), Scottish Re. Group Ltd. | |
|
| | | Elaine A. Sarsynski^^^
Age: 53 | | Trustee | | Since
2008 | | Executive Vice President (since 2005), MassMutual; Managing Director (2005), Babson Capital Management LLC;
Chief Executive Officer (2001-2005), Town of Suffield, Connecticut. | | | 57 | | | Trustee (since 2008), MassMutual Select Funds (open-end investment company). | |
|
197
Trustees and Officers (Unaudited) (Continued)
Principal Officers
who are Not
Trustees
| | Name, Address*,
and Age | | Position(s)
Held with
Trust | | Term
of Office#
and
Length
of Time
Served | | Principal
Occupation(s) During
Past 5 Years | | Number of
Portfolios in
Fund
Complex
Overseen by
Officer | |
| | | Richard J. Byrne
Age: 46 | | President | | Since 2007 | | Vice President (since 2007), Assistant Vice President (2003-2007), MassMutual; President (since 2007), MML Series Investment Fund II (open-end investment company). | | | 37 | | |
|
| | | Nicholas H. Palmerino
Age: 43 | | Chief Financial Officer and Treasurer | | Since 2006 | | Assistant Vice President (since 2006), MassMutual; Vice President (2006), Consultant (2005-2006), JPMorgan Chase Worldwide Securities Services; Senior Vice President (2003-2004), CDC IXIS Asset Management Services, Inc. and CDC IXIS Asset Management Advisers, L.P.; Vice President (1996-2003), Loomis Sayles & Company, L.P.;
Chief Financial Officer and Treasurer (since 2006), MassMutual Select Funds (open-end investment company); Chief Financial Officer and Treasurer (since 2006), MassMutual Premier Funds (open-end investment company); Chief Financial Officer and Treasurer (since 2006), MML Series Investment
Fund II (open-end investment company). | | | 91 | | |
|
| | | Andrew M. Goldberg
Age: 42 | | Vice President, Secretary and Chief Legal Officer
Assistant Secretary | | Since 2008
(2001-
2008) | | Assistant Vice President and Counsel (since 2004), Counsel (2001-2004), MassMutual; Vice President, Secretary and Chief Legal Officer (since 2008), Assistant Secretary (2001-2008), MassMutual Select Funds (open-end investment company);
Vice President, Clerk and Chief Legal Officer
(since 2008), Assistant Clerk (2004-2008), MassMutual Premier Funds (open-end investment company); Vice President, Clerk and Chief Legal Officer (since 2008), Assistant Clerk (2005-2008), MML Series Investment Fund II (open-end investment company). | | | 91 | | |
|
| | | Philip S. Wellman
Age: 44 | | Vice President and Chief Compliance Officer | | Since 2007 | | Vice President, Compliance (since 2007), Assistant Vice President and Associate General Counsel (2006-2007), MassMutual; Director, Office of General Counsel (2005-2006), Merrill Lynch, Pierce, Fenner & Smith Incorporated; Senior Vice President and Assistant General Counsel (2000-2006), Advest, Inc.; Vice President and Chief Compliance Officer (since 2007), MassMutual Select Funds (open-end investment company); Vice President and Chief Compliance Officer (since 2007), MassMutual Premier Funds (open-end investment company);
Vice President and Chief Compliance Officer
(since 2007), MML Series Investment Fund II
(open-end investment company). | | | 91 | | |
|
| | | Stephen J. Brunette
Age: 38 | | Vice President | | Since 2007 | | Assistant Vice President (since 2007), Director (2006-2007), Investment Consultant (2003-2006), MassMutual; Vice President (since 2007), MML Series Investment Fund II (open-end investment company). | | | 37 | | |
|
198
Trustees and Officers (Unaudited) (Continued)
| | Name, Address*,
and Age | | Position(s)
Held with
Trust | | Term
of Office#
and
Length
of Time
Served | | Principal
Occupation(s) During
Past 5 Years | | Number of
Portfolios in
Fund
Complex
Overseen by
Officer | |
| | | John E. Deitelbaum
Age: 40 | | Vice President
Secretary and Chief Legal Officer | | Since 2006
(2006-2008) | | Corporate Vice President and Associate General Counsel (since 2007), Vice President and Associate General Counsel (2006-2007), Second Vice President and Associate General Counsel (2000-2006), MassMutual; Vice President (since 2006), Secretary and Chief Legal Officer (2006-2008), MassMutual Select Funds (open-end investment company); Vice President (since 2006), Clerk and Chief Legal Officer (2006-2008), MassMutual Premier Funds (open-end investment company); Vice President (since 2006), Clerk and Chief Legal Officer (2006-2008), MML Series Investment Fund II (open-end investment company). | | | 91 | | |
|
| | | Eric H. Wietsma
Age: 42 | | Vice President | | Since 2006 | | Corporate Vice President (since 2007), Vice President (2005-2007), MassMutual; Vice President (1999-2005), Hartford Life Insurance Company; President (since 2008), Vice President (2006-2008), MassMutual Select Funds (open-end investment company); President (since 2008), Vice President (2006-2008), MassMutual Premier Funds (open-end investment company); Vice President (since 2006), MML Series Investment Fund II (open-end investment company). | | | 91 | | |
|
* The address of each Trustee and Principal Officer is the same as that for the Trust; 1295 State Street, Springfield, Massachusetts 01111.
** Each Trustee of the Trust serves until the next meeting of shareholders called for the purpose of electing Trustees and until the election and qualification of his successor or until he dies, resigns or is removed. Notwithstanding the foregoing, unless the Trustees determine that it is desirable and in the best interest of the Trust that an exception to the retirement policy of the Trust be made, a Trustee shall retire and cease to serve as a Trustee upon the conclusion of the calendar year in which such Trustee attains the age of seventy-two years. However, any Trustee who attained the age of seventy-two years during 2007 shall retire and cease to serve as a Trustee on or before December 31, 2009.
The Chairperson is elected to hold such office for a term of three years or until his or her successor is elected and qualified to carry out the duties and responsibilities of his or her office, or until he or she retires, dies, resigns, is removed or becomes disqualified.
*** Board II Oppenheimer Funds is deemed to be part of the Fund Complex because it is managed by OppenheimerFunds, Inc., an indirect subsidiary of MassMutual.
^ Mr. Joyal is an "Interested Person," as that term is defined in the 1940 Act, through his position as a director of Jefferies Group, Inc., a broker-dealer that may execute portfolio transactions and/or engage in principal transactions with the Funds, other investment companies advised by MassMutual or holding themselves out to investors as related companies for purposes of investment or investor services, or any other advisory accounts over which MassMutual has brokerage placement discretion.
^^ MassMutual Participation Investors and MassMutual Corporate Investors are deemed to be a part of the Fund Complex because they are managed by Babson Capital Management LLC, an indirect subsidiary of MassMutual.
^^^ Ms. Sarsynski is an Interested Person through her employment with MassMutual.
# The President, Treasurer and Secretary are elected to hold such office until their successor is elected and qualified to carry out the duties and responsibilities of their office, or until he or she dies, resigns, is removed or becomes disqualified. Each other officer shall hold office at the pleasure of the Trustees.
199
Federal Tax Information (Unaudited)
For corporate shareholders, a portion of the ordinary dividends paid during the Fund(s)' year ended December 31, 2008 qualified for the dividends received deduction, as follows:
| Fund Name | | Dividends Received
Deduction | |
| Asset Allocation Fund | | | 24.00 | % | |
| Equity Income Fund | | | 55.00 | % | |
| Income & Growth Fund | | | 24.00 | % | |
| Mid Cap Value Fund | | | 9.00 | % | |
| Mid Cap Growth Fund | | | 27.00 | % | |
200
Other Information (Unaudited)
Fund Expenses December 31, 2008
| Expense Examples: | | The following information is in regards to expenses for the six months ended December 31, 2008:
As a shareholder of the Funds, you incur ongoing costs, including management fees, distribution and/or service (12b-1) fees and other Fund expenses. These examples are intended to help you understand your ongoing costs (in dollars) of investing in the Funds and to compare these costs with the ongoing costs of investing in other mutual funds. These examples are based on an investment of $1,000 invested for the six months ended December 31, 2008. | |
|
| Actual Expenses: | | The first four columns of the table below provide information about actual account values and actual expenses. You may use this information, together with the amount you invested, to estimate the expenses that you paid over the period. Simply divide your account value by $1,000 (for example, an $8,600 account value divided by $1,000 = 8.6), then multiply the result by the number under the heading entitled "Operating Expenses Incurred" to estimate the expenses you paid on your account during this period. | |
|
| Hypothetical Example for Comparison Purposes: | | The last two columns of the table below provide information about hypothetical account values and hypothetical expenses based on the Fund's actual expense ratio and an assumed rate of return of 5% per year before expenses, which is not the Fund's actual return. The hypothetical account values and expenses may not be used to estimate the actual ending account balance or expenses you paid for the period. You may use this information to compare the ongoing costs of investing in the Fund and other funds. To do so, compare this 5% hypothetical example with the 5% hypothetical examples that appear in the shareholder reports of the other funds.
Please note that the expenses shown in the table are meant to highlight your ongoing costs only and do not reflect any transactional costs. Therefore, the last two columns of the table are useful in comparing ongoing costs only, and will not help you determine the relative total costs of owning different funds. In addition, if these transactional costs were included, your costs would have been higher. | |
|
| | | Beginning
Value | | Annualized
Expense Ratio | | Ending Value
(Based on Actual
Returns and
Expenses) | | Operating
Expenses
Incurred* | | Ending Value
(Based on Hypothetical
Returns and
Expenses) | | Operating
Expenses
Incurred* | |
| Asset Allocation Fund | |
| Initial Class | | $ | 1,000 | | | | 0.63 | % | | $ | 773.30 | | | $ | 2.81 | | | $ | 1,022.00 | | | $ | 3.20 | | |
| Service Class** | | | 1,000 | | | | 0.90 | % | | | 769.00 | | | | 3.02 | | | | 1,015.60 | | | | 4.56 | | |
| Equity Income Fund | |
| Initial Class | | | 1,000 | | | | 0.80 | % | | | 743.40 | | | | 3.51 | | | | 1,021.10 | | | | 4.06 | | |
| Service Class** | | | 1,000 | | | | 1.06 | % | | | 720.20 | | | | 3.46 | | | | 1,015.00 | | | | 5.37 | | |
| Income & Growth Fund | |
| Initial Class | | | 1,000 | | | | 0.77 | % | | | 740.60 | | | | 3.37 | | | | 1,021.30 | | | | 3.91 | | |
| Service Class** | | | 1,000 | | | | 1.03 | % | | | 734.90 | | | | 3.39 | | | | 1,015.10 | | | | 5.22 | | |
| Growth & Income Fund | |
| Initial Class | | | 1,000 | | | | 0.58 | % | | | 693.90 | | | | 2.47 | | | | 1,022.20 | | | | 2.95 | | |
| Service Class** | | | 1,000 | | | | 0.84 | % | | | 682.20 | | | | 2.68 | | | | 1,015.80 | | | | 4.26 | | |
201
Other Information (Unaudited) (Continued)
| | | Beginning
Value | | Annualized
Expense Ratio | | Ending Value
(Based on Actual
Returns and
Expenses) | | Operating
Expenses
Incurred* | | Ending Value
(Based on Hypothetical
Returns and
Expenses) | | Operating
Expenses
Incurred* | |
| Blue Chip Growth Fund | |
| Initial Class | | $ | 1,000 | | | | 0.84 | % | | $ | 646.20 | | | $ | 3.48 | | | $ | 1,020.90 | | | $ | 4.27 | | |
| Service Class** | | | 1,000 | | | | 1.10 | % | | | 638.30 | | | | 3.42 | | | | 1,014.80 | | | | 5.57 | | |
| Large Cap Growth Fund | |
| Initial Class | | | 1,000 | | | | 0.83 | % | | | 673.00 | | | | 3.49 | | | | 1,021.00 | | | | 4.22 | | |
| Service Class** | | | 1,000 | | | | 1.13 | % | | | 679.80 | | | | 3.60 | | | | 1,014.70 | | | | 5.72 | | |
| Concentrated Growth Fund | |
| Class I | | | 1,000 | | | | 0.93 | % | | | 495.00 | | | | 3.49 | | | | 1,020.50 | | | | 4.72 | | |
| Class II | | | 1,000 | | | | 0.82 | % | | | 495.60 | | | | 3.08 | | | | 1,021.00 | | | | 4.17 | | |
| Service Class I** | | | 1,000 | | | | 1.19 | % | | | 506.80 | | | | 3.40 | | | | 1,014.50 | | | | 6.03 | | |
| Mid Cap Value Fund | |
| Initial Class | | | 1,000 | | | | 0.91 | % | | | 832.00 | | | | 4.19 | | | | 1,020.60 | | | | 4.62 | | |
| Service Class** | | | 1,000 | | | | 1.16 | % | | | 763.80 | | | | 3.89 | | | | 1,014.60 | | | | 5.87 | | |
| Mid Cap Growth Fund | |
| Initial Class | | | 1,000 | | | | 0.84 | % | | | 639.70 | | | | 3.46 | | | | 1,020.90 | | | | 4.27 | | |
| Service Class** | | | 1,000 | | | | 1.11 | % | | | 639.10 | | | | 3.45 | | | | 1,014.80 | | | | 5.62 | | |
| Small/Mid Cap Value Fund | |
| Initial Class | | | 1,000 | | | | 0.81 | % | | | 682.80 | | | | 3.43 | | | | 1,021.10 | | | | 4.12 | | |
| Service Class** | | | 1,000 | | | | 1.07 | % | | | 642.40 | | | | 3.34 | | | | 1,014.90 | | | | 5.42 | | |
| Small Cap Index Fund | |
| Initial Class | | | 1,000 | | | | 0.60 | % | | | 740.60 | | | | 2.63 | | | | 1,022.10 | | | | 3.05 | | |
| Service Class** | | | 1,000 | | | | 0.91 | % | | | 682.50 | | | | 2.91 | | | | 1,015.50 | | | | 4.61 | | |
| Global Fund | |
| Class I | | | 1,000 | | | | 0.90 | % | | | 627.50 | | | | 3.68 | | | | 1,020.60 | | | | 4.57 | | |
| Class II | | | 1,000 | | | | 0.80 | % | | | 632.90 | | | | 3.28 | | | | 1,021.10 | | | | 4.06 | | |
| Service Class I** | | | 1,000 | | | | 1.15 | % | | | 667.90 | | | | 3.64 | | | | 1,014.60 | | | | 5.82 | | |
| Foreign Fund | |
| Initial Class | | | 1,000 | | | | 0.98 | % | | | 678.40 | | | | 4.13 | | | | 1,020.20 | | | | 4.98 | | |
| Service Class** | | | 1,000 | | | | 1.25 | % | | | 710.10 | | | | 4.06 | | | | 1,014.20 | | | | 6.33 | | |
| Conservative Allocation Fund | |
| Initial Class | | | 1,000 | | | | 0.20 | % | | | 832.50 | | | | 0.92 | | | | 1,024.10 | | | | 1.02 | | |
| Service Class** | | | 1,000 | | | | 0.45 | % | | | 831.50 | | | | 1.57 | | | | 1,017.30 | | | | 2.28 | | |
| Balanced Allocation Fund | |
| Initial Class | | | 1,000 | | | | 0.20 | % | | | 790.60 | | | | 0.90 | | | | 1,024.10 | | | | 1.02 | | |
| Service Class** | | | 1,000 | | | | 0.45 | % | | | 790.60 | | | | 1.53 | | | | 1,017.30 | | | | 2.28 | | |
| Moderate Allocation Fund | |
| Initial Class | | | 1,000 | | | | 0.14 | % | | | 770.70 | | | | 0.62 | | | | 1,024.40 | | | | 0.71 | | |
| Service Class** | | | 1,000 | | | | 0.39 | % | | | 769.10 | | | | 1.31 | | | | 1,017.50 | | | | 1.98 | | |
| Growth Allocation Fund | |
| Initial Class | | | 1,000 | | | | 0.13 | % | | | 725.50 | | | | 0.56 | | | | 1,024.50 | | | | 0.66 | | |
| Service Class** | | | 1,000 | | | | 0.39 | % | | | 723.90 | | | | 1.28 | | | | 1,017.50 | | | | 1.98 | | |
202
Other Information (Unaudited) (Continued)
| | | Beginning
Value | | Annualized
Expense Ratio | | Ending Value
(Based on Actual
Returns and
Expenses) | | Operating
Expenses
Incurred* | | Ending Value
(Based on Hypothetical
Returns and
Expenses) | | Operating
Expenses
Incurred* | |
| Aggressive Allocation Fund | |
| Initial Class | | $ | 1,000 | | | | 0.20 | % | | $ | 687.20 | | | $ | 0.85 | | | $ | 1,024.10 | | | $ | 1.02 | | |
| Service Class** | | | 1,000 | | | | 0.45 | % | | | 683.80 | | | | 1.44 | | | | 1,017.30 | | | | 2.28 | | |
American Funds Core
Allocation Fund | |
| Service Class I** | | | 1,000 | | | | 0.75 | % | | | 775.00 | | | | 2.53 | | | | 1,016.10 | | | | 3.80 | | |
| American Funds Growth Fund | |
| Service Class I** | | | 1,000 | | | | 0.70 | % | | | 636.00 | | | | 2.17 | | | | 1,016.30 | | | | 3.55 | | |
American Funds
International Fund | |
| Service Class I** | | | 1,000 | | | | 0.70 | % | | | 692.00 | | | | 2.25 | | | | 1,016.30 | | | | 3.55 | | |
* Expenses are calculated using the annualized expense ratio for the six months ended December 31, 2008, multiplied by the average account value over the period, multiplied by the number of days in the period, divided by the number of days in the year, unless stated otherwise.
** Actual expenses are calculated using the annualized expense ratio, multiplied by the average account value over the period from inception of the Fund/Class on August 15, 2008, through December 31, 2008, multiplied by the number of days in the inception period and divided by the number of days in the year. Hypothetical expenses are calculated using the annualized expense ratio, multiplied by the average account value for the six months ended December 31, 2008, multiplied by the number of days in the six month period and divided by the number of days in the year.
203
Distributor
MML Distributors, LLC
1295 State Street
Springfield, MA 01111-0001

© 2009 Massachusetts Mutual Life Insurance Company, Springfield, MA. All rights reserved. www.massmutual.com. MassMutual Financial Group is a marketing name for Massachusetts Mutual Life Insurance Company (MassMutual) and its affiliated companies and sales representatives.
L4540a 209 RI01828
Item 2. Code of Ethics.
As of December 31, 2008, the Registrant adopted a Code of Ethics that applies to the Principal Executive Officer and Principal Financial Officer pursuant to the Sarbanes-Oxley Act of 2002. For the year ended December 31, 2008, there were no reportable amendments to a provision of the Code of Ethics. A copy of its Code of Ethics is filed with this Form N-CSR under Item 12(a)(1).
Item 3. Audit Committee Financial Expert.
The Registrant’s Board of Trustees has determined that Richard H. Ayers and R. Alan Hunter, Jr., both members of the Audit Committee, are audit committee financial experts as defined by the Securities and Exchange Commission (the “SEC”). Mr. Ayers and Mr. Hunter are both “independent” as defined by the SEC for purposes of audit committee financial expert determinations.
Item 4. Principal Accountant Fees and Services.
(a) AUDIT FEES: The aggregate fees billed to the Registrant for professional services rendered by its independent auditors, Deloitte & Touche LLP, for the audit of the Registrant’s annual financial statements for 2008 and 2007 were $640,253 and $495,500, respectively.
(b) AUDIT RELATED FEES: No such fees were billed to the Registrant by Deloitte & Touche LLP for 2008 and 2007.
(c) TAX FEES: The aggregate fees billed to the Registrant for professional services rendered by Deloitte & Touche LLP for the review of Form 1120-RIC, Form 8613, excise distribution projections, distribution calculation and reasonable out of pocket expenses for 2008 and 2007 were $38,400 and $130,750, respectively.
(d) ALL OTHER FEES: No such fees were billed to the Registrant by Deloitte & Touche LLP for 2008 and 2007.
(e) (1) AUDIT COMMITTEE PRE-APPOVAL POLICY: All services to be performed for the Registrant by Deloitte & Touche LLP must be pre-approved by the audit committee. All services performed during 2008 and 2007 were pre-approved by the committee.
(2) Not applicable.
(f) Not applicable.
(g) The aggregate non-audit fees billed by Deloitte & Touche LLP for services rendered to the Registrant, and the Registrant’s adviser, for the fiscal years 2008 and 2007 were $217,019 and $240,750, respectively.
(h) The audit committee considers whether the provision of non-audit services to the Registrant’s adviser by Deloitte & Touche LLP that were not pre-approved pursuant to paragraph (c)(7)(ii) of Rule 2-01 of Regulation S-X is compatible with maintaining Deloitte & Touche LLP’s independence.
Item 5. Audit Committee of Listed Registrants.
Not applicable to this filing.
Item 6. Investments.
Not applicable to this filing.
Item 7. Disclosure of Proxy Voting Policies and Procedures for Closed-End Management Investment Companies.
Not applicable to this filing.
Item 8. Portfolio Managers of Closed-End Management Investment Companies.
Not applicable to this filing.
Item 9. Purchases of Equity Securities by Closed-End Management Investment Company and Affiliated Purchasers.
Not applicable to this filing.
Item 10. Submission of Matters to a Vote of Security Holders.
Not applicable to this filing.
Item 11. Controls and Procedures.
(a) The Registrant’s Principal Executive Officer and Principal Financial Officer have concluded that the Registrant’s disclosure controls and procedures (as defined in Rule 30a-3(c) under the Investment Company Act of 1940, as amended (the “1940 Act”) (17 CFR 270.30a-3(c))) are effective, as of a date within 90 days of the filing date of this Form N-CSR, to provide reasonable assurance that the information required to be disclosed by the Registrant on Form N-CSR is recorded, processed, summarized, and reported within the time periods specified in the SEC’s rules and forms, based on their evaluation of these disclosure controls and procedures required by Rule 30a-3(b) under the 1940 Act (17 CFR 270.30a-3(b)) and Rules 13a-15(b) or 15d-15(b) under the Securities Exchange Act of 1934 (17 CFR 240.13a-15(b) or 240.15d-15(b)).
(b) There were no changes in the Registrant’s internal control over financial reporting (as defined in Rule 30a-3(d) under the 1940 Act (17 CFR 270.30a-3(d))) that occurred during the Registrant’s most recent fiscal quarter that has materially affected, or is reasonably likely to materially affect, the Registrant’s internal control over financial reporting.
Item 12. Exhibits.
(a)(1) Code of Ethics (Item 2) is attached.
(a)(2) Certifications of the Principal Executive Officer and Principal Financial Officer of the Registrant as required by Rule 30a-2(a) under the 1940 Act (17 CFR 270.30a-2(a)) are attached hereto as Exhibit 99CERT.
(a)(3) Not applicable to this filing.
(b) Certifications pursuant to Section 906 of the Sarbanes-Oxley Act of 2002 as required by Rule 30a-2(b), under the 1940 Act (17 CFR 270.30a-2(b)), Rule 15d-14(b) under the Securities Exchange Act of 1934 (17 CFR 240.15d-14(b)) and Section 1350 of Chapter 63 of Title 18 of the United States Code (18 U.S.C. 1350) are attached hereto as Exhibit 99.906CERT.
SIGNATURES
Pursuant to the requirements of the Securities Exchange Act of 1934 and the Investment Company Act of 1940, the registrant has duly caused this report to be signed on its behalf by the undersigned, thereunto duly authorized.
(Registrant) | MML Series Investment Fund |
|
By (Signature and Title) | /s/ Richard J. Byrne |
| Richard J. Byrne, President and Principal Executive Officer |
|
Date | 2/20/09 | |
| | | | |
Pursuant to the requirements of the Securities Exchange Act of 1934 and the Investment Company Act of 1940, this report has been signed below by the following persons on behalf of the registrant and in the capacities and on the dates indicated.
By (Signature and Title) | /s/ Richard J. Byrne |
| Richard J. Byrne, President and Principal Executive Officer |
|
|
Date | 2/20/09 | |
|
By (Signature and Title) | /s/ Nicholas H. Palmerino |
| Nicholas H. Palmerino, Treasurer and Principal Financial Officer |
|
|
Date | 2/20/09 | |
| | | |