UNITED STATES
SECURITIES AND EXCHANGE COMMISSION
Washington, D.C. 20549
FORM N-CSR
CERTIFIED SHAREHOLDER REPORT OF REGISTERED MANAGEMENT INVESTMENT COMPANIES
| | |
Investment Company Act file number: | | 811-02619 |
| |
Exact name of registrant as specified in charter: | | MoneyMart Assets, Inc. |
| |
Address of principal executive offices: | | Gateway Center 3, |
| | | 100 Mulberry Street, |
| | | Newark, New Jersey 07102 |
| |
Name and address of agent for service: | | Deborah A. Docs |
| | | Gateway Center 3, |
| | | 100 Mulberry Street, |
| | | Newark, New Jersey 07102 |
| |
Registrant’s telephone number, including area code: | | 800-225-1852 |
| |
Date of fiscal year end: | | 12/31/2006 |
| |
Date of reporting period: | | 12/31/2006 |
Item 1—Reports to Stockholders—[INSERT REPORT]
ANNUAL REPORT
DECEMBER 31, 2006
MONEYMART ASSETS, INC.
FUND TYPE
Money market
OBJECTIVE
Maximum current income consistent with stability of capital and the maintenance of liquidity
This report is not authorized for distribution to prospective investors unless preceded or accompanied by a current prospectus.
The views expressed in this report and information about the Fund’s portfolio holdings are for the period covered by this report and are subject to change thereafter.
February 16, 2007
Dear Shareholder:
We hope you find the annual report for MoneyMart Assets informative and useful. As a MoneyMart Assets shareholder, you may be thinking about where you can find additional growth opportunities. You could invest in last year’s top-performing asset class and hope history repeats itself or you could stay in cash while waiting for the “right moment” to invest.
Instead, we believe it is better to take advantage of developing domestic and global investment opportunities through a diversified portfolio of stock and bond mutual funds. A diversified asset allocation offers two potential advantages. It helps you manage downside risk by not being overly exposed to any particular asset class, plus it gives you a better opportunity to have at least some of your assets in the right place at the right time. Your financial professional can help you create a diversified investment plan that may include mutual funds covering all the basic asset classes and that reflects your personal investor profile and tolerance for risk.
Thank you for choosing MoneyMart Assets.
Sincerely,

Judy A. Rice, President
MoneyMart Assets, Inc.
Your Fund’s Performance
Fund objective
The investment objective of MoneyMart Assets, Inc. is to seek maximum current income consistent with stability of capital and the maintenance of liquidity. There can be no assurance that the Fund will achieve its investment objective.
The Fund is a diversified portfolio of high-quality, U.S. dollar-denominated money market securities issued by the U.S. government, its agencies and instrumentalities, and major corporations and commercial banks in the United States and foreign countries. Maturities can range from one day to 13 months. We generally only purchase securities rated in one of the two highest short-term rating categories or one of the three highest long-term rating categories by at least two major rating agencies, or, if not rated, deemed to be of equivalent quality by our investment subadviser.
Yields will fluctuate from time to time, and past performance does not guarantee future results. Current performance may be lower or higher than the past performance data quoted. The investment return and principal value will fluctuate, and shares, when sold, may be worth more or less than the original cost. For the most recent month-end performance update, call (800) 225-1852.
| | | | | | | | | | | |
| Fund Facts as of 12/31/06 | | | | | | | | | |
| | | 7-Day
Current Yield | | | Net Asset
Value (NAV) | | Weighted Avg.
Maturity (WAM) | | Net Assets
(Millions) |
Class A | | 5.24 | % | | $ | 1.00 | | 44 Days | | $ | 652.4 |
Class B* | | 5.36 | % | | $ | 1.00 | | 44 Days | | $ | 71.0 |
Class C* | | 5.36 | % | | $ | 1.00 | | 44 Days | | $ | 12.4 |
Class Z* | | 5.36 | % | | $ | 1.00 | | 44 Days | | $ | 150.1 |
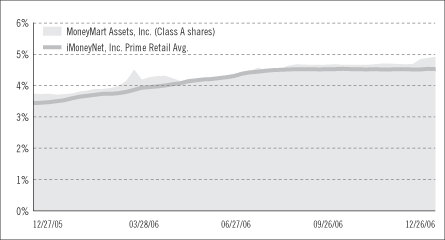
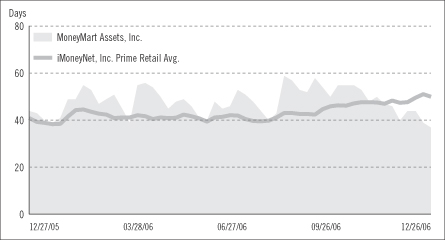
iMoneyNet, Inc. Prime Retail Avg.** | | 4.54 | % | | | N/A | | 50 Days | | | N/A |
* Class B, Class C, and Class Z shares are not subject to distribution and service (12b-1) fees.
** iMoneyNet, Inc. regularly reports a 7-day current yield and WAM on Tuesdays. This is based on the data of all funds in the iMoneyNet, Inc. Prime Retail Average category as of December 26, 2006, the closest reported date prior to the end of our reporting period.
An investment in the Fund is not insured or guaranteed by the Federal Deposit Insurance Corporation or any other government agency. Although the Fund seeks to preserve the value of your investment at $1 per share, it is possible to lose money by investing in the Fund.
| | |
| 2 | | Visit our website at www.jennisondryden.com |
Money Market Fund Yield Comparison
Weighted Average Maturity Comparison
Yields will fluctuate from time to time, and past performance does not guarantee future results. Current performance may be lower or higher than the past performance data quoted. The investment return and principal value will fluctuate, and shares, when sold, may be worth more or less than the original cost. For the most recent month-end performance update, call (800) 225-1852.
The graphs portray weekly 7-day current yields and weekly WAMs for MoneyMart Assets, Inc. (Class A shares—yields only) and the iMoneyNet, Inc. Prime Retail Average every Tuesday from December 27, 2005 to December 26, 2006, the closest dates to the beginning and end of the Fund’s reporting period. Note: iMoneyNet, Inc. regularly reports a 7-day current yield and WAM on Tuesdays. As a result, the data portrayed for the Fund at the end of the reporting period in the graphs may not match the data portrayed in the Fund Facts table as of December 31, 2006.
An investment in the Fund is not insured or guaranteed by the Federal Deposit Insurance Corporation or any other government agency. Although the Fund seeks to preserve the value of your investment at $1 per share, it is possible to lose money by investing in the Fund.
Investment Subadviser’s Report
Prudential Investment Management, Inc.
Campaign to tighten U.S. monetary policy halted in 2006
Among the most influential developments in the money markets during 2006 was the decision by the Federal Reserve (the Fed) to leave short-term interest rates unchanged in the second half of the year after repeatedly increasing them in the first half. In this changing investment environment, the Fund provided competitive yields and ample liquidity to help shareholders meet their financial needs. The Fund’s net asset value also remained at $1.00 per share.
Fed policymakers, hoping to slow economic growth enough to tame inflation without triggering a recession, increased the target for the federal funds rate on overnight loans between banks 17 times in increments of a quarter percentage point from June 2004 to June 2006. This pushed the rate from 1.00% to 5.25%. The last four rate hikes occurred in the first half of 2006. During these months, the timing of Fed policymakers’ regularly scheduled meetings, which occur roughly every six weeks, remained a focal point of our investment strategy. We primarily purchased short-term debt securities that matured around the time of the next meeting and reinvested their proceeds in higher yielding money market securities that became available after the Fed tightened monetary policy.
Shifting our strategy as Fed left rates on hold
Economic growth began to slow in the spring of 2006, particularly as higher interest rates began to take a toll on the housing sector. The economy continued to lose steam in the second half of the year, allowing Fed policymakers to leave short-term rates unchanged from July through December. With the end of the trend toward higher rates, our strategy shifted to take advantage of the changing investment opportunities. We purchased federal agency securities scheduled to mature in one year that could be retired (or called) by their respective issuers in either one, three, or six months. They offered attractive yields to compensate investors for the risk that the securities might be retired ahead of schedule.
Attractive investment opportunities often emerge at the end of a quarter and the end of a year due to the normal business practices of professional money managers, corporations, and brokerage firms involved in the money markets. By timing our term purchases to take advantage of these seasonal liquidity needs, the Fund was often able to buy securities at higher yields than would have been available otherwise. Our strategy reduced the Fund’s average maturity until, by the end of 2006, it was shorter than that of the average comparable portfolio. Positioning the Fund in this way enhanced its flexibility, which may help it respond more readily to developments that affect the money markets in 2007.
| | |
| 4 | | Visit our website at www.jennisondryden.com |
Finding good value in adjustable-rate money market securities
Throughout 2006, we maintained a large exposure to adjustable-rate money market securities that reset periodically based on formulas tied to either the one- or three-month London Interbank Offered Rates (LIBOR). Such securities were in great demand because their interest rates reset to higher levels as short-term rates rose. However, even after the Fed stopped tightening monetary policy and because some market participants expected the Fed to cut rates in 2007, three-month LIBOR was often the highest-yielding sector of the money market yield curve. Therefore, adjustable-rate securities based on three-month LIBOR remained a very attractive investment opportunity.
Fees and Expenses (Unaudited)
As a shareholder of the Fund, you incur two types of costs: (1) transaction costs, including sales charges (loads) on purchase payments and redemptions, as applicable, and (2) ongoing costs, including management fees, distribution and/or service (12b-1) fees, and other Fund expenses, as applicable. This example is intended to help you understand your ongoing costs (in dollars) of investing in the Fund and to compare these costs with the ongoing costs of investing in other mutual funds.
The example is based on an investment of $1,000 invested on July 1, 2006, at the beginning of the period, and held through the six-month period ended December 31, 2006.
The Fund’s transfer agent may charge additional fees to holders of certain accounts that are not included in the expenses shown in the table on the following page. These fees apply to Individual Retirement Accounts (IRAs) and Section 403(b) accounts. As of the close of the six-month period covered by the table, IRA fees included an annual maintenance fee of $15 per account (subject to a maximum annual maintenance fee of $25 for all accounts held by the same shareholder). Section 403(b) accounts are charged an annual $25 fiduciary maintenance fee. Some of the fees may vary in amount, or may be waived, based on your total account balance or the number of JennisonDryden or Strategic Partners Funds, including the Fund, that you own. You should consider the additional fees that were charged to your Fund account over the six-month period when you estimate the total ongoing expenses paid over the period and the impact of these fees on your ending account value, as these additional expenses are not reflected in the information provided in the expense table. Additional fees have the effect of reducing investment returns.
Actual Expenses
The first line for each share class in the table on the following page provides information about actual account values and actual expenses. You may use the information on this line, together with the amount you invested, to estimate the expenses that you paid over the period. Simply divide your account value by $1,000 (for example, an $8,600 account value ÷ $1,000 = 8.6), then multiply the result by the number on the first line under the heading “Expenses Paid During the Six-Month Period” to estimate the expenses you paid on your account during this period.
Hypothetical Example for Comparison Purposes
The second line for each share class in the table on the following page provides information about hypothetical account values and hypothetical expenses based on the Fund’s actual expense ratio and an assumed rate of return of 5% per year before
| | |
| 6 | | Visit our website at www.jennisondryden.com |
expenses, which is not the Fund’s actual return. The hypothetical account values and expenses may not be used to estimate the actual ending account balance or expenses you paid for the period. You may use this information to compare the ongoing costs of investing in the Fund and other funds. To do so, compare this 5% hypothetical example with the 5% hypothetical examples that appear in the shareholder reports of the other funds.
Please note that the expenses shown in the table are meant to highlight your ongoing costs only, and do not reflect any transactional costs such as sales charges (loads). Therefore the second line for each share class in the table is useful in comparing ongoing costs only, and will not help you determine the relative total costs of owning different funds. In addition, if these transactional costs were included, your costs would have been higher.
| | | | | | | | | | | | | | |
MoneyMart
Assets, Inc. | | Beginning Account
Value
July 1, 2006 | | Ending Account
Value December 31, 2006 | | Annualized
Expense Ratio
Based on the
Six-Month Period | | | Expenses Paid
During the
Six-Month
Period* |
| | | | | | | | | | | | | | | |
| Class A | | Actual | | $ | 1,000.00 | | $ | 1,024.40 | | 0.69 | % | | $ | 3.52 |
| | | Hypothetical | | $ | 1,000.00 | | $ | 1,021.73 | | 0.69 | % | | $ | 3.52 |
| | | | | | | | | | | | | | | |
| Class B | | Actual | | $ | 1,000.00 | | $ | 1,025.10 | | 0.56 | % | | $ | 2.86 |
| | | Hypothetical | | $ | 1,000.00 | | $ | 1,022.38 | | 0.56 | % | | $ | 2.85 |
| | | | | | | | | | | | | | | |
| Class C | | Actual | | $ | 1,000.00 | | $ | 1,025.10 | | 0.56 | % | | $ | 2.86 |
| | | Hypothetical | | $ | 1,000.00 | | $ | 1,022.38 | | 0.56 | % | | $ | 2.85 |
| | | | | | | | | | | | | | | |
| Class Z | | Actual | | $ | 1,000.00 | | $ | 1,025.10 | | 0.56 | % | | $ | 2.86 |
| | | Hypothetical | | $ | 1,000.00 | | $ | 1,022.38 | | 0.56 | % | | $ | 2.85 |
| | | | | | | | | | | | | | | |
* Fund expenses (net of fee waivers or subsidies, if any) for each share class are equal to the annualized expense ratio for each share class (provided in the table), multiplied by the average account value over the period, multiplied by the 181 days in the six-month period ended December 31, 2006, and divided by the 365 days in the Fund’s fiscal year ended December 31, 2006 (to reflect the six-month period).
Schedule of Investments
as of December 31, 2006
| | | | | | |
Principal
Amount (000) | | Description | | Value (Note 1) |
| | | | | | |
|
| | Certificates of Deposit 7.7% |
| $ | 25,000 | | Australia and New Zealand Banking Group Ltd.
4.81%, 1/29/07 | | $ | 24,999,629 |
| | 3,900 | | Barclays Bank PLC
5.44%, 6/4/07 | | | 3,899,205 |
| | 7,200 | | 5.705%, 6/28/07 | | | 7,207,972 |
| | 20,000 | | HBOS Treasury Services PLC
5.165%, 3/14/07 | | | 20,000,000 |
| | 12,000 | | Nordea Bank AB
5.70%, 6/28/07 144A | | | 12,000,000 |
| | | | | | |
| | | | | | 68,106,806 |
| | | | | | |
|
| | Commercial Paper 30.1% |
| | 20,000 | | Amsterdam Funding Corp.
5.26%, 2/2/07(a) 144A | | | 19,906,489 |
| | 10,000 | | 5.30%, 2/8/07(a) 144A | | | 9,944,056 |
| | 8,500 | | Bank of America Corp.
5.24%, 3/1/07(a) | | | 8,427,004 |
| | 2,300 | | 5.25%, 3/9/07(a) | | | 2,277,527 |
| | 10,800 | | 5.26%, 3/19/07(a) | | | 10,678,494 |
| | 6,900 | | 5.26%, 3/20/07(a) | | | 6,821,363 |
| | 14,887 | | 5.25%, 4/2/07(a) | | | 14,689,437 |
| | 20,452 | | Barton Capital Corp.
5.28%, 1/17/07(a) 144A | | | 20,404,006 |
| | 1,887 | | BASF AG(a)
5.26%, 1/29/07 144A | | | 1,879,280 |
| | 10,010 | | Bryant Park Funding
5.26%, 3/15/07(a) 144A | | | 9,903,232 |
| | 3,819 | | Ciesco LP
5.26%, 1/19/07(a) 144A | | | 3,808,956 |
| | 29,995 | | Citigroup Funding Inc.
5.29%, 2/20/07(a) | | | 29,774,619 |
| | 15,000 | | Countrywide Financial Corp.
5.32%, 2/2/07(a) | | | 14,929,067 |
| | 10,000 | | Falcon Asset Security Corp.
5.29%, 1/29/07(a) 144A | | | 9,958,856 |
| | 10,862 | | 5.31%, 2/7/07(a) 144A | | | 10,802,721 |
| | 5,000 | | Hewlett-Packard Co.
5.32%, 1/31/07(a) 144A | | | 4,977,833 |
| | 11,200 | | ING (US) Funding LLC
5.25%, 3/29/07(a) | | | 11,057,900 |
See Notes to Financial Statements.
Schedule of Investments
as of December 31, 2006 Cont’d.
| | | | | | |
Principal
Amount (000) | | Description | | Value (Note 1) |
| | | | | | |
| $ | 13,000 | | Kredietbank NA
5.24%, 3/1/07(a) 144A | | $ | 12,888,359 |
| | 5,637 | | Norddeutsche LandesBank
5.27%, 1/16/07(a) | | | 5,624,634 |
| | 27,000 | | Nyala Funding LLC
5.27%, 2/15/07(a) 144A | | | 26,822,137 |
| | 18,218 | | PB Finance, Inc. (Delaware)
5.28%, 1/31/07(a) 144A | | | 18,137,841 |
| | 13,000 | | Societe Generale NA
5.24%, 3/1/07(a) | | | 12,888,359 |
| | | | | | |
| | | | | | 266,602,170 |
| | | | | | |
|
| | Loan Participation 1.2% |
| | 5,000 | | Cargill Global Fund PLC
5.34%, 1/18/07 | | | 5,000,000 |
| | 5,114 | | Cargill, Inc.
5.34%, 1/12/07 | | | 5,114,000 |
| | | | | | |
| | | | | | 10,114,000 |
| | | | | | |
|
| | Other Corporate Obligations 52.8% |
| | 43,000 | | American Express Credit Corp. MTN
5.45%, 1/4/08(b) | | | 43,000,000 |
| | 6,000 | | Depfa Bank PLC
5.40%, 12/14/07(b) | | | 6,000,152 |
| | 5,000 | | General Electric Capital Corp. MTN
5.475%, 10/17/07(b) | | | 5,000,000 |
| | 30,000 | | Goldman Sachs Group, Inc. MTN
5.4637%, 3/30/07 | | | 30,007,845 |
| | 10,000 | | HSBC Finance Corp. MTN
5.34%, 1/4/08(b) | | | 10,000,000 |
| | 30,000 | | HSBC USA, Inc. MTN
5.35%, 1/15/08(b) | | | 30,000,000 |
| | 40,000 | | Irish Life & Permanent PLC MTN
5.39%, 1/22/08 144A | | | 39,999,097 |
| | 15,000 | | JP Morgan Chase & Co. MTN
5.32%, 1/2/08 | | | 15,000,000 |
| | 43,000 | | Merrill Lynch & Co., Inc. MTN
5.60%, 7/11/07(b) | | | 43,000,000 |
| | 14,000 | | Metropolitan Life Insurance Co.
(cost $14,000,000; purchased 10/2/06)
5.4094%, 4/2/07(b)(c) | | | 14,000,000 |
See Notes to Financial Statements.
| | |
| 10 | | Visit our website at www.jennisondryden.com |
| | | | | | |
Principal
Amount (000) | | Description | | Value (Note 1) |
| | | | | | |
| $ | 38,800 | | Morgan Stanley Dean Witter Co. MTN
5.37%, 1/3/08(b) | | $ | 38,800,000 |
| | 25,000 | | National City Bank Cleveland
5.01%, 2/14/07 | | | 25,000,000 |
| | 30,000 | | Nationwide Building Society
5.4425%, 1/23/08(b) 144A | | | 30,012,036 |
| | 30,000 | | Nordea Bank AB 144A
5.36%, 1/11/08(b) | | | 30,000,000 |
| | 1,000 | | Pacific Life Insurance Co.
(cost $1,000,000; purchased 6/15/06)
5.4806%, 7/13/07(b)(c) | | | 1,000,000 |
| | 40,000 | | Skandinaviska Enskilda Banken AB
5.35%, 1/16/08(b) 144A | | | 40,000,000 |
| | 35,000 | | Wells Fargo & Co.
5.34%, 1/3/08(b) | | | 35,000,000 |
| | 32,000 | | Westpac Banking Corp. MTN
5.3931%, 1/11/08(b) | | | 32,000,000 |
| | | | | | |
| | | | | | 467,819,130 |
| | | | | | |
|
| | U.S. Government Agency Obligations 2.8% |
| | 25,000 | | Federal Home Loan Bank
5.555%, 8/15/07 | | | 25,000,000 |
| | | | | | |
|
| | Municipal Bonds 3.7% |
| | 3,200 | | Fulton County Development Authority
5.40%, 3/1/26(d) | | | 3,200,000 |
| | 10,000 | | Los Angeles Department of Water & Power
5.37%, 7/1/25(d) | | | 10,000,000 |
| | 20,000 | | North Texas Higher Education Authority
5.35%, 12/1/45(d) | | | 20,000,000 |
| | | | | | |
| | | | | | 33,200,000 |
| | | | | | |
| | | Total Investments 98.3%
(amortized cost $870,842,106)(e) | | | 870,842,106 |
| | | Other assets in excess of liabilities 1.7% | | | 15,050,677 |
| | | | | | |
| | | Net Assets 100% | | $ | 885,892,783 |
| | | | | | |
MTN—Medium Term Note.
144A—Security was purchased pursuant to Rule 144A under the Securities Act of 1933 and may not be resold subject to that rule except to qualified institutional buyers. Unless otherwise noted, 144A securities are deemed to be liquid.
| (a) | Rate quoted represents yield-to-maturity as of purchase date. |
See Notes to Financial Statements.
| | |
| MoneyMart Assets, Inc. | | 11 |
Schedule of Investments
as of December 31, 2006 Cont’d.
| (b) | Floating Rate Security. The interest rate shown reflects the rate in effect at December 31, 2006. |
| (c) | Indicates a restricted security and has been deemed illiquid. The aggregate cost and value of restricted securities is $15,000,000 and represents 1.7% of net assets. |
| (d) | Variable rate instrument. The maturity date presented for these instruments is the later of the next date on which the security can be redeemed at par or the next date on which the rate of interest is adjusted. |
| (e) | The cost of securities for federal income tax purposes is substantially the same as for financial reporting purposes. |
The industry classification of portfolio holdings and other assets in excess of other liabilities shown as a percentage of net assets as of December 31, 2006 was as follows:
| | | |
Foreign Banks | | 34.5 | % |
Asset Backed Securities | | 20.6 | |
Commercial Banks | | 13.8 | |
Security Brokers & Dealers | | 12.6 | |
Non-Captive Finance | | 8.6 | |
Municipality | | 3.7 | |
Federal Credit Agencies | | 2.8 | |
Life Insurance | | 1.7 | |
| | | |
| | 98.3 | |
Other assets in excess of liabilities | | 1.7 | |
| | | |
| | 100.0 | % |
| | | |
See Notes to Financial Statements.
| | |
| 12 | | Visit our website at www.jennisondryden.com |
Statement of Assets and Liabilities
as of December 31, 2006
| | | |
Assets | | | |
Investments, at amortized cost which approximates market value | | $ | 870,842,106 |
Receivable for Fund shares sold | | | 19,875,505 |
Interest receivable | | | 5,772,412 |
Prepaid expenses | | | 16,369 |
| | | |
Total assets | | | 896,506,392 |
| | | |
| |
Liabilities | | | |
Payable for Fund shares reacquired | | | 7,858,176 |
Accrued expenses | | | 2,193,248 |
Management fee payable | | | 229,596 |
Payable to custodian | | | 149,621 |
Transfer agent fee payable | | | 81,191 |
Distribution fee payable | | | 66,990 |
Dividends payable | | | 29,851 |
Deferred directors’ fees | | | 4,936 |
| | | |
Total liabilities | | | 10,613,609 |
| | | |
| |
Net Assets | | $ | 885,892,783 |
| | | |
| | | | |
Net assets were comprised of: | | | |
Common stock, at par ($.001 par value; 20 billion shares authorized for issuance) | | $ | 885,893 |
Paid-in capital in excess of par | | | 885,006,890 |
| | | |
Net assets, December 31, 2006 | | $ | 885,892,783 |
| | | |
| |
Class A | | | |
Net asset value, offering price and redemption price per share
($652,402,809 ÷ 652,402,809 shares of common stock issued and outstanding) | | | $1.00 |
| | | |
| |
Class B | | | |
Net asset value, offering price and redemption price per share
($70,961,733 ÷ 70,961,733 shares of common stock issued and outstanding) | | | $1.00 |
| | | |
| |
Class C | | | |
Net asset value, offering price and redemption price per share
($12,372,556 ÷ 12,372,556 shares of common stock issued and outstanding) | | | $1.00 |
| | | |
| |
Class Z | | | |
Net asset value, offering price and redemption price per share
($150,155,685 ÷ 150,155,685 shares of common stock issued and outstanding) | | | $1.00 |
| | | |
See Notes to Financial Statements.
| | |
| MoneyMart Assets, Inc. | | 13 |
Statement of Operations
Year Ended December 31, 2006
| | | |
Net Investment Income | | | |
Income | | | |
Interest | | $ | 46,430,194 |
| | | |
| |
Expenses | | | |
Management fee | | | 2,860,861 |
Distribution fee—Class A | | | 814,316 |
Transfer agent's fees and expenses (including affiliated expense of $1,117,000) | | | 1,785,000 |
Reports to shareholders | | | 188,000 |
Custodian’s fees and expenses | | | 92,000 |
Legal fees and expenses | | | 45,000 |
Insurance | | | 33,000 |
Registration fees | | | 25,000 |
Directors’ fees | | | 20,000 |
Audit fee | | | 16,000 |
Miscellaneous | | | 43,837 |
| | | |
Total expenses | | | 5,923,014 |
| | | |
Net investment income | | | 40,507,180 |
| | | |
| |
Net Realized Gain on Investments | | | |
Net realized gain on investment transactions | | | 3,717 |
| | | |
Net Increase In Net Assets Resulting From Operations | | $ | 40,510,897 |
| | | |
See Notes to Financial Statements.
| | |
| 14 | | Visit our website at www.jennisondryden.com |
Statement of Changes in Net Assets
| | | | | | | | |
| | | Year Ended December 31, | |
| | | 2006 | | | 2005 | |
Decrease In Net Assets | | | | | | | | |
Operations | | | | | | | | |
Net investment income | | $ | 40,507,180 | | | $ | 26,672,603 | |
Net realized gain on investment transactions | | | 3,717 | | | | 42,970 | |
| | | | | | | | |
Net increase in net assets resulting from operations | | | 40,510,897 | | | | 26,715,573 | |
| | | | | | | | |
Dividends and distributions to shareholders (Note 1) | | | | | | | | |
Class A | | | (28,520,298 | ) | | | (19,408,688 | ) |
Class B | | | (3,469,005 | ) | | | (2,072,513 | ) |
Class C | | | (606,698 | ) | | | (283,243 | ) |
Class Z | | | (7,914,896 | ) | | | (4,951,129 | ) |
| | | | | | | | |
| | | (40,510,897 | ) | | | (26,715,573 | ) |
| | | | | | | | |
| |
Fund share transactions (Notes 4 and 6) (at $1.00 per share) | | | | | |
Net proceeds from shares sold(a) | | | 1,887,263,370 | | | | 1,722,577,843 | |
Net asset value of shares issued to shareholders in reinvestment of dividends and distributions | | | 39,616,340 | | | | 26,217,415 | |
Cost of shares reacquired | | | (2,021,725,130 | ) | | | (1,851,306,504 | ) |
| | | | | | | | |
Net decrease in net assets from Fund share transactions | | | (94,845,420 | ) | | | (102,511,246 | ) |
| | | | | | | | |
Total decrease | | | (94,845,420 | ) | | | (102,511,246 | ) |
| | |
Net Assets | | | | | | | | |
Beginning of year | | | 980,738,203 | | | | 1,083,249,449 | |
| | | | | | | | |
End of year | | $ | 885,892,783 | | | $ | 980,738,203 | |
| | | | | | | | |
| (a) | For the year ended December 31, 2005, the Fund includes $115,574,951 for shares issued in connection with the merger of Special Money Market Fund, Inc. |
See Notes to Financial Statements.
| | |
| MoneyMart Assets, Inc. | | 15 |
Notes to Financial Statements
MoneyMart Assets, Inc. (the “Fund”) is registered under the Investment Company Act of 1940 as a diversified, open-end management investment company. The Fund invests primarily in a portfolio of money market instruments maturing in thirteen months or less whose ratings are within the two highest rating categories by a nationally recognized statistical rating organization or, if not rated, are of comparable quality. The ability of the issuers of the securities held by the Fund to meet their obligations may be affected by economic developments in a specific industry or region.
Note 1. Accounting Policies
The following is a summary of significant accounting policies followed by the Fund in the preparation of its financial statements.
Securities Valuations: Portfolio securities are valued at amortized cost, which approximates market value. The amortized cost method involves valuing a security at its cost on the date of purchase and thereafter assuming a constant amortization to maturity of any discount or premium. If the amortized cost method is determined not to represent fair value, the fair value shall be determined by or under the direction of the Board of Directors.
Securities Transactions and Net Investment Income: Securities transactions are recorded on the trade date. Realized gains or losses on sales of securities are calculated on the identified cost basis. Interest income including amortization of premium and accretion of discount on debt securities, as required, is recorded on the accrual basis. Expenses are recorded on the accrual basis.
Net investment income or loss (other than distribution fees, which are charged directly to the respective class) and realized gains or losses are allocated daily to each class of shares based upon the relative proportion of net assets of each class at the beginning of the day.
Repurchase Agreements: In connection with transactions in repurchase agreements with United States financial institutions, it is the Fund’s policy that its custodian or designated subcustodians under triparty repurchase agreements, as the case may be, take possession of the underlying collateral securities, the value of which exceeds the principal amount of the repurchase transactions, including accrued interest. To the extent that any repurchase transaction exceeds one business day, the value of the collateral is marked to market on a daily basis to ensure the adequacy of the collateral. If the seller defaults and the value of the collateral declines or if bankruptcy
| | |
| 16 | | Visit our website at www.jennisondryden.com |
proceedings are commenced with respect to the seller of the security, realization of the collateral by the Fund may be delayed or limited.
Loan Participations: The Fund may invest in loan participations. When the Fund purchases a loan participation, the Fund typically enters into a contractual relationship with the lender or third party selling such participations (“Selling Participant”), but not the borrower. As a result, the Fund assumes the credit risk of the borrower, the selling participant and any other persons interpositioned between the Fund and borrower (“intermediate participants”). The Fund may not directly benefit from the collateral supporting the senior loan in which it has purchased the loan participation.
Federal Income Taxes: It is the Fund’s policy to continue to meet the requirements of the Internal Revenue Code applicable to regulated investment companies and to distribute all of its taxable net income and capital gains, if any, to shareholders. Therefore, no federal income tax provision is required.
Dividends and Distributions: The Fund declares daily dividends from net investment income and net realized short-term capital gains or losses. Payment of dividends is made monthly. Dividends and distributions to shareholders, which are determined in accordance with federal income tax regulations and which may differ from generally accepted accounting principles are recorded on the ex-dividend date.
Restricted Securities: The Fund may hold up to 10% of its net assets in illiquid securities, including those which are restricted as to disposition under securities law (“restricted securities”). Restricted securities, sometimes referred to as private placements, are valued pursuant to the valuation procedures noted above.
Estimates: The preparation of the financial statements requires management to make estimates and assumptions that affect the reported amounts and disclosures in the financial statements. Actual results could differ from those estimates.
Note 2. Agreements
The Fund has a management agreement with Prudential Investments LLC (“PI”). Pursuant to this agreement, PI has responsibility for all investment advisory services and supervises the subadvisor’s performance of such services. PI has entered into a subadvisory agreement with Prudential Investment Management, Inc. (“PIM”). The subadvisory agreement provides that PIM will furnish investment advisory services in connection with the management of the Fund. In connection therewith, PIM is obligated to keep certain books and records of the Fund. PI pays for the services of
| | |
| MoneyMart Assets, Inc. | | 17 |
Notes to Financial Statements
Cont’d
PIM, the cost of compensation of officers of the Fund, occupancy and certain clerical and bookkeeping costs of the Fund. The Fund bears all other costs and expenses.
The management fee paid to PI is accrued daily and payable monthly, at an annual rate of ..50 of 1% of the Fund’s average daily net assets up to $50 million and .30 of 1% of the Fund’s average daily net assets in excess of $50 million. The effective management fee rate was .311 of 1% for the year ended December 31, 2006.
The Fund has a distribution agreement with Prudential Investment Management Services LLC (“PIMS”), which acts as the distributor of the Class A, Class B, Class C and Class Z shares of the Fund. The Fund compensates PIMS for distributing and servicing the Fund’s Class A shares pursuant to the plan of distribution at an annual rate of .125 of 1% of the average daily net assets of the Class A shares. The Class A distribution fee is accrued daily and payable monthly. No distribution or service fees are paid to PIMS as distributor of Class B, C or Z shares of the Fund.
PI, PIM and PIMS are indirect, wholly-owned subsidiaries of Prudential Financial, Inc. (“Prudential”).
Note 3. Other Transactions with Affiliates
Prudential Mutual Fund Services LLC (“PMFS”), an affiliate of PI and an indirect, wholly-owned subsidiary of Prudential, serves as the Fund’s transfer agent. Transfer agent’s fees and expenses in the Statement of Operations include certain out-of-pocket and sub-transfer agent expenses paid to non-affiliates, where applicable.
The Fund pays networking fees to affiliated and unaffiliated broker/dealers. These networking fees are payments made to broker/dealers that clear mutual fund transactions through a national clearing system. For the year ended December 31, 2006, the Fund incurred approximately $40,300 in total networking fees. These amounts are included in transfer agent’s fees and expenses in the Statement of Operations.
Note 4. Capital
The Fund offers Class A, Class B, Class C and Class Z shares. Class B, C and Z shares are not subject to any distribution and/or service fees and are offered exclusively for sale to a limited group of investors.
| | |
| 18 | | Visit our website at www.jennisondryden.com |
There are 20 billion authorized shares of $.001 par value common stock divided into four classes, which consist of 13 billion Class A, 2.5 billion Class B, 2.5 billion Class C and 2 billion Class Z shares.
Transactions in shares and dollars of common stock (at $1 net asset value per share) were as follows:
| | | | |
Class A | | Amount | |
Year ended December 31, 2006: | | | | |
Shares sold | | $ | 1,322,985,711 | |
Shares issued in reinvestment of dividends and distributions | | | 28,012,480 | |
Shares reacquired | | | (1,396,635,296 | ) |
| | | | |
Net increase (decrease) in shares outstanding | | $ | (45,637,105 | ) |
| | | | |
Year ended December 31, 2005: | | | | |
Shares sold | | $ | 1,481,404,408 | |
Shares issued in reinvestment of dividends and distributions | | | 19,148,965 | |
Shares issued in connection with reorganization (Note 6) | | | 5,451,729 | |
Shares reacquired | | | (1,698,601,978 | ) |
| | | | |
Net increase (decrease) in shares outstanding | | $ | (192,596,876 | ) |
| | | | |
Class B | | | |
Year ended December 31, 2006: | | | | |
Shares sold | | $ | 30,823,981 | |
Shares issued in reinvestment of dividends and distributions | | | 3,132,707 | |
Shares reacquired | | | (46,885,671 | ) |
| | | | |
Net increase (decrease) in shares outstanding | | $ | (12,928,983 | ) |
| | | | |
Period ended December 31, 2005:* | | | | |
Shares sold | | $ | 31,772,127 | |
Shares issued in reinvestment of dividends and distributions | | | 1,857,655 | |
Shares issued in connection with reorganization (Note 6) | | | 99,278,444 | |
Shares reacquired | | | (49,017,510 | ) |
| | | | |
Net increase (decrease) in shares outstanding | | $ | 83,890,716 | |
| | | | |
| | |
| MoneyMart Assets, Inc. | | 19 |
Notes to Financial Statements
Cont’d
| | | | |
Class C | | Amount | |
Year ended December 31, 2006: | | | | |
Shares sold | | $ | 28,306,445 | |
Shares issued in reinvestment of dividends and distributions | | | 555,954 | |
Shares reacquired | | | (27,371,991 | ) |
| | | | |
Net increase (decrease) in shares outstanding | | $ | 1,490,408 | |
| | | | |
Period ended December 31, 2005:* | | | | |
Shares sold | | $ | 20,769,008 | |
Shares issued in reinvestment of dividends and distributions | | | 255,960 | |
Shares issued in connection with reorganization (Note 6) | | | 9,444,871 | |
Shares reacquired | | | (19,587,691 | ) |
| | | | |
Net increase (decrease) in shares outstanding | | $ | 10,882,148 | |
| | | | |
Class Z | | | |
Year ended December 31, 2006: | | | | |
Shares sold | | $ | 505,147,233 | |
Shares issued in reinvestment of dividends and distributions | | | 7,915,199 | |
Shares reacquired | | | (550,832,172 | ) |
| | | | |
Net increase (decrease) in shares outstanding | | $ | (37,769,740 | ) |
| | | | |
Year ended December 31, 2005: | | | | |
Shares sold | | $ | 73,057,349 | |
Shares issued in reinvestment of dividends and distributions | | | 4,954,835 | |
Shares issued in connection with reorganization (Note 6) | | | 1,399,907 | |
Shares reacquired | | | (84,099,325 | ) |
| | | | |
Net increase (decrease) in shares outstanding | | $ | (4,687,234 | ) |
| | | | |
| * | Commenced offering on March 11, 2005. |
Note 5. Distributions and Tax Information
In order to present undistributed net investment income, accumulated net realized capital gains and paid-in capital in excess of par on the Statement of Assets and Liabilities that more closely represent their tax character, certain adjustments have been made to undistributed net investment income and accumulated net realized gains on investments. For the year December 31, 2006, the adjustment was to decrease accumulated net realized gains and increase undistributed net investment income by $3,717 due to reclassification of distributions.
| | |
| 20 | | Visit our website at www.jennisondryden.com |
For the year ended December 31, 2006, the tax character of dividends paid, as reflected in the Statement of Changes in Net Assets, was $40,510,897 of ordinary income. For the year ended December 31, 2005, the tax character of dividends paid was $26,671,885 and 43,688 of ordinary income and long-term capital gains, respectively.
As of December 31, 2006, the accumulated undistributed earnings on a tax basis consisted of $13,479 of ordinary income.
Note 6. Reorganization
At the close of business on March 11, 2005, MoneyMart Assets, Inc. acquired all of the net assets of Special Money Market Fund, Inc. pursuant to a plan of reorganization approved by the Special Money Market Fund, Inc. shareholders on February 17, 2005. The acquisition was accomplished by a tax-free exchange of Class A, Class B, Class C and Class Z shares.
| | | | | | | | | | | |
Special Money Market Fund, Inc. | | MoneyMart Assets, Inc. Shares Issued | | Value of Shares Issued |
| Class A | | 5,451,729 | | Class A | | 5,451,729 | | Class A | | $ | 5,451,729 |
| Class B | | 99,278,444 | | Class B | | 99,278,444 | | Class B | | $ | 99,278,444 |
| Class C | | 9,444,871 | | Class C | | 9,444,871 | | Class C | | $ | 9,444,871 |
| Class Z | | 1,399,907 | | Class Z | | 1,399,907 | | Class Z | | $ | 1,399,907 |
The aggregate net assets of the Special Money Market Fund, Inc. and MoneyMart Assets, Inc. immediately before the acquisition were $115,574,951 and $1,033,223,410, respectively.
Note 7. New Accounting Pronouncements
On July 13, 2006, the Financial Accounting Standards Board (FASB) released FASB Interpretation No. 48 “Accounting for Uncertainty in Income Taxes” (FIN 48). FIN 48 provides guidance for how uncertain tax positions should be recognized, measured, presented and disclosed in the financial statements. FIN 48 requires the evaluation of tax positions taken or expected to be taken in the course of preparing the Fund’s tax returns to determine whether the tax positions are “more-likely-than-not” of being sustained by the applicable tax authority. Tax benefits or expenses resulting from tax positions not deemed to meet the more-likely-than-not threshold would be recorded in the year in which they arise. Adoption of FIN 48 is required for fiscal years beginning after December 15, 2006 and interim periods within those fiscal years and is to be applied to all open tax years as of the effective date. At this time, management is evaluating the implications of FIN 48 and its impact, if any, in the financial statements has not yet been determined.
| | |
| MoneyMart Assets, Inc. | | 21 |
Notes to Financial Statements
Cont’d
On September 20, 2006, the FASB released Statement of Financial Accounting Standards No. 157 “Fair Value Measurements” (FAS 157). FAS 157 establishes an authoritative definition of fair value, sets out a framework for measuring fair value, and requires additional disclosures about fair-value measurements. The application of FAS 157 is required for fiscal years beginning after November 15, 2007 and interim periods within those fiscal years. At this time, management is evaluating the implications of FAS 157 and its impact, if any, in the financial statements has not yet been determined.
| | |
| 22 | | Visit our website at www.jennisondryden.com |
Financial Highlights
| | |
| DECEMBER 31, 2006 | | ANNUAL REPORT |
MoneyMart Assets, Inc.
Financial Highlights
| | | | |
| | | Class A | |
| | | Year Ended December 31, 2006 | |
Per Share Operating Performance: | | | | |
Net Asset Value, Beginning Of Year | | $ | 1.000 | |
| | | | |
Income from investment operations: | | | | |
Net investment income and net realized gains | | | .044 | |
Dividends and distributions to shareholders | | | (.044 | ) |
| | | | |
Net asset value, end of year | | $ | 1.000 | |
| | | | |
Total Return(a): | | | 4.46 | % |
Ratios/Supplemental Data: | | | | |
Net assets, end of year (000) | | $ | 652,403 | |
Average net assets (000) | | $ | 651,453 | |
Ratios to average net assets: | | | | |
Expenses, including distribution and service (12b-1) fees | | | .68 | % |
Expenses, excluding distribution and service (12b-1) fees | | | .56 | % |
Net investment income | | | 4.38 | % |
| (a) | Total return is calculated assuming a purchase of shares on the first day and a sale on the last day of each year reported and includes reinvestment of dividends and distributions. |
See Notes to Financial Statements.
| | |
| 24 | | Visit our website at www.jennisondryden.com |
| | | | | | | | | | | | | | |
| Class A | |
| Year Ended December 31, | |
| 2005 | | | 2004 | | | 2003 | | | 2002 | |
| | | | | | | | | | | | | | |
| $ | 1.000 | | | $ | 1.000 | | | $ | 1.000 | | | $ | 1.000 | |
| | | | | | | | | | | | | | | |
| | | | | | | | | | | | | | |
| | .025 | | | | .007 | | | | .006 | | | | .013 | |
| | (.025 | ) | | | (.007 | ) | | | (.006 | ) | | | (.013 | ) |
| | | | | | | | | | | | | | | |
| $ | 1.000 | | | $ | 1.000 | | | $ | 1.000 | | | $ | 1.000 | |
| | | | | | | | | | | | | | | |
| | 2.58 | % | | | .70 | % | | | .65 | % | | | 1.35 | % |
| | | | | | | | | | | | | | |
| $ | 698,040 | | | $ | 890,637 | | | $ | 5,089,405 | | | $ | 6,930,229 | |
| $ | 786,418 | | | $ | 2,823,600 | | | $ | 6,535,734 | | | $ | 6,947,463 | |
| | | | | | | | | | | | | | |
| | .80 | % | | | .71 | % | | | .62 | % | | | .61 | % |
| | .67 | % | | | .58 | % | | | .49 | % | | | .48 | % |
| | 2.46 | % | | | .54 | % | | | .63 | % | | | 1.34 | % |
See Notes to Financial Statements.
| | |
| MoneyMart Assets, Inc. | | 25 |
Financial Highlights
Cont’d
| | | | | | | | |
| | | Class B | |
| | | Year Ended December 31, 2006 | | | March 11, 2005(a) through December 31, 2005 | |
Per Share Operating Performance: | | | | | | | | |
Net Asset Value, Beginning Of Period | | $ | 1.000 | | | $ | 1.000 | |
| | | | | | | | |
Income from investment operations: | | | | | | | | |
Net investment income and net realized gains | | | .045 | | | | .023 | |
Dividends and distributions to shareholders | | | (.045 | ) | | | (.023 | ) |
| | | | | | | | |
Net asset value, end of period | | $ | 1.000 | | | $ | 1.000 | |
| | | | | | | | |
Total Return(b): | | | 4.59 | % | | | 2.37 | % |
Ratios/Supplemental Data: | | | | | | | | |
Net assets, end of period (000) | | $ | 70,962 | | | $ | 83,891 | |
Average net assets (000) | | $ | 76,873 | | | $ | 90,153 | |
Ratios to average net assets: | | | | | | | | |
Expenses, including distribution and service (12b-1) fees | | | .56 | % | | | .65 | %(c) |
Expenses, excluding distribution and service (12b-1) fees | | | .56 | % | | | .65 | %(c) |
Net investment income | | | 4.51 | % | | | 2.84 | %(c) |
| (a) | Commencement of offering. |
| (b) | Total return is calculated assuming a purchase of shares on the first day and a sale on the last day of each period reported and includes reinvestment of dividends and distributions. Total Returns for less than a full year are not annualized. |
See Notes to Financial Statements.
| | |
| 26 | | Visit our website at www.jennisondryden.com |
| | | | | | | | |
| | | Class C | |
| | | Year Ended December 31, 2006 | | | March 11, 2005(a) through December 31, 2005 | |
Per Share Operating Performance: | | | | | | | | |
Net Asset Value, Beginning Of Period | | $ | 1.000 | | | $ | 1.000 | |
| | | | | | | | |
Income from investment operations: | | | | | | | | |
Net investment income and net realized gains | | | .045 | | | | .023 | |
Dividends and distributions to shareholders | | | (.045 | ) | | | (.023 | ) |
| | | | | | | | |
Net asset value, end of period | | $ | 1.000 | | | $ | 1.000 | |
| | | | | | | | |
Total Return(b): | | | 4.59 | % | | | 2.37 | % |
Ratios/Supplemental Data: | | | | | | | | |
Net assets, end of period (000) | | $ | 12,373 | | | $ | 10,882 | |
Average net assets (000) | | $ | 13,294 | | | $ | 12,218 | |
Ratios to average net assets: | | | | | | | | |
Expenses, including distribution and service (12b-1) fees | | | .56 | % | | | .65 | %(c) |
Expenses, excluding distribution and service (12b-1) fees | | | .56 | % | | | .65 | %(c) |
Net investment income | | | 4.56 | % | | | 2.87 | %(c) |
| (a) | Commencement of offering. |
| (b) | Total return is calculated assuming a purchase of shares on the first day and a sale on the last day of each period reported and includes reinvestment of dividends and distributions. Total Returns for less than a full year are not annualized. |
See Notes to Financial Statements.
| | |
| MoneyMart Assets, Inc. | | 27 |
Financial Highlights
Cont’d
| | | | |
| | | Class Z | |
| | | Year Ended December 31, 2006 | |
Per Share Operating Performance: | | | | |
Net Asset Value, Beginning Of Year | | $ | 1.000 | |
| | | | |
Income from investment operations: | | | | |
Net investment income and net realized gains | | | .045 | |
Dividends and distributions to shareholders | | | (.045 | ) |
| | | | |
Net asset value, end of year | | $ | 1.000 | |
| | | | |
Total Return(a): | | | 4.59 | % |
Ratios/Supplemental Data: | | | | |
Net assets, end of year (000) | | $ | 150,156 | |
Average net assets (000) | | $ | 178,667 | |
Ratios to average net assets: | | | | |
Expenses, including distribution and service (12b-1) fees | | | .56 | % |
Expenses, excluding distribution and service (12b-1) fees | | | .56 | % |
Net investment income | | | 4.43 | % |
| (a) | Total return is calculated assuming a purchase of shares on the first day and a sale on the last day of each year reported and includes reinvestment of dividends and distributions. |
See Notes to Financial Statements.
| | |
| 28 | | Visit our website at www.jennisondryden.com |
| | | | | | | | | | | | | | |
| Class Z | |
| Year Ended December 31, | |
| 2005 | | | 2004 | | | 2003 | | | 2002 | |
| | | | | | | | | | | | | | |
| $ | 1.000 | | | $ | 1.000 | | | $ | 1.000 | | | $ | 1.000 | |
| | | | | | | | | | | | | | | |
| | | | | | | | | | | | | | |
| | .027 | | | | .008 | | | | .008 | | | | .015 | |
| | (.027 | ) | | | (.008 | ) | | | (.008 | ) | | | (.015 | ) |
| | | | | | | | | | | | | | | |
| $ | 1.000 | | | $ | 1.000 | | | $ | 1.000 | | | $ | 1.000 | |
| | | | | | | | | | | | | | | |
| | 2.70 | % | | | .82 | % | | | .77 | % | | | 1.48 | % |
| | | | | | | | | | | | | | |
| $ | 187,925 | | | $ | 192,613 | | | $ | 187,718 | | | $ | 200,583 | |
| $ | 187,379 | | | $ | 188,931 | | | $ | 198,143 | | | $ | 291,473 | |
| | | | | | | | | | | | | | |
| | .67 | % | | | .58 | % | | | .49 | % | | | .48 | % |
| | .67 | % | | | .58 | % | | | .49 | % | | | .48 | % |
| | 2.64 | % | | | .83 | % | | | .75 | % | | | 1.48 | % |
See Notes to Financial Statements.
| | |
| MoneyMart Assets, Inc. | | 29 |
Report of Independent Registered Public Accounting Firm
The Board of Directors and Shareholders of
MoneyMart Assets, Inc.
We have audited the accompanying statement of assets and liabilities of MoneyMart Assets, Inc. (hereafter referred to as the “Fund”), including the portfolio of investments, as of December 31, 2006, and the related statement of operations for the year then ended, the statement of changes in net assets for each of the years in the two-year period then ended and the financial highlights for each of the years in the three-year period then ended. These financial statements and financial highlights are the responsibility of the Fund’s management. Our responsibility is to express an opinion on these financial statements and financial highlights based on our audits. The financial highlights for the years presented prior to the year ended December 31, 2004, were audited by another independent registered public accounting firm, whose report dated February 20, 2004, expressed an unqualified opinion thereon.
We conducted our audits in accordance with the standards of the Public Company Accounting Oversight Board (United States). Those standards require that we plan and perform the audit to obtain reasonable assurance about whether the financial statements and financial highlights are free of material misstatement. An audit includes examining, on a test basis, evidence supporting the amounts and disclosures in the financial statements. Our procedures included confirmation of securities owned as of December 31, 2006, by correspondence with the custodian and brokers or by other appropriate auditing procedures where replies from brokers were not received. An audit also includes assessing the accounting principles used and significant estimates made by management, as well as evaluating the overall financial statement presentation. We believe that our audits provide a reasonable basis for our opinion.
In our opinion, the financial statements and financial highlights referred to above present fairly, in all material respects, the financial position of the Fund as of December 31, 2006, and the results of its operations for the year then ended, the changes in its net assets for each of the years in the two-year period then ended and the financial highlights for each of the years in the three-year period then ended, in conformity with U.S. generally accepted accounting principles.

New York, New York
February 28, 2007
| | |
| 30 | | Visit our website at www.jennisondryden.com |
Federal Income Tax Information
(Unaudited)
We are required by the Internal Revenue Code to advise you within 60 days of the Fund’s fiscal year end (December 31, 2006) as to the federal tax status of dividends paid by the Fund during such fiscal year. Accordingly, we are advising you that during its fiscal year ended December 31, 2006, the Fund paid an ordinary dividends for Class A, Class B, Class C and Class Z shares of $.044, $.045, $.045 and $.045 per share, respectively, which represents net investment income.
The Fund designates 100% of the ordinary income dividends as qualified interest income under The American Jobs Creation Act of 2004.
We are required by New York, California, Massachusetts, Missouri and Oregon to inform you that dividends which have been derived from federal obligations are not taxable to shareholders provided the mutual fund meets certain requirements mandated by the respective states’ taxing authorities. We are pleased to report that 3.84% of the dividends paid by the Fund qualify for such deductions. Due to certain minimum portfolio holding requirements in California, Connecticut and New York, residents of those states will not be able to exclude interest on federal obligations from state and local tax.
In January 2007, you were advised on IRS Form 1099 DIV or substitute 1099 DIV as to the federal tax status of the distributions received by you in calendar year 2006.
For more detailed information regarding your state and local taxes, you should contact your tax advisor or the state/local taxing authorities.
| | |
| MoneyMart Assets, Inc. | | 31 |
Management of the Fund
(Unaudited)
Information pertaining to the Directors of MoneyMart Assets, Inc. (the “Fund”) is set forth below. Directors who are not deemed to be “interested persons” of the Fund, as defined in the Investment Company Act of 1940 (the 1940 Act), are referred to as “Independent Directors.” Directors who are deemed to be “interested persons” of the Fund are referred to as “Interested Directors.” “Fund Complex”† consists of the Fund and any other investment companies managed by PI.
Independent Directors(2)
David E.A. Carson (72), Director since 2003(3) Oversees 77 portfolios in Fund complex
Principal occupations (last 5 years): Formerly Director (January 2000-May 2000), Chairman (January 1999-December 1999), Chairman and Chief Executive Officer (January 1998-December 1998) and President, Chairman and Chief Executive Officer of People’s Bank (1983-1997).
Robert E. La Blanc (72), Director since 1996(3) Oversees 75 portfolios in Fund complex
Principal occupations (last 5 years): President (since 1981) of Robert E. La Blanc Associates, Inc. (telecommunications).
Other Directorships held:(4) Director of CA, Inc. (since 2002) (software company); FiberNet Telecom Group, Inc. (since 2003) (telecom company).
Robin B. Smith (67), Director since 1996(3) Oversees 75 portfolios in Fund complex
Principal occupations (last 5 years): Chairman of the Board (since January 2003) of Publishers Clearing House (direct marketing); formerly Chairman and Chief Executive Officer (August 1996-January 2003) of Publishers Clearing House.
Other Directorships held:(4) Formerly Director of BellSouth Corporation (1992-2006).
Stephen G. Stoneburn (63), Director since 1996(3) Oversees 75 portfolios in Fund complex
Principal occupations (last 5 years): President and Chief Executive Officer (since June 1996) of Quadrant Media Corp. (publishing company); formerly President (June 1995-June 1996) of Argus Integrated Media, Inc.; Senior Vice President and Managing Director (January 1993-1995) of Cowles Business Media; Senior Vice President of Fairchild Publications, Inc. (1975-1989).
Clay T. Whitehead (68), Director since 1999(3) Oversees 75 portfolios in Fund complex
Principal occupations (last 5 years): President (since 1983) of YCO (new business development firm).
Interested Directors(1)
Robert F. Gunia (60), Vice President and Director since 1996(3) Oversees 154 portfolios in Fund complex
Principal occupations (last 5 years): Chief Administrative Officer (since September 1999) and Executive Vice President (since December 1996) of Prudential Investments LLC; President (since April 1999) of Prudential Investment Management Services LLC; Executive Vice President (since March 1999) and Treasurer (since May 2000) of Prudential Mutual Fund Services LLC; Chief Administrative Officer, Executive Vice President and Director (since May 2003) of American Skandia Investment Services, Inc.
Other Directorships held:(4) Vice President and Director (since May 1989) and Treasurer (since 1999) of The Asia Pacific Fund, Inc.
| | |
| 32 | | Visit our website at www.jennisondryden.com |
Information pertaining to the Officers of the Fund who are not also Directors is set forth below.
Officers(2)
Judy A. Rice (59), President since 2003(3)
Principal occupations (last 5 years): President, Chief Executive Officer, Chief Operating Officer and Officer-In-Charge (since February 2003) of Prudential Investments LLC; Vice President (since February 1999) of Prudential Investment Management Services LLC; President, Chief Executive Officer and Officer-In-Charge (since April 2003) of Prudential Mutual Fund Services LLC; formerly Director (May 2003-March 2006) and Executive Vice President (June 2005-March 2006) of American Skandia Investment Services, Inc.; formerly Executive Vice President (September 1999-February 2003) of Prudential Investments LLC; Member of Board of Governors of the Investment Company Institute.
Kathryn L. Quirk (54), Chief Legal Officer since 2005(3)
Principal occupations (last 5 years): Vice President and Corporate Counsel (since September 2004) of Prudential; Executive Vice President, Chief Legal Officer and Secretary (since July 2005) of Prudential Investments LLC and Prudential Mutual Fund Services LLC; formerly Managing Director, General Counsel, Chief Compliance Officer, Chief Risk Officer and Corporate Secretary (1997-2002) of Zurich Scudder Investments, Inc.
Deborah A. Docs (49), Secretary since 2005(3)
Principal occupations (last 5 years): Vice President and Corporate Counsel (since January 2001) of Prudential; Vice President (since December 1996) and Assistant Secretary (since March 1999) of PI; formerly Vice President and Assistant Secretary (May 2003-June 2005) of American Skandia Investment Services, Inc.
Jonathan D. Shain (48), Assistant Secretary since 2005(3)
Principal occupations (last 5 years): Vice President and Corporate Counsel (since August 1998) of Prudential; Vice President and Assistant Secretary (since May 2001) of PI; Vice President and Assistant Secretary (since February 2001) of PMFS; formerly Vice President and Assistant Secretary (May 2003-June 2005) of American Skandia Investment Services, Inc.
Claudia DiGiacomo (32), Assistant Secretary since 2005(3)
Principal occupations (last 5 years): Vice President and Corporate Counsel (since January 2005) of Prudential; Vice President and Assistant Secretary of PI (since December 2005); Associate at Sidley Austin Brown & Wood LLP (1999-2004).
John P. Schwartz (35), Assistant Secretary since 2006(3)
Principal occupations (last 5 years): Vice President and Corporate Counsel (since April 2005) of Prudential; Vice President and Assistant Secretary of PI (since December 2005); Associate at Sidley, Austin Brown & Wood LLP (1997-2005).
Lee D. Augsburger (47), Chief Compliance Officer since 2004(3)
Principal occupations (last 5 years): Senior Vice President and Chief Compliance Officer (since April 2003) of PI; Vice President (since November 2000) and Chief Compliance Officer (since October 2000) of Prudential Investment Management, Inc.; Chief Compliance Officer and Senior Vice President (since May 2003) of American Skandia Investment Services, Inc.
Grace C. Torres (47), Treasurer and Principal Financial and Accounting Officer since 1995(3)
Principal occupations (last 5 years): Assistant Treasurer (since March 1999) and Senior Vice President (since September 1999) of PI; Assistant Treasurer (since May 2003) and Vice President (since June 2005) of American Skandia Investment Services, Inc.; Senior Vice President and Assistant Treasurer (since May 2003) of American Skandia Advisory Services, Inc.; formerly Senior Vice President (May 2003-June 2005) of American Skandia Investment Services, Inc.
| | |
| MoneyMart Assets, Inc. | | 33 |
M. Sadiq Peshimam (43), Assistant Treasurer since 2006(3)
Principal occupations (last 5 years): Vice President (since 2005) and Director (2000-2005) within Prudential Mutual Fund Administration.
Jack Benintende (42), Assistant Treasurer since 2006(3)
Principal occupations (last 5 years): Vice President (since June 2000) within Prudential Mutual Fund Administration; formerly Senior Manager within the investment management practice of PricewaterhouseCoopers LLP (May 1994-June 2000).
Andrew R. French (44), Assistant Secretary since 2006(3)
Principal occupations (last 5 years): Director and Corporate Counsel (since May 2006) of Prudential; formerly Senior Legal Analyst of Prudential Mutual Fund Law Department (1997-2006).
Noreen M. Fierro (42), Anti-Money Laundering Compliance Officer since 2006(3)
Principal occupations (last 5 years): Vice President, Corporate Compliance (since May 2006) of Prudential; formerly Corporate Vice President, Associate General Counsel (April 2002-May 2005) of UBS Financial Services, Inc., in their Money Laundering Prevention Group; Senior Manager (May 2005-May 2006) of Deloitte Financial Advisory Services, LLP, in their Forensic and Dispute Services, Anti-Money Laundering Group.
† | The Fund Complex consists of all investment companies managed by PI. The Funds for which PI serves as manager include Jennison Dryden Mutual Funds, Strategic Partners Funds, The Prudential Variable Contract Accounts 2, 10, 11. The Target Portfolio Trust, The Prudential Series Fund, The High Yield Income Fund, Inc., The High Yield Plus Fund, Inc., Nicholas-Applegate Fund, Inc., American Skandia Trust, and Prudential’s Gibraltar Fund, Inc. |
(1) | ”Interested” Director, as defined in the 1940 Act, by reason of employment with the Manager, a Subadvisor or the Distributor. |
(2) | Unless otherwise noted, the address of the Directors and Officers is c/o: Prudential Investments LLC, Gateway Center Three, 100 Mulberry Street, Newark, NJ 07102. |
(3) | There is no set term of office for Directors and Officers. The Independent Directors have adopted a retirement policy, which calls for the retirement of Directors on December 31 of the year in which they reach the age of 75. The table shows the individual’s length of service as Director and/or Officer. |
(4) | This includes only directorships of companies required to register, or file reports with the SEC under the Securities and Exchange Act of 1934 (that is, “public companies”) or other investment companies registered under the 1940 Act. |
Additional Information about the Directors is included in the Statement of Additional Information which is available without charge, upon request, by calling (800) 521-7466 or (732) 482-7555 (Calling from outside the U.S.)
| | |
| 34 | | Visit our website at www.jennisondryden.com |
| | | | |
| n MAIL | | n TELEPHONE | | n WEBSITE |
Gateway Center Three
100 Mulberry Street
Newark, NJ 07102 | | (800) 225-1852 | | www.jennisondryden.com |
|
| PROXY VOTING |
| The Board of Directors of the Fund has delegated to the Fund’s investment subadviser the responsibility for voting any proxies and maintaining proxy recordkeeping with respect to the Fund. A description of these proxy voting policies and procedures is available without charge, upon request, by calling (800) 225-1852 or by visiting the Securities and Exchange Commission’s website at www.sec.gov. Information regarding how the Fund voted proxies relating to portfolio securities during the most recent 12-month period ended June 30 is available on the Fund’s website and on the Commission’s website. |
|
| DIRECTORS |
| David E. A. Carson • Robert F. Gunia • Robert E. La Blanc • Robin B. Smith • Stephen G. Stoneburn • Clay T. Whitehead |
|
| OFFICERS |
Judy A. Rice, President • Robert F. Gunia, Vice President • Grace C. Torres, Treasurer and Principal Financial and Accounting Officer • Kathryn L. Quirk, Chief Legal Officer •
Deborah A. Docs, Secretary • Lee D. Augsburger, Chief Compliance Officer • Noreen M. Fierro, Anti-Money Laundering Compliance Officer • Jonathan D. Shain, Assistant Secretary •
Claudia DiGiacomo, Assistant Secretary • John P. Schwartz, Assistant Secretary •
Andrew R. French, Assistant Secretary • Jack Benintende, Assistant Treasurer • M. Sadiq Peshimam, Assistant Treasurer |
| | | | |
| MANAGER | | Prudential Investments LLC | | Gateway Center Three
100 Mulberry Street
Newark, NJ 07102 |
|
| INVESTMENT SUBADVISER | | Prudential Investment
Management, Inc. | | Gateway Center Two
100 Mulberry Street
Newark, NJ 07102 |
|
| DISTRIBUTOR | | Prudential Investment
Management Services LLC | | Gateway Center Three
100 Mulberry Street
Newark, NJ 07102 |
|
| CUSTODIAN | | The Bank of New York | | One Wall Street
New York, NY 10286 |
|
| TRANSFER AGENT | | Prudential Mutual Fund
Services LLC | | PO Box 8098
Philadelphia, PA 19176 |
|
| INDEPENDENT REGISTERED PUBLIC ACCOUNTING FIRM | | KPMG LLP | | 345 Park Avenue
New York, NY 10154 |
|
| FUND COUNSEL | | Sullivan & Cromwell LLP | | 125 Broad Street
New York, NY 10004 |
|
| An investor should consider the investment objectives, risks, charges, and expenses of the Fund carefully before investing. The prospectus for the Fund contains this and other information about the Fund. An investor may obtain a prospectus by visiting our website at www.jennisondryden.com or by calling (800) 225-1852. The prospectus should be read carefully before investing. |
E-DELIVERY
To receive your mutual fund documents on-line, go to www.icsdelivery.com/prudential/funds and enroll. Instead of receiving printed documents by mail, you will receive notification via e-mail when new materials are available. You can cancel your enrollment or change your e-mail address at any time by clicking on the change/cancel enrollment option at the icsdelivery website address.
SHAREHOLDER COMMUNICATIONS WITH DIRECTORS
Shareholders can communicate directly with the Board of Directors by writing to the Chair of the Board, MoneyMart Assets, Inc., PO Box 13964, Philadelphia, PA 19176. Shareholders can communicate directly with an individual Director by writing to the same address. Communications to the Board or individual Directors are not screened before being delivered to the addressee.
|
| AVAILABILITY OF PORTFOLIO SCHEDULE |
| The Fund files its complete schedule of portfolio holdings with the Securities and Exchange Commission for the first and third quarters of each fiscal year on Form N-Q. The Fund’s Forms N-Q are available on the Commission’s website at www.sec.gov. The Fund’s Forms N-Q may also be reviewed and copied at the Commission’s Public Reference Room in Washington, D.C. Information on the operation and location of the Public Reference Room may be obtained by calling (800) SEC-0330 (732-0330). The Fund’s schedule of portfolio holdings is also available on the Fund’s website as of the end of each fiscal quarter. |
|
| The Fund’s Statement of Additional Information contains additional information about the Fund’s Directors and is available without charge, upon request, by calling (800) 225-1852. |
Mutual Funds:
| | | | |
| ARE NOT INSURED BY THE FDIC OR ANY FEDERAL GOVERNMENT AGENCY | | MAY LOSE VALUE | | ARE NOT A DEPOSIT OF OR GUARANTEED BY ANY BANK OR ANY BANK AFFILIATE |
| | | | | | | | | | | | |
| MoneyMart Assets, Inc. | | |
| | | Share Class | | A | | B | | C | | Z | | |
| | NASDAQ | | PBMXX | | N/A | | N/A | | PMZXX | | |
| | CUSIP | | 60936A100 | | 60936A506 | | 60936A605 | | 60936A407 | | |
| | | | | | | | | | | | |
MF108E IFS-A129648 Ed. 02/2007
Item 2—Code of Ethics—See Exhibit (a)
As of the end of the period covered by this report, the registrant has adopted a code of ethics (the “Section 406 Standards for Investment Companies—Ethical Standards for Principal Executive and Financial Officers”) that applies to the registrant’s Principal Executive Officer and Principal Financial Officer; the registrant’s Principal Financial Officer also serves as the Principal Accounting Officer.
The registrant hereby undertakes to provide any person, without charge, upon request, a copy of the code of ethics. To request a copy of the code of ethics, contact the registrant 800-225-1852, and ask for a copy of the Section 406 Standards for Investment Companies—Ethical Standards for Principal Executive and Financial Officers.
Item 3—Audit Committee Financial Expert—
The registrant’s Board has determined that Mr. David E. A. Carson, member of the Board’s Audit Committee is an “audit committee financial expert,” and that he is “independent,” for purposes of this Item.
Item 4—Principal Accountant Fees and Services—
For the fiscal years ended December 31, 2006 and December 31, 2005, KPMG LLP (“KPMG”), the Registrant’s principal accountant, billed the Registrant $15,400 and $22,400, respectively, for professional services rendered for the audit of the Registrant’s annual financial statements or services that are normally provided in connection with statutory and regulatory filings.
For the fiscal year ended December 31, 2006, KPMG LLP (“KPMG”), the Registrant’s principal accountant, did not bill the Registrant for assurance and related services that are reasonably related to the performance of the audit of the registrant’s financial statements. For the fiscal year ended December 31, 2005, KPMG LLP (“KPMG”), the Registrant’s principal accountant, billed the Registrant $913 for assurance and related services that are reasonably related to the performance of the audit of the registrant’s financial statements. Professional services rendered included those in connection with additional audit procedures related to the conversion of shareholder accounts.
None.
None.
| (e)(1) | Audit Committee Pre-Approval Policies and Procedures |
THE PRUDENTIAL MUTUAL FUNDS
AUDIT COMMITTEE POLICY
on
Pre-Approval of Services Provided by the Independent Accountants
The Audit Committee of each Prudential Mutual Fund is charged with the responsibility to monitor the independence of the Fund’s independent accountants. As part of this responsibility, the Audit Committee must pre-approve any independent accounting firm’s engagement to render audit and/or permissible non-audit services, as required by law. In evaluating a proposed engagement of the independent accountants, the Audit Committee will assess the effect that the engagement might reasonably be expected to have on the accountant’s independence. The Committee’s evaluation will be based on:
| | • | | a review of the nature of the professional services expected to be provided, |
| | • | | a review of the safeguards put into place by the accounting firm to safeguard independence, and |
| | • | | periodic meetings with the accounting firm. |
Policy for Audit and Non-Audit Services Provided to the Funds
On an annual basis, the scope of audits for each Fund, audit fees and expenses, and audit-related and non-audit services (and fees proposed in respect thereof) proposed to be performed by the Fund’s independent accountants will be presented by the Treasurer and the independent accountants to the Audit Committee for review and, as appropriate, approval prior to the initiation of such services. Such presentation shall be accompanied by confirmation by both the Treasurer and the independent accountants that the proposed services will not adversely affect the independence of the independent accountants. Proposed services shall be described in sufficient detail to enable the Audit Committee to assess the appropriateness of such services and fees, and the compatibility of the provision of such services with the auditor’s independence. The Committee shall receive periodic reports on the progress of the audit and other services which are approved by the Committee or by the Committee Chair pursuant to authority delegated in this Policy.
The categories of services enumerated under “Audit Services”, “Audit-related Services”, and “Tax Services” are intended to provide guidance to the Treasurer and the independent accountants as to those categories of services which the Committee believes are generally consistent with the independence of the independent accountants and which the Committee (or the Committee Chair) would expect upon the presentation of specific proposals to pre-approve. The enumerated categories are not intended as an exclusive list of audit, audit-related or tax services, which the Committee (or the Committee Chair) would consider for pre-approval.
Audit Services
The following categories of audit services are considered to be consistent with the role of the Fund’s independent accountants:
| | • | | Annual Fund financial statement audits |
| | • | | Seed audits (related to new product filings, as required) |
| | • | | SEC and regulatory filings and consents |
Audit-related Services
The following categories of audit-related services are considered to be consistent with the role of the Fund’s independent accountants:
| | • | | Accounting consultations |
| | • | | Fund merger support services |
| | • | | Agreed Upon Procedure Reports |
| | • | | Other Internal Control Reports |
Individual audit-related services that fall within one of these categories and are not presented to the Audit Committee as part of the annual pre-approval process will be subject to pre-approval by the Committee Chair (or any other Committee member on whom this responsibility has been delegated) so long as the estimated fee for those services does not exceed $50,000.
Tax Services
The following categories of tax services are considered to be consistent with the role of the Fund’s independent accountants:
| | • | | Tax compliance services related to the filing or amendment of the following: |
| | • | | Federal, state and local income tax compliance; and, |
| | • | | Sales and use tax compliance |
| | • | | Timely RIC qualification reviews |
| | • | | Tax distribution analysis and planning |
| | • | | Tax authority examination services |
| | • | | Tax appeals support services |
| | • | | Accounting methods studies |
| | • | | Fund merger support services |
| | • | | Tax consulting services and related projects |
Individual tax services that fall within one of these categories and are not presented to the Audit Committee as part of the annual pre-approval process will be subject to pre-approval by the Committee Chair (or any other Committee member on whom this responsibility has been delegated) so long as the estimated fee for those services does not exceed $50,000.
Other Non-audit Services
Certain non-audit services that the independent accountants are legally permitted to render will be subject to pre-approval by the Committee or by one or more Committee members to whom the Committee has delegated this authority and who will report to the full Committee any pre-approval decisions made pursuant to this Policy. Non-audit services presented for pre-approval pursuant to this paragraph will be accompanied by a confirmation from both the Treasurer and the independent accountants that the proposed services will not adversely affect the independence of the independent accountants.
Proscribed Services
The Fund’s independent accountants will not render services in the following categories of non-audit services:
| | • | | Bookkeeping or other services related to the accounting records or financial statements of the Fund |
| | • | | Financial information systems design and implementation |
| | • | | Appraisal or valuation services, fairness opinions, or contribution-in-kind reports |
| | • | | Internal audit outsourcing services |
| | • | | Management functions or human resources |
| | • | | Broker or dealer, investment adviser, or investment banking services |
| | • | | Legal services and expert services unrelated to the audit |
| | • | | Any other service that the Public Company Accounting Oversight Board determines, by regulation, is impermissible. |
Pre-approval of Non-Audit Services Provided to Other Entities Within the Prudential Fund Complex
Certain non-audit services provided to Prudential Investments LLC or any of its affiliates that also provide ongoing services to the Prudential Mutual Funds will be subject to pre-approval by the Audit Committee. The only non-audit services provided to these entities that will require pre-approval are those related directly to the operations and financial reporting of the Funds. Individual projects that are not presented to the Audit Committee as part of the annual pre-approval process will be subject to pre-approval by the Committee Chair (or any other Committee member on whom this responsibility has been delegated) so long as the estimated fee for those services does not exceed $50,000. Services presented for pre-approval pursuant to this paragraph will be accompanied by a confirmation from both the Treasurer and the independent accountants that the proposed services will not adversely affect the independence of the independent accountants.
Although the Audit Committee will not pre-approve all services provided to Prudential Investments LLC and its affiliates, the Committee will receive an annual report from the Fund’s independent accounting firm showing the aggregate fees for all services provided to Prudential Investments and its affiliates.
| (e)(2) | Percentage of services referred to in 4(b)- (4)(d) that were approved by the audit committee— |
Not applicable.
| (f) | Percentage of hours expended attributable to work performed by other than full time employees of principal accountant if greater than 50%. |
Not applicable.
Not applicable to Registrant for the fiscal years 2006 and 2005. The aggregate non-audit fees billed by KPMG for services rendered to the registrant’s investment adviser and any entity controlling, controlled by, or under common control with the investment adviser that provides ongoing services to the registrant for the fiscal years 2006 and 2005 was $317,300 and $50,087, respectively.
| (h) | Principal Accountant’s Independence |
Not applicable as KPMG has not provided non-audit services to the registrant’s investment adviser and any entity controlling, controlled by, or under common control with the investment adviser that provides ongoing services to the registrant that were not pre-approved pursuant to Rule 2-01(c)(7)(ii) of Regulation S-X.
Item 5—Audit Committee of Listed Registrants—Not applicable.
Item 6—Schedule of Investments—The schedule is included as part of the report to shareholders filed under Item 1 of this Form.
Item 7—Disclosure of Proxy Voting Policies and Procedures for Closed-End Management Investment Companies—Not applicable.
Item 8—Portfolio Managers of Closed-End Management Investment Companies—Not applicable.
Item 9—Purchases of Equity Securities by Closed-End Management Investment Company and Affiliated Purchasers—Not applicable.
Item 10—Submission of Matters to a Vote of Security Holders—Not applicable.
Item 11—Controls and Procedures
| | (a) | It is the conclusion of the registrant’s principal executive officer and principal financial officer that the effectiveness of the registrant’s current disclosure controls and procedures (such disclosure controls and procedures having been evaluated within 90 days of the date of this filing) provide reasonable assurance that the information required to be disclosed by the registrant has been recorded, processed, summarized and reported within the time period specified in the Commission’s rules and forms and that the information required to be disclosed by the registrant has been accumulated and communicated to the registrant’s principal executive officer and principal financial officer in order to allow timely decisions regarding required disclosure. |
| | (b) | There has been no significant change in the registrant’s internal control over financial reporting that occurred during the registrant’s most recent fiscal quarter of the period covered by this report that has materially affected, or is likely to materially affect, the registrant’s internal control over financial reporting. |
Item 12—Exhibits
| | (a) | (1) Code of Ethics – Attached hereto as Exhibit EX-99.CODE-ETH |
(2) Certifications pursuant to Section 302 of the Sarbanes-Oxley Act—Attached hereto as Exhibit EX-99.CERT.
(3) Any written solicitation to purchase securities under Rule 23c-1.—Not applicable.
| | (b) | Certifications pursuant to Section 906 of the Sarbanes-Oxley Act—Attached hereto as Exhibit EX-99.906CERT. |
SIGNATURES
Pursuant to the requirements of the Securities Exchange Act of 1934 and the Investment Company Act of 1940, the registrant has duly caused this report to be signed on its behalf by the undersigned, thereunto duly authorized.
(Registrant) MoneyMart Assets, Inc.
By (Signature and Title)* /s/ Deborah A. Docs
Deborah A. Docs
Secretary
Date February 23, 2007
Pursuant to the requirements of the Securities Exchange Act of 1934 and the Investment Company Act of 1940, this report has been signed below by the following persons on behalf of the registrant and in the capacities and on the dates indicated.
By (Signature and Title)* /s/ Judy A. Rice
Judy A. Rice
President and Principal Executive Officer
Date February 23, 2007
By (Signature and Title)* /s/ Grace C. Torres
Grace C. Torres
Treasurer and Principal Financial Officer
Date February 23, 2007
| * | Print the name and title of each signing officer under his or her signature. |