UNITED STATES
SECURITIES AND EXCHANGE COMMISSION
Washington, D.C. 20549
FORM N-CSR
CERTIFIED SHAREHOLDER REPORT OF REGISTERED MANAGEMENT
INVESTMENT COMPANIES
| | |
Investment Company Act file number: | | 811-02619 |
MoneyMart Assets, Inc.
|
| Exact name of registrant as specified in charter: |
| | |
Gateway Center 3, 100 Mulberry Street, Newark, New Jersey 07102 |
| Address of principal executive offices: |
Deborah A. Docs
Gateway Center 3,
100 Mulberry Street,
Newark, New Jersey 07102
|
| Name and address of agent for service: |
Registrant’s telephone number, including area code: 800-225-1852
Date of fiscal year end: 7/31/2008
Date of reporting period: 7/31/2008
Item 1 – Reports to Stockholders
ANNUAL REPORT
JULY 31, 2008
MONEYMART ASSETS, INC.

FUND TYPE
Money market
OBJECTIVE
Maximum current income consistent with stability of capital and the maintenance of liquidity
This report is not authorized for distribution to prospective investors unless preceded or accompanied by a current prospectus.
The views expressed in this report and information about the Fund’s portfolio holdings are for the period covered by this report and are subject to change thereafter.
Prudential, Prudential Financial and the Rock Prudential logo are registered service marks of The Prudential Insurance Company of America, Newark, NJ, and its affiliates.
September 15, 2008
Dear Shareholder:
We hope you find the annual report for MoneyMart Assets informative and useful. As a MoneyMart Assets shareholder, you may be thinking about where you can find additional growth opportunities. You could invest in last year’s top-performing asset class and hope history repeats itself or you could stay in cash while waiting for the “right moment” to invest.
Instead, we believe it is better to take advantage of developing domestic and global investment opportunities through a diversified portfolio of stock and bond mutual funds. A diversified asset allocation offers two potential advantages. It helps you manage downside risk by not being overly exposed to any particular asset class, plus it gives you a better opportunity to have at least some of your assets in the right place at the right time. Your financial professional can help you create a diversified investment plan that may include mutual funds covering all the basic asset classes and that reflects your personal investor profile and tolerance for risk. Keep in mind that diversification and asset allocation do not assure a profit or protect against a loss in a declining market.
Thank you for choosing MoneyMart Assets.
Sincerely,

Judy A. Rice, President
MoneyMart Assets, Inc.
Your Fund’s Performance
Fund objective
The investment objective of MoneyMart Assets, Inc. is to seek maximum current income consistent with stability of capital and the maintenance of liquidity. There can be no assurance that the Fund will achieve its investment objective.
The Fund is a diversified portfolio of high-quality, U.S. dollar-denominated money market securities issued by the U.S. government, its agencies and instrumentalities, and major corporations and commercial banks in the United States and foreign countries. Maturities can range from one day to 13 months. The Fund generally only purchases securities rated in one of the two highest short-term rating categories or one of the three highest long-term rating categories by at least two major rating agencies, or, if not rated, deemed to be of equivalent quality by the investment subadviser.
Yields will fluctuate from time to time, and past performance does not guarantee future results. Current performance may be lower or higher than the past performance data quoted. The investment return and principal value will fluctuate, and shares, when sold, may be worth more or less than the original cost. For the most recent month-end performance update, call (800) 225-1852. Gross operating expenses: Class A, 0.54%; Class B, 0.42%; Class C, 0.42%; and Class Z, 0.42%.
| | | | | | | | | | | |
| Fund Facts as of 7/31/08 | | | | | | | |
| | | 7-Day
Current Yield | | | Net Asset
Value (NAV) | | Weighted Avg.
Maturity (WAM) | | Net Assets
(Millions) |
Class A | | 1.62 | % | | $ | 1.00 | | 30 Days | | $ | 752.4 |
Class B* | | 1.74 | | | $ | 1.00 | | 30 Days | | $ | 69.6 |
Class C* | | 1.74 | | | $ | 1.00 | | 30 Days | | $ | 21.4 |
Class Z* | | 1.74 | | | $ | 1.00 | | 30 Days | | $ | 178.3 |
iMoneyNet, Inc. Prime Retail Avg.** | | 1.83 | | | | N/A | | 50 Days | | | N/A |
| * | Class B, Class C, and Class Z shares are not subject to distribution and service (12b-1) fees. |
| ** | iMoneyNet, Inc. regularly reports a 7-day current yield and WAM on Tuesdays. This is based on the data of all funds in the iMoneyNet, Inc. Prime Retail Average category as of July 29, 2008, the closest reported date prior to the end of our reporting period. |
An investment in the Fund is not insured or guaranteed by the Federal Deposit Insurance Corporation or any other government agency. Although the Fund seeks to preserve the value of your investment at $1 per share, it is possible to lose money by investing in the Fund.
| | |
| 2 | | Visit our website at www.jennisondryden.com |
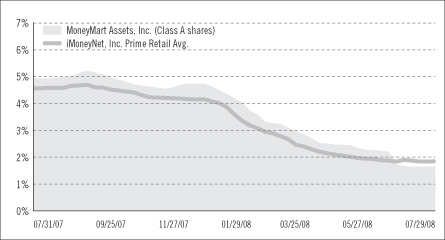
Money Market Fund Yield Comparison
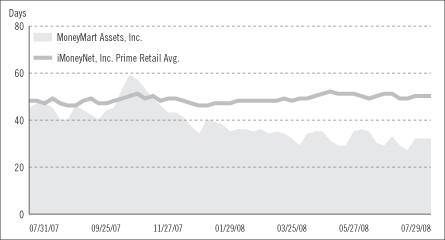
Weighted Average Maturity Comparison
Yields will fluctuate from time to time, and past performance does not guarantee future results. Current performance may be lower or higher than the past performance data quoted. The investment return and principal value will fluctuate, and shares, when sold, may be worth more or less than the original cost. For the most recent month-end performance update, call (800) 225-1852. Gross operating expenses: Class A, 0.54%; Class B, 0.42%; Class C, 0.42%; and Class Z, 0.42%.
The graphs portray weekly 7-day current yields and weekly WAMs for MoneyMart Assets, Inc. (Class A shares—yields only) and the iMoneyNet, Inc. Prime Retail Average every Tuesday from July 31, 2007 to July 29, 2008, the closest dates to the beginning and end of the Fund’s reporting period. Note: iMoneyNet, Inc. regularly reports a 7-day current yield and WAM on Tuesdays. As a result, the data portrayed for the Fund at the end of the reporting period in the graphs may not match the data portrayed in the Fund Facts table as of July 31, 2008.
An investment in the Fund is not insured or guaranteed by the Federal Deposit Insurance Corporation or any other government agency. Although the Fund seeks to preserve the value of your investment at $1 per share, it is possible to lose money by investing in the Fund.
Strategy and Performance Overview
How did the Fund perform?
The Fund provided competitive yields compared to the average comparable portfolio for the 12-month reporting period ended July 31, 2008. The net asset value of its four share classes also remained at $1.00 per share.
How is the Fund managed?
Prudential Fixed Income Management employs a team-based approached to manage the Fund. Research plays a key role in this process. Senior investment professionals develop a quarterly market outlook that provides an overall view on the economy, interest rates, the yield curve, and risk levels in the major bond markets. This outlook helps set broad investment strategies for the Fund. In selecting investments for the Fund, portfolio managers work closely with credit research analysts.
What were conditions like in the credit markets?
The reporting period was characterized by heightened stress in the U.S. financial system, a subsequent aversion to risky investments, and declining interest rates. Growing doubts about the credit worthiness of debt securities linked to subprime mortgages in the United States caused credit markets to seize up in August 2007. Concerned that the U.S. economy would suffer in the wake of financial institutions’ multibillion-dollar write-downs on mortgage-related debt securities, the Federal Reserve (the Fed) initially cut short-term rates by 50 basis points in 2007. (A basis point equals one one-hundredth of a percentage point). This lowered its target for the federal funds rate charged on overnight loans between banks to 4.75%.
Shortly thereafter, it became apparent the magnitude of the financial crisis required more aggressive and inventive measures to ease stress in the credit markets. Consequently, the Fed cut short-term rates another 275 basis points from October 2007 through April 2008, leaving its target for the federal funds rate on overnight loans between banks at 2.00%. Sharply lower borrowing costs for businesses and consumers might help stimulate growth in an economy that had possibly slid into a recession. Fed policymakers also unveiled several innovative steps aimed at boosting liquidity in the financial markets. Most notably, it allowed Wall Street investment banks to borrow from its discount window on much the same terms as commercial banks.
How did the Fund invest during the reporting period?
Yields on money market securities declined sharply in sympathy with short-term rates. In a falling-rate environment, usually the most effective approach is to slow the decline in a portfolio’s yield by locking in yields on money market securities maturing in six months to one year. Yet Prudential Fixed Income Management adopted a different strategy better suited to the heightened uncertainty and impaired liquidity permeating the credit markets.
| | |
| 4 | | Visit our website at www.jennisondryden.com |
Prudential Fixed Income Management increasingly employed a very conservative approach by investing primarily in high quality money market securities that matured in three months or less. As a result of this emphasis, the Fund’s weighted average maturity (WAM) was positioned significantly shorter than that of the average comparable portfolio for much of its reporting period. (WAM measures a portfolio’s sensitivity to changes in the level of interest rates. It considers the maturity and quantity of each security held in a portfolio.) At the end of its fiscal year, the Fund still had a diversified portfolio of high quality money market securities and is well positioned to ride out the currently unstable financial environment.
Fees and Expenses (Unaudited)
As a shareholder of the Fund, you incur two types of costs: (1) transaction costs, including sales charges (loads) on purchase payments and redemptions, as applicable, and (2) ongoing costs, including management fees, distribution and/or service (12b-1) fees, and other Fund expenses, as applicable. This example is intended to help you understand your ongoing costs (in dollars) of investing in the Fund and to compare these costs with the ongoing costs of investing in other mutual funds.
The example is based on an investment of $1,000 invested on February 1, 2008, at the beginning of the period, and held through the six-month period ended July 31, 2008. The example is for illustrative purposes only; you should consult the Prospectus for information on initial and subsequent minimum investment requirements.
The Fund’s transfer agent may charge additional fees to holders of certain accounts that are not included in the expenses shown in the table on the following page. These fees apply to individual retirement accounts (IRAs) and Section 403(b) accounts. As of the close of the seven-month period covered by the table, IRA fees included an annual maintenance fee of $15 per account (subject to a maximum annual maintenance fee of $25 for all accounts held by the same shareholder). Section 403(b) accounts are charged an annual $25 fiduciary maintenance fee. Some of the fees may vary in amount, or may be waived, based on your total account balance or the number of JennisonDryden Funds, including the Fund, that you own. You should consider the additional fees that were charged to your Fund account over the six-month period when you estimate the total ongoing expenses paid over the period and the impact of these fees on your ending account value, as these additional expenses are not reflected in the information provided in the expense table. Additional fees have the effect of reducing investment returns.
Actual Expenses
The first line for each share class in the table on the following page provides information about actual account values and actual expenses. You may use the information on this line, together with the amount you invested, to estimate the expenses that you paid over the period. Simply divide your account value by $1,000 (for example, an $8,600 account value ÷ $1,000 = 8.6), then multiply the result by the number on the first line under the heading “Expenses Paid During the Six-Month Period” to estimate the expenses you paid on your account during this period.
Hypothetical Example for Comparison Purposes
The second line for each share class in the table on the following page provides information about hypothetical account values and hypothetical expenses based on
| | |
| 6 | | Visit our website at www.jennisondryden.com |
the Fund’s actual expense ratio and an assumed rate of return of 5% per year before expenses, which is not the Fund’s actual return. The hypothetical account values and expenses may not be used to estimate the actual ending account balance or expenses you paid for the period. You may use this information to compare the ongoing costs of investing in the Fund and other funds. To do so, compare this 5% hypothetical example with the 5% hypothetical examples that appear in the shareholder reports of the other funds.
Please note that the expenses shown in the table are meant to highlight your ongoing costs only and do not reflect any transactional costs such as sales charges (loads). Therefore, the second line for each share class in the table is useful in comparing ongoing costs only and will not help you determine the relative total costs of owning different funds. In addition, if these transactional costs were included, your costs would have been higher.
| | | | | | | | | | | | | | |
MoneyMart
Assets, Inc. | | Beginning Account
Value
February 1, 2008 | | Ending Account
Value July 31, 2008 | | Annualized
Expense Ratio
Based on the
Six-Month Period | | | Expenses Paid
During the
Six-Month Period* |
| | | | | | | | | | | | | | |
| Class A | | Actual | | $ | 1,000.00 | | $ | 1,013.20 | | 0.58 | % | | $ | 2.90 |
| | | Hypothetical | | $ | 1,000.00 | | $ | 1,021.98 | | 0.58 | % | | $ | 2.92 |
| | | | | | | | | | | | | | |
| Class B | | Actual | | $ | 1,000.00 | | $ | 1,013.80 | | 0.45 | % | | $ | 2.25 |
| | | Hypothetical | | $ | 1,000.00 | | $ | 1,022.63 | | 0.45 | % | | $ | 2.26 |
| | | | | | | | | | | | | | |
| Class C | | Actual | | $ | 1,000.00 | | $ | 1,013.80 | | 0.45 | % | | $ | 2.25 |
| | | Hypothetical | | $ | 1,000.00 | | $ | 1,022.63 | | 0.45 | % | | $ | 2.26 |
| | | | | | | | | | | | | | |
| Class Z | | Actual | | $ | 1,000.00 | | $ | 1,013.80 | | 0.45 | % | | $ | 2.25 |
| | | Hypothetical | | $ | 1,000.00 | | $ | 1,022.63 | | 0.45 | % | | $ | 2.26 |
| | | | | | | | | | | | | | |
* Fund expenses (net of fee waivers or subsidies, if any) for each share class are equal to the annualized expense ratio for each share class (provided in the table), multiplied by the average account value over the period, multiplied by the 182 days in the six-month period ended July 31, 2008, and divided by the 366 days in the Fund’s fiscal year ended July 31, 2008 (to reflect the six-month period). Expenses presented in the table include the expenses of any underlying portfolios in which the Fund may invest.
Portfolio of Investments
as of July 31, 2008
| | | | | | |
Principal
Amount (000) | | Description | | Value (Note 1) |
| | | | | | |
| | | | | | |
| | Certificates of Deposit 13.4% | | | |
| $ | 30,000 | | Banco Bilbao Vizcaya Argentaria SA
2.60%, 8/22/08 | | $ | 30,000,000 |
| | | BNP Paribas Bank | | | |
| | 20,000 | | 2.58%, 8/20/08 | | | 20,000,000 |
| | 25,000 | | 2.65%, 9/3/08 | | | 25,000,000 |
| | | Branch Banking & Trust Co. | | | |
| | 11,000 | | 2.60%, 8/15/08 | | | 11,000,000 |
| | 11,000 | | 2.71%, 11/17/08 | | | 11,000,000 |
| | 20,000 | | National Bank of Canada
2.81%, 9/24/08 | | | 20,000,000 |
| | 20,000 | | Sanpaolo IMI S.P.A.
2.80%, 10/7/08 | | | 19,999,823 |
| | | | | | |
| | | | | | 136,999,823 |
| | | | | | |
| |
| | Commercial Paper 40.2% | | | |
| | | Bank of America Corp. | | | |
| | 24,000 | | 2.565%, 8/13/08(a) | | | 23,979,480 |
| | 5,000 | | 2.57%, 8/21/08(a) | | | 4,992,861 |
| | | CBA (Delaware) Finance, Inc. | | | |
| | 25,000 | | 2.62%, 9/17/08(a) | | | 24,914,486 |
| | 9,200 | | 2.62%, 9/26/08(a) | | | 9,162,505 |
| | | Citigroup Funding, Inc. | | | |
| | 9,000 | | 2.73%, 8/25/08(a) | | | 8,983,620 |
| | 22,000 | | 2.80%, 8/13/08(a) | | | 21,979,467 |
| | 10,000 | | 2.80%, 8/18/08(a) | | | 9,986,778 |
| | 5,000 | | 2.80%, 8/20/08(a), 144A | | | 4,992,611 |
| | | Danske Corp., 144A | | | |
| | 10,000 | | 2.50%, 8/15/08(a) | | | 9,990,278 |
| | 37,000 | | 2.72%, 10/10/08(a) | | | 36,804,310 |
| | 18,588 | | DnB NOR Bank ASA, 144A
2.64%, 9/17/08(a) | | | 18,523,933 |
| | 13,281 | | Dresdner U.S. Finance, Inc.
2.20%, 8/1/08(a) | | | 13,281,000 |
| | | General Electric Capital Corp. | | | |
| | 19,000 | | 2.38%, 8/18/08(a) | | | 18,978,646 |
| | 10,000 | | 2.61%, 11/12/08(a) | | | 9,925,325 |
| | 32,606 | | JPMorgan Chase & Co.
2.63%, 10/9/08(a) | | | 32,441,638 |
| | 4,718 | | KBC Financial Products International Ltd., 144A
2.75%, 10/2/08(a) | | | 4,695,655 |
See Notes to Financial Statements.
Portfolio of Investments
as of July 31, 2008 continued
| | | | | | |
Principal
Amount (000) | | Description | | Value (Note 1) |
| | | | | | |
| |
| | Commercial Paper (cont’d.) | | | |
| | | Nokia Corp., 144A | | | |
| $ | 10,000 | | 2.40%, 8/5/08(a) | | $ | 9,997,333 |
| | 20,000 | | 2.40%, 8/11/08(a) | | | 19,986,667 |
| | | Old Line Funding LLC, 144A | | | |
| | 15,000 | | 2.53%, 8/15/08(a) | | | 14,985,242 |
| | 7,000 | | 2.55%, 8/20/08(a) | | | 6,990,579 |
| | 12,000 | | Prudential PLC*
2.78%, 10/24/08(a) | | | 11,922,160 |
| | | Reckett Benckiser Group PLC, 144A | | | |
| | 3,000 | | 2.70%, 9/19/08(a) | | | 2,988,975 |
| | 3,000 | | 2.70%, 9/22/08(a) | | | 2,988,300 |
| | 2,500 | | Swedbank AB
2.82%, 8/18/08(a) | | | 2,496,671 |
| | | Swedbank Mortgage AB | | | |
| | 10,472 | | 2.74%, 8/15/08(a) | | | 10,460,842 |
| | 25,000 | | 2.75%, 8/26/08(a) | | | 24,952,257 |
| | | Tulip Funding Corp., 144A | | | |
| | 15,000 | | 2.55%, 8/12/08(a) | | | 14,988,313 |
| | 25,000 | | 2.55%, 8/14/08(a) | | | 24,976,979 |
| | 9,000 | | Westpac Securities NZ LT, 144A
2.994%, 1/28/09(a) | | | 9,000,000 |
| | | | | | |
| | | | | | 410,366,911 |
| | | | | | |
| |
| | Loan Participation 1.0% | | | |
| | 10,000 | | Cargill Global Funding PLC
2.44%, 8/14/08(c) | | | 10,000,000 |
| | | | | | |
| |
| | Other Corporate Obligations 30.5% | | | |
| | 20,000 | | Bank of America Corp., Notes
2.998%, 8/6/09(b) | | | 20,000,000 |
| | 3,000 | | General Electric Capital Corp., MTN
3.00%, 2/2/09(b) | | | 3,000,501 |
| | 20,000 | | Goldman Sachs Group, Inc., 144A
3.00%, 9/26/08(c) | | | 20,000,000 |
| | 10,000 | | HSBC Finance Corp.,
2.48%, 9/6/08(b) | | | 10,000,000 |
| | 30,000 | | HSBC USA, Inc., MTN
2.467%, 8/15/08(b) | | | 30,000,000 |
| | 40,000 | | Irish Life & Permanent PLC, MTN, 144A
2.508%, 8/20/08(b) | | | 39,999,962 |
See Notes to Financial Statements.
| | |
| 10 | | Visit our website at www.jennisondryden.com |
| | | | | | | |
Principal
Amount (000) | | Description | | Value (Note 1) | |
| | | | | | | |
| |
| | Other Corporate Obligations (cont’d.) | | | | |
| $ | 15,000 | | JPMorgan Chase & Co., MTN
2.462%, 9/2/08(b) | | $ | 15,000,000 | |
| | 5,000 | | Kommunalkredit Austria AG, 144A
2.489%, 8/22/08(b) | | | 5,000,000 | |
| | 38,800 | | Morgan Stanley Dean Witter Co., MTN
2.611%, 10/31/08(b) | | | 38,800,000 | |
| | 40,000 | | Nordea Bank AB, MTN, 144A
3.149%, 8/24/09(b) | | | 40,000,000 | |
| | 40,000 | | Skandinaviska Enskilda Banken AB
2.486%, 8/19/08(b) | | | 40,000,000 | |
| | 35,000 | | Wells Fargo & Co., MTN
2.521%, 9/3/08(b) | | | 35,000,000 | |
| | 15,000 | | Wells Fargo Bank NA
2.41%, 8/4/08(b) | | | 15,000,000 | |
| | | | | | | |
| | | | | | 311,800,463 | |
| | | | | | | |
| |
| | U.S. Government Agency Obligations 15.8% | | | | |
| | | Federal Home Loan Bank, Notes, | | | | |
| | 18,000 | | 2.18%, 2/19/09(b) | | | 18,000,000 | |
| | 24,000 | | 2.21%, 2/23/09(b) | | | 24,000,000 | |
| | 24,000 | | 2.255%, 2/27/09(b) | | | 24,000,000 | |
| | 25,000 | | 2.29%, 3/27/09(b) | | | 25,000,000 | |
| | 9,000 | | 2.358%, 2/17/09(b) | | | 9,000,000 | |
| | | Federal Home Loan Bank, Discount Notes, | | | | |
| | 11,000 | | 2.442%, 9/17/08(e) | | | 10,965,892 | |
| | 25,000 | | 2.551%, 9/24/08(e) | | | 24,907,000 | |
| | 26,000 | | Federal Home Loan Mortgage Corp., Discount Note,
2.468%, 9/22/08(e) | | | 25,909,867 | |
| | | | | | | |
| | | | | | 161,782,759 | |
| | | | | | | |
| | | Total Investments 100.9%
(amortized cost $1,030,949,956)(d) | | | 1,030,949,956 | |
| | | Liabilities in excess of other assets (0.9%) | | | (9,367,512 | ) |
| | | | | | | |
| | | Net Assets 100.0% | | $ | 1,021,582,444 | |
| | | | | | | |
| * | Not affiliated with Prudential Financial, Inc. |
MTN—Medium Term Note.
144A—Security was purchased pursuant to Rule 144A under the Securities Act of 1933 and may not be resold subject to that rule except to qualified institutional buyers. Unless otherwise noted, 144A securities are deemed to be liquid.
| (a) | Rate quoted represents yield-to-maturity as of purchase date. |
See Notes to Financial Statements.
| | |
| MoneyMart Assets, Inc. | | 11 |
Portfolio of Investments
as of July 31, 2008 continued
| (b) | Floating Rate Security. The interest rate shown reflects the rate in effect at July 31, 2008. |
| (c) | Indicates a security that has been deemed illiquid. |
| (d) | The cost of securities for federal income tax purposes is substantially the same as for financial reporting purposes. |
| (e) | Represents a zero coupon bond. Rate shown reflects the effective yield at the time of purchase. |
The industry classification of portfolio holdings and liabilities in excess of other assets shown as a percentage of net assets as of July 31, 2008 was as follows:
| | | |
Foreign Banks | | 29.9 | % |
Commercial Banks | | 16.2 | |
U.S. Government Agency Obligations | | 15.8 | |
Non-Captive Finance | | 13.7 | |
Security Brokers & Dealers | | 8.9 | |
Asset Backed Securities | | 6.1 | |
Mortgage Banks | | 3.7 | |
Telecom | | 2.9 | |
Life Insurance | | 1.2 | |
Foods | | 1.0 | |
Financial Services | | 0.9 | |
Consumer | | 0.6 | |
| | | |
| | 100.9 | |
Liabilities in excess of other assets | | (0.9 | ) |
| | | |
| | 100.0 | % |
| | | |
See Notes to Financial Statements.
| | |
| 12 | | Visit our website at www.jennisondryden.com |
Financial Statements
| | |
| JULY 31, 2008 | | ANNUAL REPORT |
MoneyMart Assets, Inc.
Statement of Assets and Liabilities
as of July 31, 2008
| | | |
Assets | | | |
Investments, at amortized cost which approximates market value | | $ | 1,030,949,956 |
Receivable for Fund shares sold | | | 17,923,920 |
Interest receivable | | | 1,451,272 |
Prepaid expenses | | | 6,307 |
| | | |
Total assets | | | 1,050,331,455 |
| | | |
| |
Liabilities | | | |
Payable for investments purchased | | | 20,000,000 |
Payable for Fund shares reacquired | | | 6,230,526 |
Accrued expenses | | | 1,623,229 |
Dividends payable | | | 366,243 |
Management fee payable | | | 263,903 |
Transfer agent fee payable | | | 112,200 |
Distribution fee payable | | | 78,218 |
Deferred directors’ fees | | | 66,625 |
Payable to custodian | | | 8,067 |
| | | |
Total liabilities | | | 28,749,011 |
| | | |
| |
Net Assets | | $ | 1,021,582,444 |
| | | |
| | | | |
Net assets were comprised of: | | | |
Common stock, at par ($.001 par value; 20 billion shares authorized for issuance) | | $ | 1,021,574 |
Paid-in capital in excess of par | | | 1,020,560,870 |
| | | |
Net assets, July 31, 2008 | | $ | 1,021,582,444 |
| | | |
See Notes to Financial Statements.
| | |
| 14 | | Visit our website at www.jennisondryden.com |
| | | |
Class A | | | |
Net asset value, offering price and redemption price per share
($752,350,208 ÷ 752,342,635 shares of common stock issued and outstanding) | | $ | 1.00 |
| | | |
| |
Class B | | | |
Net asset value, offering price and redemption price per share
($69,589,953 ÷ 69,589,558 shares of common stock issued and outstanding) | | $ | 1.00 |
| | | |
| |
Class C | | | |
Net asset value, offering price and redemption price per share | | | |
($21,352,730 ÷ 21,352,471 shares of common stock issued and outstanding) | | $ | 1.00 |
| | | |
| |
Class Z | | | |
Net asset value, offering price and redemption price per share
($178,289,553 ÷ 178,289,553 shares of common stock issued and outstanding) | | $ | 1.00 |
| | | |
See Notes to Financial Statements.
| | |
| MoneyMart Assets, Inc. | | 15 |
Statement of Operations
Year Ended July 31, 2008
| | | |
Net Investment Income | | | |
Income | | | |
Interest | | $ | 39,441,039 |
| | | |
| |
Expenses | | | |
Management fee | | | 2,966,956 |
Distribution fee—Class A | | | 873,533 |
Transfer agent’s fees and expenses (including affiliated expense of $614,000) (Note 3) | | | 614,000 |
Reports to shareholders | | | 150,000 |
Custodian’s fees and expenses | | | 90,000 |
Registration fees | | | 80,000 |
Legal fees and expenses | | | 30,000 |
Directors’ fees | | | 20,000 |
Audit fee | | | 19,000 |
Insurance | | | 11,000 |
Interest expense (Note 5) | | | 2,023 |
Miscellaneous | | | 9,915 |
| | | |
Total expenses | | | 4,866,427 |
| | | |
Net investment income | | | 34,574,612 |
| | | |
| |
Net Realized Gain On Investments | | | |
Net realized gain on investment transactions | | | 77,264 |
| | | |
Net Increase In Net Assets Resulting From Operations | | $ | 34,651,876 |
| | | |
See Notes to Financial Statements.
| | |
| 16 | | Visit our website at www.jennisondryden.com |
Statement of Changes in Net Assets
| | | | | | | | | | | | |
| | | Year Ended
July 31,
2008 | | | Seven Months
Ended
July 31,
2007 | | | Year Ended
December 31,
2006 | |
Increase (Decrease) In Net Assets | | | | | | | | | | | | |
Operations | | | | | | | | | | | | |
Net investment income | | $ | 34,574,612 | | | $ | 24,678,640 | | | $ | 40,507,180 | |
Net realized gain on investment transactions | | | 77,264 | | | | 280 | | | | 3,717 | |
| | | | | | | | | | | | |
Net increase in net assets resulting from operations | | | 34,651,876 | | | | 24,678,920 | | | | 40,510,897 | |
| | | | | | | | | | | | |
Dividends to shareholders (Note 1) | | | | | | | | | | | | |
Class A | | | (25,003,689 | ) | | | (18,029,235 | ) | | | (28,520,298 | ) |
Class B | | | (2,540,527 | ) | | | (1,947,971 | ) | | | (3,469,005 | ) |
Class C | | | (567,710 | ) | | | (371,307 | ) | | | (606,698 | ) |
Class Z | | | (6,539,950 | ) | | | (4,330,407 | ) | | | (7,914,896 | ) |
| | | | | | | | | | | | |
| | | (34,651,876 | ) | | | (24,678,920 | ) | | | (40,510,897 | ) |
| | | | | | | | | | | | |
| | | |
Fund share transactions (Note 4)
(at $1.00 per share) | | | | | | | | | | | | |
Net proceeds from shares sold | | | 1,751,125,165 | | | | 789,872,196 | | | | 1,887,263,370 | |
Net asset value of shares issued to shareholders in reinvestment of dividends | | | 34,543,045 | | | | 23,387,746 | | | | 39,616,340 | |
Cost of shares reacquired | | | (1,643,316,580 | ) | | | (819,921,911 | ) | | | (2,021,725,130 | ) |
| | | | | | | | | | | | |
Net increase (decrease) in net assets from Fund share transactions | | | 142,351,630 | | | | (6,661,969 | ) | | | (94,845,420 | ) |
| | | | | | | | | | | | |
Total increase (decrease) | | | 142,351,630 | | | | (6,661,969 | ) | | | (94,845,420 | ) |
| | | |
Net Assets | | | | | | | | | | | | |
Beginning of period | | | 879,230,814 | | | | 885,892,783 | | | | 980,738,203 | |
| | | | | | | | | | | | |
End of period | | $ | 1,021,582,444 | | | $ | 879,230,814 | | | $ | 885,892,783 | |
| | | | | | | | | | | | |
See Notes to Financial Statements.
| | |
| MoneyMart Assets, Inc. | | 17 |
Notes to Financial Statements
MoneyMart Assets, Inc. (the “Fund”) is registered under the Investment Company Act of 1940 as a diversified, open-end management investment company. The Fund invests primarily in a portfolio of money market instruments maturing in thirteen months or less whose ratings are within the two highest rating categories by a nationally recognized statistical rating organization or, if not rated, are of comparable quality. The ability of the issuers of the securities held by the Fund to meet their obligations may be affected by economic developments in a specific industry or region.
The Fund’s fiscal year had changed from an annual reporting period that ended December 31 to one that ends July 31. This change should have no impact on the way the Fund is managed. Shareholders will receive future annual and semi-annual reports on the new fiscal year-end schedule.
Note 1. Accounting Policies
The following is a summary of significant accounting policies followed by the Fund in the preparation of its financial statements.
Securities Valuations: Portfolio securities are valued at amortized cost, which approximates market value. The amortized cost method involves valuing a security at its cost on the date of purchase and thereafter assuming a constant amortization to maturity of any discount or premium. If the amortized cost method is determined not to represent fair value, the fair value shall be determined by or under the direction of the Board of Directors. When determining the fair valuation of securities some of the factors influencing the valuation include the nature of any restrictions on disposition of the securities; assessment of the general liquidity of the securities; the issuer’s financial condition and the markets in which it does business; the cost of the investment; the size of the holding and the capitalization of issuer; the prices of any recent transactions or bids/offers for such securities or any comparable securities; any available analyst media or other reports or information deemed reliable by the investment adviser regarding the issuer or the markets or industry in which it operates.
Securities Transactions and Net Investment Income: Securities transactions are recorded on the trade date. Realized gains or losses on sales of securities are calculated on the identified cost basis. Interest income including amortization of premium and accretion of discount on debt securities, as required, is recorded on the accrual basis. Expenses are recorded on the accrual basis.
| | |
| 18 | | Visit our website at www.jennisondryden.com |
Net investment income or loss (other than distribution fees, which are charged directly to the respective class) and realized gains or losses are allocated daily to each class of shares based upon the relative proportion of net assets of each class at the beginning of the day.
Repurchase Agreements: In connection with transactions in repurchase agreements with United States financial institutions, it is the Fund’s policy that its custodian or designated subcustodians under triparty repurchase agreements, as the case may be, take possession of the underlying collateral securities, the value of which exceeds the principal amount of the repurchase transactions, including accrued interest. To the extent that any repurchase transaction exceeds one business day, the value of the collateral is marked to market on a daily basis to ensure the adequacy of the collateral. If the seller defaults and the value of the collateral declines or if bankruptcy proceedings are commenced with respect to the seller of the security, realization of the collateral by the Fund may be delayed or limited.
Loan Participations: The Fund may invest in loan participations. When the Fund purchases a loan participation, the Fund typically enters into a contractual relationship with the lender or third party selling such participations (“Selling Participant”), but not the borrower. As a result, the Fund assumes the credit risk of the borrower, the selling participant and any other persons interpositioned between the Fund and borrower (“intermediate participants”). The Fund may not directly benefit from the collateral supporting the senior loan in which it has purchased the loan participation.
Federal Income Taxes: It is the Fund’s policy to continue to meet the requirements of the Internal Revenue Code applicable to regulated investment companies and to distribute all of its taxable net income and capital gains, if any, to shareholders. Therefore, no federal income tax provision is required.
Dividends and Distributions: The Fund declares daily dividends from net investment income and net realized short-term capital gains or losses. Payment of dividends is made monthly. Dividends and distributions to shareholders, which are determined in accordance with federal income tax regulations and which may differ from generally accepted accounting principles are recorded on the ex-dividend date.
Restricted Securities: The Fund may hold up to 10% of its net assets in illiquid securities, including those which are restricted as to disposition under securities law (“restricted securities”). Restricted securities, sometimes referred to as private placements, are valued pursuant to the valuation procedures noted above.
| | |
| MoneyMart Assets, Inc. | | 19 |
Notes to Financial Statements
continued
Estimates: The preparation of the financial statements requires management to make estimates and assumptions that affect the reported amounts and disclosures in the financial statements. Actual results could differ from those estimates.
Note 2. Agreements
The Fund has a management agreement with Prudential Investments LLC (“PI”). Pursuant to this agreement, PI has responsibility for all investment advisory services and supervises the subadvisor’s performance of such services. PI has entered into a subadvisory agreement with Prudential Investment Management, Inc. (“PIM”). The subadvisory agreement provides that PIM will furnish investment advisory services in connection with the management of the Fund. In connection therewith, PIM is obligated to keep certain books and records of the Fund. PI pays for the services of PIM, the cost of compensation of officers of the Fund, occupancy and certain clerical and bookkeeping costs of the Fund. The Fund bears all other costs and expenses.
The management fee paid to PI is accrued daily and payable monthly, at an annual rate of .50 of 1% of the Fund’s average daily net assets up to $50 million and .30 of 1% of the Fund’s average daily net assets in excess of $50 million. The effective management fee rate was .310 of 1% for the year ended July 31, 2008.
The Fund has a distribution agreement with Prudential Investment Management Services LLC (“PIMS”), which acts as the distributor of the Class A, Class B, Class C and Class Z shares of the Fund. The Fund compensates PIMS for distributing and servicing the Fund’s Class A shares pursuant to the plan of distribution at an annual rate of .125 of 1% of the average daily net assets of the Class A shares. The Class A distribution fee is accrued daily and payable monthly. No distribution or service fees are paid to PIMS as distributor of Class B, C or Z shares of the Fund.
PI, PIM and PIMS are indirect, wholly-owned subsidiaries of Prudential Financial, Inc. (“Prudential”).
Note 3. Other Transactions with Affiliates
Prudential Mutual Fund Services LLC (“PMFS”), an affiliate of PI and an indirect, wholly-owned subsidiary of Prudential, serves as the Fund’s transfer agent. Transfer agent’s fees and expenses in the Statement of Operations include certain out-of-pocket and sub-transfer agent expenses paid to non-affiliates, where applicable.
| | |
| 20 | | Visit our website at www.jennisondryden.com |
The Fund pays networking fees to affiliated and unaffiliated broker-dealers including fees related to the services of Pruco LLP (“Pruco”) and First Clearing, LLC (“First Clearing”), affiliates of PI. These networking fees are payments made to broker-dealers that clear mutual fund transactions through a national clearing system. For the year ended July 31, 2008, the Fund incurred approximately $194,500 in total networking fees of which $172,000 was paid to Pruco and First Clearing. These amounts are included in transfer agent’s fees and expenses in the Statement of Operations.
Note 4. Capital
The Fund offers Class A, Class B, Class C and Class Z shares. Class B, C and Z shares are not subject to any distribution and/or service fees and are offered exclusively for sale to a limited group of investors. There are 20 billion authorized shares of $.001 par value common stock divided into four classes, which consist of 13 billion Class A, 2.5 billion Class B, 2.5 billion Class C and 2 billion Class Z shares.
Transactions in shares and dollars of common stock (at $1 net asset value per share) were as follows:
| | | | | | | |
Class A | | Shares | | | Amount | |
Year ended July 31, 2008: | | | | | | | |
Shares sold | | 1,604,991,711 | | | $ | 1,604,999,281 | |
Shares issued in reinvestment of dividends | | 24,998,524 | | | | 24,998,528 | |
Shares reacquired | | (1,524,606,662 | ) | | | (1,524,606,663 | ) |
| | | | | | | |
Net increase (decrease) in shares outstanding | | 105,383,573 | | | $ | 105,391,146 | |
| | | | | | | |
Seven months ended July 31, 2007: | | | | | | | |
Shares sold | | 727,641,391 | | | $ | 727,641,391 | |
Shares issued in reinvestment of dividends | | 17,188,465 | | | | 17,188,465 | |
Shares reacquired | | (750,273,603 | ) | | | (750,273,603 | ) |
| | | | | | | |
Net increase (decrease) in shares outstanding | | (5,443,747 | ) | | $ | (5,443,747 | ) |
| | | | | | | |
Year ended December 31, 2006: | | | | | | | |
Shares sold | | 1,322,985,711 | | | $ | 1,322,985,711 | |
Shares issued in reinvestment of dividends | | 28,012,480 | | | | 28,012,480 | |
Shares reacquired | | (1,396,635,296 | ) | | | (1,396,635,296 | ) |
| | | | | | | |
Net increase (decrease) in shares outstanding | | (45,637,105 | ) | | $ | (45,637,105 | ) |
| | | | | | | |
| | |
| MoneyMart Assets, Inc. | | 21 |
Notes to Financial Statements
continued
| | | | | | | |
Class B | | Shares | | | Amount | |
Year ended July 31, 2008: | | | | | | | |
Shares sold | | 33,711,191 | | | $ | 33,711,559 | |
Shares issued in reinvestment of dividends | | 2,372,559 | | | | 2,372,587 | |
Shares reacquired | | (30,681,829 | ) | | | (30,681,830 | ) |
| | | | | | | |
Net increase (decrease) in shares outstanding | | 5,401,921 | | | $ | 5,402,316 | |
| | | | | | | |
Seven months ended July 31, 2007: | | | | | | | |
Shares sold | | 12,166,754 | | | $ | 12,166,754 | |
Shares issued in reinvestment of dividends | | 1,711,369 | | | | 1,711,369 | |
Shares reacquired | | (20,652,219 | ) | | | (20,652,219 | ) |
| | | | | | | |
Net increase (decrease) in shares outstanding | | (6,774,096 | ) | | $ | (6,774,096 | ) |
| | | | | | | |
Year ended December 31, 2006: | | | | | | | |
Shares sold | | 30,823,981 | | | $ | 30,823,981 | |
Shares issued in reinvestment of dividends | | 3,132,707 | | | | 3,132,707 | |
Shares reacquired | | (46,885,671 | ) | | | (46,885,671 | ) |
| | | | | | | |
Net increase (decrease) in shares outstanding | | (12,928,983 | ) | | $ | (12,928,983 | ) |
| | | | | | | |
Class C | | | | | | |
Year ended July 31, 2008: | | | | | | | |
Shares sold | | 28,700,102 | | | $ | 28,700,361 | |
Shares issued in reinvestment of dividends | | 531,085 | | | | 531,085 | |
Shares reacquired | | (21,300,511 | ) | | | (21,300,511 | ) |
| | | | | | | |
Net increase (decrease) in shares outstanding | | 7,930,676 | | | $ | 7,930,935 | |
| | | | | | | |
Seven months ended July 31, 2007: | | | | | | | |
Shares sold | | 14,517,190 | | | $ | 14,517,190 | |
Shares issued in reinvestment of dividends | | 329,471 | | | | 329,471 | |
Shares reacquired | | (13,797,422 | ) | | | (13,797,422 | ) |
| | | | | | | |
Net increase (decrease) in shares outstanding | | 1,049,239 | | | $ | 1,049,239 | |
| | | | | | | |
Year ended December 31, 2006: | | | | | | | |
Shares sold | | 28,306,445 | | | $ | 28,306,445 | |
Shares issued in reinvestment of dividends | | 555,954 | | | | 555,954 | |
Shares reacquired | | (27,371,991 | ) | | | (27,371,991 | ) |
| | | | | | | |
Net increase (decrease) in shares outstanding | | 1,490,408 | | | $ | 1,490,408 | |
| | | | | | | |
| | |
| 22 | | Visit our website at www.jennisondryden.com |
| | | | | | | |
Class Z | | Shares | | | Amount | |
Year ended July 31, 2008: | | | | | | | |
Shares sold | | 83,713,964 | | | $ | 83,713,964 | |
Shares issued in reinvestment of dividends | | 6,640,845 | | | | 6,640,845 | |
Shares reacquired | | (66,727,576 | ) | | | (66,727,576 | ) |
| | | | | | | |
Net increase (decrease) in shares outstanding | | 23,627,233 | | | $ | 23,627,233 | |
| | | | | | | |
Seven months ended July 31, 2007: | | | | | | | |
Shares sold | | 35,546,861 | | | $ | 35,546,861 | |
Shares issued in reinvestment of dividends | | 4,158,441 | | | | 4,158,441 | |
Shares reacquired | | (35,198,667 | ) | | | (35,198,667 | ) |
| | | | | | | |
Net increase (decrease) in shares outstanding | | 4,506,635 | | | $ | 4,506,635 | |
| | | | | | | |
Year ended December 31, 2006: | | | | | | | |
Shares sold | | 505,147,233 | | | $ | 505,147,233 | |
Shares issued in reinvestment of dividends | | 7,915,199 | | | | 7,915,199 | |
Shares reacquired | | (550,832,172 | ) | | | (550,832,172 | ) |
| | | | | | | |
Net increase (decrease) in shares outstanding | | (37,769,740 | ) | | $ | (37,769,740 | ) |
| | | | | | | |
Note 5. Borrowings
During the year ended July 31, 2008, the Fund paid interest to the custodian for temporary overdrawn balances. The average outstanding balance for 39 days was $583,754 at a weighted average interest rate of 5.46%.
Note 6. Distributions and Tax Information
Distributions to shareholders, which are determined in accordance with federal income tax regulations and which may differ from generally accepted accounting principles, are recorded on the ex-dividend date. In order to present paid-in capital in excess of par on the Statement of Assets and Liabilities that more closely represent their tax character, certain adjustments have been made to overdistribution of net investment income and accumulated realized gain on investment transactions. For the fiscal year ended July 31, 2008, the adjustments were to decrease overdistribution of net investment income and to decrease accumulated realized gain on investment transactions by $77,264 due to reclassification of capital gains into ordinary income. Net investment income, net realized gains and net assets were not affected by this change.
For the year ended July 31, 2008, the tax character of dividends paid, as reflected in the Statement of Changes in Net Assets, was $34,651,876 from ordinary income. For the seven-month period ended July 31, 2007, the tax character of dividends paid was $24,678,920 from ordinary income. For the year ended December 31, 2006, the tax character of dividends paid was $40,510,897 from ordinary income. This differs from the amount shown on the Statement of Assets and Liabilities primarily due to cumulative timing differences.
| | |
| MoneyMart Assets, Inc. | | 23 |
Notes to Financial Statements
continued
As of July 31, 2008, the accumulated undistributed earnings on a tax basis was $432,868 from ordinary income. This includes a dividend payable timing difference of $366,243 as of July 31, 2008.
Management has analyzed the Fund’s tax positions taken on federal income tax returns for all open tax years and has concluded that as of July 31, 2008, no provisions for income tax would be required in the Fund’s financial statements. The Fund’s federal and state income and federal excise tax returns for tax years for which the applicable statuses of limitations have not expired are subject to examination by the Internal Revenue Service and state departments of revenue.
Note 7. New Accounting Pronouncements
On September 20, 2006, the Financial Accounting Standards Board (“FASB”) released Statement of Financial Accounting Standards No. 157 “Fair Value Measurements” (“FAS 157”). FAS 157 establishes an authoritative definition of fair value, sets out a framework for measuring fair value, and requires additional disclosures about fair-value measurements. The application of FAS 157 is required for fiscal years beginning after November 15, 2007 and interim periods within those fiscal years. At this time, management is evaluating the implications of FAS 157 and its impact, if any, on the financial statements has not yet been determined.
In addition, in March 2008, the FASB released Statement of Financial Accounting Standards No. 161, “Disclosures about Derivative Instruments and Hedging Activities” (“FAS 161”). FAS 161 requires qualitative disclosures about objectives and strategies for using derivatives, quantitative disclosures about fair value amounts of and gains and losses on derivative instruments, and disclosures about credit-risk-related contingent features in derivative agreements. The application of FAS 161 is required for any reporting period beginning after November 15, 2008. At this time, management is evaluating the implications of FAS 161 and its impact on the financial statements has not yet been determined.
Note 8. Other
On July 21, 2008, the Board of Directors have approved the merger of Strategic Partners Mutual Funds: Dryden Money Market Fund into MoneyMart Assets, Inc. The merger is subject to the approval by the shareholders of the Dryden Money Market Fund.
| | |
| 24 | | Visit our website at www.jennisondryden.com |
Note 9. Subsequent Events
As noted in the Portfolio of Investments, the Fund held securities issued by Federal Housing Finance Agency. Subsequent to the year end, the Federal Housing Finance Agency has placed Fannie Mae and Freddie Mac into conservatorship. The values of the positions held by the Fund have not been adversely impacted since the date of these financial statements.
| | |
| MoneyMart Assets, Inc. | | 25 |
Financial Highlights
| | | | | | | | |
| | | Class A | |
| | | Year
Ended
July 31, 2008 | | | Seven-Month
Period Ended
July 31, 2007(a) | |
Per Share Operating Performance: | | | | | | | | |
Net Asset Value, Beginning Of Period | | $ | 1.000 | | | $ | 1.000 | |
| | | | | | | | |
Income from investment operations: | | | | | | | | |
Net investment income and net realized gains | | | .037 | | | | .028 | |
Dividends to shareholders | | | (.037 | ) | | | (.028 | ) |
| | | | | | | | |
Net asset value, end of period | | $ | 1.000 | | | $ | 1.000 | |
| | | | | | | | |
Total Return(b): | | | 3.79 | % | | | 2.74 | % |
Ratios/Supplemental Data: | | | | | | | | |
Net assets, end of period (000) | | $ | 752,350 | | | $ | 646,959 | |
Average net assets (000) | | $ | 698,827 | | | $ | 640,915 | |
Ratios to average net assets: | | | | | | | | |
Expenses, including distribution and service (12b-1) fees | | | .54 | % | | | .58 | %(c) |
Expenses, excluding distribution and service (12b-1) fees | | | .42 | % | | | .45 | %(c) |
Net investment income | | | 3.57 | % | | | 4.84 | %(c) |
| (a) | For the seven-month period ended July 31, 2007. The Fund changed its fiscal year end from December 31 to July 31, effective July 31, 2007. |
| (b) | Total return is calculated assuming a purchase of a share on the first day and a sale on the last day of each period reported and includes reinvestment of dividends and distributions. Total returns may reflect adjustments to conform to generally accepted accounting principles. Total returns for periods of less than one full year are not annualized. |
See Notes to Financial Statements.
| | |
| 26 | | Visit our website at www.jennisondryden.com |
| | | | | | | | | | | | | | |
|
| Class A | |
| Year Ended December 31, | |
| 2006 | | | 2005 | | | 2004 | | | 2003 | |
| | | | | | | | | | | | | | |
| $ | 1.000 | | | $ | 1.000 | | | $ | 1.000 | | | $ | 1.000 | |
| | | | | | | | | | | | | | | |
| | | | | | | | | | | | | | |
| | .044 | | | | .025 | | | | .007 | | | | .006 | |
| | (.044 | ) | | | (.025 | ) | | | (.007 | ) | | | (.006 | ) |
| | | | | | | | | | | | | | | |
| $ | 1.000 | | | $ | 1.000 | | | $ | 1.000 | | | $ | 1.000 | |
| | | | | | | | | | | | | | | |
| | 4.46 | % | | | 2.58 | % | | | .70 | % | | | .65 | % |
| | | | | | | | | | | | | | |
| $ | 652,403 | | | $ | 698,040 | | | $ | 890,637 | | | $ | 5,089,405 | |
| $ | 651,453 | | | $ | 786,418 | | | $ | 2,823,600 | | | $ | 6,535,734 | |
| | | | | | | | | | | | | | |
| | .68 | % | | | .80 | % | | | .71 | % | | | .62 | % |
| | .56 | % | | | .67 | % | | | .58 | % | | | .49 | % |
| | 4.38 | % | | | 2.46 | % | | | .54 | % | | | .63 | % |
See Notes to Financial Statements.
| | |
| MoneyMart Assets, Inc. | | 27 |
Financial Highlights
continued
| | | | |
| | | Class B | |
| | | Year
Ended
July 31, 2008 | |
Per Share Operating Performance: | | | | |
Net Asset Value, Beginning Of Period | | $ | 1.000 | |
| | | | |
Income from investment operations: | | | | |
Net investment income and net realized gains | | | .038 | |
Dividends to shareholders | | | (.038 | ) |
| | | | |
Net asset value, end of period | | $ | 1.000 | |
| | | | |
Total Return(c): | | | 3.92 | % |
Ratios/Supplemental Data: | | | | |
Net assets, end of period (000) | | $ | 69,590 | |
Average net assets (000) | | $ | 67,467 | |
Ratios to average net assets: | | | | |
Expenses, including distribution and service (12b-1) fees | | | .42 | % |
Expenses, excluding distribution and service (12b-1) fees | | | .42 | % |
Net investment income | | | 3.76 | % |
| (a) | For the seven-month period ended July 31, 2007. The Fund changed its fiscal year end from December 31 to July 31, effective July 31, 2007. |
| (b) | Commencement of offering. |
| (c) | Total return is calculated assuming a purchase of a share on the first day and a sale on the last day of each period reported and includes reinvestment of dividends and distributions. Total returns may reflect adjustments to conform to generally accepted accounting principles. Total returns for periods of less than one full year are not annualized. |
See Notes to Financial Statements.
| | |
| 28 | | Visit our website at www.jennisondryden.com |
| | | | | | | | | | |
| Class B | |
Seven-Month
Period Ended
July 31, 2007(a) | | | Year
Ended
December 31, 2006 | | | March 11, 2005(b)
through
December 31, 2005 | |
| | | | | | | | | | |
| $ | 1.000 | | | $ | 1.000 | | | $ | 1.000 | |
| | | | | | | | | | | |
| | | | | | | | | | |
| | .029 | | | | .045 | | | | .023 | |
| | (.029 | ) | | | (.045 | ) | | | (.023 | ) |
| | | | | | | | | | | |
| $ | 1.000 | | | $ | 1.000 | | | $ | 1.000 | |
| | | | | | | | | | | |
| | 2.81 | % | | | 4.59 | % | | | 2.37 | % |
| | | | | | | | | | |
| $ | 64,188 | | | $ | 70,962 | | | $ | 83,891 | |
| $ | 67,491 | | | $ | 76,873 | | | $ | 90,153 | |
| | | | | | | | | | |
| | .45 | %(d) | | | .56 | % | | | .65 | %(d) |
| | .45 | %(d) | | | .56 | % | | | .65 | %(d) |
| | 4.97 | %(d) | | | 4.51 | % | | | 2.84 | %(d) |
See Notes to Financial Statements.
| | |
| MoneyMart Assets, Inc. | | 29 |
Financial Highlights
continued
| | | | |
| | | Class C | |
| | | Year
Ended
July 31, 2008 | |
Per Share Operating Performance: | | | | |
Net Asset Value, Beginning Of Period | | $ | 1.000 | |
| | | | |
Income from investment operations: | | | | |
Net investment income and net realized gains | | | .038 | |
Dividends to shareholders | | | (.038 | ) |
| | | | |
Net asset value, end of period | | $ | 1.000 | |
| | | | |
Total Return(c): | | | 3.92 | % |
Ratios/Supplemental Data: | | | | |
Net assets, end of period (000) | | $ | 21,353 | |
Average net assets (000) | | $ | 15,596 | |
Ratios to average net assets: | | | | |
Expenses, including distribution and service (12b-1) fees | | | .42 | % |
Expenses, excluding distribution and service (12b-1) fees | | | .42 | % |
Net investment income | | | 3.63 | % |
| (a) | For the seven-month period ended July 31, 2007. The Fund changed its fiscal year end from December 31 to July 31, effective July 31, 2007. |
| (b) | Commencement of offering. |
| (c) | Total return is calculated assuming a purchase of a share on the first day and a sale on the last day of each period reported and includes reinvestment of dividends and distributions. Total returns may reflect adjustments to conform to generally accepted accounting principles. Total returns for periods of less than one full year are not annualized. |
See Notes to Financial Statements.
| | |
| 30 | | Visit our website at www.jennisondryden.com |
| | | | | | | | | | |
| Class C | |
Seven-Month
Period Ended
July 31, 2007(a) | | | Year
Ended
December 31, 2006 | | | March 11, 2005(b)
through
December 31, 2005 | |
| | | | | | | | | | |
| $ | 1.000 | | | $ | 1.000 | | | $ | 1.000 | |
| | | | | | | | | | | |
| | | | | | | | | | |
| | .029 | | | | .045 | | | | .023 | |
| | (.029 | ) | | | (.045 | ) | | | (.023 | ) |
| | | | | | | | | | | |
| $ | 1.000 | | | $ | 1.000 | | | $ | 1.000 | |
| | | | | | | | | | | |
| | 2.81 | % | | | 4.59 | % | | | 2.37 | % |
| | | | | | | | | | |
| $ | 13,422 | | | $ | 12,373 | | | $ | 10,882 | |
| $ | 12,867 | | | $ | 13,294 | | | $ | 12,218 | |
| | | | | | | | | | |
| | .45 | %(d) | | | .56 | % | | | .65 | %(d) |
| | .45 | %(d) | | | .56 | % | | | .65 | %(d) |
| | 4.97 | %(d) | | | 4.56 | % | | | 2.87 | %(d) |
See Notes to Financial Statements.
| | |
| MoneyMart Assets, Inc. | | 31 |
Financial Highlights
continued
| | | | | | | | |
| | | Class Z | |
| | | Year
Ended
July 31, 2008 | | | Seven-Month
Period Ended
July 31, 2007(a) | |
Per Share Operating Performance: | | | | | | | | |
Net Asset Value, Beginning Of Period | | $ | 1.000 | | | $ | 1.000 | |
| | | | | | | | |
Income from investment operations: | | | | | | | | |
Net investment income and net realized gains | | | .038 | | | | .029 | |
Dividends to shareholders | | | (.038 | ) | | | (.029 | ) |
| | | | | | | | |
Net asset value, end of period | | $ | 1.000 | | | $ | 1.000 | |
| | | | | | | | |
Total Return(b): | | | 3.92 | % | | | 2.81 | % |
Ratios/Supplemental Data: | | | | | | | | |
Net assets, end of period (000) | | $ | 178,289 | | | $ | 154,662 | |
Average net assets (000) | | $ | 173,762 | | | $ | 150,056 | |
Ratios to average net assets: | | | | | | | | |
Expenses, including distribution and service (12b-1) fees | | | .42 | % | | | .45 | %(c) |
Expenses, excluding distribution and service (12b-1) fees | | | .42 | % | | | .45 | %(c) |
Net investment income | | | 3.76 | % | | | 4.97 | %(c) |
| (a) | For the seven-month period ended July 31, 2007. The Fund changed its fiscal year end from December 31 to July 31, effective July 31, 2007. |
| (b) | Total return is calculated assuming a purchase of a share on the first day and a sale on the last day of each period reported and includes reinvestment of dividends and distributions. Total returns may reflect adjustments to conform to generally accepted accounting principles. Total returns for periods of less than one full year are not annualized. |
See Notes to Financial Statements.
| | |
| 32 | | Visit our website at www.jennisondryden.com |
| | | | | | | | | | | | | | |
|
| Class Z | |
| Year Ended December 31, | |
| 2006 | | | 2005 | | | 2004 | | | 2003 | |
| | | | | | | | | | | | | | |
| $ | 1.000 | | | $ | 1.000 | | | $ | 1.000 | | | $ | 1.000 | |
| | | | | | | | | | | | | | | |
| | | | | | | | | | | | | | |
| | .045 | | | | .027 | | | | .008 | | | | .008 | |
| | (.045 | ) | | | (.027 | ) | | | (.008 | ) | | | (.008 | ) |
| | | | | | | | | | | | | | | |
| $ | 1.000 | | | $ | 1.000 | | | $ | 1.000 | | | $ | 1.000 | |
| | | | | | | | | | | | | | | |
| | 4.59 | % | | | 2.70 | % | | | .82 | % | | | .77 | % |
| | | | | | | | | | | | | | |
| $ | 150,156 | | | $ | 187,925 | | | $ | 192,613 | | | $ | 187,718 | |
| $ | 178,667 | | | $ | 187,379 | | | $ | 188,931 | | | $ | 198,143 | |
| | | | | | | | | | | | | | |
| | .56 | % | | | .67 | % | | | .58 | % | | | .49 | % |
| | .56 | % | | | .67 | % | | | .58 | % | | | .49 | % |
| | 4.43 | % | | | 2.64 | % | | | .83 | % | | | .75 | % |
See Notes to Financial Statements.
| | |
| MoneyMart Assets, Inc. | | 33 |
Report of Independent Registered Public Accounting Firm
The Board of Directors and Shareholders of
MoneyMart Assets, Inc.:
We have audited the accompanying statement of assets and liabilities of MoneyMart Assets, Inc. (hereafter referred to as the “Fund”), including the portfolio of investments, as of July 31, 2008, and the related statement of operations for the year then ended, the statement of changes in net assets for the year ended July 31, 2008, for the period January 1, 2007 to July 31, 2007 and the year ended December 31, 2006, and the financial highlights for the year ended July 31, 2008, for the period January 1, 2007 to July 31, 2007 and for each of the years in the four-year period ended December 31, 2006. These financial statements and financial highlights are the responsibility of the Fund’s management. Our responsibility is to express an opinion on these financial statements and financial highlights based on our audits.
We conducted our audits in accordance with the standards of the Public Company Accounting Oversight Board (United States). Those standards require that we plan and perform the audit to obtain reasonable assurance about whether the financial statements and financial highlights are free of material misstatement. An audit includes examining, on a test basis, evidence supporting the amounts and disclosures in the financial statements. Our procedures included confirmation of securities owned as of July 31, 2008, by correspondence with the custodian and brokers or by other appropriate audit procedures when replies from brokers were not received. An audit also includes assessing the accounting principles used and significant estimates made by management, as well as evaluating the overall financial statement presentation. We believe that our audits provide a reasonable basis for our opinion.
In our opinion, the financial statements and financial highlights referred to above present fairly, in all material respects, the financial position of the Fund as of July 31, 2008, and the results of its operations for the year then ended, the changes in its net assets for the year ended July 31, 2008, for the period January 1, 2007 to July 31, 2007 and the year ended December 31, 2006 and the financial highlights for the year ended July 31, 2008, for the period January 1, 2007 to July 31, 2007 and for each of the years in the four-year period ended December 31, 2006, in conformity with U.S. generally accepted accounting principles.

New York, New York
September 26, 2008
| | |
| 34 | | Visit our website at www.jennisondryden.com |
Federal Income Tax Information
(Unaudited)
We are required by the Internal Revenue Code to advise you within 60 days of the Fund’s fiscal year end (July 31, 2008) as to the federal tax status of dividends paid by the Fund during such fiscal year. Accordingly, we are advising you that during its fiscal year ended July 31, 2008, the Fund paid an ordinary income dividends for Class A, Class B, Class C and Class Z shares of $.037, $.038, $.038 and $.038 per share, respectively, which represents net investment income.
We are required by Massachusetts, Missouri and Oregon to inform you that dividends which have been derived from interest on federal obligations are not taxable to shareholders providing the Mutual Fund meets certain requirements mandated by the respective state’s taxing authorities. We are pleased to report that 2.71% of the dividends paid by the Fund qualifies for such deduction.
The Fund designates 100% of the ordinary income dividends paid as interest related dividends under The American Jobs Creation Act of 2004.
Interest-related dividends and short-term capital gain dividends do not include any distributions paid by a Fund with respect to Fund tax years beginning after December 31, 2007. Consequently, this provision expires with respect to such distributions paid after the Fund’s fiscal year end July 31, 2008.
In January 2009, you will be advised on IRS Form 1099 DIV or substitute 1099 DIV as to the federal tax status of the distributions received by you in calendar year 2008.
For more detailed information regarding your state and local taxes, you should contact your tax advisor or the state/local taxing authorities.
| | |
| MoneyMart Assets, Inc. | | 35 |
Supplemental Proxy Information
(Unaudited)
A Special Meeting of Shareholders of MoneyMart Assets, Inc. was held on August 15, 2008. At the Meeting held on August 15, 2008, Shareholders elected Members of the Fund’s Board of Directors, as set forth below:
| | |
David E.A Carson: |
Affirmative: | | 537,766,115.35 |
Withhold: | | 9,032,152.00 |
| |
Robert E. La Blanc: | | |
Affirmative: | | 537,819,163.89 |
Withhold: | | 8,979,103.46 |
| |
Douglas H. McCorkindale: | | |
Affirmative: | | 538,116,286.19 |
Withhold: | | 8,681,981 .I6 |
| |
Linda W. Bynoe: | | |
Affirmative: | | 538,131,298.69 |
Withhold: | | 8,666,968.66 |
| |
Richard A. Redeker: | | |
Affirmative: | | 538,168,245.69 |
Withhold: | | 8,630,021.66 |
| |
Robin B. Smith: | | |
Affirmative: | | 537,954,983.13 |
Withhold: | | 8,843,284.22 |
| |
Stephen G. Stoneburn | | |
Affirmative: | | 538,263,688.89 |
Withhold: | | 8,534,578.46 |
| |
Stephen P. Munn | | |
Affirmative: | | 538,164,951.04 |
Withhold: | | 8,633,316.31 |
| |
Judy A. Rice | | |
Affirmative: | | 538,317,638.38 |
Withhold: | | 8,480,628.97 |
| |
Robert F. Gunia | | |
Affirmative: | | 538,174,005.49 |
Withhold: | | 8,624,261.86 |
| |
Kevin J. Bannon | | |
Affirmative: | | 538,253,587.92 |
Withhold: | | 8,544,679.43 |
| |
Michael S. Hyland | | |
Affirmative: | | 537,893,532.11 |
Withhold: | | 8,904,735.24 |
| | |
| 36 | | Visit our website at www.jennisondryden.com |
MANAGEMENT OF THE FUND
(Unaudited)
Information about Fund Directors/Trustees (referred to herein as “Board Members”) and Fund Officers is set forth below. Board Members who are not deemed to be “interested persons,” as defined in the 1940 Act, are referred to as “Independent Board Members.” Board Members who are deemed to be “interested persons” are referred to as “Interested Board Members.” The Board Members are responsible for the overall supervision of the operations of the Fund and perform the various duties imposed on the directors or trustees of investment companies by the 1940 Act.
| | | | |
| Independent Board Members | | |
Name, Address, Age Position(s) Portfolios Overseen(1) | | Principal Occupation(s) During Past Five Years | | Other Directorships Held |
Kevin J. Bannon (56) Board Member Portfolios Overseen: 63 | | Managing Director (since April 2008) of Highmount Capital LLC (registered investment adviser); formerly Executive Vice President and Chief Investment Officer (January 2003-August 2007) of Bank of New York Company; President (May 2003-May 2007) of BNY Hamilton Family of Mutual Funds. | | None. |
Linda W. Bynoe (56) Board Member Portfolios Overseen: 63 | | President and Chief Executive Officer (since March 1995) of Telemat Ltd. (management consulting); formerly Vice President at Morgan Stanley Co. (broker-dealer). | | Director of Simon Property Group, Inc. (real estate investment trust) (since May 2003); Anixter International (communication products distributor) (since January 2006); Director of Northern Trust Corporation (banking) (since April 2006). |
David E.A. Carson (74) Board Member Portfolios Overseen: 63 | | Director (since May 2008) of Liberty Bank; Director (since October 2007) of ICI Mutual Insurance Company; formerly President, Chairman and Chief Executive Officer of People’s Bank (1987–2000). | | None. |
Michael S. Hyland, CFA (62) Board Member Portfolios Overseen: 63 | | Independent Consultant (since February 2005); formerly Senior Managing Director (July 2001-February 2005) of Bear Stearns Co., Inc. | | None. |
Robert E. La Blanc (74) Board Member Portfolios Overseen: 63 | | President (since 1981) of Robert E. La Blanc Associates, Inc. (telecommunications). | | Director of CA, Inc. (since 2002) (software company); FiberNet Telecom Group, Inc. (since 2003) (telecom company). |
| | | | |
Douglas H. McCorkindale (69) Board Member Portfolios Overseen: 63 | | Formerly Chairman (February 2001-June 2006), Chief Executive Officer (June 2000-July 2005), President (September 1997-July 2005) and Vice Chairman (March 1984-May 2000) of Gannett Co. Inc. (publishing and media). | | Director of Continental Airlines, Inc. (since May 1993); Director of Lockheed Martin Corp. (aerospace and defense) (since May 2001). |
Stephen P. Munn (66) Board Member Portfolios Overseen: 63 | | Lead Director (since 2007) and formerly Chairman (1993-2007) of Carlisle Companies Incorporated (manufacturer of industrial products). | | None. |
Richard A. Redeker (65) Board Member Portfolios Overseen: 63 | | Retired Mutual Fund Executive (36 years); Management Consultant; Director of Penn Tank Lines, Inc. (since 1999). | | None. |
Robin B. Smith (68) Board Member & Independent Chair Portfolios Overseen: 63 | | Chairman of the Board (since January 2003) of Publishers Clearing House (direct marketing); formerly Chairman and Chief Executive Officer (August 1996-January 2003) of Publishers Clearing House. | | Formerly Director of BellSouth Corporation (telecommunications) (1992-2006). |
Stephen G. Stoneburn (65) Board Member Portfolios Overseen: 63 | | President and Chief Executive Officer (since June 1996) of Quadrant Media Corp. (publishing company); formerly President (June 1995-June 1996) of Argus Integrated Media, Inc.; Senior Vice President and Managing Director (January 1993-1995) of Cowles Business Media; Senior Vice President of Fairchild Publications, Inc (1975-1989). | | None. |
| | | | |
| Interested Board Members | | |
Judy A. Rice (60) Board Member & President Portfolios Overseen: 63 | | President, Chief Executive Officer, Chief Operating Officer and Officer-In-Charge (since February 2003) of Prudential Investments LLC; President, Chief Executive Officer and Officer-In-Charge (since April 2003) of Prudential Mutual Fund Services LLC; formerly Vice President (February 1999-April 2006) of Prudential Investment Management Services LLC; formerly President, Chief Executive Officer, Chief Operating Officer and Officer-In-Charge (May 2003-June 2005) and Director (May 2003-March 2006) and Executive Vice President (June 2005-March 2006) of AST Investment Services, Inc.; Member of Board of Governors of the Investment Company Institute. | | None. |
| | |
| | Visit our website at www.jennisondryden.com |
| | | | |
Robert F. Gunia (61) Board Member & Vice President Portfolios Overseen: 147 | | Chief Administrative Officer (since September 1999) and Executive Vice President (since December 1996) of Prudential Investments LLC; President (since April 1999) of Prudential Investment Management Services LLC; Executive Vice President (since March 1999) and Treasurer (since May 2000) of Prudential Mutual Fund Services LLC; Chief Administrative Officer, Executive Vice President and Director (since May 2003) of AST Investment Services, Inc. | | Director (since May 1989) of The Asia Pacific Fund, Inc. and Vice President (since January 2007) of The Greater China Fund, Inc. |
1 | The year that each Board Member joined the Fund’s Board is as follows: |
Kevin J. Bannon, 2008; Linda W. Bynoe, 2008; David E.A. Carson, 2003; Michael S. Hyland, 2008; Robert E. La Blanc, 1996; Douglas H. McCorkindale, 2008; Stephen P. Munn, 2008; Richard A. Redeker, 2008; Robin B. Smith, 1996; Stephen G. Stoneburn, 1996; Judy A. Rice, Director since 2008 and President since 2003; Robert F. Gunia, Vice President since 1999 and Board Member since 1996.
| | |
| Fund Officers (a)(1) | | |
Name, Address and Age Position with Fund | | Principal Occupation(s) During Past Five Years |
Kathryn L. Quirk (55) Chief Legal Officer | | Vice President and Corporate Counsel (since September 2004) of Prudential; Executive Vice President, Chief Legal Officer and Secretary (since July 2005) of PI and Prudential Mutual Fund Services LLC; Vice President and Corporate Counsel (since June 2005) and Secretary (since February 2006) of AST Investment Services, Inc.; formerly Senior Vice President and Assistant Secretary (November 2004-August 2005) of PI; formerly Assistant Secretary (June 2005-February 2006) of AST Investment Services, Inc.; formerly Managing Director, General Counsel, Chief Compliance Officer, Chief Risk Officer and Corporate Secretary (1997-2002) of Zurich Scudder Investments, Inc. |
Deborah A. Docs (50) Secretary | | Vice President and Corporate Counsel (since January 2001) of Prudential; Vice President (since December 1996) and Assistant Secretary (since March 1999) of PI; formerly Vice President and Assistant Secretary (May 2003-June 2005) of AST Investment Services, Inc. |
Jonathan D. Shain (50) Assistant Secretary | | Vice President and Corporate Counsel (since August 1998) of Prudential; Vice President and Assistant Secretary (since May 2001) of PI; Vice President and Assistant Secretary (since February 2001) of PMFS; formerly Vice President and Assistant Secretary (May 2003-June 2005) of AST Investment Services, Inc. |
Claudia DiGiacomo (33) Assistant Secretary | | Vice President and Corporate Counsel (since January 2005) of Prudential; Vice President and Assistant Secretary of PI (since December 2005); Associate at Sidley Austin Brown Wood LLP (1999-2004). |
John P. Schwartz (37) Assistant Secretary | | Vice President and Corporate Counsel (since April 2005) of Prudential; Vice President and Assistant Secretary of PI (since December 2005); Associate at Sidley Austin Brown Wood LLP (1997-2005). |
Andrew R. French (45) Assistant Secretary | | Director and Corporate Counsel (since May 2006) of Prudential; Vice President and Assistant Secretary (since January 2007) of PI; Vice President and Assistant Secretary (since January 2007) of PMFS; formerly Senior Legal Analyst of Prudential Mutual Fund Law Department (1997-2006). |
Timothy J. Knierim (49) Chief Compliance Officer | | Chief Compliance Officer of Prudential Investment Management, Inc. (since July 2007); formerly Chief Risk Officer of PIM and PI (2002-2007) and formerly Chief Ethics Officer of PIM and PI (2006-2007). |
Valerie M. Simpson (50) Deputy Chief Compliance Officer | | Chief Compliance Officer (since April 2007) of PI and AST Investment Services, Inc.; formerly Vice President-Financial Reporting (June 1999-March 2006) for Prudential Life and Annuities Finance. |
Theresa C. Thompson (46) Deputy Chief Compliance Officer | | Vice President, Mutual Fund Compliance, PI (since April 2004); and Director, Compliance, PI (2001-2004). |
| | |
| | Visit our website at www.jennisondryden.com |
| | |
Noreen M. Fierro (44) Anti-Money Laundering Compliance Officer | | Vice President, Corporate Compliance (since May 2006) of Prudential; formerly Corporate Vice President, Associate General Counsel (April 2002-May 2005) of UBS Financial Services, Inc., in their Money Laundering Prevention Group; Senior Manager (May 2005-May 2006) of Deloitte Financial Advisory Services, LLP, in their Forensic and Dispute Services, Anti-Money Laundering Group. |
Grace C. Torres (49) Treasurer and Principal Financial and Accounting Officer | | Assistant Treasurer (since March 1999) and Senior Vice President (since September 1999) of PI; Assistant Treasurer (since May 2003) and Vice President (since June 2005) of AST Investment Services, Inc.; Senior Vice President and Assistant Treasurer (since May 2003) of Prudential Annuities Advisory Services, Inc.; formerly Senior Vice President (May 2003-June 2005) of AST Investment Services, Inc. |
M. Sadiq Peshimam (44) Assistant Treasurer | | Vice President (since 2005) and Director (2000-2005) within Prudential Mutual Fund Administration. |
Peter Parrella (50) Assistant Treasurer | | Vice President (since 2007) and Director (2004-2007) within Prudential Mutual Fund Administration; formerly Tax Manager at SSB Citi Fund Management LLC (1997-2004). |
(a) | Excludes interested Board Members who also serve as President or Vice President. |
1 | The year that each individual became an Officer of the Fund is as follows: |
Kathryn L. Quirk, 2005; Deborah A. Docs, 2005; Timothy J. Knierim, 2007; Valerie M. Simpson, 2007; Theresa C. Thompson, 2008; Grace C. Torres, 1995; Noreen M. Fierro, 2006; Jonathan D. Shain, 2005; Claudia DiGiacomo, 2005; Andrew R. French, 2006; John P. Schwartz, 2006; Peter Parrella, 2007; M. Sadiq Peshimam, 2006.
Explanatory Notes
° Board Members are deemed to be “Interested,” as defined in the 1940 Act, by reason of their affiliation with Prudential Investments LLC and/or an affiliate of Prudential Investments LLC.
° Unless otherwise noted, the address of all Board Members and Officers is c/o Prudential Investments LLC, Gateway Center Three, 100 Mulberry Street, Newark, New Jersey 07102.
° There is no set term of office for Board Members or Officers. The Board Members have adopted a retirement policy, which calls for the retirement of Board Members on December 31st of the year in which they reach the age of 75.
° “Other Directorships Held” includes only directorships of companies required to register or file reports with the SEC under the Securities Exchange Act of 1934 (that is, “public companies”) or other investment companies registered under the 1940 Act.
° “Portfolios Overseen” includes all investment companies managed by Prudential Investments LLC. The investment companies for which PI serves as manager include the JennisonDryden Funds, Strategic Partners Funds, The Prudential Variable Contract Accounts, The Target Portfolio Trust, The Prudential Series Fund, The High Yield Income Fund, Inc., The High Yield Plus Fund, Inc., Nicholas-Applegate Fund, Inc., Prudential’s Gibraltar Fund, Inc. and the Advanced Series Trust.
Approval of Advisory Agreements
The Board of Directors (the “Board”) of MoneyMart Assets, Inc. (the “Fund”) oversees the management of the Fund, and, as required by law, determines annually whether to renew the Fund’s management agreement with Prudential Investments LLC (“PI”) and the Fund’s subadvisory agreement with Prudential Investment Management, Inc. (“PIM”). In considering the renewal of the agreements, the Board, including a majority of the Independent Directors, met on June 3-5, 2008 and approved the renewal of the agreements through July 31, 2009, after concluding that renewal of the agreements was in the best interests of the Fund and its shareholders.
In advance of the meetings, the Board received materials relating to the agreements, and had the opportunity to ask questions and request further information in connection with their consideration. Among other things, the Board considered comparisons with other mutual funds in relevant Peer Universes and Peer Groups. The mutual funds included in each Peer Universe or Peer Group were objectively determined solely by Lipper Inc., an independent provider of mutual fund data. The comparisons placed the Fund in various quartiles over one-, three-, five- and ten-year periods ending December 31, 2007 with the first quartile being the best 25% of the mutual funds (for performance, the best performing mutual funds and, for expenses, the lowest cost mutual funds).
In approving the agreements, the Board, including the Independent Directors advised by independent legal counsel, considered the factors they deemed relevant, including the nature, quality and extent of services provided, the performance of the Fund, the profitability of PI and its affiliates, expenses and fees, and the potential for economies of scale that may be shared with the Fund and its shareholders. In their deliberations, the Directors did not identify any single factor which alone was responsible for the Board’s decision to approve the agreements with respect to the Fund. In connection with their deliberations, the Board considered information provided by PI throughout the year at regular Board meetings, presentations from portfolio managers and other information, as well as information furnished at or in advance of the meetings on June 3-5, 2008.
The Directors determined that the overall arrangements between the Fund and PI, which serves as the Fund’s investment manager pursuant to a management agreement, and between PI and PIM, which serves as the Fund’s subadviser pursuant to the terms of a subadvisory agreement with PI, are fair and reasonable in light of the services performed, fees charged and such other matters as the Directors considered relevant in the exercise of their business judgment.
The material factors and conclusions that formed the basis for the Directors’ reaching their determinations to approve the continuance of the agreements are separately discussed below.
Approval of Advisory Agreements (continued)
Nature, Quality and Extent of Services
The Board received and considered information regarding the nature and extent of services provided to the Fund by PI and PIM. The Board considered the services provided by PI, including but not limited to the oversight of the subadviser for the Fund, as well as the provision of fund recordkeeping, compliance, and other services to the Fund. With respect to PI’s oversight of the subadviser, the Board noted that PI’s Strategic Investment Research Group (“SIRG”), which is a business unit of PI, is responsible for monitoring and reporting to PI’s senior management on the performance and operations of the subadviser. The Board also considered that PI pays the salaries of all of the officers and non-independent Directors of the Fund. The Board also considered the investment subadvisory services provided by PIM, as well as adherence to the Fund’s investment restrictions and compliance with applicable Fund policies and procedures.
The Board reviewed the qualifications, backgrounds and responsibilities of PI’s senior management responsible for the oversight of the Fund and PIM, and also reviewed the qualifications, backgrounds and responsibilities of PIM’s portfolio managers who are responsible for the day-to-day management of the Fund’s portfolio. The Board was provided with information pertaining to PI’s and PIM’s organizational structure, senior management, investment operations, and other relevant information pertaining to both PI and PIM. The Board also noted that it received favorable compliance reports from the Fund’s Chief Compliance Officer (CCO) as to both PI and PIM. The Board noted that PIM is affiliated with PI.
The Board concluded that it was satisfied with the nature, extent and quality of the investment management services provided by PI and the subadvisory services provided to the Fund by PIM, and that there was a reasonable basis on which to conclude that the Fund benefits from the services provided by PI and PIM under the management and subadvisory agreements.
Performance of MoneyMart Assets
The Board received and considered information about the Fund’s historical performance. The Board considered that the Fund’s gross performance in relation to its Peer Universe (the Lipper Retail Money Market Funds Peer Universe) was in the first quartile over the one-, three-, five- and ten- year periods. The Board also noted that the Fund outperformed its benchmark average over all periods. The Board concluded that, in light of the Fund’s competitive performance, it would be in the interest of the Fund and its shareholders to renew the agreements.
| | |
| | Visit our website at www.jennisondryden.com |
Fees and Expenses
The Board considered that the Fund’s actual management fee (which reflects any subsidies, expense caps or waivers) and the Fund’s total expenses both ranked in the Expense Group’s second quartile.
The Board concluded that the management and subadvisory fees are reasonable in light of the services provided.
Costs of Services and Profits Realized by PI
The Board was provided with information on the profitability of PI and its affiliates in serving as the Fund’s investment manager. The Board discussed with PI the methodology utilized in assembling the information regarding profitability and considered its reasonableness. The Board recognized that it is difficult to make comparisons of profitability from fund management contracts because comparative information is not generally publicly available and is affected by numerous factors, including the structure of the particular adviser, the types of funds it manages, its business mix, numerous assumptions regarding allocations and the adviser’s capital structure and cost of capital. The Board did not separately consider the profitability of the subadviser, an affiliate of PI, as its profitability was reflected in the profitability report for PI. Taking these factors into account, the Board concluded that the profitability of PI and its affiliates in relation to the services rendered was not unreasonable.
Economies of Scale
The Board noted that the management fee schedule for the Fund includes breakpoints, which have the effect of decreasing the fee rate as assets increase, and that at its current level of assets the Fund’s effective fee rate reflected some of those rate reductions. The Board received and discussed information concerning whether PI realizes economies of scale as the Fund’s assets grow beyond current levels. The Board took note that the Fund’s fee structure currently results in benefits to Fund shareholders whether or not PI realizes any economies of scale.
Other Benefits to PI and PIM
The Board considered potential ancillary benefits that might be received by PI and PIM and their affiliates as a result of their relationship with the Fund. The Board concluded that potential benefits to be derived by PI included transfer agency fees received by the Fund’s transfer agent (which is affiliated with PI), as well as benefits to the reputation or other intangible benefits resulting from PI’s association with the Fund. The Board concluded that the potential benefits to be derived by PIM included
Approval of Advisory Agreements (continued)
those generally resulting from an increase in assets under management, specifically, potential access to additional research resources and benefits to the reputation. The Board concluded that the benefits derived by PI and PIM were consistent with the types of benefits generally derived by investment managers and subadvisers to mutual funds.
After full consideration of these factors, the Board concluded that the approval of the agreements was in the best interest of the Fund and its shareholders.
| | |
| | Visit our website at www.jennisondryden.com |
| | | | |
| n MAIL | | n TELEPHONE | | n WEBSITE |
Gateway Center Three
100 Mulberry Street
Newark, NJ 07102 | | (800) 225-1852 | | www.jennisondryden.com |
|
| PROXY VOTING |
| The Board of Directors of the Fund has delegated to the Fund’s investment subadviser the responsibility for voting any proxies and maintaining proxy recordkeeping with respect to the Fund. A description of these proxy voting policies and procedures is available without charge, upon request, by calling (800) 225-1852 or by visiting the Securities and Exchange Commission’s website at www.sec.gov. Information regarding how the Fund voted proxies relating to portfolio securities during the most recent 12-month period ended June 30 is available on the Fund’s website and on the Commission’s website. |
|
| DIRECTORS |
| Kevin J. Bannon • Linda W. Bynoe • David E. A. Carson • Robert F. Gunia • Michael S. Hyland • Robert E. La Blanc • Douglas H. McCorkindale • Stephen P. Munn • Richard A. Redeker • Judy A. Rice • Robin B. Smith • Stephen G. Stoneburn |
|
| OFFICERS |
| Judy A. Rice, President • Robert F. Gunia, Vice President • Grace C. Torres, Treasurer and Principal Financial and Accounting Officer • Kathryn L. Quirk, Chief Legal Officer • Deborah A. Docs, Secretary • Timothy J. Knierim, Chief Compliance Officer • Valerie M. Simpson, Deputy Chief Compliance Officer • Theresa C. Thompson, Deputy Chief Compliance Officer • Noreen M. Fierro, Anti-Money Laundering Compliance Officer • Jonathan D. Shain, Assistant Secretary • Claudia DiGiacomo, Assistant Secretary • John P. Schwartz, Assistant Secretary • Andrew R. French, Assistant Secretary • M. Sadiq Peshimam, Assistant Treasurer • Peter Parrella, Assistant Treasurer |
| | | | |
| MANAGER | | Prudential Investments LLC | | Gateway Center Three
100 Mulberry Street
Newark, NJ 07102 |
|
| INVESTMENT SUBADVISER | | Prudential Investment
Management, Inc. | | Gateway Center Two
100 Mulberry Street
Newark, NJ 07102 |
|
| DISTRIBUTOR | | Prudential Investment
Management Services LLC | | Gateway Center Three
100 Mulberry Street
Newark, NJ 07102 |
|
| CUSTODIAN | | The Bank of New York | | One Wall Street
New York, NY 10286 |
|
| TRANSFER AGENT | | Prudential Mutual Fund
Services LLC | | PO Box 9658
Providence, RI 02940 |
|
| INDEPENDENT REGISTERED PUBLIC ACCOUNTING FIRM | | KPMG LLP | | 345 Park Avenue
New York, NY 10154 |
|
| FUND COUNSEL | | Sullivan & Cromwell LLP | | 125 Broad Street
New York, NY 10004 |
|
| An investor should consider the investment objectives, risks, charges, and expenses of the Fund carefully before investing. The prospectus for the Fund contains this and other information about the Fund. An investor may obtain a prospectus by visiting our website at www.jennisondryden.com or by calling (800) 225-1852. The prospectus should be read carefully before investing. |
E-DELIVERY
To receive your mutual fund documents on-line, go to www.icsdelivery.com/prudential/funds and enroll. Instead of receiving printed documents by mail, you will receive notification via e-mail when new materials are available. You can cancel your enrollment or change your e-mail address at any time by clicking on the change/cancel enrollment option at the icsdelivery website address.
SHAREHOLDER COMMUNICATIONS WITH DIRECTORS
Shareholders can communicate directly with the Board of Directors by writing to the Chair of the Board, MoneyMart Assets, Inc., Attn: Board of Directors, 100 Mulberry Street, Gateway Center Three, Newark, NJ 07102. Shareholders can communicate directly with an individual Director by writing to the same address. Communications to the Board or individual Directors are not screened before being delivered to the addressee.
|
| AVAILABILITY OF PORTFOLIO SCHEDULE |
| The Fund files its complete schedule of portfolio holdings with the Securities and Exchange Commission for the first and third quarters of each fiscal year on Form N-Q. The Fund’s Forms N-Q are available on the Commission’s website at www.sec.gov. The Fund’s Forms N-Q may also be reviewed and copied at the Commission’s Public Reference Room in Washington, D.C. Information on the operation and location of the Public Reference Room may be obtained by calling (800) SEC-0330 (732-0330). The Fund’s schedule of portfolio holdings is also available on the Fund’s website as of the end of each fiscal quarter. |
|
| The Fund’s Statement of Additional Information contains additional information about the Fund’s Directors and is available without charge, upon request, by calling (800) 225-1852. |
Mutual Funds:
| | | | |
| ARE NOT INSURED BY THE FDIC OR ANY FEDERAL GOVERNMENT AGENCY | | MAY LOSE VALUE | | ARE NOT A DEPOSIT OF OR GUARANTEED BY ANY BANK OR ANY BANK AFFILIATE |

| | | | | | | | | | | | |
| MoneyMart Assets, Inc. | | |
| | | Share Class | | A | | B | | C | | Z | | |
| | NASDAQ | | PBMXX | | N/A | | N/A | | PMZXX | | |
| | CUSIP | | 60936A308 | | 60936A506 | | 60936A605 | | 60936A407 | | |
| | | | | | | | | | | | |
MF108E IFS-A155033 Ed. 09/2008
Item 2 – Code of Ethics — See Exhibit (a)
As of the end of the period covered by this report, the registrant has adopted a code of ethics (the “Section 406 Standards for Investment Companies – Ethical Standards for Principal Executive and Financial Officers”) that applies to the registrant’s Principal Executive Officer and Principal Financial Officer; the registrant’s Principal Financial Officer also serves as the Principal Accounting Officer.
The registrant hereby undertakes to provide any person, without charge, upon request, a copy of the code of ethics. To request a copy of the code of ethics, contact the registrant 800-225-1852, and ask for a copy of the Section 406 Standards for Investment Companies—Ethical Standards for Principal Executive and Financial Officers.
Item 3 – Audit Committee Financial Expert –
The registrant’s Board has determined that Mr. David E. A. Carson, member of the Board’s Audit Committee is an “audit committee financial expert,” and that he is “independent,” for purposes of this Item.
Item 4 – Principal Accountant Fees and Services –
(a) Audit Fees
For the fiscal year ended July 31, 2008 and fiscal period January 1, 2007 through July 31, 2007, KPMG LLP (“KPMG”), the Registrant’s principal accountant, billed the Registrant $19,244 and $18,313, respectively, for professional services rendered for the audit of the Registrant’s annual financial statements or services that are normally provided in connection with statutory and regulatory filings.
(b) Audit-Related Fees
None.
(c) Tax Fees
None.
(d) All Other Fees
None.
(e) (1) Audit Committee Pre-Approval Policies and Procedures
THE PRUDENTIAL MUTUAL FUNDS
AUDIT COMMITTEE POLICY
on
Pre-Approval of Services Provided by the Independent Accountants
The Audit Committee of each Prudential Mutual Fund is charged with the responsibility to monitor the independence of the Fund’s independent accountants. As part of this responsibility, the Audit Committee must pre-approve any independent accounting firm’s engagement to render audit and/or permissible non-audit services, as required by law. In evaluating a proposed engagement of the independent accountants, the Audit Committee will assess the effect that the engagement might reasonably be expected to have on the accountant’s independence. The Committee’s evaluation will be based on:
| | • | | a review of the nature of the professional services expected to be provided, |
| | • | | a review of the safeguards put into place by the accounting firm to safeguard independence, and |
| | • | | periodic meetings with the accounting firm. |
Policy for Audit and Non-Audit Services Provided to the Funds
On an annual basis, the scope of audits for each Fund, audit fees and expenses, and audit-related and non-audit services (and fees proposed in respect thereof) proposed to be performed by the Fund’s independent accountants will be presented by the Treasurer and the independent accountants to the Audit Committee for review and, as appropriate, approval prior to the initiation of such services. Such presentation shall be accompanied by confirmation by both the Treasurer and the independent accountants that the proposed services will not adversely affect the independence of the independent accountants. Proposed services shall be described in sufficient detail to enable the Audit Committee to assess the appropriateness of such services and fees, and the compatibility of the provision of such services with the auditor’s independence. The Committee shall receive periodic reports on the progress of the audit and other services which are approved by the Committee or by the Committee Chair pursuant to authority delegated in this Policy.
The categories of services enumerated under “Audit Services”, “Audit-related Services”, and “Tax Services” are intended to provide guidance to the Treasurer and the independent accountants as to those categories of services which the Committee believes are generally consistent with the independence of the independent accountants and which the Committee (or the Committee Chair) would expect upon the presentation of specific proposals to pre-approve. The enumerated categories are not intended as an exclusive list of audit, audit-related or tax services, which the Committee (or the Committee Chair) would consider for pre-approval.
Audit Services
The following categories of audit services are considered to be consistent with the role of the Fund’s independent accountants:
| | • | | Annual Fund financial statement audits |
| | • | | Seed audits (related to new product filings, as required) |
| | • | | SEC and regulatory filings and consents |
Audit-related Services
The following categories of audit-related services are considered to be consistent with the role of the Fund’s independent accountants:
| | • | | Accounting consultations |
| | • | | Fund merger support services |
| | • | | Agreed Upon Procedure Reports |
| | • | | Other Internal Control Reports |
Individual audit-related services that fall within one of these categories and are not presented to the Audit Committee as part of the annual pre-approval process will be subject to pre-approval by the Committee Chair (or any other Committee member on whom this responsibility has been delegated) so long as the estimated fee for those services does not exceed $50,000.
Tax Services
The following categories of tax services are considered to be consistent with the role of the Fund’s independent accountants:
| | • | | Tax compliance services related to the filing or amendment of the following: |
| | • | | Federal, state and local income tax compliance; and, |
| | • | | Sales and use tax compliance |
| | • | | Timely RIC qualification reviews |
| | • | | Tax distribution analysis and planning |
| | • | | Tax authority examination services |
| | • | | Tax appeals support services |
| | • | | Accounting methods studies |
| | • | | Fund merger support services |
| | • | | Tax consulting services and related projects |
Individual tax services that fall within one of these categories and are not presented to the Audit Committee as part of the annual pre-approval process will be subject to pre-approval by the Committee Chair (or any other Committee member on whom this responsibility has been delegated) so long as the estimated fee for those services does not exceed $50,000.
Other Non-audit Services
Certain non-audit services that the independent accountants are legally permitted to render will be subject to pre-approval by the Committee or by one or more Committee members to whom the Committee has delegated this authority and who will report to the full Committee any pre-approval decisions made pursuant to this Policy. Non-audit services presented for pre-approval pursuant to this paragraph will be accompanied by a confirmation from both the Treasurer and the independent accountants that the proposed services will not adversely affect the independence of the independent accountants.
Proscribed Services
The Fund’s independent accountants will not render services in the following categories of non-audit services:
| | • | | Bookkeeping or other services related to the accounting records or financial statements of the Fund |
| | • | | Financial information systems design and implementation |
| | • | | Appraisal or valuation services, fairness opinions, or contribution-in-kind reports |
| | • | | Internal audit outsourcing services |
| | • | | Management functions or human resources |
| | • | | Broker or dealer, investment adviser, or investment banking services |
| | • | | Legal services and expert services unrelated to the audit |
| | • | | Any other service that the Public Company Accounting Oversight Board determines, by regulation, is impermissible. |
Pre-approval of Non-Audit Services Provided to Other Entities Within the Prudential Fund Complex
Certain non-audit services provided to Prudential Investments LLC or any of its affiliates that also provide ongoing services to the Prudential Mutual Funds will be subject to pre-approval by the Audit Committee. The only non-audit services provided to these entities that will require pre-approval are those related directly to the operations and financial reporting of the Funds. Individual projects that are not presented to the Audit Committee as part of the annual pre-approval process will be subject to pre-approval by the Committee Chair (or any other Committee member on whom this responsibility has been delegated) so long as the estimated fee for those services does not exceed $50,000. Services presented for pre-approval pursuant to this paragraph will be accompanied by a confirmation from both the Treasurer and the independent accountants that the proposed services will not adversely affect the independence of the independent accountants.
Although the Audit Committee will not pre-approve all services provided to Prudential Investments LLC and its affiliates, the Committee will receive an annual report from the Fund’s independent accounting firm showing the aggregate fees for all services provided to Prudential Investments and its affiliates.
(e) (2) Percentage of services referred to in 4(b) – 4(d) that were approved by the audit committee –
Not applicable.
(f) Percentage of hours expended attributable to work performed by other than full time employees of principal accountant if greater than 50%.
The percentage of hours expended on the principal accountant’s engagement to audit the registrant’s financial statements for the most recent fiscal year that were attributed to work performed by persons other than the principal accountant’s full-time, permanent employees was 0%.
(g) Non-Audit Fees
Not applicable to Registrant for the fiscal year 2008 and fiscal period January 1, 2007 through July 31, 2007. The aggregate non-audit fees billed by KPMG for services rendered to the registrant’s investment adviser and any entity controlling, controlled by, or under common control with the investment adviser that provides ongoing services to the registrant for the fiscal year 2008 and fiscal period January 1, 2007 through July 31, 2007 was $26,200 and $0, respectively.
(h) Principal Accountant’s Independence
Not applicable as KPMG has not provided non-audit services to the registrant’s investment adviser and any entity controlling, controlled by, or under common control with the investment adviser that provides ongoing services to the registrant that were not pre-approved pursuant to Rule 2-01(c)(7)(ii) of Regulation S-X.
Item 5 – Audit Committee of Listed Registrants – Not applicable.
Item 6 – Schedule of Investments – The schedule is included as part of the report to shareholders filed under Item 1 of this Form.
Item 7 – Disclosure of Proxy Voting Policies and Procedures for Closed-End Management Investment Companies – Not applicable.
Item 8 – Portfolio Managers of Closed-End Management Investment Companies – Not applicable.
Item 9 – Purchases of Equity Securities by Closed-End Management Investment Company and Affiliated Purchasers – Not applicable.
Item 10 – Submission of Matters to a Vote of Security Holders – Not applicable.
Item 11 – Controls and Procedures
| | (a) | It is the conclusion of the registrant’s principal executive officer and principal financial officer that the effectiveness of the registrant’s current disclosure controls and procedures (such disclosure controls and procedures having been evaluated within 90 days of the date of this filing) provide reasonable assurance that the information required to be disclosed by the registrant has been recorded, processed, summarized and reported within the time period specified in the Commission’s rules and forms and that the information required to be disclosed by the registrant has been accumulated and communicated to the registrant’s principal executive officer and principal financial officer in order to allow timely decisions regarding required disclosure. |
| | (b) | There has been no significant change in the registrant’s internal control over financial reporting that occurred during the registrant’s most recent fiscal quarter of the period covered by this report that has materially affected, or is likely to materially affect, the registrant’s internal control over financial reporting. |
Item 12 – Exhibits
(a) (1) Code of Ethics – Attached hereto as Exhibit EX-99.CODE-ETH
(2) Certifications pursuant to Section 302 of the Sarbanes-Oxley Act – Attached hereto as Exhibit EX-99.CERT.
(3) Any written solicitation to purchase securities under Rule 23c-1. – Not applicable.
(b) Certifications pursuant to Section 906 of the Sarbanes-Oxley Act – Attached hereto as Exhibit EX-99.906CERT.
SIGNATURES
Pursuant to the requirements of the Securities Exchange Act of 1934 and the Investment Company Act of 1940, the registrant has duly caused this report to be signed on its behalf by the undersigned, thereunto duly authorized.
(Registrant) MoneyMart Assets, Inc.
| | | | | | | | |
| By | | (Signature and Title)* | | /s/ Deborah A. Docs | | | | |
| | | | Deborah A. Docs | | | | |
| | | | Secretary | | | | |
Date September 25, 2008
Pursuant to the requirements of the Securities Exchange Act of 1934 and the Investment Company Act of 1940, this report has been signed below by the following persons on behalf of the registrant and in the capacities and on the dates indicated.
| | | | | | | | |
| By | | (Signature and Title)* | | /s/ Judy A. Rice | | | | |
| | | | Judy A. Rice | | | | |
| | | | President and Principal Executive Officer | | | | |
Date September 25, 2008
| | | | | | | | |
| By | | (Signature and Title)* | | /s/ Grace C. Torres | | | | |
| | | | Grace C. Torres | | | | |
| | | | Treasurer and Principal Financial Officer | | | | |
Date September 25, 2008
* | Print the name and title of each signing officer under his or her signature. |