UNITED STATES
SECURITIES AND EXCHANGE COMMISSION
Washington, D.C. 20549
FORM N-CSR
CERTIFIED SHAREHOLDER REPORT OF REGISTERED
MANAGEMENT INVESTMENT COMPANIES
| | |
| |
| Investment Company Act file number: | | 811-02619 |
| |
| Exact name of registrant as specified in charter: | | Prudential MoneyMart Assets, Inc. |
| |
| Address of principal executive offices: | | Gateway Center 3, 100 Mulberry Street, Newark, New Jersey 07102 |
| |
| Name and address of agent for service: | | Deborah A. Docs Gateway Center 3, 100 Mulberry Street, Newark, New Jersey 07102 |
| |
| Registrant’s telephone number, including area code: | | 800-225-1852 |
| |
| Date of fiscal year end: | | 7/31/2010 |
| |
| Date of reporting period: | | 7/31/2010 |
Item 1 – Reports to Stockholders

| | |
| ANNUAL REPORT | | JULY 31, 2010 |
Prudential MoneyMart
Assets, Inc.
(Formerly known as MoneyMart Assets, Inc.)
| | | | |
Fund Type Money Market Objective Maximum current income consistent with stability of capital and the maintenance of liquidity | | | | This report is not authorized for distribution to prospective investors unless preceded or accompanied by a current prospectus. The views expressed in this report and information about the Fund’s portfolio holdings are for the period covered by this report and are subject to change thereafter. Prudential Investments, Prudential, the Prudential logo and the Rock symbol are service marks of Prudential Financial, Inc. and its related entities, registered in many jurisdictions worldwide. |
| | |

| | To enroll in e-delivery, go to www.prudentialfunds.com/edelivery |
September 15, 2010
Dear Shareholder:
Earlier this year, Prudential Financial changed the name of its mutual fund family to Prudential Investments from JennisonDryden. Each of our funds now includes “Prudential” as part of its new name. The name of your fund has changed from the MoneyMart Assets, Inc. to Prudential MoneyMart Assets, Inc.
While the name of your Fund has changed, its investment objectives and portfolio management team remain the same. No action is required on your part. If you participate in an automatic investment plan, your account continues to be invested in the Fund under its new name.
Featuring the Prudential name in our funds creates an immediate connection to the experience and heritage of Prudential, a name recognized by millions for helping people grow and protect their wealth.
On the following pages, you’ll find your Fund’s annual report, including a listing of the Fund’s holdings at period-end. Money market investments such as the Fund are at the low-risk, low-reward end of the risk/reward spectrum, and the primary measure of their performance is the 7-day current yield, which is included in the attached report.
Sincerely,

Judy A. Rice, President
Prudential MoneyMart Assets, Inc.
| | |
| Prudential MoneyMart Assets, Inc. | | 1 |
Your Fund’s Performance
The Fund is a diversified portfolio of high-quality, U.S. dollar-denominated money market securities issued by the U.S. government, its agencies and instrumentalities, and major corporations and commercial banks in the United States and foreign countries. Maturities can range from one day to 13 months. The Fund generally only purchases securities rated in one of the two highest short-term rating categories or one of the three highest long-term rating categories by at least two major rating agencies, or, if not rated, deemed to be of equivalent quality by the investment subadviser.
Yields will fluctuate from time to time, and past performance does not guarantee future results. Current performance may be lower or higher than the past performance data quoted. The investment return and principal value will fluctuate, and shares, when sold, may be worth more or less than the original cost. For the most recent month-end performance update, call (800) 225-1852. Gross operating expenses: Class A, 0.59%; Class B, 0.47%; Class C, 0.47%; Class L, 0.97%; Class M, 1.47%; Class X, 1.47%; and Class Z, 0.47%. Net operating expenses: Class A, 0.31%; Class B, 0.31%; Class C, 0.31%; Class L, 0.32%; Class M, 0.32%; Class X, 0.32%; Class Z, 0.31%, after a voluntary waiver of distribution and service (12b-1) fees of Class A, Class L, Class M, and Class X shares and management fees of the Fund.
| | | | | | | | | | | |
| Fund Facts as of 7/31/10 | | | | | | | |
| | | 7-Day
Current Yield | | | Net Asset
Value (NAV) | | Weighted Avg.
Maturity (WAM) | | Net Assets
(Millions) |
Class A | | 0.02 | % | | $ | 1.00 | | 28 Days | | $ | 606.1 |
Class B* | | 0.02 | | | $ | 1.00 | | 28 Days | | $ | 52.7 |
Class C* | | 0.02 | | | $ | 1.00 | | 28 Days | | $ | 20.1 |
Class L | | 0.02 | | | $ | 1.00 | | 28 Days | | $ | 4.4 |
Class M | | 0.02 | | | $ | 1.00 | | 28 Days | | $ | 2.5 |
Class X | | 0.02 | | | $ | 1.00 | | 28 Days | | $ | 2.5 |
Class Z* | | 0.02 | | | $ | 1.00 | | 28 Days | | $ | 183.7 |
iMoneyNet, Inc. Prime Retail Avg.** | | 0.02 | | | | N/A | | 39 Days | | | N/A |
*Class B, Class C, and Class Z shares are not subject to distribution and service (12b-1) fees.
**iMoneyNet, Inc. regularly reports a 7-day current yield and WAM on Tuesdays. This is based on the data of all funds in the iMoneyNet, Inc. Prime Retail Average category as of July 27, 2010, the closest reported date prior to the end of our reporting period.
| | |
| 2 | | Visit our website at www.prudentialfunds.com |
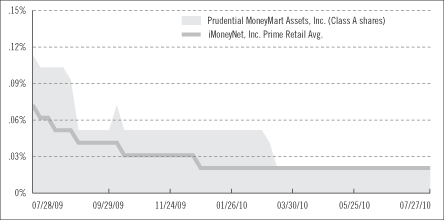
Money Market Fund Yield Comparison
Weighted Average Maturity Comparison
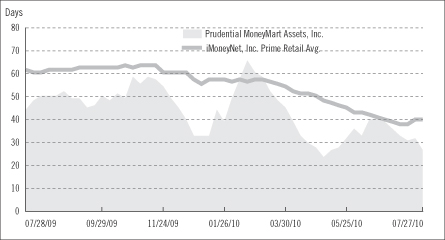
The graphs portray weekly 7-day current yields and weekly WAMs for Prudential MoneyMart Assets, Inc. (Class A shares—yields only) and the iMoneyNet, Inc. Prime Retail Average every Tuesday from July 28, 2009 to July 27, 2010, the closest dates to the beginning and end of the Fund’s reporting period. Note: iMoneyNet, Inc. regularly reports a 7-day current yield and WAM on Tuesdays. As a result, the data portrayed for the Fund at the end of the reporting period in the graphs may not match the data portrayed in the Fund Facts table as of July 31, 2010.
| | |
| Prudential MoneyMart Assets, Inc. | | 3 |
Your Fund’s Performance (continued)
An investment in the Fund is not insured or guaranteed by the Federal Deposit Insurance Corporation or any other government agency. Although the Fund seeks to preserve the value of your investment at $1 per share, it is possible to lose money by investing in the Fund.
| | |
| 4 | | Visit our website at www.prudentialfunds.com |
Strategy and Performance Overview
How did the Fund perform?
The seven-day current yields of the Fund’s share classes remained at very low levels during its reporting period that ended July 31, 2010. This reflected an environment of record low short-term interest rates in the United States as described below. The net asset values of the Fund’s share classes remained at $1.00 per share throughout its reporting period.
How is the Fund managed?
Prudential Fixed Income manages the Fund in compliance with new money-market fund regulations that took effect during the first half of 2010. The rules were designed to strengthen regulatory standards governing money market funds by increasing liquidity requirements and reducing interest-rate risk. For example, the Fund must hold at least 30% of its total assets (which can include U.S. Treasury securities) in investments that mature within seven days, while the Fund’s maximum weighted average maturity (WAM) was reduced to 60 days from 90 days. In selecting investments for the Fund, portfolio managers work closely with a team of credit research analysts to carefully choose money market securities that meet Prudential Fixed Income’s rigorous credit criteria.
What were conditions like in the credit markets?
When the reporting period began on August 1, 2009, business activity in the United States appeared to be leveling out after the economy had contracted for four consecutive calendar quarters. The economy got back on track then picked up steam in late 2009, aided by several programs employed by the U.S. government to encourage consumers to spend and, thereby, generate positive momentum in economic activity. Some of these included a tax cut for first-time home buyers and a program that allowed consumers to trade in their old cars for a credit toward the purchase of a new auto.
As economic growth moderated during the remainder of the reporting period, the Federal Reserve kept its target for the federal funds rate on overnight loans between banks near zero to help boost business activity in the United States. A reference rate for many types of money market securities, the London interbank offered rate (LIBOR) that banks pay one another to borrow in dollars for three months, initially edged lower. However, three-month LIBOR began to rise in the spring of 2010, reflecting concern about a flare-up in a sovereign-debt crisis in Europe centered mainly in the southern nations of Greece, Portugal, and Spain. As that situation began to stabilize, three-month LIBOR turned lower again in July.
| | |
| Prudential MoneyMart Assets, Inc. | | 5 |
Strategy and Performance Overview (continued)
How did the Fund invest during the reporting period?
Early in the reporting period, the Fund invested primarily in money market securities that matured in three months or less. It decided not to invest in securities with longer maturities as they did not provide significantly higher yields in the low interest-rate environment.
The Fund maintained a diversified portfolio that included instruments such as certificates of deposit and commercial paper of banks and corporations. It also increased its holdings of U.S. Treasury bills, federal agency securities, and repurchase agreements, in which a party agrees to sell a debt security to the Fund and buy that debt security back the next day at an agreed-upon price. These investments helped shorten the Fund’s WAM in keeping with the new regulatory requirements for money market funds.
| | |
| 6 | | Visit our website at www.prudentialfunds.com |
Fees and Expenses (Unaudited)
As a shareholder of the Fund, you incur two types of costs: (1) transaction costs, including sales charges (loads) on purchase payments and redemptions, as applicable, and (2) ongoing costs, including management fees, distribution and/or service (12b-1) fees, and other Fund expenses, as applicable. This example is intended to help you understand your ongoing costs (in dollars) of investing in the Fund and to compare these costs with the ongoing costs of investing in other mutual funds.
The example is based on an investment of $1,000 invested on February 1, 2010, at the beginning of the period, and held through the six-month period ended July 31, 2010. The example is for illustrative purposes only; you should consult the Prospectus for information on initial and subsequent minimum investment requirements.
The Fund’s transfer agent may charge additional fees to holders of certain accounts that are not included in the expenses shown in the table on the following page. These fees apply to individual retirement accounts (IRAs) and Section 403(b) accounts. As of the close of the six-month period covered by the table, IRA fees included an annual maintenance fee of $15 per account (subject to a maximum annual maintenance fee of $25 for all accounts held by the same shareholder). Section 403(b) accounts are charged an annual $25 fiduciary maintenance fee. Some of the fees may vary in amount, or may be waived, based on your total account balance or the number of Prudential Investments Funds, including the Fund, that you own. You should consider the additional fees that were charged to your Fund account over the six-month period when you estimate the total ongoing expenses paid over the period and the impact of these fees on your ending account value, as these additional expenses are not reflected in the information provided in the expense table. Additional fees have the effect of reducing investment returns.
Actual Expenses
The first line for each share class in the table on the following page provides information about actual account values and actual expenses. You may use the information on this line, together with the amount you invested, to estimate the expenses that you paid over the period. Simply divide your account value by $1,000 (for example, an $8,600 account value ÷ $1,000 = 8.6), then multiply the result by the number on the first line under the heading “Expenses Paid During the Six-Month Period” to estimate the expenses you paid on your account during this period.
Hypothetical Example for Comparison Purposes
The second line for each share class in the table on the following page provides information about hypothetical account values and hypothetical expenses based on the Fund’s actual expense ratio and an assumed rate of return of 5% per year before
| | |
| Prudential MoneyMart Assets, Inc. | | 7 |
Fees and Expenses (continued)
expenses, which is not the Fund’s actual return. The hypothetical account values and expenses may not be used to estimate the actual ending account balance or expenses you paid for the period. You may use this information to compare the ongoing costs of investing in the Fund and other funds. To do so, compare this 5% hypothetical example with the 5% hypothetical examples that appear in the shareholder reports of the other funds.
Please note that the expenses shown in the table are meant to highlight your ongoing costs only and do not reflect any transactional costs such as sales charges (loads). Therefore, the second line for each share class in the table is useful in comparing ongoing costs only and will not help you determine the relative total costs of owning different funds. In addition, if these transactional costs were included, your costs would have been higher.
| | | | | | | | | | | | | | |
Prudential MoneyMart
Assets, Inc. | | Beginning Account
Value
February 1, 2010 | | Ending Account
Value July 31, 2010 | | Annualized
Expense Ratio | | | Expenses Paid
During the
Six-Month Period* |
| | | | | | | | | | | | | | |
| Class A | | Actual | | $ | 1,000.00 | | $ | 1,000.10 | | 0.26 | % | | $ | 1.29 |
| | | Hypothetical | | $ | 1,000.00 | | $ | 1,023.51 | | 0.26 | % | | $ | 1.30 |
| | | | | | | | | | | | | | |
| Class B | | Actual | | $ | 1,000.00 | | $ | 1,000.10 | | 0.26 | % | | $ | 1.29 |
| | | Hypothetical | | $ | 1,000.00 | | $ | 1,023.51 | | 0.26 | % | | $ | 1.30 |
| | | | | | | | | | | | | | |
| Class C | | Actual | | $ | 1,000.00 | | $ | 1,000.10 | | 0.26 | % | | $ | 1.29 |
| | | Hypothetical | | $ | 1,000.00 | | $ | 1,023.51 | | 0.26 | % | | $ | 1.30 |
| | | | | | | | | | | | | | |
| Class L | | Actual | | $ | 1,000.00 | | $ | 1,000.10 | | 0.26 | % | | $ | 1.29 |
| | | Hypothetical | | $ | 1,000.00 | | $ | 1,023.51 | | 0.26 | % | | $ | 1.30 |
| | | | | | | | | | | | | | |
| Class M | | Actual | | $ | 1,000.00 | | $ | 1,000.10 | | 0.26 | % | | $ | 1.29 |
| | | Hypothetical | | $ | 1,000.00 | | $ | 1,023.51 | | 0.26 | % | | $ | 1.30 |
| | | | | | | | | | | | | | |
| Class X | | Actual | | $ | 1,000.00 | | $ | 1,000.10 | | 0.26 | % | | $ | 1.29 |
| | | Hypothetical | | $ | 1,000.00 | | $ | 1,023.51 | | 0.26 | % | | $ | 1.30 |
| | | | | | | | | | | | | | |
| Class Z | | Actual | | $ | 1,000.00 | | $ | 1,000.10 | | 0.26 | % | | $ | 1.29 |
| | | Hypothetical | | $ | 1,000.00 | | $ | 1,023.51 | | 0.26 | % | | $ | 1.30 |
* Fund expenses (net of fee waivers or subsidies, if any) for each share class are equal to the annualized expense ratio for each share class (provided in the table), multiplied by the average account value over the period, multiplied by the 181 days in the six-month period ended July 31, 2010, and divided by the 365 days in the Fund’s fiscal year ended July 31, 2010 (to reflect the six-month period). Expenses presented in the table include the expenses of any underlying portfolios in which the Fund may invest.
| | |
| 8 | | Visit our website at www.prudentialfunds.com |
Portfolio of Investments
as of July 31, 2010
| | | | | | |
Principal
Amount (000) | | Description | | Value (Note 1) |
| | | | | | |
| Certificates of Deposit 8.8% | | | |
| $ | 6,000 | | Bank of America NA
0.362%, 8/23/10, MTN(a) | | $ | 6,000,000 |
| | 10,000 | | 0.372%, 8/10/10(a) | | | 10,000,000 |
| | 5,000 | | BNP Paribas
0.500%, 10/18/10 | | | 5,000,541 |
| | 6,000 | | 0.600%, 9/17/10 | | | 6,000,000 |
| | 15,000 | | Chase Bank USA NA
0.250%, 8/11/10 | | | 15,000,000 |
| | 8,000 | | Royal Bank of Scotland PLC (The)
0.540%, 10/21/10 | | | 8,000,000 |
| | 7,000 | | State Street Bank & Trust Co.
0.420%, 8/19/10 | | | 7,000,000 |
| | 5,000 | | Sumitomo Mitsui Banking Corp./New York
0.370%, 8/06/10 | | | 5,000,000 |
| | 15,000 | | 0.500%, 9/22/10 | | | 15,000,000 |
| | | | | | |
| | | | | | 77,000,541 |
| | | | | | |
| |
| Commercial Paper(b) 42.3% | | | |
| | 25,000 | | Australia and New Zealand Banking Group Ltd., 144A
0.490%, 9/30/10 | | | 24,979,583 |
| | 5,000 | | BPCE SA, 144A
0.340%, 8/17/10 | | | 4,999,244 |
| | 8,000 | | Citigroup Funding, Inc.
0.320%, 8/11/10 | | | 7,999,289 |
| | 12,000 | | Commonwealth Bank of Australia, 144A
0.410%, 8/12/10 | | | 11,998,497 |
| | 11,000 | | Credit Suisse (NY Branch)
0.500%, 9/13/10 | | | 10,993,431 |
| | 30,000 | | DnB NOR Bank ASA
0.520%, 8/26/10 | | | 29,989,167 |
| | 1,000 | | Electricite de France, 144A
0.290%, 8/27/10 | | | 999,790 |
| | 2,000 | | 0.290%, 8/30/10 | | | 1,999,533 |
| | 7,000 | | 0.300%, 8/16/10 | | | 6,999,125 |
| | 9,000 | | ENI Coordination, 144A
0.340%, 8/09/10 | | | 8,999,320 |
| | 7,000 | | GDF Suez, 144A
0.350%, 8/03/10 | | | 6,999,864 |
| | 9,000 | | 0.350%, 8/16/10 | | | 8,998,688 |
See Notes to Financial Statements.
| | |
| Prudential MoneyMart Assets, Inc. | | 9 |
Portfolio of Investments
as of July 31, 2010 continued
| | | | | | |
Principal
Amount (000) | | Description | | Value (Note 1) |
| | | | | | |
| Commercial Paper(b) (cont’d.) | | | |
| $ | 6,000 | | GDF Suez, 144A
0.500%, 8/18/10 | | $ | 5,999,008 |
| | 10,000 | | General Electric Capital Corp.
0.350%, 10/12/10 | | | 9,993,000 |
| | 6,000 | | Hewlett-Packard Co., 144A
0.200%, 8/16/10 | | | 5,999,500 |
| | 5,000 | | 0.200%, 8/17/10 | | | 4,999,556 |
| | 3,000 | | International Financial Corp.
0.230%, 8/17/10 | | | 2,999,693 |
| | 15,000 | | 0.250%, 8/09/10 | | | 14,999,167 |
| | 15,000 | | National Australia Funding, 144A
0.470%, 9/01/10 | | | 14,993,929 |
| | 15,000 | | Nestle Finance International Ltd.
0.200%, 8/24/10 | | | 14,998,083 |
| | 7,000 | | New York Life Capital Corp., 144A
0.300%, 9/09/10 | | | 6,997,725 |
| | 3,000 | | Old Line Funding LLC, 144A
0.300%, 8/04/10 | | | 2,999,925 |
| | 8,000 | | 0.300%, 8/10/10 | | | 7,999,400 |
| | 15,000 | | 0.400%, 8/11/10 | | | 14,998,333 |
| | | Pacific Life Insurance Co., 144A
0.240%, 8/12/10 | | | |
| | 4,000 | | (original cost $3,999,253; purchased 7/15/10)(c) | | | 3,999,707 |
| | 40,000 | | Rabobank USA Financial Corp.
0.480%, 9/02/10 | | | 39,982,933 |
| | 5,000 | | Sanofi Aventis, 144A
0.230%, 8/10/10 | | | 4,999,713 |
| | 10,000 | | Siemens Capital Co. LLC, 144A
0.210%, 8/02/10 | | | 9,999,942 |
| | 5,000 | | Societe Generale North America, Inc.
0.375%, 9/27/10 | | | 4,997,031 |
| | 1,000 | | State Street Corp., 144A
0.415%, 8/16/10 | | | 999,827 |
| | 5,000 | | Straight-A Funding LLC, 144A
0.390%, 8/04/10 | | | 4,999,837 |
| | 30,000 | | 0.390%, 8/10/10 | | | 29,997,075 |
| | 35,000 | | UBS Finance (Delaware) LLC
0.500%, 8/16/10 | | | 34,992,708 |
| | | | | | |
| | | | | | 368,901,623 |
| | | | | | |
|
| Other Corporate Obligations 0.6% |
| | 5,000 | | Bank of America NA, Sr. Notes
0.427%, 8/27/10(a) | | | 5,000,000 |
| | | | | | |
See Notes to Financial Statements.
| | |
| 10 | | Visit our website at www.prudentialfunds.com |
| | | | | | |
Principal
Amount (000) | | Description | | Value (Note 1) |
| | | | | | |
| U.S. Government Agency Obligations 28.7% |
| $ | 50,000 | | Federal Home Loan Bank
0.180%, 8/11/10(b) | | $ | 49,997,500 |
| | 5,000 | | 0.180%, 8/13/10(b) | | | 4,999,700 |
| | 50,000 | | 0.180%, 8/25/10(b) | | | 49,994,000 |
| | 6,000 | | 0.190%, 10/18/10(b) | | | 5,997,530 |
| | 4,000 | | 0.190%, 10/13/10(b) | | | 3,998,459 |
| | 10,000 | | 0.243%, 8/20/10(a) | | | 9,997,047 |
| | 5,000 | | 0.375%, 1/06/11 | | | 4,999,357 |
| | 5,000 | | 0.400%, 1/04/11 | | | 4,999,670 |
| | 20,000 | | Federal Home Loan Mortgage Corp.
0.180%, 9/07/10(b) | | | 19,996,300 |
| | 7,800 | | 0.260%, 1/03/11(b) | | | 7,791,269 |
| | 17,497 | | 0.400%, 1/10/11(b) | | | 17,465,269 |
| | 40,000 | | 0.464%, 8/24/10(a) | | | 39,999,504 |
| | 10,000 | | Federal National Mortgage Association
0.240%, 1/19/11(b) | | | 9,988,363 |
| | 20,000 | | 0.297%, 8/05/10(a) | | | 19,999,924 |
| | | | | | |
| | | | | | 250,223,892 |
| | | | | | |
| |
| Repurchase Agreements 19.6% | | | |
| | 35,000 | | Banc of America Securities Corp.
0.230%, dated 7/30/10, due 8/02/10 in the amount of $35,000,671 (cost $35,000,000)(d) | | | 35,000,000 |
| | 50,000 | | Barclays Capital, Inc.
0.230%, dated 7/30/10, due 8/02/10 in the amount of $50,000,958 (cost $50,000,000)(d) | | | 50,000,000 |
| | 35,906 | | HSBC Securities USA, Inc.
0.210%, dated 7/30/10, due 8/02/10 in the amount of $35,906,628 (cost $35,906,000)(d) | | | 35,906,000 |
| | 50,000 | | Morgan Stanley & Co., Inc.
0.220%, dated 7/30/10, due 8/02/10 in the amount of $50,000,917 (cost $50,000,000)(d) | | | 50,000,000 |
| | | | | | |
| | | | | | 170,906,000 |
| | | | | | |
| | | Total Investments 100.0%
(amortized cost $872,032,056)(e) | | | 872,032,056 |
| | | Other assets in excess of liabilities | | | 113,387 |
| | | | | | |
| | | Net Assets 100.0% | | $ | 872,145,443 |
| | | | | | |
The following abbreviations are used in the portfolio descriptions:
144A—Security was purchased pursuant to Rule 144A under the Securities Act of 1933 and may not be resold subject to that rule except to qualified institutional buyers. Unless otherwise noted, 144A securities are deemed to be liquid.
See Notes to Financial Statements.
| | |
| Prudential MoneyMart Assets, Inc. | | 11 |
Portfolio of Investments
as of July 31, 2010 continued
MTN—Medium Term Note
| (a) | Floating Rate Security. The interest rate shown reflects the rate in effect at July 31, 2010. |
| (b) | Rate quoted represents yield-to-maturity as of purchase date. |
| (c) | Indicates a restricted security, the aggregate original cost of such security is $3,999,253. The aggregate value of $3,999,707 is approximately 0.5% of net assets. |
| (d) | Repurchase agreements are collateralized by U.S. Government Agency and FDIC Guaranteed issuances. |
| (e) | The cost of securities for federal income tax purposes is substantially the same as for financial reporting purposes. |
Various inputs are used in determining the value of the Fund’s investments. These inputs are summarized in the three broad levels listed below.
Level 1—quoted prices in active markets for identical securities
Level 2—other significant observable inputs (including quoted prices for similar securities, interest rates, prepayment speeds, credit risk, etc.)
Level 3—significant unobservable inputs (including the Fund’s own assumptions in determining the fair value of investments)
The following is a summary of the inputs used as of July 31, 2010 in valuing the Fund’s assets carried at fair value:
| | | | | | | | | |
| | | Level 1 | | Level 2 | | Level 3 |
Investments in Securities | | | | | | | | | |
Certificates of Deposit | | $ | — | | $ | 77,000,541 | | $ | — |
Commercial Paper | | | — | | | 368,901,623 | | | — |
Other Corporate Obligations | | | — | | | 5,000,000 | | | — |
U.S. Government Agency Obligations | | | — | | | 250,223,892 | | | — |
Repurchase Agreements | | | — | | | 170,906,000 | | | — |
| | | | | | | | | |
Total | | $ | — | | $ | 872,032,056 | | $ | — |
| | | | | | | | | |
See Notes to Financial Statements.
| | |
| 12 | | Visit our website at www.prudentialfunds.com |
The industry classification of portfolio holdings and other assets in excess of liabilities shown as a percentage of net assets as of July 31, 2010 were as follows:
| | | |
U.S. Government Agency Obligations | | 28.7 | % |
Financial Services | | 26.1 | |
Commercial Banks | | 25.8 | |
Asset Backed Securities | | 7.0 | |
Foreign Banks | | 6.4 | |
Electric | | 3.7 | |
Computers & Peripherals | | 1.3 | |
Healthcare Products | | 0.6 | |
Insurance | | 0.4 | |
| | | |
| | 100.0 | |
Other assets in excess of liabilities | | — | |
| | | |
| | 100.0 | % |
| | | |
See Notes to Financial Statements.
| | |
| Prudential MoneyMart Assets, Inc. | | 13 |
Statement of Assets and Liabilities
as of July 31, 2010
| | | | |
Assets | | | | |
Investments, at amortized cost which approximates fair value | | $ | 872,032,056 | |
Cash | | | 58,450 | |
Receivable for Fund shares sold | | | 4,629,876 | |
Interest receivable | | | 82,463 | |
| | | | |
Total assets | | | 876,802,845 | |
| | | | |
| |
Liabilities | | | | |
Payable for Fund shares reacquired | | | 3,886,658 | |
Accrued expenses | | | 424,056 | |
Management fee payable | | | 145,105 | |
Affiliated transfer agent fee payable | | | 118,714 | |
Deferred directors’ fees | | | 80,007 | |
Dividends payable | | | 2,862 | |
| | | | |
Total liabilities | | | 4,657,402 | |
| | | | |
| |
Net Assets | | $ | 872,145,443 | |
| | | | |
| | | | | |
Net assets were comprised of: | | | | |
Common stock, at par ($.001 par value; 20 billion shares authorized for issuance) | | $ | 872,129 | |
Paid-in capital in excess of par | | | 871,282,536 | |
| | | | |
| | | 872,154,665 | |
Distributions in excess of net investment income | | | (9,222 | ) |
| | | | |
Net assets, July 31, 2010 | | $ | 872,145,443 | |
| | | | |
See Notes to Financial Statements.
| | |
| 14 | | Visit our website at www.prudentialfunds.com |
| | | |
Class A | | | |
Net asset value, offering price and redemption price per share
($606,100,110 ÷ 606,087,770 shares of common stock issued and outstanding) | | $ | 1.00 |
| | | |
| |
Class B | | | |
Net asset value, offering price and redemption price per share
($52,720,559 ÷ 52,718,171 shares of common stock issued and outstanding) | | $ | 1.00 |
| | | |
| |
Class C | | | |
Net asset value, offering price and redemption price per share
($20,125,301 ÷ 20,124,623 shares of common stock issued and outstanding) | | $ | 1.00 |
| | | |
| |
Class L | | | |
Net asset value, offering price and redemption price per share
($4,437,905 ÷ 4,437,781 shares of common stock issued and outstanding) | | $ | 1.00 |
| | | |
| |
Class M | | | |
Net asset value, offering price and redemption price per share
($2,510,760 ÷ 2,510,748 shares of common stock issued and outstanding) | | $ | 1.00 |
| | | |
| |
Class X | | | |
Net asset value, offering price and redemption price per share
($2,514,697 ÷ 2,514,657 shares of common stock issued and outstanding) | | $ | 1.00 |
| | | |
| |
Class Z | | | |
Net asset value, offering price and redemption price per share
($183,736,111 ÷ 183,735,277 shares of common stock issued and outstanding) | | $ | 1.00 |
| | | |
See Notes to Financial Statements.
| | |
| Prudential MoneyMart Assets, Inc. | | 15 |
Statement of Operations
Year Ended July 31, 2010
| | | | |
Net Investment Income | | | | |
Income | | | | |
Interest | | $ | 3,352,458 | |
| | | | |
| |
Expenses | | | | |
Management fee | | | 2,940,089 | |
Distribution fee—Class A | | | 836,031 | |
Distribution fee—Class L | | | 27,107 | |
Distribution fee—Class M | | | 47,848 | |
Distribution fee—Class X | | | 37,221 | |
Transfer agent’s fees and expenses (including affiliated expense of $695,600) (Note 3) | | | 995,000 | |
Custodian’s fees and expenses | | | 121,000 | |
Registration fees | | | 100,000 | |
Reports to shareholders | | | 70,000 | |
U.S. Treasury Money Market Fund Guarantee Program Fee (Note 7) | | | 55,747 | |
Directors’ fees | | | 43,000 | |
Legal fees and expenses | | | 33,000 | |
Insurance | | | 26,000 | |
Audit fee | | | 22,000 | |
Miscellaneous | | | 6,743 | |
| | | | |
Total expenses | | | 5,360,786 | |
Less: Management fee waiver (Note 2) | | | (1,518,030 | ) |
Distribution fee waiver—Class A (Note 2) | | | (799,435 | ) |
Distribution fee waiver—Class L (Note 2) | | | (26,775 | ) |
Distribution fee waiver—Class M (Note 2) | | | (47,418 | ) |
Distribution fee waiver—Class X (Note 2) | | | (36,938 | ) |
| | | | |
Net expenses | | | 2,932,190 | |
| | | | |
Net investment income | | | 420,268 | |
| | | | |
| |
Net Realized Gain On Investments | | | | |
Net realized gain on investment transactions | | | 80,481 | |
| | | | |
Net Increase In Net Assets Resulting From Operations | | $ | 500,749 | |
| | | | |
See Notes to Financial Statements.
| | |
| 16 | | Visit our website at www.prudentialfunds.com |
Statement of Changes in Net Assets
| | | | | | | | |
| | | Year Ended July 31, | |
| | | 2010 | | | 2009 | |
Increase (Decrease) In Net Assets | | | | | | | | |
Operations | | | | | | | | |
Net investment income | | $ | 420,268 | | | $ | 11,993,557 | |
Net realized gain on investment transactions | | | 80,481 | | | | 62,305 | |
| | | | | | | | |
Net increase in net assets resulting from operations | | | 500,749 | | | | 12,055,862 | |
| | | | | | | | |
Dividends to shareholders (Note 1) | | | | | | | | |
Class A | | | (343,881 | ) | | | (8,555,156 | ) |
Class B | | | (34,915 | ) | | | (953,142 | ) |
Class C | | | (12,229 | ) | | | (321,357 | ) |
Class L | | | (2,782 | ) | | | (13,541 | ) |
Class M | | | (2,788 | ) | | | (20,832 | ) |
Class X | | | (2,052 | ) | | | (11,856 | ) |
Class Z | | | (98,102 | ) | | | (2,179,978 | ) |
| | | | | | | | |
| | | (496,749 | ) | | | (12,055,862 | ) |
| | | | | | | | |
| | |
Fund share transactions (Note 4) (at $1.00 per share) | | | | | | | | |
Net proceeds from shares sold | | | 1,265,529,861 | | | | 1,675,374,155 | |
Net asset value of shares issued to shareholders in reinvestment of dividends | | | 511,009 | | | | 11,928,462 | |
Net asset value of shares issued in connection with merger (Note 6) | | | — | | | | 50,060,780 | |
Cost of shares reacquired | | | (1,453,184,010 | ) | | | (1,699,661,258 | ) |
| | | | | | | | |
Net increase (decrease) in net assets from Fund share transactions | | | (187,143,140 | ) | | | 37,702,139 | |
| | | | | | | | |
Total increase (decrease) | | | (187,139,140 | ) | | | 37,702,139 | |
| | |
Net Assets | | | | | | | | |
Beginning of year | | | 1,059,284,583 | | | | 1,021,582,444 | |
| | | | | | | | |
End of year | | $ | 872,145,443 | | | $ | 1,059,284,583 | |
| | | | | | | | |
See Notes to Financial Statements.
| | |
| Prudential MoneyMart Assets, Inc. | | 17 |
Notes to Financial Statements
Prudential MoneyMart Assets, Inc. (formerly MoneyMart Assets, Inc.) (the “Fund”) is registered under the Investment Company Act of 1940 as a diversified, open-end management investment company. The Fund invests primarily in a portfolio of money market instruments maturing in thirteen months or less whose ratings are within the two highest rating categories by a nationally recognized statistical rating organization or, if not rated, are of comparable quality. The ability of the issuers of the securities held by the Fund to meet their obligations may be affected by economic developments in a specific industry or region.
Note 1. Accounting Policies
The following is a summary of significant accounting policies followed by the Fund in the preparation of its financial statements.
Securities Valuations: Portfolio securities are valued at amortized cost, which approximates fair value. The amortized cost method involves valuing a security at its cost on the date of purchase and thereafter assuming a constant amortization to maturity of any discount or premium. If the amortized cost method is determined not to represent fair value, the fair value shall be determined by or under the direction of the Board of Directors. When determining the fair valuation of securities some of the factors influencing the valuation include the nature of any restrictions on disposition of the securities; assessment of the general liquidity of the securities; the issuer’s financial condition and the markets in which it does business; the cost of the investment; the size of the holding and the capitalization of issuer; the prices of any recent transactions or bids/offers for such securities or any comparable securities; any available analyst media or other reports or information deemed reliable by the investment adviser regarding the issuer or the markets or industry in which it operates.
Securities Transactions and Net Investment Income: Securities transactions are recorded on the trade date. Realized gains or losses on sales of securities are calculated on the identified cost basis. Interest income including amortization of premium and accretion of discount on debt securities, as required, is recorded on the accrual basis. Expenses are recorded on the accrual basis.
Net investment income or loss (other than distribution fees, which are charged directly to the respective class) and realized gains or losses are allocated daily to each class of shares based upon the relative proportion of net assets of each class at the beginning of the day.
| | |
| 18 | | Visit our website at www.prudentialfunds.com |
Repurchase Agreements: In connection with transactions in repurchase agreements with United States financial institutions, it is the Fund’s policy that its custodian or designated subcustodians under triparty repurchase agreements, as the case may be, take possession of the underlying collateral securities, the value of which exceeds the principal amount of the repurchase transactions, including accrued interest. To the extent that any repurchase transaction exceeds one business day, the value of the collateral is marked to market on a daily basis to ensure the adequacy of the collateral. If the seller defaults and the value of the collateral declines or if bankruptcy proceedings are commenced with respect to the seller of the security, realization of the collateral by the Fund may be delayed or limited.
Loan Participations: The Fund may invest in loan participations. When the Fund purchases a loan participation, the Fund typically enters into a contractual relationship with the lender or third party selling such participations (“Selling Participant”), but not the borrower. As a result, the Fund assumes the credit risk of the borrower, the selling participant and any other persons interpositioned between the Fund and borrower (“intermediate participants”). The Fund may not directly benefit from the collateral supporting the senior loan in which it has purchased the loan participation.
Federal Income Taxes: It is the Fund’s policy to continue to meet the requirements of the Internal Revenue Code applicable to regulated investment companies and to distribute all of its taxable net income and capital gains, if any, to shareholders. Therefore, no federal income tax provision is required.
Dividends and Distributions: The Fund declares daily dividends from net investment income and net realized short-term capital gains or losses. Payment of dividends is made monthly. Dividends and distributions to shareholders, which are determined in accordance with federal income tax regulations and which may differ from generally accepted accounting principles are recorded on the ex-dividend date.
Restricted Securities: The Fund may hold up to 5% of its net assets in illiquid securities, including those which are restricted as to disposition under securities law (“restricted securities”). Restricted securities, sometimes referred to as private placements, are valued pursuant to the valuation procedures noted above.
Estimates: The preparation of the financial statements requires management to make estimates and assumptions that affect the reported amounts and disclosures in the financial statements. Actual results could differ from those estimates.
| | |
| Prudential MoneyMart Assets, Inc. | | 19 |
Notes to Financial Statements
continued
Note 2. Agreements
The Fund has a management agreement with Prudential Investments LLC (“PI”). Pursuant to this agreement, PI has responsibility for all investment advisory services and supervises the subadvisor’s performance of such services. PI has entered into a subadvisory agreement with Prudential Investment Management, Inc. (“PIM”). The subadvisory agreement provides that PIM will furnish investment advisory services in connection with the management of the Fund. In connection therewith, PIM is obligated to keep certain books and records of the Fund. PI pays for the services of PIM, the cost of compensation of officers of the Fund, occupancy and certain clerical and bookkeeping costs of the Fund. The Fund bears all other costs and expenses.
The management fee paid to PI is accrued daily and payable monthly, at an annual rate of .50% of the Fund’s average daily net assets up to $50 million and .30% of the Fund’s average daily net assets in excess of $50 million. The effective management fee rate was .15% of the average daily net assets for the year ended July 31, 2010.
The Fund has a distribution agreement with Prudential Investment Management Services LLC (“PIMS”), which acts as the distributor of the Class A, Class B, Class C, Class L, Class M, Class X and Class Z shares of the Fund. The Fund compensates PIMS for distributing and servicing the Fund’s Class A, Class L, Class M and Class X shares, pursuant to plans of distribution (the “Class A, L, M and X Plans”), regardless of expenses actually incurred by PIMS. The distribution fees are accrued daily and payable monthly.
Pursuant to the Class A, L, M and X Plans, the Fund compensates PIMS for distribution related activities at an annual rate of .125%, .50%, 1% and 1% of the average daily net assets of the Class A, Class L, Class M and Class X shares, respectively. No distribution or service fees are paid to PIMS as distributor of Class B, Class C and Class Z shares of the Fund.
Effective March 1, 2010, in order to support the income yield, PIMS and PI have voluntarily undertaken to waive distribution and service (12b-1) fees of Class A, Class L, Class M and Class X shares and management fees of the Fund, respectively, such that the 1-day income yield (excluding capital gain or loss) does not fall below .02%. The income yield limit was set at .05% on September 1, 2009. The waivers are voluntary and may be modified or terminated at any time. Pursuant to this undertaking, during the year ended July 31, 2010, PIMS has waived $799,435,
| | |
| 20 | | Visit our website at www.prudentialfunds.com |
$26,775, $47,418 and $36,938 of Class A’s, Class L’s, Class M’s and Class X’s distribution and service (12b-1) fees, respectively and PI has waived $1,518,030 of the Fund’s management fees. The Fund is not required to reimburse PIMS and PI for the amounts waived.
PI, PIM and PIMS are indirect, wholly-owned subsidiaries of Prudential Financial, Inc. (“Prudential”).
Note 3. Other Transactions with Affiliates
Prudential Mutual Fund Services LLC (“PMFS”), an affiliate of PI and an indirect, wholly-owned subsidiary of Prudential, serves as the Fund’s transfer agent. Transfer agent’s fees and expenses in the Statement of Operations include certain out-of-pocket and sub-transfer agent expenses paid to non-affiliates, where applicable.
The Fund pays networking fees to affiliated and unaffiliated broker-dealers including fees related to the services of Pruco LLP (“Pruco”), an affiliate of PI. Wells Fargo Advisors, LLC (“Wells Fargo”) and First Clearing, LLC (“First Clearing”), were affiliates of PI through December 31, 2009. These networking fees are payments made to broker/dealers that clear mutual fund transactions through a national clearing system. For the year ended July 31, 2010, the Fund incurred approximately $209,800 in total networking fees of which approximately $151,800 was paid to Pruco, while Wells Fargo and First Clearing were paid $6,300 and $4,700, respectively through December 31, 2009. These amounts are included in transfer agent’s fees and expenses in the Statement of Operations.
Note 4. Capital
The Fund offers Class A, Class B, Class C, Class L, Class M, Class X and Class Z shares. Class B, C and Z shares are not subject to any distribution and/or service fees and are offered exclusively for sale to a limited group of investors. Class M shares will automatically convert to Class A shares approximately eight years after purchase. Class X shares will automatically convert to Class A shares approximately ten years after purchase. Class L, Class M and Class X shares are not offered to new purchasers and are only available through exchange from the same class of shares offered by certain Prudential funds. There are 20 billion authorized shares of $.001 par value common stock divided into seven classes, which consist of 10 billion Class A, 2.5 billion Class B, 2.5 billion Class C, 1 billion Class L, 1 billion Class M, 1 billion Class X and 2 billion Class Z shares.
| | |
| Prudential MoneyMart Assets, Inc. | | 21 |
Notes to Financial Statements
continued
Transactions in shares and dollars of common stock (at $1 net asset value per share) were as follows:
| | | | | | | |
Class A | | Shares | | | Amount | |
Year ended July 31, 2010: | | | | | | | |
Shares sold | | 1,149,802,579 | | | $ | 1,149,803,047 | |
Shares issued in reinvestment of dividends | | 349,893 | | | | 349,893 | |
Shares reacquired | | (1,309,511,474 | ) | | | (1,309,511,474 | ) |
| | | | | | | |
Net increase (decrease) in shares outstanding before conversion | | (159,359,002 | ) | | | (159,358,534 | ) |
Shares issued upon conversion from Class M and Class X | | 5,752,026 | | | | 5,752,026 | |
| | | | | | | |
Net increase (decrease) in shares outstanding | | (153,606,976 | ) | | $ | (153,606,508 | ) |
| | | | | | | |
Year ended July 31, 2009: | | | | | | | |
Shares sold | | 1,508,960,936 | | | $ | 1,508,962,449 | |
Shares issued in reinvestment of dividends | | 8,445,151 | | | | 8,445,157 | |
Shares issued in connection with reorganization (Note 6) | | 17,875,062 | | | | 17,875,062 | |
Shares reacquired | | (1,532,075,948 | ) | | | (1,532,075,948 | ) |
| | | | | | | |
Net increase (decrease) in shares outstanding before conversion | | 3,205,201 | | | | 3,206,720 | |
Shares issued upon conversion from Class M and Class X | | 4,146,910 | | | | 4,146,910 | |
| | | | | | | |
Net increase (decrease) in shares outstanding | | 7,352,111 | | | $ | 7,353,630 | |
| | | | | | | |
Class B | | | | | | |
Year ended July 31, 2010: | | | | | | | |
Shares sold | | 14,632,700 | | | $ | 14,632,707 | |
Shares issued in reinvestment of dividends | | 35,451 | | | | 35,451 | |
Shares reacquired | | (34,879,279 | ) | | | (34,879,279 | ) |
| | | | | | | |
Net increase (decrease) in shares outstanding | | (20,211,128 | ) | | $ | (20,211,121 | ) |
| | | | | | | |
Year ended July 31, 2009: | | | | | | | |
Shares sold | | 44,660,828 | | | $ | 44,662,571 | |
Shares issued in reinvestment of dividends | | 901,962 | | | | 901,962 | |
Shares reacquired | | (42,223,049 | ) | | | (42,223,049 | ) |
| | | | | | | |
Net increase (decrease) in shares outstanding | | 3,339,741 | | | $ | 3,341,484 | |
| | | | | | | |
| | |
| 22 | | Visit our website at www.prudentialfunds.com |
| | | | | | | |
Class C | | Shares | | | Amount | |
Year ended July 31, 2010: | | | | | | | |
Shares sold | | 16,035,210 | | | $ | 16,035,210 | |
Shares issued in reinvestment of dividends | | 12,400 | | | | 12,400 | |
Shares reacquired | | (20,669,132 | ) | | | (20,669,132 | ) |
| | | | | | | |
Net increase (decrease) in shares outstanding | | (4,621,522 | ) | | $ | (4,621,522 | ) |
| | | | | | | |
Year ended July 31, 2009: | | | | | | | |
Shares sold | | 30,604,768 | | | $ | 30,605,088 | |
Shares issued in reinvestment of dividends | | 299,028 | | | | 299,028 | |
Shares issued in connection with reorganization (Note 6) | | 4,983,003 | | | | 4,983,003 | |
Shares reacquired | | (32,493,125 | ) | | | (32,493,125 | ) |
| | | | | | | |
Net increase (decrease) in shares outstanding | | 3,393,674 | | | $ | 3,393,994 | |
| | | | | | | |
Class L | | | | | | |
Year ended July 31, 2010: | | | | | | | |
Shares sold | | 1,538,114 | | | $ | 1,538,114 | |
Shares issued in reinvestment of dividends | | 2,719 | | | | 2,719 | |
Shares reacquired | | (3,357,807 | ) | | | (3,357,807 | ) |
| | | | | | | |
Net increase (decrease) in shares outstanding | | (1,816,974 | ) | | $ | (1,816,974 | ) |
| | | | | | | |
Period ended July 31, 2009*: | | | | | | | |
Shares sold | | 2,123,955 | | | $ | 2,124,059 | |
Shares issued in reinvestment of dividends | | 13,118 | | | | 13,117 | |
Shares issued in connection with reorganization (Note 6) | | 6,783,328 | | | | 6,783,328 | |
Shares reacquired | | (2,665,646 | ) | | | (2,665,646 | ) |
| | | | | | | |
Net increase (decrease) in shares outstanding | | 6,254,755 | | | $ | 6,254,858 | |
| | | | | | | |
Class M | | | | | | |
Year ended July 31, 2010: | | | | | | | |
Shares sold | | 1,504,802 | | | $ | 1,504,802 | |
Shares issued in reinvestment of dividends | | 2,614 | | | | 2,614 | |
Shares reacquired | | (3,318,834 | ) | | | (3,318,761 | ) |
| | | | | | | |
Net increase (decrease) in shares outstanding before conversion | | (1,811,418 | ) | | | (1,811,345 | ) |
Shares reacquired upon conversion into Class A | | (4,082,794 | ) | | | (4,082,867 | ) |
| | | | | | | |
Net increase (decrease) in shares outstanding | | (5,894,212 | ) | | $ | (5,894,212 | ) |
| | | | | | | |
Period ended July 31, 2009*: | | | | | | | |
Shares sold | | 2,383,558 | | | $ | 2,383,559 | |
Shares issued in reinvestment of dividends | | 19,459 | | | | 19,459 | |
Shares issued in connection with reorganization (Note 6) | | 13,301,528 | | | | 13,301,528 | |
Shares reacquired | | (4,370,505 | ) | | | (4,370,505 | ) |
| | | | | | | |
Net increase (decrease) in shares outstanding before conversion | | 11,334,040 | | | | 11,334,041 | |
Shares reacquired upon conversion into Class A | | (2,929,080 | ) | | | (2,929,080 | ) |
| | | | | | | |
Net increase (decrease) in shares outstanding | | 8,404,960 | | | $ | 8,404,961 | |
| | | | | | | |
| | |
| Prudential MoneyMart Assets, Inc. | | 23 |
Notes to Financial Statements
continued
| | | | | | | |
Class X | | Shares | | | Amount | |
Year ended July 31, 2010: | | | | | | | |
Shares sold | | 1,071,591 | | | $ | 1,071,591 | |
Shares issued in reinvestment of dividends | | 2,022 | | | | 2,022 | |
Shares reacquired | | (2,226,537 | ) | | | (2,226,510 | ) |
| | | | | | | |
Net increase (decrease) in shares outstanding before conversion | | (1,152,924 | ) | | | (1,152,897 | ) |
Shares reacquired upon conversion into Class A | | (1,669,132 | ) | | | (1,669,159 | ) |
| | | | | | | |
Net increase (decrease) in shares outstanding | | (2,822,056 | ) | | $ | (2,822,056 | ) |
| | | | | | | |
Period ended July 31, 2009*: | | | | | | | |
Shares sold | | 1,952,968 | | | $ | 1,952,996 | |
Shares issued in reinvestment of dividends | | 11,328 | | | | 11,328 | |
Shares issued in connection with reorganization (Note 6) | | 7,117,859 | | | | 7,117,859 | |
Shares reacquired | | (2,527,612 | ) | | | (2,527,612 | ) |
| | | | | | | |
Net increase (decrease) in shares outstanding before conversion | | 6,554,543 | | | | 6,554,571 | |
Shares reacquired upon conversion into Class A | | (1,217,830 | ) | | | (1,217,830 | ) |
| | | | | | | |
Net increase (decrease) in shares outstanding | | 5,336,713 | | | $ | 5,336,741 | |
| | | | | | | |
Class Z | | | | | | |
Year ended July 31, 2010: | | | | | | | |
Shares sold | | 80,944,390 | | | $ | 80,944,390 | |
Shares issued in reinvestment of dividends | | 105,910 | | | | 105,910 | |
Shares reacquired | | (79,221,047 | ) | | | (79,221,047 | ) |
| | | | | | | |
Net increase (decrease) in shares outstanding | | 1,829,253 | | | $ | 1,829,253 | |
| | | | | | | |
Year ended July 31, 2009: | | | | | | | |
Shares sold | | 84,683,433 | | | $ | 84,683,433 | |
Shares issued in reinvestment of dividends | | 2,238,411 | | | | 2,238,411 | |
Shares reacquired | | (83,305,373 | ) | | | (83,305,373 | ) |
| | | | | | | |
Net increase (decrease) in shares outstanding | | 3,616,471 | | | $ | 3,616,471 | |
| | | | | | | |
| * | Commenced offering on October 27, 2008. |
Note 5. Distributions and Tax Information
Distributions to shareholders, which are determined in accordance with federal income tax regulations and which may differ from generally accepted accounting principles, are recorded on the ex-dividend date. In order to present distributions in excess of net investment income, accumulated net realized gain on investment transactions and paid-in capital in excess of par on the Statement of Assets and Liabilities that more closely represent their tax character, certain adjustments have been made to distributions in excess of net investment income, accumulated net realized gain on
| | |
| 24 | | Visit our website at www.prudentialfunds.com |
investment transactions and paid-in capital in excess of par. For the year ended July 31, 2010, the adjustments were to decrease distributions in excess of net investment income by $67,259, decrease accumulated net realized gain on investment transactions by $80,481 and to increase paid-in capital in excess of par by $13,222 due to the reclassification of distributions and other book to tax differences. Net investment income, net realized gain on investment transactions and net assets were not affected by these changes.
For the years ended July 31, 2010 and 2009, the tax character of dividends paid, as reflected in the Statement of Changes in Net Assets were $496,749 and $12,055,302 from ordinary income, respectively.
As of July 31, 2010, the accumulated undistributed ordinary income on a tax basis was $52,387 (includes timing difference of $2,862 for dividends payable). This differs from the amount shown on the Statement of Assets and Liabilities primarily due to cumulative timing differences between financial and tax reporting.
Management has analyzed the Fund’s tax positions taken on federal income tax returns for all open tax years and has concluded that as of July 31, 2010, no provision for income tax would be required in the Fund’s financial statements. The Fund’s federal and state income and federal excise tax returns for tax years for which the applicable statutes of limitations have not expired are subject to examination by the Internal Revenue Service and state departments of revenue.
Note 6. Reorganization
At the close of business on December 19, 2008, the Fund acquired all of the net assets of Dryden Money Market Fund, a series of Strategic Partners Mutual Funds, Inc., pursuant to a tax-free plan of reorganization approved by the Dryden Money Market Fund shareholders on November 25, 2008. The acquisition was accomplished by a tax-free issue of Class A, Class C, Class L, Class M and Class X shares for the corresponding classes of Dryden Money Market Fund. Class D shareholders of Dryden Money Market Fund received Class A shares of the Fund.
| | | | | | | | | |
| Dryden Money Market Fund | | Prudential MoneyMart Assets, Inc. |
Class | | Shares | | Class | | Shares | | Value |
| A | | 11,983,673 | | A | | 17,875,062 | | $ | 17,875,062 |
| C | | 4,981,703 | | C | | 4,983,003 | | | 4,983,003 |
| D | | 5,948,710 | | L | | 6,783,328 | | | 6,783,328 |
| L | | 6,782,613 | | M | | 13,301,528 | | | 13,301,528 |
| M | | 13,336,994 | | X | | 7,117,859 | | | 7,117,859 |
| X | | 7,142,761 | | | | | | | |
| | |
| Prudential MoneyMart Assets, Inc. | | 25 |
Notes to Financial Statements
continued
The aggregate net assets of Dryden Money Market Fund and the Fund immediately before the acquisition were $50,131,632 and $1,072,491,665, respectively.
The Fund acquired capital loss carryforward from the reorganization with Dryden Money Market Fund of approximately $13,000. The Fund utilized the full capital loss carryforward to offset net taxable gains realized in the fiscal year ended July 31, 2009.
Note 7. Other
During the reporting period, with the approval of the Board of Directors, the Fund participated in the U.S. Treasury Department’s Temporary Guarantee Program for Money Market Funds (the “Program”) through its expiration on September 18, 2009. In connection with the participation, the Fund incurred $55,747 in fees, which was .01% of average daily net assets during the year ended July 31, 2010.
Note 8. New Accounting Pronouncement
In January 2010, the Financial Accounting Standards Board issued Accounting Standards Update (“ASU”) No. 2010-06 “Improving Disclosures about Fair Value Measurements”. ASU 2010-06 will require reporting entities to make new disclosures about amounts and reasons for significant transfers in and out of Level 1 and Level 2 fair value measurements and input and valuation techniques used to measure fair value for both recurring and nonrecurring fair value measurements that fall in either Level 2 or Level 3, and information on purchases, sales, issuances, and settlements in the roll forward of activity in Level 3 fair value measurements. The new and revised disclosures are effective for interim and annual reporting periods beginning after December 15, 2009 except for the disclosures about purchases, sales, issuances, and settlements in the roll forward of activity in Level 3 fair value measurements, which are effective for interim and annual reporting periods beginning after December 15, 2010. At this time, management is evaluating the implications of ASU No. 2010-06 and its impact on the financial statements has not been determined.
| | |
| 26 | | Visit our website at www.prudentialfunds.com |
Financial Highlights
CLASS A SHARES
| | | | | | | | | | | | | | | | | | |
Class A Shares | |
| | | Year Ended July 31, | | | Seven-Month
Period Ended
July 31, 2007(a) | | | Year Ended
December 31, | |
| Per Share Operating Performance: | | 2010 | | | 2009 | | | 2008 | | | | 2006 | | | 2005 | |
| Net Asset Value, Beginning Of Period | | $1.000 | | | $1.000 | | | $1.000 | | | $1.000 | | | $1.000 | | | $1.000 | |
| Income from investment operations: | | | | | | | | | | | | | | | | | | |
| Net investment income and net realized gains | | - | (g) | | .011 | | | .037 | | | .028 | | | .044 | | | .025 | |
| Dividends to shareholders | | - | (g) | | (.011 | ) | | (.037 | ) | | (.028 | ) | | (.044 | ) | | (.025 | ) |
| Net asset value, end of period | | $1.000 | | | $1.000 | | | $1.000 | | | $1.000 | | | $1.000 | | | $1.000 | |
| Total Return(b): | | .05% | | | 1.10% | | | 3.79% | | | 2.74% | | | 4.46% | | | 2.58% | |
| |
| Ratios/Supplemental Data: | |
| Net assets, end of period (000) | | $606,100 | | | $759,704 | | | $752,350 | | | $646,959 | | | $652,403 | | | $698,040 | |
| Average net assets (000) | | $668,825 | | | $783,488 | | | $698,827 | | | $640,915 | | | $651,453 | | | $786,418 | |
| Ratios to average net assets(f): | | | | | | | | | | | | | | | | | | |
Expenses, including distribution and
service (12b-1) fees | | .31% | (d) | | .55% | (d) | | .54% | | | .58% | (c) | | .68% | | | .80% | |
Expenses, excluding distribution and
service (12b-1) fees | | .31% | (e) | | .43% | | | .42% | | | .45% | (c) | | .56% | | | .67% | |
| Net investment income | | .04% | (d) | | 1.09% | (d) | | 3.57% | | | 4.84% | (c) | | 4.38% | | | 2.46% | |
(a) For the seven-month period ended July 31, 2007. The Fund changed its fiscal year end from December 31 to July 31, effective July 31, 2007.
(b) Total return is calculated assuming a purchase of a share on the first day and a sale on the last day of each period reported and includes reinvestment of dividends and distributions. Total returns may reflect adjustments to conform to generally accepted accounting principles. Total returns for periods of less than one full year are not annualized.
(c) Annualized.
(d) Net of management fee and distribution and service (12b-1) fees waiver. If the investment manager had not waived expenses, the expense ratios including distribution and service (12b-1) fees would have been .59% and .56% for the years ended July 31, 2010 and July 31, 2009, respectively. The net investment income (loss) ratios would have been (.24)% and 1.08% for the years ended July 31, 2010 and July 31, 2009, respectively.
(e) Net of management fee waiver. If the investment manager had not waived expenses, the expense ratio excluding distribution and service (12b-1) fees would have been .47% for the year ended July 31, 2010.
(f) Includes .01% and .03% of the U.S. Treasury Money Market Fund Guarantee Program fee for the years ended July 31, 2010 and July 31, 2009, respectively.
(g) Less than $.0005 per share.
See Notes to Financial Statements.
| | |
| Prudential MoneyMart Assets, Inc. | | 27 |
Financial Highlights
continued
CLASS B SHARES
| | | | | | | | | | | | | | | | | | |
| Class B Shares | |
| | | Year Ended July 31, | | | Seven-Month
Period Ended
July 31, 2007(a) | | | Year Ended December 31,
2006 | | | March 11, 2005(b)
through December 31,
2005 | |
| Per Share Operating Performance: | | 2010 | | | 2009 | | | 2008 | | | | |
| Net Asset Value, Beginning Of Period | | $1.000 | | | $1.000 | | | $1.000 | | | $1.000 | | | $1.000 | | | $1.000 | |
| Income from investment operations: | |
| Net investment income and net realized gains | | .001 | | | .012 | | | .038 | | | .029 | | | .045 | | | .023 | |
| Dividends to shareholders | | (.001 | ) | | (.012 | ) | | (.038 | ) | | (.029 | ) | | (.045 | ) | | (.023 | ) |
| Net asset value, end of period | | $1.000 | | | $1.000 | | | $1.000 | | | $1.000 | | | $1.000 | | | $1.000 | |
| Total Return(c): | | .05% | | | 1.22% | | | 3.92% | | | 2.81% | | | 4.59% | | | 2.37% | |
| |
| Ratios/Supplemental Data: | |
| Net assets, end of period (000) | | $52,720 | | | $72,931 | | | $69,590 | | | $64,188 | | | $70,962 | | | $83,891 | |
| Average net assets (000) | | $60,695 | | | $78,763 | | | $67,467 | | | $67,491 | | | $76,873 | | | $90,153 | |
| Ratios to average net assets(f): | | | | | | | | | | | | | | | | | | |
| Expenses, including distribution and service (12b-1) fees | | .31% | (e) | | .43% | | | .42% | | | .45% | (d) | | .56% | | | .65% | (d) |
| Expenses, excluding distribution and service (12b-1) fees | | .31% | (e) | | .43% | | | .42% | | | .45% | (d) | | .56% | | | .65% | (d) |
| Net investment income | | .05% | (e) | | 1.20% | | | 3.76% | | | 4.97% | (d) | | 4.51% | | | 2.84% | (d) |
(a) For the seven-month period ended July 31, 2007. The Fund changed its fiscal year end from December 31 to July 31, effective July 31, 2007.
(b) Commencement of offering.
(c) Total return is calculated assuming a purchase of a share on the first day and a sale on the last day of each period reported and includes reinvestment of dividends and distributions. Total returns may reflect adjustments to conform to generally accepted accounting principles. Total returns for periods of less than one full year are not annualized.
(d) Annualized.
(e) Net of management fee waiver. If the investment manager had not waived management fees, the expense ratio including distribution and service (12b-1) fees would have been .47% for the year ended July 31, 2010. The expense ratio excluding distribution and service (12b-1) fees would have been ..47% for the year ended July 31, 2010. The net investment loss ratio would have been (.11)% for the year ended July 31, 2010.
(f) Includes ..01% and .03% of the U.S. Treasury Money Market Fund Guarantee Program fee for the years ended July 31, 2010 and July 31, 2009, respectively.
See Notes to Financial Statements.
| | |
| 28 | | Visit our website at www.prudentialfunds.com |
CLASS C SHARES
| | | | | | | | | | | | | | | | | | |
| Class C Shares | |
| | | Year Ended July 31, | | | Seven-Month Period Ended
July 31, 2007(a) | | | Year Ended
December 31, 2006 | | | March 11, 2005(b) through
December 31, 2005 | |
Per Share Operating
Performance: | | 2010 | | | 2009 | | | 2008 | | | | |
| Net Asset Value, Beginning Of Period | | $1.000 | | | $1.000 | | | $1.000 | | | $1.000 | | | $1.000 | | | $1.000 | |
| Income from investment operations: | | | | | | | | | | | | | | | | | | |
| Net investment income and net realized gains | | .001 | | | .012 | | | .038 | | | .029 | | | .045 | | | .023 | |
| Dividends to shareholders | | (.001 | ) | | (.012 | ) | | (.038 | ) | | (.029 | ) | | (.045 | ) | | (.023 | ) |
| Net asset value, end of period | | $1.000 | | | $1.000 | | | $1.000 | | | $1.000 | | | $1.000 | | | $1.000 | |
| Total Return(c): | | .05% | | | 1.22% | | | 3.92% | | | 2.81% | | | 4.59% | | | 2.37% | |
| |
| Ratios/Supplemental Data: | |
| Net assets, end of period (000) | | $20,125 | | | $24,747 | | | $21,353 | | | $13,422 | | | $12,373 | | | $10,882 | |
| Average net assets (000) | | $21,593 | | | $27,653 | | | $15,596 | | | $12,867 | | | $13,294 | | | $12,218 | |
| Ratios to average net assets(f): | | | | | | | | | | | | | | | | | | |
| Expenses, including distribution and service (12b-1) fees | | .31% | (e) | | .43% | | | .42% | | | .45% | (d) | | .56% | | | .65% | (d) |
| Expenses, excluding distribution and service (12b-1) fees | | .31% | (e) | | .43% | | | .42% | | | .45% | (d) | | .56% | | | .65% | (d) |
| Net investment income | | .05% | (e) | | 1.16% | | | 3.63% | | | 4.97% | (d) | | 4.56% | | | 2.87% | (d) |
(a) For the seven-month period ended July 31, 2007. The Fund changed its fiscal year end from December 31 to July 31, effective July 31, 2007.
(b) Commencement of offering.
(c) Total return is calculated assuming a purchase of a share on the first day and a sale on the last day of each period reported and includes reinvestment of dividends and distributions. Total returns may reflect adjustments to conform to generally accepted accounting principles. Total returns for periods of less than one full year are not annualized.
(d) Annualized.
(e) Net of management fee waiver. If the investment manager had not waived management fees, the expense ratio including distribution and service (12b-1) fees would have been .47% for the year ended July 31, 2010. The expense ratio excluding distribution and service (12b-1) fees would have been ..47% for the year ended July 31, 2010. The net investment loss ratio would have been (.11)% for the year ended July 31, 2010.
(f) Includes ..01% and .03% of the U.S. Treasury Money Market Fund Guarantee Program fee for the years ended July 31, 2010 and July 31, 2009, respectively.
See Notes to Financial Statements.
| | |
| Prudential MoneyMart Assets, Inc. | | 29 |
Financial Highlights
continued
CLASS L SHARES
| | | | | | |
| Class L Shares | | | | | | |
| | | Year Ended July 31, | | | October 27, 2008(a)
through July 31, | |
| Per Share Operating Performance: | | 2010 | | | 2009 | |
| Net Asset Value, Beginning Of Period | | $1.000 | | | $1.000 | |
| Income from investment operations: | | | | | | |
| Net investment income and net realized gains | | - | (g) | | .004 | |
| Dividends to shareholders | | - | (g) | | (.004 | ) |
| Net asset value, end of period | | $1.000 | | | $1.000 | |
| Total Return(b): | | .05% | | | .45% | |
| |
| Ratios/Supplemental Data: | | | | | | |
| Net assets, end of period (000) | | $4,438 | | | $6,255 | |
| Average net assets (000) | | $5,421 | | | $5,397 | |
| Ratios to average net assets(f): | | | | | | |
Expenses, including distribution and
service (12b-1) fees | | .32% | (d) | | .68% | (c)(d) |
Expenses, excluding distribution and
service (12b-1) fees | | .31% | (e) | | .43% | (c) |
| Net investment income | | .04% | (d) | | .33% | (c)(d) |
(a) Commencement of offering.
(b) Total return is calculated assuming a purchase of a share on the first day and a sale on the last day of each period reported and includes reinvestment of dividends and distributions. Total returns may reflect adjustments to conform to generally accepted accounting principles. Total returns for periods of less than one full year are not annualized.
(c) Annualized.
(d) Net of management fee and distribution and service (12b-1) fees waiver. If the investment manager had not waived expenses, the expense ratio including distribution and service (12b-1) fees would have been .97% for the year ended July 31, 2010 and .93% for the period ended July 31, 2009. The net investment income (loss) ratios would have been (.61)% the year ended July 31, 2010 and .08% for the period ended July 31, 2009.
(e) Net of management fee waiver. If the investment manager had not waived expenses, the expense ratio excluding distribution and service (12b-1) fees would have been .47% for the year ended July 31, 2010.
(f) Includes .01% and .03% of the U.S. Treasury Money Market Fund Guarantee Program fee for the year ended July 31, 2010 and the period ended July 31, 2009, respectively.
| (g) | Less than $.0005 per share. |
See Notes to Financial Statements.
| | |
| 30 | | Visit our website at www.prudentialfunds.com |
CLASS M SHARES
| | | | | | |
| Class M Shares | |
Per Share Operating Performance: | | Year Ended July 31,
2010 | | | October 27, 2008(a)
through
July 31, 2009 | |
| Net Asset Value, Beginning Of Period | | $1.000 | | | $1.000 | |
| Income from investment operations: | | | | | | |
| Net investment income and net realized gains | | - | (g) | | .004 | |
| Dividends to shareholders | | - | (g) | | (.004 | ) |
| Net asset value, end of period | | $1.000 | | | $1.000 | |
| Total Return(b): | | .05% | | | .39% | |
| |
| Ratios/Supplemental Data: | |
| Net assets, end of period (000) | | $2,511 | | | $8,405 | |
| Average net assets (000) | | $4,785 | | | $8,737 | |
| Ratios to average net assets(f): | | | | | | |
| Expenses, including distribution and service (12b-1) fees | | .32% | (d) | | .72% | (c)(d) |
| Expenses, excluding distribution and service (12b-1) fees | | .31% | (e) | | .43% | (c) |
| Net investment income | | .05% | (d) | | .31% | (c)(d) |
(a) Commencement of offering.
(b) Total return is calculated assuming a purchase of a share on the first day and a sale on the last day of each period reported and includes reinvestment of dividends and distributions. Total returns may reflect adjustments to conform to generally accepted accounting principles. Total returns for periods of less than one full year are not annualized.
(c) Annualized.
(d) Net of management fee and distribution and service (12b-1) fees waiver. If the investment manager had not waived expenses, the expense ratio including distribution and service (12b-1) fees would have been 1.47% for the year ended July 31, 2010 and 1.43% for the period ended July 31, 2009. The net investment loss ratios would have been (1.10)% the year ended July 31, 2010 and (.40)% for the period ended July 31, 2009.
(e) Net of management fee waiver. If the investment manager had not waived expenses, the expense ratio excluding distribution and service (12b-1) fees would have been .47% for the year ended July 31, 2010.
(f) Includes .01% and .03% of the U.S. Treasury Money Market Fund Guarantee Program fee for the year ended July 31, 2010 and the period ended July 31, 2009, respectively.
(g) Less than $.0005 per share.
See Notes to Financial Statements.
| | |
| Prudential MoneyMart Assets, Inc. | | 31 |
Financial Highlights
continued
CLASS X SHARES
| | | | | | |
| Class X Shares | |
| Per Share Operating Performance: | | Year Ended July 31,
2010 | | | October 27, 2008(a) through
July 31, 2009 | |
| Net Asset Value, Beginning Of Period | | $1.000 | | | $1.000 | |
| Income from investment operations: | | | | | | |
| Net investment income and net realized gains | | - | (g) | | .004 | |
| Dividends to shareholders | | - | (g) | | (.004 | ) |
| Net asset value, end of period | | $1.000 | | | $1.000 | |
| Total Return(b): | | .05% | | | .39% | |
| |
| Ratios/Supplemental Data: | |
| Net assets, end of period (000) | | $2,515 | | | $5,337 | |
| Average net assets (000) | | $3,722 | | | $5,119 | |
| Ratios to average net assets(f): | | | | | | |
| Expenses, including distribution and service (12b-1) fees | | .32% | (d) | | .71% | (c)(d) |
| Expenses, excluding distribution and service (12b-1) fees | | .31% | (e) | | .43% | (c) |
| Net investment income | | .05% | (d) | | .30% | (c)(d) |
(a) Commencement of offering.
(b) Total return is calculated assuming a purchase of a share on the first day and a sale on the last day of each period reported and includes reinvestment of dividends and distributions. Total returns may reflect adjustments to conform to generally accepted accounting principles. Total returns for periods of less than one full year are not annualized.
(c) Annualized.
(d) Net of management fee and distribution and service (12b-1) fees waiver. If the investment manager had not waived expenses, the expense ratio including distribution and service (12b-1) fees would have been 1.47% for the year ended July 31, 2010 and 1.43% for the period ended July 31, 2009. The net investment loss ratios would have been (1.10)% the year ended July 31, 2010 and (.42)% for the period ended July 31, 2009.
(e) Net of management fee waiver. If the investment manager had not waived expenses, the expense ratio excluding distribution and service (12b-1) fees would have been .47% for the year ended July 31, 2010.
(f) Includes .01% and .03% of the U.S. Treasury Money Market Fund Guarantee Program fee for the year ended July 31, 2010 and the period ended July 31, 2009, respectively.
(g) Less than $.0005 per share.
See Notes to Financial Statements.
| | |
| 32 | | Visit our website at www.prudentialfunds.com |
CLASS Z SHARES
| | | | | | | | | | | | | | | | | | |
| Class Z Shares | |
| | | Year Ended July 31, | | | Seven-Month
Period Ended
July 31, 2007(a) | | | Year Ended
December 31, | |
| Per Share Operating Performance: | | 2010 | | | 2009 | | | 2008 | | | | 2006 | | | 2005 | |
| Net Asset Value, Beginning Of Period | | $1.000 | | | $1.000 | | | $1.000 | | | $1.000 | | | $1.000 | | | $1.000 | |
| Income from investment operations: | | | | | | | | | | | | | | | | | | |
| Net investment income and net realized gains | | .001 | | | .012 | | | .038 | | | .029 | | | .045 | | | .027 | |
| Dividends to shareholders | | (.001 | ) | | (.012 | ) | | (.038 | ) | | (.029 | ) | | (.045 | ) | | (.027 | ) |
| Net asset value, end of period | | $1.000 | | | $1.000 | | | $1.000 | | | $1.000 | | | $1.000 | | | $1.000 | |
| Total Return(b): | | .05% | | | 1.22% | | | 3.92% | | | 2.81% | | | 4.59% | | | 2.70% | |
| |
| Ratios/Supplemental Data: | |
| Net assets, end of period (000) | | $183,736 | | | $181,906 | | | $178,289 | | | $154,662 | | | $150,156 | | | $187,925 | |
| Average net assets (000) | | $181,652 | | | $180,110 | | | $173,762 | | | $150,056 | | | $178,667 | | | $187,379 | |
| Ratios to average net assets(e): | | | | | | | | | | | | | | | | | | |
Expenses, including distribution and
service (12b-1) fees | | .31% | (d) | | .43% | | | .42% | | | .45% | (c) | | .56% | | | .67% | |
Expenses, excluding distribution and
service (12b-1) fees | | .31% | (d) | | .43% | | | .42% | | | .45% | (c) | | .56% | | | .67% | |
| Net investment income | | .05% | (d) | | 1.20% | | | 3.76% | | | 4.97% | (c) | | 4.43% | | | 2.64% | |
(a) For the seven-month period ended July 31, 2007. The Fund changed its fiscal year end from December 31 to July 31, effective July 31, 2007.
(b) Total return is calculated assuming a purchase of a share on the first day and a sale on the last day of each period reported and includes reinvestment of dividends and distributions. Total returns may reflect adjustments to conform to generally accepted accounting principles. Total returns for periods of less than one full year are not annualized.
(c) Annualized.
(d) Net of management fee waiver. If the investment manager had not waived expenses, the expense ratio including distribution and service (12b-1) fees would have been .47% for the year ended July 31, 2010. The expense ratio excluding distribution and service (12b-1) fees would have been .47% for the year ended July 31, 2010. The net investment loss ratio would have been (.11)% for the year ended July 31, 2010.
(e) Includes .01% and .03% of the U.S. Treasury Money Market Fund Guarantee Program fee for the years ended July 31, 2010 and July 31, 2009, respectively.
See Notes to Financial Statements.
| | |
| Prudential MoneyMart Assets, Inc. | | 33 |
Report of Independent Registered Public Accounting Firm
The Board of Directors and Shareholders
Prudential MoneyMart Assets, Inc.:
We have audited the accompanying statement of assets and liabilities of Prudential MoneyMart Assets, Inc. (formerly MoneyMart Assets, Inc.) (hereafter referred to as the “Fund”), including the portfolio of investments, as of July 31, 2010, and the related statement of operations for the year then ended, the statement of changes in net assets for each of the years in the two-year period then ended and the financial highlights for each of the years in the five-year period then ended. These financial statements and financial highlights are the responsibility of the Fund’s management. Our responsibility is to express an opinion on these financial statements and financial highlights based on our audit.
We conducted our audits in accordance with the standards of the Public Company Accounting Oversight Board (United States). Those standards require that we plan and perform the audit to obtain reasonable assurance about whether the financial statements and financial highlights are free of material misstatement. An audit includes examining, on a test basis, evidence supporting the amounts and disclosures in the financial statements. Our procedures included confirmation of securities owned as of July 31, 2010, by correspondence with the custodian, transfer agent and brokers or by other appropriate auditing procedures when replies from brokers were not received. An audit also includes assessing the accounting principles used and significant estimates made by management, as well as evaluating the overall financial statement presentation. We believe that our audits provide a reasonable basis for our opinion.
In our opinion, the financial statements and financial highlights referred to above present fairly, in all material respects, the financial position of the Fund as of July 31, 2010, and the results of its operations for the year then ended, the changes in its net assets for each of the years in the two-year period then ended and the financial highlights for each of the years in the five-year period then ended, in conformity with U.S. generally accepted accounting principles.

New York, New York
September 21, 2010
| | |
| 34 | | Visit our website at www.prudentialfunds.com |
Federal Income Tax Information
(Unaudited)
We are required by the Internal Revenue Code of 1986, as amended (“the Code”), to advise you within 60 days of the Fund’s fiscal year end (July 31, 2010) as to the federal tax status of dividends paid by the Fund during such fiscal year. We are advising you that during its fiscal year ended July 31, 2010, the Fund paid ordinary income dividends of $.001 for Class B, Class C and Class Z per shares and less than $.0005 for Class A, Class L, Class M and Class X per share, respectively.
For the year ended July 31, 2010, the Fund designates the maximum amount allowable but not less than 98.37% as interest related dividends in accordance with Section 871(k)(1) and 881(e)(1) of the Internal Revenue Code.
Interest-related dividends do not include any distributions paid by a Fund with respect to Fund tax years beginning after December 31, 2009. Consequently, this provision expires with respect such distributions paid after Fund’s fiscal year.
In January 2011, you will be advised on IRS Form 1099 DIV or substitute 1099 DIV as to the federal tax status of the distributions received by you in calendar year 2010.
We are required by Massachusetts, Missouri and Oregon to inform you that dividends which have been derived from interest on federal obligations are not taxable to shareholders providing the Mutual Fund meets certain requirements mandated by the respective state’s taxing authorities. We are pleased to report that 4.99% of the dividends paid by the Fund qualifies for such deduction.
For more detailed information regarding your state and local taxes, you should contact your tax advisor or the state/local taxing authorities.
See Notes to Financial Statements.
| | |
| Prudential MoneyMart Assets, Inc. | | 35 |
MANAGEMENT OF THE FUND
(Unaudited)
Information about Fund Directors/Trustees (referred to herein as “Board Members”) and Fund Officers is set forth below. Board Members who are not deemed to be “interested persons,” as defined in the 1940 Act, are referred to as “Independent Board Members.” Board Members who are deemed to be “interested persons” are referred to as “Interested Board Members.” The Board Members are responsible for the overall supervision of the operations of the Fund and perform the various duties imposed on the directors or trustees of investment companies by the 1940 Act.
| | | | |
| Independent Board Members (1) | | |
Name, Address, Age Position(s) Portfolios Overseen | | Principal Occupation(s) During Past Five Years | | Other Directorships Held |
Kevin J. Bannon (58) Board Member Portfolios Overseen: 55 | | Managing Director (since April 2008) and Chief Investment Officer (since October 2008) of Highmount Capital LLC (registered investment adviser); formerly Executive Vice President and Chief Investment Officer (April 1993-August 2007) of Bank of New York Company; President (May 2003-May 2007) of BNY Hamilton Family of Mutual Funds. | | Director of Urstadt Biddle Properties (since September 2008). |
Linda W. Bynoe (58) Board Member Portfolios Overseen: 55 | | President and Chief Executive Officer (since March 1995) and formerly Chief Operating Officer (December 1989- February 1995) of Telemat Ltd. (management consulting); formerly Vice President (January 1985-June 1989) at Morgan Stanley & Co (broker-dealer). | | Director of Simon Property Group, Inc. (retail real estate) (since May 2003); Anixter International, Inc. (communication products distributor) (since January 2006); Director of Northern Trust Corporation (financial services) (since April 2006); Trustee of Equity Residential (residential real estate) (since December 2009); formerly Director of Dynegy Inc. (power generation) (September 2002-May 2006), CitiStreet Funds, Inc. (mutual funds) (May 1993-February 2005), AM- CH, Inc. (restaurant holding company) (November 2004-February 2005). |
Michael S. Hyland, CFA (64) Board Member Portfolios Overseen: 55 | | Independent Consultant (since February 2005); formerly Senior Managing Director (July 2001-February 2005) of Bear Stearns & Co, Inc.; Global Partner, INVESCO (1999-2001); Managing Director and President of Salomon Brothers Asset Management (1989-1999). | | None. |
Visit our website at www.prudentialfunds.com
| | | | |
Douglas H. McCorkindale (71) Board Member Portfolios Overseen: 55 | | Formerly Chairman (February 2001-June 2006), Chief Executive Officer (June 2000-July 2005), President (September 1997-July 2005) and Vice Chairman (March 1984-May 2000) of Gannett Co. Inc. (publishing and media). | | Director of Continental Airlines, Inc. (since May 1993); Director of Lockheed Martin Corp. (aerospace and defense) (since May 2001). |
Stephen P. Munn (68) Board Member Portfolios Overseen: 55 | | Lead Director (since 2007) and formerly Chairman (1993-2007) of Carlisle Companies Incorporated (manufacturer of industrial products). | | Lead Director (since 2007) of Carlisle Companies Incorporated (manufacturer of industrial products). |
Richard A. Redeker (67) Board Member Portfolios Overseen: 55 | | Retired Mutual Fund Senior Executive (42 years); Management Consultant; Independent Directors Council (organization of 2,800 Independent Mutual Fund Directors)-Executive Committee, Chair of Policy Steering Committee, Governing Council. | | None. |
Robin B. Smith (70) Board Member & Independent Chair Portfolios Overseen: 55 | | Chairman of the Board (since January 2003) of Publishers Clearing House (direct marketing); formerly Chairman and Chief Executive Officer (August 1996-January 2003) of Publishers Clearing House. | | Formerly Director of BellSouth Corporation (telecommunications) (1992-2006). |
Stephen G. Stoneburn (67) Board Member Portfolios Overseen: 55 | | President and Chief Executive Officer (since June 1996) of Quadrant Media Corp. (publishing company); formerly President (June 1995-June 1996) of Argus Integrated Media, Inc.; Senior Vice President and Managing Director (January 1993-1995) of Cowles Business Media; Senior Vice President of Fairchild Publications, Inc (1975-1989). | | None. |
Prudential MoneyMart Assets, Inc.
| | | | |
| Interested Board Members (1) | | |
Judy A. Rice (62) Board Member & President Portfolios Overseen: 55 | | President, Chief Executive Officer, Chief Operating Officer and Officer-In-Charge (since February 2003) of Prudential Investments LLC; President, Chief Executive Officer and Officer-In-Charge (since April 2003) of Prudential Mutual Fund Services LLC; Executive Vice President (since December 2008) of Prudential Investment Management Services LLC; formerly Vice President (February 1999-April 2006) of Prudential Investment Management Services LLC; formerly President, Chief Executive Officer, Chief Operating Officer and Officer- In-Charge (May 2003-June 2005) and Director (May 2003-March 2006) and Executive Vice President (June 2005-March 2006) of AST Investment Services, Inc.; Member of Board of Governors of the Investment Company Institute. | | None. |
Scott E. Benjamin (37) Board Member & Vice President Portfolios Overseen: 55 | | Executive Vice President (since June 2009) of Prudential Investments LLC and Prudential Investment Management Services LLC; Executive Vice President (since September 2009) of AST Investment Services, Inc.; Senior Vice President of Product Development and Marketing, Prudential Investments (since February 2006); Vice President of Product Development and Product Management, Prudential Investments (2003-2006). | | None. |
| (1) | The year that each Board Member joined the Fund’s Board is as follows: |
Kevin J. Bannon, 2008; Linda W. Bynoe, 2008; Michael S. Hyland, 2008; Douglas H. McCorkindale, 2008; Stephen P. Munn, 2008; Richard A. Redeker, 2008; Robin B. Smith, 1996; Stephen G. Stoneburn, 1996; Judy A. Rice, Board Member since 2008 and President since 2003; Scott E. Benjamin, Board Member since 2010 and Vice President since 2009.
Visit our website at www.prudentialfunds.com
| | |
| Fund Officers (a)(1) | | |
Name, Address and Age Position with Fund | | Principal Occupation(s) During Past Five Years |
Kathryn L. Quirk (57) Chief Legal Officer | | Vice President and Corporate Counsel (since September 2004) of Prudential; Executive Vice President, Chief Legal Officer and Secretary (since July 2005) of PI and Prudential Mutual Fund Services LLC; Vice President and Corporate Counsel (since June 2005) and Secretary (since February 2006) of AST Investment Services, Inc.; formerly Senior Vice President and Assistant Secretary (November 2004-August 2005) of PI; formerly Assistant Secretary (June 2005-February 2006) of AST Investment Services, Inc.; formerly Managing Director, General Counsel, Chief Compliance Officer, Chief Risk Officer and Corporate Secretary (1997-2002) of Zurich Scudder Investments, Inc. |
Deborah A. Docs (52) Secretary | | Vice President and Corporate Counsel (since January 2001) of Prudential; Vice President (since December 1996) and Assistant Secretary (since March 1999) of PI; formerly Vice President and Assistant Secretary (May 2003-June 2005) of AST Investment Services, Inc. |
Jonathan D. Shain (52) Assistant Secretary | | Vice President and Corporate Counsel (since August 1998) of Prudential; Vice President and Assistant Secretary (since May 2001) of PI; Vice President and Assistant Secretary (since February 2001) of PMFS; formerly Vice President and Assistant Secretary (May 2003-June 2005) of AST Investment Services, Inc. |
Claudia DiGiacomo (35) Assistant Secretary | | Vice President and Corporate Counsel (since January 2005) of Prudential; Vice President and Assistant Secretary of PI (since December 2005); Associate at Sidley Austin Brown & Wood LLP (1999-2004). |
John P. Schwartz (39) Assistant Secretary | | Vice President and Corporate Counsel (since April 2005) of Prudential; Vice President and Assistant Secretary of PI (since December 2005); Associate at Sidley Austin Brown & Wood LLP (1997-2005). |
Andrew R. French (47) Assistant Secretary | | Vice President and Corporate Counsel (since February 2010) of Prudential; formerly Director and Corporate Counsel (2006-2010) of Prudential; Vice President and Assistant Secretary (since January 2007) of PI; Vice President and Assistant Secretary (since January 2007) of PMFS; formerly Senior Legal Analyst of Prudential Mutual Fund Law Department (1997-2006). |
Timothy J. Knierim (51) Chief Compliance Officer | | Chief Compliance Officer of Prudential Investment Management, Inc. (since July 2007); formerly Chief Risk Officer of PIM and PI (2002-2007) and formerly Chief Ethics Officer of PIM and PI (2006-2007). |
Valerie M. Simpson (52) Deputy Chief Compliance Officer | | Chief Compliance Officer (since April 2007) of PI and AST Investment Services, Inc.; formerly Vice President-Financial Reporting (June 1999-March 2006) for Prudential Life and Annuities Finance. |
Theresa C. Thompson (48) Deputy Chief Compliance Officer | | Vice President, Compliance, PI (since April 2004); and Director, Compliance, PI (2001-2004). |
Prudential MoneyMart Assets, Inc.
| | |
Noreen M. Fierro (46) Anti-Money Laundering Compliance Officer | | Vice President, Corporate Compliance (since May 2006) of Prudential; formerly Corporate Vice President, Associate General Counsel (April 2002-May 2005) of UBS Financial Services, Inc., in their Money Laundering Prevention Group; Senior Manager (May 2005-May 2006) of Deloitte Financial Advisory Services, LLP, in their Forensic and Dispute Services, Anti-Money Laundering Group. |
Grace C. Torres (51) Treasurer and Principal Financial and Accounting Officer | | Assistant Treasurer (since March 1999) and Senior Vice President (since September 1999) of PI; Assistant Treasurer (since May 2003) and Vice President (since June 2005) of AST Investment Services, Inc.; Senior Vice President and Assistant Treasurer (since May 2003) of Prudential Annuities Advisory Services, Inc.; formerly Senior Vice President (May 2003-June 2005) of AST Investment Services, Inc. |
M. Sadiq Peshimam (46) Assistant Treasurer | | Vice President (since 2005) of Prudential Investments LLC. |
Peter Parrella (52) Assistant Treasurer | | Vice President (since 2007) and Director (2004-2007) within Prudential Mutual Fund Administration; formerly Tax Manager at SSB Citi Fund Management LLC (1997-2004). |
| (a) | Excludes Ms. Rice and Mr. Benjamin, interested Board Members who also serve as President and Vice President, respectively. |
| (1) | The year that each individual became an Officer of the Fund is as follows: |
Kathryn L. Quirk, 2005; Deborah A. Docs, 2005; Timothy J. Knierim, 2007; Valerie M. Simpson, 2007; Theresa C. Thompson, 2008; Grace C. Torres, 1997; Noreen M. Fierro, 2006; Jonathan D. Shain, 2005; Claudia DiGiacomo, 2005; Andrew R. French, 2006; John P. Schwartz, 2006; Peter Parrella, 2007; M. Sadiq Peshimam, 2006.
Explanatory Notes to Tables:
| | • | | Board Members are deemed to be “Interested,” as defined in the 1940 Act, by reason of their affiliation with Prudential Investments LLC and/or an affiliate of Prudential Investments LLC. |
| | • | | Unless otherwise noted, the address of all Board Members and Officers is c/o Prudential Investments LLC, Gateway Center Three, 100 Mulberry Street, Newark, New Jersey 07102-4077. |
| | • | | There is no set term of office for Board Members or Officers. The Board Members have adopted a retirement policy, which calls for the retirement of Board Members on December 31 of the year in which they reach the age of 75. |
| | • | | “Other Directorships Held” includes only directorships of companies required to register or file reports with the Commission under the Securities Exchange Act of 1934, as amended (the “Exchange Act”) (that is, “public companies”) or other investment companies registered under the 1940 Act. |
| | • | | “Portfolios Overseen” includes all investment companies managed by Prudential Investments LLC. The investment companies for which PI serves as manager include the Prudential Investments Mutual Funds, The Prudential Variable Contract Accounts, Target Mutual Funds, The Prudential Series Fund, Prudential’s Gibraltar Fund, Inc. and the Advanced Series Trust. |
Visit our website at www.prudentialfunds.com
Approval of Advisory Agreements
The Fund’s Board of Directors
The Board of Directors (the “Board”) of Prudential MoneyMart Assets, Inc. (the “Fund”) consists of 10 individuals, eight of whom are not “interested persons” of the Fund, as defined in the Investment Company Act of 1940, as amended (the “1940 Act”) (the “Independent Directors”). The Board is responsible for the oversight of the Fund, and its operations, and performs the various duties imposed on the directors of investment companies by the 1940 Act. The Independent Directors have retained independent legal counsel to assist them in connection with their duties. The Chair of the Board is an Independent Director. The Board has established three standing committees: the Audit Committee, the Nominating and Governance Committee, and the Investment Committee. Each committee is chaired by, and composed of, Independent Directors.
Annual Approval of the Fund’s Advisory Agreements
As required under the 1940 Act, the Board determines annually whether to renew the Fund’s management agreement with Prudential Investments LLC (“PI”) and the Fund’s subadvisory agreement with Prudential Investment Management, Inc. (“PIM”). In considering the renewal of the agreements, the Board, including all of the Independent Directors, met on June 21-23, 2010 and approved the renewal of the agreements through July 31, 2011, after concluding that the renewal of the agreements was in the best interests of the Fund and its shareholders.
In advance of the meetings, the Board requested and received materials relating to the agreements, and had the opportunity to ask questions and request further information in connection with its consideration. Among other things, the Board considered comparative fee information from PI and PIM. Also, the Board considered comparisons with other mutual funds in relevant Peer Universes and Peer Groups. The mutual funds included in each Peer Universe or Peer Group were objectively determined by Lipper Inc. (“Lipper”), an independent provider of mutual fund data. The comparisons placed the Fund in various quartiles over the one-, three-, five- and 10-year periods ending December 31, 2009 with the first quartile being the best 25% of the mutual funds (for performance, the best performing mutual funds and, for expenses, the lowest cost mutual funds).
In approving the agreements, the Board, including the Independent Directors advised by independent legal counsel, considered the factors it deemed relevant, including the nature, quality and extent of services provided by PI and the subadviser, the performance of the Fund, the profitability of PI and its affiliates, expenses and fees, and the potential for economies of scale that may be shared with the Fund and its shareholders as the Fund’s assets grow. In their deliberations, the Directors did not
| | |
| Prudential MoneyMart Assets, Inc. | | |
Approval of Advisory Agreements (continued)
identify any single factor which alone was responsible for the Board’s decision to approve the agreements with respect to the Fund. In connection with its deliberations, the Board considered information provided by PI throughout the year at regular Board meetings, presentations from portfolio managers and other information, as well as information furnished at or in advance of the meetings on June 21-23, 2010.
The Directors determined that the overall arrangements between the Fund and PI, which serves as the Fund’s investment manager pursuant to a management agreement, and between PI and PIM, which serves as the Fund’s subadviser pursuant to the terms of a subadvisory agreement with PI, are in the interest of the Fund and its shareholders in light of the services performed, fees charged and such other matters as the Directors considered relevant in the exercise of their business judgment.
The material factors and conclusions that formed the basis for the Directors’ reaching their determinations to approve the continuance of the agreements are separately discussed below.
Nature, Quality, and Extent of Services
The Board received and considered information regarding the nature, quality and extent of services provided to the Fund by PI and PIM. The Board considered the services provided by PI, including but not limited to the oversight of the subadviser for the Fund, as well as the provision of fund recordkeeping, compliance, and other services to the Fund. With respect to PI’s oversight of the subadviser, the Board noted that PI’s Strategic Investment Research Group (“SIRG”), which is a business unit of PI, is responsible for monitoring and reporting to PI’s senior management on the performance and operations of the subadviser. The Board also considered that PI pays the salaries of all of the officers and non-independent Directors of the Fund. The Board also considered the investment subadvisory services provided by PIM, as well as adherence to the Fund’s investment restrictions and compliance with applicable Fund policies and procedures.
The Board reviewed the qualifications, backgrounds and responsibilities of PI’s senior management responsible for the oversight of the Fund and PIM, and also reviewed the qualifications, backgrounds and responsibilities of PIM’s portfolio managers who are responsible for the day-to-day management of the Fund’s portfolio. The Board was provided with information pertaining to PI’s and PIM’s organizational structure, senior management, investment operations, and other relevant information pertaining to both PI and PIM. The Board also noted that it received favorable compliance reports from the Fund’s Chief Compliance Officer (“CCO”) as to both PI and PIM. The Board noted that PIM is affiliated with PI.
| | |
| | Visit our website at www.prudentialfunds.com |
The Board concluded that it was satisfied with the nature, extent and quality of the investment management services provided by PI and the subadvisory services provided to the Fund by PIM, and that there was a reasonable basis on which to conclude that the Fund benefits from the services provided by PI and PIM under the management and subadvisory agreements.
Performance of the Fund
The Board received and considered information about the Fund’s historical performance. The Board considered that the Fund’s gross performance in relation to its Peer Universe (the Lipper Retail Money Market Funds Peer Universe) was in the second quartile over the three-, five-, and 10-year periods, and in the third quartile over the one-year period. The Board concluded that, in light of the Fund’s competitive long-term performance, it would be in the interest of the Fund and its shareholders to renew the agreements.
Fees and Expenses
The Board considered that the Fund’s actual management fee (which reflects any subsidies, expense caps or waivers) ranked in the Expense Group’s third quartile, and the Fund’s total expenses ranked in the Expense Group’s second quartile. The Board concluded that the management fees and total expenses were reasonable in light of the services provided.
Costs of Services and Profits Realized by PI
The Board was provided with information on the profitability of PI and its affiliates in serving as the Fund’s investment manager. The Board discussed with PI the methodology utilized in assembling the information regarding profitability, and considered its reasonableness. The Board recognized that it is difficult to make comparisons of profitability from fund management contracts because comparative information is not generally publicly available and is affected by numerous factors, including the structure of the particular adviser, the types of funds it manages, its business mix, numerous assumptions regarding allocations and the adviser’s capital structure and cost of capital. The Board did not separately consider the profitability of the subadviser, an affiliate of PI, as its profitability was reflected in the profitability report for PI. Taking these factors into account, the Board concluded that the profitability of PI and its affiliates in relation to the services rendered was not unreasonable.
Economies of Scale
The Board noted that the management fee schedule for the Fund includes breakpoints, which have the effect of decreasing the fee rate as assets increase, and
| | |
| Prudential MoneyMart Assets, Inc. | | |
Approval of Advisory Agreements (continued)
that at its current level of assets the Fund’s effective fee rate reflected some of those rate reductions. The Board received and discussed information concerning whether PI realizes economies of scale as the Fund’s assets grow beyond current levels. The Board took note that the Fund’s fee structure currently results in benefits to Fund shareholders whether or not PI realizes any economies of scale.
Other Benefits to PI and PIM
The Board considered potential ancillary benefits that might be received by PI and PIM and their affiliates as a result of their relationship with the Fund. The Board concluded that potential benefits to be derived by PI included transfer agency fees received by the Fund’s transfer agent (which is affiliated with PI), as well as benefits to the reputation or other intangible benefits resulting from PI’s association with the Fund. The Board concluded that the potential benefits to be derived by PIM included those generally resulting from an increase in assets under management, specifically, potential access to additional research resources and benefits to the reputation. The Board concluded that the benefits derived by PI and PIM were consistent with the types of benefits generally derived by investment managers and subadvisers to mutual funds.
After full consideration of these factors, the Board concluded that the approval of the agreements was in the best interest of the Fund and its shareholders.
| | |
| | Visit our website at www.prudentialfunds.com |
| | | | |
| n MAIL | | n TELEPHONE | | n WEBSITE |
Gateway Center Three
100 Mulberry Street
Newark, NJ 07102 | | (800) 225-1852 | | www.prudentialfunds.com |
|
| PROXY VOTING |
| The Board of Directors of the Fund has delegated to the Fund’s investment subadviser the responsibility for voting any proxies and maintaining proxy recordkeeping with respect to the Fund. A description of these proxy voting policies and procedures is available without charge, upon request, by calling (800) 225-1852 or by visiting the Securities and Exchange Commission’s website at www.sec.gov. Information regarding how the Fund voted proxies relating to portfolio securities during the most recent 12-month period ended June 30 is available on the Fund’s website and on the Commission’s website. |
|
| DIRECTORS |
| Kevin J. Bannon • Scott E. Benjamin • Linda W. Bynoe • Michael S. Hyland • Douglas H. McCorkindale • Stephen P. Munn • Richard A. Redeker • Judy A. Rice • Robin B. Smith • Stephen G. Stoneburn |
|
| OFFICERS |
| Judy A. Rice, President • Scott E. Benjamin, Vice President • Grace C. Torres, Treasurer and Principal Financial and Accounting Officer • Kathryn L. Quirk, Chief Legal Officer • Deborah A. Docs, Secretary • Timothy J. Knierim, Chief Compliance Officer • Valerie M. Simpson, Deputy Chief Compliance Officer • Theresa C. Thompson, Deputy Chief Compliance Officer • Noreen M. Fierro, Anti-Money Laundering Compliance Officer • Jonathan D. Shain, Assistant Secretary • Claudia DiGiacomo, Assistant Secretary • John P. Schwartz, Assistant Secretary • Andrew R. French, Assistant Secretary • M. Sadiq Peshimam, Assistant Treasurer • Peter Parrella, Assistant Treasurer |
| | | | |
| MANAGER | | Prudential Investments LLC | | Gateway Center Three
100 Mulberry Street
Newark, NJ 07102 |
|
| INVESTMENT SUBADVISER | | Prudential Investment
Management, Inc. | | Gateway Center Two
100 Mulberry Street
Newark, NJ 07102 |
|
| DISTRIBUTOR | | Prudential Investment
Management Services LLC | | Gateway Center Three
100 Mulberry Street
Newark, NJ 07102 |
|
| CUSTODIAN | | The Bank of New York Mellon | | One Wall Street
New York, NY 10286 |
|
| TRANSFER AGENT | | Prudential Mutual Fund
Services LLC | | PO Box 9658
Providence, RI 02940 |
|
| INDEPENDENT REGISTERED PUBLIC ACCOUNTING FIRM | | KPMG LLP | | 345 Park Avenue
New York, NY 10154 |
|
| FUND COUNSEL | | Sullivan & Cromwell LLP | | 125 Broad Street
New York, NY 10004 |
|
| An investor should consider the investment objectives, risks, charges, and expenses of the Fund carefully before investing. The prospectus for the Fund contains this and other information about the Fund. An investor may obtain a prospectus by visiting our website at www.prudentialfunds.com or by calling (800) 225-1852. The prospectus should be read carefully before investing. |
E-DELIVERY
To receive your mutual fund documents online, go to www.prudentialfunds.com/edelivery and enroll. Instead of receiving printed documents by mail, you will receive notification via e-mail when new materials are available. You can cancel your enrollment or change your e-mail address at any time by visiting the website address above.
SHAREHOLDER COMMUNICATIONS WITH DIRECTORS
Shareholders can communicate directly with the Board of Directors by writing to the Chair of the Board, Prudential MoneyMart Assets, Inc., Attn: Board of Directors, 100 Mulberry Street, Gateway Center Three, Newark, NJ 07102. Shareholders can communicate directly with an individual Director by writing to the same address. Communications to the Board or individual Directors are not screened before being delivered to the addressee.
|
| AVAILABILITY OF PORTFOLIO SCHEDULE |
| The Fund files its complete schedule of portfolio holdings with the Securities and Exchange Commission for the first and third quarters of each fiscal year on Form N-Q. The Fund’s Forms N-Q are available on the Commission’s website at www.sec.gov. The Fund’s Forms N-Q may also be reviewed and copied at the Commission’s Public Reference Room in Washington, D.C. Information on the operation and location of the Public Reference Room may be obtained by calling (202) 551-8090. The Fund’s schedule of portfolio holdings is also available on the Fund’s website as of the end of each fiscal quarter. |
|
| The Fund’s Statement of Additional Information contains additional information about the Fund’s Directors and is available without charge, upon request, by calling (800) 225-1852. |
Mutual Funds:
| | | | |
| ARE NOT INSURED BY THE FDIC OR ANY FEDERAL GOVERNMENT AGENCY | | MAY LOSE VALUE | | ARE NOT A DEPOSIT OF OR GUARANTEED BY ANY BANK OR ANY BANK AFFILIATE |

| | | | | | | | | | | | | | | | | | |
| | | Prudential MoneyMart Assets, Inc. |
| | | Share Class | | A | | B | | C | | L | | M | | X | | Z | | |
| | NASDAQ | | PBMXX | | MJBXX | | MJCXX | | N/A | | N/A | | N/A | | PMZXX | | |
| | CUSIP | | 74440W409 | | 74440W201 | | 74440W300 | | 74440W508 | | 74440W607 | | 74440W706 | | 74440W805 | | |
| | | | | | | | | | | | | | | | | | |
MF108E 0186770-00001-00
Item 2 – Code of Ethics — See Exhibit (a)
As of the end of the period covered by this report, the registrant has adopted a code of ethics (the “Section 406 Standards for Investment Companies – Ethical Standards for Principal Executive and Financial Officers”) that applies to the registrant’s Principal Executive Officer and Principal Financial Officer; the registrant’s Principal Financial Officer also serves as the Principal Accounting Officer.
The registrant hereby undertakes to provide any person, without charge, upon request, a copy of the code of ethics. To request a copy of the code of ethics, contact the registrant 800-225-1852, and ask for a copy of the Section 406 Standards for Investment Companies—Ethical Standards for Principal Executive and Financial Officers.
Item 3 – Audit Committee Financial Expert –
The registrant’s Board has determined that Mr. Stephen P. Munn, member of the Board’s Audit Committee is an “audit committee financial expert,” and that he is “independent,” for purposes of this Item.
Item 4 – Principal Accountant Fees and Services –
(a) Audit Fees
For the fiscal years ended July 31, 2010 and July 31, 2009, KPMG LLP (“KPMG”), the Registrant’s principal accountant, billed the Registrant $22,000 and $19,244, respectively, for professional services rendered for the audit of the Registrant’s annual financial statements or services that are normally provided in connection with statutory and regulatory filings.
(b) Audit-Related Fees
Not applicable for the fiscal year ended July 31, 2010. During the fiscal year ended July 31, 2009, KPMG, the Registrant’s principal accountant, billed the Registrant $10,000 for professional services rendered in connection with a registration statement update and $1,558 for professional services rendered in connection with agreed upon procedures performed related to a custody conversion.
(c) Tax Fees
None.
(d) All Other Fees
None.
(e) (1) Audit Committee Pre-Approval Policies and Procedures
THE PRUDENTIAL MUTUAL FUNDS
AUDIT COMMITTEE POLICY
on
Pre-Approval of Services Provided by the Independent Accountants
The Audit Committee of each Prudential Mutual Fund is charged with the responsibility to monitor the independence of the Fund’s independent accountants. As part of this responsibility, the Audit Committee must pre-approve any independent accounting firm’s engagement to render audit and/or permissible non-audit services, as required by law. In evaluating a proposed engagement of the independent accountants, the Audit Committee will assess the effect that the engagement might reasonably be expected to have on the accountant’s independence. The Committee’s evaluation will be based on:
| | • | | a review of the nature of the professional services expected to be provided, |
| | • | | a review of the safeguards put into place by the accounting firm to safeguard independence, and |
| | • | | periodic meetings with the accounting firm. |
Policy for Audit and Non-Audit Services Provided to the Funds
On an annual basis, the scope of audits for each Fund, audit fees and expenses, and audit-related and non-audit services (and fees proposed in respect thereof) proposed to be performed by the Fund’s independent accountants will be presented by the Treasurer and the independent accountants to the Audit Committee for review and, as appropriate, approval prior to the initiation of such services. Such presentation shall be accompanied by confirmation by both the Treasurer and the independent accountants that the proposed services will not adversely affect the independence of the independent accountants. Proposed services shall be described in sufficient detail to enable the Audit Committee to assess the appropriateness of such services and fees, and the compatibility of the provision of such services with the auditor’s independence. The Committee shall receive periodic reports on the progress of the audit and other services which are approved by the Committee or by the Committee Chair pursuant to authority delegated in this Policy.
The categories of services enumerated under “Audit Services”, “Audit-related Services”, and “Tax Services” are intended to provide guidance to the Treasurer and the independent accountants as to those categories of services which the Committee believes are generally consistent with the independence of the independent accountants and which the Committee (or the Committee Chair) would expect upon the presentation of specific proposals to pre-approve. The enumerated categories are not intended as an exclusive list of audit, audit-related or tax services, which the Committee (or the Committee Chair) would consider for pre-approval.
Audit Services
The following categories of audit services are considered to be consistent with the role of the Fund’s independent accountants:
| | • | | Annual Fund financial statement audits |
| | • | | Seed audits (related to new product filings, as required) |
| | • | | SEC and regulatory filings and consents |
Audit-related Services
The following categories of audit-related services are considered to be consistent with the role of the Fund’s independent accountants:
| | • | | Accounting consultations |
| | • | | Fund merger support services |
| | • | | Agreed Upon Procedure Reports |
| | • | | Other Internal Control Reports |
Individual audit-related services that fall within one of these categories and are not presented to the Audit Committee as part of the annual pre-approval process will be subject to pre-approval by the Committee Chair (or any other Committee member on whom this responsibility has been delegated) so long as the estimated fee for those services does not exceed $50,000.
Tax Services
The following categories of tax services are considered to be consistent with the role of the Fund’s independent accountants:
| | • | | Tax compliance services related to the filing or amendment of the following: |
| | • | | Federal, state and local income tax compliance; and, |
| | • | | Sales and use tax compliance |
| | • | | Timely RIC qualification reviews |
| | • | | Tax distribution analysis and planning |
| | • | | Tax authority examination services |
| | • | | Tax appeals support services |
| | • | | Accounting methods studies |
| | • | | Fund merger support services |
| | • | | Tax consulting services and related projects |
Individual tax services that fall within one of these categories and are not presented to the Audit Committee as part of the annual pre-approval process will be subject to pre-approval by the Committee Chair (or any other Committee member on whom this responsibility has been delegated) so long as the estimated fee for those services does not exceed $50,000.
Other Non-audit Services
Certain non-audit services that the independent accountants are legally permitted to render will be subject to pre-approval by the Committee or by one or more Committee members to whom the Committee has delegated this authority and who will report to the full Committee any pre-approval decisions made pursuant to this Policy. Non-audit services presented for pre-approval pursuant to this paragraph will be accompanied by a confirmation from both the Treasurer and the independent accountants that the proposed services will not adversely affect the independence of the independent accountants.
Proscribed Services
The Fund’s independent accountants will not render services in the following categories of non-audit services:
| | • | | Bookkeeping or other services related to the accounting records or financial statements of the Fund |
| | • | | Financial information systems design and implementation |
| | • | | Appraisal or valuation services, fairness opinions, or contribution-in-kind reports |
| | • | | Internal audit outsourcing services |
| | • | | Management functions or human resources |
| | • | | Broker or dealer, investment adviser, or investment banking services |
| | • | | Legal services and expert services unrelated to the audit |
| | • | | Any other service that the Public Company Accounting Oversight Board determines, by regulation, is impermissible. |
Pre-approval of Non-Audit Services Provided to Other Entities Within the Prudential Fund Complex
Certain non-audit services provided to Prudential Investments LLC or any of its affiliates that also provide ongoing services to the Prudential Mutual Funds will be subject to pre-approval by the Audit Committee. The only non-audit services provided to these entities that will require pre-approval are those related directly to the operations and financial reporting of the Funds. Individual projects that are not presented to the Audit Committee as part of the annual pre-approval process will be subject to pre-approval by the Committee Chair (or any other Committee member on whom this responsibility has been delegated) so long as the estimated fee for those services does not exceed $50,000. Services presented for pre-approval pursuant to this paragraph will be accompanied by a confirmation from both the Treasurer and the independent accountants that the proposed services will not adversely affect the independence of the independent accountants.
Although the Audit Committee will not pre-approve all services provided to Prudential Investments LLC and its affiliates, the Committee will receive an annual report from the Fund’s independent accounting firm showing the aggregate fees for all services provided to Prudential Investments and its affiliates.
(e) (2) Percentage of services referred to in 4(b) – 4(d) that were approved by the audit committee –
One hundred percent of the services described in Item 4(b) was approved by the audit committee.
(f) Percentage of hours expended attributable to work performed by other than full time employees of principal accountant if greater than 50%.
The percentage of hours expended on the principal accountant’s engagement to audit the registrant’s financial statements for the most recent fiscal year that were attributed to work performed by persons other than the principal accountant’s full-time, permanent employees was 0%.
(g) Non-Audit Fees
Not applicable to Registrant for the fiscal years 2010 and 2009. The aggregate non-audit fees billed by KPMG for services rendered to the registrant’s investment adviser and any entity controlling, controlled by, or under common control with the investment adviser that provides ongoing services to the registrant for the fiscal years 2010 and 2009 was $0 and $0, respectively.
(h) Principal Accountant’s Independence
Not applicable as KPMG has not provided non-audit services to the registrant’s investment adviser and any entity controlling, controlled by, or under common control with the investment adviser that provides ongoing services to the registrant that were not pre-approved pursuant to Rule 2-01(c)(7)(ii) of Regulation S-X.
Item 5 – Audit Committee of Listed Registrants – Not applicable.
Item 6 – Schedule of Investments – The schedule is included as part of the report to shareholders filed under Item 1 of this Form.
Item 7 – Disclosure of Proxy Voting Policies and Procedures for Closed-End Management Investment Companies – Not applicable.
Item 8 – Portfolio Managers of Closed-End Management Investment Companies – Not applicable.
Item 9 – Purchases of Equity Securities by Closed-End Management Investment Company and Affiliated Purchasers – Not applicable.
Item 10 – Submission of Matters to a Vote of Security Holders – Not applicable.
Item 11 – Controls and Procedures
| | (a) | It is the conclusion of the registrant’s principal executive officer and principal financial officer that the effectiveness of the registrant’s current disclosure controls and procedures (such disclosure controls and procedures having been evaluated within 90 days of the date of this filing) provide reasonable assurance that the information required to be disclosed by the registrant has been recorded, processed, summarized and reported within the time period specified in the Commission’s rules and forms and that the information required to be disclosed by the registrant has been accumulated and communicated to the registrant’s principal executive officer and principal financial officer in order to allow timely decisions regarding required disclosure. |
| | (b) | There has been no significant change in the registrant’s internal control over financial reporting that occurred during the registrant’s most recent fiscal quarter of the period covered by this report that has materially affected, or is likely to materially affect, the registrant’s internal control over financial reporting. |
Item 12 – Exhibits
| | | | |
| (a) | | (1) | | Code of Ethics – Attached hereto as Exhibit EX-99.CODE-ETH |
| | |
| | (2) | | Certifications pursuant to Section 302 of the Sarbanes-Oxley Act – Attached hereto as Exhibit EX-99.CERT. |
| | |
| | (3) | | Any written solicitation to purchase securities under Rule 23c-1. – Not applicable. |
| |
| (b) | | Certifications pursuant to Section 906 of the Sarbanes-Oxley Act – Attached hereto as Exhibit EX-99.906CERT. |
SIGNATURES
Pursuant to the requirements of the Securities Exchange Act of 1934 and the Investment Company Act of 1940, the registrant has duly caused this report to be signed on its behalf by the undersigned, thereunto duly authorized.
Registrant: Prudential MoneyMart Assets, Inc.
| | |
| By: | | /S/ DEBORAH A. DOCS |
| | Deborah A. Docs |
| | Secretary |
September 22, 2010
Pursuant to the requirements of the Securities Exchange Act of 1934 and the Investment Company Act of 1940, this report has been signed below by the following persons on behalf of the registrant and in the capacities and on the dates indicated.
| | |
| By: | | /S/ JUDY A. RICE |
| | Judy A. Rice |
| | President and Principal Executive Officer |
September 22, 2010
| | |
| By: | | /S/ GRACE C. TORRES |
| | Grace C. Torres |
| | Treasurer and Principal Financial Officer |
September 22, 2010