UNITED STATES
SECURITIES AND EXCHANGE COMMISSION
Washington, D.C. 20549
FORM N-CSR
CERTIFIED SHAREHOLDER REPORT OF REGISTERED MANAGEMENT INVESTMENT
COMPANIES
| | |
| Investment Company Act file number: | | 811-02619 |
| |
| Exact name of registrant as specified in charter: | | Prudential Government Money Market Fund, Inc. |
| |
| Address of principal executive offices: | | 655 Broad Street, 6th Floor
Newark, New Jersey 07102 |
| |
| Name and address of agent for service: | | Andrew R. French 655 Broad Street, 6th Floor Newark, New Jersey 07102 |
| |
| Registrant’s telephone number, including area code: | | 800-225-1852 |
| |
| Date of fiscal year end: | | 7/31/2023 |
| |
| Date of reporting period: | | 1/31/2023 |
Item 1 – Reports to Stockholders

PGIM GOVERNMENT MONEY MARKET FUND
SEMIANNUAL REPORT
JANUARY 31, 2023

To enroll in e-delivery, go to pgim.com/investments/resource/edelivery
Table of Contents
This report is not authorized for distribution to prospective investors unless preceded or accompanied by a current prospectus.
The information about the Fund’s portfolio holdings is for the period covered by this report and is subject to change thereafter.
The accompanying financial statements as of January 31, 2023 were not audited and, accordingly, no auditor’s opinion is expressed on them.
Mutual funds are distributed by Prudential Investment Management Services LLC (PIMS), member SIPC. PGIM Fixed Income is a unit of PGIM, Inc. (PGIM), a registered investment adviser. PIMS and PGIM are Prudential Financial companies. © 2023 Prudential Financial, Inc. and its related entities. PGIM and the PGIM logo are service marks of Prudential Financial, Inc. and its related entities, registered in many jurisdictions worldwide.
2 Visit our website at pgim.com/investments
Letter from the President
| | |
 | | Dear Shareholder: We hope you find the semiannual report for the PGIM Government Money Market Fund informative and useful. The report covers performance for the six-month period ended January 31, 2023. Regarding your investments with PGIM, we believe it is important to maintain a diversified portfolio of funds consistent with your tolerance for risk, time horizon, and financial goals. |
Your financial advisor can help you create a diversified investment plan that may include funds covering all the basic asset classes and that reflects your personal investor profile and risk tolerance. However, diversification and asset allocation strategies do not assure a profit or protect against loss in declining markets.
At PGIM Investments, we provide access to active investment strategies across the global markets in the pursuit of consistent outperformance for investors. PGIM is the world’s 11th-largest investment manager with more than $1.5 trillion in assets under management. Our scale and investment expertise allow us to deliver a diversified suite of actively managed solutions across a broad spectrum of asset classes and investment styles.
Thank you for choosing our family of funds.
Sincerely,

Stuart S. Parker, President
PGIM Government Money Market Fund
March 15, 2023
PGIM Government Money Market Fund 3
Your Fund’s Performance
Yields will fluctuate from time to time, and past performance does not guarantee future results. The Fund is subject to periodic adjustments to its expense budget during the fiscal year which may affect its reported 7-day current yield. Current performance may be lower or higher than the past performance data quoted. Although the Fund seeks to preserve the value of your investment at $1.00 per share, it is possible to lose money by investing in the Fund. For the most recent month-end performance update, call (800) 225-1852 or visit our website at pgim.com/investments.
| | | | | | | | |
| | | | |
| Fund Facts as of 1/31/23 | | | | | | | | |
| | | 7-Day Current Yield (%) | | Net Asset Value (NAV) ($) | | Weighted Avg. Maturity (WAM) | | Net Assets (Millions) ($) |
| | | | |
Class A | | 3.79 | | 1.00 | | 14 Days | | 449.0 |
| | | | |
Class C | | 3.81 | | 1.00 | | 14 Days | | 11.4 |
| | | | |
Class Z | | 4.00 | | 1.00 | | 14 Days | | 88.8 |
| | | | |
iMoneyNet, Inc. | | | | | | | | |
Government & Agency Retail Avg.* | | 3.78 | | N/A | | 15 Days | | N/A |
*iMoneyNet, Inc. regularly reports a 7-day current yield and WAM on Tuesdays. This is based on the data of all funds in the iMoneyNet, Inc. Government & Agency Retail Average category as of January 31, 2023.
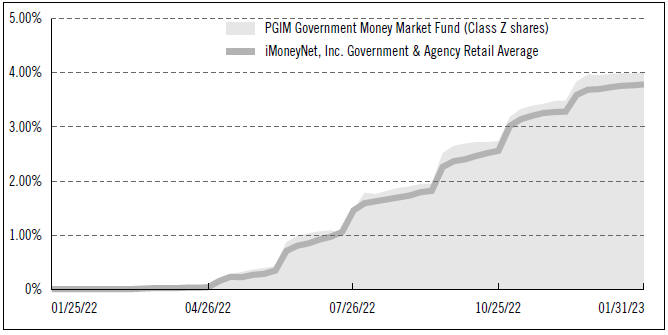
Money Market Fund Yield Comparison
4 Visit our website at pgim.com/investments
Weighted Average Maturity* (WAM) Comparison
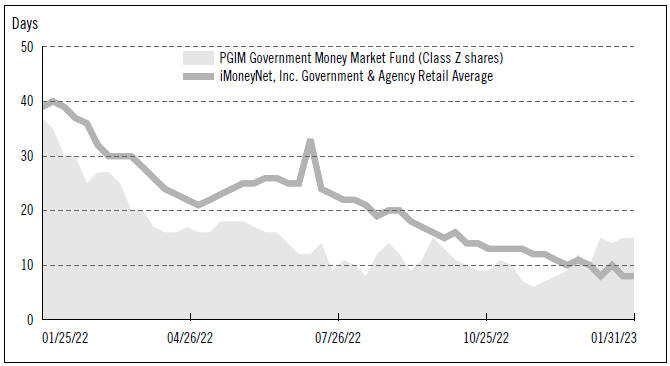
The graphs portray weekly 7-day current yields and weekly WAMs for PGIM Government Money Market Fund (Class Z shares—yields only) and the iMoneyNet, Inc. Government & Agency Retail Average every Tuesday from July 26, 2022 to January 31, 2023, the closest dates prior to the beginning and end of the Fund’s reporting period. Note: iMoneyNet, Inc. regularly reports a 7-day current yield and WAM on Tuesdays. As a result, the data portrayed for the Fund at the end of the reporting period in the graphs may not match the data portrayed in the Fund Facts table as of January 31, 2023.
*Weighted Average Maturity is based on the dollar-weighted average length of time until principal payments are expected or until securities reach maturity, taking into account any maturity shortening feature such as a call, refunding, or redemption provision.
The yield figures take into account applicable sales charges and fees, which are described for each share class in the table below.
| | | | | | |
| | | | |
| | | Class A | | Class C | | Class Z |
| | | | |
| Maximum initial sales charge | | None | | None | | None |
| | | | |
| Contingent deferred sales charge (CDSC) (as a percentage of the lower of the original purchase price or the net asset value at redemption) | | None | | None | | None |
| | | | |
| Annual distribution and service (12b-1) fees (shown as a percentage of average daily net assets) | | 0.125% | | None | | None |
An investment in the Fund is not insured or guaranteed by the Federal Deposit Insurance Corporation or any other government agency.
PGIM Government Money Market Fund 5
Your Fund’s Performance (continued)
Presentation of Fund Holdings as of 1/31/23
| | | | | | | | |
| | | |
| Ten Largest Holdings | | Interest Rate | | Maturity Date | | % of Net Assets |
| | | |
Federal Home Loan Bank | | 4.291% | | | 02/17/2023 | | | 3.5% |
| | | |
Federal Home Loan Bank | | 4.520% | | | 03/22/2023 | | | 3.3% |
| | | |
U.S. Treasury Bills | | 4.521% | | | 02/28/2023 | | | 2.7% |
| | | |
Federal Home Loan Bank | | 4.330% | | | 02/28/2023 | | | 2.0% |
| | | |
Federal Home Loan Bank | | 4.360% | | | 06/06/2023 | | | 2.0% |
| | | |
Federal Home Loan Bank | | 4.340% | | | 02/10/2023 | | | 2.0% |
| | | |
Federal Home Loan Bank | | 4.481% | | | 03/03/2023 | | | 2.0% |
| | | |
Federal Home Loan Bank | | 4.350% | | | 06/27/2023 | | | 2.0% |
| | | |
Federal Home Loan Bank | | 4.355% | | | 04/04/2023 | | | 2.0% |
| | | |
Federal Home Loan Bank | | 4.330% | | | 04/25/2023 | | | 1.9% |
Holdings reflect only short-term investments and are subject to change.
6 Visit our website at pgim.com/investments
Fees and Expenses
As a shareholder of the Fund, you incur two types of costs: (1) transaction costs, including sales charges (loads) on purchase payments and redemptions, as applicable, and (2) ongoing costs, including management fees, distribution and/or service (12b-1) fees, and other Fund expenses, as applicable. This example is intended to help you understand your ongoing costs (in dollars) of investing in the Fund and to compare these costs with the ongoing costs of investing in other mutual funds.
The example is based on an investment of $1,000 held through the six-month period ended January 31, 2023. The example is for illustrative purposes only; you should consult the Prospectus for information on initial and subsequent minimum investment requirements.
Actual Expenses
The first line for each share class in the table on the following page provides information about actual account values and actual expenses. You may use the information on this line, together with the amount you invested, to estimate the expenses that you paid over the period. Simply divide your account value by $1,000 (for example, an $8,600 account value ÷ $1,000 = 8.6), then multiply the result by the number on the first line under the heading “Expenses Paid During the Six-Month Period” to estimate the expenses you paid on your account during this period.
Hypothetical Example for Comparison Purposes
The second line for each share class in the table on the following page provides information about hypothetical account values and hypothetical expenses based on the Fund’s actual expense ratio and an assumed rate of return of 5% per year before expenses, which is not the Fund’s actual return. The hypothetical account values and expenses may not be used to estimate the actual ending account balance or expenses you paid for the period. You may use this information to compare the ongoing costs of investing in the Fund and other funds. To do so, compare this 5% hypothetical example with the 5% hypothetical examples that appear in the shareholder reports of the other funds.
The Fund’s transfer agent may charge additional fees to holders of certain accounts that are not included in the expenses shown in the table on the following page. These fees apply to individual retirement accounts (IRAs) and Section 403(b) accounts. As of the close of the six-month period covered by the table, IRA fees included an annual maintenance fee of $15 per account (subject to a maximum annual maintenance fee of $25 for all accounts held by the same shareholder). Section 403(b) accounts are charged an annual $25 fiduciary maintenance fee. Some of the fees may vary in amount, or may be waived, based on your total account balance or the number of PGIM funds, including the Fund, that you own. You should consider the additional fees that were charged to your Fund account over the six-month period when you estimate the total ongoing expenses paid over the period and the impact of these fees on your ending account value, as these additional expenses are not reflected in the information
PGIM Government Money Market Fund 7
Fees and Expenses (continued)
provided in the expense table. Additional fees have the effect of reducing investment returns.
Please note that the expenses shown in the table are meant to highlight your ongoing costs only and do not reflect any transactional costs such as sales charges (loads). Therefore, the second line for each share class in the table is useful in comparing ongoing costs only and will not help you determine the relative total costs of owning different funds. In addition, if these transactional costs were included, your costs would have been higher.
| | | | | | | | | | |
| | | | | |
PGIM Government Money Market Fund | | Beginning Account Value August 1, 2023 | | Ending Account Value January 31, 2023 | | Annualized Expense Ratio Based on the Six-Month Period | | Expenses Paid During the Six-Month Period* |
| | | | | |
Class A | | Actual | | $1,000.00 | | $1,013.90 | | 0.62% | | $3.15 |
| | Hypothetical | | $1,000.00 | | $1,022.08 | | 0.62% | | $3.16 |
| | | | | |
Class C | | Actual | | $1,000.00 | | $1,014.00 | | 0.60% | | $3.05 |
| | Hypothetical | | $1,000.00 | | $1,022.18 | | 0.60% | | $3.06 |
| | | | | |
Class Z | | Actual | | $1,000.00 | | $1,014.90 | | 0.41% | | $2.08 |
| | | Hypothetical | | $1,000.00 | | $1,023.14 | | 0.41% | | $2.09 |
*Fund expenses (net of fee waivers or subsidies, if any) for each share class are equal to the annualized expense ratio for each share class (provided in the table), multiplied by the average account value over the period, multiplied by the 184 days in the six-month period ended January 31, 2023, and divided by the 365 days in the Fund’s fiscal year ending July 31, 2023 (to reflect the six-month period). Expenses presented in the table include the expenses of any underlying portfolios in which the Fund may invest.
8 Visit our website at pgim.com/investments
Schedule of Investments (unaudited)
as of January 31, 2023
| | | | | | | | |
| | |
| Description | | Principal Amount (000)# | | | Value | |
| | |
SHORT-TERM INVESTMENTS 100.1% | | | | | | | | |
| | |
REPURCHASE AGREEMENTS 16.6% | | | | | | | | |
BOS, | | | | | | | | |
4.300%, dated 01/31/23, due 02/01/23 in the amount of $20,002,389 collateralized by U.S. Treasury Securities (coupon rates 3.000%-4.000%, maturity dates 06/30/24-10/31/29) with the aggregate value, including accrued interest, of $20,400,054. | | | 20,000 | | | $ | 20,000,000 | |
| | |
CA, | | | | | | | | |
4.300%, dated 01/31/23, due 02/01/23 in the amount of $6,090,727 collateralized by U.S. Treasury Securities (coupon rate 2.875%, maturity date 11/15/46) with the aggregate value, including accrued interest, of $6,211,831. | | | 6,090 | | | | 6,090,000 | |
| | |
CIBC, | | | | | | | | |
4.300%, dated 12/15/22, due 02/02/23 in the amount of $10,058,528 collateralized by U.S. Treasury Securities (coupon rates 0.125%-4.250%, maturity dates 01/15/24-11/15/50) with the aggregate value, including accrued interest, of $10,258,487. | | | 10,000 | | | | 10,000,000 | |
| | |
ING, | | | | | | | | |
4.310%, dated 12/15/22, due 02/02/23 in the amount of $10,058,664 collateralized by FHLMC (coupon rate 2.525%, maturity date 04/01/38), FNMA (coupon rates 2.000%-5.500%, maturity dates 01/01/35-09/01/52) and GNMA (coupon rate 5.000%, maturity date 01/20/49) with the aggregate value, including accrued interest, of $10,200,000. | | | 10,000 | | | | 10,000,000 | |
4.310%, dated 12/15/22, due 02/03/23 in the amount of $10,059,861 collateralized by FHLMC (coupon rates 3.500%-5.500%, maturity dates 04/01/52-11/01/52), FNMA (coupon rates 2.000%-5.000%, maturity dates 03/01/44-09/01/52) and GNMA (coupon rate 5.000%, maturity date 01/20/49) with the aggregate value, including accrued interest, of $10,200,000. | | | 10,000 | | | | 10,000,000 | |
| | |
TDM, | | | | | | | | |
4.300%, dated 01/31/23, due 02/01/23 in the amount of $20,002,389 collateralized by U.S. Treasury Securities (coupon rates 0.250%-1.500%, maturity dates 08/31/23-02/15/30) with the aggregate value, including accrued interest, of $20,400,025. | | | 20,000 | | | | 20,000,000 | |
See Notes to Financial Statements.
PGIM Government Money Market Fund 9
Schedule of Investments (unaudited) (continued)
as of January 31, 2023
| | | | | | | | | | | | | | | | |
| | | | |
| Description | | | | | | | | Principal
Amount (000)# | | | Value | |
| | | | |
REPURCHASE AGREEMENTS (Continued) | | | | | | | | | | | | | | | | |
WFS, | | | | | | | | | | | | | | | | |
4.310%, dated 01/31/23, due 02/01/23 in the amount of $15,001,796 collateralized by FNMA (coupon rate 2.000%, maturity date 11/01/41) with the aggregate value, including accrued interest, of $15,301,832. | | | | | | | | | | | 15,000 | | | $ | 15,000,000 | |
| | | | | | | | | | | | | | | | |
| | | | |
TOTAL REPURCHASE AGREEMENTS
(cost $91,090,000) | | | | | | | | | | | | | | | 91,090,000 | |
| | | | | | | | | | | | | | | | |
| | | | |
| | | Interest
Rate | | | Maturity
Date | | | | | | | |
| | | | |
U.S. GOVERNMENT AGENCY OBLIGATIONS 78.9% | | | | | | | | | | | | | | | | |
Federal Farm Credit Bank, SOFR + 0.008% (Cap N/A, Floor 0.000%) | | | 4.308%(c) | | | | 02/07/23 | | | | 5,250 | | | | 5,249,989 | |
Federal Farm Credit Bank, SOFR + 0.015% (Cap N/A, Floor 0.000%) | | | 4.315(c) | | | | 05/02/23 | | | | 6,000 | | | | 5,999,924 | |
Federal Farm Credit Bank, SOFR + 0.025% (Cap N/A, Floor 0.000%) | | | 4.325(c) | | | | 09/27/23 | | | | 5,400 | | | | 5,399,822 | |
Federal Farm Credit Bank, SOFR + 0.025% | | | 4.325(c) | | | | 10/27/23 | | | | 6,650 | | | | 6,649,706 | |
Federal Farm Credit Bank, SOFR + 0.035% (Cap N/A, Floor 0.000%) | | | 4.335(c) | | | | 05/12/23 | | | | 6,000 | | | | 6,000,083 | |
Federal Farm Credit Bank, SOFR + 0.040% (Cap N/A, Floor 0.000%) | | | 4.340(c) | | | | 03/10/23 | | | | 2,750 | | | | 2,750,035 | |
Federal Farm Credit Bank, SOFR + 0.050% (Cap N/A, Floor 0.000%) | | | 4.350(c) | | | | 11/09/23 | | | | 1,650 | | | | 1,650,191 | |
Federal Farm Credit Bank | | | 4.361(n) | | | | 02/08/23 | | | | 9,500 | | | | 9,491,965 | |
Federal Farm Credit Bank, SOFR + 0.110% (Cap N/A, Floor 0.000%) | | | 4.410(c) | | | | 11/15/23 | | | | 6,000 | | | | 6,000,000 | |
Federal Farm Credit Bank, SOFR + 0.120% (Cap N/A, Floor 0.000%) | | | 4.420(c) | | | | 09/14/23 | | | | 4,050 | | | | 4,050,000 | |
Federal Home Loan Bank | | | 4.210(n) | | | | 02/06/23 | | | | 6,000 | | | | 5,996,517 | |
Federal Home Loan Bank | | | 4.228(n) | | | | 02/08/23 | | | | 10,250 | | | | 10,241,617 | |
Federal Home Loan Bank | | | 4.260(n) | | | | 02/15/23 | | | | 8,000 | | | | 7,986,887 | |
Federal Home Loan Bank | | | 4.291(n) | | | | 02/17/23 | | | | 19,500 | | | | 19,463,151 | |
Federal Home Loan Bank, SOFR + 0.015% (Cap N/A, Floor 0.000%) | | | 4.315(c) | | | | 02/08/23 | | | | 5,250 | | | | 5,249,992 | |
Federal Home Loan Bank, SOFR + 0.025% (Cap N/A, Floor 0.000%) | | | 4.325(c) | | | | 02/03/23 | | | | 5,600 | | | | 5,599,995 | |
Federal Home Loan Bank, SOFR + 0.030% (Cap N/A, Floor 0.000%) | | | 4.330(c) | | | | 02/28/23 | | | | 11,000 | | | | 11,000,000 | |
Federal Home Loan Bank, SOFR + 0.030% (Cap N/A, Floor 0.000%) | | | 4.330(c) | | | | 03/21/23 | | | | 8,750 | | | | 8,750,000 | |
Federal Home Loan Bank, SOFR + 0.030% (Cap N/A, Floor 0.000%) | | | 4.330(c) | | | | 04/24/23 | | | | 8,000 | | | | 8,000,000 | |
See Notes to Financial Statements.
10
| | | | | | | | | | | | | | | | |
| | | | |
| Description | | Interest Rate | | | Maturity Date | | | Principal Amount (000)# | | | Value | |
| | | | |
U.S. GOVERNMENT AGENCY OBLIGATIONS (Continued) | | | | | | | | | | | | | | | | |
Federal Home Loan Bank, SOFR + 0.030% (Cap N/A, Floor 0.000%) | | | 4.330%(c) | | | | 04/25/23 | | | | 10,500 | | | $ | 10,500,000 | |
Federal Home Loan Bank, SOFR + 0.040% (Cap N/A, Floor 0.000%) | | | 4.340(c) | | | | 02/10/23 | | | | 11,000 | | | | 11,000,000 | |
Federal Home Loan Bank, SOFR + 0.040% (Cap N/A, Floor 0.000%) | | | 4.340(c) | | | | 02/17/23 | | | | 8,750 | | | | 8,750,000 | |
Federal Home Loan Bank, SOFR + 0.040% (Cap N/A, Floor 0.000%) | | | 4.340(c) | | | | 05/03/23 | | | | 10,250 | | | | 10,250,000 | |
Federal Home Loan Bank, SOFR + 0.040% (Cap N/A, Floor 0.000%) | | | 4.340(c) | | | | 05/25/23 | | | | 8,000 | | | | 8,000,000 | |
Federal Home Loan Bank, SOFR + 0.040% (Cap N/A, Floor 0.000%) | | | 4.340(c) | | | | 05/26/23 | | | | 10,500 | | | | 10,500,000 | |
Federal Home Loan Bank, SOFR + 0.040% (Cap N/A, Floor 0.000%) | | | 4.340(c) | | | | 10/06/23 | | | | 5,750 | | | | 5,750,000 | |
Federal Home Loan Bank, SOFR + 0.045% (Cap N/A, Floor 0.000%) | | | 4.345(c) | | | | 03/03/23 | | | | 8,750 | | | | 8,750,000 | |
Federal Home Loan Bank, SOFR + 0.050% (Cap N/A, Floor 0.000%) | | | 4.350(c) | | | | 02/08/23 | | | | 5,000 | | | | 5,000,000 | |
Federal Home Loan Bank, SOFR + 0.050% (Cap N/A, Floor 0.000%) | | | 4.350(c) | | | | 03/03/23 | | | | 5,000 | | | | 5,000,000 | |
Federal Home Loan Bank, SOFR + 0.050% (Cap N/A, Floor 0.000%) | | | 4.350(c) | | | | 06/27/23 | | | | 5,000 | | | | 5,000,000 | |
Federal Home Loan Bank, SOFR + 0.050% (Cap N/A, Floor 0.000%) | | | 4.350(c) | | | | 06/27/23 | | | | 10,750 | | | | 10,750,000 | |
Federal Home Loan Bank, SOFR + 0.050% (Cap N/A, Floor 0.000%) | | | 4.350(c) | | | | 07/06/23 | | | | 8,500 | | | | 8,500,000 | |
Federal Home Loan Bank, SOFR + 0.055% (Cap N/A, Floor 0.000%) | | | 4.355(c) | | | | 04/04/23 | | | | 10,750 | | | | 10,750,000 | |
Federal Home Loan Bank, SOFR + 0.060% (Cap N/A, Floor 0.000%) | | | 4.360(c) | | | | 04/10/23 | | | | 6,000 | | | | 6,000,000 | |
Federal Home Loan Bank, SOFR + 0.060% (Cap N/A, Floor 0.000%) | | | 4.360(c) | | | | 04/18/23 | | | | 2,000 | | | | 2,000,000 | |
Federal Home Loan Bank, SOFR + 0.060% (Cap N/A, Floor 0.000%) | | | 4.360(c) | | | | 05/01/23 | | | | 10,000 | | | | 10,000,000 | |
Federal Home Loan Bank, SOFR + 0.060% (Cap N/A, Floor 0.000%) | | | 4.360(c) | | | | 06/06/23 | | | | 11,000 | | | | 11,000,000 | |
Federal Home Loan Bank, SOFR + 0.060% (Cap N/A, Floor 0.000%) | | | 4.360(c) | | | | 07/03/23 | | | | 8,500 | | | | 8,500,000 | |
Federal Home Loan Bank, SOFR + 0.065% (Cap N/A, Floor 0.000%) | | | 4.365(c) | | | | 05/08/23 | | | | 10,000 | | | | 10,000,000 | |
Federal Home Loan Bank, SOFR + 0.070% (Cap N/A, Floor 0.000%) | | | 4.370(c) | | | | 04/03/23 | | | | 7,250 | | | | 7,250,000 | |
Federal Home Loan Bank, SOFR + 0.070% (Cap N/A, Floor 0.000%) | | | 4.370(c) | | | | 05/17/23 | | | | 7,000 | | | | 7,000,000 | |
See Notes to Financial Statements.
PGIM Government Money Market Fund 11
Schedule of Investments (unaudited) (continued)
as of January 31, 2023
| | | | | | | | | | | | | | | | |
| | | | |
| Description | | Interest Rate | | | Maturity Date | | | Principal Amount (000)# | | | Value | |
| | | | |
U.S. GOVERNMENT AGENCY OBLIGATIONS (Continued) | | | | | | | | | | | | | | | | |
Federal Home Loan Bank, SOFR + 0.070% (Cap N/A, Floor 0.000%) | | | 4.370%(c) | | | | 12/14/23 | | | | 5,600 | | | $ | 5,600,000 | |
Federal Home Loan Bank | | | 4.372(n) | | | | 02/10/23 | | | | 9,000 | | | | 8,990,190 | |
Federal Home Loan Bank, SOFR + 0.090% (Cap N/A, Floor 0.000%) | | | 4.390(c) | | | | 05/23/23 | | | | 6,000 | | | | 6,000,000 | |
Federal Home Loan Bank, SOFR + 0.090% (Cap N/A, Floor 0.000%) | | | 4.390(c) | | | | 08/15/23 | | | | 7,250 | | | | 7,250,000 | |
Federal Home Loan Bank, SOFR + 0.090% (Cap N/A, Floor 0.000%) | | | 4.390(c) | | | | 08/16/23 | | | | 3,000 | | | | 3,000,000 | |
Federal Home Loan Bank | | | 4.400(n) | | | | 02/22/23 | | | | 10,000 | | | | 9,974,508 | |
Federal Home Loan Bank, SOFR + 0.100% (Cap N/A, Floor 0.000%) | | | 4.400(c) | | | | 09/21/23 | | | | 10,000 | | | | 10,000,000 | |
Federal Home Loan Bank | | | 4.417(n) | | | | 03/01/23 | | | | 10,250 | | | | 10,215,177 | |
Federal Home Loan Bank | | | 4.480(n) | | | | 03/15/23 | | | | 10,250 | | | | 10,197,025 | |
Federal Home Loan Bank | | | 4.481(n) | | | | 03/03/23 | | | | 11,000 | | | | 10,959,208 | |
Federal Home Loan Bank | | | 4.520(n) | | | | 03/22/23 | | | | 18,000 | | | | 17,890,281 | |
Federal Home Loan Bank | | | 4.689(n) | | | | 04/26/23 | | | | 8,000 | | | | 7,913,499 | |
Federal Home Loan Bank | | | 5.000 | | | | 01/10/24 | | | | 9,500 | | | | 9,500,000 | |
| | | | | | | | | | | | | | | | |
| | | | |
TOTAL U.S. GOVERNMENT AGENCY OBLIGATIONS
(cost $433,269,762) | | | | | | | | | | | | | | | 433,269,762 | |
| | | | | | | | | | | | | | | | |
| | | | |
U.S. TREASURY OBLIGATIONS(n) 4.6% | | | | | | | | | | | | | | | | |
U.S. Treasury Bills | | | 4.496 | | | | 02/21/23 | | | | 10,500 | | | | 10,473,864 | |
U.S. Treasury Bills | | | 4.521 | | | | 02/28/23 | | | | 15,000 | | | | 14,949,315 | |
| | | | | | | | | | | | | | | | |
| | | | |
TOTAL U.S. TREASURY OBLIGATIONS
(cost $25,423,179) | | | | | | | | | | | | | | | 25,423,179 | |
| | | | | | | | | | | | | | | | |
| | | | |
TOTAL INVESTMENTS 100.1%
(cost $549,782,941)(d) | | | | | | | | | | | | | | | 549,782,941 | |
Liabilities in excess of other assets (0.1)% | | | | | | | | | | | | | | | (623,131 | ) |
| | | | | | | | | | | | | | | | |
| | | | |
NET ASSETS 100.0% | | | | | | | | | | | | | | $ | 549,159,810 | |
| | | | | | | | | | | | | | | | |
See Notes to Financial Statements.
12
Below is a list of the abbreviation(s) used in the semiannual report:
BOS—Bank of America Securities, Inc.
CA—Credit Agricole Securities Inc.
CIBC—Canadian Imperial Bank of Commerce
FHLMC—Federal Home Loan Mortgage Corporation
FNMA—Federal National Mortgage Association
GNMA—Government National Mortgage Association
ING—ING Financial Markets LLC
SOFR—Secured Overnight Financing Rate
TDM—TD Securities (USA) LLC
WFS—Wells Fargo Securities LLC
| # | Principal amount is shown in U.S. dollars unless otherwise stated. |
| (c) | Variable rate instrument. The interest rate shown reflects the rate in effect at January 31, 2023. |
| (d) | The cost of securities for federal income tax purposes is substantially the same as for financial reporting purposes. |
| (n) | Rate shown reflects yield to maturity at purchased date. |
Fair Value Measurements:
Various inputs are used in determining the value of the Fund’s investments. These inputs are summarized in the three broad levels listed below.
Level 1—unadjusted quoted prices generally in active markets for identical securities.
Level 2—quoted prices for similar securities, interest rates and yield curves, prepayment speeds, foreign currency exchange rates and other observable inputs.
Level 3—unobservable inputs for securities valued in accordance with Board approved fair valuation procedures.
The following is a summary of the inputs used as of January 31, 2023 in valuing such portfolio securities:
| | | | | | | | | | | | | | | | | | | | |
| | | Level 1 | | Level 2 | | | Level 3 |
Short-Term Investments | | | | | | | | | | | | | | | | | | | | |
Repurchase Agreements | | | | | $— | | | | | $ | 91,090,000 | | | | | | $— | | | |
U.S. Government Agency Obligations | | | | | — | | | | | | 433,269,762 | | | | | | — | | | |
U.S. Treasury Obligations | | | | | — | | | | | | 25,423,179 | | | | | | — | | | |
| | | | | | | | | | | | | | | | | | | | |
Total | | | | | $— | | | | | $ | 549,782,941 | | | | | | $— | | | |
| | | | | | | | |
Sector Allocations:
The sector allocations of investments and liabilities in excess of other assets shown as a percentage of net assets as of January 31, 2023 were as follows:
| | | | |
U.S. Government Agency Obligations | | | 78.9 | % |
| |
Repurchase Agreements | | | 16.6 | |
| | | | |
| U.S. Treasury Obligations | | | 4.6 | % |
| | | | |
| |
| | | 100.1 | |
| Liabilities in excess of other assets | | | (0.1 | ) |
| | | | |
| |
| | | 100.0 | % |
| | | | |
See Notes to Financial Statements.
PGIM Government Money Market Fund 13
Schedule of Investments (unaudited) (continued)
as of January 31, 2023
Financial Instruments/Transactions—Summary of Offsetting and Netting Arrangements:
The Fund entered into financial instruments/transactions during the reporting period that are either offset in accordance with current requirements or are subject to enforceable master netting arrangements or similar agreements that permit offsetting. The information about offsetting and related netting arrangements for financial instruments/transactions where the legal right to set-off exists is presented in the summary below.
Offsetting of financial instrument/transaction assets and liabilities:
| | | | | | | | | | | | | | | | | | |
| Description | | Counterparty | | | Gross Market Value of Recognized Assets/(Liabilities) | | Collateral Pledged/(Received)(1) | | | Net Amount | |
Repurchase Agreement | | | BOS | | | | | $20,000,000 | | | | | $(20,000,000) | | | | $— | |
Repurchase Agreement | | | CA | | | | | 6,090,000 | | | | | (6,090,000) | | | | — | |
Repurchase Agreement | | | CIBC | | | | | 10,000,000 | | | | | (10,000,000) | | | | — | |
Repurchase Agreements | | | ING | | | | | 20,000,000 | | | | | (20,000,000) | | | | — | |
Repurchase Agreement | | | TDM | | | | | 20,000,000 | | | | | (20,000,000) | | | | — | |
Repurchase Agreement | | | WFS | | | | | 15,000,000 | | | | | (15,000,000) | | | | — | |
| | | | | | | | | | | | | | | | | | |
| | | | | | | | $91,090,000 | | | | | | | | | | |
| | | | | | | | | | | | | | | | | | |
| (1) | Collateral amount disclosed by the Fund is limited to the market value of financial instruments/transactions. |
See Notes to Financial Statements.
14
Statement of Assets and Liabilities (unaudited)
as of January 31, 2023
| | | | |
| |
Assets | | | | |
| |
Investments, at value: | | $ | 458,692,941 | |
Repurchase Agreements (cost $91,090,000) | | | 91,090,000 | |
Cash | | | 325 | |
Interest receivable | | | 1,891,882 | |
Receivable for Fund shares sold | | | 627,283 | |
Prepaid expenses | | | 2,402 | |
| | | | |
| |
Total Assets | | | 552,304,833 | |
| | | | |
| |
Liabilities | | | | |
| |
Payable for Fund shares purchased | | | 2,734,080 | |
Management fee payable | | | 148,611 | |
Accrued expenses and other liabilities | | | 119,121 | |
Affiliated transfer agent fee payable | | | 55,249 | |
Distribution fee payable | | | 49,024 | |
Dividends payable | | | 38,938 | |
| | | | |
| |
Total Liabilities | | | 3,145,023 | |
| | | | |
| |
Net Assets | | $ | 549,159,810 | |
| | | | |
| |
| | | | | |
| |
Net assets were comprised of: | | | | |
Common stock, at par ($0.00001 par value; 166,000,000,000 shares authorized for issuance) | | $ | 549,135 | |
Paid-in capital in excess of par | | | 548,607,352 | |
Total distributable earnings (loss) | | | 3,323 | |
| | | | |
| |
Net assets, January 31, 2023 | | $ | 549,159,810 | |
| | | | |
See Notes to Financial Statements.
PGIM Government Money Market Fund 15
Statement of Assets and Liabilities (unaudited)
as of January 31, 2023
| | | | | | | | |
Class A | | | | | | | | |
| | | |
Net asset value, offering price and redemption price per share, ($449,005,182 ÷ 448,983,405 shares of common stock issued and outstanding) | | | | | $1.00 | | | |
| | | | | | | | |
| | | |
Class C | | | | | | | | |
| | | |
Net asset value, offering price and redemption price per share, ($11,390,202 ÷ 11,389,288 shares of common stock issued and outstanding) | | | | | $1.00 | | | |
| | | | | | | | |
| | | |
Class Z | | | | | | | | |
| | | |
Net asset value, offering price and redemption price per share, ($88,764,426 ÷ 88,762,526 shares of common stock issued and outstanding) | | | | | $1.00 | | | |
| | | | | | | | |
See Notes to Financial Statements.
16
Statement of Operations (unaudited)
Six Months Ended January 31, 2023
| | | | |
Net Investment Income (Loss) | | | | |
| |
| Interest income | | $ | 9,686,028 | |
| | | | |
| |
| Expenses | | | | |
| Management fee | | | 921,111 | |
| Distribution fee(a) | | | 299,186 | |
| Transfer agent’s fees and expenses (including affiliated expense of $137,551)(a) | | | 323,560 | |
| Custodian and accounting fees | | | 41,758 | |
| Shareholders’ reports | | | 37,420 | |
| Registration fees(a) | | | 32,391 | |
| Professional fees | | | 12,866 | |
| Audit fee | | | 12,275 | |
| Directors’ fees | | | 8,281 | |
| Miscellaneous | | | 7,623 | |
| | | | |
| |
| Total expenses | | | 1,696,471 | |
| | | | |
| |
| Net investment income (loss) | | | 7,989,557 | |
| | | | |
| |
Realized And Unrealized Gain (Loss) On Investments | | | | |
| |
| Net realized gain (loss) on investment transactions | | | (685 | ) |
| | | | |
| |
| Net Increase (Decrease) In Net Assets Resulting From Operations | | $ | 7,988,872 | |
| | | | |
| (a) | Class specific expenses and waivers were as follows: |
| | | | | | | | | | | | |
| | | Class A | | | Class C | | | Class Z | |
Distribution fee | | | 299,186 | | | | — | | | | — | |
Transfer agent’s fees and expenses | | | 300,216 | | | | 7,948 | | | | 15,396 | |
Registration fees | | | 16,607 | | | | 7,043 | | | | 8,741 | |
See Notes to Financial Statements.
PGIM Government Money Market Fund 17
Statements of Changes in Net Assets (unaudited)
| | | | | | | | | | | | | | | | |
| | |
| | | Six Months Ended January 31, 2023 | | Year Ended July 31, 2022 |
| | | | | | |
Increase (Decrease) in Net Assets | | | | | | | | | | | | | | | | |
| | | | | | |
Operations | | | | | | | | | | | | | | | | |
Net investment income (loss) | | | | $ | 7,989,557 | | | | | | | $ | 795,155 | | | |
Net realized gain (loss) on investment transactions | | | | | (685 | ) | | | | | | | 3,274 | | | |
| | | | | | | | | | | | | | | | |
| | | | | | |
Net increase (decrease) in net assets resulting from operations | | | | | 7,988,872 | | | | | | | | 798,429 | | | |
| | | | | | | | | | | | | | | | |
| | | | | | |
Dividends and Distributions | | | | | | | | | | | | | | | | |
Distributions from distributable earnings | | | | | | | | | | | | | | | | |
Class A | | | | | (6,497,178 | ) | | | | | | | (924,152 | ) | | |
Class C | | | | | (171,256 | ) | | | | | | | (25,007 | ) | | |
Class Z | | | | | (1,321,123 | ) | | | | | | | (215,009 | ) | | |
| | | | | | | | | | | | | | | | |
| | | | | | |
| | | | | (7,989,557 | ) | | | | | | | (1,164,168 | ) | | |
| | | | | | | | | | | | | | | | |
| | | | | | |
Fund share transactions (Net of share conversions) (at $1.00 per share) | | | | | | | | | | | | | | | | |
Net proceeds from shares sold | | | | | 230,781,827 | | | | | | | | 836,342,064 | | | |
Net asset value of shares issued in reinvestment of dividends and distributions | | | | | 7,783,889 | | | | | | | | 1,137,321 | | | |
Cost of shares purchased | | | | | (293,693,640 | ) | | | | | | | (739,802,296 | ) | | |
| | | | | | | | | | | | | | | | |
| | | | | | |
Net increase (decrease) in net assets from Fund share transactions | | | | | (55,127,924 | ) | | | | | | | 97,677,089 | | | |
| | | | | | | | | | | | | | | | |
| | | | | | |
Total increase (decrease) | | | | | (55,128,609 | ) | | | | | | | 97,311,350 | | | |
| | | | | | |
Net Assets: | | | | | | | | | | | | | | | | |
| | | | | | |
Beginning of period | | | | | 604,288,419 | | | | | | | | 506,977,069 | | | |
| | | | | | | | | | | | | | | | |
| | | | | | |
End of period | | | | $ | 549,159,810 | | | | | | | $ | 604,288,419 | | | |
| | | | | | | | | | | | | | | | |
See Notes to Financial Statements.
18
Financial Highlights (unaudited)
| | | | | | | | | | | | | | | | | | | | | | | | |
| | | | | | | |
Class A Shares | | | | | | | | | | | | | | | | | | | | | | | | |
| | | Six Months | | | | | | | | | | | | | | | | |
| | | Ended | | | | | | | | | | | | | | | | |
| | | January 31,
2023 | | | Year Ended July 31, | |
| | 2022 | | | 2021 | | | 2020 | | | 2019 | | | 2018 | |
| | | | | | | |
Per Share Operating Performance(a): | | | | | | | | | | | | | | | | | | | | | | | | |
Net Asset Value, Beginning of Period | | | $1.00 | | | | $1.00 | | | | $1.00 | | | | $1.00 | | | | $1.00 | | | | $1.00 | |
| Net investment income (loss) and net realized gain (loss) on investment transactions | | | 0.01 | | | | -(b | ) | | | -(b | ) | | | 0.01 | | | | 0.02 | | | | 0.01 | |
Dividends to shareholders | | | (0.01 | ) | | | -(b | ) | | | -(b | ) | | | (0.01 | ) | | | (0.02 | ) | | | (0.01 | ) |
Net asset value, end of period | | | $1.00 | | | | $1.00 | | | | $1.00 | | | | $1.00 | | | | $1.00 | | | | $1.00 | |
Total Return(c): | | | 1.39 | % | | | 0.20 | % | | | 0.01 | % | | | 0.76 | % | | | 1.69 | % | | | 0.82 | % |
| | | | | | | | | | | | | | | | | | | | | | | | | |
| | | | | | | |
Ratios/Supplemental Data: | | | | | | | | | | | | | | | | | | | | | | | | |
Net assets, end of period (000) | | | $449,005 | | | | $505,406 | | | | $414,625 | | | | $442,260 | | | | $348,427 | | | | $381,073 | |
Average net assets (000) | | | $474,795 | | | | $443,402 | | | | $475,166 | | | | $407,195 | | | | $390,207 | | | | $440,589 | |
Ratios to average net assets: | | | | | | | | | | | | | | | | | | | | | | | | |
Expenses after waivers and/or expense reimbursement | | | 0.62 | %(d) | | | 0.23 | % | | | 0.09 | % | | | 0.49 | % | | | 0.64 | % | | | 0.61 | % |
Expenses before waivers and/or expense reimbursement | | | 0.62 | %(d) | | | 0.63 | % | | | 0.63 | % | | | 0.64 | % | | | 0.64 | % | | | 0.61 | % |
Net investment income (loss) | | | 2.71 | %(d) | | | 0.14 | % | | | 0.01 | % | | | 0.70 | % | | | 1.67 | % | | | 0.81 | % |
| (a) | Calculated based on average shares outstanding during the period. |
| (b) | Amount rounds to zero. |
| (c) | Total return is calculated assuming a purchase of a share on the first day and a sale on the last day of each period reported and includes reinvestment of dividends and distributions, if any. Total returns may reflect adjustments to conform to GAAP. Total returns for periods less than one full year are not annualized. |
See Notes to Financial Statements.
PGIM Government Money Market Fund 19
Financial Highlights (unaudited) (continued)
| | | | | | | | | | | | | | | | | | | | | | | | |
| | | | | | | |
Class C Shares | | | | | | | | | | | | | | | | | | | | | | | | |
| | | Six Months | | | | | | | | | | | | | | | | |
| | | Ended | | | | | | | | | | | | | | | | |
| | | January 31,
2023 | | | Year Ended July 31, | |
| | 2022 | | | 2021 | | | 2020 | | | 2019 | | | 2018 | |
| | | | | | | |
Per Share Operating Performance(a): | | | | | | | | | | | | | | | | | | | | | | | | |
Net Asset Value, Beginning of Period | | | $1.00 | | | | $1.00 | | | | $1.00 | | | | $1.00 | | | | $1.00 | | | | $1.00 | |
| Net investment income (loss) and net realized gain (loss) on investment transactions | | | 0.01 | | | | -(b | ) | | | -(b | ) | | | 0.01 | | | | 0.02 | | | | 0.01 | |
Dividends to shareholders | | | (0.01 | ) | | | -(b | ) | | | -(b | ) | | | (0.01 | ) | | | (0.02 | ) | | | (0.01 | ) |
Net asset value, end of period | | | $1.00 | | | | $1.00 | | | | $1.00 | | | | $1.00 | | | | $1.00 | | | | $1.00 | |
Total Return(c): | | | 1.40 | % | | | 0.21 | % | | | 0.05 | % | | | 0.71 | % | | | 1.69 | % | | | 0.84 | % |
| | | | | | | | | | | | | | | | | | | | | | | | | |
| | | | | | | |
Ratios/Supplemental Data: | | | | | | | | | | | | | | | | | | | | | | | | |
Net assets, end of period (000) | | | $11,390 | | | | $12,793 | | | | $10,242 | | | | $14,538 | | | | $7,931 | | | | $9,908 | |
Average net assets (000) | | | $12,334 | | | | $10,254 | | | | $12,853 | | | | $10,815 | | | | $10,913 | | | | $11,277 | |
Ratios to average net assets: | | | | | | | | | | | | | | | | | | | | | | | | |
Expenses after waivers and/or expense reimbursement | | | 0.60 | %(d) | | | 0.25 | % | | | 0.06 | % | | | 0.48 | % | | | 0.65 | % | | | 0.60 | % |
Expenses before waivers and/or expense reimbursement | | | 0.60 | %(d) | | | 0.64 | % | | | 0.59 | % | | | 0.68 | % | | | 0.65 | % | | | 0.60 | % |
Net investment income (loss) | | | 2.75 | %(d) | | | 0.17 | % | | | 0.04 | % | | | 0.52 | % | | | 1.69 | % | | | 0.81 | % |
| (a) | Calculated based on average shares outstanding during the period. |
| (b) | Amount rounds to zero. |
| (c) | Total return is calculated assuming a purchase of a share on the first day and a sale on the last day of each period reported and includes reinvestment of dividends and distributions, if any. Total returns may reflect adjustments to conform to GAAP. Total returns for periods less than one full year are not annualized. |
See Notes to Financial Statements.
20
| | | | | | | | | | | | | | | | | | | | | | | | | | |
| | | | | | | | |
Class Z Shares | | | | | | | | | | | | | | | | | | | | | | | | | | |
| | | Six Months | | | | | | | | | | | | | | | | | | |
| | | Ended | | | | | | | | | | | | | | | | | | |
| | | January 31,
2023 | | | | | Year Ended July 31, | |
| | 2022 | | | 2021 | | | 2020 | | | 2019 | | | 2018 | |
| | | | | | | | |
Per Share Operating Performance(a): | | | | | | | | | | | | | | | | | | | | | | | | | | |
Net Asset Value, Beginning of Period | | | $1.00 | | | | | | $1.00 | | | | $1.00 | | | | $1.00 | | | | $1.00 | | | | $1.00 | |
| Net investment income (loss) and net realized gain (loss) on investment transactions | | | 0.01 | | | | | | -(b | ) | | | -(b | ) | | | 0.01 | | | | 0.02 | | | | 0.01 | |
Dividends to shareholders | | | (0.01 | ) | | | | | -(b | ) | | | -(b | ) | | | (0.01 | ) | | | (0.02 | ) | | | (0.01 | ) |
Net asset value, end of period | | | $1.00 | | | | | | $1.00 | | | | $1.00 | | | | $1.00 | | | | $1.00 | | | | $1.00 | |
Total Return(c): | | | 1.49 | % | | | | | 0.26 | % | | | 0.01 | % | | | 0.91 | % | | | 1.91 | % | | | 1.01 | % |
| | | | | | | | | | | | | | | | | | | | | | | | | | | |
| | | | | | | | |
Ratios/Supplemental Data: | | | | | | | | | | | | | | | | | | | | | | | | | | |
Net assets, end of period (000) | | | $88,764 | | | | | | $86,089 | | | | $82,110 | | | | $90,399 | | | | $76,956 | | | | $84,915 | |
Average net assets (000) | | | $88,606 | | | | | | $75,926 | | | | $86,432 | | | | $83,610 | | | | $84,238 | | | | $85,131 | |
Ratios to average net assets: | | | | | | | | | | | | | | | | | | | | | | | | | | |
Expenses after waivers and/or expense reimbursement | | | 0.41 | %(d) | | | | | 0.18 | % | | | 0.09 | % | | | 0.36 | % | | | 0.43 | % | | | 0.42 | % |
Expenses before waivers and/or expense reimbursement | | | 0.41 | %(d) | | | | | 0.42 | % | | | 0.43 | % | | | 0.43 | % | | | 0.43 | % | | | 0.42 | % |
Net investment income (loss) | | | 2.96 | %(d) | | | | | 0.20 | % | | | 0.01 | % | | | 0.84 | % | | | 1.89 | % | | | 1.00 | % |
| (a) | Calculated based on average shares outstanding during the period. |
| (b) | Amount rounds to zero. |
| (c) | Total return is calculated assuming a purchase of a share on the first day and a sale on the last day of each period reported and includes reinvestment of dividends and distributions, if any. Total returns may reflect adjustments to conform to GAAP. Total returns for periods less than one full year are not annualized. |
See Notes to Financial Statements.
PGIM Government Money Market Fund 21
Notes to Financial Statements (unaudited)
Prudential Government Money Market Fund, Inc. (the “Registered Investment Company” or “RIC”) is registered under the Investment Company Act of 1940, as amended (“1940 Act”), as an open-end management investment company. The RIC is organized as a Maryland Corporation and PGIM Government Money Market Fund (the “Fund”) is the sole series of the RIC. The Fund is classified as a diversified fund for purposes of the 1940 Act.
The investment objective of the Fund is maximum current income consistent with stability of capital and the maintenance of liquidity.
The Fund follows the investment company accounting and reporting guidance of the Financial Accounting Standards Board (“FASB”) Accounting Standard Codification (“ASC”) Topic 946 Financial Services —Investment Companies. The following is a summary of significant accounting policies followed by the Fund in the preparation of its financial statements. The policies conform to U.S. generally accepted accounting principles (“GAAP”). The Fund consistently follows such policies in the preparation of its financial statements.
Securities Valuation: The Fund holds securities and other assets and liabilities that are fair valued as of the close of each day (generally, 4:00 PM Eastern time) the New York Stock Exchange (“NYSE”) is open for trading. As described in further detail below, the Fund’s investments are valued daily based on a number of factors, including the type of investment and whether market quotations are readily available. The RIC’s Board of Directors (the “Board”) has approved the Fund’s valuation policies and procedures for security valuation and designated to PGIM Investments LLC (“PGIM Investments” or the “Manager”) as the Valuation Designee pursuant to SEC Rule 2a-5(b) to perform the fair value determination relating to all Fund investments. Pursuant to the Board’s oversight, the Valuation Designee has established a Valuation Committee to perform the duties and responsibilities as valuation designee under SEC Rule 2a-5. The valuation procedures permit the Fund to utilize independent pricing vendor services, quotations from market makers, and alternative valuation methods when market quotations are either not readily available or not deemed representative of fair value. Fair value is the price that would be received to sell an asset or paid to transfer a liability in an orderly transaction between market participants on the measurement date.
For the fiscal reporting period-end, securities and other assets and liabilities were fair valued at the close of the last U.S. business day. Trading in certain foreign securities may occur when the NYSE is closed (including weekends and holidays). Because such foreign securities trade in markets that are open on weekends and U.S. holidays, the values of some
22
of the Fund’s foreign investments may change on days when investors cannot purchase or redeem Fund shares.
Various inputs determine how the Fund’s investments are valued, all of which are categorized according to the three broad levels (Level 1, 2, or 3) detailed in the Schedule of Investments and referred to herein as the “fair value hierarchy” in accordance with FASB ASC Topic 820 - Fair Value Measurement.
The Fund’s securities of sufficient credit quality are valued using amortized cost method, which approximates fair value. The amortized cost method involves valuing a security at its cost on the date of purchase and thereafter assuming a constant amortization to maturity of the difference between the principal amount due at maturity and cost. These securities are categorized as Level 2 in the fair value hierarchy.
Securities and other assets that cannot be priced according to the methods described above are valued based on policies and procedures approved by the Board. In the event that unobservable inputs are used when determining such valuations, the securities will be classified as Level 3 in the fair value hierarchy. Altering one or more unobservable inputs may result in a significant change to a Level 3 security’s fair value measurement.
When determining the fair value of securities, some of the factors influencing the valuation include: the nature of any restrictions on disposition of the securities; assessment of the general liquidity of the securities; the issuer’s financial condition and the markets in which it does business; the cost of the investment; the size of the holding and the capitalization of the issuer; the prices of any recent transactions or bids/offers for such securities or any comparable securities; any available analyst media or other reports or information deemed reliable by the Valuation Designee regarding the issuer or the markets or industry in which it operates. Using fair value to price securities may result in a value that is different from a security’s most recent closing price and from the price used by other unaffiliated mutual funds to calculate their net asset values.
Repurchase Agreements: The Fund entered into repurchase agreements. In connection with transactions in repurchase agreements with United States financial institutions, it is the Fund’s policy that its custodian or designated subcustodians under triparty repurchase agreements, as the case may be, take possession of the underlying collateral securities, the value of which exceeds the principal amount of the repurchase transactions, including accrued interest. To the extent that any repurchase transaction exceeds one business day, the value of the collateral is marked-to-market on a daily basis to ensure the adequacy of the collateral. If the seller defaults and the value of the collateral declines or, if bankruptcy proceedings are commenced with respect to the seller of the security, realization of the collateral by the Fund may be delayed or limited.
Master Netting Arrangements: The RIC, on behalf of the Fund, is subject to various Master Agreements, or netting arrangements, with select counterparties. These are agreements which a subadviser may have negotiated and entered into on behalf of all or a portion of the
PGIM Government Money Market Fund 23
Notes to Financial Statements (unaudited) (continued)
Fund. A master netting arrangement between the Fund and the counterparty permits the Fund to offset amounts payable by the Fund to the same counterparty against amounts to be received; and by the receipt of collateral from the counterparty by the Fund to cover the Fund’s exposure to the counterparty. However, there is no assurance that such mitigating factors are easily enforceable. In addition to master netting arrangements, the right to set-off exists when all the conditions are met such that each of the parties owes the other determinable amounts, the reporting party has the right to set-off the amount owed with the amount owed by the other party, the reporting party intends to set-off and the right of set-off is enforceable by law.
Securities Transactions and Net Investment Income: Securities transactions are recorded on the trade date. Realized gains (losses) from investment and currency transactions are calculated on the specific identification method. Dividend income is recorded on the ex-date, or for certain foreign securities, when the Fund becomes aware of such dividends. Interest income, including amortization of premium and accretion of discount on debt securities, as required, is recorded on the accrual basis. Expenses are recorded on an accrual basis, which may require the use of certain estimates by management that may differ from actual. Net investment income or loss (other than class specific expenses and waivers, which are allocated as noted below) and unrealized and realized gains (losses) are allocated daily to each class of shares based upon the relative proportion of adjusted net assets of each class at the beginning of the day. Class specific expenses and waivers, where applicable, are charged to the respective share classes. Such class specific expenses and waivers include distribution fees and distribution fee waivers, shareholder servicing fees, transfer agent’s fees and expenses, registration fees and fee waivers and/or expense reimbursements, as applicable.
Taxes: It is the Fund’s policy to continue to meet the requirements of the Internal Revenue Code applicable to regulated investment companies and to distribute all of its taxable net investment income and capital gains, if any, to its shareholders. Therefore, no federal income tax provision is required. Withholding taxes on foreign dividends, interest and capital gains, if any, are recorded, net of reclaimable amounts, at the time the related income is earned.
Dividends and Distributions: Dividends and distributions to shareholders, which are determined in accordance with federal income tax regulations and which may differ from GAAP, are recorded on the ex-date. Permanent book/tax differences relating to income and gain (loss) are reclassified between total distributable earnings (loss) and paid-in capital in excess of par, as appropriate. The chart below sets forth the expected frequency of dividend and capital gains distributions to shareholders. Various factors may impact the frequency of
24
dividend distributions to shareholders, including but not limited to adverse market conditions or portfolio holding-specific events.
| | | | |
| | |
| Expected Distribution Schedule to Shareholders* | | Frequency | |
Net Investment Income | | | Monthly | |
Short-Term Capital Gains | | | Monthly | |
Long-Term Capital Gains | | | Annually | |
| * | The Fund declares dividends of any net investment income to shareholders on a daily basis and distributes the dividends every month. Under certain circumstances, the Fund may make more than one distribution of long-term capital gains during a fiscal year. |
Estimates: The preparation of financial statements requires management to make estimates and assumptions that affect the reported amounts and disclosures in the financial statements. Actual results could differ from those estimates.
The RIC, on behalf of the Fund, has a management agreement with the Manager pursuant to which it has responsibility for all investment advisory services and supervises the subadviser’s performance of such services, and pursuant to which it renders administrative services.
The Manager has entered into a subadvisory agreement with PGIM, Inc. (the “subadviser”), which provides subadvisory services to the Fund through its business unit PGIM Fixed Income. The Manager pays for the services of PGIM, Inc.
Fees payable under the management agreement are computed daily and paid monthly. For the reporting period ended January 31, 2023, the contractual and effective management fee rates were as follows:
| | | | |
| | |
| Contractual Management Rate | | Effective Management Fee, before any waivers
and/or expense reimbursements | |
0.50% to $50 million of average daily net assets; | | | 0.32% | |
0.30% over $50 million of average daily net assets. | | | | |
The RIC, on behalf of the Fund, has a distribution agreement with Prudential Investment Management Services LLC (“PIMS”), which acts as the distributor of the Class A, Class C and Class Z shares of the Fund. The Fund compensates PIMS for distributing and servicing the Fund’s Class A shares, pursuant to the plans of distribution (the “Distribution Plans”), regardless of expenses actually incurred by PIMS.
Pursuant to the Distribution Plans, the Fund compensates PIMS for distribution related activities at an annual rate based on average daily net assets per class. The distribution fees are accrued daily and payable monthly.
PGIM Government Money Market Fund 25
Notes to Financial Statements (unaudited) (continued)
The Fund’s annual gross and net distribution rates, where applicable, are as follows:
| | | | | | |
| | | | |
| | | Gross Distribution Fee | | | | Net Distribution Fee |
A | | 0.125% | | | | 0.125% |
C | | N/A | | | | N/A |
Z | | N/A | | | | N/A |
PGIM Investments, PGIM, Inc. and PIMS are indirect, wholly-owned subsidiaries of Prudential Financial, Inc. (“Prudential”).
| 4. | Other Transactions with Affiliates |
Prudential Mutual Fund Services LLC (“PMFS”), an affiliate of PGIM Investments and an indirect, wholly-owned subsidiary of Prudential, serves as the Fund’s transfer agent and shareholder servicing agent. Transfer agent’s fees and expenses in the Statement of Operations include certain out-of-pocket expenses paid to non-affiliates, where applicable.
The Fund may enter into certain securities purchase or sale transactions under Board approved Rule 17a-7 procedures. Rule 17a-7 is an exemptive rule under the 1940 Act, that subject to certain conditions, permits purchase and sale transactions among affiliated investment companies, or between an investment company and a person that is affiliated solely by reason of having a common (or affiliated) investment adviser, common directors/trustees, and/or common officers. For the reporting period ended January 31, 2023, no 17a-7 transactions were entered into by the Fund.
The Manager has analyzed the Fund’s tax positions taken on federal, state and local income tax returns for all open tax years and has concluded that no provision for income tax is required in the Fund’s financial statements for the current reporting period. Since tax authorities can examine previously filed tax returns, the Fund’s U.S. federal and state tax returns for each of the four fiscal years up to the most recent fiscal year ended July 31, 2022 are subject to such review.
The Fund offers Class A, Class C and Class Z shares. Class C and Class Z shares are not subject to any distribution and/or service fees and are offered exclusively for sale to a limited group of investors. Class C shares are sold with a CDSC of 1% on sales made within 12 months of purchase. Class C shares will automatically convert to Class A shares on a monthly basis approximately eight years (ten years prior to January 22, 2021) after
26
purchase. Class Z and Class R6 shares are not subject to any sales or redemption charges and are available exclusively for sale to a limited group of investors.
Under certain circumstances, an exchange may be made from specified share classes of the Fund to one or more other share classes of the Fund as presented in the table of transactions in shares of common stock, below.
The RIC is authorized to issue 166,000,000,000 shares of common stock, $0.00001 par value per share, designated as shares of the Fund. The authorized shares of the fund are currently classified and designated as follows:
| | | | |
| | |
| Class | | Number of Shares | |
A | | | 11,000,000,000 | |
C | | | 5,000,000,000 | |
Z | | | 50,000,000,000 | |
P | | | 100,000,000,000 | |
The Fund currently does not have any Class P shares outstanding.
As of January 31, 2023, Prudential, through its affiliated entities, including affiliated funds (if applicable), owned shares of the Fund as follows:
| | | | | | |
| | | | |
| Class | | Number of Shares | | | | Percentage of Outstanding Shares |
A | | 28,863,055 | | | | 6.4% |
Z | | 5,304,714 | | | | 6.0 |
At the reporting period end, the number of shareholders holding greater than 5% of the Fund are as follows:
| | | | | | |
| | | | |
| | | Number of Shareholders | | | | Percentage of Outstanding Shares |
Affiliated | | 1 | | | | 5.1% |
Unaffiliated | | 3 | | | | 51.7 |
Transactions in shares of common stock (at $1 net asset value per share) were as follows:
| | | | | | | | |
| | | |
| Share Class | | Shares | | | Amount | |
| | |
Class A | | | | | | | | |
Six months ended January 31, 2023: | | | | | | | | |
Shares sold | | | 208,345,585 | | | $ | 208,345,595 | |
Shares issued in reinvestment of dividends and distributions | | | 6,302,293 | | | | 6,302,293 | |
Shares purchased | | | (271,318,800 | ) | | | (271,318,800 | ) |
Net increase (decrease) in shares outstanding before conversion | | | (56,670,922 | ) | | | (56,670,912 | ) |
Shares issued upon conversion from other share class(es) | | | 275,292 | | | | 275,292 | |
Shares purchased upon conversion into other share class(es) | | | (5,033 | ) | | | (5,033 | ) |
Net increase (decrease) in shares outstanding | | | (56,400,663 | ) | | $ | (56,400,653 | ) |
PGIM Government Money Market Fund 27
Notes to Financial Statements (unaudited) (continued)
| | | | | | | | |
| | | |
| Share Class | | Shares | | | Amount | |
| | |
Year ended July 31, 2022: | | | | | | | | |
Shares sold | | | 787,599,128 | | | $ | 787,600,067 | |
Shares issued in reinvestment of dividends and distributions | | | 904,607 | | | | 904,607 | |
Shares purchased | | | (697,845,421 | ) | | | (697,845,425 | ) |
Net increase (decrease) in shares outstanding before conversion | | | 90,658,314 | | | | 90,659,249 | |
Shares issued upon conversion from other share class(es) | | | 626,142 | | | | 626,142 | |
Shares purchased upon conversion into other share class(es) | | | (205,734 | ) | | | (205,734 | ) |
Net increase (decrease) in shares outstanding | | | 91,078,722 | | | $ | 91,079,657 | |
| | |
Class C | | | | | | | | |
Six months ended January 31, 2023: | | | | | | | | |
Shares sold | | | 3,787,161 | | | $ | 3,787,161 | |
Shares issued in reinvestment of dividends and distributions | | | 170,007 | | | | 170,007 | |
Shares purchased | | | (5,084,788 | ) | | | (5,084,788 | ) |
Net increase (decrease) in shares outstanding before conversion | | | (1,127,620 | ) | | | (1,127,620 | ) |
Shares purchased upon conversion into other share class(es) | | | (275,292 | ) | | | (275,292 | ) |
Net increase (decrease) in shares outstanding | | | (1,402,912 | ) | | $ | (1,402,912 | ) |
| | |
Year ended July 31, 2022: | | | | | | | | |
Shares sold | | | 10,074,113 | | | $ | 10,074,135 | |
Shares issued in reinvestment of dividends and distributions | | | 24,637 | | | | 24,637 | |
Shares purchased | | | (6,905,815 | ) | | | (6,905,815 | ) |
Net increase (decrease) in shares outstanding before conversion | | | 3,192,935 | | | | 3,192,957 | |
Shares purchased upon conversion into other share class(es) | | | (634,090 | ) | | | (634,090 | ) |
Net increase (decrease) in shares outstanding | | | 2,558,845 | | | $ | 2,558,867 | |
| | |
Class Z | | | | | | | | |
Six months ended January 31, 2023: | | | | | | | | |
Shares sold | | | 18,649,071 | | | $ | 18,649,071 | |
Shares issued in reinvestment of dividends and distributions | | | 1,311,589 | | | | 1,311,589 | |
Shares purchased | | | (17,290,052 | ) | | | (17,290,052 | ) |
Net increase (decrease) in shares outstanding before conversion | | | 2,670,608 | | | | 2,670,608 | |
Shares issued upon conversion from other share class(es) | | | 5,033 | | | | 5,033 | |
Net increase (decrease) in shares outstanding | | | 2,675,641 | | | $ | 2,675,641 | |
| | |
Year ended July 31, 2022: | | | | | | | | |
Shares sold | | | 38,667,701 | | | $ | 38,667,862 | |
Shares issued in reinvestment of dividends and distributions | | | 208,077 | | | | 208,077 | |
Shares purchased | | | (35,051,056 | ) | | | (35,051,056 | ) |
Net increase (decrease) in shares outstanding before conversion | | | 3,824,722 | | | | 3,824,883 | |
Shares issued upon conversion from other share class(es) | | | 213,682 | | | | 213,682 | |
Net increase (decrease) in shares outstanding | | | 4,038,404 | | | $ | 4,038,565 | |
28
| 7. | Risks of Investing in the Fund |
The Fund’s risks include, but are not limited to, the risks discussed below. For further information on the Fund’s risks, please refer to the Fund’s Prospectus and Statement of Additional Information.
Adjustable and Floating Rate Securities Risk: The value of adjustable and floating rate securities may lag behind the value of fixed rate securities when interest rates change. Such securities may be subject to extended settlement periods (longer than seven days) and in unusual market conditions, with a high volume of shareholder redemptions, may present a risk of loss to the Fund or may impair the Fund’s ability satisfy shareholder redemption requests.
Credit Risk: This is the risk that the issuer, the guarantor or the insurer of a fixed income security, or the counterparty to a contract, may be unable or unwilling to make timely principal and interest payments, or to otherwise honor its obligations. Additionally, fixed income securities could lose value due to a loss of confidence in the ability of the issuer, guarantor, insurer or counterparty to pay back debt. The lower the credit quality of a bond, the more sensitive it is to credit risk.
Debt Obligations Risk: Debt obligations are subject to credit risk, market risk and interest rate risk. The Fund’s holdings, share price, yield and total return may also fluctuate in response to bond market movements. The value of bonds may decline for issuer-related reasons, including management performance, financial leverage and reduced demand for the issuer’s goods and services. Certain types of fixed income obligations also may be subject to “call and redemption risk,” which is the risk that the issuer may call a bond held by the Fund for redemption before it matures and the Fund may not be able to reinvest at the same rate of interest and therefore would earn less income.
Economic and Market Events Risk: Events in the U.S. and global financial markets, including actions taken by the U.S. Federal Reserve or foreign central banks to stimulate or stabilize economic growth or the functioning of the securities markets, or otherwise reduce inflation, may at times result in unusually high market volatility, which could negatively impact performance. Governmental efforts to curb inflation often have negative effects on the level of economic activity. Relatively reduced liquidity in credit and fixed income markets could adversely affect issuers worldwide.
Increase in Expenses Risk: Your actual cost of investing in the Fund may be higher than the expenses shown in the expense table in the Fund’s prospectus for a variety of reasons. For example, expense ratios may be higher than those shown if average net assets decrease. Net assets are more likely to decrease and Fund expense ratios are more likely to increase when markets are volatile. Active and frequent trading of Fund securities can increase expenses.
Interest Rate Risk: The value of your investment may go down when interest rates rise. A rise in rates tends to have a greater impact on the prices of longer term or duration debt
PGIM Government Money Market Fund 29
Notes to Financial Statements (unaudited) (continued)
securities. Similarly, a rise in interest rates may also have a greater negative impact on the value of equity securities whose issuers expect earnings further out in the future. For example, a fixed income security with a duration of three years is expected to decrease in value by approximately 3% if interest rates increase by 1%. This is referred to as “duration risk.” When interest rates fall, the issuers of debt obligations may prepay principal more quickly than expected, and the Fund may be required to reinvest the proceeds at a lower interest rate. This is referred to as “prepayment risk.” When interest rates rise, debt obligations may be repaid more slowly than expected, and the value of the Fund’s holdings may fall sharply. This is referred to as “extension risk.” The Fund may lose money if short-term or long-term interest rates rise sharply or in a manner not anticipated by the subadviser.
Large Shareholder and Large Scale Redemption Risk: Certain individuals, accounts, funds (including funds affiliated with the Manager) or institutions, including the Manager and its affiliates, may from time to time own or control a substantial amount of the Fund’s shares. There is no requirement that these entities maintain their investment in the Fund. There is a risk that such large shareholders or that the Fund’s shareholders generally may redeem all or a substantial portion of their investments in the Fund in a short period of time, which could have a significant negative impact on the Fund’s NAV, liquidity, and brokerage costs. Large redemptions could also result in tax consequences to shareholders and impact the Fund’s ability to implement its investment strategy. The Fund’s ability to pursue its investment objective after one or more large scale redemptions may be impaired and, as a result, the Fund may invest a larger portion of its assets in cash or cash equivalents.
Management Risk: Actively managed funds are subject to management risk. The subadviser will apply investment techniques and risk analyses in making investment decisions for the Fund, but the subadviser’s judgments about the attractiveness, value or market trends affecting a particular security, industry or sector or about market movements may be incorrect. Additionally, the investments selected for the Fund may underperform the markets in general, the Fund’s benchmark and other funds with similar investment objectives.
Market Disruption and Geopolitical Risks: Market disruption can be caused by economic, financial or political events and factors, including but not limited to, international wars or conflicts (including Russia’s military invasion of Ukraine), geopolitical developments (including trading and tariff arrangements, sanctions and cybersecurity attacks), instability in regions such as Asia, Eastern Europe and the Middle East, terrorism, natural disasters and public health epidemics (including the outbreak of COVID-19 globally).
The extent and duration of such events and resulting market disruptions cannot be predicted, but could be substantial and could magnify the impact of other risks to the Fund.
30
These and other similar events could adversely affect the U.S. and foreign financial markets and lead to increased market volatility, reduced liquidity in the securities markets, significant negative impacts on issuers and the markets for certain securities and commodities and/or government intervention. They may also cause short- or long-term economic uncertainties in the United States and worldwide. As a result, whether or not the Fund invests in securities of issuers located in or with significant exposure to the countries directly affected, the value and liquidity of the Fund’s investments may be negatively impacted. Further, due to closures of certain markets and restrictions on trading certain securities, the value of certain securities held by the Fund could be significantly impacted, which could lead to such securities being valued at zero.
COVID-19 and the related governmental and public responses have had and may continue to have an impact on the Fund’s investments and net asset value and have led and may continue to lead to increased market volatility and the potential for illiquidity in certain classes of securities and sectors of the market. They have also had and may continue to result in periods of business disruption, business closures, inability to obtain raw materials, supplies and component parts, and reduced or disrupted operations for the issuers in which the Fund invests. The occurrence, reoccurrence and pendency of public health epidemics could adversely affect the economies and financial markets either in specific countries or worldwide.
Market Risk: Securities markets may be volatile and the market prices of the Fund’s securities may decline. Securities fluctuate in price based on changes in an issuer’s financial condition and overall market and economic conditions.
Net Asset Value Risk: There is no assurance that the Fund will maintain a net asset value of $1.00 per share on a continuous basis. Furthermore, there can be no assurance that the Fund’s affiliates will purchase distressed assets from the Fund, make capital infusions, enter into capital support agreements or take other actions to ensure that the Fund maintains a net asset value of $1.00 per share. In the event any money market fund fails to maintain a stable net asset value, other money market funds, including the Fund, could face a universal risk of increased redemption pressures, potentially jeopardizing the stability of their net asset values. In general, certain other money market funds have in the past failed to maintain stable net asset values and there can be no assurance that such failures and resulting redemption pressures will not occur in the future.
Redemption Risk: The Fund may experience heavy redemptions, particularly during periods of declining or illiquid markets, that could cause the Fund to liquidate its assets at inopportune times or at a loss or depressed value and that could affect the Fund’s ability to maintain a $1.00 share price.
Repurchase Agreements Risk: Repurchase agreements could involve certain risks in the event of default or insolvency of the seller, including losses and possible delays or restrictions upon the Fund’s ability to dispose of the underlying securities. To the extent that,
PGIM Government Money Market Fund 31
Notes to Financial Statements (unaudited) (continued)
in the meantime, the value of the securities that the Fund has purchased has decreased, the Fund could experience a loss.
U.S. Government and Agency Securities Risk: U.S. Government and agency securities are subject to market risk, interest rate risk and credit risk. Not all U.S. Government securities are insured or guaranteed by the full faith and credit of the U.S. Government; some are only insured or guaranteed by the issuing agency, which must rely on its own resources to repay the debt. Some agency securities carry no guarantee whatsoever and the risk of default associated with these securities would be borne by the Fund. The maximum potential liability of the issuers of some U.S. Government securities held by the Fund may greatly exceed their current resources, including their legal right to support from the U.S. Treasury. No assurance can be given that the U.S. government would provide financial support to any such issuers if it is not obligated to do so by law. It is possible that these issuers will not have the funds to meet their payment obligations in the future. In addition, the value of U.S. Government securities may be affected by changes in the credit rating of the U.S. Government.
Yield Risk: The amount of income received by the Fund will go up or down depending on day-to-day variations in short-term interest rates, and when interest rates are very low the Fund’s expenses could absorb all or a significant portion of the Fund’s income. If interest rates increase, the Fund’s yield may not increase proportionately. For example, the Fund’s investment manager may discontinue any temporary voluntary fee limitation.
32
| | | | |
| | | |
| ∎ MAIL | | ∎ TELEPHONE | | ∎ WEBSITE |
655 Broad Street | | (800) 225-1852 | | pgim.com/investments |
Newark, NJ 07102 | | | | |
|
| |
PROXY VOTING The Board of Directors of the Fund has delegated to the Fund’s subadviser the responsibility for voting any proxies and maintaining proxy recordkeeping with respect to the Fund. A description of these proxy voting policies and procedures is available without charge, upon request, by calling (800) 225-1852 or by visiting the Securities and Exchange Commission’s website at sec.gov. Information regarding how the Fund voted proxies relating to portfolio securities during the most recent 12-month period ended June 30 is available on the Fund’s website and on the Securities and Exchange Commission’s website. |
|
| |
DIRECTORS Ellen S. Alberding ● Kevin J. Bannon ● Scott E. Benjamin ● Linda W. Bynoe ● Barry H. Evans ● Keith F. Hartstein ● Laurie Simon Hodrick ● Stuart S. Parker ● Brian K. Reid ● Grace C. Torres |
|
| |
OFFICERS Stuart S. Parker, President ● Scott E. Benjamin, Vice President ● Christian J. Kelly, Chief Financial Officer ● Claudia DiGiacomo, Chief Legal Officer ● Isabelle Sajous, Chief Compliance Officer ● Kelly Florio, Anti-Money Laundering Compliance Officer ● Andrew R. French, Secretary ● Melissa Gonzalez, Assistant Secretary ● Kelly A. Coyne, Assistant Secretary ● Patrick E. McGuinness, Assistant Secretary ● Debra Rubano, Assistant Secretary ● Lana Lomuti, Assistant Treasurer ● Russ Shupak, Treasurer and Principal Accounting Officer ● Elyse M. McLaughlin, Assistant Treasurer ● Deborah Conway, Assistant Treasurer ● Robert McCormack, Assistant Treasurer |
| | | | |
| | |
| MANAGER | | PGIM Investments LLC | | 655 Broad Street Newark, NJ 07102 |
| | |
| SUBADVISER | | PGIM Fixed Income | | 655 Broad Street Newark, NJ 07102 |
| | |
| DISTRIBUTOR | | Prudential Investment Management Services LLC | | 655 Broad Street Newark, NJ 07102 |
| | |
| CUSTODIAN | | The Bank of New York Mellon | | 240 Greenwich Street New York, NY 10286 |
| | |
| TRANSFER AGENT | | Prudential Mutual Fund Services LLC | | PO Box 534432 Pittsburgh, PA 15253 |
| | |
| INDEPENDENT REGISTERED PUBLIC ACCOUNTING FIRM | | PricewaterhouseCoopers LLP | | 300 Madison Avenue New York, NY 10017 |
| | |
| FUND COUNSEL | | Willkie Farr & Gallagher LLP | | 787 Seventh Avenue New York, NY 10019 |
|
| |
An investor should consider the investment objectives, risks, charges, and expenses of the Fund carefully before investing. The prospectus and summary prospectus contain this and other information about the Fund. An investor may obtain a prospectus and summary prospectus by visiting our website at pgim.com/investments or by calling (800) 225-1852. The prospectus and summary prospectus should be read carefully before investing. |
|
| |
E-DELIVERY To receive your mutual fund documents online, go to pgim.com/investments/resource/edelivery and enroll. Instead of receiving printed documents by mail, you will receive notification via email when new materials are available. You can cancel your enrollment or change your email address at any time by visiting the website address above. |
|
| |
SHAREHOLDER COMMUNICATIONS WITH DIRECTORS Shareholders can communicate directly with the Board of Directors by writing to the Chair of the Board, PGIM Government Money Market Fund, PGIM Investments, Attn: Board of Directors, 655 Broad Street, Newark, NJ 07102. Shareholders can communicate directly with an individual Director by writing to that Director at the same address. Communications to the Board or individual Directors are not screened before being delivered to the addressee. |
|
| |
AVAILABILITY OF PORTFOLIO HOLDINGS The Fund files a complete schedule of portfolio holdings with the Commission monthly on Form N-MFP. The Commission delays the public availability of the information filed on Form N-MFP for 60 days after the end of the reporting period included in the filing. The Form N-MFP filings (along with the Fund’s annual report and semi-annual report filed on Form N-CSR) are available on the Commission’s website at sec.gov. The Fund’s complete holdings are also available on pgim.com/investments. |
|
| |
The Fund’s Statement of Additional Information contains additional information about the Fund’s Directors and is available without Charge, upon request, by calling (800) 225-1852. |
Mutual Funds:
| | | | |
| | | |
ARE NOT INSURED BY THE FDIC OR ANY FEDERAL GOVERNMENT AGENCY | | MAY LOSE VALUE | | ARE NOT A DEPOSIT OF OR GUARANTEED BY ANY BANK OR ANY BANK AFFILIATE |

PGIM GOVERNMENT MONEY MARKET FUND - PURCHASE
| | | | | | |
| | | |
| SHARE CLASS | | A | | C | | Z |
| | | |
NASDAQ | | PBMXX | | N/A | | PMZXX |
| | | |
CUSIP | | 74440W409 | | N/A | | 74440W805 |
PGIM GOVERNMENT MONEY MARKET FUND - EXCHANGE
| | | | | | |
| | | |
| SHARE CLASS | | A | | C | | Z |
| | | |
NASDAQ | | MJAXX | | MJCXX | | PMZXX |
| | | |
CUSIP | | 74440W102 | | 74440W300 | | 74440W805 |
MF108E2
| Item 2 – | Code of Ethics – Not required, as this is not an annual filing. |
| Item 3 – | Audit Committee Financial Expert – Not required, as this is not an annual filing. |
| Item 4 – | Principal Accountant Fees and Services – Not required, as this is not an annual filing. |
| Item 5 – | Audit Committee of Listed Registrants – Not applicable. |
| Item 6 – | Schedule of Investments – The schedule is included as part of the report to shareholders filed under Item 1 of this Form. |
| Item 7 – | Disclosure of Proxy Voting Policies and Procedures for Closed-End Management Investment Companies – Not applicable. |
| Item 8 – | Portfolio Managers of Closed-End Management Investment Companies – Not applicable. |
| Item 9 – | Purchases of Equity Securities by Closed-End Management Investment Company and Affiliated Purchasers – Not applicable. |
| Item 10 – | Submission of Matters to a Vote of Security Holders – There have been no material changes to these procedures. |
| Item 11 – | Controls and Procedures |
| | (a) | It is the conclusion of the registrant’s principal executive officer and principal financial officer that the effectiveness of the registrant’s current disclosure controls and procedures (such disclosure controls and procedures having been evaluated within 90 days of the date of this filing) provide reasonable assurance that the information required to be disclosed by the registrant has been recorded, processed, summarized and reported within the time period specified in the Commission’s rules and forms and that the information required to be disclosed by the registrant has been accumulated and communicated to the registrant’s principal executive officer and principal financial officer in order to allow timely decisions regarding required disclosure. |
| | (b) | There has been no significant change in the registrant’s internal control over financial reporting (as defined in Rule 30a-3(d) under the Act (17 CFR 270.30a-3(d))) that occurred during the period covered by this report that has materially affected, or is reasonably likely to materially affect, the registrant’s internal control over financial reporting. |
| Item 12 – | Controls and Procedures - Disclosure of Securities Lending Activities for Closed-End |
Management Investment Companies – Not applicable.
SIGNATURES
Pursuant to the requirements of the Securities Exchange Act of 1934 and the Investment Company Act of 1940, the registrant has duly caused this report to be signed on its behalf by the undersigned, thereunto duly authorized.
| | | | |
| Registrant: | | | | Prudential Government Money Market Fund, Inc. |
| | |
| By: | | | | /s/ Andrew R. French Andrew R. French Secretary |
| | |
| Date: | | | | March 20, 2023 |
Pursuant to the requirements of the Securities Exchange Act of 1934 and the Investment Company Act of 1940, this report has been signed below by the following persons on behalf of the registrant and in the capacities and on the dates indicated.
| | | | |
| By: | | | | /s/ Stuart S. Parker |
| | | | Stuart S. Parker |
| | | | President and Principal Executive Officer |
| | |
| Date: | | | | March 20, 2023 |
| | |
| By: | | | | /s/ Christian J. Kelly |
| | | | Christian J. Kelly |
| | | | Chief Financial Officer (Principal Financial Officer) |
| | |
| Date: | | | | March 20, 2023 |