UNITED STATES
SECURITIES AND EXCHANGE COMMISSION
Washington, D.C. 20549
SCHEDULE 14A INFORMATION
Proxy Statement Pursuant to Section 14(a) of
the Securities Exchange Act of 1934
(Amendment No. )
Filed by the Registrant ý
Filed by a party other than the Registrant ¨
Check the appropriate box:
¨ Preliminary Proxy Statement
¨ Confidential, for Use of the Commission Only (as permitted by Rule 14a-6(e)(2))
ý Definitive Proxy Statement
¨ Definitive Additional Materials
¨ Soliciting Material under §240.14a-12
MDU Resources Group, Inc.
(Name of Registrant as Specified In Its Charter)
____________________________________________________________
(Name of Person(s) Filing Proxy Statement, if other than the Registrant)
Payment of Filing Fee (Check the appropriate box):
ý No fee required
¨ Fee computed on table below per Exchange Act Rules 14a-6(i)(1) and 0-11
| 1) | Title of each class of securities to which transaction applies: |
| 2) | Aggregate number of securities to which transaction applies: |
| 3) | Per unit price or other underlying value of transaction computed pursuant to Exchange Act Rule 0-11 (set forth the amount on which the filing fee is calculated and state how it was determined): |
| 4) | Proposed maximum aggregate value of transaction: |
| 5) | Total fee paid: |
| ¨ | Fee paid previously with preliminary materials |
| ¨ | Check box if any part of the fee is offset as provided by Exchange Act Rule 0-11(a)(2) and identify the filing for which the offsetting fee was paid previously. Identify the previous filing by registration statement number, or the Form or Schedule and the date of its filing. |
| 1) | Amount Previously Paid: |
| 2) | Form, Schedule or Registration Statement No.: |
| 3) | Filing Party: |
| 4) | Date Filed: |
| March 23, 2018 | |
Fellow Stockholders:
I invite you to join me, our Board of Directors and members of our senior management team at our annual stockholder meeting at 11 a.m., Central Daylight Saving Time, on May 8, 2018, at 909 Airport Road in Bismarck, North Dakota.
In addition to the business we will conduct at the meeting, I will describe the significant drivers of our strong 2017 financial results as well as the growth projects we have underway or soon to be started this year. Absent the benefit we recorded in 2017 from implementing the Tax Cuts and Jobs Act, which was signed into law December 22, our earnings were up about 5 percent over 2016. This shows the strength of our two-pillar approach to our operations, with strong performance from both our regulated energy delivery businesses and our construction materials and services businesses.
We remain committed to returning the value to you that you expect from your investment in MDU Resources. In 2017, we marked our 80th consecutive year of paying dividends to our stockholders and we increased our dividend payment for the 27th consecutive year, a feat achieved by fewer than 100 other U.S.-listed companies.
As we celebrate our 70th year of being listed on the New York Stock Exchange, we remain committed to Building a Strong America®. We hope you share in our excitement about the momentum we have going into 2018 and the substantial opportunities for growth at all of our businesses.
In our Proxy Statement this year, we have included additional summarized information about our environmental and social practices. If you would like greater detail about our sustainability efforts, please refer to our Sustainability Report on our website at www.mdu.com.
I look forward to seeing you May 8. Details on how to receive a ticket to attend our annual meeting are included on the Notice of Annual Meeting and page 61 of this Proxy Statement.
If you are not able to attend the annual stockholder meeting, your vote is still important to us. Please promptly follow the instructions on your notice or proxy card to vote and make sure your shares are represented.
We appreciate your continued investment in MDU Resources.
| Sincerely yours, | |
 | |
| David L. Goodin | |
| President and Chief Executive Officer | |
MDU Resources Group, Inc. Proxy Statement
Proxy Statement

1200 West Century Avenue
Mailing Address:
P.O. Box 5650
Bismarck, North Dakota 58506-5650
(701) 530-1000
P.O. Box 5650
Bismarck, North Dakota 58506-5650
(701) 530-1000
NOTICE OF ANNUAL MEETING OF STOCKHOLDERS TO BE HELD MAY 8, 2018 | ||||
March 23, 2018
NOTICE IS HEREBY GIVEN that the Annual Meeting of Stockholders of MDU Resources Group, Inc. will be held at 909 Airport Road, Bismarck, North Dakota, on Tuesday, May 8, 2018, at 11:00 a.m., Central Daylight Saving Time, for the following purposes:
Items of Business | 1. | Election of directors; |
| 2. | Advisory vote to approve the compensation paid to the company’s named executive officers; | |
| 3. | Ratification of the appointment of Deloitte & Touche LLP as the company’s independent registered public accounting firm for 2018; and | |
| 4. | Transaction of any other business that may properly come before the meeting or any adjournment(s) thereof. | |
| Record Date | The board of directors has set the close of business on March 9, 2018, as the record date for the determination of common stockholders who will be entitled to notice of, and to vote at, the meeting and any adjournment(s) thereof. | |
| Meeting Attendance | All stockholders as of the record date of March 9, 2018, are cordially invited and urged to attend the annual meeting. You must request an admission ticket in order to attend. If you are a stockholder of record and plan to attend the meeting, please contact MDU Resources Group, Inc. by email at CorporateSecretary@mduresources.com or by telephone at 701-530-1010 to request an admission ticket. A ticket will be sent to you by mail. If your shares are held beneficially in the name of a bank, broker, or other holder of record, and you plan to attend the annual meeting, you will need to submit a written request for an admission ticket by mail to: Investor Relations, MDU Resources Group, Inc., P.O. Box 5650, Bismarck, ND 58506 or by email at CorporateSecretary@mduresources.com. The request must include proof of stock ownership as of March 9, 2018, such as a bank or brokerage firm account statement or a legal proxy from the bank, broker, or other holder of record confirming ownership. A ticket will be sent to you by mail. Requests for admission tickets must be received no later than May 1, 2018. You must present your admission ticket and state-issued photo identification, such as a driver’s license, to gain admittance to the meeting. | |
Proxy Materials | Notice of Availability of Proxy Materials will be sent on or about March 23, 2018. The Notice contains basic information about the annual meeting and instructions on how to view our proxy materials and vote electronically on the Internet. Stockholders who do not receive the Notice will receive a paper copy of our proxy materials, which will be sent on or about March 29, 2018. | |
| By order of the Board of Directors, | ||
 | ||
| Daniel S. Kuntz Secretary | ||
Important Notice Regarding the Availability of Proxy Materials for the Stockholder Meeting to be Held on May 8, 2018. The 2018 Notice of Annual Meeting and Proxy Statement and 2017 Annual Report to Stockholders are available at www.mdu.com/proxymaterials. | ||
MDU Resources Group, Inc. Proxy Statement
Proxy Statement
| TABLE OF CONTENTS | |||||||
| Page | Page | ||||||
| EXECUTIVE COMPENSATION (continued) | |||||||
MDU Resources Group, Inc. Proxy Statement
Proxy Statement
| PROXY STATEMENT SUMMARY | ||
To assist you in reviewing the company’s 2017 performance and voting your shares, we call your attention to key elements of our 2018 Proxy Statement. The following is only a summary and does not contain all of the information you should consider. You should read the entire Proxy Statement carefully before voting. For more complete information about these topics, please review the complete Proxy Statement and our 2017 Annual Report to Stockholders.
| Meeting Information | Summary of Stockholder Voting Matters | ||||||||
| Board Vote Recommendation | |||||||||
| Time and Date: | Voting Matters | See Page | |||||||
11:00 a.m. Central Daylight Saving Time Tuesday, May 8, 2018 | Item 1 - | Election of Directors | FOR each nominee | ||||||
| Item 2 - | Advisory Vote to Approve the Compensation Paid to the Company’s Named Executive Officers | FOR | |||||||
| Place: | Item 3 - | Ratification of the Appointment of Deloitte & Touche LLP as the Company’s Independent Registered Public Accounting Firm for 2018 | FOR | ||||||
MDU Service Center 909 Airport Road Bismarck, ND | |||||||||
| Corporate Governance Highlights | ||||||||||||||||
MDU Resources Group, Inc. is committed to strong corporate governance practices. The following highlights our corporate governance practices and policies. See the sections entitled “Corporate Governance” and “Executive Compensation” for more information on the following: | ||||||||||||||||
| ü | Annual Election of All Directors | ü | All Three Standing Committees Consist Entirely of Independent Directors | |||||||||||||
| ü | Majority Voting for Directors | ü | Active Investor Outreach Program | |||||||||||||
| ü | Succession Planning and Implementation Process | ü | Stock Ownership Requirements for Directors and Executives | |||||||||||||
| ü | Separate Chair and CEO | ü | Anti-Hedging and Anti-Pledging Policies | |||||||||||||
| ü | Executive Sessions of Independent Directors at Every Regularly Scheduled Board Meeting | ü | No Related Party Transactions by Our Directors or Executive Officers | |||||||||||||
| ü | Annual Board and Committee Self-Evaluations | ü | Compensation Recovery/Clawback Policy | |||||||||||||
| ü | Risk Oversight by Full Board and Committees | ü | Code of Business Conduct and Ethics for Directors, Officers, and Employees | |||||||||||||
| ü | All Directors are Independent Other Than Our CEO | ü | Annual Advisory Approval on Executive Compensation | |||||||||||||
| ü | Mandatory Retirement for Directors at Age 76 | ü | Directors May Not Serve on More Than Three Public Boards Including the Company’s Board | |||||||||||||
MDU Resources Group, Inc. Proxy Statement 1
Proxy Statement
| Business Performance Highlights | ||||||
| Our overall performance in 2017 was consistent with our long-term strategy as we focused on our regulated energy delivery and construction materials and services business segments. In addition to our 2017 financial performance highlighted on the next page, we accomplished: | ||||||
| ■ | The sale of our interest in the Pronghorn natural gas processing plant in January 2017 which reduced the company’s risk by decreasing its exposure to commodity price fluctuations. | |||||
| ■ | Our construction services segment had record revenues of $1.37 billion and its backlog at December 31, 2017 was $708 million, 49% higher than 2016. | |||||
| ■ | Our construction materials and contracting segment had higher aggregate sales volumes on strong commercial and residential demand in certain regions. Its backlog at year-end of $486 million, while lower than 2016, is the third largest year-end level for this segment. The segment continues to strategically manage its nearly 1.0 billion tons of aggregate reserves. | |||||
| ■ | We received advance determination of prudence from the North Dakota Public Service Commission to purchase an expansion of the Thunder Spirit wind farm. | |||||
| ■ | The pipeline and midstream segment had record transportation volumes in 2017. | |||||
| ■ | Our pipeline and midstream segment secured sufficient capacity commitments to expand its Line Section 27 natural gas transportation system in the Bakken producing area of northwestern North Dakota. The project will involve the construction of approximately 13 miles of pipeline and associated facilities. The expansion will provide WBI Energy, Inc.’s Line Section 27 pipeline with capacity for over 600,000 dekatherms per day. The targeted in-service date for the project is fall 2018. | |||||
| ■ | Our pipeline and midstream segment continued permitting, surveying, and acquisition activity for a 38-mile natural gas transmission pipeline to deliver natural gas to eastern North Dakota and far western Minnesota. Following receipt of necessary regulatory approvals and easement acquisition, construction is expected to start and be completed in 2018. | |||||
| ■ | The board of directors authorized management to evaluate and pursue a holding company reorganization which is intended to provide further separation between the company’s regulated and unregulated businesses and additional financing flexibility as all of the company’s utility operations will be conducted through wholly-owned subsidiaries. The reorganization, which is expected to be effective January 1, 2019, is subject to approval by the Federal Energy Regulatory Commission and various state regulatory commissions. | |||||
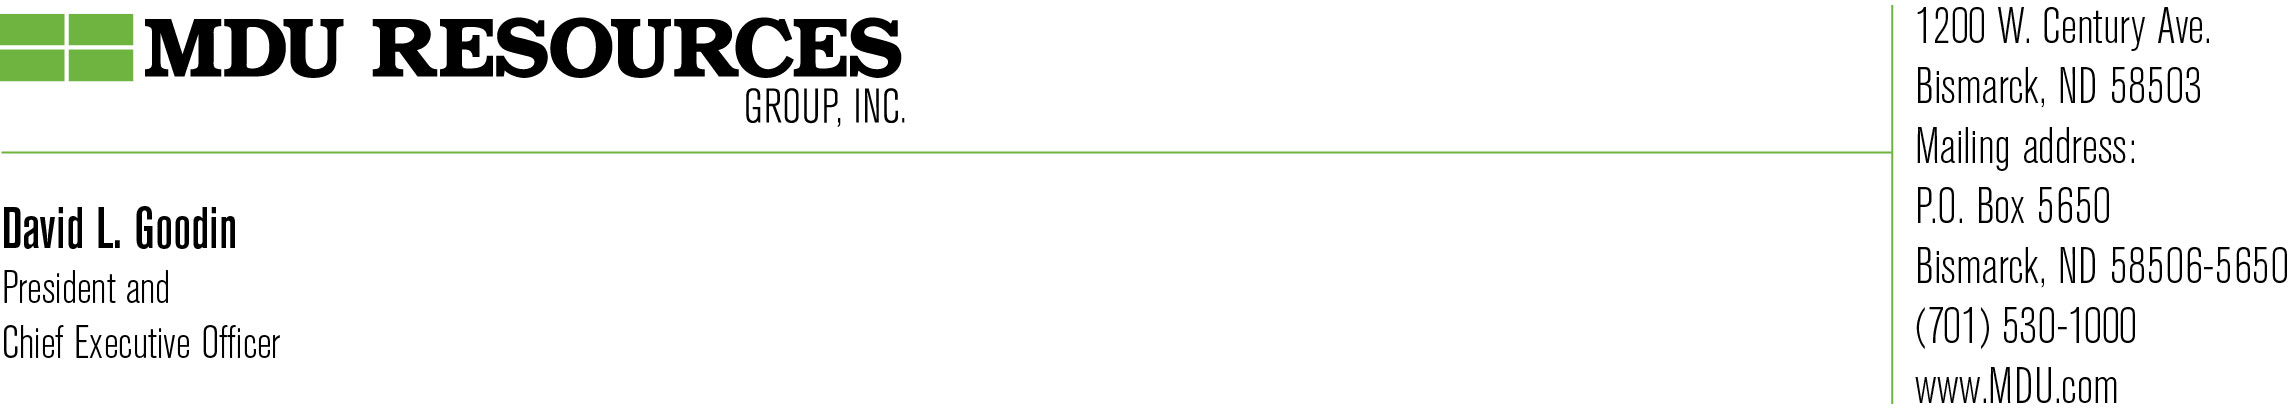
| With our accomplishments in 2017, we are optimistic about the company’s future financial performance. The chart below shows our progress over the last five years. | ||||||
* MDU Resources Group, Inc. reported 2017 earnings from continuing operations of $1.45 per share which included a benefit of 20 cents per share attributable to the federal Tax Cuts and Jobs Act, which was signed into law December 22, 2017. The earnings per share absent the federal Tax Cuts and Jobs Act benefit is $1.25. |
2 MDU Resources Group, Inc. Proxy Statement
Proxy Statement
| 2017 Financial Performance Highlights | |||||||
| ■ | Strong year-over-year performance from continuing operations, as well as benefits from the federal Tax Cuts and Jobs Act, resulted in an increase in earnings per share from continuing operations to $1.45 per share compared to $1.19 per share in 2016. Excluding the effect of the federal Tax Cuts and Jobs Act, earnings from continuing operations were $1.25 per share. Including discontinued operations, 2017 earnings were $280.4 million, or $1.43 per share, compared to $63.7 million, or 33 cents per share, in 2016. | ||||||
| ¨ | Electric and natural gas distribution segments earned $81.6 million, an increase of 17.8%. | ||||||
| ¨ | Pipeline and midstream segment earned $20.5 million, a decrease of $2.9 million reflecting the sale of the Pronghorn natural gas processing plant in January 2017. | ||||||
| ¨ | Construction materials and contracting segment earned $123.4 million, including adjustments of $41.9 million as a result of the federal Tax Cuts and Jobs Act, compared to 2016 earnings of $102.7 million. | ||||||
| ¨ | Construction services segment earned $53.3 million, including adjustments of $4.3 million as a result of the federal Tax Cuts and Jobs Act, an increase of 44.3% over 2016 earnings of $33.9 million. | ||||||
| ■ | Return of stockholder value through the dividend | ||||||
| ¨ | Increased dividend for 27th straight year | ||||||
| ¨ | Paid uninterrupted dividend for 80th straight year | ||||||
| ■ | Maintained BBB+ stable credit rating from Standard & Poor’s and Fitch Ratings agencies. | ||||||
| 27 Years | Dividends Paid | 80 Years | ||
| of Consecutive | $716 Million | of Uninterrupted | ||
| Dividend Increases | Over the Last 5 Years | Dividend Payments | ||
MDU Resources Group, Inc. Proxy Statement 3
Proxy Statement
| Compensation Highlights | |||||
| Executive compensation at the company is focused on performance. Our compensation program is structured to strongly align compensation with the company’s performance with a substantial portion of our executive compensation based upon performance incentive awards. | |||||
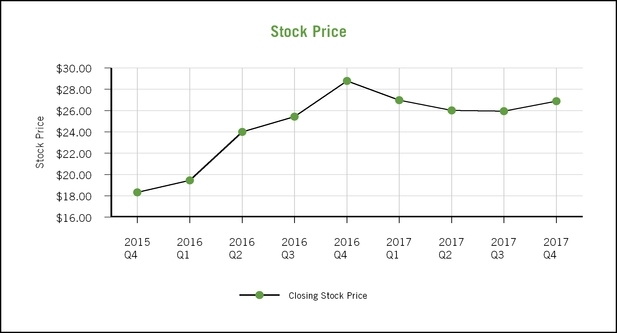
| ■ | Over 75% of our chief executive officer’s target compensation and over 60% of our other current named executive officers’ target compensation is performance based. | ||||
| ■ | 100% of our chief executive officer’s annual and long-term incentive compensation is tied to performance against pre-established, specific, measurable financial goals. | ||||
| ■ | We require all executive officers to own a significant amount of company stock based upon a multiple of their base salary. | ||||
2017 Named Executive Officer Target Pay Mix

| ■ | Base salary increase for our chief executive officer was 5% for 2017, and base salary increases for all of our other named executive officers averaged 7.8% in 2017 following base salary freezes for most executive officers in 2016. | |||
| ■ | Annual incentive award payout to our chief executive officer for 2017, which was based upon the strong performance at all four of our business units, was 173.7% of his annual incentive target. | |||
| ■ | Long-term incentive award payout for the 2015-2017 performance cycle was 144% of target based on a combined 61st percentile ranking of total stockholder return among our peer groups. | |||
4 MDU Resources Group, Inc. Proxy Statement
Proxy Statement
Key Features of our Executive Compensation Program
| What We Do | |
| þ | Pay for Performance - Annual and long-term award incentives tied to performance measures set by the compensation committee comprise the largest portion of executive compensation. |
| þ | Independent Compensation Committee - All members of the compensation committee meet the independence standards under the New York Stock Exchange listing standards and the Securities and Exchange Commission rules. |
| þ | Independent Compensation Consultant - The compensation committee retains an independent compensation consultant to evaluate executive compensation plans and practices. |
| þ | Competitive Compensation - Executive compensation reflects the executive’s performance, experience, relative value compared to other positions within the company, relationship to competitive market value compensation, the business segment’s economic environment, and the actual performance of the overall company or the executive’s business segment. |
| þ | Annual Cash Incentive - Payment of annual cash incentive awards are based on business segment and overall company achievement against pre-established financial measures. |
| þ | Long-Term Equity Incentive - The long-term equity incentive represents 53% of our CEO’s and approximately 33% of our other current named executive officer’s target compensation in the form of performance shares which may be earned based on relative total stockholder return measured over a three-year period. |
| þ | Annual Compensation Risk Analysis - We regularly analyze the risks related to our compensation programs and conduct an annual broad risk assessment. |
| þ | Stock Ownership and Retention Requirements - Executive officers are required to own, within five years of appointment or promotion, company common stock equal to a multiple of their base salary. The executive officers must also retain at least 50% of the net after tax shares of stock vested through the long-term incentive plan for the earlier of two years or until termination of employment. |
| þ | Clawback Policy - If the company’s audited financial statements are restated, the compensation committee may, or shall if required, demand repayment of some or all incentives paid to our executive officers within the last three years. |
| þ | Performance Share Awards Purchased at Market - Performance share awards are purchased on the market to avoid shareholder dilution through issuance of authorized but unissued shares. |
| What We Don’t Do | |
| ý | Stock Options - The company does not use stock options as a form of incentive compensation. |
| ý | Employment Agreements - Current executives do not have employment agreements entitling them to specific payments upon a change of control of the company. |
| ý | Perquisites - Executives do not receive perquisites which materially differ from those available to employees in general. |
| ý | Tax Gross-Ups - Executive officers do not receive tax gross-ups on any compensation. |
| ý | Hedge Stock - Executives and directors are not allowed to hedge company securities. |
| ý | Pledge Stock - Executives and directors are not allowed to pledge company securities in margin accounts or as collateral for loans. |
| ý | No Dividends or Dividend Equivalents on Unvested Shares - We do not provide for payment of dividends or dividend equivalents on unvested share awards. |
MDU Resources Group, Inc. Proxy Statement 5
Proxy Statement
| Corporate Responsibility, Environmental, and Sustainability | ||||||
MDU Resources Group, Inc. is Building a Strong America® by providing essential products and services to our customers. To ensure we can continue to provide these products and services in the communities where we do business, we recognize that we must preserve the trust our communities place in us to be a good corporate citizen. We remain committed to pursuing responsible corporate governance and environmental practices, and to maintaining the health and safety of the public and our employees. These are some highlights of our recent efforts regarding sustainability: | ||||||
| ■ | As our generation resource capacity has increased, the CO2 emission intensity of our electric generation resource fleet has been reduced by more than 25% since 2003. We expect it to continue to decline. | |||||
CO2 Emission Intensity
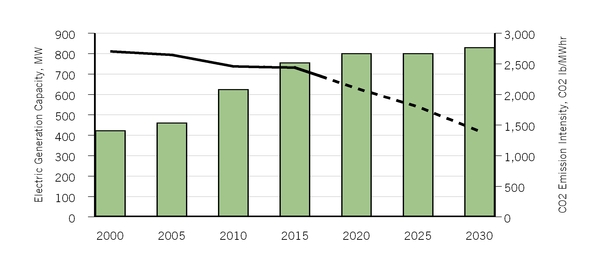
Actual CO2 lb/MWhr | |||||||||
Projected CO2 lb/MWhr | |||||||||
| Total Owned and Projected Electric Generation Capacity | |||||||||
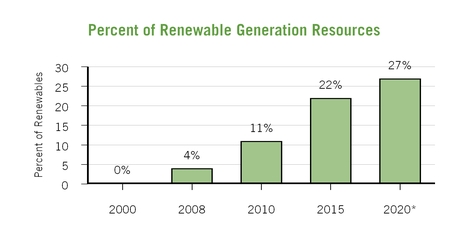
| ■ | Renewable resources comprised approximately 22% of our electric generation resource nameplate capacity in 2017. |
| ■ | We received advance determination of prudence for the expansion of the Thunder Spirit wind farm to be completed in 2018. The expansion will bring capacity of the Thunder Spirit wind farm to approximately 155 megawatts which will increase the company’s nameplate electric renewable generation capacity to approximately 27%. |
* Projected based upon expansion of the Thunder Spirit wind farm.
6 MDU Resources Group, Inc. Proxy Statement
Proxy Statement
| ■ | Approximately 24% of the electricity delivered to our customers from company-owned generation in 2017 was from renewable resources. | |||||
| ■ | We invested approximately $3.7 million in environmental emission control equipment and improvements at our coal-fired electric generation plants bringing the total of such investments to approximately $125 million since 2013. The investments have resulted in substantial reductions in mercury, SO2, NOX, and filterable particulate from our coal-fired electric generation resources. | |||||
| ■ | The company’s utility companies received high scores in customer satisfaction. Intermountain Gas Company ranked first, Cascade Natural Gas Corporation second, and Montana-Dakota Utilities Co. fourth, among West Region mid-sized natural gas utilities in the 2017 J.D. Power Gas Utility Residential Customer Satisfaction Survey. | |||||
| ■ | We were recognized on the Thomson Reuters 2017 Top 25 Global Multiline Utilities list. The list recognizes companies that have demonstrated a commitment to energy leadership in these areas: financial, management and investor confidence, risk and resilience, legal compliance, innovation, people and social sustainability, environmental impact, and reputation. | |||||
| ■ | We, along with a partner, continued construction of approximately 160 miles of 345-kilowatt electric transmission line which will facilitate delivery of renewable wind energy from North Dakota to eastern markets. | |||||
| ■ | Montana-Dakota Utilities Co. received approval to expand its Commercial Demand Response Program which will enable further reduction of peak electric demand of approximately 25 megawatts by our commercial and industrial customers. | |||||
| ■ | Knife River Corporation produces and places warm-mix asphalt in applications where warm-mix asphalt is allowed. Warm-mix asphalt is produced at cooler temperatures than traditional hot-mix asphalt methods, which reduces the amount of fuel needed in the production process and thereby reduces emissions and fumes. Knife River Corporation produced over 653,000 tons in 2014, 640,000 tons in 2015, 831,000 tons in 2016, and 722,000 tons in 2017 of warm-mix asphalt. | |||||
| ■ | Knife River Corporation continued its practice of recycling and reusing building materials. This conserves natural resources, uses less energy, alleviates waste disposal problems in local landfills, and ultimately costs less for the consumer. Knife River Corporation used over 697,000 tons in 2014, 989,000 tons in 2015, 1,030,000 tons in 2016, and 1,096,000 tons in 2017 of recycled asphalt pavement in asphalt production. | |||||
| ■ | Our subsidiary, Bombard Renewable Energy, was ranked No. 26 on Solar Power World’s 2017 Top 500 Solar Contractors List. The list ranks companies according to their influence in the U.S. solar industry based on how many kilowatts of solar generation they installed in 2016. | |||||
| ■ | The MDU Resources Foundation awarded grants of $1.84 million to educational and nonprofit institutions in 2017. Since its incorporation in 1983, the Foundation has contributed more than $32.4 million to worthwhile causes in categories of education, civic and community activities, culture and arts, environmental stewardship, and health and human services. | |||||
| ■ | We encourage and support community volunteerism by our employees. The MDU Resources Foundation contributes a $500 grant to an eligible nonprofit organization after an employee volunteers a minimum of 25 hours to the organization during non-company hours during a calendar year. In 2017, the Foundation granted $47,200 under this program matching over 5,400 employee volunteer hours. | |||||
| ■ | We were recognized as a 2020 Women on Boards Winning “W” Company for being a champion on board diversity by having 20% or more of our board seats held by women. | |||||
| ■ | We received the Missouri Slope Areawide United Way 2017 Spirit Award for showing outstanding commitment to the Bismarck-Mandan community through volunteerism and creative workplace campaigns. | |||||
| 24% | Grants Awarded | 25% | ||
| of Electricity Generated | $1.84 Million | Reduction in CO2 | ||
| from Renewable Resources | in 2017 | Since 2003 | ||
MDU Resources Group, Inc. Proxy Statement 7
Proxy Statement
| BOARD OF DIRECTORS | ||
ITEM 1. ELECTION OF DIRECTORS
The nominating and governance committee of the board, reflecting the criteria for election to the board, identifies and reviews possible candidates for the board and recommends the nominees for directors to the board for approval. The committee considers and evaluates suggestions from many sources, including stockholders, regarding possible candidates for directors. Additional information on our board composition and director nomination process is further discussed in our Proxy Statement under “Nominating and Governance Committee” in the section entitled “Corporate Governance.”
Each of the current directors has been nominated for election by the board of directors upon recommendation of the nominating and governance committee and has decided to stand for election, with the exception of A. Bart Holaday who will have attained the mandatory retirement age of 76 years at the time of the annual meeting of stockholders and, therefore, will not stand for re-election. Mr. Holaday has served on the board since 2008, and the company expresses its thanks to Mr. Holaday for his service on the board, the audit committee, and nominating and governance committee. All nominees for director are nominated to serve one-year terms until the annual meeting of stockholders in 2019 and their respective successors are elected and qualified, or until their earlier resignation, removal from office, or death.
We have provided information below about our nominees, including their ages, years of service as directors, business experience, and service on other boards of directors, including any other directorships on boards of public companies. We have also included information about each nominee’s specific experience, qualifications, attributes, or skills that led the board to conclude that he or she should serve as a director of MDU Resources Group, Inc. at the time we file our Proxy Statement, in light of our business and structure. Unless we specifically note below, no corporation or organization referred to below is a subsidiary or other affiliate of MDU Resources Group, Inc.
Director Nominees
 | Thomas Everist Age 68 | Independent Director Since 1995 Compensation Committee | Other Current Public Boards: --Raven Industries, Inc. | |
| Mr. Everist has more than 44 years of business experience in the construction materials and aggregate mining industry. He has business leadership and management experience serving as president and chair of his companies for over 30 years. Mr. Everist also has experience serving as a director and chair of another public company, which enhances his contributions to our board. | ||||
| Career Highlights | ||||
| • | President and chair of The Everist Company, Sioux Falls, South Dakota, an investment and land development company, since April 2002. Prior to January 2017, The Everist Company was engaged in aggregate, concrete, and asphalt production. | |||
| • | Managing member of South Maryland Creek Ranch, LLC, a land development company; president of SMCR, Inc., an investment company, since June 2006; and managing member of MCR Builders, LLC, which provides residential building services to South Maryland Creek Ranch, LLC, since November 2014. | |||
| • | Director and chair of the board of Everist Health, Inc., Ann Arbor, Michigan, which provides solutions for personalized medicines, since 2002, and chief executive officer from August 2012 to December 2012. | |||
| • | President and chair of L.G. Everist, Inc., Sioux Falls, South Dakota, an aggregate production company, from 1987 to April 2002. | |||
| Other Leadership Experience | ||||
| • | Director of publicly traded Raven Industries, Inc., Sioux Falls, South Dakota, a general manufacturer of electronics, flow controls, and engineered films, since 1996, and chair from April 2009 to May 2017. | |||
| • | Director of Showplace Wood Products, Inc., Sioux Falls, South Dakota, a custom cabinets manufacturer, since January 2000. | |||
| • | Director of Bell, Inc., Sioux Falls, South Dakota, a manufacturer of folding cartons and packages, since April 2011. | |||
| • | Director of Angiologix Inc., Mountain View, California, a medical diagnostic device company, from July 2010 through October 2011 when it was acquired by Everist Genomics, Inc. | |||
| • | Member of the South Dakota Investment Council, the state agency responsible for prudently investing state funds, from July 2001 to June 2006. | |||
| Education | ||||
| • | Bachelor’s degree in mechanical engineering and a master’s degree in construction management from Stanford University. | |||
8 MDU Resources Group, Inc. Proxy Statement
Proxy Statement
 | Karen B. Fagg Age 64 | Independent Director Since 2005 Compensation Committee Nominating and Governance Committee | |
| Ms. Fagg brings experience to our board in construction and engineering, energy, and the responsible development of natural resources, which are all important aspects of our business. In addition to her industry experience, Ms. Fagg has over 20 years of business leadership and management experience, including over eight years as president, chief executive officer, and chair of her own company, as well as knowledge and experience acquired through her service on a number of Montana state and community boards. | |||
| Career Highlights | |||
| • | Vice president of DOWL LLC, d/b/a DOWL HKM, an engineering and design firm, from April 2008 until her retirement on December 31, 2011. | ||
| • | President of HKM Engineering, Inc., Billings, Montana, an engineering and physical science services firm, from April 1, 1995 to June 2000, and chair, chief executive officer, and majority owner from June 2000 through March 2008. HKM Engineering, Inc. merged with DOWL LLC on April 1, 2008. | ||
| • | Employed with MSE, Inc., Butte, Montana, an energy research and development company, from 1976 through 1988, and vice president of operations and corporate development director from 1993 to April 1995. | ||
| • | Director of the Montana Department of Natural Resources and Conservation, Helena, Montana, the state agency charged with promoting stewardship of Montana’s water, soil, energy, and rangeland resources; regulating oil and gas exploration and production; and administering several grant and loan programs, for a four-year term from 1989 through 1992. | ||
| Other Leadership Experience | |||
| • | Chair of the Billings Catholic Schools Board since September 2017 and member since December 2011; and board member of St. Vincent’s Healthcare since January 2016 and previously from October 2003 until October 2009, including a term as chair. | ||
| • | Former member of several state and community boards, including the First Interstate BancSystem Foundation, from June 2013 to 2016; the Montana Justice Foundation, whose mission is to achieve equal access to justice for all Montanans through effective funding and leadership, from 2013 into 2015; Board of Trustees of Carroll College from 2005 through 2010; Montana Board of Investments, the state agency responsible for prudently investing state funds, from 2002 through 2006; Montana State University’s Advanced Technology Park from 2001 to 2005; and Deaconess Billings Clinic Health System from 1994 to 2002. | ||
| Education | |||
| • | Bachelor’s degree in mathematics from Carroll College in Helena, Montana. | ||
 | David L. Goodin Age 56 | Director Since 2013 President and Chief Executive Officer | |
| As chief executive officer of MDU Resources Group, Inc., Mr. Goodin is the only officer of the company that serves on our board. With over 34 years of significant, hands-on experience at our company, Mr. Goodin’s long history and deep knowledge and understanding of MDU Resources Group, Inc., its operating companies, and its lines of business bring continuity to the board. In addition, Mr. Goodin provides the board with valuable insight into management’s views and perspectives, as well as the day-to-day operations of the company. | |||
| Career Highlights | |||
| • | President and chief executive officer and a director of the company since January 4, 2013. | ||
| • | Prior to January 4, 2013, served as chief executive officer and president of Intermountain Gas Company, Cascade Natural Gas Corporation, Montana-Dakota Utilities Co., and Great Plains Natural Gas Co. | ||
| • | Began his career in 1983 at Montana-Dakota Utilities Co. as a division electrical engineer and served in positions of increasing responsibility until 2007 when he was named president of Cascade Natural Gas Corporation; positions included division electric superintendent, electric systems manager, vice president-operations, and executive vice president-operations and acquisitions. | ||
| Other Leadership Experience | |||
| • | Member of the U.S. Bancorp Western North Dakota Advisory Board since January 2013. | ||
| • | Director of Sanford Bismarck, an integrated health system dedicated to the work of health and healing, and Sanford Living Center, since January 2011. | ||
| • | Former board member of several industry associations, including the American Gas Association, the Edison Electric Institute, the North Central Electric Association, the Midwest ENERGY Association, and the North Dakota Lignite Energy Council. | ||
| Education | |||
| • | Bachelor of science degree in electrical and electronics engineering from North Dakota State University. | ||
| • | Masters in business administration from the University of North Dakota. | ||
| • | The Advanced Management Program at Harvard School of Business. | ||
| • | Registered professional engineer in North Dakota. | ||
MDU Resources Group, Inc. Proxy Statement 9
Proxy Statement
 | Mark A. Hellerstein Age 65 | Independent Director Since 2013 Audit Committee | |
| Mr. Hellerstein has extensive business experience in the energy industry as a result of his 17 years of senior management experience and service as board chair of St. Mary Land & Exploration Company (now SM Energy Company). As a certified public accountant, on inactive status, with extensive financial experience as a result of his employment as chief financial officer with several companies, including public companies, Mr. Hellerstein contributes significant finance and accounting knowledge to our board and audit committee. | |||
| Career Highlights | |||
| • | Chief executive officer of St. Mary Land & Exploration Company (now SM Energy Company), an energy company engaged in the acquisition, exploration, development, and production of crude oil, natural gas, and natural gas liquids, from 1995 until February 2007; president from 1992 until June 2006; and executive vice president and chief financial officer from 1991 until 1992. He was first elected to the board of St. Mary in 1992 and served as chair from 2002 until May 2009. | ||
| • | Several positions prior to joining St. Mary in 1991, including chief financial officer of CoCa Mines Inc., which mined and extracted minerals from lands previously held by the public through the Bureau of Land Management; American Golf Corporation, which manages and owns golf courses in the United States; and Worldwide Energy Corporation, an oil and gas acquisition, exploration, development, and production company with operations in the United States and Canada. | ||
| Other Leadership Experience | |||
| • | Director of Transocean Inc., a leading provider of offshore drilling services for oil and gas wells, from December 2006 to November 2007. | ||
| • | Director of the Denver Children’s Advocacy Center, whose mission is to provide a continuum of care for traumatized children and their families, from August 2006 until December 2011, including chair for the last three years. | ||
| Education and Professional | |||
| • | Bachelor’s degree in accounting from the University of Colorado. | ||
| • | Certified public accountant, on inactive status. | ||
 | Dennis W. Johnson Age 68 | Independent Director Since 2001 Vice Chair of the Board Audit Committee | |
| Mr. Johnson brings to our board over 43 years of experience in business management, manufacturing, and finance, holding positions as chair, president, and chief executive officer of TMI Corporation for 36 years, as well as through his prior service as a director of the Federal Reserve Bank of Minneapolis. As a result of his service on a number of state and local organizations in North Dakota, Mr. Johnson has significant knowledge of local, state, and regional issues involving North Dakota, a state where we have significant operations and assets. | |||
| Career Highlights | |||
| • | Vice chair of the board of the company effective February 15, 2018. | ||
| • | Chair, president, and chief executive officer of TMI Corporation, and chair and chief executive officer of TMI Transport Corporation, manufacturers of casework and architectural woodwork in Dickinson, North Dakota; employed since 1974 and serving as president or chief executive officer since 1982. | ||
| Other Leadership Experience | |||
| • | Member of the Bank of North Dakota Advisory Board of Directors since August 2017. | ||
| • | President of the Dickinson City Commission from July 2000 through October 2015. | ||
| • | Director of the Federal Reserve Bank of Minneapolis from 1993 through 1998. | ||
| • | Served on numerous industry, state, and community boards, including the North Dakota Workforce Development Council (chair); the Decorative Laminate Products Association; the North Dakota Technology Corporation; and the business advisory council of the Steffes Corporation, a metal manufacturing and engineering firm. | ||
| • | Served on North Dakota Governor Sinner’s Education Action Commission; the North Dakota Job Service Advisory Council; the North Dakota State University President’s Advisory Council; North Dakota Governor Schafer’s Transition Team; and chaired North Dakota Governor Hoeven’s Transition Team. | ||
| Education | |||
| • | Bachelor of science in electrical and electronics engineering and master of science in industrial engineering from North Dakota State University. | ||
10 MDU Resources Group, Inc. Proxy Statement
Proxy Statement
 | William E. McCracken Age 75 | Independent Director Since 2013 Compensation Committee Nominating and Governance Committee | |
| Mr. McCracken is experienced in information technology and cybersecurity through his tenure at CA, Inc. and International Business Machines Corporation (IBM). This experience coupled with his service as the chair or a member of the board of other public companies and the National Association of Corporate Directors (NACD) enables him to provide insight into the operations, challenges, and complex issues our company is facing in today’s environment and to make significant contributions to the board’s oversight of operational risk management functions and corporate governance. | |||
| Career Highlights | |||
| • | President of Executive Consulting Group, LLC, a general business consulting firm, from 2002 to present. | ||
| • | Chief executive officer of CA, Inc., one of the world’s largest information technology management software companies, from January 2010 until January 7, 2013, after which he served as executive adviser to the new chief executive officer until March 31, 2013, and as a consultant to the company until December 31, 2013; also as director of CA, Inc. from May 2005 until January 7, 2013, serving as non-executive chair of the board from June 2007 to September 2009, interim executive chair from September 2009 to January 2010, and executive chair from January 2010 to May 2010. | ||
| • | Several executive positions during his 36-year career with IBM, including serving on its Chairman’s Worldwide Management Council, a group of the top 30 executives at IBM, from 1995 to 2001. | ||
| Other Leadership Experience | |||
| • | Director of the NACD, a nonprofit membership organization for corporate board members, since 2010, and named by the NACD as one of the top 100 most influential people in the boardroom in 2009; served on that organization’s 2009 Blue Ribbon Commission (BRC) on risk governance, co-chaired its 2012 BRC on board diversity, and co-chaired its 2015 BRC on board and long-term value creation. | ||
| • | Director of IKON Office Solutions, Inc., a provider of document management systems and services, from 2003 to 2008, where he served on its audit committee, compensation committee, and strategy committee. | ||
| • | Chair of the advisory board of the Millstein Center for Global Markets and Corporate Ownership at Columbia University from 2014 to 2018 and member since 2013, and the New York chairman of the Chairmen’s Forum since 2011. | ||
| Education | |||
| • | Bachelor of science in physics and mathematics from Shippensburg University. | ||
 | Patricia L. Moss Age 64 | Independent Director Since 2003 Compensation Committee Nominating and Governance Committee | Other Current Public Boards: --First Interstate BancSystem, Inc. --Aquila Tax Free Trust of Oregon | |
| Ms. Moss has business experience and knowledge of the Pacific Northwest economy and state, local, and regional issues where a significant portion of our operations are located. Ms. Moss provides our board with experience in finance and banking, as well as experience in business development through her work at Cascade Bancorp and Bank of the Cascades, and on the Oregon Investment Fund Advisory Council, the Oregon Business Council, and the Oregon Growth Board. Ms. Moss also has experience as a certified senior professional in human resources. | ||||
| Career Highlights | ||||
| • | President and chief executive officer of Cascade Bancorp, a financial holding company, Bend, Oregon, from 1998 to January 3, 2012; chief executive officer of Cascade Bancorp’s principal subsidiary, Bank of the Cascades, from 1998 to January 3, 2012, serving also as president from 1998 to 2003; and chief operating officer, chief financial officer and secretary of Cascade Bancorp from 1987 to 1998. | |||
| Other Leadership Experience | ||||
| • | Director of First Interstate BancSystem, Inc., since May 30, 2017. | |||
| • | Director of Cascade Bancorp and Bank of the Cascades from 1993, and vice chair from January 3, 2012 until May 30, 2017 when Cascade Bancorp merged into First Interstate BancSystem, Inc., and became First Interstate Bank. | |||
| • | Chair of the Bank of the Cascades Foundation Inc. since 2014; co-chair of the Oregon Growth Board, a state board created to improve access to capital and create private-public partnerships, since May 2012; and member of the Board of Trustees for the Aquila Tax Free Trust of Oregon, a mutual fund created especially for the benefit of Oregon residents, since June 2015 and January 2002 to May 2005. | |||
| • | Former director of the Oregon Investment Fund Advisory Council, a state-sponsored program to encourage the growth of small businesses in Oregon; the Oregon Business Council, with a mission to mobilize business leaders to contribute to Oregon’s quality of life and economic prosperity; the North Pacific Group, Inc., a wholesale distributor of building materials, industrial, and hardwood products; Clear Choice Health Plans Inc., a multi-state insurance company; and City of Bend’s Juniper Ridge management advisory board. | |||
| Education | ||||
| • | Bachelor of science in business administration from Linfield College in Oregon and master’s studies at Portland State University. | |||
| • | Commercial banking school certification at the ABA Commercial Banking School at the University of Oklahoma. | |||
MDU Resources Group, Inc. Proxy Statement 11
Proxy Statement
 | Harry J. Pearce Age 75 | Independent Director Since 1997 Chair of the Board | |
| Mr. Pearce provides our board with public company leadership with his multinational business management experience and proven leadership skills through his position as vice chair at General Motors Corporation, as well as through his extensive service on the boards of large public companies, including Marriott International, Inc., Hughes Electronics Corporation, where he was chair, and Nortel Networks Corporation, where he also was chair. He also brings to our board his long experience as a practicing attorney. In addition, Mr. Pearce has focused on corporate governance issues and was the founding chair of Yale University’s Chairmen’s Forum, an organization comprised of non-executive chairmen of publicly traded companies. | |||
| Career Highlights | |||
| • | Chair of the board of the company effective August 17, 2006; lead director from February 15, 2001 until August 17, 2006; and vice chair of the board from November 16, 2000 until February 15, 2001. | ||
| • | Vice chair and director of General Motors Corporation from January 1, 1996 to May 31, 2001; general counsel from 1987 to 1994. | ||
| • | Senior partner in the Pearce & Durick law firm in Bismarck, North Dakota, prior to joining General Motors in 1987. | ||
| Other Leadership Experience | |||
| • | Director of Hughes Electronics Corporation, a General Motors Corporation subsidiary and provider of digital television entertainment, broadband satellite network, and global video and data broadcasting, from 1992 to December 2003, and retiring as chair in 2003. | ||
| • | Director of Marriott International, Inc., a major hotel chain, from 1995 to May 2015, and served on the audit, finance, compensation, and excellence committees. | ||
| • | Director of Nortel Networks Corporation, a global telecommunications company, from January 2005 to August 2009, also served as chair of the board from June 2005. | ||
| • | Fellow of the American College of Trial Lawyers, and member of the International Society of Barristers. | ||
| • | Founding chair of the Yale University’s Chairmen’s Forum; former member of the President’s Council on Sustainable Development; and co-chair of the President’s Commission on the United States Postal Service. | ||
| Education | |||
| • | Bachelor’s degree in engineering sciences from the U.S. Air Force Academy. | ||
| • | Juris doctor degree from Northwestern University’s School of Law. | ||
 | John K. Wilson Age 63 | Independent Director Since 2003 Audit Committee | |
| Mr. Wilson has an extensive background in finance and accounting, as well as experience with mergers and acquisitions, through his education and work experience at a major accounting firm and his later public utility experience in his positions as controller and vice president of Great Plains Natural Gas Co., president of Great Plains Energy Corp., and president, chief financial officer, and treasurer for Durham Resources, LLC, and all Durham Resources entities. | |||
| Career Highlights | |||
| • | President of Durham Resources, LLC, a privately held financial management company, in Omaha, Nebraska, from 1994 to December 31, 2008; president of Great Plains Energy Corp., a public utility holding company and an affiliate of Durham Resources, LLC, from 1994 to July 1, 2000; and vice president of Great Plains Natural Gas Co., an affiliate company of Durham Resources, LLC, until July 1, 2000. | ||
| • | Executive director of the Robert B. Daugherty Foundation in Omaha, Nebraska, since January 2010. | ||
| • | Held positions of audit manager at Peat, Marwick, Mitchell (now known as KPMG), controller for Great Plains Natural Gas Co., and chief financial officer and treasurer for all Durham Resources entities. | ||
| Other Leadership Experience | |||
| • | Director of HDR, Inc., an international architecture and engineering firm, since December 2008; and director of Tetrad Corporation, a privately held investment company, since April 2010, both located in Omaha, Nebraska. | ||
| • | Former director of Bridges Investment Fund, Inc., a mutual fund, from April 2003 to April 2008; director of the Greater Omaha Chamber of Commerce from January 2001 through December 2008; member of the advisory board of U.S. Bank NA Omaha from January 2000 to July 2010; and the advisory board of Duncan Aviation, an aircraft service provider, headquartered in Lincoln, Nebraska, from January 2010 to February 2016. | ||
| Education and Professional | |||
| • | Bachelor’s degree in business administration, cum laude, from the University of Nebraska – Omaha. | ||
| • | Certified public accountant, on inactive status. | ||
12 MDU Resources Group, Inc. Proxy Statement
Proxy Statement
| The board of directors recommends a vote “for” each nominee. | ||||
A majority of votes cast is required to elect a director in an uncontested election. A majority of votes cast means the number of votes cast “for” a director’s election must exceed the number of votes cast “against” the director’s election. “Abstentions” and “broker non-votes” do not count as votes cast “for” or “against” the director’s election. In a contested election, which is an election in which the number of nominees for director exceeds the number of directors to be elected and which we do not anticipate, directors will be elected by a plurality of the votes cast.
Unless you specify otherwise when you submit your proxy, the proxies will vote your shares of common stock “for” all directors nominated by the board of directors. If a nominee becomes unavailable for any reason or if a vacancy should occur before the election, which we do not anticipate, the proxies will vote your shares in their discretion for another person nominated by the board.
Our policy on majority voting for directors contained in our corporate governance guidelines requires any proposed nominee for re-election as a director to tender to the board, prior to nomination, his or her irrevocable resignation from the board that will be effective, in an uncontested election of directors only, upon:
| • | receipt of a greater number of votes “against” than votes “for” election at our annual meeting of stockholders; and |
| • | acceptance of such resignation by the board of directors. |
Following certification of the stockholder vote, the nominating and governance committee will promptly recommend to the board whether or not to accept the tendered resignation. The board will act on the nominating and governance committee’s recommendation no later than 90 days following the date of the annual meeting.
Brokers may not vote your shares on the election of directors if you have not given your broker specific instructions on how to vote. Please be sure to give specific voting instructions to your broker so your vote can be counted.
MDU Resources Group, Inc. Proxy Statement 13
Proxy Statement
| CORPORATE GOVERNANCE AND THE BOARD OF DIRECTORS | ||||
Director Independence
The board of directors has adopted guidelines on director independence that are included in our corporate governance guidelines. Our guidelines require that a substantial majority of the board consists of independent directors. In general, the guidelines require that an independent director must have no material relationship with the company directly or indirectly, except as a director. The board determines independence on the basis of the standards specified by the New York Stock Exchange (NYSE), the additional standards referenced in our corporate governance guidelines, and other facts and circumstances the board considers relevant. Based on its review, the board has determined that all directors, except for our chief executive officer Mr. Goodin, have no material relationship with us and are independent.
In determining director independence, the board of directors reviewed and considered information about any transactions, relationships, and arrangements between the non-employee directors and their immediate family members and affiliated entities on the one hand, and the company and its affiliates on the other, and in particular the following transactions, relationships, and arrangements:
| • | Charitable contributions by the MDU Resources Foundation (Foundation) to the following nonprofit organizations, where a director, or a director’s spouse, serves or has served as a director, chair, or vice chair of the board of trustees, trustee or member of the organization or related entity: Charitable contributions by the Foundation to Sanford Health Foundation, Billings Catholic Schools Foundation, the University of North Dakota Foundation, the University of North Dakota Formula SAE, and the University of Jamestown and its foundation. None of the contributions made to any of these nonprofit entities during the last three fiscal years exceeded in any single year the greater of $1 million or 2% of the relevant entity’s consolidated gross revenues. |
| • | Business relationships with entities with which a director is affiliated: (1) Payment of nominal fees to First Interstate Bank, a subsidiary of First Interstate BancSystem, Inc., where Patricia Moss has been a director since May 30, 2017. The fees were for services related to depository accounts at First Interstate Bank. These services were provided in the ordinary course of business and on substantially the same terms as those prevailing at the time for comparable services provided by other bank entities. (2) Mr. Wilson is a member of the board of directors of HDR, Inc., an architectural, engineering, environmental, and consulting firm. The company paid HDR, Inc. or its affiliates for services which were provided in the ordinary course of business and on substantially the same terms prevailing for comparable services from other consulting firms. Mr. Wilson had no role in securing or promoting the HDR, Inc. services. |
The board has also determined that all members of the audit, compensation, and nominating and governance committees of the board are independent in accordance with our guidelines and applicable NYSE and Securities Exchange Act of 1934 rules.
Stockholder Engagement
The company has an active stockholder outreach program. We believe in providing transparent and timely information to our investors. Each year we routinely engage directly or indirectly with our stockholders, including our top institutional stockholders. During 2017, the company held meetings, conference calls, and webcasts with a diverse mix of stockholders. Throughout the year, we held meetings with eight of the actively managed institutional investors included in our year-end top 30 stockholders. We engage periodically with our index fund investors; however, no direct meetings were held with this investor class in 2017. In our meetings, we discussed a variety of topics with stockholders including longer-term company strategy and our capital expenditure forecast, shorter-term operational and financial updates, and previously announced strategic initiatives. The company also held a telephone conference with a proxy advisory firm to discuss corporate governance and executive compensation practices.
Board Leadership Structure
The board separated the positions of chair of the board and chief executive officer in 2006, and our bylaws and corporate governance guidelines currently require that our chair be independent. The board believes this structure provides balance and is currently in the best interest of the company and its stockholders. Separating these positions allows the chief executive officer to focus on the full-time job of running our business, while allowing the chair of the board to lead the board in its fundamental role of providing advice to and independent oversight of management. The chair meets regularly between board meetings with the chief executive officer and consults with the chief executive officer regarding the board meeting agendas, the quality and flow of information provided to the board, and the effectiveness of the board meeting process. The board believes this split structure recognizes the time, effort, and energy the chief executive officer is required to devote to the position in the current business environment, as well as the commitment required to serve as the chair, particularly as the board’s oversight responsibilities continue to grow and demand more time and attention. The fundamental role of the board of directors is to provide oversight of the management of the company in good faith and in the best interests of the company and its
14 MDU Resources Group, Inc. Proxy Statement
Proxy Statement
stockholders. Having an independent chair is a means to ensure the chief executive officer is accountable for managing the company in close alignment with the interests of stockholders, including with respect to risk management as discussed below. An independent chair is in a position to encourage frank and lively discussions, including during regularly scheduled executive sessions consisting of only independent directors, and to assure that the company has adequately assessed all appropriate business risks before adopting its final business plans and strategies. The board believes that having separate positions and having an independent outside director serve as chair is the appropriate leadership structure for the company at this time and demonstrates our commitment to good corporate governance.
Board’s Role in Risk Oversight
Risk is inherent with every business, and how well a business manages risk can ultimately determine its success. We face a number of risks, including economic risks, environmental and regulatory risks, the impact of competition, climate and weather conditions, limitations on our ability to pay dividends, pension plan obligations, cyberattacks or acts of terrorism, and third party liabilities. Management is responsible for identifying material risks, implementing appropriate risk management strategies, and providing information regarding material risks and risk management to the board. The board, as a whole and through its committees, has responsibility for the oversight of risk management. In its risk oversight role, the board of directors has the responsibility to satisfy itself that the risk management processes designed and implemented by management are adequate for identifying, assessing, and managing risk.
The board believes establishing the right “tone at the top” and full and open communication between management and the board of directors are essential for effective risk management and oversight. Our chair meets regularly with our president and chief executive officer and other senior officers to discuss strategy and risks facing the company. Senior management attends the quarterly board meetings and is available to address any questions or concerns raised by the board on risk management-related and any other matters. Each quarter, the board of directors receives presentations from senior management on strategic matters involving our operations. At least annually, the board holds strategic planning sessions with senior management to discuss strategies, key challenges, and risks and opportunities for the company.
While the board is ultimately responsible for risk oversight at our company, our three standing board committees assist the board in fulfilling its oversight responsibilities in certain areas of risk.
| • | The audit committee assists the board in fulfilling its oversight responsibilities with respect to risk management in a general manner and specifically in the areas of financial reporting, internal controls and compliance with legal and regulatory requirements, and, in accordance with NYSE requirements, discusses with the board policies with respect to risk assessment and risk management and their adequacy and effectiveness. Risk assessment reports are regularly provided by management to the audit committee or the full board. This opens the opportunity for discussions about areas where the company may have material risk exposure, steps taken to manage such exposure, and the company’s risk tolerance in relation to company strategy. The audit committee reports regularly to the board of directors on the company’s management of risks in the audit committee’s areas of responsibility. |
| • | The compensation committee assists the board in fulfilling its oversight responsibilities with respect to the management of risks arising from our compensation policies and programs. |
| • | The nominating and governance committee assists the board in fulfilling its oversight responsibilities with respect to the management of risks associated with board organization, membership and structure, succession planning for our directors and executive officers, and corporate governance. |
Board Meetings and Committees
During 2017, the board of directors held four regular meetings and two special meetings. Each director attended at least 75% of the combined total meetings of the board and the committees on which the director served during 2017. Directors are encouraged to attend our annual meeting of stockholders. All directors attended our 2017 Annual Meeting of Stockholders.
Harry J. Pearce was elected non-employee chair of the board on August 17, 2006, and previously served as lead director from February 15, 2001 to August 17, 2006. He presides at the executive session of the non-employee directors held in connection with each regularly scheduled quarterly board of directors meeting. Dennis W. Johnson was elected vice chair of the board on February 15, 2018. The non-employee directors meet in executive session both with and without the chief executive officer at each regularly scheduled quarterly board of directors meeting. All of our non-employee directors are independent, as defined in our corporate governance guidelines and NYSE listing standards.
MDU Resources Group, Inc. Proxy Statement 15
Proxy Statement
The board has standing audit, compensation, and nominating and governance committees. The table below provides current committee membership.
| Name | Audit Committee | Compensation Committee | Nominating and Governance Committee | |
| Thomas Everist | C | |||
| Karen B. Fagg | ● | C | ||
| Mark A. Hellerstein | ● | |||
| A. Bart Holaday | ● | ● | ||
| Dennis W. Johnson | C | |||
| William E. McCracken | ● | ● | ||
| Patricia L. Moss | ● | ● | ||
| John K. Wilson | ● | |||
C - Chair | ||||
● - Member | ||||
Below is a description of each standing committee of the board. The board has affirmatively determined that each of these standing committees consists entirely of independent directors pursuant to rules established by the NYSE, rules promulgated under the Securities and Exchange Commission (SEC), and the director independence standards established by the board. The board has also determined that each member of the audit committee and the compensation committee is independent under the criteria established by the NYSE and the SEC for audit committee and compensation committee members, as applicable.
| Nominating and Governance Committee | Met Four Times in 2017 |
The nominating and governance committee met four times during 2017. The committee members are Karen B. Fagg, chair, A. Bart Holaday, William E. McCracken, and Patricia L. Moss.
The nominating and governance committee provides recommendations to the board with respect to:
| • | board organization, membership, and function; |
| • | committee structure and membership; |
| • | succession planning for our executive management and directors; and |
| • | our corporate governance guidelines. |
The nominating and governance committee assists the board in overseeing the management of risks in the committee’s areas of responsibility.
The committee identifies individuals qualified to become directors and recommends to the board the nominees for director for the next annual meeting of stockholders. The committee also identifies and recommends to the board individuals qualified to become our principal officers and the nominees for membership on each board committee. The committee oversees the evaluation of the board and management.
In identifying nominees for director, the committee consults with board members, our management, consultants, and other individuals likely to possess an understanding of our business and knowledge concerning suitable director candidates.
Our corporate governance guidelines include our policy on consideration of director candidates recommended to us. We will consider candidates that our stockholders recommend in the same manner we consider other nominees. Stockholders who wish to recommend a director candidate may submit recommendations, along with the information set forth in the guidelines, to the nominating and governance committee chair in care of the secretary at MDU Resources Group, Inc., P.O. Box 5650, Bismarck, ND 58506-5650.
Stockholders who wish to nominate persons for election to our board at an annual meeting of stockholders must follow the procedures set forth in section 2.08 of our bylaws. Our bylaws are available on our website. See “Stockholder Proposals, Director Nominations, and Other Items of Business for 2019 Annual Meeting” in the section entitled “Information about the Annual Meeting” for further details.
16 MDU Resources Group, Inc. Proxy Statement
Proxy Statement
In evaluating director candidates, the committee, in accordance with our corporate governance guidelines, considers an individual’s:
| • | background, character, and experience, including experience relative to our company’s lines of business; |
| • | skills and experience which complement the skills and experience of current board members; |
| • | success in the individual’s chosen field of endeavor; |
| • | skill in the areas of accounting and financial management, banking, business management, human resources, marketing, operations, public affairs, law, technology, risk management, governance, and operations abroad; |
| • | background in publicly traded companies including service on other public company boards of directors; |
| • | geographic area of residence; |
| • | diversity of business and professional experience, skills, gender, and ethnic background, as appropriate in light of the current composition and needs of the board; |
| • | independence, including any affiliation or relationship with other groups, organizations, or entities; and |
| • | compliance with applicable law and applicable corporate governance, code of conduct and ethics, conflict of interest, corporate opportunities, confidentiality, stock ownership and trading policies, and other policies and guidelines of the company. |
In addition, our bylaws contain requirements that a person must meet to qualify for service as a director.
The nominating and governance committee assesses the effectiveness of this policy annually in connection with the nomination of directors for election at the annual meeting of stockholders. The composition of the current board reflects diversity in business and professional experience, skills, and gender.
| Audit Committee | Met Eight Times in 2017 |
The audit committee is a separately-designated committee established in accordance with Section 3(a)(58)(A) of the Securities Exchange Act of 1934.
The audit committee met eight times during 2017. The audit committee members are Dennis W. Johnson, chair, Mark A. Hellerstein, A. Bart Holaday, and John K. Wilson. The board of directors has determined that Messrs. Johnson, Hellerstein, Holaday, and Wilson are “audit committee financial experts” as defined by SEC rules and are financially literate within meaning of the listing standards of the NYSE. They also meet the independence standard for audit committee members under our director independence guidelines, the NYSE listing standards, and SEC rules.
The audit committee assists the board of directors in fulfilling its oversight responsibilities to the stockholders and serves as a communication link among the board, management, the independent registered public accounting firm, and the internal auditors. The audit committee:
| • | assists the board’s oversight of |
| ◦ | the integrity of our financial statements and system of internal controls; |
| ◦ | the company’s compliance with legal and regulatory requirements and the code of conduct; |
| ◦ | the independent registered public accounting firm’s qualifications and independence; |
| ◦ | the performance of our internal audit function and independent registered public accounting firm; |
| ◦ | management of risk in the audit committee’s areas of responsibility; and |
| • | arranges for the preparation of and approves the report that SEC rules require we include in our annual proxy statement. See the section entitled “Audit Committee Report” for further information. |
MDU Resources Group, Inc. Proxy Statement 17
Proxy Statement
| Compensation Committee | Met Seven Times in 2017 |
During 2017, the compensation committee met seven times. The compensation committee consists entirely of independent directors within the meaning of the company’s corporate governance guidelines and the NYSE listing standards and who meet the definitions of outside or non-employee directors for purposes of Section 162(m) of the Internal Revenue Code and Rule 16-b under the Exchange Act. Members of the compensation committee are Thomas Everist, chair, Karen B. Fagg, William E. McCracken, and Patricia L. Moss.
The compensation committee assists the board of directors in fulfilling its responsibilities relating to the company’s compensation policy and programs. It has the direct responsibility for determining compensation for our Section 16 officers and for overseeing the company’s management of risk in its areas of responsibility. In addition, the compensation committee reviews and recommends any changes to director compensation policies to the board of directors. The authority and responsibility of the compensation committee is outlined in the compensation committee’s charter.
The compensation committee uses the analysis and recommendations from outside consultants, the chief executive officer, and the human resources department in making its compensation decisions. The chief executive officer, the vice president-human resources, and the general counsel regularly attend compensation committee meetings. The committee meets in executive session as needed. The processes and procedures for consideration and determination of compensation of the Section 16 officers, as well as the role of our executive officers, are discussed in the “Compensation Discussion and Analysis.”
The compensation committee has sole authority to retain compensation consultants, legal counsel, or other advisers to assist in consideration of the compensation of the chief executive officer, the other Section 16 officers, and the board of directors, and the committee is directly responsible for the appointment, compensation, and oversight of the work of such advisers. The compensation committee’s practice has been to retain a compensation consultant every other year to conduct a competitive analysis on executive compensation. The competitive analysis is conducted internally by the human resources department in the other years. The compensation committee retained a compensation consultant, Willis Towers Watson, to conduct a competitive analysis on executive compensation in 2016. Prior to retaining an adviser, the compensation committee will consider all factors relevant to ensure the adviser’s independence from management. Annually the compensation committee conducts a potential conflicts of interest assessment raised by the work of any compensation consultant and how such conflicts, if any, should be addressed. The compensation committee requested and received information from Willis Towers Watson to assist in its potential conflicts of interest assessment. Based on its review and analysis, the compensation committee determined in 2016 that Willis Towers Watson was independent from management.
The board of directors determines compensation for our non-employee directors based upon recommendations from the compensation committee. The compensation committee’s practice has been to retain a compensation consultant every other year to conduct a competitive analysis on director compensation. The compensation committee employed a compensation consultant for an analysis of director compensation in 2017.
Compensation Policies and Practices as They Relate to Risk Management
The human resources department has conducted an assessment of the risks arising from our compensation policies and practices for all employees and concluded that none of these risks is reasonably likely to have a material adverse effect on the company. Based on the human resources department’s assessment and taking into account information received from the risk identification process, senior management and our management policy committee concluded that risks arising from our compensation policies and practices are not reasonably likely to have a material adverse effect on the company. After review and discussion with senior management, the compensation committee concurred with this assessment.
As part of its assessment of the risks arising from our compensation policies and practices, the human resources department identified the principal areas of risk faced by the company that may be affected by our compensation policies and practices, including any risks resulting from our operating businesses’ compensation policies and practices. In assessing the risks arising from our compensation policies and practices, the human resources department identified the following practices designed to prevent excessive risk taking:
| • | Business management and governance practices: |
| ◦ | risk management is a specific performance competency included in the annual performance assessment of Section 16 officers; |
| ◦ | board oversight on capital expenditure and operating plans promotes careful consideration of financial assumptions; |
| ◦ | limitation on business acquisitions without board approval; |
18 MDU Resources Group, Inc. Proxy Statement
Proxy Statement
| ◦ | employee integrity training programs and anonymous reporting systems; |
| ◦ | quarterly risk assessment reports at audit committee meetings; and |
| ◦ | prohibitions on holding company stock in an account that is subject to a margin call, pledging company stock as collateral for a loan, and hedging of company stock by Section 16 officers and directors. |
| • | Executive compensation practices: |
| ◦ | active compensation committee review of executive compensation, including comparison of executive compensation to total stockholder return ratio to the ratio for the company’s peer group; |
| ◦ | the initial determination of a position’s salary grade to be at or near the 50th percentile of base salaries paid to similar positions at peer group companies and/or relevant industry companies; |
| ◦ | consideration of peer group and/or relevant industry practices to establish appropriate compensation target amounts; |
| ◦ | a balanced compensation mix of fixed salary and annual and long-term incentives tied to the company’s financial performance; |
| ◦ | use of interpolation for annual and long-term incentive awards to avoid payout cliffs; |
| ◦ | negative discretion to adjust any annual or long-term incentive award payment downward; |
| ◦ | use of caps on annual incentive awards (maximum of 240% of target) and long-term incentive stock grant awards (200% of target); |
| ◦ | clawback availability on incentive payments in the event of a financial restatement; |
| ◦ | use of performance shares, rather than stock options or stock appreciation rights, as the equity component of incentive compensation; |
| ◦ | use of performance shares for long-term incentive awards with a relative total stockholder return performance measure and mandatory reduction in award if total stockholder return over the performance period is negative; |
| ◦ | use of three-year performance periods for long-term incentive awards to discourage short-term risk-taking; |
| ◦ | substantive annual incentive goals measured primarily by return on invested capital, earnings, and earnings per share criteria, which encourage balanced performance and are important to stockholders; |
| ◦ | use of financial performance metrics that are readily monitored and reviewed; |
| ◦ | regular review of the appropriateness of the companies in the peer group; |
| ◦ | stock ownership requirements for the board and for executives receiving long-term incentive awards; |
| ◦ | mandatory holding periods for 50% of any net after-tax shares earned under long-term incentive awards; and |
| ◦ | use of independent consultants in establishing pay targets at least biennially. |
Stockholder Communications with the Board
Stockholders and other interested parties who wish to contact the board of directors or any individual director, including our non-employee chair or non-employee directors as a group, should address a communication in care of the secretary at MDU Resources Group, Inc., P.O. Box 5650, Bismarck, ND 58506-5650. The secretary will forward all communications.
Additional Governance Features
Board and Committee Evaluations
Our corporate governance guidelines provide that the board of directors, in coordination with the nominating and governance committee, will annually review and evaluate the performance and functioning of the board and its committees. The self-evaluations are intended to facilitate a candid assessment and discussion by the board and each committee of its effectiveness as a group in fulfilling its responsibilities, its performance as measured against the corporate governance guidelines, and areas for improvement. The board and committee members are provided with a questionnaire to facilitate discussion. The results of the evaluations are reviewed and discussed in executive sessions of the committees and the board of directors.
MDU Resources Group, Inc. Proxy Statement 19
Proxy Statement
Director Resignation Upon Change of Job Responsibility
Our corporate governance guidelines require a director to tender his or her resignation after a material change in job responsibility. In 2017, Mr. Everist submitted his resignation in connection with the sale by The Everist Company of its aggregate, concrete, and asphalt production interests. After considering his background, experience on the board, skills and character, and contribution to the company in light of the company’s business and structure, the board determined Mr. Everist’s resignation should not be accepted.
Majority Voting in Uncontested Director Elections
Our corporate governance guidelines require that in uncontested elections (those where the number of nominees does not exceed the number of directors to be elected), director nominees must receive the affirmative vote of a majority of the votes cast to be elected to our board of directors. Contested director elections (those where the number of director nominees exceeds the number of directors to be elected) are governed by a plurality of the vote of shares present in person or represented by proxy at the meeting.
The board has adopted a director resignation policy for incumbent directors in uncontested elections. Any proposed nominee for re-election as a director shall, before he or she is nominated to serve on the board, tender to the board his or her irrevocable resignation that will be effective, in an uncontested election of directors only, upon (i) such nominee’s receipt of a greater number of votes “against” election than votes “for” election at our annual meeting of stockholders; and (ii) acceptance of such resignation by the board of directors.
Director Overboarding Policy
Our bylaws and corporate governance guidelines state that a director may not serve on more than three public company boards, including the company’s board. Currently, all of our directors are in compliance of this policy.
Board Refreshment
The company regularly evaluates the need for board refreshment. The nominating and governance committee and the board are focused on identifying individuals whose skills and experiences will enable them to make meaningful contributions to shaping the company’s business strategy. As part of its consideration of director succession, the nominating and governance committee from time to time reviews, including when considering potential candidates, the appropriate skills and characteristics required of board members. The board believes it is important to consider diversity of skills, expertise, race, ethnicity, gender, age, education, cultural background, and professional experiences in evaluating board candidates for expected contributions to an effective board. Independent directors may not serve on the board beyond the next annual meeting of stockholders after attaining the age of 76. We believe the current retirement age allows us to benefit from long-serving directors, including their industry expertise, institutional knowledge, historical perspective, stability, and comfort with challenging company management, while maintaining our ability to refresh the board through the addition of new members. In connection with our mandatory retirement for directors, A. Bart Holaday will retire as a director at the completion of his current term at the 2018 annual meeting, and two additional directors will retire in 2019.
Prohibitions on Hedging/Pledging Company Stock
The director compensation policy prohibits directors from hedging their ownership of common stock, pledging company stock as collateral for a loan, or holding company stock in an account that is subject to a margin call.
Code of Conduct
We have a code of conduct and ethics, which we refer to as the Leading With Integrity Guide. It applies to all directors, officers, and employees.
We intend to satisfy our disclosure obligations regarding amendments to, or waivers of, any provision of the code of conduct that applies to our principal executive officer, principal financial officer, and principal accounting officer and that relates to any element of the code of ethics definition in Regulation S-K, Item 406(b), and waivers of the code of conduct for our directors or executive officers, as required by NYSE listing standards, by posting such information on our website.
20 MDU Resources Group, Inc. Proxy Statement
Proxy Statement
Corporate Governance Materials
Stockholders can see our bylaws, corporate governance guidelines, board committee charters, and Leading With Integrity Guide on our website.
| Corporate Governance Materials | Website | |
| • | Bylaws | http://www.mdu.com/integrity/governance/guidelines-and-bylaws |
| • | Corporate Governance Guidelines | http://www.mdu.com/integrity/governance/guidelines-and-bylaws |
| • | Board Committee Charters for the Audit, Compensation, and Nominating and Governance Committees | http://www.mdu.com/integrity/governance/board-charters-and-committees |
| • | Leading With Integrity Guide | http://www.mdu.com/docs/default-source/governance/leadingwithintegrity.pdf |
Related Person Transaction Disclosure
The board of directors’ policy for the review of related person transactions is contained in our corporate governance guidelines. The policy provides that the audit committee review any transaction, arrangement or relationship, or series thereof:
| • | in which we are or will be a participant; |
| • | the amount involved exceeds $120,000; and |
| • | a related person has or will have a direct or indirect material interest. |
The purpose of this review is to determine whether this transaction is in the best interests of the company.
Related persons are directors, director nominees, executive officers, holders of 5% or more of our voting stock, and their immediate family members. Related persons are required promptly to report to our general counsel all proposed or existing related person transactions in which they are involved.
If our general counsel determines that the transaction is required to be disclosed under the SEC rules, the general counsel furnishes the information to the chair of the audit committee. After its review, the committee makes a determination or a recommendation to the board and officers of the company with respect to the related person transaction. Upon receipt of the committee’s recommendation, the board of directors or officers, as the case may be, take such action as they deem appropriate in light of their responsibilities under applicable laws and regulations.
We had no related person transactions in 2017.
MDU Resources Group, Inc. Proxy Statement 21
Proxy Statement
| COMPENSATION OF NON-EMPLOYEE DIRECTORS | ||
Director Compensation for 2017
MDU Resources’ non-employee directors are compensated for their service according to the MDU Resources Group Inc. Director Compensation Policy. Only one employee, David L. Goodin, the company’s president and chief executive officer, serves as a director. Mr. Goodin receives no additional compensation for his service on the board. Director compensation is reviewed annually by the compensation committee with analysis provided by an independent consultant in odd numbered years and analysis prepared by the company’s human resources department in even numbered years. Willis Towers Watson provided the director compensation analysis for 2017. The analysis included research on market trends in director compensation as well as a review of director compensation practices of our peer group companies. Based on the analysis, the compensation committee recommended and the board approved at the May 2017 meeting, an increase to the annual base cash retainer from $65,000 to $70,000 effective June 1, 2017. In addition, the 2017 annual stock grant for the non-executive chair of the board was increased from $110,000 to $145,000. No changes were made to the annual stock grants to other directors or to the additional cash retainers for the non-executive chair of the board or the chairs of the board committees. The following table outlines the compensation paid to our non-employee directors for 2017.
| Name | Fees Earned or Paid in Cash ($) | Stock Awards ($)1 | All Other Compensation ($)2 | Total ($) | ||||||||
| Thomas Everist | 77,917 | 110,000 | 83 | 188,000 | ||||||||
| Karen B. Fagg | 77,917 | 110,000 | 83 | 188,000 | ||||||||
| Mark A. Hellerstein | 67,917 | 110,000 | 83 | 178,000 | ||||||||
| A. Bart Holaday | 67,917 | 110,000 | 83 | 178,000 | ||||||||
| Dennis W. Johnson | 82,917 | 110,000 | 1,083 | 194,000 | ||||||||
| William E. McCracken | 67,917 | 110,000 | 83 | 178,000 | ||||||||
| Patricia L. Moss | 67,917 | 110,000 | 1,083 | 179,000 | ||||||||
| Harry J. Pearce | 157,917 | 145,000 | 83 | 303,000 | ||||||||
| John K. Wilson | 67,917 | 3 | 110,000 | 83 | 178,000 | |||||||
1 | Each director received an annual retainer of $110,000 in company common stock except the non-executive chair who received $145,000 in company common stock pursuant to the MDU Resources Group, Inc. Non-Employee Director Stock Compensation Plan or the Non-Employee Director Long-Term Incentive Compensation Plan. The amount shown for each director, except Mr. Pearce, represents the aggregate grant date fair value of 4,091 shares of MDU Resources Group, Inc. common stock. The amount shown for Mr. Pearce who serves as our non-executive chair of the board represents the aggregate grant date fair value of 5,393 shares of MDU Resources Group, Inc. common stock. All shares are measured in accordance with Financial Accounting Standards Board (FASB) generally accepted accounting principles for stock-based compensation in FASB Accounting Standards Codification Topic 718. The grant date fair value is based on the purchase price of our common stock on the grant date of November 21, 2017, which was $26.88 per share. The amount paid in cash for fractional shares was $21.65 to each director and $19.98 to our non-executive chair of the board and is included in the amount reported in the stock awards column to this table. As of December 31, 2017, there are no outstanding stock awards or options associated with the Non-Employee Director Stock Compensation Plan or the Non-Employee Director Long-Term Incentive Compensation Plan. |
2 | Includes group life insurance premiums and charitable donations made on behalf of the director as applicable. |
3 | Mr. Wilson elected to receive shares of our common stock in lieu of his cash retainer pursuant to the Director Compensation Policy and the Non-Employee Director Long-Term Incentive Compensation Plan. The amount shown includes 2,451 shares of our common stock purchased on December 6, 2017, at $27.70 per share. |
22 MDU Resources Group, Inc. Proxy Statement
Proxy Statement
The following table shows the cash and stock retainers payable to our non-employee directors.
Effective through May 31, 2017 | Effective June 1, 2017 | ||||||||
| Base Cash Retainer | $ | 65,000 | $ | 70,000 | |||||
| Additional Cash Retainers: | |||||||||
| Non-Executive Chair | 90,000 | 90,000 | |||||||
| Audit Committee Chair | 15,000 | 15,000 | |||||||
| Compensation Committee Chair | 10,000 | 10,000 | |||||||
| Nominating and Governance Committee Chair | 10,000 | 10,000 | |||||||
Annual Stock Grant1 - Directors | 110,000 | 110,000 | |||||||
Annual Stock Grant2 - Non-Executive Chair | 145,000 | ||||||||
1 | The annual stock grant is a grant of shares equal in value to $110,000. | ||||||||
2 | The annual stock grant is a grant of shares equal in value to $145,000. | ||||||||
There are no meeting fees paid to directors.
Other Compensation
In addition to liability insurance, we maintain group life insurance in the amount of $100,000 on each non-employee director for the benefit of each director’s beneficiaries during the time each director serves on the board. The annual cost per director is $82.80. Directors who contribute to the company’s Good Government Fund may designate up to two charities to receive a matching donation from the MDU Resources Foundation based on their contributions to the fund. Directors are reimbursed for all reasonable travel expenses, including spousal expenses in connection with attendance at meetings of the board and its committees. Perquisites, if any, were below the disclosure threshold in 2017.
Deferral of Compensation
Directors may defer all or any portion of the annual cash retainer and any other cash compensation paid for service as a director pursuant to the Deferred Compensation Plan for Directors. Deferred amounts are held as phantom stock with dividend accruals and are paid out in cash over a five-year period after the director leaves the board.
Post-Retirement
Our post-retirement income plan for directors was terminated in May 2001 for current and future directors. The net present value of each director’s benefit was calculated and converted into phantom stock. Payment is deferred pursuant to the Deferred Compensation Plan for Directors and will be made in cash over a five-year period after the director’s retirement from the board.
Stock Ownership Policy
Our director stock ownership policy contained in our corporate governance guidelines requires each director to own our common stock equal in value to five times the director’s annual cash base retainer. Shares acquired through purchases on the open market and participation in our director stock plans are considered in ownership calculations as is ownership of our common stock by a spouse. A director is allowed five years commencing January 1 of the year following the year of that director’s initial election to the board to meet the requirements. The level of common stock ownership is monitored with an annual report made to the compensation committee of the board. All directors are in compliance with the stock ownership policy. For further details on our director’s stock ownership, see the section entitled “Security Ownership.”
MDU Resources Group, Inc. Proxy Statement 23
Proxy Statement
| SECURITY OWNERSHIP | ||
Security Ownership Table
The table below sets forth the number of shares of our common stock that each director and each nominee for director, each current named executive officer, and all directors and executive officers as a group owned beneficially as of February 28, 2018. Unless otherwise indicated, each person has sole investment and voting power (or share such power with his or her spouse) of the shares noted.
Name1 | Common Shares Beneficially Owned | Percent of Class | Post-Retirement and/or Deferred Director Fees Held as Phantom Stock2 | ||||||
| David C. Barney | 24,604 | 3,4 | * | — | |||||
| Thomas Everist | 857,549 | * | 33,952 | ||||||
| Karen B. Fagg | 67,086 | * | — | ||||||
| David L. Goodin | 176,336 | 3 | * | — | |||||
| Mark A. Hellerstein | 19,857 | * | 11,485 | ||||||
| A. Bart Holaday | 65,002 | * | 11,485 | ||||||
| Dennis W. Johnson | 86,248 | 5 | * | — | |||||
| Nicole A. Kivisto | 41,196 | 3,6 | * | — | |||||
| William E. McCracken | 19,857 | * | — | ||||||
| Patricia L. Moss | 78,525 | * | — | ||||||
| Harry J. Pearce | 241,278 | * | 55,824 | ||||||
| Jeffrey S. Thiede | 21,719 | 3 | * | — | |||||
| Jason L. Vollmer | 6,019 | 3 | * | — | |||||
| John K. Wilson | 125,458 | * | — | ||||||
| All directors and executive officers as a group (19 in number) | 1,906,649 | 0.98 | % | 112,746 | |||||
* | Less than one percent of the class. Percent of class is calculated based on 195,304,376 outstanding shares as of February 28, 2018. | ||||||||
1 | The table includes the ownership of all current directors, director nominees, current named executive officers, and other executive officers of the company without naming them. The table does not include stock ownership information for Mr. Martin Fritz who resigned effective May 23, 2017; Mr. Dennis Haider who retired on June 12, 2017; and Mr. Doran Schwartz who resigned effective September 29, 2017. | ||||||||
2 | Reported shares are not included in the “Common Shares Beneficially Owned” column. Phantom stock includes the value of post-retirement benefits for directors on the board prior to May 2001 when the post-retirement income plan for directors was terminated and the value of any cash compensation deferred pursuant to the Deferred Compensation Plan for Directors. Post-retirement and deferred amounts are held as phantom stock with dividend accruals and are paid out in cash over a five-year period after the director leaves the board. | ||||||||
3 | Includes full shares allocated to the officer’s account in our 401(k) retirement plan. | ||||||||
4 | The total includes 687 shares owned by Mr. Barney’s spouse. | ||||||||
5 | Mr. Johnson disclaims all beneficial ownership of the 163 shares owned by his spouse. | ||||||||
6 | The total includes 531 shares owned by Ms. Kivisto’s spouse. | ||||||||
We prohibit our directors and executive officers from hedging their ownership of company common stock. They may not enter into transactions that allow them to benefit from devaluation of our stock or otherwise own stock technically but without the full benefits and risks of such ownership.
Directors, executive officers, and related persons are prohibited from holding our common stock in a margin account, with certain exceptions, or pledging company securities as collateral for a loan. Company common stock may be held in a margin brokerage account only if the stock is explicitly excluded from any margin, pledge, or security provisions of the customer agreement. Company common stock may be held in a cash account, which is a brokerage account that does not allow any extension of credit on securities. “Related person” means an executive officer’s or director’s spouse, minor child, and any person (other than a tenant or domestic employee) sharing the household of a director or executive officer, as well as any entities over which a director or executive officer exercises control.
24 MDU Resources Group, Inc. Proxy Statement
Proxy Statement
Based on information from company records or filings with the SEC, the table below shows information regarding the beneficial ownership of more than five percent of any class of our voting securities.
| Title of Class | Name and Address of Beneficial Owner | Amount and Nature of Beneficial Ownership | Percent of Class | |||||||
| Common Stock | The Vanguard Group | 21,720,106 | 1 | 11.12 | % | |||||
| 100 Vanguard Blvd. | ||||||||||
| Malvern, PA 19355 | ||||||||||
| Common Stock | BlackRock, Inc. | 16,450,816 | 2 | 8.40 | % | |||||
| 55 East 52nd Street | ||||||||||
| New York, NY 10055 | ||||||||||
| Common Stock | Parnassus Investments | 15,215,391 | 3 | 7.79 | % | |||||
| 1 Market Street, Suite 1600 | ||||||||||
| San Francisco, CA 94105 | ||||||||||
| Common Stock | State Street Corporation | 11,669,385 | 4 | 5.97 | % | |||||
| State Street Financial Center | ||||||||||
| One Lincoln Street | ||||||||||
1 | Based solely on the Schedule 13G, Amendment No. 6, filed on February 9, 2018, The Vanguard Group reported sole dispositive power with respect to 21,608,438 shares, shared dispositive power with respect to 111,668 shares, sole voting power with respect to 102,120 shares, and shared voting power with respect to 22,519 shares. These shares include 87,969 shares beneficially owned by Vanguard Fiduciary Trust Company, a wholly-owned subsidiary of The Vanguard Group, Inc., as a result of its serving as investment manager of collective trust accounts, and 36,670 shares beneficially owned by Vanguard Investments Australia, Ltd., a wholly-owned subsidiary of The Vanguard Group, Inc., as a result of its serving as investment manager of Australian investment offerings. | |||||||||
2 | Based solely on the Schedule 13G, Amendment No. 8, filed on January 25, 2018, BlackRock, Inc. reported sole voting power with respect to 15,513,498 shares and sole dispositive power with respect to 16,450,816 shares as the parent holding company or control person of BlackRock Life Limited, BlackRock Advisors, LLC, BlackRock (Netherlands) B.V., BlackRock Institutional Trust Company, National Association, BlackRock Asset Management Ireland Limited, BlackRock Financial Management, Inc., BlackRock Japan Co., Ltd., BlackRock Asset Management Schweiz AG, BlackRock Investment Management, LLC, BlackRock Investment Management (UK) Limited, BlackRock Asset Management Canada Limited, BlackRock Investment Management (Australia) Limited, BlackRock Advisors (UK) Limited, BlackRock Fund Advisors, BlackRock Asset Management North Asia Limited, and BlackRock Fund Managers Ltd. | |||||||||
3 | Based solely on the Schedule 13G, Amendment No. 3, filed on February 12, 2018, Parnassus Investments reported sole voting and dispositive power with respect to 15,215,391 shares. | |||||||||
4 | Based solely on the Schedule 13G, filed on February 14, 2018, State Street Corporation reported shared voting and dispositive power with respect to 11,669,385 shares as the parent holding company or control person of State Street Bank and Trust Company, SSGA Funds Management, Inc., State Street Global Advisors Trust Company, State Street Global Advisors Asia LTD, State Street Global Advisors Singapore LTD., State Street Global Advisors Limited, and State Street Global Advisors GmbH. | |||||||||
Section 16(a) Beneficial Ownership Reporting Compliance
Section 16 of the Securities Exchange Act of 1934, as amended, requires officers, directors, and holders of more than 10% of our common stock file reports of their trading in our equity securities with the SEC. Based solely on a review of Forms 3, 4, and 5, and any amendments to these forms furnished to us during and with respect to 2017, or written representations that no Forms 5 were required, we believe that all such reports were timely filed.
MDU Resources Group, Inc. Proxy Statement 25
Proxy Statement
| EXECUTIVE COMPENSATION | ||||
ITEM 2. ADVISORY VOTE TO APPROVE THE COMPENSATION PAID TO THE COMPANY’S NAMED EXECUTIVE OFFICERS
In accordance with Section 14A of the Securities Exchange Act of 1934 and Rule 14a-21(a), we are asking our stockholders to approve, in an advisory vote, the compensation of our named executive officers as disclosed in this Proxy Statement pursuant to Item 402 of Regulation S-K. As discussed in the Compensation Discussion and Analysis, our compensation committee and board of directors believe that our current executive compensation program directly links compensation of our named executive officers to our financial performance and aligns the interests of our named executive officers with those of our stockholders. Our compensation committee and board of directors also believe that our executive compensation program provides our named executive officers with a balanced compensation package that includes an appropriate base salary along with competitive annual and long-term incentive compensation targets. These incentive programs are designed to reward our named executive officers on both an annual and long-term basis if they attain specified goals.
Our overall compensation program and philosophy is built on a foundation of these guiding principles:
| • | we pay for performance, with over 60% of our 2017 total target direct compensation for our current named executive officers in the form of performance-based incentive compensation; |
| • | we review competitive compensation data for our named executive officers, to the extent available, and incorporate internal equity in the final determination of target compensation levels; |
| • | we align executive compensation and performance by using annual performance incentives based on criteria that are important to stockholder value, including earnings, earnings per share, and return on invested capital; and |
| • | we align executive compensation and performance by using long-term performance incentives based on total stockholder return relative to our peer group. |
We are asking our stockholders to indicate their approval of our named executive officer compensation as disclosed in this Proxy Statement, including the Compensation Discussion and Analysis, the executive compensation tables, and narrative discussion. This vote is not intended to address any specific item of compensation, but rather the overall compensation of our named executive officers for 2017. Accordingly, the following resolution is submitted for stockholder vote at the 2018 annual meeting:
“RESOLVED, that the compensation paid to the company’s named executive officers, as disclosed pursuant to Item 402 of Regulation S-K, including the Compensation Discussion and Analysis, compensation tables, and narrative discussion of this Proxy Statement, is hereby approved.”
As this is an advisory vote, the results will not be binding on the company, the board of directors, or the compensation committee and will not require us to take any action. The final decision on the compensation of our named executive officers remains with our compensation committee and our board of directors, although our board and compensation committee will consider the outcome of this vote when making future compensation decisions. We intend to hold this advisory vote every year until at least the next stockholder advisory vote on the frequency of this vote.
The board of directors recommends a vote “for” the approval, on a non-binding advisory basis, of the compensation of the company’s named executive officers, as disclosed in this Proxy Statement. | ||||
Approval of the compensation of our named executive officers requires the affirmative vote of a majority of our common stock present in person or represented by proxy at the meeting and entitled to vote on the proposal. Abstentions will count as votes against this proposal. Broker non-vote shares are not entitled to vote on this proposal and, therefore, are not counted in the vote.
26 MDU Resources Group, Inc. Proxy Statement
Proxy Statement
INFORMATION CONCERNING EXECUTIVE OFFICERS
At the first meeting of the board after the annual meeting of stockholders, our board of directors elects our executive officers, who serve until their successors are chosen and qualify. A majority of our board of directors may remove any executive officer at any time. Information concerning our executive officers, including their ages as of December 31, 2017, present corporate positions, and business experience during the past five years, is as follows:
| Name | Age | Present Corporate Position and Business Experience | ||||
| David L. Goodin | 56 | Mr. Goodin was elected president and chief executive officer of the company and a director effective January 4, 2013. For more information about Mr. Goodin, see the section entitled “Item 1. Election of Directors.” | ||||
| David C. Barney | 62 | Mr. Barney was elected president and chief executive officer of Knife River Corporation effective April 30, 2013, and president effective January 1, 2012. | ||||
| Stephanie A. Barth | 45 | Ms. Barth was elected vice president, chief accounting officer and controller effective September 30, 2017. Prior to that, she was controller of the company effective May 30, 2016, vice president, treasurer and chief accounting officer of WBI Holdings, Inc. effective January 1, 2015, controller of WBI Holdings, Inc. effective September 30, 2013, and director financial planning & reporting of WBI Holdings, Inc. effective December 22, 2008. | ||||
| Trevor J. Hastings | 44 | Mr. Hastings was elected president and chief executive officer of WBI Holdings, Inc. effective October 16, 2017. Prior to that, he was vice president-business development and operations support of Knife River Corporation effective January 11, 2012. | ||||
| Anne M. Jones | 54 | Ms. Jones was elected vice president-human resources effective January 1, 2016. Prior to that, she was vice president-human resources, customer service, and safety at Montana-Dakota Utilities Co., Great Plains Natural Gas Co., Cascade Natural Gas Corporation, and Intermountain Gas Company effective July 1, 2013, and director of human resources for Montana-Dakota Utilities Co. and Great Plains Natural Gas Co. effective June 2008. | ||||
| Nicole A. Kivisto | 44 | Ms. Kivisto was elected president and chief executive officer of Montana-Dakota Utilities Co., Great Plains Natural Gas Co., Cascade Natural Gas Corporation, and Intermountain Gas Company effective January 9, 2015. Prior to that, she was vice president of operations for Montana-Dakota Utilities Co. and Great Plains Natural Gas Co. effective January 3, 2014, and vice president, controller and chief accounting officer for the company effective February 17, 2010. | ||||
| Daniel S. Kuntz | 64 | Mr. Kuntz was elected vice president, general counsel and secretary effective January 1, 2017. Prior to that, he was general counsel and secretary effective January 9, 2016, associate general counsel effective April 1, 2007, and assistant secretary effective August 17, 2007. | ||||
| Margaret (Peggy) A. Link | 51 | Ms. Link was elected vice president and chief information officer effective December 1, 2017. Prior to that, she was chief information officer effective January 1, 2016, assistant vice president-technology and cybersecurity officer effective January 1, 2015, and director shared IT services effective June 2, 2009. | ||||
| Jeffrey S. Thiede | 55 | Mr. Thiede was elected president and chief executive officer of MDU Construction Services Group, Inc. effective April 30, 2013, and president effective January 1, 2012. | ||||
| Jason L. Vollmer | 40 | Mr. Vollmer was elected vice president, chief financial officer and treasurer effective September 30, 2017. Prior to that, he was vice president, chief accounting officer and treasurer effective March 19, 2016, treasurer and director of cash and risk management effective November 29, 2014, manager of treasury services and risk management effective June 30, 2014, and manager of treasury services, cash and risk management effective April 11, 2011. | ||||
MDU Resources Group, Inc. Proxy Statement 27
Proxy Statement
COMPENSATION DISCUSSION AND ANALYSIS
The Compensation Discussion and Analysis describes how our named executive officers were compensated for 2017 and how their 2017 compensation aligns with our pay for performance philosophy. It also describes the oversight of the compensation committee and the rationale and processes used to determine the 2017 compensation of our named executive officers including the objectives and specific elements of our compensation program.
The Compensation Discussion and Analysis may contain statements regarding corporate performance targets and goals. The targets and goals are disclosed in the limited context of our compensation programs and should not be understood to be statements of management’s expectations or estimates of results or other guidance. We specifically caution investors not to apply these statements to other contexts.
Our Named Executive Officers for 2017 were:
| David L. Goodin | President and Chief Executive Officer (CEO) |
| Jason L. Vollmer | Vice President, Chief Financial Officer (CFO) and Treasurer |
| David C. Barney | President and Chief Executive Officer - Construction Materials and Contracting Segment |
| Jeffrey S. Thiede | President and Chief Executive Officer - Construction Services Segment |
| Nicole A. Kivisto | President and Chief Executive Officer - Electric and Natural Gas Distribution Segments |
| Doran N. Schwartz | Former Vice President and Chief Financial Officer |
Mr. Schwartz resigned his position effective September 29, 2017.
Executive Summary
Pay for Performance
To ensure management’s interests are aligned with those of our stockholders and the performance of the company, over 75% of the CEO’s target compensation and over 60% of the other current named executive officers’ target compensation is dependent on the achievement of company performance targets. The charts below show the target pay mix for the CEO and average target pay mix of the other current named executive officers, including base salary and the annual and long-term at-risk performance incentives.
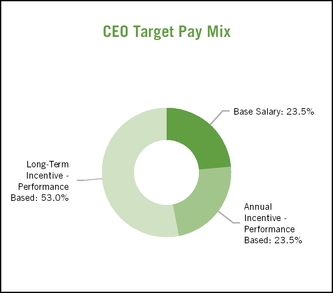
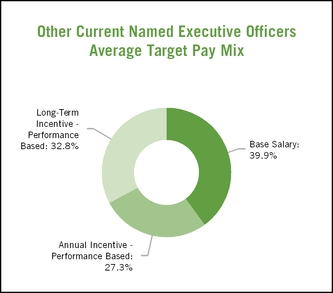
28 MDU Resources Group, Inc. Proxy Statement
Proxy Statement
Annual Base Salary
We provide our executive officers with base salary at a sufficient level to attract, recruit, and retain executives with the knowledge, skills, and abilities necessary to successfully execute their job responsibilities. Consistent with our compensation philosophy of linking pay to performance, our executives receive a relative smaller percentage of their overall target compensation in the form of base salary. In establishing base salaries, the compensation committee considers each executive’s individual performance, the scope and complexities of their responsibilities, internal equity, and whether the executive’s base salary is competitive as measured against the base salaries of similarly situated executives in our peer group and market compensation data.
Annual Cash Incentive Awards
Annual cash incentive awards for our executive officers are linked to performance by rewarding achievement of operational and financial goals and ensuring our executive officers are focused and accountable for our growth and profitability. The design of the annual cash incentive award opportunities for 2017 was the same as the design used in 2016. Each executive is assigned a target annual incentive award based on a percentage of the executive’s base salary. The actual annual cash incentive realized is determined by multiplying the target award by the payout percentage associated with achievement of the executive’s performance measures.
The compensation committee selected specific business segment financial performance measures for each business segment executive which represented 80% of their annual award opportunity. The other 20% of the business segment executives’ annual award opportunity was based on the achievement of overall company earnings per share (EPS). These measures incentivize our business segment executives to focus on the success and performance of their business segment while keeping the overall success of the company in mind.
The annual cash incentive award for corporate executives (including our CEO and CFO) is based on the achievement of each business segment’s performance measures and weighted by each business segment’s invested capital relative to overall company invested capital. The executive’s target award is multiplied by the sum of the weighted achievement percentages for the business segments to derive the executive’s realized annual award. This incentivizes the corporate executives to assist the business segments in their success while still emphasizing overall company performance. See the “Annual Incentives” section within this Compensation Discussion and Analysis for further details on our company’s annual cash incentive program.
The following chart shows the annual incentive payout of target realized by our CEO with a comparison to earnings per share from continuing operations for the last five years and demonstrates the alignment between our financial performance and realized annual cash incentive compensation.
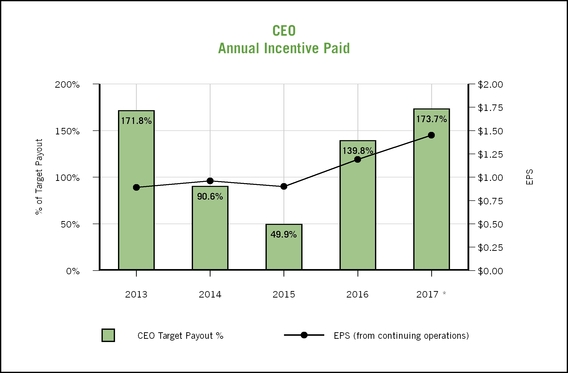
* MDU Resources Group, Inc. reported 2017 earnings from continuing operations of $1.45 per share which included a benefit of 20 cents per share attributable to the federal Tax Cuts and Jobs Act, which was signed into law December 22, 2017. The earnings per share absent the federal Tax Cuts and Jobs Act benefit is $1.25. | ||||
MDU Resources Group, Inc. Proxy Statement 29
Proxy Statement
Long-Term Equity-Based Incentive Awards
Our compensation committee grants long-term incentives to our executives in the form of performance shares which vest into company stock plus dividend equivalents after a three-year period only if certain performance measures are achieved. The performance measure used for our long-term incentives is based on our company’s total stockholder return (TSR) in comparison to that of our peers measured over a three-year period. The following chart depicts the actual vesting percentage for the last five performance cycles and demonstrates the alignment between total return to our stockholders and our realized long-term incentive compensation.
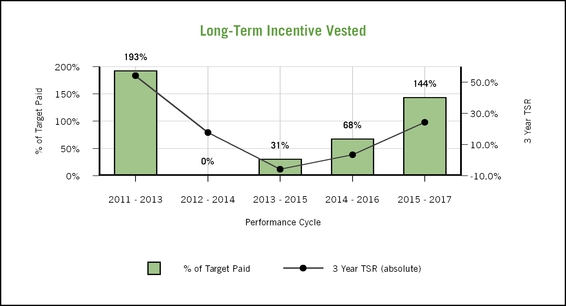
See the “Long-Term Incentives” section within this Compensation Discussion and Analysis for further details on the company’s long-term incentive program.
With the majority of our executive officer’s compensation dependent on the achievement of performance measures set by the compensation committee, we believe there is substantial alignment between executive pay and the company’s performance.
Stockholder Advisory Vote (“Say on Pay”)
At our 2017 Annual Meeting of Stockholders, 95.8% of the votes cast on the “Say on Pay” proposal approved the compensation of our named executive officers. The compensation committee viewed the 2017 vote as an expression of the stockholders general satisfaction with the company’s executive compensation programs. The compensation committee reviewed and considered the 2017 vote on “Say on Pay” in setting compensation for 2018 by continuing to link performance-based annual and long-term incentives to company financial performance and shareholder value.
30 MDU Resources Group, Inc. Proxy Statement
Proxy Statement
Compensation Practices
Our practices and policies ensure alignment between the interests of our stockholders and our executives as well as effective compensation governance.
| What We Do | |
| þ | Pay for Performance - Annual and long-term award incentives tied to performance measures set by the compensation committee comprise the largest portion of executive compensation. |
| þ | Independent Compensation Committee - All members of the compensation committee meet the independence standards under the New York Stock Exchange listing standards and the Securities and Exchange Commission rules. |
| þ | Independent Compensation Consultant - The compensation committee retains an independent compensation consultant to evaluate executive compensation plans and practices. |
| þ | Competitive Compensation - Executive compensation reflects the executive’s performance, experience, relative value compared to other positions within the company, relationship to competitive market value compensation, the business segment’s economic environment, and the actual performance of the overall company or the executive’s business segment. |
| þ | Annual Cash Incentive - Payment of annual cash incentive awards are based on business segment and overall company achievement against pre-established financial measures. |
| þ | Long-Term Equity Incentive - The long-term equity incentive represents 53% of our CEO’s and approximately 33% of our other current named executive officer’s target compensation in the form of performance shares which may be earned based on relative TSR performance measured over a three-year period. |
| þ | Annual Compensation Risk Analysis - We regularly analyze the risks related to our compensation programs and conduct an annual broad risk assessment. |
| þ | Stock Ownership and Retention Requirements - Executive officers are required to own, within five years of appointment or promotion, company common stock equal to a multiple of their base salary. The executive officers must also retain at least 50% of the net after tax shares of stock vested through the long-term incentive plan for the earlier of two years or until termination of employment. |
| þ | Clawback Policy - If the company’s audited financial statements are restated, the compensation committee may, or shall if required, demand repayment of some or all incentives paid to our executive officers within the last three years. |
| þ | Performance Share Awards Purchased at Market - Performance share awards are purchased on the market to avoid shareholder dilution by issuing authorized but unissued shares. |
| What We Don’t Do | |
| ý | Stock Options - The company does not use stock options as a form of incentive compensation. |
| ý | Employment Agreements - Current executives do not have employment agreements entitling them to specific payments upon a change of control of the company. |
| ý | Perquisites - Executives do not receive perquisites which materially differ from those available to employees in general. |
| ý | Tax Gross-Ups - Executive officers do not receive tax gross-ups on any compensation. |
| ý | Hedge Stock - Executives and directors are not allowed to hedge company securities. |
| ý | Pledge Stock - Executives and directors are not allowed to pledge company securities in margin accounts or as collateral for loans. |
| ý | No Dividends or Dividend Equivalents on Unvested Shares - We do not provide for payment of dividends or dividend equivalents on unvested share awards. |
MDU Resources Group, Inc. Proxy Statement 31
Proxy Statement
2017 Compensation Framework
Objectives of our Compensation Program
We have a written executive compensation policy for our executive officers, including all our named executive officers. Our policy’s stated objectives are to:
| • | recruit, motivate, reward, and retain high performing executive talent required to create superior long-term total stockholder return in comparison to our peer group; |
| • | reward executives for short-term performance, as well as for growth in enterprise value over the long-term; |
| • | provide a competitive compensation package relative to industry-specific and general industry comparisons and internal equity; |
| • | ensure effective utilization and development of talent by working in concert with other management processes - for example, performance appraisal, succession planning, and management development; and |
| • | ensure that compensation programs do not encourage or reward excessive or imprudent risk taking. |
Compensation Decision Process for 2017
For 2017, the compensation committee made recommendations to the board of directors regarding compensation of all executive officers, and the board of directors then approved the recommendations. The CEO’s role in the process includes the assessment of executive officer performance and recommending base salaries for the executive officers other than himself. The CEO attended all the compensation committee meetings but was not present during discussions of his compensation. The compensation committee established and approved base salaries and performance measures for the annual and long-term incentive compensation for 2017. They also certified the achievement of performance measures associated with annual and long-term incentive compensation.
At least every two years, the compensation committee hires an independent consulting firm to assess and recommend competitive pay levels, including base salaries and incentive compensation associated with executive officer positions. Typically the consulting firm conducts its analysis in even numbered years. In odd numbered years, the assessment is performed by the company’s human resources department using a variety of industry specific sources. In August 2016, Willis Towers Watson prepared the analysis of and provided recommendations for the 2017 compensation structure.
Components of Compensation
The components of our executive officer’s compensation are selected to drive financial and operational results as well as align the executive officer’s interests with those of our stockholders. The components of our executive compensation include:
| Component | Payments | Purpose | How Determined | How it Links to Performance | ||
| Base Salary | Assured | Provides sufficient, regularly paid income to recruit and retain executives with the knowledge, skills, and abilities necessary to successfully execute their job responsibilities. | Based on recommendation from the CEO for executives other than himself and analysis of peer company and industry compensation information. | Base salary is a means to attract and retain talented executives capable of driving success and performance. | ||
| Annual Cash Incentive | Performance Based At Risk | Provides an opportunity to earn annual incentive compensation to ensure focus on annual financial and operating results and to be competitive from a total renumeration standpoint. | Annual cash incentives are calculated as a percentage of base salary with payout based on the achievement of multiple performance measures established by the compensation committee. | Annual incentive performance measures are tied to the achievement of financial goals aimed to drive the success of the company. | ||
| Performance Shares | Performance Based At Risk | Provides an opportunity to earn long-term compensation to ensure focus on stockholder return and to be competitive from a total renumeration standpoint. | Performance share award opportunities are calculated as a percentage of base salary with vesting based on the company’s total stockholder return over a three-year period in comparison to the company’s peer group. | Fosters ownership in company stock and aligns the executive’s interests with those of the stockholder in increasing stockholder value. | ||
32 MDU Resources Group, Inc. Proxy Statement
Proxy Statement
Allocation of Total Target Compensation for 2017
Total target compensation consists of base salary plus target annual and long-term incentive compensation. Performance-based compensation accounts for over 75% of our CEO’s and on average approximately 60% of our other current named executive officers’ total target compensation. Incentive compensation, which consists of annual cash incentive and three-year performance share award opportunities, comprises the largest portion of our named executive officers’ total target compensation because:
| • | our named executive officers are in positions to drive, and therefore bear high levels of responsibility for our corporate performance; |
| • | incentive compensation is dependent upon our performance; |
| • | incentive compensation helps ensure focus on performance measures that are aligned with our overall strategy; and |
| • | the interests of the named executive officers are aligned with those of stockholders by making a significant portion of their target compensation contingent upon results beneficial to stockholders. |
To foster and reward long-term growth, the compensation committee generally allocates a higher percentage of total target compensation to the target long-term incentive than to the target annual incentive for our higher level executives because they are in a better position to influence our long-term performance. The long-term incentive awards, if earned by achieving performance measures, are paid in company common stock. These awards, combined with our stock retention requirements and our stock ownership policy, promote ownership of our stock by the executive officers. The compensation committee believes, as stockholders, the executive officers will be motivated to deliver results that build value for all stockholders over the long term.
Peer Group
The compensation committee evaluates the company’s compensation plan and its performance relative to a group of peer companies in determining compensation and the vesting of long-term incentive compensation. The companies included in our peer group are evaluated every year and are selected to be representative of the industries in which we operate. Questar was removed from our peer group for 2017 due to its acquisition by Dominion Energy. The following chart depicts the companies included in our 2017 peer group.
| 2017 Peer Companies | |
| Regulated Energy Delivery | Construction Materials and Services |
| ALLETE, Inc. | EMCOR Group, Inc. |
| Alliant Energy Corporation | Granite Construction Incorporated |
| Atmos Energy Corporation | IES Holdings, Inc. |
| Avista Corporation | Martin Marietta Materials, Inc. |
| Black Hills Corporation | MYR Group, Inc. |
| IDACORP, Inc. | Quanta Services, Inc. |
| National Fuel Gas Company | Sterling Construction Company, Inc. |
| Northwest Natural Gas Company | U.S. Concrete, Inc. |
| NorthWestern Corporation | Vulcan Materials Company |
| Vectren Corporation | |
2017 Compensation for Our Named Executive Officers
2017 Salary and Incentive Targets
At its November 2016 meeting, the compensation committee considered the company’s financial performance, return on invested capital for the company and individual business segments, the compensation report prepared and presented by Willis Towers Watson at its August 2016 meeting, executive performance appraisals, each executive’s tenure in position, and input and recommendations from the CEO and human resources department, in approving base salaries for the named executive officers for 2017. Mr. Goodin was not present during the portion of the meeting where the compensation committee discussed and approved the president and CEO base salary for 2017. At its February 2017 meeting, the compensation committee approved the annual and long-term incentive opportunities for our named executive officers. The following information relates to each named executive officer’s base salary, target cash annual incentive, target long-term incentive, and total direct compensation:
MDU Resources Group, Inc. Proxy Statement 33
Proxy Statement
| David L. Goodin | 2017 ($) | Compensation Component as a % of Base Salary | ||
| Base Salary | 792,750 | n/a | ||
| Target Annual Incentive Opportunity | 792,750 | 100 | % | |
| Target Long-Term Incentive Opportunity | 1,783,688 | 225 | % | |
| Target Total Potential Direct Compensation | 3,369,188 | 425 | % | |
| The Compensation Committee increased Mr. Goodin’s base salary by 5% for 2017 based on his and the company’s performance in 2016. No changes were made to Mr. Goodin’s annual or long-term incentive targets as a percentage of base salary for 2017. | ||||
| Jason L. Vollmer | 2017 ($) | Compensation Component as a % of Base Salary | ||
| Base Salary | 350,000 | n/a | ||
| Target Annual Incentive Opportunity | 132,981 | 38 | % | |
| Target Long-Term Incentive Opportunity | 112,750 | 32 | % | |
| Target Total Potential Direct Compensation | 595,731 | 170 | % | |
Upon his promotion on September 30, 2017, Mr. Vollmer’s base salary was set at $350,000 with an annual incentive target of 65% of his base salary. For 2017, Mr. Vollmer’s base salary and annual cash incentive were prorated for the period of time in his position. Due to the timing of Mr. Vollmer’s promotion, the target long-term incentive opportunity for 2017 was not changed and is based on 50% of Mr. Vollmer’s base salary prior to promotion. | ||||
| David C. Barney | 2017 ($) | Compensation Component as a % of Base Salary | ||
| Base Salary | 427,140 | n/a | ||
| Target Annual Incentive Opportunity | 320,355 | 75 | % | |
| Target Long-Term Incentive Opportunity | 384,426 | 90 | % | |
| Target Total Potential Direct Compensation | 1,131,921 | 265 | % | |
| Mr. Barney received a 5% increase in base salary for 2017 due to his success in management of the construction materials and contracting segment to a record year of earnings in 2016. For 2017, the compensation committee maintained Mr. Barney’s target annual incentive opportunity at 75% of his base salary but increased his long-term incentive opportunity from 80% to 90% to be consistent with the other business unit presidents and to be competitive with construction industry peers. | ||||
| Jeffrey S. Thiede | 2017 ($) | Compensation Component as a % of Base Salary | ||
| Base Salary | 437,750 | n/a | ||
| Target Annual Incentive Opportunity | 328,313 | 75 | % | |
| Target Long-Term Incentive Opportunity | 393,975 | 90 | % | |
| Target Total Potential Direct Compensation | 1,160,038 | 265 | % | |
| Mr. Thiede received a 3% increase in his base salary for 2017 in recognition of his successful management of the construction services segment during 2016. For 2017, the compensation committee maintained Mr. Thiede’s target annual cash incentive opportunity at 75% of base salary but increased his long-term incentive opportunity from 80% to 90% to be consistent with the other business unit presidents and to be consistent with construction industry peers. | ||||
34 MDU Resources Group, Inc. Proxy Statement
Proxy Statement
| Nicole A. Kivisto | 2017 ($) | Compensation Component as a % of Base Salary | ||
| Base Salary | 378,000 | n/a | ||
| Target Annual Incentive Opportunity | 245,700 | 65 | % | |
| Target Long-Term Incentive Opportunity | 340,200 | 90 | % | |
| Target Total Potential Direct Compensation | 963,900 | 255 | % | |
| Ms. Kivisto received a base salary increase of 18% reflecting her success and management of the electric and natural gas distribution segments in 2016, her tenure within her position, and internal equity. No changes were made to her target annual and long-term incentive opportunities as a percentage of base salary for 2017. | ||||
| Doran N. Schwartz | 2017 ($) | Compensation Component as a % of Base Salary | ||
| Base Salary | 391,500 | n/a | ||
| Target Annual Incentive Opportunity | 254,475 | 65 | % | |
| Target Long-Term Incentive Opportunity | 352,350 | 90 | % | |
| Target Total Potential Direct Compensation | 998,325 | 255 | % | |
| Mr. Schwartz received a 3% increase in base salary to reflect his successful management of the accounting and finance areas of the company during 2016. No changes were made to his target annual or long-term incentive opportunities as a percentage of base salary for 2017. Mr. Schwartz resigned his position on September 29, 2017, and as a result he was not eligible to receive an annual cash or long-term incentive award payment for 2017. | ||||
Annual Incentives
Annual incentive awards are determined for business segment executives by the achievement of specific performance measures selected by the compensation committee including financial performance measures specific to each business segment and a performance measure based on overall company EPS. For corporate executives, annual incentive awards are determined as the sum of the weighted portion of the percentage award payout of each business segment based upon achievement of its performance measures and weighted by the business segment’s invested capital relative to the overall company invested capital. Through this, our business segment executives are incentivized to primarily focus on the success and performance of their business segment while keeping the overall financial success of the company in mind, whereas our corporate executives are incentivized to assist in the success and performance of all lines of business.
The compensation committee considered and selected financial performance measures to ensure that compensation to the executives reflects the success of their respective business segments and the company as well as value provided to our stockholders. Each business segment president’s performance measures include a corporate earnings per share performance measure representing 20% of the target award opportunity and business segment financial performance measures representing 80% of the award opportunity. The following annual incentive performance measures for 2017 were adopted by the compensation committee for the business segment presidents (exclusive of the MDU Resources Group, Inc. corporate executive officers) at the February 2017 meeting:
MDU Resources Group, Inc. Proxy Statement 35
Proxy Statement
| Measure | Applies to | Purpose | Measurement | Target | Weight | How Target was Selected |
| MDU Resources Diluted Adjusted Earnings per Share (EPS) | All the Business Segment Presidents | EPS is a generally accepted accounting principle (GAAP) measurement and is a key driver of stockholder return. This goal applies to the presidents of all business segments to engage them as members of the company’s Management Policy Committee in the overall success of the company. | GAAP EPS (diluted) before discontinued operations plus any operations discontinued after December 31, 2016 and adjusted to remove: - the effect on earnings from losses on asset sales/dispositions pre-approved by the board, - the effect on earnings from withdrawal liabilities relating to multi-employer pension plans, - the effect on earnings from any acquisitions, mergers, or divestitures initiated in 2017, and - the effect on earnings from amendments to the United States tax code adopted in 2017. | $1.15 | 20% | Target reflects anticipated EPS performance within the range of guidance for 2017 while also being higher than 2016 target and actual results. |
| Return on Invested Capital (ROIC) | Electric and Natural Gas Distribution Segments President | Provides a measure of how effective the business segment uses its capital and generates a return from its capital. These segments are primarily regulated entities requiring significant capital investment. ROIC is important in providing a return to our stockholders. | Business segment earnings, without regard to after tax interest expense and preferred stock dividends divided by the business segment’s average capitalization for the calendar year. | 4.7% | 40% | Target reflects returns necessary to achieve the segments’ risk adjusted capital costs while also being higher than 2016 target and actual results in expectation of regulatory rate relief for major capital investments made in 2015. |
Pipeline and Midstream Segment President | 6.0% | 40% | Target reflects returns necessary to achieve the segment’s risk adjusted capital costs while also being higher than the 2016 target but lower than the 2016 actual results in recognition of lower expected revenues in 2017 resulting from the sale of the Pronghorn gas processing plant. | |||
| Business Segment Earnings | Electric and Natural Gas Distribution Segments President | Provides a measure of financial performance. | GAAP business segment earnings adjusted to exclude: - the effect on earnings from losses on asset sales/dispositions pre-approved by the board, - the effect on earnings from withdrawal liabilities related to multi-employer pension plans, - the effect on earnings from any acquisitions, mergers, or divestitures initiated in 2017, and - the effect on earnings from amendments to the United States tax code adopted in 2017. | $77.7 million | 40% | Target reflects earnings necessary to achieve the segments’ risk adjusted capital costs while also being higher than 2016 target and actual results. |
Pipeline and Midstream Segment President | $18.0 million | 40% | Target reflects earnings necessary to achieve the segment’s risk adjusted capital costs while lower than 2016 target and actual results in recognition of lower expected earnings in 2017 resulting from the sale of the Pronghorn gas processing plant. | |||
Construction Materials and Contracting Segment President | $63.6 million | 80% | Target reflects earnings necessary to achieve the segment’s risk adjusted capital costs and higher than 2016 target but lower than 2016 actual results in recognition that factors contributing to the segment’s record success in 2015 and 2016, such as favorable weather, may not be repeated in 2017. | |||
Construction Services Segment President | $28.1 million | 80% | Target reflects earnings above that necessary to achieve the segment’s risk adjusted capital costs but lower than 2016 target and actual earnings in recognition of the segment’s expectation for growth but offset by the loss of earnings from solar generation projects completed in 2016. | |||
36 MDU Resources Group, Inc. Proxy Statement
Proxy Statement
Actual performance results are compared to target performance measures to arrive at a percent of target achieved. The percent of target achieved is translated into a payout percentage of the target award opportunity with 100% achievement of a performance measure corresponding to a payout equal to the target annual award opportunity. Receipt of a payout requires threshold achievement of a performance measure which varies by business segment. For the company EPS performance measure, as well as the regulated energy delivery companies’ business segment performance measures, threshold payout requires achievement of 85% of the target performance measure which results in a payout of 25% of the award opportunity. For the construction materials and contracting and construction services business segments’ performance measures, threshold payout requires earnings of an amount necessary to achieve a return on invested capital equal to the segment’s risk adjusted capital costs. Maximum payouts also vary by business segment. For the company EPS performance measure, as well as the regulated energy delivery companies’ business segment performance measures, maximum payout of 200% of the award opportunity is received if the percent of target achieved is 115% or greater. For the construction materials and contracting business segment performance measure, payout levels of 200%, and a maximum payout level of 250%, is received if earnings achieve returns on invested capital of 11.9% and 12.9%, respectively. For the construction services business segment performance measure, payout levels of 200%, and a maximum payout level of 250%, is received if earnings achieve returns on invested capital of 11.5% and 14.9%, respectively. Results achieved between the payout levels are calculated using linear interpolation.
2017 Annual Performance Incentive Results
The following table shows the 2017 performance measure results, percent of target achieved based on those results, and the associated payout percentages:
| Business Segment | Performance Measure | Result | Percent of Performance Measure Achieved | Percent of Award Opportunity Payout | Weight | Weighted Award Opportunity Payout % | |||||
| All Business Segments | Earnings per Share | $1.26 | 109.6 | % | 163.8 | % | 20 | % | 32.8 | % | |
| Electric and Natural Gas Distribution Segments | Earnings | $88.0 million | 113.3 | % | 188.5 | % | 40 | % | 75.4 | % | |
| ROIC | 5.2 | % | 110.6 | % | 170.9 | % | 40 | % | 68.4 | % | |
| Pipeline and Midstream Segment | Earnings | $20.6 million | 114.6 | % | 197.8 | % | 40 | % | 79.1 | % | |
| ROIC | 7.0 | % | 116.7 | % | 200.0 | % | 40 | % | 80.0 | % | |
| Construction Materials and Contracting Segment | Earnings | $81.5 million | 128.2 | % | 147.7 | % | 80 | % | 118.2 | % | |
| Construction Services Segment | Earnings | $49.0 million | 174.6 | % | 242.1 | % | 80 | % | 193.7 | % | |
For our corporate named executive officers, namely Messrs. Goodin and Vollmer, the compensation committee continued to base the payout of the annual cash incentives on the achievement of performance measures at the business segments weighted by each business segment’s average invested capital relative to the company’s total invested capital. The compensation committee believes this approach provides alignment between our corporate executives and business segment performance. Messrs. Goodin’s and Vollmer’s 2017 annual cash incentives were earned at 173.7% of the target award opportunity based on the following proportional weighted sum of the annual business segment payouts:
| Business Segment | Column A Business Segment Award Opportunity Payout | Column B Percentage of Average Invested Capital | Column A x Column B | |||||
| Electric and Natural Gas Distribution | 176.6 | % | 60.3 | % | 106.5 | % | ||
| Pipeline and Midstream | 191.9 | % | 8.6 | % | 16.5 | % | ||
| Construction Materials and Contracting | 151.0 | % | 22.0 | % | 33.2 | % | ||
Construction Services1 | 192.8 | % | 9.1 | % | 17.5 | % | ||
| Total Payout Percentage | 173.7 | % | ||||||
1 For purposes of calculating the annual incentive payouts for corporate executives, the award opportunity payout associated with the earnings performance measure for the construction services segment was limited to 200%, which resulted in an unweighted construction services segment award opportunity payout percentage of 192.8% whereas the construction services segment president achieved an award opportunity payout of 226.5%. | ||||||||
MDU Resources Group, Inc. Proxy Statement 37
Proxy Statement
Based on the achievement of the performance targets, the named executive officers received the following 2017 annual incentive compensation:
| Name | Target Annual Incentive ($) | Annual Incentive Earned | ||
Payout as a % of Target (%) | Amount ($) | |||
| David L. Goodin | 792,750 | 173.7 | 1,377,007 | |
Jason L. Vollmer1 | 132,981 | 173.7 | 230,988 | |
| David C. Barney | 320,355 | 151.0 | 483,736 | |
| Jeffrey S. Thiede | 328,313 | 226.5 | 743,629 | |
| Nicole A. Kivisto | 245,700 | 176.6 | 433,906 | |
Doran N. Schwartz2 | 254,475 | — | — | |
1 Mr. Vollmer’s target annual incentive is prorated based on three months in his new position as vice president, CFO and treasurer and nine months in his former position as vice president, chief accounting officer and treasurer. | ||||
2 Mr. Schwartz resigned effective September 29, 2017. As a result, he was not eligible for an annual incentive payment. | ||||
Long-Term Incentives
As in the past, the compensation committee used performance shares as the form of long-term incentive compensation for 2017 and established the company’s total stockholder return as a percentile of the total stockholder return for the peer group companies over a three-year period as the performance measure for vesting of long-term incentive compensation.
Total stockholder return is the percentage change in the value of an investment in the common stock of a company from the closing price on the last trading day in the calendar year preceding the beginning of the performance period through the last trading day in the final year of the performance period. It is assumed that dividends are reinvested in additional shares of common stock at the frequency paid during the performance period. The compensation committee selected total stockholder return as the performance measure because long-term executive incentive compensation should align with our long-term performance in stockholder return as compared to other public companies in our industries.
Depending on our total three-year stockholder return compared to the total three-year stockholder returns of our peer group companies, vesting of performance share award opportunities for our named executive officers can range from 0% to 200% of the target award. Vesting of the performance share opportunities will be a function of our rank over the performance period against our peer group companies as delineated in the following table:
| The Company’s Peer TSR Percentile Rank | Vesting Percentage of Award Target |
| 75th or higher | 200% |
| 50th | 100% |
| 25th | 20% |
| Less than 25th | 0% |
Vesting for percentile ranks falling between the intervals is interpolated. If our total stockholder return over the performance period is negative, the shares and dividend equivalents otherwise earned based on the payout percentages above, if any, are reduced in accordance with the following table:
| Total Stockholder Return | Reduction in Vesting |
| 0% through -5% | 50% |
| -5.01% through -10% | 60% |
| -10.01% through -15% | 70% |
| -15.01% through -20% | 80% |
| -20.01% through -25% | 90% |
| -25.01% or below | 100% |
38 MDU Resources Group, Inc. Proxy Statement
Proxy Statement
Dividend equivalents are paid at the time of settlement in cash based on the number of shares actually vested for the performance period. No dividend equivalents are paid on unvested performance shares.
Actual vesting of performance share awards under the plan over the last five years is shown below:
| Performance Period | Vesting Percentage |
| 2015-2017 | 144% |
| 2014-2016 | 68% |
| 2013-2015 | 31% |
| 2012-2014 | 0% |
| 2011-2013 | 193% |
Results of 2015-2017 Performance Period
Our total stockholder return ranking among the peer group companies prior to our exit from the oil and gas exploration business for the period of January 1, 2015 through November 30, 2015 was 21 out of 24, and the ranking among the peer group companies adjusted for our exit from the oil and gas exploration business for the period of December 1, 2015 through December 31, 2017 was 5 out of 20. This produced a combined percentile ranking of 61% for the 2015-2017 performance period which resulted in a 144% vesting of performance shares and dividend equivalents. The named executive officers received the following long-term compensation for the 2015-2017 performance period:
| Name | Target Performance Shares (#) | Performance Shares Vested (#) | Dividend Equivalents ($) | Value of Shares and Dividend Equivalents at 12/29/17 ($)1 | ||||
| David L. Goodin | 72,164 | 103,916 | 235,370 | 3,029,151 | ||||
| Jason L. Vollmer | 1,911 | 2,751 | 6,231 | 80,192 | ||||
| David C. Barney | 11,745 | 16,912 | 38,306 | 492,985 | ||||
| Jeffrey S. Thiede | 12,638 | 18,198 | 41,218 | 530,472 | ||||
| Nicole A. Kivisto | 12,234 | 17,616 | 39,900 | 513,506 | ||||
Doran N. Schwartz2 | 14,528 | — | — | — | ||||
1 Based on the average of the high and low share price at December 29, 2017, which was $26.885. | ||||||||
2 Mr. Schwartz resigned his position effective September 29, 2017; as a result he forfeited his performance shares. | ||||||||
2017-2019 Performance Period
On February 15, 2017, for the 2017-2019 performance period, the compensation committee determined the target number of performance shares for each named executive officer by multiplying the named executive officer’s 2017 base salary by a target long-term incentive percentage and then dividing by the average of the closing prices of our stock from January 1 through January 22, 2017, which was $28.82 per share. Based on this price, the board of directors, upon recommendation of the compensation committee, awarded the following performance share opportunities to the named executive officers:
| Name | Base Salary to Determine Target ($) | Target Long-Term Incentive % (%) | Long-Term Incentive Target ($) | Performance Share Opportunities (#) | |
| David L. Goodin | 792,750 | 225 | 1,783,688 | 61,890 | |
Jason L. Vollmer1 | 225,500 | 50 | 112,750 | 3,912 | |
| David C. Barney | 427,140 | 90 | 384,426 | 13,338 | |
| Jeffrey S. Thiede | 437,750 | 90 | 393,975 | 13,670 | |
| Nicole A. Kivisto | 378,000 | 90 | 340,200 | 11,804 | |
Doran N. Schwartz2 | 391,500 | 90 | 352,350 | 12,225 | |
1 Based on Mr. Vollmer’s position and salary on the date of grant. | |||||
2 Mr. Schwartz’s shares were forfeited upon his resignation effective September 29, 2017. | |||||
MDU Resources Group, Inc. Proxy Statement 39
Proxy Statement
The named executive officers must retain 50% of the net after-tax performance shares vested pursuant to the long-term incentive award until the earlier of two years from the date the vested shares are issued or the executive’s termination of employment. If the executive’s employment is terminated during the performance period for cause at any time, or for any reason other than cause before the executive has reached age 55 and completed ten years of service, all performance shares and related dividend equivalents are forfeited. The compensation committee may also require the executive officer to retain performance shares net of taxes if the executive has not met the stock ownership requirements under the company’s stock ownership policy for executives.
Other Benefits
The company provides post employment benefit plans and programs in which our named executive officers may be participants. We believe it is important to provide post-employment benefits which approximate retirement benefits paid by other employers to executives in similar positions. The compensation committee periodically reviews the benefits provided to maintain a market-based benefits package. Our named executive officers participated in the following plans during 2017 which are described below:
| Plans | David L. Goodin | Jason L. Vollmer | David C. Barney | Jeffrey S. Thiede | Nicole A. Kivisto | Doran N. Schwartz |
| 401(k) | Yes | Yes | Yes | Yes | Yes | Yes |
| Pension | Yes | Yes | No | No | Yes | Yes |
| Supplemental Income Security Plan | Yes | No | Yes | No | Yes | Yes |
| Nonqualified Defined Contribution Plan | No | Yes | Yes | Yes | No | No |
401(k) Retirement Plan
The named executive officers as well as all employees working a minimum of 1,000 hours per year are eligible to participate in the 401(k) plan and defer annual income up to the IRS limit. The company provides a match up to 3% of the employee’s elected deferral rate. Contributions and the company match are invested in various funds based on the employee’s election including company common stock.
In 2010, the company began offering increased company contributions to our 401(k) plan in lieu of pension plan contributions. For non-bargaining unit employees hired after 2006 or who were not previously participants in the pension plan, the added retirement contribution is 5% of plan eligible compensation. For non-bargaining unit employees hired prior to 2006 and who were participants in the pension plan, the added retirement contributions are based on the employee’s age as of December 31, 2009. The retirement contribution is 11.5% for Mr. Goodin, 10.5% for Mr. Schwartz, 9.0% for Ms. Kivisto, 7.0% for Mr. Vollmer, and 5.0% for Messrs. Barney and Thiede. These amounts may be reduced in accordance with the provisions of the 401(k) plan to meet IRS limits.
Pension Plans
Effective in 2006, the defined benefit pension plans were closed to new non-bargaining unit employees and as of December 31, 2009, the defined benefit plans were frozen. For further details regarding the company’s pension plans, please refer to the section entitled “Pension Benefits for 2017.”
Supplemental Income Security Plan
We offer certain key managers and executives benefits under a nonqualified retirement plan, referred to as the Supplemental Income Security Plan (SISP). The SISP provides participants with additional retirement income and death benefits. Effective February 11, 2016, the SISP was amended to exclude new participants to the plan and freeze current benefit levels for existing participants. For further details regarding the company’s SISP, please refer to the section entitled “Pension Benefits for 2017.” Named executive officers participating in the SISP are Messrs. Goodin, Barney, and Schwartz, and Ms. Kivisto.
40 MDU Resources Group, Inc. Proxy Statement
Proxy Statement
The following table reflects our named executive officers’ SISP benefits as of December 31, 2017:
| Name | SISP Benefits | ||||
Annual Death Benefit ($) | Annual Retirement Benefit ($) | ||||
| David L. Goodin | 552,960 | 276,480 | |||
| Jason L. Vollmer | — | — | |||
| David C. Barney | 262,464 | 131,232 | |||
| Jeffrey S. Thiede | — | — | |||
| Nicole A. Kivisto | 157,728 | 78,864 | |||
| Doran N. Schwartz | 262,464 | 131,232 | |||
Nonqualified Defined Contribution Plan
The company adopted the Nonqualified Defined Contribution Plan (NQDCP) effective January 1, 2012, to provide retirement and deferred compensation for a select group of management and other highly compensated employees. The compensation committee, upon recommendation from the CEO, determines which employees will participate in the NQDCP and the amount of contributions for any year. After satisfying a vesting requirement for each contribution, distributions will be made in accordance with the terms of the plan. For further details regarding the company’s NQDCP, please refer to the section entitled “Nonqualified Deferred Compensation for 2017.”
For 2017, the compensation committee selected and approved contributions of $100,000 to Mr. Thiede, $150,000 to Mr. Barney, and $22,550 to Mr. Vollmer. The contributions awarded to Messrs. Barney, Thiede, and Vollmer represent 35.18%, 22.84%, and 10% of their base salaries, respectively.
Employment and Severance Agreements
We currently do not have employment or severance agreements with our executives entitling them to specific payments upon termination of employment or a change of control of the company. The compensation committee generally considers providing severance benefits on a case-by-case basis. Any post-employment or change of control benefits available to our executives are addressed within our incentive and retirement plans. Please refer to the section entitled “Potential Payments upon Termination or Change of Control.”
Compensation Governance
Impact of Tax and Accounting Treatment
The compensation committee may consider the impact of tax and/or accounting treatment in determining compensation.
Section 162(m) of the Internal Revenue Code limits the deductibility of certain compensation to $1 million paid to certain officers as a business expense in any tax year. When the compensation committee made its decisions for 2017 compensation, the tax code provided that compensation that qualified as “performance-based” was excluded from the $1 million deductibility limit if, among other requirements, the compensation was payable only upon attainment of pre-established, objective performance goals under a plan approved by our stockholders. Legislation signed into law in December 2017 (Tax Reform), however, expanded the number of individuals covered by the Section 162(m) deductibility limit and repealed the exception for performance-based compensation, effective for taxable years beginning after December 31, 2017. Incentive compensation approved by the compensation committee prior to the Tax Reform for our CEO and those executive officers whose overall compensation was likely to exceed $1 million was generally structured to meet the requirements for deductibility for purposes of Section 162(m). As a result of the Tax Reform, compensation paid to our covered executive officers in excess of $1 million will not be deductible, unless it qualifies for transition relief applicable to certain arrangements in place as of November 2, 2017.
The compensation committee also considers the accounting and cash flow implications of various forms of executive compensation. We expense salaries and annual incentive compensation as earned. For our equity awards, we record the accounting expense in accordance with Financial Accounting Standards Board 718, which is generally expensed over the vesting period.
MDU Resources Group, Inc. Proxy Statement 41
Proxy Statement
Stock Ownership Requirements
Executives participating in our Long-Term Performance-Based Incentive Plan are required within five years of appointment or promotion into an executive level to own our common stock equal to a multiple of their base salary as outlined in the stock ownership policy. Stock owned through our 401(k) plan or by a spouse is considered in ownership calculations. The level of stock ownership compared to the ownership requirement is determined based on the closing sale price of our stock on the last trading day of the year and base salary at December 31 of the same year. The table shows the named executive officers’ holdings as a multiple of their base salary.
| Name | Ownership Policy Multiple of Base Salary within 5 Years | Actual Holdings as a Multiple of Base Salary1 | Ownership requirement must be met by: | |
| David L. Goodin | 4X | 6.0 | 1/1/2018 | |
| Jason L. Vollmer | 3X | 0.4 | 1/1/2023 | |
| David C. Barney | 3X | 1.5 | 1/1/2019 | |
| Jeffrey S. Thiede | 3X | 1.3 | 1/1/2019 | |
| Nicole A. Kivisto | 3X | 2.9 | 1/1/2020 | |
| Doran N. Schwartz | n/a | n/a | n/a | |
1 Includes stock awards earned net of taxes for the 2015-2017 performance period. | ||||
Deferral of Annual Incentive Compensation
We provide executives the opportunity to defer receipt of earned annual incentives. If an executive chooses to defer all or part of an annual incentive, we credit the deferral with interest at a rate determined by the compensation committee. For 2017, the compensation committee chose to use an interest rate of 4.38% based on an average of the Moody’s U.S. Long-Term Corporate Bond Yield Average for “A” and “Baa” rated companies. The compensation committee’s reasons for using this interest rate recognized incentive deferrals are a low-cost source of capital for the company and are unsecured obligations and, therefore, carry a higher risk to the executives.
Clawback
In February 2016, we amended our Long-Term Incentive Plan and Executive Incentive Compensation Plan sections regarding the repayment of incentive compensation due to accounting restatements, commonly referred to as a clawback policy. The compensation committee may, or shall if required, take action to recover incentive-based compensation from specific executives in the event the company is required to restate its financial statements due to material noncompliance with any financial reporting requirements under the securities laws.
Policy Regarding Hedging Stock Ownership
Our executive compensation policy prohibits executive officers, which includes our named executive officers, from hedging their ownership of company common stock. Executives may not enter into transactions that allow the executive to benefit from devaluation of our stock or otherwise own stock technically but without the full benefits and risks of such ownership. See the section entitled “Security Ownership” for our policy on margin accounts and pledging of our stock.
COMPENSATION COMMITTEE REPORT
The compensation committee has reviewed and discussed the Compensation Discussion and Analysis required by Regulation S-K,
Item 402(b), with management. Based on the review and discussions referred to in the preceding sentence, the compensation committee recommended to the board of directors that the Compensation Discussion and Analysis be included in our Proxy Statement on Schedule 14A.
Thomas Everist, Chair
Karen B. Fagg
William E. McCracken
Patricia L. Moss
42 MDU Resources Group, Inc. Proxy Statement
Proxy Statement
EXECUTIVE COMPENSATION TABLES
Summary Compensation Table for 2017
| Name and Principal Position (a) | Year (b) | Salary ($) (c) | Bonus ($) (d) | Stock Awards ($) (e)1 | Option Awards ($) (f) | Non-Equity Incentive Plan Compensation ($) (g) | Change in Pension Value and Nonqualified Deferred Compensation Earnings ($) (h)2 | All Other Compensation ($) (i)3 | Total ($) (j) | |||||||||||||||
| David L. Goodin | 2017 | 792,750 | — | 1,504,546 | — | 1,377,007 | 342,727 | 40,971 | 4,058,001 | |||||||||||||||
| President and CEO | 2016 | 755,000 | — | 1,441,954 | — | 1,055,490 | 218,301 | 40,246 | 3,510,991 | |||||||||||||||
| 2015 | 755,000 | — | 1,386,992 | — | 376,745 | — | 39,411 | 2,558,148 | ||||||||||||||||
Jason L. Vollmer4 | 2017 | 256,625 | — | 95,101 | — | 230,988 | 3,681 | 48,156 | 634,551 | |||||||||||||||
| Vice President, CFO and | ||||||||||||||||||||||||
| Treasurer | ||||||||||||||||||||||||
| David C. Barney | 2017 | 427,140 | — | 324,247 | — | 483,736 | 93,786 | 173,331 | 1,502,240 | |||||||||||||||
| President and CEO of | 2016 | 406,800 | — | 276,232 | — | 593,114 | 77,565 | 22,905 | 1,376,616 | |||||||||||||||
| Knife River Corporation | 2015 | 395,000 | — | 225,739 | — | 637,588 | 9,530 | 22,556 | 1,290,413 | |||||||||||||||
| Jeffrey S. Thiede | 2017 | 437,750 | — | 332,318 | — | 743,629 | — | 123,163 | 1,636,860 | |||||||||||||||
| President and CEO of | 2016 | 425,000 | — | 288,598 | — | 489,600 | — | 122,708 | 1,325,906 | |||||||||||||||
| MDU Construction | 2015 | 425,000 | — | 242,902 | — | 161,857 | — | 172,506 | 1,002,265 | |||||||||||||||
| Services Group, Inc. | ||||||||||||||||||||||||
Nicole A. Kivisto5 | 2017 | 378,000 | — | 286,955 | — | 433,906 | 96,931 | 33,049 | 1,228,841 | |||||||||||||||
| President and CEO of | ||||||||||||||||||||||||
| Montana-Dakota Utilities Co. | ||||||||||||||||||||||||
Doran N. Schwartz6 | 2017 | 291,748 | — | 297,190 | — | — | 118,256 | 36,665 | 743,859 | |||||||||||||||
| Former Vice President | 2016 | 380,000 | 6,175 | 290,292 | — | 345,306 | 77,084 | 35,772 | 1,134,629 | |||||||||||||||
| and CFO | 2015 | 380,000 | — | 279,228 | — | 123,253 | — | 35,571 | 818,052 | |||||||||||||||
1 | Amounts in this column represent the aggregate grant date fair value of performance share award opportunities at target calculated in accordance with Financial Accounting Standards Board (FASB) generally accepted accounting principles for stock-based compensation in FASB Accounting Standards Codification Topic 718. This column was prepared assuming none of the awards were or will be forfeited. The amounts were calculated using the Monte Carlo simulation, as described in Note 10 of our audited financial statements in our Annual Report on Form 10-K for the year ended December 31, 2017. For 2017, the total aggregate grant date fair value of performance share award opportunities assuming the highest level of payout would be as follows: |
| Name | Aggregate grant date fair value at highest payout ($) | ||
| David L. Goodin | 3,009,092 | ||
| Jason L. Vollmer | 190,201 | ||
| David C. Barney | 648,494 | ||
| Jeffrey S. Thiede | 664,635 | ||
| Nicole A. Kivisto | 573,910 | ||
Doran N. Schwartza | 594,380 | ||
a Mr. Schwartz resigned effective September 29, 2017. As a result, he forfeited performance shares reported in column e. | |||
MDU Resources Group, Inc. Proxy Statement 43
Proxy Statement
2 | Amounts shown for 2017 represent the change in the actuarial present value for the named executive officers’ accumulated benefits under the pension plan, SISP, and Excess SISP, collectively referred to as the “accumulated pension change,” plus above-market earnings on deferred annual incentives as of December 31, 2017. |
| Name | Accumulated Pension Change ($) | Above Market Interest ($) | ||||
| David L. Goodin | 330,392 | 12,335 | ||||
| Jason L. Vollmer | 3,681 | — | ||||
| David C. Barney | 93,786 | — | ||||
| Nicole A. Kivisto | 96,629 | 302 | ||||
| Doran N. Schwartz | 118,256 | — | ||||
3 All Other Compensation is comprised of:
| Name | 401(k) ($)a | Life Insurance Premium ($) | Matching Charitable Contributions ($) | Nonqualified Defined Contribution Plan ($) | Total ($) | |||||||
| David L. Goodin | 39,150 | 621 | 1,200 | — | 40,971 | |||||||
| Jason L. Vollmer | 24,826 | 280 | 500 | 22,550 | 48,156 | |||||||
| David C. Barney | 21,600 | 531 | 1,200 | 150,000 | 173,331 | |||||||
| Jeffrey S. Thiede | 21,600 | 543 | 1,020 | 100,000 | 123,163 | |||||||
| Nicole A. Kivisto | 32,400 | 469 | 180 | — | 33,049 | |||||||
Doran N. Schwartzb | 36,000 | 365 | 300 | — | 36,665 | |||||||
a | Represents company contributions to the 401(k) plan, which includes matching contributions and retirement contributions made after the pension plans were frozen at December 31, 2009. | |||||||||||
b | Mr. Schwartz resigned effective September 29, 2017. | |||||||||||
4 | Mr. Vollmer was promoted to vice president, chief financial officer and treasurer effective September 30, 2017. He appears as a named executive officer for the first time in 2017. |
5 | Ms. Kivisto was promoted to president and chief executive officer of the electric and natural gas distribution segments effective January 9, 2015. She appears as a named executive officer for the first time in 2017. |
6 | Mr. Schwartz resigned effective September 29, 2017. As a result, he forfeited performance shares reported in column e. |
44 MDU Resources Group, Inc. Proxy Statement
Proxy Statement
Grants of Plan-Based Awards in 2017
| Estimated Future Payouts Under Non-Equity Incentive Plan Awards | Estimated Future Payouts Under Equity Incentive Plan Awards | Grant Date Fair Value of Stock and Option Awards ($) (l) | |||||||||||||||||||||
| Name (a) | Grant Date (b) | Threshold ($) (c) | Target ($) (d) | Maximum ($) (e) | Threshold (#) (f) | Target (#) (g) | Maximum (#) (h) | ||||||||||||||||
| David L. Goodin | 2/15/2017 | 1 | 198,188 | 792,750 | 1,585,500 | ||||||||||||||||||
| 2/15/2017 | 2 | 12,378 | 61,890 | 123,780 | 1,504,546 | ||||||||||||||||||
Jason L. Vollmer4 | 2/15/2017 | 3 | 33,245 | 132,981 | 265,962 | ||||||||||||||||||
| 2/15/2017 | 2 | 782 | 3,912 | 7,824 | 95,101 | ||||||||||||||||||
| David C. Barney | 2/15/2017 | 1 | 80,089 | 320,355 | 768,852 | ||||||||||||||||||
| 2/15/2017 | 2 | 2,668 | 13,338 | 26,676 | 324,247 | ||||||||||||||||||
| Jeffrey S. Thiede | 2/15/2017 | 1 | 82,078 | 328,313 | 787,951 | ||||||||||||||||||
| 2/15/2017 | 2 | 2,734 | 13,670 | 27,340 | 332,318 | ||||||||||||||||||
| Nicole A. Kivisto | 2/15/2017 | 3 | 61,425 | 245,700 | 491,400 | ||||||||||||||||||
| 2/15/2017 | 2 | 2,361 | 11,804 | 23,608 | 286,955 | ||||||||||||||||||
Doran N. Schwartz5 | 2/15/2017 | 1 | 63,619 | 254,475 | 508,950 | ||||||||||||||||||
| 2/15/2017 | 2 | 2,445 | 12,225 | 24,450 | 297,190 | ||||||||||||||||||
1 | Annual incentive for 2017 granted pursuant to the MDU Resources Group, Inc. Long-Term Performance-Based Incentive Plan. |
2 | Performance shares for the 2017-2019 performance period granted pursuant to the MDU Resources Group, Inc. Long-Term Performance-Based Incentive Plan. |
3 | Annual incentive for 2017 granted pursuant to the MDU Resources Group, Inc. Executive Incentive Compensation Plan. |
4 | Mr. Vollmer’s non-equity incentive award shown in columns c, d, and e is prorated based on his promotion effective September 30, 2017. |
5 | Mr. Schwartz resigned effective September 29, 2017, and forfeited his non-equity and equity incentive plan awards. |
Narrative Discussion Relating to the Summary Compensation Table
and Grants of Plan-Based Awards Table
and Grants of Plan-Based Awards Table
Annual Incentive
The compensation committee recommended the 2017 annual incentive award opportunities for our named executive officers and the board approved these opportunities at its meeting on February 15, 2017. The award opportunities at threshold, target, and maximum are reflected in columns (c), (d), and (e), respectively, of the Grants of Plan-Based Awards Table. The actual amount paid with respect to 2017 performance is reflected in column (g) of the Summary Compensation Table.
As described in the “Annual Incentives” section of the “Compensation Discussion and Analysis,” payment of annual award opportunities is dependent upon achievement of performance measures; actual payout may range from 0% to 200% of the target except for the construction materials and contracting and construction services segments which may range from 0% to 240%.
Messrs. Goodin, Schwartz, Barney, and Thiede received their 2017 annual incentive award opportunities pursuant to the Long-Term Performance-Based Incentive Plan. To be eligible to receive a payment, they must remain employed by the company through December 31, 2017. Mr. Schwartz resigned his position effective September 29, 2017, and therefore was not eligible to receive an annual incentive award.
The performance measures associated with the annual incentive may not be adjusted if the adjustment would increase their annual incentive award payment, unless the compensation committee determined and established the adjustment in writing within 90 days of the beginning of the performance period. The compensation committee may at its sole discretion use negative discretion based on subjective or objective measures and adjust any annual incentive award payment downward.
Mr. Vollmer and Ms. Kivisto were awarded their annual incentive opportunities pursuant to the MDU Resources Group, Inc. Executive Incentive Compensation Plan. Under the Executive Incentive Compensation Plan, executives who retire during the year at age 65 remain
MDU Resources Group, Inc. Proxy Statement 45
Proxy Statement
eligible to receive an award, but executives who terminate employment for other reasons are not eligible for an award. The compensation committee generally does not modify the performance measures; however, if major unforeseen changes in economic and environmental conditions or other significant factors beyond the control of management substantially affected management’s ability to achieve the specified performance measures, the compensation committee, in consultation with the CEO, may modify the performance measures. The compensation committee has full discretion to determine the extent to which goals have been achieved, the payment level, and whether to adjust payment of awards downward based upon individual performance. For further discussion of the specific 2017 incentive plan performance measures and results, see the “Annual Incentives” section in the “Compensation Discussion and Analysis.”
Long-Term Incentive
The compensation committee recommended long-term incentive award opportunities for the named executive officers in the form of performance shares, and the board approved the award opportunities at its meeting on February 15, 2017. The long-term incentive opportunities are presented as the number of performance shares at threshold, target, and maximum in columns (f), (g), and (h) of the Grants of Plan-Based Awards Table. The value of the long-term performance-based incentive opportunities is based on the aggregate grant date fair value and is reflected in column (e) of the Summary Compensation Table and column (l) of the Grant of Plan-Based Awards Table.
Depending on our 2017-2019 total stockholder return compared to the total three-year stockholder returns of our peer group companies, executives will receive from 0% to 200% of the target awards in February 2020. We also will pay dividend equivalents in cash on the number of shares actually vested for the performance period. The dividend equivalents will be paid in 2020 at the same time as the performance share awards are issued. In the event the company’s 2017-2019 total stockholder return is negative, the number of shares that would otherwise vest for the performance period will be reduced from 50% to 100%. For further discussion of the specific long-term incentive plan, see the “Long-Term Incentives” section in the “Compensation Discussion and Analysis.”
Nonqualified Defined Contribution Plan
The CEO recommends participants and contribution amounts to the Nonqualified Defined Contribution Plan which are approved by the compensation committee of the board of directors. The purpose of the plan is to recognize outstanding performance coupled with enhanced retention as the Nonqualified Defined Contribution Plan requires a vesting period. The amount shown in column (i) - All Other Compensation of the Summary Compensation Table includes contributions of $100,000 for Mr. Thiede, $150,000 for Mr. Barney, and $22,550 for Mr. Vollmer. For further information, see the section entitled “Nonqualified Deferred Compensation for 2017.”
Salary and Bonus in Proportion to Total Compensation
The following table shows the proportion of salary and bonus to total compensation:
| Name | Salary ($) | Bonus ($) | Total Compensation ($) | Salary and Bonus as a % of Total Compensation | ||||||||||
| David L. Goodin | 792,750 | — | 4,058,001 | 19.5 | % | |||||||||
| Jason L. Vollmer | 256,625 | — | 634,551 | 40.4 | % | |||||||||
| David C. Barney | 427,140 | — | 1,502,240 | 28.4 | % | |||||||||
| Jeffrey S. Thiede | 437,750 | — | 1,636,860 | 26.7 | % | |||||||||
| Nicole A. Kivisto | 378,000 | — | 1,228,841 | 30.8 | % | |||||||||
| Doran N. Schwartz | 291,748 | — | 743,859 | 39.2 | % | |||||||||
46 MDU Resources Group, Inc. Proxy Statement
Proxy Statement
Outstanding Equity Awards at Fiscal Year-End 2017
| Stock Awards | ||||||||||||
| Name (a) | Number of Shares or Units of Stock That Have Not Vested (#) (g) | Market Value of Shares or Units of Stock That Have Not Vested ($) (h) | Equity Incentive Plan Awards: Number of Unearned Shares, Units or Other Rights That Have Not Vested (#) (i)1 | Equity Incentive Plan Awards: Market or Payout Value of Unearned Shares, Units or Other Rights That Have Not Vested ($) (j)2 | ||||||||
| David L. Goodin | — | — | 354,234 | 9,521,810 | ||||||||
| Jason L. Vollmer | — | — | 14,138 | 380,029 | ||||||||
| David C. Barney | — | — | 63,998 | 1,720,266 | ||||||||
| Jeffrey S. Thiede | — | — | 67,544 | 1,815,583 | ||||||||
| Nicole A. Kivisto | — | — | 60,317 | 1,621,321 | ||||||||
Doran N. Schwartz3 | — | — | 71,267 | 1,915,657 | ||||||||
1 | Below is a breakdown by year of the outstanding performance share plan awards: |
| 2015 Award | 2016 Award | 2017 Award | Total | |||||
| Performance Period End | 12/31/2017 | 12/31/2018 | 12/31/2019 | |||||
| David L. Goodin | 144,328 | 197,528 | 12,378 | 354,234 | ||||
| Jason L. Vollmer | 3,822 | 9,534 | 782 | 14,138 | ||||
| David C. Barney | 23,490 | 37,840 | 2,668 | 63,998 | ||||
| Jeffrey S. Thiede | 25,276 | 39,534 | 2,734 | 67,544 | ||||
| Nicole A. Kivisto | 24,468 | 33,488 | 2,361 | 60,317 | ||||
| Doran N. Schwartz | 29,056 | 39,766 | 2,445 | 71,267 | ||||
Shares for the 2015 award are shown at the maximum level (200%) based on results for the 2015-2017 performance cycle above target.
Shares for the 2016 award are shown at the maximum level (200%) based on results for the first two years of the 2016-2018 performance cycle above target.
Shares for the 2017 award are shown at the threshold (20%) based on results for the first year of the 2017-2019 performance cycle below threshold.
2 | Value based on the number of performance shares reflected in column (i) multiplied by $26.88, the year-end per share closing stock price for 2017. |
3 | Mr. Schwartz resigned his position effective September 29, 2017. As a result, he forfeited all shares associated with the 2015-2017, 2016-2018, and 2017-2019 performance periods. |
While for purposes of the Outstanding Equity Awards at Fiscal Year-End 2017 Table, the number of shares and value shown for the 2015-2017 performance cycle is at 200% of target, the actual results for the performance period certified by the compensation committee and settled on February 16, 2018, was 144% of target. For further information, see the “Long-Term Incentives” section of the “Compensation Discussion and Analysis.”
MDU Resources Group, Inc. Proxy Statement 47
Proxy Statement
Option Exercises and Stock Vested During 2017
| Stock Awards | |||||||
Name (a) | Number of Shares Acquired on Vesting (#) (d)1 | Value Realized on Vesting ($) (e)2 | |||||
| David L. Goodin | 22,900 | 654,368 | |||||
| Jason L. Vollmer | — | — | |||||
| David C. Barney | 5,081 | 145,190 | |||||
| Jeffrey S. Thiede | 5,349 | 152,848 | |||||
| Nicole A. Kivisto | 2,755 | 78,724 | |||||
| Doran N. Schwartz | 6,017 | 171,936 | |||||
1 | Reflects performance shares for the 2014-2016 performance period ended December 31, 2016, which were approved February 16, 2017. | ||||||
2 | Reflects the value of vested performance shares based on the closing stock price of $26.37 per share on February 16, 2017, and the dividend equivalents paid on the vested shares. | ||||||
Pension Benefits for 2017
| Name (a) | Plan Name (b) | Number of Years Credited Service (#) (c)1 | Present Value of Accumulated Benefit ($) (d) | Payments During Last Fiscal Year ($) (e) | |||||||||
| David L. Goodin | Pension | 26 | 1,220,459 | — | |||||||||
Basic SISP 2 | 10 | 2,500,218 | — | ||||||||||
Excess SISP 3 | 26 | 39,023 | — | ||||||||||
| Jason L. Vollmer | Pension | 4 | 24,451 | — | |||||||||
Basic SISP 2 | n/a | — | — | ||||||||||
Excess SISP 3 | n/a | — | — | ||||||||||
| David C. Barney | Pension 3 | n/a | — | — | |||||||||
Basic SISP 2 | 10 | 1,477,483 | — | ||||||||||
Excess SISP 3 | n/a | — | — | ||||||||||
| Jeffrey S. Thiede | Pension 3 | n/a | — | — | |||||||||
Basic SISP 3 | n/a | — | — | ||||||||||
Excess SISP 3 | n/a | — | — | ||||||||||
| Nicole A. Kivisto | Pension | 14 | 254,722 | — | |||||||||
Basic SISP 2 | 6 | 489,832 | — | ||||||||||
Excess SISP 3 | n/a | — | — | ||||||||||
| Doran N. Schwartz | Pension | 4 | 125,585 | — | |||||||||
Basic SISP 2 | 10 | 923,825 | — | ||||||||||
Excess SISP 3 | n/a | — | — | ||||||||||
1 | Years of credited service related to the pension plan reflects the years of participation in the plan as of December 31, 2009, when the pension plan was frozen. Years of credited service related to the Basic SISP reflects the years toward full vesting of the benefit which is 10 years. Years of credited service related to Excess SISP reflects the same number of credited years of services as the pension plan. | ||||||||||||
2 | The present value of accumulated benefits for the Basic SISP assumes the named executive officer would be fully vested in the benefit on the benefit commencement date; therefore, no reduction was made to reflect actual vesting levels. | ||||||||||||
3 | Messrs. Barney and Thiede are not eligible to participate in the pension plans. Mr. Thiede does not participate in the SISP. Mr. Goodin is the only named executive officer eligible to participate in the Excess SISP. | ||||||||||||
48 MDU Resources Group, Inc. Proxy Statement
Proxy Statement
The amounts shown for the pension plan, Basic SISP, and Excess SISP represent the actuarial present values of the executives’ accumulated benefits accrued as of December 31, 2017, calculated using:
| • | a 3.18% discount rate for the Basic SISP and Excess SISP; |
| • | a 3.36% discount rate for the pension plan; |
| • | the Society of Actuaries RP-2014 Adjusted to 2006 Total Dataset Mortality with Scale MP-2017 for post-retirement mortality; and |
| • | no recognition of future salary increases or pre-retirement mortality. |
The actuary assumed a retirement age of 60 for the pension, Basic SISP, and Excess SISP benefits and assumed retirement benefits commence at age 60 for the pension and 65 for Basic and Excess SISP benefits.
Pension Plan
The MDU Resources Group, Inc. Pension Plan for Non-Bargaining Unit Employees (pension plan) applies to employees hired before 2006 and was amended to cease benefit accruals as of December 31, 2009. The benefits under the pension plan are based on a participant’s average annual salary over the 60 consecutive month period where the participant received the highest annual salary between 1999 and 2009. Benefits are paid as straight life annuities for single participants and as actuarially reduced annuities with a survivor benefit for married participants unless they choose otherwise.
Supplemental Income Security Plan
The Supplemental Income Security Plan (SISP), a defined benefit nonqualified retirement plan, is offered to select key managers and executives. SISP benefits are determined by reference to levels defined within the plan. Our compensation committee, after receiving recommendations from our CEO, determined each participant’s level within the plan. On February 11, 2016, the SISP was amended to exclude new participants to the plan and freeze current benefit levels for existing participants.
Basic SISP Benefits
Basic SISP is a supplemental retirement benefit intended to augment the retirement income provided under the pension plans. The Basic SISP benefits are subject to the following ten-year vesting schedule:
| • | 0% vesting for less than three years of participation; |
| • | 20% vesting for three years of participation; |
| • | 40% vesting for four years of participation; and |
| • | an additional 10% vesting for each additional year of participation up to 100% vesting for ten years of participation. |
Participants can elect to receive the Basic SISP as:
| • | monthly retirement benefits only; |
| • | monthly death benefits paid to a beneficiary only; or |
| • | a combination of retirement and death benefits, where each benefit is reduced proportionately. |
Regardless of the election, if the participant dies before the SISP retirement benefit commences, only the SISP death benefit is provided.
Basic SISP benefits vested as of December 31, 2004, are grandfathered under Section 409A of the Internal Revenue Code (Section 409A) and are subject to the SISP provisions then in effect. Typically, the grandfathered Section 409A SISP benefits are paid over 15 years, with benefits commencing when the participant attains age 65 or when the participant retires if they work beyond age 65. Basic SISP benefits vesting after December 31, 2004, are governed by amended provisions in the plan intended to comply with Section 409A. The SISP benefits for key employees as defined by Section 409A commence six months after the participant attains age 65 or when the participant retires if they work beyond age 65. The benefits are paid over a 173-month period where the first payment includes the equivalent of six months of payments plus interest equal to one-half of the annual prime interest rate on the participant’s last date of employment.
The following are Messrs. Goodin and Barney’s benefits under the grandfathered provision and those subject to Section 409A.
Grandfathered ($) | Subject to §409A ($) | Total ($) | ||||
| David L. Goodin | 271,291 | 2,228,927 | 2,500,218 | |||
| David C. Barney | 362,075 | 1,115,408 | 1,477,483 | |||
MDU Resources Group, Inc. Proxy Statement 49
Proxy Statement
Excess SISP Benefits
Excess SISP is an additional retirement benefit relating to Internal Revenue Code limitations on retirement benefits provided under the pension plans. Excess SISP benefits are equal to the difference between the monthly retirement benefits that would have been payable to the participant under the pension plans absent the limitations under the Internal Revenue Code and the actual benefits payable to the participant under the pension plans. Participants are only eligible for the Excess SISP benefits if the participant is fully vested under the pension plan, their employment terminates prior to age 65, and benefits under the pension plan are reduced due to limitations under the Internal Revenue Code on plan compensation.
In 2009, the SISP was amended to limit eligibility for the Excess SISP benefit. Mr. Goodin is the only named executive officer eligible for the Excess SISP benefit and must remain employed with the company until age 60 in order to receive the benefit. Benefits generally commence six months after the participant’s employment terminates and continue to age 65 or until the death of the participant, if prior to age 65.
Both Basic and Excess SISP benefits are forfeited if the participant’s employment is terminated for cause.
Nonqualified Deferred Compensation for 2017
Deferred Annual Incentive Compensation
Executives participating in the annual incentive compensation plans may elect to defer up to 100% of their annual incentive awards. Deferred amounts accrue interest at a rate determined annually by the compensation committee. The interest rate in effect for 2017 was 4.38% based on an average of the Moody’s U.S. Long-Term Corporate Bond Yield Average for “A” and “Baa” rated companies. The deferred amount will be paid in accordance with the participant’s election, following termination of employment or beginning in the fifth year following the year the award was earned. The amounts are paid in accordance with the participant’s election in either a lump sum or in monthly installments not to exceed 120 months. In the event of a change of control, all amounts deferred would immediately become payable. For purposes of deferred annual incentive compensation, a change of control is defined as:
| • | an acquisition during a 12-month period of 30% or more of the total voting power of our stock; |
| • | an acquisition of our stock that, together with stock already held by the acquirer, constitutes more than 50% of the total fair market value or total voting power of our stock; |
| • | replacement of a majority of the members of our board of directors during any 12-month period by directors whose appointment or election is not endorsed by a majority of the members of our board of directors; or |
| • | acquisition of our assets having a gross fair market value at least equal to 40% of the gross fair market value of all of our assets. |
Nonqualified Defined Contribution Plan
The company adopted the Nonqualified Defined Contribution Plan, effective January 1, 2012, to provide deferred compensation for a select group of employees. The compensation committee approves the amount of employer contributions under the Nonqualified Defined Contribution Plan and the obligations under the plan constitute an unsecured promise of the company to make such payments. The company credits contributions to plan accounts which capture the hypothetical investment experience based on the participant’s elections. Contributions made prior to 2017 vest four years after each contribution in accordance with the terms of the plan. Contributions made in 2017 vest rateably over a three-year period with 1/3 vesting after the first year, an additional 1/3 after the second year, and the final 1/3 after the third year. Amounts shown as aggregate earnings in the table below for Messrs. Vollmer, Barney, and Thiede reflect the change in investment value at market rates. Participants may elect to receive their vested contributions and investment earnings either in a lump sum upon separation from service with the company or in annual installments over a period of years upon the later of (i) separation from service and (ii) age 65. Plan benefits become fully vested if the participant dies while actively employed. Benefits are forfeited if the participant’s employment is terminated for cause.
50 MDU Resources Group, Inc. Proxy Statement
Proxy Statement
The table below includes individual contributions from deferrals of annual incentive compensation and company contributions under the Nonqualified Defined Contribution Plan:
Name (a) | Executive Contributions in Last FY ($) (b) | Registrant Contributions in Last FY ($) (c) | Aggregate Earnings in Last FY ($) (d) | Aggregate Withdrawals/ Distributions ($) (e) | Aggregate Balance at Last FYE ($) (f) | ||||||||||||
| David L. Goodin | 527,745 | — | 28,630 | — | 752,052 | 1 | |||||||||||
| Jason L. Vollmer | — | 22,550 | 5,125 | — | 27,675 | 2 | |||||||||||
| David C. Barney | — | 150,000 | 23,341 | — | 173,341 | 3 | |||||||||||
| Jeffrey S. Thiede | — | 100,000 | 83,052 | — | 579,981 | 4 | |||||||||||
| Nicole A. Kivisto | — | — | 723 | — | 16,945 | ||||||||||||
| Doran N. Schwartz | — | — | — | — | — | ||||||||||||
1 | Mr. Goodin deferred 50% of his 2016 annual incentive compensation which was $1,055,490 as reported in the Summary Compensation Table for 2016. | ||||||||||||||||
2 | Mr. Vollmer received $22,550 under the Nonqualified Defined Contribution Plan for 2017. This is reported in column (i) of the Summary Compensation Table for 2017. | ||||||||||||||||
3 | Mr. Barney received $150,000 under the Nonqualified Defined Contribution Plan for 2017. This is reported in column (i) of the Summary Compensation Table for 2017. | ||||||||||||||||
4 | Mr. Thiede received $100,000 under the Nonqualified Defined Contribution Plan for 2017. Mr. Thiede’s balance also includes contributions of $100,000 for 2016, $150,000 for 2015, $75,000 for 2014, and $33,000 for 2013. Each of these amounts is reported in column (i) of the Summary Compensation Table in the Proxy Statement for its respective year, where applicable. | ||||||||||||||||
Potential Payments upon Termination or Change of Control
The Potential Payments upon Termination or Change of Control Table shows the payments and benefits our named executive officers would receive in connection with a variety of employment termination scenarios or upon a change of control. For the named executive officers, the information assumes the terminations or the change of control occurred on December 31, 2017. Mr. Schwartz received no actual termination payments upon his resignation effective September 29, 2017.
The table excludes compensation and benefits that our named executive officers would have already earned during their employment with us whether or not a termination or change of control event had occurred or provided under plans or arrangements that do not discriminate in favor of the named executive officers and that are generally available to all salaried employees, such as benefits under our qualified defined benefit pension plan (for employees hired before 2006), accrued vacation pay, continuation of health care benefits, and life insurance benefits. The tables also do not include Nonqualified Defined Contribution Plan or deferred annual compensation amounts which are shown and explained in the Nonqualified Deferred Compensation for 2017 Table.
Compensation
Upon a change of control, annual incentives granted under our Long-Term Performance-Based Incentive Plan (LTIP) would vest at target and be paid in cash. Messrs. Goodin, Barney, and Thiede were awarded their annual incentives for 2017 under the LTIP and would receive the value of their annual incentive compensation at the target amount under the change of control scenarios. Having been employed for the entire year, no amounts are shown for annual incentives in the tables for Messrs. Goodin, Barney, and Thiede under termination scenarios, as they would be eligible to receive their annual incentive award based on the level that performance measures were achieved for the performance period regardless of a termination scenario occurring on December 31, 2017.
Mr. Vollmer and Ms. Kivisto were granted their annual incentive award under the Executive Incentive Compensation Plan (EICP) which has no change of control provision in regards to annual incentive compensation other than for deferred compensation. Unless otherwise determined by the compensation committee for named executive officers, or employment termination after age 65, the EICP requires participants to remain employed with the company through the service year to be eligible for a payout. Having been employed for the entire performance period, no amounts are shown for annual incentives in the tables for Mr. Vollmer or Ms. Kivisto, as they would be eligible to receive their annual incentive award based on the level that performance measures were achieved for the performance period regardless of termination or change of control scenarios occurring on December 31, 2017.
MDU Resources Group, Inc. Proxy Statement 51
Proxy Statement
Upon a change of control, performance share awards under the LTIP would be deemed fully earned and vest at their target levels for the named executive officers. For this purpose, the term “change of control” is defined in the LTIP as:
| • | the acquisition by an individual, entity, or group of 20% or more of our outstanding common stock; |
| • | a majority of our board of directors whose election or nomination was not approved by a majority of the incumbent board members; |
| • | consummation of a merger or similar transaction or sale of all or substantially all of our assets, unless our stockholders immediately prior to the transaction beneficially own more than 60% of the outstanding common stock and voting power of the resulting corporation in substantially the same proportions as before the merger, no person owns 20% or more of the resulting corporation’s outstanding common stock or voting power except for any such ownership that existed before the merger and at least a majority of the board of the resulting corporation is comprised of our directors; or |
| • | stockholder approval of our liquidation or dissolution. |
For termination scenarios other than a change of control, our award agreements provide that performance share awards are forfeited if the participant’s employment terminates before the participant has reached age 55 and completed 10 years of service. If a participant’s employment is terminated other than for cause after reaching age 55 and completing 10 years of service, performance shares are prorated as follows:
| • | termination of employment during the first year of the performance period = shares are forfeited; |
| • | termination of employment during the second year of the performance period = performance shares earned are prorated based on the number of months employed during the performance period; and |
| • | termination of employment during the third year of the performance period = full amount of any performance shares earned are received. |
Under the termination scenarios, Messrs. Goodin, Barney, and Thiede would receive performance shares as they have each reached age 55 and have 10 or more years of service. The number of performance shares received would be based on the following:
| • | 2015-2017 performance shares would vest based on the achievement of the performance measure for the period ended December 31, 2017, which was 144%; |
| • | 2016-2018 performance shares would be prorated at 24 out of 36 months (2/3) of the performance period and vest based on the achievement of the performance measure for the period ended December 31, 2018. For purposes of the Potential Payments upon Termination or Change of Control Table, the vesting is shown at 100%; and |
| • | 2017-2019 performance shares would be forfeited. |
For purposes of calculating the performance share value shown in the Potential Payments upon Termination or Change of Control Table, the number of vesting shares was multiplied by the average of the high and low stock price for the last market day of the year, which was December 29, 2017. Dividend equivalents based on the number of vesting shares are also included in the amounts presented.
Neither Ms. Kivisto nor Mr. Vollmer have reached age 55; therefore, they are not eligible for vesting of performance shares in the event of their termination.
Benefits and Perquisites
Supplemental Income Security Plan
Basic SISP benefits presented in the Potential Payments upon Termination or Change of Control Table represent the present value of vested Basic SISP as of December 31, 2017 for payments commencing at age 65 and payable for 15 years. Only Messrs. Goodin, Barney, and Ms. Kivisto are eligible for Basic SISP benefits. While Messrs. Goodin and Barney are 100% vested in their SISP benefit, Ms. Kivisto entered the plan in 2011 and is only 70% vested in her SISP benefit at December 31, 2017. In the event of death, Messrs. Goodin, Barney, and Ms. Kivisto’s beneficiaries would receive monthly death benefit payments for 15 years. The present value calculations used a 3.18% discount rate and the following monthly SISP benefit payments:
Monthly SISP Retirement Payment ($) | Monthly SISP Death Payment ($) | |||
| David L. Goodin | 23,040 | 46,080 | ||
| David C. Barney | 10,936 | 21,872 | ||
| Nicole A. Kivisto | 3,500 | 13,144 | ||
52 MDU Resources Group, Inc. Proxy Statement
Proxy Statement
The present value of the SISP benefit under the disability scenario for Ms. Kivisto reflects credit for two additional years of vesting or 90% as provided for in the plan. The terms of the Basic SISP benefit are described following the Pension Benefits for 2017 Table.
Disability
We provide disability benefits to some of our salaried employees equal to 60% of their base salary, subject to a salary limit of $200,000 for officers and $100,000 for other salaried employees when calculating benefits. For all eligible employees, disability payments continue until age 65 if disability occurs at or before age 60 and for five years if disability occurs between the ages of 60 and 65. Disability benefits are reduced for amounts paid as retirement benefits. The disability amounts in the Potential Payments upon Termination or Change of Control Table reflect the present value of the disability benefits attributable to the additional $100,000 of base salary recognized for executives under our disability program, subject to the 60% limitation, after reduction for amounts that would be paid as retirement benefits. For Messrs. Goodin and Vollmer and Ms. Kivisto, who participate in the pension plan, the amount represents the present value of the disability benefit after reduction for retirement benefits using a discount rate of 3.36%. Because Mr. Goodin’s retirement benefit is greater than the disability benefit, the amount shown is zero. For Messrs. Barney and Thiede, who do not participate in the pension plan, the amount represents the present value of the disability benefit without reduction for retirement benefits using the discount rate of 3.18%, which is considered a reasonable rate for purposes of the calculation.
Severance
None of the current named executive officers have employment or severance agreements with the company. The compensation committee generally considers providing severance benefits on a case-by-case basis. Because severance payments are discretionary, no amounts are presented in the tables.
MDU Resources Group, Inc. Proxy Statement 53
Proxy Statement
Potential Payments upon Termination or Change of Control Table
| Executive Benefits and Payments upon Termination or Change of Control | Voluntary Termination ($) | Not for Cause Termination ($) | Death ($) | Disability ($) | Change of Control (With Termination) ($) | Change of Control (Without Termination) ($) | |||||||||
| David L. Goodin | |||||||||||||||
| Compensation: | |||||||||||||||
| Annual Incentive | — | — | — | — | 792,750 | 792,750 | |||||||||
| Performance Shares | 4,900,080 | 4,900,080 | 4,900,080 | 4,900,080 | 6,621,837 | 6,621,837 | |||||||||
| Benefits and Perquisites: | |||||||||||||||
| Basic SISP | 2,502,092 | 2,502,092 | — | 2,502,092 | 2,502,092 | — | |||||||||
| SISP Death Benefits | — | — | 6,607,177 | — | — | — | |||||||||
| Disability Benefits | — | — | — | — | — | — | |||||||||
| Total | 7,402,172 | 7,402,172 | 11,507,257 | 7,402,172 | 9,916,679 | 7,414,587 | |||||||||
| Jason L. Vollmer | |||||||||||||||
| Compensation: | |||||||||||||||
| Performance Shares | — | — | — | — | 299,366 | 299,366 | |||||||||
| Benefits and Perquisites: | |||||||||||||||
| Disability Benefits | — | — | — | 980,108 | — | — | |||||||||
| Total | — | — | — | 980,108 | 299,366 | 299,366 | |||||||||
| David C. Barney | |||||||||||||||
| Compensation: | |||||||||||||||
| Annual Incentive | — | — | — | — | 320,355 | 320,355 | |||||||||
| Performance Shares | 851,383 | 851,383 | 851,383 | 851,383 | 1,248,908 | 1,248,908 | |||||||||
| Benefits and Perquisites: | |||||||||||||||
| Basic SISP | 1,463,790 | 1,463,790 | — | 1,463,790 | 1,463,790 | — | |||||||||
| SISP Death Benefits | — | — | 3,136,115 | — | — | — | |||||||||
| Disability Benefits | — | — | — | 277,761 | — | — | |||||||||
| Total | 2,315,173 | 2,315,173 | 3,987,498 | 2,592,934 | 3,033,053 | 1,569,263 | |||||||||
| Jeffrey S. Thiede | |||||||||||||||
| Compensation: | |||||||||||||||
| Annual Incentive | — | — | — | — | 328,313 | 328,313 | |||||||||
| Performance Shares | 904,925 | 904,925 | 904,925 | 904,925 | 1,308,189 | 1,308,189 | |||||||||
| Benefits and Perquisites: | |||||||||||||||
| Disability Benefits | — | — | — | 470,306 | — | — | |||||||||
| Total | 904,925 | 904,925 | 904,925 | 1,375,231 | 1,636,502 | 1,636,502 | |||||||||
| Nicole A. Kivisto | |||||||||||||||
| Compensation: | |||||||||||||||
| Performance Shares | — | — | — | — | 1,158,901 | 1,158,901 | |||||||||
| Benefits and Perquisites: | |||||||||||||||
| Basic SISP | 261,024 | 261,024 | — | 335,704 | 261,024 | — | |||||||||
| SISP Death Benefits | — | — | 1,884,651 | — | — | — | |||||||||
| Disability Benefits | — | — | — | 784,536 | — | — | |||||||||
| Total | 261,024 | 261,024 | 1,884,651 | 1,120,240 | 1,419,925 | 1,158,901 | |||||||||
54 MDU Resources Group, Inc. Proxy Statement
Proxy Statement
CEO Pay Ratio Disclosure
As required by Section 953(b) of the Dodd-Frank Wall Street Reform and Consumer Protection Act and Item 402(u) of Regulation S-K, we are providing information regarding the relationship of the annual total compensation of David L. Goodin, our president and chief executive officer, to the annual total compensation of our median employee.
Our employee workforce fluctuates during the year largely depending on the seasonality, number, and size of construction activity conducted by our businesses. Approximately 49.8% of our employee workforce is employed under union bargained labor contracts which define compensation and benefits for participants which may include payments made by the company associated with employee participation in union benefit and pension plans.
We identified the median employee by examining the 2017 taxable wage information for all individuals on the company’s payroll records as of December 31, 2017, excluding Mr. Goodin. All of the company’s employees are located in the United States. We made no adjustments to annualize compensation for individuals employed for only part of the year. We selected taxable wages as reported to the Internal Revenue Service on Form W-2 for 2017 to identify the median employee as it includes substantially all of the compensation for our median employee and provided a reasonably efficient and economic manner for the identification of the median employee. Our median employee works for our gas distribution segment. He is a unionized employee with compensation consisting of wages, meal allowances, company matching 401(k) contributions and a years of service award. Our median employee does not participate in the company’s pension plan since he joined the company in 2011, after the plan was frozen. He does receive an additional 5% company match to his 401(k) plan in lieu of pension contributions.
Once identified, we categorized the median employee’s compensation to correspond to the compensation components as reported in the Summary Compensation Table. For 2017, the total annual compensation of Mr. Goodin as reported in the Summary Compensation Table included in this Proxy Statement was $4,058,001, and the total annual compensation of our median employee was $84,883. Based on this information, the 2017 ratio of annual total compensation of Mr. Goodin to the median employee was 48 to 1.
MDU Resources Group, Inc. Proxy Statement 55
Proxy Statement
| AUDIT MATTERS | ||||
ITEM 3: RATIFICATION OF THE APPOINTMENT OF DELOITTE & TOUCHE LLP AS THE COMPANY’S INDEPENDENT REGISTERED PUBLIC ACCOUNTING FIRM FOR 2018
The audit committee at its February 2018 meeting appointed Deloitte & Touche LLP as our independent registered public accounting firm for fiscal year 2018. The board of directors concurred with the audit committee’s decision. Deloitte & Touche LLP has served as our independent registered public accounting firm since fiscal year 2002.
Although your ratification vote will not affect the appointment or retention of Deloitte & Touche LLP for 2018, the audit committee will consider your vote in determining its appointment of our independent registered public accounting firm for the next fiscal year. The audit committee, in appointing our independent registered public accounting firm, reserves the right, in its sole discretion, to change an appointment at any time during a fiscal year if it determines that such a change would be in our best interests.
A representative of Deloitte & Touche LLP will be present at the annual meeting and will be available to respond to appropriate questions. We do not anticipate that the representative will make a prepared statement at the annual meeting; however, he or she will be free to do so if he or she chooses.
| The board of directors recommends a vote “for” the ratification of the appointment of Deloitte & Touche LLP as our independent registered public accounting firm for fiscal year 2018. | ||||
Ratification of the appointment of Deloitte & Touche LLP as our independent registered public accounting firm for 2018 requires the affirmative vote of a majority of our common stock present in person or represented by proxy at the annual meeting and entitled to vote on the proposal. Abstentions will count as votes against this proposal.
Annual Evaluation and Selection of Deloitte & Touche LLP
The audit committee annually evaluates the performance of its independent registered public accounting firm, including the senior audit engagement team, and determines whether to re-engage the current independent accounting firm or consider other firms. Factors considered by the audit committee in deciding whether to retain the current independent accounting firm include:
| • | Deloitte & Touche LLP’s capabilities considering the complexity of our business and the resulting demands placed on Deloitte & Touche LLP in terms of technical expertise and knowledge of our industry and business; |
| • | the quality and candor of Deloitte & Touche LLP’s communications with the audit committee and management; |
| • | Deloitte & Touche LLP’s independence; |
| • | the quality and efficiency of the services provided by Deloitte & Touche LLP, including input from management on Deloitte & Touche LLP’s performance and how effectively Deloitte & Touche LLP demonstrated its independent judgment, objectivity, and professional skepticism; |
| • | external data on audit quality and performance, including recent Public Company Accounting Oversight Board reports on Deloitte & Touche LLP and its peer firms; and |
| • | the appropriateness of Deloitte & Touche LLP’s fees, tenure as our independent auditor, including the benefits of a longer tenure, and the controls and processes in place that help ensure Deloitte & Touche LLP’s continued independence. |
Based on this evaluation, the audit committee and the board believe that retaining Deloitte & Touche LLP to serve as our independent registered public accounting firm for the fiscal year ending December 31, 2018, is in the best interests of our company and its stockholders.
56 MDU Resources Group, Inc. Proxy Statement
Proxy Statement
The audit committee also oversees the process for, and ultimately approves, the selection of our independent registered public accounting firm’s lead engagement partner at the five-year mandatory rotation period. Prior to the mandatory rotation period in 2017, at the audit committee’s instruction, Deloitte & Touche LLP selected candidates to be considered for the lead engagement partner role, who were then interviewed by members of our company’s senior management. After considering the candidates recommended by Deloitte & Touche LLP, senior management made a recommendation to the audit committee regarding the new engagement partner. After discussing the qualifications of the proposed lead engagement partner with the current lead engagement partner, the audit committee chair interviewed the leading candidate, and the audit committee then considered the appointment and voted as an audit committee on the selection. The change in lead engagement partner after the current five-year rotation period occurred in February 2017.
Audit Fees and Non-Audit Fees
The following table summarizes the aggregate fees that our independent registered public accounting firm, Deloitte & Touche LLP, billed or is expected to bill us for professional services rendered for 2017 and 2016:
| 2017 | 2016 | ||||||||
Audit Fees 1 | $ | 2,327,450 | $ | 2,526,900 | |||||
Audit-Related Fees 2 | 46,790 | 16,710 | |||||||
Tax Fees 3 | 17,483 | — | |||||||
All Other Fees 4 | — | 3,087 | |||||||
Total Fees 5 | $ | 2,391,723 | $ | 2,546,697 | |||||
| Ratio of Tax and All Other Fees to Audit and Audit-Related Fees | 0.7 | % | 0.1 | % | |||||
1 | Audit fees for 2017 and 2016 consisted of fees for services rendered for the audit of our annual financial statements and subsidiaries, statutory and regulatory audits, reviews of quarterly financial statements, a Form S-3 Registration Statement (2017) filing, and a Form S-8 Registration Statement (2016) filing, and audits for discontinued operations for Dakota Prairie Refining, LLC (2016). |
2 | Audit-related fees for 2017 and 2016 are associated with Intermountain Gas Company Investment Tax Credit procedures (2017), supplemental schedule review for Knife River Corporation’s Northwest Region (2017), and Intermountain Gas Company public utility review (2016). |
3 | Tax fees for 2017 consisted of fees for tax training for regulated operations. |
4 | All other fees for 2016 are associated with a pollution control project at Big Stone electric generating facility. |
5 | Total fees reported above include out-of-pocket expenses related to the services provided of $282,483 for 2017 and $350,000 for 2016. |
Policy on Audit Committee Pre-Approval of Audit and Permissible Non-Audit Services of the Independent Registered Public Accounting Firm
The audit committee pre-approved all services Deloitte & Touche LLP performed in 2017 in accordance with the pre-approval policy and procedures the audit committee adopted in 2003. This policy is designed to achieve the continued independence of Deloitte & Touche LLP and to assist in our compliance with Sections 201 and 202 of the Sarbanes-Oxley Act of 2002 and related rules of the SEC.
The policy defines the permitted services in each of the audit, audit-related, tax, and all other services categories, as well as prohibited services. The pre-approval policy requires management to submit annually for approval to the audit committee a service plan describing the scope of work and anticipated cost associated with each category of service. At each regular audit committee meeting, management reports on services performed by Deloitte & Touche LLP and the fees paid or accrued through the end of the quarter preceding the meeting. Management may submit requests for additional permitted services before the next scheduled audit committee meeting to the designated member of the audit committee, Dennis W. Johnson, for approval. The designated member updates the audit committee at the next regularly scheduled meeting regarding any services approved during the interim period. At each regular audit committee meeting, management may submit to the audit committee for approval a supplement to the service plan containing any request for additional permitted services.
In addition, prior to approving any request for audit-related, tax, or all other services of more than $50,000, Deloitte & Touche LLP will provide a statement setting forth the reasons why rendering of the proposed services does not compromise Deloitte & Touche LLP’s independence. This description and statement by Deloitte & Touche LLP may be incorporated into the service plan or included as an exhibit thereto or may be delivered in a separate written statement.
MDU Resources Group, Inc. Proxy Statement 57
Proxy Statement
AUDIT COMMITTEE REPORT
In connection with our financial statements for the year ended December 31, 2017, the audit committee has (1) reviewed and discussed the audited financial statements with management; (2) discussed with the independent registered public accounting firm (the Auditors) the matters required to be discussed by Public Company Accounting Oversight Board Auditing Standard No. 1301, Communications with Audit Committees; and (3) received the written disclosures and the letter from the Auditors required by applicable requirements of the Public Company Accounting Oversight Board regarding the Auditors’ communications with the audit committee concerning independence, and has discussed with the Auditors their independence.
Based on the review and discussions referred to above, the audit committee recommended to the board of directors that the audited financial statements be included in our Annual Report on Form 10-K for the year ended December 31, 2017, for filing with the SEC.
| Dennis W. Johnson, Chair |
| Mark A. Hellerstein |
| A. Bart Holaday |
| John K. Wilson |
58 MDU Resources Group, Inc. Proxy Statement
Proxy Statement
| INFORMATION ABOUT THE ANNUAL MEETING | ||||
| Who can Vote? | Stockholders of record at the close of business on March 9, 2018, are entitled to vote each share they owned on that date on each matter presented at the meeting and any adjournment(s) thereof. As of March 9, 2018, we had 195,304,376 shares of common stock outstanding entitled to one vote per share. | ||
Distribution of our Proxy Materials using Notice and Access | We distributed proxy materials to certain of our stockholders via the Internet under the SEC’s “Notice and Access” rules to reduce our costs and decrease the environmental impact of our proxy materials. Using this method of distribution, on or about March 23, 2018, we mailed a Notice Regarding the Availability of Proxy Materials (Notice) that contains basic information about our 2018 annual meeting and instructions on how to view all proxy materials, and vote electronically, on the Internet. If you received the Notice and prefer to receive a paper copy of the proxy materials, follow the instructions in the Notice for making this request and the materials will be sent promptly to you via the preferred method. Stockholders who do not receive the Notice will receive a paper copy of our proxy materials, which will be sent on or about March 29, 2018. | ||
| How to Vote | You are encouraged to vote in advance of the meeting using one of the following voting methods, even if you are planning to attend the 2018 Annual Meeting of Stockholders. | ||
Registered Stockholders: Stockholders of record who hold their shares directly with our stock registrar can vote any one of four ways: | |||
 | Via the Internet: Go to the website shown on the Notice or Proxy Card, if you received one, and follow the instructions. | ||
 | By Telephone: Call the telephone number shown on the Notice or Proxy Card, if you received one, and follow the instructions given by the voice prompts. | ||
| Voting via the Internet or by telephone authorizes the named proxies to vote your shares in the same manner as if you marked, signed, dated, and returned a Proxy Card by mail. Your voting instructions may be transmitted up until 11:59 p.m. Eastern Time on May 7, 2018. | |||
 | By Mail: If you received paper copies of the Proxy Statement, Annual Report, and Proxy Card, mark, sign, date, and return the Proxy Card in the postage-paid envelope provided. | ||
 | In Person: Attend the annual meeting, or send a personal representative with an appropriate proxy, to vote by ballot at the meeting. (See “Notice of Annual Meeting” and “Annual Meeting Admission.”) | ||
Beneficial Stockholders: Stockholders whose shares are held beneficially in the name of a bank, broker, or other holder of record (sometimes referred to as holding shares “in street name”), will receive voting instructions from said bank, broker, or other holder of record. If you wish to vote in person at the meeting, you must obtain a legal proxy from your bank, broker, or other holder of record of your shares and present it at the meeting. | |||
| See discussion below in the MDU Resources Group, Inc. 401(k) Plan for voting instructions for shares held under our 401(k) plan. | |||
| Revoking Your Proxy or Changing Your Vote | You may change your vote at any time before the proxy is exercised. | ||
| Registered Stockholders: | |||
| ● | If you voted by mail: you may revoke your proxy by executing and delivering a timely and valid later dated proxy, by voting by ballot at the meeting, or by giving written notice of revocation to the corporate secretary. | ||
| ● | If you voted via the Internet or by telephone: you may change your vote with a timely and valid later Internet or telephone vote, as the case may be, or by voting by ballot at the meeting. | ||
| ● | Attendance at the meeting will not have the effect of revoking a proxy unless (1) you give proper written notice of revocation to the corporate secretary before the proxy is exercised, or (2) you vote by ballot at the meeting. | ||
Beneficial Stockholders: Follow the specific directions provided by your bank, broker, or other holder of record to change or revoke any voting instructions you have already provided. Alternatively, you may vote your shares by ballot at the meeting if you obtain a legal proxy from your bank, broker, or other holder of record and present it at the meeting. | |||
MDU Resources Group, Inc. Proxy Statement 59
Proxy Statement
Discretionary Voting Authority | If you complete and submit your proxy voting instructions, the individuals named as proxies will follow your instructions. If you are a stockholder of record and you submit proxy voting instructions but do not direct how to vote on each item, the individuals named as proxies will vote as the board recommends on each proposal. The individuals named as proxies will vote on any other matters properly presented at the annual meeting in accordance with their discretion. Our bylaws set forth requirements for advance notice of any nominations or agenda items to be brought up for voting at the annual meeting, and we have not received timely notice of any such matters, other than the items from the board of directors described in this Proxy Statement. | |
| Voting Standards | A majority of outstanding shares of stock entitled to vote must be present in person or represented by proxy to hold the meeting. | |
| A majority of votes cast is required to elect a director in an uncontested election. A majority of votes cast means the number of votes cast “for” a director’s election must exceed the number of votes cast “against” the director’s election. “Abstentions” and “broker non-votes” do not count as votes cast “for” or “against” the director’s election. In a contested election, which is an election in which the number of nominees for director exceeds the number of directors to be elected, directors will be elected by a plurality of the votes cast. | ||
| Approval of each of the other matters on the agenda requires the affirmative vote of a majority of the shares of common stock present or represented by proxy during the meeting. For each of these proposals, abstentions have the same effect as “against” votes. If you are a beneficial holder and do not provide specific voting instruction to your broker, the organization that holds your shares will not be authorized to vote your shares, which would result in “broker non-votes,” on proposals other than the ratification of the selection of our independent registered public accounting firm for 2018. Abstentions and broker non-votes are counted for purposes of determining whether a quorum is present at the annual meeting. | ||
| The following chart describes the proposals to be considered at the annual meeting, the vote required to elect directors and to adopt each other proposal, and the manner in which votes will be counted: | ||
| Item No. | Proposal | Voting Options | Vote Required to Adopt the Proposal | Effect of Abstentions | Effect of “Broker Non-Votes” | |
| 1 | Election of Directors | For, against, or abstain on each nominee | A nominee for director will be elected if the votes cast for such nominee exceed the votes cast against such nominee. | No effect | No effect | |
| 2 | Advisory Vote to Approve the Compensation Paid to the Company’s Named Executive Officers | For, against, or abstain | The affirmative vote of a majority of the shares of common stock represented at the annual meeting and entitled to vote thereon | Same effect as votes against | No effect | |
| 3 | Ratification of the Appointment of Deloitte & Touche LLP as the Company’s Independent Registered Public Accounting Firm for 2018 | For, against, or abstain | The affirmative vote of a majority of the shares of common stock represented at the annual meeting and entitled to vote thereon | Same effect as votes against | Brokers have discretion to vote | |
| Proxy Solicitation | The board of directors is furnishing proxy materials to solicit proxies for use at the Annual Meeting of Stockholders on May 8, 2018, and any adjournment(s) thereof. Proxies are solicited principally by mail, but directors, officers, and employees of MDU Resources Group, Inc. or its subsidiaries may solicit proxies personally, by telephone, or by electronic media, without compensation other than their regular compensation. Okapi Partners, LLC additionally will solicit proxies for approximately $8,000 plus out-of-pocket expenses. We will pay the cost of soliciting proxies and will reimburse brokers and others for forwarding proxy materials to stockholders. |
60 MDU Resources Group, Inc. Proxy Statement
Proxy Statement
Electronic Delivery of Proxy Statement and Annual Report Documents | For stockholders receiving proxy materials by mail, you can elect to receive an email in the future that will provide electronic links to these documents. Opting to receive your proxy materials online will save the company the cost of producing and mailing documents to your home or business and will also give you an electronic link to the proxy voting site. | |
| ● | Registered Stockholders: If you vote on the Internet, simply follow the prompts for enrolling in the electronic proxy delivery service. You may also enroll in the electronic proxy delivery service at any time in the future by going directly to http://enroll.icsdelivery.com/mdu to request electronic delivery. You may revoke an electronic delivery election at this site at any time. | |
| ● | Beneficial Stockholders: If you hold your shares in a brokerage account, you may also have the opportunity to receive copies of the proxy materials electronically. You may enroll in the electronic proxy delivery service at any time by going directly to http://enroll.icsdelivery.com/mdu to request electronic delivery. You may also revoke an electronic delivery election at this site at any time. In addition, you may also check the information provided in the proxy materials mailed to you by your bank or broker regarding the availability of this service or contact your bank or broker to request electronic delivery. | |
| Householding of Proxy Materials | In accordance with a Notice sent to eligible stockholders who share a single address, we are sending only one Annual Report to Stockholders and one Proxy Statement to that address unless we received instructions to the contrary from any stockholder at that address. This practice, known as “householding,” is designed to reduce our printing and postage costs. However, if a stockholder of record wishes to receive a separate Annual Report to Stockholders and Proxy Statement in the future, he or she may contact the Office of the Treasurer at MDU Resources Group, Inc., P.O. Box 5650, Bismarck, ND 58506-5650, Telephone Number: (701) 530-1000. Eligible stockholders of record who receive multiple copies of our Annual Report to Stockholders and Proxy Statement can request householding by contacting us in the same manner. Stockholders who own shares through a bank, broker, or other nominee can request householding by contacting the nominee. | |
| We will promptly deliver, upon written or oral request, a separate copy of the Annual Report to Stockholders and Proxy Statement to a stockholder at a shared address to which a single copy of the document was delivered. | ||
| MDU Resources Group, Inc. 401(k) Plan | This Proxy Statement is being used to solicit voting instructions from participants in the MDU Resources Group, Inc. 401(k) Plan with respect to shares of our common stock that are held by the trustee of the plan for the benefit of plan participants. If you are a plan participant and also own other shares as a registered stockholder or beneficial owner, you will separately receive a Notice or proxy materials to vote those other shares you hold outside of the MDU Resources Group, Inc. 401(k) Plan. If you are a plan participant, you must instruct the plan trustee to vote your shares by utilizing one of the methods described on the voting instruction form that you receive in connection with shares held in the plan. If you do not give voting instructions, the trustee generally will vote the shares allocated to your personal account in accordance with the recommendations of the board of directors. Your voting instructions may be transmitted up until 11:59 p.m. Eastern Time on May 3, 2018. | |
| Annual Meeting Admission and Guidelines | Admission: All stockholders as of the record date of March 9, 2018, are cordially invited and urged to attend the annual meeting. You must request an admission ticket in order to attend. If you are a stockholder of record and plan to attend the meeting, please contact MDU Resources by email at CorporateSecretary@mduresources.com or by telephone at 701-530-1010 to request an admission ticket. A ticket will be sent to you by mail. If your shares are held beneficially in the name of a bank, broker, or other holder of record, and you plan to attend the annual meeting, you will need to submit a written request for an admission ticket by mail to: Investor Relations, MDU Resources Group, Inc., P.O. Box 5650, Bismarck, ND 58506 or email at CorporateSecretary@mduresources.com. The request must include proof of stock ownership as of March 9, 2018, such as a bank or brokerage firm account statement or a legal proxy from the bank, broker, or other holder of record confirming ownership. A ticket will be sent to you by mail. Requests for admission tickets must be received no later than May 1, 2018. You must present your admission ticket and state-issued photo identification, such as a driver’s license, to gain admittance to the meeting. Guidelines: The business of the meeting will follow as set forth in the agenda which you will receive at the meeting entrance. The use of cameras or sound recording equipment is prohibited, except by those employed by the company to provide a record of the proceedings. The use of cell phones and other personal communication devices is also prohibited during the meeting. All devices must be turned off or muted. No firearms or weapons, banners, packages, or signs will be allowed in the meeting room. MDU Resources Group, Inc. reserves the right to inspect all items, including handbags and briefcases, that enter the meeting room. | |
MDU Resources Group, Inc. Proxy Statement 61
Proxy Statement
| Conduct of the Meeting | Neither the board of directors nor management intends to bring before the meeting any business other than the matters referred to in the Notice of Annual Meeting and this Proxy Statement. We have not been informed that any other matter will be presented at the meeting by others. However, if any other matters are properly brought before the annual meeting, or any adjournment(s) thereof, your proxies include discretionary authority for the persons named in the proxy to vote or act on such matters in their discretion. | |
| Stockholder Proposals, Director Nominations, and Other Items of Business for 2019 Annual Meeting | Stockholder Proposals for Inclusion in Next Year’s Proxy Statement. To be included in the proxy materials for our 2019 annual meeting, a stockholder proposal must be received by the corporate secretary no later than November 23, 2018, unless the date of the 2019 annual meeting is more than 30 days before or after May 8, 2019, in which case the proposal must be received a reasonable time before we begin to print and mail our proxy materials. The proposal must also comply with all applicable requirements of Rule 14a-18 under the Securities and Exchange Act of 1934. | |
Director Nominations and Other Stockholder Proposals Raised From the Floor at the 2019 Annual Meeting of Stockholders. Under our bylaws, if a stockholder intends to nominate a person as a director, or present other items of business at an annual meeting, the stockholder must provide written notice of the director nomination or stockholder proposal at least 90 days prior to the anniversary of the most recent annual meeting. Notice of director nominations or stockholder proposals for our 2019 annual meeting must be received by February 7, 2019, and meet all the requirements and contain all the information, including the completed questionnaire for director nominations, provided by our bylaws. The requirements for such notice can be found in our bylaws, a copy of which is on our website, at http://www.mdu.com/integrity/governance/guidelines-and-bylaws. | ||
We will make available to our stockholders to whom we furnish this Proxy Statement a copy of our Annual Report on Form 10-K, excluding exhibits, for the year ended December 31, 2017, which is required to be filed with the SEC. You may obtain a copy, without charge, upon written or oral request to the Office of the Treasurer of MDU Resources Group, Inc., 1200 West Century Avenue, Mailing Address: P.O. Box 5650, Bismarck, North Dakota 58506-5650, Telephone Number: (701) 530-1000. You may also access our Annual Report on Form 10-K through our website at www.mdu.com.
| By order of the Board of Directors, | |
| |
| Daniel S. Kuntz | |
| Secretary | |
| March 23, 2018 | |
62 MDU Resources Group, Inc. Proxy Statement
 |  | SCAN TO | 4 | ||||||||||
| VIEW MATERIALS & VOTE | |||||||||||||
VOTE BY INTERNET - www.proxyvote.com or scan the QR Barcode above Use the Internet to transmit your voting instructions and for electronic delivery of information up until 11:59 p.m. Eastern Time the day before the cut-off date or meeting date. Follow the instructions to obtain your records and to create an electronic voting instruction form. | |||||||||||||
1200 WEST CENTURY AVENUE P.O. BOX 5650 BISMARCK, ND 58506-5650 | |||||||||||||
VOTE BY PHONE - 1-800-690-6903 Use any touch-tone telephone to transmit your voting instructions up until 11:59 p.m. Eastern Time the day before the cut-off date or meeting date. Have your proxy card in hand when you call and then follow the instructions. | |||||||||||||
VOTE BY MAIL Mark, sign and date your proxy card and return it in the postage-paid envelope we have provided or return it to Vote Processing, c/o Broadridge, 51 Mercedes Way, Edgewood, NY 11717. | |||||||||||||
If you vote by Internet or Phone, you do not need to mail the Proxy Card | |||||||||||||
ELECTRONIC DELIVERY OF FUTURE PROXY MATERIALS If you would like to reduce the costs incurred by our company in mailing proxy materials, you can consent to receiving all future proxy statements, proxy cards and annual reports electronically via e-mail or the Internet. To sign up for electronic delivery, please follow the instructions above to vote using the Internet and, when prompted, indicate that you agree to receive or access proxy materials electronically in future years. | |||||||||||||
| TO VOTE, MARK BLOCKS BELOW IN BLUE OR BLACK INK AS FOLLOWS: | ||||||||||||||||||||||||
| KEEP THIS PORTION FOR YOUR RECORDS | ||||||||||||||||||||||||
THIS PROXY CARD IS VALID ONLY WHEN SIGNED AND DATED. | DETACH AND RETURN THIS PORTION ONLY | |||||||||||||||||||||||
| MDU RESOURCES GROUP, INC. | ||||||||||||||||||||||||
| The Board of Directors recommends you vote FOR the following: | ||||||||||||||||||||||||
| 1. | Election of Directors: | |||||||||||||||||||||||
| Nominees: | For | Against | Abstain | |||||||||||||||||||||
| 1a. | Thomas Everist | ☐ | ☐ | ☐ | ||||||||||||||||||||
| 1b. | Karen B. Fagg | ☐ | ☐ | ☐ | The Board of Directors recommends you vote FOR Items 2 and 3. | For | Against | Abstain | ||||||||||||||||
| 1c. | David L. Goodin | ☐ | ☐ | ☐ | 2. | Advisory vote to approve the compensation paid to the company's named executive officers. | ☐ | ☐ | ☐ | |||||||||||||||
| 1d. | Mark A. Hellerstein | ☐ | ☐ | ☐ | ||||||||||||||||||||
| 1e. | Dennis W. Johnson | ☐ | ☐ | ☐ | 3. | Ratification of the appointment of Deloitte & Touche LLP as the company's independent registered public accounting firm for 2018. | ☐ | ☐ | ☐ | |||||||||||||||
| 1f. | William E. McCracken | ☐ | ☐ | ☐ | ||||||||||||||||||||
| 1g. | Patricia L. Moss | ☐ | ☐ | ☐ | NOTE: Such other business as may properly come before the meeting or any adjournment thereof. | |||||||||||||||||||
| 1h. | Harry J. Pearce | ☐ | ☐ | ☐ | ||||||||||||||||||||
| 1i. | John K. Wilson | ☐ | ☐ | ☐ | ||||||||||||||||||||
| For address changes and/or comments, please check this box and write them on the back where indicated. | ☐ | |||||||||||||||||||||||
| Please sign exactly as your name(s) appear(s) hereon. When signing as attorney, executor, administrator, or other fiduciary, please give full title as such. Joint owners should each sign personally. All holders must sign. If a corporation or partnership, please sign in full corporate or partnership name by authorized officer. | ||||||||||||||||||||||||
| Signature [PLEASE SIGN WITHIN BOX] | Date | Signature (Joint Owners) | Date | |||||||||||||||||||||
| Important Notice Regarding the Availability of Proxy Materials for the Annual Meeting: | ||||
| The Combined Proxy Statement and Annual Report are available at www.proxyvote.com. | ||||
| MDU RESOURCES GROUP, INC. | ||||||||||||||||||||||
| ANNUAL MEETING OF STOCKHOLDERS | ||||||||||||||||||||||
| Tuesday, May 8, 2018, 11:00 a.m. CDT | ||||||||||||||||||||||
| 909 Airport Road | ||||||||||||||||||||||
| Bismarck, North Dakota | ||||||||||||||||||||||
| This proxy is solicited by the Board of Directors. | ||||||||||||||||||||||
| This proxy will also be used to provide voting instructions to John Hancock Trust Company LLC, as Trustee of the MDU Resources Group, Inc. 401(k) Retirement Plan, for any shares of Company common stock held in the plan. | ||||||||||||||||||||||
| The stockholder(s) hereby appoint(s) Harry J. Pearce and Daniel S. Kuntz, or either of them, as proxies, each with the power to appoint his substitute, and hereby authorize(s) them to represent and to vote, as designated on the reverse side of this ballot, all of the shares of Common Stock of MDU RESOURCES GROUP, INC. that the stockholder(s) is/are entitled to vote at the Annual Meeting of Stockholders to be held at 11:00 a.m. CDT on May 8, 2018, at the MDU Service Center, 909 Airport Road, Bismarck, North Dakota, and any adjournment or postponement thereof. | ||||||||||||||||||||||
Your vote is important! Ensure that your shares are represented at the meeting. Either (1) vote by Internet, (2) vote by phone, or (3) mark, date, sign, and return this proxy card in the postage-paid envelope provided. The deadline for voting by Internet and phone is 11:59 p.m. Eastern Time on Monday, May 7, 2018 for all stockholders, except the voting deadline for participants in the MDU Resources Group, Inc. 401(k) Retirement Plan is 11:59 p.m. Eastern Time on Thursday, May 3, 2018. | ||||||||||||||||||||||
| This proxy, when properly executed, will be voted in the manner directed herein. If no such direction is made, this proxy will be voted in accordance with the recommendations of the Board of Directors. | ||||||||||||||||||||||
| Address Changes/Comments: | ||||||||||||||||||||||
| (If you noted any Address Changes/Comments above, please mark corresponding box on the reverse side.) | ||||||||||||||||||||||
| Continued and to be signed on reverse side | ||||||||||||||||||||||