UNITED STATES
SECURITIES AND EXCHANGE COMMISSION
Washington, D.C. 20549
FORM N-CSR
CERTIFIED SHAREHOLDER REPORT OF REGISTERED
MANAGEMENT INVESTMENT COMPANIES
Investment Company Act File Number: 811-2341
Montgomery Street Income Securities, Inc.
(Exact name of registrant as specified in charter)
225 W. Wacker Drive, Suite 950
Chicago, IL 60606
(Address of principal executive offices)
Mark D. Nerud, President
225 W. Wacker Drive, Suite 950
Chicago, IL 60606
(Name and address of agent for service)
Registrant’s telephone number, including area code: (312) 338-5801
Date of fiscal year end: December 31
Date of reporting period: December 31, 2006
Form N-CSR is to be used by management investment companies to file reports with the Commission not later than 10 days after the transmission to stockholders of any report that is required to be transmitted to stockholders under Rule 30e-1 under the Investment Company Act of 1940 (17 CFR 270.30e-1). The Commission may use the information provided on Form N-CSR in its regulatory, disclosure review, inspection, and policymaking roles.
A registrant is required to disclose the information specified by Form N-CSR, and the Commission will make this information public. A registrant is not required to respond to the collection of information contained in Form N-CSR unless the Form displays a currently valid Office of Management and Budget (“OMB”) control number. Please direct comments concerning the accuracy of the information collection burden estimate and any suggestions for reducing the burden to Secretary, Securities and Exchange Commission, 450 Fifth Street, NW, Washington, DC 20549-0609. The OMB has reviewed this collection of information under the clearance requirements of 44 U.S.C. §3507.
Item 1. Reports to Stockholders.

Montgomery Street Income Securities, Inc.
Annual Report to Stockholders
December 31, 2006
Portfolio Management Review
The investments of Montgomery Street Income Securities, Inc. (the “Fund”) provided a total return based on net asset value (“NAV”) of 5.37%1 for the twelve-month period ended December 31, 2006. The total return of the Fund based on the market price of its New York Stock Exchange-traded shares was 8.70%1 for the same period. The total NAV return of the Fund outperformed the Lehman Brothers Aggregate Bond Index2, which the Fund uses as a benchmark and which posted a total return of 4.33% for the twelve-month period. Past results are not necessarily indicative of the future performance of the Fund. Investment return and principal value will fluctuate.
The Fund paid quarterly dividends totaling $1.05 for the year ended December 31, 2006. The Fund’s market price stood at $17.28 as of December 31, 2006, compared with $16.91 as of December 31, 2005. The Fund’s shares traded at an 8.1% discount to its NAV at December 31, 2006. Shares of closed-end funds frequently trade at a discount to NAV. The price of the Fund’s shares is determined by a number of factors, several of which are beyond the control of the Fund. The Fund, therefore, cannot predict whether its shares will trade at, below or above its NAV.
Economic growth, energy prices and core inflation all showed signs of moderation in the second half of 2006. Consistent with that outlook, the Federal Open Market Committee (the “FOMC”) took a pause in the recent policy campaign that brought the Federal Funds rate up to its level of 5.25% at the end of 2006. The FOMC had maintained this level since its June meeting. The slowdown in economic growth that was observed in the second half of 2006 has been induced by weakness in the housing and manufacturing sectors. Consumer spending, representing over two-thirds of U.S. GDP, has shown signs of cooling on a year over year basis. Offsetting some of this weakness has been solid growth in overall employment, particularly in the services sector.
| 1 | Total return based on net asset value reflects changes in the Fund’s net asset value during the period. Total return based on market price reflects changes in market price. Each figure assumes that dividend and capital gains, if any, were reinvested. These figures will differ depending upon the level of any discount from or premium to NAV at which the Fund’s shares traded during the period. |
| 2 | The Lehman Brothers Aggregate Bond Index is an unmanaged index representing domestic taxable investment-grade bonds, consisting of government and corporate securities, mortgage pass-through securities, and asset-backed securities with average maturities of one year or more. Index returns, unlike Fund returns, do not reflect fees or expenses. It is not possible to invest directly in an index. |
| | |
| Montgomery Street Income Securities, Inc. | | 1 |
Ten year U.S. Treasury rates rallied in the second half from a high of 5.25% down to 4.42% before settling in near 4.70% at year end. Non-Treasury debt also responded positively to the FOMC pause, with high yield, emerging markets, mortgage-backed and investment grade securities all posting excess returns to U.S. Treasuries over the six-month period. In general terms, risk was rewarded in the second half of 2006 as an outlook favoring a “soft landing” was embraced by the marketplace. The yield curve spent the second half of 2006 inverted, suggesting, to some observers, upcoming economic weakness and future FOMC rate cuts ahead. Interest rate risk in the Fund was slightly above the benchmark at the end of 2006 — consistent with a constructive view of the bond market overall. The Fund gained 6.27% for the six-months ended December 31, 2006, compared to 5.09% for the Lehman Brothers Aggregate Bond Index.
US Treasury Bond Yield Curve
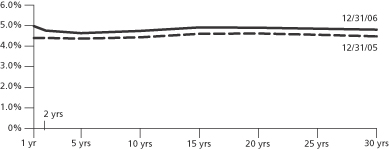
Source: Bloomberg
Performance is historical and does not guarantee future results.
The outlook of Hartford Investment Management, the Fund’s investment adviser (“HIMCO”), for the first half of 2007 is for solid, moderating levels of economic growth and inflation, consistent with a mid-cycle slowdown. An environment such as this has traditionally been constructive for credit. As a result, credit risk in the portfolio was gradually increased as this outlook developed. The additional yield achieved through the addition of this risk contributed to the Fund increasing its quarterly dividend to $0.29 per share in the fourth quarter. HIMCO is sensitive to the cyclical nature of corporate bond performance and is watching for indications that suggest a reduction in corporate risk is warranted.
| | |
| 2 | | Montgomery Street Income Securities, Inc. |
Quality Distribution
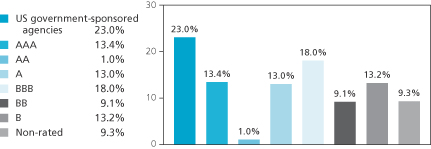
As of December 31,2006
Quality distribution is subject to change.
Percentages are based on total market value of the investment portfolio.
The quality ratings represent the lower of Moody’s Investors Service, Inc. (“Moody’s”) or Standard & Poor’s Corporation (“S&P”) credit ratings. The ratings of Moody’s and S&P represent these companies’ opinions as to the quality of the securities they rate. Ratings are relative and subject and not absolute standards of quality. A bond’s credit quality does not remove the market risk of an increase in interest rates.
On December 31, 2006, the Fund’s major allocations were to the mortgage-backed sector (26%), investment-grade corporate bonds (35%), and below-investment grade bonds (29%).
Sector Distribution
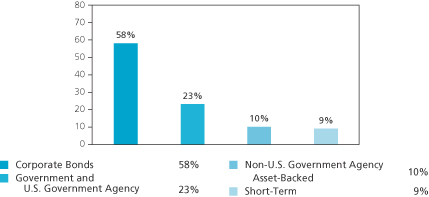
As of December 31, 2006
Sector distribution is subject to change.
Percentages are based on total value of the investment portfolio.
| | |
| Montgomery Street Income Securities, Inc. | | 3 |
The views expressed in this report reflect those of the investment adviser only through the end of the period of the report as stated on the cover. The investment adviser’s views are subject to change at any time based on market and other conditions and should not be construed as a recommendation. Investment in the Fund involves risk. The Fund invests in individual bonds whose yields and market value fluctuate so that your investment may be worth more or less than its original cost. Bond investments are subject to interest rate risk such that when interest rates rise, the price of the bonds, and thus the value of the Fund, can decline and the investor can lose principal value. Additionally, investing in foreign securities presents certain unique risks not associated with domestic investments, such as currency fluctuation, political and economic changes, and market risks. All of these factors may result in greater share price volatility. Closed-end funds, unlike open-end funds, are not continuously offered.
NOT FDIC/NCUA INSURED. NO BANK GUARANTEE. MAY LOSE VALUE. NOT A DEPOSIT. NOT INSURED BY ANY FEDERAL GOVERNMENT AGENCY.
Past performance is no guarantee of future results.
This report is sent to stockholders of Montgomery Street Income Securities, Inc., for their information. It is not a prospectus, circular or representation intended for use in the purchase or sale of shares of the Fund or of any securities mentioned in the report.
| | |
| 4 | | Montgomery Street Income Securities, Inc. |
Other Information
Dividends Paid
The Fund paid dividends of $0.25 per share on April 28, 2006; $0.25 per share on July 31, 2006; $0.26 per share on October 31, 2006; and $0.29 per share on December 29, 2006. Investment income earned by the Fund was lower during the first half of 2006, due in large part to a significant reduction in the high yield portion of the portfolio and the elimination of leverage in the form of mortgage dollar rolls. In addition, the duration of the portfolio was shortened and liquidity increased. These actions were undertaken in keeping with a belief that a more conservative investment posture was warranted during the first half of 2006, as well as in anticipation of the transition to HIMCO as the Fund’s investment adviser, which occurred at the close of business on June 9, 2006.
Dividend Reinvestment and Cash Purchase Option
The Fund maintains an optional Dividend Reinvestment and Cash Purchase Plan (the “Plan”) for the automatic reinvestment of your dividends and capital gain distributions in the shares of the Fund. Stockholders who participate in the Plan can also purchase additional shares of the Fund through the Plan’s voluntary cash investment feature. We recommend that you consider enrolling in the Plan to build your investment. The Plan’s features, including the voluntary cash investment feature, are described beginning on page 31 of this report.
Limited Share Repurchases
The Fund is authorized to repurchase a limited number of shares of the Fund’s common stock from time to time when the shares are trading at less than 95% of their NAV. Repurchases are limited to a number of shares each calendar quarter approximately equal to the number of new shares issued under the Plan with respect to income earned for the second preceding calendar quarter. There were 12,000 shares repurchased during each of the first two quarters of 2006 and 11,000 shares repurchased during each of the final two quarters of 2006, totaling 46,000 shares. Up to 12,000 shares may be repurchased during the first quarter of 2007.
| | |
| Montgomery Street Income Securities, Inc. | | 5 |
Investment Portfolio
Following the Fund’s first and third quarter ends, a complete portfolio holdings listing is filed with the U.S. Securities and Exchange Commission (“SEC”) on Form N-Q. The form is available on our website at www.montgomerystreetincome.com, or on the SEC’s website at www.sec.gov, and it also may be reviewed and copied at the SEC’s Public Reference Room in Washington, DC. Information on the operation of the SEC’s Public Reference Room may be obtained by calling (800) SEC-0330.
Certifications
The Fund’s Chief Executive Officer has certified to the New York Stock Exchange that, as of August 30, 2006, he was not aware of any violation by the Fund of applicable NYSE corporate governance listing standards. The Fund’s reports to the SEC on Forms N-CSR and N-Q contain certifications by the Fund’s Chief Executive Officer and Chief Financial Officer that relate to the Fund’s disclosure in such reports and that are required by Rule 30a-2 under the Investment Company Act of 1940, as amended.
Proxy Voting
Information about how the Fund voted any proxies related to its portfolio securities during the most recent 12-month period ended June 30, 2006 is available on our website at www.montgomerystreetincome.com or on the SEC’s website at www.sec.gov. A description of the policies that the Fund uses to determine how to vote proxies relating to portfolio securities is available without charge, upon request, by calling (877) 437-3938 or on the SEC’s website at www.sec.gov.
Reports to Stockholders
Those stockholders who wish to view the Fund’s complete portfolio holdings listing for the first and third quarters may view the Form N-Q, as described above in the “Investment Portfolio” section of this report. The Fund’s annual and semiannual reports to stockholders will be mailed to stockholders, and are also available on our Website at www.montgomerystreetincome.com or by calling (877) 437-3938.
| | |
| 6 | | Montgomery Street Income Securities, Inc. |
Net Asset Value
The Fund’s NAV is available daily on our website at www.montgomerystreetincome.com. The Fund’s NAV is published weekly on Monday and the Fund’s market value is published every Monday in The Wall Street Journal under the heading “Closed End Funds.” The Fund’s market value also is published daily in The New York Times, and both its market value and NAV are published weekly in Barron’s.
Change in Portfolio Managers
Due to the transition of investment advisers described above, as of the close of business on June 9, 2006, the following individuals of HIMCO assumed portfolio management responsibility for the Fund: Jeffrey S. MacDonald, Charles Moon and Nasri A. Toutoungi.
Change in Officer
Effective September 5, 2006, Daniel W. Koors replaced Jeffrey C. Nellessen as Treasurer and Chief Financial Officer of the Fund.
| | |
| Montgomery Street Income Securities, Inc. | | 7 |
Investment Objectives and Policies
ALIGN="left">
Investment Objectives
Your Fund is a closed-end diversified management investment company registered under the Investment Company Act of 1940, as amended (the “1940 Act”), investing and reinvesting its assets in a portfolio of selected securities. The Fund’s primary investment objective is to seek as high a level of current income as is consistent with prudent investment risks, from a diversified portfolio primarily of debt securities. Capital appreciation is a secondary objective.
Principal Investment Policies
Investment of your Fund is guided by the principal investment policies summarized below. For a more complete description of the Fund’s investment policies, please see the Fund’s Form N-2 Registration Statement dated April 29, 1992 and subsequent annual reports to stockholders.
Under normal circumstances, the Fund will invest at least 80% of its net assets, plus the amount of any borrowings for investment purposes, in income producing securities.1
At least 70% of total assets must be invested in: straight debt securities (other than municipal securities), including U.S. dollar-denominated debt securities of foreign issuers, rated within the four highest grades assigned by Moody’s Investors Service, Inc. or Standard & Poor’s Corporation; bank debt of comparable quality; U.S. government or agency securities; commercial paper; cash; cash equivalents; or Canadian government, provincial, or municipal securities (not in excess of 25% of total assets).
Up to 30% of total assets (the “30% basket”) may be invested in other U.S. or foreign straight debt securities; convertible securities; and preferred stocks.
Not more than 25% of total assets may be invested in securities of any one industry (finance companies as a whole are not considered an “industry” for the purposes of this limitation).
Not more than 5% of total assets may be invested in securities of any one issuer, other than U.S. government or agency securities.
| 1 | The Fund will provide stockholders with at least 60 days’ notice prior to making any changes to this 80% investment policy. |
| | |
| 8 | | Montgomery Street Income Securities, Inc. |
The Fund may invest money pursuant to repurchase agreements so long as the Fund is initially wholly secured with collateral consisting of securities in which the Fund can invest under its investment objectives and policies. In addition, investments in repurchase agreements must not, at the time of any such loan, be as a whole more than 20% — and be as to any one borrower more than 5% — of the Fund’s total assets.
The Fund may lend its portfolio securities to the extent permitted under the 1940 Act.
The Fund may borrow funds to purchase securities, provided that the aggregate amount of such borrowings may not exceed 30% of the Fund’s assets (including aggregate borrowings), less liabilities (excluding such borrowings).
The Fund may enter into forward foreign currency sale contracts to hedge portfolio positions, provided, among other things, that such contracts have a maturity of one year or less and that, at the time of purchase, the Fund’s obligations under such contracts do not exceed either the market value of portfolio securities denominated in the foreign currency or 15% of the Fund’s total assets.
The Fund may enter into interest rate futures contracts and purchase or write options on interest rate futures contracts, provided, among other things, that the Fund’s obligations under such instruments may not exceed the market value of the Fund’s assets not subject to the 30% basket.
It is the intention of the Fund to invest exclusively in non-voting securities. Under normal circumstances, the Fund does not intend to exercise conversion, exchange or other rights to purchase common stock or other equity securities, or otherwise to hold voting securities. In the unlikely event that the Fund does come into possession of any voting securities, the Fund intends to dispose of such securities as soon as it is reasonably practicable and prudent to do so.
| | |
| Montgomery Street Income Securities, Inc. | | 9 |
| | |
Investment Portfolio | | as of December 31, 2006 |
| | | | |
| | | Principal
Amount ($) | | Value ($) |
| | | | | |
Corporate Bonds 63.1% | | | | |
| Consumer Discretionary 9.8% | | | | |
AMR Real Estate Holdings Plc, 7.13%, 02/15/13 | | 400,000 | | 402,000 |
ArvinMeritor, Inc., 8.75%, 03/01/12 (e) | | 950,000 | | 976,125 |
Chancellor Media CCU, Inc., 8.00%, 11/01/08 | | 750,000 | | 779,743 |
Charter Communications Operating LLC, 8.00%, 04/30/12 (a) | | 500,000 | | 519,375 |
Clear Channel Communications, Inc., 7.65%, 09/15/10 | | 550,000 | | 575,826 |
COX Communications, Inc. | | | | |
5.45%, 12/15/14 | | 500,000 | | 487,117 |
5.88%, 12/01/16 (a) | | 375,000 | | 372,340 |
6.45%, 12/01/36 (a) | | 240,000 | | 236,232 |
CSC Holdings, Inc., 8.13%, 07/15/09 | | 190,000 | | 196,888 |
Dex Media West LLC/Dex Media Finance Co., 9.88%, 08/15/13 | | 450,000 | | 490,500 |
ERAC USA Finance Co., 5.90%, 11/15/15 (a) | | 429,000 | | 433,465 |
Foot Locker, Inc., 8.50%, 01/15/22 | | 155,000 | | 152,288 |
Ford Capital BV, 9.50%, 06/01/10 | | 650,000 | | 646,750 |
Fortune Brands, Inc., 5.38%, 01/15/16 | | 250,000 | | 237,052 |
General Motors Corp., 6.38%, 05/01/08 | | 750,000 | | 746,250 |
Goodyear Tire & Rubber Co., 8.63%, 12/01/11 (a) | | 1,050,000 | | 1,084,125 |
Home Depot, Inc., 5.25%, 12/16/13 | | 925,000 | | 918,121 |
Idearc, Inc., 8.00%, 11/15/16 (a) | | 500,000 | | 507,500 |
JC Penney Corp., Inc., 8.00%, 03/01/10 | | 500,000 | | 532,362 |
K Hovnanian Enterprises, Inc., 6.00%, 01/15/10 | | 310,000 | | 296,825 |
Mediacom LLC, 9.50%, 01/15/13 | | 500,000 | | 515,000 |
MGM Mirage, Inc. | | | | |
8.50%, 09/15/10 | | 500,000 | | 535,000 |
6.75%, 09/01/12 | | 300,000 | | 295,500 |
Neiman-Marcus Group, Inc., 10.38%, 10/15/15 (e) | | 450,000 | | 500,625 |
Pokagon Gaming Authority, 10.38%, 06/15/14 (a) | | 210,000 | | 229,950 |
Rochester Gas & Electric Corp., 6.38%, 09/01/33 | | 1,600,000 | | 1,719,360 |
TCI Communications, Inc., 8.75%, 08/01/15 | | 35,000 | | 41,397 |
Technical Olympic USA, 9.00%, 07/01/10 (e) | | 200,000 | | 197,000 |
Tele-Communications-TCI Group, 10.13%, 04/15/22 | | 1,291,000 | | 1,722,939 |
Tenneco, Inc., 8.63%, 11/15/14 (e) | | 745,000 | | 759,900 |
Time Warner, Inc. | | | | |
6.75%, 04/15/11 | | 800,000 | | 837,446 |
6.50%, 11/15/36 (e) | | 250,000 | | 248,831 |
Town Sports International, Inc., 9.63%, 04/15/11 | | 450,000 | | 475,313 |
Viacom, Inc., 6.88%, 04/30/36 | | 480,000 | | 474,566 |
| | | | |
| | | | 19,143,711 |
The accompanying notes are an integral part of the financial statements.
| | |
| 10 | | Montgomery Street Income Securities, Inc. |
| | | | |
| | | Principal
Amount ($) | | Value ($) |
| | | | | |
| Consumer Staples 2.7% | | | | |
Altria Group, Inc., 7.00%, 11/04/13 | | 250,000 | | 271,628 |
Anheuser-Busch Cos., Inc., 5.75%, 01/15/11 | | 750,000 | | 745,028 |
Archer Daniels Midland Co., 5.38%, 09/15/35 | | 400,000 | | 377,933 |
Coca-Cola Enterprises, Inc., 8.50%, 02/01/22 | | 500,000 | | 634,285 |
Constellation Brand, Inc., 7.25%, 09/01/16 (e) | | 200,000 | | 205,500 |
Del Laboratories, Inc., 10.37%, 11/01/11 (b) | | 400,000 | | 415,000 |
Delhaize America, Inc., 9.00%, 04/15/31 | | 450,000 | | 534,287 |
Dole Food Co., Inc., 8.63%, 05/01/09 | | 950,000 | | 944,063 |
Kraft Foods, Inc., 6.25%, 06/01/12 (e) | | 500,000 | | 519,401 |
SUPERVALU, Inc., 7.50%, 11/15/14 | | 345,000 | | 359,732 |
Wal-Mart Stores, Inc., 5.25%, 09/01/35 | | 250,000 | | 229,575 |
| | | | |
| | | | 5,236,432 |
| Energy 4.4% | | | | |
Anadarko Petroleum Corp. | | | | |
5.95%, 09/15/16 | | 520,000 | | 521,088 |
6.45%, 09/15/36 | | 450,000 | | 454,723 |
Chesapeake Energy Corp., 7.63%, 07/15/13 | | 350,000 | | 368,813 |
El Paso Corp., 7.75%, 07/15/11 (a) | | 500,000 | | 528,750 |
Energy Transfer Partners LP | | | | |
5.95%, 02/01/15 | | 2,000,000 | | 2,011,340 |
6.13%, 02/15/17 | | 290,000 | | 294,035 |
Hess Corp., 7.13%, 03/15/33 | | 450,000 | | 492,347 |
Inergy LP, 8.25%, 03/01/16 (e) | | 450,000 | | 472,500 |
Kinder Morgan Energy Partners LP, 5.70%, 01/05/16 | | 818,000 | | 750,531 |
ONEOK Partners LP | | | | |
6.15%, 10/01/16 | | 304,000 | | 308,456 |
6.65%, 10/01/36 | | 542,000 | | 554,375 |
Peabody Energy Corp., 6.88%, 03/15/13 | | 400,000 | | 410,000 |
Pemex Project Funding Master Trust, 5.75%, 12/15/15 | | 696,000 | | 691,128 |
Petrohawk Energy Corp., 9.13%, 07/15/13 | | 400,000 | | 420,000 |
Transcontinental Gas Pipe Line Corp., 6.40%, 04/15/16 | | 250,000 | | 252,500 |
| | | | |
| | | | 8,530,586 |
| Financials 27.1% | | | | |
Allstate Corp., 6.13%, 02/15/12 | | 1,000,000 | | 1,035,814 |
American Express Co., 6.80%, 09/01/66 (b) | | 1,403,000 | | 1,496,071 |
American General Institutional Capital, 7.57%, 12/01/45 (a) | | 250,000 | | 300,297 |
American International Group, Inc., 6.25%, 05/01/36 | | 350,000 | | 371,867 |
Ameriprise Financial, Inc., 7.52%, 06/01/66 (b) | | 1,015,000 | | 1,114,644 |
AXA SA, 6.46%, 12/31/49 (a) | | 873,000 | | 861,951 |
The accompanying notes are an integral part of the financial statements.
| | |
| Montgomery Street Income Securities, Inc. | | 11 |
| | | | |
| | | Principal
Amount ($) | | Value ($) |
| | | | | |
Bank One Corp., 10.00%, 08/15/10 | | 827,000 | | 944,032 |
Citigroup, Inc., 6.00%, 10/31/33 (e) | | 500,000 | | 512,096 |
Citizens Property Insurance Corp., 7.13%, 02/25/19 (a) | | 2,000,000 | | 2,292,682 |
Dow Jones CDX North America High Yield Trust, 8.38%, 12/29/11 (a) (c) (e) | | 12,000,000 | | 12,261,600 |
ERP Operating LP, 5.38%, 08/01/16 (e) | | 333,000 | | 329,520 |
Financial Security Assurance Holdings Ltd., 6.40%, 12/15/66 (a) | | 1,012,000 | | 1,016,662 |
Ford Motor Co., 9.82%, 04/15/12 (b) | | 680,000 | | 720,623 |
Ford Motor Credit Co. | | | | |
5.80%, 01/12/09 | | 1,480,000 | | 1,453,128 |
7.38%, 02/01/11 | | 500,000 | | 494,972 |
GE Business Loan Trust: | | | | |
Interest Only 0.62%, 06/15/10 (a) (b) | | 35,480,000 | | 389,925 |
6.35%, 05/15/34 (a) (b) | | 482,732 | | 482,732 |
General Motors Acceptance Corp. | | | | |
6.88%, 09/15/11 | | 1,250,000 | | 1,282,123 |
6.88%, 08/28/12 | | 415,000 | | 426,132 |
8.00%, 11/01/31 | | 900,000 | | 1,033,261 |
Genworth Financial, Inc., 6.15%, 11/15/66 (callable at 100 on 11/15/16) (g) | | 779,000 | | 777,902 |
Goldman Sachs Group, Inc. | | | | |
5.95%, 01/15/27 | | 875,000 | | 864,602 |
6.45%, 05/01/36 | | 1,650,000 | | 1,716,681 |
HSBC Bank USA NA, 5.63%, 08/15/35 | | 315,000 | | 303,497 |
HSBC Holdings Plc, 6.50%, 05/02/36 | | 500,000 | | 537,885 |
iStar Financial, Inc., 5.95%, 10/15/13 (a) | | 585,000 | | 587,947 |
JPMorgan Chase Capital XV, 5.88%, 03/15/35 | | 205,000 | | 200,289 |
JSG Funding Plc, 9.63%, 10/01/12 | | 450,000 | | 477,000 |
Kazkommerts International Bank, 8.00%, 11/03/15 (a) | | 380,000 | | 395,200 |
Liberty Mutual Group, Inc., 7.50%, 08/15/36 (a) (e) | | 450,000 | | 492,333 |
Lincoln National Corp., 7.00%, 05/17/66 | | 940,000 | | 996,293 |
MetLife, Inc., 6.40%, 12/15/36 | | 2,647,000 | | 2,659,195 |
Mizuho Finance, 8.38% 12/29/49 | | 1,405,000 | | 1,484,523 |
Mizuho JGB Investment LLC, 9.87%, 6/30/08 (a) (f) | | 2,000,000 | | 2,119,430 |
PNC Preferred Funding Trust, 6.52%, 12/31/49 (a) (e) | | 500,000 | | 508,689 |
Royal Bank of Scotland Group Plc, 9.12%, 03/31/10 | | 1,200,000 | | 1,329,403 |
SMFG Preferred Capital Ltd., 6.08%, 1/25/17 (a) (f) | | 793,000 | | 786,505 |
Standard Chartered Plc, 6.41%, 1/30/17 (a) (f) | | 754,000 | | 748,017 |
SunTrust Capital VIII, 6.10%, 12/01/66 (callable at 100 on 12/15/36) (g) | | 814,000 | | 791,801 |
SunTrust Preferred Capital I, 5.85%, 12/15/11 (e) (f) | | 180,000 | | 181,374 |
TNK-BP Finance SA, 7.50%, 07/18/16 (a) | | 600,000 | | 638,250 |
The accompanying notes are an integral part of the financial statements.
| | |
| 12 | | Montgomery Street Income Securities, Inc. |
| | | | |
| | | Principal
Amount ($) | | Value ($) |
| | | | | |
USB Capital IX, 6.19%, 04/15/11 (f) | | 1,455,000 | | 1,485,973 |
USB Realty Investors, 6.09%, 1/15/12 (a) (f) | | 700,000 | | 697,620 |
Wachovia Capital Trust III, 5.80%, 03/15/11 (f) | | 2,000,000 | | 2,016,510 |
Washington Mutual Preferred Funding Delaware, 6.53%, 3/15/11 (a) (f) | | 1,015,000 | | 1,003,328 |
Wells Fargo Capital X, 5.95%, 12/15/36 | | 387,000 | | 379,294 |
| | | | |
| | | | 52,999,673 |
| Health Care 1.6% | | | | |
Aetna, Inc., 6.63%, 06/15/36 (e) | | 560,000 | | 598,844 |
Biovail Corp., 7.88%, 04/01/10 | | 540,000 | | 551,475 |
Cigna Corp., 6.15%, 11/15/36 | | 184,000 | | 181,778 |
HCA, Inc. | | | | |
7.88%, 02/01/11 | | 500,000 | | 501,250 |
9.25%, 11/15/16 (a) | | 330,000 | | 353,513 |
Teva Pharmaceutical Industries Ltd., 6.15%, 02/01/36 | | 610,000 | | 592,692 |
Wyeth, 6.50%, 02/01/34 | | 400,000 | | 435,092 |
| | | | |
| | | | 3,214,644 |
| Industrials 1.9% | | | | |
Avis Budget Car Rental LLC, 7.87%, 05/15/14 (a) (b) | | 500,000 | | 482,500 |
Bombardier, Inc., 6.30%, 05/01/14 (a) | | 1,060,000 | | 996,400 |
Hertz Corp., 10.50%, 01/01/16 (a) | | 460,000 | | 506,000 |
Honeywell International, Inc., 5.70%, 03/15/36 | | 250,000 | | 248,568 |
Siemens Financieringsmaatschappij NV, 6.13%, 08/17/26 (a) | | 828,000 | | 846,025 |
Systems 2001 Asset Trust LLC, 7.16%, 12/15/11 (a) | | 309,288 | | 319,718 |
United Rentals, Inc., 6.50%, 02/15/12 | | 300,000 | | 296,250 |
| | | | |
| | | | 3,695,461 |
| Information Technology 2.8% | | | | |
Advanced Micro Devices, Inc., 7.75%, 11/01/12 (e) | | 345,000 | | 357,938 |
CompuCom Systems, Inc., 12.00%, 11/01/14 (a) | | 500,000 | | 515,000 |
Flextronics International Ltd., 6.50%, 05/15/13 | | 400,000 | | 395,000 |
Freescale Semiconductor, Inc., 10.13%, 12/15/16 (a) | | 405,000 | | 405,506 |
International Business Machines Corp., 8.38%, 11/01/19 | | 250,000 | | 312,055 |
Nortel Networks Corp., 10.75%, 07/15/16 (a) | | 1,000,000 | | 1,093,750 |
NXP BV, 8.12%, 10/15/13 (a) (b) | | 255,000 | | 258,825 |
Seagate Technology, Inc., 6.80%, 10/01/16 | | 435,000 | | 437,175 |
Solectron Global Financial Ltd., 8.00%, 03/15/16 | | 400,000 | | 405,000 |
UGS Corp., 10.00%, 06/01/12 | | 450,000 | | 490,500 |
Xerox Corp., 6.75%, 02/01/17 | | 777,000 | | 811,965 |
| | | | |
| | | | 5,482,714 |
The accompanying notes are an integral part of the financial statements.
| | |
| Montgomery Street Income Securities, Inc. | | 13 |
| | | | |
| | | Principal
Amount ($) | | Value ($) |
| | | | | |
| Materials 3.7% | | | | |
Boise Cascade LLC, 7.13%, 10/15/14 (e) | | 400,000 | | 387,000 |
Bowater, Inc., 8.36%, 03/15/10 (b) | | 500,000 | | 505,000 |
Catalyst Paper Corp., 8.63%, 06/15/11 | | 500,000 | | 506,250 |
Chaparral Stell Co., 10.00%, 07/15/13 | | 450,000 | | 502,312 |
Equistar Chemicals LP, 8.75%, 02/15/09 | | 850,000 | | 890,375 |
Evraz Group SA, 8.25%, 11/10/15 (a) | | 190,000 | | 195,463 |
Georgia-Pacific Corp., 7.00%, 01/15/15 (a) | | 355,000 | | 354,113 |
Huntsman International LLC, 7.88%, 11/15/14 (a) | | 400,000 | | 403,000 |
Koppers, Inc., 9.88%, 10/15/13 | | 450,000 | | 489,375 |
MHP SA, 10.25%, 11/30/11 (a) | | 200,000 | | 204,250 |
Momentive Performance Materials, Inc., 9.75%, 12/01/14 (a) | | 335,000 | | 335,000 |
Mosaic Co., 7.38%, 12/01/14 (a) (e) | | 490,000 | | 502,863 |
Newmont Mining Corp., 5.88%, 04/01/35 | | 395,000 | | 367,165 |
Pliant Corp., 11.63%, 06/15/09 (d) | | 5 | | 5 |
Vale Overseas Ltd., 8.25%, 01/17/34 | | 570,000 | | 675,189 |
Verso Paper Holdings LLC, 11.38%, 08/01/16 (a) | | 300,000 | | 315,000 |
Xstrata Plc, 5.80%, 11/15/16 (a) | | 637,000 | | 635,151 |
| | | | |
| | | | 7,267,511 |
| Telecommunication Services 4.3% | | | | |
AT&T, Inc., 6.15%, 09/15/34 | | 500,000 | | 491,782 |
Citizens Communications Co., 9.00%, 08/15/31 (e) | | 400,000 | | 434,000 |
Insight Midwest LP/Insight Capital, Inc., 9.75%, 10/01/09 | | 54,000 | | 54,878 |
Intelsat Bermuda Ltd., 9.25%, 06/15/16 (a) | | 255,000 | | 274,125 |
PanAmSat Corp., 9.00%, 06/15/16 (a) (e) | | 500,000 | | 529,375 |
Qwest Communications International, Inc., 7.50%, 02/15/14 | | 800,000 | | 824,000 |
Rogers Cable, Inc., 9.75%, 06/01/16 | | 300,000 | | 376,500 |
Sprint Capital Corp. | | | | |
7.63%, 01/30/11 | | 1,000,000 | | 1,070,701 |
8.75%, 03/15/32 | | 400,000 | | 481,444 |
Telecom Italia Capital SA | | | | |
4.00%, 01/15/10 | | 360,000 | | 343,761 |
5.25%, 11/15/13 | | 330,000 | | 314,651 |
4.95%, 09/30/14 | | 365,000 | | 338,151 |
7.20%, 07/18/36 | | 530,000 | | 553,701 |
Verizon Global Funding Corp., 7.75%, 12/01/30 | | 195,000 | | 228,731 |
Verizon New Jersey, Inc., 5.88%, 01/17/12 | | 542,000 | | 549,062 |
Vodafone Group Plc, 5.00%, 12/16/13 (e) | | 750,000 | | 724,871 |
Windstream Corp., 8.63%, 08/01/16 | | 670,000 | | 733,650 |
| | | | |
| | | | 8,323,383 |
The accompanying notes are an integral part of the financial statements.
| | |
| 14 | | Montgomery Street Income Securities, Inc. |
| | | | |
| | | Principal
Amount ($) | | Value ($) |
| | | | | |
| Utilities 4.8% | | | | |
American Electric Power Co., Inc., 5.38%, 03/15/10 (e) | | 1,000,000 | | 999,073 |
FirstEnergy Corp., 6.45%, 11/15/11 | | 500,000 | | 521,406 |
NiSource Finance Corp., 7.88%, 11/15/10 | | 1,500,000 | | 1,618,293 |
Northern States Power Co., 6.25%, 06/01/36 | | 400,000 | | 426,114 |
NRG Energy, Inc., 7.38%, 02/01/16 | | 950,000 | | 954,750 |
PSI Energy, Inc., 8.85%, 01/15/22 | | 1,225,000 | | 1,572,495 |
Puget Energy, Inc., 7.02%, 12/01/27 | | 1,000,000 | | 1,132,353 |
SPI Electricity & Gas Australia Holdings Pty Ltd., 6.15%, 11/15/13 (a) | | 2,000,000 | | 2,072,378 |
| | | | |
| | | | 9,296,862 |
| |
Total Corporate Bonds (Cost $121,836,682) | | | | 123,190,977 |
| | | | |
Non-U.S. Government Agency Asset-Backed Securities 10.8% |
Banc of America Commercial Mortgage, Inc., 5.81%, 07/10/44 (b) | | 960,000 | | 998,953 |
Banc of America Mortgage Securities, 4.81%, 09/25/35 (b) | | 1,065,000 | | 1,051,614 |
Capital Auto Receivables Asset Trust | | | | |
5.77%, 05/20/10 (a) (b) | | 150,000 | | 150,375 |
6.15%, 04/20/11 (a) (b) | | 200,000 | | 200,425 |
Citigroup Mortgage Loan Trust, Inc., 6.75%, 08/25/34 | | 734,680 | | 748,226 |
Commonwealth Bank of Australia, interest only, 2.21%, 01/25/37 (a) (b) | | 9,727,000 | | 875,430 |
Countrywide Alternative Loan Trust, | | | | |
5.50%, 08/25/34 (b) | | 543,233 | | 539,695 |
6.00%, 02/25/35 (b) | | 400,023 | | 399,921 |
6.00%, 08/25/35 (b) | | 871,602 | | 877,308 |
Ford Motor Credit Co., 6.89%, 05/15/13 (a) (b) | | 1,060,000 | | 1,060,210 |
GMAC Commercial Mortgage Securities Corp., 5.75%, 10/25/36 (b) | | 620,000 | | 619,822 |
JPMorgan Chase Commercial Mortgage Securities Corp., 4.90%, 01/12/37 | | 1,900,000 | | 1,847,776 |
Lehman Brothers Small Balance Commercial, 5.62%, 09/25/36 (a) (b) | | 255,000 | | 256,195 |
Marlin Leasing Receivables LLC, 5.33%, 09/16/13 (a) (b) | | 660,000 | | 660,568 |
Prudential Securities Secured Financing Corp., 7.19%, 06/16/31 (b) | | 914,959 | | 943,108 |
Residential Asset Securitization Trust, 5.50%, 04/25/35 | | 2,500,000 | | 2,420,974 |
Washington Mutual, Inc., 5.12%, 12/25/35 | | 1,320,000 | | 1,312,863 |
The accompanying notes are an integral part of the financial statements.
| | |
| Montgomery Street Income Securities, Inc. | | 15 |
| | | | |
| | | Principal
Amount ($) | | Value ($) |
| | | | | |
Wells Fargo Mortgage Backed Securities Trust | | | | |
5.00%, 03/25/21 | | 2,283,951 | | 2,230,420 |
4.11%, 06/25/35 (b) | | 1,974,493 | | 1,932,959 |
5.24%, 04/25/36 (b) | | 2,117,371 | | 2,101,457 |
| |
Total Non-U.S. Government Agency Asset-Backed Securities
(Cost $21,359,981) | | 21,228,299 |
| | | | |
Government and Agency Obligations 24.5% | | | | |
| Government Securities 0.5% | | | | |
| Sovereign 0.2% | | | | |
Argentina Government International Bond, 7.00%, 09/12/13 | | 210,000 | | 205,943 |
Turkey Government International Bond, 7.00%, 09/26/16 | | 200,000 | | 203,250 |
| | | | |
| | | | 409,193 |
| U.S. Treasury Securities 0.3% | | | | |
U.S. Treasury Note, 4.63%, 11/29/16 (e) | | 588,000 | | 584,142 |
| |
Total Government Securities | | | | 993,335 |
| | | | |
| U.S. Government Agency Securities 24.0% | | | | |
| Federal Farm Credit Bank 0.1% | | | | |
Federal Farm Credit Bank, 7.56%, 12/15/13 (f) | | 170,000 | | 181,808 |
| Federal Home Loan Mortgage Corp. 8.3% | | | | |
5.50%, 12/15/16 | | 590,000 | | 588,947 |
5.00%, 05/15/23 | | 1,540,000 | | 1,534,580 |
4.50%, 02/15/26 | | 815,000 | | 805,786 |
5.50%, 07/15/27 | | 679,554 | | 679,860 |
6.00%, 05/15/30 | | 790,000 | | 797,969 |
4.50%, 04/15/32 | | 1,375,000 | | 1,298,269 |
4.50%, 07/15/32 | | 410,000 | | 387,254 |
6.00%, 09/15/32 | | 1,500,000 | | 1,526,365 |
5.00%, 12/15/32 | | 895,000 | | 861,710 |
5.00%, 10/15/33 | | 1,175,000 | | 1,126,312 |
5.00%, 08/15/34 | | 1,245,000 | | 1,190,884 |
Gold 6.50%, 10/01/35 | | 5,338,560 | | 5,438,437 |
| | | | |
| | | | 16,236,373 |
The accompanying notes are an integral part of the financial statements.
| | |
| 16 | | Montgomery Street Income Securities, Inc. |
| | | | |
| | | Principal
Amount ($) | | Value ($) |
| | | | | |
| Federal National Mortgage Association 12.0% | | | | |
9.00%, 05/01/09 | | 128,738 | | 132,076 |
5.50%, 03/25/17 | | 855,000 | | 856,372 |
6.50%, 05/01/17 | | 213,110 | | 218,264 |
5.50%, 01/01/21 | | 3,624,968 | | 3,624,328 |
6.00%, 01/01/23 | | 562,582 | | 569,640 |
4.50%, 10/01/23 | | 708,931 | | 676,005 |
5.50%, 05/01/25 | | 2,390,014 | | 2,375,427 |
7.00%, 03/01/31 | | 4,405,531 | | 4,591,719 |
5.00%, 08/25/33 | | 295,000 | | 281,831 |
5.00%, 12/25/33 | | 1,060,000 | | 1,016,015 |
5.00%, 06/25/34 | | 1,033,108 | | 1,022,319 |
7.00%, 10/01/35 | | 3,583,015 | | 3,678,204 |
6.00%, 03/01/36 | | 3,702,473 | | 3,711,026 |
6.00%, 08/25/44 | | 671,731 | | 674,239 |
| | | | |
| | | | 23,427,465 |
| Government National Mortgage Association 2.2% | | | | |
6.50%, 08/20/34 | | 1,076,144 | | 1,100,005 |
6.50%, 08/20/35 | | 3,057,842 | | 3,125,996 |
| | | | |
| | | | 4,226,001 |
| Small Business Administration Participation Certificates 1.4% | | |
5.54%, 09/01/26 (b) | | 443,000 | | 449,185 |
5.37%, 10/01/26 (b) | | 965,000 | | 969,482 |
5.36%, 11/01/26 (b) | | 1,290,000 | | 1,295,103 |
| | | | |
| | | | 2,713,770 |
| |
Total U.S. Government Agency Securities | | | | 46,785,417 |
| |
Total Government and Agency Obligations (Cost $48,172,567) | | | | 47,778,752 |
| | | | |
Short-Term Investments 10.0% | | | | |
| Commercial Paper 0.1% | | | | |
UBS Finance LLC, 5.27%, 01/02/07 | | 161,000 | | 160,976 |
| Securities Lending Collateral 9.9% | | | | |
Mellon GSL Delaware Business Trust Collateral Fund | | 19,321,305 | | 19,321,305 |
| |
Total Short Term Investments (Cost $19,482,281) | | | | 19,482,281 |
The accompanying notes are an integral part of the financial statements.
| | |
| Montgomery Street Income Securities, Inc. | | 17 |
| | | |
| | | Value ($) | |
| | | | |
Total Investments 108.4% (Cost $210,851,511) | | 211,680,309 | |
Other Assets and Liabilities, Net (8.4)% | | (16,357,899 | ) |
| | |
Total Net Assets 100.0% | | 195,322,410 | |
Notes to the Schedule of Investments
| (a) | 144A: Security is exempt from registration under Rule 144A of the Securities Act of 1933. These securities may be resold in transactions exempt from registration, normally to qualified institutional buyers. The Fund has deemed this security to be liquid based on procedures approved by the Board of Directors. As of December 31, 2006, the aggregate value of 144A securities was $44,296,062 (22.7% of net assets). |
| (b) | Floating rate notes are securities whose yields vary with a designated market index or market rate, such as the coupon-equivalent of the U.S. Treasury bill rate. These securities are shown at their current rate as of December 31, 2006. |
| (c) | Certificates of beneficial interest in a Trust that has entered into a Repurchase Agreement and Credit Default Swap Agreements to track the Dow Jones CDX NA High Yield Index. |
| (d) | Security is in default. |
| (e) | All or portion of the security has been loaned. |
| (f) | Perpetual maturity security. Maturity date listed is the first call date, security is subject to call at 100 thereafter. Interest rate is fixed until the first call date and variable thereafter. |
| (g) | Interest rate is fixed until stated call date and variable thereafter. |
The accompanying notes are an integral part of the financial statements.
| | |
| 18 | | Montgomery Street Income Securities, Inc. |
| | | | |
Statement of Assets and Liabilities as of December 31, 2006 | |
| |
| Assets | | | | |
| Investments in securities, at value (a) (cost $210,851,511) | | $ | 211,680,309 | |
| Cash | | | 735,375 | |
| Interest receivable | | | 2,348,723 | |
| Other assets | | | 19,348 | |
| Receivable for dividend reinvestment | | | 201,339 | |
| Total assets | | | 214,985,094 | |
| |
| Liabilities | | | | |
| Accrued management and investment advisory fee | | | 123,962 | |
| Accrued administrative fee | | | 37,810 | |
| Return of collateral for securities on loan | | | 19,321,305 | |
| Other accrued expenses and payables | | | 179,607 | |
| Total liabilities | | | 19,662,684 | |
| Net assets, at value | | $ | 195,322,410 | |
| Net Assets | | | | |
| Net assets consist of: | | | | |
| Paid-in capital | | | 202,777,409 | |
| Undistributed investment income | | | 145,599 | |
| Net unrealized appreciation on investments | | | 828,798 | |
| Accumulated net realized loss | | | (8,429,396 | ) |
| Net assets, at value | | $ | 195,322,410 | |
| Net Asset Value per share ($195,322,410 / 10,384,967 shares of common stock outstanding, $.01 par value, 30,000,000 shares authorized) | | $ | 18.81 | |
| (a) | Includes value of securities on loan of $18,707,000. |
The accompanying notes are an integral part of the financial statements.
| | |
| Montgomery Street Income Securities, Inc. | | 19 |
| | | | |
Statement of Operations for the year ended December 31, 2006 | |
| |
| Investment Income | | | | |
| Income: | | | | |
| Interest | | $ | 10,808,724 | |
| Securities lending income | | | 15,141 | |
| Total Income | | | 10,823,865 | |
| Expenses: | | | | |
| Management and investment advisory fee | | | 674,939 | |
| Administrative fee | | | 247,243 | |
| Directors’ fees and expenses | | | 114,120 | |
| Shareholder reporting | | | 112,267 | |
| Legal | | | 70,807 | |
| Auditing | | | 49,521 | |
| Insurance | | | 44,404 | |
| Shareholder services | | | 27,000 | |
| NYSE listing fee | | | 24,022 | |
| Custodian fees | | | 10,410 | |
| Other | | | 11,771 | |
| Total expenses | | | 1,386,504 | |
| Net investment income | | | 9,437,361 | |
|
| Realized and Unrealized Gain (Loss) on Investment Transactions | |
| Net realized loss from investment transactions | | | (2,473,393 | ) |
| Net change in unrealized appreciation (depreciation) during the period on investments | | | 2,024,170 | |
| Net loss on investment transactions | | | (449,223 | ) |
| Net increase in net assets resulting from operations | | $ | 8,988,138 | |
The accompanying notes are an integral part of the financial statements.
| | |
| 20 | | Montgomery Street Income Securities, Inc. |
| | | | | | | | |
Statements of Changes in Net Assets | | | | | | | | |
| |
| | | Years Ended December 31, | |
| Increase (Decrease) in Net Assets | | 2006 | | | 2005 | |
| Operations: | | | | | | | | |
| Net investment income | | $ | 9,437,361 | | | $ | 10,330,361 | |
| Net realized loss on investment transactions | | | (2,473,393 | ) | | | (459,728 | ) |
| Net change in unrealized appreciation (depreciation) during the period on investment transactions | | | 2,024,170 | | | | (4,541,940 | ) |
| Net increase in net assets resulting from operations | | | 8,988,138 | | | | 5,328,693 | |
| Distributions to shareholders from net investment income | | | (10,892,738 | ) | | | (11,828,415 | ) |
| Fund share transactions: | | | | | | | | |
| Reinvestment of distributions | | | 736,288 | | | | 810,869 | |
| Cost of shares repurchased | | | (783,964 | ) | | | (841,458 | ) |
| Net decrease in net assets from Fund share transactions | | | (47,676 | ) | | | (30,589 | ) |
| Decrease in net assets | | | (1,952,276 | ) | | | (6,530,311 | ) |
| Net assets at beginning of period | | | 197,274,686 | | | | 203,804,997 | |
| Net assets at end of period (including undistributed net investment income of $145,599 and $131,124, respectively) | | $ | 195,322,410 | | | $ | 197,274,686 | |
| | |
| Other Information | | | | | | | | |
| Shares outstanding at beginning of period | | | 10,387,297 | | | | 10,388,517 | |
| Shares issued to shareholders in reinvestment of distributions | | | 43,670 | | | | 46,780 | |
| Shares repurchased | | | (46,000 | ) | | | (48,000 | ) |
| Net decrease in Fund shares | | | (2,330 | ) | | | (1,220 | ) |
| Shares outstanding at end of period | | | 10,384,967 | | | | 10,387,297 | |
The accompanying notes are an integral part of the financial statements.
| | |
| Montgomery Street Income Securities, Inc. | | 21 |
| | | | | | | | | | | | | | | | | | | | |
Years ended December 31, | | | 2006e | | | | 2005 | | | | 2004 | | | | 2003 | | | | 2002 | |
| | | | | |
| Selected Per Share Data | | | | | | | | | | | | | | | | | | | | |
| Net asset value, beginning of period | | $ | 18.99 | | | $ | 19.62 | | | $ | 19.64 | | | $ | 19.43 | | | $ | 19.00 | |
| Income from investment operations: | | | | | | | | | | | | | | | | | | | | |
Incomea | | | 1.03 | | | | 1.14 | | | | 1.18 | | | | 1.20 | | | | 1.36 | |
Operating expensesa | | | (.13 | ) | | | (.14 | ) | | | (.14 | ) | | | (.12 | ) | | | (.14 | ) |
Net investment incomea | | | .90 | | | | 1.00 | | | | 1.04 | | | | 1.08 | | | | 1.22 | |
Net realized and unrealized gain (loss) on investment transactions | | | (.03 | ) | | | (.49 | ) | | | .17 | | | | .42 | | | | .54 | |
Total from investment operations | | | .87 | | | | .51 | | | | 1.21 | | | | 1.50 | | | | 1.76 | |
| Less distributions from: | | | | | | | | | | | | | | | | | | | | |
Net investment income | | | (1.05 | ) | | | (1.14 | ) | | | (1.23 | ) | | | (1.29 | ) | | | (1.33 | ) |
| Net asset value, end of period | | $ | 18.81 | | | $ | 18.99 | | | $ | 19.62 | | | $ | 19.64 | | | $ | 19.43 | |
| Per share market value, end of period | | $ | 17.28 | | | $ | 16.91 | | | $ | 18.36 | | | $ | 18.55 | | | $ | 19.02 | |
| Closing price range on New York Stock Exchange for each share of Common Stock outstanding during the period (Unaudited): | | | | | | | | | | | | | | | | | | | | |
High ($) | | | 17.57 | | | | 18.85 | | | | 19.39 | | | | 20.45 | | | | 19.67 | |
Low ($) | | | 16.30 | | | | 16.55 | | | | 16.55 | | | | 17.50 | | | | 17.91 | |
| | | | | |
| Total Return | | | | | | | | | | | | | | | | | | | | |
| Based on market value (%)b | | | 8.70 | | | | (1.69 | ) | | | 5.82 | | | | 4.53 | | | | 10.12 | |
| Based on net asset value (%)b | | | 5.37 | | | | 3.31 | | | | 6.86 | d | | | 8.22 | | | | 9.71 | |
| | |
| Ratios to Average Net Assets and Supplemental Data | | | | | | | | | |
| Net assets, end of period ($millions) | | | 195 | | | | 197 | | | | 204 | | | | 204 | | | | 201 | |
| Ratio of expenses before expense reductions (%) | | | .70 | | | | .74 | | | | .75 | | | | .63 | | | | .72 | |
| Ratio of expenses after expense reductions (%) | | | .70 | | | | .74 | | | | .72 | | | | .63 | | | | .72 | |
| Ratio of net investment income (%) | | | 4.78 | | | | 5.11 | | | | 5.26 | | | | 5.47 | | | | 6.36 | |
| Portfolio turnover rate (%)c | | | 199 | | | | 157 | | | | 149 | | | | 160 | | | | 259 | |
The accompanying notes are an integral part of the financial statements.
| | |
| 22 | | Montgomery Street Income Securities, Inc. |
| a | Based on average shares outstanding during the period. |
| b | Total return based on net asset value reflects changes in the Fund’s net asset value during the period. Total return based on market value reflects changes in market value. Each figure includes reinvestment of dividends. These figures will differ depending upon the level of any discount from or premium to net asset value at which the Fund’s shares trade during the period. |
| c | The portfolio turnover rates excluding mortgage dollar roll transactions are stated in the Financial Highlights. The portfolio turnover rates for those periods that had mortgage dollar roll transactions were 349%, 376%, 426%, and 520% for the years ended December 31, 2005, 2004, 2003 and 2002, respectively. The Fund had no transactions from mortgage dollar rolls for the year ended December 31, 2006. |
| d | Total return would have been lower had certain expenses not been reduced. |
e | As discussed in Note C, the Fund changed investment advisers, effective June 9, 2006. |
The accompanying notes are an integral part of the financial statements.
| | |
| Montgomery Street Income Securities, Inc. | | 23 |
Notes to Financial Statements
ALIGN="left">
A. Significant Accounting Policies
Montgomery Street Income Securities, Inc. (the “Fund”) is registered under the Investment Company Act of 1940, as amended (the “1940 Act”), as a closed-end, diversified management investment company.
The Fund’s financial statements are prepared in accordance with accounting principles generally accepted in the United States of America which require the use of management estimates. Actual results could differ from those estimates. The policies described below are followed consistently by the Fund in the preparation of its financial statements.
Security Valuation. Investments are stated at value determined as of the close of regular trading on the New York Stock Exchange on each day the exchange is open for trading. Debt securities are valued by independent pricing services approved by, or at the direction of, the Board of Directors of the Fund. Such services may use various pricing techniques which take into account appropriate factors such as yield, quality, coupon rate, maturity, type of issue, trading characteristics and other data, as well as broker quotes. If the pricing services are unable to provide valuations, the securities are valued at the most recent bid quotation or evaluated price, as applicable, obtained from a broker-dealer. Fixed income securities purchased with an original or remaining maturity of sixty days or less, maturing at par, are valued at amortized cost. Securities and other assets for which market quotations are not readily available or for which the above valuation procedures are deemed not to reflect fair value are valued in a manner that is intended to reflect their fair value as determined in accordance with procedures approved by the Board of Directors.
Repurchase Agreements. The Fund may enter into repurchase agreements with certain banks and broker/dealers whereby the Fund, through its custodian or sub-custodian bank, receives delivery of the underlying securities, the amount of which at the time of purchase and each subsequent business day is required to be maintained at such a level that the collateral’s market value is at least equal to the principal amount of the repurchase price plus accrued interest. The custodian or agent bank holds the collateral in a separate account until the agreement matures. If the counterparty defaults and the value of the collateral declines or if bankruptcy proceedings are commenced with respect to the counterparty, realization of the collateral by the Fund may be delayed or limited. There were no repurchase agreements outstanding at December 31, 2006.
When-Issued/Delayed Delivery Securities. The Fund may purchase securities with delivery or payment to occur at a later date beyond the normal settlement period. At the time the Fund enters into a commitment to purchase a security, the transaction is recorded and the value of the security is reflected in the net asset value. The price of such security and the date when the security will be delivered and paid for are fixed at
| | |
| 24 | | Montgomery Street Income Securities, Inc. |
the time the transaction is negotiated. The value of the security may vary with market fluctuations. No interest accrues to the Fund until settlement of the trade takes place.
Certain risks may arise upon entering into when-issued or delayed delivery securities from the potential inability of counterparties to meet the terms of their contracts or if the issuer does not issue the securities due to political, economic, or other factors. Additionally, losses may arise due to changes in the value of the underlying securities. At December 31, 2006, the Fund held no when-issued or delayed delivery securities.
Securities Lending. The Fund has entered into a securities lending arrangement with its custodian. Under the terms of the agreement, the Fund receives a fee equal to a percentage of the net income generated by the collateral held during each lending transaction. The custodian is authorized to loan securities on behalf of the Fund to approved borrowers and is required to maintain collateral at least equal in value to the value of the securities loaned. Cash collateral is invested by the custodian in the Mellon GSL Delaware Business Trust Collateral Fund (a pooled investment fund). In the event of bankruptcy or other default of the borrower, the Fund could experience delays in liquidating the loan collateral or recovering the loaned securities and incur expenses related to enforcing its rights. In addition, there could be a decline in the value of the collateral or in the fair value of the securities loaned while the Fund seeks to enforce its rights thereto and the Fund could experience subnormal levels of income or lack of access to income during that period. The Fund bears the risk of any deficiency in the amount of collateral available for return to a borrower due to a loss in an approved investment.
Loan Participations/Assignments. The Fund may invest in U.S. dollar-denominated fixed and floating rate loans (“Loans”) arranged through private negotiations between a foreign sovereign entity and one or more financial institutions (“Lenders”). The Fund invests in such Loans in the form of participations in Loans (“Participations”) or assignments of all or a portion of loans from third parties. Participations typically result in the Fund having a contractual relationship only with the Lender, not with the sovereign borrower. The Fund has the right to receive payments of principal, interest and any fees to which it is entitled from the Lender selling the Participation and only upon receipt by the Lender of the payments from the borrower. In connection with purchasing Participations, the Fund generally has no right to enforce compliance by the borrower with the terms of the loan agreement relating to the Loan, nor any rights of set-off against the borrower, and the Fund will not benefit directly from any collateral supporting the Loan in which it has purchased the Participation. As a result, the Fund assumes the credit risk of both the borrower and the Lender that is selling the Participation. At December 31, 2006, the Fund held no Participations.
| | |
| Montgomery Street Income Securities, Inc. | | 25 |
Federal Income Taxes. The Fund’s policy is to comply with the requirements of the Internal Revenue Code, as amended, which are applicable to regulated investment companies and to distribute substantially all of its taxable income to its stockholders. Accordingly, the Fund paid no federal income taxes and no federal income tax provision was required.
Recent Accounting Pronouncements. On July 13, 2006, the Financial Accounting Standards Board (“FASB”) released FASB Interpretation No. 48 “Accounting for Uncertainty in Income Taxes” (“FIN 48”). FIN 48 provides guidance for how uncertain tax positions should be recognized, measured, presented and disclosed in the financial statements. FIN 48 requires the evaluation of tax positions taken or expected to be taken in the course of preparing the Fund’s tax returns to determine whether the tax positions are “more-likely-than-not” of being sustained by the applicable tax authority. Tax positions not deemed to meet the more-likely-than-not threshold would be recorded as a tax benefit or expense in the current year. The timeframe for the adoption of FIN 48 is the first financial statement reporting period for fiscal years beginning after December 15, 2006. At this time, management is evaluating the implications of FIN 48 and its impact on the financial statements has not yet been determined.
In September 2006, the FASB issued Statement on Financial Accounting Standards (“SFAS”) No. 157, “Fair Value Measurements.” This standard establishes a single authoritative definition of fair value, sets out a framework for measuring fair value and requires additional disclosures about fair value measurements. SFAS No. 157 applies to fair value measurements already required or permitted by existing standards. SFAS No. 157 is effective for financial statements issued for fiscal years beginning after November 15, 2007. The changes to current generally accepted accounting principles from the application of this Statement relate to the definition of fair value, the methods used to measure fair value, and the expanded disclosures about fair value measurements. Management is in the process of analyzing the impact of SFAS No. 157. The Fund does not believe the adoption of SFAS No. 157 will impact the financial statement amounts, however, additional disclosures may be required about the inputs used to develop the measurements and the effect of certain of the measurements on changes in net assets for the period.
Distribution of Income and Gains. Distributions of net investment income are made quarterly. Net realized gains from investment transactions in excess of available capital loss carryforwards, if any, will be distributed to stockholders at least annually. The Fund uses the specific identification method for determining realized gain or loss on investments sold for both financial and federal income tax reporting purposes.
Contingencies. In the normal course of business, the Fund may enter into contracts with service providers that contain general indemnification clauses. The Fund’s
| | |
| 26 | | Montgomery Street Income Securities, Inc. |
maximum exposure under these arrangements is unknown, as this would involve future claims that may be made against the Fund that have not yet been made. However, based on experience to date, the Fund expects any risk of loss to be remote.
Other. Investment transactions are accounted for on a trade date plus one basis for daily net asset value calculations. However, for financial reporting purposes, investment transactions are reported on trade date. Interest income is recorded on the accrual basis. Dividend income is recorded on the ex-dividend date. All premiums and discounts are amortized/accreted for financial reporting purposes.
Forward Foreign Currency Contracts. The Fund may enter into forward foreign currency contracts (“contracts”), generally to hedge foreign currency exposure between trade date and settlement date on security purchases and sales or to minimize foreign currency risk on portfolio securities denominated in foreign currencies. All contracts are marked-to-market daily based on the forward currency exchange rate. The change in market value is recorded as a receivable or payable from forward currency contracts. When a contract is closed, the difference between the value of the contract at the time it was opened and the value at the time it was closed is recorded as net realized gain (loss) on foreign currency related items.
The use of forward foreign currency contracts does not eliminate fluctuations in the underlying prices of the Fund’s portfolio securities, but it does establish a rate of exchange that can be achieved in the future. These contracts involve market risk in excess of the receivable or payable related to foreign currency contracts reflected in the Statement of Assets and Liabilities. Although contracts limit the risk of loss due to a decline in the value of the hedged currency, they also limit any potential gain that might result should the value of the currency increase. Additionally, the Fund could be exposed to the risk of a previously hedged position becoming unhedged if the counterparty to a contract is unable to meet the terms of the contract.
B. Purchases and Sales of Securities
During the year ended December 31, 2006, purchases and sales of investment securities, excluding U.S. Treasury obligations and short-term investments, aggregated $166,440,005 and $110,363,100, respectively. Purchases and sales of long-term U.S. Treasury obligations aggregated $168,955,086 and $210,016,665, respectively.
C. Related Parties
Management and Investment Advisory Agreement. Under the Management and Investment Advisory Agreement (the “Previous Agreement”) with Deutsche Investment Management Americas, Inc. (“DeIM”), an indirect, wholly owned subsidiary of Deutsche Bank AG, for the period from January 1, 2006 through
| | |
| Montgomery Street Income Securities, Inc. | | 27 |
June 8, 2006, the Fund agreed to pay DeIM for the services rendered, an annual fee, payable monthly, equal to 0.50% of the value of the net assets of the Fund up to and including $100 million, 0.45% of the value of the net assets of the Fund over $100 million and up to and including $150 million; 0.40% of the value of the net assets of the Fund over $150 million and up to and including $200 million; and 0.35% of the value of the net assets of the Fund over $200 million.
The Previous Agreement also provided, for the period from January 1, 2006 through June 8, 2006, that DeIM reimburse the Fund for all expenses (excluding interest, taxes, brokerage commissions and extraordinary expense) borne by the Fund in any fiscal year in excess of 1.50% of the first $30 million of average net assets and in excess of 1.00% of average net assets in excess of $30 million. Further, if annual expenses, as defined in the Previous Agreement, exceeded 25% of the Fund’s annual gross income, the excess would be reimbursed by DeIM.
For the period January 1, 2006 through June 8, 2006, the fees pursuant to the Previous Agreement amounted to $401,752, equivalent to an effective annualized rate of 0.46% of the Fund’s average monthly net assets.
For the period June 9, 2006 through July 12, 2006, under an Interim Investment Advisory Agreement (the “Interim Agreement”) with Hartford Investment Management Company (“HIMCO”), the Fund agreed to pay HIMCO for the services rendered, a quarterly fee equal to the product of (a) one quarter of 0.25%, times (b) the average of the net assets of the Fund on the last business day of each calendar month of the then ended calendar quarter; provided, however, that the compensation received by HIMCO under the Interim Agreement, when added to the compensation received by Jackson Fund Services (“JFS”) under the Fund Accounting and Administration Services Agreement between the Fund and JFS, would in no event exceed the compensation DeIM would have received under the Previous Agreement.
Effective July 13, 2006, upon stockholder approval, the Fund and HIMCO entered into an investment advisory agreement whereby the Fund agreed to pay HIMCO for the services rendered, a quarterly fee equal to the product of (a) one quarter of 0.25%, times (b) the average of the net assets of the Fund on the last business day of each calendar month of the then ended calendar quarter.
Fund Accounting and Administration Services Agreement. Effective June 9, 2006, under a Fund Accounting and Administration Services Agreement (the “Administration Agreement”) between the Fund and JFS, the Fund agreed to pay JFS for the services rendered, an annual fee, payable monthly, equal to 0.25% of the value of net assets of the Fund up to $100 Million; 0.20% of the value of the net assets of the Fund from $100 million to $200 million; and 0.15% of the value of the net assets of the Fund over $200 million. For the period June 9, 2006 through
| | |
| 28 | | Montgomery Street Income Securities, Inc. |
December 31, 2006, the fees pursuant to the Administration Agreement amounted to $247,243, equivalent to an effective annualized rate of 0.22% of the Fund’s average daily net assets.
Shareholder Services Fees. For the period January 1, 2006 through June 8, 2006, DWS Scudder Investment Service Company (“DWS-SISC”), an affiliate of DeIM, was the transfer, dividend paying, and shareholder services agent for the Fund. During this period, the amount charged to the Fund by DWS-SISC aggregated $15,690.
Effective June 9, 2006, Mellon Investor Services LLC replaced DWS-SISC as the transfer, dividend paying, and shareholder services agent for the Fund.
Directors’ Fees and Expenses. The Fund pays each Director retainer fees plus specified amounts for each Board and Committee meeting attended.
D. Federal Income Tax Matters
The timing and characterization of certain income and capital gains distributions are determined in accordance with federal tax regulations, which may differ from accounting principles generally accepted in the United States of America. These differences primarily relate to premium amortization on debt securities, investments in mortgage-backed securities, and investments in foreign-denominated securities. As a result, net investment income and net realized gain (loss) on investment transactions for a reporting period may differ significantly from distributions during such period. Accordingly, the Fund makes reclassifications among certain of its capital accounts without impacting the net asset value of the Fund.
As of December 31, 2006, the components of distributable earnings on a tax basis and the federal tax cost of investments are listed in the following table.
| | | | | | | | | | | | | | | | | |
| | | | | | | | | | | Tax Components of
Distributable Earnings |
Cost of
Investments | | Gross
Unrealized
Appreciation | | Gross
Unrealized
Depreciation | | | Net
Unrealized
Depreciation | | | Undistributed
Net
Investment
Income | | Accumulated
Net Realized
Gain |
| $211,806,826 | | $ | 1,372,769 | | $ | (1,499,286 | ) | | $ | (126,517 | ) | | $ | 145,599 | | $ | — |
The distributions paid of $10,892,738 and $11,828,415 for the years ended December 31, 2006 and 2005, respectively, were from ordinary income for federal income tax purposes.
| | |
| Montgomery Street Income Securities, Inc. | | 29 |
At December 31, 2006, the Fund had a tax basis capital loss carryforward of $6,606,654, which may be applied against any realized net taxable capital gains from each succeeding year until fully utilized, or until the respective expiration dates occur.
| | |
| Amount | | Year of Expiration |
| $ 781,347 | | 2010 |
| 1,872,360 | | 2013 |
| 3,952,947 | | 2014 |
| $6,606,654 | | |
The Fund realized $867,428 of capital losses after October 31, 2006, which were deferred for tax purposes to the first day of the following fiscal year.
E. Share Repurchases
The Fund is authorized to effect periodic repurchases of its shares in the open market from time to time when the Fund’s shares trade at a discount to their net asset value. During the year ended December 31, 2006, the Fund purchased 46,000 shares of common stock on the open market at a total cost of $783,964. The weighted average discount of these purchases, comparing the purchase price to the net asset value at the time of purchase was 9.7%. During the year ended December 31, 2005, the Fund purchased 48,000 shares of common stock on the open market at a total cost of $841,458 with a weighted average discount of 8.2%.
| | |
| 30 | | Montgomery Street Income Securities, Inc. |
Report of Independent Registered Public Accounting Firm
To the Stockholders and Board of Directors of
Montgomery Street Income Securities, Inc.:
We have audited the accompanying statement of assets and liabilities, including the schedule of investments, of Montgomery Street Income Securities, Inc. (the “Fund”), as of December 31, 2006, and the related statement of operations, the statement of changes in net assets, and the financial highlights for the year then ended. These financial statements and financial highlights are the responsibility of the Fund’s management. Our responsibility is to express an opinion on these financial statements and financial highlights based on our audit. The statement of changes in net assets and financial highlights of the Fund for the year ended December 31, 2005, were audited by other auditors whose report, dated February 22, 2006, expressed an unqualified opinion on the statement of changes in net assets and financial highlights. The financial highlights of the Fund for each of the periods ended on or prior to December 31, 2004, were audited by other auditors whose report, dated February 15, 2005, expressed an unqualified opinion on those financial highlights.
We conducted our audit in accordance with the standards of the Public Company Accounting Oversight Board (United States). Those standards require that we plan and perform the audit to obtain reasonable assurance about whether the financial statements and financial highlights are free of material misstatement. The Fund is not required to have, nor were we engaged to perform, an audit of its internal control over financial reporting. Our audit included consideration of internal control over financial reporting as a basis for designing audit procedures that are appropriate in the circumstances, but not for the purpose of expressing an opinion on the effectiveness of the Fund’s internal control over financial reporting. Accordingly, we express no such opinion. An audit also includes examining, on a test basis, evidence supporting the amounts and disclosures in the financial statements, assessing the accounting principles used and significant estimates made by management, as well as evaluating the overall financial statement presentation. Our procedures included confirmation of securities owned as of December 31, 2006, by correspondence with the Fund’s custodian. We believe that our audit provides a reasonable basis for our opinion.
In our opinion, the financial statements and financial highlights referred to above present fairly, in all material respects, the financial position of the Fund as of December 31, 2006, and the results of its operations, the changes in its net assets, and the financial highlights for the year then ended, in conformity with accounting principles generally accepted in the United States of America.
DELOITTE & TOUCHE LLP
Chicago, Illinois
February 22, 2007
| | |
| Montgomery Street Income Securities, Inc. | | 31 |
Dividend Reinvestment and Cash
Purchase Plan
All registered stockholders of the Fund’s Common Stock are offered the opportunity of participating in a Dividend Reinvestment and Cash Purchase Plan (the “Plan”). Registered stockholders, on request or on becoming registered stockholders, are mailed information regarding the Plan, including a form by which they may elect to participate in the Plan and thereby cause their future net investment income dividends and capital gains distributions to be invested in shares of the Fund’s common stock. Mellon Bank, N.A. is the agent (the “Plan Agent”) for stockholders who elect to participate in the Plan.
If a stockholder chooses to participate in the Plan, the stockholder’s dividends and capital gains distributions will be promptly invested, automatically increasing the stockholder’s holdings in the Fund. If the Fund declares a dividend or capital gains distributions payable either in cash or in stock of the Fund, the stockholder will automatically receive stock. If the market price per share on the payment date for the dividend (the “Valuation Date”) equals or exceeds the net asset value per share, the Fund will issue new shares to the stockholder at the greater of the following on the Valuation Date: (a) net asset value per share or (b) 95% of the market price per share. If the market price per share on the Valuation Date is less than the net asset value per share, the Fund will issue new shares to the stockholder at the market price per share on the Valuation Date. In either case, for federal income tax purposes the stockholder will be deemed to receive a distribution equal to the market value on the Valuation Date of the new shares issued. If dividends or capital gains distributions are payable only in cash, then the stockholder will receive shares purchased on the New York Stock Exchange or otherwise on the open market. In this event, for federal income tax purposes the amount of the distribution will equal the cash distribution paid. State and local taxes may also apply. All reinvestments are in full and fractional shares, carried to three decimal places.
Stockholders participating in the Plan can also purchase additional shares quarterly in any amount from $100 to $5,000 (a “Voluntary Cash Investment”) by sending in a check together with the cash remittance slip, which will be sent with each statement of the stockholder’s account, to Mellon Investor Services LLC, the Fund’s transfer agent (the “Transfer Agent”). Such additional shares will be purchased on the open market by the Plan Agent or its delegate. The purchase price of shares purchased on the open market, whether pursuant to a reinvestment of dividends payable only in cash or a
| | |
| 32 | | Montgomery Street Income Securities, Inc. |
Voluntary Cash Investment, will be the average price (including brokerage commissions) of all shares purchased by the Plan Agent or its delegate on the date such purchases are effected. In addition, stockholders may be charged a service fee in an amount up to 5% of the value of the Voluntary Cash Investment. Although subject to change, stockholders are currently charged $1 for each Voluntary Cash Investment.
Stockholders may terminate their participation in the Plan at any time and elect to receive dividends and other distributions in cash by notifying the Transfer Agent in writing. Such notification must be received not less than 10 days prior to the record date of any distribution. There is no charge or other penalty for such termination. The Plan may be terminated by the Fund upon written notice mailed to the stockholders at least 30 days prior to the record date of any distribution. Upon termination, the Fund will issue certificates for all full shares held under the Plan and cash for any fractional share.
Alternatively, stockholders may request the Transfer Agent to instruct the Plan Agent or its delegate to sell any full shares and remit the proceeds, less a $2.50 service fee and less brokerage commissions. The sale of shares (including fractional shares) will be a taxable event for federal income tax purposes and may be taxable for state and local tax purposes.
The Plan may be amended by the Fund at any time. Except when required by law, written notice of any amendment will be mailed to stockholders at least 30 days prior to its effective date. The amendment will be deemed accepted unless written notice of termination is received by the Transfer Agent prior to the effective date.
An investor holding shares in its own name can participate directly in the Plan. An investor holding shares in the name of a brokerage firm, bank or other nominee should contact that nominee, or any successor nominee, to determine whether the nominee can participate in the Plan on the investor’s behalf and to make any necessary arrangements for such participation.
Additional information, including a copy of the Plan and its Terms and Conditions and an enrollment form, can be obtained from the Transfer Agent by writing Mellon Investor Services LLC, P.O. Box 3315, South Hackensack, NJ 07606-1915, or by calling (877) 437-3938.
| | |
| Montgomery Street Income Securities, Inc. | | 33 |
Change in Independent Registered Public Accounting Firm
At a meeting held on July 13, 2006, based on Audit Committee recommendations and approvals, the Fund’s Board of Directors unanimously voted to approve Deloitte & Touche LLP as the Fund’s independent registered public accounting firm for the fiscal year ended December 31, 2006. The Fund’s previous independent registered public accountant, PricewaterhouseCoopers LLP (“PwC”) resigned as the Fund’s independent registered public accountants effective June 9, 2006 concurrent with the engagement of HIMCO because it has an existing financial relationship with the parent of the HIMCO and was no longer considered to be “independent” with respect to the Fund.
PwC’s report on the Fund’s financial statements for the fiscal year ended December 31, 2005, contained no adverse opinion or disclaimer of opinion nor was it qualified or modified as to uncertainty, audit scope or accounting principles. During the Fund’s fiscal year ended December 31, 2005, and subsequent interim period ended July 13, 2006, there were no disagreements with PwC on any matter of accounting principles or practices, financial statement disclosure or auditing scope or procedure, which disagreement, if not resolved to the satisfaction of PwC, would have caused it to make reference to the subject matter of the disagreements in connection with its report on the Fund’s financial statements for such year, and there were no reportable events of the kind described in Item 304(a)(1)(v) of Regulation S-K under the Securities Exchange Act of 1934, as amended.
Additionally, to the best of the Fund’s knowledge, for the fiscal years ended December 31, 2005 and December 31, 2004, the Fund did not consult with Deloitte & Touche LLP on items which concerned the application of accounting principles to a specified transaction, either completed or proposed, or the type of audit opinion that might be rendered on the Fund’s financial statements or concerned the subject of a disagreement (as defined in paragraph (a)(1)(iv) of Item 304 of Regulation S-K) or reportable events (as described in paragraph (a)(1)(v) of Item 304 of Regulation S-K).
| | |
| 34 | | Montgomery Street Income Securities, Inc. |
Directors and Officers
The following table presents certain information regarding the Directors and Officers of Montgomery Street Income Securities, Inc. as of December 31, 2006. Each Director’s and Officer’s age is set forth in parentheses after his or her name. The mailing address for each Director and Officer is 225 W. Wacker Drive, Suite 950, Chicago, IL 60606. Unless otherwise noted, each Director and Officer has engaged in the principal occupation(s) noted in the table for at least the most recent five years, although not necessarily in the same capacity. The term of office for each Director is until the next annual meeting of stockholders or until the election and qualification of a successor. Officers are appointed annually by, and serve at the discretion of, the Board of Directors.
| | | | |
Non-Interested Directors | | |
Name, Age,
Position(s) Held
with the Fund
and Length of
Time Served1 | | Principal Occupation(s) During Past 5 Years and
Other Directorships Held | | Number
of Funds
in Fund
Complex
Overseen |
Richard J. Bradshaw (58) Chairman and Director 1991-present (2004 to present as Chairman) | | Executive Director, Cooley Godward Kronish LLP (law firm). | | 1 |
Victor L. Hymes (49) Director 2005-present | | Chief Executive Officer and Chief Investment Officer of Legato Capital Management LLC (investment adviser) (2004-present). Formerly, Chief Operating Officer and Chief Investment Officer of Cazenave Partners, LLC (investment adviser) (2003-2004); Managing Director, Zurich Scudder Investments, Inc. (a previous adviser of the Fund) (1997-2002); and President of the Fund (2000-2002). | | 1 |
John T. Packard (73) Director 2001-present | | Executive Vice President of Mt. Eden Investment Advisors LLC (since 2005). Formerly, Managing Director, Weiss, Peck & Greer LLC (investment adviser and broker-dealer) (2002-2004); Advisory Managing Director of the same firm (2000-2002); formerly, Advisory Managing Director, Zurich Scudder Investments, Inc. (a previous adviser of the Fund) (1999-2000), Managing Director of the same firm (1985-1998), and President of the Fund (1988-2000). | | 1 |
Wendell G. Van Auken (62) Director 1994-present | | Managing Director of several venture capital funds affiliated with Mayfield Fund. Directorship: Advent Software (portfolio software company). | | 1 |
James C. Van Horne (71) Director 1985-present | | A.P. Giannini Professor of Finance, Graduate School of Business, Stanford University. Directorship: Synnex Corporation (information technology distributor). Formerly, Chairman of the Board of the Fund (1991-2004). | | 1 |
| | |
| Montgomery Street Income Securities, Inc. | | 35 |
| | | | |
Officers | | | | |
Name, Age,
Position(s) Held
with the Fund
and Length of
Time Served | | Principal Occupation(s) During Past 5 Years and
Other Directorships Held | | Number
of Funds
in Fund
Complex
Overseen |
Mark D. Nerud (40) President and Chief Executive Officer 2006-present | | President of Jackson National Asset Management, LLC (“JNAM”) and Jackson Fund Services (“JFS”) (12/06 to present); President and Trustee/Manager of 92 portfolios comprising JNL Series Trust, JNL Variable Fund LLC, and JNL Variable Fund I LLC (1/07 to present); Chief Financial Officer of JNAM and JFS (11/00 to 12/06) and Managing Board Member of JNAM (11/00 to 11/03 and 1/07 to present); Vice President (2/99 to 12/06), Treasurer, Chief Financial Officer of other investment companies advised by the JNAM (12/02 to 12/06); Vice President – Fund Accounting & Administration of Jackson National Life Insurance Company (“JNL”)(1/00 to present). | | n/a |
Daniel W. Koors (36) Chief Financial Officer 2006-present | | Vice President and Chief Financial Officer of JNAM and JFS (1/07 to present); Vice President, Treasurer and Chief Financial Officer of other investment companies advised by JNAM (12/06 to present); Assistant Treasurer of other investment companies advised by JNAM (9/06 to 12/06); Assistant Vice President – Fund Administration of JNL (8/06 to present); Partner of Deloitte & Touche LLP (2003 to 2006); Senior Manager of Deloitte & Touche LLP (2000 to 2003). | | n/a |
Susan H. Rhee (35) Secretary 2006-present | | Secretary of JNAM (11/00 to present); Vice President, Counsel, and Secretary of other investment companies advised by JNAM; Assistant Vice President of JNL (8/03 to present); Associate General Counsel of JNL (7/01 to present). | | n/a |
Toni M. Bugni (33) Chief Compliance Officer 2006-present | | Compliance Manager of JFS (2/06 - present); Legal Assistant, MetLife Advisers, LLC (2004 to 2006); Regulatory Administration Senior Specialist, PFPC Inc. (2003 to 2004); Reporting and Compliance Senior Specialist, Investors Bank & Trust (2001 to 2003). | | n/a |
| | |
| 36 | | Montgomery Street Income Securities, Inc. |
General Information
| | |
| |
Investment
Adviser | | Hartford Investment Management Company 55 Farmington Avenue Hartford, CT 06105 |
| |
| Administrator | | Jackson Fund Services 225 West Wacker Drive Chicago, IL 60606 |
| |
| Transfer Agent | | Mellon Investor Services P.O. Box 3315 South Hackensack, NJ 07606-1915 (Tel) 1/877/437-3938 |
| |
| Custodian | | Mellon Bank, N.A. One Mellon Center Pittsburgh, PA 15258 |
| |
| Legal Counsel | | Howard Rice Nemerovski Canady Falk & Rabkin PC Three Embarcadero Center San Francisco, CA 94111 |
| |
| Independent Registered Public Accounting Firm | | Deloitte & Touche LLP (Effective July 13, 2006) 111 South Wacker Drive Chicago, IL 60606-4301 |
| | |
| Montgomery Street Income Securities, Inc. | | 37 |

Presorted Standard
U.S. Postage
PAID
Lancaster, PA
Permit No. 1313
Monty-2
(42065 2/06)
Item 2. Code of Ethics.
As of December 31, 2006, the registrant had adopted a “code of ethics” (as such term is defined in the instructions to Item 2 of Form N-CSR) that applies to the registrant’s principal executive officer and principal financial and accounting officer. Effective June 9, 2006, the registrant adopted a new Principal Executive and Principal Financial Officer Code of Ethics in connection with the change of administrator of the registrant. Prior to June 9, 2006, Deutsche Investment Management Americas Inc. (“Deutsche”) acted as investment adviser and administrator to the registrant, and the registrant’s officers, including its principal executive officer and principal financial officer, were associated with Deutsche. Beginning June 9, 2006, Jackson Fund Services, a division of Jackson National Asset Management, LLC, assumed responsibilities as administrator of the registrant and also provided the registrant with new officers, including a principal executive officer and a principal financial officer. This code is filed as Exhibit 12(a)(1) hereto. There were no substantive amendments or waivers to the code of ethics during the period covered by this report.
Item 3. Audit Committee Financial Expert.
The registrant’s Board of Directors has determined that Mr. John T. Packard, Mr. Wendell G. Van Auken, and Mr. James C. Van Horne are “audit committee financial experts” (as such term is defined in the instructions to Item 3 of Form N-CSR). Each of these individuals is “independent,” meaning that he is not an “interested person” of the registrant (as that term is defined in Section 2(a)(19) of the Investment Company Act of 1940, as amended) and he does not accept any consulting, advisory, or other compensatory fee from the registrant (except in his capacity as a Board of committee member).
An “audit committee financial expert” is not an “expert” for any purpose, including for purposes of Section 11 of the Securities Act of 1933, as amended, as a result of being designated as an “audit committee financial expert.” Further, the designation of a person as an “audit committee financial expert” does not mean that the person has any greater duties, obligations, or liability than those imposed on the person without the “audit committee financial expert” designation. Similarly, the designation of a person as an “audit committee financial expert” does not affect the duties, obligations, or liability of any other member of the Audit Committee or Board of Directors.
Item 4. Principal Accountant Fees and Services.
(a) – (d)
PricewaterhouseCoopers LLP (“PwC”) was appointed by the Board of Directors as the independent registered public accounting firm of the registrant for the fiscal year ended December 31, 2005. Effective July 13, 2006, Deloitte & Touche LLP (“Deloitte”) was appointed by the Board of Directors as the independent registered public accounting firm of the registrant for the fiscal year ended December 31, 2006.
The following table sets forth the amount of fees that were billed by the principal accountant for the respective period to the registrant.
Fees for Services Rendered to the Registrant by the Principal Accountant
Fiscal Year | Audit Fees | Audit-Related Fees | Tax Fees | All Other Fees |
2005 | $41,500 | $0 | $0 | $0 |
2006 | $43,000 | $0 | $6,000 | $0 |
Tax Fees for 2006 represent fees for services rendered to the registrant for tax return preparation and review of income and capital gains distributions.
For the fiscal year ended December 31, 2005, Deutsche acted as investment adviser to the registrant. Effective as of the close of business on June 9, 2006, Hartford Investment Management Company (“Hartford”) became the investment adviser of the registrant.
The following table sets forth the amount of fees that were billed by the principal accountant for the respective period to any entity controlling, controlled by or under common control with the applicable investment adviser that provided ongoing services to the registrant (“Adviser Entities”) that were directly related to the registrant’s operations and financial reporting.
Fees for Services Rendered to Adviser Entities by the Principal Accountant
Fiscal Year | Audit-Related Fees | Tax Fees | All Other Fees |
2005 | $268,900 | $197,605 | $104,635 |
2006 | $62,552 | $0 | $0 |
Deutsche reported that Audit-Related Fees for 2005 were the aggregate fees billed for services in connection with the assessment of internal controls and additional related procedures that are reasonably related to the performance of audits or the review of financial statements of Adviser Entities. Deutsche also reported that Tax Fees for 2005 were the aggregate fees billed to Adviser Entities for professional services for tax advice, tax compliance, and tax planning. Deutsche further reported that All Other Fees for 2005 were the aggregate fees billed to Adviser Entities for services in connection with risk management and process improvement initiatives.
Audit Related Fees for 2006 included fees for an attestation engagement relating to Hartford’s performance presentations.
(e)(1) | The Audit Committee has adopted procedures for the pre-approval by the Audit Committee of (i) the engagement of the registrant’s independent auditors to provide audit and non-audit services to the registrant and (ii) the engagement of the registrant’s independent auditors to provide non-audit services to the investment adviser or its related entities that related directly to the registrant’s |
operations and financial reporting. If time does not permit, the Chairman of the Audit Committee is authorized to pre-approve the engagement of the independent auditors on behalf of the Audit Committee. The independent auditors and the investment adviser are required to report on the initiation of any such engagement at the next regular Audit Committee meeting.
(g) | For 2005, Deutsche reported that the aggregate amount of non-audit fees billed by the principal accountant to the registrant and Adviser Entities was $571,140. The aggregate amount of non-audit fees billed by the principal accountant to the registrant and Adviser Entities was $68,552 for 2006. |
(h) | For the fiscal years ended December 31, 2005 and December 31, 2006, the Audit Committee of the registrant’s Board of Directors considered the provision of non-audit services that were rendered to the respective Adviser Entities that were not pre-approved pursuant to paragraph (c)(7)(ii) of Rule 2-01 of Regulation S-X and concluded that such services were compatible with maintaining the respective principal accountant’s independence. |
Item 5. Audit Committee of Listed Registrants.
(a) | The registrant has a separately-designated standing audit committee established in accordance with Section 3(a)(58)(A) of the Securities Exchange Act of 1934, as amended. The registrant's audit committee consists of Wendell G. Van Auken (Chairman), John T. Packard, and James C. Van Horne. |
Item 6. Schedule of Investments.
Included in Reports to Stockholders under Item 1.
Item 7. Disclosure of Proxy Voting Policies and Procedures for Closed-End Management Investment Companies.
It is the intention of the registrant to invest exclusively in non-voting securities. Under normal circumstances, the registrant does not intend to exercise conversion, exchange or other rights to purchase common stock or other equity securities, or otherwise to hold voting securities. In the unlikely event that the registrant does come into possession of any voting securities, the registrant intends to dispose of such securities as soon as it is reasonably practicable and prudent to do so.
Item 8. Portfolio Managers of Closed-End Management Investment Companies.
(a) | As of the close of business on June 9, 2006 and through the present, Nasri Toutoungi, Jeff MacDonald and Charles Moon are primarily and jointly responsible for the day-to-day management of the registrant. Please see the tables below for descriptions of each individual’s role, as well as prior business experience over the last 5 years. |
Portfolio Management Team
Name | Title | Position | Years At Firm | Years In Industry |
Nasri Toutoungi | Managing Director | Senior Portfolio Manager | 4 | 19 |
Current Employer | Title/Function | Start Date | End Date |
Hartford Investment Management | Managing Director/Senior Portfolio Manager | January 2003 | Present |
Previous Employer | Title/Function | Start Date | End Date |
BlackRock, Inc. | Managing Director | 1998 | January 2002 |
| | | | | | | |
Name | Title | Position | Years At Firm | Years In Industry |
Jeff MacDonald | Vice President | Portfolio Manager | 2 | 15 |
Current Employer | Title/Function | Start Date | End Date |
Hartford Investment Management | Vice President/Portfolio Manager | January 2005 | Present |
Previous Employer | Title/Function | Start Date | End Date |
Wellington Management Company | Assistant Vice President/ Fixed Income Portfolio Analyst | December 2002 | December 2004 |
Wellington Management Company | Senior Performance Analyst | December 1999 | December 2002 |
| | | | | | | |
Name | Title | Position | Years At Firm | Years In Industry |
Charles Moon | Executive Vice President | Senior Portfolio Manager | 1 | 16 |
Current Employer | Title/Function | Start Date | End Date |
Hartford Investment Management | Executive Vice President/ Director Investment Grade Credit | March 2006 | Present |
Previous Employer | Title/Function | Start Date | End Date |
OFI Institutional Asset Management | Co-Head Investment Grade Credit/ Portfolio Manager | April 2002 | February 2006 |
Morgan Stanley Investment Management | Executive Director/ Portfolio Manager | June 1999 | March 2002 |
| | | | | | | |
The other accounts managed by the registrant’s portfolio managers are as follows as of December 31, 2006:
Portfolio Manager | Number and Total Assets of Other Registered Investment Company Accounts as of December 31, 2006 | Number and Total Assets of Other Pooled Investment Vehicle Accounts as of December 31, 2006 | Other Accounts as of December 31, 2006 |
Performance Based Accounts | Asset Based Accounts | Performance Based Accounts | Asset Based Accounts | Performance Based Accounts | Asset Based Accounts |
# | $Assets | # | $Assets | # | $Assets | # | $Assets | # | $Assets | # | $Assets |
Nasri Toutoungi | 0 | $0 | 5 | $6,199,640,450 | 0 | $0 | 1 | $150,726,804 | 0 | $0 | 10 | $1,563,283,726 |
Jeff MacDonald | 0 | $0 | 2 | $362,186,757 | 0 | $0 | 0 | $0 | 0 | $0 | 7 | $547,210,606 |
Charles Moon | 0 | $0 | 3 | $467,324,000 | 0 | $0 | 0 | $0 | 0 | $0 | 2 | $28,622,085,000 |
Portfolio managers, including assistant portfolio managers, at Hartford manage multiple portfolios for multiple clients. These accounts may include mutual funds, separate accounts (assets managed on behalf of institutions such as pension funds, insurance companies, foundations), commingled trust accounts, and other types of funds. The portfolios managed by a portfolio manager may have investment objectives, strategies and risk profiles that differ from those of the registrant. Portfolio managers make investment decisions for each portfolio, including the registrant, based on the investment objectives, policies, practices and other relevant investment considerations applicable to that portfolio. Consequently, the portfolio managers may purchase securities for one portfolio and not another portfolio. Securities purchased in one portfolio may perform better than the securities purchased for another portfolio, and vice versa. A portfolio manager or other investment professionals at Hartford may place transactions on behalf of other accounts that are directly or indirectly contrary to investment decisions made on behalf of the registrant, or make investment decisions that are similar to those made for the registrant, both of which have the potential to adversely impact the registrant depending on market conditions. In addition, some of these portfolios have fee structures that are or have the potential to be higher, in some cases significantly higher, than the fees paid by the registrant. Because a portfolio manager’s compensation is affected by revenues earned by Hartford, the incentives associated with the registrant may be significantly higher or lower than those associated with other accounts managed by a given portfolio manager.
Hartford’s goal is to provide high quality investment services to all of its clients, while meeting its fiduciary obligation to treat all clients fairly. Hartford has
adopted and implemented policies and procedures, including brokerage and trade allocation policies and procedures, that it believes address the conflicts associated with managing multiple accounts for multiple clients. In addition, Hartford monitors a variety of areas, including compliance with applicable laws and regulations, primary guidelines of the registrant, the allocation of securities, and compliance with Hartford’s Code of Ethics. Furthermore, senior investment and business personnel at Hartford periodically review the performance of Hartford’s portfolio managers. Although the firm does not track the time a portfolio manager spends on a single portfolio, it does periodically assess whether a portfolio manager has adequate time and resources to effectively manage the portfolio manager’s overall book of business.
Material conflicts of interest may arise when allocating and/or aggregating trades. Hartford may aggregate into a single trade order several individual contemporaneous client trade orders for a single security, absent specific client directions to the contrary. It is the policy of Hartford that when a decision is made to aggregate transactions on behalf of more than one account (including the registrant or other accounts over which it has discretionary authority), such transactions will be allocated to all participating client accounts in a fair and equitable manner in accordance with Hartford’s trade allocation policy. The trade allocation policy is described in Hartford’s Form ADV. Hartford’s compliance unit monitors block transactions to assure adherence to the trade allocation policy, and will inform Hartford’s Issue Resolution Council of any non-compliant transactions.
The conflicts addressed in the foregoing paragraph are primarily dealt with through strict adherence to Hartford’s Trade Allocation Policy.
As of December 31, 2006, the compensation package for portfolio managers consists of three components, which are base pay, annual incentive and long-term incentive. The base pay program provides a level of base pay that is competitive with the marketplace and reflects a portfolio manager’s contribution to Hartford’s success.
The annual incentive plan provides cash bonuses dependent on both the overall performance of Hartford and individual contributions. A portion of the bonus pool is determined based on the aggregate portfolio pre-tax performance results over three years relative to peer groups and benchmarks, and the remaining portion is based on current year operating income relative to the operating plan.
Bonuses for portfolio managers vary depending on the scope of accountability and experience level of the individual portfolio manager. An individual’s award is based on qualitative and quantitative factors including the relative performance of his/her assigned portfolios compared to a peer group or benchmark and is primarily geared to reward top quartile performance on a trailing three-year basis. The registrant is a member of the Lipper Corporate Debt Funds BBB-Rated
Category and is benchmarked to the Lehman Brothers Aggregate Bond Index. Qualitative factors such as leadership, teamwork and overall contribution made during the year are also considered.
The long-term incentive plan provides an opportunity for portfolio managers and other key contributors to Hartford to be rewarded in the future based on the continued profitable growth of Hartford. A designated portion of the Hartford’s net operating income will be allocated to long-term incentive awards each year. The size of the actual individual awards will vary greatly. The awards will vest over three years for most participants and five years for Hartford’s Managing Directors. The value of the awards will increase at the growth rate of operating income each year during the vesting period. Awards will be paid in cash at the end of the vesting period.
All portfolio managers are eligible to participate in The Hartford Financial Services Group, Inc.'s standard employee health and welfare programs, including retirement.
As of December 31, 2006, the registrant’s portfolio managers owned the following equity securities of the registrant:
Portfolio Manager | Dollar Range of Equity Securities Beneficially Owned as of December 31, 2006 |
Nasri Toutoungi | None |
Jeff MacDonald | None |
Charles Moon | None |
The information in this Item 8(a) has been provided by Hartford Investment Management Company.
Item 9. Purchases of Equity Securities by Closed-End Management Investment Company and Affiliated Purchasers.
Period | (a) Total Number of Shares (or Units) Purchased(1) | (b) Average Price Paid per Share (or Unit) | (c) Total Number of Shares (or Units) Purchased as Part of Publicly Announced Plans or Programs | (d) Maximum Number (or Approximate Dollar Value) of Shares (or Units) that May Yet Be Purchased Under the Plans or Programs |
July 1 – July 31 | 0 | 0 | n/a | n/a |
August 1 – August 31 | 5,000 | 16.85 | n/a | n/a |
September 1 – September 30 | 6,000 | 17.00 | n/a | n/a |
October 1 – October 31 | 0 | 0 | n/a | n/a |
November 1 – November 30 | 11,000 | 17.11 | n/a | n/a |
December 1 – December 31 | 0 | 0 | n/a | n/a |
Total | 22,000 | 17.02 | n/a | n/a |
(1) All purchases were made on the open market pursuant to the registrant’s Repurchase Program and related guidelines.
Item 10. Submission of Matters to a Vote of Security Holders.
There have been no material changes to the procedures by which stockholders may recommend nominees to the registrant’s Board of Directors since the registrant last disclosed such procedures in a Proxy Statement or Form N-CSR.
Item 11. Controls and Procedures.
(a) | The President/Principal Executive Officer and the Treasurer/Principal Financial Officer of the registrant have concluded, based on their evaluation of the registrant’s disclosure controls and procedures (as defined in Rule 30a-3(c) under the Act) as of a date within ninety (90) days of the filing date of this report on Form N-CSR, that such controls and procedures are effective and that the design and operation of such procedures ensures that information required to be disclosed by the registrant in this report on Form N-CSR is recorded, processed, summarized, and reported within the time periods specified in the U.S. Securities and Exchange Commission’s rules and forms. |
(b) | There has been no change in the registrant’s internal controls over financial reporting (as defined in Rule 30a-3(d) under the Investment Company Act of 1940, as amended (the “Act”)) that occurred during the second fiscal quarter of the period covered by this report that has materially affected, or is reasonably likely to materially affect, the registrant’s internal control over financial reporting. |
Item 12. Exhibits.
(a)(1) | Code of Ethics (as defined in Item 2(b) of Form N-CSR). |
| (2) | Certifications required by Rule 30a-2(a) under the Act. |
(b) | Certification required by Rule 30a-2(b) under the Act. |
SIGNATURES
Pursuant to the requirements of the Securities Exchange Act of 1934 and the Investment Company Act of 1940, the registrant has duly caused this report to be signed on its behalf by the undersigned, thereunto duly authorized.
| Montgomery Street Income Securities, Inc. |
| |
| |
By: | /s/ Mark D. Nerud |
Name: | Mark D. Nerud |
Title: | President and Principal Executive Officer |
Date: | March 6, 2007 |
Pursuant to the requirements of the Securities Exchange Act of 1934 and the Investment Company Act of 1940, this report has been signed below by the following persons on behalf of the registrant and in the capacities and on the dates indicated.
| |
By: | /s/ Mark D. Nerud |
Name: | Mark D. Nerud |
Title: | President and Principal Executive Officer |
Date: | March 6, 2007 |
| |
By: | /s/ Daniel W. Koors |
Name: | Daniel W. Koors |
Title: | Treasurer and Principal Financial Officer |
Date: | March 6, 2007 |
EXHIBIT LIST
Exhibit 12(a)(1): | Code of Ethics (as defined in Item 2(b) of Form N-CSR) |
Exhibit 12(a)(2)(a): | Certification of the Principal Executive Officer required by Rule 30a-2(a) under the Act |
Exhibit 12(a)(2)(b): | Certification of the Principal Financial Officer required by Rule 30a-2(a) under the Act |
Exhibit 12(b): | Certification required by Rule 30a-2(b) under the Act |