UNITED STATES
SECURITIES AND EXCHANGE COMMISSION
Washington, D.C. 20549
FORM N-CSR
CERTIFIED SHAREHOLDER REPORT OF REGISTERED
MANAGEMENT INVESTMENT COMPANIES
Investment Company Act File Number: 811-2340
Montgomery Street Income Securities, Inc.
(Exact name of registrant as specified in charter)
225 W. Wacker Drive, Suite 950
Chicago, IL 60606
(Address of principal executive offices)
Mark D. Nerud, President
225 W. Wacker Drive, Suite 950
Chicago, IL 60606
(Name and address of agent for service)
Registrant’s telephone number, including area code: (312) 338-5801
Date of fiscal year end: December 31
Date of reporting period: December 31, 2007
Form N-CSR is to be used by management investment companies to file reports with the Commission not later than 10 days after the transmission to stockholders of any report that is required to be transmitted to stockholders under Rule 30e-1 under the Investment Company Act of 1940 (17 CFR 270.30e-1). The Commission may use the information provided on Form N-CSR in its regulatory, disclosure review, inspection, and policymaking roles.
A registrant is required to disclose the information specified by Form N-CSR, and the Commission will make this information public. A registrant is not required to respond to the collection of information contained in Form N-CSR unless the Form displays a currently valid Office of Management and Budget (“OMB”) control number. Please direct comments concerning the accuracy of the information collection burden estimate and any suggestions for reducing the burden to Secretary, Securities and Exchange Commission, 450 Fifth Street, NW, Washington, DC 20549-0609. The OMB has reviewed this collection of information under the clearance requirements of 44 U.S.C. §3507.
Item 1. Reports to Stockholders.

Montgomery Street Income Securities, Inc.
(MTS)
Annual Report to Stockholders
December 31, 2007
Portfolio Management Review
The investments of Montgomery Street Income Securities, Inc. (the “Fund”) provided a total return based on net asset value (“NAV”) of 2.68% for the twelve-month period ended December 31, 2007.1 The total return of the Fund, based on the market price of its New York Stock Exchange-traded shares, was –0.23% for the same period. The Fund’s total NAV return underperformed the Lehman Brothers Aggregate Bond Index, the Fund’s benchmark, which posted a total return of 6.97% for the twelve-month period.2 Past results are not necessarily indicative of the future performance of the Fund. Investment return and principal value will fluctuate. The Fund paid quarterly dividends totaling $1.12 for the year ended December 31, 2007. The Fund’s market price stood at $16.13 as of December 31, 2007, compared with $17.28 as of December 31, 2006. The Fund’s shares traded at a 10.7% discount to NAV at December 31, 2007. Shares of closed-end funds frequently trade at a discount to NAV. The price of the Fund’s shares is determined by a number of factors, several of which are beyond the control of Fund management. The Fund, therefore, cannot predict whether its shares will trade at, below or above its NAV.
Although the U.S. economy grew at a solid pace for much of the year, signs of slowing emerged in the second half of 2007 as the subprime mortgage market contagion appeared to be exerting a drag on the economy. The contraction in credit and market liquidity occurring during this period led the Federal Reserve to lower the target federal funds rate on three separate occasions between September and December, bringing the rate to 4.25% at year-end. These reductions, coupled with a flight to quality, pushed Treasury yields lower, particularly on the short end, helping Treasuries to outperform all other sectors of the fixed income market.
Various factors contributed to the Fund’s underperformance versus the benchmark. An overweight to non-Treasury debt and a corresponding underweight to Treasuries was a considerable factor as Treasuries outperformed. The Fund also held an
| 1 | Total return based on NAV reflects changes in the Fund’s net asset value during each period. Total return based on market value reflects changes in market value. Each figure assumes that dividend and capital gains, if any, were reinvested. These figures will differ depending upon the level of any discount from or premium to NAV at which the Fund’s shares traded during the period. |
| 2 | The Lehman Brothers Aggregate Bond Index is an unmanaged index representing domestic taxable investment-grade bonds, consisting of government and corporate securities, mortgage pass through securities, and asset-backed securities with average maturities of one year or more. Index returns assume reinvestment of dividends, and unlike Fund returns, do not reflect fees or expenses. It is not possible to invest directly in an index. |
| | |
| Montgomery Street Income Securities, Inc. | | 1 |
overweight to the financials sector, which was particularly hard hit by the credit and liquidity crunch. Financials were favored over industrials as the Fund’s investment adviser, Hartford Investment Management Company (“HIMCO”), believed the industrial sector’s significant leveraged buyout activity elevated corporate event risk levels.
In addition, the Fund held a significant position in the subprime home equity sector. A subprime borrower is one with a poor credit history that generally does not qualify to obtain conforming or conventional loans issued by agencies such as the Federal National Mortgage Association (“FNMA”) and Federal Home Loan Mortgage Corporation (“FHLMC”). Mortgages from subprime borrowers are combined, packaged and sold to investors. These packaged loans constitute the subprime market, which is also referred to as the home equity market. In 2007, lax mortgage underwriting and home appraisal standards, adjustable rate mortgages (“ARMS”) resetting at rates considerably higher than their initial teaser rates, and declining home prices led to significant deterioration in subprime obligations. HIMCO added 2.5% to this sector during the first half of the year, bringing total subprime home equity exposure in the portfolio to 3.3% at mid-year. Despite what was, at the time, a perceived inexpensive entry point, the market continued to deteriorate rapidly, fundamentally and technically, for the balance of 2007. At December 31, 2007, the Fund held subprime home equity exposure of 0.90% in the portfolio (excluding securities lending collateral).
In addition to the Fund’s holdings of packaged subprime mortgages, financial entities such as banks, brokers, and other finance companies are exposed to the subprime market directly and/or via their holdings of collateralized debt obligations (“CDOs”), structured investment vehicles (“SIVs”), and asset backed commercial paper (“ABCP”). Also affected are non-agency mortgaged backed securities other than subprime securities. While the Fund did not have direct exposure to CDOs, SIVs, or ABCP, a significant portion of Fund assets were invested in corporate bonds of finance companies and non-subprime, agency and non-agency mortgage backed securities. The Fund’s allocation to the corporate bond market was reduced by more than 10% since year-end 2006 to less than 50% of Fund assets at year-end 2007. The exposure to non-subprime mortgage backed securities was 30.4% at year-end 2007 compared to 34.0% at year-end 2006.
High yield performance and its impact on 2007 Fund results was a tale of two distinct periods. Although the high yield segment of the market performed quite well in the
| | |
| 2 | | Montgomery Street Income Securities, Inc. |
first half of the year, growing risk aversion in the latter half caused yield spreads to widen dramatically, and the Fund’s exposure held back returns. In an effort to help reduce the potential impact of a supply/demand imbalance and deteriorating fundamentals within the high yield sector, HIMCO has trimmed the Fund’s below investment grade exposure to 14% at year-end versus a 28% allocation a year earlier.
The value and related income of debt securities, including mortgage-backed securities, asset-backed securities, and below-investment grade corporate bonds is sensitive to changes in economic conditions, including delinquencies and/or defaults. Recent instability in the markets for fixed-income securities, particularly mortgage-backed and asset-backed securities, has resulted in increased volatility of market prices and periods of illiquidity that have made it harder to obtain reliable market quotations for certain securities held by the Fund.
On a more positive note, the Fund’s non-dollar exposure served the Fund well, as did yield-curve positioning, which benefited from the steepening in the yield curve occurring during the year. HIMCO will look to add foreign bond exposure in the coming year as Europe and the United Kingdom lag behind the United States in their respective cycles. Both are just now starting to experience a slowdown in their respective economies, and the European Central Bank and the Bank of England have not yet embarked on aggressive easing campaigns.
US Treasury Bond Yield Curve
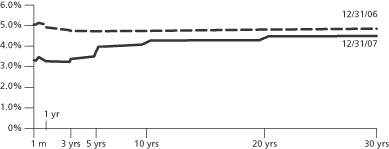
Source: Bloomberg
Performance is historical and does not guarantee future results.
| | |
| Montgomery Street Income Securities, Inc. | | 3 |
Although the economy held up fairly well through year-end, supported in part by a strong employment picture, emerging signs of weakness in employment and in retail sales suggest slow growth in the months ahead. The credit crisis has clouded visibility around the economy and significantly increased the probability of recession. As a result, HIMCO believes it is likely the Federal Reserve will continue its efforts to boost liquidity, which should cause further steepening in the yield curve.
Quality Distribution (Unaudited)
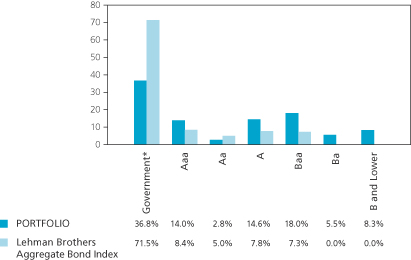
| * | Government includes U.S. Treasury, U.S. Agency and cash. |
As of December 31, 2007.
Quality distribution is subject to change.
Percentages are based on total value of the investment portfolio, excluding securities lending collateral.
The quality ratings represent the lower of Moody’s Investors Service, Inc. (“Moody’s”) or Standard & Poor’s Corporation (“S&P”) credit ratings. The ratings of Moody’s and S&P represent these companies’ opinions as to the quality of the securities they rate. Ratings are relative and subjective and are not absolute standards of quality. A bond’s credit quality does not remove the risk of an increase in interest rates or illiquidity in the market.
| | |
| 4 | | Montgomery Street Income Securities, Inc. |
Sector Distribution (Unaudited)
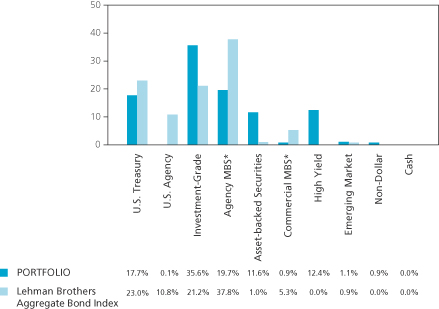
| * | Mortgage backed securities. |
As of December 31, 2007.
Sector distribution is subject to change.
Percentages are based on total value of the investment portfolio, excluding securities lending collateral.
The views expressed in this report reflect those of the investment adviser, Hartford Investment Management Company, only through the end of the period of the report as stated on the cover. The investment adviser’s views are subject to change at any time based on market and other conditions and should not be construed as a recommendation. Investment in the Fund involves risk. The Fund invests in individual bonds whose yields and value fluctuate so that your investment may be worth more or less than its original cost. Bond investments are subject to interest rate risk such that when interest rates rise, the price of the bonds, and thus the value of the Fund, can decline and the investor can lose principal value. The Fund’s investments are also subject to credit risk and liquidity risk. Additionally, investing in foreign securities presents certain unique risks not associated with domestic investments, such as currency fluctuation, political and economic changes, and market risks. All of these factors may result in greater share price volatility. Closed-end funds, unlike open-end funds, are not continuously offered.
NOT FDIC/NCUA INSURED. NO BANK GUARANTEE. MAY LOSE VALUE. NOT A DEPOSIT. NOT INSURED BY ANY FEDERAL GOVERNMENT AGENCY.
Past performance is no guarantee of future results.
This report is sent to stockholders of Montgomery Street Income Securities, Inc., for their information. It is not a prospectus, circular or representation intended for use in the purchase or sale of shares of the Fund or of any securities mentioned in the report.
| | |
| Montgomery Street Income Securities, Inc. | | 5 |
Other Information
Dividends Paid
The Fund paid dividends of $0.29 per share on April 30, 2007 (including approximately $0.01 of previously undistributed income); $0.28 per share on July 31, 2007; $0.27 per share on October 31, 2007; and $0.28 per share on December 31, 2007. In the near term, dividends to be paid by the Fund may be negatively impacted by recent declines in overall interest rates and the current reduction in the Fund’s allocation to high yield securities.
Dividend Reinvestment and Cash Purchase Option
The Fund maintains an optional Dividend Reinvestment and Cash Purchase Plan (the “Plan”) for the automatic reinvestment of your dividends and capital gain distributions in the shares of the Fund. Stockholders who participate in the Plan also can purchase additional shares of the Fund through the Plan’s voluntary cash investment feature. We recommend that you consider enrolling in the Plan to build your investment. The Plan’s features, including the voluntary cash investment feature, are described beginning on page 35 of this report.
Limited Share Repurchases
The Fund is authorized to repurchase a limited number of shares of the Fund’s common stock from time to time when the shares are trading at less than 95% of their NAV. Repurchases are limited to a number of shares each calendar quarter approximately equal to the number of new shares issued under the Plan with respect to income earned for the second preceding calendar quarter. There were 12,000 shares repurchased during each quarter of 2007. Up to 11,000 shares may be repurchased during the first quarter of 2008.
Investment Portfolio
Following the Fund’s first and third quarter ends, a complete portfolio holdings listing is filed with the U.S. Securities and Exchange Commission (“SEC”) on Form N-Q. The form is available on our website at www.montgomerystreetincome.com, or on the SEC’s website at www.sec.gov, and it also may be reviewed and copied at the SEC’s Public Reference Room in Washington, DC. Information on the operation of the SEC’s Public Reference Room may be obtained by calling (800) SEC-0330.
| | |
| 6 | | Montgomery Street Income Securities, Inc. |
Certifications
The Fund’s Chief Executive Officer has certified to the New York Stock Exchange that, as of August 3, 2007, he was not aware of any violation by the Fund of applicable NYSE corporate governance listing standards. The Fund’s reports to the SEC on Forms N-CSR and N-Q contain certifications by the Fund’s Chief Executive Officer and Chief Financial Officer that relate to the Fund’s disclosure in such reports and that are required by Rule 30a-2 under the Investment Company Act of 1940, as amended.
Proxy Voting
Information about how the Fund voted any proxies related to its portfolio securities during the most recent twelve-month period ended June 30, 2007 is available on our website at www.montgomerystreetincome.com or on the SEC’s website at www.sec.gov. A description of the policies that the Fund uses to determine how to vote proxies relating to portfolio securities is available without charge, upon request, by calling (877) 437-3938 or on the SEC’s website at www.sec.gov.
Reports to Stockholders
Those stockholders who wish to view the Fund’s complete portfolio holdings listing for the first and third quarters may view the Form N-Q, as described above in the “Investment Portfolio” section of this report. The Fund’s annual and semiannual reports to stockholders will be mailed to stockholders, and are also available on our website at www.montgomerystreetincome.com or by calling (877) 437-3938.
Net Asset Value
The Fund’s NAV and market value are published every Monday in The Wall Street Journal under the heading “Closed End Funds.” The Fund’s market value also is published daily in The New York Times, and both its market value and NAV are published weekly in Barron’s. The Fund’s market value is available daily on our website at www.montgomerystreetincome.com.
| | |
| Montgomery Street Income Securities, Inc. | | 7 |
Change in Portfolio Manager
Effective October 3, 2007, Jeffrey S. MacDonald resigned from Hartford Investment Management Company (“HIMCO”) and as a portfolio manager to the Fund to pursue other opportunities. Charles Moon and Nasri A. Toutoungi remain as portfolio managers of the Fund.
| | |
| 8 | | Montgomery Street Income Securities, Inc. |
Investment Objectives and Policies
Investment Objectives
Your Fund is a closed-end diversified management investment company registered under the Investment Company Act of 1940, as amended (the “1940 Act”), investing and reinvesting its assets in a portfolio of selected securities. The Fund’s primary investment objective is to seek as high a level of current income as is consistent with prudent investment risks, from a diversified portfolio primarily of debt securities. Capital appreciation is a secondary objective.
Principal Investment Policies
Investment of your Fund is guided by the principal investment policies summarized below. For a more complete description of the Fund’s investment policies, please see the Fund’s Form N-2 Registration Statement dated April 29, 1992 and subsequent annual reports to stockholders.
Under normal circumstances, the Fund will invest at least 80% of its net assets, plus the amount of any borrowings for investment purposes, in income producing securities.1
At least 70% of total assets must be invested in: straight debt securities (other than municipal securities), including U.S. dollar-denominated debt securities of foreign issuers, rated within the four highest grades assigned by Moody’s Investors Service, Inc. or Standard & Poor’s Corporation; bank debt of comparable quality; U.S. government or agency securities; commercial paper; cash; cash equivalents; or Canadian government, provincial, or municipal securities (not in excess of 25% of total assets).
Up to 30% of total assets (the “30% basket”) may be invested in other U.S. or foreign straight debt securities; convertible securities; and preferred stocks.
Not more than 25% of total assets may be invested in securities of any one industry (finance companies as a whole are not considered an “industry” for the purposes of this limitation).
Not more than 5% of total assets may be invested in securities of any one issuer, other than U.S. government or agency securities.
| 1 | The Fund will provide stockholders with at least 60 days’ notice prior to making any changes to this 80% investment policy. |
| | |
| Montgomery Street Income Securities, Inc. | | 9 |
The Fund may invest money pursuant to repurchase agreements so long as the Fund is initially wholly secured with collateral consisting of securities in which the Fund can invest under its investment objectives and policies. In addition, investments in repurchase agreements must not, at the time of any such loan, be as a whole more than 20% — and be as to any one borrower more than 5% — of the Fund’s total assets.
The Fund may lend its portfolio securities to the extent permitted under the 1940 Act.
The Fund may borrow funds to purchase securities, provided that the aggregate amount of such borrowings may not exceed 30% of the Fund’s assets (including aggregate borrowings), less liabilities (excluding such borrowings).
The Fund may enter into forward foreign currency sale contracts to hedge portfolio positions, provided, among other things, that such contracts have a maturity of one year or less and that, at the time of purchase, the Fund’s obligations under such contracts do not exceed either the value of portfolio securities denominated in the foreign currency or 15% of the Fund’s total assets.
The Fund may enter into interest rate futures contracts and purchase or write options on interest rate futures contracts, provided, among other things, that the Fund’s obligations under such instruments may not exceed the value of the Fund’s assets not subject to the 30% basket.
It is the intention of the Fund to invest exclusively in non-voting securities. Under normal circumstances, the Fund does not intend to exercise conversion, exchange or other rights to purchase common stock or other equity securities, or otherwise to hold voting securities. In the unlikely event that the Fund does come into possession of any voting securities, the Fund intends to dispose of such securities as soon as it is reasonably practicable and prudent to do so.
| | |
| 10 | | Montgomery Street Income Securities, Inc. |
| | |
Investment Portfolio | | as of December 31, 2007 |
| | | | | | |
| | | | | Principal Amount ($) (f) | | Value ($) |
| | | | | | | |
Corporate Bonds 48.4% | | | | | | |
| Consumer Discretionary 8.2% | | | | | | |
AMR Real Estate Holdings Plc, 7.13%, 02/15/13 | | | | 385,000 | | 361,900 |
Charter Communications Operating LLC,
8.00%, 04/30/12 (a) (j) | | | | 500,000 | | 482,500 |
Clear Channel Communications, Inc., 8.00%, 11/01/08 | | | | 750,000 | | 775,191 |
Clear Channel Communications, Inc., 7.65%, 09/15/10 | | | | 1,330,000 | | 1,366,171 |
Comcast Cable Holdings LLC, 10.13%, 04/15/22 | | | | 1,291,000 | | 1,711,783 |
Comcast Corp., 6.31%, 11/15/17 | | | | 337,000 | | 349,647 |
COX Communications, Inc., 5.45%, 12/15/14 | | | | 500,000 | | 490,017 |
COX Communications, Inc., 5.88%, 12/01/16 (a) (c) (j) | | | | 375,000 | | 372,797 |
CSC Holdings, Inc., 8.13%, 07/15/09 | | | | 190,000 | | 193,088 |
Dex Media West LLC, 9.88%, 08/15/13 | | | | 225,000 | | 234,000 |
Echostar DBS Corp., 6.38%, 10/01/11 | | | | 375,000 | | 370,500 |
ERAC USA Finance Co., 5.90%, 11/15/15 (a) (j) | | | | 429,000 | | 411,875 |
Foot Locker, Inc., 8.50%, 01/15/22 (i) | | | | 155,000 | | 142,600 |
Ford Capital BV, 9.50%, 06/01/10 | | | | 650,000 | | 612,625 |
General Motors Corp., 6.38%, 05/01/08 | | | | 750,000 | | 744,375 |
Hertz Corp., 10.50%, 01/01/16 (c) | | | | 460,000 | | 476,100 |
Idearc, Inc., 8.00%, 11/15/16 | | | | 500,000 | | 458,750 |
J.C. Penney Co., Inc., 8.00%, 03/01/10 | | | | 500,000 | | 520,585 |
J.C. Penney Co., Inc., 6.38%, 10/15/36 | | | | 341,000 | | 304,722 |
K. Hovnanian Enterprises, Inc., 6.00%, 01/15/10 | | | | 205,000 | | 132,225 |
Limited Brands, Inc., 6.90%, 07/15/17 | | | | 643,000 | | 621,268 |
Mediacom LLC, 9.50%, 01/15/13 | | | | 500,000 | | 464,375 |
MGM Mirage, Inc., 8.50%, 09/15/10 | | | | 500,000 | | 518,750 |
MGM Mirage, Inc., 6.75%, 09/01/12 (c) | | | | 300,000 | | 292,125 |
Neiman-Marcus Group, Inc., 10.38%, 10/15/15 (c) | | | | 450,000 | | 468,563 |
Quebecor Media, Inc., 7.75%, 03/15/16 (a) (j) | | | | 400,000 | | 384,000 |
Target Corp., 6.50%, 10/15/37 | | | | 395,000 | | 397,015 |
TCI Communications, Inc., 8.75%, 08/01/15 | | | | 35,000 | | 40,712 |
Tenneco, Inc., 8.63%, 11/15/14 | | | | 110,000 | | 108,075 |
Time Warner, Inc., 6.75%, 04/15/11 | | | | 800,000 | | 833,230 |
Time Warner, Inc., 6.50%, 11/15/36 | | | | 250,000 | | 243,251 |
Viacom, Inc., 6.88%, 04/30/36 | | | | 480,000 | | 481,307 |
| | | | | | |
| | | | | | 15,364,122 |
| Consumer Staples 2.5% | | | | | | |
Altria Group, Inc., 7.00%, 11/04/13 | | | | 250,000 | | 279,584 |
Anheuser-Busch Cos., Inc., 5.75%, 01/15/11 | | | | 750,000 | | 750,227 |
Aramark Corp., 8.41%, 02/01/15 (b) | | | | 475,000 | | 463,125 |
The accompanying notes are an integral part of the financial statements.
| | |
| Montgomery Street Income Securities, Inc. | | 11 |
| | | | | | |
| | | | | Principal Amount ($) (f) | | Value ($) |
| | | | | | | |
Archer-Daniels-Midland Co., 5.38%, 09/15/35 | | | | 400,000 | | 353,190 |
Coca-Cola Enterprises, Inc., 8.50%, 02/01/22 | | | | 500,000 | | 626,964 |
CVS Caremark Corp.,
6.30%, 06/01/37 (callable at 100 beginning 06/01/12) (e) | | 833,000 | | 805,129 |
General Mills, Inc., 5.65%, 09/10/12 | | | | 669,000 | | 679,916 |
Kraft Foods, Inc., 6.25%, 06/01/12 | | | | 500,000 | | 519,421 |
Wal-Mart Stores, Inc., 5.25%, 09/01/35 | | | | 250,000 | | 221,754 |
| | | | | | |
| | | | | | 4,699,310 |
| Energy 2.5% | | | | | | |
Chesapeake Energy Corp., 7.63%, 07/15/13 | | | | 350,000 | | 361,375 |
El Paso Corp., 7.75%, 07/15/11 (a) (j) | | | | 500,000 | | 513,115 |
Energipe Y Saelpa, 10.50%, 07/19/13 (a) (j) | | | | 175,000 | | 201,199 |
Inergy LP/Inergy Finance Corp., 8.25%, 03/01/16 (c) | | | | 450,000 | | 465,750 |
Kinder Morgan Energy Partners LP, 6.50%, 02/01/37 | | | | 260,000 | | 256,971 |
NGPL PipeCo LLC, 6.51%, 12/15/12 (a) (j) | | | | 1,300,000 | | 1,319,918 |
ONEOK Partners LP, 6.15%, 10/01/16 | | | | 304,000 | | 308,809 |
ONEOK Partners LP, 6.65%, 10/01/36 | | | | 542,000 | | 548,060 |
Petrohawk Energy Corp., 9.13%, 07/15/13 | | | | 400,000 | | 421,000 |
Transcontinental Gas Pipe Line Corp.,
6.40%, 04/15/16 (c) | | | | 250,000 | | 256,562 |
| | | | | | |
| | | | | | 4,652,759 |
| Financials 20.1% | | | | | | |
American General Institutional Capital,
7.57%, 12/01/45 (a) (j) | | | | 250,000 | | 275,968 |
Ameriprise Financial, Inc.,
7.52%, 06/01/66 (callable at 100 beginning 06/01/16) (e) | | 1,015,000 | | 1,010,785 |
AXA SA,
6.46% (callable at 100 beginning 12/14/18) (a) (c) (d) (j) | | | | 4,943,000 | | 4,451,033 |
Banco BMG SA, 9.15%, 01/15/16 | | | | 300,000 | | 302,490 |
Capital One Capital III, 7.67%, 08/15/36 | | | | 918,000 | | 746,484 |
CIT Group, Inc.,
6.10%, 03/15/67 (callable at 100 beginning 03/15/17) (e) | | 980,000 | | 711,577 |
Citigroup Capital XXI,
8.30%, 12/21/57 (callable at 100 beginning 12/21/37) (e) | | 1,181,000 | | 1,233,190 |
Citigroup, Inc., 6.00%, 10/31/33 | | | | 500,000 | | 462,989 |
Comerica Capital Trust,
6.58%, 02/20/37 (callable at 100 beginning 02/20/32) (e) | | 1,732,000 | | 1,383,463 |
Countrywide Financial Corp., 4.50%, 06/15/10 (i) | | | | 15,000 | | 10,900 |
Countrywide Financial Corp., 5.80%, 06/07/12 (i) | | | | 786,000 | | 574,172 |
Countrywide Home Loans, Inc., 6.25%, 04/15/09 (c) (i) | | | | 55,000 | | 42,817 |
Countrywide Home Loans, Inc., 4.13%, 09/15/09 (i) | | | | 31,000 | | 22,739 |
Countrywide Home Loans, Inc., 4.00%, 03/22/11 (i) | | | | 33,000 | | 23,828 |
The accompanying notes are an integral part of the financial statements.
| | |
| 12 | | Montgomery Street Income Securities, Inc. |
| | | | | | |
| | | | | Principal Amount ($) (f) | | Value ($) |
| | | | | | | |
DEPFA ACS Bank Plc, 1.65%, 12/20/16 | | JPY | | 190,000,000 | | 1,666,508 |
Financial Security Assurance Holdings Ltd., 6.40%, 12/15/66 (callable at 100 beginning 12/15/36) (a) (e) (j) | | | | 1,012,000 | | 864,166 |
Ford Motor Credit Co., 7.38%, 02/01/11 | | | | 500,000 | | 447,753 |
Ford Motor Credit Co., 9.69%, 04/15/12 (b) (c) | | | | 450,000 | | 442,517 |
GE Business Loan Trust, Interest Only,
(2006, 1A, IO) 0.60%, 06/15/10 (a) (b) (i) | | | | 29,470,775 | | 238,713 |
GE Business Loan Trust, (2006, 1A, D)
6.03%, 05/15/34 (a) (b) (i) | | | | 459,207 | | 406,458 |
General Motors Acceptance Corp., 6.88%, 09/15/11 | | | | 1,975,000 | | 1,689,601 |
Goldman Sachs Capital II,
5.79% (callable at 100 on 06/01/12) (d) | | | | 875,000 | | 779,034 |
HBOS Plc,
5.92% (callable at 100 beginning 10/01/15) (a) (d) (j) | | | | 600,000 | | 523,334 |
HSBC Bank USA, 5.63%, 08/15/35 (c) | | | | 315,000 | | 278,358 |
HSBC Holdings Plc, 6.50%, 05/02/36 | | | | 500,000 | | 486,088 |
ILFC E-Capital Trust II, 6.25%, 12/21/65
(callable at 100 beginning 12/21/15) (a) (e) (j) | | | | 4,490,000 | | 4,291,106 |
Janus Capital Group, Inc., 6.70%, 06/15/17 | | | | 840,000 | | 865,141 |
JPMorgan Chase Capital XV, 5.88%, 03/15/35 | | | | 205,000 | | 175,736 |
Kazkommerts International Bank, 8.00%, 11/03/15 (a) (j) | | | | 190,000 | | 157,700 |
Mellon Capital IV,
6.24% (callable at 100 beginning 06/20/12) (d) | | | | 570,000 | | 529,030 |
MetLife, Inc., 6.40%, 12/15/36
(callable at 100 beginning 12/15/31) (e) | | | | 4,627,000 | | 4,240,604 |
Mizuho Capital Investment 1 Ltd.,
6.67% (callable at 100 beginning 06/30/08) (a) (d) (j) | | | | 600,000 | | 561,378 |
Mizuho JGB Investment LLC,
9.87% (callable at 100 beginning 03/15/12) (a) (d) (j) | | | | 2,000,000 | | 2,018,264 |
Northern Rock Plc,
5.60% (callable at 100 beginning 04/30/14) (a) (d) (j) | | | | 150,000 | | 93,000 |
Northern Rock Plc,
6.59% (callable at 100 beginning 06/28/17) (a) (d) (j) | | | | 513,000 | | 318,060 |
Northgroup Preferred Capital Corp.,
6.38% (callable at 100 beginning 10/15/17) (a) (d) (j) | | | | 515,000 | | 455,039 |
PNC Preferred Funding Trust I,
6.11% (callable at 100 beginning 03/15/12) (a) (d) (j) | | | | 400,000 | | 351,658 |
Progressive Corp., 6.70%, 06/15/37
(callable at 100 beginning 06/15/17) (e) | | | | 675,000 | | 626,649 |
Residential Capital LLC, 5.65%, 06/09/08 (b) (c) | | | | 765,000 | | 654,075 |
SMFG Preferred Capital Ltd.,
6.08% (callable at 100 beginning 01/25/17) (a) (d) (j) | | | | 793,000 | | 730,527 |
State Street Capital Trust, 5.99%, 06/01/67 (b) | | | | 670,000 | | 519,788 |
TNK-BP Finance SA, 7.50%, 03/13/13 (a) (j) | | | | 300,000 | | 299,250 |
TNK-BP Finance SA, 7.50%, 07/18/16 (a) (j) | | | | 300,000 | | 290,625 |
The accompanying notes are an integral part of the financial statements.
| | |
| Montgomery Street Income Securities, Inc. | | 13 |
| | | | | | |
| | | | | Principal Amount ($) (f) | | Value ($) |
| | | | | | | |
USB Realty Investors,
6.09% (callable at 100 beginning 01/15/12) (a) (d) (j) | | | | 700,000 | | 621,906 |
Washington Mutual, Inc.,
9.75% (callable at 100 beginning 12/15/17) (a) (d) (j) | | | | 300,000 | | 240,000 |
ZFS Finance USA Trust V, 6.50%, 05/09/37
(callable at 100 beginning 05/09/17) (a) (e) (j) | | | | 582,000 | | 537,295 |
| | | | | | |
| | | | | | 37,651,796 |
| Health Care 1.2% | | | | | | |
Aetna, Inc., 6.63%, 06/15/36 | | | | 560,000 | | 554,403 |
Cigna Corp., 6.15%, 11/15/36 | | | | 184,000 | | 170,718 |
Covidien International Finance SA, 5.45%, 10/15/12 (a) (j) | | | | 300,000 | | 308,877 |
HCA, Inc., 9.25%, 11/15/16 | | | | 330,000 | | 346,500 |
Wyeth, 6.50%, 02/01/34 | | | | 400,000 | | 424,529 |
Wyeth, 5.95%, 04/01/37 | | | | 470,000 | | 471,247 |
| | | | | | |
| | | | | | 2,276,274 |
| Industrials 1.8% | | | | | | |
Bombardier, Inc., 6.30%, 05/01/14 (a) (j) | | | | 1,060,000 | | 1,036,150 |
Embraer Overseas Ltd., 6.38%, 01/24/17 | | | | 200,000 | | 189,760 |
Honeywell International, Inc., 5.70%, 03/15/36 | | | | 250,000 | | 246,184 |
Systems 2001 Asset Trust LLC, 7.16%, 12/15/11 (a) (h) (i) | | | | 255,651 | | 273,667 |
Tyco Electronics Group SA, 6.00%, 10/01/12 (a) (j) | | | | 250,000 | | 256,187 |
Tyco Electronics Group SA, 6.55%, 10/01/17 (a) (j) | | | | 262,000 | | 269,486 |
U.S. Steel Corp., 7.00%, 02/01/18 | | | | 719,000 | | 714,191 |
United Rentals, Inc., 6.50%, 02/15/12 (c) | | | | 300,000 | | 272,250 |
United Rentals North America, Inc., 7.00%, 02/15/14 | | | | 45,000 | | 37,688 |
| | | | | | |
| | | | | | 3,295,563 |
| Information Technology 1.5% | | | | | | |
Advanced Micro Devices, Inc., 7.75%, 11/01/12 | | | | 345,000 | | 300,150 |
Agilent Technologies, Inc., 6.50%, 11/01/17 | | | | 426,000 | | 432,743 |
Freescale Semiconductor, Inc., 8.87%, 12/15/14 (b) | | | | 185,000 | | 157,250 |
Freescale Semiconductor, Inc., 10.13%, 12/15/16 (c) | | | | 205,000 | | 169,125 |
International Business Machines Corp., 8.38%, 11/01/19 | | | | 250,000 | | 311,852 |
Nortel Networks Corp., 10.75%, 07/15/16 (a) (c) (j) | | | | 1,000,000 | | 1,050,000 |
Spansion, Inc., 8.25%, 06/01/13 (a) (b) (j) | | | | 395,000 | | 355,500 |
| | | | | | |
| | | | | | 2,776,620 |
| Materials 1.3% | | | | | | |
Abitibi-Consolidated, Inc., 8.49%, 06/15/11 (b) | | | | 500,000 | | 395,000 |
Bowater, Inc., 7.99%, 03/15/10 (b) | | | | 500,000 | | 435,625 |
Georgia-Pacific Corp., 7.00%, 01/15/15 (a) (c) (j) | | | | 355,000 | | 345,238 |
Huntsman International LLC, 7.88%, 11/15/14 | | | | 230,000 | | 243,800 |
The accompanying notes are an integral part of the financial statements.
| | |
| 14 | | Montgomery Street Income Securities, Inc. |
| | | | | | |
| | | | | Principal Amount ($) (f) | | Value ($) |
| | | | | | | |
MHP SA, 10.25%, 11/30/11 (a) (j) | | | | 200,000 | | 200,000 |
Momentive Performance Materials, Inc.,
9.75%, 12/01/14 (a) (j) | | | | 335,000 | | 308,200 |
Newmont Mining Corp., 5.88%, 04/01/35 | | | | 395,000 | | 347,265 |
Pliant Corp., 11.63%, 06/15/09 | | | | 5 | | 5 |
Vulcan Materials Co., 5.60%, 11/30/12 | | | | 251,000 | | 252,409 |
| | | | | | |
| | | | | | 2,527,542 |
| Telecommunication Services 4.0% | | | | | | |
AT&T, Inc., 6.15%, 09/15/34 | | | | 500,000 | | 499,163 |
Citizens Communications Co., 9.00%, 08/15/31 | | | | 400,000 | | 399,000 |
Intelsat Bermuda Ltd., 9.25%, 06/15/16 | | | | 255,000 | | 256,275 |
Level 3 Financing, Inc., 12.25%, 03/15/13 | | | | 500,000 | | 505,000 |
Qwest Communications International, Inc.,
7.50%, 02/15/14 | | | | 800,000 | | 798,000 |
Sprint Capital Corp., 8.75%, 03/15/32 (c) | | | | 695,000 | | 783,403 |
Telecom Italia Capital SA, 4.00%, 01/15/10 | | | | 360,000 | | 352,596 |
Telecom Italia Capital SA, 5.25%, 11/15/13 | | | | 330,000 | | 326,149 |
Telecom Italia Capital SA, 4.95%, 09/30/14 | | | | 365,000 | | 351,525 |
Telecom Italia Capital SA, 7.20%, 07/18/36 (c) | | | | 530,000 | | 584,359 |
Verizon Global Funding Corp., 7.75%, 12/01/30 (c) | | | | 195,000 | | 228,708 |
Verizon New Jersey, Inc., 5.88%, 01/17/12 | | | | 542,000 | | 558,151 |
Vodafone Group Plc, 6.15%, 02/27/37 (c) | | | | 1,268,000 | | 1,252,302 |
Windstream Corp., 8.63%, 08/01/16 | | | | 670,000 | | 703,500 |
| | | | | | |
| | | | | | 7,598,131 |
| Utilities 5.3% | | | | | | |
Abu Dhabi National Energy Co., 5.62%, 10/25/12 (a) (j) | | | | 775,000 | | 786,685 |
American Electric Power Co., Inc., 5.38%, 03/15/10 | | | | 1,000,000 | | 1,014,320 |
CenterPoint Energy, Inc., 6.63%, 11/01/37 | | | | 120,000 | | 120,970 |
Duke Energy Indiana, Inc., 8.85%, 01/15/22 | | | | 1,225,000 | | 1,575,626 |
Energy Future Holdings Corp., 10.88%, 11/01/17 (a) (j) | | | | 200,000 | | 201,000 |
FirstEnergy Corp., 6.45%, 11/15/11 | | | | 500,000 | | 516,308 |
Florida Power & Light Co., 5.80%, 09/15/17 | | | | 195,000 | | 202,541 |
Northern States Power Co., 6.25%, 06/01/36 | | | | 400,000 | | 415,654 |
Puget Sound Energy, Inc., 7.02%, 12/01/27 | | | | 1,000,000 | | 1,122,215 |
Rochester Gas & Electric Corp., 6.38%, 09/01/33 (i) | | | | 1,600,000 | | 1,665,026 |
SPI Electricity & Gas Australia Holdings Pty Ltd.,
6.15%, 11/15/13 (a) (i) | | | | 2,000,000 | | 2,040,770 |
Texas Competitive Electric Holdings Co. LLC,
10.25%, 11/01/15 (a) (j) | | | | 200,000 | | 198,000 |
| | | | | | |
| | | | | | 9,859,115 |
| |
Total Corporate Bonds (Cost $95,291,728) | | | | | | 90,701,232 |
The accompanying notes are an integral part of the financial statements.
| | |
| Montgomery Street Income Securities, Inc. | | 15 |
| | | | | | |
| | | | | Principal Amount ($) (f) | | Value ($) |
| | | | | | | |
Non-U.S. Government Agency Asset-Backed Securities 12.7% | | |
Banc of America Mortgage Securities, (2005, H, 2A5) 4.80%, 09/25/35 (b) | | | | 1,065,000 | | 1,045,356 |
Bayview Commercial Asset Trust, Interest Only,
(2007, 2A, I0) 1.30%, 07/25/37 (a) (b) (i) | | | | 6,637,164 | | 858,683 |
Bayview Commercial Asset Trust, Interest Only,
(2007, 4A, IO) 1.44%, 09/25/37 (a) (i) | | | | 6,957,993 | | 1,015,432 |
Bayview Financial Acquisition Trust, (2007, A, M3) 6.45%, 05/28/37 (b) (i) | | | | 800,000 | | 560,000 |
BB&T Capital Trust I, 6.82%, 06/12/57 (callable at 100 beginning 06/12/37) (e) | | | | 1,125,000 | | 1,058,369 |
Capital Auto Receivables Asset Trust, (2006, SN1A, C) 5.77%, 05/20/10 (a) (i) | | | | 150,000 | | 150,506 |
Capital Auto Receivables Asset Trust, (2006, SN1A, D) 6.15%, 04/20/11 (a) (i) | | | | 200,000 | | 200,310 |
CBA Commercial LLC, Interest Only, (2006, 2A, X1) 2.09%, 01/25/37 (a) (b) (i) | | | | 9,024,738 | | 902,473 |
Citigroup Mortgage Loan Trust, Inc., (2004, NCM2, 1CB2) 6.75%, 08/25/34 | | | | 637,526 | | 655,357 |
Citigroup Mortgage Loan Trust, Inc., (2007, WFH1, M11) 7.37%, 01/25/37 (a) (b) (h) (i) | | | | 225,000 | | 42,479 |
Countrywide Alternative Loan Trust, (2004, I4T2, A4) 5.50%, 08/25/34 (i) | | | | 401,068 | | 397,603 |
Countrywide Alternative Loan Trust, (2004, 35T2, A1) 6.00%, 02/25/35 (i) | | | | 286,207 | | 291,035 |
Countrywide Alternative Loan Trust, (2005, 28CB, 3A5) 6.00%, 08/25/35 (i) | | | | 721,724 | | 724,806 |
Credit-Based Asset Servicing and Securitization LLC,
(2006, SC1, A) 5.14%, 05/25/36 (a) (b) (i) | | | | 149,919 | | 133,194 |
Ford Credit Auto Owner Trust, (2006, C, D)
6.89%, 05/15/13 (a) (i) | | | | 1,060,000 | | 1,052,452 |
GMAC Mortgage Corp. Loan Trust, (2006, HE3, A2)
5.75%, 10/25/36 | | | | 620,000 | | 560,103 |
Goldman Sachs Mortgage Securities Corp.,
(2007, GKK1, A2) 5.58%, 12/20/49 (a) (b) (i) | | | | 250,000 | | 159,345 |
Greenwich Capital Commercial Funding Corp.,
(2006, FL4A, ONW) 6.45%, 11/05/21 (a) (b) (h) (i) | | | | 200,001 | | 189,320 |
Greenwich Capital Commercial Funding Corp., (2006, FL4A, PNW) 6.65%, 11/05/22 (a) (b) (h) (i) | | | | 190,001 | | 178,240 |
Home Equity Asset Trust MBS, (2007, 2, M4) 5.82%, 07/25/37 (b) (h) (i) | | | | 725,000 | | 227,650 |
JPMorgan Chase Commercial Mortgage Securities Corp., (2007, CB20, B) 6.20%, 02/12/51 (a) (b) (j) | | | | 550,000 | | 523,779 |
Lehman Brothers Small Balance Commercial, (2006, 2A, 2A2) 5.62%, 09/25/36 (a) (j) | | | | 255,000 | | 256,590 |
The accompanying notes are an integral part of the financial statements.
| | |
| 16 | | Montgomery Street Income Securities, Inc. |
| | | | | | |
| | | | | Principal Amount ($) (f) | | Value ($) |
| | | | | | | |
Marlin Leasing Receivables LLC, (2006, 1A, A4)
5.33%, 09/16/13 (a) (j) | | | | 660,000 | | 665,293 |
Nationstar NIM Trust, (2007, A, A) 9.97%, 03/25/37 (a) (i) | | | | 158,046 | | 155,193 |
Option One Mortgage Loan Trust (M6), (2007, FXD2, M6)
6.97%, 03/25/38 (i) | | | | 725,000 | | 198,356 |
Option One Mortgage Loan Trust (M7), (2007, FXD2, M7) 6.97%, 03/25/38 (i) | | | | 500,000 | | 124,975 |
Option One Mortgage Loan Trust (M8), (2007, FXD2, M8) 6.97%, 03/25/38 (i) | | | | 475,000 | | 106,504 |
Prudential Securities Secured Financing Corp.,
(1999, C2, A2) 7.19%, 06/16/31 | | | | 810,666 | | 825,436 |
Regions Financing Trust II,
6.63%, 05/15/47 (callable at 100 on 05/15/27) (e) | | | | 470,000 | | 388,400 |
Renaissance Home Equity Loan Trust, (2007, 1, M7)
7.50%, 04/20/37 (h) (i) | | | | 260,000 | | 116,999 |
Renaissance Home Equity Loan Trust, (2007, 2, M9)
7.50%, 06/25/37 (h) (i) | | | | 1,000,000 | | 100,000 |
Residential Asset Securitization Trust, (2005, A1, A3)
5.50%, 04/25/35 (i) | | | | 2,500,000 | | 2,325,051 |
Washington Mutual Mortgage Backed Securities Trust, (2007, SL3, AJ) 6.14%, 03/23/45 (a) (b) (i) | | | | 890,000 | | 773,152 |
Washington Mutual Mortgage Pass-Through Certificates, (2005, AR16, 1A3) 5.10%, 12/25/35 (b) (i) | | | | 1,320,000 | | 1,315,338 |
Wells Fargo Mortgage Backed Securities Trust,
(2006, 1, A3) 5.00%, 03/25/21 | | | | 2,022,147 | | 1,993,711 |
Wells Fargo Mortgage Backed Securities Trust,
(2005, AR10, 2A4) 4.11%, 06/25/35 (b) | | | | 1,753,411 | | 1,733,868 |
Wells Fargo Mortgage Backed Securities Trust,
(2006, AR8, 2A3) 5.24%, 04/25/36 (b) | | | | 1,739,559 | | 1,735,633 |
| |
Total Non-U.S. Government Agency Asset-Backed
Securities (Cost $27,048,890) | | 23,740,991 |
| | |
Government and Agency Obligations 36.3% | | | | | | |
| Government Securities 17.5% | | | | | | |
| Sovereign 0.2% | | | | | | |
Argentina Government International Bond, 7.00%, 10/03/15 | | | | 440,000 | | 370,977 |
| U.S. Treasury Securities 17.3% | | | | | | |
U.S. Treasury Bond, 4.25%, 11/15/17 (c) | | | | 7,341,000 | | 7,468,894 |
U.S. Treasury Note, 3.63%, 10/31/09 (c) | | | | 12,450,000 | | 12,572,558 |
U.S. Treasury Note, 3.88%, 10/31/12 (c) | | | | 3,909,000 | | 3,985,652 |
U.S. Treasury Note, 3.38%, 11/30/12 (c) | | | | 440,000 | | 438,522 |
U.S. Treasury Note, 3.63%, 12/31/12 (c) | | | | 8,000,000 | | 8,060,000 |
| | | | | | |
| | | | | | 32,525,626 |
| | | |
Total Government Securities (Cost $32,902,098) | | | | | | 32,896,603 |
The accompanying notes are an integral part of the financial statements.
| | |
| Montgomery Street Income Securities, Inc. | | 17 |
| | | | | | |
| | | | | Principal Amount ($) (f) | | Value ($) |
| | | | | | | |
U.S. Government Agency Securities 18.8% | | | | | | |
| Federal Farm Credit Bank 0.1% | | | | | | |
Federal Farm Credit Bank,
7.56% (callable at 100 beginning 12/15/13) (d) | | | | 170,000 | | 177,497 |
| | | |
| Federal Home Loan Mortgage Corp. 5.5% | | | | | | |
Federal Home Loan Mortgage Corp., 5.50%, 12/15/16 | | | | 560,115 | | 568,255 |
Federal Home Loan Mortgage Corp., 5.00%, 05/15/23 | | | | 1,367,223 | | 1,368,696 |
Federal Home Loan Mortgage Corp., 4.50%, 02/15/26 | | | | 566,935 | | 564,554 |
Federal Home Loan Mortgage Corp., 5.50%, 07/15/27 | | | | 513,662 | | 518,024 |
Federal Home Loan Mortgage Corp., 6.00%, 05/15/30 | | | | 790,000 | | 804,952 |
Federal Home Loan Mortgage Corp., 4.50%, 04/15/32 | | | | 1,375,000 | | 1,330,245 |
Federal Home Loan Mortgage Corp., 4.50%, 07/15/32 | | | | 410,000 | | 397,278 |
Federal Home Loan Mortgage Corp., 6.00%, 09/15/32 | | | | 1,500,000 | | 1,535,292 |
Federal Home Loan Mortgage Corp., 5.00%, 12/15/32 | | | | 895,000 | | 879,465 |
Federal Home Loan Mortgage Corp., 5.00%, 10/15/33 | | | | 1,175,000 | | 1,148,668 |
Federal Home Loan Mortgage Corp., 5.00%, 08/15/34 | | | | 1,245,000 | | 1,205,470 |
| | | | | | |
| | | | | | 10,320,899 |
| Federal National Mortgage Association 12.7% | | | | | | |
Federal National Mortgage Association,
9.00%, 05/01/09 (i) | | | | 36,585 | | 36,796 |
Federal National Mortgage Association,
5.50%, 03/25/17 | | | | 758,691 | | 772,327 |
Federal National Mortgage Association,
6.50%, 05/01/17 | | | | 194,943 | | 201,662 |
Federal National Mortgage Association,
6.00%, 01/01/23 | | | | 540,032 | | 551,993 |
Federal National Mortgage Association,
4.50%, 10/01/23 | | | | 633,811 | | 617,470 |
Federal National Mortgage Association,
5.50%, 05/01/25 | | | | 2,016,600 | | 2,026,269 |
Federal National Mortgage Association,
7.00%, 03/01/31 | | | | 4,073,978 | | 4,342,619 |
Federal National Mortgage Association,
5.00%, 08/25/33 | | | | 295,000 | | 287,722 |
Federal National Mortgage Association,
5.00%, 12/25/33 | | | | 1,060,000 | | 1,036,101 |
Federal National Mortgage Association,
5.00%, 06/25/34 | | | | 738,948 | | 748,870 |
Federal National Mortgage Association,
7.00%, 10/01/35 | | | | 2,807,479 | | 2,930,978 |
Federal National Mortgage Association,
6.50%, 04/01/37 | | | | 5,094,267 | | 5,236,579 |
Federal National Mortgage Association,
6.00%, 07/01/37 | | | | 4,488,778 | | 4,558,618 |
The accompanying notes are an integral part of the financial statements.
| | |
| 18 | | Montgomery Street Income Securities, Inc. |
| | | | | | | | |
| | | | | Shares/Principal Amount ($) (f) | | Value ($) | |
| | | | | | | | |
Federal National Mortgage Association,
6.00%, 08/25/44 | | | | 547,989 | | | 567,224 | |
| | | | | | | | |
| | | | | | | 23,915,228 | |
| Government National Mortgage Association 0.5% | | | | | | |
Government National Mortgage Association,
6.50%, 08/20/34 | | | | 931,791 | | | 964,326 | |
| | | | |
Total U.S. Government Agency Securities
(Cost $35,121,947) | | | | | | | 35,377,950 | |
| | | | |
Total Government and Agency Obligations
(Cost $68,024,045) | | | | | | | 68,274,553 | |
| | | | |
Preferred Stocks 0.6% | | | | | | | | |
| Financials 0.6% | | | | | | | | |
Federal National Mortgage Association, 8.25% (callable at 25 beginning 12/31/10) (d) | | | | 25,125 | | | 646,969 | |
Federal Home Loan Mortgage Corp.,
8.38%, Series Z (callable at 25 beginning 12/31/12) (d) | | | | 21,659 | | | 566,384 | |
| | | | |
Total Preferred Stocks (Cost $1,172,591) | | | | | | | 1,213,353 | |
| | | | |
Short-Term Investments 22.3% | | | | | | | | |
| Commercial Paper 0.7% | | | | | | | | |
Rabobank USA Financial Corp., 4.44%, 01/02/08 | | | | 1,255,000 | | | 1,254,844 | |
| Securities Lending Collateral 21.4% | | | | | | | | |
Mellon GSL Delaware Business Trust Collateral Fund, 4.98% | | | | 40,250,055 | | | 40,250,055 | |
| U.S. Treasury Securities 0.2% | | | | | | | | |
U.S. Treasury Bill, 2.98%, 03/13/08 (g) | | | | 300,000 | | | 298,181 | |
| | | | |
Total Short-Term Investments (Cost $41,803,205) | | | | | | | 41,803,080 | |
Total Investments 120.3% (Cost $233,340,459) | | | | | | | 225,733,209 | |
Other Assets and Liabilities, Net (20.3)% | | | | | | | (38,116,200 | ) |
| | | | |
Total Net Assets 100% | | | | | | $ | 187,617,009 | |
Notes to the Schedule of Investments
| (a) | 144A: Security is exempt from registration under Rule 144A of the Securities Act of 1933, as amended. These securities may be resold in transactions exempt from registration, normally to qualified institutional buyers. |
| (b) | Floating rate notes are securities whose yields vary with a designated market index or market rate, such as the coupon-equivalent of the U.S. Treasury bill rate. These securities are shown at their current rate as of December 31, 2007. |
The accompanying notes are an integral part of the financial statements.
| | |
| Montgomery Street Income Securities, Inc. | | 19 |
| (c) | All or portion of the security has been loaned. |
| (d) | Perpetual maturity security. Interest rate is fixed until the first call date and variable thereafter. |
| (e) | Interest rate is fixed until stated call date and variable thereafter. |
| (f) | Principal amounts are listed in United States Dollars unless otherwise noted. |
| (g) | All or a portion of the security pledged as collateral for open futures contracts. |
| (h) | Security fair valued in good faith in accordance with the procedures established by the Board of Directors. As of December 31, 2007, the value of fair valued securities was $1,128,355 (0.6% of net assets). |
| (i) | Illiquid Security: At December 31, 2007 the total value of illiquid securities was $17,936,166 (9.6% of net assets). |
| (j) | 144A Liquid Security: The Fund has deemed this security to be liquid based on procedures approved by the Board of Directors. As of December 31, 2007, the aggregate value of 144A Liquid Securities was $27,526,698 (14.7% of net assets). |
Abbreviations:
JPY – Japanese Yen
MBS – Mortgage Backed Security
NIM – Net Interest Margin
USD – United States Dollar
| | | | | | | | | | | | | | | |
Forward Foreign Currency
Contracts Purchased/Sold | | Settlement
Date | | Notional
Amount | | Currency
Value | | | Unrealized
Gain/(Loss) | |
| JPY/USD | | 1/10/2008 | | 105,300,000 | | | JPY | | $ | 943,487 | | | $ | (1,739 | ) |
| JPY/USD | | 1/10/2008 | | 105,330,850 | | | JPY | | | 943,764 | | | | (9,975 | ) |
| JPY/USD | | 1/15/2008 | | 66,361,677 | | | JPY | | | 594,958 | | | | 7,318 | |
| JPY/USD | | 1/16/2008 | | 210,500,000 | | | JPY | | | 1,887,443 | | | | 24,677 | |
| USD/JPY | | 1/10/2008 | | (210,630,850 | ) | | JPY | | | (1,887,251 | ) | | | 19,135 | |
| USD/JPY | | 1/15/2008 | | (210,500,000 | ) | | JPY | | | (1,887,215 | ) | | | (5,415 | ) |
| USD/JPY | | 1/16/2008 | | (210,500,000 | ) | | JPY | | | (1,887,443 | ) | | | (6,685 | ) |
| | | | | | | | | | $ | (1,292,257 | ) | | $ | 27,316 | |
| | | | | | | | | |
| Futures | | Contracts
Long/(Short) | | Unrealized
Appreciation
(Depreciation) | |
U.S. Treasury Note Future, 2-Year,
6.00% Expiration March 2008 | | 323 | | | USD | | $ | 220,669 | |
U.S. Treasury Note Future, 5-Year,
6.00% Expiration March 2008 | | 359 | | | USD | | | 56,568 | |
U.S. Treasury Note Future, 10-Year,
6.00% Expiration March 2008 | | (28 | ) | | USD | | | (3,565 | ) |
U.S. Treasury Bond Future, 20-Year,
6.00% Expiration March 2008 | | (244 | ) | | USD | | | 25,436 | |
| | | | | | | | $ | 299,108 | |
The accompanying notes are an integral part of the financial statements.
| | |
| 20 | | Montgomery Street Income Securities, Inc. |
Restricted Securities
The following table consists of 144A securities that have not been deemed liquid based on procedures approved by the Board of Directors.
| | | | | | | | | | | | | | | |
| | | Value
Beginning
of Period | | Purchases | | Sales
Proceeds | | Interest
Income | | Value
End of
Period |
| Bayview Commercial Asset Trust, Interest Only, 1.30%, 07/25/37 | | $ | — | | $ | 967,872 | | $ | — | | $ | 4,041 | | $ | 858,683 |
| Bayview Commercial Asset Trust, Interest Only, 1.44%, 09/25/37 | | | — | | | 971,927 | | | — | | | 1,110 | | | 1,015,432 |
| CBA Commercial LLC, Interest Only, 2.09%, 01/25/37 | | | — | | | 999,955 | | | — | | | 12,729 | | | 903,900 |
| Capital Auto Receivables Asset Trust, 5.77%, 05/20/10 | | | 150,375 | | | — | | | — | | | 8,655 | | | 150,506 |
| Capital Auto Receivables Asset Trust, 6.15%, 04/20/11 | | | 200,425 | | | — | | | — | | | 12,300 | | | 200,310 |
| Citigroup Mortgage Loan Trust, Inc., 7.37%, 01/25/37 | | | — | | | 186,068 | | | — | | | 15,452 | | | 93,973 |
| Credit-Based Asset Servicing and Securitization LLC, 5.14%, 05/25/36 | | | — | | | 148,537 | | | — | | | 3,480 | | | 133,194 |
| Ford Credit Auto Owner Trust, 6.89%, 05/15/13 | | | 1,060,210 | | | — | | | — | | | 73,043 | | | 1,052,452 |
| Goldman Sachs Mortgage Securities Corp., 5.58%, 12/20/49 | | | — | | | 214,688 | | | — | | | 4,699 | | | 159,345 |
| GE Business Loan Trust, Interest Only, 0.60%, 06/15/10 | | | 389,925 | | | — | | | — | | | — | | | 238,713 |
| GE Business Loan Trust, 6.03%, 05/15/34 | | | 482,732 | | | — | | | — | | | 30,519 | | | 406,458 |
| Greenwich Capital Commercial Funding Corp., 6.45%, 11/05/21 | | | — | | | 193,563 | | | — | | | 7,688 | | | 193,595 |
| Greenwich Capital Commercial Funding Corp., 6.65%, 11/05/22 | | | — | | | 183,707 | | | — | | | 7,530 | | | 185,310 |
| Nationstar NIM Trust, 9.97%, 03/25/37 | | | — | | | 500,000 | | | — | | | 23,084 | | | 187,346 |
| SPI Electricity & Gas Australia Holdings Pty Ltd., 6.15%, 11/15/13 | | | 2,072,378 | | | — | | | — | | | 123,000 | | | 2,040,770 |
| Systems 2001 Asset Trust LLC, 7.16%, 12/15/11 | | | 319,718 | | | — | | | — | | | 20,916 | | | 273,667 |
| Washington Mutual Mortgage Backed Securities Trust, 6.14%, 03/23/45 | | | — | | | 886,606 | | | — | | | 27,697 | | | 773,152 |
| | | $ | 4,675,763 | | $ | 5,252,923 | | $ | — | | $ | 375,943 | | $ | 8,866,806 |
The accompanying notes are an integral part of the financial statements.
| | |
| Montgomery Street Income Securities, Inc. | | 21 |
| | | | |
Statement of Assets and Liabilities as of December 31, 2007 | | | | |
| |
| Assets | | | | |
| Investments in securities, at value (a) (cost $233,304,396) | | $ | 225,733,209 | |
| Cash | | | 61,086 | |
| Foreign currency (cost $37,440) | | | 37,922 | |
| Receivables: | | | | |
Forward foreign currency contracts | | | 51,130 | |
Interest | | | 1,765,393 | |
Investment securities sold | | | 212,987 | |
Variation margin | | | 272,356 | |
Dividend reinvestment | | | 181,003 | |
Other assets | | | 23,762 | |
| Total assets | | | 228,338,848 | |
| |
| Liabilities | | | | |
| Accrued management and investment advisory fee | | | 119,919 | |
| Accrued administrative fee | | | 36,271 | |
| Payables: | | | | |
Forward foreign currency contracts | | | 23,814 | |
Variation margin | | | 208,219 | |
Return of collateral for securities on loan | | | 40,250,055 | |
| Other liabilities | | | 83,561 | |
| Total liabilities | | | 40,721,839 | |
| Net assets, at value | | $ | 187,617,009 | |
| Net Assets | | | | |
| Net assets consist of: | | | | |
| Paid-in capital | | | 202,724,116 | |
| Undistributed net investment income | | | 490,987 | |
| Net unrealized depreciation on investments | | | (7,244,264 | ) |
| Accumulated net realized loss | | | (8,353,830 | ) |
| Net assets, at value | | $ | 187,617,009 | |
| Net Asset Value per share ($187,617,009 / 10,382,446 shares of common stock outstanding, $.01 par value, 30,000,000 shares authorized) | | $ | 18.07 | |
| (a) | Includes value of securities on loan of $39,580,699 |
The accompanying notes are an integral part of the financial statements.
| | |
| 22 | | Montgomery Street Income Securities, Inc. |
| | | | |
Statement of Operations for the year ended December 31, 2007 | |
| |
| Investment Income | | | | |
| Income: | | | | |
| Interest | | $ | 12,158,972 | |
| Securities lending income | | | 61,214 | |
| Total income | | | 12,220,186 | |
| Expenses: | | | | |
| Management and investment advisory fee | | | 483,313 | |
| Administrative fee | | | 437,149 | �� |
| Directors' fees and expenses | | | 103,250 | |
| Legal | | | 61,976 | |
| Insurance | | | 60,401 | |
| Audit fees | | | 41,000 | |
| Stockholder reporting | | | 28,861 | |
| Stockholder services | | | 25,280 | |
| NYSE listing fee | | | 24,225 | |
| Custodian fees | | | 12,750 | |
| Other | | | 16,993 | |
| Total expenses | | | 1,295,198 | |
| Net investment income | | | 10,924,988 | |
|
| Realized and Unrealized Gain (Loss) on Investment Transactions | |
| Net realized gain from investment transactions | | | 232,651 | |
| Net realized gain from futures contracts | | | 885,931 | |
| Net realized loss from foreign currency related items | | | (2,413 | ) |
| Net change in unrealized appreciation (depreciation) during the period on investments | | | (8,400,019 | ) |
| Net change in unrealized appreciation (depreciation) during the period on futures contracts | | | 299,108 | |
| Net change in unrealized appreciation (depreciation) during the period on foreign currency related items | | | 27,849 | |
| Net loss on investment transactions | | | (6,956,893 | ) |
| Net increase in net assets resulting from operations | | $ | 3,968,095 | |
The accompanying notes are an integral part of the financial statements.
| | |
| Montgomery Street Income Securities, Inc. | | 23 |
| | | | | | | | |
Statements of Changes in Net Assets | | | | | | | | |
| |
| | | Year Ended December 31, | |
| Increase (Decrease) in Net Assets | | 2007 | | | 2006 | |
| Operations: | | | | | | | | |
| Net investment income | | $ | 10,924,988 | | | $ | 9,437,361 | |
| Net realized gain (loss) on investment transactions, futures contracts and foreign currency related items | | | 1,116,169 | | | | (2,473,393 | ) |
| Net change in unrealized appreciation (depreciation) during the period on investment transactions, futures contracts and foreign currency related items | | | (8,073,062 | ) | | | 2,024,170 | |
| Net increase in net assets resulting from operations | | | 3,968,095 | | | | 8,988,138 | |
| Distributions to shareholders from net investment income | | | (11,620,203 | ) | | | (10,892,738 | ) |
| Fund share transactions: | | | | | | | | |
| Reinvestment of distributions | | | 759,011 | | | | 736,288 | |
| Cost of shares repurchased | | | (812,304 | ) | | | (783,964 | ) |
| Net decrease in net assets from Fund share transactions | | | (53,293 | ) | | | (47,676 | ) |
| Decrease in net assets | | | (7,705,401 | ) | | | (1,952,276 | ) |
| Net assets at beginning of period | | | 195,322,410 | | | | 197,274,686 | |
| Net assets at end of period (including undistributed net investment income of $491,077 and $145,599, respectively) | | $ | 187,617,009 | | | $ | 195,322,410 | |
| | |
| Other Information | | | | | | | | |
| Shares outstanding at beginning of period | | | 10,384,967 | | | | 10,387,297 | |
| Shares issued to shareholders in reinvestment of distributions | | | 45,479 | | | | 43,670 | |
| Shares repurchased | | | (48,000 | ) | | | (46,000 | ) |
| Net decrease in Fund shares | | | (2,521 | ) | | | (2,330 | ) |
| Shares outstanding at end of period | | | 10,382,446 | | | | 10,384,967 | |
The accompanying notes are an integral part of the financial statements.
| | |
| 24 | | Montgomery Street Income Securities, Inc. |
| | | | | | | | | | | | | | | | | | | | |
Financial Highlights | |
| | | | | |
| Years ended December 31, | | 2007 | | | 2006 | | | 2005 | | | 2004 | | | 2003 | |
| | | | | |
| Selected Per Share Data | | | | | | | | | | | | | | | | | | | | |
| Net asset value, beginning of period | | $ | 18.81 | | | $ | 18.99 | | | $ | 19.62 | | | $ | 19.64 | | | $ | 19.43 | |
| Income from investment operations: | | | | | | | | | | | | | | | | | | | | |
Incomea | | | 1.18 | | | | 1.03 | | | | 1.14 | | | | 1.18 | | | | 1.20 | |
Operating expensesa | | | (0.13 | ) | | | (0.13 | ) | | | (0.14 | ) | | | (0.14 | ) | | | (0.12 | ) |
Net investment incomea | | | 1.05 | | | | 0.90 | | | | 1.00 | | | | 1.04 | | | | 1.08 | |
Net realized and unrealized gain (loss) on investment transactions | | | (0.67 | ) | | | (0.03 | ) | | | (0.49 | ) | | | 0.17 | | | | 0.42 | |
Total from investment operations | | | 0.38 | | | | 0.87 | | | | 0.51 | | | | 1.21 | | | | 1.50 | |
| Less distributions from: | | | | | | | | | | | | | | | | | | | | |
Net investment incomea | | | (1.12 | ) | | | (1.05 | ) | | | (1.14 | ) | | | (1.23 | ) | | | (1.29 | ) |
| Net asset value, end of period | | $ | 18.07 | | | $ | 18.81 | | | $ | 18.99 | | | $ | 19.62 | | | $ | 19.64 | |
| Per share market value, end of period | | $ | 16.13 | | | $ | 17.28 | | | $ | 16.91 | | | $ | 18.36 | | | $ | 18.55 | |
| Closing price range on New York Stock Exchange for each share of Common Stock outstanding during the period: | | | | | | | | | | | | | | | | | | | | |
High ($) | | | 17.80 | | | | 17.57 | | | | 18.85 | | | | 19.39 | | | | 20.45 | |
Low ($) | | | 15.77 | | | | 16.30 | | | | 16.55 | | | | 16.55 | | | | 17.50 | |
| | | | | |
| Total Return | | | | | | | | | | | | | | | | | | | | |
| Based on market value (%)b | | | (0.23 | ) | | | 8.70 | | | | (1.69 | ) | | | 5.82 | | | | 4.53 | |
| Based on net asset value (%)b | | | 2.68 | | | | 5.37 | | | | 3.31 | | | | 6.86 | d | | | 8.22 | |
| |
| Ratios to Average Net Assets and Supplemental Data | | | | | |
| Net assets, end of period ($ millions) | | | 188 | | | | 195 | | | | 197 | | | | 204 | | | | 204 | |
Ratio of expenses before expense
reductions (%) | | | 0.67 | | | | 0.70 | | | | 0.74 | | | | 0.75 | | | | 0.63 | |
Ratio of expenses after expense
reductions (%) | | | 0.67 | | | | 0.70 | | | | 0.74 | | | | 0.72 | | | | 0.63 | |
| Ratio of net investment income (%) | | | 5.64 | | | | 4.78 | | | | 5.11 | | | | 5.26 | | | | 5.47 | |
| Portfolio turnover rate (%)c | | | 122 | | | | 199 | | | | 157 | | | | 149 | | | | 160 | |
The accompanying notes are an integral part of the financial statements.
| | |
| Montgomery Street Income Securities, Inc. | | 25 |
| a | Based on average shares outstanding during the period. |
| b | Total return based on net asset value reflects changes in the Fund's net asset value during the period. Total return based on market value reflects changes in market value. Each figure includes reinvestment of dividends. These figures will differ depending upon the level of any discount from or premium to net asset value. |
| c | The portfolio turnover rates excluding mortgage dollar roll transactions are stated in the Financial Highlights. The portfolio turnover rates for those periods that had mortgage dollar roll transactions were 349%, 376%, and 426%, for the years ended December 31, 2005, 2004, and 2003, respectively. The Fund had no transactions from mortgage dollar rolls for the years ended December 31, 2006 and 2007. |
| d | Total return would have been lower had certain expenses not been reduced. |
The accompanying notes are an integral part of the financial statements.
| | |
| 26 | | Montgomery Street Income Securities, Inc. |
| | |
Notes to Financial Statements | | |
A. Significant Accounting Policies
The Fund is registered under the 1940 Act, as a closed-end, diversified management investment company.
The Fund’s financial statements are prepared in accordance with accounting principles generally accepted in the United States of America which require the use of management estimates. Actual results could differ from those estimates. The policies described below are followed consistently by the Fund in the preparation of its financial statements.
Security Valuation. Investments are stated at value determined as of the close of regular trading (generally, 4:00 PM Eastern Time) on the New York Stock Exchange on each day the exchange is open for trading. Debt securities are valued by independent pricing services approved by, or at the direction of, the Board of Directors of the Fund. Such services may use various pricing techniques which take into account appropriate factors such as yield, quality, coupon rate, maturity, type of issue, trading characteristics and other data, as well as broker quotes. If the pricing services are unable to provide valuations, the securities are valued at the most recent bid quotation or evaluated price, as applicable, obtained from a broker/dealer. Fixed income securities with a remaining maturity of sixty days or less, maturing at par, are valued at amortized cost. Securities and other assets for which market quotations are not readily available or for which the above valuation procedures are deemed not to reflect fair value are valued in a manner that is intended to reflect their fair value as determined in accordance with procedures approved by the Board of Directors.
Security Transactions and Investment Income. Investment transactions are accounted for on a trade date plus one basis for daily net asset value calculations. However, for financial reporting purposes, investment transactions are reported on trade date. Interest income is recorded on the accrual basis. All premiums and discounts are amortized/accreted for financial reporting purposes. Dividend income is recorded on the ex-dividend date.
Foreign Currency Translations. The accounting records of the Fund are maintained in U.S. dollars. Investment securities and other assets and liabilities denominated in a foreign currency are translated into U.S. dollars generally using exchange rates in effect as of 4:00 PM Eastern Time. Purchases and sales of investment securities, income receipts, and expense payments are translated into U.S. dollars at the exchange rates prevailing on the respective dates of such transactions. The Fund does not isolate that portion of the results of operations resulting from changes in foreign exchange rates on investments from the fluctuations arising from changes in market prices of foreign securities. Such fluctuations are included in net realized gain (loss) on investments and net change in unrealized appreciation (depreciation) on investments, respectively.
| | |
| Montgomery Street Income Securities, Inc. | | 27 |
Net realized gains and losses on foreign currency related items are considered ordinary income for tax purposes and arise from sales of foreign currencies, currency gains or losses realized between the trade and settlement dates on securities transactions, the difference between the amounts of dividends, interest, and foreign withholding taxes recorded and the U.S. dollar equivalent of the amounts actually received or paid, and the realized gains or losses resulting from portfolio and transaction hedges. Net change in unrealized appreciation (depreciation) on foreign currency related items arises from changes in the fair value of assets and liabilities, other than investments in securities, at period end resulting from changes in exchange rates.
Repurchase Agreements. The Fund may enter into repurchase agreements with certain banks and broker/dealers whereby the Fund agrees to purchase a security with a simultaneous agreement by the seller to repurchase the security back from the Fund at a specified price and date or upon demand. The Fund, through its custodian bank or sub-custodian bank, receives delivery of the underlying securities as collateral, the amount of which at the time of purchase and each subsequent business day is required to be maintained at such a level that the collateral’s value is at least equal to the principal amount of the repurchase price plus accrued interest. The custodian or agent bank holds the collateral in a separate account until the agreement matures. If the counterparty defaults and the value of the collateral declines or if bankruptcy proceedings are commenced with respect to the counterparty, realization of the collateral by the Fund may be delayed or limited. There were no repurchase agreements outstanding at December 31, 2007.
When-Issued/Delayed Delivery Securities. The Fund may purchase securities with delivery or payment to occur at a later date beyond the normal settlement period. At the time the Fund enters into a commitment to purchase a security, the transaction is recorded and the value of the security is reflected in the net asset value. The price of such security and the date when the security will be delivered and paid for are fixed at the time the transaction is negotiated. The value of the security may vary with market fluctuations. No interest accrues to the Fund until settlement of the trade. Certain risks may arise upon entering into when-issued or delayed delivery securities from the potential inability of counterparties to meet the terms of their contracts or if the issuer does not issue the securities due to political, economic, or other factors. Additionally, losses may arise due to changes in the value of the underlying securities.
Securities Lending. The Fund has entered into a securities lending arrangement with its custodian. Under the terms of the agreement, the Fund receives a fee equal to a percentage of the net income generated by the collateral held during each lending transaction. The custodian is authorized to loan securities on behalf of the Fund to approved borrowers and is required to maintain collateral at least equal in value to
| | |
| 28 | | Montgomery Street Income Securities, Inc. |
the value of the securities loaned. Cash collateral is invested by the custodian in the Mellon GSL Delaware Business Trust Collateral Fund (a pooled investment fund). In the event of bankruptcy or other default of the borrower, the Fund could experience delays in liquidating the loan collateral or recovering the loaned securities and incur expenses related to enforcing its rights. In addition, there could be a decline in the value of the collateral or in the fair value of the securities loaned while the Fund seeks to enforce its rights thereto and the Fund could experience subnormal levels of income or lack of access to income during that period. The Fund bears the risk of any deficiency in the amount of collateral available for return to a borrower due to a loss in an approved investment.
Loan Participations/Assignments. The Fund may invest in U.S. dollar denominated fixed and floating rate loans arranged through private negotiations between a foreign sovereign entity and one or more financial institutions (“Lenders”). The Fund invests in such loans in the form of participations in loans or assignments of all or a portion of loans from third parties. Participations typically result in the Fund having a contractual relationship only with the Lender, not with the sovereign borrower. The Fund has the right to receive payments of principal, interest and any fees to which it is entitled from the Lender selling the participation and only upon receipt by the Lender of the payments from the borrower. In connection with purchasing participations, the Fund generally has no right to enforce compliance by the borrower with the terms of the loan agreement relating to the Loan, nor any rights of set-off against the borrower, and the Fund will not benefit directly from any collateral supporting the Loan in which it has purchased the participation. As a result, the Fund assumes the credit risk of both the borrower and the Lender that is selling the participation. At December 31, 2007, the Fund held no participations.
Federal Income Taxes. The Fund intends to qualify as a “regulated investment company” and to distribute substantially all net investment income and net capital gains, if any, to its stockholders and otherwise comply with Subchapter M of the Internal Revenue Code applicable to regulated investment companies. Therefore, no federal income tax provision is required.
Recent Accounting Pronouncements. On July 13, 2006, the Financial Accounting Standards Board (“FASB”) released FASB Interpretation No. 48 “Accounting for Uncertainty in Income Taxes” (“FIN 48”). FIN 48 provides guidance for how uncertain tax positions should be recognized, measured, presented and disclosed in the financial statements. FIN 48 requires the evaluation of tax positions taken or expected to be taken in the course of preparing the Fund’s tax returns to determine whether the tax positions are “more-likely-than-not” of being sustained by the applicable tax authority. Tax positions not deemed to meet the “more-likely-than-not” threshold would be recorded as an expense in the current year. FIN 48 requires
| | |
| Montgomery Street Income Securities, Inc. | | 29 |
that management evaluate the tax positions taken in returns that remain subject to examination by the Fund’s major tax jurisdictions. At December 31, 2007, returns subject to examination include those filed for the period ended December 31, 2004 and thereafter. Management adopted FIN 48 in 2007 and has evaluated the Fund’s tax positions for the applicable periods. Based on that evaluation, management concluded that the adoption of FIN 48 did not have an effect on the Fund’s financial statements.
In September 2006, the FASB issued Statement on Financial Accounting Standards No. 157, “Fair Value Measurements” (“SFAS No. 157”). This standard establishes a single authoritative definition of fair value, sets out a framework for measuring fair value and requires additional disclosures about fair value measurements. SFAS No. 157 applies to fair value measurements already required or permitted by existing standards. SFAS No. 157 is effective for financial statements issued for fiscal years beginning after November 15, 2007. The changes to current generally accepted accounting principles from the application of this Statement relate to the definition of fair value, the methods used to measure fair value, and the expanded disclosures about fair value measurements. Management has analyzed the impact of SFAS No. 157 and does not believe the adoption of SFAS No. 157 will impact the financial statement amounts, however, additional disclosures may be required about the inputs used to develop the measurements and the effect of certain of the measurements on changes in net assets for future periods.
Distribution of Income and Capital Gains. The amount and timing of distributions are determined in accordance with federal income tax regulations, which may differ from accounting principles generally accepted in the United States of America. Distributions of net investment income are paid quarterly. Net realized gains from investment transactions will be distributed to stockholders at least annually to the extent they exceed available capital loss carryforwards. The Fund uses the specific identification method for determining realized gain or loss on investments sold for both financial and federal income tax reporting purposes.
Contingencies. In the normal course of business, the Fund may enter into contracts with service providers that contain general indemnification clauses. The Fund’s maximum exposure under these arrangements is unknown, as this would involve future claims that may be made against the Fund that have not yet been made. However, based on experience to date, the Fund expects any risk of loss to be remote.
Forward Foreign Currency Contracts. The Fund may enter into forward foreign currency contracts, generally to hedge foreign currency exposure between trade date and settlement date on security purchases and sales or to minimize foreign currency risk on portfolio securities denominated in foreign currencies. All contracts are marked-to-market daily based on the forward currency exchange rate. The change in
| | |
| 30 | | Montgomery Street Income Securities, Inc. |
value is recorded as a receivable or payable from forward currency contracts. When a contract is closed, the difference between the value of the contract at the time it was opened and the value at the time it was closed is recorded as net realized gain (loss) on foreign currency related items. The use of forward foreign currency contracts does not eliminate fluctuations in the underlying prices of the Fund’s portfolio securities, but it does establish a rate of exchange that can be achieved in the future. These contracts involve market risk in excess of the receivable or payable related to forward foreign currency contracts reflected in the Statement of Assets and Liabilities. Although contracts limit the risk of loss due to a decline in the value of the hedged currency, they also limit any potential gain that might result should the value of the currency increase. Additionally, the Fund could be exposed to the risk of a previously hedged position becoming unhedged if the counterparty to a contract is unable to meet the terms of the contract.
Futures Contracts. The Fund may buy and sell futures contracts to manage its exposure to changes in securities prices and foreign currencies or as an efficient means of adjusting overall exposure to certain markets. The risks associated with the use of futures contracts include the possibility that the value of the futures contract may not correlate with the change in the value of the hedged instrument. In addition, there is the risk that the Fund may not be able to enter into a closing transaction because of an illiquid market. Upon entering into a futures contract, the Fund is required to deposit with the broker an amount of cash or cash equivalents equal to a certain percentage of the contract amount. This is known as the “initial margin.” Futures contracts are valued based upon their quoted daily settlement prices. In the event that the settlement price is unavailable, the closing price will be used for valuation. The Fund receives from or pays to the counterparty an amount of cash equal to the daily fluctuation in the value of the contracts. Such receipts or payments, known as the "variation margin," are recorded by the Fund until the contracts are terminated at which time a realized gain or loss is recognized. Futures contracts involve, to varying degrees, risk of loss in excess of the variation margin reflected in the Statement of Assets and Liabilities.
B. Purchases and Sales of Securities
During the year ended December 31, 2007, purchases and sales of investment securities, excluding U.S. government obligations and short-term investments, aggregated $98,455,394 and $118,039,983, respectively. Purchases and sales of long-term U.S. government obligations aggregated $128,146,998 and $104,181,826, respectively.
C. Related Parties
Investment Advisory Agreement. The Fund and HIMCO entered into an Investment Advisory Agreement whereby the Fund pays HIMCO a quarterly fee
| | |
| Montgomery Street Income Securities, Inc. | | 31 |
equal to the product of (a) one quarter of 0.25%, times (b) the average of the net assets of the Fund on the last business day of each calendar month of the then ended calendar quarter.
Fund Accounting and Administration Services Agreement. The Fund has entered into a Fund Accounting and Administration Services Agreement (“Administration Agreement”) with Jackson Fund Services (“JFS”). Pursuant to the Administration Agreement, the Fund pays JFS an annual fee, payable monthly, equal to 0.25% of the value of the net assets of the Fund up to $100 million; 0.20% of the value of the net assets of the Fund from $100 million to $200 million; and 0.15% of the value of the net assets of the Fund over $200 million. JFS makes individuals available to the Fund to serve as its officers, without compensation from the Fund.
Directors’ Fees and Expenses. The Fund pays each Director a retainer fee plus specified amounts for each Board and Committee meeting attended.
D. Federal Income Tax Matters
The following information is presented on an income tax basis. The timing and characterization of certain income and capital gains distributions are determined in accordance with federal tax regulations, which may differ from accounting principles generally accepted in the United States of America. These differences primarily relate to timing differences in recognizing premium amortization on debt securities and timing differences in recognizing certain gains and losses on investment transactions. To the extent that differences arise that are permanent in nature, such amounts are reclassified within the components of net assets on the Statement of Assets and Liabilities based on their federal income tax treatment; timing differences do not require reclassification. Timing and permanent differences do not impact the net asset values of the Fund. In 2007, the permanent differences increased undistributed net investment income and accumulated realized loss by $1,040,694.
At December 31, 2007, the components of net unrealized depreciation and cost of investments are listed in the following table.
| | | | | | |
Cost of
Investments | | Gross Unrealized
Depreciation | | Gross Unrealized
Appreciation | | Net Unrealized
Depreciation |
| $234,155,566 | | $(9,020,631) | | $598,274 | | $(8,422,357) |
At December 31, 2007, the Fund had undistributed net ordinary income of $518,874.
The distributions paid of $11,620,203 and $10,892,738 for the years ended December 31, 2007 and 2006, respectively, were from net ordinary income.
| | |
| 32 | | Montgomery Street Income Securities, Inc. |
At December 31, 2007, the Fund had unused capital loss carryforwards available for federal income tax purposes which may be applied against any future realized net taxable capital gains or until the respective expiration dates occur as noted below.
| | |
| Amount | | Year of Expiration |
| $ 781,347 | | 2010 |
| 1,872,360 | | 2013 |
| 3,952,947 | | 2014 |
| 596,899 | | 2015 |
| Total: $7,203,553 | | |
E. Share Repurchases
The Fund is authorized to effect periodic repurchases of its shares in the open market from time to time when the Fund’s shares trade at a discount to their net asset value. During the year ended December 31, 2007, the Fund purchased 48,000 shares of common stock on the open market at a total cost of $812,304. The weighted average discount of these purchases, comparing the purchase price to the net asset value at the time of purchase was 9.5%. During the year ended December 31, 2006, the Fund purchased 46,000 shares of common stock on the open market at a total cost of $783,964 with a weighted average discount of 9.7%.
| | |
| Montgomery Street Income Securities, Inc. | | 33 |
Report of Independent Registered Public
Accounting Firm
To the Shareholders and Board of Directors of
Montgomery Street Income Securities, Inc.:
We have audited the accompanying statement of assets and liabilities, including the schedule of investments, of Montgomery Street Income Securities, Inc. (the “Fund”), as of December 31, 2007, and the related statement of operations for the year then ended and the statement of changes in net assets and financial highlights for each of the two years in the period then ended. These financial statements and financial highlights are the responsibility of the Fund’s management. Our responsibility is to express an opinion on these financial statements and financial highlights based on our audit. The financial highlights of the Fund for each of the periods ended on or prior to December 31, 2005, were audited by other auditors whose report, dated February 22, 2006, expressed an unqualified opinion on those financial highlights.
We conducted our audits in accordance with the standards of the Public Company Accounting Oversight Board (United States). Those standards require that we plan and perform the audit to obtain reasonable assurance about whether the financial statements and financial highlights are free of material misstatement. The Fund is not required to have, nor were we engaged to perform, an audit of its internal control over financial reporting. Our audit included consideration of internal control over financial reporting as a basis for designing audit procedures that are appropriate in the circumstances, but not for the purpose of expressing an opinion on the effectiveness of the Fund’s internal control over financial reporting. Accordingly, we express no such opinion. An audit also includes examining, on a test basis, evidence supporting the amounts and disclosures in the financial statements, assessing the accounting principles used and significant estimates made by management, as well as evaluating the overall financial statement presentation. Our procedures included confirmation of securities owned as of December 31, 2007, by correspondence with the Fund’s custodian. We believe that our audits provide a reasonable basis for our opinion.
In our opinion, the financial statements and financial highlights referred to above present fairly, in all material respects, the financial position of the Fund as of December 31, 2007, and the results of its operations for the year then ended, and the changes in its net assets and the financial highlights for the two years then ended in conformity with accounting principles generally accepted in the United States of America.
DELOITTE & TOUCHE LLP
Chicago, Illinois
February 25, 2008
| | |
| 34 | | Montgomery Street Income Securities, Inc. |
Dividend Reinvestment and Cash Purchase Plan
All registered stockholders of the Fund’s Common Stock are offered the opportunity of participating in the Plan. Registered stockholders, on request or on becoming registered stockholders, are mailed information regarding the Plan, including a form by which they may elect to participate in the Plan and thereby cause their future net investment income dividends and capital gains distributions to be invested in shares of the Fund’s common stock. Mellon Bank, N.A. is the agent (the “Plan Agent”) for stockholders who elect to participate in the Plan.
If a stockholder chooses to participate in the Plan, the stockholder’s dividends and capital gains distributions will be promptly invested, automatically increasing the stockholder’s holdings in the Fund. If the Fund declares a dividend or capital gains distributions payable either in cash or in stock of the Fund, the stockholder will automatically receive stock. If the market price per share on the payment date for the dividend (the “Valuation Date”) equals or exceeds the net asset value per share, the Fund will issue new shares to the stockholder at the greater of the following on the Valuation Date: (a) net asset value per share or (b) 95% of the market price per share. If the market price per share on the Valuation Date is less than the net asset value per share, the Fund will issue new shares to the stockholder at the market price per share on the Valuation Date. In either case, for federal income tax purposes the stockholder will be deemed to receive a distribution equal to the market value on the Valuation Date of the new shares issued. If dividends or capital gains distributions are payable only in cash, then the stockholder will receive shares purchased on the New York Stock Exchange or otherwise on the open market. In this event, for federal income tax purposes the amount of the distribution will equal the cash distribution paid. State and local taxes may also apply. All reinvestments are in full and fractional shares, carried to three decimal places.
Stockholders participating in the Plan can also purchase additional shares quarterly in any amount from $100 to $5,000 (a “Voluntary Cash Investment”) by sending in a check together with the cash remittance slip, which will be sent with each statement of the stockholder’s account, to Mellon Investor Services LLC, the Fund’s transfer agent (the “Transfer Agent”). Such additional shares will be purchased on the open market by the Plan Agent or its delegate. The purchase price of shares purchased on the open market, whether pursuant to a reinvestment of dividends payable only in cash or a
| | |
| Montgomery Street Income Securities, Inc. | | 35 |
Voluntary Cash Investment, will be the average price (including brokerage commissions) of all shares purchased by the Plan Agent or its delegate on the date such purchases are effected. In addition, stockholders may be charged a service fee in an amount up to 5% of the value of the Voluntary Cash Investment. Although subject to change, stockholders are currently charged $1 for each Voluntary Cash Investment.
Stockholders may terminate their participation in the Plan at any time and elect to receive dividends and other distributions in cash by notifying the Transfer Agent in writing. Such notification must be received not less than 10 days prior to the record date of any distribution. There is no charge or other penalty for such termination. The Plan may be terminated by the Fund upon written notice mailed to the stockholders at least 30 days prior to the record date of any distribution. Upon termination, the Fund will issue certificates for all full shares held under the Plan and cash for any fractional share.
Alternatively, stockholders may request the Transfer Agent to instruct the Plan Agent or its delegate to sell any full shares and remit the proceeds, less a $2.50 service fee and less brokerage commissions. The sale of shares (including fractional shares) will be a taxable event for federal income tax purposes and may be taxable for state and local tax purposes.
The Plan may be amended by the Fund at any time. Except when required by law, written notice of any amendment will be mailed to stockholders at least 30 days prior to its effective date. The amendment will be deemed accepted unless written notice of termination is received by the Transfer Agent prior to the effective date.
An investor holding shares in its own name can participate directly in the Plan. An investor holding shares in the name of a brokerage firm, bank or other nominee should contact that nominee, or any successor nominee, to determine whether the nominee can participate in the Plan on the investor’s behalf and to make any necessary arrangements for such participation.
Additional information, including a copy of the Plan and its Terms and Conditions and an enrollment form, can be obtained from the Transfer Agent by writing Mellon Investor Services LLC, P.O. Box 3315, South Hackensack, NJ 07606-1915, or by calling (877) 437-3938.
| | |
| 36 | | Montgomery Street Income Securities, Inc. |
Directors and Officers
The following table presents certain information regarding the Directors and Officers of Montgomery Street Income Securities, Inc. as of December 31, 2007. Each Director’s and Officer’s age is set forth in parentheses after his or her name. The mailing address for each Director and Officer is 225 W. Wacker Drive, Suite 950, Chicago, IL 60606. Unless otherwise noted, each Director and Officer has engaged in the principal occupation(s) noted in the table for at least the most recent five years, although not necessarily in the same capacity. The term of office for each Director is until the next annual meeting of stockholders or until the election and qualification of a successor. Officers are appointed annually by, and serve at the discretion of, the Board of Directors.
| | | | |
Non-Interested Directors | | |
Name, Age,
Position(s) Held
with the Fund
and Length of
Time Served | | Principal Occupation(s) During Past 5 Years and
Other Directorships Held | | Number
of Funds
in the
Fund
Complex
Overseen |
Richard J. Bradshaw (59) Chairman and Director 1991-present | | Formerly, Executive Director, Cooley Godward Kronish LLP (law firm) (1997-February 2008). Chairman of the Board of Directors of the Fund (since 2004). | | 1 |
Victor L. Hymes (50) Director 2005-present | | Chief Executive Officer and Chief Investment Officer of Legato Capital Management LLC (investment adviser) (2004-present). Formerly, Chief Operating Officer and Chief Investment Officer of Cazenave Partners, LLC (investment adviser)(2003-2004); Managing Director, Zurich Scudder Investments, Inc. (a former adviser of the Fund) (1997-2002); and President of the Fund (2000-2002). | | 1 |
John T. Packard (74) Director 2001-present | | Executive Vice President of Mt. Eden Investment Advisors LLC (since 2005). Formerly, Managing Director, Weiss, Peck & Greer LLC (investment adviser and broker-dealer) (2002-2004); Advisory Managing Director of the same firm (2000-2002); Advisory Managing Director, Zurich Scudder Investments, Inc. (a former adviser of the Fund) (1999-2000); Managing Director of the same firm (1985-1998); and President of the Fund (1988-2000). | | 1 |
Wendell G. Van Auken (63) Director 1994-present | | Managing Director of several venture capital funds affiliated with Mayfield Fund. Directorship: Advent Software (portfolio software company). | | 1 |
James C. Van Horne (72) Director 1985-present | | A.P. Giannini Professor of Finance, emeritus, Graduate School of Business, Stanford University. Directorship: Synnex Corporation (information technology distributor). Formerly, Chairman of the Board of the Fund (1991-2004). | | 1 |
| | |
| Montgomery Street Income Securities, Inc. | | 37 |
| | | | |
Officers | | |
Name, Age,
Position(s) Held
with the Fund
and Length of
Time Served | | Principal Occupation(s) During Past 5 Years and
Directorships Held | | Number
of Funds
in Fund
Complex
Overseen |
Mark D. Nerud (41) President and Chief Executive Officer 2006-present | | President of Jackson National Asset Management, LLC (“JNAM”) and Jackson Fund Services (“JFS”) (2006-present); President and Trustee/Manager of 107 investment companies advised by JNAM (2007-present); Chief Financial Officer of JNAM and JFS (2000-2006); Managing Board Member of JNAM (2000-2003 and 2007-present); Vice President (1999-2006), Treasurer and Chief Financial Officer of other investment companies advised by JNAM (2002-2006); Vice President - Fund Accounting & Administration of Jackson National Life Insurance Company (“Jackson”) (2000-present). | | n/a |
Daniel W. Koors (37) Chief Financial Officer 2006-present | | Vice President and Chief Financial Officer of JNAM and JFS (2007-present); Vice President, Treasurer and Chief Financial Officer of other investment companies advised by JNAM (2006-present); Assistant Treasurer of other investment companies advised by JNAM (2006); Assistant Vice President - Fund Administration of Jackson (2006-present); Partner of Deloitte & Touche LLP (2003-2006); Senior Manager of the same firm (2000-2003). | | n/a |
Susan S. Rhee (36) Secretary and Chief Legal Officer 2006-present | | Secretary of JNAM (2000-present); Vice President, Counsel, and Secretary of other investment companies advised by JNAM (2004-present); Assistant Vice President of Jackson (2003-present); Associate General Counsel of Jackson (2001-present). | | n/a |
Toni M. Bugni (34) Chief Compliance Officer 2006-present | | Compliance Manager of JFS (2006-present); Legal Assistant, MetLife Advisers, LLC (2004-2006); Regulatory Administration Senior Specialist, PFPC Inc. (2003-2004); Reporting and Compliance Senior Specialist, Investors Bank & Trust (2001-2003). | | n/a |
| | |
| 38 | | Montgomery Street Income Securities, Inc. |
General Information
| | |
| |
Investment
Adviser | | Hartford Investment Management Company 55 Farmington Avenue Hartford, CT 06105 |
| |
| Administrator | | Jackson Fund Services 225 West Wacker Drive Chicago, IL 60606 |
| |
| Transfer Agent | | Mellon Investor Services* P.O. Box 3315 South Hackensack, NJ 07606-1915 (Tel) 1/877/437-3938 |
| |
| Custodian | | Mellon Bank, N.A.* One Mellon Center Pittsburgh, PA 15258 |
| |
| Legal Counsel | | Howard Rice Nemerovski Canady Falk & Rabkin PC Three Embarcadero Center San Francisco, CA 94111 |
| |
Independent Registered Public Accounting Firm | | Deloitte & Touche LLP 111 South Wacker Drive Chicago, IL 60606-4301 |
| * | As of July 2, 2007, Mellon Financial Corporation, with which the Fund’s custodian, securities lending agent, transfer agent, and Plan Agent are affiliated, merged with The Bank of New York Company, Inc. to form The Bank of New York Mellon Corporation. |
| | |
| Montgomery Street Income Securities, Inc. | | 39 |
Notes
Notes
Notes

Presorted Standard
U.S. Postage
PAID
Lancaster, PA
Permit No. 1313
(42065 2/06)
Item 2. Code of Ethics.
As of December 31, 2007, the registrant had adopted a “code of ethics” (as such term is defined in the instructions to Item 2 of Form N-CSR) that applies to the registrant’s principal executive officer and principal financial and accounting officer. This code is filed as Exhibit 12(a)(1) hereto. There were no substantive amendments or waivers to the code of ethics during the period covered by this report.
Item 3. Audit Committee Financial Expert.
The registrant’s Board of Directors has determined that Mr. John T. Packard, Mr. Wendell G. Van Auken, and Mr. James C. Van Horne are “audit committee financial experts” (as such term is defined in the instructions to Item 3 of Form N-CSR). Each of these individuals is “independent,” meaning that he is not an “interested person” of the registrant (as that term is defined in Section 2(a)(19) of the Investment Company Act of 1940, as amended) and he does not accept any consulting, advisory, or other compensatory fee from the registrant (except in his capacity as a Board or committee member).
An “audit committee financial expert” is not an “expert” for any purpose, including for purposes of Section 11 of the Securities Act of 1933, as amended, as a result of being designated as an “audit committee financial expert.” Further, the designation of a person as an “audit committee financial expert” does not mean that the person has any greater duties, obligations, or liability than those imposed on the person without the “audit committee financial expert” designation. Similarly, the designation of a person as an “audit committee financial expert” does not affect the duties, obligations, or liability of any other member of the Audit Committee or Board of Directors.
Item 4. Principal Accountant Fees and Services.
(a) – (d)
Deloitte & Touche LLP (“Deloitte”) was appointed by the Board of Directors as the independent registered public accounting firm of the registrant for the fiscal years ended December 31, 2006 and December 31, 2007.
The following table sets forth the amount of fees that were billed by the principal accountant for the respective period to the registrant.
Fees for Services Rendered to the Registrant by the Principal Accountant
Fiscal Year | Audit Fees | Audit-Related Fees | Tax Fees | All Other Fees |
2006 | $43,000 | $0 | $6,000 | $0 |
2007 | $44,800 | $0 | $4,000 | $0 |
Tax Fees for 2006 and 2007 represent fees for services rendered to the registrant for tax return preparation and review of income and capital gains distributions.
Effective as of the close of business on June 9, 2006, Hartford Investment Management Company (“HIMCO”) became the investment adviser of the registrant.
The following table sets forth the amount of fees that were billed by the principal accountant for the respective period to any entity controlling, controlled by or under common control with HIMCO that provided ongoing services to the registrant (“Adviser Entities”) that were directly related to the registrant’s operations and financial reporting.
Fees for Services Rendered to Adviser Entities by the Principal Accountant
Fiscal Year | Audit-Related Fees | Tax Fees | All Other Fees |
2006 | $62,552 | $0 | $0 |
2007 | $62,859 | $0 | $0 |
Audit Related Fees for 2006 and 2007 included fees for an attestation engagement relating to HIMCO’s performance presentations.
(e)(1) | The Audit Committee has adopted procedures for the pre-approval by the Audit Committee of the engagement of the registrant’s independent auditors to provide audit and non-audit services to the registrant and the engagement of the registrant’s independent auditors to provide non-audit services to the registrant’s investment adviser or its related entities that related directly to the registrant’s operations and financial reporting. If time does not permit, the Chairman of the Audit Committee is authorized to pre-approve the engagement of the independent auditors on behalf of the Audit Committee. The independent auditors and the investment adviser are required to report on the initiation of any such engagement at the next regular Audit Committee meeting. |
(g) | The aggregate amount of non-audit fees billed by the principal accountant to the registrant and Adviser Entities was $68,552 for 2006, and is detailed in the table above. The aggregate amount of non-audit fees billed by the principal accountant to the registrant and Adviser Entities was $66,859 for 2007, and is detailed in the table above. |
(h) | For the fiscal years ended December 31, 2006 and December 31, 2007, the Audit Committee of the registrant’s Board of Directors considered the provision of non-audit services that were rendered to the respective Adviser Entities that were not pre-approved pursuant to paragraph (c)(7)(ii) of Rule 2-01 of Regulation S-X and |
concluded that such services were compatible with maintaining the respective principal accountant’s independence.
Item 5. Audit Committee of Listed Registrants.
(a) | The registrant has a separately-designated standing audit committee established in accordance with Section 3(a)(58)(A) of the Securities Exchange Act of 1934, as amended. The registrant's audit committee consists of Wendell G. Van Auken (Chairman), John T. Packard, and James C. Van Horne. |
Item 6. Schedule of Investments.
Included in Reports to Stockholders under Item 1.
Item 7. Disclosure of Proxy Voting Policies and Procedures for Closed-End Management Investment Companies.
It is the intention of the registrant to invest exclusively in non-voting securities. Under normal circumstances, the registrant does not intend to exercise conversion, exchange or other rights to purchase common stock or other equity securities, or otherwise to hold voting securities. In the unlikely event that the registrant does come into possession of any voting securities, the registrant intends to dispose of such securities as soon as it is reasonably practicable and prudent to do so.
Item 8. Portfolio Managers of Closed-End Management Investment Companies.
(a) | As of the close of business on June 9, 2006 and through the present, Nasri Toutoungi Charles Moon are primarily and jointly responsible for the day-to-day management of the registrant. Please see the tables below for descriptions of each individual’s role, as well as prior business experience over the last 5 years. |
Portfolio Management Team
Name | Title | Position | Years At Firm | Years In Industry |
Nasri Toutoungi | Managing Director | Senior Portfolio Manager | 5 | 20 |
Current Employer | Title/Function | Start Date | End Date |
Hartford Investment Management | Managing Director/Senior Portfolio Manager | January 2003 | Present |
Previous Employer | Title/Function | Start Date | End Date |
BlackRock, Inc. | Managing Director | 1998 | January 2002 |
| | | | | | | |
Name | Title | Position | Years At Firm | Years In Industry |
Charles Moon | Executive Vice President | Senior Portfolio Manager | 2 | 18 |
Current Employer | Title/Function | Start Date | End Date |
Hartford Investment Management | Executive Vice President/ Director Investment Grade Credit | March 2006 | Present |
Previous Employer | Title/Function | Start Date | End Date |
OFI Institutional Asset Management | Co-Head Investment Grade Credit/ Portfolio Manager | April 2002 | February 2006 |
Morgan Stanley Investment Management | Executive Director/ Portfolio Manager | June 1999 | March 2002 |
| | | | | | | |
The other accounts managed by the registrant’s portfolio managers are as follows as of December 31, 2007:
Portfolio Manager | Number and Total Assets of Other Registered Investment Company Accounts as of December 31, 2007 | Number and Total Assets of Other Pooled Investment Vehicle Accounts as of December 31, 2007 | Other Accounts as of December 31, 2007 |
Performance Based Accounts | Asset Based Accounts | Performance Based Accounts | Asset Based Accounts | Performance Based Accounts | Asset Based Accounts |
# | $Assets | # | $Assets | # | $Assets | # | $Assets | # | $Assets | # | $Assets |
Nasri Toutoungi | 0 | $0 | 3 | $5,899,605,517 | 0 | $0 | 1 | $197,268,648 | 0 | $0 | 12 | $3,757,924,068 |
Charles Moon | 0 | $0 | 2 | $576,272,976 | 0 | $0 | 0 | $0 | 0 | $0 | 2 | $28,311,065,055 |
Portfolio managers, including assistant portfolio managers, at Hartford manage multiple portfolios for multiple clients. These accounts may include mutual funds, separate accounts (assets managed on behalf of institutions such as pension funds, insurance companies, foundations), commingled trust accounts, and other types of funds. The portfolios managed by a portfolio manager may have investment objectives, strategies and risk profiles that differ from those of the registrant. Portfolio managers make investment decisions for each portfolio, including the registrant, based on the investment objectives, policies, practices and other relevant investment considerations applicable to that portfolio. Consequently, the portfolio managers may purchase securities for one portfolio and not another portfolio. Securities purchased in one portfolio may perform better than the securities purchased for another portfolio, and vice versa. A portfolio manager or other investment professionals at Hartford may place
transactions on behalf of other accounts that are directly or indirectly contrary to investment decisions made on behalf of the registrant, or make investment decisions that are similar to those made for the registrant, both of which have the potential to adversely impact the registrant depending on market conditions. In addition, some of these portfolios have fee structures that are or have the potential to be higher, in some cases significantly higher, than the fees paid by the registrant. Because a portfolio manager’s compensation is affected by revenues earned by Hartford, the incentives associated with the registrant may be significantly higher or lower than those associated with other accounts managed by a given portfolio manager.
Hartford’s goal is to provide high quality investment services to all of its clients, while meeting its fiduciary obligation to treat all clients fairly. Hartford has adopted and implemented policies and procedures, including brokerage and trade allocation policies and procedures, that it believes address the conflicts associated with managing multiple accounts for multiple clients. In addition, Hartford monitors a variety of areas, including compliance with applicable laws and regulations, primary guidelines of the registrant, the allocation of securities, and compliance with Hartford’s Code of Ethics. Furthermore, senior investment and business personnel at Hartford periodically review the performance of Hartford’s portfolio managers. Although the firm does not track the time a portfolio manager spends on a single portfolio, it does periodically assess whether a portfolio manager has adequate time and resources to effectively manage the portfolio manager’s overall book of business.
Material conflicts of interest may arise when allocating and/or aggregating trades. Hartford may aggregate into a single trade order several individual contemporaneous client trade orders for a single security, absent specific client directions to the contrary. It is the policy of Hartford that when a decision is made to aggregate transactions on behalf of more than one account (including the registrant or other accounts over which it has discretionary authority), such transactions will be allocated to all participating client accounts in a fair and equitable manner in accordance with Hartford’s trade allocation policy. The trade allocation policy is described in Hartford’s Form ADV. Hartford’s compliance unit monitors block transactions to assure adherence to the trade allocation policy, and will inform Hartford’s Issue Resolution Council of any non-compliant transactions.
The conflicts addressed in the foregoing paragraph are primarily dealt with through strict adherence to Hartford’s Trade Allocation Policy.
As of December 31, 2007, the compensation package for portfolio managers consists of three components, which are base pay, annual incentive and long-term incentive. The base pay program provides a level of base pay that is competitive with the marketplace and reflects a portfolio manager’s contribution to Hartford’s success.
The annual incentive plan provides cash bonuses dependent on both the overall performance of Hartford and individual contributions. A portion of the bonus pool is determined based on the aggregate portfolio pre-tax performance results over three years relative to peer groups and benchmarks, and the remaining portion is based on current year operating income relative to the operating plan.
Bonuses for portfolio managers vary depending on the scope of accountability and experience level of the individual portfolio manager. An individual’s award is based on qualitative and quantitative factors including the relative performance of his/her assigned portfolios compared to a peer group or benchmark and is primarily geared to reward top quartile performance on a trailing three-year basis. The registrant is a member of the Lipper Corporate Debt Funds BBB-Rated Category and is benchmarked to the Lehman Brothers Aggregate Bond Index. Qualitative factors such as leadership, teamwork and overall contribution made during the year are also considered.
The long-term incentive plan provides an opportunity for portfolio managers and other key contributors to Hartford to be rewarded in the future based on the continued profitable growth of Hartford. A designated portion of the Hartford’s net operating income will be allocated to long-term incentive awards each year. The size of the actual individual awards will vary greatly. The awards will vest over three years for most participants and five years for Hartford’s Managing Directors. The value of the awards will increase at the growth rate of operating income each year during the vesting period. Awards will be paid in cash at the end of the vesting period.
All portfolio managers are eligible to participate in The Hartford Financial Services Group, Inc.'s standard employee health and welfare programs, including retirement.
As of December 31, 2007, the registrant’s portfolio managers owned the following equity securities of the registrant:
Portfolio Manager | Dollar Range of Equity Securities Beneficially Owned as of December 31, 2007 |
Nasri Toutoungi | None |
Charles Moon | None |
The information in this Item 8(a) has been provided by Hartford Investment Management Company.
Item 9. Purchases of Equity Securities by Closed-End Management Investment Company and Affiliated Purchasers.
Period | (a) Total Number of Shares (or Units) Purchased(1) | (b) Average Price Paid per Share (or Unit) | (c) Total Number of Shares (or Units) Purchased as Part of Publicly Announced Plans or Programs | (d) Maximum Number (or Approximate Dollar Value) of Shares (or Units) that May Yet Be Purchased Under the Plans or Programs |
July 1 – July 31 | 0 | 0 | n/a | n/a |
August 1 – August 31 | 12,000 | 16.35 | n/a | n/a |
September 1 – September 30 | 0 | 0 | n/a | n/a |
October 1 – October 31 | 0 | 0 | n/a | n/a |
November 1 – November 30 | 12,000 | 16.23 | n/a | n/a |
December 1 – December 31 | 0 | 0 | n/a | n/a |
Total | 24,000 | 16.29 | n/a | n/a |
(1) All purchases were made on the open market pursuant to the registrant’s Repurchase Program and related guidelines.
Item 10. Submission of Matters to a Vote of Security Holders.
There have been no material changes to the procedures by which stockholders may recommend nominees to the registrant’s Board of Directors since the registrant last disclosed such procedures in a Proxy Statement or Form N-CSR.
Item 11. Controls and Procedures.
(a) | The President/Principal Executive Officer and the Treasurer/Principal Financial Officer of the registrant have concluded, based on their evaluation of the registrant’s disclosure controls and procedures (as defined in Rule 30a-3(c) under the Act) as of a date within ninety (90) days of the filing date of this report on Form N-CSR, that such controls and procedures are effective and that the design and operation of such procedures ensures that information required to be disclosed by the registrant in this report on Form N-CSR is recorded, processed, summarized, and reported within the time periods specified in the U.S. Securities and Exchange Commission’s rules and forms. |
(b) | There has been no change in the registrant’s internal controls over financial reporting (as defined in Rule 30a-3(d) under the Investment Company Act of 1940, as amended (the “Act”)) that occurred during the second fiscal quarter of the period covered by this report that has materially affected, or is reasonably likely to materially affect, the registrant’s internal control over financial reporting. |
Item 12. Exhibits.
(a)(1) | Code of Ethics (as defined in Item 2(b) of Form N-CSR). |
| (2) | Certifications required by Rule 30a-2(a) under the Act. |
(b) | Certification required by Rule 30a-2(b) under the Act. |
SIGNATURES
Pursuant to the requirements of the Securities Exchange Act of 1934 and the Investment Company Act of 1940, the registrant has duly caused this report to be signed on its behalf by the undersigned, thereunto duly authorized.
| Montgomery Street Income Securities, Inc. |
| |
| |
By: | /s/ Mark D. Nerud |
Name: | Mark D. Nerud |
Title: | President and Principal Executive Officer |
Date: | March 5, 2008 |
Pursuant to the requirements of the Securities Exchange Act of 1934 and the Investment Company Act of 1940, this report has been signed below by the following persons on behalf of the registrant and in the capacities and on the dates indicated.
| |
By: | /s/ Mark D. Nerud |
Name: | Mark D. Nerud |
Title: | President and Principal Executive Officer |
Date: | March 5, 2008 |
| |
By: | /s/ Daniel W. Koors |
Name: | Daniel W. Koors |
Title: | Treasurer and Principal Financial Officer |
Date: | March 5, 2008 |
EXHIBIT LIST
Exhibit 12(a)(1): | Code of Ethics (as defined in Item 2(b) of Form N-CSR) |
Exhibit 12(a)(2)(a): | Certification of the Principal Executive Officer required by Rule 30a-2(a) under the Act |
Exhibit 12(a)(2)(b): | Certification of the Principal Financial Officer required by Rule 30a-2(a) under the Act |
Exhibit 12(b): | Certification required by Rule 30a-2(b) under the Act |