UNITED STATES
SECURITIES AND EXCHANGE COMMISSION
Washington, D.C. 20549
FORM N-CSR
CERTIFIED SHAREHOLDER REPORT OF REGISTERED
MANAGEMENT INVESTMENT COMPANIES
Investment Company Act File Number: 811-2340
Montgomery Street Income Securities, Inc.
(Exact name of registrant as specified in charter)
225 W. Wacker Drive, Suite 950
Chicago, IL 60606
(Address of principal executive offices)
Mark D. Nerud, President
225 W. Wacker Drive, Suite 950
Chicago, IL 60606
(Name and address of agent for service)
Registrant’s telephone number, including area code: (312) 338-5801
Date of fiscal year end: December 31
Date of reporting period: January 1, 2007 – June 30, 2007
Form N-CSR is to be used by management investment companies to file reports with the Commission not later than 10 days after the transmission to stockholders of any report that is required to be transmitted to stockholders under Rule 30e-1 under the Investment Company Act of 1940 (17 CFR 270.30e-1). The Commission may use the information provided on Form N-CSR in its regulatory, disclosure review, inspection, and policymaking roles.
A registrant is required to disclose the information specified by Form N-CSR, and the Commission will make this information public. A registrant is not required to respond to the collection of information contained in Form N-CSR unless the Form displays a currently valid Office of Management and Budget (“OMB”) control number. Please direct comments concerning the accuracy of the information collection burden estimate and any suggestions for reducing the burden to Secretary, Securities and Exchange Commission, 450 Fifth Street, NW, Washington, DC 20549-0609. The OMB has reviewed this collection of information under the clearance requirements of 44 U.S.C. §3507.
Item 1. Report to Stockholders.

Montgomery Street Income Securities, Inc.
Semiannual Report to Stockholders
June 30, 2007 (Unaudited)
Portfolio Management Review
The investments of Montgomery Street Income Securities, Inc. (the “Fund”) provided a total return based on net asset value (“NAV”) of 0.80% for the six-month period ended June 30, 20071. The total return of the Fund based on the market price of its New York Stock Exchange-traded shares was 1.84% for the same period. The total NAV return of the Fund underperformed the return of the unmanaged Lehman Brothers Aggregate Bond Index, which posted a total return of 0.98% for the six-month period2. Past results are not necessarily indicative of the future performance of the Fund. Investment return and principal value will fluctuate.
The Fund paid a quarterly dividend of $0.29 per share on April 30, 2007. The Fund’s market price stood at $17.31 as of June 30, 2007, compared with $17.28 on December 31, 2006. The market price discount of the shares, as a percentage of NAV, was 7.23% on June 30, 2007. Shares of closed-end funds frequently trade at a discount to net asset value. The price of the Fund’s shares is determined by a number of factors, several of which are beyond the control of the Fund. The Fund, therefore, cannot predict whether its shares will trade at, below or above the NAV.
Economic activity slowed considerably in the early months of 2007. U.S. Gross Domestic Product (“GDP”) grew at an annualized rate of 0.7% in the first quarter, driven by weakness in net exports and inventory levels. Activity increased in recent months from these low levels raising estimates for first half GDP to a level somewhere between 2% to 3% on an annualized basis. In this environment of tepid growth and moderating, but still elevated, inflation, the Federal Open Market Committee (“FOMC”), now led by Chairman Ben Bernanke, left monetary policy unchanged during the six-month period. Employment, measured in the form of non-farm payrolls, unemployment claims, and the unemployment rate, remained constructive for a continued expansion, albeit at a moderate pace. Inflation, at the headline level,
| 1 | Total return based on NAV reflects changes in the Fund’s net asset value during each period. Total return based on market value reflects changes in market value. Each figure assumes that dividend and capital gains, if any, were reinvested. These figures will differ depending upon the level of any discount from or premium to NAV at which the Fund’s shares traded during the period. |
| 2 | The Lehman Brothers Aggregate Bond Index is an unmanaged index representing domestic taxable investment-grade bonds, consisting of government and corporate securities, mortgage pass-through securities, and asset-backed securities with average maturities of one year or more. Index returns assume reinvestment of dividends, and unlike Fund returns, do not reflect fees or expenses. It is not possible to invest directly in an index. |
| Montgomery Street Income Securities, Inc. | 1 |
increased over the first half of 2007, led by price increases in food and energy, particularly gasoline. Core prices, seen by the FOMC as a better gauge of trends in inflation, moderated by the end of the second quarter. While this moderation was consistent with the Fed’s outlook, the absolute level of core prices remained at the high end of the FOMC’s comfort range. In that environment, the Fed’s predominant concern continued to be price stability.
Rising interest rates were detrimental to the price performance of bonds during the first half of 2007, as the principal value of fixed income securities decreased as interest rates rose. For the first two quarters of 2007, the U.S. Treasury and Investment Grade Bond sectors posted modestly positive returns. Below investment grade issues continued their strong performance over the first half, led by lower quality issuers.
Weakness in subprime mortgages and high levels of leveraged buy out driven supply made these returns volatile over the period. Cash, as measured by 3-month Treasury bills, outperformed most bond sectors for the period. Yields of all maturities, excluding Treasury-bills, rose during the period; long maturities underperformed resulting in a steeper yield curve.
US Treasury Bond Yield Curve
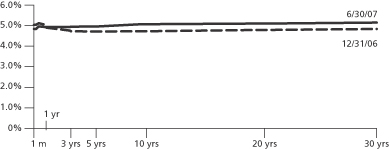
At the beginning of 2007, the Fund was positioned slightly overweight in interest rate risk relative to the benchmark. As economic conditions continued to weaken and the economic outlook deteriorated, relative interest rate risk was increased. During this period, the yield curve positioning of the Fund was slowly migrated away from the
| 2 | Montgomery Street Income Securities, Inc. |
flattening bias that existed in late 2006 to more of a bulleted structure (purchase of intermediate maturities, funded through the sale of short and long maturity holdings). Stronger economic data over the course of the second quarter increased the likelihood of higher rates in coming months and interest rate risk was reduced accordingly.
The Fund began 2007 with a constructive outlook on the “risk” sectors of the bond market, maintaining an allocation to corporate bonds of over 60% of Fund assets. Of this allocation, over 28% was represented by below investment grade issuers. Over 25% of the Fund was allocated to the mortgage-backed sector. These positions were funded with a large underweight to the government sector. Cash was maintained at a low level and average portfolio quality was A3/A-.
Over the course of the first half of the year, high yield exposure was reduced based on rich valuations and new issue supply concerns. Some of these sales funded select purchases in the home equity asset-backed securities market where recent volatility had created opportunities. Investment grade corporates were increased marginally, funded by a reduction in pass-through mortgage-backed securities. Exposure to the non-dollar sector was introduced in the first half of the year, supported by our outlook for a weaker U.S. dollar over the coming quarters. As of June 30, the Fund maintained a 1.5% exposure to both the Australian Dollar and the Euro with a 0.5% exposure to the Japanese Yen. Additionally, the Fund’s major allocations were to the mortgage-backed sector (26%), investment-grade corporate bonds (36%), and high yield bonds (20%).
| Montgomery Street Income Securities, Inc. | 3 |
Quality Distribution
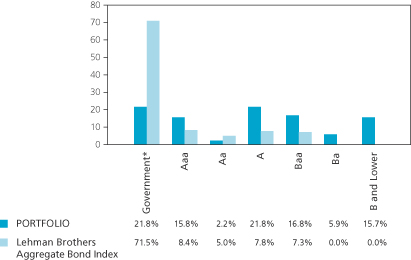
* | Government includes U.S. Treasury, U.S. Agency and cash. |
As of June 30, 2007.
Quality distribution is subject to change.
Percentages are based on total market value of the investment portfolio.
The quality ratings represent the lower of Moody’s Investors Service, Inc. (“Moody’s”) or Standard & Poor’s Corporation (“S&P”) credit ratings. The ratings of Moody’s and S&P represent these companies’ opinions as to the quality of the securities they rate. Ratings are relative and subject and not absolute standards of quality. A bond’s credit quality does not remove the market risk of an increase in interest rates.
| 4 | Montgomery Street Income Securities, Inc. |
Sector Distribution
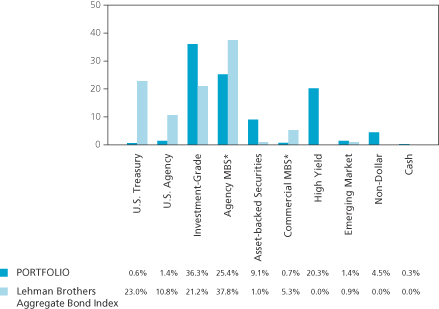
| * | Mortgage-backed Securities. |
As of June 30, 2007.
Sector distribution is subject to change.
Percentages are based on total market value of the investment portfolio.
The views expressed in this report reflect those of the investment adviser, Hartford Investment Management Company, only through the end of the period of the report as stated on the cover. The investment adviser’s views are subject to change at any time based on market and other conditions and should not be construed as a recommendation. Investment in the Fund involves risk. The Fund invests in individual bonds whose yields and market value fluctuate so that your investment may be worth more or less than its original cost. Bond investments are subject to interest rate risk such that when interest rates rise, the price of the bonds, and thus the value of the Fund, can decline and the investor can lose principal value. Additionally, investing in foreign securities presents certain unique risks not associated with domestic investments, such as currency fluctuation, political and economic changes, and market risks. All of these factors may result in greater share price volatility. Closed-end funds, unlike open-end funds, are not continuously offered.
NOT FDIC/NCUA INSURED. NO BANK GUARANTEE. MAY LOSE VALUE. NOT A DEPOSIT. NOT INSURED BY ANY FEDERAL GOVERNMENT AGENCY.
Past performance is no guarantee of future results.
This report is sent to stockholders of Montgomery Street Income Securities, Inc., for their information. It is not a prospectus, circular or representation intended for use in the purchase or sale of shares of the Fund or of any securities mentioned in the report.
| Montgomery Street Income Securities, Inc. | 5 |
Other Information
Dividends Paid
The Fund paid dividends of $0.29 per share on April 30, 2007 and $0.28 per share on July 31, 2007. The quarterly dividend paid in April included approximately $0.01 of previously undistributed income.
Dividend Reinvestment and Cash Purchase Option
The Fund maintains an optional Dividend Reinvestment and Cash Purchase Plan (the “Plan”) for the automatic reinvestment of your dividends and capital gain distributions in the shares of the Fund. Stockholders who participate in the Plan can also purchase additional shares of the Fund through the Plan’s voluntary cash investment feature. We recommend that you consider enrolling in the Plan to build your investment. The Plan’s features, including the voluntary cash investment feature, are described beginning on page 30 of this report.
Limited Share Repurchases
The Fund is authorized to repurchase a limited number of shares of the Fund’s common stock from time to time when the shares are trading at less than 95% of their NAV. Repurchases are limited to a number of shares each calendar quarter approximately equal to the number of new shares issued under the Plan with respect to income earned for the second preceding calendar quarter. There were 12,000 shares repurchased during each of the first two quarters of 2007. Up to 12,000 shares may be repurchased during the third quarter.
Investment Portfolio
Following the Fund’s first and third quarter ends, a complete portfolio holdings listing is filed with the U.S. Securities and Exchange Commission (“SEC”) on Form N-Q. The form is available on our website at www.montgomerystreetincome.com, or on the SEC’s website at www.sec.gov, and it also may be reviewed and copied at the SEC’s Public Reference Room in Washington, DC. Information on the operation of the SEC’s Public Reference Room may be obtained by calling (800) SEC-0330.
| 6 | Montgomery Street Income Securities, Inc. |
Proxy Voting
Information about how the Fund voted any proxies related to its portfolio securities during the most recent 12-month period ended June 30, 2007 is available on our website at www.montgomerystreetincome.com or on the SEC’s website at www.sec.gov. A description of the policies that the Fund uses to determine how to vote proxies relating to portfolio securities is available without charge, upon request, by calling (877) 437-3938 or on the SEC’s website at www.sec.gov.
Reports to Stockholders
Those stockholders who wish to view the Fund’s complete portfolio holdings listing for the first and third quarters may view the Form N-Q, as described above in the “Investment Portfolio” section of this report. The Fund’s annual and semiannual reports to stockholders will be mailed to stockholders, and are also available on our website at www.montgomerystreetincome.com or by calling (877) 437-3938.
Net Asset Value
The Fund’s NAV is available daily on our website at www.montgomerystreetincome.com. The Fund’s NAV and market value are published every Monday in The Wall Street Journal under the heading “Closed End Funds.” The Fund’s market value also is published daily in The New York Times, and both its market value and NAV are published weekly in Barron’s.
| Montgomery Street Income Securities, Inc. | 7 |
Investment Objectives and Policies
Investment Objectives
Your Fund is a closed-end diversified management investment company registered under the Investment Company Act of 1940, as amended (the “1940 Act”), investing and reinvesting its assets in a portfolio of selected securities. The Fund’s primary investment objective is to seek as high a level of current income as is consistent with prudent investment risks, from a diversified portfolio primarily of debt securities. Capital appreciation is a secondary objective.
Principal Investment Policies
Investment of your Fund is guided by the principal investment policies summarized below. For a more complete description of the Fund’s investment policies, please see the Fund’s Form N-2 Registration Statement dated April 29, 1992 and subsequent annual reports to stockholders.
Under normal circumstances, the Fund will invest at least 80% of its net assets, plus the amount of any borrowings for investment purposes, in income producing securities.1
At least 70% of total assets must be invested in: straight debt securities (other than municipal securities), including U.S. dollar-denominated debt securities of foreign issuers, rated within the four highest grades assigned by Moody’s Investors Service, Inc. or Standard & Poor’s Corporation; bank debt of comparable quality; U.S. government or agency securities; commercial paper; cash; cash equivalents; or Canadian government, provincial, or municipal securities (not in excess of 25% of total assets).
Up to 30% of total assets (the “30% basket”) may be invested in other U.S. or foreign straight debt securities; convertible securities; and preferred stocks.
Not more than 25% of total assets may be invested in securities of any one industry (finance companies as a whole are not considered an “industry” for the purposes of this limitation).
Not more than 5% of total assets may be invested in securities of any one issuer, other than U.S. government or agency securities.
| 1 | The Fund will provide stockholders with at least 60 days’ notice prior to making any changes to this 80% investment policy. |
| 8 | Montgomery Street Income Securities, Inc. |
The Fund may invest money pursuant to repurchase agreements so long as the Fund is initially wholly secured with collateral consisting of securities in which the Fund can invest under its investment objectives and policies. In addition, investments in repurchase agreements must not, at the time of any such loan, be as a whole more than 20% — and be as to any one borrower more than 5% — of the Fund’s total assets.
The Fund may lend its portfolio securities to the extent permitted under the 1940 Act.
The Fund may borrow funds to purchase securities, provided that the aggregate amount of such borrowings may not exceed 30% of the Fund’s assets (including aggregate borrowings), less liabilities (excluding such borrowings).
The Fund may enter into forward foreign currency sale contracts to hedge portfolio positions, provided, among other things, that such contracts have a maturity of one year or less and that, at the time of purchase, the Fund’s obligations under such contracts do not exceed either the market value of portfolio securities denominated in the foreign currency or 15% of the Fund’s total assets.
The Fund may enter into interest rate futures contracts and purchase or write options on interest rate futures contracts, provided, among other things, that the Fund’s obligations under such instruments may not exceed the market value of the Fund’s assets not subject to the 30% basket.
It is the intention of the Fund to invest exclusively in non-voting securities. Under normal circumstances, the Fund does not intend to exercise conversion, exchange or other rights to purchase common stock or other equity securities, or otherwise to hold voting securities. In the unlikely event that the Fund does come into possession of any voting securities, the Fund intends to dispose of such securities as soon as it is reasonably practicable and prudent to do so.
| Montgomery Street Income Securities, Inc. | 9 |
Investment Portfolio | as of June 30, 2007 (Unaudited) |
| Principal Amount ($) (g) | Value ($) | |||||
Corporate Bonds 58.2% | ||||||
| Consumer Discretionary 7.5% | ||||||
AMR Real Estate Holdings Plc, 7.13%, 02/15/13 | 235,000 | 226,775 | ||||
Charter Communications Operating LLC, | 500,000 | 506,250 | ||||
Clear Channel Communications, Inc., 8.00%, 11/01/08 | 750,000 | 769,271 | ||||
Clear Channel Communications, Inc., 7.65%, 09/15/10 | 550,000 | 574,446 | ||||
Comcast Cable Holdings LLC, 10.13%, 04/15/22 | 1,291,000 | 1,678,399 | ||||
COX Communications, Inc., 5.45%, 12/15/14 | 500,000 | 483,726 | ||||
COX Communications, Inc., 5.88%, 12/01/16 (a) | 375,000 | 366,647 | ||||
CSC Holdings, Inc., 8.13%, 07/15/09 (d) | 190,000 | 193,800 | ||||
Dex Media West LLC, 9.88%, 08/15/13 | 450,000 | 481,500 | ||||
ERAC USA Finance Co., 5.90%, 11/15/15 (k) | 429,000 | 419,223 | ||||
Foot Locker, Inc., 8.50%, 01/15/22 (j) | 155,000 | 157,325 | ||||
Ford Capital BV, 9.50%, 06/01/10 | 650,000 | 659,750 | ||||
General Motors Corp., 6.38%, 05/01/08 (d) | 750,000 | 745,313 | ||||
Goodyear Tire & Rubber Co., 8.63%, 12/01/11 (a) (d) | 445,000 | 468,363 | ||||
Hertz Corp., 10.50%, 01/01/16 | 460,000 | 508,300 | ||||
Idearc, Inc., 8.00%, 11/15/16 | 500,000 | 505,000 | ||||
J.C. Penney Corp., Inc., 8.00%, 03/01/10 | 500,000 | 527,956 | ||||
K Hovnanian Enterprises, Inc., 6.00%, 01/15/10 | 310,000 | 282,100 | ||||
Lear Corp., 8.75%, 12/01/16 | 745,000 | 709,613 | ||||
Mediacom LLC, 9.50%, 01/15/13 | 500,000 | 511,250 | ||||
MGM Mirage, Inc., 8.50%, 09/15/10 | 500,000 | 523,125 | ||||
MGM Mirage, Inc., 6.75%, 09/01/12 | 300,000 | 286,500 | ||||
Neiman-Marcus Group, Inc., 10.38%, 10/15/15 (d) | 450,000 | 495,000 | ||||
Pokagon Gaming Authority, 10.38%, 06/15/14 (a) (d) | 210,000 | 231,525 | ||||
TCI Communications, Inc., 8.75%, 08/01/15 | 35,000 | 40,474 | ||||
Tenneco, Inc., 8.63%, 11/15/14 (d) | 370,000 | 381,100 | ||||
Time Warner, Inc., 6.75%, 04/15/11 | 800,000 | 827,275 | ||||
Time Warner, Inc., 6.50%, 11/15/36 | 250,000 | 237,367 | ||||
Viacom, Inc., 6.88%, 04/30/36 | 480,000 | 463,739 | ||||
| 14,261,112 | ||||||
| Consumer Staples 2.4% | ||||||
Altria Group, Inc., 7.00%, 11/04/13 | 250,000 | 265,162 | ||||
Anheuser-Busch Cos., Inc., 5.75%, 01/15/11 | 750,000 | 745,031 | ||||
Aramark Corp., 8.86%, 02/01/15 (a) (b) | 475,000 | 482,125 | ||||
Archer-Daniels-Midland Co., 5.38%, 09/15/35 | 400,000 | 351,448 | ||||
Coca-Cola Enterprises, Inc., 8.50%, 02/01/22 | 500,000 | 611,436 | ||||
Constellation Brand, Inc., 7.25%, 09/01/16 (d) | 200,000 | 195,000 |
The accompanying notes are an integral part of the financial statements .
| 10 | Montgomery Street Income Securities, Inc. |
| Principal Amount ($) (g) | Value ($) | |||||
CVS Caremark Corp., 6.30%, 06/01/37 (callable at 100 on 06/01/12) (f) | 833,000 | 819,946 | ||||
Delhaize America, Inc., 9.00%, 04/15/31 | 450,000 | 543,667 | ||||
Kraft Foods, Inc., 6.25%, 06/01/12 | 500,000 | 508,176 | ||||
Wal-Mart Stores, Inc., 5.25%, 09/01/35 | 250,000 | 218,536 | ||||
| 4,740,527 | ||||||
| Energy 3.3% | ||||||
Anadarko Petroleum Corp., 6.45%, 09/15/36 | 450,000 | 432,822 | ||||
Chesapeake Energy Corp., 7.63%, 07/15/13 | 350,000 | 358,750 | ||||
El Paso Corp., 7.75%, 07/15/11 (a) | 500,000 | 515,000 | ||||
Energipe Y Saelpa, 10.50%, 07/19/13 (a) | 175,000 | 194,168 | ||||
Inergy LP/Inergy Finance Corp., 8.25%, 03/01/16 (d) | 450,000 | 462,375 | ||||
Kinder Morgan Energy Partners LP, 6.50%, 02/01/37 | 260,000 | 250,099 | ||||
ONEOK Partners LP, 6.15%, 10/01/16 | 304,000 | 303,224 | ||||
ONEOK Partners LP, 6.65%, 10/01/36 | 542,000 | 537,577 | ||||
Peabody Energy Corp., 6.88%, 03/15/13 | 400,000 | 398,000 | ||||
Pemex Project Funding Master Trust, 5.75%, 12/15/15 | 696,000 | 682,776 | ||||
Petrohawk Energy Corp., 9.13%, 07/15/13 | 400,000 | 423,000 | ||||
Rochester Gas & Electric Corp., 6.38%, 09/01/33 (j) | 1,600,000 | 1,663,405 | ||||
Transcontinental Gas Pipe Line Corp., | 250,000 | 250,626 | ||||
| 6,471,822 | ||||||
| Financials 30.7% | ||||||
AMBAC Financial Group, Inc., 6.15%, 02/15/37 (d) | 158,000 | 141,610 | ||||
American General Institutional Capital, | 250,000 | 284,344 | ||||
Ameriprise Financial, Inc., | 1,015,000 | 1,057,150 | ||||
AXA SA, | 4,943,000 | 4,595,047 | ||||
Capital One Capital IV, 6.75%, 02/17/37 (d) | 918,000 | 844,655 | ||||
CIT Group, Inc., | 980,000 | 892,508 | ||||
Citigroup, Inc., 6.00%, 10/31/33 | 500,000 | 481,411 | ||||
Comerica Capital Trust, 6.58%, 02/20/37 (d) | 1,732,000 | 1,620,785 | ||||
Countrywide Financial Corp., 5.80%, 06/07/12 | 970,000 | 963,167 | ||||
Dow Jones CDX North America High Yield Trust, 8.38%, 12/29/11 (a) (c) | 12,000,000 | 11,925,000 | ||||
Fifth Third Capital Trust, | 990,000 | 956,931 | ||||
Financial Security Assurance Holdings Ltd., | 1,012,000 | 941,024 |
The accompanying notes are an integral part of the financial statements .
| Montgomery Street Income Securities, Inc. | 11 |
| Principal Amount ($) (g) | Value ($) | |||||
Ford Motor Credit Co., 7.38%, 02/01/11 | 500,000 | 488,478 | ||||
Ford Motor Credit Co., 9.81%, 04/15/12 (b) (d) | 450,000 | 482,270 | ||||
GE Business Loan Trust, Interest Only, | 35,480,000 | 379,281 | ||||
GE Business Loan Trust, 6.32%, 05/15/34 (a) (b) | 476,125 | 476,120 | ||||
General Motors Acceptance Corp., 6.88%, 09/15/11 | 460,000 | 452,481 | ||||
General Motors Acceptance Corp., 6.88%, 08/28/12 | 415,000 | 405,589 | ||||
General Motors Acceptance Corp., 8.00%, 11/01/31 | 900,000 | 920,323 | ||||
Genworth Financial, Inc., | 779,000 | 738,346 | ||||
Goldman Sachs Capital II, | 875,000 | 853,952 | ||||
Goldman Sachs Group, Inc., 6.45%, 05/01/36 | 1,650,000 | 1,620,158 | ||||
HBOS Plc, | 600,000 | 562,719 | ||||
HSBC Bank USA, 5.63%, 08/15/35 | 315,000 | 289,449 | ||||
HSBC Holdings Plc, 6.50%, 05/02/36 | 500,000 | 513,836 | ||||
ILFC E-Capital Trust II, | 4,490,000 | 4,379,277 | ||||
Janus Capital Group, Inc., 6.70%, 06/15/17 | 840,000 | 847,246 | ||||
JPMorgan Chase Capital XV, 5.88%, 03/15/35 | 205,000 | 187,081 | ||||
JPMorgan Chase Capital XX, 6.55%, 09/29/36 (d) | 3,555,000 | 3,423,629 | ||||
JSG Funding Plc, 9.63%, 10/01/12 | 42,000 | 43,995 | ||||
Kazkommerts International Bank, 8.00%, 11/03/15 (a) | 380,000 | 369,094 | ||||
KFW International Finance, Inc., 1.75%, 03/23/10 | JPY | 117,000,000 | 964,285 | |||
Landwirtschaftliche Rentenbank., 0.65%, 09/30/08 | JPY | 113,000,000 | 914,729 | |||
Mellon Capital IV, | 570,000 | 575,141 | ||||
MetLife, Inc., 6.40%, 12/15/36 | 4,842,000 | 4,485,396 | ||||
Mizuho Capital Investment 1 Ltd., | 600,000 | 593,270 | ||||
Mizuho JGB Investment LLC, | 2,000,000 | 2,079,042 | ||||
Morgan Stanley, 5.55%, 04/27/17 | 500,000 | 479,707 | ||||
Northern Rock Plc, | 513,000 | 515,559 | ||||
Northgroup Preferred Capital Corp., | 515,000 | 499,205 | ||||
PNC Preferred Funding Trust I, 6.11%, 12/31/49 (a) (b) | 400,000 | 390,138 | ||||
Progressive Corp., | 675,000 | 670,862 | ||||
Rabobank Nederland, 6.50%, 03/18/10 (b) | AUD | 1,160,000 | 983,677 | |||
The accompanying notes are an integral part of the financial statements .
| 12 | Montgomery Street Income Securities, Inc. |
| Principal Amount ($) (g) | Value ($) | |||||
SMFG Preferred Capital Ltd., | 793,000 | 762,874 | ||||
State Street Capital Trust, | 670,000 | 671,978 | ||||
SunTrust Capital VIII, | 814,000 | 745,425 | ||||
TNK-BP Finance SA, 7.50%, 07/18/16 (a) | 600,000 | 618,600 | ||||
USB Realty Investors, | 700,000 | 686,631 | ||||
ZFS Finance USA Trust V, | 582,000 | 562,876 | ||||
| 59,336,351 | ||||||
| Health Care 1.3% | ||||||
Aetna, Inc., 6.63%, 06/15/36 | 560,000 | 569,866 | ||||
Cigna Corp., 6.15%, 11/15/36 | 184,000 | 175,270 | ||||
HCA, Inc., 7.88%, 02/01/11 | 500,000 | 507,500 | ||||
HCA, Inc., 9.25%, 11/15/16 (a) | 330,000 | 351,450 | ||||
Wyeth, 6.50%, 02/01/34 | 400,000 | 411,278 | ||||
Wyeth, 5.95%, 04/01/37 | 470,000 | 449,170 | ||||
| 2,464,534 | ||||||
| Industrials 0.9% | ||||||
Bombardier, Inc., 6.30%, 05/01/14 (a) | 1,060,000 | 1,007,000 | ||||
Honeywell International, Inc., 5.70%, 03/15/36 | 250,000 | 230,801 | ||||
Systems 2001 Asset Trust LLC, 7.16%, 12/15/11 (k) | 288,416 | 296,208 | ||||
United Rentals, Inc., 6.50%, 02/15/12 | 300,000 | 294,749 | ||||
| 1,828,758 | ||||||
| Information Technology 1.5% | ||||||
Advanced Micro Devices, Inc., 7.75%, 11/01/12 | 345,000 | 325,163 | ||||
CompuCom Systems, Inc., 12.00%, 11/01/14 (a) | 500,000 | 537,500 | ||||
Freescale Semiconductor, Inc., | 405,000 | 380,700 | ||||
International Business Machines Corp., 8.38%, 11/01/19 | 250,000 | 302,383 | ||||
Nortel Networks Corp., 10.75%, 07/15/16 (a) | 1,000,000 | 1,105,000 | ||||
Spansion LLC, 8.49%, 06/01/13 (a) (b) | 345,000 | 344,568 | ||||
| 2,995,314 | ||||||
| Materials 2.1% | ||||||
Abitibi-Consolidated, Inc., 8.86%, 06/15/11 (b) | 500,000 | 470,000 | ||||
Bowater, Inc., 8.36%, 03/15/10 (b) | 500,000 | 495,000 | ||||
Chaparral Steel Co., 10.00%, 07/15/13 | 450,000 | 491,063 | ||||
Equistar Chemicals LP, 8.75%, 02/15/09 | 850,000 | 879,750 | ||||
The accompanying notes are an integral part of the financial statements .
| Montgomery Street Income Securities, Inc. | 13 |
| Principal Amount ($) (g) | Value ($) | |||||
Georgia-Pacific Corp., 7.00%, 01/15/15 (a) | 355,000 | 341,688 | ||||
Huntsman International LLC, 7.88%, 11/15/14 | 400,000 | 428,500 | ||||
MHP SA, 10.25%, 11/30/11 (a) | 200,000 | 207,760 | ||||
Momentive Performance Materials, Inc., 9.75%, 12/01/14 (a) | 335,000 | 338,350 | ||||
Newmont Mining Corp., 5.88%, 04/01/35 | 395,000 | 349,615 | ||||
Pliant Corp., 11.63%, 06/15/09 | 5 | 5 | ||||
| 4,001,731 | ||||||
| Telecommunication Services 4.3% | ||||||
AT&T Inc., 6.15%, 09/15/34 | 500,000 | 479,405 | ||||
Citizens Communications Co., 9.00%, 08/15/31 | 400,000 | 412,000 | ||||
Insight Midwest LP/Insight Capital, Inc., | 54,000 | 54,405 | ||||
Intelsat Bermuda Ltd., 9.25%, 06/15/16 | 255,000 | 270,938 | ||||
Level 3 Financing, Inc., 12.25%, 03/15/13 | 500,000 | 573,750 | ||||
Qwest Communications International, Inc., | 800,000 | 810,000 | ||||
Sprint Capital Corp., 7.63%, 01/30/11 | 1,000,000 | 1,052,110 | ||||
Sprint Capital Corp., 8.75%, 03/15/32 | 400,000 | 449,252 | ||||
Telecom Italia Capital SA, 4.00%, 01/15/10 | 360,000 | 346,077 | ||||
Telecom Italia Capital SA, 5.25%, 11/15/13 | 330,000 | 314,448 | ||||
Telecom Italia Capital SA, 4.95%, 09/30/14 | 365,000 | 338,182 | ||||
Telecom Italia Capital SA, 7.20%, 07/18/36 | 530,000 | 544,873 | ||||
Verizon Global Funding Corp., 7.75%, 12/01/30 | 195,000 | 218,432 | ||||
Verizon New Jersey, Inc., 5.88%, 01/17/12 | 542,000 | 544,014 | ||||
Vodafone Group Plc, 6.15%, 02/27/37 | 1,268,000 | 1,179,608 | ||||
Windstream Corp., 8.63%, 08/01/16 | 670,000 | 708,524 | ||||
| 8,296,018 | ||||||
| Utilities 4.2% | ||||||
American Electric Power Co., Inc., 5.38%, 03/15/10 | 1,000,000 | 996,748 | ||||
FirstEnergy Corp., 6.45%, 11/15/11 | 500,000 | 512,707 | ||||
NiSource Finance Corp., 7.88%, 11/15/10 | 1,500,000 | 1,597,175 | ||||
Northern States Power Co., 6.25%, 06/01/36 | 400,000 | 406,816 | ||||
PSI Energy, Inc., 8.85%, 01/15/22 | 1,225,000 | 1,528,431 | ||||
Puget Energy, Inc., 7.02%, 12/01/27 | 1,000,000 | 1,099,865 | ||||
SPI Electricity & Gas Australia Holdings Pty Ltd., 6.15%, 11/15/13 (k) | 2,000,000 | 2,022,328 | ||||
| 8,164,070 | ||||||
Total Corporate Bonds (Cost $115,310,314) | 112,560,237 | |||||
The accompanying notes are an integral part of the financial statements .
| 14 | Montgomery Street Income Securities, Inc. |
| Principal Amount ($) (g) | Value ($) | |||||
Non-U.S. Government Agency Asset-Backed Securities 13.4% | ||||||
Banc of America Mortgage Securities, | 1,065,000 | 1,036,018 | ||||
Bayview Commercial Asset Trust, Interest Only, 1.30%, 07/25/37 (a) (b) (i) | 6,754,000 | 967,722 | ||||
Bayview Financial Acquisition Trust, | 800,000 | 806,704 | ||||
BB&T Capital Trust I, 6.82%, 06/12/57 (callable at 100 on 06/12/37) (d) (f) | 1,125,000 | 1,115,989 | ||||
Capital Auto Receivables Asset Trust, | 150,000 | 150,223 | ||||
Capital Auto Receivables Asset Trust, | 200,000 | 201,181 | ||||
CBA Commercial LLC, Interest Only, | 9,504,289 | 950,429 | ||||
Citigroup Mortgage Loan Trust, Inc., 8.25%, 08/25/34 | 685,655 | 692,190 | ||||
Citigroup Mortgage Loan Trust, Inc., | 225,000 | 160,734 | ||||
Countrywide Alternative Loan Trust, | 463,051 | 459,643 | ||||
Countrywide Alternative Loan Trust, | 323,246 | 323,623 | ||||
Countrywide Alternative Loan Trust, | 792,136 | 794,012 | ||||
Ford Credit Auto Owner Trust, 6.89%, 05/15/13 (a) (b) | 1,060,000 | 1,055,812 | ||||
GMAC Commercial Mortgage Securities Corp., 5.75%, 10/25/36 (b) | 620,000 | 618,759 | ||||
Greenwich Capital Commercial Funding Corp., 6.52%, 11/05/21 (a) (b) (i) | 200,001 | 193,595 | ||||
Greenwich Capital Commercial Funding Corp., 6.72%, 11/05/22 (a) (b) (i) | 190,001 | 185,310 | ||||
Home Equity Asset Trust, 6.27%, 07/25/37 (b) (i) | 725,000 | 734,439 | ||||
Lehman Brothers Small Balance Commercial, | 255,000 | 249,556 | ||||
Marlin Leasing Receivables LLC, | 660,000 | 656,753 | ||||
Nationstar NIM Trust, 9.97%, 03/25/37 (a) (b) (i) | 379,381 | 379,381 | ||||
Option One Mortgage Loan Trust (M6), | 725,000 | 711,150 | ||||
Option One Mortgage Loan Trust (M7), | 500,000 | 440,168 | ||||
Option One Mortgage Loan Trust (M8), | 475,000 | 360,359 | ||||
The accompanying notes are an integral part of the financial statements .
| Montgomery Street Income Securities, Inc. | 15 |
| Principal Amount ($) (g) | Value ($) | |||||
Prudential Securities Secured Financing Corp., | 884,981 | 903,596 | ||||
Regions Financing Trust II, 6.63%, 05/15/47 (callable at 100 on 05/15/27) (f) | 470,000 | 449,586 | ||||
Renaissance Home Equity Loan Trust, | 260,000 | 240,866 | ||||
Renaissance Home Equity Loan Trust, | 1,000,000 | 820,000 | ||||
Residential Asset Securitization Trust, | 2,500,000 | 2,366,814 | ||||
Washington Mutual, Inc., 5.12%, 12/25/35 | 1,320,000 | 1,294,421 | ||||
Washington Mutual Commercial Mortgage Securities Trust, 6.14%, 03/23/45 (a) (b) | 890,000 | 890,640 | ||||
Wells Fargo Mortgage Backed Securities Trust, 5.00%, 03/25/21 | 2,142,484 | 2,057,454 | ||||
Wells Fargo Mortgage Backed Securities Trust, 4.11%, 06/25/35 (b) | 1,852,399 | 1,816,847 | ||||
Wells Fargo Mortgage Backed Securities Trust, 5.24%, 04/25/36 (b) | 1,893,716 | 1,877,871 | ||||
Total Non-U.S. Government Agency Asset-Backed Securities | 25,961,845 | |||||
Government and Agency Obligations 27.1% | ||||||
| Government Securities 3.9% | ||||||
| Sovereign 3.3% | ||||||
Germany Government International Bond, | EUR | 2,162,000 | 2,895,269 | |||
New South Wales Treasury Corp., 8.00%, 03/01/08 (j) | AUD | 1,120,000 | 958,627 | |||
Queensland Treasury Corp., 6.00%, 07/14/09 | 1,135,000 | 948,397 | ||||
Argentina Government International Bond, | 440,000 | 399,705 | ||||
Republic of Italy, 3.80%, 03/27/08 | JPY | 113,000,000 | 936,982 | |||
Turkey Government International Bond, | 200,000 | 202,250 | ||||
| 6,341,230 | ||||||
| U.S. Treasury Securities 0.6% | ||||||
U.S. Treasury Note, 4.75%, 05/31/12 (d) | 1,132,000 | 1,123,157 | ||||
Total Government Securities (Cost $7,456,915) | 7,464,387 | |||||
The accompanying notes are an integral part of the financial statements .
| 16 | Montgomery Street Income Securities, Inc. |
| Principal Amount ($) (g) | Value ($) | |||||
U.S. Government Agency Securities 23.2% | ||||||
| Federal Farm Credit Bank 0.1% | ||||||
Federal Farm Credit Bank, | 170,000 | 181,949 | ||||
| Federal Home Loan Mortgage Corp. 5.4% | ||||||
Federal Home Loan Mortgage Corp., 5.50%, 12/15/16 | 590,000 | 585,521 | ||||
Federal Home Loan Mortgage Corp., 5.00%, 05/15/23 | 1,540,000 | 1,531,794 | ||||
Federal Home Loan Mortgage Corp., 4.50%, 02/15/26 | 717,319 | 709,327 | ||||
Federal Home Loan Mortgage Corp., 5.50%, 07/15/27 | 591,804 | 590,237 | ||||
Federal Home Loan Mortgage Corp., 6.00%, 05/15/30 | 790,000 | 790,578 | ||||
Federal Home Loan Mortgage Corp., 4.50%, 04/15/32 | 1,375,000 | 1,277,430 | ||||
Federal Home Loan Mortgage Corp., 4.50%, 07/15/32 | 410,000 | 381,335 | ||||
Federal Home Loan Mortgage Corp., 6.00%, 09/15/32 | 1,500,000 | 1,516,917 | ||||
Federal Home Loan Mortgage Corp., 5.00%, 12/15/32 | 895,000 | 849,238 | ||||
Federal Home Loan Mortgage Corp., 5.00%, 10/15/33 | 1,175,000 | 1,110,161 | ||||
Federal Home Loan Mortgage Corp., 5.00%, 08/15/34 | 1,245,000 | 1,172,622 | ||||
| 10,515,160 | ||||||
| Federal National Mortgage Association 15.9% | ||||||
Federal National Mortgage Association, | 72,138 | 73,566 | ||||
Federal National Mortgage Association, | 845,896 | 841,730 | ||||
Federal National Mortgage Association, | 204,193 | 208,496 | ||||
Federal National Mortgage Association, | 551,491 | 552,824 | ||||
Federal National Mortgage Association, | 670,537 | 625,360 | ||||
Federal National Mortgage Association, | 2,179,475 | 2,126,967 | ||||
Federal National Mortgage Association, | 4,234,061 | 4,438,062 | ||||
Federal National Mortgage Association, | 295,000 | 277,520 | ||||
Federal National Mortgage Association, | 1,060,000 | 1,001,341 | ||||
Federal National Mortgage Association, | 864,822 | 853,902 | ||||
Federal National Mortgage Association, | 3,318,992 | 3,408,390 | ||||
Federal National Mortgage Association, | 3,395,907 | 3,347,317 | ||||
The accompanying notes are an integral part of the financial statements .
| Montgomery Street Income Securities, Inc. | 17 |
| Principal Amount ($) (g) | Value ($) | ||||||
Federal National Mortgage Association, | 4,510,000 | 4,460,670 | |||||
Federal National Mortgage Association, | 7,632,019 | 7,704,444 | |||||
Federal National Mortgage Association, | 595,036 | 592,439 | |||||
| 30,513,028 | |||||||
| Government National Mortgage Association 0.5% | |||||||
Government National Mortgage Association, | 1,003,767 | 1,022,872 | |||||
| Small Business Administration Participation Certificates 1.3% | |||||||
Small Business Administration Participation Certificates, | 435,638 | 431,431 | |||||
Small Business Administration Participation Certificates, | 942,879 | 921,759 | |||||
Small Business Administration Participation Certificates, | 1,266,999 | 1,236,880 | |||||
| 2,590,070 | |||||||
Total U.S. Government Agency Securities | 44,823,079 | ||||||
Total Government and Agency Obligations | 52,287,466 | ||||||
Short-Term Investments 7.7% | |||||||
| Commercial Paper 2.3% | |||||||
International Business Machines Corp., | 2,260,000 | 2,259,328 | |||||
UBS Finance LLC (Delaware), 5.25%, 07/02/07 | 2,280,000 | 2,279,661 | |||||
| 4,538,989 | |||||||
| Securities Lending Collateral 5.3% | |||||||
Mellon GSL Delaware Business Trust Collateral Fund, 5.33% | 10,256,075 | 10,256,075 | |||||
| U.S. Treasury Securities 0.1% | |||||||
U.S. Treasury Bill, 4.61%, 09/20/07 (h) | 200,000 | 197,916 | |||||
Total Short Term Investments (Cost $14,993,017) | 14,992,980 | ||||||
Total Investments 106.4% (Cost $209,382,902) | 205,802,528 | ||||||
Other Assets and Liabilities, Net (6.4)% | (12,296,241 | ) | |||||
Total Net Assets 100% | 193,506,287 | ||||||
The accompanying notes are an integral part of the financial statements .
| 18 | Montgomery Street Income Securities, Inc. |
Notes to the Schedule of Investments
| (a) | 144A: Security is exempt from registration under Rule 144A of the Securities Act of 1933. These securities may be resold in transactions exempt from registration, normally to qualified institutional buyers. The Fund has deemed this security to be liquid based on procedures approved by the Board of Directors. As of June 30, 2007 the aggregate value of 144A securities was $44,808,420 (23.1% of net assets). |
| (b) | Floating rate notes are securities whose yields vary with a designated market index or market rate, such as the coupon-equivalent of the U.S. Treasury bill rate. These securities are shown at their current rate as of June 30, 2007. |
| (c) | Certificates of beneficial interest in a Trust that has entered into a Repurchase Agreement and Credit Default Swap Agreements to track the Dow Jones CDX North America High Yield Index (BBB/B+). |
| (d) | All or portion of the security has been loaned. |
| (e) | Perpetual maturity security. Maturity date listed is the first call date; security is subject to call at 100 thereafter. Interest rate is fixed until the first call date and variable thereafter. |
| (f) | Interest rate is fixed until stated call date and variable thereafter. |
| (g) | Principal amounts are listed in United States Dollars unless otherwise noted. |
| (h) | All or a portion of the security pledged as collateral for open futures contracts. |
| (i) | Security fair valued in good faith in accordance with the procedures established by the Board of Directors. As of June 30, 2007 the market value of fair valued securities was $13,398,777, which is 6.9% of net assets. |
| (j) | Illiquid Security: At June 30, 2007 the total value of illiquid securities was $2,779,357 (1.4% of net assets). |
| (k) | 144A Illiquid Security: Security is exempt from registration under Rule 144A of the Securities Act of 1933. These securities are restricted and may be resold only in transactions exempt from registration, normally to qualified institutional buyers. As of June 30, 2007 the aggregate value of 144A Illiquid Securities was $4,228,203 (2.2% of net assets). |
Abbreviations:
AUD - Australian Dollar
EUR - - European Currency Unit (Euro)
JPY - Japanese Yen
TBA - To Be Announced
USD - United States Dollar
| Forward Foreign Currency Contracts Purchased/Sold | Settlement Date | Notional Amount | Currency Value | Unrealized Gain/(Loss) | |||||||||||
| USD/JPY | 8/7/2007 | (235,392,000 | ) | JPY | $ | (1,919,790 | ) | $ | (589 | ) | |||||
| Futures | Notional Amount | Unrealized Appreciation (Depreciation) | |||||||
| U.S. Treasury Note Future, 2-Year, 6.00% Expiration September 2007 | 41,400,000 | USD | $ | (65,170 | ) | ||||
| U.S. Treasury Note Future, 5-Year, 6.00% Expiration September 2007 | 37,800,000 | USD | (256,615 | ) | |||||
| U.S. Treasury Note Future, 10-Year, 6.00% Expiration September 2007 | (3,100,000 | ) | USD | (24,697 | ) | ||||
| U.S. Treasury Bond Future, 20-Year, 6.00% Expiration September 2007 | (24,200,000 | ) | USD | 349,056 | |||||
| $ | 2,574 | ||||||||
The accompanying notes are an integral part of the financial statements .
| Montgomery Street Income Securities, Inc. | 19 |
Statement of Assets and Liabilities as of June 30, 2007 (Unaudited) |
| |||
| Assets | ||||
| Investments in securities, at value (a) (cost $209,382,902) | $ | 205,802,528 | ||
| Cash | 129,813 | |||
| Receivables: | ||||
Interest | 1,954,683 | |||
Investment securities sold | 598,469 | |||
Variation margin | 179,578 | |||
| Other assets | 60,995 | |||
| Total assets | 208,726,066 | |||
| Liabilities | ||||
| Accrued management and investment advisory fee | 121,571 | |||
| Accrued administrative fee | 35,891 | |||
| Payables: | ||||
Forward foreign currency contracts | 589 | |||
Investment securities purchased | 4,452,178 | |||
Variation margin | 249,938 | |||
Return of collateral for securities on loan | 10,256,075 | |||
| Other liabilities | 103,537 | |||
| Total liabilities | 15,219,779 | |||
| Net assets, at value | $ | 193,506,287 | ||
| Net Assets | ||||
| Net assets consist of: | ||||
| Paid-in capital | 202,559,904 | |||
| Undistributed investment income | 2,723,282 | |||
| Net unrealized depreciation on investments | (3,578,344 | ) | ||
| Accumulated net realized loss | (8,198,555 | ) | ||
| Net assets, at value | $ | 193,506,287 | ||
| Net Asset Value per share ($193,506,287 / 10,372,609 shares of common stock outstanding, $.01 par value, 30,000,000 shares authorized) | $ | 18.66 | ||
| (a) | Includes value of securities on loan of $10,027,276 |
The accompanying notes are an integral part of the financial statements .
| 20 | Montgomery Street Income Securities, Inc. |
Statement of Operations for the six months ended June 30, 2007 (Unaudited) |
| |||
| Investment Income | ||||
| Income: | ||||
| Interest | $ | 6,615,059 | ||
| Securities lending income | 23,477 | |||
| Total Income | 6,188,536 | |||
| Expenses: | ||||
| Management and investment advisory fee | 243,265 | |||
| Administrative fee | 219,647 | |||
| Directors’ fees and expenses | 49,834 | |||
| Shareholder reporting | 10,141 | |||
| Legal | 37,788 | |||
| Auditing | 23,587 | |||
| Insurance | 30,969 | |||
| Shareholder services | 11,603 | |||
| NYSE listing fee | 12,717 | |||
| Custodian fees | 4,591 | |||
| Other | 7,783 | |||
| Total expenses | 651,925 | |||
| Net investment income | 5,536,611 | |||
| Realized and Unrealized Gain (Loss) on Investment Transactions | ||||
| Net realized gain from investment transactions | 443,082 | |||
| Net realized (loss) from foreign currency related items | (162,360 | ) | ||
| Net change in unrealized (depreciation) during the period on investments | (4,407,142 | ) | ||
| Net loss on investment transactions | (4,126,420 | ) | ||
| Net increase in net assets resulting from operations | $ | 1,410,191 | ||
The accompanying notes are an integral part of the financial statements .
| Montgomery Street Income Securities, Inc. | 21 |
Statements of Changes in Net Assets (Unaudited) |
| |||||||
| Increase (Decrease) in Net Assets | Six Months Ended June 30, 2007 | Year Ended December 31, 2006 | ||||||
| Operations: | ||||||||
| Net investment income | $ | 5,536,611 | $ | 9,437,361 | ||||
| Net realized gain on investment transactions and foreign currency related items | 280,722 | (2,473,393 | ) | |||||
| Net change in unrealized appreciation (depreciation) during the period on investment transactions | (4,407,142 | ) | 2,024,170 | |||||
| Net increase in net assets resulting from operations | 1,410,191 | 8,988,138 | ||||||
| Distributions to shareholders from net investment income | (3,008,809 | ) | (10,892,738 | ) | ||||
| Fund share transactions: | ||||||||
| Reinvestment of distributions | 202,568 | 736,288 | ||||||
| Cost of shares repurchased | (420,073 | ) | (783,964 | ) | ||||
| Net decrease in net assets from Fund share transactions | (217,505 | ) | (47,676 | ) | ||||
| Decrease in net assets | (1,816,123 | ) | (1,952,276 | ) | ||||
| Net assets at beginning of period | 195,322,410 | 197,274,686 | ||||||
| Net assets at end of period (including undistributed net investment income of $2,723,282 and $145,579, respectively) | $ | 193,506,287 | $ | 195,322,410 | ||||
| Other Information | ||||||||
| Shares outstanding at beginning of period | 10,384,967 | 10,387,297 | ||||||
| Shares issued to shareholders in reinvestment of distributions | 11,642 | 43,670 | ||||||
| Shares repurchased | (24,000 | ) | (46,000 | ) | ||||
| Net decrease in Fund shares | (12,358 | ) | (2,330 | ) | ||||
| Shares outstanding at end of period | 10,372,609 | 10,384,967 | ||||||
The accompanying notes are an integral part of the financial statements .
| 22 | Montgomery Street Income Securities, Inc. |
Financial Highlights (Unaudited) |
| |||||||||||||||||||||||
| Years ended December 31, | 2007a | 2006 | 2005 | 2004 | 2003 | 2002 | ||||||||||||||||||
| Selected Per Share Data | ||||||||||||||||||||||||
| Net asset value, beginning of period | $ | 18.81 | $ | 18.99 | $ | 19.62 | $ | 19.64 | $ | 19.43 | $ | 19.00 | ||||||||||||
| Income from investment operations: | ||||||||||||||||||||||||
Incomeb | 0.60 | 1.03 | 1.14 | 1.18 | 1.20 | 1.36 | ||||||||||||||||||
Operating expensesb | (0.06 | ) | (0.13 | ) | (0.14 | ) | (0.14 | ) | (0.12 | ) | (0.14 | ) | ||||||||||||
Net investment incomeb | 0.54 | 0.90 | 1.00 | 1.04 | 1.08 | 1.22 | ||||||||||||||||||
Net realized and unrealized gain (loss) on investment transactions | (0.40 | ) | (0.03 | ) | (0.49 | ) | 0.17 | 0.42 | 0.54 | |||||||||||||||
Total from investment operations | 0.14 | 0.87 | 0.51 | 1.21 | 1.50 | 1.76 | ||||||||||||||||||
| Less distributions from: | ||||||||||||||||||||||||
Net investment income | (0.29 | ) | (1.05 | ) | (1.14 | ) | (1.23 | ) | (1.29 | ) | (1.33 | ) | ||||||||||||
| Net asset value, end of period | $ | 18.66 | $ | 18.81 | $ | 18.99 | $ | 19.62 | $ | 19.64 | $ | 19.43 | ||||||||||||
| Per share market value, end of period | $ | 17.31 | $ | 17.28 | $ | 16.91 | $ | 18.36 | $ | 18.55 | $ | 19.02 | ||||||||||||
| Closing price range on New York Stock Exchange for each share of Common Stock outstanding during the period (Unaudited): | ||||||||||||||||||||||||
High ($) | 17.80 | 17.57 | 18.85 | 19.39 | 20.45 | 19.67 | ||||||||||||||||||
Low ($) | 16.90 | 16.30 | 16.55 | 16.55 | 17.50 | 17.91 | ||||||||||||||||||
| Total Return | ||||||||||||||||||||||||
| Based on market value (%)c | 1.84 | g | 8.70 | (1.69 | ) | 5.82 | 4.53 | 10.12 | ||||||||||||||||
| Based on net asset value (%)c | 0.80 | g | 5.37 | 3.31 | 6.86 | e | 8.22 | 9.71 | ||||||||||||||||
| Ratios to Average Net Assets and Supplemental Data | ||||||||||||||||||||||||
| Net assets, end of period ($ millions) | 194 | 195 | 197 | 204 | 204 | 201 | ||||||||||||||||||
| Ratio of expenses before expense reductions (%) | 0.67 | f | 0.70 | 0.74 | 0.75 | 0.63 | 0.72 | |||||||||||||||||
| Ratio of expenses after expense reductions (%) | 0.67 | f | 0.70 | 0.74 | 0.72 | 0.63 | 0.72 | |||||||||||||||||
| Ratio of net investment income (%) | 5.68 | f | 4.78 | 5.11 | 5.26 | 5.47 | 6.36 | |||||||||||||||||
| Portfolio turnover rate (%)d | 64g | 199 | 157 | 149 | 160 | 259 | ||||||||||||||||||
The accompanying notes are an integral part of the financial statements .
| Montgomery Street Income Securities, Inc. | 23 |
| a | For the six months ended June 30, 2007. |
| b | Based on average shares outstanding during the period. |
| c | Total return based on net asset value reflects changes in the Fund’s net asset value during the period. Total return based on market value reflects changes in market value. Each figure includes reinvestment of dividends. These figures will differ depending upon the level of any discount from or premium to net asset value at which the Fund’s shares trade during the period. |
| d | The portfolio turnover rates excluding mortgage dollar roll transactions are stated in the Financial Highlights. The portfolio turnover rates for those periods that had mortgage dollar roll transactions were 349%, 376%, 426%, and 520% for the periods ended, December 31, 2005, 2004, 2003 and 2002, respectively. The Fund had no transactions from mortgage dollar rolls for the six months ended June 30, 2007 or the year ended December 31, 2006. |
| e | Total return would have been lower had certain expenses not been reduced. |
| f | Annualized |
| g | Not annualized |
The accompanying notes are an integral part of the financial statements .
| 24 | Montgomery Street Income Securities, Inc. |
Notes to Financial Statements (Unaudited)
A. Significant Accounting Policies
Montgomery Street Income Securities, Inc. (the “Fund”) is registered under the Investment Company Act of 1940, as amended (the “1940 Act”), as a closed-end, diversified management investment company.
The Fund’s financial statements are prepared in accordance with accounting principles generally accepted in the United States of America which require the use of management estimates. Actual results could differ from those estimates. The policies described below are followed consistently by the Fund in the preparation of its financial statements.
Security Valuation. Investments are stated at value determined as of the close of regular trading on the New York Stock Exchange on each day the exchange is open for trading. Debt securities are valued by independent pricing services approved by, or at the direction of, the Board of Directors of the Fund. Such services may use various pricing techniques which take into account appropriate factors such as yield, quality, coupon rate, maturity, type of issue, trading characteristics and other data, as well as broker quotes. If the pricing services are unable to provide valuations, the securities are valued at the most recent bid quotation or evaluated price, as applicable, obtained from a broker/dealer. Fixed income securities purchased with an original or remaining maturity of sixty days or less, maturing at par, are valued at amortized cost. Securities and other assets for which market quotations are not readily available or for which the above valuation procedures are deemed not to reflect fair value are valued in a manner that is intended to reflect their fair value as determined in accordance with procedures approved by the Board of Directors.
Repurchase Agreements. The Fund may enter into repurchase agreements with certain banks and broker/dealers whereby the Fund, through its custodian or sub-custodian bank, receives delivery of the underlying securities, the amount of which at the time of purchase and each subsequent business day is required to be maintained at such a level that the collateral’s market value is at least equal to the principal amount of the repurchase price plus accrued interest. The custodian or agent bank holds the collateral in a separate account until the agreement matures. If the counterparty defaults and the value of the collateral declines or if bankruptcy proceedings are commenced with respect to the counterparty, realization of the collateral by the Fund may be delayed or limited. There were no repurchase agreements outstanding at June 30, 2007.
When-Issued/Delayed Delivery Securities. The Fund may purchase securities with delivery or payment to occur at a later date beyond the normal settlement period. At the time the Fund enters into a commitment to purchase a security, the transaction is recorded and the value of the security is reflected in the net asset value. The price of such security and the date when the security will be delivered and paid for are fixed at
| Montgomery Street Income Securities, Inc. | 25 |
the time the transaction is negotiated. The value of the security may vary with market fluctuations. No interest accrues to the Fund until settlement of the trade takes place.
Certain risks may arise upon entering into when-issued or delayed delivery securities from the potential inability of counterparties to meet the terms of their contracts or if the issuer does not issue the securities due to political, economic, or other factors. Additionally, losses may arise due to changes in the value of the underlying securities.
Securities Lending. The Fund has entered into a securities lending arrangement with its custodian. Under the terms of the agreement, the Fund receives a fee equal to a percentage of the net income generated by the collateral held during each lending transaction. The custodian is authorized to loan securities on behalf of the Fund to approved borrowers and is required to maintain collateral at least equal in value to the value of the securities loaned. Cash collateral is invested by the custodian in the Mellon GSL Delaware Business Trust Collateral Fund (a pooled investment fund). In the event of bankruptcy or other default of the borrower, the Fund could experience delays in liquidating the loan collateral or recovering the loaned securities and incur expenses related to enforcing its rights. In addition, there could be a decline in the value of the collateral or in the fair value of the securities loaned while the Fund seeks to enforce its rights thereto and the Fund could experience subnormal levels of income or lack of access to income during that period. The Fund bears the risk of any deficiency in the amount of collateral available for return to a borrower due to a loss in an approved investment.
Loan Participations/Assignments. The Fund may invest in U.S. dollar-denominated fixed and floating rate loans (“Loans”) arranged through private negotiations between a foreign sovereign entity and one or more financial institutions (“Lenders”). The Fund invests in such Loans in the form of participations in Loans (“Participations”) or assignments of all or a portion of loans from third parties. Participations typically result in the Fund having a contractual relationship only with the Lender, not with the sovereign borrower. The Fund has the right to receive payments of principal, interest and any fees to which it is entitled from the Lender selling the Participation and only upon receipt by the Lender of the payments from the borrower. In connection with purchasing Participations, the Fund generally has no right to enforce compliance by the borrower with the terms of the loan agreement relating to the Loan, nor any rights of set-off against the borrower, and the Fund will not benefit directly from any collateral supporting the Loan in which it has purchased the Participation. As a result, the Fund assumes the credit risk of both the borrower and the Lender that is selling the Participation. At June 30, 2007, the Fund held no Participations.
| 26 | Montgomery Street Income Securities, Inc. |
Federal Income Taxes. The Fund’s policy is to comply with the requirements of the Internal Revenue Code, as amended, which are applicable to regulated investment companies and to distribute substantially all of its taxable income to its stockholders. Accordingly, the Fund has paid no federal income taxes and no federal income tax provision is required.
Recent Accounting Pronouncements. On July 13, 2006, the Financial Accounting Standards Board (“FASB”) released FASB Interpretation No. 48 “Accounting for Uncertainty in Income Taxes” (“FIN 48”). FIN 48 provides guidance for how uncertain tax positions should be recognized, measured, presented and disclosed in the financial statements. FIN 48 requires the evaluation of tax positions taken or expected to be taken in the course of preparing the Fund’s tax returns to determine whether the tax positions are “more-likely-than-not” of being sustained by the applicable tax authority. Tax positions not deemed to meet the more-likely-than-not threshold would be recorded as a tax benefit or expense in the current year. FIN 48 requires that management evaluate the tax positions taken in returns that remain subject to examination by the Fund’s major tax jurisdictions. At June 30, 2007, returns subject to examination include those filed for the period ended December 31, 2004 and thereafter. Management completed an evaluation of the Fund’s tax positions for the applicable periods as of June 30, 2007. Based on that evaluation, management concluded that the adoption of FIN 48 does not materially affect the Fund’s financial statements.
In September 2006, the FASB issued Statement on Financial Accounting Standards (“SFAS”) No. 157, “Fair Value Measurements.” This standard establishes a single authoritative definition of fair value, sets out a framework for measuring fair value and requires additional disclosures about fair value measurements. SFAS No. 157 applies to fair value measurements already required or permitted by existing standards. SFAS No. 157 is effective for financial statements issued for fiscal years beginning after November 15, 2007. The changes to current generally accepted accounting principles from the application of this Statement relate to the definition of fair value, the methods used to measure fair value, and the expanded disclosures about fair value measurements. Management is in the process of analyzing the impact of SFAS No. 157. The Fund does not believe the adoption of SFAS No. 157 will impact the financial statement amounts, however, additional disclosures may be required about the inputs used to develop the measurements and the effect of certain of the measurements on changes in net assets for the period.
Distribution of Income and Gains. Distributions of net investment income are made quarterly. Net realized gains from investment transactions in excess of available capital loss carryforwards, if any, will be distributed to stockholders at least annually. The Fund uses the specific identification method for determining realized gain or loss on investments sold for both financial and federal income tax reporting purposes.
| Montgomery Street Income Securities, Inc. | 27 |
Contingencies. In the normal course of business, the Fund may enter into contracts with service providers that contain general indemnification clauses. The Fund’s maximum exposure under these arrangements is unknown, as this would involve future claims that may be made against the Fund that have not yet been made. However, based on experience to date, the Fund expects any risk of loss to be remote.
Other. Investment transactions are accounted for on a trade date plus one basis for daily net asset value calculations. However, for financial reporting purposes, investment transactions are reported on trade date. Interest income is recorded on the accrual basis. Dividend income is recorded on the ex-dividend date. All premiums and discounts are amortized/accreted for financial reporting purposes.
Forward Foreign Currency Contracts. The Fund may enter into forward foreign currency contracts (“contracts”), generally to hedge foreign currency exposure between trade date and settlement date on security purchases and sales or to minimize foreign currency risk on portfolio securities denominated in foreign currencies. All contracts are marked-to-market daily based on the forward currency exchange rate. The change in market value is recorded as a receivable or payable from forward currency contracts. When a contract is closed, the difference between the value of the contract at the time it was opened and the value at the time it was closed is recorded as net realized gain (loss) on foreign currency related items.
The use of forward foreign currency contracts does not eliminate fluctuations in the underlying prices of the Fund’s portfolio securities, but it does establish a rate of exchange that can be achieved in the future. These contracts involve market risk in excess of the receivable or payable related to foreign currency contracts reflected in the Statement of Assets and Liabilities. Although contracts limit the risk of loss due to a decline in the value of the hedged currency, they also limit any potential gain that might result should the value of the currency increase. Additionally, the Fund could be exposed to the risk of a previously hedged position becoming unhedged if the counterparty to a contract is unable to meet the terms of the contract.
B. Purchases and Sales of Securities
During the six months ended June 30, 2007, purchases and sales of investment securities, excluding U.S. Treasury obligations and short-term investments, aggregated $66,317,314 and $60,835,127, respectively. Purchases and sales of long-term U.S. Treasury obligations aggregated $59,059,153 and $61,003,246, respectively.
C. Related Parties
Investment Advisory Agreement. The Fund and Hartford Investment Management Company (“HIMCO”) entered into an Investment Advisory Agreement whereby the Fund pays HIMCO a quarterly fee equal to the product of (a) one quarter of 0.25%, times (b) the average of the net assets of the Fund on the
| 28 | Montgomery Street Income Securities, Inc. |
last business day of each calendar month of the then ended calendar quarter. For the period January 1, 2007 through June 30, 2007, the fees pursuant to the Investment Advisory Agreement amounted to $243,265, equivalent to an effective annualized rate of 0.25% of the Fund’s average daily net assets.
Accounting and Administration Services Agreement. The Fund has entered into an Accounting and Administration Services Agreement (the “Administration Agreement”) with Jackson Fund Services (“Jackson”). Pursuant to the Administration Agreement, the Fund pays Jackson an annual fee, payable monthly, equal to 0.25% of the value of the net assets of the Fund up to $100 million; 0.20% of the value of the net assets of the Fund from $100 million to $200 million; and 0.15% of the value of the net assets of the Fund over $200 million. For the period January 1, 2007 through June 30, 2007, the fees pursuant to the Administration Agreement amounted to $219,647, equivalent to an effective annualized rate of 0.23% of the Fund’s average daily net assets. Jackson makes individuals available to the Fund to serve as its officers, without compensation from the Fund.
Directors’ Fees and Expenses. The Fund pays each Director retainer fees plus specified amounts for each Board and Committee meeting attended.
D. Federal Income Tax Matters
The timing and characterization of certain income and capital gains distributions are determined in accordance with federal tax regulations, which may differ from accounting principles generally accepted in the United States of America. These differences primarily relate to premium amortization on debt securities, investments in mortgage-backed securities, and investments in foreign-denominated securities. As a result, net investment income and net realized gain (loss) on investment transactions for a reporting period may differ significantly from distributions during such period. Accordingly, the Fund makes reclassifications among certain of its capital accounts without impacting the net asset value of the Fund.
As of June 30, 2007, the components of distributable earnings on a tax basis and the federal tax cost of investments are listed in the following table.
Cost of Investments | Gross Unrealized Appreciation | Gross Unrealized Depreciation | Net Unrealized Depreciation | |||
$209,382,856 | $1,004,933 | $(4,585,261) | $(3,580,328) |
The distributions paid of $10,892,738 for the year ended December 31, 2006 were from ordinary income for federal income tax purposes.
| Montgomery Street Income Securities, Inc. | 29 |
At December 31, 2006, the Fund had a tax basis capital loss carryforward of $6,606,654, which may be applied against any realized net taxable capital gains from each succeeding year until fully utilized, or until the respective expiration dates occur.
| Amount | Year of Expiration | |
| $ 781,347 | 2010 | |
| 1,872,360 | 2013 | |
| 3,952,947 | 2014 | |
| $6,606,654 |
The Fund realized $867,428 of capital losses after October 31, 2006, which were deferred for tax purposes to the first day of the following fiscal year.
E. Share Repurchases
The Fund is authorized to effect periodic repurchases of its shares in the open market from time to time when the Fund’s shares trade at a discount to their net asset value. During the six months ended June 30, 2007, the Fund purchased 24,000 shares of common stock on the open market at a total cost of $420,073. The weighted average discount of these purchases, comparing the purchase price to the net asset value at the time of purchase was 8.0%. During the year ended December 31, 2006, the Fund purchased 46,000 shares of common stock on the open market at a total cost of $783,964 with a weighted average discount of 9.7%.
| 30 | Montgomery Street Income Securities, Inc. |
Dividend Reinvestment and Cash Purchase Plan
All registered stockholders of the Fund’s Common Stock are offered the opportunity of participating in a Dividend Reinvestment and Cash Purchase Plan (the “Plan”). Registered stockholders, on request or on becoming registered stockholders, are mailed information regarding the Plan, including a form by which they may elect to participate in the Plan and thereby cause their future net investment income dividends and capital gains distributions to be invested in shares of the Fund’s common stock. Mellon Bank, N.A. is the agent (the “Plan Agent”) for stockholders who elect to participate in the Plan.
If a stockholder chooses to participate in the Plan, the stockholder’s dividends and capital gains distributions will be promptly invested, automatically increasing the stockholder’s holdings in the Fund. If the Fund declares a dividend or capital gains distributions payable either in cash or in stock of the Fund, the stockholder will automatically receive stock. If the market price per share on the payment date for the dividend (the “Valuation Date”) equals or exceeds the net asset value per share, the Fund will issue new shares to the stockholder at the greater of the following on the Valuation Date: (a) net asset value per share or (b) 95% of the market price per share. If the market price per share on the Valuation Date is less than the net asset value per share, the Fund will issue new shares to the stockholder at the market price per share on the Valuation Date. In either case, for federal income tax purposes the stockholder will be deemed to receive a distribution equal to the market value on the Valuation Date of the new shares issued. If dividends or capital gains distributions are payable only in cash, then the stockholder will receive shares purchased on the New York Stock Exchange or otherwise on the open market. In this event, for federal income tax purposes the amount of the distribution will equal the cash distribution paid. State and local taxes may also apply. All reinvestments are in full and fractional shares, carried to three decimal places.
Stockholders participating in the Plan can also purchase additional shares quarterly in any amount from $100 to $5,000 (a “Voluntary Cash Investment”) by sending in a check together with the cash remittance slip, which will be sent with each statement of the stockholder’s account, to Mellon Investor Services LLC, the Fund’s transfer agent (the “Transfer Agent”). Such additional shares will be purchased on the open market by the Plan Agent or its delegate. The purchase price of shares purchased on the open market, whether pursuant to a reinvestment of dividends payable only in cash or a
| Montgomery Street Income Securities, Inc. | 31 |
Voluntary Cash Investment, will be the average price (including brokerage commissions) of all shares purchased by the Plan Agent or its delegate on the date such purchases are effected. In addition, stockholders may be charged a service fee in an amount up to 5% of the value of the Voluntary Cash Investment. Although subject to change, stockholders are currently charged $1 for each Voluntary Cash Investment.
Stockholders may terminate their participation in the Plan at any time and elect to receive dividends and other distributions in cash by notifying the Transfer Agent in writing. Such notification must be received not less than 10 days prior to the record date of any distribution. There is no charge or other penalty for such termination. The Plan may be terminated by the Fund upon written notice mailed to the stockholders at least 30 days prior to the record date of any distribution. Upon termination, the Fund will issue certificates for all full shares held under the Plan and cash for any fractional share.
Alternatively, stockholders may request the Transfer Agent to instruct the Plan Agent or its delegate to sell any full shares and remit the proceeds, less a $2.50 service fee and less brokerage commissions. The sale of shares (including fractional shares) will be a taxable event for federal income tax purposes and may be taxable for state and local tax purposes.
The Plan may be amended by the Fund at any time. Except when required by law, written notice of any amendment will be mailed to stockholders at least 30 days prior to its effective date. The amendment will be deemed accepted unless written notice of termination is received by the Transfer Agent prior to the effective date.
An investor holding shares in its own name can participate directly in the Plan. An investor holding shares in the name of a brokerage firm, bank or other nominee should contact that nominee, or any successor nominee, to determine whether the nominee can participate in the Plan on the investor’s behalf and to make any necessary arrangements for such participation.
Additional information, including a copy of the Plan and its Terms and Conditions and an enrollment form, can be obtained from the Transfer Agent by writing Mellon Investor Services LLC, P.O. Box 3315, South Hackensack, NJ 07606-1915, or by calling (877) 437-3938.
| 32 | Montgomery Street Income Securities, Inc. |
Stockholder Meeting Results
The Annual Meeting of Stockholders of the Fund was held on July 12, 2007 at 101 California Street, 5th Floor, San Francisco, California. At the meeting, the following matter was voted upon and approved by the stockholders:
To elect five Directors of the Fund to hold office until the next annual meeting or until their respective successors shall have been duly elected and qualified.
| Number of Votes: | ||||
| Directors | For | Withheld | ||
Richard J. Bradshaw | 8,933,013 | 360,442 | ||
Victor L. Hymes | 8,934,192 | 359,264 | ||
John T. Packard | 8,932,601 | 360,854 | ||
Wendell G. Van Auken | 8,933,013 | 360,442 | ||
James C. Van Horne | 8,932,223 | 361,233 | ||
| Montgomery Street Income Securities, Inc. | 33 |
Directors and Officers
DIRECTORS
RICHARD J. BRADSHAW
Chairman
VICTOR L. HYMES
JOHN T. PACKARD
WENDELL G. VAN AUKEN
JAMES C. VAN HORNE
OFFICERS
MARK D. NERUD
President and Chief Executive Officer
DANIEL W. KOORS
Treasurer and Chief Financial Officer
SUSAN S. RHEE
Secretary and Chief Legal Officer
TONI M. BUGNI
Chief Compliance Officer
| 34 | Montgomery Street Income Securities, Inc. |
Investment Management Agreement Approval
At a meeting held on April 12, 2007, the Board of Directors (the “Board”) of the Fund, including the Directors of the Fund who were not parties to the agreement or “interested persons” of any such party as defined in the Investment Company Act of 1940, as amended (the “Independent Directors”), voted to continue the Investment Advisory Agreement (the “Agreement”) with HIMCO until July 31, 2008.
In reviewing the Agreement, the Board considered, among other information, written and oral reports and compilations provided by HIMCO, including comparative data from independent sources as to investment performance and advisory fees. The Board also considered the separate written and oral reports of Jackson and of Gifford Fong Associates, an independent investment consultant engaged by the Board specializing in quantitative fixed-income investment analysis. In addition, the Board took into account information provided at previous meetings and information about HIMCO and other potential investment advisers developed in connection with the Board’s search for a new investment adviser in 2006.
In approving the continuance of the Agreement, the Board of Directors considered the following factors, among others:
Nature, Extent and Quality of Services. The Board examined the nature, extent, and quality of the advisory services provided and to be provided to the Fund by HIMCO. The Board considered the terms of the Agreement, the experience and qualifications of HIMCO and its personnel in managing fixed-income instruments, and HIMCO’s investment strategy for the Fund. The Board also considered the experience of HIMCO in managing open- and closed-end funds, the availability of HIMCO’s personnel, the extent and quality of information provided by HIMCO to the Board, HIMCO’s attention to compliance matters, and the extent of any regulatory issues relating to HIMCO or its affiliates. Further, the Board considered the stability of the HIMCO organization and turnover in its personnel, the overall commitment of HIMCO to the Fund, and the general financial condition, resources and reputation of HIMCO and its parent. The Board generally was satisfied with the nature, extent, and quality of the advisory services provided to the Fund.
Investment Performance. The Board reviewed the investment performance of HIMCO over various periods compared to the performance of relevant indices and of other similar funds. The Board also reviewed with HIMCO and
| Montgomery Street Income Securities, Inc. | 35 |
Gifford Fong Associates the ways in which the investment strategies employed by HIMCO had contributed to its investment performance. The performance data showed, among other things, that in the first three quarters since HIMCO had started managing the Fund, the Fund had outperformed its benchmark index, the Lehman Brothers Aggregate Bond Index, but had underperformed the average return of the comparison group of closed-end investment grade bond funds. The Board noted that HIMCO had managed the Fund for a relatively short period of time and that it was too early to judge HIMCO’s investment performance as completely as would be the case with a longer record of investment performance.
Cost of Services. The Board examined the cost of the services provided and to be provided to the Fund by HIMCO, including comparable expense information concerning other similar funds. The advisory fee charged by HIMCO was below that charged to other similar funds managed by HIMCO, although the services provided to those other funds included certain administration. The advisory fee charged by HIMCO also was competitive with the average advisory fee charged to closed-end investment grade bond funds with advisers that provide only advisory services. It was noted that, in connection with its 2006 search for a new investment adviser, the Board had solicited fee proposals from several candidates and the fee to be charged by HIMCO was among the lowest proposed. The Board concluded that the advisory fee charged by HIMCO generally was competitive.
Profits Realized. The Board considered the profits realized and to be realized by HIMCO from its relationship with the Fund and reviewed an estimate prepared by HIMCO. The Board acknowledged the inherent limitations of profitability analyses, including their reliance on various allocations and assumptions. The Board recognized that HIMCO was entitled to earn a profit for the services it furnishes and concluded, based on the information provided, that the profit expected to be earned by HIMCO would not be excessive.
Economies of Scale. The Board considered the extent to which economies of scale could be realized and whether the advisory fee charged by HIMCO reflects any such economies of scale. It was noted that, as a closed-end fixed income fund making regular dividend distributions, the assets of the Fund were not expected to increase materially. Accordingly, the Board had negotiated with HIMCO a fixed fee rate taking into account the then current size of the Fund. In the event the size of the Fund does increase materially in the future, the Board will consider whether the advisory fee should be adjusted to reflect any economies of scale.
| 36 | Montgomery Street Income Securities, Inc. |
Other Benefits. The Board recognized that HIMCO and its affiliates may derive other benefits from their relationship with the Fund, including the use of the Fund’s performance record in marketing other products, the inclusion of the Fund on its client list, and the aggregation of the Fund’s purchase orders with other accounts.
In addition to the foregoing factors, among others, the Board considered its ability to terminate the Agreement on 60 days’ notice and the results of its 2006 search for a new investment adviser. In its deliberations, the Board did not identify any particular factor or factors that were all-important or controlling, and each Director assigned different weights to the various factors considered.
| Montgomery Street Income Securities, Inc. | 37 |
General Information
| Investment Adviser | Hartford Investment Management Company 55 Farmington Avenue Hartford, CT 06105 | |
| Administrator | Jackson Fund Services 225 West Wacker Drive Chicago, IL 60606 | |
| Transfer Agent | Mellon Investor Services* P.O. Box 3315 South Hackensack, NJ 07606-1915 (Tel) 1/877/437-3938 | |
| Custodian | Mellon Bank, N.A.* One Mellon Center Pittsburgh, PA 15258 | |
| Legal Counsel | Howard Rice Nemerovski Canady Falk & Rabkin PC Three Embarcadero Center San Francisco, CA 94111 | |
| * | As of July 2, 2007, Mellon Financial Corporation, of which the Fund’s custodian, transfer agent, and Plan Agent are affiliated, merged with The Bank of New York Company, Inc. to form The Bank of New York Mellon Corporation. |
| 38 | Montgomery Street Income Securities, Inc. |
Privacy Policy Statement
Montgomery Street Income Securities, Inc. (the “Fund”) considers the privacy of its stockholders to be of fundamental importance and has established a policy to maintain the privacy of the information you share with us. In addition, the Fund relies on the privacy and customer information protection policies and procedures of its service providers.
Personal information we collect
We do not sell any information to any third parties. However, we may collect and retain certain nonpublic personal information about you, including:
| • | Information we receive from broker-dealers, investment advisers, the Fund’s transfer agent, and the Fund’s dividend reinvestment plan administrator (such as a stockholder’s name, address and tax identification number); |
| • | An address received from a third party when a stockholder has moved; and |
| • | Account balance and transaction activity. |
Personal information we may disclose
We may occasionally disclose nonpublic personal information about you to affiliates and non-affiliates as permitted by law. Instances when we may share information include:
| • | Disclosing information to a third party in order to process account transactions that you request or authorize; |
| • | Disclosing your name and address to companies that mail Fund-related materials, such as stockholder reports and proxy materials; and |
| • | Disclosing information in connection with regulatory inquiries and legal proceedings, such as responding to a request for information or subpoena. |
When information is shared with third parties, they are not permitted to use the information for any purpose other than to assist our servicing of your account(s) or as permitted by law. If you close your account(s) or if we lose contact with you, we will continue to share information in accordance with our current privacy policy and practices. We restrict access to your nonpublic personal information to authorized agents, including employees of the Fund’s administrator who need to know that information to provide services to the
| Montgomery Street Income Securities, Inc. | 39 |
Fund and its stockholders. We maintain physical, electronic and procedural safeguards that comply with federal standards to guard your nonpublic personal information.
These measures reflect our commitment to maintaining the privacy of your nonpublic personal information. We appreciate the confidence you have shown by entrusting us with your assets.
If you would like to learn more or have any questions about our privacy practices, please contact the Fund at the following address:
Montgomery Street Income Securities, Inc.
c/o Jackson Fund Services
225 W. Wacker Drive, Suite 950
Chicago, IL 60606
Effective: August 31, 2007
| 40 | Montgomery Street Income Securities, Inc. |

Presorted Standard
U.S. Postage
PAID
Lancaster, PA
Permit No. 1313
Monty-2
(42065 2/06)
Item 2. Code of Ethics.
Not applicable.
Item 3. Audit Committee Financial Expert.
Not applicable.
Item 4. Principal Accountant Fees and Services.
Not applicable.
Item 5. Audit Committee of Listed Registrants.
Not applicable.
Item 6. Schedule of Investments.
Included in Report to Stockholders under Item 1.
Item 7. Disclosure of Proxy Voting Policies and Procedures for Closed-End Management Investment Companies.
Not applicable.
Item 8. Portfolio Managers of Closed-End Management Investment Companies.
Not applicable.
Item 9. Purchases of Equity Securities by Closed-End Management Investment Company and Affiliated Purchasers.
Period | (a) Total Number of Shares (or Units) Purchased(1) | (b) Average Price Paid per Share (or Unit) | (c) Total Number of Shares (or Units) Purchased as Part of Publicly Announced Plans or Programs | (d) Maximum Number (or Approximate Dollar Value) of Shares (or Units) that May Yet Be Purchased Under the Plans or Programs |
January 1 – January 31 | 0 | 0 | n/a | n/a |
February 1 – February 28 | 6,000 | 17.49 | n/a | n/a |
March 1 – March 31 | 6,000 | 17.46 | n/a | n/a |
April 1 – April 30 | 0 | 0 | n/a | n/a |
May 1 – May 31 | 6,000 | 17.50 | n/a | n/a |
June 1 – June 30 | 6,000 | 17.36 | n/a | n/a |
Total |
24,000 |
17.45 |
n/a |
n/a |
(1) All purchases were made on the open market pursuant to the registrant’s Repurchase Program and related guidelines.
Item 10. Submission of Matters to a Vote of Security Holders.
There have been no material changes to the procedures by which stockholders may recommend nominees to the registrant’s Board of Directors since the registrant last disclosed such procedures in a Proxy Statement or Form N-CSR.
Item 11. Controls and Procedures.
(a) | The President/Principal Executive Officer and the Treasurer/Principal Financial Officer of the registrant have concluded, based on their evaluation of the registrant’s disclosure controls and procedures (as defined in Rule 30a-3(c) under the Act) as of a date within ninety (90) days of the filing date of this report on Form N-CSR, that such controls and procedures are effective and that the design and operation of such procedures ensures that information required to be disclosed by the registrant in this report on Form N-CSR is recorded, processed, summarized, and reported within the time periods specified in the U.S. Securities and Exchange Commission’s rules and forms. |
(b) | There has been no change in the registrant’s internal controls over financial reporting (as defined in Rule 30a-3(d) under the Investment Company Act of 1940, as amended (the “Act”)) that occurred during the second fiscal quarter of the period covered by this report that has materially affected, or is reasonably likely to materially affect, the registrant’s internal control over financial reporting. |
Item 12. Exhibits.
(a)(1) | Not applicable. |
| (2) | Certifications required by Rule 30a-2(a) under the Act. |
| (3) | Not applicable. |
(b) | Certification required by Rule 30a-2(b) under the Act. |
SIGNATURES
Pursuant to the requirements of the Securities Exchange Act of 1934 and the Investment Company Act of 1940, the registrant has duly caused this report to be signed on its behalf by the undersigned, thereunto duly authorized.
| Montgomery Street Income Securities, Inc. |
|
|
|
|
By: | /s/ Mark D. Nerud |
Name: | Mark D. Nerud |
Title: | President and Principal Executive Officer |
Date: | August 29, 2007 |
Pursuant to the requirements of the Securities Exchange Act of 1934 and the Investment Company Act of 1940, this report has been signed below by the following persons on behalf of the registrant and in the capacities and on the dates indicated.
|
|
By: | /s/ Mark D. Nerud |
Name: | Mark D. Nerud |
Title: | President and Principal Executive Officer |
Date: | August 29, 2007 |
|
|
By: | /s/ Daniel W. Koors |
Name: | Daniel W. Koors |
Title: | Treasurer and Principal Financial Officer |
Date: | August 29, 2007 |
EXHIBIT LIST
Exhibit 12(a)(2)(a): | Certification of the Principal Executive Officer required by Rule 30a-2(a) under the Act |
Exhibit 12(a)(2)(b): | Certification of the Principal Financial Officer required by Rule 30a-2(a) under the Act |
Exhibit 12(b): | Certification required by Rule 30a-2(b) under the Act |