UNITED STATES
SECURITIES AND EXCHANGE COMMISSION
Washington, D.C. 20549
FORM N-CSR
CERTIFIED SHAREHOLDER REPORT OF REGISTERED
MANAGEMENT INVESTMENT COMPANIES
Investment Company Act File Number: 811-2340
Montgomery Street Income Securities, Inc.
(Exact name of registrant as specified in charter)
225 W. Wacker Drive, Suite 950
Chicago, IL 60606
(Address of principal executive offices)
Mark D. Nerud, President
225 W. Wacker Drive, Suite 950
Chicago, IL 60606
(Name and address of agent for service)
Registrant’s telephone number, including area code: (312) 338-5801
Date of fiscal year end: December 31
Date of reporting period: January 1, 2008 – June 30, 2008
Form N-CSR is to be used by management investment companies to file reports with the Commission not later than 10 days after the transmission to stockholders of any report that is required to be transmitted to stockholders under Rule 30e-1 under the Investment Company Act of 1940 (17 CFR 270.30e-1). The Commission may use the information provided on Form N-CSR in its regulatory, disclosure review, inspection, and policymaking roles.
A registrant is required to disclose the information specified by Form N-CSR, and the Commission will make this information public. A registrant is not required to respond to the collection of information contained in Form N-CSR unless the Form displays a currently valid Office of Management and Budget (“OMB”) control number. Please direct comments concerning the accuracy of the information collection burden estimate and any suggestions for reducing the burden to Secretary, Securities and Exchange Commission, 450 Fifth Street, NW, Washington, DC 20549-0609. The OMB has reviewed this collection of information under the clearance requirements of 44 U.S.C. §3507.
Item 1. Report to Stockholders.

Montgomery Street Income Securities, Inc. (MTS)
Semiannual Report to Stockholders
June 30, 2008 (Unaudited)
Portfolio Manager Review
The investments of Montgomery Street Income Securities, Inc. (the “Fund”) provided a total return based on net asset value (“NAV”) of –1.50% for the six-month period ended June 30, 20081. The total return of the Fund, based on the market price of its New York Stock Exchange-traded shares, was –0.23% for the same period. The Fund’s total NAV return underperformed the Lehman Brothers Aggregate Bond Index2, the Fund’s benchmark, which posted a total return of 1.13% for the six-month period. Past results are not necessarily indicative of the future performance of the Fund. Investment return and principal value will fluctuate.
The first half of 2008 was a period of acute investment uncertainty and volatility. The sub-prime mortgage calamity that first materialized approximately a year ago continued to spiral downward, nearly bringing the global financial system with it. The rescue acquisition of Bear Stearns in March and the innovative emergency measures taken by the Federal Reserve stalled this cycle and restored critical investor confidence. A myriad of problems, including increasing unemployment, high fuel costs, inflation concerns and continued declines in housing, continued to plague the economy at June 30. As a result, risk premiums finished the period higher. All major spread sectors underperformed comparable duration U.S. Treasuries.
Various factors contributed to the Fund’s underperformance versus its benchmark. Broadly, a higher than index allocation to spread (non-Treasury) product, at the expense of an underweight to U.S. Treasuries, was the driver of underperformance. The Fund maintained its overweight to the financial sector and added selectively to this sector throughout the first half of 2008. Despite a recovery of risk premiums from the highs of mid-March, the financial sector provided negative returns and the Fund’s overweight detracted from performance. Sub-prime home equity also generally decreased in price over the
1 | Total return based on NAV reflects changes in the Fund’s net asset value during each period. Total return based on market value reflects changes in market value. Each figure assumes that dividend and capital gains, if any, were reinvested. These figures will differ depending upon the level of any discount from or premium to NAV at which the Fund’s shares traded during the period. |
2 | The Lehman Brothers Aggregate Bond Index is an unmanaged index representing domestic taxable investment-grade bonds, consisting of government securities and corporate securities, mortgage pass through securities, and asset-backed securities with average maturities of one year or more. The Index does not include exposure to high yield or non dollar securities. Index returns assume reinvestment of dividends, and unlike Fund returns, do not reflect fees or expenses. It is not possible to invest directly in an index. |
| | |
| Montgomery Street Income Securities, Inc. | | 1 |
first half of the year. Although exposure was limited to 0.89% of the Fund’s net assets at the beginning of the year, rating downgrades and subsequent price declines detracted from total return. The high yield sector also was not exempt from spread widening. Despite only a slight increase from all time lows in the pace of defaults, declining risk appetites and fears of further economic deterioration moved risk premiums wider. The Fund’s approximately 10% average allocation to this sector negatively affected performance.
On a more positive note, duration and yield curve positioning benefited the relative performance of the portfolio as rates declined and the yield curve steepened.
The value and related income of debt securities, including mortgage-backed securities, asset-backed securities, and below-investment grade corporate bonds is sensitive to changes in economic conditions, including delinquencies and/or defaults. Recent instability in the markets for fixed-income securities, particularly mortgage-backed and asset-backed securities, has resulted in increased volatility of market prices and periods of illiquidity that have made it harder to obtain reliable market quotations for certain securities held by the Fund.
Our proprietary models demonstrate a high probability of a U.S. recession in 2008. We believe that the economy is experiencing a perfect storm of conditions which inhibit economic expansion. Housing weakness will continue to be detrimental to both consumers and banks. Higher fuel and commodity prices appear to be inflicting damage on disposable income and corporate profits. Meanwhile, lending activity is declining as balance sheets shrink and underwriting standards rise. Indications of economic slowing have continued to surface in the form of weak employment and manufacturing reports. Despite an unprecedented level of government support, the sub-prime/structured credit situation is not over.
The remainder of 2008 is expected to continue to be volatile and the economy may languish at a sub-trend growth rate for well into 2009. In many sectors however, we believe that pricing is already reflective of a long and deep recession. In the near term, we expect to maintain our overweight in the financial sector and add to spread (non-Treasury) products as market volatility creates inefficiencies. We also expect to be defensive in the high yield sector, preferring higher quality issuers, and plan to position tactically on the yield curve anticipating sustained low rates in the front end of the curve.
| | |
| 2 | | Montgomery Street Income Securities, Inc. |
US Treasury Bond Yield Curve
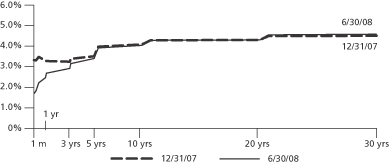
Source: Bloomberg
Performance is historical and does not guarantee future results.
Quality Distribution (Unaudited)
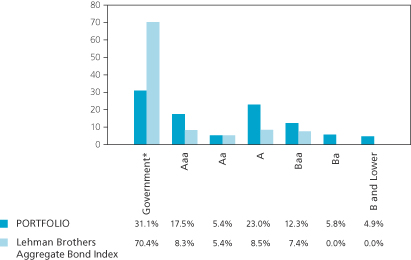
| * | Government includes U.S. Treasury, U.S. Agency and cash. |
As of June 30, 2008.
Quality distribution is subject to change.
Portfolio percentages are based on total value of the investment portfolio, excluding securities lending collateral.
The quality ratings represent the lower of Moody’s Investors Service, Inc. (“Moody’s”) or Standard & Poor’s Corporation (“S&P”) credit ratings. The ratings of Moody’s and S&P represent these companies’ opinions as to the quality of the securities they rate. Ratings are relative and subjective and are not absolute standards of quality. A bond’s credit quality does not remove the risk of an increase in interest rates or illiquidity in the market.
| | |
| Montgomery Street Income Securities, Inc. | | 3 |
Sector Distribution (Unaudited)
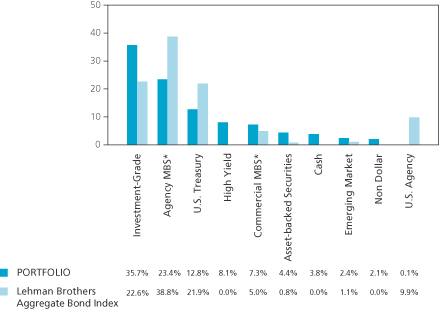
| * | Mortgage backed securities. |
As of June 30, 2008.
Sector distribution is subject to change.
Percentages are based on total value of the investment portfolio, excluding securities lending collateral.
The views expressed in this report reflect those of the investment adviser, Hartford Investment Management Company, only through the end of the period of the report as stated on the cover. The investment adviser’s views are subject to change at any time based on market and other conditions and should not be construed as a recommendation. Investment in the Fund involves risk. The Fund invests in individual bonds whose yields and value fluctuate so that your investment may be worth more or less than its original cost. Bond investments are subject to interest rate risk such that when interest rates rise, the price of the bonds, and thus the value of the Fund, can decline and the investor can lose principal value. The Fund’s investments are also subject to credit risk and liquidity risk. Additionally, investing in foreign securities presents certain unique risks not associated with domestic investments, such as currency fluctuation, political and economic changes, and market risks. All of these factors may result in greater share price volatility. Closed-end funds, unlike open-end funds, are not continuously offered or redeemed.
NOT FDIC/NCUA INSURED. NO BANK GUARANTEE. MAY LOSE VALUE. NOT A DEPOSIT. NOT INSURED BY ANY FEDERAL GOVERNMENT AGENCY.
Past performance is no guarantee of future results.
This report is sent to stockholders of Montgomery Street Income Securities, Inc., for their information. It is not a prospectus, circular or representation intended for use in the purchase or sale of shares of the Fund or of any securities mentioned in the report.
| | |
| 4 | | Montgomery Street Income Securities, Inc. |
Other Information
Dividends Paid
The Fund paid dividends of $0.26 per share on April 30, 2008 and $0.26 per share on July 31, 2008.
Market Price and Net Asset Value
The Fund’s market price stood at $15.84 as of June 30, 2008, compared with $16.13 as of December 31, 2007. The Fund’s shares traded at a 9.6% discount to NAV at June 30, 2008. Shares of closed-end funds frequently trade at a discount to NAV. The price of the Fund’s shares is determined by a number of factors, several of which are beyond the control of Fund management. The Fund, therefore, cannot predict whether its shares will trade at, below or above its NAV.
The Fund’s NAV and market value are published every Monday in The Wall Street Journal under the heading “Closed End Funds.” The Fund’s market value also is published daily in The New York Times, and both its market value and NAV are published weekly in Barron’s. The Fund’s market price is available daily on its website at www.montgomerystreetincome.com.
Dividend Reinvestment and Cash Purchase Option
The Fund maintains an optional Dividend Reinvestment and Cash Purchase Plan (the “Plan”) for the automatic reinvestment of your dividends and capital gain distributions in shares of the Fund. Stockholders who participate in the Plan also can purchase additional shares of the Fund through the Plan’s voluntary cash investment feature. We recommend that you consider enrolling in the Plan to build your investment. The Plan’s features, including the voluntary cash investment feature, are described beginning on page 35 of this report.
Limited Share Repurchases
The Fund is authorized to repurchase a limited number of shares of the Fund’s common stock from time to time when the shares are trading at less than 95% of their NAV. Repurchases are limited to a number of shares each calendar quarter approximately equal to the number of new shares issued under the Plan with respect to income earned for the second preceding calendar quarter. There were 11,000 shares repurchased during each of the first two quarters of
| | |
| Montgomery Street Income Securities, Inc. | | 5 |
2008. Up to 11,000 shares may be repurchased during the third quarter of 2008.
Investment Portfolio
Following the Fund’s first and third quarter ends, a complete portfolio holdings listing is filed with the U.S. Securities and Exchange Commission (“SEC”) on Form N-Q. The form is available on our website at www.montgomerystreetincome.com, or on the SEC’s website at www.sec.gov, and it also may be reviewed and copied at the SEC’s Public Reference Room in Washington, DC. Information on the operation of the SEC’s Public Reference Room may be obtained by calling (800) SEC-0330.
Proxy Voting
Information about how the Fund voted any proxies related to its portfolio securities during the most recent twelve-month period ended June 30, 2008 is available on our website at www.montgomerystreetincome.com or on the SEC’s website at www.sec.gov. A description of the policies that the Fund uses to determine how to vote proxies relating to portfolio securities is available without charge, upon request, by calling (877) 437-3938 or on the SEC’s website at www.sec.gov.
Reports to Stockholders
The Fund’s annual and semiannual reports to stockholders will be mailed to stockholders, and are also available on our website at www.montgomerystreetincome.com or by calling (877) 437-3938. Those stockholders who wish to view the Fund’s complete portfolio holdings listing for the first and third quarters may view the Form N-Q, as described above in the “Investment Portfolio” section of this report.
Change in Portfolio Manager
Effective July 22, 2008, Charles Moon resigned from Hartford Investment Management Company (“HIMCO”) and as a portfolio manager of the Fund. Nasri A. Toutoungi remains a portfolio manager of the Fund.
| | |
| 6 | | Montgomery Street Income Securities, Inc. |
Investment Objectives and Policies
Investment Objectives
Your Fund is a closed-end diversified management investment company registered under the Investment Company Act of 1940, as amended (the “1940 Act”), investing and reinvesting its assets in a portfolio of selected securities. The Fund’s primary investment objective is to seek as high a level of current income as is consistent with prudent investment risks, from a diversified portfolio primarily of debt securities. Capital appreciation is a secondary objective.
Principal Investment Policies
Investment of your Fund is guided by the principal investment policies summarized below. For a more complete description of the Fund’s investment policies, please see the Fund’s Form N-2 Registration Statement dated April 29, 1992 and subsequent annual reports to stockholders.
Under normal circumstances, the Fund will invest at least 80% of its net assets, plus the amount of any borrowings for investment purposes, in income producing securities.1
At least 70% of total assets must be invested in: straight debt securities (other than municipal securities), including U.S. dollar-denominated debt securities of foreign issuers, rated within the four highest grades assigned by Moody’s Investors Service, Inc. or Standard & Poor’s Corporation; bank debt of comparable quality; U.S. government or agency securities; commercial paper; cash; cash equivalents; or Canadian government, provincial, or municipal securities (not in excess of 25% of total assets).
Up to 30% of total assets (the “30% basket”) may be invested in other U.S. or foreign straight debt securities; convertible securities; and preferred stocks.
Not more than 25% of total assets may be invested in securities of any one industry (finance companies as a whole are not considered an “industry” for the purposes of this limitation).
Not more than 5% of total assets may be invested in securities of any one issuer, other than U.S. government or agency securities.
| 1 | The Fund will provide stockholders with at least 60 days’ notice prior to making any changes to this 80% investment policy. |
| | |
| Montgomery Street Income Securities, Inc. | | 7 |
The Fund may invest money pursuant to repurchase agreements so long as the Fund is initially wholly secured with collateral consisting of securities in which the Fund can invest under its investment objectives and policies. In addition, investments in repurchase agreements must not, at the time of any such loan, be as a whole more than 20% — and be as to any one borrower more than 5% — of the Fund’s total assets.
The Fund may lend its portfolio securities to the extent permitted under the 1940 Act.
The Fund may borrow funds to purchase securities, provided that the aggregate amount of such borrowings may not exceed 30% of the Fund’s assets (including aggregate borrowings), less liabilities (excluding such borrowings).
The Fund may enter into forward foreign currency sale contracts to hedge portfolio positions, provided, among other things, that such contracts have a maturity of one year or less and that, at the time of purchase, the Fund’s obligations under such contracts do not exceed either the value of portfolio securities denominated in the foreign currency or 15% of the Fund’s total assets.
The Fund may enter into interest rate futures contracts and purchase or write options on interest rate futures contracts, provided, among other things, that the Fund’s obligations under such instruments may not exceed the value of the Fund’s assets not subject to the 30% basket.
It is the intention of the Fund to invest exclusively in non-voting securities. Under normal circumstances, the Fund does not intend to exercise conversion, exchange or other rights to purchase common stock or other equity securities, or otherwise to hold voting securities. In the unlikely event that the Fund does come into possession of any voting securities, the Fund intends to dispose of such securities as soon as it is reasonably practicable and prudent to do so.
| | |
| 8 | | Montgomery Street Income Securities, Inc. |
| | |
Investment Portfolio | | as of June 30, 2008 (Unaudited) |
| | | | | | |
| | | | | Principal
Amount ($) (f) | | Value ($) |
| | | | | | | |
Corporate Bonds 44.7% | | | | | | |
| Consumer Discretionary 6.1% | | | | | | |
American Axle & Manufacturing Inc.,
5.25%, 02/11/14 (c) | | | | 375,000 | | 264,375 |
Charter Communications Operating LLC,
8.00%, 04/30/12 (a) (j) | | | | 500,000 | | 472,500 |
Clear Channel Communications Inc., 8.00%, 11/01/08 | | | | 750,000 | | 761,145 |
Clear Channel Communications Inc., 7.65%, 09/15/10 | | | | 1,330,000 | | 1,364,248 |
Comcast Cable Holdings LLC, 10.13%, 04/15/22 | | | | 1,291,000 | | 1,599,188 |
Comcast Corp., 6.30%, 11/15/17 | | | | 152,000 | | 150,632 |
COX Communications Inc., 5.45%, 12/15/14 | | | | 500,000 | | 480,483 |
CSC Holdings Inc., 8.13%, 07/15/09 | | | | 190,000 | | 191,425 |
Desarrolladora Homex SAB de CV, 7.50%, 09/28/15 (i) | | | | 280,000 | | 281,400 |
Dex Media West LLC, 9.88%, 08/15/13 | | | | 225,000 | | 202,500 |
DirecTV Holdings LLC, 7.63%, 05/15/16 (a) (j) | | | | 245,000 | | 241,325 |
ERAC USA Finance Co., 5.90%, 11/15/15 (a) (j) | | | | 429,000 | | 392,254 |
Foot Locker Inc., 8.50%, 01/15/22 (i) | | | | 155,000 | | 144,925 |
Harrah’s Operating Co. Inc., 10.75%, 02/01/16 (a) (j) | | | | 275,000 | | 228,250 |
Icahn Enterprises LP, 7.13%, 02/15/13 | | | | 385,000 | | 349,388 |
Idearc Inc., 8.00%, 11/15/16 | | | | 500,000 | | 314,375 |
J.C. Penney Co. Inc., 8.00%, 03/01/10 | | | | 500,000 | | 518,695 |
Mediacom LLC, 7.88%, 02/15/11 | | | | 650,000 | | 599,625 |
MGM Mirage Inc., 8.50%, 09/15/10 | | | | 500,000 | | 493,750 |
MGM Mirage Inc., 6.75%, 09/01/12 | | | | 300,000 | | 269,250 |
Neiman-Marcus Group Inc., 10.38%, 10/15/15 (c) | | | | 450,000 | | 450,000 |
RBS-Zero Hora Editora Jornalistica SA,
11.25%, 06/15/17 (i) | | BRL | | 400,000 | | 197,742 |
TCI Communications Inc., 8.75%, 08/01/15 | | | | 35,000 | | 39,562 |
Time Warner Inc., 6.75%, 04/15/11 | | | | 800,000 | | 817,823 |
Time Warner Inc., 6.50%, 11/15/36 | | | | 250,000 | | 222,549 |
| | | | | | |
| | | | | | 11,047,409 |
| Consumer Staples 2.1% | | | | | | |
Archer-Daniels-Midland Co., 5.38%, 09/15/35 | | | | 400,000 | | 350,691 |
Coca-Cola Enterprises Inc., 8.50%, 02/01/22 | | | | 500,000 | | 613,877 |
CVS Caremark Corp., 6.30%, 06/01/37 (callable at 100 beginning 06/01/12) (e) | | | | 833,000 | | 714,298 |
Dr. Pepper Snapple Group Inc., 6.82%, 05/01/18 (a) (j) | | | | 473,000 | | 474,952 |
General Mills Inc., 5.70%, 02/15/17 | | | | 680,000 | | 674,028 |
Kraft Foods Inc., 6.25%, 06/01/12 | | | | 500,000 | | 510,795 |
Safeway Inc., 5.80%, 08/15/12 | | | | 250,000 | | 255,628 |
Wal-Mart Stores Inc., 5.25%, 09/01/35 | | | | 250,000 | | 217,203 |
| | | | | | |
| | | | | | 3,811,472 |
The accompanying notes are an integral part of the financial statements.
| | |
| Montgomery Street Income Securities, Inc. | | 9 |
| | | | |
| | | Principal
Amount ($) (f) | | Value ($) |
| | | | | |
| Energy 1.6% | | | | |
Chesapeake Energy Corp., 7.63%, 07/15/13 | | 350,000 | | 350,875 |
Enterprise Products Operating LLC, 6.50%, 01/31/19 | | 245,000 | | 246,299 |
Inergy LP/Inergy Finance Corp., 8.25%, 03/01/16 | | 450,000 | | 443,250 |
Kinder Morgan Energy Partners LP, 6.50%, 02/01/37 | | 260,000 | | 245,843 |
NGPL PipeCo LLC, 6.51%, 12/15/12 (a) (j) | | 585,000 | | 593,927 |
ONEOK Partners LP, 6.65%, 10/01/36 | | 542,000 | | 516,596 |
Petroleos de Venezuela SA, 5.25%, 04/12/17 | | 270,000 | | 187,649 |
Transcontinental Gas Pipe Line Corp., 6.40%, 04/15/16 | | 250,000 | | 249,687 |
| | | | |
| | | | 2,834,126 |
| Financials 19.4% | | | | |
American Express Co., 8.15%, 03/19/38 | | 740,000 | | 822,472 |
American General Institutional Capital,
7.57%, 12/01/45 (a) (j) | | 250,000 | | 227,634 |
American International Group Inc., 8.18%, 05/15/58 (callable at 100 on 05/15/38) (a) (e) (j) | | 1,740,000 | | 1,637,530 |
Bank of America Corp., 8.00% (callable at 100 beginning 01/30/18) (d) | | 1,452,000 | | 1,360,335 |
Bank of America Corp., 8.13% (callable at 100 beginning 05/15/18) (d) | | 397,000 | | 375,268 |
Barclays Bank Plc, 7.70% (callable at 100 beginning 04/25/18) (a) (d) (j) | | 499,000 | | 508,536 |
BNP Paribas Capital Trust, 9.00% (callable at 100 beginning 10/27/10) (a) (d) (j) | | 198,000 | | 206,629 |
CIT Group Inc., 6.10%, 03/15/67 (callable at 100 beginning 03/15/17) (e) | | 980,000 | | 450,565 |
Citigroup Capital XXI, 8.30%, 12/21/57 (callable at 100 beginning 12/21/37) (e) | | 1,181,000 | | 1,115,253 |
Citigroup Inc., 8.40% (callable at 100 on 04/30/18) (d) | | 913,000 | | 867,907 |
Comerica Capital Trust II, 6.58%, 02/20/37 (callable at 100 beginning 02/20/32) (e) | | 1,634,000 | | 1,028,962 |
Countrywide Financial Corp., 4.50%, 06/15/10 | | 15,000 | | 13,960 |
Countrywide Financial Corp., 5.80%, 06/07/12 | | 153,000 | | 144,708 |
Countrywide Financial Corp., 6.25%, 05/15/16 (c) | | 867,000 | | 771,928 |
Countrywide Home Loans Inc., 4.00%, 03/22/11 | | 162,000 | | 147,482 |
Credit Suisse New York, 6.00%, 02/15/18 | | 494,000 | | 475,681 |
Financial Security Assurance Holdings Ltd., 6.40%, 12/15/66 (callable at 100 beginning 12/15/36) (a) (e) (j) | | 1,012,000 | | 636,244 |
Ford Motor Credit Co., 7.38%, 02/01/11 | | 500,000 | | 405,758 |
Ford Motor Credit Co., 7.16%, 04/15/12 (b) | | 450,000 | | 421,759 |
General Motors Acceptance Corp., 6.88%, 09/15/11 | | 1,000,000 | | 718,572 |
Goldman Sachs Capital II, 5.79% (callable at 100 on 06/01/12) (d) | | 1,200,000 | | 834,432 |
The accompanying notes are an integral part of the financial statements.
| | |
| 10 | | Montgomery Street Income Securities, Inc. |
| | | | |
| | | Principal
Amount ($) (f) | | Value ($) |
| | | | | |
HBOS Plc, 5.92% (callable at 100 beginning 10/01/15) (a) (d) (j) | | 600,000 | | 427,321 |
HSBC Bank USA, 5.63%, 08/15/35 | | 315,000 | | 265,342 |
HSBC Holdings Plc, 6.50%, 05/02/36 | | 500,000 | | 464,884 |
ILFC E-Capital Trust II, 6.25%, 12/21/65 (callable at 100 beginning 12/21/15) (a) (e) (j) | | 4,490,000 | | 3,747,641 |
International Lease Finance Corp., 6.38%, 03/25/13 | | 366,000 | | 334,073 |
Janus Capital Group Inc., 6.70%, 06/15/17 | | 840,000 | | 806,194 |
JPMorgan Chase & Co., 7.90% (callable at 100 on 04/30/18) (d) | | 1,674,000 | | 1,569,609 |
JPMorgan Chase Capital XV, 5.88%, 03/15/35 | | 205,000 | | 169,145 |
Kazkommerts International Bank, 8.00%, 11/03/15 (a) (j) | | 190,000 | | 156,750 |
Lincoln National Corp., 6.05%, 04/20/67 (callable at 100 beginning 04/20/17) (e) | | 260,000 | | 219,224 |
Mellon Capital IV, 6.24% (callable at 100 beginning 06/20/12) (d) | | 570,000 | | 451,363 |
Merrill Lynch & Co. Inc., 5.45%, 02/05/13 | | 750,000 | | 707,402 |
Northgroup Preferred Capital Corp., 6.38% (callable at 100 beginning 10/15/17) (a) (d) (i) | | 515,000 | | 354,042 |
PNC Preferred Funding Trust I, 6.11% (callable at 100 beginning 03/15/12) (a) (d) (j) | | 1,200,000 | | 928,636 |
Progressive Corp., 6.70%, 06/15/37 (callable at 100 beginning 06/15/17) (e) | | 2,175,000 | | 1,907,201 |
Prudential Financial Inc., 8.88%, 06/15/38 (callable at 100 beginning 06/15/18) (c) (e) | | 1,380,000 | | 1,379,611 |
RBS Capital Trust IV, 3.60% (callable at 100 beginning 09/30/14) (b) (d) | | 1,850,000 | | 1,464,046 |
RSHB Capital SA , 6.97%, 09/21/16 | | 300,000 | | 286,980 |
State Street Capital Trust IV, 3.78%, 06/15/37 (b) | | 670,000 | | 514,385 |
TNK-BP Finance SA, 7.50%, 03/13/13 (a) (j) | | 300,000 | | 295,500 |
TNK-BP Finance SA, 7.50%, 07/18/16 (a) (j) | | 300,000 | | 283,860 |
Travelers Cos. Inc., 6.25%, 03/15/37 (callable at 100 beginning 03/15/17) (e) | | 221,000 | | 189,870 |
UBS Preferred Funding Trust I, 8.62% (callable at 100 beginning 10/01/10) (d) | | 1,030,000 | | 1,034,985 |
UniCredito Italiano Capital Trust II, 9.20% (callable at 100 beginning 10/15/10) (a) (d) (j) | | 520,000 | | 533,175 |
USB Capital IX, 6.19% (callable at 100 beginning 04/15/11) (d) | | 700,000 | | 532,000 |
USB Realty Corp., 6.09% (callable at 100 beginning 01/15/12) (a) (d) (j) | | 700,000 | | 511,000 |
VIP Finance Ireland Ltd. for OJSC Vimpel Communications, 8.38%, 04/30/13 (a) (j) | | 200,000 | | 197,165 |
The accompanying notes are an integral part of the financial statements.
| | |
| Montgomery Street Income Securities, Inc. | | 11 |
| | | | |
| | | Principal
Amount ($) (f) | | Value ($) |
| | | | | |
Wachovia Corp., 7.98% (callable at 100 beginning 03/15/18) (d) | | 840,000 | | 771,456 |
Wells Fargo Capital XIII, 7.70% (callable at 100 on 03/26/13) (d) | | 1,088,000 | | 1,081,523 |
ZFS Finance USA Trust I, 6.50%, 05/09/37 (callable at 100 beginning 05/09/17) (a) (e) (j) | | 582,000 | | 507,973 |
| | | | |
| | | | 35,263,971 |
| Health Care 1.6% | | | | |
Aetna Inc., 6.63%, 06/15/36 | | 560,000 | | 537,746 |
Cigna Corp., 6.15%, 11/15/36 | | 184,000 | | 162,080 |
Covidien International Finance SA, 5.45%, 10/15/12 | | 300,000 | | 304,131 |
HCA Inc., 9.25%, 11/15/16 | | 330,000 | | 339,900 |
UnitedHealth Group Inc., 4.88%, 02/15/13 | | 695,000 | | 672,510 |
Wyeth, 6.50%, 02/01/34 | | 400,000 | | 414,745 |
Wyeth, 5.95%, 04/01/37 | | 470,000 | | 453,661 |
| | | | |
| | | | 2,884,773 |
| Industrials 2.3% | | | | |
Bombardier Inc., 6.30%, 05/01/14 (a) (j) | | 1,060,000 | | 1,012,300 |
Canadian Pacific Railway Ltd., 5.75%, 05/15/13 | | 517,000 | | 514,020 |
General Electric Capital Corp., 5.63%, 05/01/18 | | 460,000 | | 444,845 |
Honeywell International Inc., 5.70%, 03/15/36 | | 250,000 | | 236,366 |
Noble Group Ltd., 8.50%, 05/30/13 (a) (c) (j) | | 200,000 | | 197,000 |
Norfolk Southern Corp., 5.75%, 04/01/18 (a) (j) | | 411,000 | | 404,501 |
Systems 2001 Asset Trust LLC, 7.16%, 12/15/11 (a) (i) | | 244,395 | | 252,930 |
Tyco Electronics Group SA, 6.55%, 10/01/17 | | 262,000 | | 264,350 |
Waste Management Inc., 6.10%, 03/15/18 | | 847,000 | | 845,053 |
| | | | |
| | | | 4,171,365 |
| Information Technology 1.7% | | | | |
Agilent Technologies Inc., 6.50%, 11/01/17 | | 426,000 | | 414,938 |
International Business Machines Corp., 8.38%, 11/01/19 | | 250,000 | | 303,346 |
Nortel Networks Ltd., 10.75%, 07/15/16 | | 750,000 | | 742,500 |
Oracle Corp., 6.50%, 04/15/38 | | 705,000 | | 706,747 |
Tyco Electronics Group SA, 6.00%, 10/01/12 | | 250,000 | | 252,428 |
Xerox Corp., 6.35%, 05/15/18 | | 720,000 | | 710,712 |
| | | | |
| | | | 3,130,671 |
| Materials 1.3% | | | | |
Evraz Group SA, 8.88%, 04/24/13 (a) (j) | | 200,000 | | 200,240 |
Georgia-Pacific LLC, 8.13%, 05/15/11 | | 375,000 | | 370,313 |
Huntsman International LLC, 7.88%, 11/15/14 | | 155,000 | | 141,825 |
International Paper Co., 7.40%, 06/15/14 | | 465,000 | | 464,103 |
The accompanying notes are an integral part of the financial statements.
| | |
| 12 | | Montgomery Street Income Securities, Inc. |
| | | | |
| | | Principal
Amount ($) (f) | | Value ($) |
| | | | | |
MHP SA, 10.25%, 11/30/11 (a) (i) | | 200,000 | | 198,510 |
Momentive Performance Materials Inc., 9.75%, 12/01/14 | | 335,000 | | 286,425 |
Newmont Mining Corp., 5.88%, 04/01/35 | | 395,000 | | 338,073 |
Pliant Corp., 11.63%, 06/15/09 | | 5 | | 5 |
Sino-Forest Corp. 9.13%, 8/17/11 | | 180,000 | | 183,600 |
Vitro SAB de CV, 8.63%, 02/01/12 | | 279,000 | | 253,053 |
| | | | |
| | | | 2,436,147 |
| Telecommunication Services 4.3% | | | | |
AT&T Inc., 6.15%, 09/15/34 | | 500,000 | | 467,186 |
Citizens Communications Co., 9.00%, 08/15/31 | | 400,000 | | 360,000 |
COX Communications Inc., 6.25%, 06/01/18 (a) (j) | | 957,000 | | 934,218 |
Embarq Corp., 7.08%, 06/01/16 | | 77,000 | | 73,131 |
Intelsat Bermuda Ltd., 9.25%, 06/15/16 | | 255,000 | | 256,913 |
Maxcom Telecomunicaciones SAB de CV, 11.00%, 12/15/14 | | 300,000 | | 316,800 |
Qwest Communications International Inc., 7.50%, 02/15/14 | | 800,000 | | 760,000 |
Rogers Communications Inc., 8.75%, 05/01/32 | | 110,000 | | 122,722 |
Telecom Italia Capital SA, 4.00%, 01/15/10 | | 360,000 | | 355,160 |
Telecom Italia Capital SA, 5.25%, 11/15/13 | | 330,000 | | 311,733 |
Telecom Italia Capital SA, 4.95%, 09/30/14 | | 365,000 | | 334,067 |
Telecom Italia Capital SA, 7.72%, 06/04/38 | | 852,000 | | 865,750 |
Verizon Communications Inc., 5.50%, 02/15/18 | | 238,000 | | 226,412 |
Verizon New Jersey Inc., 5.88%, 01/17/12 | | 542,000 | | 549,552 |
Vodafone Group Plc, 6.15%, 02/27/37 | | 1,268,000 | | 1,159,608 |
Windstream Corp., 8.63%, 08/01/16 | | 670,000 | | 668,325 |
| | | | |
| | | | 7,761,577 |
| Utilities 4.3% | | | | |
Abu Dhabi National Energy Co., 5.62%, 10/25/12 (a) (j) | | 775,000 | | 780,939 |
American Electric Power Co. Inc., 5.38%, 03/15/10 | | 1,000,000 | | 1,010,505 |
CenterPoint Energy Resources Corp., 6.63%, 11/01/37 (c) | | 120,000 | | 111,152 |
Duke Energy Indiana Inc., 8.85%, 01/15/22 | | 1,225,000 | | 1,495,480 |
FirstEnergy Corp., 6.45%, 11/15/11 | | 500,000 | | 513,050 |
Florida Power Corp., 5.80%, 09/15/17 | | 195,000 | | 199,614 |
Northern States Power Co., 6.25%, 06/01/36 | | 400,000 | | 408,892 |
Puget Sound Energy Inc., 7.02%, 12/01/27 | | 1,000,000 | | 1,014,253 |
Rede Empresas de Energia Eletrica SA, 11.13% (callable at 100 beginning 09/30/14) (a) (d) (i) | | 300,000 | | 294,000 |
SPI Electricity & Gas Australia Holdings Pty Ltd.,
6.15%, 11/15/13 (a) (i) | | 2,000,000 | | 2,014,690 |
| | | | |
| | | | 7,842,575 |
| |
Total Corporate Bonds (Cost $87,589,007) | | | | 81,184,086 |
The accompanying notes are an integral part of the financial statements.
| | |
| Montgomery Street Income Securities, Inc. | | 13 |
| | | | |
| | | Principal
Amount ($) (f) | | Value ($) |
| | | | | |
Non-U.S. Government Agency Asset-Backed Securities 17.0% |
Banc of America Mortgage Securities Inc.,
(2005, H, 2A5), 4.80%, 09/25/35 (b) (i) | | 1,065,000 | | 1,010,007 |
Bayview Commercial Asset Trust, Interest Only
(2007, 2A, IO), 1.30%, 07/25/37 (a) (b) (h) (i) | | 6,499,514 | | 675,950 |
Bayview Commercial Asset Trust, Interest Only
(2007, 4A, IO), 1.44%, 09/25/37 (a) (h) (i) | | 6,889,995 | | 826,799 |
Bayview Financial Acquisition Trust, (2007, A, M3)
4.13%, 05/28/37 (b) (h) (i) | | 800,000 | | 280,000 |
Bear Stearns Commercial Mortgage Securities Inc.,
(2005, T20, A4A) 5.30%, 10/12/42 | | 580,000 | | 556,949 |
Bear Stearns Commercial Mortgage Securities Inc.,
(2007, PW15, A4) 5.33%, 02/11/44 | | 600,000 | | 554,974 |
Capital Auto Receivables Asset Trust, (2006, SN1A, C)
5.77%, 05/20/10 (a) (i) | | 150,000 | | 147,757 |
Capital Auto Receivables Asset Trust, (2006, SN1A, D)
6.15%, 04/20/11 (a) (i) | | 200,000 | | 193,360 |
CBA Commercial LLC, (2006, 2A, X1)
2.15%, 01/25/39 (a) (b) (h) (i) | | 8,646,810 | | 843,064 |
Citigroup Commercial Mortgage Trust, (2006, C5, ASB) 5.41%, 10/15/49 | | 1,000,000 | | 960,791 |
Citigroup Mortgage Loan Trust Inc., (2004, NCM2, 1CB2) 6.75%, 08/25/34 (i) | | 608,658 | | 590,018 |
Citigroup Mortgage Loan Trust Inc., (2007, WFH1, M11) 4.98%, 01/25/37 (a) (b) (i) | | 225,000 | | 18,424 |
Citigroup/Deutsche Bank Commercial Mortgage Trust, (2007, CD4, A4) 5.32%, 12/11/49 | | 1,200,000 | | 1,109,297 |
Countrywide Alternative Loan Trust, (2004, 14T2, A4) 5.50%, 08/25/34 (i) | | 351,680 | | 338,157 |
Countrywide Alternative Loan Trust, (2004, 35T2, A1) 6.00%, 02/25/35 (i) | | 249,162 | | 241,405 |
Countrywide Alternative Loan Trust, (2005, 28CB, 3A5) 6.00%, 08/25/35 (i) | | 646,966 | | 620,237 |
Credit Suisse Mortgage Capital Certificates, (2007, C2, A2) 5.45%, 01/15/49 | | 1,000,000 | | 980,124 |
Credit-Based Asset Servicing and Securitization LLC,
(2006, SC1, A) 2.75%, 05/25/36 (a) (b) (i) | | 147,297 | | 113,373 |
CW Capital Cobalt Ltd., (2007, C2, A3) 5.48%, 04/15/47 | | 450,000 | | 418,629 |
Ford Credit Auto Owner Trust, (2006, C, D)
6.89%, 05/15/13 (a) (i) | | 1,060,000 | | 953,098 |
GE Business Loan Trust, Interest Only (2006, 1A, IO)
0.60%, 05/15/34 (a) (b) (h) (i) | | 29,470,775 | | 213,368 |
GE Business Loan Trust, (2006, 1A, D)
3.47%, 05/15/34 (a) (b) (h) (j) | | 444,532 | | 263,937 |
The accompanying notes are an integral part of the financial statements.
| | |
| 14 | | Montgomery Street Income Securities, Inc. |
| | | | |
| | | Principal
Amount ($) (f) | | Value ($) |
| | | | | |
GMAC Commercial Mortgage Securities Inc., (2004, C3, A5) 4.86%, 12/10/41 | | 1,000,000 | | 951,548 |
GMAC Mortgage Corp. Loan Trust, (2006, HE3, A2)
5.75%, 10/25/36 | | 620,000 | | 455,803 |
Goldman Sachs Mortgage Securities Corp., (2007, GKK1, A2) 5.70%, 12/20/49 (a) (b) (h) (i) | | 250,000 | | 84,050 |
Greenwich Capital Commercial Funding Corp., (2006, FL4A, ONW) 3.65%, 11/05/21 (a) (b) (h) (i) | | 200,001 | | 178,001 |
Greenwich Capital Commercial Funding Corp., (2006, FL4A, PNW) 3.85%, 11/05/21 (a) (b) (h) (i) | | 190,001 | | 165,301 |
Greenwich Capital Commercial Funding Corp., (2007, GG11, A4) 5.74%, 08/10/17 | | 850,000 | | 803,485 |
JPMorgan Chase Commercial Mortgage Securities Corp., (2007, C1, A4) 5.72%, 01/15/17 | | 1,000,000 | | 938,403 |
JPMorgan Chase Commercial Mortgage Securities Corp., (2007, CB19, A4) 5.94%, 02/12/49 (b) | | 925,000 | | 879,600 |
JPMorgan Chase Commercial Mortgage Securities Corp., (2008, C2, A4) 6.07%, 02/12/51 | | 890,000 | | 859,724 |
JPMorgan Chase Commercial Mortgage Securities Corp., (2007, CB20, B) 6.40%, 02/12/51 (a) (b) (j) | | 550,000 | | 415,320 |
Lehman Brothers Small Balance Commercial, (2006, 2A, 2A2) 5.62%, 09/25/36 (a) (j) | | 255,000 | | 222,044 |
Marlin Leasing Receivables LLC, (2006, 1A, A4)
5.33%, 09/16/13 (a) (j) | | 660,000 | | 671,081 |
Morgan Stanley Capital I, (2007, IQ13, A4) 5.36%, 03/15/44 | | 1,000,000 | | 924,493 |
Nationstar NIM Trust, (2007, A, A) 9.97%, 03/25/37 (a) (h) (i) | | 24,562 | | 12,281 |
Option One Mortgage Loan Trust, (2007, FXD2, M6)
6.99%, 03/25/37 (i) | | 725,000 | | 96,708 |
Option One Mortgage Loan Trust, (2007, FXD2, M7)
6.99%, 03/25/37 (i) | | 500,000 | | 59,696 |
Option One Mortgage Loan Trust, (2007, FXD2, M8)
6.99%, 03/25/37 (i) | | 475,000 | | 54,242 |
Prudential Securities Secured Financing Corp., (1999, C2, A2) 7.19%, 06/16/31 | | 681,174 | | 688,610 |
Residential Asset Securitization Trust, (2005, A1, A3)
5.50%, 04/25/35 (i) | | 2,500,000 | | 2,120,343 |
Wachovia Bank Commercial Mortgage Trust, (2006, C27, AM) 5.80%, 07/15/45 | | 760,000 | | 706,906 |
Wachovia Bank Commercial Mortgage Trust, (2007, C32, A3) 5.93%, 06/15/49 (b) | | 1,010,000 | | 958,344 |
Washington Mutual Commercial Mortgage Securities Trust, (2007, SL3, AJ) 6.31%, 03/23/45 (a) (b) (j) | | 890,000 | | 595,604 |
Washington Mutual Mortgage Pass-Through Certificates, (2005, AR16, 1A3) 5.10%, 12/25/35 (b) (i) | | 1,320,000 | | 1,244,181 |
The accompanying notes are an integral part of the financial statements.
| | |
| Montgomery Street Income Securities, Inc. | | 15 |
| | | | | | |
| | | | | Principal
Amount ($) (f) | | Value ($) |
| | | | | | | |
Wells Fargo Mortgage Backed Securities Trust,
(2006, A, A3) 5.00%, 03/25/21 | | | | 1,857,321 | | 1,771,420 |
Wells Fargo Mortgage Backed Securities Trust,
(2005, AR10, 2A4) 4.11%, 06/25/35 (b) (i) | | | | 1,622,858 | | 1,606,834 |
Wells Fargo Mortgage Backed Securities Trust,
(2006, AR8, 2A3) 5.24%, 04/25/36 (i) | | | | 1,545,449 | | 1,521,444 |
| |
Total Non-U.S. Government Agency Asset-Backed Securities (Cost $35,111,850) | | | | | | 30,895,184 |
| | | | | | |
Government and Agency Obligations 33.0% | | | | | | |
| Government Securities 15.1% | | | | | | |
| Sovereign 2.4% | | | | | | |
Argentina Government International Bond,
7.00%, 10/03/15 | | | | 250,000 | | 174,625 |
Democratic Socialist Republic of Sri Lanka,
8.25%, 10/24/12 (i) | | | | 200,000 | | 179,974 |
El Salvador Government International Bond,
7.65%, 06/15/35 | | | | 255,000 | | 263,925 |
United Kingdom Treasury Bond, 5.00%, 03/07/18 | | GBP | | 1,846,000 | | 3,636,368 |
Venezuela Government International Bond,
5.75%, 02/26/16 | | | | 75,000 | | 58,913 |
| | | | | | |
| | | | | | 4,313,805 |
| U.S. Treasury Securities 12.7% | | | | | | |
U.S. Treasury Bond, 5.00%, 05/15/37 (c) | | | | 1,378,000 | | 1,480,920 |
U.S. Treasury Bond, 4.38%, 02/15/38 (c) | | | | 600,000 | | 584,813 |
U.S. Treasury Note, 4.00%, 09/30/09 (c) | | | | 7,997,000 | | 8,158,811 |
U.S. Treasury Note, 1.75%, 03/31/10 (c) | | | | 9,363,000 | | 9,242,302 |
U.S. Treasury Note, 2.50%, 03/31/13 (c) | | | | 937,000 | | 903,986 |
U.S. Treasury Note, 3.50%, 05/31/13 (c) | | | | 74,000 | | 74,549 |
U.S. Treasury Note, 3.88%, 05/15/18 (c) | | | | 2,707,600 | | 2,684,967 |
| | | | | | |
| | | | | | 23,130,348 |
| |
Total Government Securities (Cost $27,606,850) | | | | | | 27,444,153 |
| | | | | | |
| U.S. Government Agency Securities 17.9% | | | | | | |
| Federal Farm Credit Bank 0.1% | | | | | | |
Federal Farm Credit Bank, 7.56% (callable at 100 beginning 12/15/13) (d) | | | | 170,000 | | 162,076 |
The accompanying notes are an integral part of the financial statements.
| | |
| 16 | | Montgomery Street Income Securities, Inc. |
| | | | |
| | | Principal
Amount ($) (f) | | Value ($) |
| | | | | |
| Federal Home Loan Mortgage Corp. 5.3% | | | | |
Federal Home Loan Mortgage Corp., 5.50%, 12/15/16 | | 490,092 | | 500,300 |
Federal Home Loan Mortgage Corp., 5.00%, 05/15/23 | | 923,040 | | 928,522 |
Federal Home Loan Mortgage Corp., 4.50%, 02/15/26 | | 394,824 | | 396,206 |
Federal Home Loan Mortgage Corp., 5.50%, 07/15/27 | | 424,325 | | 431,814 |
Federal Home Loan Mortgage Corp., 6.00%, 05/15/30 | | 790,000 | | 812,162 |
Federal Home Loan Mortgage Corp., 4.50%, 04/15/32 | | 1,375,000 | | 1,334,202 |
Federal Home Loan Mortgage Corp., 4.50%, 07/15/32 | | 410,000 | | 399,124 |
Federal Home Loan Mortgage Corp., 6.00%, 09/15/32 | | 1,500,000 | | 1,543,288 |
Federal Home Loan Mortgage Corp., 5.00%, 12/15/32 | | 895,000 | | 874,893 |
Federal Home Loan Mortgage Corp., 5.00%, 10/15/33 | | 1,175,000 | | 1,142,902 |
Federal Home Loan Mortgage Corp., 5.00%, 08/15/34 | | 1,245,000 | | 1,210,308 |
| | | | |
| | | | 9,573,721 |
| Federal National Mortgage Association 12.0% | | | | |
Federal National Mortgage Association,
9.00%, 05/01/09 (i) | | 11,924 | | 11,970 |
Federal National Mortgage Association, 5.50%, 03/25/17 | | 673,284 | | 688,758 |
Federal National Mortgage Association, 6.50%, 05/01/17 | | 184,981 | | 192,974 |
Federal National Mortgage Association, 6.00%, 01/01/23 | | 528,194 | | 537,172 |
Federal National Mortgage Association, 4.50%, 10/01/23 | | 599,006 | | 568,863 |
Federal National Mortgage Association, 5.50%, 05/01/25 | | 1,820,874 | | 1,821,959 |
Federal National Mortgage Association, 7.00%, 03/01/31 | | 3,720,862 | | 3,980,588 |
Federal National Mortgage Association, 5.00%, 08/25/33 | | 295,000 | | 286,747 |
Federal National Mortgage Association, 5.00%, 12/25/33 | | 1,060,000 | | 1,032,077 |
Federal National Mortgage Association, 5.00%, 06/25/34 | | 604,550 | | 614,842 |
Federal National Mortgage Association, 7.00%, 10/01/35 | | 2,787,873 | | 2,931,846 |
Federal National Mortgage Association, 6.50%, 04/01/37 | | 4,373,786 | | 4,508,085 |
Federal National Mortgage Association, 6.00%, 07/01/37 | | 4,050,337 | | 4,091,167 |
Federal National Mortgage Association, 6.00%, 08/25/44 | | 512,173 | | 518,111 |
| | | | |
| | | | 21,785,159 |
| Government National Mortgage Association 0.5% | | |
Government National Mortgage Association,
6.50%, 08/20/34 | | 845,578 | | 873,820 |
| |
Total U.S. Government Agency Securities
(Cost $32,144,814) | | | | 32,394,776 |
| |
Total Government and Agency Obligations
(Cost $59,751,664) | | | | 59,838,929 |
The accompanying notes are an integral part of the financial statements.
| | |
| Montgomery Street Income Securities, Inc. | | 17 |
| | | | | | |
| | | Shares/Principal
Amount ($) (f) | | Value ($) | |
| | | | | | |
Preferred Stocks 0.6% | | | | | | |
| Financials 0.6% | | | | | | |
Federal Home Loan Mortgage Corp., 8.38%, Series Z (callable at 25 beginning 12/31/12) (d) | | 21,659 | | | 526,314 | |
Federal National Mortgage Association, 8.25% (callable at 25 beginning 12/31/10) (c) (d) | | 25,125 | | | 576,618 | |
| | |
Total Preferred Stocks (Cost $1,172,591) | | | | | 1,102,932 | |
| | | | | | |
Short-Term Investments 18.1% | | | | | | |
| Commercial Paper 3.5% | | | | | | |
BNP Paribas, 3.00%, 07/01/08 | | 1,500,000 | | | 1,500,000 | |
Illinois Tool Works Inc., 2.45%, 07/01/08 | | 1,688,000 | | | 1,688,000 | |
Nestle Capital, 2.53%, 07/01/08 (a) (j) | | 1,500,000 | | | 1,500,000 | |
Societe Generale, 2.55% 7/01/2008 | | 1,600,000 | | | 1,600,000 | |
| | | | | | |
| | | | | 6,288,000 | |
| Securities Lending Collateral 14.4% | | | | | | |
Mellon GSL Delaware Business Trust Collateral Fund, 2.70% | | 26,368,616 | | | 26,139,209 | |
| U.S. Treasury Securities 0.2% | | | | | | |
U.S. Treasury Bill, 1.99%, 09/11/08 (g) | | 375,000 | | | 373,740 | |
| | |
Total Short-Term Investments (Cost $33,030,131) | | | | | 32,800,949 | |
| | |
Total Investments 113.4% (Cost $216,655,243) | | | | | 205,822,080 | |
Other Assets and Liabilities, Net (13.4%) | | | | | (24,358,224 | ) |
| | |
Total Net Assets — 100% | | | | $ | 181,463,856 | |
Notes to the Investment Portfolio
| (a) | Rule 144A or Section 4(2) of the Securities Act of 1933, as amended, provide an exemption from the registration requirements for resale of this security to an institutional investor. |
| (b) | Floating rate notes are securities whose yields vary with a designated market index or market rate, such as the coupon-equivalent of the U.S. Treasury bill rate. These securities are shown at their current rate as of June 30, 2008. |
| (c) | All or portion of the security has been loaned. |
| (d) | Perpetual maturity security. |
| (e) | Interest rate is fixed until stated call date and variable thereafter. |
| (f) | Principal amounts are listed in United States Dollars unless otherwise noted. |
| (g) | All or a portion of the security pledged as collateral for open futures contracts. |
The accompanying notes are an integral part of the financial statements.
| | |
| 18 | | Montgomery Street Income Securities, Inc. |
| (h) | Security fair valued in good faith in accordance with the procedures established by the Board of Directors. As of June 30, 2008, the value of fair valued securities was $3,542,751 (2.0% of net assets). |
| (i) | Illiquid Security: At June 30, 2008 the total value of illiquid securities was $18,138,281 (10.0% of net assets). |
| (j) | Rule 144A or Section 4(2) Liquid Security: The Fund has deemed this security to be liquid based on procedures approved by the Board of Directors. As of June 30, 2008, the aggregate value of Rule 144A and Section 4(2) Liquid Securities was $20,405,986 (11.2% of net assets). |
Abbreviations:
BRL – Brazilian Real
GBP – British Pound
NIM – Net Interest Margin
USD – United States Dollar
| | | | | | | | | | | | | | |
Forward Foreign Currency
Contracts Purchased/Sold | | Settlement
Date | | Notional
Amount | | Currency
Value | | | Unrealized
Gain/(Loss) | |
| USD/GBP | | 09/19/08 | | (1,957,119) | | GBP | | $ | (3,873,813 | ) | | $ | (54,123 | ) |
| | | | | | | | | |
| Futures | | Contracts
Long/(Short) | | | | | Unrealized
Appreciation/
(Depreciation) | |
U.S. Treasury Note Future, 2-Year,
6.00% Expiration September 2008 | | 48 | | | USD | | $ | 20,865 | |
U.S. Treasury Note Future, 5-Year,
6.00% Expiration September 2008 | | 236 | | | USD | | | 247,570 | |
U.S. Treasury Note Future, 10-Year,
6.00% Expiration September 2008 | | (11 | ) | | USD | | | (19,534 | ) |
U.S. Treasury Bond Future, 20-Year,
6.00% Expiration September 2008 | | (44 | ) | | USD | | | (115,375 | ) |
| | | | | | | | $ | 133,526 | |
Fair Value Measurements
In September 2006, the Financial Accounting Standards Board (“FASB”) issued Statement on Financial Accounting Standards (“SFAS”) No. 157, “Fair Value Measurements.” This standard establishes a single authoritative definition of fair value, sets out a framework for measuring fair value and requires additional disclosures about fair value measurements. The changes to current generally accepted accounting principles from the application of this statement relate to the definition of fair value, the methods used to measure fair value, and the expanded disclosures about fair value measurements.
The accompanying notes are an integral part of the financial statements.
| | |
| Montgomery Street Income Securities, Inc. | | 19 |
Various inputs are used in determining the value of the Fund’s investments under SFAS No. 157 guidance. These inputs are summarized into three broad categories. Level 1 includes exchange-listed prices, broker quotes in active markets, and exchange traded derivative contracts. Level 2 includes value determined from significant observable inputs such as vendor evaluated debt instruments, securities valued at amortized cost, and modeled over-the-counter derivative contracts. Level 3 includes value determined from significant unobservable inputs including the Fund’s own assumptions in determining the fair value of the investment and certain quotes received from brokers.
The inputs or methodology used for valuing securities are not necessarily an indication of the risk associated with investing in those securities. The following is a summary of the inputs used to value the Fund’s assets requiring disclosure under SFAS No. 157, as noted above, as of June 30, 2008:
| | | | | | |
| | | Investments
in Securities | | Investments in
Derivatives* |
| Level 1 | | $ | 27,242,141 | | $ | 268,435 |
| Level 2 | | | 175,037,188 | | | — |
| Level 3 | | | 3,542,751 | | | — |
| Total | | $ | 205,822,080 | | $ | 268,435 |
The following is a summary of the inputs used to value the Fund’s liabilities requiring disclosure under SFAS No. 157, as noted above, as of June 30, 2008:
| | | | |
| | | Investments
in Derivatives* | |
| Level 1 | | $ | (134,909 | ) |
| Level 2 | | | (54,123 | ) |
| Level 3 | | | — | |
| Total | | $ | (189,032 | ) |
| * | Investments in derivatives include futures contracts and forward foreign currency contracts. These derivatives are valued at the unrealized appreciation/(depreciation) of the instrument. |
The accompanying notes are an integral part of the financial statements.
| | |
| 20 | | Montgomery Street Income Securities, Inc. |
The following table is a reconciliation of securities which represent significant unobservable inputs (Level 3) in determination of the fair value.
| | | | |
| | | Investments
in Securities | |
| Balance at beginning of period | | $ | 5,970,154 | |
| Realized gain / (loss) | | | (957,791 | ) |
| Change in unrealized appreciation / (depreciation) | | | (90,054 | ) |
| Net purchases / (sales) | | | (290,260 | ) |
| Transfers in and / or out of Level 3 during the period | | | (1,089,298 | ) |
| Balance at end of period | | $ | 3,542,751 | |
Restricted Securities
The following table includes Rule 144A securities that have not been deemed liquid based on procedures approved by the Board of Directors.
| | | | | | | | | | | |
| | | Acquisition
Date | | Cost | | Value
End of
Period
06/30/08 | | Percent
of Net
Assets | |
| Bayview Commercial Asset Trust, (2007, 2A, IO) Interest Only, 1.30%, 07/25/37 | | 05/09/07 | | $ | 945,052 | | $ | 675,950 | | 0.4 | % |
| Bayview Commercial Asset Trust, (2007, 4A, IO) Interest Only, 1.44%, 09/25/37 | | 08/08/07 | | | 872,743 | | | 826,799 | | 0.5 | |
| CBA Commercial LLC, (2006, 2A, X1) 2.15%, 01/25/39 | | 01/29/07 | | | 807,623 | | | 843,064 | | 0.5 | |
| Capital Auto Receivables Asset Trust, (2006, SN1A, C) 5.77%, 05/20/10 | | 08/23/06 | | | 149,998 | | | 147,757 | | 0.1 | |
| Capital Auto Receivables Asset Trust, (2006, SN1A, D) 6.15%, 04/20/11 | | 08/23/06 | | | 199,978 | | | 193,360 | | 0.1 | |
| Citigroup Mortgage Loan Trust Inc., (2007, WFH1, M11) 4.98%, 01/25/37 | | 01/12/07 | | | 186,402 | | | 18,424 | | — | |
Credit-Based Asset Servicing and Securitization LLC, (2006, SC1, A)
2.75%, 05/25/36 | | 07/25/07 | | | 143,880 | | | 113,373 | | 0.1 | |
| Ford Credit Auto Owner Trust, (2006, C, D) 6.89%, 05/15/13 | | 11/17/06 | | | 1,059,993 | | | 953,098 | | 0.5 | |
| GE Business Loan Trust, Interest Only (2006, 1A, IO) 0.60%, 05/15/34 | | 06/20/06 | | | 126,346 | | | 213,368 | | 0.1 | |
| Goldman Sachs Mortgage Securities Corp., (2007, GKK1, A2) 5.70%, 12/20/49 | | 08/13/07 | | | 214,827 | | | 84,050 | | — | |
The accompanying notes are an integral part of the financial statements.
| | |
| Montgomery Street Income Securities, Inc. | | 21 |
| | | | | | | | | | | |
| | | Acquisition
Date | | Cost | | Value
End of
Period
06/30/08 | | Percent
of Net
Assets | |
| Greenwich Capital Commercial Funding Corp., (2006, FL4A, ONW) 3.65%, 11/05/21 | | 05/17/07 | | $ | 193,865 | | $ | 178,001 | | 0.1 | % |
| Greenwich Capital Commercial Funding Corp., (2006, FL4A, PNW) 3.85%, 11/05/21 | | 05/17/07 | | | 183,997 | | | 165,301 | | 0.1 | |
| MHP SA, 10.25%, 11/30/11 | | 11/30/06 | | | 200,000 | | | 198,510 | | 0.1 | |
Nationstar NIM Trust, (2007, A, A)
9.97%, 03/25/37 | | 04/26/07 | | | 24,562 | | | 12,281 | | — | |
| Northgroup Preferred Capital Corp., 6.38% (callable at 100 beginning 10/15/17) | | 05/11/07 | | | 515,000 | | | 354,042 | | 0.2 | |
| Rede Empresas de Energia Eletrica SA, 11.13% (callable at 100 beginning 09/30/14) | | 01/28/08 | | | 283,507 | | | 294,000 | | 0.2 | |
| SPI Electricity & Gas Australia Holdings Pty Ltd., 6.15%, 11/15/13 | | 05/15/06 | | | 2,119,916 | | | 2,014,690 | | 1.1 | |
Systems 2001 Asset Trust LLC,
7.16%, 12/15/11 | | 05/15/06 | | | 256,634 | | | 252,930 | | 0.1 | |
| | | | | $ | 8,484,323 | | $ | 7,538,998 | | 4.2 | % |
The accompanying notes are an integral part of the financial statements.
| | |
| 22 | | Montgomery Street Income Securities, Inc. |
| | |
Financial Statements (Unaudited) |
| | | | |
Statement of Assets and Liabilities as of June 30, 2008 (Unaudited) | |
| |
| Assets | | | | |
| Investments in securities, at value (a) (cost $216,655,243) | | $ | 205,822,080 | |
| Foreign currency (cost $155,323) | | | 158,874 | |
| Receivables: | | | | |
Interest | | | 1,848,038 | |
Investment securities sold | | | 388,292 | |
Variation margin | | | 35,656 | |
| Other assets | | | 57,912 | |
| Total assets | | | 208,310,852 | |
| |
| Liabilities | | | | |
| Cash overdraft | | | 38,925 | |
| Accrued management and investment advisory fee | | | 111,781 | |
| Accrued administrative fee | | | 33,962 | |
| Payables: | | | | |
Investment securities purchased | | | 161,776 | |
Forward foreign currency contracts | | | 54,123 | |
Variation margin | | | 1,031 | |
Interest | | | 802 | |
Return of collateral for securities on loan | | | 26,368,616 | |
| Other liabilities | | | 75,980 | |
| Total liabilities | | | 26,846,996 | |
| Net assets, at value | | $ | 181,463,856 | |
| Net Assets | | | | |
| Net assets consist of: | | | | |
| Paid-in capital | | $ | 202,517,121 | |
| Undistributed net investment income | | | 2,756,552 | |
| Net unrealized depreciation on investments | | | (10,749,815 | ) |
| Accumulated net realized loss | | | (13,060,002 | ) |
| Net assets, at value | | $ | 181,463,856 | |
| Net Asset Value per share ($181,463,856 / 10,370,260 shares of common stock outstanding, $.01 par value, 30,000,000 shares authorized) | | $ | 17.50 | |
| (a) | Includes value of securities on loan of $25,859,422. |
The accompanying notes are an integral part of the financial statements.
| | |
| Montgomery Street Income Securities, Inc. | | 23 |
| | | | |
Statement of Operations for the six months ended June 30, 2008 (Unaudited) | |
| |
| Investment Income | | | | |
| Income: | | | | |
| Interest | | $ | 5,374,738 | |
| Securities lending income | | | 194,297 | |
| Dividends | | | 54,738 | |
| Total income | | | 5,623,773 | |
| Expenses: | | | | |
| Management and investment advisory fee | | | 231,329 | |
| Administrative fee | | | 209,817 | |
| Directors’ fees and expenses | | | 50,556 | |
| Legal | | | 37,916 | |
| Stockholder reporting | | | 32,862 | |
| Insurance | | | 27,806 | |
| Audit fees | | | 25,278 | |
| Stockholder services | | | 13,954 | |
| NYSE listing fee | | | 12,638 | |
| Custodian fees | | | 8,494 | |
| Other | | | 10,148 | |
| Total expenses | | | 660,798 | |
| Net investment income | | | 4,962,975 | |
|
| Realized and Unrealized Gain (Loss) on Investment Transactions | |
| Net realized loss from investment transactions | | | (5,465,394 | ) |
| Net realized gain from futures contracts | | | 860,192 | |
| Net realized loss from foreign currency related items | | | (100,970 | ) |
| Net change in unrealized appreciation (depreciation) during the period on investments | | | (3,261,918 | ) |
| Net change in unrealized appreciation (depreciation) during the period on futures contracts | | | (165,582 | ) |
| Net change in unrealized appreciation (depreciation) during the period on foreign currency related items | | | (78,051 | ) |
| Net loss on investment transactions | | | (8,211,723 | ) |
| Net decrease in net assets resulting from operations | | $ | (3,248,748 | ) |
The accompanying notes are an integral part of the financial statements.
| | |
| 24 | | Montgomery Street Income Securities, Inc. |
| | | | | | | | |
Statements of Changes in Net Assets (Unaudited) | |
| | |
| Increase (Decrease) in Net Assets | | Six Months Ended
June 30, 2008 | | | Year Ended
December 31, 2007 | |
| Operations: | | | | | | | | |
| Net investment income | | $ | 4,962,975 | | | $ | 10,924,988 | |
| Net realized gain (loss) on investment transactions, futures contracts and foreign currency related items | | | (4,706,172 | ) | | | 1,116,169 | |
| Net change in unrealized appreciation (depreciation) during the period on investment transactions, futures contracts and foreign currency related items | | | (3,505,551 | ) | | | (8,073,062 | ) |
| Net increase (decrease) in net assets resulting from operations | | | (3,248,748 | ) | | | 3,968,095 | |
Distributions to stockholders from net
investment income | | | (2,697,410 | ) | | | (11,620,203 | ) |
| Fund share transactions: | | | | | | | | |
| Reinvestment of distributions | | | 160,263 | | | | 759,011 | |
| Cost of shares repurchased | | | (367,258 | ) | | | (812,304 | ) |
| Net decrease in net assets from Fund share transactions | | | (206,995 | ) | | | (53,293 | ) |
| Decrease in net assets | | | (6,153,153 | ) | | | (7,705,401 | ) |
| Net assets at beginning of period | | | 187,617,009 | | | | 195,322,410 | |
| Net assets at end of period (including undistributed net investment income of $2,756,552 and $490,987, respectively) | | $ | 181,463,856 | | | $ | 187,617,009 | |
| | |
| Other Information | | | | | | | | |
| Shares outstanding at beginning of period | | | 10,382,446 | | | | 10,384,967 | |
| Shares issued to stockholders in reinvestment of distributions | | | 9,814 | | | | 45,479 | |
| Shares repurchased | | | (22,000 | ) | | | (48,000 | ) |
| Net decrease in Fund shares | | | (12,186 | ) | | | (2,521 | ) |
| Shares outstanding at end of period | | | 10,370,260 | | | | 10,382,446 | |
The accompanying notes are an integral part of the financial statements.
| | |
| Montgomery Street Income Securities, Inc. | | 25 |
| | | | | | | | | | | | | | | | | | | | | | | | |
Financial Highlights (Unaudited) | |
| | | | | | |
| Years ended December 31, | | 2008a | | | 2007 | | | 2006 | | | 2005 | | | 2004 | | | 2003 | |
| | | | | | |
| Selected Per Share Data | | | | | | | | | | | | | | | | | | | | | | | | |
| Net asset value, beginning of period | | $ | 18.07 | | | $ | 18.81 | | | $ | 18.99 | | | $ | 19.62 | | | $ | 19.64 | | | $ | 19.43 | |
| Income from investment operations: | | | | | | | | | | | | | | | | | | | | | | | | |
Incomeb | | | 0.54 | | | | 1.18 | | | | 1.03 | | | | 1.14 | | | | 1.18 | | | | 1.20 | |
Operating expensesb | | | (0.06 | ) | | | (0.13 | ) | | | (0.13 | ) | | | (0.14 | ) | | | (0.14 | ) | | | (0.12 | ) |
Net investment incomeb | | | 0.48 | | | | 1.05 | | | | 0.90 | | | | 1.00 | | | | 1.04 | | | | 1.08 | |
Net realized and unrealized gain (loss) on investment transactions | | | (0.79 | ) | | | (0.67 | ) | | | (0.03 | ) | | | (0.49 | ) | | | 0.17 | | | | 0.42 | |
Total from investment operations | | | (0.31 | ) | | | 0.38 | | | | 0.87 | | | | 0.51 | | | | 1.21 | | | | 1.50 | |
| Less distributions from: | | | | | | | | | | | | | | | | | | | | | | | | |
Net investment income | | | (0.26 | ) | | | (1.12 | ) | | | (1.05 | ) | | | (1.14 | ) | | | (1.23 | ) | | | (1.29 | ) |
| Net asset value, end of period | | $ | 17.50 | | | $ | 18.07 | | | $ | 18.81 | | | $ | 18.99 | | | $ | 19.62 | | | $ | 19.64 | |
| Per share market value, end of period | | $ | 15.84 | | | $ | 16.13 | | | $ | 17.28 | | | $ | 16.91 | | | $ | 18.36 | | | $ | 18.55 | |
| Closing price range on New York Stock Exchange for each share of Common Stock outstanding during the period: | | | | | | | | | | | | | | | | | | | | | | | | |
High ($) | | | 17.27 | | | | 17.80 | | | | 17.57 | | | | 18.85 | | | | 19.39 | | | | 20.45 | |
Low ($) | | | 15.84 | | | | 15.77 | | | | 16.30 | | | | 16.55 | | | | 16.55 | | | | 17.50 | |
| | | | | | |
| Total Return | | | | | | | | | | | | | | | | | | | | | | | | |
| Based on market value (%)c | | | (0.23 | )g | | | (0.23 | ) | | | 8.70 | | | | (1.69 | ) | | | 5.82 | | | | 4.53 | |
| Based on net asset value (%)c | | | (1.50 | )g | | | 2.68 | | | | 5.37 | | | | 3.31 | | | | 6.86 | e | | | 8.22 | |
| | | |
| Ratios to Average Net Assets and Supplemental Data | | | | | | | | | | | | | |
| Net assets, end of period ($ millions) | | | 181 | | | | 188 | | | | 195 | | | | 197 | | | | 204 | | | | 204 | |
| Ratio of expenses before expense reductions (%) | | | 0.71 | f | | | 0.67 | | | | 0.70 | | | | 0.74 | | | | 0.75 | | | | 0.63 | |
| Ratio of expenses after expense reductions (%) | | | 0.71 | f | | | 0.67 | | | | 0.70 | | | | 0.74 | | | | 0.72 | | | | 0.63 | |
| Ratio of net investment income (%) | | | 5.35 | f | | | 5.64 | | | | 4.78 | | | | 5.11 | | | | 5.26 | | | | 5.47 | |
| Portfolio turnover rate (%)d | | | 80 | g | | | 122 | | | | 199 | | | | 157 | | | | 149 | | | | 160 | |
The accompanying notes are an integral part of the financial statements.
| | |
| 26 | | Montgomery Street Income Securities, Inc. |
| a | For the six months ended June 30, 2008. |
| b | Based on average shares outstanding during the period. |
| c | Total return based on net asset value reflects changes in the Fund’s net asset value during the period. Total return based on market value reflects changes in market value. Each figure includes reinvestment of dividends. These figures will differ depending upon the level of any discount from or premium to net asset value. |
| d | The portfolio turnover rates excluding mortgage dollar roll transactions are stated in the Financial Highlights. The portfolio turnover rates for those periods that had mortgage dollar roll transactions were 349%, 376%, and 426%, for the years ended December 31, 2005, 2004, and 2003, respectively. The Fund had no transactions from mortgage dollar rolls for the six months ended June 30, 2008 and for the years ended December 31, 2007 and 2006. |
| e | Total return would have been lower had certain expenses not been reduced. |
| | |
| Montgomery Street Income Securities, Inc. | | 27 |
| | |
Notes to Financial Statements (Unaudited) | | |
A. Significant Accounting Policies
The Fund is registered under the 1940 Act, as a closed-end, diversified management investment company.
The Fund’s financial statements are prepared in accordance with accounting principles generally accepted in the United States of America (“GAAP”) which requires the use of management estimates. Actual results could differ from those estimates. The policies described below are followed consistently by the Fund in the preparation of its financial statements.
Security Valuation. Investments are stated at value determined as of the close of regular trading (generally, 4:00 PM Eastern Time) on the New York Stock Exchange on each day the exchange is open for trading. Debt securities are valued by independent pricing services approved by, or at the direction of, the Board of Directors of the Fund (the “Board”). Such services may use various pricing techniques which take into account appropriate factors such as yield, quality, coupon rate, maturity, type of issue, trading characteristics and other data, as well as broker quotes. If the pricing services are unable to provide valuations, the securities are valued at the most recent bid quotation or evaluated price, as applicable, obtained from a broker/dealer. Fixed income securities with a remaining maturity of sixty (60) days or less, maturing at par, are valued at amortized cost, unless it is determined that such practice does not approximate market value.
Market quotations may not be readily available for certain debt and derivative instruments. If market quotations are not readily available or if it is determined that a quotation of a security does not represent its fair value, then the security is valued at a “fair value” as determined in good faith using procedures adopted by the Board. Although there can be no assurance, in general, the fair value of a security is the amount the owner of such security might reasonably expect to receive upon its current sale. Situations that may require a security to be fair valued include instances where a security is thinly traded or restricted as to resale. In addition, securities may be fair valued based on the occurrence of a significant event. Significant events may be specific to a particular issuer, such as mergers, restructurings or defaults. Alternatively, significant events may affect an entire market, such as natural disasters or government actions. Under the procedures adopted by the Board, the Adviser may rely on independent pricing services or other sources to assist in determining the fair value of a security. Factors considered to determine fair value include the correlation with price movement of similar securities in the same or other markets; the type, cost and investment characteristics of the security; the business and financial condition of the issuer; and trading or other market data. The value of an investment for purposes of calculating the Fund’s net asset value can differ depending on the source and method used to determine the value.
| | |
| 28 | | Montgomery Street Income Securities, Inc. |
Security Transactions and Investment Income. Investment transactions are accounted for on a trade date plus one basis for daily net asset value calculations. However, for financial reporting purposes, investment transactions are reported on trade date. Interest income is recorded on the accrual basis. All premiums and discounts are amortized/accreted for financial reporting purposes. Dividend income is recorded on the ex-dividend date.
Foreign Currency Translations. The accounting records of the Fund are maintained in U.S. dollars. Investment securities and other assets and liabilities denominated in a foreign currency are translated into U.S. dollars generally using exchange rates in effect as of 4:00 PM Eastern Time. Purchases and sales of investment securities, income receipts, and expense payments are translated into U.S. dollars at the exchange rates prevailing on the respective dates of such transactions. The Fund does not isolate that portion of the results of operations resulting from changes in foreign exchange rates on investments from the fluctuations arising from changes in market prices of foreign securities. Such fluctuations are included in net realized gain (loss) on investments and net change in unrealized appreciation (depreciation) on investments, respectively.
Net realized gains and losses on foreign currency related items are considered ordinary income for tax purposes and arise from sales of foreign currencies, currency gains or losses realized between the trade and settlement dates on securities transactions, the difference between the amounts of dividends, interest, and foreign withholding taxes recorded and the U.S. dollar equivalent of the amounts actually received or paid, and the realized gains or losses resulting from portfolio and transaction hedges. Net change in unrealized appreciation (depreciation) on foreign currency related items arises from changes in the fair value of assets and liabilities, other than investments in securities, at period end resulting from changes in exchange rates.
Repurchase Agreements. The Fund may enter into repurchase agreements with certain banks and broker/dealers whereby the Fund agrees to purchase a security with a simultaneous agreement by the seller to repurchase the security back from the Fund at a specified price and date or upon demand. The Fund, through its custodian bank or sub-custodian bank, receives delivery of the underlying securities as collateral, the amount of which at the time of purchase and each subsequent business day is required to be maintained at such a level that the collateral’s value is at least equal to the principal amount of the repurchase price plus accrued interest. The custodian or agent bank holds the collateral in a separate account until the agreement matures. If the counterparty defaults and the value of the collateral declines or if bankruptcy proceedings are commenced with respect to the counterparty, realization of the collateral by the Fund may be delayed or limited. There were no repurchase agreements outstanding at June 30, 2008.
| | |
| Montgomery Street Income Securities, Inc. | | 29 |
When-Issued/Delayed Delivery Securities. The Fund may purchase securities with delivery or payment to occur at a date beyond the normal settlement period. At the time the Fund enters into a commitment to purchase a security, the transaction is recorded and the value of the security is reflected in the net asset value. The price of such security and the date when the security will be delivered and paid for are fixed at the time the transaction is negotiated. The value of the security may vary with market fluctuations. No interest accrues to the Fund until settlement of the trade. Certain risks may arise upon entering into when-issued or delayed delivery securities from the potential inability of counterparties to meet the terms of their contracts or if the issuer does not issue the securities due to political, economic, or other factors. Additionally, losses may arise due to changes in the value of the underlying securities.
Securities Lending. The Fund has entered into a securities lending arrangement with its custodian. Under the terms of the agreement, the Fund receives a fee equal to a percentage of the net income generated by the collateral held during each lending transaction. The custodian is authorized to loan securities on behalf of the Fund to approved borrowers and is required to maintain collateral at least equal in value to the value of the securities loaned. Cash collateral is invested by the custodian in the Mellon GSL Delaware Business Trust Collateral Fund (a pooled investment fund). In the event of bankruptcy or other default of the borrower, the Fund could experience delays in liquidating the loan collateral or recovering the loaned securities and incur expenses related to enforcing its rights. In addition, there could be a decline in the value of the collateral or in the fair value of the securities loaned while the Fund seeks to enforce its rights thereto and the Fund could experience subnormal levels of income or lack of access to income during that period. The Fund bears the risk of any deficiency in the amount of collateral available for return to a borrower due to a loss in an approved investment.
Loan Participations/Assignments. The Fund may invest in U.S. dollar denominated fixed and floating rate loans arranged through private negotiations between a foreign sovereign entity and one or more financial institutions (“Lenders”). The Fund invests in such loans in the form of participations in loans or assignments of all or a portion of loans from third parties. Participations typically result in the Fund having a contractual relationship only with the Lender, not with the sovereign borrower. The Fund has the right to receive payments of principal, interest and any fees to which it is entitled from the Lender selling the participation and only upon receipt by the Lender of the payments from the borrower. In connection with purchasing participations, the Fund generally has no right to enforce compliance by the borrower with the terms of the loan agreement relating to the loan, nor any rights of set-off against the borrower, and the Fund will not benefit directly from any collateral supporting the loan in which it has purchased the participation. As a result,
| | |
| 30 | | Montgomery Street Income Securities, Inc. |
the Fund assumes the credit risk of both the borrower and the Lender that is selling the participation. At June 30, 2008, the Fund held no participations.
Federal Income Taxes. The Fund intends to qualify as a “regulated investment company” and to distribute substantially all net investment income and net capital gains, if any, to its stockholders and otherwise comply with Subchapter M of the Internal Revenue Code applicable to regulated investment companies. Therefore, no federal income tax provision is required.
Distribution of Income and Capital Gains. The amount and timing of distributions are determined in accordance with federal income tax regulations, which may differ from GAAP. Distributions of net investment income are paid quarterly. Net realized gains from investment transactions will be distributed to stockholders at least annually to the extent they exceed available capital loss carryforwards. The Fund uses the specific identification method for determining realized gain or loss on investments sold for both financial and federal income tax reporting purposes.
Contingencies. In the normal course of business, the Fund may enter into contracts with service providers that contain general indemnification clauses. The Fund’s maximum exposure under these arrangements is unknown, as this would involve future claims that may be made against the Fund that have not yet been made. However, based on experience to date, the Fund expects any risk of loss to be remote.
Forward Foreign Currency Contracts. The Fund may enter into forward foreign currency contracts, generally to hedge foreign currency exposure between trade date and settlement date on security purchases and sales or to minimize foreign currency risk on portfolio securities denominated in foreign currencies. All contracts are marked-to-market daily based on the foreign currency exchange rate. The change in value is recorded as a receivable or payable from forward foreign currency contracts. When a contract is closed, the difference between the value of the contract at the time it was opened and the value at the time it was closed is recorded as net realized gain (loss) on foreign currency related items. The use of forward foreign currency contracts does not eliminate fluctuations in the underlying prices of the Fund’s portfolio securities, but it does establish a rate of exchange that can be achieved in the future. These contracts involve market risk in excess of the receivable or payable related to forward foreign currency contracts reflected in the Statement of Assets and Liabilities. Although contracts limit the risk of loss due to a decline in the value of the hedged currency, they also limit any potential gain that might result should the value of the currency increase. Additionally, the Fund could be exposed to the risk of a previously hedged position becoming unhedged if the counterparty to a contract is unable to meet the terms of the contract.
| | |
| Montgomery Street Income Securities, Inc. | | 31 |
Futures Contracts. The Fund may buy and sell futures contracts to manage its exposure to changes in securities prices and foreign currencies or as an efficient means of adjusting overall exposure to certain markets. The risks associated with the use of futures contracts include the possibility that the value of the futures contract may not correlate with the change in the value of the hedged instrument. In addition, there is the risk that the Fund may not be able to enter into a closing transaction because of an illiquid market. Upon entering into a futures contract, the Fund is required to deposit with the broker an amount of cash or cash equivalents equal to a certain percentage of the contract amount. This is known as the “initial margin.” Futures contracts are valued based upon their quoted daily settlement prices. In the event that the settlement price is unavailable, the closing price will be used for valuation. The Fund receives from or pays to the counterparty an amount of cash equal to the daily fluctuation in the value of the contracts. Such receipts or payments, known as the “variation margin,” are recorded by the Fund until the contracts are terminated at which time a realized gain or loss is recognized. Futures contracts involve, to varying degrees, risk of loss in excess of the variation margin reflected in the Statement of Assets and Liabilities.
B. Purchases and Sales of Securities
During the six months ended June 30, 2008, purchases and sales of investment securities, excluding U.S. government obligations and short-term investments, aggregated $58,827,787 and $59,786,751, respectively. Purchases and sales of long-term U.S. government obligations aggregated $84,627,120 and $85,351,822, respectively.
C. Related Parties
Investment Advisory Agreement. The Fund and HIMCO entered into an Investment Advisory Agreement whereby the Fund pays HIMCO a quarterly fee equal to the product of (a) one quarter of 0.25%, times (b) the average of the net assets of the Fund on the last business day of each calendar month of the then ended calendar quarter.
Fund Accounting and Administration Services Agreement. The Fund has entered into a Fund Accounting and Administration Services Agreement (“Administration Agreement”) with Jackson Fund Services (“JFS”). Pursuant to the Administration Agreement, the Fund pays JFS an annual fee, payable monthly, equal to 0.25% of the value of the average daily net assets of the Fund up to $100 million; 0.20% of the value of the average daily net assets of the Fund from $100 million to $200 million; and 0.15% of the value of the average daily net assets of the Fund over $200 million. JFS makes individuals available to the Fund to serve as its officers, without compensation from the Fund.
| | |
| 32 | | Montgomery Street Income Securities, Inc. |
Directors’ Fees and Expenses. The Fund pays each Director a retainer fee plus specified amounts for each Board and Committee meeting attended.
D. Federal Income Tax Matters
The following information is presented on an income tax basis. The timing and characterization of certain income and capital gains are determined in accordance with federal tax regulations, which may differ from GAAP. These differences primarily relate to timing differences in recognizing premium amortization on debt securities and timing differences in recognizing certain gains and losses on investment transactions. To the extent that differences arise that are permanent in nature, such amounts are reclassified within the components of net assets on the Statement of Assets and Liabilities based on their federal income tax treatment; timing differences do not require reclassification. Timing and permanent differences do not impact the net asset values of the Fund.
At June 30, 2008, the cost of investments and the components of net unrealized depreciation are listed in the following table.
| | | | | | |
Cost of
Investments | | Gross Unrealized
Depreciation | | Gross Unrealized
Appreciation | | Net Unrealized
Depreciation |
| $217,506,413 | | $(12,164,045) | | $479,712 | | $(11,684,333) |
At December 31, 2007, the Fund’s last fiscal year end, the Fund had undistributed net ordinary income of $518,874. Distributions paid of $11,620,203 were from net ordinary income.
At December 31, 2007, the Fund’s last fiscal year end, the Fund had unused capital loss carryforwards available for federal income tax purposes which may be applied against any future realized net taxable capital gains or until the respective expiration dates occur as noted below.
| | |
| Amount | | Year of Expiration |
| $ 781,347 | | 2010 |
| 1,872,360 | | 2013 |
| 3,952,947 | | 2014 |
| 596,899 | | 2015 |
| $7,203,553 | | |
FASB Interpretation No. 48 (“FIN 48”), “Accounting for Uncertainty in Income Taxes”, provides guidance for how uncertain tax positions should be recognized, measured, presented and disclosed in the financial statements. FIN 48 requires the evaluation of tax positions taken or expected to be taken in the course of preparing each Fund’s tax returns to determine whether the tax positions are “more-likely-than-not” of being sustained by the applicable tax authority. Tax positions not deemed to
| | |
| Montgomery Street Income Securities, Inc. | | 33 |
meet the “more-likely-than-not” threshold would result in the Fund recording a tax expense in the current year. FIN 48 requires that management evaluate the tax positions taken in returns that remain subject to examination by the Fund’s major tax jurisdictions. Management completed an evaluation of the Fund’s tax positions and based on that evaluation, noted no material impact on the Fund’s financial statements during the period ended June 30, 2008.
E. Share Repurchases
The Fund is authorized to effect periodic repurchases of its shares in the open market from time to time when the Fund’s shares trade at a discount to their net asset value. During the six-months ended June 30, 2008, the Fund purchased 22,000 shares of common stock on the open market at a total cost of $367,258. The weighted average discount of these purchases, comparing the purchase price to the net asset value at the time of purchase was 7.2%. During the year ended December 31, 2007, the Fund purchased 48,000 shares of common stock on the open market at a total cost of $812,304 with a weighted average discount of 9.5%.
F. Recent Accounting Pronouncements
In March 2008, the FASB released SFAS No. 161, “Disclosures about Derivative Instruments and Hedging Activities”. SFAS No. 161 requires qualitative disclosures about objectives and strategies for using derivatives, quantitative disclosures about fair value and gains and losses on derivative instruments, and disclosures about credit risk related contingent features in derivative agreements. The application of SFAS No. 161 is required for fiscal years beginning after November 15, 2008 and interim periods within those fiscal years. At this time, management is evaluating the implications of SFAS No. 161, and its impact on the financial statements has not yet been determined.
| | |
| 34 | | Montgomery Street Income Securities, Inc. |
Dividend Reinvestment and Cash Purchase Plan
All registered stockholders of the Fund’s Common Stock are offered the opportunity of participating in the Plan. Registered stockholders, on request or on becoming registered stockholders, are mailed information regarding the Plan, including a form by which they may elect to participate in the Plan and thereby cause their future net investment income dividends and capital gains distributions to be invested in shares of the Fund’s common stock. The Bank of New York Mellon Corporation is the agent (the “Plan Agent”) for stockholders who elect to participate in the Plan.
If a stockholder chooses to participate in the Plan, the stockholder’s dividends and capital gains distributions will be promptly invested, automatically increasing the stockholder’s holdings in the Fund. If the Fund declares a dividend or capital gains distributions payable either in cash or in stock of the Fund, the stockholder will automatically receive stock. If the market price per share on the payment date for the dividend (the “Valuation Date”) equals or exceeds the net asset value per share, the Fund will issue new shares to the stockholder at the greater of the following on the Valuation Date: (a) net asset value per share or (b) 95% of the market price per share. If the market price per share on the Valuation Date is less than the net asset value per share, the Fund will issue new shares to the stockholder at the market price per share on the Valuation Date. In either case, for federal income tax purposes the stockholder will be deemed to receive a distribution equal to the market value on the Valuation Date of the new shares issued. If dividends or capital gains distributions are payable only in cash, then the stockholder will receive shares purchased on the New York Stock Exchange or otherwise on the open market. In this event, for federal income tax purposes the amount of the distribution will equal the cash distribution paid. State and local taxes may also apply. All reinvestments are in full and fractional shares, carried to three decimal places.
Stockholders participating in the Plan can also purchase additional shares quarterly in any amount from $100 to $5,000 (a “Voluntary Cash Investment”) by sending in a check together with the cash remittance slip, which will be sent with each statement of the stockholder’s account, to BNY Mellon Shareowner Services, the Fund’s transfer agent (the “Transfer Agent”). Such additional shares will be purchased on the open market by the Plan Agent or its delegate. The purchase price of shares purchased on the open market, whether pursuant to a reinvestment of dividends payable only in cash
| | |
| Montgomery Street Income Securities, Inc. | | 35 |
or a Voluntary Cash Investment, will be the average price (including brokerage commissions) of all shares purchased by the Plan Agent or its delegate on the date such purchases are effected. In addition, stockholders may be charged a service fee in an amount up to 5% of the value of the Voluntary Cash Investment. Although subject to change, stockholders are currently charged $1 for each Voluntary Cash Investment.
Stockholders may terminate their participation in the Plan at any time and elect to receive dividends and other distributions in cash by notifying the Transfer Agent in writing. Such notification must be received not less than 10 days prior to the record date of any distribution. There is no charge or other penalty for such termination. The Plan may be terminated by the Fund upon written notice mailed to the stockholders at least 30 days prior to the record date of any distribution. Upon termination, the Fund will issue certificates for all full shares held under the Plan and cash for any fractional share.
Alternatively, stockholders may request the Transfer Agent to instruct the Plan Agent or its delegate to sell any full shares and remit the proceeds, less a $2.50 service fee and less brokerage commissions. The sale of shares (including fractional shares) will be a taxable event for federal income tax purposes and may be taxable for state and local tax purposes.
The Plan may be amended by the Fund at any time. Except when required by law, written notice of any amendment will be mailed to stockholders at least 30 days prior to its effective date. The amendment will be deemed accepted unless written notice of termination is received by the Transfer Agent prior to the effective date.
An investor holding shares in its own name can participate directly in the Plan. An investor holding shares in the name of a brokerage firm, bank or other nominee should contact that nominee, or any successor nominee, to determine whether the nominee can participate in the Plan on the investor’s behalf and to make any necessary arrangements for such participation.
Additional information, including a copy of the Plan and its Terms and Conditions and an enrollment form, can be obtained from the Transfer Agent by writing BNY Mellon Shareowner Services, 480 Washington Boulevard Jersey City, NC 07310, or by calling (877) 437-3938.
| | |
| 36 | | Montgomery Street Income Securities, Inc. |
Stockholder Meeting Results
The Annual Meeting of Stockholders of the Fund was held on July 10, 2008 at 3 Embarcadero Center, 7th Floor, San Francisco, California. At the meeting, the following matter was voted upon and approved by the stockholders:
To elect five Directors of the Fund to hold office until the next annual meeting or until their respective successors shall have been duly elected and qualified.
| | | | |
| | | Number of Votes: |
| Directors | | For | | Withheld |
Richard J. Bradshaw | | 8,953,010 | | 158,848 |
Victor L. Hymes | | 8,954,993 | | 156,866 |
John T. Packard | | 8,952,403 | | 159,455 |
Wendell G. Van Auken | | 8,952,912 | | 158,946 |
James C. Van Horne | | 8,951,225 | | 160,634 |
| | |
| Montgomery Street Income Securities, Inc. | | 37 |
Directors and Officers
DIRECTORS
RICHARD J. BRADSHAW
Chairman
VICTOR L. HYMES
JOHN T. PACKARD
WENDELL G. VAN AUKEN
JAMES C. VAN HORNE
OFFICERS
MARK D. NERUD
President and Chief Executive Officer
DANIEL W. KOORS
Treasurer and Chief Financial Officer
SUSAN S. RHEE
Secretary and Chief Legal Officer
TONI M. BUGNI
Chief Compliance Officer
| | |
| 38 | | Montgomery Street Income Securities, Inc. |
Investment Advisory Agreement Approval
At a meeting held on April 10, 2008, the Board of Directors (the “Board”) of the Fund, including the Directors of the Fund who were not parties to the agreement or “interested persons” of any such party as defined in the 1940 Act (the “Independent Directors”), voted to continue the Investment Advisory Agreement (the “Agreement”) with HIMCO until July 31, 2009.
In reviewing the Agreement, the Board considered, among other information, the written and oral reports and compilations provided by HIMCO, including comparative data from independent sources as to investment performance and advisory fees. The Board also considered the separate written and oral reports of Gifford Fong Associates, an independent investment consultant engaged by the Board specializing in quantitative fixed-income investment analysis and JFS. In addition, the Board took into account information provided at previous meetings and information about HIMCO and other potential investment advisers developed in connection with the Board’s search for a new adviser in 2006.
In approving the continuance of the Agreement, the Board of Directors considered the following factors, among others:
Nature, Extent and Quality of Services. The Board examined the nature, extent, and quality of the advisory services provided and to be provided to the Fund by HIMCO. The Board considered the terms of the agreement, the experience and qualifications of HIMCO and its personnel in managing fixed-income instruments, HIMCO’s investment strategy for the Fund, and the risk profile of the Fund’s investments. The Board also considered the experience of HIMCO in managing open- and closed-end funds, the availability of HIMCO’s personnel, the extent and quality of information provided by HIMCO to the Board, HIMCO’s attention to compliance matters, and the extent of any regulatory issues relating to HIMCO or its affiliates. Further, the Board considered the stability of the HIMCO organization and turnover in its personnel, the overall commitment of HIMCO to the Fund, and the general financial condition, resources and reputation of HIMCO and its parent. The Board generally was satisfied with the nature, extent, and quality of the advisory services provided to the Fund.
Investment Performance. The Board reviewed the investment performance of HIMCO over various periods compared to the performance of relevant indices and of other similar funds. The Board also reviewed with HIMCO and
| | |
| Montgomery Street Income Securities, Inc. | | 39 |
Gifford Fong Associates the ways in which the investment strategies employed by HIMCO had contributed to its investment performance. The performance data showed, among other things, that for the first three quarters after HIMCO assumed management of the Fund in July 2006, the Fund had outperformed its benchmark, the Lehman Brothers Aggregate Bond Index, but underperformed the average return of the comparison group of closed-end investment-grade bond funds; for calendar year 2007, the Fund had underperformed its benchmark index and also underperformed the average return of the comparison group; and for the first quarter of 2008, the Fund had underperformed its benchmark index, but outperformed the average return based on net asset value of the comparison group. The Board noted that the fixed income markets had been quite volatile, that HIMCO was committed to improving the performance of the Fund, and that HIMCO had been managing the Fund for a relatively brief period.
Cost of Services. The Board examined the cost of the services provided and to be provided to the Fund by HIMCO, including expense information concerning other similar funds. The advisory fee charged by HIMCO was below that charged to other similar funds, including those managed by HIMCO, although the services provided to those other similar funds included certain administration services. It was noted that, in connection with its 2006 search for a new investment adviser, the Board had solicited fee proposals from several candidates, and the fee to be charged by HIMCO was among the lowest proposed. The Board concluded that the advisory fee charged by HIMCO generally was competitive.
Profits Realized. The Board considered the profits realized and to be realized by HIMCO from its relationship with the Fund and reviewed an estimate prepared by HIMCO. The Board acknowledged the inherent limitations of profitability analyses, including their reliance on various allocations and assumptions. The Board recognized that HIMCO was entitled to earn a profit for the services it furnishes and concluded, based on the information provided, that the profit expected to be earned by HIMCO would not be excessive.
Economies of Scale. The Board considered the extent to which economies of scale could be realized and whether the advisory fee charged by HIMCO reflects any such economies of scale. It was noted that, as a closed-end fixed income fund making regular dividend distributions, the assets of the Fund were not expected to increase materially. Accordingly, the Board had
| | |
| 40 | | Montgomery Street Income Securities, Inc. |
negotiated with HIMCO a fixed fee rate taking into account the then current size of the Fund. In the event the size of the Fund does increase materially in the future, the Board will consider whether the advisory fee should be adjusted to reflect any economies of scale.
Other Benefits. The Board recognized that HIMCO and its affiliates may derive other benefits from their relationship with the Fund, including the use of the Fund’s performance record in marketing other products, the inclusion of the Fund on its client list, and the aggregation of the Fund’s purchase orders with other accounts.
In addition to the foregoing factors, among others, the Board considered its ability to terminate the Agreement on sixty (60) days’ notice. In its deliberations, the Board did not identify any particular factor or factors that were all-important or controlling, and each Director assigned different weights to the various factors considered.
| | |
| Montgomery Street Income Securities, Inc. | | 41 |
General Information
| | |
| |
Investment
Adviser | | Hartford Investment Management Company 55 Farmington Avenue Hartford, CT 06105 |
| |
| Administrator | | Jackson Fund Services 225 West Wacker Drive Chicago, IL 60606 |
| |
| Transfer Agent | | BNY Mellon Shareowner Services c/o MSIS Stock Transfer 480 Washington Boulevard Jersey City, NJ 07310 (Tel) 1/877/437-3938 |
| |
| Custodian | | The Bank of New York Mellon Corporation One Mellon Center Pittsburgh, PA 15258 |
| |
| Legal Counsel | | Howard Rice Nemerovski Canady Falk & Rabkin PC Three Embarcadero Center San Francisco, CA 94111 |
| | |
| 42 | | Montgomery Street Income Securities, Inc. |
Privacy Policy Statement
Montgomery Street Income Securities, Inc. (the “Fund”) considers the privacy of its stockholders to be of fundamental importance and has established a policy to maintain the privacy of the information you share with us. In addition, the Fund relies on the privacy and customer information protection policies and procedures of its service providers.
Personal information we collect
We do not sell any information to any third parties. However, we may collect and retain certain nonpublic personal information about you, including:
| | • | | Information we receive from broker-dealers, investment advisers, the Fund’s transfer agent, and the Fund’s dividend reinvestment plan administrator (such as a stockholder’s name, address and tax identification number); |
| | • | | An address received from a third party when a stockholder has moved; and |
| | • | | Account balance and transaction activity. |
Personal information we may disclose
We may occasionally disclose nonpublic personal information about you to affiliates and non-affiliates as permitted by law. Instances when we may share information include:
| | • | | Disclosing information to a third party in order to process account transactions that you request or authorize; |
| | • | | Disclosing your name and address to companies that mail Fund-related materials, such as stockholder reports and proxy materials; and |
| | • | | Disclosing information in connection with regulatory inquiries and legal proceedings, such as responding to a request for information or subpoena. |
When information is shared with third parties, they are not permitted to use the information for any purpose other than to assist our servicing of your account(s) or as permitted by law. If you close your account(s) or if we lose contact with you, we will continue to share information in accordance with our current privacy policy and practices. We restrict access to your nonpublic personal information to authorized agents, including employees of the Fund’s administrator who need to know that information to provide services to the
| | |
| Montgomery Street Income Securities, Inc. | | 43 |
Fund and its stockholders. We maintain physical, electronic and procedural safeguards that comply with federal standards to guard your nonpublic personal information.
These measures reflect our commitment to maintaining the privacy of your nonpublic personal information. We appreciate the confidence you have shown by entrusting us with your assets.
If you would like to learn more or have any questions about our privacy practices, please contact the Fund at the following address:
Montgomery Street Income Securities, Inc.
c/o Jackson Fund Services
225 W. Wacker Drive, Suite 1200
Chicago, IL 60606
Effective: August 31, 2007
| | |
| 44 | | Montgomery Street Income Securities, Inc. |
Notes
Notes

Presorted Standard
U.S. Postage
PAID
Lancaster, PA
Permit No. 1313
MSIS
(42065 2/06)
Item 2. Code of Ethics.
Not applicable.
Item 3. Audit Committee Financial Expert.
Not applicable.
Item 4. Principal Accountant Fees and Services.
Not applicable.
Item 5. Audit Committee of Listed Registrants.
Not applicable.
Item 6. Investments.
(a) | Included in Report to Stockholders under Item 1. |
Item 7. Disclosure of Proxy Voting Policies and Procedures for Closed-End Management Investment Companies.
Not applicable.
Item 8. Portfolio Managers of Closed-End Management Investment Companies.
(b) | Effective July 22, 2008, Charles Moon resigned from Hartford Investment |
Management Company (“HIMCO”), the Fund’s investment adviser, and as a portfolio manager of the Fund. Nasri A. Toutoungi remains a portfolio manager of the Fund.
Item 9. Purchases of Equity Securities by Closed-End Management Investment Company and Affiliated Purchasers.
Period | (a) Total Number of Shares (or Units) Purchased(1) | (b) Average Price Paid per Share (or Unit) | (c) Total Number of Shares (or Units) Purchased as Part of Publicly Announced Plans or Programs | (d) Maximum Number (or Approximate Dollar Value) of Shares (or Units) that May Yet Be Purchased Under the Plans or Programs |
January 1 – January 31 | 0 | 0 | n/a | n/a |
February 1 – February 29 | 5,000 | 16.71 | n/a | n/a |
March 1 – March 31 | 6,000 | 16.73 | n/a | n/a |
April 1 – April 30 | 0 | 0 | n/a | n/a |
May 1 – May 31 | 11,000 | 16.56 | n/a | n/a |
June 1 – June 30 | 0 | 0 | n/a | n/a |
Total | 22,000 | 16.67 | n/a | n/a |
(1) All purchases were made on the open market pursuant to the registrant’s Repurchase Program and related guidelines.
Item 10. Submission of Matters to a Vote of Security Holders.
There have been no material changes to the procedures by which stockholders may recommend nominees to the registrant’s Board of Directors since the registrant last disclosed such procedures in a Proxy Statement or Form N-CSR.
Item 11. Controls and Procedures.
(a) | The President/Principal Executive Officer and the Treasurer/Principal Financial Officer of the registrant have concluded, based on their evaluation of the registrant’s disclosure controls and procedures (as defined in Rule 30a-3(c) under the Investment Company Act of 1940, as amended) as of a date within ninety (90) days of the filing date of this report on Form N-CSR, that such controls and procedures are effective and that the design and operation of such procedures ensures that information required to be disclosed by the registrant in this report on Form N-CSR is recorded, processed, summarized, and reported within the time periods specified in the U.S. Securities and Exchange Commission’s rules and forms. |
(b) | There has been no change in the registrant’s internal controls over financial reporting (as defined in Rule 30a-3(d) under the Investment Company Act of 1940, as amended) that occurred during the second fiscal quarter of the period covered by this report that has materially affected, or is reasonably likely to materially affect, the registrant’s internal control over financial reporting. |
Item 12. Exhibits.
| (2) | Certifications required by Rule 30a-2(a) under the Act. |
(b) | Certification required by Rule 30a-2(b) under the Act. |
SIGNATURES
Pursuant to the requirements of the Securities Exchange Act of 1934 and the Investment Company Act of 1940, the registrant has duly caused this report to be signed on its behalf by the undersigned, thereunto duly authorized.
| Montgomery Street Income Securities, Inc. |
| |
| |
By: | /s/ Mark D. Nerud |
Name: | Mark D. Nerud |
Title: | President and Principal Executive Officer |
Date: | August 28, 2008 |
Pursuant to the requirements of the Securities Exchange Act of 1934 and the Investment Company Act of 1940, this report has been signed below by the following persons on behalf of the registrant and in the capacities and on the dates indicated.
| |
By: | /s/ Mark D. Nerud |
Name: | Mark D. Nerud |
Title: | President and Principal Executive Officer |
Date: | August 28, 2008 |
| |
By: | /s/ Daniel W. Koors |
Name: | Daniel W. Koors |
Title: | Treasurer and Principal Financial Officer |
Date: | August 28, 2008 |
EXHIBIT LIST
Exhibit 12(a)(2)(a): | Certification of the Principal Executive Officer required by Rule 30a-2(a) under the Act |
Exhibit 12(a)(2)(b): | Certification of the Principal Financial Officer required by Rule 30a-2(a) under the Act |
Exhibit 12(b): | Certification required by Rule 30a-2(b) under the Act |