UNITED STATES
SECURITIES AND EXCHANGE COMMISSION
Washington, D.C. 20549
FORM N-CSR
CERTIFIED SHAREHOLDER REPORT OF REGISTERED
MANAGEMENT INVESTMENT COMPANIES
Investment Company Act File Number: 811-2340
Montgomery Street Income Securities, Inc.
(Exact name of registrant as specified in charter)
225 W. Wacker Drive, Suite 1200
Chicago, IL 60606
(Address of principal executive offices)
Mark D. Nerud, President
225 W. Wacker Drive, Suite 1200
Chicago, IL 60606
(Name and address of agent for service)
Registrant’s telephone number, including area code: (312) 338-5801
Date of fiscal year end: December 31
Date of reporting period: January 1, 2011 – June 30, 2011
Form N-CSR is to be used by management investment companies to file reports with the Commission not later than 10 days after the transmission to stockholders of any report that is required to be transmitted to stockholders under Rule 30e-1 under the Investment Company Act of 1940 (17 CFR 270.30e-1). The Commission may use the information provided on Form N-CSR in its regulatory, disclosure review, inspection, and policymaking roles.
A registrant is required to disclose the information specified by Form N-CSR, and the Commission will make this information public. A registrant is not required to respond to the collection of information contained in Form N-CSR unless the Form displays a currently valid Office of Management and Budget (“OMB”) control number. Please direct comments concerning the accuracy of the information collection burden estimate and any suggestions for reducing the burden to Secretary, Securities and Exchange Commission, 450 Fifth Street, NW, Washington, DC 20549-0609. The OMB has reviewed this collection of information under the clearance requirements of 44 U.S.C. §3507.
Item 1. Report to Stockholders.

Montgomery Street
Income Securities, Inc. (MTS)
Semiannual Report to Stockholders
June 30, 2011 (Unaudited)
Portfolio Manager Review
Montgomery Street Income Securities, Inc. (the “Fund”) had a total return based on net asset value (“NAV”) of 3.33% for the six-month period ended June 30, 2011. The total return of the Fund, based on the market price of its New York Stock Exchange traded shares, was 2.23% for the same period.1,3 The Fund’s NAV total return outperformed the Barclay’s Capital U.S. Aggregate Bond Index2, the Fund’s benchmark, which posted a total return of 2.72% for the six-month period.3
During the first half of the year, concern about political unrest across the Middle East and North Africa, the strongest earthquake on record in Japan and the sovereign debt crisis in the Eurozone sparked a flight to safety and boosted demand for Treasuries.
The Treasury rally stalled during the final days of the first half of the year, as Greece’s parliament approved austerity measures, easing concerns about the potential for the Euro area’s first sovereign default. In addition, U.S. manufacturing businesses expanded at a faster pace in June, suggesting that the supply chain disruption from the Japanese earthquake was easing.
Another indicator that raised hopes for stronger growth in the second half of 2011 was falling commodity prices. Lower retail fuel prices relieved some stress on consumers coping with an official unemployment rate over 9% and continued weakness in residential property markets.
On June 30, 2011 the Federal Reserve (the “Fed”) ended its program of buying $600 billion worth of Treasuries, known as QE2, and indicated its intent to continue buying Treasuries with proceeds from maturing debt. The Fed also reiterated its “extended period” language for a near-zero federal funds rate.
U.S. Treasury Bond Yield Curve (Unaudited)
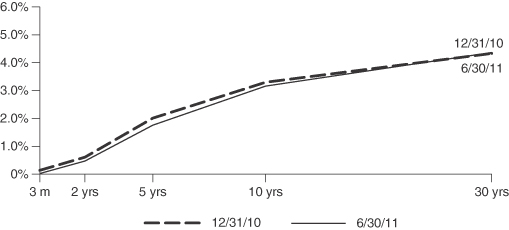
Source: Bloomberg
Performance is historical and does not guarantee future results.
| 1 | Total return based on NAV reflects changes in the Fund’s net asset value during the period. Total return based on market value reflects changes in market value. Each figure assumes that dividend and capital gain distributions, if any, were reinvested. These figures will differ depending upon the level of any discount from or premium to NAV at which the Fund’s shares traded during the period. |
| 2 | The Barclays Capital U.S. Aggregate Bond Index is a broad-based benchmark that measures the investment grade, U.S. dollar-denominated, fixed-rate taxable bond market, including Treasuries, government-related and corporate securities, mortgage backed securities (agency fixed-rate and hybrid adjustable rate mortgage pass-throughs), asset backed securities and commercial mortgage backed securities. The Index does not include exposure to high yield, non-dollar securities or cash. Index returns assume reinvestment of dividends, and unlike Fund returns, do not reflect fees or expenses. It is not possible to invest directly in an index. |
| 3 | Past results are not necessarily indicative of the future performance of the Fund. Investment return and principal value will fluctuate. |
| | | | |
| Montgomery Street Income Securities, Inc. | | | 1 | |
Given the Fund’s primary focus on income generation, the Fund remained overweight in investment grade corporate bonds during the period. Well-capitalized banks and insurance companies provided the opportunity to take advantage of the steep yield curve as well as the improved asset quality of money center financial institutions.
The Fund’s sector positioning, within corporates, was positive for relative performance versus the benchmark and was further enhanced by security selection. Continued weakness related to real estate exposure and volatility associated with regulatory capital led to negative performance for banks in June. Non-U.S. banks performed slightly worse than U.S. banks given heightened risks associated with exposures to Greece, Portugal and Ireland. While the Fund’s performance was negatively impacted by the overweight to banks, its relative positions favoring names with less exposure to the European periphery helped mitigate the negative impact.
The Fund’s overweight positioning to natural gas pipelines was positive for performance. While the sector underperformed the broader investment grade credit market overall as negative press called into question the underlying resource potential of natural shale gas wells, positive security selection in the sector more than offset this negative impact.
The Fund’s interest rate positioning versus the benchmark was negative for performance. The Fund’s exposure to non-U.S. developed country interest rates, particularly core Europe, added to returns as rates fell on fears of a global economic slowdown; however, an underweight to U.S. duration detracted from returns as rates fell. A focus on shorter maturities, implemented via money market futures, detracted from performance. An overweight to emerging markets (“EM”), especially to external debt in Brazil and corporates in Russia, were positive for performance. An underweight to agency mortgage-backed securities (“MBS”) detracted from performance as the sector outperformed like-duration Treasuries during the period; however, exposure to non-agency MBS mitigated some of this negative impact. An overweight to bonds of banks, finance companies, and life insurers all added to performance as these sectors outpaced the broader corporate market amid improving balance sheets and higher profits. Finally, exposure to EM currencies added to returns.
Corporations emerged from the first quarter of 2011 in solid fundamental shape, exhibiting positive sales and earnings trends as they rode the wave of domestic and global growth, while remaining well insulated from higher commodity prices. Despite a rather bumpy ride during the second quarter, due in large part to heightened sovereign risk in southern Europe and weaker than expected growth, credit market returns maintained pace with Treasuries and encountered only modest spread widening during the period.
Corporations continued to issue bonds as investment grade companies brought nearly $140 billion to market in the first two months of the second quarter, before lightening up in June with only $28 billion. This supply was met with robust investor demand in approach of a perennially light issuance period upcoming in the second half of the summer, resulting in high grade bond spreads trading in increasingly narrow ranges. Lastly, high grade credit mutual fund and exchange-traded fund flows during the second quarter remained strong, underscoring the positive technical environment for the sector.
While high grade market technicals remained positive, there was a notable growth swoon at the end of the second quarter and investor risk appetite suffered as a result. These effects were partially assuaged late in June as Greece passed its second round of austerity votes and a major U.S. bank reached a large mortgage litigation settlement; however, growth in developed markets continues to remain slow without the usual post-recession acceleration.
Credit yields fell from 3.91% to 3.65% and spreads widened from 132 to 140 basis points on an option-adjusted basis. Within corporates, utilities were the best performing sectors led by natural gas distributors, electric companies and pipelines. Industrials outpaced financials. Top performers were media-cable, refining and entertainment. Paper and non-captive consumer finance were the worst performing sectors of the benchmark.
| | |
| 2 | | Montgomery Street Income Securities, Inc. |
Sector Distribution (Unaudited)
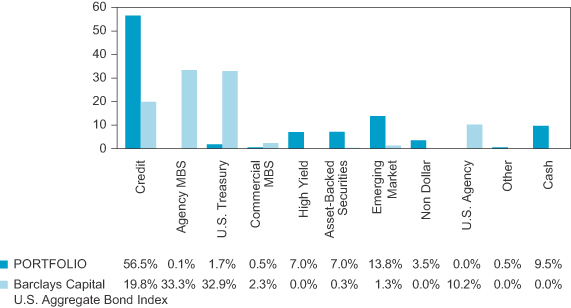
As of June 30, 2010.
Sector distribution is subject to change.
Percentages are based on total value of the investment portfolio.
Quality Distribution (Unaudited)
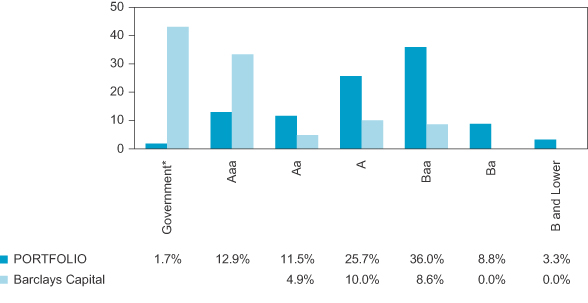
| * | Government includes U.S. Treasury securities. |
As of June 30, 2010.
Quality distribution is subject to change.
Portfolio percentages are based on total value of the investment portfolio.
The quality ratings represent the higher of Moody’s Investors Service, Inc. (“Moody’s”) or Standard & Poor’s Corporation (“S&P”) credit ratings. The ratings of Moody’s and S&P represent these companies’ opinions as to the quality of the securities they rate. Ratings are relative and subjective and are not absolute standards of quality. A bond’s credit quality does not remove the risk of an increase in interest rates or illiquidity in the market.
| | | | |
| Montgomery Street Income Securities, Inc. | | | 3 | |
PIMCO’s outlook for slowing global growth over the next 9-12 months, or cyclical horizon, is in line with its Secular New Normal thesis. In the developed world, many sovereign balance sheets remain under pressure. Fiscal and monetary stimulus programs are not gaining much traction in economies with weak initial conditions prior to the 2008 financial crisis. In emerging economies, anti-inflation measures such as monetary tightening and capital controls will continue to temper growth. The appetite for investment-led growth in developing countries such as China is waning as such investment is increasingly seen as less productive than expected. PIMCO does not expect EM economies overall to be as stimulative for the rest of the world as they have been in the recent past.
The Eurozone’s sovereign debt crisis will remain a major source of volatility over the cyclical time frame. The risk of contagion and disorderly debt deflation in Europe is escalating, which could heighten global risk aversion and dampen growth elsewhere. A default by Greece on its government debt has a high probability over the next year and the likelihood that Portugal and Ireland will follow suit is growing.
In light of heightened sovereign debt and solvency concerns in southern Europe, combined with growing macro and regulatory uncertainty, PIMCO intends to target investments in areas believed to have high risk-adjusted returns in the second half of 2011.
PIMCO views U.S. banks as better investments than their European counterparts given their less risky, more profitable sources of financing as well as much less sensitivity to sovereign credit risk in peripheral Europe. As profitability increases and balance sheets grow healthier by improving asset quality and capital position, U.S. banks are fundamentally equipped to outpace various credit alternatives looking forward.
While PIMCO continues to find attractive opportunities within the investment grade credit universe, PIMCO maintains a selective approach amid a very strong technical environment, relying on comprehensive analysis of each credit and the associated risks.
This material contains the current opinions of the investment adviser only through the end of the period of the report as stated on the cover. Such opinions are subject to change without notice and should not be construed as a recommendation.
Investment in the Fund involves risk. The Fund invests in individual bonds whose yields and value fluctuate so that an investment in the Fund may be worth more or less than its original cost. Bond investments are subject to interest rate risk such that when interest rates rise, the price of the bonds, and thus the value of the Fund, can decline and the investor can lose principal value. The Fund’s investments are also subject to credit risk and liquidity risk. Additionally, investing in foreign securities presents certain unique risks not associated with domestic investments, such as currency fluctuation, political and economic changes, and market risks. All of these factors may result in greater share price volatility. Closed-end funds, unlike open-end funds, are not continuously offered or redeemed.
NOT FDIC/NCUA INSURED. NO BANK GUARANTEE. MAY LOSE VALUE. NOT A DEPOSIT.
NOT INSURED BY ANY FEDERAL GOVERNMENT AGENCY.
Past performance is no guarantee of future results.
This report is sent to stockholders of Montgomery Street Income Securities, Inc., for their information. It is not a prospectus, circular or representation intended for use in the purchase or sale of shares of the Fund or of any securities mentioned in the report.
| | |
| 4 | | Montgomery Street Income Securities, Inc. |
Other Information
Investment Objectives
The primary investment objective of the Fund is to seek as high a level of current income as is consistent with prudent investment risks, from a diversified portfolio primarily of debt securities. Capital appreciation is a secondary objective. The investment objectives of the Fund may be changed by the Fund’s Board of Directors (the “Board”) without stockholder approval. There can be no assurance that the investment objectives of the Fund will be attained.
Market Price and Net Asset Value
The Fund’s market price was $15.94 as of June 30, 2011, compared with $15.78 as of December 31, 2010. The Fund’s shares traded at an 8.8% discount to NAV of $17.48 at June 30, 2011. Shares of closed-end funds frequently trade at a discount to NAV. The price of the Fund’s shares is determined by a number of factors, several of which are beyond the control of Fund management. The Fund, therefore, cannot predict whether its shares will trade at, below or above its NAV.
The Fund’s market price is published daily in The New York Times and on The Wall Street Journal website at www.wsj.com. The Fund’s NAV is available daily on its website at www.montgomerystreetincome.com and published weekly in Barron’s.
Dividends Paid
The Fund paid dividends of $0.19 per share on April 29, 2011, and July 29, 2011.
Dividend Reinvestment and Cash Purchase Option
The Fund maintains an optional Dividend Reinvestment and Cash Purchase Plan (the “Plan”) for the automatic reinvestment of your dividends and capital gain distributions in shares of the Fund. Stockholders who participate in the Plan also can purchase additional shares of the Fund through the Plan’s voluntary cash investment feature. We recommend that you consider enrolling in the Plan to build your investment. The Plan’s features, including the voluntary cash investment feature, are described on page 28 of this report.
Limited Share Repurchases
The Fund is authorized to repurchase a limited number of shares of the Fund’s common stock from time to time when the shares are trading at less than 95% of their NAV. Repurchases are limited to a number of shares each calendar quarter approximately equal to the number of new shares issued under the Plan with respect to income earned for the second preceding calendar quarter. There were 6,000 shares repurchased in the first and second quarter of 2011. 6,000 shares will be repurchased during the third quarter of 2011.
Investment Portfolio
Following the Fund’s first and third quarter ends, a complete portfolio holdings listing is filed with the U.S. Securities and Exchange Commission (“SEC”) on Form N-Q. The form is available in the “Financial Reports” tab on the Fund’s website at www.montgomerystreetincome.com, or on the SEC’s website at www.sec.gov, and it also may be reviewed and copied at the SEC’s Public Reference Room in Washington, DC. Information on the operation of the SEC’s Public Reference Room may be obtained by calling (800) SEC-0330.
Proxy Voting
Information about how the Fund voted any proxies related to its portfolio securities during the twelve-month period ended June 30, 2011 is available in the “Financial Reports” tab on the Fund’s website at www.montgomerystreetincome.com or on the SEC’s website at www.sec.gov. A description of the policies that the Fund uses to determine how to vote proxies relating to portfolio securities is available without charge, upon request, by calling (877) 437-3938 or on the SEC’s website at www.sec.gov.
Under the Fund’s current policy, it is the intention of the Fund to invest exclusively in non-voting securities. Under normal circumstances, the Fund does not intend to hold voting securities. In the event that the Fund does come into possession of any voting securities, the Fund intends to dispose of such securities as soon as it is reasonably practicable and prudent to do so. The Board may change this policy at any time.
| | | | |
| Montgomery Street Income Securities, Inc. | | | 5 | |
Reports to Stockholders
The Fund’s annual and semiannual reports to stockholders will be mailed to stockholders, and also are available in the “Financial Reports” tab on the Fund’s website at www.montgomerystreetincome.com or by calling (877) 437-3938. Those stockholders who wish to view the Fund’s complete portfolio holdings listing for the first and third quarters may view the Fund’s Form N-Q, as described above in “Investment Portfolio.”
Change in Officer
Effective July 14, 2011, Megan E. Garcy replaced Susan S. Rhee as Secretary of the Fund.
| | |
| 6 | | Montgomery Street Income Securities, Inc. |
| | |
| Investment Portfolio | | as of June 30, 2011 (Unaudited) |
| | | | | | | | |
| | | Principal
Amount ($) | | | Value ($) | |
| | | | | | | |
Corporate Bonds 78.4% | | | | | | | | |
| | |
| Consumer Discretionary 2.3% | | | | | | | | |
Aviation Capital Group, 7.13%, 10/15/20 (a) | | | 600,000 | | | | 619,830 | |
COX Communications Inc., 6.25%, 06/01/18 (a) | | | 263,000 | | | | 301,225 | |
CSC Holdings Inc., 8.63%, 02/15/19 | | | 2,000,000 | | | | 2,255,000 | |
NBC Universal Inc., 2.88%, 04/01/16 (a) | | | 300,000 | | | | 300,481 | |
Reynolds Group Inc., 7.13%, 04/15/19 (a) | | | 300,000 | | | | 297,750 | |
TCI Communications Inc., 8.75%, 08/01/15 | | | 35,000 | | | | 42,960 | |
Time Warner Cable Inc., 8.25%, 04/01/19 | | | 290,000 | | | | 361,688 | |
| | | | | | | | |
| | | | | | | 4,178,934 | |
| Consumer Staples 3.6% | | | | | | | | |
Altria Group Inc., 9.70%, 11/10/18 | | | 3,000,000 | | | | 3,942,363 | |
Altria Group Inc., 9.25%, 08/06/19 | | | 500,000 | | | | 651,973 | |
Anheuser-Busch InBev Worldwide Inc., 7.75%, 01/15/19 | | | 360,000 | | | | 452,896 | |
Kraft Foods Inc., 5.38%, 02/10/20 | | | 512,000 | | | | 559,717 | |
Wesfarmers Ltd., 2.98%, 05/18/16 (b) | | | 900,000 | | | | 902,661 | |
| | | | | | | | |
| | | | | | | 6,509,610 | |
| Energy 13.3% | | | | | | | | |
Anadarko Petroleum Corp., 6.45%, 09/15/36 | | | 800,000 | | | | 834,757 | |
BP Capital Markets Plc, 2.75%, 02/27/12 | | | 16,000 | | | | 16,222 | |
BP Capital Markets Plc, 3.13%, 03/10/12 | | | 38,000 | | | | 38,659 | |
BP Capital Markets Plc, 3.75%, 06/17/13 | | | 24,000 | | | | 24,997 | |
BP Capital Markets Plc, 3.63%, 05/08/14 | | | 521,000 | | | | 547,635 | |
BP Capital Markets Plc, 3.13%, 10/01/15 | | | 800,000 | | | | 821,356 | |
Coffeyville Resources LLC, 9.00%, 04/01/15 (a) | | | 1,011,000 | | | | 1,096,935 | |
Energy Transfer Partners LP, 8.50%, 04/15/14 | | | 200,000 | | | | 232,691 | |
Energy Transfer Partners LP, 9.70%, 03/15/19 | | | 500,000 | | | | 638,958 | |
Energy Transfer Partners LP, 9.00%, 04/15/19 | | | 2,000,000 | | | | 2,486,796 | |
Gazprom OAO, 9.25%, 04/23/19 (a) | | | 300,000 | | | | 374,625 | |
Midcontinent Express Pipeline LLC, 6.70%, 09/15/19 (a) | | | 400,000 | | | | 448,695 | |
NGPL PipeCo LLC, 6.51%, 12/15/12 (a) | | | 2,475,000 | | | | 2,602,693 | |
NGPL PipeCo LLC, 7.12%, 12/15/17 (a) | | | 800,000 | | | | 896,227 | |
Novatek Finance Ltd., 5.33%, 02/03/16 (a) | | | 1,000,000 | | | | 1,030,000 | |
Novatek Finance Ltd., 6.60%, 02/03/21 (a) | | | 800,000 | | | | 836,000 | |
Odebrecht Drilling Norbe VIII/IX Ltd., 6.35%, 06/30/21 (a) | | | 1,700,000 | | | | 1,793,500 | |
Petrobras International Finance Co., 7.88%, 03/15/19 | | | 2,000,000 | | | | 2,421,828 | |
Pioneer Natural Resources Co., 7.20%, 01/15/28 | | | 200,000 | | | | 209,508 | |
Pride International Inc., 6.88%, 08/15/20 | | | 500,000 | | | | 581,488 | |
Ras Laffan Liquefied Natural Gas Co. Ltd. III, 5.30%, 09/30/20 | | | 921,700 | | | | 981,610 | |
Rockies Express Pipeline LLC, 6.25%, 07/15/13 (a) | | | 3,000,000 | | | | 3,219,297 | |
Rockies Express Pipeline LLC, 5.63%, 04/15/20 (a) | | | 1,000,000 | | | | 1,021,846 | |
Transcontinental Gas Pipe Line Corp., 6.40%, 04/15/16 | | | 250,000 | | | | 289,745 | |
Transocean Inc., 6.50%, 11/15/20 | | | 500,000 | | | | 559,119 | |
| | | | | | | | |
| | | | | | | 24,005,187 | |
| Financials 48.0% | | | | | | | | |
Abbey National Treasury Services Plc, 1.85%, 04/25/14 (c) | | | 800,000 | | | | 795,226 | |
ABN AMRO Holding NA, 6.52% (callable at 100 beginning 11/08/12) (a) (d) (e) | | | 1,000,000 | | | | 925,000 | |
American Express Co., 6.15%, 08/28/17 | | | 1,000,000 | | | | 1,139,567 | |
American Express Credit Corp., 7.30%, 08/20/13 | | | 700,000 | | | | 779,092 | |
American International Group Inc., 4.95%, 03/20/12 | | | 3,000,000 | | | | 3,054,000 | |
American International Group Inc., 8.25%, 08/15/18 | | | 500,000 | | | | 574,313 | |
Asciano Finance Ltd., 5.00%, 04/07/18 (a) | | | 300,000 | | | | 307,946 | |
The accompanying notes are an integral part of the financial statements.
| | | | |
| Montgomery Street Income Securities, Inc. | | | 7 | |
| | | | | | | | |
| | | Principal
Amount ($) | | | Value ($) | |
| | | | | | | |
Australia & New Zealand Banking Group Ltd., 5.10%, 01/13/20 (a) | | | 800,000 | | | | 829,750 | |
BAC Capital Trust XI, 6.63%, 05/23/36 | | | 120,000 | | | | 115,827 | |
Banco Bradesco SA, 2.36%, 05/16/14 (a) (c) | | | 500,000 | | | | 506,264 | |
Banco do Brasil SA, 6.00%, 01/22/20 (a) | | | 500,000 | | | | 537,500 | |
Banco Santander Brasil SA, 4.50%, 04/06/15 (a) | | | 100,000 | | | | 101,750 | |
Banco Santander Brasil SA, 4.50%, 04/06/15 | | | 300,000 | | | | 305,250 | |
Banco Santander Chile, 1.52%, 04/20/12 (a) (c) | | | 900,000 | | | | 900,744 | |
Banco Santander Chile, 3.75%, 09/22/15 (a) | | | 500,000 | | | | 503,750 | |
Banco Votorantim SA, 5.25%, 02/11/16 | | | 400,000 | | | | 405,520 | |
Banque PSA Finance, 2.15%, 04/04/14 (a) (c) | | | 300,000 | | | | 299,442 | |
Barclays Bank Plc, 7.43% (callable at 100 beginning 12/15/17) (a) (d) (e) | | | 200,000 | | | | 204,000 | |
Barclays Bank Plc, 5.00%, 09/22/16 | | | 400,000 | | | | 430,297 | |
Barclays Bank Plc, 10.18%, 06/12/21 (a) | | | 1,400,000 | | | | 1,756,538 | |
BBVA Bancomer SA, 4.50%, 03/10/16 (a) | | | 500,000 | | | | 508,750 | |
BBVA Bancomer SA, 6.50%, 03/10/21 (a) | | | 400,000 | | | | 408,000 | |
BNP Paribas SA, 7.78% (callable at 100 beginning 07/02/18) (d) (e), EUR | | | 500,000 | | | | 761,333 | |
BPCE SA, 2.02%, 02/07/14 (a) (c) | | | 700,000 | | | | 704,815 | |
Braskem Finance Ltd., 5.75%, 04/15/21 (a) | | | 400,000 | | | | 402,520 | |
Capital One Capital V, 10.25%, 08/15/39 | | | 1,000,000 | | | | 1,060,000 | |
CBA Capital Trust II, 6.02% (callable at 100 beginning 03/15/16) (a) (d) (e) | | | 200,000 | | | | 197,080 | |
Citigroup Inc., 6.01%, 01/15/15 | | | 2,600,000 | | | | 2,861,139 | |
Citigroup Inc., 8.50%, 05/22/19 | | | 1,235,000 | | | | 1,530,974 | |
Commonwealth Bank of Australia, 0.98%, 03/17/14 (a) (c) | | | 200,000 | | | | 200,719 | |
Commonwealth Bank of Australia, 5.00%, 10/15/19 (a) | | | 450,000 | | | | 468,275 | |
Credit Agricole SA, 5.14% (callable at 100 beginning 02/24/16) (d) (e), GBP | | | 200,000 | | | | 264,818 | |
Credit Agricole SA, 1.72%, 01/21/14 (a) (c) | | | 400,000 | | | | 405,521 | |
Export-Import Bank of Korea, 4.00%, 01/29/21 | | | 200,000 | | | | 184,105 | |
FCE Bank Plc, 7.13%, 01/16/12, EUR | | | 1,000,000 | | | | 1,474,086 | |
Fibria Overseas Finance Ltd., 7.50%, 05/04/20 | | | 100,000 | | | | 108,880 | |
Fibria Overseas Finance Ltd., 6.75%, 03/03/21 (a) | | | 200,000 | | | | 209,500 | |
Goldman Sachs Group Inc., 5.95%, 01/18/18 | | | 650,000 | | | | 700,617 | |
Goldman Sachs Group Inc., 5.38%, 03/15/20 | | | 1,000,000 | | | | 1,032,645 | |
Goldman Sachs Group Inc., 6.00%, 06/15/20 | | | 3,200,000 | | | | 3,443,162 | |
HBOS Plc, 6.75%, 05/21/18 (a) | | | 700,000 | | | | 673,635 | |
HSBC Bank Plc, 4.13%, 08/12/20 (a) | | | 2,000,000 | | | | 1,936,006 | |
HSBC Bank Plc, 5.00%, 03/20/23 (d), GBP | | | 500,000 | | | | 785,812 | |
HSBC Finance Corp., 6.68%, 01/15/21 (a) | | | 300,000 | | | | 307,804 | |
International Lease Finance Corp., 7.13%, 09/01/18 (a) | | | 1,700,000 | | | | 1,819,000 | |
Intesa Sanpaolo SpA, 2.66%, 02/24/14 (a) (c) | | | 1,800,000 | | | | 1,795,594 | |
IPIC GMTN Ltd., 5.00%, 11/15/20 (a) | | | 300,000 | | | | 297,000 | |
JPMorgan Chase & Co., 6.00%, 01/15/18 | | | 2,000,000 | | | | 2,224,308 | |
JPMorgan Chase & Co., 6.30%, 04/23/19 | | | 1,800,000 | | | | 2,028,845 | |
Lazard Group LLC, 6.85%, 06/15/17 | | | 500,000 | | | | 551,420 | |
LBG Capital No.1 Plc, 7.87%, 08/25/20, GBP | | | 1,000,000 | | | | 1,460,542 | |
LBG Capital No.1 Plc, 7.88%, 11/01/20 | | | 450,000 | | | | 420,750 | |
Lloyds TSB Bank Plc, 6.38%, 01/21/21 | | | 100,000 | | | | 104,106 | |
Manufacturers & Traders Trust Co, 5.59% (callable at 100 beginning 12/28/15) (d) (e) | | | 410,000 | | | | 405,339 | |
Mellon Capital IV, 6.24% (callable at 100 beginning 06/20/12) (d) (e) | | | 570,000 | | | | 521,550 | |
Merrill Lynch & Co. Inc., 6.05%, 05/16/16 | | | 580,000 | | | | 608,066 | |
Merrill Lynch & Co. Inc., 6.88%, 04/25/18 | | | 2,650,000 | | | | 2,932,008 | |
Metropolitan Life Global Funding I, 1.00%, 01/10/14 (a) (c) | | | 300,000 | | | | 299,928 | |
Morgan Stanley, 6.63%, 04/01/18 | | | 1,000,000 | | | | 1,101,593 | |
Morgan Stanley, 7.30%, 05/13/19 | | | 1,500,000 | | | | 1,701,039 | |
Morgan Stanley, 5.50%, 01/26/20 | | | 2,850,000 | | | | 2,887,138 | |
The accompanying notes are an integral part of the financial statements.
| | |
| 8 | | Montgomery Street Income Securities, Inc. |
| | | | | | | | |
| | | Principal
Amount ($) | | | Value ($) | |
| | | | | | | |
Morgan Stanley, 5.38%, 08/10/20, EUR | | | 100,000 | | | | 142,117 | |
OJSC Russian Agricultural Bank, 6.30%, 05/15/17 | | | 500,000 | | | | 527,500 | |
Rabobank Capital Funding Trust III, 5.25% (callable at 100 on 10/21/16) (a) (d) (e) | | | 800,000 | | | | 802,126 | |
Rabobank Nederland NV, 11.00% (callable at 100 beginning 06/30/19) (a) (d) (e) | | | 1,000,000 | | | | 1,276,000 | |
Rabobank Nederland NV, 6.88%, 03/19/20, EUR | | | 1,100,000 | | | | 1,595,333 | |
RCI Banque SA, 2.12%, 04/11/14 (a) (c) | | | 600,000 | | | | 601,132 | |
Regions Financial Corp., 4.88%, 04/26/13 | | | 1,000,000 | | | | 1,008,593 | |
Royal Bank of Scotland Plc, 5.63%, 08/24/20 | | | 2,000,000 | | | | 2,000,836 | |
RZD Capital Ltd., 5.74%, 04/03/17 | | | 1,300,000 | | | | 1,381,250 | |
Sberbank, 5.50%, 07/07/15 | | | 700,000 | | | | 741,125 | |
Sberbank Via SB Capital SA, 5.40%, 03/24/17 | | | 1,200,000 | | | | 1,245,000 | |
Shinhan Bank, 4.13%, 10/04/16 (a) | | | 200,000 | | | | 203,663 | |
SLM Corp., 5.13%, 08/27/12 | | | 1,000,000 | | | | 1,026,080 | |
SLM Corp., 5.38%, 01/15/13 | | | 2,000,000 | | | | 2,055,428 | |
SLM Corp., 8.45%, 06/15/18 | | | 500,000 | | | | 548,806 | |
State Street Capital Trust IV, 1.25%, 06/15/37 (callable at 100 beginning 06/15/12) (c) | | | 670,000 | | | | 542,439 | |
Sydney Airport Finance Co. Pty Ltd., 5.13%, 02/22/21 (a) | | | 2,100,000 | | | | 2,110,483 | |
TNK-BP Finance SA, 7.50%, 03/13/13 | | | 1,600,000 | | | | 1,732,000 | |
TransCapitalInvest Ltd., 8.70%, 08/07/18 | | | 2,250,000 | | | | 2,764,687 | |
UBS AG Stamford, 5.88%, 12/20/17 | | | 300,000 | | | | 329,091 | |
UBS Preferred Funding Trust V, 6.24% (callable at 100 beginning 05/15/16) (d) (e) | | | 1,100,000 | | | | 1,078,000 | |
USB Capital IX, 3.50% (callable at 100 beginning 04/15/11) (d) (e) | | | 625,000 | | | | 516,587 | |
USB Realty Corp., 6.09% (callable at 100 beginning 01/15/12) (a) (d) (e) | | | 600,000 | | | | 523,500 | |
Ventas Realty LP, 3.13%, 11/30/15 | | | 100,000 | | | | 99,016 | |
VTB Bank, 6.88%, 05/29/18 (a) | | | 400,000 | | | | 429,200 | |
Wachovia Corp., 5.75%, 02/01/18 | | | 800,000 | | | | 884,630 | |
Wells Fargo Capital XIII, 7.70% (callable at 100 beginning 03/26/13) (d) (e) | | | 2,100,000 | | | | 2,142,000 | |
White Nights Finance BV, 10.50%, 03/25/14 | | | 2,000,000 | | | | 2,390,400 | |
| | | | | | | | |
| | | | | | | 86,957,220 | |
| Health Care 2.5% | | | | | | | | |
Boston Scientific Corp., 6.40%, 06/15/16 | | | 1,200,000 | | | | 1,351,589 | |
Fresenius Medical Care Term Loan B, 1.68%, 03/31/13 (c) | | | 654,370 | | | | 650,202 | |
Fresenius Medical Care Term Loan B, 1.68%, 03/31/13 (c) | | | 158,905 | | | | 157,893 | |
Fresenius Medical Care Term Loan B, 1.68%, 03/31/13 (c) | | | 162,148 | | | | 161,115 | |
Fresenius Medical Care Term Loan B, 1.68%, 03/31/13 (c) | | | 19,341 | | | | 19,217 | |
HCA Inc., 8.50%, 04/15/19 | | | 2,000,000 | | | | 2,210,000 | |
| | | | | | | | |
| | | | | | | 4,550,016 | |
| Industrials 0.5% | | | | | | | | |
CSN Islands XI Corp., 6.88%, 09/21/19 (a) | | | 700,000 | | | | 763,875 | |
CSN Resources SA, 6.50%, 07/21/20 (a) | | | 200,000 | | | | 212,500 | |
| | | | | | | | |
| | | | | | | 976,375 | |
| Materials 5.4% | | | | | | | | |
Anglo American Capital Plc, 9.38%, 04/08/14 (a) | | | 543,000 | | | | 649,166 | |
Cliffs Natural Resources Inc., 5.90%, 03/15/20 | | | 1,000,000 | | | | 1,082,662 | |
CSN Resources SA, 6.50%, 07/21/20 | | | 500,000 | | | | 531,250 | |
Dow Chemical Co., 8.55%, 05/15/19 | | | 990,000 | | | | 1,276,549 | |
Georgia-Pacific LLC, 5.40%, 11/01/20 (a) | | | 2,300,000 | | | | 2,344,004 | |
GTL Trade Finance Inc., 7.25%, 10/20/17 | | | 2,000,000 | | | | 2,240,000 | |
LBI Escrow Corp., 8.00%, 11/01/17 (a) | | | 900,000 | | | | 1,001,250 | |
Rio Tinto Finance USA Ltd., 9.00%, 05/01/19 | | | 200,000 | | | | 265,008 | |
Teck Resources Ltd., 10.75%, 05/15/19 | | | 360,000 | | | | 454,950 | |
| | | | | | | | |
| | | | | | | 9,844,839 | |
The accompanying notes are an integral part of the financial statements.
| | | | |
| Montgomery Street Income Securities, Inc. | | | 9 | |
| | | | | | | | |
| | | Principal
Amount ($) | | | Value ($) | |
| | | | | | | |
| Telecommunication Services 0.3% | | | | | | | | |
Qtel International Finance Ltd., 4.75%, 02/16/21 (a) | | | 300,000 | | | | 292,500 | |
Rogers Communications Inc., 7.50%, 03/15/15 | | | 179,000 | | | | 211,915 | |
| | | | | | | | |
| | | | | | | 504,415 | |
| Utilities 2.5% | | | | | | | | |
Centrais Eletricas Brasileiras SA, 6.88%, 07/30/19 | | | 400,000 | | | | 453,000 | |
Consumers Energy Co., 6.70%, 09/15/19 | | | 540,000 | | | | 647,713 | |
Duquesne Light Holdings Inc., 6.40%, 09/15/20 (a) | | | 400,000 | | | | 413,761 | |
Florida Power Corp., 5.80%, 09/15/17 | | | 195,000 | | | | 226,626 | |
Korea Electric Power Corp., 3.00%, 10/05/15 (a) | | | 1,400,000 | | | | 1,377,057 | |
NRG Energy Inc., 8.25%, 09/01/20 | | | 200,000 | | | | 204,000 | |
NRG Energy Inc. Term Loan, 2.51%, 05/05/18 (c) | | | 200,000 | | | | 200,028 | |
NRG Energy Inc. Term Loan B, 2.06%, 02/01/13 (c) | | | 90,941 | | | | 90,704 | |
NRG Energy Inc. Term Loan B, 2.06%, 02/01/13 (c) | | | 888,703 | | | | 886,383 | |
| | | | | | | | |
| | | | | | | 4,499,272 | |
| |
Total Corporate Bonds (cost $138,292,010) | | | | | | | 142,025,868 | |
| | | | | | | | |
Non-U.S. Government Agency Asset-Backed Securities 13.1% | | | | | | | | |
Aircraft Certificate Owner Trust, (2003, 1A, D), 6.46%, 09/20/22 (a) | | | 70,357 | | | | 70,357 | |
Ally Auto Receivables Trust, (2009, B, A3), 1.98%, 10/15/13 (a) | | | 1,000,000 | | | | 1,010,058 | |
American Airlines Pass-Through Trust, 10.38%, 07/02/19 | | | 1,959,050 | | | | 2,262,703 | |
American Airlines Pass-Through Trust (insured by Assured Guaranty Corp.), 7.86%, 04/01/13 | | | 1,000,000 | | | | 1,012,500 | |
Banc of America Funding Corp. REMIC, (2004, A, 1A3), 4.95%, 09/20/34 (c) | | | 1,011,742 | | | | 1,011,957 | |
Banc of America Mortgage Securities Inc. REMIC, (2005, H, 2A5), 3.20%, 09/25/35 (c) | | | 1,065,000 | | | | 790,502 | |
Bayview Commercial Asset Trust, Interest Only REMIC, (2007, 4A, IO), 2.83%, 09/25/37 (a) (c) | | | 5,311,986 | | | | 478,079 | |
Bayview Commercial Asset Trust, Interest Only REMIC, (2007, 2A, IO), 3.57%, 05/25/14 (a) (c) | | | 4,963,346 | | | | 423,373 | |
Bayview Financial Acquisition Trust REMIC, (2007, B, 2A1), 0.49%, 08/28/37 (c) | | | 442,303 | | | | 428,678 | |
Bear Stearns Adjustable Rate Mortgage Trust REMIC, (2004, 6, 2A1), 3.09%, 09/25/34 (c) | | | 778,739 | | | | 666,145 | |
Citigroup Mortgage Loan Trust Inc. REMIC, (2004, NCM2, 1CB2), 6.75%, 08/25/34 | | | 188,381 | | | | 200,197 | |
Continental Airlines Pass-Through Trust Class A, 9.00%, 07/08/16 | | | 1,878,741 | | | | 2,151,159 | |
Countrywide Alternative Loan Trust REMIC, (2004, 14T2, A4), 5.50%, 08/25/34 | | | 100,002 | | | | 100,137 | |
Countrywide Alternative Loan Trust REMIC, (2004, 35T2, A1), 6.00%, 02/25/35 | | | 92,700 | | | | 92,296 | |
Credit Suisse First Boston Mortgage Securities Corp. REMIC, (2004, AR8, 2A1), 2.85%, 09/25/34 (c) | | | 1,389,998 | | | | 1,307,824 | |
Credit-Based Asset Servicing and Securitization LLC, (2006, SC1, A), 0.46%, 05/25/36 (a) (c) | | | 105,175 | | | | 91,564 | |
Delta Air Lines Inc. Pass-Through Trust, 7.11%, 03/18/13 | | | 2,000,000 | | | | 2,022,400 | |
Galaxy CLO Ltd., (2005, 4A, A1VB), 0.56%, 04/17/17 (a) (c) | | | 986,155 | | | | 960,813 | |
GMAC Mortgage Corp. Loan Trust REMIC (insured by Financial Guaranty Insurance Co.),
(2006, HE3, A2), 5.75%, 10/25/36 (c) | | | 277,588 | | | | 182,107 | |
Holmes Master Issuer Plc, (2011, 1A, A3) 2.68%, 10/15/54 (c), EUR | | | 700,000 | | | | 1,017,884 | |
Lehman Brothers Small Balance Commercial REMIC, (2006, 2A, 2A2), 5.62%, 09/25/36 (a) (c) | | | 167,084 | | | | 150,090 | |
Nationstar NIM Trust, (2007, A, A), 9.79%, 03/25/37 (a) | | | 22,008 | | | | — | |
Residential Asset Securitization Trust REMIC, (2005, A1, A3), 5.50%, 04/25/35 | | | 2,351,996 | | | | 2,134,590 | |
Truman Capital Mortgage Loan Trust REMIC, (2006, 1, A), 0.45%, 03/25/36 (a) (c) | | | 1,890,083 | | | | 1,377,511 | |
UAL, 2009-1 Pass-Through Trust, 10.40%, 11/01/16 | | | 1,818,241 | | | | 2,061,340 | |
Washington Mutual Mortgage Pass-Through Certificates REMIC, (2005, AR16, 1A3), 2.59%, 12/25/35 | | | 1,320,000 | | | | 1,002,726 | |
Wells Fargo Mortgage Backed Securities Trust REMIC, (2006, 1, A3), 5.00%, 03/25/21 | | | 670,370 | | | | 666,904 | |
| |
Total Non-U.S. Government Agency Asset-Backed Securities (cost $24,558,391) | | | | | | | 23,673,894 | |
| | | | | | | | |
Government and Agency Obligations 2.1% | | | | | | | | |
| | |
| Government Securities 2.0% | | | | | | | | |
| | |
| Sovereign 0.2% | | | | | | | | |
Banco Nacional de Desenvolvimento Economico e Social, 5.50%, 07/12/20 (a) | | | 400,000 | | | | 423,500 | |
The accompanying notes are an integral part of the financial statements.
| | |
| 10 | | Montgomery Street Income Securities, Inc. |
| | | | | | | | |
| | | Principal
Amount ($)/
Contracts | | | Value ($) | |
| | | | | | | |
| U.S. Treasury Securities 1.8% | | | | | | | | |
U.S. Treasury Bond, 4.25%, 11/15/40 (f) | | | 3,300,000 | | | | 3,225,750 | |
| | |
| U.S. Government Agency Mortgage-Backed Securities 0.1% | | | | | | | | |
| | |
| Federal Home Loan Mortgage Corp. 0.0% | | | | | | | | |
Federal Home Loan Mortgage Corp. REMIC, 7.00%, 08/15/21 | | | 15,695 | | | | 17,620 | |
| | |
| Federal National Mortgage Association 0.1% | | | | | | | | |
Federal National Mortgage Association REMIC, 5.00%, 06/25/34 | | | 132,144 | | | | 132,262 | |
| |
Total Government and Agency Obligations (cost $3,650,828) | | | | | | | 3,799,132 | |
| | | | | | | | |
Purchased Options 0.0% | | | | | | | | |
Interest Rate Put Swaption, 3 month LIBOR versus 1.25% fixed, Expiration 04/30/12, GSC | | | 20 | | | | 2,300 | |
| |
Total Purchased Options (cost $7,600) | | | | | | | 2,300 | |
| | | | | | | | |
Short Term Investments 9.8% | | | | | | | | |
| | |
| U.S. Treasury Securities 0.1% | | | | | | | | |
U.S. Treasury Bill, 0.04%, 09/08/11 (f) | | $ | 260,000 | | | | 259,992 | |
| | |
| Repurchase Agreements 9.7% | | | | | | | | |
Repurchase Agreement with BCL, 0.05% (Collateralized by $8,533,357 Fannie Mae, 5.00%, due on 10/01/35, value $9,066,692) acquired on 06/30/2011, due 07/01/2011 at $8,800,012 | | | 8,800,000 | | | | 8,800,000 | |
Repurchase Agreement with BCL, 0.06% (Collateralized by $8,533,357 Fannie Mae, 5.00%, due on 10/01/35, value $9,066,692) acquired on 06/30/2011, due 07/05/2011 at $8,800,059 | | | 8,800,000 | | | | 8,800,000 | |
| |
Total Short Term Investments (cost $17,859,980) | | | | | | | 17,859,992 | |
| |
Total Investments — 103.4% (cost $184,368,809) | | | | | | | 187,361,186 | |
Other Assets and Liabilities, Net (3.4%) (f) | | | | | | | (6,176,503 | ) |
| |
Total Net Assets — 100% | | | | | | $ | 181,184,683 | |
Notes to the Investment Portfolio (Unaudited)
| (a) | Rule 144A or Section 4(2) liquid security. The Fund’s investment adviser has deemed this security to be liquid based on procedures approved by the Fund’s Board of Directors. As of June 30, 2011, the aggregate value of Rule 144A or Section 4(2) liquid securities was $50,331,497 (27.8% of net assets). |
| (b) | Restricted Rule 144A or Section 4(2) security. Rule 144A or Section 4(2) of the Securities Act of 1933, as amended, provides an exemption from the registration requirements for resale of this security to institutional buyers. |
| (c) | Floating rate note. Floating rate notes are securities whose yields vary with a designated market index or market rate, such as the coupon-equivalent of the U.S. Treasury bill rate. These securities are shown at their current rate as of June 30, 2011. |
| (d) | Interest rate is fixed until stated call date and variable thereafter. |
| (e) | Perpetual maturity security. |
| (f) | All or a portion of the security or cash pledged as collateral for open futures contracts or swap agreements. Total value of securities or cash pledged as of June 30, 2011 was $367,540. |
Restricted Securities
Restricted securities are purchased in private placement transactions and cannot be sold without prior registration unless the sale is pursuant to an exemption under the Securities Exchange Act of 1933, as amended. The following table consists of Rule 144A securities held by the Fund at June 30, 2011 that have not been deemed liquid by the Fund’s investment adviser.
| | | | | | | | | | | | | | | | |
| | | Initial Acquisition Date | | | Cost | | | Ending
Value | | | Percent
of Net
Assets | |
| Wesfarmers Ltd. , 2.98%, 05/18/16 | | | 05/09/2011 | | | $ | 900,000 | | | $ | 902,661 | | | | 0.5 | % |
The accompanying notes are an integral part of the financial statements.
| | | | |
| Montgomery Street Income Securities, Inc. | | | 11 | |
| | | | | | | | | | | | | | | | |
| Schedule of Written Options | | Expiration
Date | | | Exercise
Price | | | Contracts | | | Value | |
| Eurodollar Future Put Option | | | 03/19/2012 | | | | 99 | | | | 37 | | | $ | (5,087 | ) |
| Put Swaption, 3 month LIBOR versus 2.0% fixed, GSC | | | 05/02/2013 | | | | N/A | | | | 43 | | | | (1,575 | ) |
| | | | | | | | | | | | 80 | | | $ | (6,662 | ) |
| | | | | | | | |
| Summary of Written Options | | Contracts | | | Premiums | |
| Options outstanding at December 31, 2010 | | | — | | | $ | — | |
| Options written during the period | | | (106 | ) | | | (41,890 | ) |
| Options expired during the period | | | 26 | | | | 3,997 | |
| Options outstanding at June 30, 2011 | | | (80 | ) | | $ | (37,893 | ) |
| | | | | | | | |
| Schedule of Open Futures Contracts | | Contracts
Long | | | Unrealized
Appreciation/
(Depreciation) | |
| 3-Month Euro Euribor Future, Expiration December 2011 | | | 10 | | | $ | 10,196 | |
| 90-Day Eurodollar Future, Expiration June 2012 | | | 1 | | | | (152 | ) |
| 90-Day Eurodollar Future, Expiration December 2012 | | | 3 | | | | (1,261 | ) |
| 90-Day Eurodollar Future, Expiration March 2013 | | | 2 | | | | (878 | ) |
| 90-Day Eurodollar Future, Expiration June 2013 | | | 2 | | | | (883 | ) |
| 90-Day Eurodollar Future, Expiration September 2013 | | | 2 | | | | (1,348 | ) |
| Euro-Bund Future, Expiration September 2011 | | | 26 | | | | (34,316 | ) |
| | | | | | | $ | (28,642 | ) |
Schedule of Open Forward Foreign Currency Contracts
| | | | | | | | | | | | | | | | |
| Counterparty | | Currency Purchased/Sold | | Settlement Date | | Notional Amount | | | Currency Value | | | Unrealized
Gain/(Loss) | |
| BCL | | CAD/USD | | 09/19/2011 | | | CAD 1,748,000 | | | $ | 1,808,890 | | | $ | 42,288 | |
| GSC | | EUR/USD | | 07/18/2011 | | | EUR 1,665,000 | | | | 2,413,604 | | | | (51,742 | ) |
| BCL | | EUR/USD | | 07/18/2011 | | | EUR 61,000 | | | | 88,426 | | | | (85 | ) |
| GSC | | KRW/USD | | 11/14/2011 | | | KRW 2,488,640,000 | | | | 2,313,367 | | | | 35,228 | |
| BCL | | NOK/USD | | 08/08/2011 | | | NOK 7,891,000 | | | | 1,459,438 | | | | (30,492 | ) |
| BCL | | USD/CAD | | 09/19/2011 | | | CAD (438,000 | ) | | | (453,257 | ) | | | (4,174 | ) |
| GSC | | USD/EUR | | 07/18/2011 | | | EUR (6,536,000 | ) | | | (9,474,663 | ) | | | (25,979 | ) |
| BCL | | USD/EUR | | 07/18/2011 | | | EUR (623,000 | ) | | | (903,108 | ) | | | (12,446 | ) |
| BCL | | USD/EUR | | 07/18/2011 | | | EUR (584,000 | ) | | | (846,573 | ) | | | (10,804 | ) |
| BCL | | USD/EUR | | 07/18/2011 | | | EUR (51,000 | ) | | | (73,930 | ) | | | (1,010 | ) |
| BCL | | USD/EUR | | 07/18/2011 | | | EUR (683,000 | ) | | | (990,085 | ) | | | (7,493 | ) |
| BCL | | USD/EUR | | 07/18/2011 | | | EUR (607,000 | ) | | | (879,914 | ) | | | (18,655 | ) |
| BCL | | USD/GBP | | 09/13/2011 | | | GBP (1,613,000 | ) | | | (2,586,497 | ) | | | 50,725 | |
| BCL | | USD/JPY | | 07/14/2011 | | | JPY (146,978,000 | ) | | | (1,825,782 | ) | | | 4,483 | |
| | | | | | | | | | | $ | (9,950,085 | ) | | $ | (30,156 | ) |
The accompanying notes are an integral part of the financial statements.
| | |
| 12 | | Montgomery Street Income Securities, Inc. |
Schedule of Credit Default Swap Agreements
| | | | | | | | | | | | | | | | | | | | | | | | | | |
| Counterparty | | Reference Obligation | | Implied Credit Spread3 | | | Fixed
Received/ Pay Rate | | | Expiration
Date | | | Notional
Amount1,4 | | | Value | | | Unrealized
Appreciation/
(Depreciation) | |
| Credit default swap agreements - sell protection2 | |
| GSI | | Arcelormittal, 6.13%, 06/01/18 | | | 2.19 | % | | | 1.00 | % | | | 03/20/2016 | | | $ | (1,600,000 | ) | | $ | (82,698 | ) | | $ | (23,554 | ) |
| GSI | | Canadian Natural Resources Ltd., 6.25%, 03/15/38 | | | 0.79 | % | | | 1.00 | % | | | 12/20/2015 | | | | (500,000 | ) | | | 4,484 | | | | 2,996 | |
| BBP | | Federative Republic of Brazil, 12.25%, 03/06/30 | | | 1.08 | % | | | 1.00 | % | | | 06/20/2016 | | | | (2,400,000 | ) | | | (8,762 | ) | | | (263 | ) |
| BBP | | People’s Republic of China,
4.75%, 10/29/13 | | | 0.81 | % | | | 1.00 | % | | | 06/20/2016 | | | | (1,800,000 | ) | | | 16,081 | | | | (11,776 | ) |
| BBP | | Republic of Korea, 4.88%, 09/22/14 | | | 0.97 | % | | | 1.00 | % | | | 06/20/2016 | | | | (2,700,000 | ) | | | 3,417 | | | | (5,018 | ) |
| BBP | | United Mexican States, 7.50%, 04/08/33 | | | 1.04 | % | | | 1.00 | % | | | 06/20/2016 | | | | (1,200,000 | ) | | | (2,403 | ) | | | (3,103 | ) |
| | | | | | | | | | | | | | | | | $ | (10,200,000 | ) | | $ | (69,881 | ) | | $ | (40,718 | ) |
| 1 | | Notional Amount is stated in USD unless otherwise noted. |
| 2 | | When the Fund is a seller of protection and a credit event occurs, as defined under the terms of that particular swap agreement, the Fund will either (i) pay the buyer of protection an amount equal to the notional amount of the referenced obligation and take delivery of the referenced obligation or underlying security comprising the referenced index or (ii) pay a net settlement amount in the form of cash or securities equal to the notional amount of the swap agreement less the recovery value of the referenced obligation or underlying security comprising the referenced index. |
| 3 | | Implied credit spreads, represented in absolute terms, utilized in determining the market value of credit default swap agreements on corporate issues serve as an indicator of the current status of the payment/performance risk and represent the likelihood or risk of default for the credit derivative. The implied credit spread of a particular referenced entity reflects the cost of buying/selling protection and may include upfront payments required to be made to enter into the agreement. Wider credit spreads represent a deterioration of the referenced entity’s credit soundness and a greater likelihood or risk of default or other credit event occurring as defined under the terms of the agreement. |
| 4 | | The maximum potential amount the Fund could be required to pay as a seller of credit protection or receive as a buyer of credit protection if a credit event occurs is limited to the total notional amount which is defined under the terms of the swap agreement. |
Financial Accounting Standards Board (“FASB”) Topic 815, “Derivatives and Hedging”*
The following is a summary of the fair valuations of the Fund’s derivative instruments categorized by risk exposure.
Fair values of derivative instruments on the Statement of Assets and Liabilities as of June 30, 2011:
| | | | | | | | | | | | |
| Assets | | Credit
Contracts | | | Interest Rate
Contracts | | | Foreign Currency
Exchange Rate
Contracts | |
| Investments in securities, at value | | $ | — | | | $ | 2,300 | | | $ | — | |
| Forward foreign currency contracts | | | — | | | | — | | | | 132,724 | |
| Variation margin** | | | — | | | | 200 | | | | — | |
| Unrealized appreciation on swap agreements | | | 2,996 | | | | — | | | | — | |
| Swap premiums paid | | | 37,915 | | | | — | | | | — | |
| | | $ | 40,911 | | | $ | 2,500 | | | $ | 132,724 | |
| | | |
| Liabilities | | Credit
Contracts | | | Equity
Contracts | | | Foreign Currency
Exchange Rate
Contracts | |
| Written options, at value | | $ | — | | | $ | 6,662 | | | $ | — | |
| Forward foreign currency contracts | | | — | | | | — | | | | 162,880 | |
| Variation margin** | | | — | | | | 45,077 | | | | — | |
| Unrealized depreciation on swap agreements | | | 43,714 | | | | — | | | | — | |
| Swap premiums received | | | 61,337 | | | | — | | | | — | |
| | | $ | 105,051 | | | $ | 51,739 | | | $ | 162,880 | |
The accompanying notes are an integral part of the financial statements.
| | | | |
| Montgomery Street Income Securities, Inc. | | | 13 | |
The effect of derivative instruments on the Statement of Operations for the six months ended June 30, 2011:
| | | | | | | | | | | | | | | | |
| Net realized gain (loss) from: | | Credit
Contracts | | | Interest Rate
Contracts | | | Foreign Currency
Exchange Rate
Contracts | | | Total | |
| Investment transactions | | $ | — | | | $ | — | | | $ | — | | | $ | — | |
| Foreign currency related items*** | | | — | | | | — | | | | (358,251 | ) | | | (358,251 | ) |
| Futures contracts | | | — | | | | (196,612 | ) | | | — | | | | (196,612 | ) |
| Written options contracts | | | — | | | | 3,998 | | | | — | | | | 3,998 | |
| Swap agreements | | | 31,092 | | | | (200,765 | ) | | | — | | | | (169,673 | ) |
| | | $ | 31,092 | | | $ | (393,379 | ) | | $ | (358,251 | ) | | $ | (720,538 | ) |
| | | | |
| Net Change in unrealized appreciation (depreciation) on: | | Credit
Contracts | | | Interest Rate
Contracts | | | Foreign Currency
Exchange Rate
Contracts | | | Total | |
| Investments**** | | $ | — | | | $ | (5,300 | ) | | $ | — | | | $ | (5,300 | ) |
| Foreign currency related items*** | | | — | | | | — | | | | (147,486 | ) | | | (147,486 | ) |
| Futures contracts | | | — | | | | (38,778 | ) | | | — | | | | (38,778 | ) |
| Written options contracts | | | — | | | | 31,231 | | | | — | | | | 31,231 | |
| Swap agreements | | | (45,506 | ) | | | — | | | | — | | | | (45,506 | ) |
| | | $ | (45,506 | ) | | $ | (12,847 | ) | | $ | (147,486 | ) | | $ | (205,839 | ) |
| * | | See Note C in the Notes to Financial Statements for additional information. |
| ** | | The fair value of derivative instruments may include cumulative appreciation (depreciation) of futures contracts as reported in the Notes to the Investment Portfolio. Only current day’s variation margin is reported within the Statement of Assets and Liabilities. |
| *** | | Net realized gain (loss) on forward foreign currency contracts is included in net realized gain (loss) from foreign currency related items in the Statement of Operations. Net change in unrealized appreciation (depreciation) on forward foreign currency contracts is included in net change in unrealized appreciation (depreciation) in foreign currency related items. |
| **** | | Includes change in unrealized appreciation (depreciation) on purchased options. |
FASB Accounting Standards Codification (“ASC”) Topic 820, “Fair Value Measurements and Disclosure”
This standard establishes a single authoritative definition of fair value, sets out a framework for measuring fair value and requires additional disclosures about fair value measurements. Various inputs are used in determining the value of the Fund’s investments under FASB ASC Topic 820 guidance. The inputs are summarized into three broad categories. Level 1 includes exchange-listed prices. Level 2 includes valuations determined from significant direct or indirect observable inputs. Direct observable inputs include broker quotes, closing prices of similar securities in active markets, closing prices for identical or similar securities in non-active markets or corporate action or reorganization entitlement values. Indirect observable inputs include factors such as interest rates, yield curves, prepayment speeds or credit ratings. Level 2 includes valuations of vendor evaluated debt instruments, broker quotes in active markets, securities valued at amortized cost, modeled over-the-counter derivatives contracts, and swap agreements valued by pricing services. Level 3 includes valuations determined from significant unobservable inputs including management’s own assumptions in determining the fair value of the investment. Inputs used to determine the fair value of Level 3 securities include security specific inputs such as: credit quality, credit rating spreads, issuer news, trading characteristics, call features or maturity; or industry specific inputs such as trading activity of similar markets or securities, changes in the security’s underlying index or comparable securities’ models. Level 3 valuations include certain single source quotes received from brokers (either directly or through a vendor), securities restricted to resale due to market events, newly issued securities or securities for which reliable quotes are not available. There were no significant transfers between Level 1 and Level 2 during the period ended June 30, 2011. The only significant transfer between Level 2 and Level 3 valuations during the period ended June 30, 2011 related to certain mortgage backed securities valued by an approved independent pricing service, that were previously valued using investment adviser guidance. Fixed income investments valued by investment adviser guidance generally are considered a Level 3 valuation. Fixed income investments valued by an approved independent pricing service generally are considered a Level 2 valuation. The inputs or methodology used for valuing securities are not necessarily an indication of the risk associated with investing in those securities. See “Security Valuation” in the Notes to the Financial Statements for security valuation accounting policies.
The accompanying notes are an integral part of the financial statements.
| | |
| 14 | | Montgomery Street Income Securities, Inc. |
The following table summarizes the Fund’s investments in securities and other financial instruments as of June 30, 2011 by valuation level.
| | | | | | | | | | | | | | | | |
| | | Assets - Investments in Securities | |
| | | Level 1 | | | Level 2 | | | Level 3 | | | Total | |
| Corporate Bonds | | | $— | | | $ | 142,025,868 | | | $ | — | | | $ | 142,025,868 | |
| Non-U.S. Government Agency Asset-Backed Securities | | | — | | | | 23,673,894 | | | | — | | | | 23,673,894 | |
| Government and Agency Obligations | | | — | | | | 3,799,132 | | | | — | | | | 3,799,132 | |
| Short Term Investments | | | — | | | | 17,859,992 | | | | — | | | | 17,859,992 | |
| Purchased Options | | | — | | | | 2,300 | | | | — | | | | 2,300 | |
| Fund Total | | | $— | | | $ | 187,361,186 | | | $ | — | | | $ | 187,361,186 | |
| |
| | | Assets - Other Financial Instruments† | |
| | | Level 1 | | | Level 2 | | | Level 3 | | | Total | |
| Futures Contracts | | | $10,196 | | | | $— | | | $ | — | | | | $10,196 | |
| Forward Foreign Currency Contracts | | | — | | | | 132,724 | | | | — | | | | 132,724 | |
| Credit Default Swap Agreements | | | — | | | | 2,996 | | | | — | | | | 2,996 | |
| Fund Total | | | $10,196 | | | | $135,720 | | | $ | — | | | | $145,916 | |
| |
| | | Liabilities - Other Financial Instruments† | |
| | | Level 1 | | | Level 2 | | | Level 3 | | | Total | |
| Written Options | | | $(5,087) | | | | $(1,575) | | | | $— | | | | $(6,662) | |
| Futures Contracts | | | (38,838) | | | | — | | | | — | | | | (38,838) | |
| Forward Foreign Currency Contracts | | | — | | | | (162,880) | | | | — | | | | (162,880) | |
| Credit Default Swap Agreements | | | — | | | | (43,714) | | | | — | | | | (43,714) | |
| Fund Total | | | $(43,925) | | | | $(208,169) | | | | $— | | | | $(252,094) | |
| † | Investments in other financial instruments are derivative instruments not reflected in the Investment Portfolio and include written options, futures contracts, forward foreign currency contracts, and swap agreements. Options purchased are included in the investment portfolio. All derivatives are reflected at the unrealized appreciation/(depreciation) on the instrument, except for written options which are reflected at value. |
| | |
| Abbreviations: | | |
| |
| CAD – Canadian Dollar | | MBIA– Municipal Bond Investors Assurance |
| |
| EUR – European Currency Unit (Euro) | | NIM – Net Interest Margin |
| |
| GBP – British Pound | | REMIC – Real Estate Mortgage Investment Conduit |
| |
| JPY – Japanese Yen | | BBP – Barclays Bank PLC |
| |
| KRW – Korean Won | | BCL – Barclays Capital Inc. |
| |
| NOK – Norwegian Krone | | GSC – Goldman Sachs & Co. |
| |
| USD – United States Dollar | | GSI – Goldman Sachs International |
The accompanying notes are an integral part of the financial statements.
| | | | |
| Montgomery Street Income Securities, Inc. | | | 15 | |
Financial Statements (Unaudited)
Statement of Assets and Liabilities as of June 30, 2011 (Unaudited)
| | | | |
| Assets | | | |
| Investments in securities, at value (cost $184,368,809) | | $ | 187,361,186 | |
| Cash | | | 528,034 | |
| Foreign currency (cost $208,973) | | | 211,348 | |
| Receivables: | | | | |
Investments sold | | | 99,650 | |
Forward foreign currency contracts | | | 132,724 | |
Interest | | | 2,390,939 | |
Variation margin | | | 200 | |
Deposits with counterparties | | | 1,000 | |
| Unrealized appreciation on swap agreements | | | 2,996 | |
| Swap premiums paid | | | 37,915 | |
| Other assets | | | 52,229 | |
| Total assets | | | 190,818,221 | |
| |
| Liabilities | | | |
| Accrued management and investment advisory fee | | | 113,327 | |
| Accrued administrative fee | | | 34,046 | |
| Written options, at value (premiums $37,893) | | | 6,662 | |
| Payables: | | | | |
Investment securities purchased | | | 9,087,960 | |
Directors’ fees and expense | | | 975 | |
Variation margin | | | 45,077 | |
Swap agreements | | | 43,714 | |
Forward foreign currency contracts | | | 162,880 | |
| Swap premiums received | | | 61,337 | |
| Other liabilities | | | 77,560 | |
| Total liabilities | | | 9,633,538 | |
| Net assets, at value | | $ | 181,184,683 | |
| Net assets consist of: | | | | |
| Paid-in capital | | | 202,451,688 | |
| Undistributed net investment income | | | 2,215,262 | |
| Net unrealized appreciation on investments and foreign currency related items | | | 2,930,253 | |
| Accumulated net realized loss | | | (26,412,520 | ) |
| Net assets, at value | | $ | 181,184,683 | |
| Net Asset Value per share ($181,184,683/10,366,428 shares of common stock outstanding, $.01 par value, 30,000,000 shares authorized) | | $ | 17.48 | |
The accompanying notes are an integral part of the financial statements.
| | |
| 16 | | Montgomery Street Income Securities, Inc. |
Statement of Operations for the period ended June 30, 2011 (Unaudited)
| | | | |
| Investment Income | | | |
| Income: | | | | |
| Interest | | $ | 4,719,721 | |
| Total income | | | 4,719,721 | |
| Expenses: | | | | |
| Management and investment advisory fee | | | 223,830 | |
| Administrative fee | | | 203,859 | |
| Legal | | | 62,085 | |
| Directors’ fees and expenses | | | 60,544 | |
| Stockholder reporting | | | 27,313 | |
| Insurance | | | 24,261 | |
| Audit fees | | | 22,230 | |
| Stockholder services | | | 13,398 | |
| NYSE listing fee | | | 11,887 | |
| Custodian fees | | | 3,492 | |
| Other | | | 14,113 | |
| Total expenses | | | 667,012 | |
| Net investment income | | | 4,052,709 | |
| |
| Realized and Unrealized Gain (Loss) on Investment Transactions and Foreign Currency Related Items | | | |
| Net realized gain from investment transactions | | | 1,337,168 | |
| Net realized loss from futures contracts | | | (196,612 | ) |
| Net realized loss from swap agreements | | | (169,673 | ) |
| Net realized loss from foreign currency related items | | | (282,121 | ) |
| Net realized gain from written options contracts | | | 3,998 | |
| Net change in unrealized appreciation (depreciation) investments | | | 1,090,350 | |
| Net change in unrealized appreciation (depreciation) on swap agreements | | | (45,506 | ) |
| Net change in unrealized appreciation (depreciation) on futures contracts | | | (38,778 | ) |
| Net change in unrealized appreciation (depreciation) on written options contracts | | | 31,231 | |
| Net change in unrealized appreciation (depreciation) on foreign currency related items | | | (139,151 | ) |
| Net gain on investment transactions and foreign currency related Items | | | 1,590,906 | |
| Net increase in net assets resulting from operations | | $ | 5,643,615 | |
The accompanying notes are an integral part of the financial statements.
| | | | |
| Montgomery Street Income Securities, Inc. | | | 17 | |
Statement of Changes in Net Assets (Unaudited)
| | | | | | | | |
| Increase in Net Assets | | Six Months Ended
June 30, 2011 | | | Year Ended
December 31, 2010 | |
| Operations: | | | | | | | | |
| Net investment income | | $ | 4,052,709 | | | $ | 7,530,260 | |
| Net realized gain on investment transactions and foreign currency related items | | | 692,760 | | | | 5,025,920 | |
| Net change in unrealized appreciation (depreciation) during the year on investment transactions and foreign currency related items | | | 898,146 | | | | 2,313,852 | |
| Net increase in net assets resulting from operations | | | 5,643,615 | | | | 14,870,032 | |
| Distributions to stockholders from net investment income | | | (1,969,531 | ) | | | (7,567,767 | ) |
| Fund share transactions: | | | | | | | | |
| Reinvestment of distributions | | | 102,028 | | | | 409,906 | |
| Cost of shares repurchased | | | (188,660 | ) | | | (457,942 | ) |
| Net decrease in net assets from fund share transactions | | | (86,632 | ) | | | (48,036 | ) |
| Increase in net assets | | | 3,587,452 | | | | 7,254,229 | |
| Net assets at beginning of period | | | 177,597,231 | | | | 170,343,002 | |
| Net assets at end of period (including undistributed net investment income of $2,215,262 and $132,084, respectively) | | $ | 181,184,683 | | | $ | 177,597,231 | |
| | |
| Other information | | | | | | |
| Shares outstanding at beginning of period | | | 10,371,952 | | | | 10,375,256 | |
| Shares issued to stockholders in reinvestment of distributions | | | 6,476 | | | | 25,696 | |
| Shares repurchased | | | (12,000 | ) | | | (29,000 | ) |
| Net decrease in fund shares outstanding | | | (5,524 | ) | | | (3,304 | ) |
| Shares outstanding at end of period | | | 10,366,428 | | | | 10,371,952 | |
The accompanying notes are an integral part of the financial statements.
| | |
| 18 | | Montgomery Street Income Securities, Inc. |
Financial Highlights (Unaudited)
| | | | | | | | | | | | | | | | | | | | | | | | |
| Years Ended December 31, | | 2011c | | | 2010d | | | 2009 | | | 2008 | | | 2007 | | | 2006e | |
| | | | | | |
| Selected Per Share Data | | | | | | | | | | | | | | | | | | |
| Net asset value, beginning of period | | $ | 17.12 | | | $ | 16.42 | | | $ | 15.13 | | | $ | 18.07 | | | $ | 18.81 | | | $ | 18.99 | |
| Income from investment operations: | | | | | | | | | | | | | | | | | | | | | | | | |
Incomea | | | 0.45 | | | | 0.86 | | | | 0.85 | | | | 1.07 | | | | 1.18 | | | | 1.03 | |
Operating expensesa | | | (0.06 | ) | | | (0.14 | ) | | | (0.12 | ) | | | (0.12 | ) | | | (0.13 | ) | | | (0.13 | ) |
Net investment incomea | | | 0.39 | | | | 0.72 | | | | 0.73 | | | | 0.95 | | | | 1.05 | | | | 0.90 | |
Net realized and unrealized gain (loss) on investment transactions | | | 0.16 | | | | 0.71 | | | | 1.33 | | | | (2.84 | ) | | | (0.67 | ) | | | (0.03 | ) |
| Total from investment operations | | | 0.55 | | | | 1.43 | | | | 2.06 | | | | (1.89 | ) | | | 0.38 | | | | 0.87 | |
| Less distributions from: | | | | | | | | | | | | | | | | | | | | | | | | |
Net investment income | | | (0.19 | ) | | | (0.73 | ) | | | (0.77 | ) | | | (1.05 | ) | | | (1.12 | ) | | | (1.05 | ) |
| Net asset value, end of period | | $ | 17.48 | | | $ | 17.12 | | | $ | 16.42 | | | $ | 15.13 | | | $ | 18.07 | | | $ | 18.81 | |
| Per share market value, end of period | | $ | 15.94 | | | $ | 15.78 | | | $ | 14.68 | | | $ | 13.82 | | | $ | 16.13 | | | $ | 17.28 | |
| Closing price range on New York Stock Exchange for each share of Common Stock outstanding: | | | | | | | | | | | | | | | | | | | | | | | | |
High ($) | | | 15.99 | | | | 16.78 | | | | 15.10 | | | | 17.27 | | | | 17.80 | | | | 17.57 | |
Low ($) | | | 15.44 | | | | 14.67 | | | | 13.19 | | | | 11.25 | | | | 15.77 | | | | 16.30 | |
| | | | | | |
| Total Return | | | | | | | | | | | | | | | | | | |
| Based on market value (%)b | | | 2.23 | g | | | 12.50 | | | | 12.04 | | | | (7.94 | ) | | | (0.23 | ) | | | 8.70 | |
| Based on net asset value (%)b | | | 3.33 | g | | | 9.12 | | | | 14.47 | | | | (10.04 | ) | | | 2.68 | | | | 5.37 | |
| | | | | | |
| Ratio to Average Net Assets and Supplemental Data | | | | | | | | | | | | | | | | | | |
| Net assets, end of period ($ millions) | | | 181 | | | | 178 | | | | 170 | | | | 157 | | | | 188 | | | | 195 | |
| Ratio of expenses (%) | | | 0.74 | f | | | 0.82 | | | | 0.76 | | | | 0.73 | | | | 0.67 | | | | 0.70 | |
| Ratio of net investment income (%) | | | 4.53 | f | | | 4.28 | | | | 4.64 | | | | 5.57 | | | | 5.64 | | | | 4.78 | |
| Portfolio turnover rate (%) | | | 16 | g | | | 132 | | | | 175 | | | | 170 | | | | 122 | | | | 199 | |
| a | Based on average shares outstanding during the period. |
| b | Total return based on net asset value reflects changes in the Fund’s net asset value during the period. Total return based on market value reflects changes in market price. Each figure includes reinvestment of dividends. These figures will differ depending upon the level of any discount or premium between market price and net asset value. |
| c | For the six months ended June 30, 2011. |
| d | The Fund changed investment adviser effective March 15, 2010. |
| e | The Fund changed investment adviser effective June 9, 2006. |
The accompanying notes are an integral part of the financial statements.
| | | | |
| Montgomery Street Income Securities, Inc. | | | 19 | |
Notes to Financial Statements (Unaudited)
A. Significant Accounting Policies
Montgomery Street Income Securities Inc. (the “Fund”) is registered under the Investment Company Act of 1940, as amended (the “1940 Act”), as a closed-end, diversified management investment company.
The Fund’s financial statements are prepared, as of the close of the New York Stock Exchange (“NYSE”) on June 30, 2011, in accordance with accounting principles generally accepted in the United States of America (“GAAP”) which requires the use of management estimates. Actual results could differ from those estimates. The policies described below are followed consistently by the Fund in the preparation of its financial statements.
Security Valuation. Investments are stated at value determined as of the close of regular trading (generally, 4:00 PM Eastern Time) on the NYSE on each day the exchange is open for trading. Debt securities are valued by independent pricing services approved by, or at the direction of, the Fund’s Board of Directors (the “Board”). If the pricing services are unable to provide valuations, debt securities are valued at the most recent bid quotation or evaluated price, as applicable, obtained from a broker/dealer or widely used quotation system. Fixed income securities with a remaining maturity of sixty days or less, maturing at par, are valued at amortized cost, unless it is determined that such price does not approximate market value. Forward foreign currency contracts are valued at the forward foreign currency exchange rate as of the close of the NYSE. Futures contracts traded on a liquid exchange are valued at the settlement price. If the settlement price is not available, exchange traded futures are valued at the last sales price as of the close of business on the local exchange. Options traded on a liquid exchange are valued at the last traded price as of the close of business on the local exchange. If the last trade is determined to not be representative of fair value, exchange-traded options are valued at the last bid. Options traded on an illiquid exchange are valued at the most recent bid quotation obtained from a broker/dealer. Non-exchange traded derivatives, including swap agreements, are generally valued by approved pricing services. If the pricing services are unable to provide valuations, non-exchange traded derivatives are valued at the most recent bid quotation or evaluated price, as applicable, obtained from a broker/dealer or by pricing models using observable inputs. Pricing services used to value debt and derivative securities may use various pricing techniques which take into account appropriate factors such as yield, quality, coupon rate, maturity, type of issue, trading characteristics, call features, credit ratings and other data, as well as broker quotes.
Market quotations may not be readily available for certain debt and derivative investments. If market quotations are not readily available or if it is determined that a quotation of an investment does not represent market value, then the investment is valued at a “fair value” as determined in good faith using procedures approved by the Board. Although there can be no assurance, in general, the fair value of a security is the amount the owner of such security might reasonably expect to receive upon its current sale. Situations that may require a security to be fair valued may include instances where a security is thinly traded or restricted as to resale. In addition, securities may be fair valued based on the occurrence of a significant event. Significant events may be specific to a particular issuer, such as mergers, restructurings or defaults. Alternatively, significant events may affect an entire market, such as natural disasters or government actions. Securities are fair valued based on observable and unobservable inputs including Jackson Fund Services’ (“JFS” or the “Administrator”) own assumptions in determining fair value. Under the procedures adopted by the Board, the Administrator may rely on independent pricing services or other sources to assist in determining the fair value of a security. Factors considered to determine fair value include the correlation with price movement of similar securities in the same or other markets; the type, cost and investment characteristics of the security; the business and financial condition of the issuer; and trading or other market data. The value of an investment for purposes of calculating the Fund’s net asset value (“NAV”) can differ depending on the source and method used to determine the value.
See the Notes to the Investment Portfolio, FASB ASC Topic 820, “Fair Value Measurements and Disclosure,” for expanded disclosure of fair value measurements.
Recent Accounting Pronouncements. In April 2011, the FASB released Accounting Standards Update (“ASU”) No. 2011-03 “Reconsideration of Effective Control for Repurchase Agreements.” ASU No. 2011-03 is intended to improve financial reporting of repurchase agreements and other agreements that both entitle and obligate a transferor to repurchase or redeem the financial assets before their maturity. The ASU eliminates the collateral maintenance provision that an entity may use to determine whether a transfer of securities in a repurchase agreement is accounted for as a sale or a secured borrowing. The ASU may cause certain dollar roll transactions that are currently accounted for as purchase and sale to be characterized as a secured borrowing transaction. The ASU is effective for the first interim or annual period beginning on or after December 15, 2011. Management is currently evaluating the impact ASU No. 2011-03 will have on its financial statement disclosures.
| | |
| 20 | | Montgomery Street Income Securities, Inc. |
In May 2011, FASB released ASU No. 2011-04 “Amendments to Achieve Common Fair Value Measurement and Disclosure Requirements in U.S. GAAP and International Financial Reporting Standards.” ASU 2011-04 further clarifies fair value measurement principles and requires additional disclosures. Effective for interim and annual periods beginning after December 15, 2011, entities will need to disclose the amounts and reasons for any transfers between Level 1 and Level 2 securities, quantitative information relating to significant observable inputs, a narrative description of the valuation process, and a narrative description of the sensitivity of the fair value measurement to changes in unobservable or Level 3 fair valuation inputs.
Security Transactions and Investment Income. Investment transactions are accounted for on a trade date plus one basis for daily NAV calculations. However, for financial reporting purposes, investment transactions are reported on trade date. Interest income is recorded on the accrual basis. All premiums and discounts are amortized/accreted for financial reporting purposes. Dividend income is recorded on the ex-dividend date.
Foreign Currency Translations. The accounting records of the Fund are maintained in U.S. dollars. Investment securities and other assets and liabilities denominated in a foreign currency are translated into U.S. dollars generally using exchange rates in effect as of 4:00 PM Eastern Time. Purchases and sales of investment securities, income receipts, and expense payments are translated into U.S. dollars at the exchange rates prevailing on the respective dates of such transactions. The Fund does not isolate that portion of the results of operations resulting from changes in foreign exchange rates on investments from the fluctuations arising from changes in market prices of foreign securities. Such fluctuations are included in net realized gain (loss) on investment transactions and net change in unrealized appreciation (depreciation) on investments, respectively.
Net realized gains and losses on foreign currency related items are considered ordinary income for tax purposes and arise from sales of foreign currencies, currency gains or losses realized between the trade and settlement dates on securities transactions, the difference between the amounts of dividends, interest, and foreign withholding taxes recorded and the U.S. dollar equivalent of the amounts actually received or paid, and the realized gains or losses resulting from portfolio and transaction hedges. Net change in unrealized appreciation (depreciation) on foreign currency related items arises from changes in the fair value of assets and liabilities, other than investments in securities, at period end resulting from changes in exchange rates.
Federal Income Taxes. The Fund intends to qualify as a “regulated investment company” and to distribute substantially all net investment income and net capital gains, if any, to its stockholders and otherwise comply with Subchapter M of the Internal Revenue Code applicable to regulated investment companies. Therefore, no federal income tax provision is required.
Distribution of Income and Capital Gains. The amount and timing of distributions are determined in accordance with federal income tax regulations, which may differ from GAAP. Distributions of net investment income are paid quarterly. Net realized gains from investment transactions will be distributed to stockholders at least annually to the extent they exceed available capital loss carryforwards. The Fund uses the specific identification method for determining realized gain or loss on investments sold for both financial and federal income tax reporting purposes.
Contingencies. In the normal course of business, the Fund may enter into contracts with service providers that contain general indemnification clauses. The Fund’s maximum exposure under these arrangements is unknown, as this would involve future claims that may be made against the Fund that have not yet been made. However, based on experience to date, the Fund expects any risk of loss to be remote.
B. Investments and Risks
When-Issued/Delayed Delivery Securities. The Fund may purchase securities with delivery or payment to occur at a date beyond the normal settlement period. At the time the Fund enters into a commitment to purchase a security, the transaction is recorded and the value of the security is reflected in the NAV. The price of such security and the date when the security will be delivered and paid for are fixed at the time the transaction is negotiated. The value of the security may vary with market fluctuations. No interest accrues to the Fund until settlement of the trade. Certain risks may arise upon entering into when-issued or delayed delivery securities from the potential inability of counterparties to meet the terms of their contracts or if the issuer does not issue the securities due to political, economic, or other factors. Additionally, losses may arise due to changes in the value of the underlying securities.
| | | | |
| Montgomery Street Income Securities, Inc. | | | 21 | |
Illiquid Investments and Restricted Securities. Illiquid securities and other investments are those that may not be sold or disposed of in the ordinary course of business within seven days, at approximately the price used to determine the Fund’s NAV per share. The Fund may not be able to sell illiquid investments when Pacific Investment Management Company (“PIMCO” or the “Adviser”) considers it desirable to do so or may have to sell such investments at a price that is lower than the price that could be obtained if the investments were liquid. A sale of illiquid investments may require more time and may result in higher dealer discounts and other selling expenses than would the sale of those that are liquid. Illiquid investments also may be more difficult to value, due to the unavailability of reliable market quotations for such investments, and investment in them may have an adverse impact on NAV. The Fund may also purchase certain restricted securities, commonly known as Rule 144A and Section 4(2) paper securities, which may be determined to be liquid pursuant to policies and guidelines established by the Board.
Repurchase Agreements. The Fund may enter into repurchase agreements with certain banks and broker/dealers whereby the Fund agrees to purchase a security with a simultaneous agreement by the seller to repurchase the security back from the Fund at a specified price and date or upon demand. The Fund, through the custodian or sub-custodian bank, receives delivery of underlying securities used as collateral, the amount of which, at the time of purchase and each subsequent business day, is required to be maintained at such a level that the collateral’s value is at least equal to the principal amount of the repurchase price plus accrued interest. The custodian holds the collateral in a separate account until the agreement matures. If the counterparty defaults and the value of the collateral declines or if bankruptcy proceedings are commenced with respect to the counterparty, realization of the collateral by the Fund may be delayed or limited.
U.S. Government Agencies or Government Sponsored Enterprises. The Fund may invest in U.S. government agencies or government sponsored enterprises. U.S. government securities are obligations of and, in certain cases, guaranteed by, the U.S. government, its agencies or instrumentalities. Some U.S. government securities, such as Treasury bills, notes and bonds, and securities guaranteed by the Government National Mortgage Association, are supported by the full faith and credit of the U.S. government; others, such as those of the Federal Home Loan Bank, are supported by the right of the issuer to borrow from the U.S. Department of the Treasury (the “U.S. Treasury”); others, such as those of the Federal National Mortgage Association (“FNMA”) are supported by the discretionary authority of the U.S. government to purchase the agency’s obligations. U.S. government securities may include zero coupon securities, which do not distribute interest on a current basis and tend to be subject to greater risk than interest-paying securities of similar maturities.
Government-related guarantors (i.e., guarantors who are not backed by the full faith and credit of the U.S. government) include FNMA and the Federal Home Loan Mortgage Corporation (“FHLMC”). FNMA purchases conventional (i.e., not insured or guaranteed by any government agency) residential mortgages from a list of approved seller/servicers which include state and federally chartered savings and loan associations, mutual savings banks, commercial banks and credit unions and mortgage bankers. Pass-through securities issued by FNMA are guaranteed as to timely payment of principal and interest by FNMA, but are not backed by the full faith and credit of the U.S. government. FHLMC issues Participation Certificates (“PCs”), which are pass-through securities, each representing an undivided interest in a pool of residential mortgages. FHLMC guarantees the timely payment of interest and ultimate collection of principal, but PCs are not backed by the full faith and credit of the U.S. government.
FNMA and FHMLC were placed into conservatorship by the Federal Housing Finance Agency (“FHFA”). As the conservator, FHFA succeeded to all rights, titles, powers and privileges of FNMA and FHLMC and of any stockholder, officer or director of FNMA and FHLMC with respect to FNMA and FHLMC and each enterprise’s assets. In connection with the conservatorship, the U.S. Treasury entered into a Senior Preferred Stock Purchase Agreement with FNMA and FHLMC. This agreement contains various covenants that severely limit each enterprise’s operations. In exchange for entering into these agreements, the U.S. Treasury received senior preferred stock in each enterprise and warrants to purchase each enterprise’s common stock. The U.S. Treasury announced the creation of a new secured lending facility, which is available to FNMA and FHLMC as a liquidity backstop and the creation of a temporary program to purchase mortgage-backed securities issued by FNMA and FHLMC. FNMA and FHLMC are continuing to operate as going concerns while in conservatorship and each remains liable for all of its obligations, including its guaranty obligations, associated with its mortgage-backed securities.
Market, Credit and Counterparty Risk. In the normal course of business the Fund trades and holds financial instruments and enters into financial transactions where risk of potential loss exists due to changes in the market including rates and liquidity (“market risk”) or failure of the issuer to perform (“credit risk”). Similar to credit risk, the Fund may be exposed to counterparty risk, or the risk that an institution or other entity with which the Fund has unsettled or open transactions will default. Financial assets, which potentially expose the Fund to market, credit and counterparty risk, consist principally of
| | |
| 22 | | Montgomery Street Income Securities, Inc. |
cash due from counterparties and investments. The extent of the Fund’s exposure to market, credit and counterparty risks with respect to these financial assets is reflected in their carrying value as recorded in the Fund’s Statement of Assets and Liabilities.
C. Financial Derivative Instruments
FASB ASC Topic 815, “Derivatives and Hedging”. This standard includes the requirement for enhanced qualitative disclosures about objectives and strategies for using derivative instruments and disclosures regarding credit-related contingent features in derivative instruments, as well as quantitative disclosures in the semi-annual and annual financial statements about fair value, gains and losses and volume of activity for derivative instruments. Information about these instruments is disclosed in the context of each instrument’s primary underlying risk exposure that is categorized as credit, equity price, interest rate, and foreign currency exchange rate risk. The objectives, strategies and underlying risks for each instrument are discussed in the following paragraphs.
A tabular disclosure for each derivative investment by risk category is presented in the Notes to the Investment Portfolio which references the location on the Statement of Assets and Liabilities and the realized and unrealized gain (loss) in the Statement of Operations for each derivative investment. The derivative instruments outstanding as of the period ended June 30, 2011 as disclosed in the Notes to the Investment Portfolio and the amounts of realized and changes in unrealized gains and losses on derivative instruments during the period as disclosed in the Statement of Operations serve as indicators of the volume of derivative activity for the Fund.
Options Contracts. The Fund may be subject to interest rate risk in the normal course of pursuing its investment objective. The Fund sold (“wrote”) and purchased options on futures and swaps (“swaptions”) to manage its exposure to and hedge against changes in interest rates, generate income and as an efficient means of adjusting overall exposure to certain markets as part of its investment strategy. An option contract on an interest rate futures contract is an option, for which a negotiated premium is paid, with an exchange-specified expiration date, to enter into an interest rate futures contract that is exchange-specified in terms of the financial instrument, settlement date, and exercise price. A “put” on an interest rate futures contract requires a writer of the contract to enter into the buy side of the specified interest rate futures contract if a buyer of the put exercises the put before the expiration date. A “call” on an interest rate futures contract requires a writer of the contract to enter into the sell side of the specified interest rate futures contract if a buyer of the call exercises the call before the expiration date. Exercise of the option requires that the writer immediately deposit initial margin on the interest rate futures contract and immediately mark any loss position to the market. Upon exercise of the option, the Fund may immediately enter into an offsetting futures contract with respect to the futures contract that was exercised. A swaption is a contract that gives a counterparty the right (but not the obligation) in return for payment of a premium, to enter into a new swap agreement or to shorten, extend, cancel or otherwise modify an existing swap agreement, at some designated future time on specified terms.
When the Fund purchases an option, the premium paid by the Fund is recorded as an asset and is subsequently marked-to-market to reflect the current value of the option. Premiums paid for purchasing options which expire are treated as realized losses. Premiums paid for purchasing options which are exercised or closed are added to the cost basis of the underlying investment or offset against the proceeds of the underlying investment transaction to determine realized gain or loss. When the Fund writes a call or put option, the premium received by the Fund is recorded as a liability and is subsequently marked to market to reflect the current value of the option. Premiums received from writing options which expire are treated as realized gains. Premiums received from writing options which are exercised or closed are added to the proceeds of the underlying investment transaction or reduce the cost basis of the underlying investment to determine the realized gain or loss.
Options contracts involve, to varying degrees, risk of loss in excess of the premium paid or received recorded by the Fund. The primary risks associated with the use of option contracts on futures contracts involve similar risks to trading in the underlying futures contracts, including the imperfect correlation between the change in value of the securities held by the Fund and the prices of the underlying futures contracts and the possibility the Fund may not be able to enter into a closing transaction because of an illiquid market. Option contracts entered into by the Fund during the period were traded on public markets that are regulated by the Commodities Futures Trading Commission. Similar to futures contracts, there is minimal counterparty risk to the Fund since the options on futures contracts traded by the Fund were exchange traded and the exchange’s clearing house, as counterparty to all exchange traded options, guarantees the options contracts against default.
| | | | |
| Montgomery Street Income Securities, Inc. | | | 23 | |
Futures Contracts. The Fund may be subject to interest rate risk in the normal course of pursuing its investment objective. The Fund used futures contracts to manage its exposure to or hedge against changes in interest rates and as an efficient means of adjusting exposure to certain markets as part of its overall investment strategy. Upon entering into a futures contract, the Fund is required to deposit with the broker an amount of cash or cash equivalents equal to a certain percentage of the contract amount known as the “initial margin”. The Fund receives from or pays to the counterparty an amount of cash equal to the daily fluctuation in the value of the contracts. Such receipts or payments, known as the “variation margin”, are recorded by the Fund until the contracts are terminated at which time realized gains and losses are recognized. Futures contracts involve, to varying degrees, risk of loss in excess of the variation margin recorded by the Fund. The primary risks associated with the use of futures contracts are the imperfect correlation between the change in value of the securities held by the Fund and the prices of the futures contracts and the possibility the Fund may not be able to enter into a closing transaction because of an illiquid market. With futures, there is minimal counterparty risk to the Fund since future contracts are exchange traded and the exchange’s clearinghouse, as counterparty to all exchange traded futures, guarantees the futures contracts against default.
The Fund has claimed an exclusion from the definition of the term “commodity pool operator” under the Commodity Exchange Act and, therefore, it is not subject to registration or regulation as a commodity pool operator under that Act.
Forward Foreign Currency Contracts. The Fund may be subject to foreign currency exchange rate risk in the normal course of pursuing its investment objective. The Fund entered into forward foreign currency contracts to minimize foreign currency risk on portfolio securities denominated in foreign currencies and as part of its overall investment strategy. A forward foreign currency contract is an agreement between two parties to buy and sell a currency at a set price on a future date. The use of forward foreign currency contracts does not eliminate fluctuations in the underlying prices of the Fund’s portfolio securities, but it does establish a rate of foreign exchange that can be achieved in the future. The market value of a forward foreign currency contact fluctuates with changes in foreign currency exchange rates. Forward foreign currency contracts are marked-to-market daily and the change in value is recorded by the Fund as an unrealized gain or loss and as a receivable or payable from forward foreign currency contracts. Upon delivery or receipt of the currency, a realized gain or loss which is equal to the difference between the value of the contract at the time it was opened and the value at the time it was closed is recorded. Forward foreign currency contracts involve market risk in excess of the receivable or payable related to forward foreign currency contracts recorded by the Fund. Although contracts limit the risk of loss due to a decline in the value of the hedged currency, they also limit any potential gain that might result should the value of the currency increase. Additionally, the Fund could be exposed to the risk of a previously hedged position becoming unhedged if the counterparty to a contract is unable to meet the terms of the contract or if the value of the currency changes unfavorably to the U.S. dollar.
Swap Agreements. Swap agreements are privately negotiated agreements between the Fund and a counterparty to exchange the return generated by one instrument for the return generated by another instrument. Swap agreements are illiquid investments. If the Fund transacts in swap agreements, they are a party to International Swaps and Derivatives Association, Inc. (“ISDA”) Master Agreements (“ISDA Master Agreements”) with select counterparties. The ISDA Master Agreements govern transactions in over-the-counter derivative and forward foreign currency contracts and maintain provisions for general obligations, representations, agreements, collateral and events of default or termination. Events of termination include conditions that may entitle counterparties to elect to terminate early and cause settlement of all outstanding transactions under the applicable ISDA Master Agreement. Any election of early termination could be material to the financial statements. The amount of collateral exchanged is based on provisions within the ISDA Master Agreements and is determined by the net exposure with the counterparty and is not identified for a specific swap agreement.
Swap agreements are marked-to-market daily and change in value is recorded by the Fund as an unrealized gain or loss. Swap premiums paid or received at the beginning of the measurement period which are recorded by the Fund represent payments made or received upon entering into the swap agreement to compensate for differences between the stated terms of the swap agreement and prevailing market conditions relating to credit spreads, interest rates, currency exchange rates, and other relevant factors as appropriate. These upfront payments are amortized over the life of the swap agreement and recorded as a realized gain or loss upon termination or maturity of the swap agreement. A liquidation payment received or made at the termination of the swap agreement is recorded as realized gain or loss. Net periodic payments received or paid by the Fund are included as part of realized gain or loss.
Entering into swap agreements involves, to varying degrees, elements of credit and market risk in excess of the unrealized gain or loss recorded by the Fund. Such risks involve the possibility that there will be no liquid market for these agreements, that there may be unfavorable changes the value of underlying securities and that the counterparty to the agreements may
| | |
| 24 | | Montgomery Street Income Securities, Inc. |
default on its obligation to perform. In addition, entering into swap agreements involves documentation risk resulting from the possibility that that the parties to the swap agreements may disagree as to the meaning of contractual terms in the agreements. The credit risk associated with contracts is reduced by master netting arrangements to the extent that if an event of default occurs, all amounts with the counterparty are terminated and settled on a net basis. The Fund’s overall exposure to credit risk subject to master netting arrangements can change substantially within a short period, as it is affected by each transaction subject to the arrangement.
The Fund’s collateral delivered to counterparties as of June 30, 2011 is identified with a footnote in the Investment Portfolio. Collateral received from counterparties is included in deposits from counterparties in the Statement of Assets and Liabilities.
Credit Default Swap Agreements. The Fund may be subject to credit risk in the normal course of pursuing its investment objective. The Fund used credit default swap agreements on corporate issues and sovereign issues to manage credit exposure. Credit default swap agreements involve one party making a stream of payments (referred to as the buyer of protection) to another party (the seller of protection) in exchange for the right to receive a specified return if a credit event occurs for the referenced entity. A credit event is defined under the terms of each swap agreement and may include, but is not limited to, underlying entity default, bankruptcy, write-down, principal shortfall or interest shortfall. If a credit event occurs and cash settlement is not elected, a variety of other deliverable obligations may be delivered in lieu of the specific referenced obligation. The ability to deliver other obligations may result in a cheapest-to-deliver option (the buyer of protection’s right to choose the deliverable obligation with the lowest value following a credit event).
The Fund can be either a seller or buyer of protection when entering into a credit default swap agreement. As a seller of protection, the Fund will generally receive from the buyer of protection a fixed rate of income throughout the term of the swap if there is no credit event. As a seller, the Fund adds leverage to its portfolio because, in addition to its total net assets, the Fund is subject to investment exposure on the notional amount of the swap. If the Fund is a seller of protection and a credit event occurs, as defined under the terms of that particular swap agreement, the Fund will either pay to the buyer of protection an amount equal to the notional amount of the swap and take delivery of the referenced obligation or other deliverable obligations or pay a net settlement amount in the form of cash or securities equal to the notional amount of the swap less the recovery value of the referenced obligation. If the Fund is a buyer of protection and a credit event occurs, as defined under the terms of that particular swap agreement, the Fund will either receive from the seller of protection an amount equal to the notional amount of the swap and deliver the referenced obligation or other deliverable obligations or receive a net settlement amount in the form of cash or securities equal to the notional amount of the swap less the recovery value of the referenced obligation. Until a credit event occurs, recovery values are determined by market makers considering either industry standard recovery rates or entity specific factors and considerations. When a credit event occurs, the recovery value is determined by a facilitated auction, administered by ISDA, whereby a minimum number of allowable broker bids, together with a specified valuation method, are used to calculate the settlement value.
Either as a seller of protection or a buyer of protection of a credit default swap agreement, the Fund’s maximum risk of loss from counterparty risk is the fair value of the agreement. This risk is mitigated by having a master netting arrangement between the Fund and the counterparty and by posting collateral by the counterparty to the Fund to cover the Fund’s exposure to the counterparty. The maximum potential amount of future payments (undiscounted) that the Fund as a seller of protection could be required to make under a credit default swap agreement would be an amount equal to the notional amount of the agreement. These potential amounts would be partially offset by any recovery values of the respective referenced obligations, upfront payments received upon entering into the agreement or net amounts received from the settlement of buy protection credit default swap agreements entered into by the Fund for the same referenced entity or entities.
Interest Rate Swap Agreements. The Fund may be subject to interest rate risk in the normal course of pursuing its investment objective. The Fund entered into interest rate swap agreements to hedge against the risk that the value of its fixed rate bond investments would decrease/increase as interest rates rise/fall and to manage interest rate and yield curve exposures and as a substitute for investment in physical securities. Interest rate swap agreements involve the exchange by the Fund with another party of their respective commitments to pay or receive interest with respect to the notional amount of principal.
The Fund’s maximum risk of loss from counterparty credit risk for an interest rate swap agreement is the discounted net value of the cash flows to be received from or paid to the counterparty over the contract’s remaining life, to the extent this amount is positive. This risk is mitigated by having a master netting arrangement between the Fund and the counterparty and by posting of collateral by the counterparty to the Fund to cover the Fund’s exposure to the counterparty.
| | | | |
| Montgomery Street Income Securities, Inc. | | | 25 | |
D. Purchases and Sales of Securities
During the period ended June 30, 2011, purchases and sales of investment securities, excluding U.S. government obligations and short-term investments, aggregated $23,144,708 and $34,286,526, respectively. During the period ended June 30, 2011, purchases and sales of long-term U.S. government obligations aggregated $4,698,326 and $1,681,400, respectively.
Fund Transactions and Brokerage. Subject to compliance with Rule 17a-7 under the 1940 Act, the Adviser is permitted to cause the Fund to purchase securities from or sell securities to another account, including another investment company, advised by the Adviser.
There are occasions when portfolio transactions for the Fund are executed as part of concurrent authorizations to purchase or sell the same security for the Fund and for other accounts served by the Adviser or an affiliated company. They are effected only when the Adviser believes that to do so is in the best interest of the Fund and the other accounts participating. When such concurrent authorizations occur, the executions will be allocated in an equitable manner.
E. Fees and Agreements
Investment Advisory Agreement. The Fund and PIMCO entered into an Investment Advisory Agreement whereby the Fund pays PIMCO a quarterly fee at the annual rate of 0.25% of the average daily net assets of the Fund.
Fund Accounting and Administration Services Agreement. The Fund entered into a Fund Accounting and Administration Services Agreement (“Administration Agreement”) with JFS. Pursuant to the Administration Agreement, the Fund pays JFS an annual fee, payable monthly, equal to 0.25% of the average daily value of the net assets of the Fund up to $100 million; 0.20% of the average daily value of the net assets of the Fund from $100 million to $200 million; and 0.15% of the average daily value of the net assets of the Fund over $200 million. JFS makes individuals available to the Fund to serve as its officers. Officers are not directly compensated by the Fund.
Directors’ Fees and Expenses. The Fund pays each Board Director a retainer fee plus specified amounts for each Board and Committee meeting attended.
F. Income Tax Matters
The following information is presented on an income tax basis. The timing and characterization of certain income and capital gains are determined in accordance with federal tax regulations, which may differ from GAAP. These differences primarily relate to timing differences in recognizing certain gains and losses on investment transactions and accounting treatment for notional principal contracts. To the extent that differences arise that are permanent in nature, such amounts are reclassified within the components of net assets on the Statement of Assets and Liabilities based on their federal income tax treatment; timing differences do not require reclassification. Timing and permanent differences do not impact the NAV of the Fund.
At June 30, 2011, the cost of investments and the components of net unrealized appreciation are listed in the following table.
| | | | | | | | | | | | |
Cost of
Investments | | Gross Unrealized
Depreciation | | | Gross Unrealized
Appreciation | | | Net Unrealized
Appreciation | |
| $184,446,711 | | $ | (2,559,398 | ) | | $ | 5,473,873 | | | $ | 2,914,475 | |
The distributions paid of $7,567,767 for the year ended December 31, 2010, were from net ordinary income.
At December 31, 2010, the Fund’s last fiscal year end, the Fund had unused capital loss carryforwards available for federal income tax purposes which may be applied against any future realized net taxable capital gains or until the respective expiration dates occur as noted below.
| | | | |
| Year of Expiration | | Amount | |
| 2014 | | $ | 1,984,761 | |
| 2015 | | | 596,899 | |
| 2016 | | | 12,721,218 | |
| 2017 | | | 11,494,100 | |
| Total | | $ | 26,796,978 | |
| | |
| 26 | | Montgomery Street Income Securities, Inc. |
The Regulated Investment Company Modernization Act of 2010 (“Act”) was enacted on December 22, 2010. In general, the provisions of the Act will be effective for the Fund’s fiscal year ending December 31, 2011. Under the Act, the Fund will be permitted to carry forward capital losses for an unlimited period. However, any losses incurred during those future taxable years will be required to be utilized prior to the losses incurred in pre-enactment taxable years. As a result of this ordering rule, pre-enactment capital loss carry forwards may be more likely to expire unused. Additionally, post-enactment capital losses that are carried forward will retain their character as either short-term or long-term capital losses, and will not be considered exclusively short-term as under previous law. Relevant information regarding the impact of the Act on the Fund will be contained within the Income Tax Matters section of the financial statement notes in the Fund’s Annual Report for the fiscal year ending December 31, 2011.
The Fund had $220,261 of capital losses realized from November 1, 2010, through December 31, 2010, which were deferred for tax purposes to January 1, 2011, the first day of the current fiscal year.
FASB ASC Topic 740, “Income Taxes”, provides guidance for how uncertain tax positions should be recognized, measured, presented and disclosed in the financial statements. FASB ASC Topic 740 requires the evaluation of tax positions taken or expected to be taken in the course of preparing the Fund’s tax returns to determine whether the tax positions are “more-likely-than-not” of being sustained by the applicable tax authority. Tax positions not deemed to meet the “more-likely-than-not” threshold would result in the Fund recording a tax expense in the current year. FASB ASC Topic 740 requires that management evaluate the tax positions taken in returns for 2007 through 2010 which remain subject to examination, by the Internal Revenue Service. These returns are not subject to examination by any other tax jurisdictions. Management completed an evaluation of the Fund’s tax positions and based on that evaluation, determined that no provision for federal income tax was required in the Fund’s financial statements during the period ended June 30, 2011.
G. Share Repurchases
The Fund is authorized to effect repurchases of its shares in the open market from time to time when the Fund’s shares trade at a discount to their NAV. During the period ended June 30, 2011, the Fund purchased 12,000 shares of common stock on the open market at a total cost of $188,660. The weighted average discount of these purchases, comparing the purchase price to the NAV at the time of purchase, was 9.71%. During the year ended December 31, 2010, the Fund purchased 29,000 shares of common stock on the open market at a total cost of $457,942. The weighted average discount of these purchases, comparing the purchase price to the NAV on the day of purchase, was 7.42%.
H. Subsequent Events
Management has evaluated subsequent events for the Fund through the date the financial statements are issued, and has concluded there are no events that require financial statement disclosure and/or adjustments to the financial statements.
| | | | |
| Montgomery Street Income Securities, Inc. | | | 27 | |
Dividend Reinvestment and Cash Purchase Plan
All registered stockholders of the Fund’s Common Stock are offered the opportunity of participating in the Plan. Registered stockholders, on request or on becoming registered stockholders, are mailed information regarding the Plan, including a form by which they may elect to participate in the Plan and thereby cause their future net investment income dividends and capital gains distributions to be invested in shares of the Fund’s common stock. The Custodian is the agent (the “Plan Agent”) for stockholders who elect to participate in the Plan.
If a stockholder chooses to participate in the Plan, the stockholder’s dividends and capital gains distributions will be promptly invested, automatically increasing the stockholder’s holdings in the Fund. If the Fund declares a dividend or capital gains distributions payable either in cash or in stock of the Fund, the stockholder will automatically receive stock. If the market price per share on the payment date for the dividend (the “Valuation Date”) equals or exceeds the net asset value per share, the Fund will issue new shares to the stockholder at the greater of the following on the Valuation Date: (a) net asset value per share or (b) 95% of the market price per share. If the market price per share on the Valuation Date is less than the net asset value per share, the Fund will issue new shares to the stockholder at the market price per share on the Valuation Date. In either case, for federal income tax purposes the stockholder will be deemed to receive a distribution equal to the market value on the Valuation Date of the new shares issued. If dividends or capital gains distributions are payable only in cash, then the stockholder will receive shares purchased on the New York Stock Exchange or otherwise on the open market. In this event, for federal income tax purposes the amount of the distribution will equal the cash distribution paid. State and local taxes may also apply. All reinvestments are in full and fractional shares, carried to three decimal places.
Stockholders participating in the Plan can also purchase additional shares quarterly in any amount from $100 to $5,000 (a “Voluntary Cash Investment”) by sending in a check together with the cash remittance slip, which will be sent with each statement of the stockholder’s account, to BNY Mellon Shareowner Services, the Fund’s transfer agent (the “Transfer Agent”). Such additional shares will be purchased on the open market by the Plan Agent or its delegate. The purchase price of shares purchased on the open market, whether pursuant to a reinvestment of dividends payable only in cash or a Voluntary Cash Investment, will be the average price (including brokerage commissions) of all shares purchased by the Plan Agent or its delegate on the date such purchases are effected. In addition, stockholders may be charged a service fee in an amount up to 5% of the value of the Voluntary Cash Investment. Although subject to change, stockholders are currently charged $1 for each Voluntary Cash Investment.
Stockholders may terminate their participation in the Plan at any time and elect to receive dividends and other distributions in cash by notifying the Transfer Agent in writing. Such notification must be received not less than 10 days prior to the record date of any distribution. There is no charge or other penalty for such termination. The Plan may be terminated by the Fund upon written notice mailed to the stockholders at least 30 days prior to the record date of any distribution. Upon termination, the Fund will issue certificates for all full shares held under the Plan and cash for any fractional share.
Alternatively, stockholders may request the Transfer Agent to instruct the Plan Agent or its delegate to sell any full shares and remit the proceeds, less a $2.50 service fee and less brokerage commissions. The sale of shares (including fractional shares) will be a taxable event for federal income tax purposes and may be taxable for state and local tax purposes.
The Plan may be amended by the Fund at any time. Except when required by law, written notice of any amendment will be mailed to stockholders at least 30 days prior to its effective date. The amendment will be deemed accepted unless written notice of termination is received by the Transfer Agent prior to the effective date.
An investor holding shares in its own name can participate directly in the Plan. An investor holding shares in the name of a brokerage firm, bank or other nominee should contact that nominee, or any successor nominee, to determine whether the nominee can participate in the Plan on the investor’s behalf and to make any necessary arrangements for such participation.
Additional information, including a copy of the Plan and its Terms and Conditions and an enrollment form, can be obtained from the Transfer Agent by writing BNY Mellon Shareowner Services, 480 Washington Boulevard, Jersey City, NJ 07310, or by calling (877) 437-3938.
| | |
| 28 | | Montgomery Street Income Securities, Inc. |
Stockholder Meeting Results
The Annual Meeting of Stockholders of the Fund was held on July 14, 2011 at 3 Embarcadero Center, 7th Floor, San Francisco, California. At the meeting, the following matter was voted upon and approved by the stockholders: To elect four Directors of the Fund to hold office until the next annual meeting or until their respective successors shall have been duly elected and qualfied.
| | | | | | | | |
| | | Number of Votes: | |
| | | For | | | Withheld | |
| Directors | | | | | | | | |
| Richard J. Bradshaw | | | 8,987,733 | | | | 201,630 | |
| Victor L. Hymes | | | 9,064,094 | | | | 125,269 | |
| Wendell G. Van Auken | | | 9,002,584 | | | | 186,780 | |
| Nancy E. Wallace | | | 8,992,592 | | | | 196,771 | |
Directors and Officers
| | |
| DIRECTORS | | OFFICERS |
| |
RICHARD J. BRADSHAW Chairman VICTOR L. HYMES WENDELL G. VAN AUKEN NANCY E. WALLACE | | MARK D. NERUD President and Chief Executive Officer DANIEL W. KOORS Treasurer and Chief Financial Officer MEGAN E. GARCY Secretary SUSAN S. RHEE Chief Legal Officer TONI M. BUGNI Chief Compliance Officer |
| |
| |
| |
| |
| |
| |
| |
| |
| |
| | | | |
| Montgomery Street Income Securities, Inc. | | | 29 | |
Investment Advisory Agreement Approval
At a meeting held on April 14, 2011, the Board, including the Directors of the Fund who were not parties to the agreement or “interested persons” of any such party as defined in the 1940 Act, (the “Independent Directors”), voted to continue the Investment Advisory Agreement (the “Agreement”) with PIMCO until July 31, 2012.
In reviewing the Agreement, the Board considered, among other information, the written and oral reports provided by PIMCO. The Board also considered the separate written and oral reports of Gifford Fong Associates, an independent investment consultant engaged by the Board specializing in quantitative fixed-income analysis, and Jackson Fund Services, the Funds Administrator. In addition, the Board took into account information provided at previous meetings, as well as information about PIMCO and other potential investment advisers developed in connection with the Board’s search for a new adviser in 2010, when PIMCO was originally appointed.
Nature, Extent, and Quality of Services. The Board examined the nature, extent, and quality of the advisory services provided and to be provided to the Fund by PIMCO. The Board considered the terms of the Agreement, the experience and qualifications of PIMCO and its personnel in managing fixed-income instruments, PIMCO’s investment strategy for the Fund, and the risk profile of the Fund’s investments. The Board also considered the experience of PIMCO in managing open- and closed-end funds, the availability and responsiveness of PIMCO’s personnel, the extent and quality of information provided by PIMCO to the Board, PIMCO’s compliance policies and procedures and attention to compliance matters, and the extent of any regulatory issues relating to PIMCO or its affiliates. Further, the Board considered the stability of the PIMCO organization and turnover in its personnel, the overall commitment of PIMCO to the Fund, and the general financial condition, resources, and reputation of PIMCO and its parent. The Board generally was satisfied with the nature, extent, and quality of the advisory services provided to the Fund.
Investment Performance. The Board reviewed the investment performance of PIMCO over various periods compared to the performance of relevant indices, of a peer group of other similar funds, and of fund and non-fund accounts of PIMCO using similar investment strategies. The Board also reviewed with PIMCO and Gifford Fong Associates the ways in which the investment strategies employed by PIMCO had contributed to its investment performance. The performance data showed, among other things, that the Fund outperformed its benchmark, the Barclays Capital U.S. Aggregate Bond Index, for the three-month, six-month, nine-month and one-year periods ended March 31, 2011, but that the Fund had underperformed the average of its peer fund group for the nine-month period ended March 31, 2011. The Board noted that PIMCO had been managing the Fund for the relatively brief period since March 15, 2010.
Cost of Services. The Board examined the cost of the services provided and to be provided to the Fund by PIMCO, including expense information concerning the peer group of other similar funds and of fund and non-fund accounts of PIMCO employing similar investment strategies. The advisory fee charged by PIMCO was comparable to that charged to other PIMCO fund and non-fund accounts. The advisory fee charged by PIMCO was also comparable to the advisory fee charged by the Fund’s prior investment adviser, as well as to the advisory fees proposed by the other adviser candidates considered by the Board in connection with its 2010 search. The Board concluded that the advisory fees charged by PIMCO generally were competitive.
Profits Realized. The Board considered profits realized and to be realized by PIMCO from its relationship with the Fund and reviewed an estimate prepared by PIMCO. The Board acknowledged the inherent limitations of profitability analyses, including its reliance on various allocations and assumptions. The Board recognized that PIMCO was entitled to earn a profit for the services it furnishes and concluded that the profit estimated to be earned by PIMCO would not be excessive.
Economies of Scale. The Board considered the extent to which economies of scale could be realized as the Fund grows and whether the advisory fee charged by PIMCO reflects any such economies of scale. It was noted that, as a closed-end fixed income fund making regular dividend distributions, the assets of the Fund were not expected to increase materially. Accordingly, the Board had negotiated with PIMCO a fixed fee rate taking into account the then-current size of the Fund. In the event the size of the Fund does increase materially in the future, the Board will consider whether the advisory fee should be adjusted to reflect any economies of scale.
Other Benefits. The Board recognized that PIMCO and its affiliates may derive other benefits from its relationship with the Fund, including the use of the Fund’s performance record in marketing other products, the inclusion of the Fund on its client list, and the aggregation of the Fund’s purchase orders with other accounts.
In addition to the foregoing factors, among others, the Board considered its ability to terminate the Agreement on sixty days’ notice. In its deliberations, the Board did not identify any particular factor or factors that were all-important or controlling; and each Director assigned different weights to the various factors considered.
| | |
| 30 | | Montgomery Street Income Securities, Inc. |
General Information
| | |
Investment
Adviser | | Pacific Investment Management Company LLC 840 Newport Center Drive Newport Beach, CA 92660 |
| Administrator | | Jackson Fund Services 225 West Wacker Drive Chicago, IL 60606 |
| Transfer Agent | | BNY Mellon Shareowner Services c/o MSIS Stock Transfer 480 Washington Boulevard Jersey City, NJ 07310 (Tel) 1/877/437-3938 |
| Custodian | | The Bank of New York Mellon Corporation One Mellon Center Pittsburgh, PA 15258 |
| Legal Counsel | | Howard Rice Three Embarcadero Center San Francisco, CA 94111 |
| | | | |
| Montgomery Street Income Securities, Inc. | | | 31 | |
Privacy Policy Statement
The Fund considers the privacy of its stockholders to be of fundamental importance and has established a policy to maintain the privacy of the information you share with us. In addition, the Fund relies on the privacy and customer information protection policies and procedures of its service providers.
Personal information we collect
We do not sell any information to any third parties. However, we may collect and retain certain nonpublic personal information about you, including:
| | • | | Information we receive from broker-dealers, investment advisers, the Fund’s transfer agent, and the Fund’s dividend reinvestment plan administrator (such as a stockholder’s name, address and tax identification number); |
| | • | | An address received from a third party when a stockholder has moved; and |
| | • | | Account balance and transaction activity. |
Personal information we may disclose
We may occasionally disclose nonpublic personal information about you to affiliates and non-affiliates as permitted by law. Instances when we may share information include:
| | • | | Disclosing information to a third party in order to process account transactions that you request or authorize; |
| | • | | Disclosing your name and address to companies that mail Fund related materials, such as stockholder reports and proxy materials; and |
| | • | | Disclosing information in connection with regulatory inquiries and legal proceedings, such as responding to a request for information or subpoena. |
When information is shared with third parties, they are not permitted to use the information for any purpose other than to assist our servicing of your account(s) or as permitted by law. If you close your account(s) or if we lose contact with you, we will continue to share information in accordance with our current privacy policy and practices. We restrict access to your nonpublic personal information to authorized agents, including employees of the Fund’s administrator who need to know that information to provide services to the Fund and its stockholders. We maintain physical, electronic and procedural safeguards that comply with federal standards to guard your nonpublic personal information.
These measures reflect our commitment to maintaining the privacy of your nonpublic personal information. We appreciate the confidence you have shown by entrusting us with your assets.
If you would like to learn more or have any questions about our privacy practices, please contact the Fund at the following address:
Montgomery Street Income Securities, Inc.
c/o Jackson Fund Services
225 W. Wacker Drive, Suite 1200
Chicago, IL 60606
Effective: August 31, 2007
| | |
| 32 | | Montgomery Street Income Securities, Inc. |

Jackson Fund Services
225 West Wacker Drive Suite 1200
Chicago, IL 60606
Presorted Standard
U.S. Postage
PAID
Lancaster, PA
Permit No. 1313
MSIS
(42065 8/11)
Item 2. Code of Ethics.
Not applicable.
Item 3. Audit Committee Financial Expert.
Not applicable.
Item 4. Principal Accountant Fees and Services.
Not applicable.
Item 5. Audit Committee of Listed Registrants.
Not applicable.
Item 6. Investments.
| (a) | Included in Report to Stockholders under Item 1. |
Item 7. Disclosure of Proxy Voting Policies and Procedures for Closed-End Management Investment Companies.
Not applicable.
Item 8. Portfolio Managers of Closed-End Management Investment Companies.
Not applicable.
Item 9. Purchases of Equity Securities by Closed-End Management Investment Company and Affiliated Purchasers.
| | | | | | | | | | | | | | | | |
Period | | (a)
Total Number of
Shares (or Units)
Purchased(1) | | | (b)
Average Price
Paid per Share
(or Unit) | | | (c)
Total Number of
Shares (or Units)
Purchased as Part of
Publicly Announced
Plans or Programs | | | (d)
Maximum Number (or
Approximate Dollar Value)
of Shares (or Units) that
May Yet Be Purchased
Under the Plans or
Programs | |
January 1 – January 31 | | | 6,000 | | | | 15.60 | | | | n/a | | | | n/a | |
February 1 – February 28 | | | 0 | | | | 0 | | | | n/a | | | | n/a | |
March 1 – March 31 | | | 0 | | | | 0 | | | | n/a | | | | n/a | |
April 1 �� April 30 | | | 0 | | | | 0 | | | | n/a | | | | n/a | |
May 1 – May 31 | | | 6,000 | | | | 15.75 | | | | n/a | | | | n/a | |
June 1 – June 30 | | | 0 | | | | 0 | | | | n/a | | | | n/a | |
| | | | | | | | | | | | | | | | |
Total | | | 12,000 | | | | 15.68 | | | | n/a | | | | n/a | |
| (1) | All purchases were made on the open market pursuant to the registrant’s Repurchase Program and related guidelines. |
Item 10. Submission of Matters to a Vote of Security Holders.
There have been no material changes to the procedures by which stockholders may recommend nominees to the registrant’s Board of Directors since the registrant last disclosed such procedures in a Proxy Statement or Form N-CSR.
Item 11. Controls and Procedures.
| (a) | The President/Principal Executive Officer and the Treasurer/Principal Financial Officer of the registrant have concluded, based on their evaluation of the registrant’s disclosure controls and procedures (as defined in Rule 30a-3(c) under the Investment Company Act of 1940, as amended) as of a date within ninety (90) days of the filing date of this report on Form N-CSR, that such controls and procedures are effective and that the design and operation of such procedures ensures that information required to be disclosed by the registrant in this report on Form N-CSR is recorded, processed, summarized, and reported within the time periods specified in the U.S. Securities and Exchange Commission’s rules and forms. |
| (b) | There has been no change in the registrant’s internal controls over financial reporting (as defined in Rule 30a-3(d) under the Investment Company Act of 1940, as amended) that occurred during the second fiscal quarter of the period covered by this report that has materially affected, or is reasonably likely to materially affect, the registrant’s internal control over financial reporting. |
Item 12. Exhibits.
| | |
| |
| (a)(1) | | Not applicable. |
| |
| (2) | | Certifications required by Rule 30a-2(a) under the Investment Company Act of 1940, as amended. |
| |
| (3) | | Not applicable. |
| |
| (b) | | Certification required by Rule 30a-2(b) under the Investment Company Act of 1940, as amended. |
SIGNATURES
Pursuant to the requirements of the Securities Exchange Act of 1934 and the Investment Company Act of 1940, the registrant has duly caused this report to be signed on its behalf by the undersigned, thereunto duly authorized.
| | |
| Montgomery Street Income Securities, Inc. |
| |
| By: | | /S/ MARK D. NERUD |
| Name: | | Mark D. Nerud |
| Title: | | President and Principal Executive Officer |
| Date: | | August 29, 2011 |
Pursuant to the requirements of the Securities Exchange Act of 1934 and the Investment Company Act of 1940, this report has been signed below by the following persons on behalf of the registrant and in the capacities and on the dates indicated.
| | |
| By: | | /s/ MARK D. NERUD |
| Name: | | Mark D. Nerud |
| Title: | | President and Principal Executive Officer |
| Date: | | August 29, 2011 |
| |
| By: | | /s/ DANIEL W. KOORS |
| Name: | | Daniel W. Koors |
| Title: | | Treasurer and Principal Financial Officer |
| Date: | | August 29, 2011 |
EXHIBIT LIST
| | |
| |
| Exhibit 12(a)(2)(a): | | Certification of the Principal Executive Officer required by Rule 30a-2(a) under the Investment Company Act of 1940, as amended |
| |
| Exhibit 12(a)(2)(b): | | Certification of the Principal Financial Officer required by Rule 30a-2(a) under the Investment Company Act of 1940, as amended |
| |
| Exhibit 12(b): | | Certification required by Rule 30a-2(b) under the Investment Company Act of 1940, as amended |