UNITED STATES
SECURITIES AND EXCHANGE COMMISSION
Washington, D.C. 20549
FORM N-CSR
CERTIFIED SHAREHOLDER REPORT OF
REGISTERED MANAGEMENT INVESTMENT COMPANIES
Investment Company Act file number: 811-01685
| | |
| Name of Registrant: | Vanguard Morgan Growth Fund |
| Address of Registrant: | P.O. Box 2600 |
| | Valley Forge, PA 19482 |
| |
| Name and address of agent for service: | Anne E. Robinson, Esquire |
| | | P.O. Box 876 |
| | | Valley Forge, PA 19482 |
Registrant’s telephone number, including area code: (610) 669-1000
Date of fiscal year end: September 30
Date of reporting period: October 1, 2017 – March 31, 2018
Item 1: Reports to Shareholders

Semiannual Report | March 31, 2018
Vanguard Morgan™ Growth Fund
Vanguard’s Principles for Investing Success
We want to give you the best chance of investment success. These principles, grounded in Vanguard’s research and experience, can put you on the right path.
Goals. Create clear, appropriate investment goals.
Balance. Develop a suitable asset allocation using broadly diversified funds. Cost. Minimize cost.
Discipline. Maintain perspective and long-term discipline.
A single theme unites these principles: Focus on the things you can control.
We believe there is no wiser course for any investor.
| |
| Contents | |
| Your Fund’s Performance at a Glance. | 1 |
| CEO’s Perspective. | 2 |
| Advisors’ Report. | 4 |
| Results of Proxy Voting. | 9 |
| Fund Profile. | 11 |
| Performance Summary. | 13 |
| Financial Statements. | 14 |
| About Your Fund’s Expenses. | 29 |
| Trustees Approve Advisory Arrangements. | 31 |
| Glossary. | 33 |
Please note: The opinions expressed in this report are just that—informed opinions. They should not be considered promises or advice. Also, please keep in mind that the information and opinions cover the period through the date on the front of this report. Of course, the risks of investing in your fund are spelled out in the prospectus.
See the Glossary for definitions of investment terms used in this report.
About the cover: Nautical images have been part of Vanguard’s rich heritage since its start in 1975. For an incoming ship, a lighthouse offers a beacon and safe path to shore. You can similarly depend on Vanguard to put you first––and light the way––as you strive to meet your financial goals. Our client focus and low costs, stemming from our unique ownership structure, assure that your interests are paramount.
Your Fund’s Performance at a Glance
• Vanguard Morgan Growth Fund returned more than 9% for the six months ended March 31, 2018. It slightly surpassed its benchmark, the Russell 3000 Growth Index, and the average return of its peer funds.
• The fund seeks long-term capital appreciation using a multimanager approach that provides exposure to a large-, mid-, and small-capitalization U.S. growth stocks.
• During the period, growth stocks outperformed their value counterparts, and large-cap stocks topped their mid- and small-cap peers. U.S. stocks outpaced those of developed markets but trailed emerging markets stocks.
• Five of the fund’s eleven industry sectors produced positive returns. Information technology, consumer staples, real estate, materials, and telecommunications services contributed most to the fund’s relative performance, while health care, energy, and financials detracted the most.
| | | |
| Total Returns: Six Months Ended March 31, 2018 | | | |
| | | | Total |
| | | | Returns |
| Vanguard Morgan Growth Fund | | | |
| Investor Shares | | | 9.39% |
| Admiral™ Shares | | | 9.43 |
| Russell 3000 Growth Index | | | 9.20 |
| Multi-Cap Growth Funds Average | | | 9.18 |
| Multi-Cap Growth Funds Average: Derived from data provided by Lipper, a Thomson Reuters Company. | | |
| Admiral Shares carry lower expenses and are available to investors who meet certain account-balance requirements. | |
| |
| |
| Expense Ratios | | | |
| Your Fund Compared With Its Peer Group | | | |
| | Investor | Admiral | Peer Group |
| | Shares | Shares | Average |
| Morgan Growth Fund | 0.38% | 0.28% | 1.17% |
The fund expense ratios shown are from the prospectus dated January 26, 2018, and represent estimated costs for the current fiscal year. For the six months ended March 31, 2018, the fund’s annualized expense ratios were 0.39% for Investor Shares and 0.29% for Admiral Shares. The peer-group expense ratio is derived from data provided by Lipper, a Thomson Reuters Company, and captures information through year-end 2017.
Peer group: Multi-Cap Growth Funds.
1
CEO’s Perspective

Tim Buckley
President and Chief Executive Officer
Dear Shareholder,
I feel extremely fortunate to have the chance to lead a company filled with people who come to work every day passionate about Vanguard’s core purpose: to take a stand for all investors, to treat them fairly, and to give them the best chance for investment success.
When I joined Vanguard in 1991, I found a mission-driven team focused on improving lives—helping people retire more comfortably, put their children through college, and achieve financial security. I also found a company with purpose in an industry ripe for improvement.
It was clear, even early in my career, that the cards were stacked against most investors. Hidden fees, performance-chasing, and poor advice were relentlessly eroding investors’ dreams.
We knew Vanguard could be different and, as a result, could make a real difference. We have lowered the costs of investing for our shareholders significantly. And we’re proud of the performance of our funds.
Vanguard is built for Vanguard investors—we focus solely on you, our fund shareholders. Everything we do is designed to give our clients the best chance for investment success. In my role as CEO, I’ll keep this priority
2
front and center. We’re proud of what we’ve achieved, but we’re even more excited about what’s to come.
Steady, time-tested guidance
Our guidance for investors, as always, is to stay the course, tune out the hyperbolic headlines, and focus on your goals and what you can control, such as costs and how much you save. This time-tested advice has served our clients well over the decades.
Regardless of how the markets perform in the short term, I’m incredibly optimistic about the future for our investors. We have a dedicated team serving you, and we will never stop striving to make
Vanguard the best place for you to invest through our high-quality funds and services, advice and guidance to help you meet your financial goals, and an experience that makes you feel good about entrusting us with your hard-earned savings.
Thank you for your continued loyalty.

Mortimer J. Buckley
President and Chief Executive Officer
April 13, 2018
| | | |
| Market Barometer | | | |
| | | | Total Returns |
| | | Periods Ended March 31, 2018 |
| | Six | One | Five Years |
| | Months | Year | (Annualized) |
| Stocks | | | |
| Russell 1000 Index (Large-caps) | 5.85% | 13.98% | 13.17% |
| Russell 2000 Index (Small-caps) | 3.25 | 11.79 | 11.47 |
| Russell 3000 Index (Broad U.S. market) | 5.65 | 13.81 | 13.03 |
| FTSE All-World ex US Index (International) | 4.03 | 16.45 | 6.30 |
| |
| Bonds | | | |
| Bloomberg Barclays U.S. Aggregate Bond Index | | | |
| (Broad taxable market) | -1.08% | 1.20% | 1.82% |
| Bloomberg Barclays Municipal Bond Index | | | |
| (Broad tax-exempt market) | -0.37 | 2.66 | 2.73 |
| Citigroup Three-Month U.S. Treasury Bill Index | 0.63 | 1.07 | 0.30 |
| |
| CPI | | | |
| Consumer Price Index | 1.11% | 2.36% | 1.40% |
3
Advisors’ Report
For the six months ended March 31, 2018, Vanguard Morgan Growth Fund returned 9.39% for Investor Shares and 9.43% for the lower-cost Admiral Shares. Your fund is managed by four independent advisors, a strategy that enhances the fund’s diversification by providing exposure to distinct yet complementary investment approaches. It’s not uncommon for different advisors to have different views about individual securities or the broader investment environment.
The advisors, the percentage of fund assets each manages, and brief descriptions of their investment strategies are presented in the accompanying table. The advisors have also prepared a discussion of the investment environment that existed during the fiscal period and of how portfolio positioning reflects this assessment. (Please note that the Frontier Capital Management discussion refers to industry sectors as defined by Russell classifications rather than the Global Industry Classification Standard used elsewhere in this report.)
These comments were prepared on April 17, 2018.
Wellington Management Company llp
Portfolio Manager:
Paul E. Marrkand, CFA,
Senior Managing Director
Our portion of the fund uses traditional methods of stock selection—fundamental research and analysis—to identify mid-and large-capitalization companies that we believe have above-average growth
prospects. We seek to build a portfolio that has diversified sources of return with a balance of growth, quality, and valuation attributes.
U.S. equities and other developed-market stocks around the world rose during the period; the S&P 500 Index returned 5.84% and the MSCI World Index returned 4.40%. Fixed income markets fell; the Bloomberg Barclays U.S. Aggregate Bond Index returned –1.08%.
Successes
Sector allocation boosted the portfolio’s returns over the six months. An overweighted allocation to information technology and an underweight to consumer staples helped relative performance.
Security selection was strongest in consumer discretionary and materials; top contributors included NetApp (information technology), Microsoft (information technology), and an underweight to Comcast (consumer discretionary). We eliminated our position in Comcast early in the period.
Shortfalls
Security selection hurt relative performance, primarily in health care, financials, and industrials. Among the largest detractors were Celgene (health care) and Oracle (information technology). Our decision not to own benchmark constituent Netflix (consumer discretionary) also disappointed. We exited our position in Celgene over the period. The company made very high-risk, expensive
4
acquisitions in early 2018, which we took as an indication that its pipeline was more at risk than we had originally perceived.
By sector, an underweighted allocation to consumer discretionary, the top contributor to the index, and an overweight to energy also lagged.
We remain optimistic about the portfolio’s favorable risk/reward profile. We continue to purchase, at attractive valuations, capital-compounding companies with what we believe to have long-term competitive advantages that can maintain a free-cash flow growth rate beyond that of the market. Through this bottom-up process, the portfolio ended the period most overweighted in information technology and most underweighted in consumer discretionary and consumer staples.
Jennison Associates LLC
Portfolio Managers:
Kathleen A. McCarragher,
Managing Director
Blair A. Boyer,
Managing Director
Our process examines company, industry, and sector fundamentals and prospects over short and longer terms, projecting how markets, industries, and businesses will evolve over time. We build our portion of the portfolio through individual stock selection, based on individual company fundamentals.
Over the period, information technology positions were strong contributors to return. Adobe Systems, historically best known for Photoshop, PDF, and Flash, has transformed into a subscription-based provider of digital services in two of the fastest-growing enterprise software markets—content creation and digital marketing.
Tencent continued to perform well, driven by its dominant position and monetization opportunities in China’s online gaming and instant messaging markets as well as its advertising and payment service efforts. Chipmaker Nvidia is leading high-growth markets such as gaming, automotive, high-performance computing, and cloud and enterprise, where developers have coalesced around its platform.
In consumer discretionary, Netflix keeps raising its competitive barriers with investments in content, resulting in strong subscriber growth and increased pricing and operating leverage. Amazon’s scale dominance gives it an advantageous cost structure and the ability to aggressively invest in its businesses. Cable operator Charter Communications declined as subscriber metrics fell short of expectations and capital expenditures dampened free cash flow. Tesla fell on production challenges and a setback in its semiautonomous driving program.
In industrials, Boeing’s gain reflected cash generation from the sale of 787 Dreamliner commercial jets, solid cost controls, and ramped-up 737 jet production.
5
Health care positions hurt performance. Celgene lowered its long-term guidance because of pipeline disappointments. Still largely tied to its leading product, the company is in the early stages of a diversification strategy. Alexion Pharmaceuticals is pursuing label expansion opportunities for its flagship product but is in a transitionary phase under new management. BioMarin Pharmaceuticals’ weakness was related to a lack of near-term clinical catalysts and indications that a new drug launch might be slower than anticipated.
Vanguard Quantitative Equity Group
Portfolio Managers:
James P. Stetler
Binbin Guo, Principal,
Head of Alpha Equity Investments
The period opened with global equities posting positive returns for the seventh consecutive quarter. As 2018 began, this economic momentum continued against a backdrop of rising volatility and a hawkish tone from the major central banks. In the United States, companies began to respond to new tax laws, and strong earnings announcements moved the S&P 500 Index to a record high at the end of January. Developed Europe and Asia Pacific equities also rose, fueled by improvement in macroeconomic fundamentals.
February brought a sudden change in market sentiment and the return of volatility after an unusually long period of calm. The broad U.S. equity market (as measured by the Russell 3000 Index) returned 5.65% for the six months. U.S. stock market performance was mixed; seven of eleven sectors advanced, led by information technology and consumer discretionary. Growth stocks outperformed their value counterparts, and large-caps topped small-caps.
Although it’s important to understand how overall performance is affected by such macro factors, our approach to investing focuses on specific fundamentals—not technical analysis of stock price movements. We believe that attractive stocks exhibit five key characteristics: high quality—healthy balance sheets and steady cash-flow generation; effective use of capital—sound investment policies that favor internal over external funding; consistent earnings growth—the ability to grow earnings year after year; strong market sentiment—market confirmation of our view; and reasonable valuation—we strive to avoid overpriced stocks.
Using these five themes, we generate a composite daily stock ranking. We then monitor our portfolio based on those rankings and adjust when appropriate to maximize expected returns while minimizing exposure to risks that our research indicates don’t improve returns (such as industry selection and other risks relative to the benchmark).
6
For the period, our quality, growth, valuation, and sentiment models helped performance, but management decisions did not. Our strongest sector results were in industrials, information technology, and financials. Our weakest results were in consumer discretionary, energy, and consumer staples.
At the stock level, the largest contributions came from overweighted positions in Square, Burlington Stores, Arista Networks, and XPO Logistics, as well as an underweight to Charter Communications. Overweighted allocations to Albemarle, Advanced Micro Devices, and Pilgrim’s Pride and underweights to Netflix and Amazon detracted.
We believe that our approach will benefit investors over the long term and feel that the fund offers a strong mix of stocks with attractive valuation and growth characteristics relative to its benchmark.
Frontier Capital Management Co., LLC
Portfolio Managers:
Stephen M. Knightly, CFA, President
Christopher J. Scarpa, Vice President
Investment environment
Mid-cap growth equities achieved solid gains during the period despite the return of volatility after a historic run of uninterrupted advances. The calendar year ended strongly with the passing of new tax legislation, but 2018 started with renewed volatility brought about by interest rate, trade, and political concerns.
Successes
Consumer discretionary and energy sector stocks boosted relative results. Consumer discretionary holdings performed best, led by Dollar General and Dollar Tree, both of which reported solid financial results and benefited from favorable tax legislation.
Shortfalls
Performance was restrained by stock selection in technology, health care, and financial services. In technology, communications-related companies MACOM Technology Solutions and Universal Display were hurt by demand shortfalls from Apple and delayed telecommunications deployments in China.
In health care, unfavorable policy changes in the United Kingdom caused short-term disruptions in Acadia Healthcare’s behavioral health business, and Incyte suffered product delays and development setbacks at the FDA. In financials, proposed new regulations in Europe weighed on transaction-processing company Euronet Worldwide and insurance broker Aon.
Outlook
We expect 2018 to be a “tug of war” between strong corporate earnings and factors. We believe valuations will moderate amid tightening monetary policy, political uncertainty, and rising trade tensions.
7
Vanguard Morgan Growth Fund Investment Advisors
| | | |
| | Fund Assets Managed | |
| Investment Advisor | % | $ Million | Investment Strategy |
| Wellington Management | 46 | 6,557 | Uses traditional methods of stock selection— |
| Company LLP | | | fundamental research and analysis—to identify |
| | | | companies that it believes have above-average |
| | | | growth prospects. Research focuses on mid- and |
| | | | large-cap companies, evaluating and ranking each |
| | | | stock on a consistent set of growth, quality, and |
| | | | valuation criteria. We seek to build a portfolio with |
| | | | diversified sources of return with a balance of growth, |
| | | | quality, and valuation attributes. |
| Jennison Associates LLC | 22 | 3,200 | Uses a research-driven, fundamental investment |
| | | | approach that relies on in-depth company knowledge |
| | | | gleaned through meetings with management, |
| | | | customers, and suppliers. |
| Vanguard Quantitative Equity | 15 | 2,087 | Employs a quantitative fundamental management |
| Group | | | approach, using models that assess valuation, growth |
| | | | prospects, management decisions, market |
| | | | sentiment, and earnings and balance-sheet quality of |
| | | | companies as compared with their peers. |
| Frontier Capital Management | 15 | 2,080 | Uses a research-driven, fundamental investment |
| Co., LLC | | | approach that seeks companies with above-average |
| | | | growth prospects, reasonable valuations, and |
| | | | competitive advantages. |
| Cash Investments | 2 | 350 | These short-term reserves are invested by Vanguard |
| | | | in equity index products to simulate investments in |
| | | | stocks. Each advisor also may maintain a modest |
| | | | cash position. |
8
Results of Proxy Voting
At a special meeting of shareholders on November 15, 2017, fund shareholders approved the following proposals:
Proposal 1—Elect trustees for the fund.*
The individuals listed in the table below were elected as trustees for the fund. All trustees with the exception of Ms. Mulligan, Ms. Raskin, and Mr. Buckley (each of whom already serves as a director of The Vanguard Group, Inc.) served as trustees to the funds prior to the shareholder meeting.
| | | |
| | | | Percentage |
| Trustee | For | Withheld | For |
| Mortimer J. Buckley | 170,223,452 | 8,120,298 | 95.4% |
| Emerson U. Fullwood | 169,869,185 | 8,474,566 | 95.2% |
| Amy Gutmann | 169,891,210 | 8,452,541 | 95.3% |
| JoAnn Heffernan Heisen | 170,288,185 | 8,055,566 | 95.5% |
| F. Joseph Loughrey | 169,955,057 | 8,388,693 | 95.3% |
| Mark Loughridge | 170,139,078 | 8,204,672 | 95.4% |
| Scott C. Malpass | 169,997,661 | 8,346,090 | 95.3% |
| F. William McNabb III | 170,036,838 | 8,306,912 | 95.3% |
| Deanna Mulligan | 170,235,564 | 8,108,187 | 95.5% |
| André F. Perold | 169,710,674 | 8,633,076 | 95.2% |
| Sarah Bloom Raskin | 169,993,660 | 8,350,090 | 95.3% |
| Peter F. Volanakis | 170,152,829 | 8,190,922 | 95.4% |
| * Results are for all funds within the same trust. | | | |
Proposal 3—Approve a manager-of-managers arrangement with wholly owned subsidiaries of Vanguard.
This arrangement enables Vanguard or the fund to enter into and materially amend investment advisory arrangements with wholly owned subsidiaries of Vanguard, subject to the approval of the fund’s board of trustees and any conditions imposed by the Securities and Exchange Commission (SEC), while avoiding the costs and delays associated with obtaining future shareholder approval. The ability of the fund to operate in this manner is contingent upon the SEC’s approval of a pending application for an order of exemption.
| | | | | |
| | | | | Broker | Percentage |
| Vanguard Fund | For | Abstain | Against | Non-Votes | For |
| Morgan Growth Fund | 149,972,714 | 9,222,174 | 5,841,807 | 13,307,055 | 84.1% |
9
Fund shareholders did not approve the following proposal:
Proposal 7—Institute transparent procedures to avoid holding investments in companies that, in management’s judgment, substantially contribute to genocide or crimes against humanity, the most egregious violations of human rights. Such procedures may include time-limited engagement with problem companies if management believes that their behavior can be changed.
The trustees recommended a vote against the proposal for the following reasons: (1) Vanguard is fully compliant with all applicable U.S. laws and regulations that prohibit the investment in any company owned or controlled by the government of Sudan; (2) the addition of further investment constraints is not in fund shareholders’ best interests if those constraints are unrelated to a fund’s stated investment objective, policies, and strategies; and (3) divestment is an ineffective means to implement social change, as it often puts the shares into the hands of another owner with no direct impact to the company’s capitalization.
| | | | | |
| | | | | Broker | Percentage |
| Vanguard Fund | For | Abstain | Against | Non-Votes | For |
| Morgan Growth Fund | 35,651,478 | 11,284,189 | 118,101,028 | 13,307,055 | 20.0% |
10
Morgan Growth Fund
Fund Profile
As of March 31, 2018
| | |
| Share-Class Characteristics | |
| | Investor | Admiral |
| | Shares | Shares |
| Ticker Symbol | VMRGX | VMRAX |
| Expense Ratio1 | 0.38% | 0.28% |
| 30-Day SEC Yield | 0.68% | 0.78% |
| | | |
| Portfolio Characteristics | | |
| | | Russell | DJ |
| | | 3000 | U.S. Total |
| | | Growth | Market |
| | Fund | Index | FA Index |
| Number of Stocks | 293 | 1,741 | 3,771 |
| Median Market Cap | $80.1B | $85.1B | $64.2B |
| Price/Earnings Ratio | 30.9x | 26.8x | 21.2x |
| Price/Book Ratio | 5.2x | 6.0x | 2.9x |
| Return on Equity | 16.5% | 20.3% | 15.0% |
| Earnings Growth | | | |
| Rate | 12.3% | 11.6% | 8.4% |
| Dividend Yield | 1.0% | 1.2% | 1.8% |
| Foreign Holdings | 3.6% | 0.0% | 0.0% |
| Turnover Rate | | | |
| (Annualized) | 47% | — | — |
| Short-Term | | | |
| Reserves | 2.1% | — | — |
| | |
| Volatility Measures | | |
| | Russell | DJ |
| | 3000 | U.S. Total |
| | Growth | Market |
| | Index | FA Index |
| R-Squared | 0.97 | 0.86 |
| Beta | 1.02 | 1.02 |
These measures show the degree and timing of the fund’s fluctuations compared with the indexes over 36 months.
| | | |
| Sector Diversification (% of equity exposure) |
| | | Russell | DJ |
| | | 3000 | U.S. Total |
| | | Growth | Market |
| | Fund | Index | FA Index |
| Consumer Discretionary | 15.9% | 18.2% | 12.9% |
| Consumer Staples | 1.8 | 6.1 | 6.8 |
| Energy | 2.8 | 0.8 | 5.5 |
| Financials | 7.6 | 3.7 | 15.1 |
| Health Care | 11.3 | 13.5 | 13.3 |
| Industrials | 11.0 | 13.1 | 10.9 |
| Information Technology | 45.7 | 37.6 | 23.9 |
| Materials | 2.5 | 3.5 | 3.3 |
| Real Estate | 1.2 | 2.5 | 3.7 |
| Telecommunication | | | |
| Services | 0.1 | 0.9 | 1.7 |
| Utilities | 0.1 | 0.1 | 2.9 |
Sector categories are based on the Global Industry Classification Standard (“GICS”), except for the “Other” category (if applicable), which includes securities that have not been provided a GICS classification as of the effective reporting period.
| | |
| Ten Largest Holdings (% of total net assets) |
| Microsoft Corp. | Systems Software | 4.3% |
| Apple Inc. | Technology | |
| | Hardware, Storage & | |
| | Peripherals | 4.3 |
| Alphabet Inc. | Internet Software & | |
| | Services | 4.2 |
| Amazon.com Inc. | Internet & Direct | |
| | Marketing Retail | 3.9 |
| Facebook Inc. | Internet Software & | |
| | Services | 2.6 |
| Visa Inc. | Data Processing & | |
| | Outsourced Services | 2.0 |
| Home Depot Inc. | Home Improvement | |
| | Retail | 1.9 |
| Mastercard Inc. | Data Processing & | |
| | Outsourced Services | 1.6 |
| Adobe Systems Inc. | Application Software | 1.5 |
| Alibaba Group Holding | Internet Software & | |
| Ltd. | Services | 1.2 |
| Top Ten | | 27.5% |
The holdings listed exclude any temporary cash investments and equity index products.
1 The expense ratios shown are from the prospectus dated January 26, 2018, and represent estimated costs for the current fiscal year. For the six months ended March 31, 2018, the annualized expense ratios were 0.39% for Investor Shares and 0.29% for Admiral Shares.
11
Morgan Growth Fund
Investment Focus
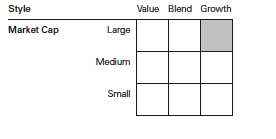
12
Morgan Growth Fund
Performance Summary
All of the returns in this report represent past performance, which is not a guarantee of future results that may be achieved by the fund. (Current performance may be lower or higher than the performance data cited. For performance data current to the most recent month-end, visit our website at vanguard.com/performance.) Note, too, that both investment returns and principal value can fluctuate widely, so an investor’s shares, when sold, could be worth more or less than their original cost. The returns shown do not reflect taxes that a shareholder would pay on fund distributions or on the sale of fund shares.
Fiscal-Year Total Returns (%): September 30, 2007, Through March 31, 2018
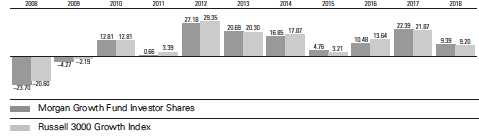
Note: For 2018, performance data reflect the six months ended March 31, 2018.
| | | | |
| Average Annual Total Returns: Periods Ended March 31, 2018 | | | |
| | Inception | One | Five | Ten |
| | Date | Year | Years | Years |
| Investor Shares | 12/31/1968 | 22.53% | 15.16% | 10.17% |
| Admiral Shares | 5/14/2001 | 22.63 | 15.28 | 10.32 |
See Financial Highlights for dividend and capital gains information.
13
Morgan Growth Fund
Financial Statements (unaudited)
Statement of Net Assets
As of March 31, 2018
The fund reports a complete list of its holdings in regulatory filings four times in each fiscal year, at the quarter-ends. For the second and fourth fiscal quarters, the lists appear in the fund’s semiannual and annual reports to shareholders. For the first and third fiscal quarters, the fund files the lists with the Securities and Exchange Commission on Form N-Q. Shareholders can look up the fund’s Forms N-Q on the SEC’s website at sec.gov. Forms N-Q may also be reviewed and copied at the SEC’s Public Reference Room (see the back cover of this report for further information).
| | | |
| | | | Market |
| | | | Value• |
| | | Shares | ($000) |
| Common Stocks (98.0%)1 | | |
| Consumer Discretionary (15.4%) | |
| * | Amazon.com Inc. | 389,533 | 563,787 |
| | Home Depot Inc. | 1,503,695 | 268,019 |
| * | Netflix Inc. | 576,795 | 170,356 |
| | TJX Cos. Inc. | 1,227,015 | 100,075 |
| | Marriott International Inc. | | |
| | Class A | 700,886 | 95,306 |
| * | Booking Holdings Inc. | 41,556 | 86,453 |
| * | O’Reilly Automotive Inc. | 329,818 | 81,590 |
| | McDonald’s Corp. | 472,398 | 73,874 |
| | Las Vegas Sands Corp. | 830,324 | 59,700 |
| | Kering SA | 122,755 | 58,860 |
| * | Charter Communications | | |
| | Inc. Class A | 187,989 | 58,506 |
| | Domino’s Pizza Inc. | 225,084 | 52,571 |
| *,^ | Tesla Inc. | 197,041 | 52,439 |
| | Ross Stores Inc. | 479,491 | 37,391 |
| | Dollar General Corp. | 354,379 | 33,152 |
| | Comcast Corp. Class A | 924,624 | 31,594 |
| * | Dollar Tree Inc. | 329,345 | 31,255 |
| | Aramark | 787,045 | 31,136 |
| * | LKQ Corp. | 802,327 | 30,448 |
| | Yum! Brands Inc. | 336,114 | 28,613 |
| | Dana Inc. | 864,313 | 22,265 |
| * | ServiceMaster Global | | |
| | Holdings Inc. | 437,162 | 22,230 |
| MGM Resorts International | 574,028 | 20,102 |
| | Lowe’s Cos. Inc. | 194,620 | 17,078 |
| | Walt Disney Co. | 141,316 | 14,194 |
| * | Burlington Stores Inc. | 104,676 | 13,938 |
| * | Bright Horizons Family | | |
| | Solutions Inc. | 138,174 | 13,779 |
| ^ | Sirius XM Holdings Inc. | 2,069,970 | 12,917 |
| | Hilton Worldwide | | |
| | Holdings Inc. | 163,514 | 12,878 |
| | Texas Roadhouse Inc. | | |
| | Class A | 215,794 | 12,469 |
| | | |
| * | Michael Kors Holdings Ltd. | 187,518 | 11,641 |
| | Lear Corp. | 60,688 | 11,293 |
| * | Liberty Media Corp-Liberty | | |
| | SiriusXM Class A | 274,063 | 11,264 |
| * | Live Nation | | |
| | Entertainment Inc. | 259,905 | 10,952 |
| * | NVR Inc. | 3,750 | 10,500 |
| | H&R Block Inc. | 392,330 | 9,969 |
| | Wynn Resorts Ltd. | 51,742 | 9,436 |
| | Starbucks Corp. | 123,357 | 7,141 |
| | Royal Caribbean Cruises | | |
| | Ltd. | 27,590 | 3,248 |
| | NIKE Inc. Class B | 39,439 | 2,620 |
| * | Michaels Cos. Inc. | 86,409 | 1,703 |
| | Polaris Industries Inc. | 13,540 | 1,551 |
| * | Liberty Media Corp-Liberty | | |
| | SiriusXM Class C | 29,702 | 1,213 |
| | | | 2,199,506 |
| Consumer Staples (1.6%) | | |
| | Costco Wholesale Corp. | 494,396 | 93,159 |
| | Estee Lauder Cos. Inc. | | |
| | Class A | 511,703 | 76,612 |
| * | Monster Beverage Corp. | 616,795 | 35,287 |
| * | Pilgrim’s Pride Corp. | 358,715 | 8,828 |
| | Brown-Forman Corp. | | |
| | Class B | 151,845 | 8,260 |
| | Colgate-Palmolive Co. | 35,875 | 2,572 |
| * | US Foods Holding Corp. | 66,015 | 2,163 |
| | PepsiCo Inc. | 19,044 | 2,079 |
| | Sysco Corp. | 32,285 | 1,936 |
| | Lamb Weston Holdings Inc. | 10,801 | 629 |
| | | | 231,525 |
| Energy (2.7%) | | |
| | Schlumberger Ltd. | 1,099,723 | 71,240 |
| | BP plc ADR | 1,722,013 | 69,810 |
| | Chevron Corp. | 611,003 | 69,679 |
| | Pioneer Natural | | |
| | Resources Co. | 372,159 | 63,930 |
14
Morgan Growth Fund
| | | |
| | | | Market |
| | | | Value• |
| | | Shares | ($000) |
| | Baker Hughes a GE Co. | 961,377 | 26,697 |
| * | Carrizo Oil & Gas Inc. | 1,128,189 | 18,051 |
| | ConocoPhillips | 268,952 | 15,946 |
| | Anadarko Petroleum Corp. | 246,549 | 14,894 |
| * | Concho Resources Inc. | 82,965 | 12,472 |
| | Cabot Oil & Gas Corp. | 237,316 | 5,691 |
| | EOG Resources Inc. | 46,885 | 4,936 |
| | Andeavor | 33,510 | 3,370 |
| * | Continental Resources Inc. | 29,643 | 1,747 |
| | | | 378,463 |
| Financials (7.3%) | | |
| | American Express Co. | 1,008,039 | 94,030 |
| | JPMorgan Chase & Co. | 834,607 | 91,782 |
| | Intercontinental | | |
| | Exchange Inc. | 1,044,646 | 75,758 |
| | Goldman Sachs Group | | |
| | Inc. | 292,367 | 73,636 |
| | Bank of America Corp. | 2,334,349 | 70,007 |
| | Morgan Stanley | 1,163,486 | 62,782 |
| | Citigroup Inc. | 926,722 | 62,554 |
| | TD Ameritrade | | |
| | Holding Corp. | 983,685 | 58,264 |
| | S&P Global Inc. | 285,069 | 54,465 |
| | FactSet Research | | |
| | Systems Inc. | 196,406 | 39,167 |
| * | Berkshire Hathaway | | |
| | Inc. Class B | 181,250 | 36,156 |
| | Raymond James | | |
| | Financial Inc. | 400,421 | 35,802 |
| | Nasdaq Inc. | 382,081 | 32,943 |
| | SEI Investments Co. | 379,875 | 28,456 |
| | Webster Financial Corp. | 475,703 | 26,354 |
| * | E*TRADE Financial Corp. | 462,362 | 25,620 |
| | Aon plc | 161,351 | 22,642 |
| | Willis Towers Watson plc | 140,446 | 21,374 |
| | BlackRock Inc. | 39,069 | 21,164 |
| | Moody’s Corp. | 113,707 | 18,341 |
| | LPL Financial Holdings Inc. | 291,553 | 17,805 |
| | Evercore Inc. Class A | 171,300 | 14,937 |
| | T. Rowe Price Group Inc. | 135,504 | 14,630 |
| | Progressive Corp. | 229,181 | 13,964 |
| | Ameriprise Financial Inc. | 75,903 | 11,229 |
| | Comerica Inc. | 88,375 | 8,478 |
| | FNF Group | 137,915 | 5,519 |
| | Brown & Brown Inc. | 106,492 | 2,709 |
| | Affiliated Managers | | |
| | Group Inc. | 12,103 | 2,295 |
| | MSCI Inc. Class A | 2,890 | 432 |
| | | | 1,043,295 |
| Health Care (10.9%) | | |
| | Bristol-Myers Squibb Co. | 2,132,381 | 134,873 |
| | Gilead Sciences Inc. | 1,217,385 | 91,779 |
| * | Edwards Lifesciences | | |
| | Corp. | 656,676 | 91,619 |
| | Aetna Inc. | 494,460 | 83,564 |
| | | |
| | Anthem Inc. | 361,614 | 79,447 |
| * | BioMarin Pharmaceutical | | |
| | Inc. | 926,288 | 75,094 |
| | Zoetis Inc. | 857,923 | 71,645 |
| | Danaher Corp. | 670,109 | 65,610 |
| * | Illumina Inc. | 268,527 | 63,485 |
| | AbbVie Inc. | 578,506 | 54,756 |
| * | Vertex Pharmaceuticals | | |
| | Inc. | 320,821 | 52,287 |
| | Thermo Fisher Scientific | | |
| | Inc. | 230,643 | 47,619 |
| | Amgen Inc. | 271,934 | 46,359 |
| * | ICON plc | 391,820 | 46,290 |
| | UnitedHealth Group Inc. | 204,995 | 43,869 |
| * | Celgene Corp. | 426,686 | 38,065 |
| | McKesson Corp. | 252,252 | 35,535 |
| * | Alexion Pharmaceuticals Inc. | 309,691 | 34,518 |
| | Cooper Cos. Inc. | 139,067 | 31,820 |
| * | Align Technology Inc. | 124,940 | 31,376 |
| * | Nektar Therapeutics | | |
| | Class A | 275,673 | 29,293 |
| * | Acadia Healthcare Co. Inc. | 510,513 | 20,002 |
| * | Waters Corp. | 98,081 | 19,484 |
| * | QIAGEN NV | 599,608 | 19,373 |
| * | Nevro Corp. | 213,106 | 18,470 |
| | STERIS plc | 193,040 | 18,022 |
| * | Intuitive Surgical Inc. | 41,987 | 17,333 |
| | Humana Inc. | 63,157 | 16,978 |
| | Teleflex Inc. | 63,629 | 16,224 |
| * | Insulet Corp. | 177,298 | 15,368 |
| * | Neurocrine Biosciences Inc. | 182,200 | 15,110 |
| | Cigna Corp. | 90,027 | 15,101 |
| | Baxter International Inc. | 225,487 | 14,666 |
| | AmerisourceBergen Corp. | | |
| | Class A | 144,599 | 12,466 |
| * | Alkermes plc | 199,359 | 11,555 |
| * | Mettler-Toledo | | |
| | International Inc. | 19,630 | 11,288 |
| * | Incyte Corp. | 133,464 | 11,122 |
| * | Exact Sciences Corp. | 274,220 | 11,059 |
| | Eli Lilly & Co. | 126,185 | 9,763 |
| | Dentsply Sirona Inc. | 180,842 | 9,098 |
| * | Centene Corp. | 71,968 | 7,691 |
| * | Exelixis Inc. | 327,436 | 7,253 |
| * | Veeva Systems Inc. Class A | 67,132 | 4,902 |
| * | IQVIA Holdings Inc. | 39,851 | 3,910 |
| | Agilent Technologies Inc. | 28,236 | 1,889 |
| * | Varian Medical Systems Inc. | 3,469 | 425 |
| | | | 1,557,455 |
| Industrials (10.7%) | | |
| | Caterpillar Inc. | 1,127,540 | 166,177 |
| | Boeing Co. | 430,582 | 141,179 |
| | Parker-Hannifin Corp. | 755,859 | 129,275 |
| | Rockwell Automation Inc. | 491,093 | 85,548 |
| | Cummins Inc. | 494,751 | 80,194 |
15
Morgan Growth Fund
| | | |
| | | | Market |
| | | | Value• |
| | | Shares | ($000) |
| | Emerson Electric Co. | 1,139,755 | 77,845 |
| | Dover Corp. | 766,771 | 75,312 |
| * | IHS Markit Ltd. | 1,323,068 | 63,825 |
| | Fortive Corp. | 809,704 | 62,768 |
| | Raytheon Co. | 256,157 | 55,284 |
| | Roper Technologies Inc. | 187,192 | 52,543 |
| | Honeywell International | | |
| | Inc. | 349,370 | 50,487 |
| | Cintas Corp. | 273,954 | 46,731 |
| | Waste Connections Inc. | 554,237 | 39,761 |
| * | HD Supply Holdings Inc. | 1,025,988 | 38,926 |
| | KAR Auction Services Inc. | 612,493 | 33,197 |
| | Union Pacific Corp. | 205,214 | 27,587 |
| | Experian plc | 1,265,018 | 27,327 |
| | AO Smith Corp. | 363,043 | 23,086 |
| * | JetBlue Airways Corp. | 957,225 | 19,451 |
| | Hexcel Corp. | 287,644 | 18,579 |
| | Knight-Swift | | |
| | Transportation | | |
| | Holdings Inc. | 388,061 | 17,855 |
| * | Beacon Roofing Supply Inc. | 334,009 | 17,726 |
| | 3M Co. | 72,550 | 15,926 |
| | Lockheed Martin Corp. | 43,940 | 14,849 |
| | Harris Corp. | 87,822 | 14,164 |
| * | United Rentals Inc. | 74,238 | 12,823 |
| | Old Dominion Freight | | |
| | Line Inc. | 84,117 | 12,363 |
| * | Middleby Corp. | 98,242 | 12,161 |
| | Spirit AeroSystems | | |
| | Holdings Inc. Class A | 144,297 | 12,078 |
| * | TransUnion | 210,559 | 11,956 |
| | Allison Transmission | | |
| | Holdings Inc. | 293,487 | 11,464 |
| | Graco Inc. | 190,590 | 8,714 |
| * | XPO Logistics Inc. | 80,703 | 8,216 |
| | Kansas City Southern | 68,427 | 7,517 |
| | Waste Management Inc. | 82,801 | 6,965 |
| | AMETEK Inc. | 73,555 | 5,588 |
| * | Copart Inc. | 98,622 | 5,023 |
| | IDEX Corp. | 28,443 | 4,053 |
| | Expeditors International of | |
| | Washington Inc. | 49,950 | 3,162 |
| | TransDigm Group Inc. | 7,211 | 2,213 |
| | United Parcel Service Inc. | |
| | Class B | 13,410 | 1,404 |
| | HEICO Corp. Class A | 7,970 | 565 |
| | Xylem Inc. | 6,428 | 494 |
| | | | 1,522,361 |
| Information Technology (44.8%) | |
| | Microsoft Corp. | 6,792,441 | 619,946 |
| | Apple Inc. | 3,658,456 | 613,816 |
| * | Alphabet Inc. Class C | 454,526 | 468,975 |
| * | Facebook Inc. Class A | 2,340,489 | 373,987 |
| | Visa Inc. Class A | 2,419,078 | 289,370 |
| | | |
| | Mastercard Inc. Class A | 1,312,377 | 229,876 |
| * | Adobe Systems Inc. | 1,009,367 | 218,104 |
| * | Alibaba Group Holding | | |
| | Ltd. ADR | 931,155 | 170,904 |
| * | salesforce.com Inc. | 1,400,853 | 162,919 |
| * | PayPal Holdings Inc. | 2,005,567 | 152,162 |
| | Tencent Holdings Ltd. | 2,505,152 | 133,352 |
| | Global Payments Inc. | 1,165,029 | 129,924 |
| * | Alphabet Inc. Class A | 119,745 | 124,192 |
| * | Workday Inc. Class A | 935,785 | 118,948 |
| | Oracle Corp. | 2,403,511 | 109,961 |
| | NVIDIA Corp. | 469,233 | 108,670 |
| | SS&C Technologies | | |
| | Holdings Inc. | 1,990,753 | 106,784 |
| * | Red Hat Inc. | 682,601 | 102,056 |
| * | Worldpay Inc. Class A | 1,192,270 | 98,052 |
| | Applied Materials Inc. | 1,735,420 | 96,507 |
| | Texas Instruments Inc. | 915,563 | 95,118 |
| | Intuit Inc. | 496,834 | 86,126 |
| | International Business | | |
| | Machines Corp. | 548,999 | 84,233 |
| * | VeriSign Inc. | 617,861 | 73,253 |
| | Activision Blizzard Inc. | 1,028,212 | 69,363 |
| * | Electronic Arts Inc. | 563,108 | 68,271 |
| | Broadcom Ltd. | 266,212 | 62,733 |
| | Cisco Systems Inc. | 1,452,524 | 62,299 |
| | DXC Technology Co. | 619,632 | 62,292 |
| * | Gartner Inc. | 491,694 | 57,833 |
| | Maxim Integrated | | |
| | Products Inc. | 923,265 | 55,599 |
| | NetApp Inc. | 885,149 | 54,605 |
| * | eBay Inc. | 1,354,508 | 54,505 |
| * | ServiceNow Inc. | 326,207 | 53,971 |
| | QUALCOMM Inc. | 902,544 | 50,010 |
| | KLA-Tencor Corp. | 434,915 | 47,410 |
| * | Splunk Inc. | 453,449 | 44,615 |
| | Teradyne Inc. | 969,734 | 44,326 |
| | Xilinx Inc. | 612,333 | 44,235 |
| * | Fiserv Inc. | 614,611 | 43,828 |
| | Analog Devices Inc. | 456,733 | 41,622 |
| * | Yandex NV Class A | 923,689 | 36,439 |
| * | Autodesk Inc. | 284,095 | 35,677 |
| * | InterXion Holding NV | 523,969 | 32,544 |
| | CDK Global Inc. | 493,872 | 31,282 |
| * | Check Point Software | | |
| | Technologies Ltd. | 292,599 | 29,067 |
| | Lam Research Corp. | 139,678 | 28,377 |
| * | WEX Inc. | 180,870 | 28,328 |
| * | Palo Alto Networks Inc. | 143,261 | 26,005 |
| | Accenture plc Class A | 169,048 | 25,949 |
| * | Conduent Inc. | 1,314,208 | 24,497 |
| * | Integrated Device | | |
| | Technology Inc. | 794,747 | 24,287 |
| * | Qorvo Inc. | 335,208 | 23,615 |
16
Morgan Growth Fund
| | | |
| | | | Market |
| | | | Value• |
| | | Shares | ($000) |
| | Amphenol Corp. Class A | 243,958 | 21,012 |
| * | Guidewire Software Inc. | 257,908 | 20,847 |
| * | Euronet Worldwide Inc. | 263,262 | 20,777 |
| * | Atlassian Corp. plc Class A | 383,773 | 20,693 |
| | Marvell Technology | | |
| | Group Ltd. | 901,760 | 18,937 |
| | Jack Henry & | | |
| | Associates Inc. | 147,030 | 17,783 |
| * | Micron Technology Inc. | 336,961 | 17,569 |
| | Monolithic Power | | |
| | Systems Inc. | 146,375 | 16,946 |
| * | Semtech Corp. | 384,398 | 15,011 |
| * | Square Inc. | 280,119 | 13,782 |
| | Broadridge Financial | | |
| | Solutions Inc. | 125,345 | 13,749 |
| | Total System Services Inc. | 158,481 | 13,670 |
| * | ON Semiconductor Corp. | 555,304 | 13,583 |
| * | Dell Technologies Inc. | | |
| | Class V | 184,366 | 13,497 |
| * | Okta Inc. | 328,859 | 13,105 |
| * | Flex Ltd. | 777,214 | 12,692 |
| | CDW Corp. | 171,785 | 12,078 |
| *,^ | VMware Inc. Class A | 99,504 | 12,067 |
| * | Match Group Inc. | 243,539 | 10,823 |
| * | Fortinet Inc. | 198,318 | 10,626 |
| | Universal Display Corp. | 101,268 | 10,228 |
| | Alliance Data Systems Corp. | 47,814 | 10,178 |
| *,^ | MACOM Technology | | |
| | Solutions Holdings Inc. | 566,988 | 9,412 |
| * | Arista Networks Inc. | 27,838 | 7,107 |
| * | Twitter Inc. | 215,938 | 6,264 |
| *,^ | Advanced Micro | | |
| | Devices Inc. | 474,993 | 4,774 |
| * | IPG Photonics Corp. | 12,489 | 2,915 |
| | Fidelity National Information | | |
| | Services Inc. | 20,819 | 2,005 |
| * | Take-Two Interactive | | |
| | Software Inc. | 13,606 | 1,330 |
| | | | 6,394,279 |
| Materials (2.4%) | | |
| | Rio Tinto plc ADR | 1,925,191 | 99,205 |
| | Ball Corp. | 841,428 | 33,413 |
| * | Berry Global Group Inc. | 537,079 | 29,437 |
| | FMC Corp. | 315,245 | 24,138 |
| | Sherwin-Williams Co. | 60,508 | 23,726 |
| | Eagle Materials Inc. | 220,775 | 22,751 |
| | Martin Marietta | | |
| | Materials Inc. | 102,114 | 21,168 |
| | Vulcan Materials Co. | 183,568 | 20,958 |
| * | Allegheny | | |
| | Technologies Inc. | 724,582 | 17,158 |
| * | Cleveland-Cliffs Inc. | 2,214,332 | 15,390 |
| * | Freeport-McMoRan Inc. | 810,739 | 14,245 |
| | CF Industries Holdings Inc. | 279,322 | 10,539 |
| | | |
| * | Alcoa Corp. | 218,715 | 9,834 |
| | Chemours Co. | 112,702 | 5,490 |
| | Steel Dynamics Inc. | 9,403 | 416 |
| | | | 347,868 |
| Other (1.0%) | | |
| ^,2 | Vanguard Growth ETF | 974,900 | 138,319 |
| |
| Real Estate (1.2%) | | |
| | American Tower Corp. | 515,472 | 74,919 |
| * | SBA Communications | | |
| | Corp. Class A | 333,084 | 56,931 |
| * | CBRE Group Inc. Class A | 272,576 | 12,871 |
| | CubeSmart | 373,992 | 10,547 |
| | Equity LifeStyle | | |
| | Properties Inc. | 67,192 | 5,897 |
| | Prologis Inc. | 60,708 | 3,824 |
| | SL Green Realty Corp. | 12,066 | 1,168 |
| | | | 166,157 |
| Telecommunication Services (0.0%) | |
| * | T-Mobile US Inc. | 77,014 | 4,701 |
| |
| Utilities (0.0%) | | |
| | NRG Energy Inc. | 150,783 | 4,603 |
| Total Common Stocks | | |
| (Cost $9,067,957) | | 13,988,532 |
| Temporary Cash Investments (2.4%)1 | |
| Money Market Fund (2.1%) | | |
| 3,4 | Vanguard Market Liquidity | | |
| | Fund, 1.775% | 2,982,213 | 298,221 |
| |
| | | Face | |
| | | Amount | |
| | | ($000) | |
| Repurchase Agreement (0.2%) | |
| | Bank of America Securities, | |
| | LLC 1.800%, 4/2/18 | | |
| | (Dated 3/29/18, | | |
| | Repurchase Value | | |
| | $32,006,000, collateralized | |
| | by Government National | | |
| | Mortgage Assn. 3.500%– | |
| | 4.000%, 12/20/44–5/20/46, | |
| | with a value of | | |
| | $32,640,000) | 32,000 | 32,000 |
| |
| U. S. Government and Agency Obligations (0.1%) |
| | United States Treasury Bill, | |
| | 1.461%, 5/3/18 | 3,000 | 2,996 |
| 5 | United States Treasury Bill, | |
| | 1.429%, 5/24/18 | 1,400 | 1,397 |
| 5 | United States Treasury Bill, | |
| | 1.446%, 5/31/18 | 200 | 199 |
17
Morgan Growth Fund
| | | |
| | | Face | Market |
| | Amount | Value • |
| | | ($000) | ($000) |
| 5 | United States Treasury Bill, | | |
| | 1.599%, 6/7/18 | 300 | 299 |
| 5 | United States Treasury Bill, | | |
| | 1.509%, 6/21/18 | 3,400 | 3,387 |
| 5 | United States Treasury Bill, | | |
| | 1.541%, 6/28/18 | 2,000 | 1,992 |
| 5 | United States Treasury Bill, | | |
| | 1.693%, 7/12/18 | 3,300 | 3,284 |
| | | | 13,554 |
| Total Temporary Cash Investments | |
| (Cost $343,763) | | 343,775 |
| Total Investments (100.4%) | | |
| (Cost $9,411,720) | | 14,332,307 |
| |
| | | | Amount |
| | | | ($000) |
| Other Assets and Liabilities (-0.4%) | |
| Other Assets | | |
| Investment in Vanguard | | 785 |
| Receivables for Investment Securities Sold | 33,376 |
| Receivables for Accrued Income | | 6,796 |
| Receivables for Capital Shares Issued | 16,485 |
| Variation Margin Receivable— | | |
| | Futures Contracts | | 2,903 |
| Other Assets | | 1,808 |
| Total Other Assets | | 62,153 |
| Liabilities | | |
| Payables for Investment Securities | |
| | Purchased | | (34,375) |
| Collateral for Securities on Loan | | (43,803) |
| Payable for Capital Shares Redeemed | (17,620) |
| Payables to Investment Advisor | | (5,785) |
| Payables to Vanguard | | (18,469) |
| Total Liabilities | | (120,052) |
| Net Assets (100%) | | 14,274,408 |
| |
| |
| At March 31, 2018, net assets consisted of: |
| | | | Amount |
| | | | ($000) |
| Paid-in Capital | | 8,827,603 |
| Undistributed Net Investment Income | 9,532 |
| Accumulated Net Realized Gains | | 528,152 |
| Unrealized Appreciation (Depreciation) | |
| | Investment Securities | | 4,920,587 |
| | Futures Contracts | | (11,475) |
| | Foreign Currencies | | 9 |
| Net Assets | | 14,274,408 |
| |
| | Amount |
| | ($000) |
| Investor Shares—Net Assets | |
| Applicable to 141,522,482 outstanding | |
| $.001 par value shares of beneficial | |
| interest (unlimited authorization) | 4,269,295 |
| Net Asset Value Per Share— | |
| Investor Shares | $30.17 |
| |
| |
| Admiral Shares—Net Assets | |
| Applicable to 106,946,322 outstanding |
| $.001 par value shares of beneficial | |
| interest (unlimited authorization) | 10,005,113 |
| Net Asset Value Per Share— | |
| Admiral Shares | $93.55 |
• See Note A in Notes to Financial Statements.
* Non-income-producing security.
^ Includes partial security positions on loan to broker-dealers. The total value of securities on loan is $42,350,000.
1 The fund invests a portion of its cash reserves in equity markets through the use of index futures contracts. After giving effect to futures investments, the fund’s effective
common stock and temporary cash investment positions represent 99.5% and 0.9%, respectively, of net assets.
2 Considered an affiliated company of the fund as the issuer is another member of The Vanguard Group.
3 Affiliated money market fund available only to Vanguard funds and certain trusts and accounts managed by Vanguard. Rate shown is the 7-day yield.
4 Includes $43,803,000 of collateral received for securities on loan.
5 Securities with a value of $9,661,000 have been segregated as initial margin for open futures contracts.
ADR—American Depositary Receipt.
18
| | | | |
| Morgan Growth Fund | | | | |
| |
| |
| Derivative Financial Instruments Outstanding as of Period End | | |
| Futures Contracts | | | | |
| | | | | ($000) |
| | | | | Value and |
| | | Number of | | Unrealized |
| | | Long (Short) | Notional | Appreciation |
| | Expiration | Contracts | Amount | (Depreciation) |
| Long Futures Contracts | | | | |
| E-mini S&P 500 Index | June 2018 | 1,640 | 216,726 | (11,475) |
Unrealized appreciation (depreciation) on open futures contracts is required to be treated as realized gain (loss) for tax purposes.
See accompanying Notes, which are an integral part of the Financial Statements.
19
| |
| Morgan Growth Fund | |
| |
| |
| Statement of Operations | |
| |
| |
| | Six Months Ended |
| | March 31, 2018 |
| | ($000) |
| Investment Income | |
| Income | |
| Dividends—Unaffiliated Issuers1 | 68,919 |
| Dividends—Affiliated Issuers | 814 |
| Interest—Unaffiliated Issuers | 247 |
| Interest—Affiliated Issuers | 1,846 |
| Securities Lending—Net | 266 |
| Total Income | 72,092 |
| Expenses | |
| Investment Advisory Fees—Note B | |
| Basic Fee | 10,454 |
| Performance Adjustment | 974 |
| The Vanguard Group—Note C | |
| Management and Administrative—Investor Shares | 4,350 |
| Management and Administrative—Admiral Shares | 5,532 |
| Marketing and Distribution—Investor Shares | 308 |
| Marketing and Distribution—Admiral Shares | 260 |
| Custodian Fees | 49 |
| Shareholders’ Reports and Proxy—Investor Shares | 65 |
| Shareholders’ Reports and Proxy—Admiral Shares | 41 |
| Trustees’ Fees and Expenses | 11 |
| Total Expenses | 22,044 |
| Expenses Paid Indirectly | (204) |
| Net Expenses | 21,840 |
| Net Investment Income | 50,252 |
| Realized Net Gain (Loss) | |
| Investment Securities Sold—Unaffiliated Issuers | 623,113 |
| Investment Securities Sold—Affiliated Issuers | (54) |
| Futures Contracts | 14,136 |
| Foreign Currencies | (106) |
| Realized Net Gain (Loss) | 637,089 |
| Change in Unrealized Appreciation (Depreciation) | |
| Investment Securities—Unaffiliated Issuers | 526,033 |
| Investment Securities—Affiliated Issuers | 8,891 |
| Futures Contracts | (14,209) |
| Foreign Currencies | 3 |
| Change in Unrealized Appreciation (Depreciation) | 520,718 |
| Net Increase (Decrease) in Net Assets Resulting from Operations | 1,208,059 |
| 1 Dividends are net of foreign withholding taxes of $85,000. | |
| |
| See accompanying Notes, which are an integral part of the Financial Statements. | |
20
| | |
| Morgan Growth Fund | | |
| |
| |
| Statement of Changes in Net Assets | | |
| |
| | Six Months Ended | Year Ended |
| | March 31, | September 30, |
| | 2018 | 2017 |
| | ($000) | ($000) |
| Increase (Decrease) in Net Assets | | |
| Operations | | |
| Net Investment Income | 50,252 | 128,143 |
| Realized Net Gain (Loss) | 637,089 | 975,056 |
| Change in Unrealized Appreciation (Depreciation) | 520,718 | 1,283,043 |
| Net Increase (Decrease) in Net Assets Resulting from Operations | 1,208,059 | 2,386,242 |
| Distributions | | |
| Net Investment Income | | |
| Investor Shares | (35,011) | (31,763) |
| Admiral Shares | (78,282) | (63,618) |
| Realized Capital Gain1 | | |
| Investor Shares | (284,516) | (179,416) |
| Admiral Shares | (639,751) | (317,116) |
| Total Distributions | (1,037,560) | (591,913) |
| Capital Share Transactions | | |
| Investor Shares | 32,075 | (491,323) |
| Admiral Shares | 1,080,497 | 503,058 |
| Net Increase (Decrease) from Capital Share Transactions | 1,112,572 | 11,735 |
| Total Increase (Decrease) | 1,283,071 | 1,806,064 |
| Net Assets | | |
| Beginning of Period | 12,991,337 | 11,185,273 |
| End of Period2 | 14,274,408 | 12,991,337 |
1 Includes fiscal 2018 and 2017 short-term gain distributions totaling $82,554,000 and $0, respectively. Short-term gain distributions are treated as ordinary income dividends for tax purposes.
2 Net Assets—End of Period includes undistributed (overdistributed) net investment income of $9,532,000 and $72,679,000.
See accompanying Notes, which are an integral part of the Financial Statements.
21
| | | | | | |
| Morgan Growth Fund | | | | | | |
| |
| |
| Financial Highlights | | | | | | |
| |
| |
| Investor Shares | | | | | | |
| Six Months | | | | | |
| | Ended | | | | | |
| For a Share Outstanding | March 31, | | | Year Ended September 30, |
| Throughout Each Period | 2018 | 2017 | 2016 | 2015 | 2014 | 2013 |
| Net Asset Value, Beginning of Period | $29.83 | $25.74 | $25.29 | $27.07 | $24.26 | $20.31 |
| Investment Operations | | | | | | |
| Net Investment Income | .1001 | .2771,2 | .207 | .219 | .187 | .230 |
| Net Realized and Unrealized Gain (Loss) | | | | | | |
| on Investments | 2.647 | 5.196 | 2.385 | 1.017 | 3.785 | 3.925 |
| Total from Investment Operations | 2.747 | 5.473 | 2.592 | 1.236 | 3.972 | 4.155 |
| Distributions | | | | | | |
| Dividends from Net Investment Income | (. 264) | (. 208) | (.175) | (.191) | (.172) | (. 205) |
| Distributions from Realized Capital Gains | (2.143) | (1.175) | (1.967) | (2.825) | (.990) | — |
| Total Distributions | (2.407) | (1.383) | (2.142) | (3.016) | (1.162) | (.205) |
| Net Asset Value, End of Period | $30.17 | $29.83 | $25.74 | $25.29 | $27.07 | $24.26 |
| |
| Total Return3 | 9.39% | 22.39% | 10.48% | 4.76% | 16.85% | 20.69% |
| |
| Ratios/Supplemental Data | | | | | | |
| Net Assets, End of Period (Millions) | $4,269 | $4,177 | $4,063 | $4,077 | $4,580 | $4,922 |
| Ratio of Total Expenses to | | | | | | |
| Average Net Assets4 | 0.39% | 0.38% | 0.38% | 0.40% | 0.40% | 0.39% |
| Ratio of Net Investment Income to | | | | | | |
| Average Net Assets | 0.64% | 1.02%2 | 0.81% | 0.80% | 0.72% | 1.06% |
| Portfolio Turnover Rate | 47% | 48% | 51% | 41% | 52% | 53% |
The expense ratio, net investment income ratio, and turnover rate for the current period have been annualized.
| 1 | Calculated based on average shares outstanding. |
| 2 | Net investment income per share and the ratio of net investment income to average net assets include $.043 and 0.16%, respectively, from income received as a result of the General Electric Co. and Baker Hughes Inc. merger in July 2017. |
| 3 | Total returns do not include account service fees that may have applied in the periods shown. Fund prospectuses provide information about any applicable account service fees. |
| 4 | Includes performance-based investment advisory fee increases (decreases) of 0.01%, 0.00%, 0.01%, (0.01%), (0.04%), and (0.05%). |
See accompanying Notes, which are an integral part of the Financial Statements.
22
| | | | | | |
| Morgan Growth Fund | | | | | | |
| |
| |
| Financial Highlights | | | | | | |
| |
| |
| Admiral Shares | | | | | | |
| Six Months | | | | | |
| | Ended | | | | | |
| For a Share Outstanding | March 31, | | | Year Ended September 30, |
| Throughout Each Period | 2018 | 2017 | 2016 | 2015 | 2014 | 2013 |
| Net Asset Value, Beginning of Period | $92.45 | $79.80 | $78.42 | $83.97 | $75.26 | $63.02 |
| Investment Operations | | | | | | |
| Net Investment Income | . 3581 | .9431,2 | .726 | .804 | .719 | .831 |
| Net Realized and Unrealized Gain (Loss) | | | | | | |
| on Investments | 8.198 | 16.076 | 7.402 | 3.123 | 11.722 | 12.144 |
| Total from Investment Operations | 8.556 | 17.019 | 8.128 | 3.927 | 12.441 | 12.975 |
| Distributions | | | | | | |
| Dividends from Net Investment Income | (. 813) | (.730) | (. 656) | (.727) | (. 664) | (.735) |
| Distributions from Realized Capital Gains | (6.643) | (3.639) | (6.092) | (8.750) | (3.067) | — |
| Total Distributions | (7.456) | (4.369) | (6.748) | (9.477) | (3.731) | (.735) |
| Net Asset Value, End of Period | $93.55 | $92.45 | $79.80 | $78.42 | $83.97 | $75.26 |
| |
| Total Return3 | 9.43% | 22.48% | 10.60% | 4.88% | 17.03% | 20.86% |
| |
| Ratios/Supplemental Data | | | | | | |
| Net Assets, End of Period (Millions) | $10,005 | $8,814 | $7,122 | $6,806 | $6,250 | $5,019 |
| Ratio of Total Expenses to | | | | | | |
| Average Net Assets4 | 0.29% | 0.28% | 0.28% | 0.27% | 0.26% | 0.25% |
| Ratio of Net Investment Income to | | | | | | |
| Average Net Assets | 0.74% | 1.12%2 | 0.91% | 0.93% | 0.86% | 1.20% |
| Portfolio Turnover Rate | 47% | 48% | 51% | 41% | 52% | 53% |
The expense ratio, net investment income ratio, and turnover rate for the current period have been annualized. 1 Calculated based on average shares outstanding.
2 Net investment income per share and the ratio of net investment income to average net assets include $.134 and 0.16%, respectively, from income received as a result of the General Electric Co. and Baker Hughes Inc. merger in July 2017.
3 Total returns do not include account service fees that may have applied in the periods shown. Fund prospectuses provide information about any applicable account service fees.
4 Includes performance-based investment advisory fee increases (decreases) of 0.01%, 0.00%, 0.01%, (0.01%), (0.04%), and (0.05%).
See accompanying Notes, which are an integral part of the Financial Statements.
23
Morgan Growth Fund
Notes to Financial Statements
Vanguard Morgan Growth Fund is registered under the Investment Company Act of 1940 as an open-end investment company, or mutual fund. The fund offers two classes of shares: Investor Shares and Admiral Shares. Investor Shares are available to any investor who meets the fund’s minimum purchase requirements. Admiral Shares are designed for investors who meet certain administrative, service, and account-size criteria.
A. The following significant accounting policies conform to generally accepted accounting principles for U.S. investment companies. The fund consistently follows such policies in preparing its financial statements.
1. Security Valuation: Securities are valued as of the close of trading on the New York Stock Exchange (generally 4 p.m., Eastern time) on the valuation date. Equity securities are valued at the latest quoted sales prices or official closing prices taken from the primary market in which each security trades; such securities not traded on the valuation date are valued at the mean of the latest quoted bid and asked prices. Securities for which market quotations are not readily available, or whose values have been affected by events occurring before the fund’s pricing time but after the close of the securities’ primary markets, are valued at their fair values calculated according to procedures adopted by the board of trustees. These procedures include obtaining quotations from an independent pricing service, monitoring news to identify significant market- or security-specific events, and evaluating changes in the values of foreign market proxies (for example, ADRs, futures contracts, or exchange-traded funds), between the time the foreign markets close and the fund’s pricing time. When fair-value pricing is employed, the prices of securities used by a fund to calculate its net asset value may differ from quoted or published prices for the same securities. Investments in Vanguard Market Liquidity Fund are valued at that fund’s net asset value. Temporary cash investments are valued using the latest bid prices or using valuations based on a matrix system (which considers such factors as security prices, yields, maturities, and ratings), both as furnished by independent pricing services.
2. Foreign Currency: Securities and other assets and liabilities denominated in foreign currencies are translated into U.S. dollars using exchange rates obtained from an independent third party as of the fund’s pricing time on the valuation date. Realized gains (losses) and unrealized appreciation (depreciation) on investment securities include the effects of changes in exchange rates since the securities were purchased, combined with the effects of changes in security prices. Fluctuations in the value of other assets and liabilities resulting from changes in exchange rates are recorded as unrealized foreign currency gains (losses) until the assets or liabilities are settled in cash, at which time they are recorded as realized foreign currency gains (losses).
3. Futures Contracts: The fund uses index futures contracts to a limited extent, with the objective of maintaining full exposure to the stock market while maintaining liquidity. The fund may purchase or sell futures contracts to achieve a desired level of investment, whether to accommodate portfolio turnover or cash flows from capital share transactions. The primary risks associated with the use of futures contracts are imperfect correlation between changes in market values of stocks held by the fund and the prices of futures contracts, and the possibility of an illiquid market. Counterparty risk involving futures is mitigated because a regulated clearinghouse is the counterparty instead of the clearing broker. To further mitigate counterparty risk, the fund trades futures contracts on an exchange, monitors the financial strength of its clearing brokers and clearinghouse, and has entered into clearing agreements with its clearing brokers. The clearinghouse imposes initial margin requirements to secure the fund’s performance and requires daily settlement of variation margin representing changes in the market value of each contract.
24
Morgan Growth Fund
Futures contracts are valued at their quoted daily settlement prices. The notional amounts of the contracts are not recorded in the Statement of Net Assets. Fluctuations in the value of the contracts are recorded in the Statement of Net Assets as an asset (liability) and in the Statement of Operations as unrealized appreciation (depreciation) until the contracts are closed, when they are recorded as realized futures gains (losses).
During the six months ended March 31, 2018, the fund’s average investments in long and short futures contracts represented 1% and 0% of net assets, respectively, based on the average of the notional amounts at each quarter-end during the period.
4. Repurchase Agreements: The fund enters into repurchase agreements with institutional counterparties. Securities pledged as collateral to the fund under repurchase agreements are held by a custodian bank until the agreements mature, and in the absence of a default, such collateral cannot be repledged, resold, or rehypothecated. Each agreement requires that the market value of the collateral be sufficient to cover payments of interest and principal. The fund further mitigates its counterparty risk by entering into repurchase agreements only with a diverse group of prequalified counterparties, monitoring their financial strength, and entering into master repurchase agreements with its counterparties. The master repurchase agreements provide that, in the event of a counterparty’s default (including bankruptcy), the fund may terminate any repurchase agreements with that counterparty, determine the net amount owed, and sell or retain the collateral up to the net amount owed to the fund. Such action may be subject to legal proceedings, which may delay or limit the disposition of collateral.
5. Federal Income Taxes: The fund intends to continue to qualify as a regulated investment company and distribute all of its taxable income. Management has analyzed the fund’s tax positions taken for all open federal income tax years (September 30, 2014–2017), and for the period ended March 31, 2018, and has concluded that no provision for federal income tax is required in the fund’s financial statements.
6. Distributions: Distributions to shareholders are recorded on the ex-dividend date.
7. Securities Lending: To earn additional income, the fund lends its securities to qualified institutional borrowers. Security loans are subject to termination by the fund at any time, and are required to be secured at all times by collateral in an amount at least equal to the market value of securities loaned. Daily market fluctuations could cause the value of loaned securities to be more or less than the value of the collateral received. When this occurs, the collateral is adjusted and settled on the next business day. The fund further mitigates its counterparty risk by entering into securities lending transactions only with a diverse group of prequalified counterparties, monitoring their financial strength, and entering into master securities lending agreements with its counterparties. The master securities lending agreements provide that, in the event of a counterparty’s default (including bankruptcy), the fund may terminate any loans with that borrower, determine the net amount owed, and sell or retain the collateral up to the net amount owed to the fund; however, such actions may be subject to legal proceedings. While collateral mitigates counterparty risk, in the event of a default, the fund may experience delays and costs in recovering the securities loaned. The fund invests cash collateral received in Vanguard Market Liquidity Fund, and records a liability in the Statement of Net Assets for the return of the collateral, during the period the securities are on loan. Securities lending income represents fees charged to borrowers plus income earned on invested cash collateral, less expenses associated with the loan. During the term of the loan, the fund is entitled to all distributions made on or in respect of the loaned securities.
25
Morgan Growth Fund
8. Credit Facility: The fund and certain other funds managed by The Vanguard Group (“Vanguard”) participate in a $3.1 billion committed credit facility provided by a syndicate of lenders pursuant to a credit agreement that may be renewed annually; each fund is individually liable for its borrowings, if any, under the credit facility. Borrowings may be utilized for temporary and emergency purposes, and are subject to the fund’s regulatory and contractual borrowing restrictions. The participating funds are charged administrative fees and an annual commitment fee of 0.10% of the undrawn amount of the facility; these fees are allocated to the funds based on a method approved by the fund’s board of trustees and included in Management and Administrative expenses on the fund’s Statement of Operations. Any borrowings under this facility bear interest at a rate based upon the higher of the one-month London Interbank Offered Rate, federal funds effective rate, or overnight bank funding rate plus an agreed-upon spread.
The fund had no borrowings outstanding at March 31, 2018, or at any time during the period then ended.
9. Other: Dividend income is recorded on the ex-dividend date. Interest income includes income distributions received from Vanguard Market Liquidity Fund and is accrued daily. Premiums and discounts on debt securities purchased are amortized and accreted, respectively, to interest income over the lives of the respective securities. Security transactions are accounted for on the date securities are bought or sold. Costs used to determine realized gains (losses) on the sale of investment securities are those of the specific securities sold.
Each class of shares has equal rights as to assets and earnings, except that each class separately bears certain class-specific expenses related to maintenance of shareholder accounts (included in Management and Administrative expenses), shareholder reporting, and the proxy. Marketing and distribution expenses are allocated to each class of shares based on a method approved by the board of trustees. Income, other non-class-specific expenses, and gains and losses on investments are allocated to each class of shares based on its relative net assets.
B. The investment advisory firms Wellington Management Company LLP , Jennison Associates LLC, and Frontier Capital Management Co., LLC, each provide investment advisory services to a portion of the fund for a fee calculated at an annual percentage rate of average net assets managed by the advisor. The basic fee of Wellington Management Company LLP is subject to quarterly adjustments based on performance relative to the Russell 3000 Growth Index for the preceding three years. The basic fee of Jennison Associates LLC is subject to quarterly adjustments based on performance relative to the Russell 1000 Growth Index for the preceding three years. The basic fee of Frontier Capital Management Co., LLC, is subject to quarterly adjustments based on performance relative to the Russell Midcap Growth Index for the preceding three years.
Vanguard provides investment advisory services to a portion of the fund as described below; the fund paid Vanguard advisory fees of $577,000 for the six months ended March 31, 2018.
For the six months ended March 31, 2018, the aggregate investment advisory fee paid to all advisors represented an effective annual basic rate of 0.15% of the fund’s average net assets, before a net increase of $974,000 (0.01%) based on performance.
C. In accordance with the terms of a Funds’ Service Agreement (the “FSA”) between Vanguard and the fund, Vanguard furnishes to the fund investment advisory, corporate management, administrative, marketing, and distribution services at Vanguard’s cost of operations (as defined by the FSA). These costs of operations are allocated to the fund based on methods and guidelines approved by the board of trustees. Vanguard does not require reimbursement in the current period
26
Morgan Growth Fund
for certain costs of operations (such as deferred compensation/benefits and risk/insurance costs); the fund’s liability for these costs of operations is included in Payables to Vanguard on the Statement of Net Assets. All other costs of operations payable to Vanguard are generally settled twice a month.
Upon the request of Vanguard, the fund may invest up to 0.40% of its net assets as capital in Vanguard. At March 31, 2018, the fund had contributed to Vanguard capital in the amount of $785,000 representing 0.01% of the fund’s net assets and 0.31% of Vanguard’s capitalization. The fund’s trustees and officers are also directors and employees, respectively, of Vanguard.
D. The fund has asked its investment advisors to direct certain security trades, subject to obtaining the best price and execution, to brokers who have agreed to rebate to the fund part of the commissions generated. Such rebates are used solely to reduce the fund’s management and administrative expenses. The fund’s custodian bank has also agreed to reduce its fees when the fund maintains cash on deposit in the non-interest-bearing custody account. For the six months ended March 31, 2018, these arrangements reduced the fund’s management and administrative expenses by $202,000 and custodian fees by $2,000. The total expense reduction represented an effective annual rate of 0.00% of the fund’s average net assets.
E. Various inputs may be used to determine the value of the fund’s investments. These inputs are summarized in three broad levels for financial statement purposes. The inputs or methodologies used to value securities are not necessarily an indication of the risk associated with investing in those securities.
Level 1—Quoted prices in active markets for identical securities.
Level 2—Other significant observable inputs (including quoted prices for similar securities, interest rates, prepayment speeds, credit risk, etc.).
Level 3—Significant unobservable inputs (including the fund’s own assumptions used to determine the fair value of investments). Any investments valued with significant unobservable inputs are noted on the Statement of Net Assets.
The following table summarizes the market value of the fund’s investments as of March 31, 2018, based on the inputs used to value them:
| | | |
| | Level 1 | Level 2 | Level 3 |
| Investments | ($000) | ($000) | ($000) |
| Common Stocks | 13,768,993 | 219,539 | — |
| Temporary Cash Investments | 298,221 | 45,554 | — |
| Futures Contracts—Assets1 | 2,903 | — | — |
| Total | 14,070,117 | 265,093 | — |
| 1 Represents variation margin on the last day of the reporting period. | | | |
F. Distributions are determined on a tax basis and may differ from net investment income and realized capital gains for financial reporting purposes. Differences may be permanent or temporary. Permanent differences are reclassified among capital accounts in the financial statements to reflect their tax character. Temporary differences arise when certain items of income, expense, gain, or loss are recognized in different periods for financial statement and tax purposes. These differences will reverse at some time in the future. Differences in classification may also result from the treatment of short-term gains as ordinary income for tax purposes. The fund’s tax-basis capital gains and losses are determined only at the end of each fiscal year.
27
Morgan Growth Fund
At March 31, 2018, the cost of investment securities for tax purposes was $9,411,720,000. Net unrealized appreciation of investment securities for tax purposes was $4,920,587,000, consisting of unrealized gains of $5,051,547,000 on securities that had risen in value since their purchase and $130,960,000 in unrealized losses on securities that had fallen in value since their purchase.
G. During the six months ended March 31, 2018, the fund purchased $3,452,568,000 of investment securities and sold $3,181,066,000 of investment securities, other than temporary cash investments
H. Capital share transactions for each class of shares were:
| | | | |
| | Six Month Ended | | Year Ended |
| | March 31, 2018 | September 30, 2017 |
| | Amount | Shares | Amount | Shares |
| | ($000) | (000) | ($000) | (000) |
| Investor Shares | | | | |
| Issued | 488,813 | 15,944 | 389,859 | 14,339 |
| Issued in Lieu of Cash Distributions | 311,810 | 10,563 | 207,382 | 8,416 |
| Redeemed | (768,548) | (25,021) | (1,088,564) | (40,543) |
| Net Increase (Decrease)—Investor Shares | 32,075 | 1,486 | (491,323) | (17,788) |
| Admiral Shares | | | | |
| Issued | 1,282,005 | 13,465 | 1,161,157 | 13,763 |
| Issued in Lieu of Cash Distributions | 664,366 | 7,259 | 352,218 | 4,614 |
| Redeemed | (865,874) | (9,118) | (1,010,317) | (12,291) |
| Net Increase (Decrease)—Admiral Shares | 1,080,497 | 11,606 | 503,058 | 6,086 |
I. Transactions during the period in investments where the issuer is another member of The Vanguard Group were as follows:
| | | | | | | | |
| | | | | | Current Period Transactions | |
| | Sept. 30, | | Proceeds Realized | | | | March 31, |
| | 2017 | | from | Net | Change in | | Capital Gain | 2018 |
| | Market | Purchases | Securities | Gain | Unrealized | | Distributions | Market |
| | Value | at Cost | Sold | (Loss) | App. (Dep.) | Income | Received | Value |
| | ($000) | ($000) | ($000) | ($000) | ($000) | ($000) | ($000) | ($000) |
| Vanguard | | | | | | | | |
| Growth ETF | 129,418 | — | — | — | 8,901 | 814 | — | 138,319 |
| Vanguard Market | | | | | | | | |
| Liquidity Fund | 388,722 | NA1 | NA1 | (54) | (10) | 1,846 | — | 298,221 |
| Total | 518,140 | — | — | (54) | 8,891 | 2,660 | — | 436,540 |
1 Not applicable—purchases and sales are for temporary cash investment purposes.
J. Management has determined that no material events or transactions occurred subsequent to March 31, 2018, that would require recognition or disclosure in these financial statements.
28
About Your Fund’s Expenses
As a shareholder of the fund, you incur ongoing costs, which include costs for portfolio management, administrative services, and shareholder reports (like this one), among others. Operating expenses, which are deducted from a fund’s gross income, directly reduce the investment return of the fund.
A fund’s expenses are expressed as a percentage of its average net assets. This figure is known as the expense ratio. The following examples are intended to help you understand the ongoing costs (in dollars) of investing in your fund and to compare these costs with those of other mutual funds. The examples are based on an investment of $1,000 made at the beginning of the period shown and held for the entire period.
The accompanying table illustrates your fund’s costs in two ways:
• Based on actual fund return. This section helps you to estimate the actual expenses that you paid over the period. The ”Ending Account Value“ shown is derived from the fund‘s actual return, and the third column shows the dollar amount that would have been paid by an investor who started with $1,000 in the fund. You may use the information here, together with the amount you invested, to estimate the expenses that you paid over the period.
To do so, simply divide your account value by $1,000 (for example, an $8,600 account value divided by $1,000 = 8.6), then multiply the result by the number given for your fund under the heading ”Expenses Paid During Period.“
• Based on hypothetical 5% yearly return. This section is intended to help you compare your fund‘s costs with those of other mutual funds. It assumes that the fund had a yearly return of 5% before expenses, but that the expense ratio is unchanged. In this case—because the return used is not the fund’s actual return—the results do not apply to your investment. The example is useful in making comparisons because the Securities and Exchange Commission requires all mutual funds to calculate expenses based on a 5% return. You can assess your fund’s costs by comparing this hypothetical example with the hypothetical examples that appear in shareholder reports of other funds.
Note that the expenses shown in the table are meant to highlight and help you compare ongoing costs only and do not reflect transaction costs incurred by the fund for buying and selling securities. Further, the expenses do not include any purchase, redemption, or account service fees described in the fund prospectus. If such fees were applied to your account, your costs would be higher. Your fund does not carry a “sales load.”
The calculations assume no shares were bought or sold during the period. Your actual costs may have been higher or lower, depending on the amount of your investment and the timing of any purchases or redemptions.
You can find more information about the fund’s expenses, including annual expense ratios, in the Financial Statements section of this report. For additional information on operating expenses and other shareholder costs, please refer to your fund’s current prospectus.
29
| | | |
| Six Months Ended March 31, 2018 | | | |
| | Beginning | Ending | Expenses |
| | Account Value | Account Value | Paid During |
| Morgan Growth Fund | 9/30/2017 | 3/31/2018 | Period |
| Based on Actual Fund Return | | | |
| Investor Shares | $1,000.00 | $1,093.85 | $2.04 |
| Admiral Shares | 1,000.00 | 1,094.34 | 1.51 |
| Based on Hypothetical 5% Yearly Return | | | |
| Investor Shares | $1,000.00 | $1,022.99 | $1.97 |
| Admiral Shares | 1,000.00 | 1,023.49 | 1.46 |
The calculations are based on expenses incurred in the most recent six-month period. The fund’s annualized six-month expense ratios for that period are 0.39% for Investor Shares and 0.29% for Admiral Shares. The dollar amounts shown as “Expenses Paid” are equal to the annualized expense ratio multiplied by the average account value over the period, multiplied by the number of days in the most recent six-month period, then divided by the number of days in the most recent 12-month period (182/365).
30
Trustees Approve Advisory Arrangements
The board of trustees of Vanguard Morgan Growth Fund has renewed the fund’s investment advisory arrangements with Frontier Capital Management Co., LLC (Frontier), Jennison Associates LLC (Jennison), Wellington Management Company LLP (Wellington Management), and The Vanguard Group, Inc. (Vanguard), through its Quantitative Equity Group. The board determined that renewing the fund’s advisory arrangements was in the best interests of the fund and its shareholders.
The board based its decisions upon an evaluation of each advisor’s investment staff, portfolio management process, and performance. This evaluation included information provided to the board by Vanguard’s Portfolio Review Department, which is responsible for fund and advisor oversight and product management. The Portfolio Review Department met regularly with the advisors and made monthly presentations to the board during the fiscal year that directed the board’s focus to relevant information and topics.
The board, or an investment committee made up of board members, also received information throughout the year during advisor presentations. For each advisor presentation, the board was provided with letters and reports that included information about, among other things, the advisory firm and the advisor’s assessment of the investment environment, portfolio performance, and portfolio characteristics.
In addition, the board received monthly reports, which included a Market and Economic Report, a Fund Dashboard Monthly Summary, and a Fund Performance Report.
Prior to their meeting, the trustees were provided with a memo and materials that summarized the information they received over the course of the year. They also considered the factors discussed below, among others. However, no single factor determined whether the board approved the arrangements. Rather, it was the totality of the circumstances that drove the board’s decisions.
Nature, extent, and quality of services
The board reviewed the quality of the fund’s investment management services over both the short and long term and took into account the organizational depth and stability of each advisor. The board considered the following:
Frontier. Founded in 1980, Frontier employs a fundamental, research-intensive investment approach focused on small- and mid-sized companies. The advisor’s bottom-up, collaborative investment approach seeks to identify companies with a combination of superior growth potential and attractive valuation. Frontier’s investment process emphasizes companies with understandable business models, good franchises, accelerating sales and margins, and healthy balance sheets, ideally seeking companies that can grow earnings in multiple ways. Analysts regularly interact with management and other companies in the supply chain. Frontier has managed a portion of the fund since 2008.
Jennison. Founded in 1969, Jennison is an indirect, wholly owned subsidiary of Prudential Financial, Inc. The firm currently oversees a wide range of equity and fixed income strategies. The investment team at Jennison uses internal fundamental research and a highly interactive bottom-up stock selection process to identify companies that exhibit above-average growth in units, revenues, earnings, and cash flows. When analyzing a company for purchase or sale, the analysis focuses on the duration of the growth opportunity and seeks to capture inflection points in the company’s growth. Jennison has managed a portion of the fund since 2007.
31
Wellington Management. Founded in 1928, Wellington Management is among the nation’s oldest and most respected institutional investment managers. The investment team at Wellington Management seeks to create a portfolio with balanced exposure to growth, quality, and valuation in an attempt to deliver consistent results over time. Bottom-up fundamental research focuses on large- and mid-capitalization companies with a proven record of sales and earnings growth, profitability, and cash-flow generation. This research seeks to incorporate multiple projections of future revenue and cash flow growth to avoid overreliance on any single data point. Wellington Management has advised the fund since 1968.
Vanguard. Vanguard has been managing investments for more than three decades. The Quantitative Equity Group adheres to a sound, disciplined investment management process; the team has considerable experience, stability, and depth. Vanguard has managed a portion of the fund since 1993.
The board concluded that each advisor’s experience, stability, depth, and performance, among other factors, warranted continuation of the advisory arrangements.
Investment performance
The board considered the short- and long-term performance of the fund and each advisor, including any periods of outperformance or underperformance compared with a relevant benchmark index and peer group. The board concluded that the performance was such that each advisory arrangement should continue. Information about the fund’s most recent performance can be found in the Performance Summary section of this report.
Cost
The board concluded that the fund’s expense ratio was well below the average expense ratio charged by funds in its peer group and that the fund’s advisory expense rates were also well below its peer-group average. Information about the fund’s expenses appears in the About Your Fund’s Expenses section of this report as well as in the Financial Statements section, which also includes information about the fund’s advisory expense rates.
The board did not consider the profitability of Frontier, Jennison, and Wellington Management in determining whether to approve the advisory fees, because the firms are independent of Vanguard and the advisory fees are the result of arm’s-length negotiations. The board does not conduct a profitability analysis of Vanguard because of Vanguard’s unique “at-cost” structure. Unlike most other mutual fund management companies, Vanguard is owned by the funds it oversees and produces “profits” only in the form of reduced expenses for fund shareholders.
The benefit of economies of scale
The board concluded that the fund’s shareholders benefit from economies of scale because of breakpoints in the advisory fee schedules for Frontier, Jennison, and Wellington Management.
The breakpoints reduce the effective rate of the fees as the fund’s assets managed by each advisor increase. The board also concluded that the fund’s at-cost arrangement with Vanguard ensures that the fund will realize economies of scale as it grows, with the cost to shareholders declining as fund assets managed by Vanguard increase.
The board will consider whether to renew the advisory arrangements again after a one-year period.
32
Glossary
30-Day SEC Yield. A fund’s 30-day SEC yield is derived using a formula specified by the U.S. Securities and Exchange Commission. Under the formula, data related to the fund’s security holdings in the previous 30 days are used to calculate the fund’s hypothetical net income for that period, which is then annualized and divided by the fund’s estimated average net assets over the calculation period. For the purposes of this calculation, a security’s income is based on its current market yield to maturity (for bonds), its actual income (for asset-backed securities), or its projected dividend yield (for stocks). Because the SEC yield represents hypothetical annualized income, it will differ—at times significantly—from the fund’s actual experience. As a result, the fund’s income distributions may be higher or lower than implied by the SEC yield.
Beta. A measure of the magnitude of a fund’s past share-price fluctuations in relation to the ups and downs of a given market index. The index is assigned a beta of 1.00. Compared with a given index, a fund with a beta of 1.20 typically would have seen its share price rise or fall by 12% when the index rose or fell by 10%. For this report, beta is based on returns over the past 36 months for both the fund and the index. Note that a fund’s beta should be reviewed in conjunction with its R-squared (see definition). The lower the R-squared, the less correlation there is between the fund and the index, and the less reliable beta is as an indicator of volatility.
Dividend Yield. Dividend income earned by stocks, expressed as a percentage of the aggregate market value (or of net asset value, for a fund). The yield is determined by dividing the amount of the annual dividends by the aggregate value (or net asset value) at the end of the period. For a fund, the dividend yield is based solely on stock holdings and does not include any income produced by other investments.
Earnings Growth Rate. The average annual rate of growth in earnings over the past five years for the stocks now in a fund.
Equity Exposure. A measure that reflects a fund’s investments in stocks and stock futures. Any holdings in short-term reserves are excluded.
Expense Ratio. A fund’s total annual operating expenses expressed as a percentage of the fund’s average net assets. The expense ratio includes management and administrative expenses, but does not include the transaction costs of buying and selling portfolio securities.
Foreign Holdings. The percentage of a fund represented by securities or depositary receipts of companies based outside the United States.
Inception Date. The date on which the assets of a fund (or one of its share classes) are first invested in accordance with the fund’s investment objective. For funds with a subscription period, the inception date is the day after that period ends. Investment performance is measured from the inception date.
Median Market Cap. An indicator of the size of companies in which a fund invests; the midpoint of market capitalization (market price x shares outstanding) of a fund’s stocks, weighted by the proportion of the fund’s assets invested in each stock. Stocks representing half of the fund’s assets have market capitalizations above the median, and the rest are below it.
Price/Book Ratio. The share price of a stock divided by its net worth, or book value, per share.
For a fund, the weighted average price/book ratio of the stocks it holds.
33
Price/Earnings Ratio. The ratio of a stock’s current price to its per-share earnings over the past year. For a fund, the weighted average P/E of the stocks it holds. P/E is an indicator of market expectations about corporate prospects; the higher the P/E, the greater the expectations for a company’s future growth.
R-Squared. A measure of how much of a fund’s past returns can be explained by the returns from the market in general, as measured by a given index. If a fund’s total returns were precisely synchronized with an index’s returns, its R-squared would be 1.00. If the fund’s returns bore no relationship to the index’s returns, its R-squared would be 0. For this report, R-squared is based on returns over the past 36 months for both the fund and the index.
Return on Equity. The annual average rate of return generated by a company during the past five years for each dollar of shareholder’s equity (net income divided by shareholder’s equity). For a fund, the weighted average return on equity for the companies whose stocks it holds.
Short-Term Reserves. The percentage of a fund invested in highly liquid, short-term securities that can be readily converted to cash.
Turnover Rate. An indication of the fund’s trading activity. Funds with high turnover rates incur higher transaction costs and may be more likely to distribute capital gains (which may be taxable to investors). The turnover rate excludes in-kind transactions, which have minimal impact on costs.
34
The Global Industry Classification Standard (“GICS”) was developed by and is the exclusive property and a service mark of MSCI Inc. (“MSCI”) and Standard and Poor’s, a division of McGraw-Hill Companies, Inc. (“S&P”), and is licensed for use by Vanguard. Neither MSCI, S&P nor any third party involved in making or compiling the GICS or any GICS classification makes any express or implied warranties or representations with respect to such standard or classification (or the results to be obtained by the use thereof), and all such parties hereby expressly disclaim all warranties of originality, accuracy, completeness, merchantability or fitness for a particular purpose with respect to any such standard or classification. Without limiting any of the foregoing, in no event shall MSCI, S&P, any of its affiliates or any third party involved in making or compiling the GICS or any GICS classification have any liability for any direct, indirect, special, punitive, consequential or any other damages (including lost profits) even if notified of the possibility of such damages.
35
This page intentionally left blank.
This page intentionally left blank.
This page intentionally left blank.
The People Who Govern Your Fund
The trustees of your mutual fund are there to see that the fund is operated and managed in your best interests since, as a shareholder, you are a part owner of the fund. Your fund’s trustees also serve on the board of directors of The Vanguard Group, Inc., which is owned by the Vanguard funds and provides services to them on an at-cost basis.
A majority of Vanguard’s board members are independent, meaning that they have no affiliation with Vanguard or the funds they oversee, apart from the sizable personal investments they have made as private individuals. The independent board members have distinguished backgrounds in business, academia, and public service. Each of the trustees and executive officers oversees 208 Vanguard funds.
Information for each trustee and executive officer of the fund appears below. The mailing address of the trustees and officers is P.O. Box 876, Valley Forge, PA 19482. More information about the trustees is in the Statement of Additional Information, which can be obtained, without charge, by contacting Vanguard at 800-662-7447, or online at vanguard.com.
Interested Trustees1
F. William McNabb III
Born in 1957. Trustee since July 2009. Principal occupation(s) during the past five years and other experience: chairman of the board (January 2010–present) of Vanguard and of each of the investment companies served by Vanguard, trustee (2009–present) of each of the investment companies served by Vanguard, and director (2008–present) of Vanguard. Chief executive officer and president (2008–2017) of Vanguard and each of the investment companies served by Vanguard, managing director (1995–2008) of Vanguard, and director (1997–2018) of Vanguard Marketing Corporation. Director (2018–present) of UnitedHealth Group.
Mortimer J. Buckley
Born in 1969. Trustee since January 2018. Principal occupation(s) during the past five years and other experience: chief executive officer (January 2018–present) of Vanguard; chief executive officer, president, and trustee (January 2018–present) of each of the investment companies served by Vanguard; president and director (2017–present) of Vanguard; and president (February 2018–present) of Vanguard Marketing Corporation. Chief investment officer (2013–2017), managing director (2002–2017), head of the Retail Investor Group (2006–2012), and chief information officer (2001–2006) of Vanguard. Chairman of the board (2011–2017) of the Children’s Hospital of Philadelphia.
Independent Trustees
Emerson U. Fullwood
Born in 1948. Trustee since January 2008. Principal occupation(s) during the past five years and other experience: executive chief staff and marketing officer for North America and corporate vice president (retired 2008) of Xerox Corporation (document management products and services). Former president of the Worldwide Channels Group, Latin America, and Worldwide Customer Service and executive chief staff officer of Developing Markets of Xerox. Executive in residence and 2009–2010 Distinguished Minett Professor at the Rochester Institute of Technology. Lead director of SPX FLOW, Inc. (multi-industry manufacturing). Director of the University of Rochester Medical Center, the Monroe Community College Foundation, the United Way of Rochester, North Carolina A&T University, and Roberts Wesleyan College. Trustee of the University of Rochester.
Amy Gutmann
Born in 1949. Trustee since June 2006. Principal occupation(s) during the past five years and other experience: president (2004–present) of the University of Pennsylvania. Christopher H. Browne Distinguished Professor of Political Science, School of Arts and Sciences, and professor of communication, Annenberg School for Communication, with secondary faculty appointments in the Department of Philosophy, School of Arts and Sciences, and at the Graduate School of Education, University of Pennsylvania. Trustee of the National Constitution Center.
1 Mr. McNabb and Mr. Buckley are considered “interested persons,” as defined in the Investment Company Act of 1940, because they are officers of the Vanguard funds.
JoAnn Heffernan Heisen
Born in 1950. Trustee since July 1998. Principal occupation(s) during the past five years and other experience: corporate vice president of Johnson & Johnson (pharmaceuticals/medical devices/consumer products) and member of its executive committee (1997–2008). Chief global diversity officer (retired 2008), vice president and chief information officer (1997–2006), controller (1995–1997), treasurer (1991–1995), and assistant treasurer (1989–1991) of Johnson & Johnson. Director of Skytop Lodge Corporation (hotels) and the Robert Wood Johnson Foundation. Member of the advisory board of the Institute for Women’s Leadership at Rutgers University.
F. Joseph Loughrey
Born in 1949. Trustee since October 2009. Principal occupation(s) during the past five years and other experience: president and chief operating officer (retired 2009) and vice chairman of the board (2008–2009) of Cummins Inc. (industrial machinery). Chairman of the board of Hillenbrand, Inc. (specialized consumer services), Oxfam America, and the Lumina Foundation for Education. Director of the V Foundation for Cancer Research. Member of the advisory council for the College of Arts and Letters and chair of the advisory board to the Kellogg Institute for International Studies, both at the University of Notre Dame.
Mark Loughridge
Born in 1953. Trustee since March 2012. Principal occupation(s) during the past five years and other experience: senior vice president and chief financial officer (retired 2013) of IBM (information technology services). Fiduciary member of IBM’s Retirement Plan Committee (2004–2013), senior vice president and general manager (2002–2004) of IBM Global Financing, vice president and controller (1998–2002) of IBM, and a variety of other prior management roles at IBM. Member of the Council on Chicago Booth.
Scott C. Malpass
Born in 1962. Trustee since March 2012. Principal occupation(s) during the past five years and other experience: chief investment officer (1989–present) and vice president (1996–present) of the University of Notre Dame. Assistant professor of finance at the Mendoza College of Business, University of Notre Dame, and member of the Notre Dame 403(b) Investment Committee. Chairman of the board of TIFF Advisory Services, Inc. Member of the board of Catholic Investment Services, Inc. (investment advisors), the board of advisors for Spruceview Capital Partners, and the board of superintendence of the Institute for the Works of Religion.
Deanna Mulligan
Born in 1963. Trustee since January 2018. Principal occupation(s) during the past five years and other experience: president (2010–present) and chief executive officer (2011–present) of The Guardian Life Insurance Company of America. Chief operating officer (2010–2011) and executive vice president (2008–2010) of Individual Life and Disability of The Guardian Life Insurance Company of America. Member of the board of The Guardian Life Insurance Company of America, the American Council of Life Insurers, the Partnership for New York City (business leadership), and the Committee Encouraging Corporate Philanthropy. Trustee of the Economic Club of New York and the Bruce Museum (arts and science). Member of the Advisory Council for the Stanford Graduate School of Business.
André F. Perold
Born in 1952. Trustee since December 2004. Principal occupation(s) during the past five years and other experience: George Gund Professor of Finance and Banking, Emeritus at the Harvard Business School (retired 2011). Chief investment officer and co-managing partner of HighVista Strategies LLC (private investment firm). Overseer of the Museum of Fine Arts Boston.
Sarah Bloom Raskin
Born in 1961. Trustee since January 2018. Principal occupation(s) during the past five years and other experience: deputy secretary (2014–2017) of the United States Department of the Treasury. Governor (2010–2014) of the Federal Reserve Board. Commissioner (2007–2010) of financial regulation for the State of Maryland. Member of the board of directors (2012–2014) of Neighborhood Reinvestment Corporation. Director of i(x) Investments, LLC.
Peter F. Volanakis
Born in 1955. Trustee since July 2009. Principal occupation(s) during the past five years and other experience: president and chief operating officer (retired 2010) of Corning Incorporated (communications equipment) and director of Corning Incorporated (2000–2010) and Dow Corning (2001–2010). Director (2012) of SPX Corporation (multi-industry manufacturing). Overseer of the Amos Tuck School of Business Administration, Dartmouth College (2001–2013). Chairman of the board of trustees of Colby-Sawyer College. Member of the Board of Hypertherm Inc. (industrial cutting systems, software, and consumables).
Executive Officers
Glenn Booraem
Born in 1967. Principal occupation(s) during the past five years and other experience: principal of Vanguard. Investment stewardship officer (2017–present), treasurer (2015–2017), controller (2010–2015), and assistant controller (2001–2010) of each of the investment companies served by Vanguard.
Christine M. Buchanan
Born in 1970. Principal occupation(s) during the past five years and other experience: principal of Vanguard and global head of Fund Administration at Vanguard. Treasurer (2017–present) of each of the investment companies served by Vanguard. Partner (2005–2017) at KPMG LLP (audit, tax, and advisory services).
Brian Dvorak
Born in 1973. Principal occupation(s) during the past five years and other experience: principal of Vanguard. Chief compliance officer (2017–present) of Vanguard and each of the investment companies served by Vanguard. Assistant vice president (2017–present) of Vanguard Marketing Corporation. Vice president and director of Enterprise Risk Management (2011–2013) at Oppenheimer Funds, Inc.
Thomas J. Higgins
Born in 1957. Principal occupation(s) during the past five years and other experience: principal of Vanguard. Chief financial officer (2008–present) and treasurer (1998–2008) of each of the investment companies served by Vanguard.
Peter Mahoney
Born in 1974. Principal occupation(s) during the past five years and other experience: principal of Vanguard. Controller (2015–present) of each of the investment companies served by Vanguard. Head of International Fund Services (2008–2014) at Vanguard.
Anne E. Robinson
Born in 1970. Principal occupation(s) during the past five years and other experience: general counsel (2016–present) of Vanguard. Secretary (2016–present) of Vanguard and of each of the investment companies served by Vanguard. Managing director (2016–present) of Vanguard. Director and senior vice president (2016–2018) of Vanguard Marketing Corporation. Managing director and general counsel of Global Cards and Consumer Services (2014–2016) at Citigroup. Counsel (2003–2014) at American Express.
Michael Rollings
Born in 1963. Principal occupation(s) during the past five years and other experience: finance director (2017–present) and treasurer (2017) of each of the investment companies served by Vanguard. Managing director (2016–present) of Vanguard. Chief financial officer (2016–present) of Vanguard. Director (2016–present) of Vanguard Marketing Corporation. Executive vice president and chief financial officer (2006–2016) of MassMutual Financial Group.
Vanguard Senior Management Team | |
Mortimer J. Buckley Gregory Davis John James Martha G. King John T. Marcante Chris D. McIsaac | James M. Norris Thomas M. Rampulla Karin A. Risi Anne E. Robinson Michael Rollings |
Chairman Emeritus and Senior Advisor
John J. Brennan
Chairman, 1996–2009
Chief Executive Officer and President, 1996–2008
Founder
John C. Bogle
Chairman and Chief Executive Officer, 1974–1996

| |
| | P.O. Box 2600 |
| | Valley Forge, PA 19482-2600 |
| |
| |
| |
| Connect with Vanguard® > vanguard.com |
| |
| |
| |
| Fund Information > 800-662-7447 | Source for Bloomberg Barclays indexes: Bloomberg |
| Direct Investor Account Services > 800-662-2739 | Index Services Limited. Copyright 2018, Bloomberg. All |
| | rights reserved. |
| Institutional Investor Services > 800-523-1036 | |
| | CFA® is a registered trademark owned by CFA Institute. |
| Text Telephone for People | |
| Who Are Deaf or Hard of Hearing > 800-749-7273 | |
| |
| This material may be used in conjunction | |
| with the offering of shares of any Vanguard | |
| fund only if preceded or accompanied by | |
| the fund’s current prospectus. | |
| |
| All comparative mutual fund data are from Lipper, a | |
| Thomson Reuters Company, or Morningstar, Inc., unless | |
| otherwise noted. | |
| |
| You can obtain a free copy of Vanguard’s proxy voting | |
| guidelines by visiting vanguard.com/proxyreporting or by | |
| calling Vanguard at 800-662-2739. The guidelines are | |
| also available from the SEC’s website, sec.gov. In | |
| addition, you may obtain a free report on how your fund | |
| voted the proxies for securities it owned during the 12 | |
| months ended June 30. To get the report, visit either | |
| vanguard.com/proxyreporting or sec.gov. | |
| |
| You can review and copy information about your fund at | |
| the SEC’s Public Reference Room in Washington, D.C. To | |
| find out more about this public service, call the SEC at | |
| 202-551-8090. Information about your fund is also | |
| available on the SEC’s website, and you can receive | |
| copies of this information, for a fee, by sending a | |
| request in either of two ways: via email addressed to | |
| publicinfo@sec.gov or via regular mail addressed to the | |
| Public Reference Section, Securities and Exchange | |
| Commission, Washington, DC 20549-1520. | |
| | © 2018 The Vanguard Group, Inc. |
| | All rights reserved. |
| | Vanguard Marketing Corporation, Distributor. |
| |
| | Q262 052018 |
Item 2: Code of Ethics.
Not Applicable.
Item 3: Audit Committee Financial Expert.
Not Applicable.
Item 4: Principal Accountant Fees and Services.
(a) Audit Fees.
Not Applicable.
Item 5: Audit Committee of Listed Registrants.
Not Applicable.
Item 6: Investments.
Not Applicable.
Item 7: Disclosure of Proxy Voting Policies and Procedures for Closed-End Management Investment Companies.
Not Applicable.
Item 8: Portfolio Managers of Closed-End Management Investment Companies.
Not Applicable.
Item 9: Purchase of Equity Securities by Closed-End Management Investment Company and Affiliated Purchasers.
Not Applicable.
Item 10: Submission of Matters to a Vote of Security Holders.
Not Applicable.
Item 11: Controls and Procedures.
(a) Disclosure Controls and Procedures. The Principal Executive and Financial Officers concluded that the Registrant’s Disclosure Controls and Procedures are effective based on their evaluation of the Disclosure Controls and Procedures as of a date within 90 days of the filing date of this report.
(b) Internal Control Over Financial Reporting. There were no significant changes in Registrant’s Internal Control Over Financial Reporting or in other factors that could significantly affect this control subsequent to the date of the evaluation, including any corrective actions with regard to significant deficiencies and material weaknesses.
Item 12: Disclosure of Securities Lending Activities for Closed-End Management Investment Companies.
Not Applicable.
Item 13: Exhibits.
(a) Certifications.
Pursuant to the requirements of the Securities Exchange Act of 1934 and the Investment Company Act of 1940, the registrant has duly caused this report to be signed on its behalf by the undersigned, thereunto duly authorized.
VANGUARD MORGAN GROWTH FUND |
| BY: | /s/ MORTIMER J. BUCKLEY* |
| MORTIMER J. BUCKLEY
CHIEF EXECUTIVE OFFICER |
Date: May 17, 2018
Pursuant to the requirements of the Securities Exchange Act of 1934 and the Investment Company Act of 1940, this report has been signed below by the following persons on behalf of the registrant and in the capacities and on the dates indicated.
VANGUARD MORGAN GROWTH FUND |
| BY: | /s/ MORTIMER J. BUCKLEY* |
| MORTIMER J. BUCKLEY
CHIEF EXECUTIVE OFFICER |
Date: May 17, 2018
VANGUARD MORGAN GROWTH FUND |
| BY: | /s/ THOMAS J. HIGGINS* |
| THOMAS J. HIGGINS
CHIEF FINANCIAL OFFICER |
Date: May 17, 2018
* By: /s/ Anne E. Robinson
Anne E. Robinson, pursuant to a Power of Attorney filed on January 18, 2018 see file Number 33-32216, Incorporated by Reference.