UNITED STATES
SECURITIES AND EXCHANGE COMMISSION
Washington, D.C. 20549
FORM N-CSR
CERTIFIED SHAREHOLDER REPORT OF
REGISTERED MANAGEMENT INVESTMENT COMPANIES
Investment Company Act file number: 811-01685
Name of Registrant: Vanguard Morgan Growth Fund
Address of Registrant:
P.O. Box 2600
Valley Forge, PA 19482
Name and address of agent for service:
Heidi Stam, Esquire
P.O. Box 876
Valley Forge, PA 19482
Registrant’s telephone number, including area code: (610) 669-1000
Date of fiscal year end: September 30
Date of reporting period: October 1, 2014 – March 31, 2015
Item 1: Reports to Shareholders
Semiannual Report | March 31, 2015
Vanguard Morgan™ Growth Fund
The mission continues
On May 1, 1975, Vanguard began operations, a fledgling company based on the simple but revolutionary idea that a mutual fund company should be managed solely in the interest of its investors.
Four decades later, that revolutionary spirit continues to animate the enterprise. Vanguard remains on a mission to give investors the best chance of investment success.
As we mark our 40th anniversary, we thank you for entrusting your assets to Vanguard and giving us the opportunity to help you reach your financial goals in the decades to come.
| |
| Contents | |
| Your Fund’s Total Returns. | 1 |
| Chairman’s Letter. | 2 |
| Advisors’ Report. | 7 |
| Fund Profile. | 12 |
| Performance Summary. | 13 |
| Financial Statements. | 14 |
| About Your Fund’s Expenses. | 29 |
| Trustees Approve Advisory Arrangements. | 31 |
| Glossary. | 33 |
Please note: The opinions expressed in this report are just that—informed opinions. They should not be considered promises or advice. Also, please keep in mind that the information and opinions cover the period through the date on the front of this report. Of course, the risks of investing in your fund are spelled out in the prospectus.
See the Glossary for definitions of investment terms used in this report.
About the cover: Since our founding, Vanguard has drawn inspiration from the enterprise and valor demonstrated by British naval hero Horatio Nelson and his command at the Battle of the Nile in 1798. The photograph displays a replica of a merchant ship from the same era as Nelson’s flagship, the HMS Vanguard.
| | | | |
| Your Fund’s Total Returns | | | | |
| |
| |
| |
| |
| Six Months Ended March 31, 2015 | | | | |
| | | | | Total |
| | | | | Returns |
| Vanguard Morgan Growth Fund | | | | |
| Investor Shares | | | | 9.73% |
| Admiral™ Shares | | | | 9.78 |
| Russell 3000 Growth Index | | | | 9.43 |
| Multi-Cap Growth Funds Average | | | | 8.85 |
| Multi-Cap Growth Funds Average: Derived from data provided by Lipper, a Thomson Reuters Company. | | |
| Admiral Shares carry lower expenses and are available to investors who meet certain account-balance requirements. | |
| |
| Your Fund’s Performance at a Glance | | | | |
| September 30, 2014, Through March 31, 2015 | | | | |
| | | | Distributions Per Share |
| | Starting | Ending | Income | Capital |
| | Share Price | Share Price | Dividends | Gains |
| Vanguard Morgan Growth Fund | | | | |
| Investor Shares | $27.07 | $26.49 | $0.191 | $2.825 |
| Admiral Shares | 83.97 | 82.08 | 0.727 | 8.750 |
1

Chairman’s Letter
Dear Shareholder,
Growth stocks generally prospered over the six months ended March 31, 2015, and your fund’s advisors capitalized on the trend. Vanguard Morgan Growth Fund returned 9.73% for Investor Shares and 9.78% for the lower-cost Admiral Shares. That compares with the 9.43% return of the benchmark, the Russell 3000 Growth Index, and the 8.85% average return of multi-capitalization growth funds.
The fund’s result also exceeded that of the broad stock market, as growth stocks were very much in favor with investors. The return of the Russell 3000 Growth Index was almost double that of the Russell 3000 Value Index.
Driving the advance was the health care sector, which got a boost from mergers and acquisitions. Health care stocks were a strong point for the fund as well, more than offsetting weakness in the energy sector.
The Fed’s cautious approach was favorable for U.S. stocks
The broad U.S. stock market returned about 7% for the six months. Stocks were resilient after declining markedly at the start of the period and enduring bouts of turmoil in subsequent months. Investors’ concerns included the strength of thedollar and how that would affect the profits of U.S.-based multinational corporations.
Overall, stocks responded favorably to both the Federal Reserve’s cautious approach to raising short-term interest rates and the
2
monetary stimulus efforts of other central banks. A strong rebound in February, when the broad market notched its largest monthly gain since October 2011, helped lift returns for the period.
International stocks had a slightly negative return as the dollar’s strength against many foreign currencies hurt results. Without this currency effect, stocks outside the United States generally advanced. The developed markets of the Pacific, particularly Japan, were especially strong.
Global central bank stimulus helped drive up bond prices
Bond prices, too, were supported by accommodative monetary policies from central banks and by investors who sought safe-haven assets amid turbulence in the stock market. The broad U.S. taxable bond market returned 3.43%. The yield of the 10-year Treasury note ended March at 1.95%, down from 2.48% six months earlier. (Bond prices and yields move in opposite directions.) Municipal bonds returned 2.40%, though results faded later in the period as more bonds were issued.
International bond markets (as measured by the Barclays Global Aggregate Index ex USD) returned –7.49%, a reflection of foreign currencies’ weakness relative to the dollar. International bonds hedged to eliminate the effect of currency exchange rates produced positive returns.
| | | |
| Market Barometer | | | |
| |
| | | | Total Returns |
| | | Periods Ended March 31, 2015 |
| | Six | One | Five Years |
| | Months | Year | (Annualized) |
| Stocks | | | |
| Russell 1000 Index (Large-caps) | 6.55% | 12.73% | 14.73% |
| Russell 2000 Index (Small-caps) | 14.46 | 8.21 | 14.57 |
| Russell 3000 Index (Broad U.S. market) | 7.13 | 12.37 | 14.71 |
| FTSE All-World ex US Index (International) | -0.08 | -0.21 | 5.19 |
| |
| Bonds | | | |
| Barclays U.S. Aggregate Bond Index (Broad taxable market) | 3.43% | 5.72% | 4.41% |
| Barclays Municipal Bond Index (Broad tax-exempt market) | 2.40 | 6.62 | 5.11 |
| Citigroup Three-Month U.S. Treasury Bill Index | 0.00 | 0.03 | 0.06 |
| |
| CPI | | | |
| Consumer Price Index | -0.80% | -0.07% | 1.64% |
3
The Fed’s target of 0%–0.25% for short-term interest rates continued to cap returns for money market funds and savings accounts.
For the period, the fund kept up its streak of strong returns
Vanguard Morgan Growth Fund’s return of nearly 10% would be considered a good result for a full year, let alone a half year. And it comes on the heels of a string of outsize returns. The fund, like both its benchmark and the broad stock market, has notched double-digit advances in four of the past five fiscal years.
After such an extended winning streak, it’s not unusual to experience a pullback, which can test an investor’s commitment to staying the course. So keep in mind that weathering the market’s inevitable short-term downturns is crucial to realizing its long-term potential benefits. This is particularly important when investing in an actively managed fund such as the Morgan Growth Fund. By design, the performance of an active fund can be out of step with the broader market, and an investor may need to be patient to reap future rewards. (For more about keeping the market’s ups and downs in perspective, see the box on page 5.)
For the latest six months, though, returns were mostly positive, at least outside the energy sector. As I mentioned, health care was a strong point for both the fund and its index. A flurry of acquisitions of biotech-nology companies helped fuel the sector’s ascent. Health care stocks accounted for
| | | |
| Expense Ratios | | | |
| Your Fund Compared With Its Peer Group | | | |
| | Investor | Admiral | Peer Group |
| | Shares | Shares | Average |
| Morgan Growth Fund | 0.40% | 0.26% | 1.28% |
The fund expense ratios shown are from the prospectus dated January 26, 2015, and represent estimated costs for the current fiscal year. For the six months ended March 31, 2015, the fund’s annualized expense ratios were 0.41% for Investor Shares and 0.27% for Admiral Shares. The peer-group expense ratio is derived from data provided by Lipper, a Thomson Reuters Company, and captures information through year-end 2014.
Peer group: Multi-Cap Growth Funds.
4
about one-fifth of the fund’s holdings, on average, during the period. This was second only to information technology stocks, which constituted about one-third of the fund.
Other fund successes included companies that cater to consumers—from hotels to internet retailers—as investors anticipated that tumbling prices at the pump would translate into higher consumer spending elsewhere. But falling oil prices were a negative for the energy sector, which slumped sharply for both the fund and the overall market.
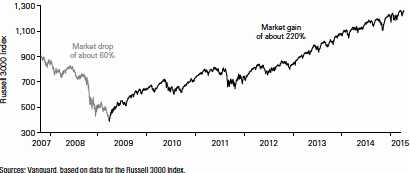
Marking the sixth anniversary of the bull market
There’s been a long and steep climb in the U.S. stock market in the six years since the worst of the financial crisis.
The dark line in the chart below traces the rise in the Russell 3000 Index from a low of 390 on March 9, 2009, to 1,241 on March 9, 2015—an increase of roughly 220% in 72 months.
The robustness and duration of the advance defied the predictions of some market pundits. Of course, the financial crisis caught many of them off guard as well. The lighter line below charts the drop of about 60% in the index in 17 months, from its pre-crisis peak of 908 on October 9, 2007.
These sharp and unexpected movements illustrate the challenge of trying to time the markets. Instead of trying to guess which way the wind will blow (and for how long), investors are generally better off staying committed to their investment plan through market ups and downs. Rebalancing your portfolio from time to time will help keep market movements from pushing your allocation to stocks and bonds off target.
The performance of the U.S. stock market since the start of the financial crisis
5
For more about the advisors’ strategy and the fund’s positioning during the six months, see the Advisors’ Report that follows this letter.
Our focus on balanced investing has roots going back many decades
On May 1, Vanguard will celebrate its 40th anniversary. Although many things have changed since 1975, our investment philosophy has not. From the start, we’ve focused on four timeless, straightforward principles that we believe help give clients the best chance for investment success:
• Goals. Create clear, appropriate investment goals.
• Balance. Develop a suitable asset allocation using broadly diversified funds.
• Cost. Minimize cost.
• Discipline. Maintain perspective and long-term discipline.
Vanguard has followed all these principles since its founding, and one—the focus on balanced investing—is in the company’s DNA. That’s because our predecessor company, Wellington Management, was a pioneer in this respect, launching a fund in 1929 that included both stocks and bonds.
The Wellington Fund got its start on the eve of the Great Depression, but it thrived over the long term, thanks in large part to its balancing of stocks and bonds. And this strategy continues to define the fund, now one of the nation’s largest balanced funds.
As we embark on our fifth decade, we’ll continue to emphasize the importance of balanced, diversified investing. How investors allocate assets between stocks and bonds has an enormous effect on the risks and returns of their portfolios. And broad diversification reduces exposure to specific risks while providing opportunities to benefit from the market’s current leaders. (You can read more in Vanguard’s Principles for Investing Success, available at vanguard.com/research.)
As always, thank you for investing with Vanguard.
Sincerely,

F. William McNabb III
Chairman and Chief Executive Officer April 15, 2015
6
Advisors’ Report
For the fiscal half year ended March 31, 2015, Vanguard Morgan Growth Fund returned 9.73% for Investor Shares and 9.78% for the lower-cost Admiral Shares. Your fund is managed by five independent advisors, a strategy that enhances the fund’s diversification by providing exposure to distinct yet complementary investment approaches. It’s not uncommon for different advisors to have different views about individual securities or the broader investment environment.
The advisors, the percentage of fund assets each manages, and brief descriptions of their investment strategies are presented in the accompanying table. The advisors have also prepared a discussion of the investment environment that existed during the period and of how portfolio positioning reflects this assessment. These comments were prepared on April 21, 2015.
Wellington Management Company LLP
Portfolio Manager: Paul E. Marrkand, CFA, Senior Managing Director
Our portion of the fund uses traditional methods of stock selection—fundamental research and analysis—to identify companies that we believe have above-average growth prospects. Our research focuses on mid- and large-capitalization companies, evaluating and ranking each stock on a consistent set of growth, quality, and valuation criteria. We seek to build a portfolio of diversified sources of return with a balance of growth, quality, and valuation attributes.
U.S. equities and other developed-market stocks around the world rose during the period; the S&P 500 Index returned 5.93% and the MSCI World Index 3.35%.
Successes
Sector allocation, a residual outcome of our bottom-up stock selection process, boosted the portfolio’s relative return. Results were driven primarily by our underweight allocation to the materials and energy sectors and an overweight allocation to health care.
Our stock selection was strongest in consumer staples and materials. Top individual contributors to benchmark-relative performance included O’Reilly Automotive in the consumer discretionary sector and Aetna in health care. Not holding benchmark constituents IBM and Schlumberger also helped.
Shortfalls
Security selection detracted from relative performance in information technology, health care, and financials. The weakest holdings included Microsoft, Apache, and NetApp. We eliminated our position in Apache before the end of the period. Our underweight allocation to consumer discretionary also lagged.
7
We ended the period most overweighted in information technology and health care and most underweighted in industrials and energy. We remain optimistic about our portfolio’s favorable risk/reward profile. We continue to purchase attractively valued, capital-compounding companies with what we believe to be sustainable competitive advantages that can maintain a free-cash-flow growth rate beyond that of the market.
Jennison Associates LLC
Portfolio Managers: Kathleen A. McCarragher, Managing Director
Blair A. Boyer,
Managing Director
The U.S. equity market advanced as the economic outlook continued to improve. The Federal Reserve ended its asset purchase program, confident that gains in economic activity and the labor market were sustainable.
Successes
BioMarin Pharmaceutical benefited from solid sales of its treatments for rare genetic diseases and from positive developments in its drug pipeline. Apple’s strength reflected expanding global acceptance of its platform. We expect that product updates will sustain attractive revenue growth. Biogen profited from strong sales of its multiple sclerosis treatment and positive data from trials of an Alzheimer’s drug.
Shortfalls
Falling energy prices led customers of oil equipment and services provider Schlumberger to curtail future spending. Tesla Motors declined on production and delivery issues. We believe the company is positioned to drive rapid growth in the adoption of electric cars. Canadian Pacific Railway was hurt by worries that sharply lower oil prices would lead to lower volumes of crude oil shipping on its rail line.
Vanguard Equity Investment Group
Portfolio Managers: James P. Stetler, Principal James D. Troyer, CFA, Principal Michael R. Roach, CFA
For the six-month period, our stock selection models were effective in distinguishing the outperformers from the underperformers in most industry groups. Our growth, quality, valuation, and sentiment models lifted relative results; our management decisions model was more neutral. Selection was positive in seven sectors but slightly negative in three.
Successes
The largest contributions to our relative return came from information technology and consumer discretionary holdings.
In IT, Freescale Semiconductor, Electronic Arts, and Skyworks Solutions added the
8
most. In consumer discretionary, O’Reilly Automotive, Lowe’s, and Whirlpool stood out.
Shortfalls
Our overall selections in financials and materials were negative. Positions in American Express, Discover Financial Services, and Citigroup as well as Westlake Chemical and Alcoa did not perform as expected.
Frontier Capital Management Co., LLC
Portfolio Managers: Stephen Knightly, CFA, President Christopher J. Scarpa, Vice President
Improved economic activity, modest earnings growth, and continued accommodative monetary policy drove growth stocks, especially mid- and small-capitalization shares, sharply higher over the six months.
Successes
Health care, technology, and consumer discretionary stocks contributed substantially to relative performance. Health care holdings were boosted by our focus on companies that are helping the government lower the cost of care, such as managed-care firms Centene and Humana. In technology, a long-term shift in the video game market to higher-margin digital sales drove significant earnings growth and stock appreciation for Electronic Arts. Proprietary content gains in wireless devices led to rapid climbs for NXP Semiconductors and Avago Technologies. In the consumer discretionary sector, lower fuel prices and improved employment enhanced results for low-income-oriented retailers including Ross Stores.
Shortfalls
The collapse in fuel prices and concurrent surge in the dollar weighed on a number of industrial and materials holdings. Particularly affected were perceived beneficiaries of renewed domestic oil production and a need for energy infrastructure such as Kirby, MasTec, and Eagle Materials.
Kalmar Investment Advisers
Portfolio Managers:
Ford B. Draper, Jr., President and Chief Investment Officer Dana F. Walker, CFA, Co-Head of the Investment Team
On the whole, the U.S. equity market was rewarding for the last six months; however, the most recent quarter was more mixed, accompanied by a pickup in volatility. Causes included a rising number of geopolitical flashpoints, particularly in the Middle East; the sharp appreciation in the U.S. dollar; and declines in commodity prices—most notably the plunge in oil. Concerns about the timing and degree of Federal Reserve tightening also affected results.
9
Nevertheless, we envisage improving U.S. growth of perhaps 2.5%, helped by better weather, port reopenings, continued employment gains, and subdued interest rates. Global deflation risk may also be starting to wane amid a possible upturn in Eurozone growth. Such an environment suggests to us that recession risk is still several years away. Earnings for well-positioned companies should keep expanding here and abroad, and, buoyed by policy moves and mergers and acquisitions, the market should maintain its upward trend.
Successes
For the six months, more of our biggest contributors to portfolio return came from the consumer discretionary sector than any other; they included CarMax, Tractor Supply, O’Reilly Automotive, and Jarden. In keeping with our bottom-up stock-picking style, various stocks from other sectors, such as Cognizant Technology Solutions, ResMed, Alliance Data Systems, and Watsco, also boosted results.
Shortfalls
Most of our biggest detractors resulted from the drastic decline in oil and gas prices. These included Southwestern Energy, an exploration and production company; Weatherford International and Core Laboratories, both in oil services; and Chicago Bridge & Iron, an energy-related engineering and construction firm. Although there are some strong arguments for lower oil prices, a potential bottom seems to be forming for oil. Herbalife and Discovery Communications also lagged.
10
| | | |
| Vanguard Morgan Growth Fund Investment Advisors | |
| |
| | Fund Assets Managed | |
| Investment Advisor | % | $ Million | Investment Strategy |
| Wellington Management | 45 | 5,245 | Uses traditional methods of stock selection— |
| Company LLP | | | fundamental research and analysis—to identify |
| | | | companies that it believes have above-average growth |
| | | | prospects. Research focuses on mid- and large-cap |
| | | | companies, evaluating and ranking each stock on a |
| | | | consistent set of growth, quality, and valuation criteria. |
| | | | We seek to build a portfolio with diversified sources of |
| | | | return with a balance of growth, quality, and valuation |
| | | | attributes. |
| Jennison Associates LLC | 20 | 2,256 | Uses a research-driven, fundamental investment |
| | | | approach that relies on in-depth company knowledge |
| | | | gleaned through meetings with management, |
| | | | customers, and suppliers. |
| Vanguard Equity Investment | 13 | 1,544 | Employs a quantitative fundamental management |
| Group | | | approach, using models that assess valuation, growth |
| | | | prospects, management decisions, market sentiment, |
| | | | and earnings and balance-sheet quality of companies |
| | | | as compared with their peers. |
| Frontier Capital Management Co., | 10 | 1,195 | Uses a research-driven, fundamental investment |
| LLC | | | approach that seeks companies with above-average |
| | | | growth prospects, reasonable valuations, and |
| | | | competitive advantages. |
| Kalmar Investment Advisers | 10 | 1,110 | Employs a “growth-with-value” strategy using creative, |
| | | | bottom-up research to uncover vigorously growing, |
| | | | high-quality businesses whose stocks can also be |
| | | | bought inefficiently valued. The strategy has a dual |
| | | | objective of strong returns with lower risk. |
| Cash Investments | 2 | 212 | These short-term reserves are invested by Vanguard in |
| | | | equity index products to simulate investments in |
| | | | stocks. Each advisor also may maintain a modest cash |
| | | | position. |
11
Morgan Growth Fund
Fund Profile
As of March 31, 2015
| | | |
| Share-Class Characteristics | | |
| | Investor | | Admiral |
| | Shares | | Shares |
| Ticker Symbol | VMRGX | | VMRAX |
| Expense Ratio1 | 0.40% | | 0.26% |
| 30-Day SEC Yield | 0.75% | | 0.88% |
| |
| Portfolio Characteristics | | |
| | | Russell | DJ |
| | | 3000 | U.S. Total |
| | | Growth | Market |
| | Fund | Index | FA Index |
| Number of Stocks | 346 | 1,867 | 3,757 |
| Median Market Cap | $38.1B | $52.3B | $46.5B |
| Price/Earnings Ratio | 27.0x | 24.6x | 21.4x |
| Price/Book Ratio | 5.1x | 5.4x | 2.8x |
| Return on Equity | 22.3% | 22.7% | 17.5% |
| Earnings Growth | | | |
| Rate | 17.9% | 17.5% | 13.5% |
| Dividend Yield | 1.1% | 1.4% | 1.9% |
| Foreign Holdings | 4.0% | 0.0% | 0.0% |
| Turnover Rate | | | |
| (Annualized) | 40% | — | — |
| Short-Term Reserves | 1.0% | — | — |
| |
| Sector Diversification (% of equity exposure) |
| | | | DJ |
| | | | U.S. |
| | | Russell | Total |
| | | 3000 | Market |
| | | Growth | FA |
| | Fund | Index | Index |
| Consumer | | | |
| Discretionary | 18.6% | 18.6% | 13.4% |
| Consumer Staples | 5.4 | 10.0 | 8.4 |
| Energy | 2.2 | 4.4 | 7.3 |
| Financials | 5.0 | 5.4 | 17.6 |
| Health Care | 21.2 | 15.1 | 14.6 |
| Industrials | 9.6 | 12.0 | 11.1 |
| Information | | | |
| Technology | 34.3 | 28.3 | 19.0 |
| Materials | 2.4 | 4.0 | 3.5 |
| Telecommunication | | | |
| Services | 1.3 | 2.1 | 2.0 |
| Utilities | 0.0 | 0.1 | 3.1 |
| | |
| Volatility Measures | | |
| | Russell | DJ |
| | 3000 | U.S. Total |
| | Growth | Market |
| | Index | FA Index |
| R-Squared | 0.97 | 0.88 |
| Beta | 1.06 | 1.03 |
| These measures show the degree and timing of the fund’s fluctuations compared with the indexes over 36 months. |
|
| |
| Ten Largest Holdings (% of total net assets) |
| Apple Inc. | Technology | |
| | Hardware, Storage & |
| | Peripherals | 5.8% |
| Google Inc. | Internet Software & |
| | Services | 2.2 |
| Facebook Inc. | Internet Software & |
| | Services | 1.8 |
| Oracle Corp. | Systems Software | 1.7 |
| Gilead Sciences Inc. | Biotechnology | 1.7 |
| Amazon.com Inc. | Internet Retail | 1.5 |
| Microsoft Corp. | Systems Software | 1.5 |
| Biogen Inc. | Biotechnology | 1.4 |
| Home Depot Inc. | Home Improvement |
| | Retail | 1.3 |
| Costco Wholesale Corp. | Hypermarkets & | |
| | Super Centers | 1.2 |
| Top Ten | | 20.1% |
| The holdings listed exclude any temporary cash investments and equity index products. |
| | |
Investment Focus
1 The expense ratios shown are from the prospectus dated January 26, 2015, and represent estimated costs for the current fiscal year. For the six months ended March 31, 2015, the annualized expense ratios were 0.41% for Investor Shares and 0.27% for Admiral Shares.
12
Morgan Growth Fund
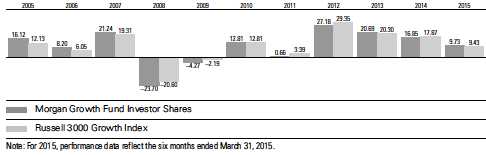
Performance Summary
All of the returns in this report represent past performance, which is not a guarantee of future results that may be achieved by the fund. (Current performance may be lower or higher than the performance data cited. For performance data current to the most recent month-end, visit our website at vanguard.com/performance.) Note, too, that both investment returns and principal value can fluctuate widely, so an investor’s shares, when sold, could be worth more or less than their original cost. The returns shown do not reflect taxes that a shareholder would pay on fund distributions or on the sale of fund shares.
Fiscal-Year Total Returns (%): September 30, 2004, Through March 31, 2015
| | | | |
| Average Annual Total Returns: Periods Ended March 31, 2015 | | | |
| |
| | Inception | One | Five | Ten |
| | Date | Year | Years | Years |
| Investor Shares | 12/31/1968 | 14.95% | 14.64% | 8.81% |
| Admiral Shares | 5/14/2001 | 15.11 | 14.79 | 8.97 |
See Financial Highlights for dividend and capital gains information.
13
Morgan Growth Fund
Financial Statements (unaudited)
Statement of Net Assets
As of March 31, 2015
The fund reports a complete list of its holdings in regulatory filings four times in each fiscal year, at the quarter-ends. For the second and fourth fiscal quarters, the lists appear in the fund’s semiannual and annual reports to shareholders. For the first and third fiscal quarters, the fund files the lists with the Securities and Exchange Commission on Form N-Q. Shareholders can look up the fund’s Forms N-Q on the SEC’s website at sec.gov. Forms N-Q may also be reviewed and copied at the SEC’s Public Reference Room (see the back cover of this report for further information).
| | | |
| | | | Market |
| | | | Value• |
| | | Shares | ($000) |
| Common Stocks (98.4%)1 | | |
| Consumer Discretionary (18.2%) | |
| * | Amazon.com Inc. | 477,659 | 177,737 |
| | Home Depot Inc. | 1,352,617 | 153,671 |
| * | O’Reilly Automotive Inc. | 511,677 | 110,645 |
| | Comcast Corp. Class A | 1,798,302 | 101,550 |
| | Lowe’s Cos. Inc. | 1,284,166 | 95,529 |
| * | Priceline Group Inc. | 72,624 | 84,545 |
| | NIKE Inc. Class B | 836,418 | 83,918 |
| | TJX Cos. Inc. | 1,160,087 | 81,264 |
| | Wyndham | | |
| | Worldwide Corp. | 748,852 | 67,749 |
| * | Netflix Inc. | 158,455 | 66,027 |
| | Marriott International Inc. | | |
| | Class A | 689,474 | 55,379 |
| * | Chipotle Mexican Grill Inc. | | |
| | Class A | 83,361 | 54,230 |
| | Starbucks Corp. | 544,906 | 51,603 |
| | Advance Auto Parts Inc. | 304,144 | 45,527 |
| | Inditex SA ADR | 2,816,476 | 44,909 |
| | PulteGroup Inc. | 1,947,452 | 43,292 |
| | Expedia Inc. | 448,495 | 42,217 |
| *,^ | Tesla Motors Inc. | 194,633 | 36,741 |
| * | LKQ Corp. | 1,421,318 | 36,329 |
| * | Hilton Worldwide | | |
| | Holdings Inc. | 1,162,509 | 34,434 |
| | Walt Disney Co. | 316,800 | 33,229 |
| | Whirlpool Corp. | 150,769 | 30,464 |
| * | Vipshop Holdings | | |
| | Ltd. ADR | 888,471 | 26,157 |
| | Wolverine World Wide Inc. | 717,635 | 24,005 |
| * | Urban Outfitters Inc. | 519,085 | 23,696 |
| | Ross Stores Inc. | 208,300 | 21,946 |
| | Scripps Networks | | |
| | Interactive Inc. Class A | 291,089 | 19,957 |
| * | Michaels Cos. Inc. | 672,745 | 18,204 |
| * | Ulta Salon Cosmetics | | |
| | & Fragrance Inc. | 116,915 | 17,637 |
| | CBS Corp. Class B | 273,600 | 16,588 |
| | Brunswick Corp. | 320,204 | 16,474 |
| | BorgWarner Inc. | 270,060 | 16,333 |
| | | |
| | | | Market |
| | | | Value• |
| | | Shares | ($000) |
| | Tractor Supply Co. | 191,440 | 16,284 |
| * | Jarden Corp. | 302,747 | 16,015 |
| | DSW Inc. Class A | 432,335 | 15,944 |
| | L Brands Inc. | 168,600 | 15,897 |
| | VF Corp. | 206,835 | 15,577 |
| | Wynn Resorts Ltd. | 119,587 | 15,054 |
| | Harman International | | |
| | Industries Inc. | 104,170 | 13,920 |
| | Hanesbrands Inc. | 412,260 | 13,815 |
| | Starwood Hotels & | | |
| | Resorts Worldwide Inc. | 158,090 | 13,201 |
| | GNC Holdings Inc. Class A | 261,538 | 12,834 |
| * | IMAX Corp. | 380,622 | 12,831 |
| * | Discovery | | |
| | Communications Inc. | 415,495 | 12,247 |
| | Carter’s Inc. | 124,935 | 11,553 |
| | Delphi Automotive plc | 142,400 | 11,355 |
| | Service Corp. International | 424,275 | 11,052 |
| * | CarMax Inc. | 159,820 | 11,029 |
| * | Discovery Communications | | |
| | Inc. Class A | 345,210 | 10,619 |
| | Harley-Davidson Inc. | 168,715 | 10,248 |
| * | AutoZone Inc. | 15,000 | 10,232 |
| * | Bright Horizons Family | | |
| | Solutions Inc. | 198,870 | 10,196 |
| | Macy’s Inc. | 147,800 | 9,594 |
| * | Michael Kors | | |
| | Holdings Ltd. | 142,449 | 9,366 |
| | Royal Caribbean | | |
| | Cruises Ltd. | 114,300 | 9,355 |
| | Dunkin’ Brands Group Inc. | 193,673 | 9,211 |
| * | lululemon athletica Inc. | 139,254 | 8,915 |
| * | NVR Inc. | 6,600 | 8,769 |
| * | Sirius XM Holdings Inc. | 2,276,900 | 8,698 |
| | Comcast Corp. | 132,900 | 7,451 |
| | Cablevision Systems | | |
| | Corp. Class A | 398,700 | 7,296 |
| * | MGM Resorts | | |
| | International | 283,095 | 5,953 |
| | Twenty-First Century | | |
| | Fox Inc. | 178,100 | 5,856 |
14
| | | |
| Morgan Growth Fund | | |
| |
| |
| |
| | | | Market |
| | | | Value• |
| | | Shares | ($000) |
| * | DIRECTV | 66,400 | 5,651 |
| * | Liberty Global plc Class A | 75,000 | 3,860 |
| | Twenty-First Century | | |
| | Fox Inc. Class A | 96,700 | 3,272 |
| | Las Vegas Sands Corp. | 50,200 | 2,763 |
| | Time Warner Inc. | 32,700 | 2,761 |
| * | Liberty Global plc | 50,601 | 2,520 |
| * | Hyatt Hotels Corp. Class A | 16,500 | 977 |
| | | | 2,104,157 |
| Consumer Staples (5.2%) | | |
| | Costco Wholesale Corp. | 932,322 | 141,242 |
| | CVS Health Corp. | 758,515 | 78,286 |
| * | Monster Beverage Corp. | 523,787 | 72,490 |
| | Mondelez International Inc. | | |
| | Class A | 1,910,618 | 68,954 |
| | Anheuser-BuschInBev | | |
| | NV ADR | 439,856 | 53,623 |
| | Estee Lauder Cos. Inc. | | |
| | Class A | 349,556 | 29,069 |
| | Colgate-Palmolive Co. | 397,925 | 27,592 |
| * | Hain Celestial Group Inc. | 246,865 | 15,812 |
| | PepsiCo Inc. | 158,600 | 15,165 |
| * | United Natural Foods Inc. | 192,100 | 14,800 |
| | Sysco Corp. | 381,894 | 14,409 |
| | Kroger Co. | 168,800 | 12,940 |
| | Brown-Forman Corp. | | |
| | Class B | 138,579 | 12,521 |
| * | Rite Aid Corp. | 1,185,000 | 10,298 |
| | Clorox Co. | 82,500 | 9,107 |
| | Mead Johnson | | |
| | Nutrition Co. | 73,600 | 7,399 |
| ^ | Pilgrim’s Pride Corp. | 321,600 | 7,265 |
| | Coty Inc. Class A | 280,400 | 6,805 |
| | Walgreens Boots | | |
| | Alliance Inc. | 25,500 | 2,159 |
| | Coca-Cola Co. | 13,000 | 527 |
| | | | 600,463 |
| Energy (2.1%) | | |
| | Cabot Oil & Gas Corp. | 1,287,292 | 38,014 |
| | Schlumberger Ltd. | 376,746 | 31,436 |
| | Baker Hughes Inc. | 395,621 | 25,153 |
| * | Carrizo Oil & Gas Inc. | 327,260 | 16,248 |
| | EOG Resources Inc. | 159,600 | 14,634 |
| * | Gulfport Energy Corp. | 256,615 | 11,781 |
| | Core Laboratories NV | 104,475 | 10,917 |
| * | Continental Resources Inc. | 223,400 | 9,756 |
| | Tesoro Corp. | 100,800 | 9,202 |
| | Valero Energy Corp. | 136,700 | 8,697 |
| | Plains GP Holdings LP | | |
| | Class A | 303,500 | 8,610 |
| | ONEOK Inc. | 173,800 | 8,384 |
| * | Cameron International | | |
| | Corp. | 181,620 | 8,195 |
| | Anadarko Petroleum | | |
| | Corp. | 97,600 | 8,082 |
| | | |
| | | | Market |
| | | | Value• |
| | | Shares | ($000) |
| * | Weatherford | | |
| | International plc | 647,640 | 7,966 |
| * | Southwestern Energy Co. | 300,070 | 6,959 |
| | Superior Energy | | |
| | Services Inc. | 240,685 | 5,377 |
| * | EP Energy Corp. Class A | 359,300 | 3,765 |
| | Kinder Morgan Inc. | 67,400 | 2,835 |
| * | Memorial Resource | | |
| | Development Corp. | 106,300 | 1,886 |
| | | | 237,897 |
| Financials (4.7%) | | |
| | American Express Co. | 753,579 | 58,870 |
| | Morgan Stanley | 1,297,719 | 46,316 |
| | Moody’s Corp. | 431,468 | 44,786 |
| | Bank of America Corp. | 2,686,779 | 41,350 |
| | Public Storage | 207,278 | 40,863 |
| | Intercontinental | | |
| | Exchange Inc. | 169,152 | 39,458 |
| | Raymond James | | |
| | Financial Inc. | 419,947 | 23,845 |
| | American Tower | | |
| | Corporation | 248,755 | 23,420 |
| * | E*TRADE Financial Corp. | 787,092 | 22,475 |
| | Aon plc | 230,821 | 22,186 |
| | T. Rowe Price Group Inc. | 240,865 | 19,505 |
| * | Affiliated Managers | | |
| | Group Inc. | 83,265 | 17,884 |
| | Waddell & Reed | | |
| | Financial Inc. Class A | 323,397 | 16,021 |
| * | Signature Bank | 110,418 | 14,308 |
| | American International | | |
| | Group Inc. | 199,133 | 10,910 |
| | JPMorgan Chase & Co. | 179,683 | 10,885 |
| | Ameriprise Financial Inc. | 77,800 | 10,179 |
| | Northern Trust Corp. | 141,900 | 9,883 |
| * | Berkshire Hathaway Inc. | | |
| | Class B | 65,400 | 9,439 |
| | Simon Property Group Inc. | 46,100 | 9,019 |
| | WisdomTree | | |
| | Investments Inc. | 413,138 | 8,866 |
| * | SVB Financial Group | 68,657 | 8,722 |
| | Health Care REIT Inc. | 92,000 | 7,117 |
| | Allied World Assurance Co. | | |
| | Holdings AG | 172,900 | 6,985 |
| | General Growth | | |
| | Properties Inc. | 191,000 | 5,644 |
| | Ventas Inc. | 71,500 | 5,221 |
| | Apartment Investment | | |
| | & Management Co. | 77,900 | 3,066 |
| | Discover Financial Services | 51,800 | 2,919 |
| | Legg Mason Inc. | 45,900 | 2,534 |
| | Citigroup Inc. | 46,800 | 2,411 |
| | Crown Castle | | |
| | International Corp. | 9,700 | 801 |
| | Kilroy Realty Corp. | 8,100 | 617 |
| | | | 546,505 |
| | | |
| Morgan Growth Fund | | |
| |
| |
| |
| | | | Market |
| | | | Value• |
| | | Shares | ($000) |
| Health Care (20.8%) | | |
| * | Gilead Sciences Inc. | 1,945,563 | 190,918 |
| * | Biogen Inc. | 374,451 | 158,108 |
| | Bristol-Myers Squibb Co. | 2,034,765 | 131,242 |
| * | Celgene Corp. | 1,120,163 | 129,132 |
| | Amgen Inc. | 715,130 | 114,314 |
| * | Actavis plc | 357,324 | 106,347 |
| * | Vertex | | |
| | Pharmaceuticals Inc. | 861,119 | 101,586 |
| * | BioMarin | | |
| | Pharmaceutical Inc. | 755,047 | 94,094 |
| | Merck & Co. Inc. | 1,419,802 | 81,610 |
| | Aetna Inc. | 740,432 | 78,878 |
| | Eli Lilly & Co. | 971,234 | 70,560 |
| | Medtronic plc | 850,627 | 66,340 |
| | CR Bard Inc. | 384,750 | 64,388 |
| * | Illumina Inc. | 322,633 | 59,894 |
| | Becton Dickinson and Co. | 374,308 | 53,747 |
| * | Alexion | | |
| | Pharmaceuticals Inc. | 304,701 | 52,805 |
| | Zimmer Holdings Inc. | 398,976 | 46,888 |
| | Johnson & Johnson | 458,269 | 46,102 |
| | Novo Nordisk A/S ADR | 789,232 | 42,137 |
| | Shire plc ADR | 151,542 | 36,263 |
| | Cooper Cos. Inc. | 176,507 | 33,081 |
| * | Cerner Corp. | 426,843 | 31,271 |
| | Perrigo Co. plc | 186,538 | 30,881 |
| | AstraZeneca plc ADR | 448,605 | 30,698 |
| * | Medivation Inc. | 234,202 | 30,228 |
| * | HCA Holdings Inc. | 400,815 | 30,153 |
| * | Centene Corp. | 399,000 | 28,205 |
| | Cardinal Health Inc. | 286,791 | 25,889 |
| | Anthem Inc. | 166,384 | 25,691 |
| | Agilent Technologies Inc. | 593,834 | 24,674 |
| | Humana Inc. | 132,191 | 23,533 |
| ^ | ResMed Inc. | 318,895 | 22,890 |
| | Zoetis Inc. | 488,650 | 22,620 |
| | AbbVie Inc. | 362,500 | 21,221 |
| | Thermo Fisher | | |
| | Scientific Inc. | 149,190 | 20,042 |
| * | Express Scripts | | |
| | Holding Co. | 203,455 | 17,654 |
| * | Alkermes plc | 287,853 | 17,550 |
| * | Varian Medical | | |
| | Systems Inc. | 185,080 | 17,414 |
| * | Incyte Corp. | 186,428 | 17,088 |
| * | Mylan NV | 287,231 | 17,047 |
| * | MEDNAX Inc. | 220,482 | 15,987 |
| | Cigna Corp. | 109,900 | 14,225 |
| | Universal Health | | |
| | Services Inc. Class B | 112,997 | 13,301 |
| * | Mallinckrodt plc | 100,360 | 12,711 |
| | AmerisourceBergen Corp. | | |
| | Class A | 110,400 | 12,549 |
| * | Akorn Inc. | 239,815 | 11,394 |
| * | Edwards Lifesciences Corp. | 76,800 | 10,941 |
| | | |
| | | | Market |
| | | | Value• |
| | | Shares | ($000) |
| | HealthSouth Corp. | 239,617 | 10,629 |
| * | PAREXEL International | | |
| | Corp. | 152,505 | 10,521 |
| * | Mettler-Toledo | | |
| | International Inc. | 31,500 | 10,353 |
| * | Quintiles Transnational |
| | | |
| | Holdings Inc. | 142,000 | 9,510 |
| * | United Therapeutics Corp. | 54,700 | 9,432 |
| | UnitedHealth Group Inc. | 67,900 | 8,032 |
| * | Jazz Pharmaceuticals plc | 44,730 | 7,729 |
| * | Salix Pharmaceuticals Ltd. | 40,095 | 6,929 |
| * | Molina Healthcare Inc. | 98,024 | 6,596 |
| | McKesson Corp. | 21,200 | 4,795 |
| * | Align Technology Inc. | 85,095 | 4,577 |
| * | Charles River Laboratories | | |
| | International Inc. | 42,000 | 3,330 |
| | Abbott Laboratories | 53,800 | 2,493 |
| | | | 2,399,217 |
| Industrials (9.3%) | | |
| | Boeing Co. | 918,877 | 137,905 |
| | Honeywell | | |
| | International Inc. | 676,595 | 70,576 |
| | United Parcel Service Inc. | | |
| | Class B | 691,402 | 67,024 |
| | TransDigm Group Inc. | 260,671 | 57,014 |
| | Danaher Corp. | 561,192 | 47,645 |
| | 3M Co. | 270,749 | 44,660 |
| | Illinois Tool Works Inc. | 451,103 | 43,820 |
| ^ | Canadian Pacific | | |
| | Railway Ltd. | 207,407 | 37,893 |
| * | Stericycle Inc. | 205,105 | 28,803 |
| | American Airlines | | |
| | Group Inc. | 504,900 | 26,649 |
| | JB Hunt Transport | | |
| | Services Inc. | 311,918 | 26,636 |
| | Wabtec Corp. | 241,096 | 22,907 |
| | Union Pacific Corp. | 195,900 | 21,218 |
| | Rockwell Automation Inc. | 175,321 | 20,335 |
| | Equifax Inc. | 202,783 | 18,859 |
| | Pentair plc | 296,920 | 18,673 |
| * | United Rentals Inc. | 201,195 | 18,341 |
| | Cintas Corp. | 223,495 | 18,244 |
| * | Spirit Airlines Inc. | 234,524 | 18,143 |
| | AMETEK Inc. | 317,593 | 16,686 |
| | Lockheed Martin Corp. | 79,400 | 16,115 |
| | Fastenal Co. | 362,025 | 15,000 |
| | Watsco Inc. | 118,145 | 14,851 |
| | Acuity Brands Inc. | 86,925 | 14,617 |
| * | IHS Inc. Class A | 127,630 | 14,519 |
| * | Copart Inc. | 365,982 | 13,750 |
| | Roper Industries Inc. | 76,768 | 13,204 |
| | Carlisle Cos. Inc. | 140,045 | 12,972 |
| | Southwest Airlines Co. | 277,200 | 12,280 |
| | Delta Air Lines Inc. | 268,100 | 12,054 |
| | MSC Industrial Direct | | |
| | Co. Inc. Class A | 163,680 | 11,818 |
16
| | | |
| Morgan Growth Fund | | |
| |
| |
| |
| | | | Market |
| | | | Value• |
| | | Shares | ($000) |
| | Snap-on Inc. | 78,810 | 11,590 |
| * | Hertz Global Holdings Inc. | 522,880 | 11,336 |
| * | United Continental | | |
| | Holdings Inc. | 168,500 | 11,332 |
| * | Armstrong World | | |
| | Industries Inc. | 188,595 | 10,839 |
| | PACCAR Inc. | 162,900 | 10,285 |
| | KAR Auction Services Inc. | 252,540 | 9,579 |
| | Expeditors International | | |
| | of Washington Inc. | 196,245 | 9,455 |
| | Masco Corp. | 352,500 | 9,412 |
| | Alaska Air Group Inc. | 139,100 | 9,206 |
| | Flowserve Corp. | 162,795 | 9,196 |
| | Pall Corp. | 88,192 | 8,854 |
| * | Spirit AeroSystems | | |
| | Holdings Inc. Class A | 169,500 | 8,850 |
| * | Quanta Services Inc. | 252,975 | 7,217 |
| | Robert Half | | |
| | International Inc. | 118,200 | 7,153 |
| | Caterpillar Inc. | 88,700 | 7,099 |
| | B/E Aerospace Inc. | 107,873 | 6,863 |
| * | Kirby Corp. | 76,267 | 5,724 |
| * | Verisk Analytics Inc. Class A | 76,830 | 5,486 |
| | FedEx Corp. | 13,900 | 2,300 |
| | Textron Inc. | 34,500 | 1,529 |
| | | | 1,076,516 |
| Information Technology (33.6%) | |
| | Apple Inc. | 5,392,482 | 670,987 |
| * | Facebook Inc. Class A | 2,488,899 | 204,625 |
| | Oracle Corp. | 4,631,297 | 199,840 |
| * | Google Inc. Class C | 350,579 | 192,117 |
| | Microsoft Corp. | 4,229,764 | 171,961 |
| | Altera Corp. | 2,869,956 | 123,150 |
| | QUALCOMM Inc. | 1,651,402 | 114,508 |
| | MasterCard Inc. Class A | 1,261,925 | 109,018 |
| | Cisco Systems Inc. | 3,930,143 | 108,177 |
| | Visa Inc. Class A | 1,426,668 | 93,318 |
| * | Alibaba Group Holding | | |
| | Ltd. ADR | 1,087,645 | 90,536 |
| * | Alliance Data Systems | | |
| | Corp. | 298,935 | 88,560 |
| * | F5 Networks Inc. | 711,861 | 81,821 |
| | Intuit Inc. | 781,388 | 75,763 |
| * | Google Inc. Class A | 115,772 | 64,219 |
| * | Twitter Inc. | 1,223,435 | 61,270 |
| * | Check Point Software | | |
| | Technologies Ltd. | 746,652 | 61,203 |
| * | LinkedIn Corp. Class A | 236,317 | 59,046 |
| * | salesforce.com inc | 854,398 | 57,082 |
| * | Red Hat Inc. | 753,295 | 57,062 |
| | Broadcom Corp. Class A | 1,207,788 | 52,291 |
| | Maxim Integrated | | |
| | Products Inc. | 1,493,849 | 52,001 |
| | NetApp Inc. | 1,442,739 | 51,160 |
| | Paychex Inc. | 1,029,683 | 51,088 |
| | Skyworks Solutions Inc. | 519,472 | 51,059 |
| | | |
| | | | Market |
| | | | Value• |
| | | Shares | ($000) |
| * | Cognizant Technology | | |
| | Solutions Corp. Class A | 793,920 | 49,533 |
| * | Electronic Arts Inc. | 824,345 | 48,484 |
| | Western Digital Corp. | 520,833 | 47,401 |
| * | Workday Inc. Class A | 478,052 | 40,352 |
| * | Adobe Systems Inc. | 538,500 | 39,817 |
| | Linear Technology Corp. | 830,831 | 38,883 |
| | Amphenol Corp. Class A | 646,165 | 38,079 |
| | Activision Blizzard Inc. | 1,411,672 | 32,080 |
| | Microchip Technology Inc. | 623,703 | 30,499 |
| | Global Payments Inc. | 283,435 | 25,985 |
| * | NXP Semiconductors NV | 246,806 | 24,769 |
| * | Splunk Inc. | 413,541 | 24,482 |
| * | Tencent Holdings Ltd. | 1,211,062 | 22,998 |
| * | FleetCor Technologies Inc. | 148,941 | 22,478 |
| | Avago Technologies Ltd. | | |
| | Class A | 165,539 | 21,020 |
| | FactSet Research | | |
| | Systems Inc. | 123,919 | 19,728 |
| * | Fortinet Inc. | 554,984 | 19,397 |
| * | FireEye Inc. | 488,041 | 19,156 |
| | International Business | | |
| | Machines Corp. | 116,400 | 18,682 |
| * | Akamai Technologies Inc. | 261,078 | 18,548 |
| | Brocade Communications | | |
| | Systems Inc. | 1,489,796 | 17,676 |
| | Amdocs Ltd. | 313,130 | 17,034 |
| | Accenture plc Class A | 180,900 | 16,949 |
| * | Gartner Inc. | 200,023 | 16,772 |
| | Atmel Corp. | 1,947,303 | 16,026 |
| | SS&C Technologies | | |
| | Holdings Inc. | 255,848 | 15,939 |
| | CDW Corp. | 411,900 | 15,339 |
| | Xilinx Inc. | 354,393 | 14,991 |
| | Jack Henry & | | |
| | Associates Inc. | 210,590 | 14,718 |
| * | VeriFone Systems Inc. | 415,415 | 14,494 |
| * | Vantiv Inc. Class A | 381,251 | 14,373 |
| | Lam Research Corp. | 200,769 | 14,101 |
| | Marvell Technology | | |
| | Group Ltd. | 939,896 | 13,817 |
| | SanDisk Corp. | 214,530 | 13,648 |
| * | Cadence Design | | |
| | Systems Inc. | 654,269 | 12,065 |
| | Fidelity National | | |
| | Information Services Inc. | 176,055 | 11,982 |
| * | Fiserv Inc. | 133,400 | 10,592 |
| * | Synaptics Inc. | 121,463 | 9,876 |
| * | Flextronics | | |
| | International Ltd. | 715,300 | 9,066 |
| | Fair Isaac Corp. | 94,228 | 8,360 |
| * | Autodesk Inc. | 137,965 | 8,090 |
| | CDK Global Inc. | 167,528 | 7,834 |
| | Jabil Circuit Inc. | 327,400 | 7,655 |
| * | Rackspace Hosting Inc. | 143,000 | 7,377 |
| * | Informatica Corp. | 153,945 | 6,751 |
17
| | | |
| Morgan Growth Fund | | |
| |
| |
| |
| | | | Market |
| | | | Value• |
| | | Shares | ($000) |
| | FLIR Systems Inc. | 168,455 | 5,269 |
| | Texas Instruments Inc. | 77,900 | 4,455 |
| * | Yelp Inc. Class A | 81,074 | 3,839 |
| * | VMware Inc. Class A | 46,600 | 3,822 |
| * | eBay Inc. | 29,700 | 1,713 |
| * | LendingClub Corp. | 47,641 | 936 |
| | EMC Corp. | 19,500 | 498 |
| | | | 3,880,290 |
| Materials (2.3%) | | |
| | Sherwin-Williams Co. | 365,872 | 104,091 |
| | Monsanto Co. | 321,483 | 36,180 |
| | Ashland Inc. | 166,160 | 21,154 |
| * | WR Grace & Co. | 161,870 | 16,004 |
| | PolyOne Corp. | 371,070 | 13,859 |
| | Eagle Materials Inc. | 163,720 | 13,680 |
| | PPG Industries Inc. | 54,891 | 12,380 |
| | Cytec Industries Inc. | 215,800 | 11,662 |
| | Alcoa Inc. | 764,100 | 9,872 |
| | Ball Corp. | 133,800 | 9,452 |
| | Worthington Industries Inc. | 343,295 | 9,135 |
| | CF Industries Holdings Inc. | 27,005 | 7,661 |
| | Valspar Corp. | 27,400 | 2,302 |
| | | | 267,432 |
| Other (0.9%) | | |
| 2 | Vanguard Growth ETF | 1,044,900 | 109,307 |
| |
| Telecommunication Services (1.3%) | |
| | Verizon | | |
| | Communications Inc. | 1,846,183 | 89,780 |
| * | SBA Communications | | |
| | Corp. Class A | 448,798 | 52,554 |
| | Cogent Communications | | |
| | Holdings Inc. | 285,900 | 10,101 |
| | | | 152,435 |
| Total Common Stocks | | |
| (Cost $7,712,661) | | 11,374,219 |
| Temporary Cash Investments (2.3%)1 | |
| Money Market Fund (2.1%) | | |
| 3,4 | Vanguard Market | | |
| | Liquidity Fund, | | |
| | 0.128% | 253,624,000 | 253,624 |
| | | |
| | | Face | Market |
| | | Amount | Value• |
| | | ($000) | ($000) |
| Repurchase Agreement (0.1%) | | |
| | Bank of America Securities, | | |
| | LLC 0.120%, 4/1/15 | | |
| | (Dated 3/31/15, Repurchase | | |
| | Value $13,100,000, | | |
| | collateralized by U.S. | | |
| | Treasury Note/Bond | | |
| | 7.500%, 11/15/16, with | | |
| | a value of $13,362,000) | 13,100 | 13,100 |
| |
| U.S. Government and Agency Obligations (0.1%) |
| 5,6 | Fannie Mae Discount | | |
| | Notes, 0.170%, 6/17/15 | 1,600 | 1,599 |
| 7 | Federal Home Loan | | |
| | Bank Discount Notes, | | |
| | 0.070%, 4/10/15 | 500 | 500 |
| 6,7 | Federal Home Loan | | |
| | Bank Discount Notes, | | |
| | 0.063%, 4/29/15 | 3,000 | 3,000 |
| 6,7 | Federal Home Loan | | |
| | Bank Discount Notes, | | |
| | 0.060%, 5/20/15 | 100 | 100 |
| 6,7 | Federal Home Loan | | |
| | Bank Discount Notes, | | |
| | 0.181%, 6/22/15 | 1,000 | 1,000 |
| 5,6 | Freddie Mac Discount | | |
| | Notes, 0.118%, 7/31/15 | 200 | 200 |
| | | | 6,399 |
| Total Temporary Cash Investments | |
| (Cost $273,122) | | 273,123 |
| Total Investments (100.7%) | | |
| (Cost $7,985,783) | | 11,647,342 |
| Other Assets and Liabilities (-0.7%) | |
| Other Assets | | 97,536 |
| Liabilities4 | | (182,757) |
| | | | (85,221) |
| Net Assets (100%) | | 11,562,121 |
18
Morgan Growth Fund
| |
| At March 31, 2015, net assets consisted of: |
| | Amount |
| | ($000) |
| Paid-in Capital | 7,522,362 |
| Undistributed Net Investment Income | 10,884 |
| Accumulated Net Realized Gains | 367,710 |
| Unrealized Appreciation (Depreciation) | |
| Investment Securities | 3,661,559 |
| Futures Contracts | (394) |
| Net Assets | 11,562,121 |
| |
| |
| Investor Shares—Net Assets | |
| Applicable to 176,754,837 outstanding | |
| $.001 par value shares of beneficial | |
| interest (unlimited authorization) | 4,682,188 |
| Net Asset Value Per Share— | |
| Investor Shares | $26.49 |
| |
| |
| Admiral Shares—Net Assets | |
| Applicable to 83,816,685 outstanding | |
| $.001 par value shares of beneficial | |
| interest (unlimited authorization) | 6,879,933 |
| Net Asset Value Per Share— | |
| Admiral Shares | $82.08 |
• See Note A in Notes to Financial Statements.
* Non-income-producing security.
^ Includes partial security positions on loan to broker-dealers. The total value of securities on loan is $54,767,000.
1 The fund invests a portion of its cash reserves in equity markets through the use of index futures contracts. After giving effect to futures
investments, the fund’s effective common stock and temporary cash investment positions represent 99.2% and 1.5%, respectively,
of net assets.
2 Considered an affiliated company of the fund as the issuer is another member of The Vanguard Group.
3 Affiliated money market fund available only to Vanguard funds and certain trusts and accounts managed by Vanguard. Rate shown is the
7-day yield.
4 Includes $56,339,000 of collateral received for securities on loan.
5 The issuer was placed under federal conservatorship in September 2008; since that time, its daily operations have been managed by the
Federal Housing Finance Agency and it receives capital from the U.S. Treasury, as needed to maintain a positive net worth, in exchange
for senior preferred stock.
6 Securities with a value of $4,799,000 have been segregated as initial margin for open futures contracts.
7 The issuer operates under a congressional charter; its securities are generally neither guaranteed by the U.S. Treasury nor backed by the
full faith and credit of the U.S. government.
ADR—American Depositary Receipt.
REIT—Real Estate Investment Trust.
See accompanying Notes, which are an integral part of the Financial Statements.
19
| |
| Morgan Growth Fund | |
| |
| |
| Statement of Operations | |
| |
| | Six Months Ended |
| | March 31, 2015 |
| | ($000) |
| Investment Income | |
| Income | |
| Dividends1,2 | 76,431 |
| Interest2 | 108 |
| Securities Lending | 167 |
| Total Income | 76,706 |
| Expenses | |
| Investment Advisory Fees—Note B | |
| Basic Fee | 8,939 |
| Performance Adjustment | (1,159) |
| The Vanguard Group—Note C | |
| Management and Administrative—Investor Shares | 5,806 |
| Management and Administrative—Admiral Shares | 3,649 |
| Marketing and Distribution—Investor Shares | 336 |
| Marketing and Distribution—Admiral Shares | 523 |
| Custodian Fees | 53 |
| Shareholders’ Reports—Investor Shares | 1 |
| Shareholders’ Reports—Admiral Shares | 12 |
| Trustees’ Fees and Expenses | 11 |
| Total Expenses | 18,171 |
| Expenses Paid Indirectly | (138) |
| Net Expenses | 18,033 |
| Net Investment Income | 58,673 |
| Realized Net Gain (Loss) | |
| Investment Securities Sold2 | 437,060 |
| Futures Contracts | (499) |
| Foreign Currencies | (20) |
| Realized Net Gain (Loss) | 436,541 |
| Change in Unrealized Appreciation (Depreciation) | |
| Investment Securities | 544,867 |
| Futures Contracts | (232) |
| Foreign Currencies | 1 |
| Change in Unrealized Appreciation (Depreciation) | 544,636 |
| Net Increase (Decrease) in Net Assets Resulting from Operations | 1,039,850 |
1 Dividends are net of foreign withholding taxes of $290,000.
2 Dividend income, interest income, and realized net gain (loss) from affiliated companies of the fund were $771,000, $100,000, and $0, respectively.
See accompanying Notes, which are an integral part of the Financial Statements.
20
| | |
| Morgan Growth Fund | | |
| |
| |
| Statement of Changes in Net Assets | | |
| |
| | Six Months Ended | Year Ended |
| | March 31, | September 30, |
| | 2015 | 2014 |
| | ($000) | ($000) |
| Increase (Decrease) in Net Assets | | |
| Operations | | |
| Net Investment Income | 58,673 | 85,467 |
| Realized Net Gain (Loss) | 436,541 | 1,188,527 |
| Change in Unrealized Appreciation (Depreciation) | 544,636 | 377,642 |
| Net Increase (Decrease) in Net Assets Resulting from Operations | 1,039,850 | 1,651,636 |
| Distributions | | |
| Net Investment Income | | |
| Investor Shares | (31,623) | (32,172) |
| Admiral Shares | (53,891) | (46,958) |
| Realized Capital Gain1 | | |
| Investor Shares | (467,717) | (185,177) |
| Admiral Shares | (648,615) | (216,896) |
| Total Distributions | (1,201,846) | (481,203) |
| Capital Share Transactions | | |
| Investor Shares | 169,815 | (892,889) |
| Admiral Shares | 723,984 | 611,582 |
| Net Increase (Decrease) from Capital Share Transactions | 893,799 | (281,307) |
| Total Increase (Decrease) | 731,803 | 889,126 |
| Net Assets | | |
| Beginning of Period | 10,830,318 | 9,941,192 |
| End of Period2 | 11,562,121 | 10,830,318 |
1 Includes fiscal 2015 and 2014 short-term gain distributions totaling $135,145,000 and $11,778,000, respectively. Short-term gain distributions are treated as ordinary income dividends for tax purposes.
2 Net Assets—End of Period includes undistributed (overdistributed) net investment income of $10,884,000 and $37,745,000.
See accompanying Notes, which are an integral part of the Financial Statements.
21
| | | | | | |
| Morgan Growth Fund | | | | | | |
| |
| |
| Financial Highlights | | | | | | |
| |
| |
| Investor Shares | | | | | | |
| | Six Months | | | | | |
| | Ended | | | | | |
| For a Share Outstanding | March 31, | | | Year Ended September 30, |
| Throughout Each Period | 2015 | 2014 | 2013 | 2012 | 2011 | 2010 |
| Net Asset Value, Beginning of Period | $27.07 | $24.26 | $20.31 | $16.06 | $16.04 | $14.32 |
| Investment Operations | | | | | | |
| Net Investment Income | .135 | .187 | .230 | .141 | .087 | .097 |
| Net Realized and Unrealized Gain | | | | | | |
| (Loss) on Investments | 2.301 | 3.785 | 3.925 | 4.209 | .029 | 1.733 |
| Total from Investment Operations | 2.436 | 3.972 | 4.155 | 4.350 | .116 | 1.830 |
| Distributions | | | | | | |
| Dividends from Net Investment Income | (.191) | (.172) | (. 205) | (.100) | (. 096) | (.110) |
| Distributions from Realized Capital Gains | (2.825) | (.990) | — | — | — | — |
| Total Distributions | (3.016) | (1.162) | (.205) | (.100) | (.096) | (.110) |
| Net Asset Value, End of Period | $26.49 | $27.07 | $24.26 | $20.31 | $16.06 | $16.04 |
| |
| Total Return1 | 9.73% | 16.85% | 20.69% | 27.18% | 0.66% | 12.81% |
| |
| Ratios/Supplemental Data | | | | | | |
| Net Assets, End of Period (Millions) | $4,682 | $4,580 | $4,922 | $5,283 | $5,009 | $5,432 |
| Ratio of Total Expenses to | | | | | | |
| Average Net Assets2 | 0.41% | 0.40% | 0.39% | 0.40% | 0.42% | 0.44% |
| Ratio of Net Investment Income to | | | | | | |
| Average Net Assets | 0.92% | 0.72% | 1.06% | 0.74% | 0.47% | 0.62% |
| Portfolio Turnover Rate | 40% | 52% | 53% | 49% | 55% | 60% |
The expense ratio, net income ratio, and turnover rate for the current period have been annualized.
1 Total returns do not include account service fees that may have applied in the periods shown. Fund prospectuses provide information about any applicable account service fees.
2 Includes performance-based investment advisory fee increases (decreases) of (0.02%), (0.04%), (0.05%), (0.04%), (0.01%), and 0.01%.
See accompanying Notes, which are an integral part of the Financial Statements.
22
| | | | | | |
| Morgan Growth Fund | | | | | | |
| |
| |
| Financial Highlights | | | | | | |
| |
| |
| Admiral Shares | | | | | | |
| | Six Months | | | | | |
| | Ended | | | | | |
| For a Share Outstanding | March 31, | | | Year Ended September 30, |
| Throughout Each Period | 2015 | 2014 | 2013 | 2012 | 2011 | 2010 |
| Net Asset Value, Beginning of Period | $83.97 | $75.26 | $63.02 | $49.84 | $49.75 | $44.42 |
| Investment Operations | | | | | | |
| Net Investment Income | . 480 | .719 | . 831 | . 535 | . 342 | . 372 |
| Net Realized and Unrealized Gain (Loss) | | | | | | |
| on Investments | 7.107 | 11.722 | 12.144 | 13.036 | .110 | 5.364 |
| Total from Investment Operations | 7.587 | 12.441 | 12.975 | 13.571 | .452 | 5.736 |
| Distributions | | | | | | |
| Dividends from Net Investment Income | (.727) | (. 664) | (.735) | (. 391) | (. 362) | (. 406) |
| Distributions from Realized Capital Gains | (8.750) | (3.067) | — | — | — | — |
| Total Distributions | (9.477) | (3.731) | (.735) | (.391) | (.362) | (.406) |
| Net Asset Value, End of Period | $82.08 | $83.97 | $75.26 | $63.02 | $49.84 | $49.75 |
| |
| Total Return1 | 9.78% | 17.03% | 20.86% | 27.35% | 0.83% | 12.95% |
| |
| Ratios/Supplemental Data | | | | | | |
| Net Assets, End of Period (Millions) | $6,880 | $6,250 | $5,019 | $3,725 | $2,554 | $2,445 |
| Ratio of Total Expenses to | | | | | | |
| Average Net Assets2 | 0.27% | 0.26% | 0.25% | 0.26% | 0.28% | 0.30% |
| Ratio of Net Investment Income to | | | | | | |
| Average Net Assets | 1.06% | 0.86% | 1.20% | 0.88% | 0.61% | 0.76% |
| Portfolio Turnover Rate | 40% | 52% | 53% | 49% | 55% | 60% |
The expense ratio, net income ratio, and turnover rate for the current period have been annualized.
1 Total returns do not include account service fees that may have applied in the periods shown. Fund prospectuses provide information about any applicable account service fees.
2 Includes performance-based investment advisory fee increases (decreases) of (0.02%), (0.04%), (0.05%), (0.04%), (0.01%), and 0.01%.
See accompanying Notes, which are an integral part of the Financial Statements.
23
Morgan Growth Fund
Notes to Financial Statements
Vanguard Morgan Growth Fund is registered under the Investment Company Act of 1940 as an open-end investment company, or mutual fund. The fund offers two classes of shares: Investor Shares and Admiral Shares. Investor Shares are available to any investor who meets the fund’s minimum purchase requirements. Admiral Shares are designed for investors who meet certain administrative, service, and account-size criteria.
A. The following significant accounting policies conform to generally accepted accounting principles for U.S. investment companies. The fund consistently follows such policies in preparing its financial statements.
1. Security Valuation: Securities are valued as of the close of trading on the New York Stock Exchange (generally 4 p.m., Eastern time) on the valuation date. Equity securities are valued at the latest quoted sales prices or official closing prices taken from the primary market in which each security trades; such securities not traded on the valuation date are valued at the mean of the latest quoted bid and asked prices. Securities for which market quotations are not readily available, or whose values have been affected by events occurring before the fund’s pricing time but after the close of the securities’ primary markets, are valued at their fair values calculated according to procedures adopted by the board of trustees. These procedures include obtaining quotations from an independent pricing service, monitoring news to identify significant market- or security-specific events, and evaluating changes in the values of foreign market proxies (for example, ADRs, futures contracts, or exchange-traded funds), between the time the foreign markets close and the fund’s pricing time. When fair-value pricing is employed, the prices of securities used by a fund to calculate its net asset value may differ from quoted or published prices for the same securities. Investments in Vanguard Market Liquidity Fund are valued at that fund’s net asset value. Temporary cash investments acquired over 60 days to maturity are valued using the latest bid prices or using valuations based on a matrix system (which considers such factors as security prices, yields, maturities, and ratings), both as furnished by independent pricing services. Other temporary cash investments are valued at amortized cost, which approximates market value.
2. Foreign Currency: Securities and other assets and liabilities denominated in foreign currencies are translated into U.S. dollars using exchange rates obtained from an independent third party as of the fund’s pricing time on the valuation date. Realized gains (losses) and unrealized appreciation (depreciation) on investment securities include the effects of changes in exchange rates since the securities were purchased, combined with the effects of changes in security prices. Fluctuations in the value of other assets and liabilities resulting from changes in exchange rates are recorded as unrealized foreign currency gains (losses) until the assets or liabilities are settled in cash, at which time they are recorded as realized foreign currency gains (losses).
3. Futures Contracts: The fund uses index futures contracts to a limited extent, with the objective of maintaining full exposure to the stock market while maintaining liquidity. The fund may purchase or sell futures contracts to achieve a desired level of investment, whether to accommodate portfolio turnover or cash flows from capital share transactions. The primary risks associated with the use of futures contracts are imperfect correlation between changes in market values of stocks held by the fund and the prices of futures contracts, and the possibility of an illiquid market. Counterparty risk involving futures is mitigated because a regulated clearinghouse is the counterparty instead of the clearing broker. To further mitigate counterparty risk, the fund trades futures contracts on an exchange, monitors the financial strength of its clearing brokers and clearinghouse, and has entered into clearing agreements with its clearing brokers. The clearinghouse imposes initial margin requirements to secure the fund’s performance and requires daily settlement of variation margin representing changes in the market value of each contract.
24
Morgan Growth Fund
Futures contracts are valued at their quoted daily settlement prices. The aggregate settlement values of the contracts are not recorded in the Statement of Net Assets. Fluctuations in the value of the contracts are recorded in the Statement of Net Assets as an asset (liability) and in the Statement of Operations as unrealized appreciation (depreciation) until the contracts are closed, when they are recorded as realized futures gains (losses).
During the six months ended March 31, 2015, the fund’s average investments in long and short futures contracts represented less than 1% and 0% of net assets, respectively, based on the average of aggregate settlement values at each quarter-end during the period.
4. Repurchase Agreements: The fund enters into repurchase agreements with institutional counter-parties. Securities pledged as collateral to the fund under repurchase agreements are held by a custodian bank until the agreements mature. Each agreement requires that the market value of the collateral be sufficient to cover payments of interest and principal. The fund further mitigates its counterparty risk by entering into repurchase agreements only with a diverse group of prequalified counterparties, monitoring their financial strength, and entering into master repurchase agreements with its counterparties. The master repurchase agreements provide that, in the event of a counter-party’s default (including bankruptcy), the fund may terminate any repurchase agreements with that counterparty, determine the net amount owed, and sell or retain the collateral up to the net amount owed to the fund. Such action may be subject to legal proceedings, which may delay or limit the disposition of collateral.
5. Federal Income Taxes: The fund intends to continue to qualify as a regulated investment company and distribute all of its taxable income. Management has analyzed the fund’s tax positions taken for all open federal income tax years (September 30, 2011–2014), and for the period ended March 31, 2015, and has concluded that no provision for federal income tax is required in the fund’s financial statements.
6. Distributions: Distributions to shareholders are recorded on the ex-dividend date.
7. Securities Lending: To earn additional income, the fund lends its securities to qualified institutional borrowers. Security loans are required to be secured at all times by collateral in an amount at least equal to the market value of securities loaned. Daily market fluctuations could cause the value of loaned securities to be more or less than the value of the collateral received. When this occurs, the collateral is adjusted and settled on the next business day. The fund further mitigates its counterparty risk by entering into securities lending transactions only with a diverse group of prequalified counterparties, monitoring their financial strength, and entering into master securities lending agreements with its counterparties. The master securities lending agreements provide that, in the event of a counterparty’s default (including bankruptcy), the fund may terminate any loans with that borrower, determine the net amount owed, and sell or retain the collateral up to the net amount owed to the fund; however, such actions may be subject to legal proceedings. While collateral mitigates counterparty risk, in the absence of a default the fund may experience delays and costs in recovering the securities loaned. The fund invests cash collateral received in Vanguard Market Liquidity Fund, and records a liability in the Statement of Net Assets for the return of the collateral, during the period the securities are on loan. Securities lending income represents fees charged to borrowers plus income earned on invested cash collateral, less expenses associated with the loan.
8. Credit Facility: The fund and certain other funds managed by The Vanguard Group participate in a $3 billion committed credit facility provided by a syndicate of lenders pursuant to a credit agreement that may be renewed annually; each fund is individually liable for its borrowings, if any, under the credit facility. Borrowings may be utilized for temporary and emergency purposes, and are subject
25
Morgan Growth Fund
to the fund’s regulatory and contractual borrowing restrictions. The participating funds are charged administrative fees and an annual commitment fee of 0.06% of the undrawn amount of the facility; these fees are allocated to the funds based on a method approved by the fund’s board of trustees and included in Management and Administrative expenses on the fund’s Statement of Operations. Any borrowings under this facility bear interest at a rate equal to the higher of the federal funds rate or LIBOR reference rate plus an agreed-upon spread.
The fund had no borrowings outstanding at March 31, 2015, or at any time during the period then ended.
9. Other: Dividend income is recorded on the ex-dividend date. Interest income includes income distributions received from Vanguard Market Liquidity Fund and is accrued daily. Premiums and discounts on debt securities purchased are amortized and accreted, respectively, to interest income over the lives of the respective securities. Security transactions are accounted for on the date securities are bought or sold. Costs used to determine realized gains (losses) on the sale of investment securities are those of the specific securities sold.
Each class of shares has equal rights as to assets and earnings, except that each class separately bears certain class-specific expenses related to maintenance of shareholder accounts (included in Management and Administrative expenses) and shareholder reporting. Marketing and distribution expenses are allocated to each class of shares based on a method approved by the board of trustees. Income, other non-class-specific expenses, and gains and losses on investments are allocated to each class of shares based on its relative net assets.
B. Wellington Management Company LLP, Jennison Associates LLC, Frontier Capital Management Co., LLC, and Kalmar Investment Advisers each provide investment advisory services to a portion of the fund for a fee calculated at an annual percentage rate of average net assets managed by the advisor. The basic fee of Wellington Management Company LLP is subject to quarterly adjustments based on performance for the preceding three years relative to the Russell 3000 Growth Index. The basic fee of Jennison Associates LLC is subject to quarterly adjustments based on performance for the preceding three years relative to the Russell 1000 Growth Index. The basic fees of Frontier Capital Management Co., LLC, and Kalmar Investment Advisers are subject to quarterly adjustments based on performance for the preceding three years relative to the Russell Midcap Growth Index.
The Vanguard Group provides investment advisory services to a portion of the fund on an at-cost basis; the fund paid Vanguard advisory fees of $395,000 for the six months ended March 31, 2015.
For the six months ended March 31, 2015, the aggregate investment advisory fee represented an effective annual basic rate of 0.16% of the fund’s average net assets, before a decrease of $1,159,000 (0.02%) based on performance.
C. The Vanguard Group furnishes at cost corporate management, administrative, marketing, and distribution services. The costs of such services are allocated to the fund based on methods approved by the board of trustees. The fund has committed to invest up to 0.40% of its net assets in Vanguard. At March 31, 2015, the fund had contributed capital of $1,053,000 to Vanguard (included in Other Assets), representing 0.01% of the fund’s net assets and 0.42% of Vanguard’s capitalization. The fund’s trustees and officers are also directors and officers of Vanguard.
26
Morgan Growth Fund
D. The fund has asked its investment advisors to direct certain security trades, subject to obtaining the best price and execution, to brokers who have agreed to rebate to the fund part of the commissions generated. Such rebates are used solely to reduce the fund’s management and administrative expenses. For the six months ended March 31, 2015, these arrangements reduced the fund’s expenses by $138,000 (an annual rate of 0.00% of average net assets).
E. Various inputs may be used to determine the value of the fund’s investments. These inputs are summarized in three broad levels for financial statement purposes. The inputs or methodologies used to value securities are not necessarily an indication of the risk associated with investing in those securities.
Level 1—Quoted prices in active markets for identical securities.
Level 2—Other significant observable inputs (including quoted prices for similar securities, interest rates, prepayment speeds, credit risk, etc.).
Level 3—Significant unobservable inputs (including the fund’s own assumptions used to determine the fair value of investments).
The following table summarizes the market value of the fund’s investments as of March 31, 2015, based on the inputs used to value them:
| | | |
| | Level 1 | Level 2 | Level 3 |
| Investments | ($000) | ($000) | ($000) |
| Common Stocks | 11,351,221 | 22,998 | — |
| Temporary Cash Investments | 253,624 | 19,499 | — |
| Futures Contracts—Liabilities1 | (741) | — | — |
| Total | 11,604,104 | 42,497 | — |
| 1 Represents variation margin on the last day of the reporting period. | | | |
F. At March 31, 2015, the aggregate settlement value of open futures contracts and the related unrealized appreciation (depreciation) were:
| | | | |
| | | | | ($000) |
| | | | Aggregate | |
| | | Number of | Settlement | Unrealized |
| | | Long (Short) | Value | Appreciation |
| Futures Contracts | Expiration | Contracts | Long (Short) | (Depreciation) |
| S&P 500 Index | June 2015 | 193 | 99,434 | (338) |
| E-mini S&P 500 Index | June 2015 | 37 | 3,812 | (56) |
| | | | | (394) |
Unrealized appreciation (depreciation) on open futures contracts is required to be treated as realized gain (loss) for tax purposes.
G. Distributions are determined on a tax basis and may differ from net investment income and realized capital gains for financial reporting purposes. Differences may be permanent or temporary. Permanent differences are reclassified among capital accounts in the financial statements to reflect their tax character. Temporary differences arise when certain items of income, expense, gain, or loss are recognized in different periods for financial statement and tax purposes. These differences will
27
Morgan Growth Fund
reverse at some time in the future. Differences in classification may also result from the treatment of short-term gains as ordinary income for tax purposes. The fund’s tax-basis capital gains and losses are determined only at the end of each fiscal year.
During the six months ended March 31, 2015, the fund realized net foreign currency losses of $20,000, which decreased distributable net income for tax purposes; accordingly, such losses have been reclassified from accumulated net realized gains to undistributed net investment income.
At March 31, 2015, the cost of investment securities for tax purposes was $7,985,783,000. Net unrealized appreciation of investment securities for tax purposes was $3,661,559,000, consisting of unrealized gains of $3,739,329,000 on securities that had risen in value since their purchase and $77,770,000 in unrealized losses on securities that had fallen in value since their purchase.
H. During the six months ended March 31, 2015, the fund purchased $2,242,868,000 of investment securities and sold $2,576,401,000 of investment securities, other than temporary cash investments.
| | | | |
| I. Capital share transactions for each class of shares were: | | | |
| | Six Months Ended | | Year Ended |
| | March 31, 2015 | September 30, 2014 |
| | Amount | Shares | Amount | Shares |
| | ($000) | (000) | ($000) | (000) |
| Investor Shares | | | | |
| Issued | 180,652 | 6,832 | 320,152 | 12,401 |
| Issued in Lieu of Cash Distributions | 489,705 | 19,699 | 213,461 | 8,667 |
| Redeemed | (500,542) | (18,959) | (1,426,502) | (54,768) |
| Net Increase (Decrease)—Investor Shares | 169,815 | 7,572 | (892,889) | (33,700) |
| Admiral Shares | | | | |
| Issued | 467,560 | 5,719 | 1,260,885 | 15,671 |
| Issued in Lieu of Cash Distributions | 648,115 | 8,415 | 242,786 | 3,182 |
| Redeemed | (391,691) | (4,753) | (892,089) | (11,116) |
| Net Increase (Decrease)—Admiral Shares | 723,984 | 9,381 | 611,582 | 7,737 |
J. Management has determined that no material events or transactions occurred subsequent to March 31, 2015, that would require recognition or disclosure in these financial statements.
28
About Your Fund’s Expenses
As a shareholder of the fund, you incur ongoing costs, which include costs for portfolio management, administrative services, and shareholder reports (like this one), among others. Operating expenses, which are deducted from a fund’s gross income, directly reduce the investment return of the fund.
A fund’s expenses are expressed as a percentage of its average net assets. This figure is known as the expense ratio. The following examples are intended to help you understand the ongoing costs (in dollars) of investing in your fund and to compare these costs with those of other mutual funds. The examples are based on an investment of $1,000 made at the beginning of the period shown and held for the entire period.
The accompanying table illustrates your fund’s costs in two ways:
• Based on actual fund return. This section helps you to estimate the actual expenses that you paid over the period. The ”Ending Account Value“ shown is derived from the fund‘s actual return, and the third column shows the dollar amount that would have been paid by an investor who started with $1,000 in the fund. You may use the information here, together with the amount you invested, to estimate the expenses that you paid over the period.
To do so, simply divide your account value by $1,000 (for example, an $8,600 account value divided by $1,000 = 8.6), then multiply the result by the number given for your fund under the heading ”Expenses Paid During Period.“
• Based on hypothetical 5% yearly return. This section is intended to help you compare your fund‘s costs with those of other mutual funds. It assumes that the fund had a yearly return of 5% before expenses, but that the expense ratio is unchanged. In this case—because the return used is not the fund’s actual return—the results do not apply to your investment. The example is useful in making comparisons because the Securities and Exchange Commission requires all mutual funds to calculate expenses based on a 5% return. You can assess your fund’s costs by comparing this hypothetical example with the hypothetical examples that appear in shareholder reports of other funds.
Note that the expenses shown in the table are meant to highlight and help you compare ongoing costs only and do not reflect transaction costs incurred by the fund for buying and selling securities. Further, the expenses do not include any purchase, redemption, or account service fees described in the fund prospectus. If such fees were applied to your account, your costs would be higher. Your fund does not carry a “sales load.”
The calculations assume no shares were bought or sold during the period. Your actual costs may have been higher or lower, depending on the amount of your investment and the timing of any purchases or redemptions.
You can find more information about the fund’s expenses, including annual expense ratios, in the Financial Statements section of this report. For additional information on operating expenses and other shareholder costs, please refer to your fund’s current prospectus.
29
| | | |
| Six Months Ended March 31, 2015 | | | |
| | Beginning | Ending | Expenses |
| | Account Value | Account Value | Paid During |
| Morgan Growth Fund | 9/30/2014 | 3/31/2015 | Period |
| Based on Actual Fund Return | | | |
| Investor Shares | $1,000.00 | $1,097.29 | $2.14 |
| Admiral Shares | 1,000.00 | 1,097.77 | 1.41 |
| Based on Hypothetical 5% Yearly Return | | | |
| Investor Shares | $1,000.00 | $1,022.89 | $2.07 |
| Admiral Shares | 1,000.00 | 1,023.59 | 1.36 |
The calculations are based on expenses incurred in the most recent six-month period. The fund’s annualized six-month expense ratios for that period are 0.41% for Investor Shares and 0.27% for Admiral Shares. The dollar amounts shown as “Expenses Paid” are equal to the annualized expense ratio multiplied by the average account value over the period, multiplied by the number of days in the most recent six-month period, then divided by the number of days in the most recent 12-month period.
30
Trustees Approve Advisory Arrangements
The board of trustees of Vanguard Morgan Growth Fund has renewed the fund’s investment advisory arrangements with Frontier Capital Management Co., LLC (Frontier), Jennison Associates LLC (Jennison), Kalmar Investment Advisers (Kalmar), Wellington Management Company LLP (Wellington Management), and The Vanguard Group, Inc. (Vanguard) (Vanguard’s Equity Investment Group through its Quantitative Equity Group). The board determined that renewing the fund’s advisory arrangements was in the best interests of the fund and its shareholders.
The board based its decisions upon an evaluation of each advisor’s investment staff, portfolio management process, and performance. The trustees considered the factors discussed below, among others. However, no single factor determined whether the board approved the arrangements. Rather, it was the totality of the circumstances that drove the board’s decisions.
Nature, extent, and quality of services
The board considered the quality of the fund’s investment management services over both the short and long term, and took into account the organizational depth and stability of each advisor. The board noted the following:
Frontier. Frontier, founded in 1980, is known for a fundamental, research-intensive investment approach focused on small and midsized stocks. The firm’s bottom-up, collaborative investment approach seeks to identify companies with a combination of superior growth potential and attractive valuation. Frontier’s investment process emphasizes companies with understandable business models, good franchises, accelerating sales and margins, and healthy balance sheets. Analysts regularly interact with management and other companies in the supply chain to effectively construct a portfolio of stocks for the fund. Frontier has managed a portion of the fund since 2008.
Jennison. Jennison, founded in 1969, is an indirect, wholly owned subsidiary of Prudential Financial, Inc. The firm currently oversees a wide range of equity and fixed income strategies. The investment team at Jennison uses internal fundamental research and a highly interactive bottom-up stock selection process to identify companies that exhibit above-average growth in units, revenues, earnings, and cash flows. When evaluating a company for purchase or sale, the analysis focuses on the duration of the growth opportunity and seeks to capture inflection points in the company’s growth. Jennison has managed a portion of the fund since 2007.
Kalmar. Kalmar, together with its parent company, Kalmar Investments Inc., founded in 1982, specializes in small- and mid-capitalization growth stocks. Kalmar is a research-driven investment firm that is entirely focused on the management of “growth with value” small- and mid-cap equity portfolios. Kalmar believes that there is a high-reward/low-risk anomaly offered by the equity market in the stocks of solid, well-managed, rapidly growing smaller companies. Through independent fundamental research, Kalmar attempts to discover such companies, buy them at undervalued levels, and own them for the longer term. Kalmar has managed a portion of the fund since 2008.
Wellington Management. Wellington Management, founded in 1928, is among the nation’s oldest and most respected institutional investment managers. The investment team at Wellington Management seeks to create a portfolio with balanced exposure to growth, quality, and valuation in an attempt to deliver consistent results over time. Research focuses on large- and mid-capitalization companies with a proven record of sales and earnings growth, profitability, and cash-flow generation. Wellington Management has advised the fund since 1968.
31
Vanguard. Vanguard has been managing investments for more than three decades. The Quantitative Equity Group adheres to a sound, disciplined investment management process; the team has considerable experience, stability, and depth. Vanguard has managed a portion of the fund since 1993.
The board concluded that each advisor’s experience, stability, depth, and performance, among other factors, warranted continuation of the advisory arrangements.
Investment performance
The board considered the short- and long-term performance of the fund and each advisor, including any periods of outperformance or underperformance relative to a benchmark index and peer group. The board concluded that the performance was such that each advisory arrangement should continue. Information about the fund’s most recent performance can be found in the Performance Summary section of this report.
Cost
The board concluded that the fund’s expense ratio was well below the average expense ratio charged by funds in its peer group and that the fund’s advisory fee rate was also well below its peer-group average. Information about the fund’s expenses appears in the About Your Fund’s Expenses section of this report as well as in the Financial Statements section, which also includes information about the fund’s advisory fee rate.
The board did not consider profitability of Frontier, Jennison, Kalmar, and Wellington Management in determining whether to approve the advisory fees, because the firms are independent of Vanguard and the advisory fees are the result of arm’s-length negotiations. The board does not conduct a profitability analysis of Vanguard, because of Vanguard’s unique “at-cost” structure. Unlike most other mutual fund management companies, Vanguard is owned by the funds it oversees, and produces “profits” only in the form of reduced expenses for fund shareholders.
The benefit of economies of scale
The board concluded that the fund’s shareholders benefit from economies of scale because of breakpoints in the advisory fee schedules for Frontier, Jennison, Kalmar, and Wellington Management. The breakpoints reduce the effective rate of the fees as the fund’s assets managed by each advisor increase. The board also concluded that the fund’s at-cost arrangement with Vanguard ensures that the fund will realize economies of scale as it grows, with the cost to shareholders declining as fund assets managed by Vanguard increase.
The board will consider whether to renew the advisory arrangements again after a one-year period.
32
Glossary
30-Day SEC Yield. A fund’s 30-day SEC yield is derived using a formula specified by the U.S. Securities and Exchange Commission. Under the formula, data related to the fund’s security holdings in the previous 30 days are used to calculate the fund’s hypothetical net income for that period, which is then annualized and divided by the fund’s estimated average net assets over the calculation period. For the purposes of this calculation, a security’s income is based on its current market yield to maturity (for bonds), its actual income (for asset-backed securities), or its projected dividend yield (for stocks). Because the SEC yield represents hypothetical annualized income, it will differ—at times significantly—from the fund’s actual experience. As a result, the fund’s income distributions may be higher or lower than implied by the SEC yield.
Beta. A measure of the magnitude of a fund’s past share-price fluctuations in relation to the ups and downs of a given market index. The index is assigned a beta of 1.00. Compared with a given index, a fund with a beta of 1.20 typically would have seen its share price rise or fall by 12% when the index rose or fell by 10%. For this report, beta is based on returns over the past 36 months for both the fund and the index. Note that a fund’s beta should be reviewed in conjunction with its R-squared (see definition). The lower the R-squared, the less correlation there is between the fund and the index, and the less reliable beta is as an indicator of volatility.
Dividend Yield. Dividend income earned by stocks, expressed as a percentage of the aggregate market value (or of net asset value, for a fund). The yield is determined by dividing the amount of the annual dividends by the aggregate value (or net asset value) at the end of the period. For a fund, the dividend yield is based solely on stock holdings and does not include any income produced by other investments.
Earnings Growth Rate. The average annual rate of growth in earnings over the past five years for the stocks now in a fund.
Equity Exposure. A measure that reflects a fund’s investments in stocks and stock futures. Any holdings in short-term reserves are excluded.
Expense Ratio. A fund’s total annual operating expenses expressed as a percentage of the fund’s average net assets. The expense ratio includes management and administrative expenses, but does not include the transaction costs of buying and selling portfolio securities.
Foreign Holdings. The percentage of a fund represented by securities or depositary receipts of companies based outside the United States.
Inception Date. The date on which the assets of a fund (or one of its share classes) are first invested in accordance with the fund’s investment objective. For funds with a subscription period, the inception date is the day after that period ends. Investment performance is measured from the inception date.
Median Market Cap. An indicator of the size of companies in which a fund invests; the midpoint of market capitalization (market price x shares outstanding) of a fund’s stocks, weighted by the proportion of the fund’s assets invested in each stock. Stocks representing half of the fund’s assets have market capitalizations above the median, and the rest are below it.
Price/Book Ratio. The share price of a stock divided by its net worth, or book value, per share. For a fund, the weighted average price/book ratio of the stocks it holds.
33
Price/Earnings Ratio. The ratio of a stock’s current price to its per-share earnings over the past year. For a fund, the weighted average P/E of the stocks it holds. P/E is an indicator of market expectations about corporate prospects; the higher the P/E, the greater the expectations for a company’s future growth.
R-Squared. A measure of how much of a fund’s past returns can be explained by the returns from the market in general, as measured by a given index. If a fund’s total returns were precisely synchronized with an index’s returns, its R-squared would be 1.00. If the fund’s returns bore no relationship to the index’s returns, its R-squared would be 0. For this report, R-squared is based on returns over the past 36 months for both the fund and the index.
Return on Equity. The annual average rate of return generated by a company during the past five years for each dollar of shareholder’s equity (net income divided by shareholder’s equity). For a fund, the weighted average return on equity for the companies whose stocks it holds.
Short-Term Reserves. The percentage of a fund invested in highly liquid, short-term securities that can be readily converted to cash.
Turnover Rate. An indication of the fund’s trading activity. Funds with high turnover rates incur higher transaction costs and may be more likely to distribute capital gains (which may be taxable to investors). The turnover rate excludes in-kind transactions, which have minimal impact on costs.
34
This page intentionally left blank.
The People Who Govern Your Fund
The trustees of your mutual fund are there to see that the fund is operated and managed in your best interests since, as a shareholder, you are a part owner of the fund. Your fund’s trustees also serve on the board of directors of The Vanguard Group, Inc., which is owned by the Vanguard funds and provides services to them on an at-cost basis.
A majority of Vanguard’s board members are independent, meaning that they have no affiliation with Vanguard or the funds they oversee, apart from the sizable personal investments they have made as private individuals. The independent board members have distinguished backgrounds in business, academia, and public service. Each of the trustees and executive officers oversees 178 Vanguard funds.
The following table provides information for each trustee and executive officer of the fund. More information about the trustees is in the Statement of Additional Information, which can be obtained, without charge, by contacting Vanguard at 800-662-7447, or online at vanguard.com.
InterestedTrustee1
F. William McNabb III
Born 1957. Trustee Since July 2009. Chairman of the Board. Principal Occupation(s) During the Past Five Years and Other Experience: Chairman of the Board of The Vanguard Group, Inc., and of each of the investment companies served by The Vanguard Group, since January 2010; Director of The Vanguard Group since 2008; Chief Executive Officer and President of The Vanguard Group, and of each of the investment companies served by The Vanguard Group, since 2008; Director of Vanguard Marketing Corporation; Managing Director of The Vanguard Group (1995–2008).
IndependentTrustees
Emerson U. Fullwood
Born 1948. Trustee Since January 2008. Principal Occupation(s) During the Past Five Years and Other Experience: Executive Chief Staff and Marketing Officer for North America and Corporate Vice President (retired 2008) of Xerox Corporation (document management products and services); Executive in Residence and 2009–2010 Distinguished Minett Professor at the Rochester Institute of Technology; Director of SPX Corporation (multi-industry manufacturing), the United Way of Rochester, Amerigroup Corporation (managed health care), the University of Rochester Medical Center, Monroe Community College Foundation, and North Carolina A&T University.
Rajiv L. Gupta
Born 1945. Trustee Since December 2001.2 Principal Occupation(s) During the Past Five Years and Other Experience: Chairman and Chief Executive Officer (retired 2009) and President (2006–2008) of Rohm and Haas Co. (chemicals); Director of Tyco International PLC (diversified manufacturing and services), Hewlett-Packard Co. (electronic computer manufacturing), and Delphi Automotive PLC (automotive components); Senior Advisor at New Mountain Capital.
Amy Gutmann
Born 1949. Trustee Since June 2006. Principal Occupation(s) During the Past Five Years and Other Experience: President of the University of Pennsylvania; Christopher H. Browne Distinguished Professor of Political Science, School of Arts and Sciences, and Professor of Communication, Annenberg School for Communication, with secondary faculty appointments in the Department of Philosophy, School of Arts and Sciences, and at the Graduate School of Education, University of Pennsylvania; Trustee of the National Constitution Center; Chair of the Presidential Commission for the Study of Bioethical Issues.
JoAnn Heffernan Heisen
Born 1950. Trustee Since July 1998. Principal Occupation(s) During the Past Five Years and Other Experience: Corporate Vice President and Chief Global Diversity Officer (retired 2008) and Member of the Executive Committee (1997–2008) of Johnson & Johnson (pharmaceuticals/medical devices/ consumer products); Director of Skytop Lodge Corporation (hotels), the University Medical Center at Princeton, the Robert Wood Johnson Foundation, and the Center for Talent Innovation; Member of the Advisory Board of the Institute for Women’s Leadership at Rutgers University.
F. Joseph Loughrey
Born 1949. Trustee Since October 2009. Principal Occupation(s) During the Past Five Years and Other Experience: President and Chief Operating Officer (retired 2009) of Cummins Inc. (industrial machinery); Chairman of the Board of Hillenbrand, Inc. (specialized consumer services), and of Oxfam America; Director of SKF AB (industrial machinery), Hyster-Yale Materials Handling, Inc. (forklift trucks), the Lumina Foundation for Education, and the V Foundation for Cancer Research; Member of the Advisory Council for the College of Arts and Letters and of the Advisory Board to the Kellogg Institute for International Studies, both at the University of Notre Dame.
Mark Loughridge
Born 1953. Trustee Since March 2012. Principal Occupation(s) During the Past Five Years and Other Experience: Senior Vice President and Chief Financial Officer (retired 2013) at IBM (information technology services); Fiduciary Member of IBM’s Retirement Plan Committee (2004–2013); Director of the Dow Chemical Company; Member of the Council on Chicago Booth.
Scott C. Malpass
Born 1962. Trustee Since March 2012. Principal Occupation(s) During the Past Five Years and Other Experience: Chief Investment Officer and Vice President at the University of Notre Dame; Assistant Professor of Finance at the Mendoza College of Business at Notre Dame; Member of the Notre Dame 403(b) Investment Committee; Board Member of TIFF Advisory Services, Inc., and Catholic Investment Services, Inc. (investment advisors); Member of the Investment Advisory Committee of Major League Baseball.
André F. Perold
Born 1952. Trustee Since December 2004. Principal Occupation(s) During the Past Five Years and Other Experience: George Gund Professor of Finance and Banking, Emeritus at the Harvard Business School (retired 2011); Chief Investment Officer and Managing Partner of HighVista Strategies LLC (private investment firm); Director of Rand Merchant Bank; Overseer of the Museum of Fine Arts Boston.
Peter F. Volanakis
Born 1955. Trustee Since July 2009. Principal Occupation(s) During the Past Five Years and Other Experience: President and Chief Operating Officer (retired 2010) of Corning Incorporated (communications equipment); Trustee of Colby-Sawyer College; Member of the Advisory Board of the Norris Cotton Cancer Center and of the Advisory Board of the Parthenon Group (strategy consulting).
Executive Officers
Glenn Booraem
Born 1967. Controller Since July 2010. Principal Occupation(s) During the Past Five Years and Other Experience: Principal of The Vanguard Group, Inc.; Controller of each of the investment companies served by The Vanguard Group; Assistant Controller of each of the investment companies served by The Vanguard Group (2001–2010).
Thomas J. Higgins
Born 1957. Chief Financial Officer Since September 2008. Principal Occupation(s) During the Past Five Years and Other Experience: Principal of The Vanguard Group, Inc.; Chief Financial Officer of each of the investment companies served by The Vanguard Group; Treasurer of each of the investment companies served by The Vanguard Group (1998–2008).
Kathryn J. Hyatt
Born 1955. Treasurer Since November 2008. Principal Occupation(s) During the Past Five Years and Other Experience: Principal of The Vanguard Group, Inc.; Treasurer of each of the investment companies served by The Vanguard Group; Assistant Treasurer of each of the investment companies served by The Vanguard Group (1988–2008).
Heidi Stam
Born 1956. Secretary Since July 2005. Principal Occupation(s) During the Past Five Years and Other Experience: Managing Director of The Vanguard Group, Inc.; General Counsel of The Vanguard Group; Secretary of The Vanguard Group and of each of the investment companies served by The Vanguard Group; Director and Senior Vice President of Vanguard Marketing Corporation.
Vanguard Senior Management Team
| |
Mortimer J. Buckley Kathleen C. Gubanich Paul A. Heller Martha G. King John T. Marcante | Chris D. McIsaac Michael S. Miller James M. Norris Glenn W. Reed |
Chairman Emeritus and Senior Advisor
John J. Brennan
Chairman, 1996–2009
Chief Executive Officer and President, 1996–2008
Founder
John C. Bogle
Chairman and Chief Executive Officer, 1974–1996
1 Mr. McNabb is considered an “interested person,” as defined in the Investment Company Act of 1940, because he is an officer of the Vanguard funds.
2 December 2002 for Vanguard Equity Income Fund, the Vanguard Municipal Bond Funds, and the Vanguard State Tax-Exempt Funds.

|
| P.O. Box 2600 |
| Valley Forge, PA 19482-2600 |
Connect with Vanguard® > vanguard.com
| |
| Fund Information > 800-662-7447 | CFA® is a registered trademark owned by CFA Institute. |
| Direct Investor Account Services > 800-662-2739 | |
| Institutional Investor Services > 800-523-1036 | |
| Text Telephone for People | |
| Who Are Deaf or Hard of Hearing> 800-749-7273 | |
| |
| This material may be used in conjunction | |
| with the offering of shares of any Vanguard | |
| fund only if preceded or accompanied by | |
| the fund’s current prospectus. | |
| |
| All comparative mutual fund data are from Lipper, a | |
| Thomson Reuters Company, or Morningstar, Inc., unless | |
| otherwise noted. | |
| |
| You can obtain a free copy of Vanguard’s proxy voting | |
| guidelines by visiting vanguard.com/proxyreporting or by | |
| calling Vanguard at 800-662-2739. The guidelines are | |
| also available from the SEC’s website, sec.gov. In | |
| addition, you may obtain a free report on how your fund | |
| voted the proxies for securities it owned during the 12 | |
| months ended June 30. To get the report, visit either | |
| vanguard.com/proxyreporting or sec.gov. | |
| |
| You can review and copy information about your fund at | |
| the SEC’s Public Reference Room in Washington, D.C. To | |
| find out more about this public service, call the SEC at | |
| 202-551-8090. Information about your fund is also | |
| available on the SEC’s website, and you can receive | |
| copies of this information, for a fee, by sending a | |
| request in either of two ways: via e-mail addressed to | |
| publicinfo@sec.gov or via regular mail addressed to the | |
| Public Reference Section, Securities and Exchange | |
| Commission, Washington, DC 20549-1520. | |
| |
| | © 2015 The Vanguard Group, Inc. |
| | All rights reserved. |
| | Vanguard Marketing Corporation, Distributor. |
| |
| | Q262 052015 |
Item 2: Code of Ethics.
Not Applicable.
Item 3: Audit Committee Financial Expert.
Not Applicable.
Item 4: Principal Accountant Fees and Services.
(a) Audit Fees.
Not Applicable.
Item 5: Audit Committee of Listed Registrants.
Not Applicable.
Item 6: Investments.
Not Applicable.
Item 7: Disclosure of Proxy Voting Policies and Procedures for Closed-End Management Investment Companies.
Not Applicable.
Item 8: Portfolio Managers of Closed-End Management Investment Companies.
Not Applicable.
Item 9: Purchase of Equity Securities by Closed-End Management Investment Company and Affiliated Purchasers.
Not Applicable.
Item 10: Submission of Matters to a Vote of Security Holders.
Not Applicable.
Item 11: Controls and Procedures.
(a) Disclosure Controls and Procedures. The Principal Executive and Financial Officers concluded that the Registrant’s Disclosure Controls and Procedures are effective based on their evaluation of the Disclosure Controls and Procedures as of a date within 90 days of the filing date of this report.
(b) Internal Control Over Financial Reporting. There were no significant changes in Registrant’s Internal Control Over Financial Reporting or in other factors that could significantly affect this control subsequent to the date of the evaluation, including any corrective actions with regard to significant deficiencies and material weaknesses.
Item 12: Exhibits.
(a) Certifications.
Pursuant to the requirements of the Securities Exchange Act of 1934 and the Investment Company Act of 1940, the registrant has duly caused this report to be signed on its behalf by the undersigned, thereunto duly authorized.
| |
| | VANGUARD MORGAN GROWTH FUND |
| |
| By: | /s/ F. WILLIAM MCNABB III* |
| | F. WILLIAM MCNABB III |
| | CHIEF EXECUTIVE OFFICER |
| |
| Date: May 21, 2015 |
Pursuant to the requirements of the Securities Exchange Act of 1934 and the Investment Company Act of 1940, this report has been signed below by the following persons on behalf of the registrant and in the capacities and on the dates indicated.
| |
| | VANGUARD MORGAN GROWTH FUND |
| |
| By: | /s/ F. WILLIAM MCNABB III* |
| | F. WILLIAM MCNABB III |
| | CHIEF EXECUTIVE OFFICER |
| |
| Date: May 21, 2015 |
| |
| | VANGUARD MORGAN GROWTH FUND |
| |
| By: | /s/ THOMAS J. HIGGINS* |
| | THOMAS J. HIGGINS |
| | CHIEF FINANCIAL OFFICER |
| |
| Date: May 21, 2015 |
* By: /s/ Heidi Stam
Heidi Stam, pursuant to a Power of Attorney filed on April 22, 2014 see file Number 2-17620, Incorporated by Reference.