UNITED STATES
SECURITIES AND EXCHANGE COMMISSION
Washington, D.C. 20549
FORM N-CSR
CERTIFIED SHAREHOLDER REPORT
OF
REGISTERED MANAGEMENT INVESTMENT COMPANIES
| |
| Investment Company Act file number: | 811-01685 |
Name of Registrant: | Vanguard Morgan Growth Fund |
Address of Registrant: | P.O. Box 2600 |
| | Valley Forge, PA 19482 |
Name and address of agent for service: | Heidi Stam, Esquire |
| | P.O. Box 876 |
| | Valley Forge, PA 19482 |
Registrant’s telephone number, including area code: (610) 669-1000 |
Date of fiscal year end: September 30 | |
Date of reporting period: October 1, 2013 – March 31, 2014 |
Item 1: Reports to Shareholders | |

Semiannual Report | March 31, 2014
Vanguard Morgan™ Growth Fund

Vanguard’s Principles for Investing Success
We want to give you the best chance of investment success. These principles,
grounded in Vanguard’s research and experience, can put you on the right path.
Goals. Create clear, appropriate investment goals.
Balance. Develop a suitable asset allocation using broadly diversified funds.
Cost. Minimize cost.
Discipline. Maintain perspective and long-term discipline.
A single theme unites these principles: Focus on the things you can control.
We believe there is no wiser course for any investor.
| |
| Contents | |
| Your Fund’s Total Returns. | 1 |
| Chairman’s Letter. | 2 |
| Advisors’ Report. | 7 |
| Fund Profile. | 12 |
| Performance Summary. | 14 |
| Financial Statements. | 15 |
| About Your Fund’s Expenses. | 30 |
| Trustees Approve Advisory Arrangements. | 32 |
| Glossary. | 34 |
Please note: The opinions expressed in this report are just that—informed opinions. They should not be considered promises or advice.
Also, please keep in mind that the information and opinions cover the period through the date on the front of this report. Of course, the
risks of investing in your fund are spelled out in the prospectus.
See the Glossary for definitions of investment terms used in this report.
About the cover: The ship’s wheel represents leadership and guidance, essential qualities in navigating difficult seas.
This one is a replica based on an 18th-century British vessel. The HMSVanguard, another ship of that era, served as the
flagship for British Admiral Horatio Nelson when he defeated a French fleet at the Battle of the Nile.
Your Fund’s Total Returns
| |
| Six Months Ended March 31, 2014 | |
| | Total |
| | Returns |
| Vanguard Morgan Growth Fund | |
| Investor Shares | 11.54% |
| Admiral™ Shares | 11.61 |
| Russell 3000 Growth Index | 11.43 |
| Multi-Cap Growth Funds Average | 10.66 |
| Multi-Cap Growth Funds Average: Derived from data provided by Lipper, a Thomson Reuters Company. |
| Admiral Shares carry lower expenses and are available to investors who meet certain account-balance requirements. |
| | | | |
| Your Fund’s Performance at a Glance | | | | |
| September 30, 2013, Through March 31, 2014 | | | | |
| | | | Distributions Per Share |
| | Starting | Ending | Income | Capital |
| | Share Price | Share Price | Dividends | Gains |
| Vanguard Morgan Growth Fund | | | | |
| Investor Shares | $24.26 | $25.84 | $0.172 | $0.990 |
| Admiral Shares | 75.26 | 80.08 | 0.664 | 3.067 |
1

Chairman’s Letter
Dear Shareholder,
Surging health care stocks helped Vanguard Morgan Growth Fund deliver a strong performance for the six months ended March 31, 2014. The fund returned 11.54% for Investor Shares and 11.61% for the lower-cost Admiral Shares. That compares with the 11.43% return for the benchmark, the Russell 3000 Growth Index, and the 10.66% average return for peer funds.
In general, the growth stocks that your fund specializes in underperformed their value counterparts for the period. That may have been related to a cooling off of technology stocks, a staple of growth-style investing, during the latter part of the six months: After their torrid advance in 2013, tech stocks hit concerns in the new year about pricey valuations.
Despite recent choppiness, U.S. stocks were productive
The broad U.S. stock market recorded a gain of about 12% for the six months ended March 31, although its path became increasingly rocky over the period’s second half. Corporate earnings, for the most part, continued to rise as the U.S. economy showed modest growth.
The Federal Reserve’s stimulative bond-buying program has helped support the market for several years. Since January, however, the Fed has been making monthly cuts in its purchases, and this has created some apprehension among investors. Slow economic growth in China and the conflict in Ukraine have also caused market turbulence.
2
International stocks returned about 5%. The developed markets of Europe, where the economy has improved somewhat, posted a strong advance, while the developed markets of the Pacific region and emerging markets had weaker results.
Bonds reclaimed some ground after a difficult stretch
Over the six months, the broad U.S. taxable bond market returned 1.70%, a welcome result in view of the market’s struggles for much of calendar-year 2013. The yield of the 10-year Treasury note finished the half year at 2.72%, up from 2.63% at September’s end, but down from nearly 3% on December 31. (Bond prices and yields move in opposite directions.)
Many bond investors have been focusing on the possibility of interest rates moving higher and the negative effect that would have on bond prices. However, there’s a flip side to rising rates. As Greg Davis, the new head of our Fixed Income Group, recently noted, long-term investors can benefit over time because “you’re going to be reinvesting those coupon payments and principal payments at higher rates.”
Municipal bonds returned 3.65% for the six months, another major improvement over calendar-year 2013, as investors waded back into the muni market; many had fled last year when challenges surfaced for some issuers. For money market and savings accounts, returns
| | | |
| Market Barometer | | | |
| |
| | Total Returns |
| | Periods Ended March 31, 2014 |
| | Six | One | Five Years |
| | Months | Year | (Annualized) |
| Stocks | | | |
| Russell 1000 Index (Large-caps) | 12.48% | 22.41% | 21.73% |
| Russell 2000 Index (Small-caps) | 9.94 | 24.90 | 24.31 |
| Russell 3000 Index (Broad U.S. market) | 12.28 | 22.61 | 21.93 |
| FTSE All-World ex US Index (International) | 5.25 | 12.50 | 15.93 |
| |
| Bonds | | | |
| Barclays U.S. Aggregate Bond Index (Broad taxable market) | 1.70% | -0.10% | 4.80% |
| Barclays Municipal Bond Index (Broad tax-exempt market) | 3.65 | 0.39 | 5.71 |
| Citigroup Three-Month U.S. Treasury Bill Index | 0.00 | 0.05 | 0.08 |
| |
| CPI | | | |
| Consumer Price Index | 0.92% | 1.51% | 2.13% |
3
remained meager because of the Fed’s target of 0%–0.25% for short-term interest rates.
International bond markets (as measured by the Barclays Global Aggregate Index ex USD) returned 2.05%.
Health care stocks helped lead the fund’s advance
Vanguard Morgan Growth Fund is diversified both in its advisors and in its holdings. The fund uses five advisors, each with a distinct investment strategy, and it invests in more than 300 stocks across a variety of sectors. This approach can help mute some of the volatility that tends to be associated with the stocks of fast-growing companies.
The fund’s largest allocation is to technology, which averaged about 30% of assets during the period. But it was the health care sector that was Morgan Growth’s standout performer—its six-month return of about 17% was the highest among the fund’s sectors. Shares of everything from giant pharmaceutical companies to small biotech firms climbed as investors reacted to progress on new treatments for disease and a more favorable regulatory climate. Drugmakers weren’t the only health care firms whose stocks notched robust advances; the fund also benefited from its investments in pharmacy benefit managers and the distributors of medical products.
| | | |
| Expense Ratios | | | |
| Your Fund Compared With Its Peer Group | | | |
| | Investor | Admiral | Peer Group |
| | Shares | Shares | Average |
| Morgan Growth Fund | 0.39% | 0.25% | 1.34% |
The fund expense ratios shown are from the prospectus dated January 28, 2014, and represent estimated costs for the current fiscal year. For
the six months ended March 31, 2014, the fund’s annualized expense ratios were 0.40% for Investor Shares and 0.26% for Admiral Shares.
The peer-group expense ratio is derived from data provided by Lipper, a Thomson Reuters Company, and captures information through
year-end 2013.
Peer group: Multi-Cap Growth Funds.
4
Another productive sector was financials, where the fund’s holdings outpaced their benchmark counterparts. Banks benefited from reduced debt, increased deposits, and improved lending conditions. Consumer finance companies were buoyed by the global trend toward electronic payments, and diversified financial services giants, asset managers, and insurance firms all flourished in the solid investing climate.
| The appeal of low-cost investing is growing |
| |
| Minimizing investment costs is a critical part of every investor’s toolkit. Why? Because every |
| dollar paid for fund management expenses is simply a dollar less that can work on your behalf. |
| |
| Put another way, the lower your mutual fund’s costs, the greater your share of the fund’s return. |
| Not surprisingly, research indicates that lower-cost investments have tended to outperform |
| their higher-cost counterparts. |
| |
| Investors are catching on to the value of lower-cost mutual funds. Funds with lower expense |
| ratios dominated in attracting investment dollars over the decade ended December 31, 2012, |
| according to a Vanguard research paper titled Costs Matter: Are Fund Investors Voting With |
| Their Feet? (You can read the paper at vanguard.com/matter.) And, as the chart below shows, |
| Vanguard’s leadership in keeping down costs for investors seems to have encouraged the |
| industry to reduce its average costs—at least over the past decade. |
| |
| Even so, Vanguard’s average expenses continue to be less than one-fifth the industry average: |
| 0.19% versus 1.08% (as of December 31, 2013). That cost difference remains a powerful tool |
| in the hands of Vanguard clients. |
| |
| Vanguard fund costs remain far below industry average |
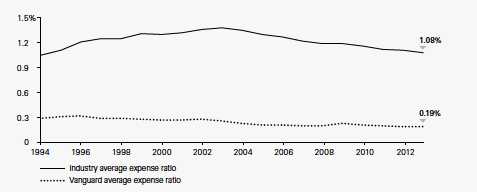
| Sources: Vanguard and Lipper, a Thomson Reuters Company. |
5
The fund’s technology holdings, which didn’t include some of the big gainers among computer networking companies, modestly trailed their counterparts in the benchmark. For more about the advisor’s strategy and the fund’s positioning during the six months, see the Advisors’ Report that follows this letter.
Divining the future is tricky, but preparing for it is prudent
Predictions are often made but rarely come true. In an interview with our newsletter In The Vanguard, University of Pennsylvania professor Philip Tetlock noted: “As a whole, experts were slightly more accurate than the proverbial dart-throwing chimpanzee.”
Dr. Tetlock’s extensive research on the accuracy of predictions found that it’s best to think in terms of probabilities and to avoid bold, specific declarations about what the future holds. At Vanguard, we agree that forecasting the economy and capital markets should be leavened with modesty. Joe Davis, our chief economist, is fond of saying that we “treat the future with the humility it deserves.”
That’s why our economists don’t make the pinpoint projections that you’ll see elsewhere. Instead, using sophisticated statistical models, we provide a range and probability of potential outcomes—for the return of U.S. stocks, for example. And we explain our rationale for such outcomes, allowing you to make better-informed decisions about risk and return.
In January, as they do each year, our economists issued Vanguard’s Economic and Investment Outlook. They also update their perspectives periodically and address significant developments, such as changes in Federal Reserve policy. (You can read our most recent outlook at vanguard.com/research.)
Our forecasts acknowledge that no one can envision every scenario. And that reality underlines one of Vanguard’s core investment principles: Develop a suitable asset allocation using broadly diversified funds. Having a balanced portfolio can help you get through unforeseen events and achieve your goals—even without a crystal ball.
As always, thank you for investing with Vanguard.
Sincerely,

F. William McNabb III
Chairman and Chief Executive Officer
April 14, 2014
6
Advisors’ Report
For the fiscal half year ended March 31, 2014, Vanguard Morgan Growth Fund returned 11.54% for Investor Shares and 11.61% for the lower-cost Admiral Shares. Your fund is managed by five independent advisors, a strategy that enhances the fund’s diversification by providing exposure to distinct, yet complementary, investment approaches. It’s not uncommon for different advisors to have different views about individual securities or the broader investment environment.
The advisors, the percentage of fund assets each manages, and brief descriptions of their investment strategies are presented in the table on page 11. The advisors have also prepared a discussion of the investment environment that existed during the period and of how portfolio positioning reflects this assessment. These comments were prepared on April 17, 2014.
Wellington Management Company, llp
Portfolio Manager:
Paul E. Marrkand, CFA,
Senior Vice President
Our portion of the fund uses traditional methods of stock selection—fundamental research and analysis—to identify companies that we believe have above-average growth prospects. Research focuses on mid- and large-cap companies, evaluating and ranking each stock on a consistent set of growth, quality, and valuation criteria. We seek to build a portfolio with diversified sources of return and with a balance of growth, quality, and valuation attributes.
It was a strong six months for U.S. equities and other developed-market stocks around the world as the S&P 500 Index returned 12.51% and the MSCI World Index 9.62%. Fixed income markets moved up modestly, with the Barclays U.S. Aggregate Bond Index returning 1.70% during the period.
Successes
Sector allocation, a residual outcome of our bottom-up stock selection process, contributed to the portfolio’s relative return during the period, primarily through our underweighting of the consumer staples sector.
Our stock selection was strongest within the financial, consumer staples, and health care sectors. The largest individual contributors to benchmark-relative performance included Valero Energy (energy), Western Digital (information technology), and InterActiveCorp (information technology).
Shortfalls
Security selection overall detracted from relative performance during the period. Most notably, selection was weak among consumer discretionary, industrial, and information technology stocks. The largest detractors included Cisco Systems, NetApp, and Altera, all technology stocks. We significantly reduced our position in Cisco.
We ended the period most overweighted in the information technology and health care sectors and most underweighted in the consumer staples and materials sectors. We are very optimistic about our portfolio’s prospects and its favorable
7
risk/reward profile. Strong long-term trends within the information technology sphere, including cloud computing, mobility, security, and data storage, also should help drive sustained growth.
Jennison Associates LLC
Portfolio Managers:
Kathleen A. McCarragher,
Managing Director
Blair A. Boyer,
Managing Director
The U.S. economy remained on a slow growth trajectory. At the start of 2014, the Federal Reserve began to taper its quantitative stimulus, signaling confidence in the sustainability of improving economic activity and labor market conditions.
Successes
Google performed well, reflecting its continued strong competitive position, solid advertising revenue, and YouTube monetization opportunities. Biogen Idec benefited from the strong launch of its new multiple sclerosis treatment. Michael Kors, a global fashion lifestyle brand, performed well across regions and all channels.
Shortfalls
Shares of LinkedIn declined after management provided lower-than-expected guidance. The company’s investment in its business could limit shorter-term margin improvement but drive longer-term revenue growth and margin expansion. Whole Foods Market’s
aggressive expansion through new stores and acquisitions, and investment in more competitive pricing, is limiting its potential for higher profit margins. We eliminated our position in eBay as the company’s growth slowed from above-average to in line with the overall e-commerce industry, and because we have concerns about eBay’s long-term competitive position.
Vanguard Equity Investment Group
Portfolio Managers:
James P. Stetler, Principal
James D. Troyer, CFA, Principal
Michael R. Roach, CFA
For the six-month period, four of the five components of our stock selection model were effective in identifying the outperformers from the underperformers within each industry group. The growth, management decisions, valuation, and sentiment components helped performance, while the quality component detracted from results. Our stock selections were positive in seven of ten sectors, and slightly negative in the three others.
Successes
Our selections had the largest positive impact in energy and industrials. Within the energy sector, Helmerich & Payne and Ultra Petroleum contributed the most to our relative results; within industrials, the leaders were Southwest Airlines, Delta Air Lines, and Lockheed Martin.
8
Shortfalls
Our selections in financials were negative overall, as our positions in Citigroup and American International Group did not perform as expected.
Frontier Capital Management Co., LLC
Portfolio Managers:
Stephen Knightly, CFA, President
Christopher J. Scarpa,
Vice President
Equities broadly advanced, with the fund’s benchmark, the Russell 3000 Growth Index, returning 11.43% for the six months. The rise reflected improved economic activity, low inflation, and steady earnings growth.
Successes
Strong stock selection helped drive notable gains in the health care, financial services, technology, and industrial sectors. Our holdings in companies lowering the cost of drugs, such as Actavis, benefited health care returns. An improved credit environment boosted financials, with investments in Alliance Data Systems, Signature Bank, and E*Trade paying off. Strong demand for wireless devices produced solid growth for NXP Semiconductors and Avago within technology. A focus on the global upturn in aerospace lifted industrial holdings B/E Aerospace and United Continental.
Shortfalls
Negative selection in consumer staples was the biggest constraint on otherwise solid performance; the sector was hurt by weather-related shopping trends, which affected companies such as GNC Holdings.
Kalmar Investment Advisers
Portfolio Managers:
Ford B. Draper, Jr., President
and Chief Investment Officer
Dana F. Walker, CFA, Co-Head
of the Investment Team
Put simply, the last six months in the stock market can be seen as two periods: The first five months, during which the markets were exceptionally rewarding (aside from a meaningful interruption in late January), with gains driven mainly by ongoing Federal Reserve stimulus and a rise in overall valuations; and the final month, which saw the beginning of a significant correction. Excess valuations had built among high-growth, momentum-driven stocks, often from companies with little to no earnings (for example, social-media and similar internet stocks). The excesses were even more extreme for many biotechs, where a speculative feeding frenzy took place. Both types of stocks are being wrung out in the present correction.
We had expected that 2014 would be more volatile than 2013, and that is definitely the case thus far. In a longer-term context, equity valuations have indeed risen in recent years but do not appear extreme, except in certain speculative areas mentioned above. Moreover, the U.S. and world economies appear to be on a path of slow improvement, and, with depressing winter weather behind us, growth appears likely to strengthen.
We are optimistic that this may lead to a stabilization and improvement in stock prices, supported by rising corporate
9
earnings. Consequential monetary tightening by the Fed still appears quite distant.
Successes
Our bigger contributors included Alliance Data Systems, Cognizant, Thermo Fisher Scientific, United Rentals, and Salix Pharmaceuticals.
Shortfalls
Our returns were held back because our valuation disciplines and risk controls prevented us from owning the red-hot biotechs. Other individual detractors included Ulta Salon and LKQ Corporation, both of which we added to on weakness; Herbalife (which came under a public short-selling attack by a prominent hedge fund investor); and Clean Harbors.
10
| | | |
| Vanguard Morgan Growth Fund Investment Advisors | |
| |
| | Fund Assets Managed | |
| Investment Advisor | % | $ Million | Investment Strategy |
| Wellington Management | 47 | 5,007 | Uses traditional methods of stock selection— |
| Company, LLP | | | fundamental research and analysis—to identify |
| | | | companies that it believes have above-average growth |
| | | | prospects. Research focuses on mid- and large-cap |
| | | | companies, evaluating and ranking each stock on a |
| | | | consistent set of growth, quality, and valuation criteria. |
| | | | We seek to build a portfolio with diversified sources of |
| | | | return with a balance of growth, quality, and valuation |
| | | | attributes. |
| Jennison Associates LLC | 19 | 2,015 | Uses a research-driven, fundamental investment |
| | | | approach that relies on in-depth company knowledge |
| | | | gleaned through meetings with management, |
| | | | customers, and suppliers. |
| Vanguard Equity Investment | 13 | 1,395 | Employs a quantitative fundamental management |
| Group | | | approach, using models that assess valuation, growth |
| | | | prospects, management decisions, market sentiment, |
| | | | and earnings and balance-sheet quality of companies |
| | | | as compared with their peers. |
| Frontier Capital Management Co., | 10 | 1,099 | Uses a research-driven, fundamental investment |
| LLC | | | approach that seeks companies with above-average |
| | | | growth prospects, reasonable valuations, and |
| | | | competitive advantages. |
| Kalmar Investment Advisers | 10 | 1,065 | Employs a “growth-with-value” strategy using creative, |
| | | | bottom-up research to uncover vigorously growing, |
| | | | high-quality businesses whose stocks can also be |
| | | | bought inefficiently valued. The strategy has a dual |
| | | | objective of strong returns with lower risk. |
| Cash Investments | 1 | 146 | These short-term reserves are invested by Vanguard in |
| | | | equity index products to simulate investments in |
| | | | stocks. Each advisor also may maintain a modest cash |
| | | | position. |
11
Morgan Growth Fund
Fund Profile
As of March 31, 2014
| | |
| Share-Class Characteristics | |
| | Investor | Admiral |
| | Shares | Shares |
| Ticker Symbol | VMRGX | VMRAX |
| Expense Ratio1 | 0.39% | 0.25% |
| 30-Day SEC Yield | 0.57% | 0.71% |
| | | |
| Portfolio Characteristics | | |
| | | | DJ |
| | | | U.S. |
| | | Russell | Total |
| | | 3000 | Market |
| | | Growth | FA |
| | Fund | Index | Index |
| Number of Stocks | 327 | 1,782 | 3,674 |
| Median Market Cap | $33.3B | $50.0B | $43.7B |
| Price/Earnings Ratio | 25.3x | 23.0x | 20.1x |
| Price/Book Ratio | 4.2x | 4.8x | 2.6x |
| Return on Equity | 21.5% | 22.6% | 17.2% |
| Earnings Growth | | | |
| Rate | 18.7% | 15.4% | 12.4% |
| Dividend Yield | 1.0% | 1.5% | 1.9% |
| Foreign Holdings | 3.2% | 0.0% | 0.0% |
| Turnover Rate | | | |
| (Annualized) | 54% | — | — |
| Short-Term Reserves | 0.9% | — | — |
| | |
| Volatility Measures | | |
| | | DJ |
| | | U.S. Total |
| | Russell 3000 | Market |
| | Growth Index | FA Index |
| R-Squared | 0.98 | 0.93 |
| Beta | 1.11 | 1.09 |
| These measures show the degree and timing of the fund’s |
| fluctuations compared with the indexes over 36 months. |
| | |
| Ten Largest Holdings (% of total net assets) |
| Google Inc. | Internet Software & | |
| | Services | 3.3% |
| Microsoft Corp. | Systems Software | 2.4 |
| Apple Inc. | Computer Hardware | 2.4 |
| Oracle Corp. | Systems Software | 1.7 |
| Facebook Inc. | Internet Software & | |
| | Services | 1.6 |
| Biogen Idec Inc. | Biotechnology | 1.5 |
| Gilead Sciences Inc. | Biotechnology | 1.4 |
| QUALCOMM Inc. | Communications | |
| | Equipment | 1.3 |
| Amgen Inc. | Biotechnology | 1.2 |
| MasterCard Inc. | Data Processing & | |
| | Outsourced Services | 1.1 |
| Top Ten | | 17.9% |
| The holdings listed exclude any temporary cash investments and equity index products. |
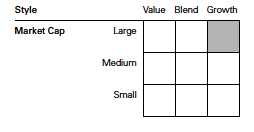
Investment Focus
1 The expense ratios shown are from the prospectus dated January 28, 2014, and represent estimated costs for the current fiscal year. For the six
months ended March 31, 2014, the annualized expense ratios were 0.40% for Investor Shares and 0.26% for Admiral Shares.
12
Morgan Growth Fund
| | | |
| Sector Diversification (% of equity exposure) |
| | | | DJ |
| | | | U.S. |
| | | Russell | Total |
| | | 3000 | Market |
| | | Growth | FA |
| | Fund | Index | Index |
| Consumer Discretionary 19.0% | 18.9% | 12.8% |
| Consumer Staples | 3.5 | 11.1 | 8.4 |
| Energy | 4.5 | 4.7 | 9.4 |
| Financials | 5.9 | 5.7 | 17.6 |
| Health Care | 19.5 | 13.1 | 13.0 |
| Industrials | 13.2 | 12.6 | 11.5 |
| Information Technology | 31.7 | 27.0 | 18.1 |
| Materials | 2.2 | 4.6 | 3.9 |
| Telecommunication | | | |
| Services | 0.5 | 2.2 | 2.2 |
| Utilities | 0.0 | 0.1 | 3.1 |
13
Morgan Growth Fund
Performance Summary
All of the returns in this report represent past performance, which is not a guarantee of future results that may be achieved by the fund. (Current performance may be lower or higher than the performance data cited. For performance data current to the most recent month-end, visit our website at vanguard.com/performance.) Note, too, that both investment returns and principal value can fluctuate widely, so an investor’s shares, when sold, could be worth more or less than their original cost. The returns shown do not reflect taxes that a shareholder would pay on fund distributions or on the sale of fund shares.
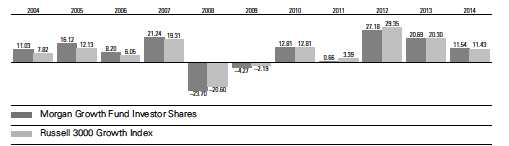
Fiscal-Year Total Returns (%): September 30, 2003, Through March 31, 2014
Note: For 2014, performance data reflect the six months ended March 31, 2014.
| | | | |
| Average Annual Total Returns: Periods Ended March 31, 2014 | | | |
| |
| | Inception | One | Five | Ten |
| | Date | Year | Years | Years |
| Investor Shares | 12/31/1968 | 24.75% | 20.85% | 7.66% |
| Admiral Shares | 5/14/2001 | 24.90 | 21.02 | 7.82 |
See Financial Highlights for dividend and capital gains information.
14
Morgan Growth Fund
Financial Statements (unaudited)
Statement of Net Assets
As of March 31, 2014
The fund reports a complete list of its holdings in regulatory filings four times in each fiscal year, at the quarter-ends. For the second and fourth fiscal quarters, the lists appear in the fund’s semiannual and annual reports to shareholders. For the first and third fiscal quarters, the fund files the lists with the Securities and Exchange Commission on Form N-Q. Shareholders can look up the fund’s Forms N-Q on the SEC’s website at sec.gov. Forms N-Q may also be reviewed and copied at the SEC’s Public Reference Room (see the back cover of this report for further information).
| | | |
| | | | Market |
| | | | Value |
| | | Shares | ($000) |
| Common Stocks (98.4%)1 | | |
| Consumer Discretionary (18.5%) | |
| | Home Depot Inc. | 1,327,167 | 105,019 |
| | TJX Cos. Inc. | 1,706,563 | 103,503 |
| * | priceline.com Inc. | 86,643 | 103,269 |
| | Comcast Corp. Class A | 2,055,349 | 102,809 |
| * | Amazon.com Inc. | 287,507 | 96,752 |
| * | O’Reilly Automotive Inc. | 597,435 | 88,653 |
| | Lowe’s Cos. Inc. | 1,647,122 | 80,544 |
| | Starwood Hotels & | | |
| | Resorts Worldwide Inc. | 998,009 | 79,441 |
| | Wyndham Worldwide Corp. | 951,378 | 69,669 |
| * | Michael Kors Holdings Ltd. | 743,130 | 69,312 |
| | NIKE Inc. Class B | 917,342 | 67,755 |
| * | DIRECTV | 690,080 | 52,736 |
| | Wynn Resorts Ltd. | 216,523 | 48,101 |
| | PulteGroup Inc. | 2,366,371 | 45,411 |
| * | Netflix Inc. | 125,661 | 44,236 |
| | Twenty-First Century | | |
| | Fox Inc. Class A | 1,362,368 | 43,555 |
| | Inditex SA ADR | 1,383,979 | 41,575 |
| * | Discovery | | |
| | Communications Inc. | | |
| | Class A | 502,433 | 41,551 |
| | Expedia Inc. | 559,654 | 40,575 |
| | Omnicom Group Inc. | 497,323 | 36,106 |
| * | Chipotle Mexican Grill Inc. | | |
| | Class A | 58,491 | 33,226 |
| * | LKQ Corp. | 1,253,918 | 33,041 |
| | Scripps Networks | | |
| | Interactive Inc. Class A | 399,282 | 30,309 |
| | Harley-Davidson Inc. | 414,715 | 27,624 |
| | Delphi Automotive plc | 356,900 | 24,219 |
| *,^ | Tesla Motors Inc. | 112,316 | 23,412 |
| * | Discovery | | |
| | Communications Inc. | 298,190 | 22,979 |
| | VF Corp. | 367,064 | 22,714 |
| * | HomeAway Inc. | 533,281 | 20,089 |
| * | ASOS plc ADR | 224,702 | 19,758 |
| | Burberry Group plc | 835,880 | 19,434 |
| | | |
| | Starbucks Corp. | 261,033 | 19,155 |
| * | Jarden Corp. | 315,205 | 18,859 |
| * | CarMax Inc. | 386,045 | 18,067 |
| * | Urban Outfitters Inc. | 457,150 | 16,672 |
| | Tractor Supply Co. | 234,930 | 16,593 |
| * | TRW Automotive | | |
| | Holdings Corp. | 189,400 | 15,459 |
| | Dick’s Sporting Goods Inc. | 255,415 | 13,948 |
| * | Ulta Salon Cosmetics & | | |
| | Fragrance Inc. | 138,940 | 13,544 |
| | Walt Disney Co. | 160,300 | 12,835 |
| | Viacom Inc. Class B | 148,700 | 12,638 |
| | CBS Corp. Class B | 201,900 | 12,477 |
| | Las Vegas Sands Corp. | 152,900 | 12,351 |
| * | Imax Corp. | 402,520 | 11,001 |
| | Wolverine World Wide Inc. | 385,045 | 10,993 |
| * | MGM Resorts International | 420,000 | 10,861 |
| | Gap Inc. | 218,700 | 8,761 |
| | Goodyear Tire & Rubber Co. 331,100 | 8,652 |
| | Advance Auto Parts Inc. | 68,000 | 8,602 |
| | Service Corp. International | 424,275 | 8,435 |
| | GNC Holdings Inc. Class A | 190,580 | 8,389 |
| * | Bright Horizons Family | | |
| | Solutions Inc. | 203,970 | 7,977 |
| | Dunkin’ Brands Group Inc. | 157,573 | 7,907 |
| | McDonald’s Corp. | 75,000 | 7,352 |
| | Cablevision Systems Corp. | | |
| | Class A | 433,600 | 7,315 |
| | Tiffany & Co. | 84,800 | 7,305 |
| | PetSmart Inc. | 105,400 | 7,261 |
| | Comcast Corp. | 138,800 | 6,768 |
| | Whirlpool Corp. | 44,400 | 6,636 |
| * | ASOS plc | 74,482 | 6,438 |
| * | NVR Inc. | 5,400 | 6,194 |
| * | AutoZone Inc. | 11,400 | 6,123 |
| | Target Corp. | 89,000 | 5,385 |
| | Time Warner Cable Inc. | 32,400 | 4,445 |
| | Extended Stay America Inc. | 67,500 | 1,537 |
| * | Liberty Global plc | 15,400 | 627 |
| * | Coupons.com Inc. | 22,781 | 562 |
15
Morgan Growth Fund
| | | |
| | | | Market |
| | | | Value |
| | | Shares | ($000) |
| * | Liberty Global plc Class A | 9,000 | 374 |
| * | Liberty Interactive Corp. | | |
| | Class A | 9,300 | 268 |
| | | | 1,986,143 |
| Consumer Staples (3.4%) | | |
| | Costco Wholesale Corp. | 732,801 | 81,839 |
| | CVS Caremark Corp. | 793,979 | 59,437 |
| * | Keurig Green Mountain Inc. | 414,103 | 43,725 |
| | Anheuser-Busch InBev | | |
| | NV ADR | 291,512 | 30,696 |
| | Whole Foods Market Inc. | 595,653 | 30,206 |
| | Herbalife Ltd. | 466,660 | 26,726 |
| | Philip Morris | | |
| | International Inc. | 164,000 | 13,427 |
| | PepsiCo Inc. | 158,600 | 13,243 |
| | Brown-Forman Corp. | | |
| | Class B | 142,179 | 12,752 |
| | Wal-Mart Stores Inc. | 159,600 | 12,198 |
| | Kroger Co. | 209,000 | 9,123 |
| | Coca-Cola Co. | 177,156 | 6,849 |
| | Walgreen Co. | 102,000 | 6,735 |
| | Kraft Foods Group Inc. | 119,400 | 6,699 |
| | Hershey Co. | 29,600 | 3,090 |
| | Colgate-Palmolive Co. | 25,900 | 1,680 |
| | | | 358,425 |
| Energy (4.3%) | | |
| | Schlumberger Ltd. | 674,746 | 65,788 |
| | Cabot Oil & Gas Corp. | 1,425,990 | 48,313 |
| | National Oilwell Varco Inc. | 542,256 | 42,225 |
| | Apache Corp. | 428,193 | 35,519 |
| | Valero Energy Corp. | 519,785 | 27,601 |
| | Core Laboratories NV | 138,985 | 27,580 |
| * | Cameron International Corp. | 366,810 | 22,658 |
| | Oceaneering | | |
| | International Inc. | 279,304 | 20,071 |
| * | Continental Resources Inc. | 138,700 | 17,236 |
| | Devon Energy Corp. | 249,889 | 16,725 |
| | EOG Resources Inc. | 81,600 | 16,007 |
| * | Weatherford | | |
| | International Ltd. | 871,890 | 15,136 |
| * | Southwestern Energy Co. | 300,070 | 13,806 |
| * | Concho Resources Inc. | 108,646 | 13,309 |
| | Superior Energy | | |
| | Services Inc. | 380,270 | 11,697 |
| * | Gulfport Energy Corp. | 157,455 | 11,208 |
| * | Carrizo Oil & Gas Inc. | 170,200 | 9,099 |
| | Chesapeake Energy Corp. | 353,500 | 9,057 |
| *,^ | SandRidge Energy Inc. | 1,354,800 | 8,318 |
| | SM Energy Co. | 112,900 | 8,049 |
| | Helmerich & Payne Inc. | 74,800 | 8,045 |
| *,^ | Ultra Petroleum Corp. | 298,700 | 8,032 |
| | Cimarex Energy Co. | 38,500 | 4,586 |
| | | | 460,065 |
| | | |
| Financials (5.7%) | | |
| | American Express Co. | 1,116,068 | 100,480 |
| | Bank of America Corp. | 5,275,401 | 90,737 |
| | Morgan Stanley | 1,406,657 | 43,846 |
| | IntercontinentalExchange | | |
| | Group Inc. | 207,449 | 41,040 |
| | Waddell & Reed | | |
| | Financial Inc. Class A | 465,929 | 34,302 |
| | Goldman Sachs Group Inc. | 185,316 | 30,364 |
| | JPMorgan Chase & Co. | 458,862 | 27,858 |
| | Aon plc | 245,900 | 20,725 |
| | T. Rowe Price Group Inc. | 240,865 | 19,835 |
| * | Signature Bank | 143,732 | 18,051 |
| * | E*TRADE Financial Corp. | 734,300 | 16,904 |
| * | Affiliated Managers | | |
| | Group Inc. | 83,265 | 16,657 |
| | American Tower | | |
| | Corporation | 195,345 | 15,993 |
| | Raymond James | | |
| | Financial Inc. | 275,400 | 15,403 |
| * | Berkshire Hathaway Inc. | | |
| | Class B | 105,900 | 13,234 |
| | Discover Financial Services | 200,400 | 11,661 |
| * | SVB Financial Group | 88,557 | 11,404 |
| | Citigroup Inc. | 227,600 | 10,834 |
| | Arthur J Gallagher & Co. | 223,080 | 10,614 |
| | Ameriprise Financial Inc. | 92,100 | 10,137 |
| | McGraw Hill Financial Inc. | 126,400 | 9,644 |
| | Allied World Assurance Co. | | |
| | Holdings AG | 80,600 | 8,317 |
| | Simon Property Group Inc. | 48,200 | 7,905 |
| | Legg Mason Inc. | 159,500 | 7,822 |
| | Public Storage | 28,400 | 4,785 |
| * | WisdomTree | | |
| | Investments Inc. | 356,400 | 4,676 |
| | General Growth | | |
| | Properties Inc. | 200,500 | 4,411 |
| * | Realogy Holdings Corp. | 55,200 | 2,398 |
| | TD Ameritrade | | |
| | Holding Corp. | 50,800 | 1,725 |
| | Crown Castle | | |
| | International Corp. | 3,800 | 280 |
| | | | 612,042 |
| Health Care (19.1%) | | |
| * | Biogen Idec Inc. | 512,969 | 156,902 |
| * | Gilead Sciences Inc. | 2,078,742 | 147,300 |
| | Amgen Inc. | 1,077,501 | 132,899 |
| * | Celgene Corp. | 831,481 | 116,075 |
| * | Express Scripts | | |
| | Holding Co. | 1,435,106 | 107,762 |
| | Bristol-Myers Squibb Co. | 1,771,246 | 92,016 |
| | Merck & Co. Inc. | 1,502,607 | 85,303 |
| | Allergan Inc. | 531,666 | 65,980 |
| | CR Bard Inc. | 442,033 | 65,412 |
| | Medtronic Inc. | 1,050,837 | 64,668 |
16
Morgan Growth Fund
| | | | |
| | | | | Market |
| | | | | Value |
| | | | Shares | ($000) |
| | McKesson Corp. | | 361,027 | 63,747 |
| | Eli Lilly & Co. | 1,068,417 | 62,887 |
| * | Alexion | | | |
| | Pharmaceuticals Inc. | | 371,043 | 56,447 |
| | Zimmer Holdings Inc. | | 550,762 | 52,091 |
| | Becton Dickinson and Co. | 437,659 | 51,241 |
| | Johnson & Johnson | | 515,368 | 50,625 |
| | Aetna Inc. | | 625,814 | 46,917 |
| | Novo Nordisk A/S ADR | 998,403 | 45,577 |
| * | Actavis plc | | 185,785 | 38,244 |
| * | BioMarin | | | |
| | Pharmaceutical Inc. | | 557,038 | 37,996 |
| | Cooper Cos. Inc. | | 272,209 | 37,391 |
| * | Illumina Inc. | | 243,351 | 36,177 |
| | Perrigo Co. plc | | 229,280 | 35,460 |
| * | Vertex Pharmaceuticals Inc. | 485,829 | 34,358 |
| * | HCA Holdings Inc. | | 613,886 | 32,229 |
| | Shire plc ADR | | 214,123 | 31,804 |
| * | Mylan Inc. | | 588,200 | 28,722 |
| * | Salix Pharmaceuticals Ltd. | 255,748 | 26,498 |
| * | Covance Inc. | | 223,700 | 23,242 |
| | Thermo Fisher | | | |
| | Scientific Inc. | | 187,035 | 22,489 |
| * | Intercept | | | |
| | Pharmaceuticals Inc. | | 65,216 | 21,508 |
| | AbbVie Inc. | | 374,300 | 19,239 |
| | Zoetis Inc. | | 619,985 | 17,942 |
| * | MEDNAX Inc. | | 282,982 | 17,539 |
| * | Catamaran Corp. | | 382,935 | 17,140 |
| * | Alkermes plc | | 380,570 | 16,779 |
| | Abbott Laboratories | | 407,000 | 15,674 |
| | ResMed Inc. | | 318,895 | 14,251 |
| * | Boston Scientific Corp. | 647,100 | 8,749 |
| * | Allscripts Healthcare | | | |
| | Solutions Inc. | | 464,900 | 8,382 |
| * | Incyte Corp. Ltd. | | 148,700 | 7,958 |
| * | Quintiles Transnational | | |
| | Holdings Inc. | | 148,800 | 7,555 |
| | Cigna Corp. | | 83,700 | 7,008 |
| * | Cerner Corp. | | 117,798 | 6,626 |
| | UnitedHealth Group Inc. | 63,400 | 5,198 |
| * | Intrexon Corp. | | 142,900 | 3,757 |
| * | Forest Laboratories Inc. | 35,900 | 3,312 |
| * | Charles River Laboratories | | |
| | International Inc. | | 42,000 | 2,534 |
| * | Castlight Health Inc. Class B | 25,661 | 545 |
| | | | | 2,050,155 |
| Industrials (13.0%) | | | |
| | Boeing Co. | | 822,432 | 103,207 |
| | United Technologies Corp. | 859,919 | 100,473 |
| | Honeywell International Inc. | 814,061 | 75,512 |
| | Danaher Corp. | | 942,923 | 70,719 |
| | Rockwell Automation Inc. | 515,791 | 64,242 |
| | | |
| | United Parcel Service Inc. | | |
| | Class B | 572,587 | 55,759 |
| | TransDigm Group Inc. | 289,449 | 53,606 |
| * | B/E Aerospace Inc. | 598,009 | 51,901 |
| | Parker Hannifin Corp. | 410,459 | 49,136 |
| | Precision Castparts Corp. | 191,229 | 48,335 |
| | Canadian Pacific | | |
| | Railway Ltd. | 295,036 | 44,382 |
| | 3M Co. | 321,063 | 43,555 |
| | Chicago Bridge & | | |
| | Iron Co. NV | 458,980 | 40,000 |
| * | IHS Inc. Class A | 319,271 | 38,791 |
| | Pentair Ltd. | 458,120 | 36,347 |
| | Illinois Tool Works Inc. | 402,684 | 32,750 |
| | Tyco International Ltd. | 747,849 | 31,709 |
| | Dover Corp. | 357,318 | 29,211 |
| * | United Rentals Inc. | 236,860 | 22,487 |
| * | Hertz Global Holdings Inc. | 800,660 | 21,330 |
| | Flowserve Corp. | 236,400 | 18,520 |
| * | Kirby Corp. | 181,800 | 18,407 |
| | Fastenal Co. | 362,025 | 17,855 |
| | Watsco Inc. | 165,060 | 16,491 |
| | AMETEK Inc. | 317,593 | 16,353 |
| | Union Pacific Corp. | 84,400 | 15,838 |
| | JB Hunt Transport | | |
| | Services Inc. | 219,070 | 15,756 |
| | MSC Industrial Direct Co. | | |
| | Inc. Class A | 163,680 | 14,162 |
| * | Genesee & Wyoming Inc. | | |
| | Class A | 145,360 | 14,146 |
| | Delta Air Lines Inc. | 361,400 | 12,523 |
| * | Jacobs Engineering | | |
| | Group Inc. | 193,300 | 12,275 |
| * | American Airlines | | |
| | Group Inc. | 331,000 | 12,115 |
| * | Stericycle Inc. | 104,925 | 11,922 |
| | Pall Corp. | 129,192 | 11,559 |
| * | United Continental | | |
| | Holdings Inc. | 252,400 | 11,265 |
| | KAR Auction Services Inc. | 349,440 | 10,606 |
| | Southwest Airlines Co. | 432,500 | 10,211 |
| * | Armstrong World | | |
| | Industries Inc. | 189,400 | 10,086 |
| * | MasTec Inc. | 232,000 | 10,078 |
| | Wabtec Corp. | 125,100 | 9,695 |
| * | Quanta Services Inc. | 252,975 | 9,335 |
| | Emerson Electric Co. | 135,900 | 9,078 |
| * | Spirit Airlines Inc. | 152,000 | 9,029 |
| * | WESCO International Inc. | 99,544 | 8,284 |
| * | WABCO Holdings Inc. | 78,100 | 8,244 |
| | Carlisle Cos. Inc. | 100,225 | 7,952 |
| | Lockheed Martin Corp. | 48,300 | 7,884 |
| | Masco Corp. | 352,500 | 7,829 |
17
Morgan Growth Fund
| | | |
| | | | Market |
| | | | Value |
| | | Shares | ($000) |
| | Expeditors International of | | |
| | Washington Inc. | 196,245 | 7,777 |
| | IDEX Corp. | 105,300 | 7,675 |
| | Acuity Brands Inc. | 50,360 | 6,676 |
| * | Spirit AeroSystems | | |
| | Holdings Inc. Class A | 207,600 | 5,852 |
| | Dun & Bradstreet Corp. | 48,800 | 4,848 |
| * | Verisk Analytics Inc. Class A | 76,830 | 4,607 |
| | Caterpillar Inc. | 18,000 | 1,789 |
| * | Copart Inc. | 29,600 | 1,077 |
| | | | 1,391,251 |
| Information Technology (31.0%) | |
| * | Google Inc. Class A | 318,366 | 354,822 |
| | Microsoft Corp. | 6,287,085 | 257,708 |
| | Apple Inc. | 471,471 | 253,057 |
| | Oracle Corp. | 4,434,754 | 181,426 |
| * | Facebook Inc. Class A | 2,856,761 | 172,091 |
| | QUALCOMM Inc. | 1,702,561 | 134,264 |
| | MasterCard Inc. Class A | 1,606,098 | 119,976 |
| * | Alliance Data | | |
| | Systems Corp. | 404,987 | 110,339 |
| | Visa Inc. Class A | 459,198 | 99,123 |
| | Xilinx Inc. | 1,605,680 | 87,140 |
| * | Salesforce.com Inc. | 1,457,905 | 83,232 |
| | Altera Corp. | 2,021,278 | 73,251 |
| * | Check Point Software | | |
| | Technologies Ltd. | 1,064,969 | 72,024 |
| | SanDisk Corp. | 844,106 | 68,533 |
| * | Red Hat Inc. | 1,180,886 | 62,563 |
| | IAC/InterActiveCorp | 829,254 | 59,200 |
| | Intuit Inc. | 757,194 | 58,857 |
| | Western Digital Corp. | 632,110 | 58,040 |
| * | F5 Networks Inc. | 537,389 | 57,302 |
| * | VMware Inc. Class A | 456,817 | 49,345 |
| * | LinkedIn Corp. Class A | 258,255 | 47,762 |
| | NetApp Inc. | 1,244,209 | 45,911 |
| * | Skyworks Solutions Inc. | 1,174,592 | 44,071 |
| | Microchip Technology Inc. | 878,774 | 41,970 |
| | Maxim Integrated | | |
| | Products Inc. | 1,221,320 | 40,450 |
| * | Informatica Corp. | 1,031,180 | 38,958 |
| * | Cognizant Technology | | |
| | Solutions Corp. Class A | 687,620 | 34,800 |
| | Cisco Systems Inc. | 1,518,989 | 34,041 |
| | Amphenol Corp. Class A | 344,760 | 31,597 |
| | Paychex Inc. | 702,232 | 29,915 |
| * | Electronic Arts Inc. | 967,545 | 28,069 |
| | Linear Technology Corp. | 553,488 | 26,949 |
| * | Workday Inc. Class A | 290,968 | 26,603 |
| * | FireEye Inc. | 392,792 | 24,184 |
| * | Atmel Corp. | 2,850,803 | 23,833 |
| * | Yahoo! Inc. | 632,182 | 22,695 |
| * | NXP Semiconductor NV | 380,300 | 22,365 |
| | International Business | | |
| | Machines Corp. | 115,000 | 22,136 |
| | | |
| * | NetSuite Inc. | 202,804 | 19,232 |
| | Fidelity National | | |
| | Information Services Inc. | 354,595 | 18,953 |
| * | Vantiv Inc. Class A | 626,761 | 18,941 |
| * | FleetCor Technologies Inc. | 161,444 | 18,582 |
| | Global Payments Inc. | 246,200 | 17,507 |
| * | Cadence Design | | |
| | Systems Inc. | 1,085,968 | 16,876 |
| * | Gartner Inc. | 237,029 | 16,459 |
| * | Trimble Navigation Ltd. | 413,440 | 16,070 |
| * | NCR Corp. | 439,215 | 16,053 |
| * | Lam Research Corp. | 271,525 | 14,934 |
| | Avago Technologies Ltd. | | |
| | Class A | 224,500 | 14,460 |
| | Accenture plc Class A | 180,900 | 14,421 |
| * | Splunk Inc. | 192,779 | 13,782 |
| | Texas Instruments Inc. | 274,500 | 12,943 |
| * | Autodesk Inc. | 205,320 | 10,098 |
| *,^ | Twitter Inc. | 199,893 | 9,329 |
| | Motorola Solutions Inc. | 144,257 | 9,274 |
| | Jack Henry & | | |
| | Associates Inc. | 157,990 | 8,810 |
| * | Freescale | | |
| | Semiconductor Ltd. | 357,200 | 8,719 |
| * | WEX Inc. | 88,330 | 8,396 |
| * | Akamai Technologies Inc. | 121,867 | 7,094 |
| | Western Union Co. | 420,200 | 6,875 |
| * | Concur Technologies Inc. | 66,550 | 6,593 |
| * | Knowles Corp. | 198,502 | 6,267 |
| * | Yelp Inc. Class A | 62,000 | 4,770 |
| * | Zynga Inc. Class A | 981,000 | 4,218 |
| * | eBay Inc. | 45,400 | 2,508 |
| * | Micron Technology Inc. | 60,300 | 1,427 |
| | EMC Corp. | 34,300 | 940 |
| | LSI Corp. | 76,400 | 846 |
| | | | 3,323,979 |
| Materials (2.1%) | | |
| | Monsanto Co. | 421,879 | 47,997 |
| | FMC Corp. | 457,933 | 35,059 |
| | Sherwin-Williams Co. | 171,977 | 33,902 |
| * | WR Grace & Co. | 215,635 | 21,385 |
| | Eagle Materials Inc. | 210,820 | 18,691 |
| | Ashland Inc. | 166,160 | 16,530 |
| | PPG Industries Inc. | 57,491 | 11,122 |
| | Worthington Industries Inc. | 243,535 | 9,315 |
| | Praxair Inc. | 68,560 | 8,979 |
| | Ball Corp. | 146,600 | 8,035 |
| | Cytec Industries Inc. | 79,700 | 7,780 |
| | Westlake Chemical Corp. | 69,800 | 4,619 |
| | Rock-Tenn Co. Class A | 24,700 | 2,608 |
| | | | 226,022 |
| Other (0.9%) | | |
| 2 | Vanguard Growth ETF | 1,044,900 | 97,677 |
18
Morgan Growth Fund
| | | |
| | | | Market |
| | | | Value |
| | | Shares | ($000) |
| Telecommunication Services (0.4%) | |
| * | SBA Communications Corp. | |
| | Class A | 393,691 | 35,810 |
| | Cogent Communications | | |
| | Group Inc. | 244,200 | 8,676 |
| * | Level 3 | | |
| | Communications Inc. | 66,700 | 2,611 |
| | | | 47,097 |
| Total Common Stocks | | |
| (Cost $7,178,527) | | 10,552,856 |
| Temporary Cash Investments (1.6%)1 | |
| Money Market Fund (0.9%) | | |
| 3,4 | Vanguard Market Liquidity | | |
| | Fund, 0.122% | 97,833,000 | 97,833 |
| |
| | | Face | |
| | | Amount | |
| | | ($000) | |
| Repurchase Agreement (0.6%) | |
| | Bank of America | | |
| | Securities, LLC 0.080%, | | |
| | 4/1/14 (Dated 3/31/14, | | |
| | Repurchase Value | | |
| | $73,700,000, | | |
| | collateralized by Federal | | |
| | National Mortgage Assn. | | |
| | 3.500%–4.500%, | | |
| | 6/1/42–11/1/43, with a | | |
| | value of $75,174,000) | 73,700 | 73,700 |
| | | |
| U.S. Government and Agency Obligations (0.1%) |
| 5,6 | Federal Home Loan | | |
| | Bank Discount Notes, | | |
| | 0.062%, 4/21/14 | 300 | 300 |
| 5 | Federal Home Loan | | |
| | Bank Discount Notes, | | |
| | 0.075%, 5/21/14 | 400 | 400 |
| 5,6 | Federal Home Loan | | |
| | Bank Discount Notes, | | |
| | 0.090%–0.110%, 7/16/14 | 500 | 500 |
| 5,6 | Federal Home Loan Bank | | |
| | Discount Notes, | | |
| | 0.093%, 7/18/14 | 1,800 | 1,800 |
| 6,7 | Freddie Mac Discount | | |
| | Notes, 0.105%, 6/18/14 | 4,000 | 3,999 |
| | | | 6,999 |
| Total Temporary Cash Investments | |
| (Cost $178,532) | | 178,532 |
| Total Investments (100.0%) | | |
| (Cost $7,357,059) | | 10,731,388 |
| Other Assets and Liabilities (0.0%) | |
| Other Assets | | 111,647 |
| Liabilities4 | | (116,199) |
| | | | (4,552) |
| Net Assets (100%) | | 10,726,836 |
19
Morgan Growth Fund
| |
| At March 31, 2014, net assets consisted of: |
| | Amount |
| | ($000) |
| Paid-in Capital | 6,936,864 |
| Overdistributed Net Investment Income | (385) |
| Accumulated Net Realized Gains | 415,701 |
| Unrealized Appreciation (Depreciation) | |
| Investment Securities | 3,374,329 |
| Futures Contracts | 327 |
| Net Assets | 10,726,836 |
| |
| |
| Investor Shares—Net Assets | |
| Applicable to 190,244,346 outstanding | |
| $.001 par value shares of beneficial | |
| interest (unlimited authorization) | 4,915,901 |
| Net Asset Value Per Share— | |
| Investor Shares | $25.84 |
| |
| |
| Admiral Shares—Net Assets | |
| Applicable to 72,559,663 outstanding | |
| $.001 par value shares of beneficial | |
| interest (unlimited authorization) | 5,810,935 |
| Net Asset Value Per Share— | |
| Admiral Shares | $80.08 |
See Note A in Notes to Financial Statements.
* Non-income-producing security.
^ Includes partial security positions on loan to broker-dealers. The total value of securities on loan is $18,073,000.
1 The fund invests a portion of its cash reserves in equity markets through the use of index futures contracts. After giving effect to futures
investments, the fund’s effective common stock and temporary cash investment positions represent 99.0% and 1.0%, respectively, of
net assets.
2 Considered an affiliated company of the fund as the issuer is another member of The Vanguard Group.
3 Affiliated money market fund available only to Vanguard funds and certain trusts and accounts managed by Vanguard. Rate shown is
the 7-day yield.
4 Includes $19,107,000 of collateral received for securities on loan.
5 The issuer operates under a congressional charter; its securities are generally neither guaranteed by the U.S. Treasury nor backed by the
full faith and credit of the U.S. government.
6 Securities with a value of $3,299,000 have been segregated as initial margin for open futures contracts.
7 The issuer was placed under federal conservatorship in September 2008; since that time, its daily operations have been managed by the
Federal Housing Finance Agency and it receives capital from the U.S. Treasury, as needed to maintain a positive net worth, in exchange
for senior preferred stock.
ADR—American Depositary Receipt.
See accompanying Notes, which are an integral part of the Financial Statements.
20
Morgan Growth Fund
Statement of Operations
| |
| | Six Months Ended |
| | March 31, 2014 |
| | ($000) |
| Investment Income | |
| Income | |
| Dividends1,2 | 56,831 |
| Interest2 | 115 |
| Securities Lending | 729 |
| Total Income | 57,675 |
| Expenses | |
| Investment Advisory Fees—Note B | |
| Basic Fee | 8,464 |
| Performance Adjustment | (1,883) |
| The Vanguard Group—Note C | |
| Management and Administrative—Investor Shares | 6,307 |
| Management and Administrative—Admiral Shares | 3,249 |
| Marketing and Distribution—Investor Shares | 407 |
| Marketing and Distribution—Admiral Shares | 461 |
| Custodian Fees | 88 |
| Shareholders’ Reports—Investor Shares | 22 |
| Shareholders’ Reports—Admiral Shares | 24 |
| Trustees’ Fees and Expenses | 9 |
| Total Expenses | 17,148 |
| Expenses Paid Indirectly | (146) |
| Net Expenses | 17,002 |
| Net Investment Income | 40,673 |
| Realized Net Gain (Loss) | |
| Investment Securities Sold2 | 450,641 |
| Futures Contracts | 13,788 |
| Foreign Currencies | 108 |
| Realized Net Gain (Loss) | 464,537 |
| Change in Unrealized Appreciation (Depreciation) | |
| Investment Securities | 634,643 |
| Futures Contracts | 1,130 |
| Foreign Currencies | (4) |
| Change in Unrealized Appreciation (Depreciation) | 635,769 |
| Net Increase (Decrease) in Net Assets Resulting from Operations | 1,140,979 |
| 1 Dividends are net of foreign withholding taxes of $290,000. |
| 2 Dividend income, interest income, and realized net gain (loss) from affiliated companies of the fund were $650,000, $100,000, and $0, respectively. |
See accompanying Notes, which are an integral part of the Financial Statements.
21
Morgan Growth Fund
Statement of Changes in Net Assets
| | |
| | Six Months Ended | Year Ended |
| | March 31, | September 30, |
| | 2014 | 2013 |
| | ($000) | ($000) |
| Increase (Decrease) in Net Assets | | |
| Operations | | |
| Net Investment Income | 40,673 | 105,086 |
| Realized Net Gain (Loss) | 464,537 | 998,555 |
| Change in Unrealized Appreciation (Depreciation) | 635,769 | 665,448 |
| Net Increase (Decrease) in Net Assets Resulting from Operations | 1,140,979 | 1,769,089 |
| Distributions | | |
| Net Investment Income | | |
| Investor Shares | (32,172) | (51,062) |
| Admiral Shares | (46,958) | (44,266) |
| Realized Capital Gain1 | | |
| Investor Shares | (185,177) | — |
| Admiral Shares | (216,896) | — |
| Total Distributions | (481,203) | (95,328) |
| Capital Share Transactions | | |
| Investor Shares | (332,207) | (1,262,867) |
| Admiral Shares | 458,075 | 522,261 |
| Net Increase (Decrease) from Capital Share Transactions | 125,868 | (740,606) |
| Total Increase (Decrease) | 785,644 | 933,155 |
| Net Assets | | |
| Beginning of Period | 9,941,192 | 9,008,037 |
| End of Period2 | 10,726,836 | 9,941,192 |
| 1 Includes fiscal 2014 short-term gain distributions totaling $11,794,000. Short-term gain distributions are treated as ordinary income dividends for tax purposes. |
| 2 Net Assets—End of Period includes undistributed (overdistributed) net investment income of ($385,000) and $37,964,000. |
See accompanying Notes, which are an integral part of the Financial Statements.
22
Morgan Growth Fund
Financial Highlights
| | | | | | | |
| Investor Shares | | | | | | | |
| | Six Months | | | | | |
| | | Ended | | | | | |
| For a Share Outstanding | March 31, | Year Ended September 30, |
| Throughout Each Period | | 2014 | 2013 | 2012 | 2011 | 2010 | 2009 |
| Net Asset Value, Beginning of Period | $24.26 | $20.31 | $16.06 | $16.04 | $14.32 | $15.15 |
| Investment Operations | | | | | | | |
| Net Investment Income | | .088 | . 230 | .141 | .087 | .097 | .114 |
| Net Realized and Unrealized Gain (Loss) | | | | | | |
| on Investments | | 2.654 | 3.925 | 4.209 | .029 | 1.733 | (.804) |
| Total from Investment Operations | | 2.742 | 4.155 | 4.350 | .116 | 1.830 | (.690) |
| Distributions | | | | | | | |
| Dividends from Net Investment Income | (.172) | (. 205) | (.100) | (. 096) | (.110) | (.140) |
| Distributions from Realized Capital Gains | (.990) | — | — | — | — | — |
| Total Distributions | | (1.162) | (. 205) | (.100) | (. 096) | (.110) | (.140) |
| Net Asset Value, End of Period | | $25.84 | $24.26 | $20.31 | $16.06 | $16.04 | $14.32 |
| |
| Total Return1 | | 11.54% | 20.69% | 27.18% | 0.66% | 12.81% | -4.27% |
| |
| Ratios/Supplemental Data | | | | | | | |
| Net Assets, End of Period (Millions) | $4,916 | $4,922 | $5,283 | $5,009 | $5,432 | $5,239 |
| Ratio of Total Expenses to | | | | | | | |
| Average Net Assets2 | | 0.40% | 0.39% | 0.40% | 0.42% | 0.44% | 0.48% |
| Ratio of Net Investment Income to | | | | | | |
| Average Net Assets | | 0.69% | 1.06% | 0.74% | 0.47% | 0.62% | 0.94% |
| Portfolio Turnover Rate | | 54% | 53% | 49% | 55% | 60% | 87% |
The expense ratio, net income ratio, and turnover rate for the current period have been annualized.
1 Total returns do not include account service fees that may have applied in the periods shown. Fund prospectuses provide information about
any applicable account service fees.
2 Includes performance-based investment advisory fee increases (decreases) of (0.04%), (0.05%), (0.04%), (0.01%), 0.01%, and 0.02%.
See accompanying Notes, which are an integral part of the Financial Statements.
23
Morgan Growth Fund
Financial Highlights
| | | | | | | |
| Admiral Shares | | | | | | | |
| | Six Months | | | | | |
| | | Ended | | | | | |
| For a Share Outstanding | March 31, | Year Ended September 30, |
| Throughout Each Period | | 2014 | 2013 | 2012 | 2011 | 2010 | 2009 |
| Net Asset Value, Beginning of Period | $75.26 | $63.02 | $49.84 | $49.75 | $44.42 | $47.03 |
| Investment Operations | | | | | | | |
| Net Investment Income | | .342 | .831 | .535 | .342 | .372 | .414 |
| Net Realized and Unrealized Gain (Loss) | | | | | | |
| on Investments | | 8.209 | 12.144 | 13.036 | .110 | 5.364 | (2.502) |
| Total from Investment Operations | | 8.551 | 12.975 | 13.571 | .452 | 5.736 | (2.088) |
| Distributions | | | | | | | |
| Dividends from Net Investment Income | (.664) | (.735) | (.391) | (.362) | (.406) | (.522) |
| Distributions from Realized Capital Gains | (3.067) | — | — | — | — | — |
| Total Distributions | | (3.731) | (.735) | (.391) | (.362) | (.406) | (.522) |
| Net Asset Value, End of Period | | $80.08 | $75.26 | $63.02 | $49.84 | $49.75 | $44.42 |
| |
| Total Return | | 11.61% | 20.86% | 27.35% | 0.83% | 12.95% | -4.09% |
| |
| Ratios/Supplemental Data | | | | | | | |
| Net Assets, End of Period (Millions) | $5,811 | $5,019 | $3,725 | $2,554 | $2,445 | $2,251 |
| Ratio of Total Expenses to | | | | | | | |
| Average Net Assets1 | | 0.26% | 0.25% | 0.26% | 0.28% | 0.30% | 0.31% |
| Ratio of Net Investment Income to | | | | | | |
| Average Net Assets | | 0.83% | 1.20% | 0.88% | 0.61% | 0.76% | 1.11% |
| Portfolio Turnover Rate | | 54% | 53% | 49% | 55% | 60% | 87% |
| The expense ratio, net income ratio, and turnover rate for the current period have been annualized. |
| 1 Includes performance-based investment advisory fee increases (decreases) of (0.04%), (0.05%), (0.04%), (0.01%), 0.01%, and 0.02%. |
See accompanying Notes, which are an integral part of the Financial Statements.
24
Morgan Growth Fund
Notes to Financial Statements
Vanguard Morgan Growth Fund is registered under the Investment Company Act of 1940 as an open-end investment company, or mutual fund. The fund offers two classes of shares: Investor Shares and Admiral Shares. Investor Shares are available to any investor who meets the fund’s minimum purchase requirements. Admiral Shares are designed for investors who meet certain administrative, service, and account-size criteria.
A. The following significant accounting policies conform to generally accepted accounting principles for U.S. mutual funds. The fund consistently follows such policies in preparing its financial statements.
1. Security Valuation: Securities are valued as of the close of trading on the New York Stock Exchange (generally 4 p.m., Eastern time) on the valuation date. Equity securities are valued at the latest quoted sales prices or official closing prices taken from the primary market in which each security trades; such securities not traded on the valuation date are valued at the mean of the latest quoted bid and asked prices. Securities for which market quotations are not readily available, or whose values have been affected by events occurring before the fund’s pricing time but after the close of the securities’ primary markets, are valued at their fair values calculated according to procedures adopted by the board of trustees. These procedures include obtaining quotations from an independent pricing service, monitoring news to identify significant market- or security-specific events, and evaluating changes in the values of foreign market proxies (for example, ADRs, futures contracts, or exchange-traded funds), between the time the foreign markets close and the fund’s pricing time. When fair-value pricing is employed, the prices of securities used by a fund to calculate its net asset value may differ from quoted or published prices for the same securities. Investments in Vanguard Market Liquidity Fund are valued at that fund’s net asset value. Temporary cash investments acquired over 60 days to maturity are valued using the latest bid prices or using valuations based on a matrix system (which considers such factors as security prices, yields, maturities, and ratings), both as furnished by independent pricing services. Other temporary cash investments are valued at amortized cost, which approximates market value.
2. Foreign Currency: Securities and other assets and liabilities denominated in foreign currencies are translated into U.S. dollars using exchange rates obtained from an independent third party as of the fund’s pricing time on the valuation date. Realized gains (losses) and unrealized appreciation (depreciation) on investment securities include the effects of changes in exchange rates since the securities were purchased, combined with the effects of changes in security prices. Fluctuations in the value of other assets and liabilities resulting from changes in exchange rates are recorded as unrealized foreign currency gains (losses) until the assets or liabilities are settled in cash, at which time they are recorded as realized foreign currency gains (losses).
3. Futures Contracts: The fund uses index futures contracts to a limited extent, with the objective of maintaining full exposure to the stock market while maintaining liquidity. The fund may purchase or sell futures contracts to achieve a desired level of investment, whether to accommodate portfolio turnover or cash flows from capital share transactions. The primary risks associated with the use of futures contracts are imperfect correlation between changes in market values of stocks held by the fund and the prices of futures contracts, and the possibility of an illiquid market. Counterparty risk involving futures is mitigated because a regulated clearinghouse is the counterparty instead of the clearing broker. To further mitigate counterparty risk, the fund trades futures contracts on an exchange, monitors the financial strength of its clearing brokers and clearinghouse, and has entered into clearing agreements with its clearing brokers. The clearinghouse imposes initial margin requirements to secure the fund’s performance and requires daily settlement of variation margin representing changes in the market value of each contract.
25
Morgan Growth Fund
Futures contracts are valued at their quoted daily settlement prices. The aggregate notional amounts of the contracts are not recorded in the Statement of Net Assets. Fluctuations in the value of the contracts are recorded in the Statement of Net Assets as an asset (liability) and in the Statement of Operations as unrealized appreciation (depreciation) until the contracts are closed, when they are recorded as realized futures gains (losses).
During the six months ended March 31, 2014, the fund’s average investments in long and short futures contracts represented less than 1% and 0% of net assets, respectively, based on quarterly average aggregate settlement values.
4. Repurchase Agreements: The fund enters into repurchase agreements with institutional counter-parties. Securities pledged as collateral to the fund under repurchase agreements are held by a custodian bank until the agreements mature. Each agreement requires that the market value of the collateral be sufficient to cover payments of interest and principal. The fund further mitigates its counterparty risk by entering into repurchase agreements only with a diverse group of prequalified counterparties, monitoring their financial strength, and entering into master repurchase agreements with its counterparties. The master repurchase agreements provide that, in the event of a counterparty’s default (including bankruptcy), the fund may terminate any repurchase agreements with that counterparty, determine the net amount owed, and sell or retain the collateral up to the net amount owed to the fund. Such action may be subject to legal proceedings, which may delay or limit the disposition of collateral.
5. Federal Income Taxes: The fund intends to continue to qualify as a regulated investment company and distribute all of its taxable income. Management has analyzed the fund’s tax positions taken for all open federal income tax years (September 30, 2010–2013), and for the period ended March 31, 2014, and has concluded that no provision for federal income tax is required in the fund’s financial statements.
6. Distributions: Distributions to shareholders are recorded on the ex-dividend date.
7. Securities Lending: To earn additional income, the fund lends its securities to qualified institutional borrowers. Security loans are required to be secured at all times by collateral in an amount at least equal to the market value of securities loaned. Daily market fluctuations could cause the value of loaned securities to be more or less than the value of the collateral received. When this occurs, the collateral is adjusted and settled on the next business day. The fund further mitigates its counterparty risk by entering into securities lending transactions only with a diverse group of prequalified counterparties, monitoring their financial strength, and entering into master securities lending agreements with its counterparties. The master securities lending agreements provide that, in the event of a counterparty’s default (including bankruptcy), the fund may terminate any loans with that borrower, determine the net amount owed, and sell or retain the collateral up to the net amount owed to the fund; however, such actions may be subject to legal proceedings. While collateral mitigates counterparty risk, in the absence of a default the fund may experience delays and costs in recovering the securities loaned. The fund invests cash collateral received in Vanguard Market Liquidity Fund, and records a liability in the Statement of Net Assets for the return of the collateral, during the period the securities are on loan. Securities lending income represents fees charged to borrowers plus income earned on invested cash collateral, less expenses associated with the loan.
8. Credit Facility: The fund and certain other funds managed by The Vanguard Group participate in a $2.89 billion committed credit facility provided by a syndicate of lenders pursuant to a credit agreement which may be renewed annually; each fund is individually liable for its borrowings, if any, under the credit facility. Borrowings may be utilized for temporary and emergency purposes, and are subject to
26
Morgan Growth Fund
the fund’s regulatory and contractual borrowing restrictions. The participating funds are charged administrative fees and an annual commitment fee of 0.06% of the undrawn amount of the facility, which are allocated to the funds in accordance with a methodology approved by the board of trustees and included in Management and Administrative expenses on the fund’s Statement of Operations. Any borrowings under this facility bear interest at a rate equal to the higher of the Federal Funds Rate or LIBOR Reference Rate plus an agreed-upon spread.
The fund had no borrowings outstanding at March 31, 2014, or at any time during the period then ended.
9. Other: Dividend income is recorded on the ex-dividend date. Interest income includes income distributions received from Vanguard Market Liquidity Fund and is accrued daily. Premiums and discounts on debt securities purchased are amortized and accreted, respectively, to interest income over the lives of the respective securities. Security transactions are accounted for on the date securities are bought or sold. Costs used to determine realized gains (losses) on the sale of investment securities are those of the specific securities sold.
Each class of shares has equal rights as to assets and earnings, except that each class separately bears certain class-specific expenses related to maintenance of shareholder accounts (included in Management and Administrative expenses) and shareholder reporting. Marketing and distribution expenses are allocated to each class of shares based on a method approved by the board of trustees. Income, other non-class-specific expenses, and gains and losses on investments are allocated to each class of shares based on its relative net assets.
B. Wellington Management Company, llp, Jennison Associates LLC, Frontier Capital Management Co., LLC, and Kalmar Investment Advisers each provide investment advisory services to a portion of the fund for a fee calculated at an annual percentage rate of average net assets managed by the advisor. The basic fee of Wellington Management Company, llp, is subject to quarterly adjustments based on performance for the preceding three years relative to the Russell 3000 Growth Index. The basic fee of Jennison Associates LLC is subject to quarterly adjustments based on performance for the preceding three years relative to the Russell 1000 Growth Index. The basic fees of Frontier Capital Management Co., LLC, and Kalmar Investment Advisers are subject to quarterly adjustments based on performance for the preceding three years relative to the Russell Midcap Growth Index.
The Vanguard Group provides investment advisory services to a portion of the fund on an at-cost basis; the fund paid Vanguard advisory fees of $294,000 for the six months ended March 31, 2014.
For the six months ended March 31, 2014, the aggregate investment advisory fee represented an effective annual basic rate of 0.16% of the fund’s average net assets, before a decrease of $1,883,000 (0.04%) based on performance.
C. The Vanguard Group furnishes at cost corporate management, administrative, marketing, and distribution services. The costs of such services are allocated to the fund under methods approved by the board of trustees. The fund has committed to provide up to 0.40% of its net assets in capital contributions to Vanguard. At March 31, 2014, the fund had contributed capital of $1,194,000 to Vanguard (included in Other Assets), representing 0.01% of the fund’s net assets and 0.48% of Vanguard’s capitalization. The fund’s trustees and officers are also directors and officers of Vanguard.
27
Morgan Growth Fund
D. The fund has asked its investment advisors to direct certain security trades, subject to obtaining the best price and execution, to brokers who have agreed to rebate to the fund part of the commissions generated. Such rebates are used solely to reduce the fund’s management and administrative expenses. For the six months ended March 31, 2014, these arrangements reduced the fund’s expenses by $146,000 (an annual rate of 0.00% of average net assets).
E. Various inputs may be used to determine the value of the fund’s investments. These inputs are summarized in three broad levels for financial statement purposes. The inputs or methodologies used to value securities are not necessarily an indication of the risk associated with investing in those securities.
Level 1—Quoted prices in active markets for identical securities.
Level 2—Other significant observable inputs (including quoted prices for similar securities, interest rates, prepayment speeds, credit risk, etc.).
Level 3—Significant unobservable inputs (including the fund’s own assumptions used to determine the fair value of investments).
The following table summarizes the market value of the fund’s investments as of March 31, 2014, based on the inputs used to value them:
| | | |
| | Level 1 | Level 2 | Level 3 |
| Investments | ($000) | ($000) | ($000) |
| Common Stocks | 10,526,984 | 25,872 | — |
| Temporary Cash Investments | 97,833 | 80,699 | — |
| Futures Contracts—Assets1 | 488 | — | — |
| Total | 10,625,305 | 106,571 | — |
| 1 Represents variation margin on the last day of the reporting period. |
F. At March 31, 2014, the aggregate settlement value of open futures contracts and the related unrealized appreciation (depreciation) were:
| | | | |
| | | | ($000) |
| | | | Aggregate | |
| | | Number of | Settlement | Unrealized |
| | | Long (Short) | Value | Appreciation |
| Futures Contracts | Expiration | Contracts | Long (Short) | (Depreciation) |
| S&P 500 Index | June 2014 | 135 | 62,930 | 315 |
| E-mini S&P 500 Index | June 2014 | 14 | 1,305 | 12 |
| | | | | 327 |
Unrealized appreciation (depreciation) on open futures contracts is required to be treated as realized gain (loss) for tax purposes.
G. Distributions are determined on a tax basis and may differ from net investment income and realized capital gains for financial reporting purposes. Differences may be permanent or temporary. Permanent differences are reclassified among capital accounts in the financial statements to reflect their tax character. Temporary differences arise when certain items of income, expense, gain, or loss are recognized in different periods for financial statement and tax purposes. These differences will
28
Morgan Growth Fund
reverse at some time in the future. Differences in classification may also result from the treatment of short-term gains as ordinary income for tax purposes. The fund’s tax-basis capital gains and losses are determined only at the end of each fiscal year.
During the six months ended March 31, 2014, the fund realized net foreign currency gains of $108,000, which increased distributable net income for tax purposes; accordingly, such gains have been reclassified from accumulated net realized gains to overdistributed net investment income.
At March 31, 2014, the cost of investment securities for tax purposes was $7,357,059,000. Net unrealized appreciation of investment securities for tax purposes was $3,374,329,000 consisting of unrealized gains of $3,424,338,000 on securities that had risen in value since their purchase and $50,009,000 in unrealized losses on securities that had fallen in value since their purchase.
H. During the six months ended March 31, 2014, the fund purchased $2,780,750,000 of investment securities and sold $3,120,879,000 of investment securities, other than temporary cash investments.
I. Capital share transactions for each class of shares were:
| | | | |
| | Six Months Ended | Year Ended |
| | March 31, 2014 | September 30, 2013 |
| | Amount | Shares | Amount | Shares |
| | ($000) | (000) | ($000) | (000) |
| Investor Shares | | | | |
| Issued | 186,403 | 7,283 | 268,773 | 12,587 |
| Issued in Lieu of Cash Distributions | 213,461 | 8,667 | 49,772 | 2,519 |
| Redeemed | (732,071) | (28,589) | (1,581,412) | (72,367) |
| Net Increase (Decrease)—Investor Shares | (332,207) | (12,639) | (1,262,867) | (57,261) |
| Admiral Shares | | | | |
| Issued | 722,541 | 9,096 | 1,256,023 | 18,539 |
| Issued in Lieu of Cash Distributions | 242,786 | 3,182 | 39,037 | 638 |
| Redeemed | (507,252) | (6,417) | (772,799) | (11,580) |
| Net Increase (Decrease)—Admiral Shares | 458,075 | 5,861 | 522,261 | 7,597 |
J. Management has determined that no material events or transactions occurred subsequent to March 31, 2014, that would require recognition or disclosure in these financial statements.
29
About Your Fund’s Expenses
As a shareholder of the fund, you incur ongoing costs, which include costs for portfolio management, administrative services, and shareholder reports (like this one), among others. Operating expenses, which are deducted from a fund’s gross income, directly reduce the investment return of the fund.
A fund’s expenses are expressed as a percentage of its average net assets. This figure is known as the expense ratio. The following examples are intended to help you understand the ongoing costs (in dollars) of investing in your fund and to compare these costs with those of other mutual funds. The examples are based on an investment of $1,000 made at the beginning of the period shown and held for the entire period.
The accompanying table illustrates your fund’s costs in two ways:
• Based on actual fund return. This section helps you to estimate the actual expenses that you paid over the period. The ”Ending Account Value“ shown is derived from the fund‘s actual return, and the third column shows the dollar amount that would have been paid by an investor who started with $1,000 in the fund. You may use the information here, together with the amount you invested, to estimate the expenses that you paid over the period.
To do so, simply divide your account value by $1,000 (for example, an $8,600 account value divided by $1,000 = 8.6), then multiply the result by the number given for your fund under the heading ”Expenses Paid During Period.“
• Based on hypothetical 5% yearly return. This section is intended to help you compare your fund‘s costs with those of other mutual funds. It assumes that the fund had a yearly return of 5% before expenses, but that the expense ratio is unchanged. In this case—because the return used is not the fund’s actual return—the results do not apply to your investment. The example is useful in making comparisons because the Securities and Exchange Commission requires all mutual funds to calculate expenses based on a 5% return. You can assess your fund’s costs by comparing this hypothetical example with the hypothetical examples that appear in shareholder reports of other funds.
Note that the expenses shown in the table are meant to highlight and help you compare ongoing costs only and do not reflect transaction costs incurred by the fund for buying and selling securities. Further, the expenses do not include any purchase, redemption, or account service fees described in the fund prospectus. If such fees were applied to your account, your costs would be higher. Your fund does not carry a “sales load.”
The calculations assume no shares were bought or sold during the period. Your actual costs may have been higher or lower, depending on the amount of your investment and the timing of any purchases or redemptions.
You can find more information about the fund’s expenses, including annual expense ratios, in the Financial Statements section of this report. For additional information on operating expenses and other shareholder costs, please refer to your fund’s current prospectus.
30
| | | |
| Six Months Ended March 31, 2014 | | | |
| | Beginning | Ending | Expenses |
| | Account Value | Account Value | Paid During |
| Morgan Growth Fund | 9/30/2013 | 3/31/2014 | Period |
| Based on Actual Fund Return | | | |
| Investor Shares | $1,000.00 | $1,115.38 | $2.11 |
| Admiral Shares | 1,000.00 | 1,116.08 | 1.37 |
| Based on Hypothetical 5% Yearly Return | | | |
| Investor Shares | $1,000.00 | $1,022.94 | $2.02 |
| Admiral Shares | 1,000.00 | 1,023.64 | 1.31 |
The calculations are based on expenses incurred in the most recent six-month period. The fund’s annualized six-month expense ratios for that
period are 0.40% for Investor Shares and 0.26% for Admiral Shares. The dollar amounts shown as “Expenses Paid” are equal to the
annualized expense ratio multiplied by the average account value over the period, multiplied by the number of days in the most recent
six-month period, then divided by the number of days in the most recent 12-month period.
31
Trustees Approve Advisory Arrangements
The board of trustees of Vanguard Morgan Growth Fund has renewed the fund’s investment advisory arrangements with Frontier Capital Management Co., LLC (Frontier), Jennison Associates LLC (Jennison), Kalmar Investment Advisers (Kalmar), Wellington Management Company, llp (Wellington Management), and The Vanguard Group, Inc. (Vanguard) (through its Equity Investment Group). The board determined that renewing the fund’s advisory arrangements was in the best interests of the fund and its shareholders.
The board based its decisions upon an evaluation of each advisor’s investment staff, portfolio management process, and performance. The trustees considered the factors discussed below, among others. However, no single factor determined whether the board approved the arrangements. Rather, it was the totality of the circumstances that drove the board’s decisions.
Nature, extent, and quality of services
The board considered the quality of the fund’s investment management services over both the short and long term, and took into account the organizational depth and stability of each advisor. The board noted the following: Frontier. Frontier, founded in 1980, is known for a fundamental, research-intensive investment approach focused on small and midsized stocks. The firm seeks companies with a combination of superior growth potential and attractive valuation. Frontier’s investment process emphasizes companies with understandable business models, good franchises, accelerating sales and margins, and healthy balance sheets. Analysts regularly interact with management and other companies in the supply chain to effectively construct a portfolio of stocks for the fund. Frontier has managed a portion of the fund since 2008.
Jennison. Jennison, founded in 1969, is an indirect, wholly owned subsidiary of Prudential Financial, Inc. The firm currently oversees a wide range of equity and fixed income strategies. The investment team at Jennison uses internal fundamental research and a highly interactive bottom-up stock selection process to identify companies that exhibit above-average growth in units, revenues, earnings, and cash flows. When evaluating a company for purchase or sale, the analysis focuses on the duration of the growth opportunity and seeks to capture inflection points in the company’s growth. Jennison has managed a portion of the fund since 2007.
Kalmar. Kalmar, together with its parent company, Kalmar Investments Inc., founded in 1982, specializes in small- and mid-capitalization growth stocks. Kalmar is a research-driven investment firm that is entirely focused on the management of “growth with value” small- and mid-cap equity portfolios. Kalmar believes that there is a high-reward/low-risk anomaly offered by the equity market in the stocks of solid, well-managed, rapidly growing smaller companies. Through independent fundamental research, Kalmar attempts to discover such companies, buy them at undervalued levels, and own them for the longer term. Kalmar has managed a portion of the fund since 2008.
Wellington Management. Wellington Management, founded in 1928, is among the nation’s oldest and most respected institutional investment managers. The investment team at Wellington Management uses traditional methods of stock selection to identify companies that it believes have above-average growth prospects, particularly those in industries undergoing change. Research focuses on large- and mid-capitalization companies with a proven record of sales and earnings growth, profitability, and cash-flow generation. Wellington Management has advised the fund since 1968.
32
Vanguard. Vanguard has been managing investments for more than three decades. The Equity Investment Group adheres to a sound, disciplined investment management process; the team has considerable experience, stability, and depth. Vanguard has managed a portion of the fund since 1993.
The board concluded that each advisor’s experience, stability, depth, and performance, among other factors, warranted continuation of the advisory arrangements.
Investment performance
The board considered the short- and long-term performance of the fund and each advisor, including any periods of outperformance or underperformance relative to a benchmark index and peer group. The board concluded that the performance was such that each advisory arrangement should continue. Information about the fund’s most recent performance can be found in the Performance Summary section of this report.
Cost
The board concluded that the fund’s expense ratio was well below the average expense ratio charged by funds in its peer group and that the fund’s advisory fee rate was also well below its peer-group average. Information about the fund’s expenses appears in the About Your Fund’s Expenses section of this report as well as in the Financial Statements section, which also includes information about the fund’s advisory fee rate.
The board did not consider profitability of Frontier, Jennison, Kalmar, and Wellington Management in determining whether to approve the advisory fees, because the firms are independent of Vanguard and the advisory fees are the result of arm’s-length negotiations. The board does not conduct a profitability analysis of Vanguard, because of Vanguard’s unique “at-cost” structure. Unlike most other mutual fund management companies, Vanguard is owned by the funds it oversees, and produces “profits” only in the form of reduced expenses for fund shareholders.
The benefit of economies of scale
The board concluded that the fund’s shareholders benefit from economies of scale because of breakpoints in the advisory fee schedules for Frontier, Jennison, Kalmar, and Wellington Management. The breakpoints reduce the effective rate of the fees as the fund’s assets managed by each advisor increase. The board also concluded that the fund’s at-cost arrangement with Vanguard ensures that the fund will realize economies of scale as it grows, with the cost to shareholders declining as fund assets managed by Vanguard increase.
The board will consider whether to renew the advisory arrangements again after a one-year period.
33
Glossary
30-Day SEC Yield. A fund’s 30-day SEC yield is derived using a formula specified by the U.S. Securities and Exchange Commission. Under the formula, data related to the fund’s security holdings in the previous 30 days are used to calculate the fund’s hypothetical net income for that period, which is then annualized and divided by the fund’s estimated average net assets over the calculation period. For the purposes of this calculation, a security’s income is based on its current market yield to maturity (for bonds), its actual income (for asset-backed securities), or its projected dividend yield (for stocks). Because the SEC yield represents hypothetical annualized income, it will differ—at times significantly—from the fund’s actual experience. As a result, the fund’s income distributions may be higher or lower than implied by the SEC yield.
Beta. A measure of the magnitude of a fund’s past share-price fluctuations in relation to the ups and downs of a given market index. The index is assigned a beta of 1.00. Compared with a given index, a fund with a beta of 1.20 typically would have seen its share price rise or fall by 12% when the index rose or fell by 10%. For this report, beta is based on returns over the past 36 months for both the fund and the index. Note that a fund’s beta should be reviewed in conjunction with its R-squared (see definition). The lower the R-squared, the less correlation there is between the fund and the index, and the less reliable beta is as an indicator of volatility.
Dividend Yield. Dividend income earned by stocks, expressed as a percentage of the aggregate market value (or of net asset value, for a fund). The yield is determined by dividing the amount of the annual dividends by the aggregate value (or net asset value) at the end of the period. For a fund, the dividend yield is based solely on stock holdings and does not include any income produced by other investments.
Earnings Growth Rate. The average annual rate of growth in earnings over the past five years for the stocks now in a fund.
Equity Exposure. A measure that reflects a fund’s investments in stocks and stock futures. Any holdings in short-term reserves are excluded.
Expense Ratio. A fund’s total annual operating expenses expressed as a percentage of the fund’s average net assets. The expense ratio includes management and administrative expenses, but does not include the transaction costs of buying and selling portfolio securities.
Foreign Holdings. The percentage of a fund represented by securities or depositary receipts of companies based outside the United States.
Inception Date. The date on which the assets of a fund (or one of its share classes) are first invested in accordance with the fund’s investment objective. For funds with a subscription period, the inception date is the day after that period ends. Investment performance is measured from the inception date.
Median Market Cap. An indicator of the size of companies in which a fund invests; the midpoint of market capitalization (market price x shares outstanding) of a fund’s stocks, weighted by the proportion of the fund’s assets invested in each stock. Stocks representing half of the fund’s assets have market capitalizations above the median, and the rest are below it.
Price/Book Ratio. The share price of a stock divided by its net worth, or book value, per share. For a fund, the weighted average price/book ratio of the stocks it holds.
34
Price/Earnings Ratio. The ratio of a stock’s current price to its per-share earnings over the past year. For a fund, the weighted average P/E of the stocks it holds. P/E is an indicator of market expectations about corporate prospects; the higher the P/E, the greater the expectations for a company’s future growth.
R-Squared. A measure of how much of a fund’s past returns can be explained by the returns from the market in general, as measured by a given index. If a fund’s total returns were precisely synchronized with an index’s returns, its R-squared would be 1.00. If the fund’s returns bore no relationship to the index’s returns, its R-squared would be 0. For this report, R-squared is based on returns over the past 36 months for both the fund and the index.
Return on Equity. The annual average rate of return generated by a company during the past five years for each dollar of shareholder’s equity (net income divided by shareholder’s equity). For a fund, the weighted average return on equity for the companies whose stocks it holds.
Short-Term Reserves. The percentage of a fund invested in highly liquid, short-term securities that can be readily converted to cash.
Turnover Rate. An indication of the fund’s trading activity. Funds with high turnover rates incur higher transaction costs and may be more likely to distribute capital gains (which may be taxable to investors). The turnover rate excludes in-kind transactions, which have minimal impact on costs.
35
The People Who Govern Your Fund
The trustees of your mutual fund are there to see that the fund is operated and managed in your best interests since, as a shareholder, you are a part owner of the fund. Your fund’s trustees also serve on the board of directors of The Vanguard Group, Inc., which is owned by the Vanguard funds and provides services to them on an at-cost basis.
A majority of Vanguard’s board members are independent, meaning that they have no affiliation with Vanguard or the funds they oversee, apart from the sizable personal investments they have made as private individuals. The independent board members have distinguished backgrounds in business, academia, and public service. Each of the trustees and executive officers oversees 179 Vanguard funds.
The following table provides information for each trustee and executive officer of the fund. More information about the trustees is in the Statement of Additional Information, which can be obtained, without charge, by contacting Vanguard at 800-662-7447, or online at vanguard.com.
| InterestedTrustee1 | and Delphi Automotive LLP (automotive components); |
| | Senior Advisor at New Mountain Capital. |
| F. William McNabb III | |
| Born 1957. Trustee Since July 2009. Chairman of the | Amy Gutmann |
| Board. Principal Occupation(s) During the Past Five | Born 1949. Trustee Since June 2006. Principal |
| Years: Chairman of the Board of The Vanguard Group, | Occupation(s) During the Past Five Years: President of |
| Inc., and of each of the investment companies served | the University of Pennsylvania; Christopher H. Browne |
| by The Vanguard Group, since January 2010; Director | Distinguished Professor of Political Science, School of |
| of The Vanguard Group since 2008; Chief Executive | Arts and Sciences, and Professor of Communication, |
| Officer and President of The Vanguard Group, and of | Annenberg School for Communication, with secondary |
| each of the investment companies served by The | faculty appointments in the Department of Philosophy, |
| Vanguard Group, since 2008; Director of Vanguard | School of Arts and Sciences, and at the Graduate |
| Marketing Corporation; Managing Director of The | School of Education, University of Pennsylvania; |
| Vanguard Group (1995–2008). | Trustee of the National Constitution Center; Chair |
| | of the Presidential Commission for the Study of |
| | Bioethical Issues. |
| IndependentTrustees | |
| | |
| Emerson U. Fullwood | JoAnn Heffernan Heisen |
| Born 1948. Trustee Since January 2008. Principal | Born 1950. Trustee Since July 1998. Principal |
| Occupation(s) During the Past Five Years: Executive | Occupation(s) During the Past Five Years: Corporate |
| Chief Staff and Marketing Officer for North America | Vice President and Chief Global Diversity Officer |
| and Corporate Vice President (retired 2008) of Xerox | (retired 2008) and Member of the Executive |
| Corporation (document management products and | Committee (1997–2008) of Johnson & Johnson |
| services); Executive in Residence and 2009–2010 | (pharmaceuticals/medical devices/consumer |
| Distinguished Minett Professor at the Rochester | products); Director of Skytop Lodge Corporation |
| Institute of Technology; Director of SPX Corporation | (hotels), the University Medical Center at Princeton, |
| (multi-industry manufacturing), the United Way of | the Robert Wood Johnson Foundation, and the Center |
| Rochester, Amerigroup Corporation (managed health | for Talent Innovation; Member of the Advisory Board |
| care), the University of Rochester Medical Center, | of the Maxwell School of Citizenship and Public Affairs |
| Monroe Community College Foundation, and North | at Syracuse University. |
| Carolina A&T University. | |
| F. Joseph Loughrey |
| Rajiv L. Gupta | Born 1949. Trustee Since October 2009. Principal |
| Born 1945. Trustee Since December 2001.2 | Occupation(s) During the Past Five Years: President |
| Principal Occupation(s) During the Past Five Years: | and Chief Operating Officer (retired 2009) of Cummins |
| Chairman and Chief Executive Officer (retired 2009) | Inc. (industrial machinery); Chairman of the Board |
| and President (2006–2008) of Rohm and Haas Co. | of Hillenbrand, Inc. (specialized consumer services), |
| (chemicals); Director of Tyco International, Ltd. | and of Oxfam America; Director of SKF AB (industrial |
| (diversified manufacturing and services), Hewlett- | machinery), Hyster-Yale Materials Handling, Inc. |
| Packard Co. (electronic computer manufacturing), | (forklift trucks), the Lumina Foundation for Education, |
| | |
| and the V Foundation for Cancer Research; Member | Executive Officers | |
| of the Advisory Council for the College of Arts and | | |
| Letters and of the Advisory Board to the Kellogg | Glenn Booraem | |
| Institute for International Studies, both at the | Born 1967. Controller Since July 2010. Principal |
| University of Notre Dame. | Occupation(s) During the Past Five Years: Principal |
| | of The Vanguard Group, Inc.; Controller of each of |
| Mark Loughridge | the investment companies served by The Vanguard |
| Born 1953. Trustee Since March 2012. Principal | Group; Assistant Controller of each of the investment |
| Occupation(s) During the Past Five Years: Senior Vice | companies served by The Vanguard Group (2001–2010). |
| President and Chief Financial Officer (retired 2013) | | |
| at IBM (information technology services); Fiduciary | Thomas J. Higgins | |
| Member of IBM’s Retirement Plan Committee (2004– | Born 1957. Chief Financial Officer Since September |
| 2013); Member of the Council on Chicago Booth. | 2008. Principal Occupation(s) During the Past Five |
| | Years: Principal of The Vanguard Group, Inc.; Chief |
| Scott C. Malpass | Financial Officer of each of the investment companies |
| Born 1962. Trustee Since March 2012. Principal | served by The Vanguard Group; Treasurer of each of |
| Occupation(s) During the Past Five Years: Chief | the investment companies served by The Vanguard |
| Investment Officer and Vice President at the University | Group (1998–2008). | |
| of Notre Dame; Assistant Professor of Finance at the | | |
| Mendoza College of Business at Notre Dame; Member | Kathryn J. Hyatt | |
| of the Notre Dame 403(b) Investment Committee; | Born 1955. Treasurer Since November 2008. Principal |
| Board Member of TIFF Advisory Services, Inc. | Occupation(s) During the Past Five Years: Principal of |
| (investment advisor); Member of the Investment | The Vanguard Group, Inc.; Treasurer of each of the |
| Advisory Committees of the Financial Industry | investment companies served by The Vanguard |
| Regulatory Authority (FINRA) and of Major League | Group; Assistant Treasurer of each of the investment |
| Baseball. | companies served by The Vanguard Group (1988–2008). |
| |
| André F. Perold | Heidi Stam | |
| Born 1952. Trustee Since December 2004. Principal | Born 1956. Secretary Since July 2005. Principal |
| Occupation(s) During the Past Five Years: George | Occupation(s) During the Past Five Years: Managing |
| Gund Professor of Finance and Banking, Emeritus | Director of The Vanguard Group, Inc.; General Counsel |
| at the Harvard Business School (retired 2011); | of The Vanguard Group; Secretary of The Vanguard |
| Chief Investment Officer and Managing Partner of | Group and of each of the investment companies |
| HighVista Strategies LLC (private investment firm); | served by The Vanguard Group; Director and Senior |
| Director of Rand Merchant Bank; Overseer of the | Vice President of Vanguard Marketing Corporation. |
| Museum of Fine Arts Boston. | | |
| | Vanguard Senior ManagementTeam |
| Alfred M. Rankin, Jr. | | |
| Born 1941. Trustee Since January 1993. Principal | Mortimer J. Buckley | Chris D. McIsaac |
| Occupation(s) During the Past Five Years: Chairman, | Kathleen C. Gubanich | Michael S. Miller |
| President, and Chief Executive Officer of NACCO | Paul A. Heller | James M. Norris |
| Industries, Inc. (housewares/lignite), and of Hyster- | Martha G. King | Glenn W. Reed |
| Yale Materials Handling, Inc. (forklift trucks); Chairman | John T. Marcante | |
| of the Board of University Hospitals of Cleveland. | | |
| |
| Peter F. Volanakis | Chairman Emeritus and Senior Advisor |
| Born 1955. Trustee Since July 2009. Principal | | |
| Occupation(s) During the Past Five Years: President | John J. Brennan | |
| and Chief Operating Officer (retired 2010) of Corning | Chairman, 1996–2009 | |
| Incorporated (communications equipment); Trustee of | Chief Executive Officer and President, 1996–2008 |
| Colby-Sawyer College; Member of the Advisory Board | | |
| of the Norris Cotton Cancer Center and of the Advisory | | |
| Board of the Parthenon Group (strategy consulting). | Founder | |
| | John C. Bogle | |
| | Chairman and Chief Executive Officer, 1974–1996 |
1 Mr. McNabb is considered an “interested person,” as defined in the Investment Company Act of 1940, because he is an officer of the
Vanguard funds.
2 December 2002 for Vanguard Equity Income Fund, the Vanguard Municipal Bond Funds, and the Vanguard State Tax-Exempt Funds.
| |  |
| | | P.O. Box 2600 |
| | | Valley Forge, PA 19482-2600 |
| |
| |
| |
| Connect with Vanguard® > vanguard.com |
| |
| |
| |
| Fund Information > 800-662-7447 | | CFA® is a trademark owned by CFA Institute. |
| Direct Investor Account Services > 800-662-2739 | |
| Institutional Investor Services > 800-523-1036 | |
| Text Telephone for People | | |
| With Hearing Impairment > 800-749-7273 | |
| |
| This material may be used in conjunction | |
| with the offering of shares of any Vanguard | |
| fund only if preceded or accompanied by | |
| the fund’s current prospectus. | |
| |
| All comparative mutual fund data are from Lipper, a | |
| Thomson Reuters Company, or Morningstar, Inc., unless | |
| otherwise noted. | | |
| |
| You can obtain a free copy of Vanguard’s proxy voting | |
| guidelines by visiting vanguard.com/proxyreporting or by | |
| calling Vanguard at 800-662-2739. The guidelines are | |
| also available from the SEC’s website, sec.gov. In | |
| addition, you may obtain a free report on how your fund | |
| voted the proxies for securities it owned during the 12 | |
| months ended June 30. To get the report, visit either | |
| vanguard.com/proxyreporting or sec.gov. | |
| |
| You can review and copy information about your fund at | |
| the SEC’s Public Reference Room in Washington, D.C. To | |
| find out more about this public service, call the SEC at | |
| 202-551-8090. Information about your fund is also | |
| available on the SEC’s website, and you can receive | |
| copies of this information, for a fee, by sending a | |
| request in either of two ways: via e-mail addressed to | |
| publicinfo@sec.gov or via regular mail addressed to the | |
| Public Reference Section, Securities and Exchange | |
| Commission, Washington, DC 20549-1520. | |
| |
| | | © 2014 The Vanguard Group, Inc. |
| | | All rights reserved. |
| | | Vanguard Marketing Corporation, Distributor. |
| |
| | | Q262 052014 |
Item 2: Code of Ethics.
Not Applicable.
Item 3:
Not Applicable.
Item 4: Principal Accountant Fees and Services.
Not. Applicable.
Item 5: Audit Committee of Listed Registrants.
Not Applicable.
Item 6: Investments.
Not Applicable.
Item 7: Disclosure of Proxy Voting Policies and Procedures for Closed-End Management Investment Companies.
Not Applicable.
Item 8: Portfolio Managers of Closed-End Management Investment Companies.
Not Applicable.
Item 9: Purchase of Equity Securities by Closed-End Management Investment Company and Affiliated Purchasers.
Not Applicable.
Item 10: Submission of Matters to a Vote of Security Holders.
Not Applicable.
Item 11: Controls and Procedures.
(a) Disclosure Controls and Procedures. The Principal Executive and Financial Officers concluded that the Registrant’s Disclosure Controls and Procedures are effective based on their evaluation of the Disclosure Controls and Procedures as of a date within 90 days of the filing date of this report.
0314238, v0.55
(b) Internal Control Over Financial Reporting. There were no significant changes in Registrant’s Internal Control Over Financial Reporting or in other factors that could significantly affect this control subsequent to the date of the evaluation, including any corrective actions with regard to significant deficiencies and material weaknesses.
Item 12: Exhibits.
(a) Certifications.
Pursuant to the requirements of the Securities Exchange Act of 1934 and the Investment Company Act of 1940, the registrant has duly caused this report to be signed on its behalf by the undersigned, thereunto duly authorized.
| |
| | VANGUARD MORGAN GROWTH FUND |
| |
| |
| BY: | /s/ F. WILLIAM MCNABB III* |
| F. WILLIAM MCNABB III |
| | CHIEF EXECUTIVE OFFICER |
| |
| Date: May 19, 2014 |
Pursuant to the requirements of the Securities Exchange Act of 1934 and the Investment Company Act of 1940, this report has been signed below by the following persons on behalf of the registrant and in the capacities and on the dates indicated.
| |
| | VANGUARD MORGAN GROWTH FUND |
| |
BY: | /s/ F. WILLIAM MCNABB III* |
| | F. WILLIAM MCNABB III |
| | CHIEF EXECUTIVE OFFICER |
Date: May 19, 2014 |
| | VANGUARD MORGAN GROWTH FUND |
| |
BY: | /s/ THOMAS J. HIGGINS* |
| THOMAS J. HIGGINS |
| | CHIEF FINANCIAL OFFICER |
Date: May 19, 2014 |
* By: /s/ Heidi Stam
Heidi Stam, pursuant to a Power of Attorney filed on April 22, 2014 see file Number
2-17620, Incorporated by Reference.