UNITED STATES
SECURITIES AND EXCHANGE COMMISSION
Washington, D.C. 20549
FORM N-CSR
CERTIFIED SHAREHOLDER REPORT
OF
REGISTERED MANAGEMENT INVESTMENT COMPANIES
Investment Company Act file number: 811-1685
Name of Registrant: Vanguard Morgan Growth Fund
Address of Registrant:
P.O. Box 2600
Valley Forge, PA 19482
Name and address of agent for service:
Heidi Stam, Esquire
P.O. Box 876
Valley Forge, PA 19482
Registrant’s telephone number, including area code: (610) 669-1000
Date of fiscal year end: September 30
Date of reporting period: October 1, 2011 – March 31, 2012
Item 1: Reports to Shareholders
 |
| Semiannual Report | March 31, 2012 |
| Vanguard MorganTM Growth Fund |
> For the six months ended March 31, 2012, Vanguard Morgan Growth Fund returned about 28%.
> The fund outperformed the return of its benchmark index and the average return of peer funds.
> A rally in the broad U.S. stock market and astute stock choices by the fund’s advisors accounted for the fund’s strong performance over the six months.
| |
| Contents | |
| Your Fund’s Total Returns. | 1 |
| Chairman’s Letter. | 2 |
| Advisors’ Report. | 6 |
| Fund Profile. | 10 |
| Performance Summary. | 11 |
| Financial Statements. | 12 |
| About Your Fund’s Expenses. | 25 |
| Trustees Approve Advisory Arrangements. | 27 |
| Glossary. | 29 |
Please note: The opinions expressed in this report are just that—informed opinions. They should not be considered promises or advice.
Also, please keep in mind that the information and opinions cover the period through the date on the front of this report. Of course, the
risks of investing in your fund are spelled out in the prospectus.
See the Glossary for definitions of investment terms used in this report.
About the cover: Vanguard was named for the HMS Vanguard, flagship of British Admiral Horatio Nelson. A ship—whose
performance and safety depend on the work of all hands—has served as a fitting metaphor for the Vanguard crew as we
strive to help clients reach their financial goals.
Your Fund’s Total Returns
| |
| Six Months Ended March 31, 2012 | |
| | Total |
| | Returns |
| Vanguard Morgan Growth Fund | |
| Investor Shares | 28.18% |
| Admiral™ Shares | 28.28 |
| Russell 3000 Growth Index | 27.12 |
| Multi-Cap Growth Funds Average | 25.92 |
Multi-Cap Growth Funds Average: Derived from data provided by Lipper Inc.
Admiral Shares carry lower expenses and are available to investors who meet certain account-balance requirements.
Your Fund’s Performance at a Glance
September 30, 2011, Through March 31, 2012
| | | | |
| | | | Distributions Per Share |
| | Starting | Ending | Income | Capital |
| | Share Price | Share Price | Dividends | Gains |
| Vanguard Morgan Growth Fund | | | | |
| Investor Shares | $16.06 | $20.47 | $0.100 | $0.000 |
| Admiral Shares | 49.84 | 63.48 | 0.391 | 0.000 |
1

Chairman’s Letter
Dear Shareholder,
The U.S. stock market rebounded sharply in the six months ended March 31, 2012, as investors regained confidence in the economy and the European debt crisis stabilized. Vanguard Morgan Growth Fund returned about 28% for the period—a robust performance that outpaced the return of its benchmark index and the average return of its multi-capitalization growth fund peers.
Each of the fund’s ten industry sectors produced double-digit returns for the period. The advisors’ stock selection contributed to the fund’s outperformance of its comparative standards.
A surge of optimism fueled a powerful global rally in stocks
During the past six months, optimism displaced the apprehension that had restrained stock prices through summer 2011. The broad U.S. stock market returned more than 26%. Markets abroad returned more than 15%. Investors’ good spirits reflected confidence that the slow, grinding economic expansion in the United States was at last gathering momentum, and that Europe’s debt crisis could be wrestled under control.
By the end of the period, however, that confidence had begun to evaporate in the face of ambiguous economic reports and renewed concern about Europe. The abrupt mood swing was consistent with the financial markets’ volatility since the 2008–2009 financial crisis.
2
Aside from munis, most bonds saw subdued six-month returns
The broad taxable bond market produced a modest six-month return of 1.43%. In general, interest rates remained more or less steady at very low levels. In some segments of the bond market, however, yields crept lower still, boosting bond prices. The broad municipal bond market, for example, produced a solid six-month return of 3.91% as investors bid up muni prices.
As it has since December 2008, the Federal Reserve Board kept its target for the shortest-term interest rates between 0% and 0.25%. That policy has kept a tight lid on the returns available from money market funds and savings accounts.
Information technology led rally in growth stocks
Vanguard Morgan Growth Fund, which invests in more than 300 large- and mid-cap growth stocks, focuses on fast-growing companies with valuations deemed reasonable by its five advisors. The fund’s impressive six-month result was largely driven by investors’ willingness to take on more risk after a highly volatile summer and early fall. As the economy headed into an upswing in the fourth quarter of 2011, investors grew more confident and sought out opportunities for growth.
| | | |
| Market Barometer | | | |
| |
| | | | Total Returns |
| | | Periods Ended March 31, 2012 |
| | Six | One | Five Years |
| | Months | Year | (Annualized) |
| Stocks | | | |
| Russell 1000 Index (Large-caps) | 26.27% | 7.86% | 2.19% |
| Russell 2000 Index (Small-caps) | 29.83 | -0.18 | 2.13 |
| Dow Jones U.S. Total Stock Market Index | 26.60 | 7.16 | 2.47 |
| MSCI All Country World Index ex USA (International) | 15.37 | -7.18 | -1.56 |
| |
| Bonds | | | |
| Barclays Capital U.S. Aggregate Bond Index (Broad | | | |
| taxable market) | 1.43% | 7.71% | 6.25% |
| Barclays Capital Municipal Bond Index (Broad | | | |
| tax-exempt market) | 3.91 | 12.07 | 5.42 |
| Citigroup Three-Month U.S. Treasury Bill Index | 0.00 | 0.05 | 1.11 |
| |
| CPI | | | |
| Consumer Price Index | 1.10% | 2.65% | 2.24% |
3
For the six months, Morgan Growth Fund’s return bested that of the U.S. stock market. The fund’s performance mirrored prevailing trends in the broad market, where growth stocks trumped their value counterparts.
While each of the fund’s ten sectors produced strong returns for the period, its outsized holdings in information technology and consumer discretionary proved the most beneficial.
The tech industry, a favorite of growth investors because it provides exposure to companies with rapid increases in sales and earnings, represented about 37% of the fund’s assets, on average, during the period. The sector did well across the board, aided by robust corporate spending and consumer demand and by the stellar fourth-quarter performance of companies selling tablet computers and smartphones. Firms that make communication equipment and provide consulting and data processing tools also stood out.
Representing about 17% of the fund’s assets, on average, during the period, consumer discretionary stocks contributed about five percentage points to the fund’s total return. These stocks benefited from consumers’ increased appetite for specialty apparel, luxury goods, and the fare at chain restaurants.
The advisors’ decisions within the consumer staples and energy sectors significantly boosted the fund’s performance relative to its benchmark. The fund’s smaller allocation to soft drink
Expense Ratios
Your Fund Compared With Its Peer Group
| | | |
| | Investor | Admiral | Peer Group |
| | Shares | Shares | Average |
| Morgan Growth Fund | 0.42% | 0.28% | 1.34% |
The fund expense ratios shown are from the prospectus dated January 26, 2012, and represent estimated costs for the current fiscal year. For the six months ended March 31, 2012, the fund’s annualized expense ratios were 0.40% for Investor Shares and 0.26% for Admiral Shares. The peer-group expense ratio is derived from data provided by Lipper Inc. and captures information through year-end 2011.
Peer group: Multi-Cap Growth Funds.
4
companies and household product makers boosted relative performance. In the energy sector, the advisors’ astute stock selection among oil and gas producers, explorers, and refiners also helped the fund surpass the performance of its benchmark.
Conversely, lackluster stock selection in the health care sector restrained Morgan Growth’s returns for the half-year. The advisors’ choices among pharmaceutical companies and drug distributors hurt the fund’s results compared with those of its benchmark.
Balance and diversification are key regardless of market conditions
The stock market, although still volatile, is in dramatically better shape than when I wrote to you six months ago. The sharp contrast is perhaps a good reminder of how quickly market conditions can change and how futile it is to predict short-term moves.
At Vanguard, we encourage you to always look beyond the market’s recent peaks and troughs. We believe that you will be best served by creating a broadly diversified portfolio that includes a mix of stocks, bonds, and money market funds consistent with your long-term investment goals and risk tolerance.
Recent Vanguard research provided further insight on why balance and diversification are important in the face of market volatility and economic uncertainty. One notable finding: Over the past 85 years, a hypothetical portfolio made up of 50% stocks and 50% bonds would have produced statistically equivalent returns whether the U.S. economy was in or out of recession. (The commentary, Recessions and Balanced Portfolio Returns, can be found at vanguard.com/research.)
The Morgan Growth Fund, which invests in a broad array of large- and mid-cap growth stocks, can play an important role in such a balanced and diversified portfolio.
Thank you for investing with Vanguard.
Sincerely,

F. William McNabb III
Chairman and Chief Executive Officer
April 16, 2012
5
Advisors’ Report
For the fiscal half-year ended March 31, 2012, Vanguard Morgan Growth Fund returned 28.18% for Investor Shares and 28.28% for the lower-cost Admiral Shares. Your fund is managed by five independent advisors, a strategy that enhances the fund’s diversification by providing exposure to distinct, yet complementary, investment approaches. It’s not uncommon for different advisors to have different views about individual securities or the broader investment environment. The advisors, the percentage of fund assets each manages, and brief descriptions of their investment strategies are presented in the table below. The advisors have also prepared a discussion of the investment environment that existed during the fiscal year and of how portfolio positioning reflects this assessment. These comments were prepared on April 20, 2012.
| | | |
| Vanguard Morgan Growth Fund Investment Advisors | |
| |
| | Fund Assets Managed | |
| Investment Advisor | % | $ Million | Investment Strategy |
| Wellington Management | 45 | 4,274 | Uses traditional methods of stock selection—research |
| Company, LLP | | | and analysis—that identify companies believed to have |
| | | | above-average growth prospects, particularly those in |
| | | | industries undergoing change. Focuses on mid- and |
| | | | large-capitalization companies with proven records of |
| | | | sales and earnings growth, profitability, and cash-flow |
| | | | generation. |
| Jennison Associates LLC | 19 | 1,802 | Uses research-driven, fundamental investment |
| | | | approach that relies on in-depth company knowledge |
| | | | gleaned through meetings with management, |
| | | | customers, and suppliers. |
| Vanguard Equity Investment | 12 | 1,127 | Employs a quantitative, fundamental management |
| Group | | | approach, using models that assess valuation, growth |
| | | | prospects, management decisions, market sentiment, |
| | | | and earnings quality of companies versus their peers. |
| Frontier Capital Management Co., | 11 | 1,022 | Uses research-driven, fundamental investment |
| LLC | | | approach that seeks companies with above-average |
| | | | growth prospects, reasonable valuations, and |
| | | | competitive advantages. |
| Kalmar Investment Advisers | 11 | 1,014 | Employs a “growth-with-value” strategy using creative, |
| | | | bottom-up research to uncover vigorously growing, |
| | | | high-quality businesses whose stocks can also be |
| | | | bought inefficiently valued. The strategy has a dual |
| | | | objective of strong returns with lower risk. |
| Cash Investments | 2 | 205 | These short-term reserves are invested by Vanguard in |
| | | | equity index products to simulate investments in |
| | | | stocks. Each advisor also may maintain a modest cash |
| | | | position. |
6
Wellington Management Company, LLP
Portfolio Manager:
Paul E. Marrkand, CFA, Senior Vice President
Our portion of the Morgan Growth Fund utilizes traditional methods of stock selection—research and analysis—to identify companies that we believe have above-average growth prospects, particularly those in industries undergoing change. Research focuses on mid- and large-cap companies with a proven record of sales and earnings growth, profitability, and cash-flow generation.
At times over the last six months, the markets appeared to have been driven purely by top-down macroeconomic factors. We remained true to our bottom-up process during this volatile period and continued to build the portfolio on a stock-by-stock basis, investing in undervalued companies that have the ability to innovate, gain market share, and grow their sales and free cash flow at an above-average rate.
Stock selection contributed favorably to results during the period, particularly within the energy, industrial, and consumer discretionary sectors. An underweighted position in the lagging consumer staples sector boosted the portfolio’s relative returns, as did an overweighting to the strongly performing information technology sector. Apple was the top individual contributor to the portfolio’s performance during the six months; its share price rose after the company reported better-than-expected revenue and earnings, led by robust sales of the iPhone 4S.
Our underweighted position in materials, as well as our security selection within that sector, detracted from relative performance. Amazon.com was the most significant of only a handful of absolute detractors; the stock dropped following the firm’s earnings release, which revealed that Amazon continues to invest heavily in its business, cutting into near-term operating earnings.
Jennison Associates LLC
Portfolio Manager:
Kathleen A. McCarragher, Managing Director
Stock selection was broadly beneficial in our portion of the portfolio for the six months. In the technology sector, Apple’s financial results beat projections on the strength of iPad, iPhone, and Mac computer sales. Next-generation datacenter management company VMware rose on better-than-anticipated financial results and earnings guidance.
After oil prices fell on concerns of a slowdown in global growth, we tilted the portfolio’s energy position toward companies we expected to benefit as prices rebounded. These holdings, including EOG Resources and Concho Resources, posted substantial gains.
In consumer staples, natural foods retailer Whole Foods reported better-than-projected earnings on strong sales,
7
solid operating margins, and capital discipline. In consumer discretionary, Starbucks benefited from strong domestic and international growth and enthusiasm about its expanding presence in the premium single-cup coffee market. Strong earnings propelled Coach, the luxury bag and accessories retailer.
The portfolio’s industrial and financial holdings advanced for the period, but lagged the benchmark. Underweighted positions in industrials and materials detracted from relative performance. Notable individual detractors from return included Amazon.com and Green Mountain Coffee Roasters. Although Amazon’s accelerated business investment is affecting short-term profitability, we believe it is positioning the company for robust longer-term growth. Green Mountain declined on allegations of inventory and revenue reporting irregularities.
Vanguard Equity Investment Group
Portfolio Managers:
James P. Stetler, Principal
James D. Troyer, CFA, Principal
Michael R. Roach, CFA
Multi-cap growth stocks, the focus of your investment in the fund, outperformed their multi-cap value counterparts by about 1 percentage point, creating a generally favorable environment for growth-oriented strategies.
Information technology, utilities, and industrial companies led returns within the universe of multi-cap growth stocks, as represented by the MSCI US Prime Market 750 Growth Index. Telecommunication services and consumer staples companies were the laggards for the fiscal period, although all ten sectors provided positive returns.
Our stock selection for the Morgan Growth portfolio generated positive returns in six of ten sectors, negative returns in three sectors, and flat returns in one. Company selections within the energy, consumer staples, and materials sectors added the most to our relative returns. In energy, National Oilwell Varco, Williams Companies, and Tesoro boosted our results. In consumer staples, Philip Morris, Herbalife, and Whole Foods Market were the largest contributors to our relative returns, while International Paper, CF Industries, and PPG Industries stood out in materials.
Selection results were disappointing in health care and information technology. Most of our underperformance in those two groups came from our underweighted positions in companies such as Express Scripts, Gilead Sciences, EMC, and Visa.
8
Frontier Capital Management Co., LLC
Portfolio Managers:
Stephen Knightly, CFA, Senior Vice President
Christopher J. Scarpa, Vice President
Equities posted strong returns as European fears receded while the United States demonstrated renewed economic vigor. Challenges remain: a fragile Europe, high oil prices, and slowing growth in emerging markets. In our opinion, economic expansion will remain subdued and modest growth should keep inflation and interest rates low. The combination has historically been favorable for equities. Although consolidation is likely, stocks remain attractively valued.
Performance was aided by strong stock selection in energy, industrials, and financials. Investments in production companies with solid drilling inventories spurred energy. The vibrant aerospace cycle benefited industrials. Strong capital markets drove solid returns for brokers.
Information technology and health care hindered performance. Technology was hurt by a stock-specific event as faster-than-expected royalty attrition at Rovi dealt a short-term hit despite the stock’s long-term appeal. Health care was hindered by a pipeline setback at Watson Pharmaceuticals. We continue to see promise in Watson.
Kalmar Investment Advisers
Portfolio Manager:
Ford B. Draper, Jr., President and Chief Investment Officer
From the 2011 low at the beginning of October to the end of March 2012, the U.S. stock market entered a powerful rally as it recovered from a confidence crisis precipitated by fears of a double-dip recession and anxiety over Eurozone sovereign debt. Despite the extreme complacency that built up during this advance—which could well be corrected—we are optimistic about the overall outlook for 2012. However, the uncertainty on several important fronts suggests that concentration on high-quality businesses and substantial diversification are warranted. Careful stock selection will be important, as valuations of good growth companies are no longer cheap.
Our biggest successes came from a variety of sectors and included companies such as W.R. Grace, F5 Networks, CarMax, and Fastenal.
Over the last six months our biggest detractors from return included holdings in health care (Hospira and Allscripts) and information technology (Rovi and RF Micro Devices).
9
Morgan Growth Fund
Fund Profile
As of March 31, 2012
| | |
| Share-Class Characteristics | |
| | Investor | Admiral |
| | Shares | Shares |
| Ticker Symbol | VMRGX | VMRAX |
| Expense Ratio1 | 0.42% | 0.28% |
| 30-Day SEC Yield | 0.56% | 0.70% |
| | | |
| Portfolio Characteristics | | |
| | | Russell | DJ |
| | | 3000 | U.S. Total |
| | | Growth | Market |
| | Fund | Index | Index |
| Number of Stocks | 317 | 1,730 | 3,716 |
| Median Market Cap | $23.6B | $37.2B | $35.6B |
| Price/Earnings Ratio | 19.0x | 18.5x | 17.1x |
| Price/Book Ratio | 3.9x | 4.1x | 2.3x |
| Return on Equity | 23.2% | 24.3% | 18.1% |
| Earnings Growth Rate | 18.2% | 15.3% | 8.5% |
| Dividend Yield | 0.9% | 1.4% | 1.9% |
| Foreign Holdings | 3.2% | 0.0% | 0.0% |
| Turnover Rate | | | |
| (Annualized) | 51% | — | — |
| Short-Term Reserves | 1.2% | — | — |
| | | |
| Sector Diversification (% of equity exposure) |
| | | Russell | DJ |
| | | 3000 | U.S. Total |
| | | Growth | Market |
| | Fund | Index | Index |
| Consumer | | | |
| Discretionary | 17.0% | 14.5% | 12.0% |
| Consumer Staples | 6.5 | 11.3 | 9.4 |
| Energy | 8.1 | 9.9 | 10.5 |
| Financials | 4.1 | 4.5 | 15.9 |
| Health Care | 13.0 | 11.2 | 11.5 |
| Industrials | 10.5 | 12.8 | 11.0 |
| Information | | | |
| Technology | 37.5 | 29.8 | 19.8 |
| Materials | 3.0 | 5.1 | 4.0 |
| Telecommunication | | | |
| Services | 0.3 | 0.8 | 2.5 |
| Utilities | 0.0 | 0.1 | 3.4 |
| | |
| Volatility Measures | | |
| | | DJ |
| | | U.S. Total |
| | Russell 3000 | Market |
| | Growth Index | Index |
| R-Squared | 0.99 | 0.96 |
| Beta | 1.07 | 1.05 |
These measures show the degree and timing of the fund’s fluctuations compared with the indexes over 36 months.
| | |
| Ten Largest Holdings (% of total net assets) |
| Apple Inc. | Computer | |
| | Hardware | 6.0% |
| International Business | IT Consulting & | |
| Machines Corp. | Other Services | 2.7 |
| Cisco Systems Inc. | Communications | |
| | Equipment | 2.5 |
| Microsoft Corp. | Systems Software | 2.3 |
| EMC Corp. | Computer Storage | |
| | & Peripherals | 2.2 |
| Google Inc. Class A | Internet Software & | |
| | Services | 1.6 |
| UnitedHealth Group Inc. | Managed Health | |
| | Care | 1.5 |
| Exxon Mobil Corp. | Integrated Oil & | |
| | Gas | 1.4 |
| QUALCOMM Inc. | Communications | |
| | Equipment | 1.3 |
| Starbucks Corp. | Restaurants | 1.3 |
| Top Ten | | 22.8% |
The holdings listed exclude any temporary cash investments and equity index products.
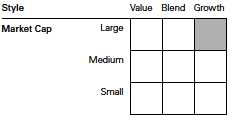
Investment Focus
1 The expense ratios shown are from the prospectus dated January 26, 2012, and represent estimated costs for the current fiscal year. For the six months ended March 31, 2012, the annualized expense ratios were 0.40% for Investor Shares and 0.26% for Admiral Shares.
10
Morgan Growth Fund
Performance Summary
All of the returns in this report represent past performance, which is not a guarantee of future results that may be achieved by the fund. (Current performance may be lower or higher than the performance data cited. For performance data current to the most recent month-end, visit our website at vanguard.com/performance.) Note, too, that both investment returns and principal value can fluctuate widely, so an investor’s shares, when sold, could be worth more or less than their original cost. The returns shown do not reflect taxes that a shareholder would pay on fund distributions or on the sale of fund shares.
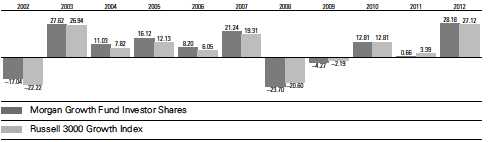
Fiscal-Year Total Returns (%): September 30, 2001, Through March 31, 2012
Note: For 2012, performance data reflect the six months ended March 31, 2012.
Average Annual Total Returns: Periods Ended March 31, 2012
| | | | |
| | Inception | One | Five | Ten |
| | Date | Year | Years | Years |
| Investor Shares | 12/31/1968 | 7.72% | 3.45% | 5.30% |
| Admiral Shares | 5/14/2001 | 7.91 | 3.61 | 5.47 |
See Financial Highlights for dividend and capital gains information.
11
Morgan Growth Fund
Financial Statements (unaudited)
Statement of Net Assets
As of March 31, 2012
The fund reports a complete list of its holdings in regulatory filings four times in each fiscal year, at the quarter-ends. For the second and fourth fiscal quarters, the lists appear in the fund’s semiannual and annual reports to shareholders. For the first and third fiscal quarters, the fund files the lists with the Securities and Exchange Commission on Form N-Q. Shareholders can look up the fund’s Forms N-Q on the SEC’s website at sec.gov. Forms N-Q may also be reviewed and copied at the SEC’s Public Reference Room (see the back cover of this report for further information).
| | | |
| | | | Market |
| | | | Value• |
| | | Shares | ($000) |
| Common Stocks (97.4%)1 | | |
| Consumer Discretionary (16.5%) | |
| | Starbucks Corp. | 2,118,923 | 118,427 |
| | Coach Inc. | 1,224,862 | 94,657 |
| | Ralph Lauren Corp. | | |
| | Class A | 417,618 | 72,803 |
| * | Amazon.com Inc. | 340,716 | 68,998 |
| | McDonald’s Corp. | 601,312 | 58,989 |
| | Omnicom Group Inc. | 1,115,237 | 56,487 |
| * | Bed Bath & Beyond Inc. | 797,319 | 52,440 |
| * | priceline.com Inc. | 72,734 | 52,187 |
| | TJX Cos. Inc. | 1,200,033 | 47,653 |
| * | Lululemon Athletica Inc. | 637,481 | 47,607 |
| * | Dollar Tree Inc. | 500,380 | 47,281 |
| | NIKE Inc. Class B | 388,872 | 42,169 |
| | Ross Stores Inc. | 708,553 | 41,167 |
| * | LKQ Corp. | 1,312,531 | 40,912 |
| * | O’Reilly Automotive Inc. | 419,308 | 38,304 |
| *,^ | ITT Educational | | |
| | Services Inc. | 553,889 | 36,634 |
| | PetSmart Inc. | 617,872 | 35,355 |
| | News Corp. Class A | 1,767,596 | 34,804 |
| | Yum! Brands Inc. | 467,740 | 33,294 |
| * | BorgWarner Inc. | 382,328 | 32,246 |
| | Lowe’s Cos. Inc. | 935,249 | 29,348 |
| | Bayerische Motoren | | |
| | Werke AG ADR | 914,864 | 27,382 |
| * | CarMax Inc. | 747,025 | 25,884 |
| | Tractor Supply Co. | 278,140 | 25,188 |
| * | Apollo Group Inc. Class A | 572,203 | 22,110 |
| * | Michael Kors Holdings Ltd. | 470,617 | 21,926 |
| | Gentex Corp. | 893,865 | 21,900 |
| | Buckle Inc. | 426,320 | 20,421 |
| * | Discovery | | |
| | Communications Inc. | 432,415 | 20,272 |
| * | Sirius XM Radio Inc. | 8,065,111 | 18,630 |
| | Starwood Hotels & | | |
| | Resorts Worldwide Inc. | 272,800 | 15,389 |
| | Nordstrom Inc. | 275,005 | 15,323 |
| | | |
| | | | Market |
| | | | Value• |
| | | Shares | ($000) |
| | Tim Hortons Inc. | 281,235 | 15,057 |
| *,^ | Tesla Motors Inc. | 390,071 | 14,526 |
| | Harley-Davidson Inc. | 294,300 | 14,444 |
| * | Urban Outfitters Inc. | 482,630 | 14,049 |
| * | Discovery | | |
| | Communications Inc. | | |
| | Class A | 244,400 | 12,367 |
| * | DIRECTV Class A | 242,900 | 11,985 |
| | Time Warner Cable Inc. | 130,300 | 10,619 |
| | CBS Corp. Class B | 294,700 | 9,993 |
| | Harman International | | |
| | Industries Inc. | 206,450 | 9,664 |
| | DeVry Inc. | 277,625 | 9,403 |
| | Limited Brands Inc. | 170,800 | 8,198 |
| * | Deckers Outdoor Corp. | 124,180 | 7,830 |
| | Home Depot Inc. | 155,100 | 7,803 |
| * | AutoZone Inc. | 20,200 | 7,510 |
| | Advance Auto Parts Inc. | 84,200 | 7,458 |
| | Wynn Resorts Ltd. | 56,500 | 7,056 |
| | Comcast Corp. Class A | 233,100 | 6,995 |
| | Chico’s FAS Inc. | 462,345 | 6,981 |
| | Polaris Industries Inc. | 91,800 | 6,623 |
| ^ | Weight Watchers | | |
| | International Inc. | 84,400 | 6,515 |
| | DISH Network Corp. | | |
| | Class A | 190,300 | 6,267 |
| | Dick’s Sporting Goods Inc. | 127,900 | 6,149 |
| * | Steven Madden Ltd. | 137,400 | 5,874 |
| | Las Vegas Sands Corp. | 100,000 | 5,757 |
| | Service Corp. International | 447,920 | 5,044 |
| * | Goodyear Tire & | | |
| | Rubber Co. | 361,400 | 4,055 |
| | News Corp. Class B | 199,000 | 3,976 |
| * | Tempur-Pedic | | |
| | International Inc. | 28,500 | 2,406 |
| | Viacom Inc. Class B | 44,200 | 2,098 |
| | Ford Motor Co. | 133,800 | 1,671 |
| | VF Corp. | 4,000 | 584 |
| | | | 1,555,144 |
12
Morgan Growth Fund
| | | |
| | | | Market |
| | | | Value |
| | | Shares | ($000) |
| Consumer Staples (6.2%) | | |
| | Philip Morris | | |
| | International Inc. | 1,234,389 | 109,379 |
| | Coca-Cola Co. | 1,377,923 | 101,980 |
| | Costco Wholesale Corp. | 823,820 | 74,803 |
| | Wal-Mart Stores Inc. | 1,013,362 | 62,018 |
| | Whole Foods Market Inc. | 732,292 | 60,927 |
| | Mead Johnson | | |
| | Nutrition Co. | 561,083 | 46,278 |
| | Estee Lauder Cos. Inc. | | |
| | Class A | 662,098 | 41,010 |
| | Herbalife Ltd. | 354,310 | 24,384 |
| * | Green Mountain | | |
| | Coffee Roasters Inc. | 302,132 | 14,152 |
| | PepsiCo Inc. | 165,700 | 10,994 |
| * | Monster Beverage Corp. | 168,976 | 10,492 |
| | Kroger Co. | 327,500 | 7,935 |
| | Dr Pepper Snapple | | |
| | Group Inc. | 137,100 | 5,513 |
| | Kellogg Co. | 76,200 | 4,087 |
| | Kimberly-Clark Corp. | 50,000 | 3,694 |
| | Hershey Co. | 37,500 | 2,300 |
| | Coca-Cola Enterprises Inc. | 68,700 | 1,965 |
| | Colgate-Palmolive Co. | 19,600 | 1,916 |
| | Campbell Soup Co. | 21,600 | 731 |
| | | | 584,558 |
| Energy (7.8%) | | |
| | Exxon Mobil Corp. | 1,524,956 | 132,259 |
| | Occidental | | |
| | Petroleum Corp. | 662,078 | 63,050 |
| | Core Laboratories NV | 386,273 | 50,822 |
| * | Concho Resources Inc. | 493,959 | 50,423 |
| | National Oilwell Varco Inc. | 601,466 | 47,799 |
| | Diamond Offshore | | |
| | Drilling Inc. | 714,620 | 47,701 |
| | Oceaneering | | |
| | International Inc. | 757,967 | 40,847 |
| | Valero Energy Corp. | 1,485,281 | 38,276 |
| | Noble Energy Inc. | 272,390 | 26,634 |
| | EOG Resources Inc. | 227,261 | 25,249 |
| * | Cameron International Corp. | 424,265 | 22,414 |
| * | McDermott | | |
| | International Inc. | 1,748,270 | 22,395 |
| * | Continental Resources Inc. | 232,300 | 19,936 |
| * | Superior Energy | | |
| | Services Inc. | 523,030 | 13,787 |
| * | SandRidge Energy Inc. | 1,480,760 | 11,594 |
| *,^ | InterOil Corp. | 217,000 | 11,156 |
| | Ensco plc ADR | 205,063 | 10,854 |
| | Anadarko Petroleum Corp. | 134,955 | 10,572 |
| * | Kodiak Oil & Gas Corp. | 987,380 | 9,834 |
| | Schlumberger Ltd. | 139,900 | 9,783 |
| | Williams Cos. Inc. | 280,800 | 8,652 |
| * | Weatherford | | |
| | International Ltd. | 556,960 | 8,405 |
| | | |
| | | | Market |
| | | | Value |
| | | Shares | ($000) |
| | Cabot Oil & Gas Corp. | 230,700 | 7,191 |
| | Marathon Petroleum Corp. | 159,700 | 6,925 |
| | HollyFrontier Corp. | 204,300 | 6,568 |
| * | Denbury Resources Inc. | 335,000 | 6,107 |
| | Helmerich & Payne Inc. | 110,400 | 5,956 |
| * | Tesoro Corp. | 212,200 | 5,695 |
| | EQT Corp. | 113,900 | 5,491 |
| * | Plains Exploration & | | |
| | Production Co. | 128,400 | 5,476 |
| * | Southwestern Energy Co. | 178,780 | 5,471 |
| | Halliburton Co. | 9,100 | 302 |
| | | | 737,624 |
| Exchange-Traded Fund (0.8%) | |
| ^,2 | Vanguard Growth ETF | 1,044,900 | 74,157 |
| |
| Financials (3.8%) | | |
| | American Express Co. | 1,722,336 | 99,654 |
| * | American Tower | | |
| | Corporation | 943,014 | 59,429 |
| | Goldman Sachs Group Inc. | 340,742 | 42,378 |
| | T. Rowe Price Group Inc. | 406,890 | 26,570 |
| | Raymond James | | |
| | Financial Inc. | 612,100 | 22,360 |
| * | Affiliated Managers | | |
| | Group Inc. | 168,250 | 18,812 |
| | Jefferies Group Inc. | 818,491 | 15,420 |
| | Moody’s Corp. | 269,090 | 11,329 |
| | Simon Property Group Inc. | 65,600 | 9,557 |
| | Arthur J Gallagher & Co. | 211,980 | 7,576 |
| | Fidelity National | | |
| | Financial Inc. Class A | 393,106 | 7,088 |
| | Hancock Holding Co. | 184,631 | 6,556 |
| | Capital One Financial Corp. | 117,600 | 6,555 |
| | Discover Financial Services | 191,400 | 6,381 |
| * | CBRE Group Inc. Class A | 310,670 | 6,201 |
| | Public Storage | 40,100 | 5,541 |
| | US Bancorp | 115,600 | 3,662 |
| | Digital Realty Trust Inc. | 36,900 | 2,730 |
| * | Arch Capital Group Ltd. | 21,600 | 804 |
| | Aon Corp. | 11,500 | 564 |
| | Ventas Inc. | 7,600 | 434 |
| | | | 359,601 |
| Health Care (12.6%) | | |
| | UnitedHealth Group Inc. | 2,340,438 | 137,945 |
| | Amgen Inc. | 1,184,509 | 80,535 |
| * | Celgene Corp. | 1,018,811 | 78,978 |
| * | Express Scripts Inc. | 1,107,774 | 60,019 |
| | Abbott Laboratories | 899,236 | 55,114 |
| * | Intuitive Surgical Inc. | 90,831 | 49,208 |
| * | Waters Corp. | 513,366 | 47,568 |
| | Allergan Inc. | 491,658 | 46,919 |
| | Shire plc ADR | 486,478 | 46,094 |
| | Agilent Technologies Inc. | 976,726 | 43,474 |
| | Cooper Cos. Inc. | 474,212 | 38,748 |
13
Morgan Growth Fund
| | | |
| | | | Market |
| | | | Value |
| | | Shares | ($000) |
| | Novo Nordisk A/S ADR | 274,553 | 38,083 |
| * | Watson | | |
| | Pharmaceuticals Inc. | 552,270 | 37,035 |
| * | Hologic Inc. | 1,630,235 | 35,132 |
| * | Alexion | | |
| | Pharmaceuticals Inc. | 301,005 | 27,951 |
| | AmerisourceBergen Corp. | | |
| | Class A | 690,819 | 27,412 |
| * | Gilead Sciences Inc. | 558,185 | 27,267 |
| | Aetna Inc. | 524,344 | 26,301 |
| | Cardinal Health Inc. | 558,299 | 24,068 |
| * | Vertex Pharmaceuticals Inc. | 536,456 | 22,000 |
| * | Edwards Lifesciences Corp. | 300,236 | 21,836 |
| * | DaVita Inc. | 229,300 | 20,676 |
| * | Life Technologies Corp. | 370,481 | 18,087 |
| * | Bruker Corp. | 1,060,266 | 16,233 |
| * | ResMed Inc. | 511,880 | 15,822 |
| * | Catalyst Health | | |
| | Solutions Inc. | 235,943 | 15,037 |
| * | Biogen Idec Inc. | 102,619 | 12,927 |
| * | Gen-Probe Inc. | 194,360 | 12,907 |
| * | Allscripts Healthcare | | |
| | Solutions Inc. | 730,100 | 12,120 |
| | Baxter International Inc. | 186,900 | 11,173 |
| | Patterson Cos. Inc. | 319,900 | 10,685 |
| * | Mednax Inc. | 137,596 | 10,233 |
| | McKesson Corp. | 110,900 | 9,734 |
| * | Cerner Corp. | 108,654 | 8,275 |
| | Perrigo Co. | 79,900 | 8,254 |
| * | SXC Health Solutions Corp. | 102,500 | 7,683 |
| | Humana Inc. | 77,000 | 7,121 |
| * | Mylan Inc. | 260,000 | 6,097 |
| * | Salix Pharmaceuticals Ltd. | 114,660 | 6,020 |
| * | Human Genome | | |
| | Sciences Inc. | 524,200 | 4,319 |
| * | Medco Health | | |
| | Solutions Inc. | 55,500 | 3,902 |
| | HCA Holdings Inc. | 140,700 | 3,481 |
| * | Charles River Laboratories | | |
| | International Inc. | 13,900 | 502 |
| | | | 1,192,975 |
| Industrials (10.1%) | | |
| | Caterpillar Inc. | 917,883 | 97,773 |
| | Boeing Co. | 1,148,046 | 85,380 |
| | AMETEK Inc. | 1,252,265 | 60,747 |
| | Honeywell | | |
| | International Inc. | 857,482 | 52,349 |
| | Precision Castparts Corp. | 262,543 | 45,394 |
| * | BE Aerospace Inc. | 913,664 | 42,458 |
| | Parker Hannifin Corp. | 492,895 | 41,674 |
| | Tyco International Ltd. | 665,951 | 37,413 |
| | Cummins Inc. | 292,605 | 35,124 |
| | MSC Industrial | | |
| | Direct Co. Inc. Class A | 327,316 | 27,259 |
| * | IHS Inc. Class A | 266,205 | 24,930 |
| | | |
| | | | Market |
| | | | Value |
| | | Shares | ($000) |
| | General Electric Co. | 1,226,975 | 24,625 |
| | Joy Global Inc. | 331,788 | 24,386 |
| | Dover Corp. | 322,253 | 20,283 |
| | Pentair Inc. | 403,980 | 19,233 |
| * | WESCO International Inc. | 253,609 | 16,563 |
| | Fastenal Co. | 278,025 | 15,041 |
| ^ | Progressive Waste | | |
| | Solutions Ltd. | 669,080 | 14,506 |
| | Waste Connections Inc. | 440,800 | 14,339 |
| * | Corrections Corp. | | |
| | of America | 514,759 | 14,058 |
| | Union Pacific Corp. | 130,100 | 13,983 |
| * | Hertz Global Holdings Inc. | 845,280 | 12,713 |
| * | Quanta Services Inc. | 603,860 | 12,621 |
| | Pall Corp. | 208,992 | 12,462 |
| | Chicago Bridge & | | |
| | Iron Co. NV | 286,870 | 12,390 |
| | Flowserve Corp. | 106,245 | 12,272 |
| * | United Continental | | |
| | Holdings Inc. | 516,200 | 11,098 |
| | Snap-on Inc. | 175,930 | 10,726 |
| * | HUB Group Inc. Class A | 283,535 | 10,216 |
| | Landstar System Inc. | 176,745 | 10,202 |
| * | Swift Transportation Co. | 863,230 | 9,962 |
| | JB Hunt Transport | | |
| | Services Inc. | 181,745 | 9,881 |
| | Expeditors International | | |
| | of Washington Inc. | 207,180 | 9,636 |
| * | Verisk Analytics Inc. | | |
| | Class A | 200,100 | 9,399 |
| | PACCAR Inc. | 180,900 | 8,472 |
| | Lockheed Martin Corp. | 86,900 | 7,809 |
| * | Stericycle Inc. | 92,245 | 7,715 |
| | Textron Inc. | 266,100 | 7,406 |
| | Republic Services Inc. | | |
| | Class A | 228,600 | 6,986 |
| | UTi Worldwide Inc. | 383,081 | 6,600 |
| * | Alaska Air Group Inc. | 174,814 | 6,262 |
| | United Parcel Service Inc. | | |
| | Class B | 77,400 | 6,248 |
| * | AGCO Corp. | 131,300 | 6,199 |
| * | Sensata Technologies | | |
| | Holding NV | 172,900 | 5,789 |
| | Norfolk Southern Corp. | 82,600 | 5,438 |
| * | Colfax Corp. | 142,920 | 5,037 |
| | 3M Co. | 39,400 | 3,515 |
| | Pitney Bowes Inc. | 108,700 | 1,911 |
| | FedEx Corp. | 10,500 | 966 |
| | Emerson Electric Co. | 10,900 | 569 |
| | | | 958,018 |
| Information Technology (36.4%) | |
| * | Apple Inc. | 937,468 | 561,984 |
| | International Business | | |
| | Machines Corp. | 1,199,571 | 250,290 |
| | Cisco Systems Inc. | 11,076,808 | 234,274 |
14
Morgan Growth Fund
| | | |
| | | | Market |
| | | | Value |
| | | Shares | ($000) |
| | Microsoft Corp. | 6,618,999 | 213,463 |
| * | EMC Corp. | 6,938,307 | 207,317 |
| * | Google Inc. Class A | 237,777 | 152,472 |
| | QUALCOMM Inc. | 1,808,749 | 123,031 |
| | Oracle Corp. | 3,248,682 | 94,732 |
| | Altera Corp. | 2,297,059 | 91,469 |
| * | Red Hat Inc. | 1,275,734 | 76,404 |
| * | NetApp Inc. | 1,568,499 | 70,222 |
| * | VMware Inc. Class A | 604,004 | 67,872 |
| * | Alliance Data | | |
| | Systems Corp. | 520,255 | 65,531 |
| * | QLogic Corp. | 3,385,305 | 60,123 |
| * | eBay Inc. | 1,603,925 | 59,169 |
| * | F5 Networks Inc. | 426,294 | 57,533 |
| * | Baidu Inc. ADR | 384,974 | 56,118 |
| * | Autodesk Inc. | 1,268,960 | 53,702 |
| * | Check Point Software | | |
| | Technologies Ltd. | 814,474 | 51,996 |
| | IAC/InterActiveCorp | 1,049,735 | 51,531 |
| | Xilinx Inc. | 1,363,308 | 49,665 |
| | Avago Technologies Ltd. | 1,250,883 | 48,747 |
| * | Dell Inc. | 2,486,817 | 41,281 |
| | Analog Devices Inc. | 1,001,149 | 40,446 |
| * | Cognizant Technology | | |
| | Solutions Corp. Class A | 470,930 | 36,238 |
| * | Salesforce.com Inc. | 208,892 | 32,276 |
| * | VeriFone Systems Inc. | 602,481 | 31,251 |
| | Mastercard Inc. Class A | 74,040 | 31,137 |
| * | LinkedIn Corp. Class A | 288,925 | 29,467 |
| | Intuit Inc. | 436,600 | 26,253 |
| * | Citrix Systems Inc. | 331,274 | 26,141 |
| * | Rovi Corp. | 775,885 | 25,255 |
| * | Symantec Corp. | 1,293,158 | 24,182 |
| * | Emulex Corp. | 2,261,793 | 23,477 |
| * | SanDisk Corp. | 400,646 | 19,868 |
| | Fidelity National | | |
| | Information Services Inc. | 594,670 | 19,695 |
| * | Riverbed Technology Inc. | 685,757 | 19,256 |
| * | Trimble Navigation Ltd. | 347,265 | 18,898 |
| | KLA-Tencor Corp. | 326,058 | 17,744 |
| * | BMC Software Inc. | 426,030 | 17,109 |
| * | MICROS Systems Inc. | 285,303 | 15,774 |
| | Total System Services Inc. | 672,900 | 15,524 |
| * | Polycom Inc. | 713,900 | 13,614 |
| | Accenture plc Class A | 202,500 | 13,061 |
| * | Lam Research Corp. | 269,250 | 12,014 |
| | Amphenol Corp. Class A | 179,315 | 10,718 |
| | Jabil Circuit Inc. | 415,563 | 10,439 |
| * | NeuStar Inc. Class A | 260,504 | 9,704 |
| * | Atmel Corp. | 979,768 | 9,661 |
| * | Informatica Corp. | 182,390 | 9,648 |
| * | Gartner Inc. | 219,429 | 9,356 |
| * | Teradata Corp. | 137,278 | 9,356 |
| | Broadcom Corp. Class A | 226,700 | 8,909 |
| | Intersil Corp. Class A | 783,248 | 8,772 |
| | | | |
| | | | | Market |
| | | | | Value |
| | | | Shares | ($000) |
| * | Fairchild Semiconductor | | |
| | International Inc. Class A | 555,472 | 8,165 |
| * | Teradyne Inc. | | 477,970 | 8,073 |
| * | Ariba Inc. | | 243,389 | 7,961 |
| * | Nuance | | | |
| | Communications Inc. | 300,695 | 7,692 |
| * | ON Semiconductor Corp. | 828,165 | 7,462 |
| * | Fiserv Inc. | | 103,300 | 7,168 |
| * | Compuware Corp. | | 749,870 | 6,891 |
| | FLIR Systems Inc. | | 271,900 | 6,882 |
| * | Western Digital Corp. | 153,700 | 6,362 |
| | Motorola Solutions Inc. | 117,857 | 5,991 |
| * | Freescale Semiconductor | | |
| | Holdings I Ltd. | | 355,604 | 5,473 |
| * | RF Micro Devices Inc. 1,054,775 | 5,253 |
| | Maxim Integrated | | | |
| | Products Inc. | | 179,600 | 5,135 |
| * | JDS Uniphase Corp. | 322,900 | 4,679 |
| | Visa Inc. Class A | | 29,300 | 3,457 |
| | Intel Corp. | | 99,600 | 2,800 |
| | Global Payments Inc. | 44,800 | 2,127 |
| * | Motorola Mobility | | | |
| | Holdings Inc. | | 45,837 | 1,799 |
| | | | | 3,437,539 |
| Materials (2.9%) | | | |
| | FMC Corp. | | 470,439 | 49,801 |
| | CF Industries Holdings Inc. | 234,194 | 42,775 |
| | Sherwin-Williams Co. | 380,022 | 41,297 |
| * | WR Grace & Co. | | 442,820 | 25,595 |
| | Freeport-McMoRan | | | |
| | Copper & Gold Inc. | 501,768 | 19,087 |
| | Cliffs Natural | | | |
| | Resources Inc. | | 219,119 | 15,176 |
| | Monsanto Co. | | 156,100 | 12,450 |
| | Albemarle Corp. | | 178,240 | 11,393 |
| | Walter Energy Inc. | | 165,365 | 9,791 |
| * | Crown Holdings Inc. | 236,100 | 8,696 |
| | Praxair Inc. | | 72,380 | 8,298 |
| | Allegheny Technologies Inc. | 190,442 | 7,840 |
| | PPG Industries Inc. | | 78,200 | 7,492 |
| | International Paper Co. | 176,800 | 6,206 |
| | Sealed Air Corp. | | 288,600 | 5,573 |
| | Celanese Corp. Class A | 106,600 | 4,923 |
| | | | | 276,393 |
| Telecommunication Services (0.3%) | |
| * | Crown Castle | | | |
| | International Corp. | 525,900 | 28,052 |
| Total Common Stocks | | | |
| (Cost $6,563,480) | | | 9,204,061 |
| Temporary Cash Investments (3.4%)1 | |
| Money Market Fund (2.7%) | | |
| 3,4 | Vanguard Market Liquidity | | |
| | Fund, 0.123% | 258,608,615 | 258,609 |
15
Morgan Growth Fund
| | | |
| | | Face | Market |
| | | Amount | Value |
| | | ($000) | ($000) |
| Repurchase Agreement (0.6%) | | |
| | Bank of America Securities, | | |
| | LLC 0.120%, 4/2/12 | | |
| | (Dated 3/30/12, Repurchase | | |
| | Value $50,901,000, | | |
| | collateralized by Federal | | |
| | National Mortgage Assn. | | |
| | 4.000%, 12/1/39) | 50,900 | 50,900 |
| |
| U.S. Government and Agency Obligations (0.1%) |
| 5,6 | Fannie Mae Discount | | |
| | Notes, 0.040%, 4/16/12 | 7,000 | 6,999 |
| 5,6 | Freddie Mac Discount | | |
| | Notes, 0.060%, 4/27/12 | 2,000 | 2,000 |
| 5,6 | Freddie Mac Discount | | |
| | Notes, 0.100%, 4/30/12 | 300 | 300 |
| | | | 9,299 |
| Total Temporary Cash Investments | |
| (Cost $318,809) | | 318,808 |
| Total Investments (100.8%) | | |
| (Cost $6,882,289) | | 9,522,869 |
| Other Assets and Liabilities (-0.8%) | |
| Other Assets | | 77,129 |
| Liabilities4 | | (156,003) |
| | | | (78,874) |
| Net Assets (100%) | | 9,443,995 |
| |
| At March 31, 2012, net assets consisted of: |
| | Amount |
| | ($000) |
| Paid-in Capital | 7,872,258 |
| Overdistributed Net Investment Income | (2,643) |
| Accumulated Net Realized Losses | (1,067,875) |
| Unrealized Appreciation (Depreciation) | |
| Investment Securities | 2,640,580 |
| Futures Contracts | 1,675 |
| Net Assets | 9,443,995 |
| |
| |
| Investor Shares—Net Assets | |
| Applicable to 283,721,872 outstanding | |
| $.001 par value shares of beneficial | |
| interest (unlimited authorization) | 5,808,427 |
| Net Asset Value Per Share— | |
| Investor Shares | $20.47 |
| |
| |
| Admiral Shares—Net Assets | |
| Applicable to 57,270,982 outstanding | |
| $.001 par value shares of beneficial | |
| interest (unlimited authorization) | 3,635,568 |
| Net Asset Value Per Share— | |
| Admiral Shares | $63.48 |
See Note A in Notes to Financial Statements.
* Non-income-producing security.
^ Part of security position is on loan to broker-dealers. The total value of securities on loan is $70,868,000.
1 The fund invests a portion of its cash reserves in equity markets through the use of index futures contracts. After giving effect to futures investments, the fund’s effective common stock and temporary cash investment positions represent 98.8% and 2.0%, respectively, of net assets.
2 Considered an affiliated company of the fund as the issuer is another member of The Vanguard Group.
3 Affiliated money market fund available only to Vanguard funds and certain trusts and accounts managed by Vanguard. Rate shown is the 7-day yield.
4 Includes $73,820,000 of collateral received for securities on loan.
5 The issuer was placed under federal conservatorship in September 2008; since that time, its daily operations have been managed by the Federal Housing Finance Agency and it receives capital from the U.S. Treasury in exchange for senior preferred stock.
6 Securities with a value of $8,300,000 have been segregated as initial margin for open futures contracts.
ADR—American Depositary Receipt.
See accompanying Notes, which are an integral part of the Financial Statements.
16
Morgan Growth Fund
Statement of Operations
| |
| | Six Months Ended |
| | March 31, 2012 |
| | ($000) |
| Investment Income | |
| Income | |
| Dividends1,2 | 46,073 |
| Interest2 | 139 |
| Security Lending | 731 |
| Total Income | 46,943 |
| Expenses | |
| Investment Advisory Fees—Note B | |
| Basic Fee | 6,958 |
| Performance Adjustment | (1,821) |
| The Vanguard Group—Note C | |
| Management and Administrative—Investor Shares | 6,942 |
| Management and Administrative—Admiral Shares | 1,615 |
| Marketing and Distribution—Investor Shares | 626 |
| Marketing and Distribution—Admiral Shares | 340 |
| Custodian Fees | 76 |
| Shareholders’ Reports—Investor Shares | 65 |
| Shareholders’ Reports—Admiral Shares | 17 |
| Trustees’ Fees and Expenses | 10 |
| Total Expenses | 14,828 |
| Expenses Paid Indirectly | (143) |
| Net Expenses | 14,685 |
| Net Investment Income | 32,258 |
| Realized Net Gain (Loss) | |
| Investment Securities Sold2 | 99,045 |
| Futures Contracts | 22,760 |
| Realized Net Gain (Loss) | 121,805 |
| Change in Unrealized Appreciation (Depreciation) | |
| Investment Securities | 1,941,397 |
| Futures Contracts | 6,762 |
| Change in Unrealized Appreciation (Depreciation) | 1,948,159 |
| Net Increase (Decrease) in Net Assets Resulting from Operations | 2,102,222 |
1 Dividends are net of foreign withholding taxes of $240,000.
2 Dividend income, interest income, and realized net gain (loss) from affiliated companies of the fund were $440,000, $107,000, and $0, respectively.
See accompanying Notes, which are an integral part of the Financial Statements.
17
Morgan Growth Fund
Statement of Changes in Net Assets
| | |
| | Six Months Ended | Year Ended |
| | March 31, | September 30, |
| | 2012 | 2011 |
| | ($000) | ($000) |
| Increase (Decrease) in Net Assets | | |
| Operations | | |
| Net Investment Income | 32,258 | 45,694 |
| Realized Net Gain (Loss) | 121,805 | 793,630 |
| Change in Unrealized Appreciation (Depreciation) | 1,948,159 | (741,826) |
| Net Increase (Decrease) in Net Assets Resulting from Operations | 2,102,222 | 97,498 |
| Distributions | | |
| Net Investment Income | | |
| Investor Shares | (30,342) | (30,610) |
| Admiral Shares | (20,234) | (19,672) |
| Realized Capital Gain | | |
| Investor Shares | — | — |
| Admiral Shares | — | — |
| Total Distributions | (50,576) | (50,282) |
| Capital Share Transactions | | |
| Investor Shares | (550,253) | (475,300) |
| Admiral Shares | 379,451 | 114,941 |
| Net Increase (Decrease) from Capital Share Transactions | (170,802) | (360,359) |
| Total Increase (Decrease) | 1,880,844 | (313,143) |
| Net Assets | | |
| Beginning of Period | 7,563,151 | 7,876,294 |
| End of Period1 | 9,443,995 | 7,563,151 |
| 1 Net Assets—End of Period includes undistributed (overdistributed) net investment income of ($2,643,000) and $15,675,000. |
See accompanying Notes, which are an integral part of the Financial Statements.
18
Morgan Growth Fund
Financial Highlights
| | | | | | | |
| Investor Shares | | | | | | | |
| | Six Months | | | | | |
| | | Ended | | | | | |
| For a Share Outstanding | March 31, | | | Year Ended September 30, |
| Throughout Each Period | | 2012 | 2011 | 2010 | 2009 | 2008 | 2007 |
| Net Asset Value, Beginning of Period | $16.06 | $16.04 | $14.32 | $15.15 | $21.45 | $18.34 |
| Investment Operations | | | | | | | |
| Net Investment Income | | .064 | .087 | .097 | .114 | .148 | .207 |
| Net Realized and Unrealized Gain (Loss) | | | | | | |
| on Investments | | 4.446 | .029 | 1.733 | (.804) | (4.912) | 3.604 |
| Total from Investment Operations | | 4.510 | .116 | 1.830 | (.690) | (4.764) | 3.811 |
| Distributions | | | | | | | |
| Dividends from Net Investment Income | (.100) | (.096) | (.110) | (.140) | (.175) | (.204) |
| Distributions from Realized Capital Gains | — | — | — | — | (1.361) | (.497) |
| Total Distributions | | (.100) | (.096) | (.110) | (.140) | (1.536) | (.701) |
| Net Asset Value, End of Period | | $20.47 | $16.06 | $16.04 | $14.32 | $15.15 | $21.45 |
| |
| Total Return1 | | 28.18% | 0.66% | 12.81% | -4.27% | -23.70% | 21.24% |
| |
| Ratios/Supplemental Data | | | | | | | |
| Net Assets, End of Period (Millions) | $5,808 | $5,009 | $5,432 | $5,239 | $5,418 | $6,590 |
| Ratio of Total Expenses to | | | | | | | |
| Average Net Assets2 | | 0.40% | 0.42% | 0.44% | 0.48% | 0.38% | 0.37% |
| Ratio of Net Investment Income to | | | | | | |
| Average Net Assets | | 0.70% | 0.47% | 0.62% | 0.94% | 0.80% | 1.06% |
| Portfolio Turnover Rate | | 51% | 55% | 60% | 87% | 88% | 79% |
The expense ratio, net income ratio, and turnover rate for the current period have been annualized.
1 Total returns do not include account service fees that may have applied in the periods shown. Fund prospectuses provide information about any applicable account service fees.
2 Includes performance-based investment advisory fee increases (decreases) of (0.04%), (0.01%), 0.01%, 0.02%, 0.00%, and 0.00%.
See accompanying Notes, which are an integral part of the Financial Statements.
19
Morgan Growth Fund
Financial Highlights
Admiral Shares
| | | | | | | |
| | Six Months | | | | | |
| | | Ended | | | | | |
| For a Share Outstanding | March 31, | | | Year Ended September 30, |
| Throughout Each Period | | 2012 | 2011 | 2010 | 2009 | 2008 | 2007 |
| Net Asset Value, Beginning of Period | $49.84 | $49.75 | $44.42 | $47.03 | $66.58 | $56.94 |
| Investment Operations | | | | | | | |
| Net Investment Income | | .246 | .342 | .372 | .414 | .555 | .742 |
| Net Realized and Unrealized Gain (Loss) | | | | | | |
| on Investments | | 13.785 | .110 | 5.364 | (2.502) | (15.244) | 11.184 |
| Total from Investment Operations | | 14.031 | .452 | 5.736 | (2.088) | (14.689) | 11.926 |
| Distributions | | | | | | | |
| Dividends from Net Investment Income | (.391) | (.362) | (.406) | (.522) | (.641) | (.745) |
| Distributions from Realized Capital Gains | — | — | — | — | (4.220) | (1.541) |
| Total Distributions | | (.391) | (.362) | (.406) | (.522) | (4.861) | (2.286) |
| Net Asset Value, End of Period | | $63.48 | $49.84 | $49.75 | $44.42 | $47.03 | $66.58 |
| |
| Total Return1 | | 28.28% | 0.83% | 12.95% | -4.09% | -23.57% | 21.43% |
| |
| Ratios/Supplemental Data | | | | | | | |
| Net Assets, End of Period (Millions) | $3,636 | $2,554 | $2,445 | $2,251 | $2,512 | $2,683 |
| Ratio of Total Expenses to | | | | | | | |
| Average Net Assets2 | | 0.26% | 0.28% | 0.30% | 0.31% | 0.21% | 0.21% |
| Ratio of Net Investment Income to | | | | | | |
| Average Net Assets | | 0.84% | 0.61% | 0.76% | 1.11% | 0.97% | 1.22% |
| Portfolio Turnover Rate | | 51% | 55% | 60% | 87% | 88% | 79% |
The expense ratio, net income ratio, and turnover rate for the current period have been annualized.
1 Total returns do not include account service fees that may have applied in the periods shown. Fund prospectuses provide information about any applicable account service fees.
2 Includes performance-based investment advisory fee increases (decreases) of (0.04%), (0.01%), 0.01%, 0.02%, 0.00%, and 0.00%.
See accompanying Notes, which are an integral part of the Financial Statements.
20
Morgan Growth Fund
Notes to Financial Statements
Vanguard Morgan Growth Fund is registered under the Investment Company Act of 1940 as an open-end investment company, or mutual fund. The fund offers two classes of shares: Investor Shares and Admiral Shares. Investor Shares are available to any investor who meets the fund’s minimum purchase requirements. Admiral Shares are designed for investors who meet certain administrative, service, and account-size criteria.
A. The following significant accounting policies conform to generally accepted accounting principles for U.S. mutual funds. The fund consistently follows such policies in preparing its financial statements.
1. Security Valuation: Securities are valued as of the close of trading on the New York Stock Exchange (generally 4 p.m., Eastern time) on the valuation date. Equity securities are valued at the latest quoted sales prices or official closing prices taken from the primary market in which each security trades; such securities not traded on the valuation date are valued at the mean of the latest quoted bid and asked prices. Securities for which market quotations are not readily available, or whose values have been affected by events occurring before the fund’s pricing time but after the close of the securities’ primary markets, are valued at their fair values calculated according to procedures adopted by the board of trustees. These procedures include obtaining quotations from an independent pricing service, monitoring news to identify significant market- or security-specific events, and evaluating changes in the values of foreign market proxies (for example, ADRs, futures contracts, or exchange-traded funds), between the time the foreign markets close and the fund’s pricing time. When fair-value pricing is employed, the prices of securities used by a fund to calculate its net asset value may differ from quoted or published prices for the same securities. Investments in Vanguard Market Liquidity Fund are valued at that fund’s net asset value. Temporary cash investments acquired over 60 days to maturity are valued using the latest bid prices or using valuations based on a matrix system (which considers such factors as security prices, yields, maturities, and ratings), both as furnished by independent pricing services. Other temporary cash investments are valued at amortized cost, which approximates market value.
2. Futures Contracts: The fund uses index futures contracts to a limited extent, with the objective of maintaining full exposure to the stock market while maintaining liquidity. The fund may purchase or sell futures contracts to achieve a desired level of investment, whether to accommodate portfolio turnover or cash flows from capital share transactions. The primary risks associated with the use of futures contracts are imperfect correlation between changes in market values of stocks held by the fund and the prices of futures contracts, and the possibility of an illiquid market.
Futures contracts are valued at their quoted daily settlement prices. The aggregate principal amounts of the contracts are not recorded in the Statement of Net Assets. Fluctuations in the value of the contracts are recorded in the Statement of Net Assets as an asset (liability) and in the Statement of Operations as unrealized appreciation (depreciation) until the contracts are closed, when they are recorded as realized futures gains (losses).
3. Repurchase Agreements: The fund may enter into repurchase agreements. Securities pledged as collateral for repurchase agreements are held by a custodian bank until the agreements mature. Each agreement requires that the market value of the collateral be sufficient to cover payments of interest and principal. In the event of default or bankruptcy by the other party to the agreement, the fund may sell or retain the collateral; however, such action may be subject to legal proceedings.
4. Federal Income Taxes: The fund intends to continue to qualify as a regulated investment company and distribute all of its taxable income. Management has analyzed the fund’s tax positions taken for all open federal income tax years (September 30, 2008–2011), and for the period ended March 31, 2012, and has concluded that no provision for federal income tax is required in the fund’s financial statements.
21
Morgan Growth Fund
5. Distributions: Distributions to shareholders are recorded on the ex-dividend date.
6. Security Lending: The fund may lend its securities to qualified institutional borrowers to earn additional income. Security loans are required to be secured at all times by collateral at least equal to the market value of securities loaned. The fund invests cash collateral received in Vanguard Market Liquidity Fund, and records a liability for the return of the collateral, during the period the securities are on loan. Security lending income represents fees charged to borrowers plus income earned on investing cash collateral, less expenses associated with the loan.
7. Other: Dividend income is recorded on the ex-dividend date. Interest income includes income distributions received from Vanguard Market Liquidity Fund and is accrued daily. Security transactions are accounted for on the date securities are bought or sold. Costs used to determine realized gains (losses) on the sale of investment securities are those of the specific securities sold.
Each class of shares has equal rights as to assets and earnings, except that each class separately bears certain class-specific expenses related to maintenance of shareholder accounts (included in Management and Administrative expenses) and shareholder reporting. Marketing and distribution expenses are allocated to each class of shares based on a method approved by the board of trustees. Income, other non-class-specific expenses, and gains and losses on investments are allocated to each class of shares based on its relative net assets.
B. Wellington Management Company, LLP, Jennison Associates LLC, Frontier Capital Management Co., LLC, and Kalmar Investment Advisers each provide investment advisory services to a portion of the fund for a fee calculated at an annual percentage rate of average net assets managed by the advisor. The basic fee of Wellington Management Company, LLP is subject to quarterly adjustments based on performance for the preceding three years relative to the Russell 3000 Growth Index. The basic fee of Jennison Associates LLC is subject to quarterly adjustments based on performance for the preceding three years relative to the Russell 1000 Growth Index. The basic fees of Frontier Capital Management Co., LLC, and Kalmar Investment Advisers are subject to quarterly adjustments based on performance for the preceding three years relative to the Russell Midcap Growth Index.
The Vanguard Group provides investment advisory services to a portion of the fund on an at-cost basis; the fund paid Vanguard advisory fees of $205,000 for the six months ended March 31, 2012.
For the six months ended March 31, 2012, the aggregate investment advisory fee represented an effective annual basic rate of 0.16% of the fund’s average net assets, before a decrease of $1,821,000 (0.04%) based on performance.
C. The Vanguard Group furnishes at cost corporate management, administrative, marketing, and distribution services. The costs of such services are allocated to the fund under methods approved by the board of trustees. The fund has committed to provide up to 0.40% of its net assets in capital contributions to Vanguard. At March 31, 2012, the fund had contributed capital of $1,358,000 to Vanguard (included in Other Assets), representing 0.01% of the fund’s net assets and 0.54% of Vanguard’s capitalization. The fund’s trustees and officers are also directors and officers of Vanguard.
D. The fund has asked its investment advisors to direct certain security trades, subject to obtaining the best price and execution, to brokers who have agreed to rebate to the fund part of the commissions generated. Such rebates are used solely to reduce the fund’s management and administrative expenses. For the six months ended March 31, 2012, these arrangements reduced the fund’s expenses by $143,000 (an annual rate of 0.00% of average net assets).
22
Morgan Growth Fund
E. Various inputs may be used to determine the value of the fund’s investments. These inputs are summarized in three broad levels for financial statement purposes. The inputs or methodologies used to value securities are not necessarily an indication of the risk associated with investing in those securities.
Level 1—Quoted prices in active markets for identical securities.
Level 2—Other significant observable inputs (including quoted prices for similar securities, interest rates, prepayment speeds, credit risk, etc.).
Level 3—Significant unobservable inputs (including the fund’s own assumptions used to determine the fair value of investments).
The following table summarizes the market value of the fund’s investments as of March 31, 2012, based on the inputs used to value them:
| | | |
| | Level 1 | Level 2 | Level 3 |
| Investments | ($000) | ($000) | ($000) |
| Common Stocks | 9,204,061 | — | — |
| Temporary Cash Investments | 258,609 | 60,199 | — |
| Futures Contracts—Assets1 | 446 | — | — |
| Total | 9,463,116 | 60,199 | — |
| 1 Represents variation margin on the last day of the reporting period. | | | |
F. At March 31, 2012, the aggregate settlement value of open futures contracts and the related unrealized appreciation (depreciation) were:
| | | | |
| | | | | ($000) |
| | | | Aggregate | |
| | | Number of | Settlement | Unrealized |
| | | Long (Short) | Value | Appreciation |
| Futures Contracts | Expiration | Contracts | Long (Short) | (Depreciation) |
| S&P 500 Index | June 2012 | 312 | 109,450 | 1,629 |
| E-mini S&P 500 Index | June 2012 | 271 | 19,013 | 46 |
Unrealized appreciation (depreciation) on open futures contracts is required to be treated as realized gain (loss) for tax purposes.
G. Distributions are determined on a tax basis and may differ from net investment income and realized capital gains for financial reporting purposes. Differences may be permanent or temporary. Permanent differences are reclassified among capital accounts in the financial statements to reflect their tax character. Temporary differences arise when certain items of income, expense, gain, or loss are recognized in different periods for financial statement and tax purposes; these differences will reverse at some time in the future. Differences in classification may also result from the treatment of short-term gains as ordinary income for tax purposes.
The fund’s tax-basis capital gains and losses are determined only at the end of each fiscal year. For tax purposes, at September 30, 2011, the fund had available capital loss carryforwards totaling $1,190,331,000 to offset future net capital gains of $90,903,000 through September 30, 2017, and $1,099,428,000 through September 30, 2018. The fund will use these capital losses to offset net taxable capital gains, if any, realized during the year ending September 30, 2012; should the fund realize net capital losses for the year, the losses will be added to the loss carryforward balance above.
23
Morgan Growth Fund
At March 31, 2012, the cost of investment securities for tax purposes was $6,882,289,000. Net unrealized appreciation of investment securities for tax purposes was $2,640,580,000, consisting of unrealized gains of $2,789,153,000 on securities that had risen in value since their purchase and $148,573,000 in unrealized losses on securities that had fallen in value since their purchase.
H. During the six months ended March 31, 2012, the fund purchased $2,119,207,000 of investment securities and sold $2,187,064,000 of investment securities, other than temporary cash investments.
I. Capital share transactions for each class of shares were:
| | | | |
| | Six Months Ended | | Year Ended |
| | March 31, 2012 | September 30, 2011 |
| | Amount | Shares | Amount | Shares |
| | ($000) | (000) | ($000) | (000) |
| Investor Shares | | | | |
| Issued | 370,205 | 20,185 | 881,191 | 48,755 |
| Issued in Lieu of Cash Distributions | 29,253 | 1,660 | 29,637 | 1,644 |
| Redeemed | (949,711) | (49,964) | (1,386,128) | (77,285) |
| Net Increase (Decrease)—Investor Shares | (550,253) | (28,119) | (475,300) | (26,886) |
| Admiral Shares | | | | |
| Issued | 654,765 | 10,868 | 800,719 | 14,395 |
| Issued in Lieu of Cash Distributions | 17,720 | 324 | 17,322 | 310 |
| Redeemed | (293,034) | (5,166) | (703,100) | (12,596) |
| Net Increase (Decrease)—Admiral Shares | 379,451 | 6,026 | 114,941 | 2,109 |
J. In preparing the financial statements as of March 31, 2012, management considered the impact of subsequent events for potential recognition or disclosure in these financial statements.
24
About Your Fund’s Expenses
As a shareholder of the fund, you incur ongoing costs, which include costs for portfolio management, administrative services, and shareholder reports (like this one), among others. Operating expenses, which are deducted from a fund’s gross income, directly reduce the investment return of the fund.
A fund’s expenses are expressed as a percentage of its average net assets. This figure is known as the expense ratio. The following examples are intended to help you understand the ongoing costs (in dollars) of investing in your fund and to compare these costs with those of other mutual funds. The examples are based on an investment of $1,000 made at the beginning of the period shown and held for the entire period.
The accompanying table illustrates your fund’s costs in two ways:
• Based on actual fund return. This section helps you to estimate the actual expenses that you paid over the period. The ”Ending Account Value“ shown is derived from the fund‘s actual return, and the third column shows the dollar amount that would have been paid by an investor who started with $1,000 in the fund. You may use the information here, together with the amount you invested, to estimate the expenses that you paid over the period.
To do so, simply divide your account value by $1,000 (for example, an $8,600 account value divided by $1,000 = 8.6), then multiply the result by the number given for your fund under the heading ”Expenses Paid During Period.“
• Based on hypothetical 5% yearly return. This section is intended to help you compare your fund‘s costs with those of other mutual funds. It assumes that the fund had a yearly return of 5% before expenses, but that the expense ratio is unchanged. In this case—because the return used is not the fund’s actual return—the results do not apply to your investment. The example is useful in making comparisons because the Securities and Exchange Commission requires all mutual funds to calculate expenses based on a 5% return. You can assess your fund’s costs by comparing this hypothetical example with the hypothetical examples that appear in shareholder reports of other funds.
Note that the expenses shown in the table are meant to highlight and help you compare ongoing costs only and do not reflect transaction costs incurred by the fund for buying and selling securities. Further, the expenses do not include any purchase, redemption, or account service fees described in the fund prospectus. If such fees were applied to your account, your costs would be higher. Your fund does not carry a “sales load.”
The calculations assume no shares were bought or sold during the period. Your actual costs may have been higher or lower, depending on the amount of your investment and the timing of any purchases or redemptions.
You can find more information about the fund’s expenses, including annual expense ratios, in the Financial Statements section of this report. For additional information on operating expenses and other shareholder costs, please refer to your fund’s current prospectus.
25
Six Months Ended March 31, 2012
| | | |
| | Beginning | Ending | Expenses |
| | Account Value | Account Value | Paid During |
| Morgan Growth Fund | 9/30/2011 | 3/31/2012 | Period |
| Based on Actual Fund Return | | | |
| Investor Shares | $1,000.00 | $1,281.83 | $2.28 |
| Admiral Shares | 1,000.00 | 1,282.79 | 1.48 |
| Based on Hypothetical 5% Yearly Return | | | |
| Investor Shares | $1,000.00 | $1,023.00 | $2.02 |
| Admiral Shares | 1,000.00 | 1,023.70 | 1.32 |
The calculations are based on expenses incurred in the most recent six-month period. The fund’s annualized six-month expense ratios for that period are 0.40% for Investor Shares and 0.26% for Admiral Shares. The dollar amounts shown as “Expenses Paid” are equal to the annualized expense ratio multiplied by the average account value over the period, multiplied by the number of days in the most recent six-month period, then divided by the number of days in the most recent 12-month period.
26
Trustees Approve Advisory Arrangements
The board of trustees of Vanguard Morgan Growth Fund has renewed the fund’s investment advisory arrangements with Frontier Capital Management Co., LLC, Jennison Associates LLC, Kalmar Investment Advisers, Wellington Management Company, LLP, and The Vanguard Group, Inc. (through its Equity Investment Group). The board determined that the retention of the advisors was in the best interests of the fund and its shareholders.
The board based its decisions upon an evaluation of each advisor’s investment staff, portfolio management process, and performance. The trustees considered the factors discussed below, among others. However, no single factor determined whether the board approved the arrangements. Rather, it was the totality of the circumstances that drove the board’s decisions.
Nature, extent, and quality of services
The board considered the quality of the fund’s investment management over both the short and long term, and took into account the organizational depth and stability of each advisor. The board noted the following:
Frontier Capital Management Company, LLC. Frontier, founded in 1980, is an investment management boutique that focuses on investing in small- and mid-cap stocks. Frontier is an affiliate of Affiliated Managers Group, but retains a 30% ownership interest. The firm employs a fundamental, bottom-up investment approach that seeks companies with a combination of superior growth potential and attractive valuation. Frontier’s investment process emphasizes companies with understandable business models, good franchises, accelerating sales and margins, and healthy balance sheets. Analysts regularly interact with management and other companies in the supply chain to effectively construct a portfolio of stocks for the fund. Frontier has managed a portion of the fund since 2008.
Jennison Associates LLC. Jennison, founded in 1969, is an indirect, wholly owned subsidiary of Prudential Financial, Inc. The firm currently oversees a wide range of equity and fixed income strategies. The investment team at Jennison Associates uses internal fundamental research and a highly interactive bottom-up stock selection process to identify companies that exhibit above-average growth in units, revenues, earnings, and cash flows. When evaluating a company for purchase or sale, the analysis focuses on the duration of the growth opportunity and seeks to capture inflection points in the company’s growth. Jennison has managed a portion of the fund since 2007.
Kalmar Investment Advisers. Kalmar, together with its parent company, Kalmar Investments Inc., founded in 1982, specializes in small- and mid-capitalization growth stock. Kalmar is a research-driven investment firm that is entirely focused on the management of “growth with value” small- and mid-cap equity portfolios. Kalmar believes that there is a high-reward/low-risk anomaly offered by the equity market in the stocks of solid, well-managed, rapidly growing smaller companies. Through independent fundamental research, Kalmar attempts to discover such companies, buy them at undervalued levels, and own them for the longer term. Kalmar has managed a portion of the fund since 2008.
Wellington Management Company, LLP. Wellington Management, founded in 1928, is among the nation’s oldest and most respected institutional investment managers. The investment team at Wellington Management uses traditional methods of stock selection to identify companies that it believes have above-average growth prospects, particularly those in industries undergoing change. Research focuses on large- and mid-cap companies with a proven record of sales and earnings growth, profitability, and cash-flow generation. Wellington Management has advised the fund since 1968.
27
The Vanguard Group, Inc. Vanguard has been managing investments for more than three decades. The Equity Investment Group adheres to a sound, disciplined investment management process; the team has considerable experience, stability, and depth. Vanguard has managed a portion of the fund since 1993.
The board concluded that each advisor’s experience, stability, depth, and performance, among other factors, warranted continuation of the advisory arrangements.
Investment performance
The board considered the short and longterm performance of the fund, including any periods of outperformance or underperformance of a relevant benchmark and peer group. The board concluded that each advisor has carried out the fund’s investment strategy in disciplined fashion; however, the fund’s results versus its benchmark have been less favorable over the one, three, and fiveyear periods. The board noted that the fund has outperformed its peer group over both the short and long term. Information about the fund’s most recent performance can be found in the Performance Summary section of this report.
Cost
The board concluded that the fund’s expense ratio was well below the average expense ratio charged by funds in its peer group and that the fund’s advisory fee rate was also well below its peergroup average. Information about the fund’s expenses appears in the About Your Fund’s Expenses section of this report as well as in the Financial Statements section, which also includes information about the fund’s advisory fee rate.
The board did not consider profitability of Frontier, Jennison, Kalmar, and Wellington Management in determining whether to approve the advisory fees, because the firms are independent of Vanguard, and the advisory fees are the result of arm’slength negotiations. The board does not conduct a profitability analysis of Vanguard, because of Vanguard’s unique “atcost” structure. Unlike most other mutual fund management companies, Vanguard is owned by the funds it oversees, and produces “profits” only in the form of reduced expenses for fund shareholders.
The benefit of economies of scale
The board concluded that the fund’s shareholders benefit from economies of scale because of breakpoints in the advisory fee schedules for Frontier, Jennison, Kalmar, and Wellington Management. The breakpoints reduce the effective rate of the fees as the fund’s assets managed by each advisor increase. The board also concluded that the fund’s lowcost arrangement with Vanguard ensures that the fund will realize economies of scale as it grows, with the cost to shareholders declining as fund assets managed by Vanguard increase.
The board will consider whether to renew the advisory arrangements again after a oneyear period.
28
Glossary
30-Day SEC Yield. A fund’s 30-day SEC yield is derived using a formula specified by the U.S. Securities and Exchange Commission. Under the formula, data related to the fund’s security holdings in the previous 30 days are used to calculate the fund’s hypothetical net income for that period, which is then annualized and divided by the fund’s estimated average net assets over the calculation period. For the purposes of this calculation, a security’s income is based on its current market yield to maturity (for bonds), its actual income (for asset-backed securities), or its projected dividend yield (for stocks). Because the SEC yield represents hypothetical annualized income, it will differ—at times significantly—from the fund’s actual experience. As a result, the fund’s income distributions may be higher or lower than implied by the SEC yield.
Beta. A measure of the magnitude of a fund’s past share-price fluctuations in relation to the ups and downs of a given market index. The index is assigned a beta of 1.00. Compared with a given index, a fund with a beta of 1.20 typically would have seen its share price rise or fall by 12% when the index rose or fell by 10%. For this report, beta is based on returns over the past 36 months for both the fund and the index. Note that a fund’s beta should be reviewed in conjunction with its R-squared (see definition). The lower the R-squared, the less correlation there is between the fund and the index, and the less reliable beta is as an indicator of volatility.
Dividend Yield. Dividend income earned by stocks, expressed as a percentage of the aggregate market value (or of net asset value, for a fund). The yield is determined by dividing the amount of the annual dividends by the aggregate value (or net asset value) at the end of the period. For a fund, the dividend yield is based solely on stock holdings and does not include any income produced by other investments.
Earnings Growth Rate. The average annual rate of growth in earnings over the past five years for the stocks now in a fund.
Equity Exposure. A measure that reflects a fund’s investments in stocks and stock futures. Any holdings in short-term reserves are excluded.
Expense Ratio. A fund’s total annual operating expenses expressed as a percentage of the fund’s average net assets. The expense ratio includes management and administrative expenses, but does not include the transaction costs of buying and selling portfolio securities.
Foreign Holdings. The percentage of a fund represented by securities or depositary receipts of companies based outside the United States.
Inception Date. The date on which the assets of a fund (or one of its share classes) are first invested in accordance with the fund’s investment objective. For funds with a subscription period, the inception date is the day after that period ends. Investment performance is measured from the inception date.
Median Market Cap. An indicator of the size of companies in which a fund invests; the midpoint of market capitalization (market price x shares outstanding) of a fund’s stocks, weighted by the proportion of the fund’s assets invested in each stock. Stocks representing half of the fund’s assets have market capitalizations above the median, and the rest are below it.
Price/Book Ratio. The share price of a stock divided by its net worth, or book value, per share. For a fund, the weighted average price/book ratio of the stocks it holds.
29
Price/Earnings Ratio. The ratio of a stock’s current price to its per-share earnings over the past year. For a fund, the weighted average P/E of the stocks it holds. P/E is an indicator of market expectations about corporate prospects; the higher the P/E, the greater the expectations for a company’s future growth.
R-Squared. A measure of how much of a fund’s past returns can be explained by the returns from the market in general, as measured by a given index. If a fund’s total returns were precisely synchronized with an index’s returns, its R-squared would be 1.00. If the fund’s returns bore no relationship to the index’s returns, its R-squared would be 0. For this report, R-squared is based on returns over the past 36 months for both the fund and the index.
Return on Equity. The annual average rate of return generated by a company during the past five years for each dollar of shareholder’s equity (net income divided by shareholder’s equity). For a fund, the weighted average return on equity for the companies whose stocks it holds.
Short-Term Reserves. The percentage of a fund invested in highly liquid, short-term securities that can be readily converted to cash.
Turnover Rate. An indication of the fund’s trading activity. Funds with high turnover rates incur higher transaction costs and may be more likely to distribute capital gains (which may be taxable to investors). The turnover rate excludes in-kind transactions, which have minimal impact on costs.
30
This page intentionally left blank.
The People Who Govern Your Fund
The trustees of your mutual fund are there to see that the fund is operated and managed in your best interests since, as a shareholder, you are a part owner of the fund. Your fund’s trustees also serve on the board of directors of The Vanguard Group, Inc., which is owned by the Vanguard funds and provides services to them on an at-cost basis.
A majority of Vanguard’s board members are independent, meaning that they have no affiliation with Vanguard or the funds they oversee, apart from the sizable personal investments they have made as private individuals. The independent board members have distinguished backgrounds in business, academia, and public service. Each of the trustees and executive officers oversees 179 Vanguard funds.
The following table provides information for each trustee and executive officer of the fund. More information about the trustees is in the Statement of Additional Information, which can be obtained, without charge, by contacting Vanguard at 800-662-7447, or online at vanguard.com.
| |
| InterestedTrustee1 | and Delphi Automotive LLP (automotive components); |
| Senior Advisor at New Mountain Capital; Trustee of |
| F. William McNabb III | |
| Born 1957. Trustee Since July 2009. Chairman of the | |
| Board. Principal Occupation(s) During the Past Five | The Conference Board. |
| Years: Chairman of the Board of The Vanguard Group, | |
| Inc., and of each of the investment companies served | Amy Gutmann |
| by The Vanguard Group, since January 2010; Director | Born 1949. Trustee Since June 2006. Principal |
| of The Vanguard Group since 2008; Chief Executive | Occupation(s) During the Past Five Years: President |
| Officer and President of The Vanguard Group and of | of the University of Pennsylvania; Christopher H. |
| each of the investment companies served by The | Browne Distinguished Professor of Political Science |
| Vanguard Group since 2008; Director of Vanguard | in the School of Arts and Sciences with secondary |
| Marketing Corporation; Managing Director of The | appointments at the Annenberg School for Commu- |
| Vanguard Group (1995–2008). | nication and the Graduate School of Education |
| of the University of Pennsylvania; Director of |
| Carnegie Corporation of New York, Schuylkill River |
| Independent Trustees | Development Corporation, and Greater Philadelphia |
| Chamber of Commerce; Trustee of the National |
| Emerson U. Fullwood | Constitution Center; Chair of the Presidential |
| Born 1948. Trustee Since January 2008. Principal | Commission for the Study of Bioethical Issues. |
| Occupation(s) During the Past Five Years: Executive | |
| Chief Staff and Marketing Officer for North America | JoAnn Heffernan Heisen |
| and Corporate Vice President (retired 2008) of Xerox | Born 1950. Trustee Since July 1998. Principal |
| Corporation (document management products and | Occupation(s) During the Past Five Years: Corporate |
| services); Executive in Residence and 2010 | Vice President and Chief Global Diversity Officer |
| Distinguished Minett Professor at the Rochester | (retired 2008) and Member of the Executive |
| Institute of Technology; Director of SPX Corporation | Committee (1997–2008) of Johnson & Johnson |
| (multi-industry manufacturing), the United Way of | (pharmaceuticals/medical devices/consumer |
| Rochester, Amerigroup Corporation (managed health | products); Director of Skytop Lodge Corporation |
| care), the University of Rochester Medical Center, | (hotels), the University Medical Center at Princeton, |
| Monroe Community College Foundation, and North | the Robert Wood Johnson Foundation, and the Center |
| Carolina A&T University. | for Talent Innovation; Member of the Advisory Board |
| of the Maxwell School of Citizenship and Public Affairs |
| Rajiv L. Gupta | at Syracuse University. |
| Born 1945. Trustee Since December 2001.2 | |
| Principal Occupation(s) During the Past Five Years: | F. Joseph Loughrey |
| Chairman and Chief Executive Officer (retired 2009) | Born 1949. Trustee Since October 2009. Principal |
| and President (2006–2008) of Rohm Haas Co. | Occupation(s) During the Past Five Years: President |
| (chemicals); Director of Tyco International, Ltd. | and Chief Operating Officer (retired 2009) of Cummins |
| (diversified manufacturing and services), Hewlett- | Inc. (industrial machinery); Director of SKF AB |
| Packard Co. (electronic computer manufacturing), | (industrial machinery), Hillenbrand, Inc. (specialized |
| consumer services), the Lumina Foundation for |
| |
| |
| | |
| Education, and Oxfam America; Chairman of the | Executive Officers | |
| Advisory Council for the College of Arts and Letters | | |
| and Member of the Advisory Board to the Kellogg | Glenn Booraem | |
| Institute for International Studies at the University | Born 1967. Controller Since July 2010. Principal |
| of Notre Dame. | Occupation(s) During the Past Five Years: Principal |
| | of The Vanguard Group, Inc.; Controller of each of |
| Mark Loughridge | the investment companies served by The Vanguard |
| Born 1953. Trustee Since March 2012. Principal | Group; Assistant Controller of each of the investment |
| Occupation(s) During the Past Five Years: Senior Vice | companies served by The Vanguard Group (2001–2010). |
| President and Chief Financial Officer at IBM (information | | |
| technology services); Fiduciary Member of IBM’s | Thomas J. Higgins | |
| Retirement Plan Committee. | Born 1957. Chief Financial Officer Since September |
| | 2008. Principal Occupation(s) During the Past Five |
| Scott C. Malpass | Years: Principal of The Vanguard Group, Inc.; Chief |
| Born 1962. Trustee Since March 2012. Principal | Financial Officer of each of the investment companies |
| Occupation(s) During the Past Five Years: Chief | served by The Vanguard Group; Treasurer of each of |
| Investment Officer and Vice President at the University | the investment companies served by The Vanguard |
| of Notre Dame; Assistant Professor of Finance at the | Group (1998–2008). | |
| Mendoza College of Business at Notre Dame; Member | | |
| of the Notre Dame 403(b) Investment Committee; | Kathryn J. Hyatt | |
| Director of TIFF Advisory Services, Inc. (investment | Born 1955. Treasurer Since November 2008. Principal |
| advisor); Member of the Investment Advisory | Occupation(s) During the Past Five Years: Principal of |
| Committees of the Financial Industry Regulatory | The Vanguard Group, Inc.; Treasurer of each of the |
| Authority (FINRA) and of Major League Baseball. | investment companies served by The Vanguard |
| | Group; Assistant Treasurer of each of the investment |
| André F. Perold | companies served by The Vanguard Group (1988–2008). |
| Born 1952. Trustee Since December 2004. Principal | | |
| Occupation(s) During the Past Five Years: George | Heidi Stam | |
| Gund Professor of Finance and Banking at the Harvard | Born 1956. Secretary Since July 2005. Principal |
| Business School (retired 2011); Chief Investment | Occupation(s) During the Past Five Years: Managing |
| Officer and Managing Partner of HighVista Strategies | Director of The Vanguard Group, Inc.; General Counsel |
| LLC (private investment firm); Director of Rand | of The Vanguard Group; Secretary of The Vanguard |
| Merchant Bank; Overseer of the Museum of Fine | Group and of each of the investment companies |
| Arts Boston. | served by The Vanguard Group; Director and Senior |
| | Vice President of Vanguard Marketing Corporation; |
| Alfred M. Rankin, Jr. | Principal of The Vanguard Group (1997–2006). |
| Born 1941. Trustee Since January 1993. Principal | | |
| Occupation(s) During the Past Five Years: Chairman, | | |
| President, and Chief Executive Officer of NACCO | Vanguard Senior ManagementTeam |
| Industries, Inc. (forklift trucks/housewares/lignite); | | |
| Director of Goodrich Corporation (industrial products/ | Mortimer J. Buckley | Michael S. Miller |
| aircraft systems and services) and the National | Kathleen C. Gubanich | James M. Norris |
| Association of Manufacturers; Chairman of the Board | Paul A. Heller | Glenn W. Reed |
| of the Federal Reserve Bank of Cleveland and of | Martha G. King | George U. Sauter |
| University Hospitals of Cleveland; Advisory Chairman | Chris D. McIsaac | |
| of the Board of The Cleveland Museum of Art. | | |
| | |
| Peter F. Volanakis | Chairman Emeritus and Senior Advisor |
| Born 1955. Trustee Since July 2009. Principal | | |
| Occupation(s) During the Past Five Years: President | John J. Brennan | |
| and Chief Operating Officer (retired 2010) of Corning | Chairman, 1996–2009 | |
| Incorporated (communications equipment); Director | Chief Executive Officer and President, 1996–2008 | |
| of SPX Corporation (multi-industry manufacturing); | | |
| Overseer of the Amos Tuck School of Business | |
| Administration at Dartmouth College; Advisor to the | Founder | |
| Norris Cotton Cancer Center. | | |
| John C. Bogle | |
| Chairman and Chief Executive Officer, 1974–1996 | |
| | |
| | |
| |
| | |
1 Mr. McNabb is considered an “interested person,” as defined in the Investment Company Act of 1940, because he is an officer of the Vanguard funds.
2 December 2002 for Vanguard Equity Income Fund, Vanguard Growth Equity Fund, the Vanguard Municipal Bond Funds, and the Vanguard State Tax-Exempt Funds.
|  |
| P.O. Box 2600 |
| Valley Forge, PA 19482-2600 |
Connect with Vanguard® > vanguard.com
| |
| Fund Information > 800-662-7447 | CFA® is a trademark owned by CFA Institute. |
| Direct Investor Account Services > 800-662-2739 | |
| Institutional Investor Services > 800-523-1036 | |
| Text Telephone for People | |
| With Hearing Impairment > 800-749-7273 | |
| |
| This material may be used in conjunction | |
| with the offering of shares of any Vanguard | |
| fund only if preceded or accompanied by | |
| the fund’s current prospectus. | |
| |
| All comparative mutual fund data are from Lipper Inc. or | |
| Morningstar, Inc., unless otherwise noted. | |
| |
| You can obtain a free copy of Vanguard’s proxy voting | |
| guidelines by visiting vanguard.com/proxyreporting or by | |
| calling Vanguard at 800-662-2739. The guidelines are | |
| also available from the SEC’s website, sec.gov. In | |
| addition, you may obtain a free report on how your fund | |
| voted the proxies for securities it owned during the 12 | |
| months ended June 30. To get the report, visit either | |
| vanguard.com/proxyreporting or sec.gov. | |
| |
| You can review and copy information about your fund at | |
| the SEC’s Public Reference Room in Washington, D.C. To | |
| find out more about this public service, call the SEC at | |
| 202-551-8090. Information about your fund is also | |
| available on the SEC’s website, and you can receive | |
| copies of this information, for a fee, by sending a | |
| request in either of two ways: via e-mail addressed to | |
| publicinfo@sec.gov or via regular mail addressed to the | |
| Public Reference Section, Securities and Exchange | |
| Commission, Washington, DC 20549-1520. | |
| |
| |
| | © 2012 The Vanguard Group, Inc. |
| | All rights reserved. |
| | Vanguard Marketing Corporation, Distributor. |
| |
| | Q262 052012 |
Item 2:
Not Applicable.
Item 3:
Not Applicable.
Item 4: Principal Accountant Fees and Services.
Not Applicable.
Item 5: Audit Committee of Listed Registrants.
Not Applicable.
Item 6: Investments.
Not Applicable.
Item 7: Disclosure of Proxy Voting Policies and Procedures for Closed-End Management Investment Companies.
Not Applicable.
Item 8: Portfolio Managers of Closed-End Management Investment Companies.
Not Applicable.
Item 9: Purchase of Equity Securities by Closed-End Management Investment Company and Affiliated Purchasers.
Not Applicable.
Item 10: Submission of Matters to a Vote of Security Holders.
Not Applicable.
Item 11: Controls and Procedures.
(a) Disclosure Controls and Procedures. The Principal Executive and Financial Officers concluded that the Registrant's Disclosure Controls and Procedures are effective based on their evaluation of the Disclosure Controls and Procedures as of a date within 90 days of the filing date of this report.
(b) Internal Control Over Financial Reporting. There were no significant changes in Registrant’s Internal Control Over Financial Reporting or in other factors that could significantly affect this control subsequent to the date of the evaluation, including any corrective actions with regard to significant deficiencies and material weaknesses.
Item 12: Exhibits.
(a) Certifications.
Pursuant to the requirements of the Securities Exchange Act of 1934 and the Investment Company Act of 1940, the registrant has duly caused this report to be signed on its behalf by the undersigned, thereunto duly authorized.
|
| VANGUARD MORGAN GROWTH FUND |
| |
| /s/ F. WILLIAM MCNABB III* |
| F. WILLIAM MCNABB III |
| CHIEF EXECUTIVE OFFICER |
| |
| Date: May 22, 2012 |
Pursuant to the requirements of the Securities Exchange Act of 1934 and the Investment Company Act of 1940, this report has been signed below by the following persons on behalf of the registrant and in the capacities and on the dates indicated.
|
| VANGUARD MORGAN GROWTH FUND |
| |
| /s/ F. WILLIAM MCNABB III* |
| F. WILLIAM MCNABB III |
| CHIEF EXECUTIVE OFFICER |
| |
| Date: May 22, 2012 |
|
| VANGUARD MORGAN GROWTH FUND |
| |
| /s/ THOMAS J. HIGGINS* |
| THOMAS J. HIGGINS |
| CHIEF FINANCIAL OFFICER |
| |
| Date: May 22, 2012 |
* By: /s/ Heidi Stam
Heidi Stam, pursuant to a Power of Attorney filed on March 27, 2012 see file Number 2-11444, Incorporated by Reference.