UNITED STATES
SECURITIES AND EXCHANGE COMMISSION
Washington, D.C. 20549
FORM N-CSR
CERTIFIED SHAREHOLDER REPORT OF
REGISTERED MANAGEMENT INVESTMENT COMPANIES
Investment Company Act file number: 811-1685
Name of Registrant: Vanguard Morgan Growth Fund
Address of Registrant:
P.O. Box 2600
Valley Forge, PA 19482
Name and address of agent for service:
Heidi Stam, Esquire
P.O. Box 876
Valley Forge, PA 19482
Registrant’s telephone number, including area code: (610) 669-1000
Date of fiscal year end: September 30
Date of reporting period: October 1, 2009 – March 31, 2010
Item 1: Reports to Shareholders
 |
| Vanguard Morgan™ Growth Fund |
| Semiannual Report |
|
| March 31, 2010 |
 |
|
|
|
|
> For the six-month period ended March 31, 2010, Vanguard Morgan Growth Fund returned about 13%.
> The fund’s returns surpassed the average return of peer funds and were in line with those of its benchmark, the Russell 3000 Growth Index.
> Stocks in the information technology and health care sectors contributed significantly to the fund’s performance for the period.
| |
| Contents | |
| Your Fund’s Total Returns. | 1 |
| Chairman’s Letter. | 2 |
| Advisors’ Report. | 6 |
| Fund Profile. | 12 |
| Performance Summary. | 13 |
| Financial Statements. | 14 |
| About Your Fund’s Expenses. | 27 |
| Trustees Approve Advisory Arrangements. | 29 |
| Glossary. | 31 |
Please note: The opinions expressed in this report are just that—informed opinions. They should not be considered promises or advice. Also, please keep in mind that the information and opinions cover the period through the date on the front of this report. Of course, the risks of investing in your fund are spelled out in the prospectus.
See the Glossary for definitions of investment terms used in this report.
Cover photograph: Veronica Coia.
| |
| Your Fund’s Total Returns | |
| |
| |
| |
| |
| Six Months Ended March 31, 2010 | |
| | Total |
| | Returns |
| Vanguard Morgan Growth Fund | |
| Investor Shares | 12.88% |
| Admiral™ Shares | 12.97 |
| Russell 3000 Growth Index | 12.89 |
| Multi-Cap Growth Funds Average | 11.59 |
| Multi-Cap Growth Funds Average: Derived from data provided by Lipper Inc. | |
Admiral Shares are a lower-cost class of shares available to many longtime shareholders and to those with significant investments in the fund.
Your Fund’s Performance at a Glance
September 30, 2009 , Through March 31, 2010
| | | | |
| | | | Distributions Per Share |
| | Starting | Ending | Income | Capital |
| | Share Price | Share Price | Dividends | Gains |
| Vanguard Morgan Growth Fund | | | | |
| Investor Shares | $14.32 | $16.05 | $0.110 | $0.000 |
| Admiral Shares | 44.42 | 49.76 | 0.406 | 0.000 |
1

Chairman’s Letter
Dear Shareholder,
After rising dramatically throughout most of 2009, domestic stocks continued to post gains throughout the first three months of 2010, although not as rapidly. For the six-month period ended March 31, 2010, the broad U.S. stock market posted a solid return of about 12%.
Vanguard Morgan Growth Fund fared slightly better than the broad market for the fiscal half-year, returning about 13%. The fund performed in line with its benchmark, the Russell 3000 Growth Index, and was ahead of the average multi-capitalization growth fund for the period. The fund’s holdings in the health care and information technology sectors contributed significantly to performance, while its selections in the financial sector were a weak spot.
Stock market rally continued despite a few minor setbacks
After a steep but short-lived decline, stocks resumed their uphill trek in February. The broad U.S. stock market ended the six-month period up about 12%. Since stocks began their historic recovery in March just over a year ago, U.S. equities have risen more than 70%.
During the six months, small-capitalization companies outperformed larger-cap companies, while growth stocks trumped their value counterparts, though the differences weren’t all that significant.
2
Foreign stocks didn’t fare as well as domestic stocks, but still ended the period on a positive note. Investors’ concerns about Greece’s creditworthi-ness, as well as that of economies such as Portugal and Spain, weighed on the European markets. In Asia, possible changes to China’s monetary policies and weakness in the Japanese market hindered the region’s results. Emerging-market stocks, which made a quick and substantial recovery from the global financial crisis, continued to outperform developed-market stocks.
Investors still favored riskier bond options
The broad U.S. taxable bond market returned about 2% for the period, as investors continued to prefer higher- risk corporate bonds over government issues. The broad municipal bond market returned 0.28%. The yields of longer-term U.S. Treasury bonds rose during the six months, while those of the shortest-term securities remained near 0%.
The Federal Reserve Board has kept its target for short-term interest rates unchanged at 0% to 0.25% since December 2008 and has said that it expects to maintain that rate for “an extended period.” In late February, Fed Chairman Ben Bernanke said that low interest rates were still necessary to help the economy recover, but that the central bank would be ready to tighten credit “at the appropriate time.” The Fed has, however, begun to wind down credit programs established during the financial crisis.
| | | |
| Market Barometer | | | |
| |
| | | | Total Returns |
| | | Periods Ended March 31, 2010 |
| | Six | One | Five Years |
| | Months | Year | (Annualized) |
| Stocks | | | |
| Russell 1000 Index (Large-caps) | 12.11% | 51.60% | 2.31% |
| Russell 2000 Index (Small-caps) | 13.07 | 62.76 | 3.36 |
| Dow Jones U.S. Total Stock Market Index | 12.48 | 52.88 | 2.82 |
| MSCI All Country World Index ex USA (International) | 5.51 | 61.67 | 6.59 |
| |
| Bonds | | | |
| Barclays Capital U.S. Aggregate Bond Index (Broad | | | |
| taxable market) | 1.99% | 7.69% | 5.44% |
| Barclays Capital Municipal Bond Index | 0.28 | 9.69 | 4.58 |
| Citigroup Three-Month U.S. Treasury Bill Index | 0.05 | 0.13 | 2.76 |
| |
| CPI | | | |
| Consumer Price Index | 0.77% | 2.31% | 2.40% |
3
Technology and health care stocks drive performance
During the six-month period covered in this report, Vanguard Morgan Growth Fund posted positive results in all sectors of the market, with the exception of the utilities sector. The fund’s return of about 13% for the half-year reflects strong stock selection by your fund’s advisors in several market sectors.
Information technology was the fund’s biggest contributor to performance, as well as its most heavily weighted sector, accounting for about 41% of the fund’s holdings, on average, during the period. The index weighting, by contrast, was about 32%. Technology companies have remained among the top performers since the stock market rally began last spring, so the fund’s overweighting in the sector provided a boost to performance. Holdings in computer storage and in computer peripherals such as monitors, keyboards, and printers—including NetApp and SanDisk—benefited as businesses resumed technology spending.
The strong performance of health care stocks also helped push returns higher. Significant holdings in pharmaceutical companies Mylan and Teva Pharmaceutical Industries helped the fund’s performance relative to the index. Stocks in the consumer discretionary sector also contributed to returns. Internet and specialty retailers, including such names as Amazon.com and Urban Outfitters, saw stock prices spike as consumer spending picked up.
| | | |
| Expense Ratios | | | |
| Your Fund Compared With Its Peer Group | | | |
| | Investor | Admiral | Peer Group |
| | Shares | Shares | Average |
| Morgan Growth Fund | 0.48% | 0.31% | 1.40% |
The fund expense ratios shown are from the prospectus dated January 26, 2010, and represent estimated costs for the current fiscal year based on the fund’s net assets as of the prospectus date. For the six months ended March 31, 2010, the fund’s annualized expense ratios were 0.49% for Investor Shares and 0.31% for Admiral Shares. The peer-group expense ratio is derived from data provided by Lipper Inc. and captures information through year-end 2009.
Peer group: Multi-Cap Growth Funds.
4
In the financial industry, the fund’s overweighting in capital market stocks relative to the index, particularly in the investment banks Goldman Sachs Group and Morgan Stanley, hindered performance. These stocks took a hit in recent months as investors continued to be skeptical of big financial institutions.
The utilities sector was the only area of the market to post negative results for the period. That said, the sector accounted for less than 1% of the fund’s holdings, on average, during the period, which helped to minimize the impact.
Keep your sights set on the long term
Despite a pause in February, the stock market kept climbing over the past six months, extending a powerful rally that began over a year ago. Although stocks continue to post solid gains for now, it’s impossible to know for sure whether this current bull market will persist.
Coming to terms with the market’s unpredictability includes the recognition that although you can’t control the market, you can control how you invest your money. That’s why Vanguard urges investors to create an investment plan that includes a mix of stocks, bonds, and short-term investments appropriate for their long-term goals and risk tolerance—and then stick with it. A well-diversified portfolio can offer some protection during a down market, while also providing an opportunity for long-term growth.
With its low expense ratio and broad diversification among domestic growth stocks, we believe that the Morgan Growth Fund can be an excellent addition to a well-balanced investment plan.
On another matter, I would like to inform you that as of January 1, 2010, we completed a leadership transition that began in March 2008. I succeeded Jack Brennan as chairman of Vanguard and each of the funds. Jack has agreed to serve as chairman emeritus and senior advisor. Under Jack’s leadership, Vanguard has grown to become a preeminent firm in the mutual fund industry. Jack’s energy, his relentless pursuit of perfection, and his unwavering focus on always doing the right thing for our clients are evident in every facet of Vanguard policy today.
As always, thank you for entrusting your assets to Vanguard.
Sincerely,

F. William McNabb III
Chairman and Chief Executive Officer
April 15, 2010
5
Advisors’ Report
For the fiscal half-year ended March 31, 2010, Vanguard Morgan Growth Fund returned 12.88% for Investor Shares and 12.97% for the lower-cost Admiral Shares. Your fund is managed by five independent advisors, a strategy that enhances the fund’s diversification by providing exposure to distinct, yet complementary, investment approaches. It’s not uncommon for different advisors to have different views about individual securities or the broader investment environment.
The advisors, the percentage of fund assets each manages, and brief descriptions of their investment strategies are presented in the table below. The advisors have also prepared a discussion of the investment environment that existed during the fiscal period and of how portfolio positioning reflects this assessment.
These comments were prepared on April 16, 2010.
| | | |
| Vanguard Morgan Growth Fund Investment Advisors | |
| |
| | Fund Assets Managed | |
| Investment Advisor | % | $ Million | Investment Strategy |
| Wellington Management | 41 | 3,452 | Uses traditional methods of stock selection—research |
| Company, LLP | | | and analysis—that identify companies believed to have |
| | | | above-average growth prospects, particularly those in |
| | | | industries undergoing change. Focuses on mid- and |
| | | | large-capitalization companies with proven records of |
| | | | sales and earnings growth, profitability, and cash-flow |
| | | | generation. |
| Vanguard Quantitative Equity | 19 | 1,549 | Employs a quantitative, fundamental management |
| Group | | | approach, using models that assess valuation, growth |
| | | | prospects, management decisions, market sentiment, |
| |
| Jennison Associates LLC | 18 | 1,480 | Research-driven, fundamental investment approach |
| | | | that relies on in-depth company knowledge gleaned |
| | | | through meetings with management, customers, and |
| | | | suppliers. |
| Frontier Capital Management Co., | 10 | 851 | Research-driven, fundamental investment approach |
| LLC | | | that seeks companies with above-average growth |
| | | | prospects, reasonable valuations, and competitive |
| | | | advantages. |
| Kalmar Investment Advisers | 10 | 790 | Employs a “growth-with-value” strategy using creative, |
| | | | bottom-up research to uncover vigorously growing, |
| | | | high-quality businesses whose stocks can also be |
| | | | bought inefficiently valued. The strategy has a dual |
| | | | objective of strong returns with lower risk. |
| Cash Investments | 2 | 178 | These short-term reserves are invested by Vanguard in |
| | | | equity index products to simulate investments in |
| | | | stocks. Each advisor also may maintain a modest cash |
| | | | position. |
6
Wellington Management
Company, LLP
Portfolio Manager:
Paul E. Marrkand, CFA,
Senior Vice President
Our portion of the fund uses traditional methods of stock selection, including research and analysis, to identify companies that we believe have above-average growth prospects, particularly those in industries undergoing change. Research focuses on mid- and large-capitalization companies with a proven record of sales and earnings growth, profitability, and cash-flow generation.
Based on our growth, quality, and valuation investment process, our investment results for the fiscal half-year benefited primarily from purchase decisions made in late-2008 and early 2009. Our analysis identified numerous companies that offered extremely attractive risk/reward opportunities during that time of upheaval in the market.
New purchases over the period included investments in Amazon.com, SanDisk, General Electric, Las Vegas Sands, and Boeing. More specifically, Boeing continued to move forward successfully with flight tests of its new Dreamliner airplane. The company’s airplane production rate increased and will likely be maintained at a high rate for several years as airlines’ profitability improves and the Dreamliner enters full production in 2011. Las Vegas Sands continued to increase its sales volume at its Macau properties. We believe the company will sustain an above-average revenue growth rate with its new casino and retail complex in Singapore, scheduled to open in April 2010.
In addition, based on our scenario analysis, we increased our weighting in existing positions when their stock prices became very attractive. We added meaningfully to QLogic and Emulex, each of which contributed positively to performance over the last six months.
Unfortunately, we made decisions to initiate investments in certain companies and to add to certain existing positions that ultimately underperformed in the six-months just ended, including EMC, Intersil, Expedia, and NetEase.com. However, based on our growth, quality, and valuation process, we have added to these positions even though their stock prices declined, because we think they continue to offer attractive risk/reward opportunities.
7
Vanguard Quantitative
Equity Group
Portfolio Manager:
James P. Stetler, Principal
The U.S. equity market performed quite well for the fiscal half-year, rising more than 12% as the economy continued to exhibit signs of recovery, corporate earnings were stronger than anticipated, and more investors appeared to regain confidence in exposure to equities.
Volatility persisted in the investing mix, as not all news during the period was positive. The financial markets were upset by events such as China’s steps to slow its economy, Greece’s debt worries, and the uncertainty of health care and financial market regulation in the United States. Volatility in the U.S. markets could be with us for some time as the Federal Reserve begins to revise its credit policy and as employment and housing uncertainties remain. Growth stocks continued to outpace value-oriented, dividend-paying companies by more than 1 percentage point for the full six months, led by consumer discretionary and industrial companies. However, this trend was broken during the second three months as value outperformed growth by more than 2 percentage points.
Our quality and market-sentiment indicators were the best-performing components of our company evaluation process during the period. Our quality model separates cheap stocks that deserve their low valuation because of poor margins from their more profitable peers, while the market-sentiment model measures the market’s overall evaluation of a company’s value. Our valuation, growth, and management decisions models were neutral.
At the stock level, selection results were strongest in the technology, consumer staples, and financial sectors. Selections like Ford Motor, Berkshire Hathaway, Micron Technology, Apple, and Coca-Cola Enterprises led our relative results. On the other hand, our selection results in the industrial and energy sectors overall were detractors. We were underweighted in companies like Boeing, Visa, Medtronic, and Union Pacific, which held back our performance as those companies performed better than the market for the semiannual period.
8
Jennison Associates LLC
Portfolio Manager:
Kathleen A. McCarragher,
Managing Director
We build our portfolio from the bottom up, based on research of company fundamentals. During the most recent fiscal half-year, the portfolio benefited from strong stock selection in the information technology, consumer discretionary, and health care sectors.
Several technology holdings posted 25%-plus gains. Chinese-language Internet search engine Baidu reported strong results as advertising growth accelerated. We believe the Chinese search market is in its early growth stage, and we like Baidu’s improving execution and exploration of long-term monetization opportunities.
MasterCard and Visa saw improving payment-processing volumes. Both companies are benefiting as consumers continue their secular shift from paper money to electronic credit/debit transactions. VMware’s financial results beat expectations by wide margins. The firm’s software allows companies to more efficiently integrate and manage server, storage, and networking functions, thereby lowering their costs. Apple continues to be a prime beneficiary of the digitization of music, photos, and video because of its cutting-edge software for managing, editing, and sharing content. Its creativity and innovation in product design and marketing should continue to drive share gains.
In consumer discretionary, the secular movement toward e-commerce was again reflected in Amazon.com’s strong results and continued market-share gains. And in health care, generic drugmakers Mylan and Teva Pharmaceutical Industries were standout performers. Demand for generic medicines is climbing as consumers and governments scramble to contain costs.
A notable detractor from our results was Weatherford International, which reported disappointing earnings amid concerns that its largest project might be reevaluated by Mexico’s national oil company. We closed our position in the stock. Goldman Sachs and Morgan Stanley detracted from the return in financials.
The revenue gains of companies held in the portfolio continued to accelerate. We remain confident that our holdings will achieve better-than-average revenue growth this year.
9
Frontier Capital
Management Co., LLC
Portfolio Manager:
Stephen Knightly, CFA,
Senior Vice President
Trends that propelled a remarkable recovery in 2009 continued to provide a favorable 2010 backdrop: namely, strong corporate profits and improved global economic activity. Over the past six months, performance was led by the producer durables, energy, and telecommunication services sectors. Our team added to a number of producer durable holdings during late 2009 and early 2010, given unique opportunities in the transportation and capital goods sectors; both areas offered attractive valuations, appealing long-term demand, and ample margin opportunities.
With corporate balance sheets in solid shape (excluding financial firms, where cash is at a 25-year high), a strong case can be made for a U.S. economic recovery led by business rather than the consumer. However, over the short term, sharp market gains have come from depressed areas of consumer spending and related indebted financial institutions. Avoidance of such areas hindered the relative performance of the Russell Midcap Growth Index for the period.
Looking forward, with the global recovery well established, policymakers face the daunting task of withdrawing massive liquidity injected into the financial system, as well as tackling burdensome deficits. The question for investors will be “at what cost?” Difficult policy responses are apt to restrain valuations and curb growth.
As earnings growth becomes challenged, leadership is likely to move from the high-beta cyclicals to secular-growth-oriented companies. Such a transition has a strong precedent as cycles mature. Our portfolio is positioned to benefit from this shift, given its emphasis on companies with enduring secular demand, market-share opportunities in growth markets, and margin expansion beyond one-time cost-cutting. Many such opportunities are found in areas related to businesses’ productivity tools; hence, the portfolio is overweighted in select producer durables and technology companies.
10
Kalmar Investment Advisers
Portfolio Manager:
Ford B. Draper, Jr., President and
Chief Investment Officer
Over the last six months, both U.S. and foreign economies have strengthened, notably more than was anticipated a year ago. The U.S. recovery is broadening; employment is turning positive, and real gross domestic product should exceed its 2008 peak shortly. We believe the U.S. economy is moving into a sustainable expansion, as have a number of Asian and emerging-market economies. World stock markets anticipated these positive developments and, encouraged by them, have continued to move higher.
Accordingly, while staying focused on quality businesses and seeking companies with particular growth drivers and favorable internal initiatives not discounted in their stock prices, we have been increasing the portfolio’s economic sensitivity. Examples of more economically sensitive, genuine growth businesses that we have added are: Gentex, Juniper Networks, Darden Restaurants, Discovery Communications, and Airgas.
A pervasive trend since the market recovery began a full year ago has been the outperformance of low-quality, economically most threatened, smaller companies. These low-quality influences, while continuing longer than usual in this market cycle, and presenting a headwind to the relative returns of Kalmar’s high-quality management approach, also create opportunities. Specifically, we have been using the market’s distraction with such stocks to add and raise our exposure to classy businesses mining true secular-growth themes, including: Herbalife, Cooper Cos., ICON, Salesforce.com, Sysco, and Urban Outfitters.
For the fund’s fiscal half-year, in addition to the low-quality headwind, Kalmar was most negatively affected by the decline of natural gas prices on our exploration & production and oil-service holdings, even though reserve growth for the former continued robust. In addition, our holding in Corrections Corporation of America suffered as state budgetary problems produced fears of prison outsourcing cutbacks.
Befitting our bottom-up growth style, our biggest portfolio successes came from many different industries, including: F5 Networks, ResMed, Express Scripts, and Airgas, which recently became the subject of a takeover offer.
11
Morgan Growth Fund
Fund Profile
As of March 31, 2010
| | | |
| Share-Class Characteristics | | |
| | Investor | | Admiral |
| | Shares | | Shares |
| Ticker Symbol | VMRGX | | VMRAX |
| Expense Ratio1 | 0.48% | | 0.31% |
| 30-Day SEC | | | |
| Yield | 0.41% | | 0.59% |
| |
| Portfolio Characteristics | | |
| | | Russell | DJ |
| | | 3000 | U.S. Total |
| | | Growth | Market |
| | Fund | Index | Index |
| Number of Stocks | 338 | 1,887 | 4,159 |
| Median Market Cap $17.9B | $33.7B | $31.4B |
| Price/Earnings Ratio | 23.5x | 21.2x | 23.0x |
| Price/Book Ratio | 3.2x | 3.5x | 2.2x |
| Return on Equity | 22.2% | 24.0% | 19.1% |
| Earnings Growth Rate | 15.3% | 14.3% | 6.9% |
| Dividend Yield | 0.9% | 1.5% | 1.7% |
| Foreign Holdings | 3.9% | 0.0% | 0.0% |
| Turnover Rate | | | |
| (Annualized) | 61% | — | — |
| Short-Term Reserves | 1.5% | — | — |
Sector Diversification (% of equity exposure)
| | | |
| | | Russell | DJ |
| | | 3000 | U.S. Total |
| | | Growth | Market |
| | Fund | Index | Index |
| Consumer | | | |
| Discretionary | 14.6% | 11.4% | 11.0% |
| Consumer Staples | 3.7 | 14.9 | 9.8 |
| Energy | 6.1 | 3.9 | 10.0 |
| Financials | 6.1 | 5.2 | 17.3 |
| Health Care | 12.9 | 16.6 | 12.4 |
| Industrials | 12.0 | 10.9 | 10.9 |
| Information | | | |
| Technology | 40.7 | 31.9 | 18.5 |
| Materials | 2.4 | 3.7 | 4.0 |
| Telecommunication | | | |
| Services | 1.2 | 0.7 | 2.6 |
| Utilities | 0.3 | 0.8 | 3.5 |
| | |
| Volatility Measures | | |
| | | DJ |
| | | U.S. Total |
| | Russell 3000 | Market |
| | Growth Index | Index |
| R-Squared | 0.99 | 0.94 |
| Beta | 1.02 | 0.98 |
These measures show the degree and timing of the fund’s fluctuations compared with the indexes over 36 months.
Ten Largest Holdings (% of total net assets)
| | |
| Apple Inc. | Computer | |
| | Hardware | 3.4% |
| Microsoft Corp. | Systems Software | 3.2 |
| Cisco Systems Inc. | Communications | |
| | Equipment | 3.1 |
| Google Inc. Class A | Internet Software & | |
| | Services | 2.5 |
| International Business | Computer | |
| Machines Corp. | Hardware | 2.3 |
| Oracle Corp. | Systems Software | 1.6 |
| NetApp Inc. | Computer Storage | |
| | & Peripherals | 1.4 |
| Intel Corp. | Semiconductors | 1.4 |
| Goldman Sachs Group | Investment Banking | |
| Inc. | & Brokerage | 1.4 |
| Amazon.com Inc. | Internet Retail | 1.3 |
| Top Ten | | 21.6% |
The holdings listed exclude any temporary cash investments and equity index products.
Investment Focus
1 The expense ratios shown are from the prospectus dated January 26, 2010, and represent estimated costs for the current fiscal year based on the fund’s net assets as of the prospectus date. For the six months ended March 31, 2010, the annualized expense ratios were 0.49% for Investor Shares and 0.31% for Admiral Shares.
12
Morgan Growth Fund
Performance Summary
All of the returns in this report represent past performance, which is not a guarantee of future results that may be achieved by the fund. (Current performance may be lower or higher than the performance data cited. For performance data current to the most recent month-end, visit our website at www.vanguard.com/performance.) Note, too, that both investment returns and principal value can fluctuate widely, so an investor’s shares, when sold, could be worth more or less than their original cost. The returns shown do not reflect taxes that a shareholder would pay on fund distributions or on the sale of fund shares.
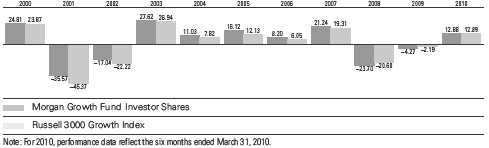
Fiscal-Year Total Returns (%): September 30, 1999, Through March 31, 2010
Average Annual Total Returns: Periods Ended March 31, 2010
| | | | |
| | Inception | One | Five | Ten |
| | Date | Year | Years | Years |
| Investor Shares | 12/31/1968 | 49.67% | 3.27% | -1.03% |
| Admiral Shares | 5/14/2001 | 49.93 | 3.45 | 1.881 |
| 1 Return since inception. | | | | |
Vanguard fund total returns do not include any transaction or account fees that applied in the periods shown. Fund prospectuses provide information about current fees.
See Financial Highlights for dividend and capital gains information.
13
Morgan Growth Fund
Financial Statements (unaudited)
Statement of Net Assets
As of March 31, 2010
The fund reports a complete list of its holdings in regulatory filings four times in each fiscal year, at the quarter-ends. For the second and fourth fiscal quarters, the lists appear in the fund’s semiannual and annual reports to shareholders. For the first and third fiscal quarters, the fund files the lists with the Securities and Exchange Commission on Form N-Q. Shareholders can look up the fund’s Forms N-Q on the SEC’s website at www.sec.gov. Forms N-Q may also be reviewed and copied at the SEC’s Public Reference Room (see the back cover of this report for further information).
| | | |
| | | | Market |
| | | | Value• |
| | | Shares | ($000) |
| Common Stocks (97.4%)1 | | |
| Consumer Discretionary (14.2%) | |
| * | Amazon.com Inc. | 821,972 | 111,566 |
| * | Starbucks Corp. | 3,457,944 | 83,924 |
| | TJX Cos. Inc. | 1,394,908 | 59,311 |
| | Omnicom Group Inc. | 1,183,136 | 45,917 |
| | Coach Inc. | 1,078,915 | 42,639 |
| * | Las Vegas Sands Corp. | 2,014,755 | 42,612 |
| | Home Depot Inc. | 1,304,800 | 42,210 |
| | Walt Disney Co. | 1,179,053 | 41,161 |
| | Ross Stores Inc. | 739,442 | 39,538 |
| | Expedia Inc. | 1,447,900 | 36,140 |
| * | Urban Outfitters Inc. | 946,154 | 35,982 |
| | McDonald’s Corp. | 498,119 | 33,234 |
| | NIKE Inc. Class B | 428,570 | 31,500 |
| * | LKQ Corp. | 1,433,851 | 29,107 |
| * | ITT Educational | | |
| | Services Inc. | 238,123 | 26,784 |
| | Advance Auto Parts Inc. | 637,676 | 26,731 |
| | DeVry Inc. | 393,310 | 25,644 |
| | Guess? Inc. | 532,878 | 25,035 |
| * | Apollo Group Inc. Class A | 403,666 | 24,741 |
| * | Kohl’s Corp. | 427,850 | 23,438 |
| | Tractor Supply Co. | 392,880 | 22,807 |
| ^ | Buckle Inc. | 570,341 | 20,966 |
| | American Eagle | | |
| | Outfitters Inc. | 1,109,850 | 20,554 |
| * | Dollar Tree Inc. | 332,660 | 19,700 |
| * | Ford Motor Co. | 1,457,300 | 18,318 |
| | Scripps Networks | | |
| | Interactive Inc. Class A | 386,539 | 17,143 |
| * | Bed Bath & Beyond Inc. | 383,300 | 16,773 |
| | Service Corp. International | 1,645,300 | 15,104 |
| * | Bally Technologies Inc. | 359,862 | 14,589 |
| | Chico’s FAS Inc. | 989,000 | 14,261 |
| * | O’Reilly Automotive Inc. | 327,810 | 13,673 |
| * | Discovery | | |
| | Communications Inc. | | |
| | Class A | 373,980 | 12,637 |
| * | GameStop Corp. Class A | 535,350 | 11,730 |
| | Abercrombie & Fitch Co. | 244,059 | 11,139 |
| | | |
| | | | Market |
| | | | Value• |
| | | Shares | ($000) |
| * | CarMax Inc. | 417,585 | 10,490 |
| | Gap Inc. | 451,100 | 10,425 |
| | Yum! Brands Inc. | 262,200 | 10,050 |
| | Darden Restaurants Inc. | 209,480 | 9,330 |
| | Gentex Corp. | 474,105 | 9,207 |
| * | WMS Industries Inc. | 200,900 | 8,426 |
| * | Harman International | | |
| | Industries Inc. | 180,000 | 8,420 |
| ^ | Garmin Ltd. | 204,500 | 7,869 |
| | DR Horton Inc. | 505,100 | 6,364 |
| | McGraw-Hill Cos. Inc. | 159,600 | 5,690 |
| * | DIRECTV Class A | 157,100 | 5,312 |
| | DISH Network Corp. | | |
| | Class A | 249,900 | 5,203 |
| | Target Corp. | 90,700 | 4,771 |
| | Comcast Corp. | 257,534 | 4,628 |
| | Williams-Sonoma Inc. | 170,200 | 4,475 |
| | Comcast Corp. Class A | 236,725 | 4,455 |
| | H&R Block Inc. | 120,400 | 2,143 |
| | Lowe’s Cos. Inc. | 73,900 | 1,791 |
| * | NVR Inc. | 700 | 509 |
| * | priceline.com Inc. | 1,500 | 382 |
| | Cablevision Systems Corp. | | |
| | Class A | 6,300 | 152 |
| | | | 1,176,700 |
| Consumer Staples (3.4%) | | |
| | Wal-Mart Stores Inc. | 796,100 | 44,263 |
| | Philip Morris | | |
| | International Inc. | 668,700 | 34,879 |
| | Colgate-Palmolive Co. | 369,900 | 31,538 |
| | Costco Wholesale Corp. | 489,000 | 29,198 |
| | PepsiCo Inc. | 327,200 | 21,648 |
| | Avon Products Inc. | 436,600 | 14,788 |
| | Herbalife Ltd. | 271,510 | 12,522 |
| | General Mills Inc. | 176,100 | 12,466 |
| | Mead Johnson | | |
| | Nutrition Co. | 224,900 | 11,702 |
| | Coca-Cola Enterprises Inc. | 405,400 | 11,213 |
| | Walgreen Co. | 281,800 | 10,452 |
| | Estee Lauder Cos. Inc. | | |
| | Class A | 153,000 | 9,925 |
14
| | | |
| Morgan Growth Fund | | |
| |
| |
| |
| | | | Market |
| | | | Value• |
| | | Shares | ($000) |
| * | Whole Foods Market Inc. | 227,500 | 8,224 |
| | Sysco Corp. | 253,160 | 7,468 |
| | CVS Caremark Corp. | 187,010 | 6,837 |
| | Dr Pepper Snapple | | |
| | Group Inc. | 163,600 | 5,754 |
| | Kimberly-Clark Corp. | 69,000 | 4,339 |
| | Procter & Gamble Co. | 51,936 | 3,286 |
| | Coca-Cola Co. | 57,478 | 3,161 |
| | Hormel Foods Corp. | 26,500 | 1,113 |
| | | | 284,776 |
| Energy (5.9%) | | |
| | Occidental Petroleum Corp. | 875,155 | 73,986 |
| | Schlumberger Ltd. | 908,000 | 57,622 |
| | Valero Energy Corp. | 1,829,318 | 36,038 |
| * | Oceaneering | | |
| | International Inc. | 521,154 | 33,088 |
| | Baker Hughes Inc. | 602,372 | 28,215 |
| * | Southwestern Energy Co. | 554,280 | 22,570 |
| * | Ultra Petroleum Corp. | 381,005 | 17,766 |
| | Noble Energy Inc. | 230,425 | 16,821 |
| | Smith International Inc. | 387,841 | 16,607 |
| * | Cameron | | |
| | International Corp. | 353,440 | 15,148 |
| | National Oilwell Varco Inc. | 290,800 | 11,801 |
| | Peabody Energy Corp. | 252,700 | 11,548 |
| * | Continental Resources Inc. | 271,200 | 11,540 |
| * | Concho Resources Inc. | 220,546 | 11,107 |
| * | Petrohawk Energy Corp. | 483,980 | 9,815 |
| | Noble Corp. | 233,000 | 9,744 |
| | Core Laboratories NV | 73,920 | 9,669 |
| | Massey Energy Co. | 171,747 | 8,981 |
| | Diamond Offshore | | |
| | Drilling Inc. | 98,100 | 8,712 |
| * | Pride International Inc. | 287,700 | 8,663 |
| | Murphy Oil Corp. | 149,900 | 8,423 |
| | EXCO Resources Inc. | 450,200 | 8,275 |
| | XTO Energy Inc. | 157,400 | 7,426 |
| * | FMC Technologies Inc. | 104,100 | 6,728 |
| * | Transocean Ltd. | 75,867 | 6,553 |
| * | InterOil Corp. | 89,400 | 5,793 |
| | Cabot Oil & Gas Corp. | 155,100 | 5,708 |
| | Tidewater Inc. | 117,700 | 5,564 |
| | Consol Energy Inc. | 128,600 | 5,486 |
| * | Weatherford | | |
| | International Ltd. | 290,380 | 4,605 |
| | Helmerich & Payne Inc. | 39,400 | 1,500 |
| | Anadarko Petroleum Corp. | 15,200 | 1,107 |
| | | | 486,609 |
| Exchange-Traded Fund (0.7%) | | |
| ^,2 | Vanguard Growth ETF | 1,044,900 | 58,040 |
| |
| Financials (5.8%) | | |
| | Goldman Sachs Group Inc. | 661,869 | 112,935 |
| | Lincoln National Corp. | 1,761,070 | 54,065 |
| | Morgan Stanley | 1,441,245 | 42,214 |
| | Franklin Resources Inc. | 288,300 | 31,972 |
| | | |
| | | | Market |
| | | | Value• |
| | | Shares | ($000) |
| | JPMorgan Chase & Co. | 591,700 | 26,479 |
| | State Street Corp. | 552,513 | 24,940 |
| | Itau Unibanco Holding | | |
| | SA ADR | 926,619 | 20,376 |
| | Wells Fargo & Co. | 609,358 | 18,963 |
| * | Affiliated Managers | | |
| | Group Inc. | 196,400 | 15,516 |
| | Waddell & | | |
| | Reed Financial Inc. | 430,075 | 15,500 |
| | Lazard Ltd. Class A | 418,770 | 14,950 |
| | Principal Financial | | |
| | Group Inc. | 408,200 | 11,924 |
| | Raymond James | | |
| | Financial Inc. | 443,200 | 11,851 |
| | T Rowe Price Group Inc. | 189,900 | 10,431 |
| | Aflac Inc. | 159,900 | 8,681 |
| | BlackRock Inc. | 37,800 | 8,231 |
| | Hudson City Bancorp Inc. | 579,500 | 8,206 |
| * | TD Ameritrade | | |
| | Holding Corp. | 373,600 | 7,121 |
| | Invesco Ltd. | 284,400 | 6,231 |
| | Northern Trust Corp. | 106,500 | 5,885 |
| * | CB Richard Ellis Group Inc. | | |
| | Class A | 333,100 | 5,280 |
| | US Bancorp | 191,000 | 4,943 |
| | American Express Co. | 108,200 | 4,464 |
| * | Berkshire Hathaway Inc. | | |
| | Class B | 51,750 | 4,206 |
| * | St. Joe Co. | 66,700 | 2,158 |
| | Public Storage | 16,300 | 1,499 |
| | Jefferies Group Inc. | 46,100 | 1,091 |
| | | | 480,112 |
| Health Care (12.5%) | | |
| * | Medco Health | | |
| | Solutions Inc. | 1,147,600 | 74,089 |
| | Medtronic Inc. | 1,596,227 | 71,878 |
| | Eli Lilly & Co. | 1,649,786 | 59,755 |
| | Baxter International Inc. | 824,872 | 48,008 |
| | Teva Pharmaceutical | | |
| | Industries Ltd. ADR | 736,600 | 46,465 |
| *,^ | Mylan Inc. | 2,004,200 | 45,515 |
| * | Gilead Sciences Inc. | 822,400 | 37,403 |
| * | Laboratory Corp. of | | |
| | America Holdings | 482,631 | 36,540 |
| * | Waters Corp. | 526,407 | 35,554 |
| | Shire PLC ADR | 435,487 | 28,725 |
| * | Express Scripts Inc. | 273,410 | 27,822 |
| * | Hospira Inc. | 490,701 | 27,798 |
| * | WellPoint Inc. | 420,149 | 27,049 |
| | Johnson & Johnson | 405,300 | 26,426 |
| * | Amgen Inc. | 424,700 | 25,380 |
| | CR Bard Inc. | 290,204 | 25,137 |
| | Alcon Inc. | 149,350 | 24,129 |
| | Abbott Laboratories | 397,530 | 20,942 |
| * | Illumina Inc. | 527,100 | 20,504 |
| | Perrigo Co. | 330,400 | 19,401 |
15
| | | |
| Morgan Growth Fund | | |
| |
| |
| |
| | | | Market |
| | | | Value• |
| | | Shares | ($000) |
| *,^ | QIAGEN NV | 816,700 | 18,776 |
| * | Vertex Pharmaceuticals Inc. | 435,800 | 17,811 |
| * | United Therapeutics Corp. | 296,900 | 16,427 |
| * | ResMed Inc. | 255,940 | 16,291 |
| * | Hologic Inc. | 866,613 | 16,067 |
| * | Covance Inc. | 244,800 | 15,028 |
| * | Varian Medical | | |
| | Systems Inc. | 243,500 | 13,473 |
| | McKesson Corp. | 202,700 | 13,321 |
| | Cooper Cos. Inc. | 337,280 | 13,113 |
| * | Thermo Fisher | | |
| | Scientific Inc. | 251,200 | 12,922 |
| * | ICON PLC ADR | 441,100 | 11,645 |
| * | Life Technologies Corp. | 216,771 | 11,331 |
| | Beckman Coulter Inc. | 172,400 | 10,827 |
| | Quest Diagnostics Inc. | 175,400 | 10,224 |
| * | Eclipsys Corp. | 502,359 | 9,987 |
| | Patterson Cos. Inc. | 319,900 | 9,933 |
| * | Intuitive Surgical Inc. | 27,790 | 9,675 |
| * | Catalyst Health | | |
| | Solutions Inc. | 226,163 | 9,359 |
| * | Cephalon Inc. | 130,180 | 8,824 |
| * | Edwards | | |
| | Lifesciences Corp. | 87,500 | 8,652 |
| * | Warner Chilcott PLC | | |
| | Class A | 335,900 | 8,582 |
| | UnitedHealth Group Inc. | 248,600 | 8,122 |
| * | Amylin | | |
| | Pharmaceuticals Inc. | 344,200 | 7,741 |
| | Merck & Co. Inc. | 187,266 | 6,994 |
| * | VCA Antech Inc. | 240,800 | 6,750 |
| * | ev3 Inc. | 350,971 | 5,566 |
| * | Myriad Genetics Inc. | 125,200 | 3,011 |
| * | Endo Pharmaceuticals | | |
| | Holdings Inc. | 81,500 | 1,931 |
| * | Biogen Idec Inc. | 30,200 | 1,732 |
| * | Lincare Holdings Inc. | 14,200 | 637 |
| * | Community Health | | |
| | Systems Inc. | 10,000 | 369 |
| | | | 1,033,641 |
| Industrials (11.6%) | | |
| | Caterpillar Inc. | 1,436,249 | 90,268 |
| | Boeing Co. | 996,978 | 72,391 |
| | Parker Hannifin Corp. | 757,219 | 49,022 |
| | General Electric Co. | 2,595,542 | 47,239 |
| | Cummins Inc. | 759,302 | 47,039 |
| | Ingersoll-Rand PLC | 1,106,659 | 38,589 |
| | Illinois Tool Works Inc. | 813,399 | 38,523 |
| | Raytheon Co. | 668,005 | 38,156 |
| | Dover Corp. | 774,493 | 36,208 |
| | Joy Global Inc. | 590,857 | 33,442 |
| | Southwest Airlines Co. | 2,455,652 | 32,464 |
| | Emerson Electric Co. | 545,991 | 27,485 |
| | AMETEK Inc. | 603,824 | 25,035 |
| | United Technologies Corp. | 336,000 | 24,733 |
| | Precision Castparts Corp. | 189,300 | 23,986 |
| | | |
| | | | Market |
| | | | Value• |
| | | Shares | ($000) |
| | Fastenal Co. | 456,090 | 21,888 |
| | FedEx Corp. | 213,892 | 19,978 |
| | Flowserve Corp. | 171,660 | 18,929 |
| | United Parcel Service Inc. | | |
| | Class B | 266,300 | 17,152 |
| * | BE Aerospace Inc. | 543,646 | 16,554 |
| | Pall Corp. | 397,352 | 16,089 |
| * | Chicago Bridge & | | |
| | Iron Co. NV | 672,700 | 15,647 |
| * | WABCO Holdings Inc. | 521,516 | 15,604 |
| | AO Smith Corp. | 276,139 | 14,517 |
| * | Aecom Technology Corp. | 420,108 | 11,918 |
| | Goodrich Corp. | 163,500 | 11,530 |
| | Lockheed Martin Corp. | 135,300 | 11,260 |
| * | IHS Inc. Class A | 205,350 | 10,980 |
| * | Stericycle Inc. | 186,900 | 10,186 |
| * | HUB Group Inc. Class A | 361,162 | 10,105 |
| | ITT Corp. | 173,700 | 9,312 |
| * | Corrections Corp. of | | |
| | America | 459,150 | 9,119 |
| | MSC Industrial Direct Co. | | |
| | Class A | 172,800 | 8,764 |
| * | McDermott | | |
| | International Inc. | 323,900 | 8,719 |
| * | Hertz Global Holdings Inc. | 792,100 | 7,913 |
| * | Foster Wheeler AG | 289,740 | 7,864 |
| | CH Robinson | | |
| | Worldwide Inc. | 138,500 | 7,735 |
| | Robert Half | | |
| | International Inc. | 242,900 | 7,391 |
| | Watsco Inc. | 108,900 | 6,194 |
| * | Navistar International Corp. | 132,400 | 5,922 |
| | Landstar System Inc. | 134,100 | 5,630 |
| | CLARCOR Inc. | 161,888 | 5,584 |
| | Republic Services Inc. | | |
| | Class A | 170,300 | 4,942 |
| * | Owens Corning | 166,800 | 4,243 |
| | JB Hunt Transport | | |
| | Services Inc. | 108,280 | 3,885 |
| | Honeywell | | |
| | International Inc. | 79,000 | 3,576 |
| | L-3 Communications | | |
| | Holdings Inc. | 32,300 | 2,960 |
| * | Alliant Techsystems Inc. | 27,300 | 2,219 |
| | Pitney Bowes Inc. | 81,700 | 1,998 |
| | Union Pacific Corp. | 22,600 | 1,657 |
| * | FTI Consulting Inc. | 29,000 | 1,140 |
| | Iron Mountain Inc. | 19,600 | 537 |
| | | | 964,221 |
| Information Technology (39.7%) | |
| * | Apple Inc. | 1,189,750 | 279,508 |
| | Microsoft Corp. | 9,043,297 | 264,697 |
| * | Cisco Systems Inc. | 9,923,189 | 258,301 |
| * | Google Inc. Class A | 360,977 | 204,678 |
| | International Business | | |
| | Machines Corp. | 1,486,270 | 190,614 |
16
| | | |
| Morgan Growth Fund | | |
| |
| |
| |
| | | | Market |
| | | | Value• |
| | | Shares | ($000) |
| | Oracle Corp. | 5,204,527 | 133,704 |
| * | NetApp Inc. | 3,608,542 | 117,494 |
| | Intel Corp. | 5,164,328 | 114,958 |
| * | Juniper Networks Inc. | 3,093,436 | 94,907 |
| | Hewlett-Packard Co. | 1,659,500 | 88,202 |
| * | EMC Corp. | 4,395,463 | 79,294 |
| | Xilinx Inc. | 2,800,538 | 71,414 |
| * | QLogic Corp. | 3,499,367 | 71,037 |
| | Visa Inc. Class A | 761,034 | 69,277 |
| * | eBay Inc. | 2,497,395 | 67,305 |
| | Altera Corp. | 2,655,630 | 64,558 |
| * | VMware Inc. Class A | 1,135,065 | 60,499 |
| | Mastercard Inc. Class A | 214,990 | 54,607 |
| * | SanDisk Corp. | 1,470,214 | 50,914 |
| | Intersil Corp. Class A | 2,833,548 | 41,823 |
| | Analog Devices Inc. | 1,441,265 | 41,537 |
| * | BMC Software Inc. | 1,057,164 | 40,172 |
| | QUALCOMM Inc. | 956,649 | 40,170 |
| * | Emulex Corp. | 2,890,874 | 38,391 |
| * | Check Point Software | | |
| | Technologies | 1,018,524 | 35,709 |
| * | Adobe Systems Inc. | 961,300 | 34,001 |
| * | Riverbed Technology Inc. | 1,190,977 | 33,824 |
| * | Alliance Data | | |
| | Systems Corp. | 506,130 | 32,387 |
| * | Cognizant Technology | | |
| | Solutions Corp. Class A | 609,700 | 31,082 |
| * | Dell Inc. | 2,034,686 | 30,541 |
| | Texas Instruments Inc. | 1,200,701 | 29,381 |
| * | Agilent Technologies Inc. | 838,000 | 28,819 |
| * | Skyworks Solutions Inc. | 1,661,900 | 25,926 |
| * | Hewitt Associates Inc. | | |
| | Class A | 635,687 | 25,288 |
| | Amphenol Corp. Class A | 535,010 | 22,572 |
| | Western Union Co. | 1,296,421 | 21,987 |
| * | Western Digital Corp. | 549,900 | 21,441 |
| * | Equinix Inc. | 210,900 | 20,529 |
| * | Marvell Technology | | |
| | Group Ltd. | 997,900 | 20,337 |
| * | Baidu Inc. ADR | 32,888 | 19,634 |
| * | Netease.com ADR | 488,922 | 17,342 |
| *,^ | Shanda Interactive | | |
| | Entertainment Ltd. ADR | 384,749 | 16,771 |
| * | Longtop Financial | | |
| | Technologies Ltd. ADR | 474,448 | 15,282 |
| * | Atheros | | |
| | Communications Inc. | 383,996 | 14,864 |
| * | F5 Networks Inc. | 237,970 | 14,638 |
| | Tyco Electronics Ltd. | 524,888 | 14,424 |
| * | Seagate Technology | 760,100 | 13,879 |
| | Broadcom Corp. Class A | 408,400 | 13,551 |
| | Tencent Holdings Ltd. ADR | 633,700 | 12,706 |
| * | Symantec Corp. | 663,600 | 11,228 |
| | Fidelity National | | |
| | Information Services Inc. | 424,980 | 9,962 |
| * | Rovi Corp. | 266,020 | 9,877 |
| | | |
| | | | Market |
| | | | Value• |
| | | Shares | ($000) |
| * | Sybase Inc. | 210,800 | 9,827 |
| * | Micron Technology Inc. | 942,900 | 9,797 |
| | Applied Materials Inc. | 653,160 | 8,805 |
| | Solera Holdings Inc. | 223,505 | 8,638 |
| * | Avago Technologies Ltd. | 417,740 | 8,589 |
| * | Nuance | | |
| | Communications Inc. | 516,040 | 8,587 |
| * | Sohu.com Inc. | 146,856 | 8,018 |
| * | Microsemi Corp. | 454,500 | 7,881 |
| * | Amdocs Ltd. | 260,300 | 7,838 |
| | CA Inc. | 328,000 | 7,698 |
| * | FLIR Systems Inc. | 271,900 | 7,668 |
| * | Genpact Ltd. | 452,610 | 7,590 |
| * | Intuit Inc. | 217,000 | 7,452 |
| | Jabil Circuit Inc. | 443,963 | 7,188 |
| * | McAfee Inc. | 151,300 | 6,072 |
| * | Polycom Inc. | 190,420 | 5,823 |
| | Tellabs Inc. | 766,790 | 5,805 |
| * | Red Hat Inc. | 168,900 | 4,944 |
| * | Salesforce.com Inc. | 56,105 | 4,177 |
| | ADTRAN Inc. | 152,800 | 4,026 |
| * | VeriSign Inc. | 153,400 | 3,990 |
| * | Teradata Corp. | 111,700 | 3,227 |
| * | ON Semiconductor Corp. | 341,300 | 2,730 |
| * | Flextronics | | |
| | International Ltd. | 287,272 | 2,252 |
| | Global Payments Inc. | 6,100 | 278 |
| | | | 3,294,943 |
| Materials (2.3%) | | |
| | Nucor Corp. | 960,784 | 43,600 |
| | Albemarle Corp. | 678,400 | 28,920 |
| | Freeport-McMoRan | | |
| | Copper & Gold Inc. | 205,800 | 17,192 |
| | Celanese Corp. Class A | 441,200 | 14,052 |
| | Southern Copper Corp. | 416,702 | 13,197 |
| | Newmont Mining Corp. | 213,500 | 10,874 |
| | International Paper Co. | 364,000 | 8,958 |
| * | Crown Holdings Inc. | 316,500 | 8,533 |
| | Praxair Inc. | 101,900 | 8,458 |
| | Airgas Inc. | 115,790 | 7,367 |
| | Allegheny Technologies Inc. | 134,000 | 7,235 |
| * | Owens-Illinois Inc. | 177,800 | 6,319 |
| | Ecolab Inc. | 115,400 | 5,072 |
| | Walter Energy Inc. | 45,400 | 4,189 |
| | Monsanto Co. | 44,257 | 3,161 |
| * | Pactiv Corp. | 107,000 | 2,694 |
| | FMC Corp. | 13,400 | 811 |
| | AK Steel Holding Corp. | 13,700 | 313 |
| | | | 190,945 |
| Telecommunication Services (1.1%) | |
| * | American Tower Corp. | | |
| | Class A | 1,317,645 | 56,145 |
| * | NII Holdings Inc. | 347,500 | 14,477 |
| * | NeuStar Inc. Class A | 465,750 | 11,737 |
| | Brasil Telecom SA ADR | 375,592 | 7,170 |
17
| | | |
| Morgan Growth Fund | | |
| |
| |
| |
| | | | Market |
| | | | Value• |
| | | Shares | ($000) |
| | Millicom International | | |
| | Cellular SA | 44,150 | 3,936 |
| | | | 93,465 |
| Utilities (0.2%) | | |
| * | AES Corp. | 1,557,170 | 17,129 |
| Total Common Stocks | | |
| (Cost $6,393,744) | | 8,080,581 |
| Temporary Cash Investments (3.9%)1 | |
| Money Market Fund (3.6%) | | |
| 3,4 | Vanguard Market Liquidity | |
| | Fund, 0.183% | 296,199,783 | 296,200 |
| |
| | | Face | |
| | | Amount | |
| | | ($000) | |
| Repurchase Agreement (0.2%) | |
| | Banc of America | | |
| | Securities, LLC | | |
| | 0.020%, 4/1/10 (Dated | | |
| | 3/31/10, Repurchase Value | |
| | $18,900,000, collateralized | |
| | by Government National | |
| | Mortgage Assn. 6.000%, | |
| | 9/15/39) | 18,900 | 18,900 |
| |
| U.S. Government and Agency Obligations (0.1%) |
| 5,6 | Fannie Mae Discount Notes, | |
| | 0.300%, 9/8/10 | 2,000 | 1,998 |
| 5,6 | Freddie Mac Discount Notes, | |
| | 0.320%, 9/7/10 | 1,500 | 1,498 |
| 5,6 | Freddie Mac Discount Notes, | |
| | 0.320%, 9/20/10 | 500 | 499 |
| 5,6 | Freddie Mac Discount Notes, | |
| | 0.245%, 9/21/10 | 8,000 | 7,989 |
| | | | 11,984 |
| Total Temporary Cash Investments | |
| (Cost $327,085) | | 327,084 |
| |
| | Market |
| | Value• |
| | ($000) |
| Total Investments (101.3%) | |
| (Cost $6,720,829) | 8,407,665 |
| Other Assets and Liabilities (-1.3%) | |
| Other Assets | 41,786 |
| Liabilities4 | (149,601) |
| | (107,815) |
| Net Assets (100%) | 8,299,850 |
| |
| |
| At March 31, 2010, net assets consisted of: |
| | Amount |
| | ($000) |
| Paid-in Capital | 8,803,620 |
| Overdistributed Net Investment Income | (5,629) |
| Accumulated Net Realized Losses | (2,187,289) |
| Unrealized Appreciation (Depreciation) | |
| Investment Securities | 1,686,836 |
| Futures Contracts | 2,312 |
| Net Assets | 8,299,850 |
| |
| |
| Investor Shares—Net Assets | |
| Applicable to 359,090,508 outstanding | |
| $.001 par value shares of beneficial | |
| interest (unlimited authorization) | 5,762,332 |
| Net Asset Value Per Share— | |
| Investor Shares | $16.05 |
| |
| |
| Admiral Shares—Net Assets | |
| Applicable to 50,996,542 outstanding | |
| $.001 par value shares of beneficial | |
| interest (unlimited authorization) | 2,537,518 |
| Net Asset Value Per Share— | |
| Admiral Shares | $49.76 |
• See Note A in Notes to Financial Statements.
* Non-income-producing security.
^ Part of security position is on loan to broker-dealers. The total value of securities on loan is $87,708,000.
1 The fund invests a portion of its cash reserves in equity markets through the use of index futures contracts. After giving effect to futures investments, the fund’s effective common stock and temporary cash investment positions represent 98.7% and 2.6%, respectively, of ne t assets.
2 Considered an affiliated company of the fund as the issuer is another member of The Vanguard Group.
3 Affiliated money market fund available only to Vanguard funds and certain trusts and accounts managed by Vanguard. Rate shown is the 7-day yield.
4 Includes $90,985,000 of collateral received for securities on loan.
5 The issuer operates under a congressional charter; its securities are not backed by the full faith and credit of the U.S. government.
6 Securities with a value of $11,984,000 have been segregated as initial margin for open futures contracts.
ADR—American Depositary Receipt.
See accompanying Notes, which are an integral part of the Financial Statements.
18
| |
| Morgan Growth Fund | |
| |
| |
| Statement of Operations | |
| |
| | Six Months Ended |
| | March 31, 2010 |
| | ($000) |
| Investment Income | |
| Income | |
| Dividends1,2 | 41,501 |
| Interest2 | 231 |
| Security Lending | 1,465 |
| Total Income | 43,197 |
| Expenses | |
| Investment Advisory Fees—Note B | |
| Basic Fee | 6,284 |
| Performance Adjustment | 718 |
| The Vanguard Group—Note C | |
| Management and Administrati ve—Investor Shares | 7,673 |
| Management and Administrati ve—Admiral Shares | 1,181 |
| Marketing and Distribution& #151;Investor Shares | 573 |
| Marketing and Distribution& #151;Admiral Shares | 290 |
| Custodian Fees | 60 |
| Shareholders’ Reports—Investor Shares | 49 |
| Shareholders’ Reports—Admiral Shares | 19 |
| Trustees’ Fees and Expenses | 8 |
| Total Expenses | 16,855 |
| Expenses Paid Indirectly | (357) |
| Net Expenses | 16,498 |
| Net Investment Income | 26,699 |
| Realized Net Gain (Loss) | |
| Investment Securities Sold2 | 191,256 |
| Futures Contracts | 17,449 |
| Foreign Currencies | 8 |
| Realized Net Gain (Loss) | 208,713 |
| Change in Unrealized Appreciation (Depreciation) | |
| Investment Securities | 724,209 |
| Futures Contracts | (3,361) |
| Foreign Currencies | (7) |
| Change in Unrealized Appreciation (Depreciation) | 720,841 |
| Net Increase (Decrease) in Net Assets Resulting from Operations | 956,253 |
1 Dividends are net of foreign withholding taxes of $164,000.
2 Dividend income, interest income, and realized net gain (loss) from affiliated companies of the fund were $339,000, $190,000, and $0, respectively.
See accompanying Notes, which are an integral part of the Financial Statements.
19
| | |
| Morgan Growth Fund | | |
| |
| |
| Statement of Changes in Net Assets | | |
| |
| | Six Months Ended | Year Ended |
| | March 31, | September 30, |
| | 2010 | 2009 |
| | ($000) | ($000) |
| Increase (Decrease) in Net Assets | | |
| Operations | | |
| Net Investment Income | 26,699 | 62,567 |
| Realized Net Gain (Loss) | 208,713 | (1,995,393) |
| Change in Unrealized Appreciation (Depreciation) | 720,841 | 1,591,889 |
| Net Increase (Decrease) in Net Assets Resulting from Operations | 956,253 | (340,937) |
| Distributions | | |
| Net Investment Income | | |
| Investor Shares | (39,716) | (50,414) |
| Admiral Shares | (20,471) | (27,239) |
| Realized Capital Gain | | |
| Investor Shares | — | — |
| Admiral Shares | — | — |
| Total Distributions | (60,187) | (77,653) |
| Capital Share Transactions | | |
| Investor Shares | (102,468) | 96,224 |
| Admiral Shares | 16,269 | (117,934) |
| Net Increase (Decrease) from Capital Share Transactions | (86,199) | (21,710) |
| Total Increase (Decrease) | 809,867 | (440,300) |
| Net Assets | | |
| Beginning of Period | 7,489,983 | 7,930,283 |
| End of Period1 | 8,299,850 | 7,489,983 |
1 Net Assets—End of Period includes undistributed (overdistributed) net investment income of ($5,629,000) and $27,851,000.
See accompanying Notes, which are an integral part of the Financial Statements.
20
| | | | | | |
| Morgan Growth Fund | | | | | | |
| |
| |
| Financial Highlights | | | | | | |
| |
| |
| Investor Shares | | | | | | |
| | Six Months | | | | | |
| | Ended | | | | | |
| For a Share Outstanding | March 31, | | | Year Ended September 30, |
| Throughout Each Period | 2010 | 2009 | 2008 | 2007 | 2006 | 2005 |
| Net Asset Value, Beginning of Period | $14.32 | $15.15 | $21.45 | $18.34 | $17.04 | $14.77 |
| Investment Operations | | | | | | |
| Net Investment Income | .048 | .114 | .148 | .207 | .165 | .129 |
| Net Realized and Unrealized Gain (Loss) | | | | | | |
| on Investments | 1.792 | (.804) | (4.912) | 3.604 | 1.230 | 2.246 |
| Total from Investment Operations | 1.840 | (.690) | (4.764) | 3.811 | 1.395 | 2.375 |
| Distributions | | | | | | |
| Dividends from Net Investment Income | (.110) | (.140) | (.175) | (.204) | (.095) | (.105) |
| Distributions from Realized Capital Gains | — | — | (1.361) | (.497) | — | — |
| Total Distributions | (.110) | (.140) | (1.536) | (.701) | (.095) | (.105) |
| Net Asset Value, End of Period | $16.05 | $14.32 | $15.15 | $21.45 | $18.34 | $17.04 |
| |
| Total Return1 | 12.88% | -4.27% | -23.70% | 21.24% | 8.20% | 16.12% |
| |
| Ratios/Supplemental Data | | | | | | |
| Net Assets, End of Period (Millions) | $5,762 | $5,239 | $5,418 | $6,590 | $5,171 | $4,539 |
| Ratio of Total Expenses to | | | | | | |
| Average Net Assets2 | 0.49%3 | 0.48% | 0.38% | 0.37% | 0.42% | 0.41% |
| Ratio of Net Investment Income to | | | | | | |
| Average Net Assets | 0.62%3 | 0.94% | 0.80% | 1.06% | 0.95% | 0.82% |
| Portfolio Turnover Rate | 61%3 | 87% | 88% | 79% | 90% | 88% |
1 Total returns do not include the account service fee that may be applicable to certain accounts with balances below $10,000.
2 Includes performance-based investment advisory fee increases (decreases) of 0.02%, 0.02%, 0.00%, 0.00%, 0.02% and 0.00%.
3 Annualized.
See accompanying Notes, which are an integral part of the Financial Statements.
21
| | | | | | | |
| Morgan Growth Fund | | | | | | | |
| |
| |
| Financial Highlights | | | | | | |
| |
| |
| Admiral Shares | | | | | | | |
| | Six Months | | | | | |
| | | Ended | | | | | |
| For a Share Outstanding | March 31, | | | Year Ended September 30, |
| Throughout Each Period | | 2010 | 2009 | 2008 | 2007 | 2006 | 2005 |
| Net Asset Value, Beginning of Period | $44.42 | $47.03 | $66.58 | $56.94 | $52.91 | $45.84 |
| Investment Operations | | | | | | | |
| Net Investment Income | | .191 | .414 | .555 | .742 | .620 | .500 |
| Net Realized and Unrealized Gain (Loss) | | | | | | |
| on Investments | | 5.555 | (2.502) | (15.244) | 11.184 | 3.808 | 6.956 |
| Total from Investment Operations | | 5.746 | (2.088) | (14.689) | 11.926 | 4.428 | 7.456 |
| Distributions | | | | | | | |
| Dividends from Net Investment Income | (.406) | (.522) | (.641) | (.745) | (.398) | (.386) |
| Distributions from Realized Capital Gains | — | — | (4.220) | (1.541) | — | — |
| Total Distributions | | (.406) | (.522) | (4.861) | (2.286) | (.398) | (.386) |
| Net Asset Value, End of Period | | $49.76 | $44.42 | $47.03 | $66.58 | $56.94 | $52.91 |
| |
| Total Return | | 12.97% | -4.09% | -23.57% | 21.43% | 8.39% | 16.32% |
| |
| Ratios/Supplemental Data | | | | | | | |
| Net Assets, End of Period (Millions) | $2,538 | $2,251 | $2,512 | $2,683 | $1,691 | $1,110 |
| Ratio of Total Expenses to | | | | | | | |
| Average Net Assets1 | | 0.31%2 | 0.31% | 0.21% | 0.21% | 0.23% | 0.24% |
| Ratio of Net Investment Income to | | | | | | | |
| Average Net Assets | | 0.80%2 | 1.11% | 0.97% | 1.22% | 1.14% | 0.96% |
| Portfolio Turnover Rate | | 61%2 | 87% | 88% | 79% | 90% | 88% |
1 Includes performance-based investment advisory fee increases (decreases) of 0.02%, 0.02%, 0.00%, 0.00%, 0.02% and 0.00%.
2 Annualized.
See accompanying Notes, which are an integral part of the Financial Statements.
22
Morgan Growth Fund
Notes to Financial Statements
Vanguard Morgan Growth Fund is registered under the Investment Company Act of 1940 as an openend investment company, or mutual fund. The fund offers two classes of shares: Investor Shares and
Admiral Shares. Investor Shares are available to any investor who meets the fund’s minimum purchase requirements. Admiral Shares are designed for investors who meet certain administrative, service, tenure, and account-size criteria.
A. The following significant accounting policies conform to generally accepted accounting principles for U.S. mutual funds. The fund consistently follows such policies in preparing its financial statements.
1. Security Valuation: Securities are valued as of the close of trading on the New York Stock Exchange (generally 4 p.m., Eastern time) on the valuation date. Equity securities are valued at the latest quoted sales prices or official closing prices taken from the primary market in which each security trades; such securities not traded on the valuation date are valued at the mean of the latest quoted bid and asked prices. Securities for which market quotations are not readily available, or whose values have been affected by events occurring before the fund’s pricing time but after the close of the securities’ primary markets, are valued at their fair values calculated according to procedures adop ted by the board of trustees. These procedures include obtaining quotations from an independent pricing service, monitoring news to identify significant market- or security-specific events, and evaluating changes in the values of foreign market proxies (for example, ADRs, futures contracts, or exchange-traded funds), between the time the foreign markets close and the fund’s pricing time. When fair-value pricing is employed, the prices of securities used by a fund to calculate its net asset value may differ f rom quoted or published prices for the same securities. Investments in Vanguard Market Liquidity Fund are valued at that fund’s net asset value. Temporary cash investments acquired over 60 days to maturity are valued using the latest bid prices or using valuations based on a matrix system (which considers such factors as security prices, yields, maturities, and ratings), both as furnished by independent pricing services. Other temporary cash investments are valued at amortized cost, which approximates market value.
2. Foreign Currency: Securities and other assets and liabilities denominated in foreign currencies are translated into U.S. dollars using exchange rates obtained from an independent third party as of the fund’s pricing time on the valuation date. Realized gains (losses) and unrealized appreciation (depreciation) on investment securities include the effects of changes in exchange rates since the securities were purchased, combined with the effects of changes in security prices. Fluctuations in the value of other assets and liabilities resulting from changes in exchange rates are recorded as unrealized foreign currency gains (losses) until the assets or liabilities are settled in cash, at which tim e they are recorded as realized foreign currency gains (losses).
3. Futures Contracts: The fund uses index futures contracts to a limited extent, with the objective of maintaining full ex posure to the stock market while maintaining liquidity. The fund may purchase or sell futures contracts to achieve a desired level of investment, whether to accommodate portfolio turnover or cash flows from capital share transactions. The primary risks associated with the use of futures contracts are imperfect correlation between changes in market values of stocks held by the fund and the prices of futures contracts, and the possibility of an illiquid market.
Futures contracts are valued at their quoted daily settlement prices. The aggregate principal amounts of the contracts are not recorded in the Statement of Net Assets. Fluctuations in the value of the contracts are recorded in the Statement of Net Assets as an asset (liability) and in the Statement of Operations as unrealized appreciation (depreciation) until the contracts are closed, when they are recorded as realized futures gains (losses).
23
Morgan Growth Fund
4. Repurchase Agreements: The fund may invest in repurchase agreements. Securities pledged as collateral for repurchase agreements are held by a custodian bank until the agreements mature. Eac h agreement requires that the market value of the collateral be sufficient to cover payments of interest and principal; however, in the event of default or bankruptcy by the other party to the agreement, retention of the collateral may be subject to legal proceedings.
5. Federal Income Taxes: The fund intends to continue to qualify as a regulated investment company and distribute all of its taxable income. Management has analyzed the fund’s tax positions taken for all open federal income tax years (September 30, 2006–2009), and for the period ended March 31, 2010, and has concluded that no provision for federal income tax is required in the fund’s financial statements.
6. Distributions: Distributions to shareholders are recorded on the ex-dividend date.
7. Security Lending: The fund may lend its securities to qualified institutional borrowers to earn additional income. Security loans are required to be secured at all times by collateral at least equal to the market value of securities loaned. The fund invests cash collateral received in Vanguard Market Liquidity Fund, and records a liability for the return of the collateral, during the period the securities are on loan. Security lending income represents the income earned on investing c ash collateral, less expenses associated with the loan.
8. Other: Dividend income is recorded on the ex-dividend date. Interest income includes income distributions received from Vanguard Market Liquidity Fund and is accrued daily. Security transactions are accounted for on the date securities are bought or sold. Costs used to determine realized gains (losses) on the sale of investment securities are those of the specific securities sold.
Each class of shares has equal rights as to assets and earnings, except that each class separately bears certain class-specific expenses related to maintenance of shareholder accounts (included in Management and Administrative expenses) and shareholder reporting. Marketing and distribution expenses are allocated to each class of shares based on a method approved by the board of trustees. Income, other non-class-specific expenses, and gains and losses on investments are allocated to each class of shares based on its relative net assets.
B. Wellington Management Company, LLP ,Jennison Associates LLC, Frontier Capital Management Co., LLC, and Kalmar Investment Advisers each provide investment advisory services to a portion of the fund for a fee calculated at an annual percentage rate of average net assets managed by the advisor. The basic fee of Wellington Management Company, LLP, is subj ect to quarterly adjustments based on performance for the preceding three years relative to the Russell 3000 Growth Index. The basic fee of Jennison Associates LLC is subject to quarterly adjustments based on performance for the preceding three years relative to the Russell 1000 Growth Index. The basic fees of Frontier Capital Management Co., LLC, and Kalmar Investment Advisers are subject to quarterly adjustments based on performance since December 31, 2008, relative to the Russell Midcap Growth Index.
The Vanguard Group provides investment advisory services to a portion of the fund on an at-cost basis; the fund paid Vanguard advisory fees of $501,000 for the six months ended March 31, 2010.
For the six months ended March 31, 2010, the aggregate investment advisory fee represented an effective annual basic rate of 0.16% of the fund’s average net assets, before an increase of $718,000 (0.02%) based on performance.
24
Morgan Growth Fund
C. The Vanguard Group furnishes at cost corporate management, administrative, marketing, and distribution services. The costs of such services are allocated to the fund under methods approved by the board of trustees. The fund has committed to provide up to 0.40% of its net assets in capital contributions to Vanguard. At March 31, 2010, the fund had contributed capital of $1,552,000 to Vanguard (included in Other Assets), representing 0.02% of the fund’s net assets and 0.62% of Vanguard’s capitalization. The fund’s trustees and officers are also directors and officers of Vanguard.
D. The fund has asked its investment advisors to direct certain security trades, subject to obtaining the best price and execution, to brokers who have agreed to rebate to the fund part of the commissions generated. Such rebates are used solely to reduce the fund’s management and administrative expenses. For the six months ended March 31, 2010, these arrangements reduced the fund’s expenses by $357,000 (an annual rate of 0.01% of average net assets).
E. Various inputs may be used to determine the value of the fund’s investments. These inputs are summarized in three broad levels for financial statement purposes. The inputs or methodologies used to value securities are not necessarily an indication of the risk associated with investing in those securities.
Level 1—Quoted prices in active markets for identical securities.
Level 2—Other significant observable inputs (including quo ted prices for similar securities, interest rates, prepayment speeds, credit risk, etc.).
Level 3—Significant unobservable inputs (including the fund’s own assumptions used to determine the fair value of investments).
The following table summarizes the fund’s investments as of March 31, 2010, based on the inputs used to value them:
| | | |
| | Level 1 | Level 2 | Level 3 |
| Investments | ($000) | ($000) | ($000) |
| Common Stocks | 8,080,581 | — | — |
| Temporary Cash Investments | 296,200 | 30,884 | — |
| Futures Contracts—Liabilities1 | (443) | — | — |
| Total | 8,376,338 | 30,884 | — |
1 Represents variation margin on the last day of the reporting period.
F. At March 31, 2010, the aggregate settlement value of open futures contracts and the related unrealized appreciation (depreciation) were:
| | | | |
| | | | | ($000) |
| | | Number of | Aggregate | Unrealized |
| | | Long (Short) | Settlement | Appreciation |
| Futures Contracts | Expiration | Contracts | Value | (Depreciation) |
| S&P 500 Index | June 2010 | 382 | 111,277 | 2,323 |
| E-mini S&P 500 Index | June 2010 | 50 | 2,913 | (11) |
Unrealized appreciation (depreciation) on open futures contracts is required t o be treated as realized gain (loss) for tax purposes.
25
Morgan Growth Fund
G. Distributions are determined on a tax basis and may differ from net investment in come and realized capital gains f or financial reporting purposes. Differences may be permanent or temporary. Permanent differences are reclassified among capital acc ounts in the financial statements to reflect their tax character. Temporary differences arise when certain items of income, expense, gain, or loss are recognized in different periods for financial statement and tax purposes; these differences will reverse at some time in the future. Differences in classification may also result from the treatment of shor t-term gains as ordinary income for tax purposes.
During the six months ended March 31, 2010, the fund realized net foreign currency gains of $8,000, which increased distributable net income for tax purposes; accordingly, such gains have been reclassified from accumulated net realized losses to overdistributed net investment income.
The fund’s tax-basis capital gains and losses are determined only at the end of each fiscal year. For tax purposes, at September 30, 2009, the fund had available capital loss carryforwards totaling $879,082,000 to offset future net capital gains through September 30, 2017. In addition, the fund realized losses of $1,504,330,000 during the period from November 1, 2008, through September 30, 2009, which are deferred and will be treated as realized for tax purposes in fiscal 2010. The fund will use these capital losses to offset net taxable capital gains, if any, realized during the year ending September 30, 2010; should the fund realize net capital losses for the year, the losses will be added to the loss carryforward balance above.
At March 31, 2010, the cost of investment securities for tax purposes was $6,720,829,000. Net unrealized appreciation of investment securities for tax purposes was $1,686,836,000, consisting of unrealized gains of $1,779,807,000 on securities that had risen in value since their purchase and $92,971,000 in unrealized losses on securities that had fallen in value since their purchase.
H. During the six months ended March 31, 2010, the fund purchased $2,286,352,000 of investment securities and sold $2,375,298,000 of investment securities, other than temporary cash investments.
| | | | |
| I. Capital share transactions for each class of shares were: | | | |
| | Six Months Ended | | Year Ended |
| | March 31, 2010 | September 30, 2009 |
| | Amount | Shares | Amount | Shares |
| | ($000) | (000) | ($000) | (000) |
| Investor Shares | | | | |
| Issued | 317,299 | 21,076 | 838,795 | 70,793 |
| Issued in Lieu of Cash Distributions | 38,553 | 2,500 | 48,928 | 4,472 |
| Redeemed | (458,320) | (30,421) | (791,499) | (67,053) |
| Net Increase (Decrease)—Investor Shares | (102,468) | (6,845) | 96,224 | 8,212 |
| Admiral Shares | | | | |
| Issued | 202,418 | 4,319 | 371,510 | 10,237 |
| Issued in Lieu of Cash Distributions | 17,395 | 364 | 22,380 | 660 |
| Redeemed | (203,544) | (4,363) | (511,824) | (13,638) |
| Net Increase (Decrease)—Admiral Shares | 16,269 | 320 | (117,934) | (2,741) |
J. In preparing the financial statements as of March 31, 2010, management considered the impact of subsequent events for potential recognition or disclosure in these financial statements.
26
About Your Fund’s Expenses
As a shareholder of the fund, you incur ongoing costs, which include costs for portfolio management, administrative services, and shareholder reports (like this one), among others. Operating expenses, which are deducted from a fund’s gross income, directly reduce the investment return of the fund.
A fund’s expenses are expressed as a percentage of its average net assets. This figure is known as the expense ratio. The following examples are intended to help you understand the ongoing costs (in dollars) of investing in your fund and to compare these costs with those of other mutual funds. The examples are based on an investment of $1,000 made at the beginning of the period shown and held for the entire period.
The accompanying table illustrates your fund’s costs in two ways:
• Based on actual fund return. This section helps you to estimate the actual expenses that you paid over the period. The ”Ending Account Value“ shown is derived from the fund‘s actual return, and the third column shows the dollar amount that would have been paid by an investor who started with $1,000 in the fund. You may use the information here, together with the amount you invested, to estimate the expenses that you paid over the period.
To do so, simply divide your account value by $1,000 (for example, an $8,600 account value divided by $1,000 = 8.6), then multiply the result by the number given for your fund under the heading ”Expenses Paid During Period.“
• Based on hypothetical 5% yearly return. This section is intended to help you compare your fund‘s costs with those of other mutual funds. It assumes that the fund had a yearly return of 5% before expenses, but that the expense ratio is unchanged. In this case—because the return used is not the fund’s actual return—the results do not apply to your investment. The example is useful in making comparisons because the Securities and Exchange Commission requires all mutual funds to calculate expenses based on a 5% return. You can assess your fund’s costs by comparing this hypothetical example with the hypothetical examples that appear in shareholder reports of other funds.
Note that the expenses shown in the table are meant to highlight and help you compare ongoing costs only and do not reflect transaction costs incurred by the fund for buying and selling securities. Further, the expenses do not include the account service fee described in the prospectus. If such a fee were applied to your account, your costs would be higher. Your fund does not charge transaction fees, such as purchase or redemption fees, nor does it carry a “sales load.” The calculations assume no shares were bought or sold during the period. Your actual costs may have been higher or lower, depending on the amount of your investment and the timing of any purchases or redemptions.
You can find more information about the fund’s expenses, including annual expense ratios, in the Financial Statements section of this report. For additional information on operating expenses and other shareholder costs, please refer to your fund’s current prospectus.
27
| | | |
| Six Months Ended March 31, 2010 | | | |
| | Beginning | Ending | Expenses |
| | Account Value | Account Value | Paid During |
| Morgan Growth Fund | 9/30/2009 | 3/31/2010 | Period |
| Based on Actual Fund Return | | | |
| Investor Shares | $1,000.00 | $1,128.81 | $2.60 |
| Admiral Shares | 1,000.00 | 1,129.73 | 1.65 |
| Based on Hypothetical 5% Yearly Return | | | |
| Investor Shares | $1,000.00 | $1,022.49 | $2.47 |
| Admiral Shares | 1,000.00 | 1,023.39 | 1.56 |
The calculations are based on expenses incurred in the most recent six-month period. The fund’s annualized six-month expense ratios for that period are 0.49% for Investor Shares and 0.31% for Admiral Shares. The dollar amounts shown as “Expenses Paid” are equal to the annualized expense ratio multiplied by the average account value over the period, multiplied by the number of days in the most recent six-month period, then divided by the number of days in the most recent 12-month period.
28
Trustees Approve Advisory Arrangements
The board of trustees of Vanguard Morgan Growth Fund has renewed the fund’s investment advisory arrangements with Frontier Capital Management Co., LLC, Jennison Associates LLC, Kalmar Investment Advisers, Wellington Management Company, LLP, and The Vanguard Group, Inc. (through its Quantitative Equity Group). The board determined that the retention of the advisors was in the best interests of the fund and its shareholders.
The board based its decisions upon an evaluation of each advisor’s investment staff, portfolio manage-ment process, and performance. The trustees considered the factors discussed below, among others. However, no single factor determined whether the board approved the arrangements. Rather, it was the totality of the circumstances that drove the board’s decisions.
Nature, extent, and quality of services
The board considered the quality of the fund’s investment management over both the short and long term, and took into account the orga nizational depth and stability of each advisor. The board noted the following:
Frontier Capital Management Co., LLC. Frontier, founded in 1980, is an investment management boutique that focuses on investing in small- and mid-capitalization stocks. Frontier is an affiliate of Affiliated Managers Group, but retains a 35% ownership interest. The firm employs a fundamental, bottom-up investment approach that seeks companies with a combination of superior growth potential and attractive valuation. The investment process emphasizes companies with understandable business models, good franchises, accelerating sales and margins, and healthy balance sheets. Analysts regularly interact with management and other companies in the supply chain to effectively construct a portfolio of stocks for the fund. Frontier has managed a portion of the fund since 2008.
Jennison Associates LLC. Jennison, founded in 1969, is an indirect, wholly owned subsidiary of Prudential Financial, Inc. The firm currently oversees a wide range of equity a nd fixed income strategies. The investment team at Jennison Associates uses internal fundamental research and a highly interactive stock selection process to identify companies that exhibit above-average growth in units, revenues, earnings, and cash flows. When analyzing a company for purchase or sale, the analysis focuses on the duration of the growth opportunity and seeks to capture inflection points in the company’s growth. The firm has managed a portion of the fund since 2007.
Kalmar Investment Advisers. Kalmar, together with its parent company, Kalmar Investments Inc., founded in 1982, specializes in small- and mid-capitalization growth stocks. Kalmar is a research-driven investment firm that is entir ely focused on the management of “growth with value” small- and mid-cap equity portfolios. Kalmar believes that there is a high-reward/low-risk anomaly offered by the equity market in the stocks of solid, well-managed, rapidly growing smaller companies. Through independent fundamental research, Kalmar attempts to discover such companies, buy them at undervalued levels, and own them for the longer term. The firm has managed a portion of the fund since 2008.
Wellington Management Company, LLP. Wellington Management, founded in 1928, is among the nation’s oldest and most respected institutional investment managers. The investment team at Wellington Management uses traditional methods of stock selection to identify companies that it believes have above-average growth prospects, particularly those in industries undergo ing change. Research focuses on large- and mid-cap companies with a proven record of sales and earnings growth, profitability, and cash-flow generation. The firm has advised the fund since 1968.
29
The Vanguard Group, Inc. Vanguard has been managing investments for more than three decades. The Quantitative Equity Group adheres to a sound, disciplined investment management process; the team has considerable experience, stability, and depth. Vanguard has managed a portion of the fund since 1993.
The board concluded that each advisor’s experience, stability, depth, and performance, among other factors, warranted continuation of the advisory arrangements.
Investment performance
The board considered the short- and long-term performance of the fund, including any periods of outperformance or underperformance of a rel evant benchmark and peer group. The board concluded that each advi sor has carried out the fund’s investment strategy in disciplined fashion, and that performanc e results have allowed the fund to remain competitive versus its benchmark and the fund’s peer group. Information about the fund’s most recent performance can be found in the Performance Summary section of this report.
Cost
The board concluded that the fund’s expense ratio was well below the average expense ratio charged by funds in its peer group and that the fund’s advisory fee rate was also well below its peer-group average. Information about the fund’s expense ratio appears in the About Your Fund’s Expenses section of this report as well as in the Financial Statements section, which also includes information about the advisory fee rate.
The board did not consider profitability of Frontier, Jennison, Kalmar, and Wellington Management in determining whether to approve the advisory fees, because the firms are independent of Vanguard, and the advisory fees are the result of arm’s-length negotiations. The board does not conduct a profitability analysis of Vanguard, because of Vanguard’s unique “at-cost” structure. Unlike most other mutual fund management companies, Vanguard is owned by the funds it oversees, and produces “profits” only in the form of reduced expenses for fund shareholders.
The benefit of economies of scale
The board concluded that the fund’s shareholders benefit from economies of scale because of breakpoints in the advisory fee schedules for Frontier, Jennison, Kalmar, and Wellington Management.
The breakpoints reduce the effect ive rate of the fees as the fund’s assets managed by each firm increase. The board also concluded that the fund’s low-cost arrangement with Vanguard ensures that the fund will realize economies of scale as it grows, with the cost to shareholders declining as fund assets managed by Vanguard increase.
The board will consider whether to renew the advisory arrangements again after a one-year period.
30
Glossary
30-Day SEC Yield. A fund’s 30-day SEC yield is derived using a formula specified by the U.S. Securities and Exchange Commission. Under the formula, data related to the fund’s security holdings in the previous 30 days are used to calculate the fund’s hypothetical net income for that period, which is then annualized and divided by the fund’s estimated average net assets over the calculation period. For the purposes of this calculation, a security’s income is based on its current market yield to maturity (in the case of bonds) or its projected dividend yield (for stocks). Because the SEC yield represents hypothetical annualized income, it will differ—at times significantly—from the fund’s actual experience. As a result, the fund’s income distributions may be higher or lower than implied by the SEC yield.
Beta. A measure of the magnitude of a fund’s past share-price fluctuations in relation to the ups and downs of a given market index. The index is assigned a beta of 1.00. Compared with a given index, a fund with a beta of 1.20 typically would have seen its share price rise or fall by 12% when the index rose or fell by 10%. For this report, beta is based on returns over the past 36 months for both the fund and the index. Note that a fund’s beta should be reviewed in conjunction with its R-squared (see definition). The lower the R-squared, the less correlation there is between the fund and the index, and the less reliable beta is as an indicator of volatility.
Dividend Yield. Dividend income earned by stocks, expressed as a percentage of the aggregate market value (or of net asset value, for a fund). The yield is determined by dividing the amount of the annual dividends by the aggregate value (or net asset value) at the end of the period. For a fund, the dividend yield is based solely on stock holdings and does not include any income produced by other investments.
Earnings Growth Rate. The average annual rate of growth in earnings over the past five years for the stocks now in a fund.
Equity Exposure. A measure that reflects a fund’s investments in stocks and stock futures. Any holdings in short-term reserves are excluded.
Expense Ratio. The percentage of a fund’s average net assets used to pay its annual administrative and advisory expenses. These expenses directly reduce returns to investors.
Foreign Holdings. The percentage of a fund represented by stocks or depositary receipts of companies based outside the United States.
Inception Date. The date on which the assets of a fund (or one of its share classes) are first invested in accordance with the fund’s investment objective. For funds with a subscription period, the inception date is the day after that period ends. Investment performance is measured from the inception date.
Median Market Cap. An indicator of the size of companies in which a fund invests; the midpoint of market capitalization (market price x shares outstanding) of a fund’s stocks, weighted by the proportion of the fund’s assets invested in each stock. Stocks representing half of the fund’s assets have market capitalizations above the median, and the rest are below it.
Price/Book Ratio. The share price of a stock divided by its net worth, or book value, per share. For a fund, the weighted average price/book ratio of the stocks it holds.
31
Price/Earnings Ratio. The ratio of a stock’s current price to its per-share earnings over the past year. For a fund, the weighted average P/E of the stocks it holds. P/E is an indicator of market expectations about corporate prospects; the higher the P/E, the greater the expectations for a company’s future growth.
R-Squared. A measure of how much of a fund’s past returns can be explained by the returns from the market in general, as measured by a given index. If a fund’s total returns were precisely synchronized with an index’s returns, its R-squared would be 1.00. If the fund’s returns bore no relationship to the index’s returns, its R-squared would be 0. For this report, R-squared is based on returns over the past 36 months for both the fund and the index.
Return on Equity. The annual average rate of return generated by a company during the past five years for each dollar of shareholder’s equity (net income divided by shareholder’s equity). For a fund, the weighted average return on equity for the companies whose stocks it holds.
Short-Term Reserves. The percentage of a fund invested in highly liquid, short-term securities that can be readily converted to cash.
Turnover Rate. An indication of the fund’s trading activity. Funds with high turnover rates incur higher transaction costs and may be more likely to distribute capital gains (which may be taxable to investors). The turnover rate excludes in-kind transactions, which have minimal impact on costs.
32
This page intentionally left blank.
This page intentionally left blank.
This page intentionally left blank.
The People Who Govern Your Fund
The trustees of your mutual fund are there to see that the fund is operated and managed in your best interests since, as a shareholder, you are a part owner of the fund. Your fund’s trustees also serve on the board of directors of The Vanguard Group, Inc., which is owned by the Vanguard funds and provides services to them on an at-cost basis.
A majority of Vanguard’s board members are independent, meaning that they have no affiliation with Vanguard or the funds they oversee, apart from the sizable personal investments they have made as private individuals. The independent board members have distinguished backgrounds in business, academia, and public service. Each of the trustees and executive officers oversees 162 Vanguard funds.
The following table provides information for each trustee and executive officer of the fund. More information about the trustees is in the Statement of Additional Informatio n, which can be obtained, wit hout charge, by contacting Vanguard at 800-662-7447, or online at www.vanguard.com.
| |
| Interested Trustee1 | Rajiv L. Gupta |
| | Born 1945. Trustee Since December 2001.2 |
| F. William McNabb III | Principal Occupation (s) During the Past Five Years: |
| Born 1957. Trustee Since July 2009. Chairman of the | Chairman and Chief Executive Officer (retired 2009) |
| Board. Principal Occupation(s) During the Past Five | and President (2006–2008) of Rohm and Haas Co. |
| Years: Chairman of the Board of The Vanguard Group, | (chemicals); Director of Tyco International, Ltd. |
| Inc., and of each of the investment companies served | (diversified manufacturing and services) and Hewlett- |
| by The Vanguard Group, since January 2010; Director | Packard Co. (electronic computer manufacturing); |
| of The Vanguard Group since 2008; Chief Executive | Trustee of The Conference Board; Member of the |
| Officer and President of The Vanguard Group and of | Board of Managers of Delphi Automotive LLP |
| each of the investment companies served by The | (automotive components). |
| Vanguard Group since 2008; Director of Vanguard | |
| Marketing Corporation; Managing Director of The | Amy Gutmann |
| Vanguard Group (1995–2008). | Born 1949. Trustee Since June 2006. Principal |
| | Occupation(s) During the Past Five Years: President |
| | of the University of Pennsylvania; Christopher H. |
| Independent Trustees | Browne Distinguished Professor of Political Science |
| | in the School of Arts and Sciences with secondary |
| Emerson U. Fullwood | appointments at the Annenberg School for Commu- |
| Born 1948. Trustee Since January 2008. Principal | nication and the Graduate School of Education of |
| Occupation(s) During the Past Five Years: Executive | the University of Pennsylvania; Director of Carnegie |
| Chief Staff and Marketing Officer for North America | Corporation of New York, Schuylkill River Development |
| and Corporate Vice President (retired 2008) of Xerox | Corporation, and Greater Philadelphia Chamber of |
| Corporation (documen t management products and | Commerce; Trustee of the National Constitution Center; |
| services); Director of SPX Corporation (multi-industry | Chair of the Presidential Commission for the Study of |
| manufacturing), the United Way of Rochester, | Bioethical Issues. |
| Amerigroup Corporation (managed health care), | |
| the University of Rochester Medical Center, and | |
| Monroe Community College Foundation. | |
| | |
| JoAnn Heffernan Heisen | Executive Officers | |
| Born 1950. Trustee Since July 1998. Principal | | |
| Occupation(s) During the Past Five Years: Corporate | Thomas J. Higgins | |
| Vice President and Chief Global Diversity Officer since | Born 1957. Chief Financial Officer Since September |
| 2006 (retired 2008) and Member of the Executive | 2008. Principal Occupation(s) During the Past Five |
| Committee (retired 2008) of Johnson & Johnson | Years: Principal of The Vanguard Group, Inc.; Chief |
| (pharmaceuticals/consumer products); Vice President | Financial Officer of each of the investment companies |
| and Chief Information Officer of Johnson & Johnson | served by The Vanguard Group since 2008; Treasurer |
| (1997–2005); Director of the University Medical Center | of each of the investment companies served by The |
| at Princeton and Women’s Research and Education | Vanguard Group (1998–2008). |
| Institute; Member of the Advisory Board of the | | |
| Maxwell School of Citizenship and Public Affairs | Kathryn J. Hyatt | |
| at Syracuse University. | Born 1955. Treasurer Since November 2008. Principal |
| | Occupation(s) During the Past Five Years: Principal |
| F. Joseph Loughrey | of The Vanguard Group, Inc.; Treasurer of each of |
| Born 1949. Trustee Since October 2009. Principal | the investment companies served by The Vanguard |
| Occupation(s) During the Past Five Years: President | Group since 2008; Assistant Treasurer of each of the |
| and Chief Operating Officer since 2005 (retired 2009) | investment companies served by The Vanguard Group |
| and Vice Chairman of the Board (2008–2009) of | (1988–2008). | |
| Cummins Inc. (industrial machinery); Director of | | |
| SKF AB (industrial machinery), Hillenbrand, Inc. | Heidi Stam | |
| (specialized consumer services), Sauer-Danfoss Inc. | Born 1956. Secretary Since July 2005. Principal |
| (machinery), the Lumina Foundation for Education, | Occupation(s) During the Past Five Years: Managing |
| and Oxfam America; Chairman of the Advisory Council | Director of The Vanguard Group, Inc., since 2006; |
| for the College of Arts and Letters at the University of | General Counsel of The Vanguard Group since 2005; |
| Notre Dame. | Secretary of The Vanguard Group and of each of the |
| | investment companies served by The Vanguard Group |
| André F. Perold | since 2005; Director and Senior Vice President of |
| Born 1952. Trustee Since December 2004. Principal | Vanguard Marketing Corporation since 2005; |
| Occupation(s) During the Past Five Years: George | Principal of The Vanguard Group (1997–2006). |
| Gund Professor of Finance and Banking at the Harvard | | |
| Business School; Chair of the Investment Committee | | |
| of HighVista Strategies LLC (private investment firm). | Vanguard Senior Management Team |
| |
| Alfred M. Rankin, Jr. | R. Gregory Barton | Michael S. Miller |
| Born 1941. Trustee Since January 1993. Principal | Mortimer J. Buckley | James M. Norris |
| Occupation(s) During the Past Five Years: Chairman, | Kathleen C. Gubanich | Glenn W. Reed |
| President, and Chief Executive Officer of NACCO | Paul A. Heller | George U. Sauter |
| Industries, Inc. (forklift trucks/housewares/lignite); | | |
| Director of Goodrich Corporation (industrial products/ | | |
| aircraft systems and services); Chairman of the Federal | Chairman Emeritus and Senior Advisor |
| Reserve Bank of Cleveland; Trustee of The Cleveland | | |
| Museum of Art. | John J. Brennan | |
| | Chairman, 1996–2009 | |
| Peter F. Volanakis | Chief Executive Officer and President, 1996–2008 |
| Born 1955. Trustee Since July 2009. Principal | | |
| Occupation(s) During the Past Five Years: President | | |
| since 2007 and Chief Operating Officer since 2005 | Founder | |
| of Corning Incorporated (communications equipment); | | |
| President of Corning Technologies (2001–2005); | John C. Bogle | |
| Director of Corning Incorporated and Dow Corning; | Chairman and Chief Executive Officer, 1974–1996 |
| Trustee of the Corning Incorporated Foundation and | | |
| the Corning Museum of Glass; Overseer of the | | |
| Amos Tuck School of Business Administration at | | |
| Dartmouth College. | | |
1 Mr. McNabb is considered an “interested person,” as defined in the Investment Company Act of 1940, because he is an officer of the Vanguard funds.
2 December 2002 for Vanguard Equity Income Fund, Vanguard Growth Equity Fund, the Vanguard Municipal Bond Funds, and the Vanguard State Tax-Exempt Funds.
|  |
| |
| | P.O. Box 2600 |
| | Valley Forge, PA 19482-2600 |
| |
| |
| |
| Connect with Vanguard® >www.vanguard.com | |
| |
| |
| |
| Fund Information > 800-662-7447 | CFA® is a trademark owned by CFA Institute. |
| Direct Investor Account Services > 800-662-2739 |
| Institutional Investor Services > 800-523-1036 |
| Text Telephone for People With Hearing Impairment > 800-749-7273 | |
|
| |
| This material may be used in conjunction with the offering of shares of any Vanguard |
| fund only if preceded or accompanied by the fund’s current prospectus. |
| |
| All comparative mutual fund data are from Lipper Inc. or Morningstar, Inc., unless otherwise noted. |
| |
| You can obtain a free copy of Vanguard’s proxy voting guidelines by visiting our website, www.vanguard.com, |
| and searching for “proxy voting guidelines,” or by calling Vanguard at 800-662-2739. The guidelines are also |
| available from the SEC’s website, www.sec.gov. In addition, you may obtain a free report on how your fund |
| voted the proxies for securities it owned during the 12 months ended June 30. To get the report, visit either |
| www.vanguard.com or www.sec.gov. | |
| |
| You can review and copy information about your fund at the SEC’s Public Reference Room in Washington, D.C. To |
| find out more about this public service, call the SEC at 202-551-8090. Information about your fund is also |
| available on the SEC’s website, and you can receive copies of this information, for a fee, by sending a |
| request in either of two ways: via e-mail addressed to publicinfo@sec.gov or via regular mail addressed to the |
| Public Reference Section, Securities and Exchange Commission, Washington, DC 20549-1520. |
|
| © 2010 The Vanguard Group, Inc. |
| All rights reserved. |
| Vanguard Marketing Corporation, Distributor. |
| |
| Q262 052010 |
Item 2: Not Applicable.
Item 3: Not Applicable.
Item 4: Not Applicable.
Item 5: Not Applicable.
Item 6: Not Applicable.
Item 7: Not Applicable.
Item 8: Not Applicable.
Item 9: Not Applicable.
Item 10: Not Applicable.
Item 11: Controls and Procedures.
(a) Disclosure Controls and Procedures. The Principal Executive and Financial Officers concluded that the Registrant's Disclosure Controls and Procedures are effective based on their evaluation of the Disclosure Controls and Procedures as of a date within 90 days of the filing date of this report.
(b) Internal Control Over Financial Reporting. There were no significant changes in Registrant’s Internal Control Over Financial Reporting or in other factors that could significantly affect this control subsequent to the date of the evaluation, including any corrective actions with regard to significant deficiencies and material weaknesses.
Item 12: Exhibits.
(a) Code of Ethics.
(b) Certifications.
Pursuant to the requirements of the Securities Exchange Act of 1934 and the Investment Company Act of 1940, the registrant has duly caused this report to be signed on its behalf by the undersigned, thereunto duly authorized.
| |
| | VANGUARD MORGAN GROWTH FUND |
| |
| By: | /s/ F. WILLIAM MCNABB III* |
| | F. WILLIAM MCNABB III |
| | CHIEF EXECUTIVE OFFICER |
| |
| Date: May 21, 2010 |
Pursuant to the requirements of the Securities Exchange Act of 1934 and the Investment Company Act of 1940, this report has been signed below by the following persons on behalf of the registrant and in the capacities and on the dates indicated.
| |
| | VANGUARD MORGAN GROWTH FUND |
| |
| By: | /s/ F. WILLIAM MCNABB III* |
| | F. WILLIAM MCNABB III |
| | CHIEF EXECUTIVE OFFICER |
| |
| Date: May 21, 2010 |
| |
| |
| |
| | VANGUARD MORGAN GROWTH FUND |
| |
| By: | /s/ THOMAS J. HIGGINS* |
| | THOMAS J. HIGGINS |
| | CHIEF FINANCIAL OFFICER |
Date: May 21, 2010
* By: /s/ Heidi Stam
Heidi Stam, pursuant to a Power of Attorney filed on April 26, 2010, see file Number 33-53683, is Incorporated by Reference.