| |
| |
Vanguard® Morgan™ Growth Fund |
| |
| |
| |
| |
> Semiannual Report | |
| |
| |
| |
| |
March 31, 2007 | |
| |
| |
| 
|
| |
| |
| |
| |
| |
| |
| |
| |
| |
> During the six months ended March 31, 2007, the Investor Shares of Vanguard Morgan Growth Fund returned 8.8%, surpassing the return of the fund’s benchmark and the average return for multi-cap growth funds.
> Stock holdings in the industrials sector provided a strong boost to the fund’s returns for the period. Smaller sectors, including energy and materials, also made outsized contributions.
> The fund’s largest sector, information technology, turned in modest results, as did the financials group.
Contents | |
| |
Your Fund’s Total Returns | 1 |
Chairman’s Letter | 2 |
Advisors’ Report | 6 |
Fund Profile | 10 |
Performance Summary | 11 |
Financial Statements | 12 |
About Your Fund’s Expenses | 26 |
Trustees Approve Advisory Arrangements | 28 |
Glossary | 30 |
Please note: The opinions expressed in this report are just that—informed opinions. They should not be considered promises or advice. Also, please keep in mind that the information and opinions cover the period through the date on the cover of this report. Of course, the risks of investing in your fund are spelled out in the prospectus.
Your Fund’s Total Returns
Six Months Ended March 31, 2007 | |
| Total |
| Returns |
Vanguard Morgan Growth Fund | |
Investor Shares | 8.8% |
Admiral™ Shares1 | 8.9 |
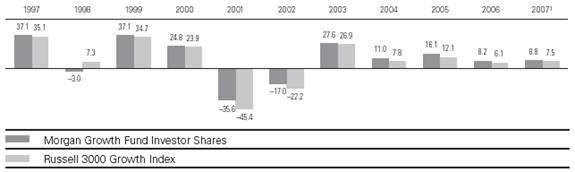
Russell 3000 Growth Index | 7.5 |
Average Multi-Cap Growth Fund2 | 8.6 |
Dow Jones Wilshire 5000 Index | 8.9 |
Your Fund’s Performance at a Glance |
September 30, 2006–March 31, 2007 |
| | | Distributions Per Share |
| Starting | Ending | Income | Capital |
| Share Price | Share Price | Dividends | Gains |
Vanguard Morgan Growth Fund | | | | |
Investor Shares | $18.34 | $19.25 | $0.204 | $0.497 |
Admiral Shares | 56.94 | 59.71 | 0.745 | 1.541 |
1 A lower-cost class of shares available to many longtime shareholders and to those with significant investments in the fund.
2 Derived from data provided by Lipper Inc.
1

Chairman’s Letter
Dear Shareholder,
Vanguard Morgan Growth Fund’s Investor Shares posted a solid 8.8% return during the half-year ended March 31, 2007. (The fund’s Admiral Shares returned 8.9%.) The fund’s results for the period surpassed the average return for multi-cap growth funds and the return of the Russell 3000 Growth Index. The advisors’ astute stock selections in industrials, the fund’s second-largest sector by weight, as well as in materials and energy, two much smaller sectors, enhanced the fund’s performance versus comparative yardsticks.
As you may already know, the fund’s board of trustees added a fourth advisor, Jennison Associates LLC, in January to handle a portion of the fund’s assets. We welcome Jennison to the fund’s skilled and experienced advisory team.
Six-month stock market return reflected disparate market moods
The broad U.S. stock market stitched together a solid six-month return from patches of strength and weakness. Stock prices rallied at the start of the period, pulled back in February—in part, a reaction to the Chinese market’s swoon—then recovered in March, buoyed by generally benign economic and corporate-profit reports.
Small-capitalization stocks outpaced large-caps, and international stocks outperformed their U.S. counterparts—patterns that have been in place for much of the past few years.
2
As the Fed sat tight, bonds produced coupon-like returns
The Federal Reserve Board remained offstage during the six months, keeping its target for the federal funds rate at 5.25% throughout the period. Despite some interim back-and-forth, longer-term bond yields finished the period pretty much where they started. With rates—and prices—more or less stable, bonds’ returns were consistent with their coupons.
The broad taxable bond market returned 2.8% for the six-month period. The municipal securities market posted a return of 1.9%. Money market instruments, one of the fixed income market’s bright spots in recent months, returned 2.5% for the half-year, as measured by the Citigroup 3-Month Treasury Bill Index.
Some solid stock choices boosted returns
For the fiscal half-year, Morgan Growth Fund’s Investor Shares outperformed the fund’s benchmark by 1.3 percentage points; its advantage over its peer average was a narrower 0.2 percentage point. The fund’s result reflected the collective efforts of four advisors who apply their respective skills in quantitative and fundamental research to seek stocks that offer reasonable valuations and above-average growth potential.
Most of the fund’s return—7.3 percentage points—came during the first three months of the period. For the six months, all of the fund’s ten industry sectors produced positive returns.
Market Barometer | | | |
| | | Total Returns |
| | Periods Ended March 31, 2007 |
| Six Months | One Year | Five Years1 |
Stocks | | | |
Russell 1000 Index (Large-caps) | 8.2% | 11.8% | 6.9% |
Russell 2000 Index (Small-caps) | 11.0 | 5.9 | 10.9 |
Dow Jones Wilshire 5000 Index (Entire market) | 8.9 | 11.4 | 7.8 |
MSCI All Country World Index ex USA (International) | 15.5 | 20.3 | 17.4 |
| | | |
Bonds | | | |
Lehman Aggregate Bond Index (Broad taxable market) | 2.8% | 6.6% | 5.4% |
Lehman Municipal Bond Index | 1.9 | 5.4 | 5.5 |
Citigroup 3-Month Treasury Bill Index | 2.5 | 5.0 | 2.5 |
| | | |
CPI | | | |
Consumer Price Index | 1.2% | 2.8% | 2.8% |
1 Annualized.
3
The industrials sector, the fund’s second-largest on average, made the biggest contribution to performance over the period. The leading contributors were AMR, parent company of American Airlines, which has enjoyed renewed profitability, and Manpower, the employment service company, which has benefited from a strong jobs market and trends in temporary-to-permanent hiring. Boeing did well, buoyed by strong orders for its new commercial jet, the 787 Dreamliner. Several machinery producers, such as mining-equipment makers Joy Global and Terex, also posted solid gains.
The fund’s overweighted positions in the energy and materials sectors proved beneficial over the period. Strong global supply-and-demand patterns continued to boost energy stocks, which provided notable returns from oil and gas drillers (GlobalSantaFe) and integrated oil companies (ConocoPhillips and Chevron). Among materials stocks, mining companies, particularly copper and gold miner Freeport-McMoRan, and steel makers, especially Nucor, made significant contributions.
Disappointments included the fund’s information technology holdings, which represented nearly a quarter of its assets on average. The advisors missed some opportunities, particularly among high-flying Internet companies, and several of the fund’s semiconductor makers suffered weak returns, as intense price competition gripped that volatile subsector. Financials holdings were also a weak spot for the fund, as a handful of poorly performing insurance and consumer-lending holdings eroded the sector’s returns.
Annualized Expense Ratios1 | | | |
Your fund compared with its peer group |
| | | Average |
| Investor | Admiral | Multi-Cap |
| Shares | Shares | Growth Fund |
Morgan Growth Fund | 0.39% | 0.21% | 1.49% |
1 Fund expense ratios reflect the six months ended March 31, 2007. Peer-group expense ratio is derived from data provided by Lipper Inc. and captures information through year-end 2006.
4
Recent market jitters offer a valuable reminder
The market pullback in late February probably caught many investors off guard. Having seen a strong rally in major market indexes over roughly the past four years—led by strength in international markets—they witnessed a sharp drop in the U.S. market indexes over a few days. However, the dust settled fairly quickly, and March saw a return to order.
This volatility provides an opportunity to remind investors about the importance of diversification. Vanguard believes firmly that choosing, and maintaining, a balanced mix of stocks, bonds, and cash investments that is appropriate to your time horizon, risk tolerance, and long-term objectives can play a major part in the success of your investment portfolio. Resisting the urge to abruptly change course distinguishes seasoned investors from those who remain unsure of their plans or are uncomfortable with market fluctuations.
The Morgan Growth Fund—with its dedicated focus on high-quality, growth-oriented stocks—can play a meaningful role in the stock portion of your portfolio, helping you move closer to your goals.
Thank you for entrusting your hard-earned assets to Vanguard.
Sincerely,

John J. Brennan
Chairman and Chief Executive Officer
April 17, 2007
5
Advisors’ Report
During the six months ended March 31, 2007, the Investor Shares of Vanguard Morgan Growth Fund returned 8.8%, while the Admiral Shares returned 8.9%. This performance reflects the combined efforts of your fund’s four independent advisors. (Jennison Associates joined the advisory team on January 4, 2007, a bit more than halfway through the period.) The use of four advisors provides exposure to distinct, yet complementary, investment approaches, enhancing the fund’s diversification.
The advisors, the percentage of fund assets each manages, and a brief description of their investment strategies are presented in the table below. The advisors have also prepared a discussion of the investment environment that existed during the fiscal half-year and of how their portfolio positioning reflects this assessment.
Wellington Management Company, LLP
Portfolio Manager: Paul E. Marrkand, CFA,
Vice President
Equity markets gained early in the period, amid an environment of strong corporate profitability and benign inflation. After reaching record highs, Chinese equities suffered a sell-off in late February that rippled through world markets. Market reaction in the United States was further exacerbated by concerns over slowing economic growth (namely a sharp drop in durable-goods orders), worries about the state of the subprime mortgage market, and
Vanguard Morgan Growth Fund Investment Advisors |
| | | |
Fund Assets Managed | |
Investment Advisor | | % | $ Million | | Investment Strategy |
Wellington Management | | 36 | 2,866 | | Traditional methods of stock selection—research and |
Company, LLP | | | | | analysis—that identify companies believed to have |
| | | | | above-average growth prospects, particularly those in |
| | | | | industries undergoing change. Focuses on mid- and large- |
| | | | | capitalization companies with proven records of sales and |
| | | | | earnings growth, profitability, and cash-flow generation. |
Franklin Portfolio Associates, LLC | | 28 | 2,182 | | Quantitative management using a blend of valuation |
| | | | | and growth/momentum factors to drive stock- |
| | | | | selection decisions for a mid-cap growth subportfolio. |
Vanguard Quantitative Equity Group | | 27 | 2,139 | | Quantitative management using models that assess |
| | | | | valuation, marketplace sentiment, and balance-sheet |
| | | | | characteristics of companies versus their peers. |
Jennison Associates LLC | | 5 | 412 | | Research-driven fundamental investment approach that |
| | | | | relies on in-depth company knowledge gleaned through |
| | | | | meetings with management, customers, and suppliers. |
Cash Investments1 | | 4 | 325 | | — |
| | | | | | | | |
1 These short-term reserves are invested by Vanguard in equity index products to simulate investments in stocks. Each advisor also may maintain a modest cash position.
6
the specter of higher inflation. These events served as a reminder both of the increasingly intertwined nature of the global economy and of China’s increasing influence therein, as developed and emerging markets worldwide soon found themselves affected by what had happened.
We believe these impediments will reduce the sales growth rates and profit levels of many companies over the next several years and make it more difficult to achieve sustainable profit growth.
We seek to invest in innovative companies with the ability to gain market share and grow sales and profits at a solid rate, despite a challenging economic environment. Our purchases over the past six months were driven by valuation and growth opportunities. New names in our subportfolio include IBM, Diamond Offshore, American Eagle Outfitters, and Google. We also added to existing positions in Eli Lilly and Boeing. We eliminated holdings in AMR, Illinois Tool Works, AstraZeneca, and Munich Re and trimmed holdings in News Corp. and Newmont Mining.
Franklin Portfolio Associates, LLC
Portfolio Manager: John S. Cone, CFA
Our management approach is based on a quantitative strategy that uses a blend of valuation and growth/momentum factors to drive stock-selection decisions. By considering a blend of stock characteristics, we intend to diversify the risk in the investment process to generate returns that are more consistent than those driven by a narrowly defined process. Recent market conditions highlight the appeal of this approach, as valuation factors were successful from October through December (when momentum and growth factors performed poorly), while momentum factors dominated stock selection from January through March.
Our results for the six months benefited from strong stock selection in several areas, including grocery stores (Kroger), semiconductors (MEMC Electronic Materials and NVIDIA), medical providers (WellCare Health Plans and Coventry Health Care), computer hardware (NCR), and energy (Holly and XTO Energy).
Our results were hindered by poor performances from Patterson-UTI Energy (which provides land-based drilling services in the United States and western Canada), IndyMac Bancorp (a thrift and mortgage banker), American Eagle Outfitters (a clothing retailer), and Wynn Resorts (a hotel and casino operator).
We remain cautiously optimistic about U.S. stocks, as earnings growth has generally kept pace with stock price increases so that overall valuations remain reasonable. As usual, there are risks as economic growth slows and the ultimate impact of the housing contraction remains unclear.
7
However, absent a significant rise in interest rates, we remain positive on the prospects for U.S. stocks, particularly those with a growth bias.
Vanguard Quantitative Equity Group
Portfolio Manager: James P. Stetler, Principal
To identify attractive investment opportunities within the large- and mid-cap growth stock universes, we employ a quantitative assessment of specific fundamental characteristics of companies. This process combines three models (based on valuation, sentiment, and earnings prospects) to rank companies of similar size and businesses against one another. We emphasize the higher-ranked stocks in the portfolio and either avoid or underweight the lower-ranked companies relative to their benchmark weightings. For this six-month period, the stock-ranking models—working in concert with one another—contributed positively to our subportfolio’s overall results.
Evaluated individually, our earnings prospect model was the strongest performer, while both the valuation and sentiment models were neutral. Over short time periods such as this, the models can vary in their effectiveness. However, over the longer term, we expect all three models to generate positive and consistent excess returns.
Because we maintain sector weightings that are essentially the same as those in the benchmark index, our success (or lack thereof) in picking the better-performing stocks in each group drives our results. During the period, our stock selections in the materials, capital goods, and telecommunication industries were the strongest contributors to our overall results. Allegheny Technologies and Phelps Dodge in materials, Boeing in capital goods, and Telephone and Data Systems in telecom led our results. These positive results were partially offset by poor selections in the semiconductor and technology industries, where Advanced Micro Devices, Micron Technology, and Molex performed poorly.
We continue to believe that the best way to deliver consistent, value-added, long-term investment results is through a highly disciplined, quantitative strategy. The resulting portfolio offers an attractive mix of stocks with high earnings quality, market acceptance, and reasonable valuations.
Jennison Associates LLC
Portfolio Manager: Kathleen A.
McCarragher, Managing Director
Since we began managing part of the Morgan Growth Fund in early January, health care holdings contributed most to our subportfolio’s relative performance, as Gilead Sciences, Alcon, Baxter International, and Abbott Laboratories posted double-digit gains. Gilead’s strong franchise in AIDS therapeutics and its Tamiflu royalty stream are funding the development of early
8
pipeline products, while Alcon’s long-term growth centers on a premium intraocular lens opportunity, geographic expansion in pharmaceuticals, and organic operating leverage. The consumer discretionary sector also provided solid gains, led by Coach. This luxury accessories maker continues to deliver consistent, above-average earnings growth.
Information technology holdings hurt our subportfolio’s performance, as gains in Apple and QUALCOMM were offset by declines in Marvell Technology and SAP. Apple’s growth has been driven by the strength of iPod sales and a resurgence in Macintosh computer sales. The company should continue to benefit from its creativity and innovation in product design and marketing. QUALCOMM, the world leader in digital cell phone technology, has an extensive patent portfolio and unique technology expertise. SAP, a global enterprise software company, declined on lower-than-projected license sales, a gauge of future maintenance and consulting fees.
Industrials also detracted from relative performance, the result of a moderate decline in General Electric. The company’s shares have begun to recover based on expectations of stable future earnings growth.
Economic expansion is likely to continue to moderate over the course of 2007. While concerns about inflation and rising interest rates have diminished somewhat because of moderating commodity prices and slower economic growth, inflation above the Fed’s targeted 1%–2% annual rate remains an issue for the equity market. Corporate earnings growth is beginning to slow, hardly surprising at this stage of the economic cycle. The companies in which we invest should generate above-average growth in revenues, earnings, and cash flows in this environment.
9
Fund Profile
As of March 31, 2007
Portfolio Characteristics | | |
| | Comparative | Broad |
| Fund | Index1 | Index2 |
Number of Stocks | 338 | 1,974 | 4,948 |
Median Market Cap | $19.3B | $30.5B | $30.6B |
Price/Earnings Ratio | 18.1x | 21.3x | 17.6x |
Price/Book Ratio | 3.7x | 4.0x | 2.8x |
Yield | | 1.1% | 1.7% |
Investor Shares | 0.9% | | |
Admiral Shares | 1.0% | | |
Return on Equity | 19.5% | 19.7% | 16.9% |
Earnings Growth Rate | 25.1% | 20.9% | 20.8% |
Foreign Holdings | 3.4% | 0.0% | 0.7% |
Turnover Rate | 79%3 | — | — |
Expense Ratio | | — | — |
Investor Shares | 0.39%3 | | |
Admiral Shares | 0.21%3 | | |
Short-Term Reserves | 2% | — | — |
Sector Diversification (% of portfolio) | |
| | Comparative | Broad |
| Fund | Index1 | Index2 |
Consumer Discretionary | 15% | 14% | 12% |
Consumer Staples | 7 | 10 | 9 |
Energy | 8 | 4 | 9 |
Financials | 8 | 9 | 22 |
Health Care | 15 | 17 | 11 |
Industrials | 15 | 15 | 11 |
Information Technology | 25 | 26 | 15 |
Materials | 3 | 3 | 4 |
Telecommunication | | | |
Services | 1 | 1 | 3 |
Utilities | 1 | 1 | 4 |
Short-Term Reserves | 2% | — | — |
Volatility Measures4 | |
| Fund Versus | Fund Versus |
| Comparative Index1 | Broad Index2 |
R-Squared | 0.93 | 0.93 |
Beta | 1.06 | 1.21 |
Ten Largest Holdings5 (% of total net assets) |
| | |
Oracle Corp. | systems software | 2.1% |
The Boeing Co. | aerospace and | |
| defense | 1.9 |
Microsoft Corp. | systems software | 1.7 |
Cisco Systems, Inc. | communications | |
| equipment | 1.7 |
International Business | | |
Machines Corp. | computer hardware | 1.4 |
The Walt Disney Co. | movies and | |
| entertainment | 1.3 |
Freeport-McMoRan | | |
Copper & Gold, Inc. | diversified metals | |
Class B | and mining | 1.3 |
GlobalSantaFe Corp. | oil and gas drilling | 1.3 |
American Eagle | | |
Outfitters, Inc. | apparel retail | 1.2 |
Google Inc. | internet software | |
| and services | 1.1 |
Top Ten | | 15.0% |
Investment Focus
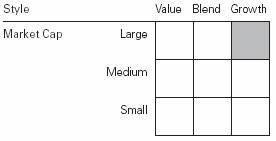
1 Russell 3000 Growth Index.
2 Dow Jones Wilshire 5000 Index.
3 Annualized.
4 For an explanation of R-squared, beta, and other terms used here, see the Glossary on page 30.
5 “Ten Largest Holdings” excludes any temporary cash investments and equity index products.
10
Performance Summary
All of the returns in this report represent past performance, which is not a guarantee of future results that may be achieved by the fund. (Current performance may be lower or higher than the performance data cited. For performance data current to the most recent month-end, visit our website at www.vanguard.com/performance.) Note, too, that both investment returns and principal value can fluctuate widely, so an investor’s shares, when sold, could be worth more or less than their original cost. The returns shown do not reflect taxes that a shareholder would pay on fund distributions or on the sale of fund shares.
Fiscal-Year Total Returns (%): September 30, 1996–March 31, 2007
Average Annual Total Returns: Periods Ended March 31, 2007
|
|---|
| Inception Date | One Year | Five Years | Ten Years |
|---|
|
| Investor Shares | 12/31/1968 | 7.05% | 7.19% | 8.56% |
|
| Admiral Shares | 5/14/2001 | 7.26 | 7.36 | 4.262 |
|
1 Six months ended March 31, 2007.
2 Return since inception.
Note: See Financial Highlights tables on pages 20 and 21 for dividend and capital gains information.
11
Financial Statements (unaudited)
Statement of Net Assets
As of March 31, 2007
The fund provides a complete list of its holdings four times in each fiscal year, at the quarter-ends. For the second and fourth fiscal quarters, the lists appear in the fund’s semiannual and annual reports to shareholders. For the first and third fiscal quarters, the fund files the lists with the Securities and Exchange Commission on Form N-Q. Shareholders can look up the fund’s Forms N-Q on the SEC’s website at www.sec.gov. Forms N-Q may also be reviewed and copied at the SEC’s Public Reference Room (see the back cover of this report for further information).
| | | Market |
| | | Value• |
| | Shares | ($000) |
Common Stocks (94.8%)1 | | |
Consumer Discretionary (14.1%) | | |
| The Walt Disney Co. | 3,101,600 | 106,788 |
| American Eagle | | |
| Outfitters, Inc. | 3,186,450 | 95,562 |
| J.C. Penney Co., Inc. | | |
| (Holding Co.) | 813,000 | 66,796 |
| Wynn Resorts Ltd. | 645,500 | 61,232 |
| News Corp., Class A | 2,143,400 | 49,555 |
| Starwood Hotels & | | |
| Resorts Worldwide, Inc. | 761,300 | 49,370 |
* | Kohl’s Corp. | 631,800 | 48,402 |
| TJX Cos., Inc. | 1,543,800 | 41,621 |
| Yum! Brands, Inc. | 686,900 | 39,675 |
| Sherwin-Williams Co. | 539,400 | 35,622 |
| Darden Restaurants Inc. | 653,100 | 26,901 |
| Target Corp. | 445,700 | 26,412 |
* | Comcast Corp. Class A | 977,226 | 25,359 |
| International Game | | |
| Technology | 622,800 | 25,149 |
| Home Depot, Inc. | 683,200 | 25,101 |
* | Apollo Group, Inc. Class A | 565,000 | 24,804 |
| Brinker International, Inc. | 735,950 | 24,066 |
| Polo Ralph Lauren Corp. | 271,200 | 23,906 |
* | ^Nutri/System Inc. | 363,200 | 19,035 |
| Lowe’s Cos., Inc. | 518,300 | 16,321 |
| NIKE, Inc. Class B | 146,500 | 15,567 |
| Time Warner, Inc. | 732,900 | 14,453 |
| Coach, Inc. | 282,200 | 14,124 |
| Omnicom Group Inc. | 119,600 | 12,245 |
| Meredith Corp. | 202,400 | 11,616 |
* | Expedia, Inc. | 470,221 | 10,900 |
* | Dick’s Sporting Goods, Inc. | 181,200 | 10,557 |
| ^Pool Corp. | 268,100 | 9,598 |
* | EchoStar Communications | | |
| Corp. Class A | 220,200 | 9,563 |
| Foot Locker, Inc. | 397,000 | 9,349 |
| Ctrip.com International Ltd. | 130,000 | 8,708 |
| Hilton Hotels Corp. | 240,600 | 8,652 |
* | Office Depot, Inc. | 246,200 | 8,651 |
| Daihatsu Motor Co., Ltd. | 825,000 | 7,823 |
| Tempur-Pedic | | |
| International Inc. | 297,000 | 7,719 |
| Harley-Davidson, Inc. | 131,000 | 7,696 |
| Lamar Advertising Co. | | |
| Class A | 120,400 | 7,582 |
* | Starbucks Corp. | 232,800 | 7,301 |
* | DIRECTV Group, Inc. | 302,626 | 6,982 |
* | Viacom Inc. Class B | 169,300 | 6,960 |
| Limited Brands, Inc. | 258,300 | 6,731 |
| Abercrombie & Fitch Co. | 86,555 | 6,550 |
* | ITT Educational Services, Inc. | 78,000 | 6,356 |
| McDonald’s Corp. | 130,200 | 5,866 |
| Family Dollar Stores, Inc. | 195,754 | 5,798 |
| Ross Stores, Inc. | 160,400 | 5,518 |
| DaimlerChrysler AG | 65,000 | 5,318 |
| The McGraw-Hill Cos., Inc. | 78,300 | 4,924 |
| Barnes & Noble, Inc. | 123,400 | 4,868 |
| D. R. Horton, Inc. | 215,700 | 4,745 |
* | Liberty Media Corp.-Capital | | |
| Series A | 40,775 | 4,509 |
* | DreamWorks Animation | | |
| SKG, Inc. | 144,400 | 4,416 |
| Honda Motor Co., Ltd. | 121,000 | 4,208 |
| Best Buy Co., Inc. | 82,150 | 4,002 |
* | Liberty Media | | |
| Corp.-Interactive Series A | 139,374 | 3,320 |
| Johnson Controls, Inc. | 34,300 | 3,245 |
* | Las Vegas Sands Corp. | 33,400 | 2,893 |
* | Sears Holdings Corp. | 14,700 | 2,648 |
| Cablevision Systems NY | | |
| Group Class A | 66,700 | 2,030 |
| Clear Channel | | |
| Communications, Inc. | 55,299 | 1,938 |
| Federated Department | | |
| Stores, Inc. | 27,500 | 1,239 |
| E.W. Scripps Co. Class A | 14,000 | 626 |
* | Comcast Corp. Special | | |
| Class A | 15,234 | 388 |
| | | 1,119,859 |
12
| | | Market |
| | | Value• |
| | Shares | ($000) |
Consumer Staples (6.4%) | | |
| PepsiCo, Inc. | 1,348,200 | 85,692 |
| The Procter & Gamble Co. | 1,114,775 | 70,409 |
| The Kroger Co. | 1,793,800 | 50,675 |
| Altria Group, Inc. | 551,200 | 48,401 |
| General Mills, Inc. | 765,000 | 44,538 |
| Wal-Mart Stores, Inc. | 823,800 | 38,677 |
| Colgate-Palmolive Co. | 340,800 | 22,762 |
| The Pepsi Bottling | | |
| Group, Inc. | 689,600 | 21,991 |
| CVS/Caremark Corp. | 477,710 | 16,309 |
| Walgreen Co. | 266,000 | 12,207 |
| Anheuser-Busch Cos., Inc. | 239,252 | 12,073 |
| The Coca-Cola Co. | 232,678 | 11,169 |
| McCormick & Co., Inc. | 288,900 | 11,128 |
* | Herbalife Ltd. | 280,700 | 11,001 |
| Carolina Group | 123,500 | 9,338 |
| Archer-Daniels-Midland Co. | 247,467 | 9,082 |
| The Estee Lauder Cos. Inc. | | |
| Class A | 169,700 | 8,290 |
| Campbell Soup Co. | 178,100 | 6,937 |
| Alberto-Culver Co. | 272,600 | 6,237 |
| Costco Wholesale Corp. | 105,599 | 5,685 |
| Sysco Corp. | 132,500 | 4,482 |
| Safeway, Inc. | 42,200 | 1,546 |
* | Energizer Holdings, Inc. | 16,800 | 1,434 |
| | | 510,063 |
Energy (8.0%) | | |
| GlobalSantaFe Corp. | 1,664,900 | 102,691 |
| ConocoPhillips Co. | 1,186,900 | 81,125 |
| XTO Energy, Inc. | 1,208,162 | 66,219 |
* | Transocean Inc. | 771,500 | 63,032 |
| Chevron Corp. | 820,000 | 60,647 |
| Diamond Offshore | | |
| Drilling, Inc. | 472,000 | 38,208 |
| Schlumberger Ltd. | 518,200 | 35,808 |
| Holly Corp. | 595,800 | 35,331 |
| Patterson-UTI Energy, Inc. | 1,160,100 | 26,033 |
| Tidewater Inc. | 369,200 | 21,628 |
| Kinder Morgan, Inc. | 143,800 | 15,308 |
* | Unit Corp. | 301,200 | 15,238 |
* | Weatherford | | |
| International Ltd. | 244,500 | 11,027 |
| Noble Corp. | 133,953 | 10,539 |
* | Nabors Industries, Inc. | 288,900 | 8,572 |
| ENSCO International, Inc. | 145,951 | 7,940 |
| Halliburton Co. | 245,600 | 7,795 |
* | Grant Prideco, Inc. | 149,206 | 7,436 |
| Petroleo Brasileiro | | |
| Series A ADR | 70,000 | 6,255 |
| BJ Services Co. | 222,700 | 6,213 |
| Baker Hughes, Inc. | 67,600 | 4,470 |
| | | 631,515 |
Financials (7.2%) | | |
| UBS AG-NEW | 809,100 | 48,085 |
| The First Marblehead Corp. | 939,350 | 42,167 |
| The Goldman Sachs | | |
| Group, Inc. | 171,900 | 35,520 |
* | CB Richard Ellis Group, Inc. | 866,700 | 29,624 |
* | IntercontinentalExchange Inc. | 220,100 | 26,898 |
| W.R. Berkley Corp. | 760,223 | 25,179 |
| ACE Ltd. | 439,400 | 25,072 |
* | ^NYSE Group Inc. | 205,300 | 19,247 |
* | E*TRADE Financial Corp. | 880,800 | 18,691 |
| Northern Trust Corp. | 302,800 | 18,210 |
| Capital One Financial Corp. | 230,000 | 17,356 |
| American Express Co. | 300,800 | 16,965 |
| Ambac Financial Group, Inc. | 188,400 | 16,276 |
| Synovus Financial Corp. | 450,800 | 14,579 |
| Ameriprise Financial, Inc. | 255,000 | 14,571 |
| Jones Lang LaSalle Inc. | 135,700 | 14,151 |
* | Berkshire Hathaway Inc. | | |
| Class B | 3,830 | 13,941 |
| ^IndyMac Bancorp, Inc. | 426,600 | 13,673 |
* | AmeriCredit Corp. | 590,300 | 13,494 |
| Charles Schwab Corp. | 711,255 | 13,009 |
| SEI Investments Co. | 207,800 | 12,516 |
* | CBOT Holdings, Inc. Class A | 68,200 | 12,378 |
| Hudson City Bancorp, Inc. | 860,400 | 11,770 |
| State Street Corp. | 142,200 | 9,207 |
| Host Hotels & Resorts Inc. | | |
| REIT | 326,800 | 8,598 |
| Lazard Ltd. Class A | 165,900 | 8,325 |
| Julius Baer Holding Ltd. | 50,000 | 6,821 |
| Prudential Financial, Inc. | 72,900 | 6,580 |
| Franklin Resources Corp. | 54,400 | 6,573 |
| HCC Insurance Holdings, Inc. | 175,300 | 5,399 |
| Simon Property Group, Inc. | | |
| REIT | 48,000 | 5,340 |
| AFLAC Inc. | 113,400 | 5,337 |
| Progressive Corp. of Ohio | 235,100 | 5,130 |
| MBIA, Inc. | 68,800 | 4,506 |
| Forest City Enterprise | | |
| Class A | 54,427 | 3,602 |
| SLM Corp. | 83,600 | 3,419 |
| SL Green Realty Corp. REIT | 24,500 | 3,361 |
| The Chicago Mercantile | | |
| Exchange | 5,000 | 2,662 |
| Vornado Realty Trust REIT | 17,600 | 2,100 |
| Mellon Financial Corp. | 44,200 | 1,907 |
| General Growth | | |
| Properties Inc. REIT | 25,100 | 1,621 |
| Public Storage, Inc. REIT | 12,300 | 1,164 |
| Axis Capital Holdings Ltd. | 32,900 | 1,114 |
* | Arch Capital Group Ltd. | 4,838 | 330 |
| People’s Bank | 6,100 | 271 |
* | Markel Corp. | 500 | 242 |
| | | 566,981 |
13
| | | Market |
| | | Value• |
| | Shares | ($000) |
Health Care (14.5%) | | |
| Abbott Laboratories | 1,464,430 | 81,715 |
| Merck & Co., Inc. | 1,460,000 | 64,488 |
| Schering-Plough Corp. | 2,431,620 | 62,031 |
* | Forest Laboratories, Inc. | 1,132,757 | 58,269 |
| Eli Lilly & Co. | 1,080,000 | 58,007 |
| Johnson & Johnson | 938,600 | 56,560 |
* | WellCare Health Plans Inc. | 595,700 | 50,783 |
| AmerisourceBergen Corp. | 921,500 | 48,609 |
* | Thermo Fisher | | |
| Scientific, Inc. | 923,400 | 43,169 |
* | Amgen, Inc. | 757,400 | 42,324 |
* | Gilead Sciences, Inc. | 539,500 | 41,272 |
* | Coventry Health Care Inc. | 635,775 | 35,635 |
| Mylan Laboratories, Inc. | 1,589,600 | 33,604 |
* | Biogen Idec Inc. | 586,900 | 26,047 |
* | Millennium | | |
| Pharmaceuticals, Inc. | 2,194,400 | 24,928 |
| Eisai Co., Ltd. | 518,100 | 24,780 |
* | WellPoint Inc. | 277,772 | 22,527 |
| UnitedHealth Group Inc. | 423,600 | 22,438 |
* | Genentech, Inc. | 271,999 | 22,337 |
| Shionogi & Co., Ltd. | 1,241,000 | 22,265 |
* | Emdeon Corp. | 1,353,000 | 20,471 |
| Becton, Dickinson & Co. | 265,800 | 20,437 |
* | Laboratory Corp. of | | |
| America Holdings | 263,500 | 19,138 |
| Baxter International, Inc. | 333,972 | 17,590 |
* | Celgene Corp. | 321,500 | 16,866 |
| Medtronic, Inc. | 338,499 | 16,607 |
* | Cytyc Corp. | 416,400 | 14,245 |
| Wyeth | 270,898 | 13,553 |
* | Medco Health | | |
| Solutions, Inc. | 184,200 | 13,360 |
| Roche Holdings AG | 71,000 | 12,554 |
* | Lincare Holdings, Inc. | 336,100 | 12,318 |
| McKesson Corp. | 208,500 | 12,206 |
* | Humana Inc. | 171,700 | 9,962 |
| Dade Behring Holdings Inc. | 204,800 | 8,980 |
| DENTSPLY International Inc. | 258,300 | 8,459 |
| Manor Care, Inc. | 141,200 | 7,676 |
| Cardinal Health, Inc. | 96,600 | 7,047 |
* | Kinetic Concepts, Inc. | 137,300 | 6,953 |
* | Cephalon, Inc. | 96,480 | 6,870 |
| Alcon, Inc. | 51,200 | 6,749 |
| Novartis AG ADR | 119,700 | 6,539 |
* | Amylin | | |
| Pharmaceuticals, Inc. | 154,400 | 5,768 |
| Aetna Inc. | 129,472 | 5,670 |
| CIGNA Corp. | 37,307 | 5,322 |
* | Intuitive Surgical, Inc. | 43,300 | 5,264 |
| Quest Diagnostics, Inc. | 105,300 | 5,251 |
* | Sierra Health Services, Inc. | 122,200 | 5,031 |
* | Techne Corp. | 86,500 | 4,939 |
* | Boston Scientific Corp. | 257,824 | 3,749 |
* | Express Scripts Inc. | 44,800 | 3,616 |
| Stryker Corp. | 52,700 | 3,495 |
* | ImClone Systems, Inc. | 70,600 | 2,878 |
| Universal Health Services | | |
| Class B | 16,500 | 945 |
| | | 1,152,296 |
Industrials (14.5%) | | |
| The Boeing Co. | 1,669,500 | 148,435 |
| Parker Hannifin Corp. | 937,000 | 80,872 |
| Manpower Inc. | 852,000 | 62,852 |
| Emerson Electric Co. | 1,282,600 | 55,267 |
| Joy Global Inc. | 1,283,650 | 55,069 |
| Rockwell Collins, Inc. | 796,900 | 53,337 |
* | Terex Corp. | 715,000 | 51,308 |
* | Continental Airlines, | | |
| Inc. Class B | 1,341,500 | 48,817 |
| Cummins Inc. | 252,000 | 36,469 |
| Raytheon Co. | 659,300 | 34,587 |
| Vallourec SA | 120,000 | 30,729 |
| General Dynamics Corp. | 352,200 | 26,908 |
| PACCAR, Inc. | 341,800 | 25,088 |
* | Allied Waste | | |
| Industries, Inc. | 1,936,900 | 24,386 |
| C.H. Robinson | | |
| Worldwide Inc. | 497,900 | 23,775 |
| ^Tata Motors Ltd. | 1,355,000 | 21,965 |
| United Technologies Corp. | 332,900 | 21,639 |
| Avery Dennison Corp. | 332,400 | 21,360 |
| Robert Half | | |
| International, Inc. | 531,300 | 19,663 |
| Roper Industries Inc. | 320,000 | 17,562 |
| 3M Co. | 222,700 | 17,021 |
* | Jacobs Engineering | | |
| Group Inc. | 348,200 | 16,244 |
| W.W. Grainger, Inc. | 199,800 | 15,433 |
* | Thomas & Betts Corp. | 301,300 | 14,709 |
| United Parcel Service, Inc. | 205,900 | 14,434 |
| MSC Industrial Direct Co., | | |
| Inc. Class A | 305,300 | 14,251 |
| Lockheed Martin Corp. | 134,100 | 13,010 |
| Gamesa Corporacion | | |
| Tecnologica, SA | 347,000 | 12,591 |
| CSX Corp. | 310,700 | 12,444 |
* | Gardner Denver Inc. | 336,500 | 11,727 |
| Deere & Co. | 106,500 | 11,570 |
| Caterpillar, Inc. | 168,100 | 11,268 |
| General Electric Co. | 313,700 | 11,092 |
| Equifax, Inc. | 274,000 | 9,987 |
| Precision Castparts Corp. | 95,825 | 9,971 |
| FedEx Corp. | 88,600 | 9,518 |
* | McDermott | | |
| International, Inc. | 171,300 | 8,390 |
| Textron, Inc. | 90,700 | 8,145 |
| Norfolk Southern Corp. | 153,000 | 7,742 |
| Burlington Northern | | |
| Santa Fe Corp. | 85,600 | 6,885 |
14
| | | Market | |
| | | Value• | |
| | Shares | ($000) | |
* | AMR Corp. | 220,600 | 6,717 | |
* | Alliant Techsystems, Inc. | 71,700 | 6,304 | |
| First Solar, Inc. | 116,600 | 6,064 | |
* | UAL Corp. | 157,000 | 5,993 | |
| Waste Management, Inc. | 173,500 | 5,970 | |
| Illinois Tool Works, Inc. | 109,200 | 5,635 | |
| Trinity Industries, Inc. | 131,900 | 5,529 | |
| Republic Services, Inc. | | | |
| Class A | 168,000 | 4,674 | |
| Pitney Bowes, Inc. | 43,600 | 1,979 | |
* | Raytheon Co. Warrants | | | |
| Exp. 6/16/11 | 4,580 | 79 | |
| | | 1,145,464 | |
Information Technology (24.3%) | | |
| Communications Equipment (3.4%) | | |
* | Cisco Systems, Inc. | 5,189,700 | 132,493 | |
| QUALCOMM Inc. | 1,157,200 | 49,366 | |
| Motorola, Inc. | 2,322,899 | 41,046 | |
| Harris Corp. | 383,500 | 19,539 | |
* | Corning, Inc. | 591,100 | 13,442 | |
| Research In Motion Ltd. | 60,300 | 8,230 | |
* | Sonus Networks, Inc. | 200,000 | 1,614 | |
| | | | |
| Computers & Peripherals (5.4%) | |
| International Business | | | |
| Machines Corp. | 1,216,900 | 114,705 | |
* | Network Appliance, Inc. | 1,968,900 | 71,904 | |
| Hewlett-Packard Co. | 1,702,500 | 68,338 | |
* | Apple Computer, Inc. | 651,000 | 60,484 | |
* | Lexmark International, Inc. | 485,600 | 28,388 | |
* | Western Digital Corp. | 1,554,100 | 26,124 | |
* | NCR Corp. | 425,700 | 20,336 | |
* | Dell Inc. | 603,600 | 14,010 | |
* | Sun Microsystems, Inc. | 1,574,700 | 9,464 | |
* | Emulex Corp. | 505,000 | 9,236 | |
* | EMC Corp. | 533,100 | 7,383 | |
| | | | |
| Electronic Equipment & Instruments (1.6%) | |
| Amphenol Corp. | 421,200 | 27,197 | |
| CDW Corp. | 314,000 | 19,289 | |
| Molex, Inc. | 672,700 | 18,970 | |
| Jabil Circuit, Inc. | 522,700 | 11,191 | |
* | Mettler-Toledo | | | |
| International Inc. | 121,400 | 10,874 | |
* | Vishay Intertechnology, Inc. | 751,300 | 10,503 | |
| Hon Hai Precision Industry | | | |
| Co., Ltd. | 1,391,602 | 9,299 | |
* | Ingram Micro, Inc. Class A | 402,600 | 7,774 | |
* | Flextronics International Ltd. | 644,126 | 7,047 |
| AVX Corp. | 296,200 | 4,502 |
| Internet Software & Services (1.4%) | |
* | Google Inc. | 188,300 | 86,272 |
* | eBay Inc. | 348,700 | 11,559 |
* | Yahoo! Inc. | 313,900 | 9,822 |
| | | |
| IT Services (3.1%) | | |
| Accenture Ltd. | 1,951,944 | 75,228 |
* | Fiserv, Inc. | 847,900 | 44,990 |
* | Alliance Data Systems Corp. | 473,379 | 29,170 |
| Automatic Data | | |
| Processing, Inc. | 536,300 | 25,957 |
| Paychex, Inc. | 620,300 | 23,491 |
* | Convergys Corp. | 534,400 | 13,579 |
| Western Union Co. | 532,200 | 11,682 |
| MasterCard, Inc. Class A | 82,600 | 8,775 |
| Syntel, Inc. | 232,100 | 8,042 |
| Electronic Data | | |
| Systems Corp. | 220,469 | 6,103 |
* | CheckFree Corp. | 27,608 | 1,024 |
| | | |
| Semiconductors & Semiconductor | |
| Equipment (3.7%) | | |
* | LAM Research Corp. | 1,418,700 | 67,161 |
* | Altera Corp. | 2,950,000 | 58,971 |
* | MEMC Electronic | | |
| Materials, Inc. | 637,300 | 38,608 |
| Intel Corp. | 1,795,100 | 34,340 |
* | Novellus Systems, Inc. | 891,300 | 28,539 |
* | NVIDIA Corp. | 811,200 | 23,346 |
| Texas Instruments, Inc. | 463,700 | 13,957 |
* | Micron Technology, Inc. | 720,000 | 8,698 |
| Applied Materials, Inc. | 427,599 | 7,834 |
* | International Rectifier Corp. | 152,900 | 5,842 |
| Broadcom Corp. | 172,200 | 5,522 |
| Marvell Technology | | |
| Group Ltd. | 223,200 | 3,752 |
| | | |
| Software (5.7%) | | |
* | Oracle Corp. | 9,303,600 | 168,674 |
| Microsoft Corp. | 4,860,475 | 135,461 |
* | Cadence Design | | |
| Systems, Inc. | 1,770,200 | 37,281 |
* | BMC Software, Inc. | 1,155,799 | 35,587 |
* | Adobe Systems, Inc. | 691,900 | 28,852 |
* | Intuit, Inc. | 483,200 | 13,220 |
| Nintendo Co. | 45,000 | 13,031 |
* | Symantec Corp. | 679,588 | 11,757 |
| SAP AG ADR | 128,600 | 5,742 |
| | | 1,924,617 |
15
| | | Market |
| | | Value• |
| | Shares | ($000) |
Materials (3.2%) | | |
| Freeport-McMoRan Copper | | |
| & Gold, Inc. Class B | 1,557,700 | 103,104 |
| Antofagasta PLC | 3,790,000 | 38,556 |
| Nucor Corp. | 536,500 | 34,942 |
* | Pactiv Corp. | 770,200 | 25,987 |
| Monsanto Co. | 401,757 | 22,081 |
| Agrium, Inc. | 307,000 | 11,767 |
| Allegheny Technologies Inc. | 92,400 | 9,858 |
| Newmont Mining Corp. | | |
| (Holding Co.) | 195,998 | 8,230 |
| Praxair, Inc. | 46,500 | 2,928 |
| | | 257,453 |
Telecommunication Services (0.8%) | |
| AT&T Inc. | 740,000 | 29,178 |
| Telephone & Data | | |
| Systems, Inc. | 339,989 | 20,270 |
* | Qwest Communications | | |
| International Inc. | 1,216,000 | 10,932 |
* | NeuStar, Inc. Class A | 150,000 | 4,266 |
* | American Tower Corp. | | |
| Class A | 32,800 | 1,278 |
| | | 65,924 |
Utilities (1.0%) | | |
* | AES Corp. | 2,088,800 | 44,951 |
* | Allegheny Energy, Inc. | 446,587 | 21,945 |
| TXU Corp. | 136,508 | 8,750 |
| Constellation Energy | | |
| Group, Inc. | 29,700 | 2,583 |
| Questar Corp. | 25,200 | 2,248 |
| | | 80,477 |
Exchange-Traded Fund (0.8%) | | |
2 | ^Vanguard Growth ETF | 1,044,900 | 60,970 |
Total Common Stocks | | |
(Cost $6,498,097) | | 7,515,619 |
Temporary Cash Investments (6.2%) | |
Money Market Fund (4.2%) | | |
3 | Vanguard Market | | |
| Liquidity Fund, | | |
| 5.288% | 276,891,878 | 276,892 |
3 | Vanguard Market | | |
| Liquidity Fund, | | |
| 5.288%—Note G | 55,818,000 | 55,818 |
| | | 332,710 |
| | Face | Market |
| | Amount | Value• |
| | ($000) | ($000) |
Repurchase Agreement (1.8%) | | |
| Goldman, Sachs & Co. | | |
| 5.37%, 4/2/07 (Dated 3/31/07, | |
| Repurchase Value | | |
| $141,363,000, collateralized | | |
| by Federal Home Loan | | |
| Mortgage Corp. | | |
| 4.500%–8.000%, | | |
| 1/1/14–3/1/37, and | | |
| Federal National Mortgage | | |
| Assn. 4.000%–7.500%, | | |
| 2/1/14–3/1/37) | 141,300 | 141,300 |
| | | |
U.S. Agency Obligations (0.2%) | | |
4 | Federal Home Loan Bank | | |
5 | 5.230%, 4/18/07 | 2,000 | 1,996 |
4 | Federal Home Loan | | |
| Mortgage Corp. | | |
5 | 5.189%, 4/9/07 | 4,000 | 3,996 |
4 | Federal National | | |
| Mortgage Assn. | | |
5 | 5.215%, 4/9/07 | 10,000 | 9,990 |
| | | 15,982 |
Total Temporary Cash Investments | |
(Cost $489,989) | | 489,992 |
Total Investments (101.0%) | | |
(Cost $6,988,086) | | 8,005,611 |
Other Assets and Liabilities (–1.0%) | |
Other Assets—Note C | | 145,113 |
Liabilities—Note G | | (226,272) |
| | | (81,159) |
Net Assets (100%) | | 7,924,452 |
16
At March 31, 2007, net assets consisted of:6 |
| Amount |
| ($000) |
Paid-in Capital | 6,715,397 |
Undistributed Net Investment Income | 12,445 |
Accumulated Net Realized Gains | 177,268 |
Unrealized Appreciation (Depreciation) | |
Investment Securities | 1,017,525 |
Futures Contracts | 1,807 |
Foreign Currencies | 10 |
Net Assets | 7,924,452 |
| |
Investor Shares—Net Assets | |
Applicable to 302,080,443 outstanding $.001 |
par value shares of beneficial interest | |
(unlimited authorization) | 5,814,418 |
Net Asset Value Per Share— | |
Investor Shares | $19.25 |
| |
Admiral Shares—Net Assets | |
Applicable to 35,336,592 outstanding $.001 |
par value shares of beneficial interest | |
(unlimited authorization) | 2,110,034 |
Net Asset Value Per Share— | |
Admiral Shares | $59.71 |
• See Note A in Notes to Financial Statements.
* Non-income-producing security.
^ Part of security position is on loan to broker-dealers. See Note G in Notes to Financial Statements.
1 The fund invests a portion of its cash reserves in equity markets through the use of index futures contracts. After giving effect to futures investments, the fund’s effective common stock and temporary cash investment positions represent 98.2% and 2.8%, respectively, of net assets. See Note E in Notes to Financial Statements.
2 Considered an affiliated company of the fund as the issuer is another member of The Vanguard Group.
3 Affiliated money market fund available only to Vanguard funds and certain trusts and accounts managed by Vanguard. Rate shown is the 7-day yield.
4 The issuer operates under a congressional charter; its securities are neither issued nor guaranteed by the U.S. government. If needed, access to additional funding from the U.S. Treasury (beyond the issuer’s line of credit) would require congressional action.
5 Securities with a value of $15,982,000 have been segregated as initial margin for open futures contracts.
6 See Note E in Notes to Financial Statements for the tax-basis components of net assets.
ADR—American Depositary Receipt.
REIT – Real Estate Investment Trust.
17
Statement of Operations
| Six Months Ended |
| March 31, 2007 |
| ($000) |
Investment Income | |
Income | |
Dividends1,2 | 49,359 |
Interest2 | 12,709 |
Security Lending | 632 |
Total Income | 62,700 |
Expenses | |
Investment Advisory Fees—Note B | |
Basic Fee | 3,183 |
Performance Adjustment | 218 |
The Vanguard Group—Note C | |
Management and Administrative—Investor Shares | 7,716 |
Management and Administrative—Admiral Shares | 895 |
Marketing and Distribution—Investor Shares | 557 |
Marketing and Distribution—Admiral Shares | 222 |
Custodian Fees | 98 |
Shareholders’ Reports—Investor Shares | 57 |
Shareholders’ Reports—Admiral Shares | 8 |
Trustees’ Fees and Expenses | 5 |
Total Expenses | 12,959 |
Expenses Paid Indirectly—Note D | (239) |
Net Expenses | 12,720 |
Net Investment Income | 49,980 |
Realized Net Gain (Loss) | |
Investment Securities Sold2 | 210,877 |
Futures Contracts | 12,577 |
Foreign Currencies | 63 |
Realized Net Gain (Loss) | 223,517 |
Change in Unrealized Appreciation (Depreciation) | |
Investment Securities | 340,140 |
Futures Contracts | (1,312) |
Foreign Currencies | 14 |
Change in Unrealized Appreciation (Depreciation) | 338,842 |
Net Increase (Decrease) in Net Assets Resulting from Operations | 612,339 |
1 Dividends are net of foreign withholding taxes of $113,000.
2 Dividend income, interest income, and realized net gain (loss) from affiliated companies of the fund were $300,000, $6,805,000, and $0, respectively.
18
Statement of Changes in Net Assets
| Six Months Ended | Year Ended |
| Mar. 31, | Sept. 30, |
| 2007 | 2006 |
| ($000) | ($000) |
Increase (Decrease) in Net Assets | | |
Operations | | |
Net Investment Income | 49,980 | 64,002 |
Realized Net Gain (Loss) | 223,517 | 566,551 |
Change in Unrealized Appreciation (Depreciation) | 338,842 | (147,432) |
Net Increase (Decrease) in Net Assets Resulting from Operations | 612,339 | 483,121 |
Distributions | | |
Net Investment Income | | |
Investor Shares | (57,771) | (25,348) |
Admiral Shares | (23,226) | (9,445) |
Realized Capital Gain | | |
Investor Shares | (140,746) | — |
Admiral Shares | (48,042) | — |
Total Distributions | (269,785) | (34,793) |
Capital Share Transactions—Note H | | |
Investor Shares | 383,603 | 281,742 |
Admiral Shares | 336,510 | 482,819 |
Net Increase (Decrease) from Capital Share Transactions | 720,113 | 764,561 |
Total Increase (Decrease) | 1,062,667 | 1,212,889 |
Net Assets | | |
Beginning of Period | 6,861,785 | 5,648,896 |
End of Period1 | 7,924,452 | 6,861,785 |
1 Net Assets—End of Period includes undistributed net investment income of $12,445,000 and $43,399,000.
19
Financial Highlights
Morgan Growth Fund Investor Shares | | | | | |
| | | | | | |
| Six Months | | | | | |
| Ended | | | |
For a Share Outstanding | Mar. 31, | Year Ended September 30, |
Throughout Each Period | 2007 | 2006 | 2005 | 2004 | 2003 | 2002 |
Net Asset Value, Beginning of Period | $18.34 | $17.04 | $14.77 | $13.34 | $10.49 | $12.71 |
Investment Operations | | | | | | |
Net Investment Income | .123 | .165 | .1291 | .05 | .04 | .049 |
Net Realized and Unrealized Gain | | | | | | |
(Loss) on Investments | 1.488 | 1.230 | 2.246 | 1.42 | 2.85 | (2.194) |
Total from Investment Operations | 1.611 | 1.395 | 2.375 | 1.47 | 2.89 | (2.145) |
Distributions | | | | | | |
Dividends from Net Investment Income | (.204) | (.095) | (.105) | (.04) | (.04) | (.075) |
Distributions from Realized Capital Gains | (.497) | — | — | — | — | — |
Total Distributions | (.701) | (.095) | (.105) | (.04) | (.04) | (.075) |
Net Asset Value, End of Period | $19.25 | $18.34 | $17.04 | $14.77 | $13.34 | $10.49 |
| | | | | | |
Total Return | 8.80% | 8.20% | 16.12% | 11.03% | 27.62% | –17.04% |
| | | | | | |
Ratios/Supplemental Data | | | | | | |
Net Assets, End of Period (Millions) | $5,814 | $5,171 | $4,539 | $4,115 | $3,329 | $2,369 |
Ratio of Total Expenses to | | | | | | |
Average Net Assets2 | 0.39%* | 0.42% | 0.41% | 0.44% | 0.50% | 0.48% |
Ratio of Net Investment | | | | | | |
Income to Average Net Assets | 1.29%* | 0.95% | 0.82%1 | 0.32% | 0.31% | 0.37% |
Portfolio Turnover Rate | 79%* | 90% | 88% | 88% | 91% | 104% |
1 Net investment income per share and the ratio of net investment income to average net assets include $0.044 and 0.28%, respectively, resulting from a special dividend from Microsoft Corp. in November 2004.
2 Includes performance-based investment advisory fee increases (decreases) of 0.01%, 0.02%, 0.00%, 0.01%, 0.00%, and 0.00%.
* Annualized.
20
Morgan Growth Fund Admiral Shares | | | | | |
| | | | | |
| Six Months | | | | | |
| Ended | |
For a Share Outstanding | Mar. 31, | Year Ended September 30, |
Throughout Each Period | 2007 | 2006 | 2005 | 2004 | 2003 | 2002 |
Net Asset Value, Beginning of Period | $56.94 | $52.91 | $45.84 | $41.40 | $32.58 | $39.44 |
Investment Operations | | | | | | |
Net Investment Income | .435 | .620 | .5001 | .212 | .17 | .20 |
Net Realized and Unrealized Gain | | | | | | |
(Loss) on Investments | 4.621 | 3.808 | 6.956 | 4.416 | 8.83 | (6.79) |
Total from Investment Operations | 5.056 | 4.428 | 7.456 | 4.628 | 9.00 | (6.59) |
Distributions | | | | | | |
Dividends from Net Investment Income | (.745) | (.398) | (.386) | (.188) | (.18) | (.27) |
Distributions from Realized Capital Gains | (1.541) | — | — | — | — | — |
Total Distributions | (2.286) | (.398) | (.386) | (.188) | (.18) | (.27) |
Net Asset Value, End of Period | $59.71 | $56.94 | $52.91 | $45.84 | $41.40 | $32.58 |
| | | | | | |
Total Return | 8.90% | 8.39% | 16.32% | 11.19% | 27.73% | –16.90% |
| | | | | | |
Ratios/Supplemental Data | | | | | | |
Net Assets, End of Period (Millions) | $2,110 | $1,691 | $1,110 | $513 | $390 | $246 |
Ratio of Total Expenses to | | | | | | |
Average Net Assets2 | 0.21%* | 0.23% | 0.24% | 0.30% | 0.36% | 0.36% |
Ratio of Net Investment Income to | | | | | | |
Average Net Assets | 1.47%* | 1.14% | 0.96%1 | 0.47% | 0.45% | 0.49% |
Portfolio Turnover Rate | 79%* | 90% | 88% | 88% | 91% | 104% |
1 Net investment income per share and the ratio of net investment income to average net assets include $0.184 and 0.28%, respectively, resulting from a special dividend from Microsoft Corp. in November 2004.
2 Includes performance-based investment advisory fee increases (decreases) of 0.01%, 0.02%, 0.00%, 0.01%, 0.00%, and 0.00%.
* Annualized.
See accompanying Notes, which are an integral part of the Financial Statements.
21
Notes to Financial Statements
Vanguard Morgan Growth Fund is registered under the Investment Company Act of 1940 as an open-end investment company, or mutual fund. The fund offers two classes of shares, Investor Shares and Admiral Shares. Investor Shares are available to any investor who meets the fund’s minimum purchase requirements. Admiral Shares are designed for investors who meet certain administrative, service, tenure, and account-size criteria.
A. The following significant accounting policies conform to generally accepted accounting principles for U.S. mutual funds. The fund consistently follows such policies in preparing its financial statements.
1. Security Valuation: Securities are valued as of the close of trading on the New York Stock Exchange (generally 4:00 p.m. Eastern time) on the valuation date. Equity securities are valued at the latest quoted sales prices or official closing prices taken from the primary market in which each security trades; such securities not traded on the valuation date are valued at the mean of the latest quoted bid and asked prices. Securities for which market quotations are not readily available, or whose values have been affected by events occurring before the fund’s pricing time but after the close of the securities’ primary markets, are valued at their fair values calculated according to procedures adopted by the board of trustees. These procedures include obtaining quotations from an independent pricing service, monitoring news to identify significant market- or security-specific events, and evaluating changes in the values of foreign market proxies (for example, ADRs, futures contracts or exchange-traded funds), between the time the foreign markets close and the fund’s pricing time. When fair-value pricing is employed, the prices of securities used by a fund to calculate its net asset value may differ from quoted or published prices for the same securities. Investments in Vanguard Market Liquidity Fund are valued at that fund’s net asset value. Temporary cash investments acquired over 60 days to maturity are valued using the latest bid prices or using valuations based on a matrix system (which considers such factors as security prices, yields, maturities, and ratings), both as furnished by independent pricing services. Other temporary cash investments are valued at amortized cost, which approximates market value.
2. Foreign Currency: Securities and other assets and liabilities denominated in foreign currencies are translated into U.S. dollars at the exchange rates on the valuation date as employed by Morgan Stanley Capital International (MSCI) in the calculation of its indexes. As part of the fund’s fair-value procedures, exchange rates may be adjusted if they change significantly before the fund’s pricing time but after the time at which the MSCI rates are determined (generally 11:00 a.m. Eastern time).
Realized gains (losses) and unrealized appreciation (depreciation) on investment securities include the effects of changes in exchange rates since the securities were purchased, combined with the effects of changes in security prices. Fluctuations in the value of other assets and liabilities resulting from changes in exchange rates are recorded as unrealized foreign currency gains (losses) until the asset or liability is settled in cash, when they are recorded as realized foreign currency gains (losses).
3. Futures Contracts: The fund uses index futures contracts to a limited extent, with the objective of maintaining full exposure to the stock market while maintaining liquidity. The fund may purchase or sell futures contracts to achieve a desired level of investment, whether to accommodate portfolio turnover or cash flows from capital share transactions. The primary risks associated with the use of futures contracts are imperfect correlation between changes in market values of stocks held by the fund and the prices of futures contracts, and the possibility of an illiquid market.
22
Futures contracts are valued at their quoted daily settlement prices. The aggregate principal amounts of the contracts are not recorded in the Statement of Net Assets. Fluctuations in the value of the contracts are recorded in the Statement of Net Assets as an asset (liability) and in the Statement of Operations as unrealized appreciation (depreciation) until the contracts are closed, when they are recorded as realized futures gains (losses).
4. Repurchase Agreements: The fund may invest in repurchase agreements. Securities pledged as collateral for repurchase agreements are held by a custodian bank until the agreements mature. Each agreement requires that the market value of the collateral be sufficient to cover payments of interest and principal; however, in the event of default or bankruptcy by the other party to the agreement, retention of the collateral may be subject to legal proceedings.
5. Federal Income Taxes: The fund intends to continue to qualify as a regulated investment company and distribute all of its taxable income. Accordingly, no provision for federal income taxes is required in the financial statements.
6. Distributions: Distributions to shareholders are recorded on the ex-dividend date.
7. Security Lending: The fund may lend its securities to qualified institutional borrowers to earn additional income. Security loans are required to be secured at all times by collateral at least equal to the market value of securities loaned. The fund invests cash collateral received in Vanguard Market Liquidity Fund, and records a liability for the return of the collateral, during the period the securities are on loan. Security lending income represents the income earned on investing cash collateral, less expenses associated with the loan.
8. Other: Dividend income is recorded on the ex-dividend date. Interest income includes income distributions received from Vanguard Market Liquidity Fund and is accrued daily. Security transactions are accounted for on the date securities are bought or sold. Costs used to determine realized gains (losses) on the sale of investment securities are those of the specific securities sold.
Each class of shares has equal rights as to assets and earnings, except that each class separately bears certain class-specific expenses related to maintenance of shareholder accounts (included in Management and Administrative expenses) and shareholder reporting. Marketing and distribution expenses are allocated to each class of shares based on a method approved by the board of trustees. Income, other non-class-specific expenses, and gains and losses on investments are allocated to each class of shares based on its relative net assets.
B. Wellington Management Company, LLP, Franklin Portfolio Associates, LLC, and, beginning January 4, 2007, Jennison Associates LLC, each provide investment advisory services to a portion of the fund for a fee calculated at an annual percentage rate of average net assets managed by the advisor. The basic fee for Wellington Management Company, LLP, is subject to quarterly adjustments based on performance for the preceding three years relative to the Russell 3000 Growth Index; the basic fee of Franklin Portfolio Associates, LLC, is subject to quarterly adjustments based on performance for the preceding three years relative to the Russell Midcap Growth Index. In accordance with the advisory contract entered into with Jennison Associates LLC, in January 2007, the investment advisory fee will be subject to quarterly adjustments based on performance relative to the Russell 1000 Growth Index beginning January 1, 2008.
23
The Vanguard Group provides investment advisory services to a portion of the fund on an at-cost basis; the fund paid Vanguard advisory fees of $464,000 for the six months ended March 31, 2007.
For the six months ended March 31, 2007, the aggregate investment advisory fee represented an effective annual basic rate of 0.09% of the fund’s average net assets, before an increase of $218,000 (0.01%) based on performance.
C. The Vanguard Group furnishes at cost corporate management, administrative, marketing, and distribution services. The costs of such services are allocated to the fund under methods approved by the board of trustees. The fund has committed to provide up to 0.40% of its net assets in capital contributions to Vanguard. At March 31, 2007, the fund had contributed capital of $724,000 to Vanguard (included in Other Assets), representing 0.01% of the fund’s net assets and 0.72% of Vanguard’s capitalization. The fund’s trustees and officers are also directors and officers of Vanguard.
D. The fund has asked its investment advisors to direct certain security trades, subject to obtaining the best price and execution, to brokers who have agreed to rebate to the fund part of the commissions generated. Such rebates are used solely to reduce the fund’s management and administrative expenses. The fund’s custodian bank has also agreed to reduce its fees when the fund maintains cash on deposit in the non-interest-bearing custody account. For the six months ended March 31, 2007, these arrangements reduced the fund’s management and administrative expenses by $221,000 and custodian fees by $18,000. The total expense reduction represented an effective annual rate of 0.01% of the fund’s average net assets.
E. Distributions are determined on a tax basis and may differ from net investment income and realized capital gains for financial reporting purposes. Differences may be permanent or temporary. Permanent differences are reclassified among capital accounts in the financial statements to reflect their tax character. Temporary differences arise when certain items of income, expense, gain, or loss are recognized in different periods for financial statement and tax purposes; these differences will reverse at some time in the future. Differences in classification may also result from the treatment of short-term gains as ordinary income for tax purposes. The fund’s tax-basis capital gains and losses are determined only at the end of each fiscal year.
During the six months ended March 31, 2007, the fund realized net foreign currency losses of $63,000, which decreased distributable net income for tax purposes; accordingly, such losses have been reclassified from accumulated net realized gains to undistributed net investment income.
At March 31, 2007, the cost of investment securities for tax purposes was $6,988,086,000. Net unrealized appreciation of investment securities for tax purposes was $1,017,525,000, consisting of unrealized gains of $1,149,909,000 on securities that had risen in value since their purchase and $132,384,000 in unrealized losses on securities that had fallen in value since their purchase.
At March 31, 2007, the aggregate settlement value of open futures contracts expiring in June 2007 and the related unrealized appreciation (depreciation) were:
| | | ($000) |
| | Aggregate | Unrealized |
| Number of | Settlement | Appreciation |
Futures Contracts | Long Contracts | Value | (Depreciation) |
S&P 500 Index | 594 | 212,533 | 1,889 |
E-mini S&P 500 Index | 746 | 53,384 | (82) |
24
Unrealized appreciation (depreciation) on open futures contracts is required to be treated as realized gain (loss) for tax purposes.
F. During the six months ended March 31, 2007, the fund purchased $3,277,449,000 of investment securities and sold $2,776,545,000 of investment securities, other than temporary cash investments.
G. The market value of securities on loan to broker-dealers at March 31, 2007, was $52,940,000, for which the fund received cash collateral of $55,818,000.
H. Capital share transactions for each class of shares were:
| Six Months Ended | | Year Ended |
| March 31, 2007 | | September 30, 2006 |
| Amount | Shares | | Amount | Shares |
| ($000) | (000) | | ($000) | (000) |
Investor Shares | | | | | |
Issued | 620,859 | 32,424 | | 1,021,080 | 57,014 |
Issued in Lieu of Cash Distributions | 193,649 | 10,112 | | 24,672 | 1,378 |
Redeemed | (430,905) | (22,427) | | (764,010) | (42,825) |
Net Increase (Decrease)—Investor Shares | 383,603 | 20,109 | | 281,742 | 15,567 |
Admiral Shares | | | | | |
Issued | 404,666 | 6,798 | | 680,890 | 12,292 |
Issued in Lieu of Cash Distributions | 58,650 | 988 | | 6,969 | 125 |
Redeemed | (126,806) | (2,145) | | (205,040) | (3,693) |
Net Increase (Decrease)—Admiral Shares | 336,510 | 5,641 | | 482,819 | 8,724 |
I. In June 2006, the Financial Accounting Standards Board issued Interpretation No. 48 (“FIN 48”), “Accounting for Uncertainty in Income Taxes.” FIN 48 establishes the minimum threshold for recognizing, and a system for measuring, the benefits of tax-return positions in financial statements. FIN 48 will be effective for the fund’s fiscal year beginning October 1, 2007. Management is in the process of analyzing the fund’s tax positions for purposes of implementing FIN 48; based on the analysis completed to date, management does not believe the adoption of FIN 48 will result in any material impact to the fund’s financial statements.
25
About Your Fund’s Expenses
As a shareholder of the fund, you incur ongoing costs, which include costs for portfolio management, administrative services, and shareholder reports (like this one), among others. Operating expenses, which are deducted from a fund’s gross income, directly reduce the investment return of the fund.
A fund’s expenses are expressed as a percentage of its average net assets. This figure is known as the expense ratio. The following examples are intended to help you understand the ongoing costs (in dollars) of investing in your fund and to compare these costs with those of other mutual funds. The examples are based on an investment of $1,000 made at the beginning of the period shown and held for the entire period.
The table below illustrates your fund’s costs in two ways:
• Based on actual fund return. This section helps you to estimate the actual expenses that you paid over the period. The “Ending Account Value” shown is derived from the fund’s actual return, and the third column shows the dollar amount that would have been paid by an investor who started with $1,000 in the fund. You may use the information here, together with the amount you invested, to estimate the expenses that you paid over the period.
To do so, simply divide your account value by $1,000 (for example, an $8,600 account value divided by $1,000 = 8.6), then multiply the result by the number given for your fund under the heading “Expenses Paid During Period.”
• Based on hypothetical 5% yearly return. This section is intended to help you compare your fund’s costs with those of other mutual funds. It assumes that the fund had a yearly return of 5% before expenses, but that the expense ratio is unchanged. In this case—because the return used is not the fund’s actual return—the results do not apply to your investment. The example is useful in making comparisons because the Securities and Exchange Commission requires all mutual funds to calculate expenses based on a 5% return. You can assess your fund’s costs by comparing this hypothetical example with the hypothetical examples that appear in shareholder reports of other funds.
Six Months Ended September 30, 2006 | | | |
| Beginning | Ending | Expenses |
| Account Value | Account Value | Paid During |
Morgan Growth Fund | 9/30/2006 | 3/31/2007 | Period1 |
Based on Actual Fund Return | | | |
Investor Shares | $1,000.00 | $1,088.04 | $2.03 |
Admiral Shares | 1,000.00 | 1,089.03 | 1.09 |
Based on Hypothetical 5% Yearly Return | | | |
Investor Shares | $1,000.00 | $1,022.99 | $1.97 |
Admiral Shares | 1,000.00 | 1,023.88 | 1.06 |
1 The calculations are based on expenses incurred in the most recent six-month period. The fund’s annualized six-month expense ratios for that period are 0.39% for Investor Shares and 0.21% for Admiral Shares. The dollar amounts shown as “Expenses Paid” are equal to the annualized expense ratio multiplied by the average account value over the period, multiplied by the number of days in the most recent six-month period, then divided by the number of days in the most recent 12-month period.
26
Note that the expenses shown in the table are meant to highlight and help you compare ongoing costs only and do not reflect any transactional costs or account maintenance fees. They do not include your fund’s low-balance fee, which is described in the prospectus. If this fee were applied to your account, your costs would be higher. Your fund does not charge transaction fees, such as purchase or redemption fees, nor does it carry a “sales load.”
The calculations assume no shares were bought or sold during the period. Your actual costs may have been higher or lower, depending on the amount of your investment and the timing of any purchases or redemptions.
You can find more information about the fund’s expenses, including annual expense ratios, in the Financial Statements section of this report. For additional information on operating expenses and other shareholder costs, please refer to the appropriate fund prospectus.
27
Trustees Approve Advisory Arrangements
The board of trustees of Vanguard Morgan Growth Fund has added Jennison Associates LLC to the fund’s investment advisory team as of January 4, 2007. The board also has approved an amended investment advisory agreement with Wellington Management Company, LLP, and has renewed the investment advisory arrangements with Franklin Portfolio Associates, LLC, and The Vanguard Group, Inc. (through its Quantitative Equity Group).
The board approved changes to Wellington Management’s base-fee and performance-adjustment schedules. The revised base-fee schedule will have no impact on the fund’s expense ratio. The performance schedule will now be based on a “linear” rather than a “step” approach. The board concluded that linear adjustments better align the interests of an advisor with those of the fund shareholders because the advisor’s compensation is more closely linked to its performance.
The board determined that adding a new investment advisor, amending Wellington Management’s advisory agreement, and retaining Franklin Portfolio Associates and Vanguard as advisors were in the best interests of the fund and its shareholders.
The board based its decision upon an evaluation of each advisor’s investment staff, portfolio management process, and performance. The trustees considered the factors discussed below, among others. However, no single factor determined whether the board approved the arrangements. Rather, it was the totality of the circumstances that drove the board’s decision.
Nature, extent, and quality of services
The board considered the quality of the fund’s investment management over both short- and long-term periods and took into account the organizational depth and stability of each advisor. The board noted the following:
• Wellington Management Company. Wellington Management, which was founded in 1928, is among the nation’s oldest and most respected institutional investment managers. The firm has advised the fund since 1968. The investment team at Wellington Management uses traditional methods of stock selection to identify companies that it believes have above-average growth prospects, particularly those in industries undergoing change.
• Franklin Portfolio Associates. Franklin Portfolio Associates, which was founded in 1982, is known for quantitative equity management that combines investment experience and the use of financial databases and computer modeling. In seeking to identify attractive mid-capitalization growth stocks, the investment team employs more than 40 computer models, covering a broad range of public data. The firm has advised the fund since 1990.
• Jennison Associates. Founded in 1969, Jennison Associates is a fully owned subsidiary of Prudential Insurance Company of America. Jennison Associates employees a research-driven investment approach that relies on in-depth company knowledge. It seeks companies with above-average growth in revenues, earnings, and cash flows that are trading at attractive valuations relative to expectations. The firm has advised the fund since January 2007.
• The Vanguard Group. Vanguard has been managing investments for more than two decades.
George U. Sauter, Vanguard managing director and chief investment officer, has been in the investment management business since 1985, and has led the Quantitative Equity Group since 1987. The Group adheres to a sound, disciplined investment management process; the team has considerable experience, stability, and depth.
28
The board concluded that each advisor’s experience, stability, depth, and performance, among other factors, warranted the addition, amendment, or continuation, as applicable, of the advisory arrangements.
Investment performance
The board considered the short- and long-term performance of the fund, including any periods of outperformance or underperformance of relevant benchmarks and peer groups. The board concluded that each advisor has carried out the fund’s investment strategy in disciplined fashion, and that performance results have allowed the fund to remain competitive versus its benchmark and its average peer fund. Further, the board concluded that Jennison Associates’ other investment portfolios have been competitive versus the fund’s benchmark and the fund’s peer group over various short- and long-term periods. Information about the fund’s most recent performance can be found in the Performance Summary portion of this report.
Cost
The board considered the cost of services to be provided, including consideration of competitive fee rates, and concluded that, after implementation of the new agreement with Jennison Associates, the amended agreement with Wellington Management, and the renewed arrangements with the other two investment advisors, the fund’s advisory fee rate and expense ratio should remain well below the advisory fee rates and expense ratios of the fund’s peers. Information about the fund’s expense ratio appears in the About Your Fund’s Expenses section of this report as well as in the Financial Statements section, which also includes information about the advisory fee rate.
The board did not consider profitability of Wellington Management, Franklin Portfolio Associates, or Jennison Associates in determining whether to approve the advisory fee arrangements, because the firms are independent of Vanguard, and the advisory fees are the result of arm’s-length negotiations. The board does not consider a profitability analysis of Vanguard because of Vanguard’s unique “at-cost” structure. Unlike most other mutual fund management companies, Vanguard is owned by the funds it oversees, and produces “profits” only in the form of reduced expenses for fund shareholders.
The benefit of economies of scale
The board concluded that the fund’s shareholders benefit from economies of scale because of breakpoints in the advisory fee schedules for Wellington Management, Franklin Portfolio Associates, and Jennison Associates. The breakpoints reduce the effective rate of the fees as the fund’s assets managed by each advisor increase. The board also concluded that the fund’s low-cost arrangement with Vanguard ensures that the fund will realize economies of scale as it grows, with the cost to shareholders declining as the fund’s assets managed by Vanguard increase.
The advisory arrangements will continue for one year and are renewable by the fund’s board after that for successive one-year periods.
29
Glossary
Beta. A measure of the magnitude of a fund’s past share-price fluctuations in relation to the ups and downs of a given market index. The index is assigned a beta of 1.00. Compared with a given index, a fund with a beta of 1.20 typically would have seen its share price rise or fall by 12% when the index rose or fell by 10%. A fund’s beta should be reviewed in conjunction with its R-squared (see definition below). The lower the R-squared, the less correlation there is between the fund and the index, and the less reliable beta is as an indicator of volatility.
Earnings Growth Rate. The average annual rate of growth in earnings over the past five years for the stocks now in a fund.
Expense Ratio. The percentage of a fund’s average net assets used to pay its annual administrative and advisory expenses. These expenses directly reduce returns to investors.
Foreign Holdings. The percentage of a fund represented by stocks or depositary receipts of companies based outside the United States.
Inception Date. The date on which the assets of a fund (or one of its share classes) are first invested in accordance with the fund’s investment objective. For funds with a subscription period, the inception date is the day after that period ends. Investment performance is measured from the inception date.
Median Market Cap. An indicator of the size of companies in which a fund invests; the midpoint of market capitalization (market price x shares outstanding) of a fund’s stocks, weighted by the proportion of the fund’s assets invested in each stock. Stocks representing half of the fund’s assets have market capitalizations above the median, and the rest are below it.
Price/Book Ratio. The share price of a stock divided by its net worth, or book value, per share. For a fund, the weighted average price/book ratio of the stocks it holds.
Price/Earnings Ratio. The ratio of a stock’s current price to its per-share earnings over the past year. For a fund, the weighted average P/E of the stocks it holds. P/E is an indicator of market expectations about corporate prospects; the higher the P/E, the greater the expectations for a company’s future growth.
R-Squared. A measure of how much of a fund’s past returns can be explained by the returns from the market in general, as measured by a given index. If a fund’s total returns were precisely synchronized with an index’s returns, its R-squared would be 1.00. If the fund’s returns bore no relationship to the index’s returns, its R-squared would be 0.
Return on Equity. The annual average rate of return generated by a company during the past five years for each dollar of shareholder’s equity (net income divided by shareholder’s equity). For a fund, the weighted average return on equity for the companies whose stocks it holds.
Short-Term Reserves. The percentage of a fund invested in highly liquid, short-term securities that can be readily converted to cash.
Turnover Rate. An indication of the fund’s trading activity. Funds with high turnover rates incur higher transaction costs and may be more likely to distribute capital gains (which may be taxable to investors). The turnover rate excludes in-kind transactions, which have minimal impact on costs.
Yield. A snapshot of a fund’s income from interest and dividends. The yield, expressed as a percentage of the fund’s net asset value, is based on income earned over the past 30 days and is annualized, or projected forward for the coming year. The index yield is based on the current annualized rate of income provided by securities in the index.
30
This page intentionally left blank.
The People Who Govern Your Fund
The trustees of your mutual fund are there to see that the fund is operated and managed in your best interests since, as a shareholder, you are a part owner of the fund. Your fund’s trustees also serve on the board of directors of The Vanguard Group, Inc., which is owned by the Vanguard funds and provides services to them on an at-cost basis.
A majority of Vanguard’s board members are independent, meaning that they have no affiliation with Vanguard or the funds they oversee, apart from the sizable personal investments they have made as private individuals.
Our independent board members bring distinguished backgrounds in business, academia, and public service to their task of working with Vanguard officers to establish the policies and oversee the activities of the funds. Among board members’ responsibilities are selecting investment advisors for the funds; monitoring fund operations, performance, and costs; reviewing contracts; nominating and selecting new trustees/directors; and electing Vanguard officers.
Each trustee serves a fund until its termination; or until the trustee’s retirement, resignation, or death; or otherwise as specified in the fund’s organizational documents. Any trustee may be removed at a shareholders’ meeting by a vote representing two-thirds of the net asset value of all shares of the fund together with shares of other Vanguard funds organized within the same trust. The table on these two pages shows information for each trustee and executive officer of the fund. The mailing address of the trustees and officers is P.O. Box 876, Valley Forge, PA 19482.
Chairman of the Board, Chief Executive Officer, and Trustee |
| |
John J. Brennan1 | |
Born 1954 | Principal Occupation(s) During the Past Five Years: Chairman of the Board, Chief Executive |
Trustee since May 1987; | Officer, and Director/Trustee of The Vanguard Group, Inc., and of each of the investment |
Chairman of the Board and | companies served by The Vanguard Group. |
Chief Executive Officer | |
147 Vanguard Funds Overseen | |
| |
Independent Trustees | |
| |
Charles D. Ellis | |
Born 1937 | Principal Occupation(s) During the Past Five Years: Applecore Partners (pro bono ventures |
Trustee since January 2001 | in education); Senior Advisor to Greenwich Associates (international business strategy |
147 Vanguard Funds Overseen | consulting); Successor Trustee of Yale University; Overseer of the Stern School of Business |
| at New York University; Trustee of the Whitehead Institute for Biomedical Research. |
| |
Rajiv L. Gupta | |
Born 1945 | Principal Occupation(s) During the Past Five Years: Chairman and Chief Executive Officer |
Trustee since December 20012 | of Rohm and Haas Co. (chemicals); Board Member of the American Chemistry Council; |
147 Vanguard Funds Overseen | Director of Tyco International, Ltd. (diversified manufacturing and services) since 2005; |
| Trustee of Drexel University and of the Chemical Heritage Foundation. |
| |
Amy Gutmann | |
Born 1949 | Principal Occupation(s) During the Past Five Years: President of the University of |
Trustee since June 2006 | Pennsylvania since 2004; Professor in the School of Arts and Sciences, Annenberg School |
147 Vanguard Funds Overseen | for Communication, and Graduate School of Education of the University of Pennsylvania |
| since 2004; Provost (2001–2004) and Laurance S. Rockefeller Professor of Politics and the |
| University Center for Human Values (1990–2004), Princeton University; Director of Carnegie |
| Corporation of New York since 2005 and of Schuylkill River Development Corporation and |
| Greater Philadelphia Chamber of Commerce since 2004. |
JoAnn Heffernan Heisen | |
Born 1950 | Principal Occupation(s) During the Past Five Years: Corporate Vice President and Chief |
Trustee since July 1998 | Global Diversity Officer since 2006, Vice President and Chief Information Officer |
147 Vanguard Funds Overseen | (1997–2005), and Member of the Executive Committee of Johnson & Johnson |
| (pharmaceuticals/consumer products); Director of the University Medical Center |
| at Princeton and Women’s Research and Education Institute. |
| |
André F. Perold | |
Born 1952 | Principal Occupation(s) During the Past Five Years: George Gund Professor of Finance |
Trustee since December 2004 | and Banking, Harvard Business School; Senior Associate Dean, Director of Faculty |
147 Vanguard Funds Overseen | Recruiting, and Chair of Finance Faculty, Harvard Business School; Director and Chairman |
| of UNX, Inc. (equities trading firm) since 2003; Chair of the Investment Committee of |
| HighVista Strategies LLC (private investment firm) since 2005; Director of registered |
| investment companies advised by Merrill Lynch Investment Managers and affiliates |
| (1985–2004), Genbel Securities Limited (South African financial services firm) |
| (1999–2003), Gensec Bank (1999–2003), Sanlam, Ltd. (South African insurance |
| company) (2001–2003), and Stockback, Inc. (credit card firm) (2000–2002). |
| |
Alfred M. Rankin, Jr. | |
Born 1941 | Principal Occupation(s) During the Past Five Years: Chairman, President, Chief Executive |
Trustee since January 1993 | Officer, and Director of NACCO Industries, Inc. (forklift trucks/housewares/lignite); Director |
147 Vanguard Funds Overseen | of Goodrich Corporation (industrial products/aircraft systems and services). |
| |
J. Lawrence Wilson | |
Born 1936 | Principal Occupation(s) During the Past Five Years: Retired Chairman and Chief Executive |
Trustee since April 1985 | Officer of Rohm and Haas Co. (chemicals); Director of Cummins Inc. (diesel engines) and |
147 Vanguard Funds Overseen | AmerisourceBergen Corp. (pharmaceutical distribution); Trustee of Vanderbilt University |
| and of Culver Educational Foundation. |
| |
Executive Officers1 | |
| |
Heidi Stam | |
Born 1956 | Principal Occupation(s) During the Past Five Years: Managing Director of The Vanguard |
Secretary since July 2005 | Group, Inc., since 2006; General Counsel of The Vanguard Group since 2005; Secretary of |
147 Vanguard Funds Overseen | The Vanguard Group, and of each of the investment companies served by The Vanguard |
| Group, since 2005; Principal of The Vanguard Group (1997–2006). |
| |
Thomas J. Higgins | |
Born 1957 | Principal Occupation(s) During the Past Five Years: Principal of The Vanguard Group, Inc.; |
Treasurer since July 1998 | Treasurer of each of the investment companies served by The Vanguard Group. |
147 Vanguard Funds Overseen | |
| |
| |
Vanguard Senior Management Team | | |
| | |
R. Gregory Barton | Kathleen C. Gubanich | Michael S. Miller |
Mortimer J. Buckley | Paul A. Heller | Ralph K. Packard |
James H. Gately | F. William McNabb, III | George U. Sauter |
| | |
Founder | | |
| | |
John C. Bogle | | |
Chairman and Chief Executive Officer, 1974–1996 | |
| | | |
1 Officers of the funds are “interested persons” as defined in the Investment Company Act of 1940.
2 December 2002 for Vanguard Equity Income Fund, Vanguard Growth Equity Fund, the Vanguard Municipal Bond Funds, and the Vanguard State Tax-Exempt Funds.
More information about the trustees is in the Statement of Additional Information, available from The Vanguard Group.
P.O. Box 2600
Valley Forge, PA 19482-2600
Connect with Vanguard® > www.vanguard.com
Fund Information > 800-662-7447 | Vanguard, Morgan, Admiral, Connect with Vanguard, and |
| the ship logo are trademarks of The Vanguard Group, Inc. |
Direct Investor Account Services > 800-662-2739 | |
| All other marks are the exclusive property of their |
Institutional Investor Services > 800-523-1036 | respective owners. |
| |
Text Telephone for the | |
Hearing-Impaired > 800-952-3335 | All comparative mutual fund data are from Lipper Inc. |
| or Morningstar, Inc., unless otherwise noted. |
| You can obtain a free copy of Vanguard’s proxy voting |
| guidelines by visiting our website, www.vanguard.com, |
| and searching for “proxy voting guidelines,” or by calling |
| Vanguard at 800-662-2739. They are also available from |
This material may be used in conjunction | the SEC’s website, www.sec.gov. In addition, you may |
fund only if preceded or accompanied by | obtain a free report on how your fund voted the proxies for |
the fund’s current prospectus. | securities it owned during the 12 months ended June 30. |
| To get the report, visit either www.vanguard.com |
| or www.sec.gov. |
| |
| |
| You can review and copy information about your fund |
| at the SEC’s Public Reference Room in Washington, D.C. |
| To find out more about this public service, call the SEC |
| at 202-551-8090. Information about your fund is also |
| available on the SEC’s website, and you can receive |
| copies of this information, for a fee, by sending a |
| request in either of two ways: via e-mail addressed to |
| publicinfo@sec.gov or via regular mail addressed to the |
| Public Reference Section, Securities and Exchange |
| Commission, Washington, DC 20549-0102. |
| |
| |
| |
| |
| © 2007 The Vanguard Group, Inc. |
| All rights reserved. |
| Vanguard Marketing Corporation, Distributor. |
| |
| Q262 052007 |
(a) Disclosure Controls and Procedures. The Principal Executive and Financial Officers concluded that the Registrant's Disclosure Controls and Procedures are effective based on their evaluation of the Disclosure Controls and Procedures as of a date within 90 days of the filing date of this report.
(b) Internal Control Over Financial Reporting. There were no significant changes in Registrant‘s Internal Control Over Financial Reporting or in other factors that could significantly affect this control subsequent to the date of the evaluation, including any corrective actions with regard to significant deficiencies and material weaknesses.
Certifications.
Pursuant to the requirements of the Securities Exchange Act of 1934 and the Investment Company Act of 1940, the registrant has duly caused this report to be signed on its behalf by the undersigned, thereunto duly authorized.
Pursuant to the requirements of the Securities Exchange Act of 1934 and the Investment Company Act of 1940, this report has been signed below by the following persons on behalf of the registrant and in the capacities and on the dates indicated.
*By Power of Attorney. See File Number 002-65955-99, filed on July 27, 2006. Incorporated by Reference.