
> Vanguard Morgan Growth Fund returned about –28% for both Investor Shares and Admiral Shares for the six months ended March 31, 2009, a few paces behind the return of the fund’s benchmark and the average return of peer-group funds.
> Since our fiscal-year report to you, there has been little relief for stock markets worldwide, as they faced above-normal levels of uncertainty stemming from continued credit-market turmoil and a global economic slowdown.
> The fund’s hardest-hit sectors included information technology and health care.
Contents | |
| |
Your Fund’s Total Returns | 1 |
President’s Letter | 2 |
Advisors’ Report | 6 |
Fund Profile | 11 |
Performance Summary | 12 |
Financial Statements | 13 |
About Your Fund’s Expenses | 27 |
Trustees Approve Advisory Arrangements | 29 |
Glossary | 31 |
Please note: The opinions expressed in this report are just that—informed opinions. They should not be considered promises or advice. Also, please keep in mind that the information and opinions cover the period through the date on the front of this report. Of course, the risks of investing in your fund are spelled out in the prospectus.
Your Fund’s Total Returns
Six Months Ended March 31, 2009 | | |
| Ticker | Total |
| Symbol | Returns |
Vanguard Morgan Growth Fund | | |
Investor Shares | VMRGX | –27.80% |
Admiral™ Shares1 | VMRAX | –27.74 |
Russell 3000 Growth Index | | –26.64 |
Average Multi-Cap Growth Fund2 | | –27.45 |
Your Fund’s Performance at a Glance | | | | |
September 30, 2008–March 31, 2009 | | | | |
| | | Distributions Per Share |
| Starting | Ending | Income | Capital |
| Share Price | Share Price | Dividends | Gains |
Vanguard Morgan Growth Fund | | | | |
Investor Shares | $15.15 | $10.80 | $0.140 | $0.000 |
Admiral Shares | 47.03 | 33.47 | 0.522 | 0.000 |
1 A lower-cost class of shares available to many longtime shareholders and to those with significant investments in the fund.
2 Derived from data provided by Lipper Inc.
1

President’s Letter
Dear Shareholder,
Despite the continuation of a tough stock market, Vanguard Morgan Growth Fund ended the fiscal half-year with a particularly strong performance in March. This wasn’t enough, however, to counter the general market downturn that produced double-digit declines in every sector of the fund and its benchmark, the Russell 3000 Growth Index.
During the six months ended March 31, Morgan Growth returned about –28% for both Investor Shares and Admiral Shares, obviously a disappointing performance, and just a bit behind the fund’s benchmark and competing funds.
Extreme distress dappled with glimmers of hope
The six months ended March 31 witnessed extreme distress in global stock markets, with both U.S. and international stocks returning about –31%. The embattled financial sector continued to struggle, prompting regulators in the United States and abroad to take ever more aggressive actions to help the big banks fortify their fragile balance sheets.
Even as the gloom intensified, a few signs of recovery appeared on the horizon. Toward the end of the period, the swift contraction in manufacturing activity seemed to lessen. And throughout the six months, news from the housing sector seemed to improve. From their lows in early March through the end of the period, global stock markets generated a double-digit return.
2
Credit-market turmoil provoked dramatic response
Developments in the fixed income market were, if anything, even more unusual. In the months after the September collapse of Lehman Brothers, a major presence in the bond market, the trading of corporate bonds came to a near standstill as investors stampeded into U.S. Treasury bonds—considered the safest, most liquid credits—driving prices higher and yields lower. The difference between the yields of Treasuries and corporate bonds surged to levels not seen since the 1930s.
The Federal Reserve Board responded to the credit-market and economic crises with a dramatic easing of monetary policy, reducing its target for short-term interest rates to an all-time low of 0% to 0.25%. The Fed also created new programs designed to bring borrowers and lenders back to the market. For the six-month period, the Barclays Capital U.S. Aggregate Bond Index returned 4.70% on the strength of Treasuries and other government-backed bonds. The broad municipal bond market returned 5.00%.
Technology and health care affected performance the most
The primary drivers of the Morgan Growth Fund’s performance during the fiscal half-year were the returns from its two largest sectors, information technology and health care. Holdings in these sectors accounted for half of the fund’s assets, on average, and shaved about 11 percentage points from the fund’s performance.
Market Barometer | | | |
| | | Total Returns |
| | Periods Ended March 31, 2009 |
| Six Months | One Year | Five Years1 |
Stocks | | | |
Russell 1000 Index (Large-caps) | –30.59% | –38.27% | –4.54% |
Russell 2000 Index (Small-caps) | –37.17 | –37.50 | –5.24 |
Dow Jones Wilshire 5000 Index (Entire market) | –30.72 | –37.69 | –4.24 |
MSCI All Country World Index ex USA (International) | –30.54 | –46.18 | –0.24 |
| | | |
| | | |
Bonds | | | |
Barclays Capital U.S. Aggregate Bond Index | | | |
(Broad taxable market) | 4.70% | 3.13% | 4.13% |
Barclays Capital Municipal Bond Index | 5.00 | 2.27 | 3.21 |
Citigroup 3-Month Treasury Bill Index | 0.30 | 1.13 | 3.06 |
| | | |
| | | |
CPI | | | |
Consumer Price Index | –2.78% | –0.38% | 2.57% |
1 Annualized.
3
Almost 10 percentage points more were lopped from the fund’s return by its industrial and energy holdings. Industrial stocks typically sustain some of the heaviest blows as the economy contracts. Energy stocks are vulnerable to this same dynamic, which was compounded during the six months by a dramatic collapse in oil prices.
The fund’s return moderately lagged that of its benchmark, the Russell 3000 Growth Index. Compared with the stocks held in the benchmark, the advisors’ stock selections both aided the fund’s return and hindered it, with a few more misses than hits.
On the disappointing side were selections in the health care sector, especially equipment and instrument suppliers. The consumer staples sector was another weak spot for the fund, mainly because of the stocks of beverage and food products companies. The fund’s holdings in the information technology sector were also disappointing overall, despite some helpful picks among software firms. These included stocks that—despite the general stock market gloom—actually went up, such as Shanda Interactive Entertainment, a Chinese game-maker, and BMC Software, a business software firm.
The fund benefited from the advisors’ selections among consumer discretionary stocks, even though the sector—which includes companies such as restaurants and retailers that are among the first to feel the pinch of an economic downturn—declined on an absolute basis. These
Expense Ratios1 | | | |
Your Fund Compared With Its Peer Group | | | |
| | | Average |
| Investor | Admiral | Multi-Cap |
| Shares | Shares | Growth Fund |
Morgan Growth Fund | 0.46% | 0.29% | 1.41% |
1 The fund expense ratios shown are from the prospectus dated January 27, 2009, and represent estimated costs for the current fiscal year based on the fund’s current net assets. For the six months ended March 31, 2009, the annualized expense ratios were 0.49% for Investor Shares and 0.32% for Admiral Shares. The peer-group expense ratio is derived from data provided by Lipper Inc. and captures information through year-end 2008.
4
holdings included the stocks of education services providers ITT Educational Services and Apollo Group and, in an economic environment in which consumers favored maintaining their cars rather than buying new ones, the stocks of auto-parts stores, such as O’Reilly Automotive. The advisors also chose well in the troubled financial sector.
Extraordinary markets demand extraordinary discipline
Investors have good reasons for feeling a bit shell-shocked by the sometimes dramatic daily ups and downs of the stock market over the last several months. Most financial assets—not just stocks—suffered historic losses. Even more notable were the speed and breadth of the declines.
While investors cannot control what happened, they can control how they react to extraordinary events and how they position their portfolios. History has shown the importance of maintaining an investment plan that is balanced and diversified within and across asset classes and is consistent with your time horizon, goals, and tolerance for risk. We are confident that such a disciplined investment approach can pay off in the long term.
On a final note, I would like to welcome two new advisors, Frontier Capital Management Co., LLC, and Kalmar Investment Advisers. Frontier, based in Boston, is new to Vanguard. Kalmar, based in Wilmington, Delaware, has served as an advisor to Vanguard Explorer™ Fund since 2005. Our newest advisors replace Franklin Portfolio Associates, LLC. We thank Franklin for its years of service to our shareholders.
As always, thank you for entrusting your assets to Vanguard.
Sincerely,

F. William McNabb III
President and Chief Executive Officer
April 15, 2009
5
Advisors’ Report
During the six months ended March 31, 2009, Vanguard Morgan Growth Fund returned about –28%. Your fund is managed by five independent advisors. This provides exposure to distinct, yet complementary, investment approaches, enhancing the fund’s diversification.
The advisors, the percentage of fund assets each manages, and brief descriptions of their investment strategies are presented in the table below. The advisors have also prepared a discussion of the investment environment that existed during the fiscal period and of how their portfolio positioning reflects this assessment. These comments were prepared on April 15, 2009.
Wellington Management Company, LLP
Portfolio Manager:
Paul E. Marrkand, CFA,
Senior Vice President
Our investment results benefited from strong stock selection in the consumer discretionary, financial, and energy sectors. BMC Software, an enterprise software company, contributed to results. BMC continues to expand its highly profitable mainframe software business despite the
Vanguard Morgan Growth Fund Investment Advisors |
| | | |
| Fund Assets Managed | |
Investment Advisor | % | $ Million | Investment Strategy |
Wellington Management | 38 | 2,150 | Traditional methods of stock selection—research and |
Company, LLP | | | analysis—that identify companies believed to have |
| | | above-average growth prospects, particularly those |
| | | in industries undergoing change. Focuses on mid- |
| | | and large-capitalization companies with proven records |
| | | of sales and earnings growth, profitability and cash |
| | | flow generation. |
Vanguard Quantitative | 21 | 1,189 | Quantitative management using models that assess |
Equity Group | | | valuation, marketplace sentiment, and balance-sheet |
| | | characteristics of companies versus their peers. |
Jennison Associates LLC | 16 | 920 | Research-driven fundamental investment approach that |
| | | relies on in-depth company knowledge gleaned through |
| | | meetings with management, customers, and suppliers. |
Frontier Capital Management Co., LLC | 10 | 577 | Research-driven fundamental investment approach that |
| | | seeks companies with above-average growth prospects, |
| | | reasonable valuations, and competitive advantages. |
Kalmar Investment Advisers | 10 | 547 | Research-driven fundamental investment approach |
| | | that seeks undervalued stocks of vigorously growing |
| | | firms with strong products, strong-to-improving |
| | | balance sheets, attractive or improving returns, |
| | | and conservative accounting. |
Cash Investments | 5 | 306 | These short-term reserves are invested by Vanguard in |
| | | equity index products to simulate investments in stocks. |
| | | Each advisor also may maintain a modest cash position. |
6
weak economic conditions. Shares of Life Technologies, a biotechnology tools and reagents company, also added to returns. The company should accelerate its sales growth rate because of the increased funding for the National Institutes of Health that was included in the 2009 stimulus bill. The free cash flow generated by numerous new products and increased efficiencies from Internet-based distribution will also lead to a higher return on capital for the firm.
Stock selection in consumer staples, materials, and industrials detracted from results. Shares of Caterpillar, the heavy equipment and engine manufacturer, were severely hindered by the global recession. The company’s weak first-quarter results disappointed investors. We added to our holdings in Caterpillar based on the company’s attractive valuation, given its dominant global distribution advantage and its long-term growth prospects.
Our purchases over the previous six months were driven by valuation and growth opportunities. New names included Wal-Mart Stores, Amazon.com, Gilead Sciences, and State Street. We eliminated our holdings in United Technologies, Nike, Kimberly Clark, and Apple. At the end of the period, our largest sector positions were in the information technology, health care, and consumer discretionary sectors.
Vanguard Quantitative Equity Group
Portfolio Manager:
James P. Stetler, Principal
The equity market’s negative momentum from 2008 decelerated a bit during the first calendar quarter as growth stocks returned –4.53% for the three months, as measured by the Russell 3000 Growth Index. That brought the benchmark’s decline for the six-month period to about –27%, while the overall fund was off about –28%.
The first two months of the year were the worst of the period, with the market declining by more than 12% as it reacted negatively to the government’s initial stimulus announcements. However, as the government provided more details and additional plans, the market turned around in March and returned almost 9%.
Whether or not we have reached a market bottom remains to be seen. You can be sure that first-quarter earnings announcements, particularly those in the financial sector, are going to be scrutinized very carefully, and the market’s next steps will certainly be influenced by those results.
Our portion of the fund’s performance relative to its benchmark is derived from our ability to accurately evaluate stocks against their industry and market-cap peers, to identify the outperformers from the under-performers, and to effectively implement those decisions in our portfolio. We analyze companies based on several criteria: relative valuation characteristics, market sentiment/ momentum factors, the quality and direction of earnings, and management decisions regarding key company attributes. We
7
continue to believe strongly that the formula for long-term success involves finding companies with attractive valuation and sentiment characteristics and quality balance sheets. Unfortunately, these characteristics have not been rewarded over recent periods.
For the six-month period, our stock selection was strongest in the consumer discretionary sector, where the portfolio benefited from overweight positions in ITT Educational Services and AutoZone. Relative performance also benefited from underweighting some of the sector’s poorest performers, such as Liberty Media and Johnson Controls. Stock selection was most disappointing in the technology and materials sectors, where holdings in Western Union and Corning (in tech) and United States Steel and Celanese (in materials) detracted from our results.
Jennison Associates LLC
Portfolio Manager:
Kathleen A. McCarragher,
Managing Director
In a period marked by a persistent, full-blown credit crisis and a worsening recession, the portfolio’s relative bright spots included stock selections among its financial, consumer discretionary, and health care holdings.
In the consumer discretionary sector, Amazon.com reported strong earnings in the wake of its biggest holiday season ever, even as other retailers felt the brunt of the recession. The company’s results reflect the ongoing shift toward e-commerce and Amazon.com’s continued gains in market share.
The portfolio was helped by an overweight position and strong security selection in health care, where Mylan and Genentech advanced. The strong earnings of Mylan, a generic drug manufacturer, reflected the integration benefits of recent mergers. The global economic slowdown is expected to boost demand for generic medicines as consumers and governments look to cut costs. As for Genentech, a leader in biotechnology, its share price rose when its majority shareholder, Roche, offered to acquire the remaining interest in the company it didn’t already own at a premium to the prevailing market price.
An underweight stance in industrials aided relative returns, but stock selection in the sector hurt performance. Declining energy prices had an impact on oil and drilling for McDermott International, an engineering and construction company. Defense contractors, including Lockheed Martin, also declined because of concerns about potential cuts in the defense budget. We believe Lockheed’s programs are well-positioned to proceed.
In information technology, Adobe Systems and Hewlett-Packard fell on concerns that the deteriorating economic environment would lead to further cuts in corporate discretionary spending on technology, despite the two companies’ operating efficiency and strong expense control.
8
We remain focused on the profit and cash-flow prospects of our holdings. We believe the firms we own are well-capitalized and capable of generating earnings-per-share growth at a healthy premium to market averages.
Frontier Capital Management Co., LLC
Portfolio Manager:
Stephen Knightly, CFA,
Senior Vice President
During the first calendar quarter, solid stock picking in transportation, telecommunications, technology, and packaging investments provided strong returns. Our hesitancy about the worldwide economy helped performance because this led us to underweight industrials; however, it also prevented us from enjoying the strong bounce that many consumer discretionary stocks enjoyed in March.
In positioning our portfolios, we endeavor to strike a balance on two fronts. First, we capitalize on compelling opportunities by investing in leading companies with bright long-term outlooks but whose near-term prospects are less clear. Second, we identify stocks with steadier short- and long-term growth attributes. As a result of these efforts, we have increased our exposure to a number of leading technology and industrial companies that have reasonable earnings expectations and valuations.
Regardless of the sector, we are focused on corporations with strong balance sheets, below-average price-to-sales valuations, and improved competitive positions. We have been judiciously increasing our exposure to technology and industrials while scaling out of a number of health care holdings. These health care holdings have served us well during the market’s collapse but now face a much more uncertain regulatory and reimbursement outlook because of mounting fiscal budget constraints.
We expect mid-cap growth stocks to remain an area of market leadership given that long-term growth attributes will remain vitally important to asset returns in the low-growth environment we envision. Our approach within this attractive segment of the market is to invest in companies that can not only persevere through the difficult months ahead but also thrive as the economy recovers by enhancing their competitive positions.
Kalmar Investment Advisers
Portfolio Manager:
Ford B. Draper, Jr., President and
Chief Investment Officer
As a new manager for Vanguard Morgan Growth Fund, Kalmar has been on board for just four of the past six months. This was a very challenging and volatile time in the stock market as the global economy went into temporary free fall. Sharp spending cutbacks by consumers prompted drastic inventory cutbacks by businesses. Under pressure from both, corporate earnings declined sharply, the outlook for many businesses became unclear,
9
and investors’ risk appetites plummeted. Finding companies that could actually deliver growth under these circumstances was extremely difficult.
January and February produced severe losses in the stock market that led to an extremely oversold market in early March. Out of this came a flashy bear market rally as many early-cycle, more-economically-sensitive stocks surged on hope, the purchase of shares to cover short positions, and the Obama administration’s announcement of additional massive stimulus programs and its efforts to thaw the credit market and remove toxic assets from banks.
However, given the economic drag from the deleveraging of balance sheets, rising unemployment, falling disposable income, and severe wealth destruction, we believe it is premature to assume that equities will make sustainable headway going forward. We do believe that the market has commenced a drawn-out, volatile bottoming process, and though the ultimate low may have come in early March, the end of that bottoming process probably still lies ahead.
On the other hand, it would appear reasonable to expect that by the fall the market may be able to discount a low-sloping economic recovery that would begin in 2010. Thus, Kalmar will continue to build into its portion of the Morgan Growth Fund companies that should be able to thrive in a low-growth recovery marked by constrained credit.
Looking backward to the market challenges of the last four months, our returns suffered, for example, from declines in Corrections Corporation of America, a for-profit prison management company whose stock was hurt by fears of capacity cutbacks in light of the budgetary deficits of its state clients. Also underperforming was Central European Distribution, the U.S.-managed spirits and vodka brand owner and distributor, whose sizable new investments in Russia became threatened by political developments and the sudden decline in the ruble.
Examples on the winning side were MetroPCS Communications and O’Reilly Automotive. MetroPCS, which offers low-cost, no-frills cell phone service, is gaining notable market share as it expands its operating territories city by city around the country. O’Reilly’s auto parts distribution business is benefiting as consumers retain their cars longer and the company successfully integrates a large geographic acquisition.
10
Morgan Growth Fund
Fund Profile
As of March 31, 2009
Portfolio Characteristics | | |
| | Comparative | Broad |
| Fund | Index1 | Index2 |
Number of Stocks | 342 | 1,818 | 4,489 |
Median Market Cap | $17.8B | $21.8B | $22.3B |
Price/Earnings Ratio | 13.8x | 13.6x | 15.0x |
Price/Book Ratio | 2.6x | 2.6x | 1.7x |
Yield3 | | 2.0% | 2.7% |
Investor Shares | 0.9% | | |
Admiral Shares | 1.1% | | |
Return on Equity | 22.7% | 23.0% | 20.2% |
Earnings Growth Rate | 21.2% | 21.4% | 15.0% |
Foreign Holdings | 3.2% | 0.0% | 0.0% |
Turnover Rate4 | 91% | — | — |
Expense Ratio5 | | — | — |
Investor Shares | 0.46% | | |
Admiral Shares | 0.29% | | |
Short-Term Reserves | 2.6% | — | — |
Sector Diversification (% of equity exposure) |
| | Comparative | Broad |
| Fund | Index1 | Index2 |
Consumer Discretionary | 11.3% | 10.5% | 9.4% |
Consumer Staples | 9.4 | 13.1 | 11.2 |
Energy | 8.6 | 7.8 | 12.3 |
Financials | 5.6 | 3.4 | 13.1 |
Health Care | 18.1 | 15.7 | 14.6 |
Industrials | 9.2 | 12.2 | 10.0 |
Information Technology | 32.9 | 30.5 | 17.7 |
Materials | 3.4 | 4.1 | 3.7 |
Telecommunication | | | |
Services | 1.1 | 0.9 | 3.6 |
Utilities | 0.4 | 1.8 | 4.4 |
Volatility Measures6 | |
| Fund Versus | Fund Versus |
| Comparative Index1 | Broad Index2 |
R-Squared | 0.98 | 0.93 |
Beta | 1.02 | 1.00 |
Ten Largest Holdings7 (% of total net assets) |
| | |
Cisco Systems, Inc. | communications | |
| equipment | 3.1% |
Microsoft Corp. | systems software | 2.8 |
International Business | | |
Machines Corp. | computer hardware | 2.5 |
Oracle Corp. | systems software | 2.3 |
Wal-Mart Stores, Inc. | hypermarkets | |
| and super centers | 2.0 |
Abbott Laboratories | pharmaceuticals | 1.7 |
Occidental | integrated oil | |
Petroleum Corp. | and gas | 1.5 |
Gilead Sciences, Inc. | biotechnology | 1.5 |
QUALCOMM Inc. | communications | |
| equipment | 1.4 |
Philip Morris | | |
International Inc. | tobacco | 1.3 |
Top Ten | | 20.1% |
Investment Focus
1 Russell 3000 Growth Index.
2 Dow Jones Wilshire 5000 Index.
3 30-day SEC yield for the fund; annualized dividend yield for the indexes. See the Glossary.
4 Annualized.
5 The expense ratios shown are from the prospectus dated January 27, 2009, and represent estimated costs for the current fiscal year based on the fund’s current net assets. For the six months ended March 31, 2009, the annualized expense ratios were 0.49% for Investor Shares and 0.32% for Admiral Shares.
6 For an explanation of R-squared, beta, and other terms used here, see the Glossary.
7 The holdings listed exclude any temporary cash investments and equity index products.
11
Morgan Growth Fund
Performance Summary
All of the returns in this report represent past performance, which is not a guarantee of future results that may be achieved by the fund. (Current performance may be lower or higher than the performance data cited. For performance data current to the most recent month-end, visit our website at www.vanguard.com/performance.) Note, too, that both investment returns and principal value can fluctuate widely, so an investor’s shares, when sold, could be worth more or less than their original cost. The returns shown do not reflect taxes that a shareholder would pay on fund distributions or on the sale of fund shares.
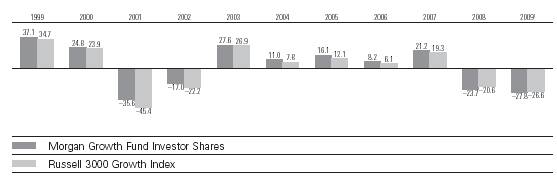
Fiscal-Year Total Returns (%): September 30, 1998–March 31, 2009
Average Annual Total Returns: Periods Ended March 31, 2009
| Inception Date | One Year | Five Years | Ten Years |
Investor Shares2 | 12/31/1968 | –37.03% | –4.09% | –1.88% |
Admiral Shares | 5/14/2001 | –36.95 | –3.94 | –2.993 |
1 Six months ended March 31, 2009.
2 Total returns do not include the account service fee that may be applicable to certain accounts with balances below $10,000.
3 Return since inception.
Note: See Financial Highlights tables for dividend and capital gains information.
12
Morgan Growth Fund
Financial Statements (unaudited)
Statement of Net Assets
As of March 31, 2009
The fund provides a complete list of its holdings four times in each fiscal year, at the quarter-ends. For the second and fourth fiscal quarters, the lists appear in the fund’s semiannual and annual reports to shareholders. For the first and third fiscal quarters, the fund files the lists with the Securities and Exchange Commission on Form N-Q. Shareholders can look up the fund’s Forms N-Q on the SEC’s website at www.sec.gov. Forms N-Q may also be reviewed and copied at the SEC’s Public Reference Room (see the back cover of this report for further information).
| | | Market |
| | | Value• |
| | Shares | ($000) |
Common Stocks (93.2%)1 | | |
Consumer Discretionary (10.6%) | | |
* | Amazon.com, Inc. | 809,605 | 59,457 |
| TJX Cos., Inc. | 2,133,600 | 54,706 |
* | AutoZone Inc. | 292,800 | 47,615 |
* | Apollo Group, Inc. | | |
| Class A | 466,300 | 36,525 |
| Advance Auto Parts, Inc. | 763,700 | 31,373 |
| NIKE, Inc. Class B | 463,500 | 21,734 |
* | ITT Educational | | |
| Services, Inc. | 168,800 | 20,496 |
* | Urban Outfitters, Inc. | 1,209,900 | 19,806 |
* | O’Reilly Automotive, Inc. | 535,480 | 18,747 |
| Yum! Brands, Inc. | 668,100 | 18,359 |
| Target Corp. | 528,800 | 18,185 |
* | LKQ Corp. | 1,146,735 | 16,364 |
| McDonald’s Corp. | 294,300 | 16,060 |
* | Dollar Tree, Inc. | 346,000 | 15,414 |
| The Walt Disney Co. | 766,400 | 13,918 |
* | GameStop Corp. Class A | 467,320 | 13,094 |
* | Coach, Inc. | 780,400 | 13,033 |
| Abercrombie & Fitch Co. | 511,300 | 12,169 |
* | Kohl’s Corp. | 259,300 | 10,974 |
| DeVry, Inc. | 227,200 | 10,947 |
| Scripps Networks | | |
| Interactive | 477,800 | 10,755 |
| Family Dollar Stores, Inc. | 305,800 | 10,205 |
| Lowe’s Cos., Inc. | 550,200 | 10,041 |
| Burger King Holdings Inc. | 408,200 | 9,368 |
* | DreamWorks | | |
| Animation SKG, Inc. | 410,000 | 8,872 |
* | Tractor Supply Co. | 243,700 | 8,788 |
| Comcast Corp. | | |
| Special Class A | 635,134 | 8,174 |
* | Penn National Gaming, Inc. | 337,400 | 8,148 |
| Comcast Corp. Class A | 578,525 | 7,891 |
| The Gap, Inc. | 515,200 | 6,693 |
| Omnicom Group Inc. | 256,300 | 5,997 |
| Service Corp. International | 1,645,300 | 5,742 |
| Polo Ralph Lauren Corp. | 122,700 | 5,184 |
* | Bed Bath & Beyond, Inc. | 183,800 | 4,549 |
| Ross Stores, Inc. | 121,200 | 4,349 |
* | DIRECTV Group, Inc. | 155,226 | 3,538 |
| The McGraw-Hill Cos., Inc. | 150,900 | 3,451 |
* | Panera Bread Co. | 52,500 | 2,935 |
* | DISH Network Corp. | 249,900 | 2,776 |
* | WMS Industries, Inc. | 132,700 | 2,775 |
| Tiffany & Co. | 107,900 | 2,326 |
| H & R Block, Inc. | 120,400 | 2,190 |
* | Priceline.com, Inc. | 1,500 | 118 |
| | | 603,841 |
Consumer Staples (8.5%) | | |
| Wal-Mart Stores, Inc. | 2,236,300 | 116,511 |
| Philip Morris | | |
| International Inc. | 2,080,200 | 74,014 |
| Colgate-Palmolive Co. | 771,825 | 45,522 |
| PepsiCo, Inc. | 648,700 | 33,395 |
| Costco Wholesale Corp. | 682,999 | 31,637 |
| The Coca-Cola Co. | 629,078 | 27,648 |
| The Procter & Gamble Co. | 535,336 | 25,209 |
| Kellogg Co. | 601,300 | 22,026 |
| Nestle SA ADR | 569,400 | 19,083 |
* | Cadbury PLC | 426,000 | 12,908 |
| CVS Caremark Corp. | 461,310 | 12,681 |
| The Kroger Co. | 491,900 | 10,438 |
| Sysco Corp. | 282,600 | 6,443 |
* | Central European | | |
| Distribution Corp. | 466,300 | 5,017 |
| H.J. Heinz Co. | 147,400 | 4,873 |
| Herbalife Ltd. | 324,400 | 4,860 |
| Lorillard, Inc. | 75,200 | 4,643 |
| Campbell Soup Co. | 154,600 | 4,230 |
| Molson Coors Brewing Co. | |
| Class B | 110,400 | 3,785 |
* | Energizer Holdings, Inc. | 68,300 | 3,394 |
* | Ralcorp Holdings, Inc. | 58,600 | 3,157 |
* | Dr. Pepper Snapple | | |
| Group, Inc. | 163,600 | 2,767 |
| General Mills, Inc. | 47,700 | 2,379 |
* | Dean Foods Co. | 120,800 | 2,184 |
13
Morgan Growth Fund
| | | Market |
| | | Value• |
| | Shares | ($000) |
| Walgreen Co. | 82,600 | 2,144 |
| Avon Products, Inc. | 96,000 | 1,846 |
| Archer-Daniels-Midland Co. | 54,967 | 1,527 |
| | | 484,321 |
Energy (7.8%) | | |
| Occidental Petroleum Corp. | 1,557,000 | 86,647 |
| XTO Energy, Inc. | 1,083,575 | 33,179 |
| Hess Corp. | 606,700 | 32,883 |
| Noble Energy, Inc. | 468,300 | 25,232 |
| Smith International, Inc. | 1,148,200 | 24,663 |
| Diamond Offshore | | |
| Drilling, Inc. | 382,600 | 24,050 |
* | Southwestern Energy Co. | 799,400 | 23,734 |
| Schlumberger Ltd. | 562,700 | 22,857 |
| Apache Corp. | 313,700 | 20,105 |
* | Transocean Ltd. | 258,607 | 15,216 |
| Baker Hughes Inc. | 458,500 | 13,090 |
| Noble Corp. | 424,700 | 10,231 |
| Tidewater Inc. | 265,500 | 9,858 |
* | Continental Resources, Inc. | 455,900 | 9,670 |
* | Ultra Petroleum Corp. | 255,500 | 9,170 |
| Cabot Oil & Gas Corp. | 384,000 | 9,051 |
* | Petrohawk Energy Corp. | 464,720 | 8,937 |
| Core Laboratories N.V. | 100,400 | 7,345 |
* | Weatherford | | |
| International Ltd. | 662,700 | 7,336 |
| Peabody Energy Corp. | 270,500 | 6,773 |
| CONSOL Energy, Inc. | 262,700 | 6,631 |
| Murphy Oil Corp. | 139,700 | 6,254 |
| EOG Resources, Inc. | 110,000 | 6,024 |
| ENSCO International, Inc. | 173,951 | 4,592 |
* | Cameron International Corp. | 209,400 | 4,592 |
* | Oceaneering | | |
| International, Inc. | 124,400 | 4,587 |
* | Atwood Oceanics, Inc. | 262,000 | 4,347 |
* | National Oilwell Varco Inc. | 91,000 | 2,613 |
| Arch Coal, Inc. | 138,800 | 1,856 |
| Helmerich & Payne, Inc. | 39,400 | 897 |
| Massey Energy Co. | 69,800 | 706 |
* | FMC Technologies Inc. | 3,500 | 110 |
| Walter Industries, Inc. | 4,000 | 92 |
| | | 443,328 |
Exchange-Traded Fund (0.7%) | | |
2 | Vanguard Growth ETF | 1,044,900 | 39,037 |
| | | |
Financials (4.9%) | | |
| The Goldman Sachs | | |
| Group, Inc. | 412,600 | 43,744 |
| Charles Schwab Corp. | 1,728,855 | 26,797 |
| State Street Corp. | 783,300 | 24,110 |
| Morgan Stanley | 822,300 | 18,724 |
| Northern Trust Corp. | 289,200 | 17,300 |
| BlackRock, Inc. | 107,300 | 13,953 |
^ | Raymond James | | |
| Financial, Inc. | 509,000 | 10,027 |
* | Berkshire Hathaway Inc. | | |
| Class B | 3,302 | 9,312 |
| Wells Fargo & Co. | 647,500 | 9,220 |
| Everest Re Group, Ltd. | 127,600 | 9,034 |
* | Nasdaq OMX Group, Inc. | 429,300 | 8,406 |
| W.R. Berkley Corp. | 370,000 | 8,343 |
* | Affiliated Managers | | |
| Group, Inc. | 196,400 | 8,192 |
| The Chubb Corp. | 182,700 | 7,732 |
* | Itau Unibanco Banco | | |
| Multiplo SA | 690,584 | 7,514 |
| Aon Corp. | 183,000 | 7,470 |
| AFLAC Inc. | 314,100 | 6,081 |
| Annaly Capital | | |
| Management Inc. REIT | 398,200 | 5,523 |
| T. Rowe Price Group Inc. | 189,900 | 5,480 |
* | TD Ameritrade Holding Corp. | 373,600 | 5,159 |
| Invesco, Ltd. | 354,600 | 4,915 |
| Progressive Corp. of Ohio | 331,000 | 4,449 |
| CME Group, Inc. | 16,450 | 4,053 |
| Franklin Resources, Inc. | 73,500 | 3,959 |
| Hudson City Bancorp, Inc. | 301,800 | 3,528 |
| Simon Property | | |
| Group, Inc. REIT | 56,198 | 1,947 |
| Bank of New York | | |
| Mellon Corp. | 50,200 | 1,418 |
| Moody’s Corp. | 55,800 | 1,279 |
| Public Storage, Inc. REIT | 22,400 | 1,238 |
* | The St. Joe Co. | 66,700 | 1,117 |
| Jefferies Group, Inc. | 46,100 | 636 |
| | | 280,660 |
Health Care (16.9%) | | |
| Abbott Laboratories | 2,049,730 | 97,772 |
* | Gilead Sciences, Inc. | 1,796,500 | 83,214 |
| Eli Lilly & Co. | 1,611,900 | 53,854 |
| Baxter International, Inc. | 841,572 | 43,105 |
* | Medco Health Solutions, Inc. | 935,900 | 38,690 |
* | Amgen Inc. | 755,100 | 37,393 |
| Medtronic, Inc. | 1,268,099 | 37,371 |
| Teva Pharmaceutical | | |
| Industries Ltd. | | |
| Sponsored ADR | 762,200 | 34,337 |
| Johnson & Johnson | 562,800 | 29,603 |
* | Celgene Corp. | 647,900 | 28,767 |
* | Varian Medical Systems, Inc. | 825,700 | 25,134 |
* | Genzyme Corp. | 396,193 | 23,530 |
* | Life Technologies Corp. | 640,300 | 20,797 |
* | Express Scripts Inc. | 448,300 | 20,698 |
| Alcon, Inc. | 222,000 | 20,182 |
| Roche Holding AG ADR | 563,300 | 19,364 |
* | Mylan Inc. | 1,439,200 | 19,300 |
| AstraZeneca Group | | |
| PLC ADR | 535,200 | 18,973 |
| Merck & Co., Inc. | 566,200 | 15,146 |
| Pharmaceutical Product | | |
| Development, Inc. | 589,800 | 13,990 |
* | DaVita, Inc. | 301,700 | 13,260 |
14
Morgan Growth Fund
| | | Market |
| | | Value• |
| | Shares | ($000) |
* | St. Jude Medical, Inc. | 342,500 | 12,443 |
* | Endo Pharmaceuticals | | |
| Holdings, Inc. | 672,600 | 11,892 |
| Wyeth | 274,000 | 11,793 |
| Omnicare, Inc. | 462,408 | 11,324 |
* | ResMed Inc. | 313,600 | 11,083 |
* | Biogen Idec Inc. | 202,800 | 10,631 |
* | Cephalon, Inc. | 150,280 | 10,234 |
* | Thermo Fisher | | |
| Scientific, Inc. | 286,100 | 10,205 |
* | VCA Antech, Inc. | 400,700 | 9,036 |
| PerkinElmer, Inc. | 696,500 | 8,894 |
| Beckman Coulter, Inc. | 172,400 | 8,794 |
* | Covance, Inc. | 244,800 | 8,722 |
* | Intuitive Surgical, Inc. | 91,428 | 8,719 |
| Quest Diagnostics, Inc. | 175,400 | 8,328 |
| Covidien Ltd. | 249,800 | 8,303 |
| Schering-Plough Corp. | 324,720 | 7,647 |
| UnitedHealth Group Inc. | 353,700 | 7,403 |
* | Edwards Lifesciences Corp. | 118,900 | 7,209 |
* | Hologic, Inc. | 517,700 | 6,777 |
* | Patterson Companies, Inc. | 319,900 | 6,033 |
* | IDEXX Laboratories, Inc. | 174,000 | 6,017 |
* | Laboratory Corp. of | | |
| America Holdings | 101,700 | 5,948 |
| C.R. Bard, Inc. | 73,900 | 5,891 |
* | Myriad Genetics, Inc. | 125,200 | 5,693 |
* | Psychiatric Solutions, Inc. | 357,400 | 5,622 |
*,^ | Qiagen NV | 347,000 | 5,538 |
* | Immucor Inc. | 218,800 | 5,503 |
| Shire PLC ADR | 145,500 | 5,229 |
* | Watson Pharmaceuticals, Inc. | 160,600 | 4,996 |
| McKesson Corp. | 135,800 | 4,758 |
* | Vertex Pharmaceuticals, Inc. | 147,900 | 4,249 |
* | Lincare Holdings, Inc. | 188,300 | 4,105 |
* | Amylin Pharmaceuticals, Inc. | 344,200 | 4,044 |
* | Millipore Corp. | 65,317 | 3,750 |
| Techne Corp. | 64,200 | 3,512 |
* | WellPoint Inc. | 65,372 | 2,482 |
| Becton, Dickinson & Co. | 21,600 | 1,452 |
* | Hospira, Inc. | 18,700 | 577 |
* | Warner Chilcott Ltd. | 29,800 | 314 |
| | | 959,630 |
Industrials (8.5%) | | |
| Raytheon Co. | 1,080,200 | 42,063 |
| Emerson Electric Co. | 1,457,600 | 41,658 |
| Caterpillar, Inc. | 1,061,100 | 29,668 |
| Joy Global Inc. | 1,275,400 | 27,166 |
| Cummins Inc. | 900,800 | 22,925 |
| Fluor Corp. | 623,318 | 21,536 |
| Dover Corp. | 798,000 | 21,051 |
| Lockheed Martin Corp. | 288,082 | 19,886 |
| Ametek, Inc. | 504,957 | 15,790 |
* | Jacobs Engineering | | |
| Group Inc. | 368,500 | 14,246 |
| General Dynamics Corp. | 288,400 | 11,995 |
* | Aecom Technology Corp. | 441,300 | 11,509 |
* | Navistar International Corp. | 322,747 | 10,799 |
* | Clean Harbors Inc. | 204,900 | 9,835 |
* | Corrections Corp. of America | 705,600 | 9,039 |
* | Stericycle, Inc. | 186,900 | 8,921 |
* | URS Corp. | 220,516 | 8,911 |
| ITT Industries, Inc. | 223,900 | 8,614 |
| Burlington Northern | | |
| Santa Fe Corp. | 135,200 | 8,132 |
| Union Pacific Corp. | 197,800 | 8,132 |
| Expeditors International | | |
| of Washington, Inc. | 273,400 | 7,735 |
* | Foster Wheeler AG | 428,190 | 7,481 |
| L-3 Communications | | |
| Holdings, Inc. | 102,200 | 6,929 |
| Republic Services, Inc. | | |
| Class A | 369,700 | 6,340 |
| Illinois Tool Works, Inc. | 199,300 | 6,149 |
* | Quanta Services, Inc. | 279,400 | 5,993 |
^ | Ritchie Brothers | | |
| Auctioneers Inc. | 306,125 | 5,691 |
| MSC Industrial | | |
| Direct Co., Inc. Class A | 172,800 | 5,369 |
^ | Fastenal Co. | 166,900 | 5,367 |
| The Boeing Co. | 150,600 | 5,358 |
| Goodrich Corp. | 137,300 | 5,202 |
| Waste Management, Inc. | 202,900 | 5,194 |
| 3M Co. | 101,400 | 5,042 |
| C.H. Robinson | | |
| Worldwide Inc. | 107,000 | 4,880 |
| J.B. Hunt | | |
| Transport Services, Inc. | 201,800 | 4,865 |
* | AGCO Corp. | 204,300 | 4,004 |
| Honeywell International Inc. | 132,200 | 3,683 |
| Flowserve Corp. | 63,900 | 3,586 |
* | Tetra Tech, Inc. | 163,500 | 3,332 |
| Danaher Corp. | 60,000 | 3,253 |
* | Kansas City Southern | 251,800 | 3,200 |
| The Dun & Bradstreet Corp. | 41,480 | 3,194 |
| Norfolk Southern Corp. | 91,600 | 3,092 |
| CSX Corp. | 116,500 | 3,012 |
| Deere & Co. | 67,700 | 2,225 |
| Pitney Bowes, Inc. | 81,700 | 1,908 |
* | First Solar, Inc. | 13,600 | 1,805 |
* | Alliant Techsystems, Inc. | 22,000 | 1,474 |
| Ryder System, Inc. | 48,900 | 1,384 |
| United Technologies Corp. | 31,600 | 1,358 |
| Precision Castparts Corp. | 19,000 | 1,138 |
* | AMR Corp. | 207,000 | 660 |
| | | 481,779 |
Information Technology (31.0%) | | |
* | Cisco Systems, Inc. | 10,513,800 | 176,316 |
| Microsoft Corp. | 8,801,375 | 161,681 |
| International Business | | |
| Machines Corp. | 1,447,600 | 140,258 |
* | Oracle Corp. | 7,358,400 | 132,966 |
| | | | |
| QUALCOMM Inc. | 2,002,154 | 77,904 |
15
Morgan Growth Fund
| | | Market |
| | | Value• |
| | Shares | ($000) |
| Altera Corp. | 3,712,900 | 65,161 |
* | Google Inc. | 186,800 | 65,018 |
* | Apple Inc. | 536,000 | 56,344 |
* | BMC Software, Inc. | 1,697,199 | 56,008 |
| Hewlett-Packard Co. | 1,455,400 | 46,660 |
* | NetApp, Inc. | 3,052,000 | 45,292 |
| Visa Inc. | 761,500 | 42,339 |
| Xilinx, Inc. | 2,123,910 | 40,694 |
| Intel Corp. | 2,534,300 | 38,141 |
| Accenture Ltd. | 1,243,444 | 34,182 |
| Texas Instruments, Inc. | 1,854,605 | 30,620 |
| Analog Devices, Inc. | 1,521,000 | 29,310 |
* | QLogic Corp. | 2,504,100 | 27,846 |
* | Adobe Systems, Inc. | 1,109,600 | 23,734 |
* | Hewitt Associates, Inc. | 762,800 | 22,701 |
* | Activision Blizzard, Inc. | 2,149,290 | 22,482 |
* | Juniper Networks, Inc. | 1,491,200 | 22,457 |
* | Research In Motion Ltd. | 520,900 | 22,435 |
| Western Union Co. | 1,747,436 | 21,965 |
* | Symantec Corp. | 1,454,200 | 21,726 |
| MasterCard, Inc. Class A | 128,300 | 21,488 |
*,^ | Shanda Interactive | | |
| Entertainment, Ltd. | 458,700 | 18,132 |
* | Cognizant Technology | | |
| Solutions Corp. | 769,600 | 16,000 |
* | Microsemi Corp. | 1,338,600 | 15,528 |
* | Teradata Corp. | 910,800 | 14,773 |
* | SAIC, Inc. | 749,500 | 13,993 |
*,^ | Alliance Data Systems Corp. | 365,100 | 13,490 |
* | McAfee Inc. | 379,400 | 12,710 |
* | Equinix, Inc. | 210,900 | 11,842 |
* | Affiliated Computer | | |
| Services, Inc. Class A | 245,200 | 11,743 |
* | Emulex Corp. | 2,068,100 | 10,403 |
| Applied Materials, Inc. | 916,600 | 9,853 |
* | Sohu.com Inc. | 237,400 | 9,807 |
| Amphenol Corp. Class A | 308,600 | 8,792 |
* | EMC Corp. | 732,000 | 8,345 |
* | Amdocs Ltd. | 446,100 | 8,262 |
* | Western Digital Corp. | 412,300 | 7,974 |
| FactSet Research | | |
| Systems Inc. | 151,600 | 7,579 |
^ | Giant Interactive | | |
| Group Inc. | 1,058,100 | 7,195 |
* | Macrovision | | |
| Solutions Corp. | 362,800 | 6,454 |
* | F5 Networks, Inc. | 307,500 | 6,442 |
* | Intuit, Inc. | 217,000 | 5,859 |
* | Marvell Technology | | |
| Group Ltd. | 630,900 | 5,779 |
| CA, Inc. | 328,000 | 5,776 |
* | Broadcom Corp. | 283,900 | 5,672 |
* | FLIR Systems, Inc. | 271,900 | 5,569 |
* | NeuStar, Inc. Class A | 323,100 | 5,412 |
* | ANSYS, Inc. | 197,700 | 4,962 |
| Automatic Data | | |
| Processing, Inc. | 136,900 | 4,813 |
* | Fiserv, Inc. | 125,300 | 4,568 |
| Linear Technology Corp. | 183,900 | 4,226 |
* | LSI Corp. | 1,379,900 | 4,195 |
* | VeriSign, Inc. | 219,600 | 4,144 |
| Global Payments Inc. | 121,900 | 4,073 |
* | Check Point Software | | |
| Technologies Ltd. | 181,900 | 4,040 |
* | Skyworks Solutions, Inc. | 496,200 | 3,999 |
* | Nuance | | |
| Communications, Inc. | 355,300 | 3,859 |
* | Concur Technologies, Inc. | 183,700 | 3,525 |
| National | | |
| Semiconductor Corp. | 319,200 | 3,278 |
| Microchip Technology, Inc. | 146,700 | 3,109 |
* | Polycom, Inc. | 190,420 | 2,931 |
* | NCR Corp. | 286,000 | 2,274 |
* | Dolby Laboratories Inc. | 59,400 | 2,026 |
* | Dell Inc. | 200,100 | 1,897 |
* | MEMC Electronic | | |
| Materials, Inc. | 111,300 | 1,835 |
* | eBay Inc. | 132,800 | 1,668 |
* | Lexmark International, Inc. | 65,900 | 1,112 |
* | Mettler-Toledo | | |
| International Inc. | 400 | 21 |
| | | 1,765,667 |
Materials (3.2%) | | |
| Monsanto Co. | 792,157 | 65,828 |
| FMC Corp. | 650,700 | 28,071 |
* | Crown Holdings, Inc. | 1,001,200 | 22,757 |
| The Mosaic Co. | 407,000 | 17,086 |
| Praxair, Inc. | 213,700 | 14,380 |
| Airgas, Inc. | 166,200 | 5,619 |
| Albemarle Corp. | 244,200 | 5,316 |
| Martin Marietta | | |
| Materials, Inc. | 66,200 | 5,250 |
| Ecolab, Inc. | 115,400 | 4,008 |
| Barrick Gold Corp. | 104,400 | 3,385 |
| Celanese Corp. Series A | 196,500 | 2,627 |
* | Owens-Illinois, Inc. | 177,800 | 2,568 |
| Cliffs Natural Resources Inc. | 97,900 | 1,778 |
| Newmont Mining Corp. | | |
| (Holding Co.) | 28,700 | 1,285 |
| Terra Industries, Inc. | 35,600 | 1,000 |
| CF Industries Holdings, Inc. | 9,200 | 654 |
| | | 181,612 |
Telecommunication Services (0.9%) | | |
* | American | | |
| Tower Corp. Class A | 803,300 | 24,444 |
* | MetroPCS | | |
| Communications Inc. | 1,135,300 | 19,391 |
| | | | |
| Brasil Telecom SA-ADR | 445,693 | 7,390 |
* | Level 3 | | |
| Communications, Inc. | 535,400 | 492 |
| | | 51,717 |
16
Morgan Growth Fund
| | | Market |
| | | Value• |
| | Shares | ($000) |
Utilities (0.2%) | | |
| PPL Corp. | 256,300 | 7,358 |
* | NRG Energy, Inc. | 108,000 | 1,901 |
* | AES Corp. | 125,200 | 728 |
| | | 9,987 |
Total Common Stocks | | |
(Cost $6,299,249) | | 5,301,579 |
Temporary Cash Investments (8.2%)1 | | |
Money Market Fund (6.5%) | | |
3,4 | Vanguard Market | | |
| Liquidity Fund, | | |
| 0.440% | 372,135,155 | 372,135 |
| | | |
| | | |
| | Face | |
| | Amount | |
| | ($000) | |
Repurchase Agreement (1.1%) | | |
| JPMorgan Securities Inc. | | |
| 0.240%, 4/1/09 (Dated 3/31/09, | | |
| Repurchase Value | | |
| $61,700,000, collateralized | | |
| by Federal National Mortgage | | |
| Assn. 5.500%–7.000%, | | |
| 5/1/37–6/1/38) | 61,700 | 61,700 |
| | | |
U.S. Government and Agency Obligations (0.6%) |
5,6 | Federal Home Loan Mortgage | | |
| Corp., 1.206%, 4/30/09 | 21,000 | 20,999 |
5,6 | Federal National Mortgage | | |
| Assn., 0.531%, 7/31/09 | 5,000 | 4,996 |
5,6 | Federal Home Loan Mortgage | | |
| Corp., 0.381%, 8/24/09 | 8,000 | 7,990 |
| | | 33,985 |
Total Temporary Cash Investments | | |
(Cost $467,794) | | 467,820 |
| Market |
| Value• |
| ($000) |
Total Investments (101.4%) | |
(Cost $6,767,043) | 5,769,399 |
Other Assets and Liabilities (–1.4%) | |
Other Assets | 45,667 |
Liabilities4 | (126,225) |
| (80,558) |
Net Assets (100%) | 5,688,841 |
At March 31, 2009, net assets consisted of: | |
| Amount |
| ($000) |
Paid-in Capital | 8,953,798 |
Overdistributed Net Investment Income | (240) |
Accumulated Net Realized Losses | (2,278,768) |
Unrealized Appreciation (Depreciation) | |
Investment Securities | (997,644) |
Futures Contracts | 11,708 |
Foreign Currencies | (13) |
Net Assets | 5,688,841 |
| |
| |
Investor Shares—Net Assets | |
Applicable to 360,183,306 outstanding | |
$.001 par value shares of beneficial | |
interest (unlimited authorization) | 3,889,235 |
Net Asset Value Per Share— | |
Investor Shares | $10.80 |
| |
| |
Admiral Shares—Net Assets | |
Applicable to 53,768,504 outstanding | |
$.001 par value shares of beneficial | |
interest (unlimited authorization) | 1,799,606 |
Net Asset Value Per Share— | |
Admiral Shares | $33.47 |
• See Note A in Notes to Financial Statements.
* Non-income-producing security.
^ Part of security position is on loan to broker-dealers. The total value of securities on loan is $51,878,000.
1 The fund invests a portion of its cash reserves in equity markets through the use of index futures contracts. After giving effect to futures investments, the fund’s effective common stock and temporary cash investment positions represent 97.8% and 3.6%, respectively, of net assets.
2 Considered an affiliated company of the fund as the issuer is another member of The Vanguard Group.
3 Affiliated money market fund available only to Vanguard funds and certain trusts and accounts managed by Vanguard. Rate shown is the 7-day yield.
4 Includes $53,865,000 of collateral received for securities on loan.
5 The issuer operates under a congressional charter; its securities are not backed by the full faith and credit of the U.S. government.
6 Securities with a value of $33,985,000 have been segregated as initial margin for open futures contracts.
ADR—American Depositary Receipt.
REIT—Real Estate Investment Trust.
See accompanying Notes, which are an integral part of the Financial Statements.
17
Morgan Growth Fund
Statement of Operations
| Six Months Ended |
| March 31, 2009 |
| ($000) |
Investment Income | |
Income | |
Dividends1,2 | 44,165 |
Interest2 | 1,833 |
Security Lending | 890 |
Total Income | 46,888 |
Expenses | |
Investment Advisory Fees—Note B | |
Basic Fee | 4,082 |
Performance Adjustment | 622 |
The Vanguard Group—Note C | |
Management and Administrative—Investor Shares | 5,693 |
Management and Administrative—Admiral Shares | 1,003 |
Marketing and Distribution—Investor Shares | 783 |
Marketing and Distribution—Admiral Shares | 371 |
Custodian Fees | 46 |
Auditing Fees | 1 |
Shareholders’ Reports—Investor Shares | 57 |
Shareholders’ Reports—Admiral Shares | 18 |
Trustees’ Fees and Expenses | 5 |
Total Expenses | 12,681 |
Expenses Paid Indirectly | (261) |
Net Expenses | 12,420 |
Net Investment Income | 34,468 |
Realized Net Gain (Loss) | |
Investment Securities Sold2 | (1,751,243) |
Futures Contracts | (126,715) |
Foreign Currencies | (201) |
Realized Net Gain (Loss) | (1,878,159) |
Change in Unrealized Appreciation (Depreciation) | |
Investment Securities | (394,345) |
Futures Contracts | 32,004 |
Foreign Currencies | (26) |
Change in Unrealized Appreciation (Depreciation) | (362,367) |
Net Increase (Decrease) in Net Assets Resulting from Operations | (2,206,058) |
1 Dividends are net of foreign withholding taxes of $213,000.
2 Dividend income, interest income, and realized net gain (loss) from affiliated companies of the fund were $330,000, $1,502,000, and $0, respectively.
See accompanying Notes, which are an integral part of the Financial Statements.
18
Morgan Growth Fund
Statement of Changes in Net Assets
| Six Months Ended | | Year Ended |
| March 31, | | September 30, |
| 2009 | | 2008 |
| ($000) | | ($000) |
Increase (Decrease) in Net Assets | | | |
Operations | | | |
Net Investment Income | 34,468 | | 78,392 |
Realized Net Gain (Loss) | (1,878,159) | | (302,261) |
Change in Unrealized Appreciation (Depreciation) | (362,367) | | (2,160,476) |
Net Increase (Decrease) in Net Assets Resulting from Operations | (2,206,058) | | (2,384,345) |
Distributions | | | |
Net Investment Income | | | |
Investor Shares | (50,414) | | (54,791) |
Admiral Shares | (27,239) | | (27,586) |
Realized Capital Gain1 | | | |
Investor Shares | — | | (426,117) |
Admiral Shares | — | | (181,607) |
Total Distributions | (77,653) | | (690,101) |
Capital Share Transactions | | | |
Investor Shares | 31,531 | | 949,252 |
Admiral Shares | 10,738 | | 782,658 |
Net Increase (Decrease) from Capital Share Transactions | 42,269 | | 1,731,910 |
Total Increase (Decrease) | (2,241,442) | | (1,342,536) |
Net Assets | | | |
Beginning of Period | 7,930,283 | | 9,272,819 |
End of Period2 | 5,688,841 | | 7,930,283 |
1 Includes fiscal 2008 short-term gain distributions totaling $172,806,000. Short-term gain distributions are treated as ordinary income dividends for tax purposes.
2 Net Assets—End of Period includes undistributed (overdistributed) net investment income of ($240,000) and $43,146,000.
See accompanying Notes, which are an integral part of the Financial Statements.
19
Morgan Growth Fund
Financial Highlights
Investor Shares | | | | | | |
| | | | | | |
| Six Months | | | | | |
| Ended | | | |
For a Share Outstanding | March 31, | Year Ended September 30, |
Throughout Each Period | 2009 | 2008 | 2007 | 2006 | 2005 | 2004 |
Net Asset Value, Beginning of Period | $15.15 | $21.45 | $18.34 | $17.04 | $14.77 | $13.34 |
Investment Operations | | | | | | |
Net Investment Income | .062 | .148 | .207 | .165 | .1291 | .050 |
Net Realized and Unrealized Gain (Loss) | | | | | | |
on Investments | (4.272) | (4.912) | 3.604 | 1.230 | 2.246 | 1.420 |
Total from Investment Operations | (4.210) | (4.764) | 3.811 | 1.395 | 2.375 | 1.470 |
Distributions | | | | | | |
Dividends from Net Investment Income | (.140) | (.175) | (.204) | (.095) | (.105) | (.040) |
Distributions from Realized Capital Gains | — | (1.361) | (.497) | — | — | — |
Total Distributions | (.140) | (1.536) | (.701) | (.095) | (.105) | (.040) |
Net Asset Value, End of Period | $10.80 | $15.15 | $21.45 | $18.34 | $17.04 | $14.77 |
| | | | | | |
| | | | | | |
Total Return2 | –27.80% | –23.70% | 21.24% | 8.20% | 16.12% | 11.03% |
| | | | | | |
| | | | | | |
Ratios/Supplemental Data | | | | | | |
Net Assets, End of Period (Millions) | $3,889 | $5,418 | $6,590 | $5,171 | $4,539 | $4,115 |
Ratio of Total Expenses to | | | | | | |
Average Net Assets3 | 0.49%4 | 0.38% | 0.37% | 0.42% | 0.41% | 0.44% |
Ratio of Net Investment Income to | | | | | | |
Average Net Assets | 1.12%4 | 0.80% | 1.06% | 0.95% | 0.82%1 | 0.32% |
Portfolio Turnover Rate | 91%4 | 88% | 79% | 90% | 88% | 88% |
1 Net investment income per share and the ratio of net investment income to average net assets include $0.044 and 0.28%, respectively, resulting from a special dividend from Microsoft Corp. in November 2004.
2 Total returns do not include the account service fee that may be applicable to certain accounts with balances below $10,000.
3 Includes performance-based investment advisory fee increases (decreases) of 0.02%, 0.00%, 0.00%, 0.02%, 0.00%, and 0.01%.
4 Annualized.
See accompanying Notes, which are an integral part of the Financial Statements.
20
Morgan Growth Fund
Financial Highlights
Admiral Shares | | | | | | |
| | | | | | |
| Six Months | | | | | |
| Ended | | | |
For a Share Outstanding | March 31, | Year Ended September 30, |
Throughout Each Period | 2009 | 2008 | 2007 | 2006 | 2005 | 2004 |
Net Asset Value, Beginning of Period | $47.03 | $66.58 | $56.94 | $52.91 | $45.84 | $41.40 |
Investment Operations | | | | | | |
Net Investment Income | .235 | .555 | .742 | .620 | .5001 | .212 |
Net Realized and Unrealized Gain (Loss) | | | | | | |
on Investments | (13.273) | (15.244) | 11.184 | 3.808 | 6.956 | 4.416 |
Total from Investment Operations | (13.038) | (14.689) | 11.926 | 4.428 | 7.456 | 4.628 |
Distributions | | | | | | |
Dividends from Net Investment Income | (.522) | (.641) | (.745) | (.398) | (.386) | (.188) |
Distributions from Realized Capital Gains | — | (4.220) | (1.541) | — | — | — |
Total Distributions | (.522) | (4.861) | (2.286) | (.398) | (.386) | (.188) |
Net Asset Value, End of Period | $33.47 | $47.03 | $66.58 | $56.94 | $52.91 | $45.84 |
| | | | | | |
| | | | | | |
Total Return | –27.74% | –23.57% | 21.43% | 8.39% | 16.32% | 11.19% |
| | | | | | |
| | | | | | |
Ratios/Supplemental Data | | | | | | |
Net Assets, End of Period (Millions) | $1,800 | $2,512 | $2,683 | $1,691 | $1,110 | $513 |
Ratio of Total Expenses to | | | | | | |
Average Net Assets2 | 0.32%3 | 0.21% | 0.21% | 0.23% | 0.24% | 0.30% |
Ratio of Net Investment Income to | | | | | | |
Average Net Assets | 1.29%3 | 0.97% | 1.22% | 1.14% | 0.96%1 | 0.47% |
Portfolio Turnover Rate | 91%3 | 88% | 79% | 90% | 88% | 88% |
1 Net investment income per share and the ratio of net investment income to average net assets include $0.184 and 0.28%, respectively, resulting from a special dividend from Microsoft Corp. in November 2004.
2 Includes performance-based investment advisory fee increases (decreases) of 0.02%, 0.00%, 0.00%, 0.02%, 0.00%, and 0.01%.
3 Annualized.
See accompanying Notes, which are an integral part of the Financial Statements.
21
Morgan Growth Fund
Notes to Financial Statements
Vanguard Morgan Growth Fund is registered under the Investment Company Act of 1940 as an open-end investment company, or mutual fund. The fund offers two classes of shares: Investor Shares and Admiral Shares. Investor Shares are available to any investor who meets the fund’s minimum purchase requirements. Admiral Shares are designed for investors who meet certain administrative, service, tenure, and account-size criteria.
A. The following significant accounting policies conform to generally accepted accounting principles for U.S. mutual funds. The fund consistently follows such policies in preparing its financial statements.
1. Security Valuation: Securities are valued as of the close of trading on the New York Stock Exchange (generally 4 p.m., Eastern time) on the valuation date. Equity securities are valued at the latest quoted sales prices or official closing prices taken from the primary market in which each security trades; such securities not traded on the valuation date are valued at the mean of the latest quoted bid and asked prices. Securities for which market quotations are not readily available, or whose values have been affected by events occurring before the fund’s pricing time but after the close of the securities’ primary markets, are valued at their fair values calculated according to procedures adopted by the board of trustees. These procedures include obtaining quotations from an independent pricing service, monitoring news to identify significant market- or security-specific events, and evaluating changes in the values of foreign market proxies (for example, ADRs, futures contracts, or exchange-traded funds), between the time the foreign markets close and the fund’s pricing time. When fair-value pricing is employed, the prices of securities used by a fund to calculate its net asset value may differ from quoted or published prices for the same securities. Investments in Vanguard Market Liquidity Fund are valued at that fund’s net asset value. Temporary cash investments acquired over 60 days to maturity are valued using the latest bid prices or using valuations based on a matrix system (which considers such factors as security prices, yields, maturities, and ratings), both as furnished by independent pricing services. Other temporary cash investments are valued at amortized cost, which approximates market value.
2. Foreign Currency: Securities and other assets and liabilities denominated in foreign currencies are translated into U.S. dollars using exchange rates obtained from an independent third party as of the fund’s pricing time on the valuation date. Realized gains (losses) and unrealized appreciation (depreciation) on investment securities include the effects of changes in exchange rates since the securities were purchased, combined with the effects of changes in security prices. Fluctuations in the value of other assets and liabilities resulting from changes in exchange rates are recorded as unrealized foreign currency gains (losses) until the assets or liabilities are settled in cash, at which time they are recorded as realized foreign currency gains (losses).
3. Futures Contracts: The fund uses index futures contracts to a limited extent, with the objective of maintaining full exposure to the stock market while maintaining liquidity. The fund may purchase or sell futures contracts to achieve a desired level of investment, whether to accommodate portfolio turnover or cash flows from capital share transactions. The primary risks associated with the use of futures contracts are imperfect correlation between changes in market values of stocks held by the fund and the prices of futures contracts, and the possibility of an illiquid market.
Futures contracts are valued at their quoted daily settlement prices. The aggregate principal amounts of the contracts are not recorded in the Statement of Net Assets. Fluctuations in the value of the contracts are recorded in the Statement of Net Assets as an asset (liability) and in the Statement of Operations as unrealized appreciation (depreciation) until the contracts are closed, when they are recorded as realized futures gains (losses).
22
Morgan Growth Fund
4. Repurchase Agreements: The fund may invest in repurchase agreements. Securities pledged as collateral for repurchase agreements are held by a custodian bank until the agreements mature. Each agreement requires that the market value of the collateral be sufficient to cover payments of interest and principal; however, in the event of default or bankruptcy by the other party to the agreement, retention of the collateral may be subject to legal proceedings.
5. Federal Income Taxes: The fund intends to continue to qualify as a regulated investment company and distribute all of its taxable income. Management has analyzed the fund’s tax positions taken on federal income tax returns for all open tax years (tax years ended September 30, 2005–2008) and for the period ended March 31, 2009, and has concluded that no provision for federal income tax is required in the fund’s financial statements.
6. Distributions: Distributions to shareholders are recorded on the ex-dividend date.
7. Security Lending: The fund may lend its securities to qualified institutional borrowers to earn additional income. Security loans are required to be secured at all times by collateral at least equal to the market value of securities loaned. The fund invests cash collateral received in Vanguard Market Liquidity Fund, and records a liability for the return of the collateral, during the period the securities are on loan. Security lending income represents the income earned on investing cash collateral, less expenses associated with the loan.
8. Other: Dividend income is recorded on the ex-dividend date. Interest income includes income distributions received from Vanguard Market Liquidity Fund and is accrued daily. Security transactions are accounted for on the date securities are bought or sold. Costs used to determine realized gains (losses) on the sale of investment securities are those of the specific securities sold.
Each class of shares has equal rights as to assets and earnings, except that each class separately bears certain class-specific expenses related to maintenance of shareholder accounts (included in Management and Administrative expenses) and shareholder reporting. Marketing and distribution expenses are allocated to each class of shares based on a method approved by the board of trustees. Income, other non-class-specific expenses, and gains and losses on investments are allocated to each class of shares based on its relative net assets.
B. Wellington Management Company, LLP, Jennison Associates LLC, Frontier Capital Management Co., LLC, and Kalmar Investment Advisers each provide investment advisory services to a portion of the fund for a fee calculated at an annual percentage rate of average net assets managed by the advisor. The basic fee of Wellington Management Company, LLP, is subject to quarterly adjustments based on performance for the preceding three years relative to the Russell 3000 Growth Index. The basic fee of Jennison Associates LLC is subject to quarterly adjustments based on performance since March 31, 2007, relative to the Russell 1000 Growth Index. In accordance with the advisory contracts entered into with Frontier Capital Management Co., LLC, and Kalmar Investment Advisers in November 2008, beginning October 1, 2009, the investment advisory fees will be subject to quarterly adjustments based on performance since December 31, 2008, relative to the Russell Midcap Growth Index. Until November 2008, a portion of the fund was managed by Franklin Portfolio Associates, LLC. The basic fee paid to Franklin Portfolio Associates, LLC, was subject to quarterly adjustments based on performance for the preceding three years relative to the Russell Midcap Growth Index.
23
Morgan Growth Fund
The Vanguard Group provides investment advisory services to a portion of the fund on an at-cost basis; the fund paid Vanguard advisory fees of $352,000 for the six months ended March 31, 2009.
For the six months ended March 31, 2009, the aggregate investment advisory fee represented an effective annual basic rate of 0.14% of the fund’s average net assets, before an increase of $622,000 (0.02%) based on performance.
C. The Vanguard Group furnishes at cost corporate management, administrative, marketing, and distribution services. The costs of such services are allocated to the fund under methods approved by the board of trustees. The fund has committed to provide up to 0.40% of its net assets in capital contributions to Vanguard. At March 31, 2009, the fund had contributed capital of $1,502,000 to Vanguard (included in Other Assets), representing 0.03% of the fund’s net assets and 0.60% of Vanguard’s capitalization. The fund’s trustees and officers are also directors and officers of Vanguard.
D. The fund has asked its investment advisors to direct certain security trades, subject to obtaining the best price and execution, to brokers who have agreed to rebate to the fund part of the commissions generated. Such rebates are used solely to reduce the fund’s management and administrative expenses. The fund’s custodian bank has also agreed to reduce its fees when the fund maintains cash on deposit in the non-interest-bearing custody account. For the six months ended March 31, 2009, these arrangements reduced the fund’s management and administrative expenses by $260,000 and custodian fees by $1,000. The total expense reduction represented an effective annual rate of 0.01% of the fund’s average net assets.
E. Distributions are determined on a tax basis and may differ from net investment income and realized capital gains for financial reporting purposes. Differences may be permanent or temporary. Permanent differences are reclassified among capital accounts in the financial statements to reflect their tax character. Temporary differences arise when certain items of income, expense, gain, or loss are recognized in different periods for financial statement and tax purposes; these differences will reverse at some time in the future. Differences in classification may also result from the treatment of short-term gains as ordinary income for tax purposes.
During the six months ended March 31, 2009, the fund realized net foreign currency losses of $201,000, which decreased distributable net income for tax purposes; accordingly, such losses have been reclassified from accumulated net realized losses to overdistributed net investment income.
The fund’s tax-basis capital gains and losses are determined only at the end of each fiscal year. For tax purposes, at September 30, 2008, the fund had available realized losses of $411,147,000 to offset future net capital gains through September 30, 2017. The fund will use these capital losses to offset net taxable capital gains, if any, realized during the year ending September 30, 2009; should the fund realize net capital losses for the year, the losses will be added to the loss carryforward balance above.
At March 31, 2009, the cost of investment securities for tax purposes was $6,767,043,000. Net unrealized depreciation of investment securities for tax purposes was $997,644,000, consisting of unrealized gains of $281,181,000 on securities that had risen in value since their purchase and $1,278,825,000 in unrealized losses on securities that had fallen in value since their purchase.
24
Morgan Growth Fund
At March 31, 2009, the aggregate settlement value of open futures contracts expiring in June 2009 and the related unrealized appreciation (depreciation) were:
| | | ($000) |
| Number of | Aggregate | Unrealized |
| Long (Short) | Settlement | Appreciation |
Futures Contracts | Contracts | Value | (Depreciation) |
E-mini S&P 500 Index | 4,431 | 176,088 | 1,999 |
S&P 500 Index | 435 | 86,434 | 9,709 |
Unrealized appreciation (depreciation) on open futures contracts is required to be treated as realized gain (loss) for tax purposes.
F. During the six months ended March 31, 2009, the fund purchased $3,025,838,000 of investment securities and sold $3,048,531,000 of investment securities, other than temporary cash investments.
G. Capital share transactions for each class of shares were:
| Six Months Ended | Year Ended |
| March 31, 2009 | September 30, 2008 |
| Amount | Shares | | Amount | Shares |
| ($000) | (000) | | ($000) | (000) |
Investor Shares | | | | | |
Issued | 446,307 | 39,550 | | 1,538,894 | 82,992 |
Issued in Lieu of Cash Distributions | 48,928 | 4,472 | | 469,940 | 24,566 |
Redeemed | (463,704) | (41,561) | | (1,059,582) | (57,122) |
Net Increase (Decrease)—Investor Shares | 31,531 | 2,461 | | 949,252 | 50,436 |
Admiral Shares | | | | | |
Issued | 206,877 | 6,010 | | 1,043,087 | 17,859 |
Issued in Lieu of Cash Distributions | 22,380 | 660 | | 176,658 | 2,979 |
Redeemed | (218,519) | (6,319) | | (437,087) | (7,717) |
Net Increase (Decrease)—Admiral Shares | 10,738 | 351 | | 782,658 | 13,121 |
H. In September 2006, the Financial Accounting Standards Board issued Statement of Financial Accounting Standards No. 157 (“FAS 157”), “Fair Value Measurements.” FAS 157 establishes a framework for measuring fair value and expands disclosures about fair value measurements in financial statements.
The various inputs that may be used to determine the value of the fund’s investments are summarized in three broad levels. The inputs or methodologies used for valuing securities are not necessarily an indication of the risk associated with investing in those securities.
25
Morgan Growth Fund
Level 1—Quoted prices in active markets for identical securities.
Level 2—Other significant observable inputs (including quoted prices for similar securities, interest rates, prepayment speeds, credit risk, etc.).
Level 3—Significant unobservable inputs (including the fund’s own assumptions used to determine the fair value of investments).
The following table summarizes the fund’s investments as of March 31, 2009, based on the inputs used to value them:
| Investments | Futures |
| in Securities | Contracts |
Valuation Inputs | ($000) | ($000) |
Level 1—Quoted prices | 5,673,714 | 11,708 |
Level 2—Other significant observable inputs | 95,685 | — |
Level 3—Significant unobservable inputs | — | — |
Total | 5,769,399 | 11,708 |
26
About Your Fund’s Expenses
As a shareholder of the fund, you incur ongoing costs, which include costs for portfolio management, administrative services, and shareholder reports (like this one), among others. Operating expenses, which are deducted from a fund’s gross income, directly reduce the investment return of the fund.
A fund’s expenses are expressed as a percentage of its average net assets. This figure is known as the expense ratio. The following examples are intended to help you understand the ongoing costs (in dollars) of investing in your fund and to compare these costs with those of other mutual funds. The examples are based on an investment of $1,000 made at the beginning of the period shown and held for the entire period.
The accompanying table illustrates your fund’s costs in two ways:
• Based on actual fund return. This section helps you to estimate the actual expenses that you paid over the period. The “Ending Account Value” shown is derived from the fund’s actual return, and the third column shows the dollar amount that would have been paid by an investor who started with $1,000 in the fund. You may use the information here, together with the amount you invested, to estimate the expenses that you paid over the period.
To do so, simply divide your account value by $1,000 (for example, an $8,600 account value divided by $1,000 = 8.6), then multiply the result by the number given for your fund under the heading “Expenses Paid During Period.”
• Based on hypothetical 5% yearly return. This section is intended to help you compare your fund’s costs with those of other mutual funds. It assumes that the fund had a yearly return of 5% before expenses, but that the expense ratio is unchanged. In this case—because the return used is not the fund’s actual return—the results do not apply to your investment. The example is useful in making comparisons because the Securities and Exchange Commission requires all mutual funds to calculate expenses based on a 5% return. You can assess your fund’s costs by comparing this hypothetical example with the hypothetical examples that appear in shareholder reports of other funds.
Six Months Ended March 31, 2009 | | | |
| Beginning | Ending | Expenses |
| Account Value | Account Value | Paid During |
Morgan Growth Fund | 9/30/2008 | 3/31/2009 | Period1 |
Based on Actual Fund Return | | | |
Investor Shares | $1,000.00 | $721.99 | $2.10 |
Admiral Shares | 1,000.00 | 722.64 | 1.37 |
Based on Hypothetical 5% Yearly Return | | | |
Investor Shares | $1,000.00 | $1,022.49 | $2.47 |
Admiral Shares | 1,000.00 | 1,023.34 | 1.61 |
1 The calculations are based on expenses incurred in the most recent six-month period. The fund’s annualized six-month expense ratios for that period are 0.49% for Investor Shares and 0.32% for Admiral Shares. The dollar amounts shown as “Expenses Paid” are equal to the annualized expense ratio multiplied by the average account value over the period, multiplied by the number of days in the most recent six-month period, then divided by the number of days in the most recent 12-month period.
27
Note that the expenses shown in the table are meant to highlight and help you compare ongoing costs only and do not reflect transaction costs incurred by the fund for buying and selling securities. Further, the expenses do not include the account service fee described in the prospectus. If such a fee were applied to your account, your costs would be higher. Your fund does not charge transaction fees, such as purchase or redemption fees, nor does it carry a “sales load.”
The calculations assume no shares were bought or sold during the period. Your actual costs may have been higher or lower, depending on the amount of your investment and the timing of any purchases or redemptions.
You can find more information about the fund’s expenses, including annual expense ratios, in the Financial Statements section of this report. For additional information on operating expenses and other shareholder costs, please refer to your fund’s current prospectus.
28
Trustees Approve Advisory Arrangements
The board of trustees of Vanguard Morgan Growth Fund has renewed the fund’s investment advisory arrangements with Wellington Management Company, LLP, Jennison Associates LLC, and The Vanguard Group, Inc. (through its Quantitative Equity Group). The board determined that the retention of the advisors was in the best interests of the fund and its shareholders. The board previously approved investment advisory agreements with Frontier Capital Management Co., LLC, and Kalmar Investment Advisers. Please see the Annual Report dated September 30, 2008, for additional information on the board’s approval of the arrangements with Frontier Capital Management and Kalmar Investment Advisers.
The board based its decisions upon an evaluation of each advisor’s investment staff, portfolio management process, and performance. The trustees considered the factors discussed below, among others. However, no single factor determined whether or not the board approved the arrangements. Rather, it was the totality of the circumstances that drove the board’s decision.
Nature, extent, and quality of services
The board considered the quality of the fund’s investment management over both the short and long term, and took into account the organizational depth and stability of each advisor. The board noted the following:
Wellington Management Company. Wellington Management, which was founded in 1928, is among the nation’s oldest and most respected institutional managers. The firm has provided investment advisory services to the fund since 1968. The investment team at Wellington Management uses traditional methods of stock selection to identify companies that it believes have above-average growth prospects, particularly those in industries undergoing change. Research focuses on large- and mid-capitalization companies with a proven record of sales and earnings growth, profitability, and cash-flow generation.
Jennison Associates. Jennison Associates, founded in 1969, is a fully owned subsidiary of Prudential Financial, Inc. The investment team at Jennison Associates uses internal fundamental research and a highly interactive, bottom-up stock-selection process to identify companies that exhibit above-average growth in units, revenues, earnings, and cash flows. When analyzing a company for purchase or sale, the team focuses on the duration of the growth opportunity and seeks to capture inflection points in the company’s growth. The firm has provided investment advisory services to the fund since 2007.
The Vanguard Group. Vanguard has been managing investments for more than 25 years. George U. Sauter, Vanguard managing director and chief investment officer, has been in the investment management business since 1985. Mr. Sauter has led the Quantitative Equity Group since 1987. The Quantitative Equity Group adheres to a sound, disciplined investment management process; the team has considerable experience, stability, and depth. Vanguard has provided investment advisory services to the fund since 1993.
The board concluded that each advisor’s experience, stability, depth, and performance, among other factors, warranted continuation of the advisory arrangements.
Investment performance
The board considered the short- and long-term performance of the fund, including any periods of outperformance or underperformance of a relevant benchmark and peer group. The board concluded that each advisor has carried out the fund’s investment strategy in disciplined fashion, and that performance results have allowed the fund to remain competitive versus its benchmark and the fund’s peer group. Information about the fund’s most recent performance can be found in the Performance Summary section of this report.
29
Cost
The board concluded that the fund’s expense ratio was far below the average expense ratio charged by funds in its peer group. The board noted that the fund’s advisory fee rate was also well below the peer-group average. Information about the fund’s expense ratio appears in the About Your Fund’s Expenses section of this report as well as in the Financial Statements section, which also includes information about the advisory fee rates.
The board did not consider profitability of Wellington Management and Jennison Associates in determining whether to approve the advisory fees, because the firms are independent of Vanguard and the advisory fees are the result of arm’s-length negotiations. The board does not conduct a profitability analysis of Vanguard because of Vanguard’s unique “at-cost” structure. Unlike most other mutual fund management companies, Vanguard is owned by the funds it oversees, and produces “profits” only in the form of reduced expenses for fund shareholders.
The benefit of economies of scale
The board concluded that the fund’s shareholders benefit from economies of scale because of breakpoints in the advisory fee schedules for Wellington Management and Jennison Associates. The breakpoints reduce the effective rate of the fees as the fund’s assets managed by the firms increase. The board also concluded that the fund’s low-cost arrangement with Vanguard ensures that the fund will realize economies of scale as it grows, with the cost to shareholders declining as the fund’s assets managed by Vanguard increase.
The board will consider whether to renew the advisory arrangements again after a one-year period.
30
Glossary
Beta. A measure of the magnitude of a fund’s past share-price fluctuations in relation to the ups and downs of a given market index. The index is assigned a beta of 1.00. Compared with a given index, a fund with a beta of 1.20 typically would have seen its share price rise or fall by 12% when the index rose or fell by 10%. For this report, beta is based on returns over the past 36 months for both the fund and the index. Note that a fund’s beta should be reviewed in conjunction with its R-squared (see definition). The lower the R-squared, the less correlation there is between the fund and the index, and the less reliable beta is as an indicator of volatility.
Earnings Growth Rate. The average annual rate of growth in earnings over the past five years for the stocks now in a fund.
Equity Exposure. A measure that reflects a fund’s investments in stocks and stock futures. Any holdings in short-term reserves are excluded.
Expense Ratio. The percentage of a fund’s average net assets used to pay its annual administrative and advisory expenses. These expenses directly reduce returns to investors.
Foreign Holdings. The percentage of a fund represented by stocks or depositary receipts of companies based outside the United States.
Inception Date. The date on which the assets of a fund (or one of its share classes) are first invested in accordance with the fund’s investment objective. For funds with a subscription period, the inception date is the day after that period ends. Investment performance is measured from the inception date.
Median Market Cap. An indicator of the size of companies in which a fund invests; the midpoint of market capitalization (market price x shares outstanding) of a fund’s stocks, weighted by the proportion of the fund’s assets invested in each stock. Stocks representing half of the fund’s assets have market capitalizations above the median, and the rest are below it.
Price/Book Ratio. The share price of a stock divided by its net worth, or book value, per share. For a fund, the weighted average price/book ratio of the stocks it holds.
Price/Earnings Ratio. The ratio of a stock’s current price to its per-share earnings over the past year. For a fund, the weighted average P/E of the stocks it holds. P/E is an indicator of market expectations about corporate prospects; the higher the P/E, the greater the expectations for a company’s future growth.
R-Squared. A measure of how much of a fund’s past returns can be explained by the returns from the market in general, as measured by a given index. If a fund’s total returns were precisely synchronized with an index’s returns, its R-squared would be 1.00. If the fund’s returns bore no relationship to the index’s returns, its R-squared would be 0. For this report, R-squared is based on returns over the past 36 months for both the fund and the index.
Return on Equity. The annual average rate of return generated by a company during the past five years for each dollar of shareholder’s equity (net income divided by shareholder’s equity). For a fund, the weighted average return on equity for the companies whose stocks it holds.
Short-Term Reserves. The percentage of a fund invested in highly liquid, short-term securities that can be readily converted to cash.
31
Turnover Rate. An indication of the fund’s trading activity. Funds with high turnover rates incur higher transaction costs and may be more likely to distribute capital gains (which may be taxable to investors). The turnover rate excludes in-kind transactions, which have minimal impact on costs.
Yield. A fund’s 30-day SEC yield is derived using a formula specified by the U.S. Securities and Exchange Commission. Under the formula, data related to the fund’s security holdings in the previous 30 days are used to calculate the fund’s hypothetical net income for that period, which is then annualized and divided by the fund’s estimated average net assets over the calculation period. For the purposes of this calculation, a security’s income is based on its current market yield to maturity (in the case of bonds) or its projected dividend yield (for stocks). Because the SEC yield represents hypothetical annualized income, it will differ—at times significantly—from the fund’s actual experience. As a result, the fund’s income distributions may be higher or lower than implied by the SEC yield.
32
This page intentionally left blank.
This page intentionally left blank.
This page intentionally left blank.
The People Who Govern Your Fund
The trustees of your mutual fund are there to see that the fund is operated and managed in your best interests since, as a shareholder, you are a part owner of the fund. Your fund’s trustees also serve on the board of directors of The Vanguard Group, Inc., which is owned by the Vanguard funds and provides services to them on an at-cost basis.
A majority of Vanguard’s board members are independent, meaning that they have no affiliation with Vanguard or the funds they oversee, apart from the sizable personal investments they have made as private individuals. The independent board members have distinguished backgrounds in business, academia, and public service. Each of the trustees and executive officers oversees 157 Vanguard funds.
The following table provides information for each trustee and executive officer of the fund. More information about the trustees is in the Statement of Additional Information, which can be obtained, without charge, by contacting Vanguard at 800-662-7447, or online at www.vanguard.com.
Chairman of the Board and Interested Trustee
John J. Brennan1
Born 1954. Trustee Since May 1987. Chairman of the Board. Principal Occupation(s) During the Past Five Years: Chairman of the Board and Director/Trustee of The Vanguard Group, Inc., and of each of the investment companies served by The Vanguard Group; Chief Executive Officer and President of The Vanguard Group and of each of the investment companies served by The Vanguard Group (1996–2008).
Independent Trustees
Charles D. Ellis
Born 1937. Trustee Since January 2001. Principal Occupation(s) During the Past Five Years: Applecore Partners (pro bono ventures in education); Senior Advisor to Greenwich Associates (international business strategy consulting); Successor Trustee of Yale University; Overseer of the Stern School of Business at New York University; Trustee of the Whitehead Institute for Biomedical Research.
Emerson U. Fullwood
Born 1948. Trustee Since January 2008. Principal Occupation(s) During the Past Five Years: Retired Executive Chief Staff and Marketing Officer for North America and Corporate Vice President of Xerox Corporation (photocopiers and printers); Director of SPX Corporation (multi-industry manufacturing), the United Way of Rochester, the Boy Scouts of America, Amerigroup Corporation (direct health and medical insurance carriers), and Monroe Community College Foundation.
Rajiv L. Gupta
Born 1945. Trustee Since December 2001.2 Principal Occupation(s) During the Past Five Years: Chairman and Chief Executive Officer of Rohm and Haas Co. (chemicals); President of Rohm and Haas Co. (2006–2008); Board Member of American Chemistry Council; Director of Tyco International, Ltd. (diversified manufacturing and services) and Hewlett-Packard Co. (electronic computer manufacturing); Trustee of The Conference Board.
Amy Gutmann
Born 1949. Trustee Since June 2006. Principal
Occupation(s) During the Past Five Years: President of the University of Pennsylvania; Christopher H. Browne Distinguished Professor of Political Science in the School of Arts and Sciences with Secondary Appointments at the Annenberg School for Communication and the Graduate School of Education of the University of Pennsylvania; Director of Carnegie Corporation of New York, Schuylkill River Development Corporation, and Greater Philadelphia Chamber of Commerce; Trustee of the National Constitution Center.
JoAnn Heffernan Heisen
Born 1950. Trustee Since July 1998. Principal Occupation(s) During the Past Five Years: Retired Corporate Vice President, Chief Global Diversity Officer, and Member of the Executive Committee of Johnson & Johnson (pharmaceuticals/consumer products); Vice President and Chief Information Officer (1997–2005) of Johnson & Johnson; Director of the University Medical Center at Princeton and Women’s Research and Education Institute.
André F. Perold
Born 1952. Trustee Since December 2004. Principal Occupation(s) During the Past Five Years: George Gund Professor of Finance and Banking, Senior Associate Dean, and Director of Faculty Recruiting, Harvard Business School; Director and Chairman of UNX, Inc. (equities trading firm); Chair of the Investment Committee of HighVista Strategies LLC (private investment firm).
Alfred M. Rankin, Jr.
Born 1941. Trustee Since January 1993. Principal Occupation(s) During the Past Five Years: Chairman, President, Chief Executive Officer, and Director of NACCO Industries, Inc. (forklift trucks/housewares/ lignite); Director of Goodrich Corporation (industrial products/aircraft systems and services).
J. Lawrence Wilson
Born 1936. Trustee Since April 1985. Principal Occupation(s) During the Past Five Years: Retired Chairman and Chief Executive Officer of Rohm and Haas Co. (chemicals); Director of Cummins Inc. (diesel engines) and AmerisourceBergen Corp. (pharmaceutical distribution); Trustee of Vanderbilt University and of Culver Educational Foundation.
Executive Officers
Thomas J. Higgins1
Born 1957. Chief Financial Officer Since September 2008. Principal Occupation(s) During the Past Five Years: Principal of The Vanguard Group, Inc.; Chief Financial Officer of each of the investment companies served by The Vanguard Group since 2008; Treasurer of each of the investment companies served by The Vanguard Group (1998–2008).
Kathryn J. Hyatt1
Born 1955. Treasurer Since November 2008. Principal Occupation(s) During the Past Five Years: Principal of The Vanguard Group, Inc.; Treasurer of each of the investment companies served by The Vanguard Group since 2008; Assistant Treasurer of each of the investment companies served by The Vanguard Group (1988–2008).
F. William McNabb III1
Born 1957. Chief Executive Officer Since August 2008. President Since March 2008. Principal Occupation(s) During the Past Five Years: Director of The Vanguard Group, Inc., since 2008; Chief Executive Officer and President of The Vanguard Group and of each of the investment companies served by The Vanguard Group since 2008; Director of Vanguard Marketing Corporation; Managing Director of The Vanguard Group (1995–2008).
Heidi Stam1
Born 1956. Secretary Since July 2005. Principal Occupation(s) During the Past Five Years: Managing Director of The Vanguard Group, Inc., since 2006; General Counsel of The Vanguard Group since 2005; Secretary of The Vanguard Group and of each of the investment companies served by The Vanguard Group since 2005; Director and Senior Vice President of Vanguard Marketing Corporation since 2005; Principal of The Vanguard Group (1997–2006).
Vanguard Senior Management Team |
| |
| |
R. Gregory Barton | Michael S. Miller |
Mortimer J. Buckley | James M. Norris |
Kathleen C. Gubanich | Glenn W. Reed |
Paul A. Heller | George U. Sauter |
Founder
John C. Bogle
Chairman and Chief Executive Officer, 1974–1996
1 These individuals are “interested persons” as defined in the Investment Company Act of 1940.
2 December 2002 for Vanguard Equity Income Fund, Vanguard Growth Equity Fund, the Vanguard Municipal Bond Funds, and the Vanguard State Tax-Exempt Funds.

P.O. Box 2600
Valley Forge, PA 19482-2600
Connect with Vanguard® > www.vanguard.com
Fund Information > 800-662-7447 | All comparative mutual fund data are from Lipper Inc. |
| or Morningstar, Inc., unless otherwise noted. |
Direct Investor Account Services > 800-662-2739 | |
| You can obtain a free copy of Vanguard’s proxy voting |
Institutional Investor Services > 800-523-1036 | guidelines by visiting our website, www.vanguard.com, |
| and searching for “proxy voting guidelines,” or by |
Text Telephone for People | calling Vanguard at 800-662-2739. The guidelines are |
With Hearing Impairment > 800-952-3335 | also available from the SEC’s website, www.sec.gov. |
| In addition, you may obtain a free report on how your |
| fund voted the proxies for securities it owned during |
| the 12 months ended June 30. To get the report, visit |
This material may be used in conjunction | either www.vanguard.com or www.sec.gov. |
with the offering of shares of any Vanguard | |
fund only if preceded or accompanied by | |
the fund’s current prospectus. | |
| |
| You can review and copy information about your fund |
| at the SEC’s Public Reference Room in Washington, D.C. |
| To find out more about this public service, call the SEC |
CFA® is a trademark owned by CFA Institute. | at 202-551-8090. Information about your fund is also |
| available on the SEC’s website, and you can receive |
The funds or securities referred to herein are not | copies of this information, for a fee, by sending a |
sponsored, endorsed, or promoted by MSCI, and MSCI | request in either of two ways: via e-mail addressed to |
bears no liability with respect to any such funds or | publicinfo@sec.gov or via regular mail addressed to the |
securities. For any such funds or securities, the | Public Reference Section, Securities and Exchange |
prospectus or the Statement of Additional Information | Commission, Washington, DC 20549-0102 |
contains a more detailed description of the limited | |
relationship MSCI has with The Vanguard Group and | |
any related funds. | |
| |
| |
| |
Russell is a trademark of The Frank Russell Company. | |
| |
| |
| |
| |
| |
| |
| |
| |
| © 2009 The Vanguard Group, Inc. |
| All rights reserved. |
| Vanguard Marketing Corporation, Distributor. |
| |
| Q262 052009 |