UNITED STATES
SECURITIES AND EXCHANGE COMMISSION
Washington, D.C. 20549
FORM N-CSR
CERTIFIED SHAREHOLDER REPORT
OF
REGISTERED MANAGEMENT INVESTMENT COMPANIES
| |
| Investment Company Act file number: 811-1685 |
|
| Name of Registrant: | Vanguard Morgan Growth Fund |
| |
| Address of Registrant: | P.O. Box 2600 |
| | Valley Forge, PA 19482 |
| |
| Name and address of agent for service: | Heidi Stam, Esquire |
| | P.O. Box 876 |
| | Valley Forge, PA 19482 |
| |
| Registrant’s telephone number, including area code: (610) 669-1000 |
|
| Date of fiscal year end: September 30 |
|
| Date of reporting period: October 1, 2010 – March 31, 2011 |
|
| Item 1: Reports to Shareholders |

|
| Vanguard Morgan™ Growth Fund |
| Semiannual Report |
|
| March 31, 2011 |

> For the six months ended March 31, 2011, Vanguard Morgan Growth Fund
returned about 20%, slightly ahead of its benchmark index and the average
return of competing funds.
> Stock markets worldwide rose impressively over the six months, overcoming
hurdles related to the unrest in North Africa and the Middle East and the
earthquake and tsunami in Japan.
> Each of the ten industry sectors posted positive results, and strong stock
selection carried the fund’s performance.
| Contents | |
| Your Fund’s Total Returns. | 1 |
| Chairman’s Letter. | 2 |
| Advisors’ Report. | 6 |
| Fund Profile. | 11 |
| Performance Summary. | 12 |
| Financial Statements. | 13 |
| About Your Fund’s Expenses. | 27 |
| Trustees Approve Advisory Arrangements. | 29 |
| Glossary. | 31 |
Please note: The opinions expressed in this report are just that—informed opinions. They should not be considered promises or advice.
Also, please keep in mind that the information and opinions cover the period through the date on the front of this report. Of course, the
risks of investing in your fund are spelled out in the prospectus.
See the Glossary for definitions of investment terms used in this report.
Cover photograph: Jean Maher.
Your Fund’s Total Returns
| |
| Six Months Ended March 31, 2011 | |
| | Total |
| | Returns |
| Vanguard Morgan Growth Fund | |
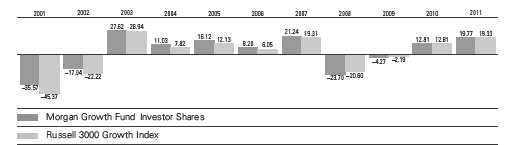
| Investor Shares | 19.77% |
| Admiral™ Shares | 19.87 |
| Russell 3000 Growth Index | 19.33 |
| Multi-Cap Growth Funds Average | 18.91 |
| Multi-Cap Growth Funds Average: Derived from data provided by Lipper Inc. |
| Admiral Shares carry lower expenses and are available to investors who meet certain account-balance requirements. |
Your Fund’s Performance at a Glance
September 30, 2010 , Through March 31, 2011
| | | | |
| | | | Distributions Per Share |
| | Starting | Ending | Income | Capital |
| | Share Price | Share Price | Dividends | Gains |
| Vanguard Morgan Growth Fund | | | | |
| Investor Shares | $16.04 | $19.11 | $0.096 | $0.000 |
| Admiral Shares | 49.75 | 59.25 | 0.362 | 0.000 |
1

Chairman’s Letter
Dear Shareholder,
The stock market displayed momentum and resiliency for the six months ended March 31, 2011, as the U.S. economy continued to improve and corporate earnings increased. Vanguard Morgan Growth Fund benefited from this strong investment environment, as well as sharp stock selections from the fund’s five advisors.
Morgan Growth Fund returned about 20% for the period, a bit better than its benchmark, the Russell 3000 Growth Index, and the average return of its multi-capitalization growth fund peers. All ten industry sectors contributed to the fund’s return. Compared with the benchmark, the fund’s stock selection proved to be an advantage across almost every sector.
Despite distressing headlines, stock markets rallied
Global stock markets produced exceptional returns for the six months ended March 31, a period punctuated by unnerving developments such as political upheaval in the Middle East and North Africa, new sovereign debt dilemmas in Europe, and a nuclear emergency in Japan. On a more optimistic note, the U.S. economy continued to grind into gear. Job growth picked up, fueling hopes that the good news might be persistent enough to bring down the high unemployment rate.
2
The broad U.S. stock market returned more than 18%. The stocks of smaller companies, which are keenly sensitive to the rhythms of the business cycle, did even better. Non-U.S. stock markets trailed their American counterparts, though as a group, their six-month return topped 10%. European stocks performed best.
All but the shortest-term rates moved higher, affecting bond prices
With the exception of the shortest-term securities, the rates on fixed income investments moved higher during the six-month period. At the start of the period, the 10-year U.S. Treasury note yielded a meager 2.51%. By the end, the rate had climbed to 3.45% as investors demanded more compensation for the possibility that inflation will continue to accelerate from financial-crisis lows.
Rising rates put short-term pressure on bond prices. The broad U.S. taxable bond market produced a slightly negative return. The broad municipal bond market, which came under pressure both from rising rates and concern (exaggerated, in Vanguard’s view) about the financial strength of state and municipal borrowers, returned –3.68%.
As it has since December 2008, the Federal Reserve held its target for short-term interest rates near 0%. This stance kept the returns available from money market instruments, such as the 3-month Treasury bill, in the same neighborhood.
Strong-performing stock choices lifted fund’s performance
Morgan Growth Fund showed notable strength across all sectors during the six-month period. Information technology,
| | | |
| Market Barometer | | | |
| |
| | Total Returns |
| | Periods Ended March 31, 2011 |
| | Six | One | Five Years |
| | Months | Year | (Annualized) |
| Stocks | | | |
| Russell 1000 Index (Large-caps) | 18.13% | 16.69% | 2.93% |
| Russell 2000 Index (Small-caps) | 25.48 | 25.79 | 3.35 |
| Dow Jones U.S. Total Stock Market Index | 18.51 | 17.50 | 3.27 |
| MSCI All Country World Index ex USA (International) | 10.85 | 13.15 | 3.59 |
| |
| Bonds | | | |
| Barclays Capital U.S. Aggregate Bond Index (Broad | | | |
| taxable market) | -0.88% | 5.12% | 6.03% |
| Barclays Capital Municipal Bond Index (Broad | | | |
| tax-exempt market) | -3.68 | 1.63 | 4.14 |
| Citigroup Three-Month U.S. Treasury Bill Index | 0.06 | 0.15 | 2.09 |
| |
| CPI | | | |
| Consumer Price Index | 2.30% | 2.68% | 2.26% |
3
by far the fund’s largest sector, contributed the most to its return. Businesses continued to expand their technology budgets, and the fund benefited from its larger exposure, compared with the benchmark, to chipmaker Altera and networking firms Juniper and Riverbed Technologies. At the same time, the fund’s allocation was much less than the benchmark’s to Hewlett-Packard, which suffered from weak consumer demand for personal computers.
The consumer discretionary sector was also a significant contributor. As the economy continued to improve, consumers gained confidence and felt secure enough to increase their spending. Beyond that
simple story, further factors led ubiquitous coffee chain Starbucks to strong returns. Starbucks rose on news of its strategic arrangement with Green Mountain Coffee Roasters. Entertainment titan Walt Disney, also a major holding, profited from rising affiliate fees and advertising rates as well as receipts from its movies and theme parks.
Economic improvement also made a difference in the industrials sector. Corporations, both in the United States and abroad, were helped by rising demand for construction and farm machinery. Caterpillar, the world’s largest heavy equipment manufacturer, made significant inroads in developing markets.
| | | |
| Expense Ratios | | | |
| Your Fund Compared With Its Peer Group | | | |
| | Investor | Admiral | Peer Group |
| | Shares | Shares | Average |
| Morgan Growth Fund | 0.44% | 0.30% | 1.45% |
The fund expense ratios shown are from the prospectus dated January 26, 2011, and represent estimated costs for the current fiscal year. For
the six months ended March 31, 2011, the fund’s annualized expense ratios were 0.42% for Investor Shares and 0.28% for Admiral Shares.
The peer-group expense ratio is derived from data provided by Lipper Inc. and captures information through year-end 2010.
Peer group: Multi-Cap Growth Funds.
4
While the fund had little exposure to consumer staples stocks, which underperformed during the period, the advisors’ selection within that segment significantly boosted performance. Leading the way was food retailer Whole Foods Markets. Conversely, the fund had less exposure than the benchmark to Wal-Mart Stores. Many consumers who flocked to Wal-Mart during the financial crisis have resumed shopping at higher-end stores. The chain’s core customers, on the other hand, have less money to spend on discretionary items, now that rising oil prices are siphoning more out of their wallets.
Morgan Growth’s biggest stumble came in the energy sector. Energy conglomerate Exxon Mobil, which totals about 5% of the benchmark, surged nearly 40% during the period. Morgan’s allocation to Exxon Mobil was just a fraction of the benchmark’s weighting, although that misstep was offset by strong stock picks elsewhere in the sector.
Look at the long-term regardless of market’s moods
Even bad news can’t seem to derail the stock market’s recovery, now two years old. The broad stock market paused but didn’t plunge on news of the Middle East unrest and Japan’s earthquake, tsunami, and nuclear crisis. But the stock market can
be fickle both as a friend and as a foe, and investors should be aware of its tendencies even though its patterns are unpredictable. Just as the terrible financial crisis of 2008 didn’t last, the current buoyant environment will also eventually fade.
Because the market can be erratic in the short term but a potentially powerful tool in the long term, we recommend you take an investment approach designed to build wealth—while allowing you to hold fast through ups and downs—over time. This means creating a balanced portfolio of stocks, bonds, and cash reserves that is based on your specific time horizon, goals, and risk tolerance. The Morgan Growth Fund, which draws on the expertise and experience of five independent advisors, can play an important role in your portfolio by providing low-cost and broadly diversified exposure to U.S. growth stocks.
As always, thank you for entrusting your assets to Vanguard.
Sincerely,

F. William McNabb III
Chairman and Chief Executive Officer
April 12, 2011
5
Advisors’ Report
For the fiscal half-year ended March 31, 2011, Vanguard Morgan Growth Fund returned 19.77% for Investor Shares and 19.87% for the lower-cost Admiral Shares. Your fund is managed by five independent advisors, a strategy that enhances the fund’s diversification by providing exposure to distinct, yet complementary, investment approaches. It’s not uncommon for different advisors to have different views about individual securities or the broader investment environment.
The advisors, the percentage of fund assets each manages, and brief descriptions of their investment strategies are presented in the table below. The advisors have also prepared a discussion of the investment environment that existed during the fiscal year and of how portfolio positioning reflects this assessment. These comments were prepared on April 19, 2011.
| | | |
| Vanguard Morgan Growth Fund Investment Advisors | |
| |
| | Fund Assets Managed | |
| Investment Advisor | % | $ Million | Investment Strategy |
| Wellington Management | 45 | 4,225 | Uses traditional methods of stock selection—research |
| Company, LLP | | | and analysis—that identify companies believed to have |
| | | | above-average growth prospects, particularly those in |
| | | | industries undergoing change. Focuses on mid- and |
| | | | large-capitalization companies with proven records of |
| | | | sales and earnings growth, profitability, and cash-flow |
| | | | generation. |
| Jennison Associates LLC | 18 | 1,675 | Research-driven, fundamental investment approach |
| | | | that relies on in-depth company knowledge gleaned |
| | | | through meetings with management, customers, and |
| | | | suppliers. |
| Vanguard Quantitative Equity | 12 | 1,161 | Employs a quantitative, fundamental management |
| Group | | | approach, using models that assess valuation, growth |
| | | | prospects, management decisions, market sentiment, |
| | | | and earnings quality of companies versus their peers. |
| Frontier Capital Management Co., | 11 | 1,071 | Research-driven, fundamental investment approach |
| LLC | | | that seeks companies with above-average growth |
| | | | prospects, reasonable valuations, and competitive |
| | | | advantages. |
| Kalmar Investment Advisers | 11 | 1,041 | Employs a “growth-with-value” strategy using creative, |
| | | | bottom-up research to uncover vigorously growing, |
| | | | high-quality businesses whose stocks can also be |
| | | | bought inefficiently valued. The strategy has a dual |
| | | | objective of strong returns with lower risk. |
| Cash Investments | 3 | 256 | These short-term reserves are invested by Vanguard in |
| | | | equity index products to simulate investments in |
| | | | stocks. Each advisor also may maintain a modest cash |
| | | | position. |
6
Wellington Management
Company, llp
Portfolio Manager:
Paul E. Marrkand, CFA,
Senior Vice President
Our portion of the fund uses traditional methods of stock selection, including research and analysis, to identify companies that we believe have above-average growth prospects, particularly those in industries undergoing change. Research focuses on mid- and large-capitalization companies with a proven record of sales and earnings growth, profitability, and cash-flow generation.
Based on our growth, quality, and valuation investment process, we were able to take advantage of the volatility in the market over the past six months by purchasing sustainable growth companies at attractive valuations. We remained true to our process and continued to invest in undervalued companies that have the ability to innovate, gain market share, and grow sales and free cash flow at an above-average rate.
Security selection contributed to the portfolio’s return over the period. As a beneficiary of wide area network optimization across the globe, information technology holding Riverbed Technology was a top contributor for the period.
Sector allocation was a detractor for the half-year, with Cisco Systems among the portfolio’s top relative detractors. Shares of Cisco fell on weaker-than-expected revenue guidance as state and local government spending slowed sharply on budget concerns. However, based upon our current present-value scenario analysis, we find Cisco extremely attractive at today’s prices and have increased the size of our position.
Jennison Associates LLC
Portfolio Manager:
Kathleen A. McCarragher,
Managing Director
Energy was the U.S. market’s strongest-performing sector by a wide margin in the period, spurred first by indications of stronger global economic expansion then by unrest in the Middle East and uncertainty related to Japan’s earthquake and tsunami. Because of its underweighted position, the portfolio was hurt by the rapid run-up in the sector.
Stock selection, on the other hand, was broadly beneficial to portfolio return. Oil services company Schlumberger’s returns outpaced those of the energy sector as a whole as the operating environment encouraged increased investment. In technology, Juniper Networks rose on
7
increased customer spending and new high-speed silicon products. Starbucks was a notable performer in consumer discretionary on strong domestic and international growth. In health care, scientific-testing equipment maker Agilent reported stronger-than-projected earnings and offered better-than-expected earnings guidance. In consumer staples, Whole Foods’ earnings exceeded forecasts on strong sales, solid operating margins, and capital discipline.
Underweighted positions in industrials and materials hurt relative performance, as did overweightings in health care and information technology. Individual detractors from return included Abbott, which faced competitive threats; Anheuser-Busch InBev, which declined on concerns about volume growth; and generic drug company Teva, which offered disappointing earnings guidance.
Vanguard Quantitative Equity Group
Portfolio Manager:
James P. Stetler, Principal
During the fiscal half-year U.S. equity markets showed resiliency and continued to rebound from the low points reached over two years ago despite global economic and geopolitical concerns. Strong corporate earnings and better-than-
expected job growth buoyed equities despite the volatility brought on by the turmoil in the Arab world, the continuing European sovereign debt crisis, and the uncertainty following the natural disaster in Japan. Markets experienced a shock in mid-February as investors digested news related to the protests in the Middle East and Northern Africa, combined with a 20% increase in crude oil prices, before stabilizing and resuming the climb to levels not seen since mid-2008.
Multi-cap growth stocks, the focus of your investment in the Morgan Growth Fund, outpaced value stocks by more than a full percentage point, led by energy, materials, and industrial companies. Telecommunications and consumer staples companies were the laggards for the fiscal period, although all ten sectors provided positive absolute returns.
Our stock selection results added value in eight of ten sectors and were strongest in the health care, industrials, and information technology sectors. In health care, selections such as Amerisource Bergen and United Health Group added most to our returns. In consumer discretionary and information technology, CBS, Starbucks, Altera, and Autodesk were large contributors to relative results.
8
Frontier Capital Management Co., LLC
Portfolio Manager:
Stephen Knightly, CFA,
Senior Vice President
Christopher J. Scarpa,
Vice President
Given the balance of macroeconomic influences, including unrest in the Middle East and North Africa as well as the devastation in Japan, we expect corporate earnings growth to slow to more normalized levels. In an environment where earnings growth is driven less by cost-cutting and cyclical recovery, we expect companies with enduring secular growth attributes, attractive opportunities to expand margins, and appealing valuations to lead performance.
The portfolio was boosted by strong contributions from the technology and health care sectors. In technology, we continued to focus on share gainers in strong secular growth markets. In health care, our attention was centered on companies with multiple ways of making money. Our goal is to identify those companies that through multiple methods (sales, improving margins, strong cash flow) can produce strong returns on capital.
Performance was hindered by consumer discretionary stocks. No single stock was down substantially, but a number suffered under the pressure of rising oil prices, which tends to crimp consumer spending.
Kalmar Investment Advisers
Portfolio Manager:
Ford B. Draper, Jr., President and
Chief Investment Officer
Starting just after Federal Reserve Chairman Ben Bernanke’s late-August announcement of a second round of monetary stimulus measures, dubbed “QE2” for quantitative easing, the U.S. stock markets climbed steadily on low volatility––until recently. This reflected an improving outlook for U.S. and world economic growth and expanding corporate profits, the primary driver of the stock market.
In the most recent quarter, market volatility escalated sharply as so-called “exogenous risks” affected the market. Considering the magnitude of uncertainty from Eurozone debt jitters, uprisings in the Middle East, spiking oil prices, the NATO allies’ bombing of Libya, and Japan’s natural and nuclear disasters, the market has behaved heroically, moving up to post-recession highs. To Kalmar, this resiliency confirms
9
the present bull market and signals further improvement ahead in employment, consumer and business spending, and corporate profits. If true, for the time being we believe this could put a rising floor under equities. Meanwhile, stock market valuations are still reasonable.
Even in an economy whose growth appears to be gaining traction, Kalmar continues to emphasize ownership of “better companies” that are able to create their own future growth opportunities through innovation and internal initiatives. Such self-generating capabilities allow corporate success that is more reliable and more independent of big picture developments. Accordingly, our portfolio contains a blend of differentiated cyclical growers, true secular growth companies, and growth “special situations” with unique business drivers, all of which we buy with attractive valuations relative to their prospects.
Our biggest portfolio successes for the six months from a sector standpoint came in our technology, financial services, and producer durables holdings; and our relative shortfalls came in consumer discretionary and energy, the best performer of all sectors. In energy, our absolute returns were good but lagged
exceptional sector returns, driven by sharply rising oil prices. The portfolio’s exploration and production companies were very successful in boosting reserves but their focus on natural gas was a detriment at a time of weak gas pricing. Our consumer discretionary performance was hurt by several one-off company earnings setbacks, including specialty retailer Urban Outfitters, which we still own, and WMS Industries, which we sold because demand for gambling equipment is not recovering with the economy.
Individual big contributors came from many sectors, prominently including technology: Verifone Systems, the leader in electronic payment terminals; Cognizant Technology Solutions, the Indian software outsourcer; and Polycom Inc., the video conferencing leader. Each benefited from business efforts to reduce costs while maintaining advantages in essential business tasks. Other successes included Foster Wheeler, the international engineering and construction company; Trimble Navigation, which applies GPS technology to industrial applications; Herbalife, the emerging-market-focused direct sales organization; Fastenal, the industrial supply distributor; and Cooper Cos., the international market leader in specialty contact lenses.
10
Morgan Growth Fund
Fund Profile
As of March 31, 2011
| | |
| Share-Class Characteristics | |
| | Investor | Admiral |
| | Shares | Shares |
| Ticker Symbol | VMRGX | VMRAX |
| Expense Ratio1 | 0.44% | 0.30% |
| 30-Day SEC Yield | 0.41% | 0.55% |
| | | |
| Portfolio Characteristics | | |
| | | Russell | DJ |
| | | 3000 | U.S. Total |
| | | Growth | Market |
| | Fund | Index | Index |
| Number of Stocks | 336 | 1,876 | 3,817 |
| Median Market Cap $17.2B | $35.1B | $31.4B |
| Price/Earnings Ratio | 20.6x | 18.9x | 17.9x |
| Price/Book Ratio | 3.7x | 3.8x | 2.3x |
| Return on Equity | 23.1% | 24.1% | 18.9% |
| Earnings Growth Rate 12.5% | 10.4% | 5.9% |
| Dividend Yield | 0.8% | 1.3% | 1.7% |
| Foreign Holdings | 5.4% | 0.0% | 0.0% |
| Turnover Rate | | | |
| (Annualized) | 61% | — | — |
| Short-Term Reserves | 3.0% | — | — |
| | | |
| Sector Diversification (% of equity exposure) |
| | | Russell | DJ |
| | | 3000 | U.S. Total |
| | | Growth | Market |
| | Fund | Index | Index |
| Consumer | | | |
| Discretionary | 14.5% | 14.5% | 11.8% |
| Consumer Staples | 3.8 | 8.7 | 9.2 |
| Energy | 9.4 | 11.4 | 11.8 |
| Financials | 4.2 | 4.7 | 16.2 |
| Health Care | 12.1 | 10.7 | 10.7 |
| Industrials | 14.2 | 13.9 | 11.6 |
| Information | | | |
| Technology | 36.7 | 30.1 | 18.5 |
| Materials | 3.5 | 5.1 | 4.5 |
| Telecommunication | | | |
| Services | 1.4 | 0.8 | 2.6 |
| Utilities | 0.2 | 0.1 | 3.1 |
| | |
| Volatility Measures | | |
| | | DJ |
| | | U.S. Total |
| | Russell 3000 | Market |
| | Growth Index | Index |
| R-Squared | 0.99 | 0.95 |
| Beta | 1.02 | 0.99 |
| These measures show the degree and timing of the fund’s fluctuations compared with the indexes over 36 months. |
| | |
| Ten Largest Holdings (% of total net assets) |
| Apple Inc. | Computer | |
| | Hardware | 3.4% |
| International Business | IT Consulting & | |
| Machines Corp. | Other Services | 3.2 |
| Oracle Corp. | Systems Software | 2.2 |
| EMC Corp. | Computer Storage | |
| | & Peripherals | 1.8 |
| Altera Corp. | Semiconductors | 1.7 |
| Microsoft Corp. | Systems Software | 1.7 |
| Cisco Systems Inc. | Communications | |
| | Equipment | 1.7 |
| Google Inc. Class A | Internet Software & | |
| | Services | 1.6 |
| Caterpillar Inc. | Construction & | |
| | Farm Machinery & | |
| | Heavy Trucks | 1.4 |
| NetApp Inc. | Computer Storage | |
| | & Peripherals | 1.2 |
| Top Ten | | 19.9% |
| The holdings listed exclude any temporary cash investments and equity index products. |
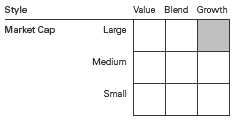
Investment Focus
1 The expense ratios shown are from the prospectus dated January 26, 2011, and represent estimated costs for the current fiscal year. For
the six months ended March 31, 2011, the annualized expense ratios were 0.42% for Investor Shares and 0.28% for Admiral Shares.
11
Morgan Growth Fund
Performance Summary
All of the returns in this report represent past performance, which is not a guarantee of future results that may be achieved by the fund. (Current performance may be lower or higher than the performance data cited. For performance data current to the most recent month-end, visit our website at vanguard.com/performance.) Note, too, that both investment returns and principal value can fluctuate widely, so an investor’s shares, when sold, could be worth more or less than their original cost. The returns shown do not reflect taxes that a shareholder would pay on fund distributions or on the sale of fund shares.
Fiscal-Year Total Returns (%): September 30, 2000, Through March 31, 2011
Note: For 2011, performance data reflect the six months ended March 31, 2011.
Average Annual Total Returns: Periods Ended March 31, 2011
| | | | |
| | Inception | One | Five | Ten |
| | Date | Year | Years | Years |
| Investor Shares | 12/31/1968 | 19.70% | 3.32% | 4.39% |
| Admiral Shares | 5/14/2001 | 19.84 | 3.49 | 3.571 |
| 1 Return since inception. |
See Financial Highlights for dividend and capital gains information.
12
Morgan Growth Fund
Financial Statements (unaudited)
Statement of Net Assets
As of March 31, 2011
The fund reports a complete list of its holdings in regulatory filings four times in each fiscal year, at the quarter-ends. For the second and fourth fiscal quarters, the lists appear in the fund’s semiannual and annual reports to shareholders. For the first and third fiscal quarters, the fund files the lists with the Securities and Exchange Commission on Form N-Q. Shareholders can look up the fund’s Forms N-Q on the SEC’s website at sec.gov. Forms N-Q may also be reviewed and copied at the SEC’s Public Reference Room (see the back cover of this report for further information).
| | | |
| | | | Market |
| | | | Value |
| | | Shares | ($000) |
| Common Stocks (95.2%)1 | | |
| Consumer Discretionary (13.8%) | |
| | Starbucks Corp. | 2,946,498 | 108,873 |
| * | Amazon.com Inc. | 477,260 | 85,969 |
| | Coach Inc. | 1,285,070 | 66,875 |
| | Omnicom Group Inc. | 1,190,741 | 58,418 |
| * | Ford Motor Co. | 3,718,794 | 55,447 |
| | Walt Disney Co. | 1,143,786 | 49,286 |
| | Ross Stores Inc. | 655,955 | 46,651 |
| * | ITT Educational | | |
| | Services Inc. | 622,846 | 44,938 |
| | TJX Cos. Inc. | 808,080 | 40,186 |
| | NIKE Inc. Class B | 522,581 | 39,559 |
| * | LKQ Corp. | 1,558,251 | 37,554 |
| | Bayerische Motoren | | |
| | Werke AG ADR | 1,265,922 | 35,186 |
| | Advance Auto Parts Inc. | 525,471 | 34,481 |
| | Home Depot Inc. | 928,279 | 34,402 |
| | News Corp. Class A | 1,848,439 | 32,459 |
| * | Apollo Group Inc. Class A | 584,090 | 24,362 |
| * | Lululemon Athletica Inc. | 232,475 | 20,702 |
| | Tractor Supply Co. | 338,785 | 20,280 |
| * | CarMax Inc. | 583,345 | 18,725 |
| * | priceline.com Inc. | 36,464 | 18,467 |
| | Gentex Corp. | 577,385 | 17,466 |
| | Polo Ralph Lauren Corp. | | |
| | Class A | 138,099 | 17,076 |
| * | BorgWarner Inc. | 213,346 | 17,002 |
| * | Dollar Tree Inc. | 295,400 | 16,401 |
| | DeVry Inc. | 290,910 | 16,020 |
| | Harman International | | |
| | Industries Inc. | 341,900 | 16,008 |
| * | Discovery Communications | | |
| | Inc. Class A | 401,000 | 16,000 |
| | Nordstrom Inc. | 346,970 | 15,572 |
| * | Discovery Communications | | |
| | Inc. | 432,415 | 15,225 |
| | McDonald’s Corp. | 197,500 | 15,028 |
| | Starwood Hotels & Resorts | | |
| | Worldwide Inc. | 237,900 | 13,827 |
| | | |
| * | DIRECTV Class A | 290,200 | 13,581 |
| | Williams-Sonoma Inc. | 304,635 | 12,338 |
| | Scripps Networks | | |
| | Interactive Inc. Class A | 245,600 | 12,302 |
| | Harley-Davidson Inc. | 278,200 | 11,821 |
| | Buckle Inc. | 290,524 | 11,737 |
| * | Bed Bath & Beyond Inc. | 241,200 | 11,643 |
| * | Las Vegas Sands Corp. | 273,007 | 11,526 |
| | Target Corp. | 225,000 | 11,252 |
| * | Urban Outfitters Inc. | 375,400 | 11,198 |
| * | Warnaco Group Inc. | 194,925 | 11,148 |
| * | O’Reilly Automotive Inc. | 193,200 | 11,101 |
| | Darden Restaurants Inc. | 209,480 | 10,292 |
| | Service Corp. International | 924,415 | 10,224 |
| | CBS Corp. Class B | 372,300 | 9,322 |
| * | Tenneco Inc. | 210,858 | 8,951 |
| * | Ctrip.com International | | |
| | Ltd. ADR | 204,896 | 8,501 |
| | Wynn Resorts Ltd. | 65,600 | 8,348 |
| | Autoliv Inc. | 106,340 | 7,894 |
| * | AutoZone Inc. | 28,400 | 7,769 |
| | Tiffany & Co. | 116,600 | 7,164 |
| | Cablevision Systems Corp. | | |
| | Class A | 201,500 | 6,974 |
| * | TRW Automotive | | |
| | Holdings Corp. | 120,200 | 6,621 |
| | Chico’s FAS Inc. | 437,953 | 6,525 |
| | Time Warner Cable Inc. | 71,200 | 5,079 |
| * | Fossil Inc. | 48,699 | 4,561 |
| * | Chipotle Mexican Grill Inc. | | |
| | Class A | 15,700 | 4,276 |
| | Comcast Corp. Class A | | |
| | Special Shares | 183,634 | 4,264 |
| * | Liberty Global Inc. Class A | 58,700 | 2,431 |
| * | Liberty Global Inc. | 59,000 | 2,359 |
| | Virgin Media Inc. | 67,500 | 1,876 |
| * | DISH Network Corp. Class A | 24,100 | 587 |
| | Lowe’s Cos. Inc. | 13,500 | 357 |
| | | | 1,302,467 |
13
Morgan Growth Fund
| | | |
| | | | Market |
| | | | Value |
| | | Shares | ($000) |
| Consumer Staples (3.4%) | | |
| | Whole Foods Market Inc. | 657,725 | 43,344 |
| | Estee Lauder Cos. Inc. | | |
| | Class A | 391,902 | 37,764 |
| | Mead Johnson Nutrition Co. | 582,638 | 33,752 |
| | Costco Wholesale Corp. | 417,695 | 30,625 |
| | Philip Morris | | |
| | International Inc. | 414,700 | 27,217 |
| | Wal-Mart Stores Inc. | 469,200 | 24,422 |
| | Herbalife Ltd. | 299,010 | 24,327 |
| * | Hansen Natural Corp. | 296,938 | 17,884 |
| | PepsiCo Inc. | 189,800 | 12,225 |
| | Coca-Cola Co. | 148,278 | 9,838 |
| | Colgate-Palmolive Co. | 117,500 | 9,489 |
| | Kroger Co. | 379,000 | 9,085 |
| | Anheuser-Busch | | |
| | InBev NV ADR | 143,268 | 8,191 |
| | Dr Pepper Snapple | | |
| | Group Inc. | 188,800 | 7,016 |
| | Coca-Cola Enterprises Inc. | 240,500 | 6,566 |
| | Hershey Co. | 94,000 | 5,109 |
| | Sara Lee Corp. | 274,300 | 4,847 |
| | Kimberly-Clark Corp. | 46,600 | 3,042 |
| | Hormel Foods Corp. | 94,800 | 2,639 |
| | Walgreen Co. | 19,700 | 791 |
| | | | 318,173 |
| Energy (8.8%) | | |
| | Occidental Petroleum Corp. | 898,449 | 93,879 |
| | Exxon Mobil Corp. | 940,280 | 79,106 |
| | Schlumberger Ltd. | 804,148 | 74,995 |
| * | Cameron International | | |
| | Corp. | 1,070,246 | 61,111 |
| | Valero Energy Corp. | 2,023,226 | 60,333 |
| | Anadarko Petroleum Corp. | 528,032 | 43,256 |
| * | Concho Resources Inc. | 394,728 | 42,354 |
| | Canadian Natural | | |
| | Resources Ltd. | 853,657 | 42,196 |
| | Diamond Offshore | | |
| | Drilling Inc. | 439,920 | 34,182 |
| | Baker Hughes Inc. | 413,430 | 30,358 |
| * | Oceaneering | | |
| | International Inc. | 318,946 | 28,530 |
| | BP plc ADR | 583,372 | 25,750 |
| * | SandRidge Energy Inc. | 1,480,760 | 18,954 |
| * | Continental Resources Inc. | 220,700 | 15,773 |
| *,^ | InterOil Corp. | 210,600 | 15,719 |
| * | Pride International Inc. | 287,700 | 12,357 |
| * | Petrohawk Energy Corp. | 483,980 | 11,877 |
| * | Superior Energy | | |
| | Services Inc. | 277,460 | 11,376 |
| * | Alpha Natural | | |
| | Resources Inc. | 191,310 | 11,358 |
| * | McDermott | | |
| | International Inc. | 445,300 | 11,306 |
| | Core Laboratories NV | 100,490 | 10,267 |
| | | |
| | Peabody Energy Corp. | 139,300 | 10,024 |
| | National Oilwell Varco Inc. | 119,540 | 9,476 |
| | Pioneer Natural | | |
| | Resources Co. | 85,600 | 8,724 |
| | Cabot Oil & Gas Corp. | 164,600 | 8,719 |
| | Consol Energy Inc. | 154,300 | 8,275 |
| * | Whiting Petroleum Corp. | 111,700 | 8,204 |
| | El Paso Corp. | 430,200 | 7,744 |
| * | Southwestern Energy Co. | 178,780 | 7,682 |
| | Hess Corp. | 89,600 | 7,635 |
| | Sunoco Inc. | 155,900 | 7,107 |
| * | Weatherford | | |
| | International Ltd. | 290,380 | 6,563 |
| | Murphy Oil Corp. | 56,100 | 4,119 |
| * | Tesoro Corp. | 106,700 | 2,863 |
| | Halliburton Co. | 32,800 | 1,635 |
| | Arch Coal Inc. | 13,100 | 472 |
| | | | 834,279 |
| Exchange-Traded Fund (0.7%) | |
| ^,2 | Vanguard Growth ETF | 1,044,900 | 67,187 |
| |
| Financials (3.7%) | | |
| | Goldman Sachs Group Inc. | 451,218 | 71,505 |
| | American Express Co. | 1,541,853 | 69,692 |
| | Lincoln National Corp. | 1,006,076 | 30,223 |
| | T Rowe Price Group Inc. | 404,790 | 26,886 |
| * | CB Richard Ellis Group | | |
| | Inc. Class A | 872,570 | 23,298 |
| * | Affiliated Managers | | |
| | Group Inc. | 168,250 | 18,401 |
| | Raymond James | | |
| | Financial Inc. | 480,500 | 18,374 |
| | Moody’s Corp. | 505,390 | 17,138 |
| | Lazard Ltd. Class A | 359,945 | 14,967 |
| | Discover Financial Services | 362,500 | 8,743 |
| * | Citigroup Inc. | 1,897,500 | 8,387 |
| | Aflac Inc. | 152,300 | 8,038 |
| | Ameriprise Financial Inc. | 118,900 | 7,262 |
| | Capital One Financial Corp. | 126,400 | 6,568 |
| | Franklin Resources Inc. | 52,500 | 6,567 |
| | Waddell & Reed Financial | | |
| | Inc. Class A | 159,575 | 6,480 |
| | Public Storage | 43,500 | 4,825 |
| | US Bancorp | 115,600 | 3,055 |
| | Simon Property Group Inc. | 20,100 | 2,154 |
| | | | 352,563 |
| Health Care (11.4%) | | |
| * | Express Scripts Inc. | 1,520,335 | 84,546 |
| | UnitedHealth Group Inc. | 1,668,627 | 75,422 |
| * | Agilent Technologies Inc. | 1,530,279 | 68,526 |
| * | Waters Corp. | 701,877 | 60,993 |
| * | Amgen Inc. | 877,760 | 46,916 |
| | Cardinal Health Inc. | 1,116,005 | 45,901 |
| | Shire plc ADR | 514,495 | 44,813 |
14
Morgan Growth Fund
| | | |
| | | | Market |
| | | | Value |
| | | Shares | ($000) |
| | Cooper Cos. Inc. | 624,780 | 43,391 |
| | AmerisourceBergen Corp. | | |
| | Class A | 988,669 | 39,112 |
| * | Laboratory Corp. of | | |
| | America Holdings | 376,285 | 34,667 |
| * | Illumina Inc. | 490,122 | 34,343 |
| * | Hologic Inc. | 1,544,859 | 34,296 |
| | Stryker Corp. | 530,337 | 32,245 |
| * | Vertex Pharmaceuticals Inc. | 655,337 | 31,410 |
| * | Celgene Corp. | 473,972 | 27,268 |
| | Pfizer Inc. | 1,179,857 | 23,963 |
| | Teva Pharmaceutical | | |
| | Industries Ltd. ADR | 463,531 | 23,255 |
| * | Intuitive Surgical Inc. | 63,993 | 21,339 |
| * | Hospira Inc. | 382,120 | 21,093 |
| * | United Therapeutics Corp. | 307,540 | 20,611 |
| * | Watson Pharmaceuticals | | |
| | Inc. | 315,370 | 17,664 |
| | Novo Nordisk A/S ADR | 127,781 | 16,002 |
| | Perrigo Co. | 197,300 | 15,689 |
| * | ResMed Inc. | 511,880 | 15,356 |
| * | Allscripts Healthcare | | |
| | Solutions Inc. | 730,100 | 15,325 |
| * | DaVita Inc. | 153,700 | 13,143 |
| * | Bruker Corp. | 568,727 | 11,858 |
| * | Varian Medical | | |
| | Systems Inc. | 163,810 | 11,080 |
| | Patterson Cos. Inc. | 319,900 | 10,298 |
| | McKesson Corp. | 129,300 | 10,221 |
| * | Biogen Idec Inc. | 136,550 | 10,021 |
| * | Medco Health | | |
| | Solutions Inc. | 174,000 | 9,772 |
| * | Catalyst Health | | |
| | Solutions Inc. | 172,563 | 9,651 |
| * | ICON plc ADR | 441,100 | 9,523 |
| * | Gilead Sciences Inc. | 215,622 | 9,151 |
| * | Mednax Inc. | 132,800 | 8,846 |
| * | Edwards Lifesciences Corp. | 87,400 | 7,604 |
| | Abbott Laboratories | 152,800 | 7,495 |
| * | Mylan Inc. | 327,300 | 7,420 |
| * | Covance Inc. | 134,420 | 7,355 |
| * | Endo Pharmaceuticals | | |
| | Holdings Inc. | 158,400 | 6,045 |
| * | Community Health | | |
| | Systems Inc. | 150,000 | 5,999 |
| * | Cerner Corp. | 48,177 | 5,357 |
| * | Alexion Pharmaceuticals | | |
| | Inc. | 52,130 | 5,144 |
| | Allergan Inc. | 70,200 | 4,986 |
| * | Amylin Pharmaceuticals Inc. | 317,518 | 3,610 |
| | Johnson & Johnson | 58,300 | 3,454 |
| | Lincare Holdings Inc. | 103,200 | 3,061 |
| | Medtronic Inc. | 38,299 | 1,507 |
| | | | 1,076,747 |
| | | |
| Industrials (13.5%) | | |
| | Caterpillar Inc. | 1,209,896 | 134,722 |
| | General Electric Co. | 3,816,785 | 76,527 |
| | Parker Hannifin Corp. | 776,497 | 73,519 |
| | Boeing Co. | 821,785 | 60,755 |
| | Honeywell International Inc. | 984,711 | 58,797 |
| | Deere & Co. | 515,218 | 49,919 |
| | Joy Global Inc. | 500,172 | 49,422 |
| | Emerson Electric Co. | 730,011 | 42,655 |
| | Dover Corp. | 590,881 | 38,845 |
| | AMETEK Inc. | 881,833 | 38,686 |
| | Illinois Tool Works Inc. | 699,655 | 37,585 |
| | Precision Castparts Corp. | 248,316 | 36,547 |
| * | BE Aerospace Inc. | 1,020,464 | 36,257 |
| * | IHS Inc. Class A | 391,350 | 34,732 |
| | Cummins Inc. | 312,275 | 34,232 |
| * | Foster Wheeler AG | 798,240 | 30,030 |
| | Fastenal Co. | 456,090 | 29,568 |
| * | Navistar International Corp. | 417,350 | 28,935 |
| | CH Robinson | | |
| | Worldwide Inc. | 387,729 | 28,742 |
| | Expeditors International of | | |
| | Washington Inc. | 453,445 | 22,736 |
| | MSC Industrial Direct Co. | | |
| | Class A | 299,416 | 20,501 |
| | Flowserve Corp. | 150,335 | 19,363 |
| | Chicago Bridge & | | |
| | Iron Co. NV | 470,720 | 19,139 |
| | Cooper Industries plc | 276,360 | 17,936 |
| | Ingersoll-Rand plc | 342,200 | 16,532 |
| | United Parcel Service Inc. | | |
| | Class B | 211,500 | 15,719 |
| | Pall Corp. | 256,492 | 14,777 |
| * | HUB Group Inc. Class A | 382,162 | 13,830 |
| * | Hertz Global Holdings Inc. | 845,280 | 13,212 |
| * | Swift Transporation Co. | 863,230 | 12,689 |
| * | Corrections Corp. of | | |
| | America | 459,150 | 11,203 |
| * | Alaska Air Group Inc. | 170,307 | 10,801 |
| | Lennox International Inc. | 203,528 | 10,701 |
| * | Stericycle Inc. | 120,505 | 10,685 |
| | IESI-BFC Ltd. | 417,455 | 10,591 |
| | JB Hunt Transport | | |
| | Services Inc. | 223,445 | 10,149 |
| * | WESCO International Inc. | 154,900 | 9,681 |
| * | CNH Global NV | 175,100 | 8,501 |
| | UTi Worldwide Inc. | 419,681 | 8,494 |
| | Donaldson Co. Inc. | 134,403 | 8,238 |
| | Landstar System Inc. | 176,745 | 8,074 |
| | Rockwell Automation Inc. | 83,700 | 7,922 |
| | Rockwell Collins Inc. | 117,800 | 7,637 |
| | Union Pacific Corp. | 74,200 | 7,296 |
| | Southwest Airlines Co. | 545,300 | 6,887 |
| | Waste Connections Inc. | 236,900 | 6,820 |
15
Morgan Growth Fund
| | | |
| | | | Market |
| | | | Value |
| | | Shares | ($000) |
| * | Delta Air Lines Inc. | 611,200 | 5,990 |
| | PACCAR Inc. | 109,700 | 5,743 |
| * | TransDigm Group Inc. | 64,505 | 5,407 |
| | Pitney Bowes Inc. | 81,700 | 2,099 |
| * | AGCO Corp. | 34,900 | 1,918 |
| | Republic Services Inc. | | |
| | Class A | 41,300 | 1,241 |
| | | | 1,272,987 |
| Information Technology (35.2%) | |
| * | Apple Inc. | 909,249 | 316,828 |
| | International Business | | |
| | Machines Corp. | 1,830,892 | 298,564 |
| | Oracle Corp. | 6,275,267 | 209,406 |
| * | EMC Corp. | 6,527,832 | 173,314 |
| | Altera Corp. | 3,683,337 | 162,141 |
| | Microsoft Corp. | 6,351,859 | 161,083 |
| | Cisco Systems Inc. | 9,118,177 | 156,377 |
| * | Google Inc. Class A | 258,987 | 151,821 |
| * | NetApp Inc. | 2,269,401 | 109,340 |
| * | Juniper Networks Inc. | 1,974,920 | 83,105 |
| * | Cognizant Technology | | |
| | Solutions Corp. Class A | 877,505 | 71,429 |
| | Xilinx Inc. | 2,042,616 | 66,998 |
| * | QLogic Corp. | 3,575,487 | 66,325 |
| * | Autodesk Inc. | 1,458,688 | 64,343 |
| * | Baidu Inc. ADR | 428,822 | 59,096 |
| | Analog Devices Inc. | 1,476,610 | 58,149 |
| * | VMware Inc. Class A | 636,196 | 51,875 |
| | QUALCOMM Inc. | 890,629 | 48,833 |
| * | Check Point Software | | |
| | Technologies Ltd. | 933,796 | 47,670 |
| * | Dell Inc. | 3,271,950 | 47,476 |
| * | Alliance Data | | |
| | Systems Corp. | 528,355 | 45,380 |
| * | VeriFone Systems Inc. | 686,886 | 37,744 |
| | Intersil Corp. Class A | 2,951,236 | 36,743 |
| * | Red Hat Inc. | 807,689 | 36,661 |
| * | Citrix Systems Inc. | 491,796 | 36,127 |
| * | Salesforce.com Inc. | 260,307 | 34,772 |
| * | Adobe Systems Inc. | 1,044,932 | 34,650 |
| * | BMC Software Inc. | 668,415 | 33,247 |
| * | IAC/InterActiveCorp | 1,050,922 | 32,463 |
| | Avago Technologies Ltd. | 1,040,437 | 32,358 |
| | Broadcom Corp. Class A | 798,178 | 31,432 |
| * | Emulex Corp. | 2,760,737 | 29,457 |
| | Amphenol Corp. Class A | 537,410 | 29,230 |
| * | eBay Inc. | 931,852 | 28,925 |
| * | Rovi Corp. | 529,960 | 28,432 |
| * | Skyworks Solutions Inc. | 872,100 | 28,274 |
| * | Atmel Corp. | 1,919,656 | 26,165 |
| | TE Connectivity Ltd. | 572,788 | 19,945 |
| | Fidelity National | | |
| | Information Services Inc. | 594,670 | 19,440 |
| * | Lam Research Corp. | 324,370 | 18,379 |
| | | |
| * | Teradata Corp. | 361,200 | 18,313 |
| * | Riverbed Technology Inc. | 478,933 | 18,032 |
| * | Trimble Navigation Ltd. | 347,265 | 17,551 |
| * | MEMC Electronic | | |
| | Materials Inc. | 1,246,198 | 16,151 |
| * | F5 Networks Inc. | 154,415 | 15,838 |
| | Mastercard Inc. Class A | 58,490 | 14,723 |
| * | Intuit Inc. | 262,900 | 13,960 |
| | ADTRAN Inc. | 307,800 | 13,069 |
| * | RF Micro Devices Inc. | 1,993,795 | 12,780 |
| | Hewlett-Packard Co. | 302,500 | 12,393 |
| | Accenture plc Class A | 221,000 | 12,148 |
| * | Ariba Inc. | 302,189 | 10,317 |
| * | Nuance Communications | | |
| | Inc. | 516,040 | 10,094 |
| * | Alcatel-Lucent ADR | 1,733,128 | 10,069 |
| | Jabil Circuit Inc. | 483,963 | 9,887 |
| * | Polycom Inc. | 190,420 | 9,873 |
| * | Microsemi Corp. | 454,500 | 9,413 |
| | FLIR Systems Inc. | 271,900 | 9,410 |
| * | TriQuint Semiconductor Inc. | 691,400 | 8,926 |
| * | Fiserv Inc. | 131,300 | 8,235 |
| * | ON Semiconductor Corp. | 720,322 | 7,110 |
| * | Novellus Systems Inc. | 146,200 | 5,428 |
| *,3 | Mail.ru Group Ltd. GDR | 178,747 | 5,353 |
| * | Motorola Mobility | | |
| | Holdings Inc. | 202,637 | 4,944 |
| | Intel Corp. | 225,500 | 4,548 |
| *,^ | Longtop Financial | | |
| | Technologies Ltd. ADR | 140,108 | 4,402 |
| * | Flextronics International | | |
| | Ltd. | 314,072 | 2,346 |
| * | Motorola Solutions Inc. | 51,157 | 2,286 |
| * | Advanced Micro | | |
| | Devices Inc. | 121,400 | 1,044 |
| | Texas Instruments Inc. | 25,200 | 871 |
| | Visa Inc. Class A | 11,400 | 839 |
| | | | 3,314,350 |
| Materials (3.3%) | | |
| | Nucor Corp. | 818,135 | 37,651 |
| | EI du Pont de | | |
| | Nemours & Co. | 605,827 | 33,302 |
| | Cliffs Natural | | |
| | Resources Inc. | 324,361 | 31,878 |
| | Teck Resources Ltd. | | |
| | Class B | 597,885 | 31,700 |
| | Sherwin-Williams Co. | 321,535 | 27,006 |
| | Rio Tinto plc ADR | 378,999 | 26,954 |
| | Freeport-McMoRan | | |
| | Copper & Gold Inc. | 280,900 | 15,604 |
| | Praxair Inc. | 143,930 | 14,623 |
| | Albemarle Corp. | 244,200 | 14,596 |
| * | Crown Holdings Inc. | 347,400 | 13,403 |
| | Walter Energy Inc. | 87,465 | 11,845 |
16
Morgan Growth Fund
| | | |
| | | | Market |
| | | | Value |
| | | Shares | ($000) |
| | Newmont Mining Corp. | 186,200 | 10,163 |
| | Allegheny Technologies Inc. | 134,942 | 9,138 |
| | FMC Corp. | 88,974 | 7,556 |
| | International Paper Co. | 228,600 | 6,899 |
| | Ball Corp. | 190,200 | 6,819 |
| | Alcoa Inc. | 363,000 | 6,407 |
| | Lubrizol Corp. | 11,600 | 1,554 |
| | Monsanto Co. | 7,400 | 535 |
| | | | 307,633 |
| Telecommunication Services (1.3%) | | |
| * | American Tower Corp. | | |
| | Class A | 953,394 | 49,405 |
| | Vodafone Group plc ADR | 1,117,308 | 32,123 |
| * | NII Holdings Inc. | 317,130 | 13,215 |
| * | Crown Castle | | |
| | International Corp. | 279,700 | 11,901 |
| | Millicom International | | |
| | Cellular SA | 109,905 | 10,569 |
| * | MetroPCS | | |
| | Communications Inc. | 307,700 | 4,997 |
| | | | 122,210 |
| Utilities (0.1%) | | |
| * | AES Corp. | 838,370 | 10,899 |
| Total Common Stocks | | |
| (Cost $6,521,735) | | 8,979,495 |
| Temporary Cash Investments (5.2%)1 | | |
| Money Market Fund (2.8%) | | |
| 4,5 | Vanguard Market Liquidity | | |
| | Fund, 0.208% | 260,004,161 | 260,004 |
| | | |
| | | Face | Market |
| | | Amount | Value |
| | | ($000) | ($000) |
| Repurchase Agreement (2.2%) | | |
| | Banc of America Securities, | | |
| | LLC 0.140%, 4/1/11 (Dated | | |
| | 3/31/11, Repurchase Value | | |
| | $211,800,000, collateralized | | |
| | by Federal Home Loan | | |
| | Mortgage Corp. 5.879%, | | |
| | 7/1/37, and Federal National | | |
| | Mortgage Assn. 2.239%- | | |
| | 5.646%, 5/1/35-3/1/41) | 211,800 | 211,800 |
| |
| U.S. Government and Agency Obligations (0.2%) |
| 6,7 | Federal Home Loan Bank | | |
| | Discount Notes, | | |
| | 0.250%, 6/15/11 | 6,000 | 5,998 |
| 6,7 | Freddie Mac Discount | | |
| | Notes, 0.180%, 5/2/11 | 10,000 | 9,999 |
| 6,7 | Freddie Mac Discount | | |
| | Notes, 0.271%, 6/7/11 | 220 | 220 |
| | | | 16,217 |
| Total Temporary Cash Investments | |
| (Cost $488,019) | | 488,021 |
| Total Investments (100.4%) | | |
| (Cost $7,009,754) | | 9,467,516 |
| Other Assets and Liabilities (-0.4%) | |
| Other Assets | | 58,303 |
| Liabilities5 | | (97,190) |
| | | | (38,887) |
| Net Assets (100%) | | 9,428,629 |
17
Morgan Growth Fund
| |
| At March 31, 2011, net assets consisted of: |
| | Amount |
| | ($000) |
| Paid-in Capital | 8,455,001 |
| Overdistributed Net Investment Income | (8,233) |
| Accumulated Net Realized Losses | (1,479,050) |
| Unrealized Appreciation (Depreciation) | |
| Investment Securities | 2,457,762 |
| Futures Contracts | 3,149 |
| Net Assets | 9,428,629 |
| |
| |
| Investor Shares—Net Assets | |
| Applicable to 319,329,685 outstanding | |
| $.001 par value shares of beneficial | |
| interest (unlimited authorization) | 6,101,440 |
| Net Asset Value Per Share— | |
| Investor Shares | $19.11 |
| |
| |
| Admiral Shares—Net Assets | |
| Applicable to 56,154,244 outstanding | |
| $.001 par value shares of beneficial | |
| interest (unlimited authorization) | 3,327,189 |
| Net Asset Value Per Share— | |
| Admiral Shares | $59.25 |
See Note A in Notes to Financial Statements.
* Non-income-producing security.
^ Part of security position is on loan to broker-dealers. The total value of securities on loan is $17,303,000.
1 The fund invests a portion of its cash reserves in equity markets through the use of index futures contracts. After giving effect
to futures investments, the fund’s effective common stock and temporary cash investment positions represent 97.2% and 3.2%,
respectively, of net assets.
2 Considered an affiliated company of the fund as the issuer is another member of The Vanguard Group.
3 Security exempt from registration under Rule 144A of the Securities Act of 1933. Such securities may be sold in transactions exempt from
registration, normally to qualified institutional buyers. At March 31, 2011, the value of this security represented 0.1% of net assets.
4 Affiliated money market fund available only to Vanguard funds and certain trusts and accounts managed by Vanguard. Rate shown is the
7-day yield.
5 Includes $17,795,000 of collateral received for securities on loan.
6 The issuer operates under a congressional charter; its securities are not backed by the full faith and credit of the U.S. government.
7 Securities with a value of $15,517,000 have been segregated as initial margin for open futures contracts.
ADR—American Depositary Receipt.
GDR—Global Depositary Receipt.
See accompanying Notes, which are an integral part of the Financial Statements.
18
Morgan Growth Fund
Statement of Operations
| |
| | Six Months Ended |
| | March 31, 2011 |
| | ($000) |
| Investment Income | |
| Income | |
| Dividends1,2 | 37,564 |
| Interest2 | 339 |
| Security Lending | 173 |
| Total Income | 38,076 |
| Expenses | |
| Investment Advisory Fees—Note B | |
| Basic Fee | 7,288 |
| Performance Adjustment | (483) |
| The Vanguard Group—Note C | |
| Management and Administrative—Investor Shares | 7,032 |
| Management and Administrative—Admiral Shares | 1,561 |
| Marketing and Distribution—Investor Shares | 669 |
| Marketing and Distribution—Admiral Shares | 332 |
| Custodian Fees | 80 |
| Shareholders’ Reports—Investor Shares | 33 |
| Shareholders’ Reports—Admiral Shares | 20 |
| Trustees’ Fees and Expenses | 8 |
| Total Expenses | 16,540 |
| Expenses Paid Indirectly | (250) |
| Net Expenses | 16,290 |
| Net Investment Income | 21,786 |
| Realized Net Gain (Loss) | |
| Investment Securities Sold2 | 481,301 |
| Futures Contracts | 22,959 |
| Realized Net Gain (Loss) | 504,260 |
| Change in Unrealized Appreciation (Depreciation) | |
| Investment Securities | 1,023,374 |
| Futures Contracts | 1,615 |
| Change in Unrealized Appreciation (Depreciation) | 1,024,989 |
| Net Increase (Decrease) in Net Assets Resulting from Operations | 1,551,035 |
1 Dividends are net of foreign withholding taxes of $110,000.
2 Dividend income, interest income, and realized net gain (loss) from affiliated companies of the fund were $390,000, $256,000,
and $0, respectively.
See accompanying Notes, which are an integral part of the Financial Statements.
19
Morgan Growth Fund
Statement of Changes in Net Assets
| | |
| | Six Months Ended | Year Ended |
| | March 31, | September 30, |
| | 2011 | 2010 |
| | ($000) | ($000) |
| Increase (Decrease) in Net Assets | | |
| Operations | | |
| Net Investment Income | 21,786 | 52,591 |
| Realized Net Gain (Loss) | 504,260 | 412,692 |
| Change in Unrealized Appreciation (Depreciation) | 1,024,989 | 467,615 |
| Net Increase (Decrease) in Net Assets Resulting from Operations | 1,551,035 | 932,898 |
| Distributions | | |
| Net Investment Income | | |
| Investor Shares | (30,610) | (39,716) |
| Admiral Shares | (19,672) | (20,471) |
| Realized Capital Gain | | |
| Investor Shares | — | — |
| Admiral Shares | — | — |
| Total Distributions | (50,282) | (60,187) |
| Capital Share Transactions | | |
| Investor Shares | (332,072) | (417,198) |
| Admiral Shares | 383,654 | (69,202) |
| Net Increase (Decrease) from Capital Share Transactions | 51,582 | (486,400) |
| Total Increase (Decrease) | 1,552,335 | 386,311 |
| Net Assets | | |
| Beginning of Period | 7,876,294 | 7,489,983 |
| End of Period1 | 9,428,629 | 7,876,294 |
| 1 Net Assets—End of Period includes undistributed (overdistributed) net investment income of ($8,233,000) and $20,263,000. |
See accompanying Notes, which are an integral part of the Financial Statements.
20
Morgan Growth Fund
Financial Highlights
| | | | | | |
| Investor Shares | | | | | | |
| | Six Months | | | | | |
| | Ended | | | | | |
| For a Share Outstanding | March 31, | Year Ended September 30, |
| Throughout Each Period | 2011 | 2010 | 2009 | 2008 | 2007 | 2006 |
| Net Asset Value, Beginning of Period | $16.04 | $14.32 | $15.15 | $21.45 | $18.34 | $17.04 |
| Investment Operations | | | | | | |
| Net Investment Income | .041 | .097 | .114 | .148 | .207 | .165 |
| Net Realized and Unrealized Gain (Loss) | | | | | | |
| on Investments | 3.125 | 1.733 | (.804) | (4.912) | 3.604 | 1.230 |
| Total from Investment Operations | 3.166 | 1.830 | (.690) | (4.764) | 3.811 | 1.395 |
| Distributions | | | | | | |
| Dividends from Net Investment Income | (.096) | (.110) | (.140) | (.175) | (.204) | (.095) |
| Distributions from Realized Capital Gains | — | — | — | (1.361) | (.497) | — |
| Total Distributions | (.096) | (.110) | (.140) | (1.536) | (.701) | (.095) |
| Net Asset Value, End of Period | $19.11 | $16.04 | $14.32 | $15.15 | $21.45 | $18.34 |
| |
| Total Return1 | 19.77% | 12.81% | -4.27% | -23.70% | 21.24% | 8.20% |
| |
| Ratios/Supplemental Data | | | | | | |
| Net Assets, End of Period (Millions) | $6,101 | $5,432 | $5,239 | $5,418 | $6,590 | $5,171 |
| Ratio of Total Expenses to | | | | | | |
| Average Net Assets2 | 0.42% | 0.44% | 0.48% | 0.38% | 0.37% | 0.42% |
| Ratio of Net Investment Income to | | | | | | |
| Average Net Assets | 0.45% | 0.62% | 0.94% | 0.80% | 1.06% | 0.95% |
| Portfolio Turnover Rate | 61% | 60% | 87% | 88% | 79% | 90% |
The expense ratio, net income ratio, and turnover rate for the current period have been annualized.
1 Total returns do not include account service fees that may have applied in the periods shown. Fund prospectuses provide information about
any applicable transaction fees.
2 Includes performance-based investment advisory fee increases (decreases) of (0.01%), 0.01%, 0.02%, 0.00%, 0.00%, and 0.02%.
See accompanying Notes, which are an integral part of the Financial Statements.
21
Morgan Growth Fund
Financial Highlights
| | | | | | |
| Admiral Shares | | | | | | |
| | Six Months | | | | | |
| | Ended | | | | | |
| For a Share Outstanding | March 31, | Year Ended September 30, |
| Throughout Each Period | 2011 | 2010 | 2009 | 2008 | 2007 | 2006 |
| Net Asset Value, Beginning of Period | $49.75 | $44.42 | $47.03 | $66.58 | $56.94 | $52.91 |
| Investment Operations | | | | | | |
| Net Investment Income | .161 | .372 | .414 | .555 | .742 | .620 |
| Net Realized and Unrealized Gain (Loss) | | | | | | |
| on Investments | 9.701 | 5.364 | (2.502) | (15.244) | 11.184 | 3.808 |
| Total from Investment Operations | 9.862 | 5.736 | (2.088) | (14.689) | 11.926 | 4.428 |
| Distributions | | | | | | |
| Dividends from Net Investment Income | (.362) | (.406) | (.522) | (.641) | (.745) | (.398) |
| Distributions from Realized Capital Gains | — | — | — | (4.220) | (1.541) | — |
| Total Distributions | (.362) | (.406) | (.522) | (4.861) | (2.286) | (.398) |
| Net Asset Value, End of Period | $59.25 | $49.75 | $44.42 | $47.03 | $66.58 | $56.94 |
| |
| Total Return | 19.87% | 12.95% | -4.09% | -23.57% | 21.43% | 8.39% |
| |
| Ratios/Supplemental Data | | | | | | |
| Net Assets, End of Period (Millions) | $3,327 | $2,445 | $2,251 | $2,512 | $2,683 | $1,691 |
| Ratio of Total Expenses to | | | | | | |
| Average Net Assets1 | 0.28% | 0.30% | 0.31% | 0.21% | 0.21% | 0.23% |
| Ratio of Net Investment Income to | | | | | | |
| Average Net Assets | 0.59% | 0.76% | 1.11% | 0.97% | 1.22% | 1.14% |
| Portfolio Turnover Rate | 61% | 60% | 87% | 88% | 79% | 90% |
The expense ratio, net income ratio, and turnover rate for the current period have been annualized.
1 Includes performance-based investment advisory fee increases (decreases) of (0.01%), 0.01%, 0.02%, 0.00%, 0.00%, and 0.02%.
See accompanying Notes, which are an integral part of the Financial Statements.
22
Morgan Growth Fund
Notes to Financial Statements
Vanguard Morgan Growth Fund is registered under the Investment Company Act of 1940 as an open-end investment company, or mutual fund. The fund offers two classes of shares: Investor Shares and Admiral Shares. Investor Shares are available to any investor who meets the fund’s minimum purchase requirements. Admiral Shares are designed for investors who meet certain administrative, service, and account-size criteria.
A. The following significant accounting policies conform to generally accepted accounting principles for U.S. mutual funds. The fund consistently follows such policies in preparing its financial statements.
1. Security Valuation: Securities are valued as of the close of trading on the New York Stock Exchange (generally 4 p.m., Eastern time) on the valuation date. Equity securities are valued at the latest quoted sales prices or official closing prices taken from the primary market in which each security trades; such securities not traded on the valuation date are valued at the mean of the latest quoted bid and asked prices. Securities for which market quotations are not readily available, or whose values have been affected by events occurring before the fund’s pricing time but after the close of the securities’ primary markets, are valued at their fair values calculated according to procedures adopted by the board of trustees. These procedures include obtaining quotations from an independent pricing service, monitoring news to identify significant market- or security-specific events, and evaluating changes in the values of foreign market proxies (for example, ADRs, futures contracts, or exchange-traded funds), between the time the foreign markets close and the fund’s pricing time. When fair-value pricing is employed, the prices of securities used by a fund to calculate its net asset value may differ from quoted or published prices for the same securities. Investments in Vanguard Market Liquidity Fund are valued at that fund’s net asset value. Temporary cash investments acquired over 60 days to maturity are valued using the latest bid prices or using valuations based on a matrix system (which considers such factors as security prices, yields, maturities, and ratings), both as furnished by independent pricing services. Other temporary cash investments are valued at amortized cost, which approximates market value.
2. Futures Contracts: The fund uses index futures contracts to a limited extent, with the objective of maintaining full exposure to the stock market while maintaining liquidity. The fund may purchase or sell futures contracts to achieve a desired level of investment, whether to accommodate portfolio turnover or cash flows from capital share transactions. The primary risks associated with the use of futures contracts are imperfect correlation between changes in market values of stocks held by the fund and the prices of futures contracts, and the possibility of an illiquid market.
Futures contracts are valued at their quoted daily settlement prices. The aggregate principal amounts of the contracts are not recorded in the Statement of Net Assets. Fluctuations in the value of the contracts are recorded in the Statement of Net Assets as an asset (liability) and in the Statement of Operations as unrealized appreciation (depreciation) until the contracts are closed, when they are recorded as realized futures gains (losses).
3. Repurchase Agreements: The fund invests in repurchase agreements. Securities pledged as collateral for repurchase agreements are held by a custodian bank until the agreements mature. Each agreement requires that the market value of the collateral be sufficient to cover payments of interest and principal; however, in the event of default or bankruptcy by the other party to the agreement, retention of the collateral may be subject to legal proceedings.
4. Federal Income Taxes: The fund intends to continue to qualify as a regulated investment company and distribute all of its taxable income. Management has analyzed the fund’s tax positions taken for all open federal income tax years (September 30, 2007–2010), and for the period ended March 31, 2011, and has concluded that no provision for federal income tax is required in the fund’s financial statements.
23
Morgan Growth Fund
5. Distributions: Distributions to shareholders are recorded on the ex-dividend date.
6. Security Lending: The fund may lend its securities to qualified institutional borrowers to earn additional income. Security loans are required to be secured at all times by collateral at least equal to the market value of securities loaned. The fund invests cash collateral received in Vanguard Market Liquidity Fund, and records a liability for the return of the collateral, during the period the securities are on loan. Security lending income represents fees charged to borrowers plus income earned on investing cash collateral, less expenses associated with the loan.
7. Other: Dividend income is recorded on the ex-dividend date. Interest income includes income distributions received from Vanguard Market Liquidity Fund and is accrued daily. Security transactions are accounted for on the date securities are bought or sold. Costs used to determine realized gains (losses) on the sale of investment securities are those of the specific securities sold.
Each class of shares has equal rights as to assets and earnings, except that each class separately bears certain class-specific expenses related to maintenance of shareholder accounts (included in Management and Administrative expenses) and shareholder reporting. Marketing and distribution expenses are allocated to each class of shares based on a method approved by the board of trustees. Income, other non-class-specific expenses, and gains and losses on investments are allocated to each class of shares based on its relative net assets.
B. Wellington Management Company, LLP, Jennison Associates LLC, Frontier Capital Management Co., LLC, and Kalmar Investment Advisers each provide investment advisory services to a portion of the fund for a fee calculated at an annual percentage rate of average net assets managed by the advisor. The basic fee of Wellington Management Company, LLP, is subject to quarterly adjustments based on performance for the preceding three years relative to the Russell 3000 Growth Index. The basic fee of Jennison Associates LLC is subject to quarterly adjustments based on performance for the preceding three years relative to the Russell 1000 Growth Index. The basic fees of Frontier Capital Management Co., LLC, and Kalmar Investment Advisers are subject to quarterly adjustments based on performance since December 31, 2008, relative to the Russell Midcap Growth Index.
The Vanguard Group provides investment advisory services to a portion of the fund on an at-cost basis; the fund paid Vanguard advisory fees of $419,000 for the six months ended March 31, 2011.
For the six months ended March 31, 2011, the aggregate investment advisory fee represented an effective annual basic rate of 0.17% of the fund’s average net assets, before a decrease of $483,000 (0.01%) based on performance.
C. The Vanguard Group furnishes at cost corporate management, administrative, marketing, and distribution services. The costs of such services are allocated to the fund under methods approved by the board of trustees. The fund has committed to provide up to 0.40% of its net assets in capital contributions to Vanguard. At March 31, 2011, the fund had contributed capital of $1,526,000 to Vanguard (included in Other Assets), representing 0.02% of the fund’s net assets and 0.61% of Vanguard’s capitalization. The fund’s trustees and officers are also directors and officers of Vanguard.
D. The fund has asked its investment advisors to direct certain security trades, subject to obtaining the best price and execution, to brokers who have agreed to rebate to the fund part of the commissions generated. Such rebates are used solely to reduce the fund’s management and administrative expenses. For the six months ended March 31, 2011, these arrangements reduced the fund’s expenses by $250,000 (an annual rate of 0.01% of average net assets).
24
Morgan Growth Fund
E. Various inputs may be used to determine the value of the fund’s investments. These inputs are summarized in three broad levels for financial statement purposes. The inputs or methodologies used to value securities are not necessarily an indication of the risk associated with investing in those securities.
Level 1—Quoted prices in active markets for identical securities.
Level 2—Other significant observable inputs (including quoted prices for similar securities, interest
rates, prepayment speeds, credit risk, etc.).
Level 3—Significant unobservable inputs (including the fund’s own assumptions used to determine the
fair value of investments).
The following table summarizes the fund’s investments as of March 31, 2011, based on the inputs used to value them:
| | | |
| | Level 1 | Level 2 | Level 3 |
| Investments | ($000) | ($000) | ($000) |
| Common Stocks | 8,974,142 | 5,353 | — |
| Temporary Cash Investments | 260,004 | 228,017 | — |
| Futures Contracts—Assets1 | 9 | — | — |
| Futures Contracts—Liabilities1 | (425) | — | — |
| Total | 9,233,730 | 233,370 | — |
| 1 Represents variation margin on the last day of the reporting period. |
F. At March 31, 2011, the aggregate settlement value of open futures contracts and the related unrealized appreciation (depreciation) were:
| | | | |
| | | | ($000) |
| | | | Aggregate | |
| | | Number of | Settlement | Unrealized |
| | | Long (Short) | Value | Appreciation |
| Futures Contracts | Expiration | Contracts | Long (Short) | (Depreciation) |
| S&P 500 Index | June 2011 | 531 | 175,363 | 2,935 |
| E-mini S&P 500 Index | June 2011 | 190 | 12,549 | 214 |
Unrealized appreciation (depreciation) on open futures contracts is required to be treated as realized gain (loss) for tax purposes.
G. Distributions are determined on a tax basis and may differ from net investment income and realized capital gains for financial reporting purposes. Differences may be permanent or temporary. Permanent differences are reclassified among capital accounts in the financial statements to reflect their tax character. Temporary differences arise when certain items of income, expense, gain, or loss are recognized in different periods for financial statement and tax purposes; these differences will reverse at some time in the future. Differences in classification may also result from the treatment of short-term gains as ordinary income for tax purposes.
The fund’s tax-basis capital gains and losses are determined only at the end of each fiscal year. For tax purposes, at September 30, 2010, the fund had available capital loss carryforwards totaling $1,978,510,000 to offset future net capital gains of $879,082,000 through September 30, 2017, and $1,099,428,000 through September 30, 2018. The fund will use these capital losses to offset net taxable capital gains, if any, realized during the year ending September 30, 2011; should the fund realize net capital losses for the year, the losses will be added to the loss carryforward balance above.
25
Morgan Growth Fund
At March 31, 2011, the cost of investment securities for tax purposes was $7,009,754,000. Net unrealized appreciation of investment securities for tax purposes was $2,457,762,000, consisting of unrealized gains of $2,609,513,000 on securities that had risen in value since their purchase and $151,751,000 in unrealized losses on securities that had fallen in value since their purchase.
H. During the six months ended March 31, 2011, the fund purchased $2,564,006,000 of investment securities and sold $2,732,427,000 of investment securities, other than temporary cash investments.
I. Capital share transactions for each class of shares were:
| | | | |
| | Six Months Ended | Year Ended |
| | March 31, 2011 | September 30, 2010 |
| | Amount | Shares | Amount | Shares |
| | ($000) | (000) | ($000) | (000) |
| Investor Shares | | | | |
| Issued | 453,988 | 25,019 | 656,780 | 43,144 |
| Issued in Lieu of Cash Distributions | 29,637 | 1,644 | 38,554 | 2,500 |
| Redeemed | (815,697) | (46,060) | (1,112,532) | (72,852) |
| Net Increase (Decrease)—Investor Shares | (332,072) | (19,397) | (417,198) | (27,208) |
| Admiral Shares | | | | |
| Issued | 593,937 | 10,787 | 381,035 | 8,051 |
| Issued in Lieu of Cash Distributions | 17,322 | 310 | 17,395 | 364 |
| Redeemed | (227,605) | (4,079) | (467,632) | (9,955) |
| Net Increase (Decrease)—Admiral Shares | 383,654 | 7,018 | (69,202) | (1,540) |
J. In preparing the financial statements as of March 31, 2011, management considered the impact of subsequent events for potential recognition or disclosure in these financial statements.
26
About Your Fund’s Expenses
As a shareholder of the fund, you incur ongoing costs, which include costs for portfolio management, administrative services, and shareholder reports (like this one), among others. Operating expenses, which are deducted from a fund’s gross income, directly reduce the investment return of the fund.
A fund’s expenses are expressed as a percentage of its average net assets. This figure is known as the expense ratio. The following examples are intended to help you understand the ongoing costs (in dollars) of investing in your fund and to compare these costs with those of other mutual funds. The examples are based on an investment of $1,000 made at the beginning of the period shown and held for the entire period.
The accompanying table illustrates your fund’s costs in two ways:
• Based on actual fund return. This section helps you to estimate the actual expenses that you paid over the period. The ”Ending Account Value“ shown is derived from the fund‘s actual return, and the third column shows the dollar amount that would have been paid by an investor who started with $1,000 in the fund. You may use the information here, together with the amount you invested, to estimate the expenses that you paid over the period.
To do so, simply divide your account value by $1,000 (for example, an $8,600 account value divided by $1,000 = 8.6), then multiply the result by the number given for your fund under the heading ”Expenses Paid During Period.“
• Based on hypothetical 5% yearly return. This section is intended to help you compare your fund‘s costs with those of other mutual funds. It assumes that the fund had a yearly return of 5% before expenses, but that the expense ratio is unchanged. In this case—because the return used is not the fund’s actual return—the results do not apply to your investment. The example is useful in making comparisons because the Securities and Exchange Commission requires all mutual funds to calculate expenses based on a 5% return. You can assess your fund’s costs by comparing this hypothetical example with the hypothetical examples that appear in shareholder reports of other funds.
Note that the expenses shown in the table are meant to highlight and help you compare ongoing costs only and do not reflect transaction costs incurred by the fund for buying and selling securities. Further, the expenses do not include the account service fee described in the prospectus. If such a fee were applied to your account, your costs would be higher. Your fund does not charge transaction fees, such as purchase or redemption fees, nor does it carry a “sales load.”
The calculations assume no shares were bought or sold during the period. Your actual costs may have been higher or lower, depending on the amount of your investment and the timing of any purchases or redemptions.
You can find more information about the fund’s expenses, including annual expense ratios, in the Financial Statements section of this report. For additional information on operating expenses and other shareholder costs, please refer to your fund’s current prospectus.
27
| | | |
| Six Months Ended March 31, 2011 | | | |
| | Beginning | Ending | Expenses |
| | Account Value | Account Value | Paid During |
| Morgan Growth Fund | 9/30/2010 | 3/31/2011 | Period |
| Based on Actual Fund Return | | | |
| Investor Shares | $1,000.00 | $1,197.74 | $2.30 |
| Admiral Shares | 1,000.00 | 1,198.67 | 1.53 |
| Based on Hypothetical 5% Yearly Return | | | |
| Investor Shares | $1,000.00 | $1,022.84 | $2.12 |
| Admiral Shares | 1,000.00 | 1,023.54 | 1.41 |
The calculations are based on expenses incurred in the most recent six-month period. The fund’s annualized six-month expense ratios for that
period are 0.42% for Investor Shares and 0.28% for Admiral Shares. The dollar amounts shown as “Expenses Paid” are equal to the
annualized expense ratio multiplied by the average account value over the period, multiplied by the number of days in the most recent
six-month period, then divided by the number of days in the most recent 12-month period.
28
Trustees Approve Advisory Arrangements
The board of trustees of Vanguard Morgan Growth Fund has renewed the fund’s investment advisory arrangements with Frontier Capital Management Co., LLC, Jennison Associates LLC, Kalmar Investment Advisers, Wellington Management Company, LLP, and The Vanguard Group, Inc. (through its Quantitative Equity Group). The board determined that the retention of the advisors was in the best interests of the fund and its shareholders.
The board based its decisions upon an evaluation of each advisor’s investment staff, portfolio management process, and performance. The trustees considered the factors discussed below, among others. However, no single factor determined whether the board approved the arrangements. Rather, it was the totality of the circumstances that drove the board’s decisions.
Nature, extent, and quality of services
The board considered the quality of the fund’s investment management over both the short and long term, and took into account the organizational depth and stability of each advisor. The board noted the following:
Frontier Capital Management Company, LLC. Frontier, founded in 1980, is an investment management boutique that focuses on investing in small- and mid-capitalization stocks. Frontier is an affiliate of Affiliated Managers Group, but retains a 30% ownership interest. The firm employs a fundamental, bottom-up investment approach that seeks companies with a combination of superior growth potential and attractive valuation. The investment process emphasizes companies with understandable business models, good franchises, accelerating sales and margins, and healthy balance sheets. Analysts regularly interact with management and other companies in the supply chain to effectively construct a portfolio of stocks for the fund. Frontier has managed a portion of the fund since 2008.
Jennison Associates LLC. Jennison, founded in 1969, is an indirect, wholly owned subsidiary of Prudential Financial, Inc. The firm currently oversees a wide range of equity and fixed income strategies. The investment team at Jennison Associates uses internal fundamental research and a highly interactive bottom-up stock selection process to identify companies that exhibit above-average growth in units, revenues, earnings, and cash flows. When evaluating a company for purchase or sale, the analysis focuses on the duration of the growth opportunity and seeks to capture inflection points in the company’s growth. Jennison has managed a portion of the fund since 2007.
Kalmar Investment Advisers. Kalmar, together with its parent company, Kalmar Investments Inc., founded in 1982, specializes in small- and mid-capitalization growth stock. Kalmar is a research-driven investment firm that is entirely focused on the management of “growth with value” small- and mid-cap equity portfolios. Kalmar believes that there is a high-reward/low-risk anomaly offered by the equity market in the stocks of solid, well-managed, rapidly growing smaller companies that are less well understood institutionally. Through independent fundamental research, Kalmar attempts to discover such companies, buy them at undervalued levels, and own them for the longer term. Kalmar has managed a portion of the fund since 2008.
Wellington Management Company, LLP. Wellington Management, founded in 1928, is among the nation’s oldest and most respected institutional investment managers. The investment team at Wellington Management uses traditional methods of stock selection to identify companies that it believes have above-average growth prospects, particularly those in industries undergoing change. Research focuses on large- and mid-cap companies with a proven record of sales and earnings growth, profitability, and cash-flow generation. Wellington Management has advised the fund since 1968.
29
The Vanguard Group, Inc. Vanguard has been managing investments for more than three decades. The Quantitative Equity Group adheres to a sound, disciplined investment management process; the team has considerable experience, stability, and depth. Vanguard has managed a portion of the fund since 1993.
The board concluded that each advisor’s experience, stability, depth, and performance, among other factors, warranted continuation of the advisory arrangements.
Investment performance
The board considered the short- and long-term performance of the fund, including any periods of outperformance or underperformance of a relevant benchmark and peer group. The board concluded that each advisor has carried out the fund’s investment strategy in disciplined fashion, and that performance results have allowed the fund to remain competitive versus its benchmark and peer group. Information about the fund’s most recent performance can be found in the Performance Summary section of this report.
Cost
The board concluded that the fund’s expense ratio was well below the average expense ratio charged by funds in its peer group and that the fund’s advisory fee rate was also well below its peer-group average. Information about the fund’s expenses appears in the About Your Fund’s Expenses section of this report as well as in the Financial Statements section, which also includes information about the fund’s advisory fee rate.
The board did not consider profitability of Frontier, Jennison, Kalmar, and Wellington Management in determining whether to approve the advisory fees, because the firms are independent of Vanguard, and the advisory fees are the result of arm’s-length negotiations. The board does not conduct a profitability analysis of Vanguard, because of Vanguard’s unique “at-cost” structure. Unlike most other mutual fund management companies, Vanguard is owned by the funds it oversees, and produces “profits” only in the form of reduced expenses for fund shareholders.
The benefit of economies of scale
The board concluded that the fund’s shareholders benefit from economies of scale because of breakpoints in the advisory fee schedules for Frontier, Jennison, Kalmar, and Wellington Management. The breakpoints reduce the effective rate of the fees as the fund’s assets managed by each advisor increase. The board also concluded that the fund’s low-cost arrangement with Vanguard ensures that the fund will realize economies of scale as it grows, with the cost to shareholders declining as fund assets managed by Vanguard increase.
The board will consider whether to renew the advisory arrangements again after a one-year period.
30
Glossary
30-Day SEC Yield. A fund’s 30-day SEC yield is derived using a formula specified by the U.S. Securities and Exchange Commission. Under the formula, data related to the fund’s security holdings in the previous 30 days are used to calculate the fund’s hypothetical net income for that period, which is then annualized and divided by the fund’s estimated average net assets over the calculation period. For the purposes of this calculation, a security’s income is based on its current market yield to maturity (in the case of bonds) or its projected dividend yield (for stocks). Because the SEC yield represents hypothetical annualized income, it will differ—at times significantly—from the fund’s actual experience. As a result, the fund’s income distributions may be higher or lower than implied by the SEC yield.
Beta. A measure of the magnitude of a fund’s past share-price fluctuations in relation to the ups and downs of a given market index. The index is assigned a beta of 1.00. Compared with a given index, a fund with a beta of 1.20 typically would have seen its share price rise or fall by 12% when the index rose or fell by 10%. For this report, beta is based on returns over the past 36 months for both the fund and the index. Note that a fund’s beta should be reviewed in conjunction with its R-squared (see definition). The lower the R-squared, the less correlation there is between the fund and the index, and the less reliable beta is as an indicator of volatility.
Dividend Yield. Dividend income earned by stocks, expressed as a percentage of the aggregate market value (or of net asset value, for a fund). The yield is determined by dividing the amount of the annual dividends by the aggregate value (or net asset value) at the end of the period. For a fund, the dividend yield is based solely on stock holdings and does not include any income produced by other investments.
Earnings Growth Rate. The average annual rate of growth in earnings over the past five years for the stocks now in a fund.
Equity Exposure. A measure that reflects a fund’s investments in stocks and stock futures. Any holdings in short-term reserves are excluded.
Expense Ratio. The percentage of a fund’s average net assets used to pay its annual administrative and advisory expenses. These expenses directly reduce returns to investors.
Foreign Holdings. The percentage of a fund represented by stocks or depositary receipts of companies based outside the United States.
Inception Date. The date on which the assets of a fund (or one of its share classes) are first invested in accordance with the fund’s investment objective. For funds with a subscription period, the inception date is the day after that period ends. Investment performance is measured from the inception date.
Median Market Cap. An indicator of the size of companies in which a fund invests; the midpoint of market capitalization (market price x shares outstanding) of a fund’s stocks, weighted by the proportion of the fund’s assets invested in each stock. Stocks representing half of the fund’s assets have market capitalizations above the median, and the rest are below it.
Price/Book Ratio. The share price of a stock divided by its net worth, or book value, per share. For a fund, the weighted average price/book ratio of the stocks it holds.
31
Price/Earnings Ratio. The ratio of a stock’s current price to its per-share earnings over the past year. For a fund, the weighted average P/E of the stocks it holds. P/E is an indicator of market expectations about corporate prospects; the higher the P/E, the greater the expectations for a company’s future growth.
R-Squared. A measure of how much of a fund’s past returns can be explained by the returns from the market in general, as measured by a given index. If a fund’s total returns were precisely synchronized with an index’s returns, its R-squared would be 1.00. If the fund’s returns bore no relationship to the index’s returns, its R-squared would be 0. For this report, R-squared is based on returns over the past 36 months for both the fund and the index.
Return on Equity. The annual average rate of return generated by a company during the past five years for each dollar of shareholder’s equity (net income divided by shareholder’s equity). For a fund, the weighted average return on equity for the companies whose stocks it holds.
Short-Term Reserves. The percentage of a fund invested in highly liquid, short-term securities that can be readily converted to cash.
Turnover Rate. An indication of the fund’s trading activity. Funds with high turnover rates incur higher transaction costs and may be more likely to distribute capital gains (which may be taxable to investors). The turnover rate excludes in-kind transactions, which have minimal impact on costs.
32
This page intentionally left blank.
This page intentionally left blank.
This page intentionally left blank.
The People Who Govern Your Fund
The trustees of your mutual fund are there to see that the fund is operated and managed in your best interests since, as a shareholder, you are a part owner of the fund. Your fund’s trustees also serve on the board of directors of The Vanguard Group, Inc., which is owned by the Vanguard funds and provides services to them on an at-cost basis.
A majority of Vanguard’s board members are independent, meaning that they have no affiliation with Vanguard or the funds they oversee, apart from the sizable personal investments they have made as private individuals. The independent board members have distinguished backgrounds in business, academia, and public service. Each of the trustees and executive officers oversees 179 Vanguard funds.
The following table provides information for each trustee and executive officer of the fund. More information about the trustees is in the Statement of Additional Information, which can be obtained, without charge, by contacting Vanguard at 800-662-7447, or online at vanguard.com.
| |
| Interested Trustee1 | and President (2006–2008) of Rohm and Haas Co. |
| | (chemicals); Director of Tyco International, Ltd. |
| F. William McNabb III | (diversified manufacturing and services) and Hewlett- |
| Born 1957. Trustee Since July 2009. Chairman of the | Packard Co. (electronic computer manufacturing); |
| Board. Principal Occupation(s) During the Past Five | Senior Advisor at New Mountain Capital; Trustee |
| Years: Chairman of the Board of The Vanguard Group, | of The Conference Board; Member of the Board of |
| Inc., and of each of the investment companies served | Managers of Delphi Automotive LLP (automotive |
| by The Vanguard Group, since January 2010; Director | components). |
| of The Vanguard Group since 2008; Chief Executive | |
| Officer and President of The Vanguard Group and of | Amy Gutmann |
| each of the investment companies served by The | Born 1949. Trustee Since June 2006. Principal |
| Vanguard Group since 2008; Director of Vanguard | Occupation(s) During the Past Five Years: President |
| Marketing Corporation; Managing Director of The | of the University of Pennsylvania; Christopher H. |
| Vanguard Group (1995–2008). | Browne Distinguished Professor of Political Science |
| | in the School of Arts and Sciences with secondary |
| | appointments at the Annenberg School for Commu- |
| Independent Trustees | nication and the Graduate School of Education |
| | of the University of Pennsylvania; Director of |
| Emerson U. Fullwood | Carnegie Corporation of New York, Schuylkill River |
| Born 1948. Trustee Since January 2008. Principal | Development Corporation, and Greater Philadelphia |
| Occupation(s) During the Past Five Years: Executive | Chamber of Commerce; Trustee of the National |
| Chief Staff and Marketing Officer for North America | Constitution Center; Chair of the Presidential |
| and Corporate Vice President (retired 2008) of Xerox | Commission for the Study of Bioethical Issues. |
| Corporation (document management products and | |
| services); Executive in Residence and 2010 | JoAnn Heffernan Heisen |
| Distinguished Minett Professor at the Rochester | Born 1950. Trustee Since July 1998. Principal |
| Institute of Technology; Director of SPX Corporation | Occupation(s) During the Past Five Years: Corporate |
| (multi-industry manufacturing), the United Way of | Vice President and Chief Global Diversity Officer |
| Rochester, Amerigroup Corporation (managed health | (retired 2008) and Member of the Executive |
| care), the University of Rochester Medical Center, | Committee (1997–2008) of Johnson & Johnson |
| Monroe Community College Foundation, and North | (pharmaceuticals/consumer products); Director of |
| Carolina A&T University. | Skytop Lodge Corporation (hotels), the University |
| | Medical Center at Princeton, the Robert Wood |
| Rajiv L. Gupta | Johnson Foundation, and the Center for Work Life |
| Born 1945. Trustee Since December 2001.2 | Policy; Member of the Advisory Board of the |
| Principal Occupation(s) During the Past Five Years: | Maxwell School of Citizenship and Public Affairs |
| Chairman and Chief Executive Officer (retired 2009) | at Syracuse University. |
| | |
| F. Joseph Loughrey | Thomas J. Higgins | |
| Born 1949. Trustee Since October 2009. Principal | Born 1957. Chief Financial Officer Since September |
| Occupation(s) During the Past Five Years: President | 2008. Principal Occupation(s) During the Past Five |
| and Chief Operating Officer (retired 2009) and Vice | Years: Principal of The Vanguard Group, Inc.; Chief |
| Chairman of the Board (2008–2009) of Cummins Inc. | Financial Officer of each of the investment companies |
| (industrial machinery); Director of SKF AB (industrial | served by The Vanguard Group since 2008; Treasurer |
| machinery), Hillenbrand, Inc. (specialized consumer | of each of the investment companies served by The |
| services), the Lumina Foundation for Education, and | Vanguard Group (1998–2008). |
| Oxfam America; Chairman of the Advisory Council | | |
| for the College of Arts and Letters and Member | Kathryn J. Hyatt | |
| of the Advisory Board to the Kellogg Institute for | Born 1955. Treasurer Since November 2008. Principal |
| International Studies at the University of Notre Dame. | Occupation(s) During the Past Five Years: Principal |
| | of The Vanguard Group, Inc.; Treasurer of each of |
| André F. Perold | the investment companies served by The Vanguard |
| Born 1952. Trustee Since December 2004. Principal | Group since 2008; Assistant Treasurer of each of the |
| Occupation(s) During the Past Five Years: George | investment companies served by The Vanguard Group |
| Gund Professor of Finance and Banking at the Harvard | (1988–2008). | |
| Business School; Chair of the Investment Committee | | |
| of HighVista Strategies LLC (private investment firm). | Heidi Stam | |
| | Born 1956. Secretary Since July 2005. Principal |
| Alfred M. Rankin, Jr. | Occupation(s) During the Past Five Years: Managing |
| Born 1941. Trustee Since January 1993. Principal | Director of The Vanguard Group, Inc., since 2006; |
| Occupation(s) During the Past Five Years: Chairman, | General Counsel of The Vanguard Group since 2005; |
| President, and Chief Executive Officer of NACCO | Secretary of The Vanguard Group and of each of the |
| Industries, Inc. (forklift trucks/housewares/lignite); | investment companies served by The Vanguard Group |
| Director of Goodrich Corporation (industrial products/ | since 2005; Director and Senior Vice President of |
| aircraft systems and services) and the National | Vanguard Marketing Corporation since 2005; |
| Association of Manufacturers; Chairman of the | Principal of The Vanguard Group (1997–2006). |
| Federal Reserve Bank of Cleveland; Vice Chairman | | |
| of University Hospitals of Cleveland; President of | | |
| the Board of The Cleveland Museum of Art. | Vanguard Senior Management Team |
| |
| Peter F. Volanakis | R. Gregory Barton | Michael S. Miller |
| Born 1955. Trustee Since July 2009. Principal | Mortimer J. Buckley | James M. Norris |
| Occupation(s) During the Past Five Years: President | Kathleen C. Gubanich | Glenn W. Reed |
| and Chief Operating Officer (retired 2010) of Corning | Paul A. Heller | George U. Sauter |
| Incorporated (communications equipment); Director of | | |
| Corning Incorporated (2000–2010) and Dow Corning | | |
| (2001–2010); Overseer of the Amos Tuck School of | Chairman Emeritus and Senior Advisor |
| Business Administration at Dartmouth College. | | |
| | John J. Brennan | |
| | Chairman, 1996–2009 | |
| Executive Officers | Chief Executive Officer and President, 1996–2008 |
| |
| Glenn Booraem | | |
| Born 1967. Controller Since July 2010. Principal | Founder | |
| Occupation(s) During the Past Five Years: Principal | | |
| of The Vanguard Group, Inc.; Controller of each of | John C. Bogle | |
| the investment companies served by The Vanguard | Chairman and Chief Executive Officer, 1974–1996 |
| Group since 2010; Assistant Controller of each of | | |
| the investment companies served by The Vanguard | | |
| Group (2001–2010). | | |
1 Mr. McNabb is considered an “interested person,” as defined in the Investment Company Act of 1940, because he is an officer of the
Vanguard funds.
2 December 2002 for Vanguard Equity Income Fund, Vanguard Growth Equity Fund, the Vanguard Municipal Bond Funds, and the Vanguard
State Tax-Exempt Funds.

| | | P.O. Box 2600 |
| | | Valley Forge, PA 19482-2600 |
| |
| |
| |
| Connect with Vanguard® > vanguard.com | |
| |
| |
| |
| Fund Information > 800-662-7447 | | CFA® is a trademark owned by CFA Institute. |
| Direct Investor Account Services > 800-662-2739 | |
| Institutional Investor Services > 800-523-1036 | |
| Text Telephone for People | | |
| With Hearing Impairment > 800-749-7273 | |
| |
| This material may be used in conjunction | |
| with the offering of shares of any Vanguard | |
| fund only if preceded or accompanied by | |
| the fund’s current prospectus. | |
| |
| All comparative mutual fund data are from Lipper Inc. or | |
| Morningstar, Inc., unless otherwise noted. | |
| |
| You can obtain a free copy of Vanguard’s proxy voting | |
| guidelines by visiting vanguard.com/proxyreporting or by | |
| calling Vanguard at 800-662-2739. The guidelines are | |
| also available from the SEC’s website, sec.gov. In | |
| addition, you may obtain a free report on how your fund | |
| voted the proxies for securities it owned during the 12 | |
| months ended June 30. To get the report, visit either | |
| vanguard.com/proxyreporting or sec.gov. | |
| |
| You can review and copy information about your fund at | |
| the SEC’s Public Reference Room in Washington, D.C. To | |
| find out more about this public service, call the SEC at | |
| 202-551-8090. Information about your fund is also | |
| available on the SEC’s website, and you can receive | |
| copies of this information, for a fee, by sending a | |
| request in either of two ways: via e-mail addressed to | |
| publicinfo@sec.gov or via regular mail addressed to the | |
| Public Reference Section, Securities and Exchange | |
| Commission, Washington, DC 20549-1520. | |
| |
| |
| | | © 2011 The Vanguard Group, Inc. |
| | | All rights reserved. |
| | | Vanguard Marketing Corporation, Distributor. |
| |
| | | Q262 052011 |
Item 2: Code of Ethics.
Not Applicable.
Item 3: Audit Committee Financial Expert.
Not Applicable.
Item 4: Principal Accountant Fees and Services.
Not Applicable.
Item 5: Audit Committee of Listed Registrants.
Not Applicable.
Item 6: Investments.
Not Applicable.
Item 7: Disclosure of Proxy Voting Policies and Procedures for Closed-End Management Investment Companies.
Not Applicable.
Item 8: Portfolio Managers of Closed-End Management Investment Companies.
Not Applicable.
Item 9: Purchase of Equity Securities by Closed-End Management Investment Company and Affiliated Purchasers.
Not Applicable.
Item 10: Submission of Matters to a Vote of Security Holders.
Not Applicable.
Item 11: Controls and Procedures.
(a) Disclosure Controls and Procedures. The Principal Executive and Financial Officers concluded that the Registrant's Disclosure Controls and Procedures are effective based on their evaluation of the Disclosure Controls and Procedures as of a date within 90 days of the filing date of this report.
(b) Internal Control Over Financial Reporting. There were no significant changes in Registrant’s Internal Control Over Financial Reporting or in other factors that could significantly affect this control subsequent to the date of the evaluation, including any corrective actions with regard to significant deficiencies and material weaknesses.
Item 12: Exhibits.
(a) Code of Ethics.
(b) Certifications.
Pursuant to the requirements of the Securities Exchange Act of 1934 and the Investment Company Act of 1940, the registrant has duly caused this report to be signed on its behalf by the undersigned, thereunto duly authorized.
| |
| | VANGUARD MORGAN GROWTH FUND |
| |
| |
| BY: | /s/ F. WILLIAM MCNABB III* |
| F. WILLIAM MCNABB III |
| CHIEF EXECUTIVE OFFICER |
| |
| Date: May 19, 2011 |
Pursuant to the requirements of the Securities Exchange Act of 1934 and the Investment Company Act of 1940, this report has been signed below by the following persons on behalf of the registrant and in the capacities and on the dates indicated.
| |
| | VANGUARD MORGAN GROWTH FUND |
| |
| BY: | /s/ F. WILLIAM MCNABB III* |
| F. WILLIAM MCNABB III |
| CHIEF EXECUTIVE OFFICER |
| |
| Date: May 19, 2011 |
|
| | VANGUARD MORGAN GROWTH FUND |
| |
| BY: | /s/ THOMAS J. HIGGINS* |
| | THOMAS J. HIGGINS |
| CHIEF FINANCIAL OFFICER |
| |
| Date: May 19, 2011 |
* By: /s/ Heidi Stam
Heidi Stam, pursuant to a Power of Attorney filed on April 26, 2010, see file Number
33-53683, Incorporated by Reference.