UNITED STATES
SECURITIES AND EXCHANGE COMMISSION
Washington, D.C. 20549
FORM N-CSR
CERTIFIED SHAREHOLDER REPORT
OF
REGISTERED MANAGEMENT INVESTMENT COMPANIES
Investment Company Act file number: 811-01685
Name of Registrant: Vanguard Morgan Growth Fund
Address of Registrant:
P.O. Box 2600
Valley Forge, PA 19482
Name and address of agent for service:
Heidi Stam, Esquire
P.O. Box 876
Valley Forge, PA 19482
Registrant’s telephone number, including area code: (610) 669-1000
Date of fiscal year end: September 30
Date of reporting period: October 1, 2012 – March 31, 2013
Item 1: Reports to Shareholders

|
| Semiannual Report | March 31, 2013 |
| Vanguard MorganTM Growth Fund |
| |
 |
> For the six months ended March 31, 2013, Vanguard Morgan Growth Fund returned about 8%.
> The fund trailed its benchmark index and peer funds.
> The portfolio’s performance mirrored trends in the broad market, where value stocks trumped their growth counterparts.
| |
| Contents | |
| Your Fund’s Total Returns. | 1 |
| Chairman’s Letter. | 2 |
| Advisors’ Report. | 8 |
| Fund Profile. | 12 |
| Performance Summary. | 13 |
| Financial Statements. | 14 |
| About Your Fund’s Expenses. | 28 |
| Trustees Approve Advisory Arrangements. | 30 |
| Glossary. | 32 |
Please note: The opinions expressed in this report are just that—informed opinions. They should not be considered promises or advice. Also, please keep in mind that the information and opinions cover the period through the date on the front of this report. Of course, the risks of investing in your fund are spelled out in the prospectus.
See the Glossary for definitions of investment terms used in this report.
About the cover: Our cover photograph shows rigging on the HMSSurprise, a replica of an 18th-century Royal Navy frigate. It was featured in the 2003 movie Master and Commander: The Far Side of the World, which was based on Patrick O’Brian’s sea novels, set amid the Napoleonic Wars. Vanguard was named for another ship of that era, the HMSVanguard, which was the flagship of British Admiral Horatio Nelson at the Battle of the Nile.
Your Fund’s Total Returns
| |
| Six Months Ended March 31, 2013 | |
| | Total |
| | Returns |
| Vanguard Morgan Growth Fund | |
| Investor Shares | 7.90% |
| Admiral™ Shares | 7.99 |
| Russell 3000 Growth Index | 8.52 |
| Multi-Cap Growth Funds Average | 8.88 |
| Multi-Cap Growth Funds Average: Derived from data provided by Lipper Inc. | |
| Admiral Shares carry lower expenses and are available to investors who meet certain account-balance requirements. | |
| | | | |
| Your Fund’s Performance at a Glance | | | | |
| September 30, 2012, Through March 31, 2013 | | | | |
| | | | Distributions Per Share |
| | Starting | Ending | Income | Capital |
| | Share Price | Share Price | Dividends | Gains |
| Vanguard Morgan Growth Fund | | | | |
| Investor Shares | $20.31 | $21.69 | $0.205 | $0.000 |
| Admiral Shares | 63.02 | 67.25 | 0.735 | 0.000 |
1

Chairman’s Letter
Dear Shareholder,
The U.S. stock market turned in a strong performance for the six months ended March 31, 2013. While stocks in general were boosted by continued signs of economic improvement, stocks of value companies benefited most. Growth stocks—like those held in Vanguard Morgan Growth Fund—underperformed their value counterparts, as well as the broad market.
In this investment environment, the Morgan Growth Fund returned about 8%. The fund’s return was about 1 percentage point lower than the return of its benchmark index, the Russell 3000 Growth Index, and the average return of its peers, mainly because of some missed opportunities in a handful of sectors.
Global equity markets delivered a powerful rally
Global stocks advanced for the fifth straight month to finish the halfyear ended March 31 with impressive gains. The Standard & Poor’s 500 Index closed at a record high on the period’s final business day after financial markets in recent months shrugged off the U.S. “fiscal cliff” crisis, the unsettled Italian national elections, and a controversial bailout package for Cyprus.
Peter Westaway, Vanguard’s chief European economist, said that the latest developments in Europe had been “rather bad,” but that the market had for the most part already priced in these events. “As
2
always,” he said, “we think investors should assess their portfolios carefully and avoid making impulsive moves.”
U.S. equities returned more than 11% as the economic recovery slowly built momentum, the housing market rebounded further, and the labor market improved. International equities were up more than 9%. Returns were about 16% in the Pacific region, where Japan’s accommodative monetary policy has helped spark the nation’s stock market, and nearly 10% in Europe. Emerging markets stocks rose about 4%.
Bond returns barely budged as yields lingered near lows
The broad U.S. taxable bond market scraped out a minuscule gain of 0.09% for the halfyear as U.S. Treasury yields remained just slightly above their alltime lows. Although the yield of the benchmark 10year Treasury note increased during the six months and topped 2.00% at various times, it closed the period at about 1.85%. (Bond prices and yields move in opposite directions.) Municipal bonds returned almost 1% for the six months despite price declines in March. And returns of money market funds and savings accounts barely
| | | |
| Market Barometer | | | |
| |
| | | | Total Returns |
| | | Periods Ended March 31, 2013 |
| | Six | One | Five Years |
| | Months | Year | (Annualized) |
| Stocks | | | |
| Russell 1000 Index (Large-caps) | 11.10% | 14.43% | 6.15% |
| Russell 2000 Index (Small-caps) | 14.48 | 16.30 | 8.24 |
| Russell 3000 Index (Broad U.S. market) | 11.35 | 14.56 | 6.32 |
| MSCI All Country World Index ex USA (International) | 9.20 | 8.36 | -0.39 |
| |
| Bonds | | | |
| Barclays U.S. Aggregate Bond Index (Broad taxable market) | 0.09% | 3.77% | 5.47% |
| Barclays Municipal Bond Index (Broad tax-exempt market) | 0.96 | 5.25 | 6.10 |
| Citigroup Three-Month U.S. Treasury Bill Index | 0.05 | 0.08 | 0.30 |
| |
| CPI | | | |
| Consumer Price Index | 0.59% | 1.47% | 1.74% |
3
registered as shortterm interest rates remained between 0% and 0.25%, under the Federal Reserve’s fouryearold policy.
Robert Auwaerter, head of Vanguard’s Fixed Income Group, doesn’t anticipate abrupt policy changes from the central bank. “We don’t see the Fed changing course in the near term,” he said, “and when the Fed does, we expect it’ll go slowly so as not to undo the efforts made to keep interest rates low and to stimulate the economy.”
Growth stocks lagged their value counterparts
Vanguard Morgan Growth Fund provides exposure to stocks of large and midcapitalization U.S. companies that, according to the fund’s advisors, are poised for fasterthanaverage growth of revenues and earnings. As I mentioned previously, stocks of growth companies lagged the broad market for the most recent sixmonth period, as investors favored their value counterparts. This investment environment was obviously less than ideal for your fund, which nonetheless turned in a solid performance.
The industrial and health care sectors contributed most to the fund’s advance for the period, each adding more than 2 percentage points to the fund’s total return. Industrial stocks were bolstered by demand both at home and abroad during the six months. While the sector posted strong returns across the board, stocks of
| | | |
| Expense Ratios | | | |
| Your Fund Compared With Its Peer Group | | | |
| | Investor | Admiral | Peer Group |
| | Shares | Shares | Average |
| Morgan Growth Fund | 0.40% | 0.26% | 1.31% |
The fund expense ratios shown are from the prospectus dated January 28, 2013, and represent estimated costs for the current fiscal year. For the six months ended March 31, 2013, the fund’s annualized expense ratios were 0.39% for Investor Shares and 0.25% for Admiral Shares. The peer-group expense ratio is derived from data provided by Lipper Inc. and captures information through year-end 2012.
Peer group: Multi-Cap Growth Funds.
4
|
| Investment insight |
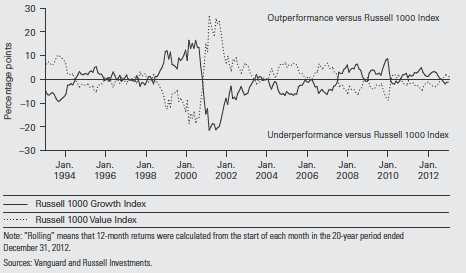
| Growth stocks versus value stocks: A case for both |
| Growth and value stocks typically take turns outperforming each other. The chart |
| here shows how they have switched off during the past 20 years in leading or lagging |
| a broad market average. |
| |
| These two styles of investing are typically considered complementary—when growth |
| is performing well, value typically isn’t, and vice versa. Generally speaking, growth |
| stocks represent companies that are expected to expand their businesses at a rapid |
| pace, while value stocks typically represent more established, slowergrowing |
| companies. |
| |
| Which does better in the long run? Neither. Vanguard research has shown that there |
| is no significant longterm difference in the risk/reward characteristics of growth and |
| value stocks. But, because their performance can vary considerably over shorter time |
| periods, a truly diversified portfolio should have exposure to both. |
| |
| Rolling 12-month return differences, 1993–2012 |
 |
5
aerospace and defense firms added most to performance. In health care, stocks of biotechnology firms and pharmaceutical companies stood out. Large companies in both fields have profited from improved pipelines of new medicines, as well as a more favorable regulatory climate at the Food and Drug Administration.
Consumer discretionary and financial stocks also added significantly to the fund’s overall returns. In the consumer discretionary category, stocks of media companies and specialty retailers stood out; in financials, the leaders were capital markets firms and diversified financial services companies.
The information technology sector was the only area where the fund posted a negative result. IT stocks—often a favorite among growth investors—accounted for about 30% of the fund’s holdings, on average, during the period. Disappointing earnings from computer hardware companies, particularly some leading tablet computer and smartphone producers, weighed heavily on the sector. The fund’s tech holdings detracted about 1 percentage point from its total return.
Your fund’s tempered results relative to its benchmark can be attributed to the advisors’ stock selection in a handful of sectors where performance was good but did not keep up with the index. The advisors missed some opportunities in the consumer staples sector, particularly among packaged food and soft drink companies; in consumer discretionary, where the fund missed out on returns from casinos and gaming companies, restaurants, and internet retailers; and in materials, where holdings in metals and mining companies and chemical companies weighed on results.
Low cost and talent drive successful active management
Investors sometimes ask whether it’s a contradiction that Vanguard, a champion of index investing, offers actively managed mutual funds. To understand how active funds fit into our philosophy, consider for a moment why indexing has proved its mettle: It’s a generally lowcost, taxefficient way to build a diversified portfolio that lets you keep more of your fund’s returns. Because index funds seek to track the overall market or a segment of it, they typically cost much less to run than funds that are actively managed in an effort to outperform the market. And the less you pay for a fund, the more of its returns come back to you.
The same principle—low cost—drives our approach to active funds. The other essential ingredient is talent. Some wonder how we can afford to hire top active managers when we place such importance on keeping investing costs low. The answer lies in five key characteristics of Vanguard’s structure and culture—our mutual ownership, our large scale, performance incentives aligned with investors’ interests, a longterm perspective, and a rigorous oversight process,
6
which I lead. (You can read more about our approach in The Case for Vanguard Active Management: Solving the Low-Cost/ Top-Talent Paradox? at vanguard.com/ research.)
These enduring advantages don’t guarantee outperformance, of course. Even in those cases where an active stock fund outperforms over long periods, it doesn’t necessarily mean that investors earned more than the index results every year—or even every decade. And investors have no way of knowing beforehand which funds will outperform.
But for those willing to accept the greater risks that come with active investing, we believe Vanguard’s combination of talented advisors and low costs can improve the odds.
As always, thank you for entrusting your assets to Vanguard.
Sincerely,

F. William McNabb III
Chairman and Chief Executive Officer
April 12, 2013
7
Advisors’ Report
For the fiscal halfyear ended March 31, 2013, Vanguard Morgan Growth Fund returned 7.90% for Investor Shares and 7.99% for the lowercost Admiral Shares. Your fund is managed by five independent advisors, a strategy that enhances the fund’s diversification by providing exposure to distinct, yet complementary, investment approaches. It’s not uncommon for
different advisors to have different views about individual securities or the broader investment environment. The advisors, the percentage of fund assets each manages, and brief descriptions of their investment strategies are presented in the table below. The advisors have also prepared a discussion of the investment environment that existed during the period and of how
| | | |
| Vanguard Morgan Growth Fund Investment Advisors | |
| |
| | Fund Assets Managed | |
| Investment Advisor | % | $ Million | Investment Strategy |
| Wellington Management | 46 | 4,278 | Uses traditional methods of stock selection—research |
| Company, LLP | | | and analysis—that identify companies believed to have |
| | | | above-average growth prospects, particularly those in |
| | | | industries undergoing change. Focuses on mid- and |
| | | | large-capitalization companies with proven records of |
| | | | sales and earnings growth, profitability, and cash-flow |
| | | | generation. |
| Jennison Associates LLC | 19 | 1,800 | Uses a research-driven, fundamental investment |
| | | | approach that relies on in-depth company knowledge |
| | | | gleaned through meetings with management, |
| | | | customers, and suppliers. |
| Vanguard Equity Investment | 13 | 1,187 | Employs a quantitative, fundamental management |
| Group | | | approach, using models that assess valuation, growth |
| | | | prospects, management decisions, market sentiment, |
| | | | and earnings quality of companies versus their peers. |
| Frontier Capital Management Co., | 10 | 912 | Uses a research-driven, fundamental investment |
| LLC | | | approach that seeks companies with above-average |
| | | | growth prospects, reasonable valuations, and |
| | | | competitive advantages. |
| Kalmar Investment Advisers | 10 | 903 | Employs a “growth-with-value” strategy using creative, |
| | | | bottom-up research to uncover vigorously growing, |
| | | | high-quality businesses whose stocks can also be |
| | | | bought inefficiently valued. The strategy has a dual |
| | | | objective of strong returns with lower risk. |
| Cash Investments | 2 | 185 | These short-term reserves are invested by Vanguard in |
| | | | equity index products to simulate investments in |
| | | | stocks. Each advisor also may maintain a modest cash |
| | | | position. |
8
portfolio positioning reflects this assessment. These comments were prepared on April 18, 2013.
Wellington Management Company, llp
Portfolio Manager:
Paul E. Marrkand, CFA, Senior Vice President
Our portion of the fund uses traditional methods of stock selection—research and analysis—to identify companies that we believe have aboveaverage growth prospects, particularly those in industries undergoing change. Our research focuses on mid and largecapitalization companies with a proven record of sales and earnings growth, profitability, and cashflow generation.
Equities in the United States and throughout much of the world rose during the period, as the S&P 500 Index posted a return of 10.19% and the MSCI EAFE Index returned 12.04%. Fixed income performance was more muted as the Barclays U.S. Aggregate Bond Index returned just 0.09%.
Stock selection in health care and financials boosted performance in our portfolio during the period. Celgene, a global biopharmaceutical company, was among the portfolio’s top contributors. Celgene is engaged in the development of therapies to treat cancer and immuneinflammatoryrelated diseases. The company issued revenue and earnings guidance materially above consensus expectations, which generated a favorable market reaction.
Overall, though, our security selection detracted from performance during the period, particularly among stocks in the materials and consumer discretionary sectors. ITT Educational Services, for example, weighed on performance. Shares of this provider of postsecondary degree programs fell after the company posted disappointing earnings based on lower revenue per student and lower demand.
In spite of our disappointment over the portfolio’s shortfalls during the period, we are very optimistic about the portfolio’s prospects and its favorable risk/reward profile. In particular, we see attractive riskadjusted potential in the portfolio’s largecap technology company holdings. Overall, we believe valuations remain attractive, balance sheets are strong, and many technology companies have the potential to generate high levels of free cash flow. Strong longterm trends involving cloud computing, mobility, security, and data storage also should help drive sustained growth.
While we continue to emphasize balance with respect to our growth, quality, and valuation metrics, the largest current weighting in the portfolio is to valuation. After stresstesting our models, we believe we have a higher relative margin of safety than we have had in quite some time, without sacrificing growth or quality. We remain disciplined in executing our process and believe we have a very attractive portfolio of companies with strong balance sheets, solid growth opportunities, and high returns on capital.
9
Jennison Associates LLC
Portfolio Manager:
Kathleen A. McCarragher, Managing Director
Investors shrugged off the drama of Washington’s efforts to avoid the “fiscal cliff” and its ensuing tax increases as the calendar year came to a close, instead focusing on improving housing and employment data, rising consumer confidence, and forecasts for continued strength in corporate profits.
In our portfolio, successes included LinkedIn, the online professional network operator, whose revenue and earnings exceeded consensus expectations significantly. Gilead Sciences, which makes HIV and hepatitis C treatments, reported strong revenue and earnings. Biogen Idec had its new treatment for multiple sclerosis approved by the Food and Drug Administration. And Goldman Sachs posted financial results that exceeded consensus expectations.
Our shortfalls included Apple. The company’s financial results were in line with expectations, but estimates of forward growth were lowered. VMware suffered from uncertainty about when revenue related to new data center software products would accelerate. Alexion Pharmaceuticals was hurt by concerns about delayed European reimbursement and pricing of a key drug, Soliris, to treat a rare, genetic, and lifethreatening blood disorder. And Whole
Foods Market reported earnings per share that were in line with expectations, but comparablestore sales growth moderated.
Vanguard Equity Investment Group
Portfolio Managers:
James P. Stetler, Principal
James D. Troyer, CFA, Principal
Michael R. Roach, CFA
For the sixmonth period, the results of our stock selection models were mixed in distinguishing the outperformers from the underperformers in each industry group. Our market sentiment, quality, and management decisions models contributed to performance, while our growth and valuation models detracted from results.
Our stock selections were positive in eight of ten sectors. Our selections had the largest positive impact in energy, health care, and industrials. In energy, Marathon Petroleum and Tesoro provided a lift. In health care, McKesson and Pharmacyclics led our results, while Delta Air Lines and Honeywell International led in industrials.
However, our overall selections in financials and technology detracted from results. Most of the underperformance in financials stemmed from not owning or from underweighting companies; two examples are Berkshire Hathaway and Morgan Stanley. In the technology sector, Apple and Advanced Micro Devices did not perform as expected.
10
Frontier Capital Management Co., LLC
Portfolio Managers:
Stephen Knightly, CFA, President
Christopher J. Scarpa, Vice President
Equities registered strong gains during the period, with the Russell Midcap Growth Index returning 13.39%. The significant advance in stocks reflected improved economic readings as well as greater clarity regarding domestic fiscal policy.
Our portfolio showed strong stock selection in health care, industrials, and financials. Health care gains were achieved by owning companies such as Covance and Sirona Dental that have innovative offerings and are capturing share in growth markets. Industrials benefited from a rebound in aerospace spending for companies such as B/E Aerospace after a pause in the market amid European economic concerns during the summer of 2012. Financial services did well because of improved equity market fundamentals, which benefited brokerage firms such as Raymond James Financial.
The challenges faced by European economies weighed on materials companies, while new tax policies hurt lowend consumer discretionary firms.
Kalmar Investment Advisers
Portfolio Manager:
Ford B. Draper, Jr., President and Chief Investment Officer
Though economic growth will ebb and flow, the continuation of stimulus from central banks around the world, low inflation, and output gaps here and abroad suggest a possible multiyear expansion ahead. Together with the reasonable valuation of equities, this suggests the stock market should override occasional corrections and produce appealing returns.
In the last six months our overall returns were good. Our biggest detractors were Herbalife, F5 Networks, Nuance Communications, and SandRidge Energy.
Our biggest contributing sectors were consumer discretionary and information technology. Our largest individual contributors included CarMax, Hertz, Cabot Oil & Gas, B/E Aerospace, Fidelity National Information Services, and Pentair.
11
Morgan Growth Fund
Fund Profile
As of March 31, 2013
| | |
| Share-Class Characteristics | |
| | Investor | Admiral |
| | Shares | Shares |
| Ticker Symbol | VMRGX | VMRAX |
| Expense Ratio1 | 0.40% | 0.26% |
| 30-Day SEC Yield | 0.86% | 1.00% |
| | | |
| Portfolio Characteristics | | | |
| | | | DJ U.S. |
| | | Russell | Total |
| | | 3000 | Market |
| | | Growth | FA |
| | Fund | Index | Index |
| Number of Stocks | 326 | 1,678 | 3,586 |
| Median Market Cap | $34.3B | $46.4B | $40.0B |
| Price/Earnings Ratio | 20.4x | 20.2x | 18.1x |
| Price/Book Ratio | 3.4x | 4.4x | 2.3x |
| Return on Equity | 19.9% | 22.8% | 16.6% |
| Earnings Growth Rate | 14.5% | 14.8% | 9.6% |
| Dividend Yield | 1.2% | 1.7% | 2.0% |
| Foreign Holdings | 2.9% | 0.0% | 0.0% |
| Turnover Rate | | | |
| (Annualized) | 62% | — | — |
| Short-Term Reserves | 0.9% | — | — |
| | | |
| Sector Diversification (% of equity exposure) |
| | | | DJ U.S. |
| | | Russell | Total |
| | | 3000 | Market |
| | | Growth | FA |
| | Fund | Index | Index |
| Consumer Discretionary | 17.0% | 16.8% | 12.4% |
| Consumer Staples | 7.8 | 12.3 | 9.5 |
| Energy | 5.3 | 4.3 | 10.1 |
| Financials | 5.0 | 5.1 | 17.3 |
| Health Care | 15.8 | 13.4 | 12.2 |
| Industrials | 13.9 | 13.3 | 11.1 |
| Information Technology | 30.3 | 28.4 | 17.4 |
| Materials | 3.4 | 4.0 | 3.8 |
| Telecommunication | | | |
| Services | 1.5 | 2.2 | 2.6 |
| Utilities | 0.0 | 0.2 | 3.6 |
| | |
| Volatility Measures | | |
| | | DJ U.S. |
| | | Total |
| | | Market |
| | Russell 3000 | FA |
| | Growth Index | Index |
| R-Squared | 0.99 | 0.96 |
| Beta | 1.08 | 1.08 |
These measures show the degree and timing of the fund’s fluctuations compared with the indexes over 36 months.
| | |
| Ten Largest Holdings (% of total net assets) |
| Apple Inc. | Computer Hardware | 2.8% |
| Google Inc. Class A | Internet Software & | |
| | Services | 2.5 |
| Cisco Systems Inc. | Communications | |
| | Equipment | 2.4 |
| International Business | IT Consulting & | |
| Machines Corp. | Other Services | 1.7 |
| Microsoft Corp. | Systems Software | 1.5 |
| Amgen Inc. | Biotechnology | 1.3 |
| Amazon.com Inc. | Internet Retail | 1.3 |
| Oracle Corp. | Systems Software | 1.3 |
| Gilead Sciences Inc. | Biotechnology | 1.3 |
| Wal-Mart Stores Inc. | Hypermarkets & | |
| | Super Centers | 1.2 |
| Top Ten | | 17.3% |
The holdings listed exclude any temporary cash investments and equity index products.
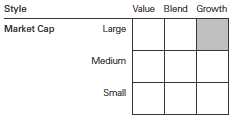
Investment Focus
1 The expense ratios shown are from the prospectus dated January 28, 2013, and represent estimated costs for the current fiscal year. For the six months ended March 31, 2013, the annualized expense ratios were 0.39% for Investor Shares and 0.25% for Admiral Shares.
12
Morgan Growth Fund
Performance Summary
All of the returns in this report represent past performance, which is not a guarantee of future results that may be achieved by the fund. (Current performance may be lower or higher than the performance data cited. For performance data current to the most recent month-end, visit our website at vanguard.com/performance.) Note, too, that both investment returns and principal value can fluctuate widely, so an investor’s shares, when sold, could be worth more or less than their original cost. The returns shown do not reflect taxes that a shareholder would pay on fund distributions or on the sale of fund shares.
Fiscal-Year Total Returns (%): September 30, 2002, Through March 31, 2013
| | | | |
| Average Annual Total Returns: Periods Ended March 31, 2013 | | | |
| | Inception | One | Five | Ten |
| | Date | Year | Years | Years |
| Investor Shares | 12/31/1968 | 7.06% | 5.41% | 8.85% |
| Admiral Shares | 5/14/2001 | 7.21 | 5.56 | 9.01 |
See Financial Highlights for dividend and capital gains information.
13
Morgan Growth Fund
Financial Statements (unaudited)
Statement of Net Assets
As of March 31, 2013
The fund reports a complete list of its holdings in regulatory filings four times in each fiscal year, at the quarter-ends. For the second and fourth fiscal quarters, the lists appear in the fund’s semiannual and annual reports to shareholders. For the first and third fiscal quarters, the fund files the lists with the Securities and Exchange Commission on Form N-Q. Shareholders can look up the fund’s Forms N-Q on the SEC’s website at sec.gov. Forms N-Q may also be reviewed and copied at the SEC’s Public Reference Room (see the back cover of this report for further information).
| | | |
| | | | Market |
| | | | Value |
| | | Shares | ($000) |
| Common Stocks (98.5%)1 | | |
| Consumer Discretionary (16.6%) | |
| * | Amazon.com Inc. | 453,293 | 120,798 |
| | TJX Cos. Inc. | 1,943,388 | 90,853 |
| | Home Depot Inc. | 1,260,363 | 87,948 |
| * | O’Reilly Automotive Inc. | 841,698 | 86,316 |
| | Comcast Corp. Class A | 2,017,759 | 84,766 |
| | Lowe’s Cos. Inc. | 2,219,374 | 84,159 |
| | Starwood Hotels & | | |
| | Resorts Worldwide Inc. | 1,058,266 | 67,443 |
| | Ralph Lauren Corp. | | |
| | Class A | 336,106 | 56,906 |
| | News Corp. Class A | 1,732,955 | 52,890 |
| | Omnicom Group Inc. | 843,046 | 49,655 |
| | NIKE Inc. Class B | 798,834 | 47,139 |
| | Sirius XM Radio Inc. | 12,483,240 | 38,448 |
| | Inditex SA ADR | 1,351,498 | 35,835 |
| | Wyndham | | |
| | Worldwide Corp. | 538,894 | 34,748 |
| * | Michael Kors | | |
| | Holdings Ltd. | 591,825 | 33,610 |
| | Wynn Resorts Ltd. | 233,591 | 29,236 |
| * | Dollar Tree Inc. | 602,197 | 29,164 |
| * | priceline.com Inc. | 41,742 | 28,716 |
| | Ford Motor Co. | 2,015,723 | 26,507 |
| * | LKQ Corp. | 1,135,543 | 24,709 |
| | PetSmart Inc. | 395,549 | 24,564 |
| ^ | Buckle Inc. | 518,848 | 24,204 |
| | Harley-Davidson Inc. | 432,600 | 23,058 |
| * | CarMax Inc. | 550,675 | 22,963 |
| * | Urban Outfitters Inc. | 584,406 | 22,640 |
| | Prada SPA | 2,216,385 | 22,616 |
| * | Discovery | | |
| | Communications Inc. | 298,190 | 20,736 |
| *,^ | Lululemon Athletica Inc. | 287,561 | 17,929 |
| * | Discovery | | |
| | Communications Inc. | | |
| | Class A | 214,582 | 16,896 |
| | PVH Corp. | 131,600 | 14,056 |
| | Dick’s Sporting Goods Inc. | 287,210 | 13,585 |
| | | |
| | | | Market |
| | | | Value |
| | | Shares | ($000) |
| | Tractor Supply Co. | 117,465 | 12,232 |
| * | DIRECTV | 203,200 | 11,503 |
| * | Imax Corp. | 402,520 | 10,759 |
| | VF Corp. | 63,216 | 10,604 |
| | Time Warner Cable Inc. | 104,900 | 10,077 |
| | McDonald’s Corp. | 93,700 | 9,341 |
| | Gentex Corp. | 453,320 | 9,071 |
| | Walt Disney Co. | 150,800 | 8,565 |
| | Macy’s Inc. | 203,600 | 8,519 |
| | Target Corp. | 116,600 | 7,981 |
| | Gap Inc. | 225,400 | 7,979 |
| * | Ulta Salon Cosmetics | | |
| | & Fragrance Inc. | 93,675 | 7,604 |
| | Dunkin’ Brands Group Inc. | 198,773 | 7,331 |
| | H&R Block Inc. | 244,715 | 7,200 |
| * | PulteGroup Inc. | 352,100 | 7,127 |
| | Service Corp. International | 424,275 | 7,098 |
| | Comcast Corp. | 171,500 | 6,795 |
| | Starbucks Corp. | 118,400 | 6,744 |
| * | Bed Bath & Beyond Inc. | 104,441 | 6,728 |
| * | Cabela’s Inc. | 102,500 | 6,230 |
| * | TRW Automotive | | |
| | Holdings Corp. | 110,100 | 6,056 |
| * | Steven Madden Ltd. | 139,190 | 6,005 |
| | Tiffany & Co. | 84,800 | 5,897 |
| * | Goodyear Tire & Rubber Co. | 453,100 | 5,714 |
| | News Corp. Class B | 167,800 | 5,162 |
| * | Liberty Media Corp. | 23,900 | 2,668 |
| *,^ | ITT Educational Services Inc. | 146,703 | 2,022 |
| | CBS Corp. Class B | 40,700 | 1,900 |
| | Tupperware Brands Corp. | 20,800 | 1,700 |
| | Virgin Media Inc. | 25,950 | 1,271 |
| | Delphi Automotive plc | 18,700 | 830 |
| | | | 1,541,806 |
| Consumer Staples (7.6%) | | |
| | Wal-Mart Stores Inc. | 1,547,366 | 115,789 |
| | Costco Wholesale Corp. | 1,014,070 | 107,603 |
| | Philip Morris | | |
| | International Inc. | 1,117,195 | 103,575 |
| | Coca-Cola Co. | 1,822,225 | 73,691 |
14
Morgan Growth Fund
| | | |
| | | | Market |
| | | | Value |
| | | Shares | ($000) |
| | CVS Caremark Corp. | 1,129,009 | 62,084 |
| | Whole Foods Market Inc. | 588,337 | 51,038 |
| *,^ | Green Mountain | | |
| | Coffee Roasters Inc. | 830,770 | 47,155 |
| | Estee Lauder Cos. Inc. | | |
| | Class A | 571,875 | 36,617 |
| | Anheuser-Busch | | |
| | InBev NV ADR | 277,991 | 27,674 |
| | Altria Group Inc. | 472,000 | 16,232 |
| | Herbalife Ltd. | 400,200 | 14,987 |
| | Brown-Forman Corp. | | |
| | Class B | 142,179 | 10,152 |
| | Kroger Co. | 282,400 | 9,359 |
| | Kraft Foods Group Inc. | 143,600 | 7,400 |
| | Ingredion Inc. | 89,400 | 6,465 |
| | PepsiCo Inc. | 76,700 | 6,068 |
| | Kimberly-Clark Corp. | 40,200 | 3,939 |
| | Colgate-Palmolive Co. | 20,800 | 2,455 |
| | | | 702,283 |
| Energy (5.1%) | | |
| | Noble Energy Inc. | 449,665 | 52,008 |
| | Schlumberger Ltd. | 574,715 | 43,041 |
| | Oceaneering | | |
| | International Inc. | 582,043 | 38,654 |
| | Valero Energy Corp. | 775,607 | 35,282 |
| | Cabot Oil & Gas Corp. | 497,920 | 33,664 |
| * | Transocean Ltd. | 617,257 | 32,073 |
| | Diamond Offshore | | |
| | Drilling Inc. | 388,837 | 27,048 |
| * | Cameron International Corp. | 369,685 | 24,104 |
| | National Oilwell Varco Inc. | 302,877 | 21,429 |
| | Core Laboratories NV | 131,077 | 18,078 |
| * | Continental Resources Inc. | 157,600 | 13,700 |
| * | Concho Resources Inc. | 133,746 | 13,031 |
| *,^ | InterOil Corp. | 170,100 | 12,946 |
| * | Superior Energy | | |
| | Services Inc. | 495,420 | 12,866 |
| | Ensco plc Class A | 194,238 | 11,654 |
| * | Southwestern Energy Co. | 300,070 | 11,181 |
| | EOG Resources Inc. | 85,900 | 11,001 |
| * | Kodiak Oil & Gas Corp. | 1,027,517 | 9,340 |
| | Marathon Petroleum Corp. | 72,200 | 6,469 |
| | Tesoro Corp. | 110,100 | 6,446 |
| * | Weatherford | | |
| | International Ltd. | 527,560 | 6,405 |
| | Helmerich & Payne Inc. | 97,500 | 5,918 |
| | Exxon Mobil Corp. | 65,522 | 5,904 |
| | HollyFrontier Corp. | 111,608 | 5,742 |
| * | McDermott | | |
| | International Inc. | 450,620 | 4,952 |
| | CARBO Ceramics Inc. | 50,500 | 4,599 |
| *,^ | SandRidge Energy Inc. | 192,750 | 1,016 |
| | | | 468,551 |
| Exchange-Traded Fund (0.9%) | |
| 2 | Vanguard Growth ETF | 1,044,900 | 80,990 |
| | | |
| | | | Market |
| | | | Value |
| | | Shares | ($000) |
| Financials (4.8%) | | |
| | Bank of America Corp. | 5,546,768 | 67,560 |
| | American Express Co. | 976,427 | 65,870 |
| | Goldman Sachs Group Inc. | 296,680 | 43,656 |
| | Morgan Stanley | 1,894,070 | 41,632 |
| | JPMorgan Chase & Co. | 745,181 | 35,366 |
| | T. Rowe Price Group Inc. | 451,620 | 33,813 |
| | Raymond James | | |
| | Financial Inc. | 482,100 | 22,225 |
| * | Affiliated Managers | | |
| | Group Inc. | 99,605 | 15,296 |
| | American Tower | | |
| | Corporation | 197,645 | 15,203 |
| | Fidelity National | | |
| | Financial Inc. Class A | 586,709 | 14,803 |
| | Allied World Assurance Co. | | |
| | Holdings AG | 148,100 | 13,732 |
| | Arthur J Gallagher & Co. | 284,780 | 11,764 |
| | Discover Financial Services | 224,800 | 10,080 |
| | Franklin Resources Inc. | 65,200 | 9,833 |
| * | Signature Bank | 86,232 | 6,791 |
| * | American International | | |
| | Group Inc. | 162,400 | 6,304 |
| | Simon Property Group Inc. | 28,400 | 4,503 |
| | Weyerhaeuser Co. | 133,900 | 4,202 |
| | Moody’s Corp. | 73,496 | 3,919 |
| | General Growth | | |
| | Properties Inc. | 184,500 | 3,668 |
| | Vornado Realty Trust | 37,400 | 3,128 |
| | Weingarten Realty Investors | 90,800 | 2,865 |
| | US Bancorp | 83,500 | 2,833 |
| | Aon plc | 24,800 | 1,525 |
| | Public Storage | 5,300 | 807 |
| * | Ocwen Financial Corp. | 7,200 | 273 |
| | | | 441,651 |
| Health Care (15.5%) | | |
| | Amgen Inc. | 1,197,790 | 122,785 |
| * | Gilead Sciences Inc. | 2,404,596 | 117,657 |
| * | Biogen Idec Inc. | 581,867 | 112,248 |
| * | Celgene Corp. | 561,082 | 65,035 |
| | Eli Lilly & Co. | 1,085,631 | 61,653 |
| | Abbott Laboratories | 1,682,986 | 59,443 |
| * | Express Scripts | | |
| | Holding Co. | 948,700 | 54,693 |
| | Allergan Inc. | 455,990 | 50,902 |
| | Johnson & Johnson | 622,767 | 50,774 |
| | AbbVie Inc. | 1,146,960 | 46,773 |
| | Zimmer Holdings Inc. | 615,648 | 46,309 |
| * | Vertex | | |
| | Pharmaceuticals Inc. | 793,308 | 43,616 |
| | McKesson Corp. | 385,072 | 41,572 |
| | Merck & Co. Inc. | 893,367 | 39,514 |
| * | Alexion | | |
| | Pharmaceuticals Inc. | 405,654 | 37,377 |
| | Cooper Cos. Inc. | 333,684 | 35,998 |
| | Shire plc ADR | 372,009 | 33,987 |
15
Morgan Growth Fund
| | | |
| | | | Market |
| | | | Value |
| | | Shares | ($000) |
| | Novo Nordisk A/S ADR | 204,517 | 33,030 |
| * | Actavis Inc. | 298,490 | 27,494 |
| | Aetna Inc. | 486,771 | 24,884 |
| * | Sirona Dental Systems Inc. | 327,219 | 24,126 |
| * | Hologic Inc. | 1,053,016 | 23,798 |
| * | Edwards Lifesciences Corp. | 272,918 | 22,423 |
| | ResMed Inc. | 467,095 | 21,655 |
| * | Catamaran Corp. | 394,745 | 20,933 |
| * | Bruker Corp. | 969,858 | 18,524 |
| * | BioMarin | | |
| | Pharmaceutical Inc. | 293,842 | 18,295 |
| | Medtronic Inc. | 379,693 | 17,830 |
| * | Covance Inc. | 226,800 | 16,856 |
| | Thermo Fisher | | |
| | Scientific Inc. | 213,010 | 16,293 |
| * | Salix Pharmaceuticals Ltd. | 275,155 | 14,082 |
| * | MEDNAX Inc. | 151,896 | 13,614 |
| | Baxter International Inc. | 140,200 | 10,184 |
| | Becton Dickinson and Co. | 96,500 | 9,226 |
| | Cigna Corp. | 147,300 | 9,187 |
| | Cie Generale d’Optique | | |
| | Essilor International SA | 78,681 | 8,755 |
| * | Mylan Inc. | 270,500 | 7,828 |
| | HCA Holdings Inc. | 170,200 | 6,915 |
| * | Centene Corp. | 144,300 | 6,355 |
| * | Pharmacyclics Inc. | 78,400 | 6,304 |
| * | DaVita HealthCare | | |
| | Partners Inc. | 53,107 | 6,298 |
| * | Seattle Genetics Inc. | 172,828 | 6,137 |
| * | Cerner Corp. | 58,899 | 5,581 |
| * | Onyx Pharmaceuticals Inc. | 56,918 | 5,058 |
| * | Regeneron | | |
| | Pharmaceuticals Inc. | 22,900 | 4,040 |
| * | Myriad Genetics Inc. | 155,750 | 3,956 |
| | UnitedHealth Group Inc. | 64,600 | 3,696 |
| | St. Jude Medical Inc. | 72,900 | 2,948 |
| * | Charles River Laboratories | | |
| | International Inc. | 42,000 | 1,859 |
| | Warner Chilcott plc Class A | 30,900 | 419 |
| | | | 1,438,919 |
| Industrials (13.7%) | | |
| | Boeing Co. | 1,079,109 | 92,641 |
| | 3M Co. | 784,182 | 83,366 |
| | AMETEK Inc. | 1,872,093 | 81,174 |
| | Honeywell | | |
| | International Inc. | 1,017,885 | 76,698 |
| | United Technologies Corp. | 787,335 | 73,561 |
| * | Hertz Global Holdings Inc. | 2,615,357 | 58,218 |
| | Parker Hannifin Corp. | 572,301 | 52,411 |
| | TransDigm Group Inc. | 320,895 | 49,071 |
| | Precision Castparts Corp. | 252,948 | 47,964 |
| | Danaher Corp. | 745,573 | 46,337 |
| * | B/E Aerospace Inc. | 711,144 | 42,875 |
| | General Electric Co. | 1,762,302 | 40,744 |
| | Illinois Tool Works Inc. | 630,671 | 38,433 |
| | | |
| | | | Market |
| | | | Value |
| | | Shares | ($000) |
| ^ | Canadian Pacific | | |
| | Railway Ltd. | 245,877 | 32,080 |
| | Dover Corp. | 398,029 | 29,008 |
| * | Quanta Services Inc. | 807,398 | 23,075 |
| * | IHS Inc. Class A | 211,800 | 22,180 |
| | Tyco International Ltd. | 651,975 | 20,863 |
| | Pentair Ltd. | 385,875 | 20,355 |
| | ADT Corp. | 395,477 | 19,355 |
| | Flowserve Corp. | 107,500 | 18,029 |
| | Union Pacific Corp. | 118,000 | 16,804 |
| * | United Continental | | |
| | Holdings Inc. | 510,800 | 16,351 |
| | United Parcel Service Inc. | | |
| | Class B | 180,900 | 15,539 |
| * | WESCO International Inc. | 200,809 | 14,581 |
| | MSC Industrial Direct | | |
| | Co. Inc. Class A | 163,680 | 14,040 |
| | Fastenal Co. | 263,350 | 13,523 |
| * | MRC Global Inc. | 396,442 | 13,055 |
| | Pall Corp. | 178,492 | 12,203 |
| | Emerson Electric Co. | 215,000 | 12,012 |
| * | Clean Harbors Inc. | 195,175 | 11,338 |
| | Landstar System Inc. | 167,415 | 9,558 |
| * | Alaska Air Group Inc. | 148,114 | 9,473 |
| * | Stericycle Inc. | 87,375 | 9,277 |
| | A.O. Smith Corp. | 124,124 | 9,132 |
| | Ingersoll-Rand plc | 165,200 | 9,088 |
| | J.B. Hunt Transport | | |
| | Services Inc. | 119,770 | 8,920 |
| * | Delta Air Lines Inc. | 521,900 | 8,617 |
| * | Verisk Analytics Inc. | | |
| | Class A | 136,696 | 8,425 |
| | Lockheed Martin Corp. | 84,000 | 8,108 |
| * | United Rentals Inc. | 143,460 | 7,886 |
| * | Kirby Corp. | 101,600 | 7,803 |
| | Textron Inc. | 253,800 | 7,566 |
| | Masco Corp. | 358,800 | 7,266 |
| | Expeditors International | | |
| | of Washington Inc. | 196,245 | 7,008 |
| | Acuity Brands Inc. | 98,590 | 6,837 |
| | KAR Auction Services Inc. | 333,080 | 6,672 |
| | Dun & Bradstreet Corp. | 66,600 | 5,571 |
| * | Chart Industries Inc. | 68,900 | 5,513 |
| | WW Grainger Inc. | 22,280 | 5,013 |
| | FedEx Corp. | 44,300 | 4,350 |
| | Robert Half | | |
| | International Inc. | 73,200 | 2,747 |
| * | Fortune Brands Home | | |
| | & Security Inc. | 55,000 | 2,059 |
| | | | 1,264,773 |
| Information Technology (29.6%) | |
| | Apple Inc. | 587,568 | 260,075 |
| * | Google Inc. Class A | 294,232 | 233,629 |
| | Cisco Systems Inc. | 10,486,598 | 219,275 |
| | International Business | | |
| | Machines Corp. | 725,297 | 154,706 |
16
Morgan Growth Fund
| | | |
| | | | Market |
| | | | Value |
| | | Shares | ($000) |
| | Microsoft Corp. | 4,970,950 | 142,219 |
| | Oracle Corp. | 3,715,933 | 120,173 |
| | Mastercard Inc. Class A | 174,790 | 94,584 |
| * | eBay Inc. | 1,559,401 | 84,551 |
| | QUALCOMM Inc. | 1,221,189 | 81,759 |
| | Visa Inc. Class A | 418,531 | 71,083 |
| * | NetApp Inc. | 1,936,274 | 66,143 |
| * | Red Hat Inc. | 1,307,857 | 66,125 |
| | Altera Corp. | 1,753,648 | 62,202 |
| * | LinkedIn Corp. Class A | 317,331 | 55,869 |
| * | Alliance Data | | |
| | Systems Corp. | 342,465 | 55,442 |
| * | Yahoo! Inc. | 2,125,139 | 50,005 |
| | Xilinx Inc. | 1,308,192 | 49,934 |
| | IAC/InterActiveCorp | 1,023,764 | 45,742 |
| | Intuit Inc. | 646,605 | 42,450 |
| * | Check Point Software | | |
| | Technologies Ltd. | 802,805 | 37,724 |
| * | EMC Corp. | 1,516,848 | 36,237 |
| | Broadcom Corp. Class A | 999,233 | 34,643 |
| * | VMware Inc. Class A | 437,226 | 34,488 |
| * | Salesforce.com Inc. | 188,244 | 33,664 |
| * | SanDisk Corp. | 608,948 | 33,492 |
| | Microchip Technology Inc. | 779,887 | 28,669 |
| | Amphenol Corp. Class A | 349,760 | 26,110 |
| * | F5 Networks Inc. | 280,524 | 24,989 |
| | Avago Technologies Ltd. | | |
| | Class A | 676,120 | 24,286 |
| | Western Digital Corp. | 458,745 | 23,066 |
| | Fidelity National | | |
| | Information Services Inc. | 563,275 | 22,317 |
| * | Facebook Inc. Class A | 865,257 | 22,133 |
| * | Cognizant Technology | | |
| | Solutions Corp. Class A | 288,310 | 22,087 |
| * | BMC Software Inc. | 463,665 | 21,482 |
| * | Gartner Inc. | 377,529 | 20,541 |
| * | NetSuite Inc. | 233,149 | 18,666 |
| * | Trimble Navigation Ltd. | 543,620 | 16,287 |
| * | Autodesk Inc. | 362,980 | 14,969 |
| * | Workday Inc. Class A | 237,965 | 14,666 |
| | Accenture plc Class A | 181,300 | 13,773 |
| * | Baidu Inc. ADR | 155,351 | 13,624 |
| | Maxim Integrated | | |
| | Products Inc. | 399,635 | 13,048 |
| * | Lam Research Corp. | 313,825 | 13,011 |
| | Jack Henry & | | |
| | Associates Inc. | 279,090 | 12,897 |
| * | Cadence Design | | |
| | Systems Inc. | 877,316 | 12,221 |
| * | NCR Corp. | 439,215 | 12,105 |
| * | Citrix Systems Inc. | 164,250 | 11,852 |
| * | WEX Inc. | 149,350 | 11,724 |
| | FEI Co. | 174,802 | 11,283 |
| * | QLogic Corp. | 933,207 | 10,825 |
| * | Informatica Corp. | 313,675 | 10,812 |
| * | Emulex Corp. | 1,599,036 | 10,442 |
| | | |
| | | | Market |
| | | | Value |
| | | Shares | ($000) |
| * | Nuance | | |
| | Communications Inc. | 484,865 | 9,785 |
| * | Concur Technologies Inc. | 140,000 | 9,612 |
| | Texas Instruments Inc. | 260,400 | 9,239 |
| * | Symantec Corp. | 369,900 | 9,129 |
| | Motorola Solutions Inc. | 141,857 | 9,083 |
| * | Atmel Corp. | 1,266,053 | 8,812 |
| * | Rovi Corp. | 408,425 | 8,744 |
| * | Fiserv Inc. | 94,400 | 8,291 |
| | Computer Sciences Corp. | 142,840 | 7,032 |
| * | Vantiv Inc. Class A | 282,800 | 6,714 |
| * | Teradata Corp. | 113,978 | 6,669 |
| * | Akamai Technologies Inc. | 182,267 | 6,432 |
| * | LSI Corp. | 888,300 | 6,023 |
| * | Equinix Inc. | 22,480 | 4,863 |
| | Paychex Inc. | 134,353 | 4,712 |
| | NVIDIA Corp. | 345,600 | 4,431 |
| * | Freescale | | |
| | Semiconductor Ltd. | 181,200 | 2,698 |
| | | | 2,746,368 |
| Materials (3.3%) | | |
| | Monsanto Co. | 1,082,295 | 114,323 |
| | Sherwin-Williams Co. | 267,594 | 45,194 |
| | FMC Corp. | 492,833 | 28,106 |
| * | WR Grace & Co. | 233,690 | 18,113 |
| | Ashland Inc. | 222,275 | 16,515 |
| | Albemarle Corp. | 259,930 | 16,251 |
| | Celanese Corp. Class A | 180,400 | 7,947 |
| | Praxair Inc. | 68,560 | 7,647 |
| | Martin Marietta | | |
| | Materials Inc. | 74,695 | 7,620 |
| * | Allied Nevada Gold Corp. | 454,983 | 7,489 |
| | Eagle Materials Inc. | 109,300 | 7,283 |
| | Cytec Industries Inc. | 94,002 | 6,964 |
| | PPG Industries Inc. | 51,391 | 6,883 |
| | CF Industries | | |
| | Holdings Inc. | 30,700 | 5,844 |
| | Allegheny | | |
| | Technologies Inc. | 142,442 | 4,517 |
| | Ball Corp. | 93,300 | 4,439 |
| | Axiall Corp. | 29,497 | 1,834 |
| | | | 306,969 |
| Telecommunication Services (1.4%) | |
| | Verizon | | |
| | Communications Inc. | 1,879,129 | 92,359 |
| * | SBA Communications | | |
| | Corp. Class A | 377,196 | 27,166 |
| * | Crown Castle | | |
| | International Corp. | 131,000 | 9,123 |
| * | MetroPCS | | |
| | Communications Inc. | 191,600 | 2,088 |
| | | | 130,736 |
| Total Common Stocks | | |
| (Cost $7,071,735) | | 9,123,046 |
17
Morgan Growth Fund
| | | |
| | | | Market |
| | | | Value |
| | | Shares | ($000) |
| Temporary Cash Investments (2.7%)1 | |
| Money Market Fund (2.5%) | | |
| 3,4 | Vanguard Market | | |
| | Liquidity Fund, | | |
| | 0.147% | 241,735,000 | 241,735 |
| |
| | | Face | |
| | | Amount | |
| | | ($000) | |
| Repurchase Agreement (0.1%) | | |
| | Bank of America | | |
| | Securities, LLC 0.190%, | | |
| | 4/1/13 (Dated 3/28/13, | | |
| | Repurchase Value | | |
| | $7,400,000, collateralized | | |
| | by U.S. Treasury Note/Bond | | |
| | 0.875%, 1/31/17) | 7,400 | 7,400 |
| |
| U.S. Government and Agency Obligations (0.1%) |
| 5,6 | Fannie Mae Discount | | |
| | Notes, 0.085%, 4/3/13 | 5,000 | 5,000 |
| 6,7 | Federal Home Loan | | |
| | Bank Discount Notes, | | |
| | 0.140%, 5/29/13 | 400 | 400 |
| 5,6 | Freddie Mac Discount | | |
| | Notes, 0.130%, 9/16/13 | 1,400 | 1,399 |
| | | | 6,799 |
| Total Temporary Cash Investments | |
| (Cost $255,934) | | 255,934 |
| Total Investments (101.2%) | | |
| (Cost $7,327,669) | | 9,378,980 |
| |
| | Market |
| | Value |
| | ($000) |
| Other Assets and Liabilities (-1.2%) | |
| Other Assets | 47,476 |
| Liabilities4 | (161,077) |
| | (113,601) |
| Net Assets (100%) | 9,265,379 |
| |
| At March 31, 2013, net assets consisted of: |
| | Amount |
| | ($000) |
| Paid-in Capital | 7,186,051 |
| Overdistributed Net Investment Income | (368) |
| Accumulated Net Realized Gains | 27,116 |
| Unrealized Appreciation (Depreciation) | |
| Investment Securities | 2,051,311 |
| Futures Contracts | 1,290 |
| Foreign Currencies | (21) |
| Net Assets | 9,265,379 |
| |
| Investor Shares—Net Assets | |
| Applicable to 235,885,455 outstanding | |
| $.001 par value shares of beneficial | |
| interest (unlimited authorization) | 5,117,049 |
| Net Asset Value Per Share— | |
| Investor Shares | $21.69 |
| |
| Admiral Shares—Net Assets | |
| Applicable to 61,686,507 outstanding | |
| $.001 par value shares of beneficial | |
| interest (unlimited authorization) | 4,148,330 |
| Net Asset Value Per Share— | |
| Admiral Shares | $67.25 |
See Note A in Notes to Financial Statements.
* Non-income-producing security.
^ Part of security position is on loan to broker-dealers. The total value of securities on loan is $64,656,000.
1 The fund invests a portion of its cash reserves in equity markets through the use of index futures contracts. After giving effect to futures investments, the fund’s effective common stock and temporary cash investment positions represent 99.6% and 1.6%, respectively, of net assets.
2 Considered an affiliated company of the fund as the issuer is another member of The Vanguard Group.
3 Affiliated money market fund available only to Vanguard funds and certain trusts and accounts managed by Vanguard. Rate shown is the 7-day yield.
4 Includes $65,420,000 of collateral received for securities on loan.
5 The issuer was placed under federal conservatorship in September 2008; since that time, its daily operations have been managed by the Federal Housing Finance Agency and it receives capital from the U.S. Treasury, as needed to maintain a positive net worth, in exchange for senior preferred stock.
6 Securities with a value of $5,500,000 have been segregated as initial margin for open futures contracts.
7 The issuer operates under a congressional charter; its securities are generally neither guaranteed by the U.S. Treasury nor backed by the full faith and credit of the U.S. government.
ADR—American Depositary Receipt.
See accompanying Notes, which are an integral part of the Financial Statements.
18
Morgan Growth Fund
| |
| Statement of Operations | |
| |
| | Six Months Ended |
| | March 31, 2013 |
| | ($000) |
| Investment Income | |
| Income | |
| Dividends1,2 | 73,435 |
| Interest2 | 210 |
| Security Lending | 1,404 |
| Total Income | 75,049 |
| Expenses | |
| Investment Advisory Fees—Note B | |
| Basic Fee | 7,408 |
| Performance Adjustment | (1,886) |
| The Vanguard Group—Note C | |
| Management and Administrative—Investor Shares | 6,286 |
| Management and Administrative—Admiral Shares | 2,131 |
| Marketing and Distribution—Investor Shares | 474 |
| Marketing and Distribution—Admiral Shares | 337 |
| Custodian Fees | 63 |
| Shareholders’ Reports—Investor Shares | 21 |
| Shareholders’ Reports—Admiral Shares | 21 |
| Trustees’ Fees and Expenses | 15 |
| Total Expenses | 14,870 |
| Expenses Paid Indirectly | (114) |
| Net Expenses | 14,756 |
| Net Investment Income | 60,293 |
| Realized Net Gain (Loss) | |
| Investment Securities Sold2 | 643,438 |
| Futures Contracts | 6,046 |
| Foreign Currencies | 11 |
| Realized Net Gain (Loss) | 649,495 |
| Change in Unrealized Appreciation (Depreciation) | |
| Investment Securities | (23,051) |
| Futures Contracts | 2,213 |
| Foreign Currencies | (21) |
| Change in Unrealized Appreciation (Depreciation) | (20,859) |
| Net Increase (Decrease) in Net Assets Resulting from Operations | 688,929 |
1 Dividends are net of foreign withholding taxes of $179,000.
2 Dividend income, interest income, and realized net gain (loss) from affiliated companies of the fund were $678,000, $125,000, and $0, respectively.
See accompanying Notes, which are an integral part of the Financial Statements.
19
Morgan Growth Fund
| | |
| Statement of Changes in Net Assets | | |
| |
| | Six Months Ended | Year Ended |
| | March 31, | September 30, |
| | 2013 | 2012 |
| | ($000) | ($000) |
| Increase (Decrease) in Net Assets | | |
| Operations | | |
| Net Investment Income | 60,293 | 69,558 |
| Realized Net Gain (Loss) | 649,495 | 567,311 |
| Change in Unrealized Appreciation (Depreciation) | (20,859) | 1,379,343 |
| Net Increase (Decrease) in Net Assets Resulting from Operations | 688,929 | 2,016,212 |
| Distributions | | |
| Net Investment Income | | |
| Investor Shares | (51,062) | (30,342) |
| Admiral Shares | (44,266) | (20,234) |
| Realized Capital Gain | | |
| Investor Shares | — | — |
| Admiral Shares | — | — |
| Total Distributions | (95,328) | (50,576) |
| Capital Share Transactions | | |
| Investor Shares | (494,131) | (1,008,677) |
| Admiral Shares | 157,872 | 487,927 |
| Net Increase (Decrease) from Capital Share Transactions | (336,259) | (520,750) |
| Total Increase (Decrease) | 257,342 | 1,444,886 |
| Net Assets | | |
| Beginning of Period | 9,008,037 | 7,563,151 |
| End of Period1 | 9,265,379 | 9,008,037 |
| 1 Net Assets—End of Period includes undistributed (overdistributed) net investment income of ($368,000) and $34,656,000. |
See accompanying Notes, which are an integral part of the Financial Statements.
20
Morgan Growth Fund
Financial Highlights
| | | | | | |
| Investor Shares | | | | | | |
| | Six Months | | | | | |
| | Ended | | | | | |
| For a Share Outstanding | March 31, | | | Year Ended September 30, |
| Throughout Each Period | 2013 | 2012 | 2011 | 2010 | 2009 | 2008 |
| Net Asset Value, Beginning of Period | $20.31 | $16.06 | $16.04 | $14.32 | $15.15 | $21.45 |
| Investment Operations | | | | | | |
| Net Investment Income | .132 | .141 | .087 | .097 | .114 | .148 |
| Net Realized and Unrealized Gain (Loss) | | | | | | |
| on Investments | 1.453 | 4.209 | .029 | 1.733 | (.804) | (4.912) |
| Total from Investment Operations | 1.585 | 4.350 | .116 | 1.830 | (.690) | (4.764) |
| Distributions | | | | | | |
| Dividends from Net Investment Income | (.205) | (.100) | (.096) | (.110) | (.140) | (.175) |
| Distributions from Realized Capital Gains | — | — | — | — | — | (1.361) |
| Total Distributions | (.205) | (.100) | (.096) | (.110) | (.140) | (1.536) |
| Net Asset Value, End of Period | $21.69 | $20.31 | $16.06 | $16.04 | $14.32 | $15.15 |
| |
| Total Return1 | 7.90% | 27.18% | 0.66% | 12.81% | -4.27% | -23.70% |
| |
| Ratios/Supplemental Data | | | | | | |
| Net Assets, End of Period (Millions) | $5,117 | $5,283 | $5,009 | $5,432 | $5,239 | $5,418 |
| Ratio of Total Expenses to | | | | | | |
| Average Net Assets2 | 0.39% | 0.40% | 0.42% | 0.44% | 0.48% | 0.38% |
| Ratio of Net Investment Income to | | | | | | |
| Average Net Assets | 1.10% | 0.74% | 0.47% | 0.62% | 0.94% | 0.80% |
| Portfolio Turnover Rate | 62% | 49% | 55% | 60% | 87% | 88% |
The expense ratio, net income ratio, and turnover rate for the current period have been annualized.
1 Total returns do not include account service fees that may have applied in the periods shown. Fund prospectuses provide information about any applicable account service fees.
2 Includes performance-based investment advisory fee increases (decreases) of (0.04%), (0.04%), (0.01%), 0.01%, 0.02%, and 0.00%.
See accompanying Notes, which are an integral part of the Financial Statements.
21
Morgan Growth Fund
Financial Highlights
| | | | | | |
| Admiral Shares | | | | | | |
| | Six Months | | | | | |
| | Ended | | | | | |
| For a Share Outstanding | March 31, | | | Year Ended September 30, |
| Throughout Each Period | 2013 | 2012 | 2011 | 2010 | 2009 | 2008 |
| Net Asset Value, Beginning of Period | $63.02 | $49.84 | $49.75 | $44.42 | $47.03 | $66.58 |
| Investment Operations | | | | | | |
| Net Investment Income | .461 | .535 | .342 | .372 | .414 | .555 |
| Net Realized and Unrealized Gain (Loss) | | | | | | |
| on Investments | 4.504 | 13.036 | .110 | 5.364 | (2.502) | (15.244) |
| Total from Investment Operations | 4.965 | 13.571 | .452 | 5.736 | (2.088) | (14.689) |
| Distributions | | | | | | |
| Dividends from Net Investment Income | (.735) | (.391) | (.362) | (.406) | (.522) | (.641) |
| Distributions from Realized Capital Gains | — | — | — | — | — | (4.220) |
| Total Distributions | (.735) | (.391) | (.362) | (.406) | (.522) | (4.861) |
| Net Asset Value, End of Period | $67.25 | $63.02 | $49.84 | $49.75 | $44.42 | $47.03 |
| |
| Total Return1 | 7.99% | 27.35% | 0.83% | 12.95% | -4.09% | -23.57% |
| |
| Ratios/Supplemental Data | | | | | | |
| Net Assets, End of Period (Millions) | $4,148 | $3,725 | $2,554 | $2,445 | $2,251 | $2,512 |
| Ratio of Total Expenses to | | | | | | |
| Average Net Assets2 | 0.25% | 0.26% | 0.28% | 0.30% | 0.31% | 0.21% |
| Ratio of Net Investment Income to | | | | | | |
| Average Net Assets | 1.24% | 0.88% | 0.61% | 0.76% | 1.11% | 0.97% |
| Portfolio Turnover Rate | 62% | 49% | 55% | 60% | 87% | 88% |
The expense ratio, net income ratio, and turnover rate for the current period have been annualized.
1 Total returns do not include account service fees that may have applied in the periods shown. Fund prospectuses provide information about any applicable account service fees.
2 Includes performance-based investment advisory fee increases (decreases) of (0.04%), (0.04%), (0.01%), 0.01%, 0.02%, and 0.00%.
See accompanying Notes, which are an integral part of the Financial Statements.
22
Morgan Growth Fund
Notes to Financial Statements
Vanguard Morgan Growth Fund is registered under the Investment Company Act of 1940 as an open-end investment company, or mutual fund. The fund offers two classes of shares: Investor Shares and Admiral Shares. Investor Shares are available to any investor who meets the fund’s minimum purchase requirements. Admiral Shares are designed for investors who meet certain administrative, service, and account-size criteria.
A. The following significant accounting policies conform to generally accepted accounting principles for U.S. mutual funds. The fund consistently follows such policies in preparing its financial statements.
1. Security Valuation: Securities are valued as of the close of trading on the New York Stock Exchange (generally 4 p.m., Eastern time) on the valuation date. Equity securities are valued at the latest quoted sales prices or official closing prices taken from the primary market in which each security trades; such securities not traded on the valuation date are valued at the mean of the latest quoted bid and asked prices. Securities for which market quotations are not readily available, or whose values have been affected by events occurring before the fund’s pricing time but after the close of the securities’ primary markets, are valued at their fair values calculated according to procedures adopted by the board of trustees. These procedures include obtaining quotations from an independent pricing service, monitoring news to identify significant market- or security-specific events, and evaluating changes in the values of foreign market proxies (for example, ADRs, futures contracts, or exchange-traded funds), between the time the foreign markets close and the fund’s pricing time. When fair-value pricing is employed, the prices of securities used by a fund to calculate its net asset value may differ from quoted or published prices for the same securities. Investments in Vanguard Market Liquidity Fund are valued at that fund’s net asset value. Temporary cash investments acquired over 60 days to maturity are valued using the latest bid prices or using valuations based on a matrix system (which considers such factors as security prices, yields, maturities, and ratings), both as furnished by independent pricing services. Other temporary cash investments are valued at amortized cost, which approximates market value.
2. Foreign Currency: Securities and other assets and liabilities denominated in foreign currencies are translated into U.S. dollars using exchange rates obtained from an independent third party as of the fund’s pricing time on the valuation date. Realized gains (losses) and unrealized appreciation (depreciation) on investment securities include the effects of changes in exchange rates since the securities were purchased, combined with the effects of changes in security prices. Fluctuations in the value of other assets and liabilities resulting from changes in exchange rates are recorded as unrealized foreign currency gains (losses) until the assets or liabilities are settled in cash, at which time they are recorded as realized foreign currency gains (losses).
3. Futures Contracts: The fund uses index futures contracts to a limited extent, with the objective of maintaining full exposure to the stock market while maintaining liquidity. The fund may purchase or sell futures contracts to achieve a desired level of investment, whether to accommodate portfolio turnover or cash flows from capital share transactions. The primary risks associated with the use of futures contracts are imperfect correlation between changes in market values of stocks held by the fund and the prices of futures contracts, and the possibility of an illiquid market.
Futures contracts are valued at their quoted daily settlement prices. The aggregate principal amounts of the contracts are not recorded in the Statement of Net Assets. Fluctuations in the value of the contracts are recorded in the Statement of Net Assets as an asset (liability) and in the Statement of Operations as unrealized appreciation (depreciation) until the contracts are closed, when they are recorded as realized futures gains (losses).
23
Morgan Growth Fund
During the six months ended March 31, 2013, the fund’s average investment in long futures contracts represented less than 1% of net assets, based on quarterly average aggregate settlement values.
4. Repurchase Agreements: The fund may enter into repurchase agreements. Securities pledged as collateral for repurchase agreements are held by a custodian bank until the agreements mature. Each agreement requires that the market value of the collateral be sufficient to cover payments of interest and principal. In the event of default or bankruptcy by the other party to the agreement, the fund may sell or retain the collateral; however, such action may be subject to legal proceedings.
5. Federal Income Taxes: The fund intends to continue to qualify as a regulated investment company and distribute all of its taxable income. Management has analyzed the fund’s tax positions taken for all open federal income tax years (September 30, 2009–2012), and for the period ended March 31, 2013, and has concluded that no provision for federal income tax is required in the fund’s financial statements.
6. Distributions: Distributions to shareholders are recorded on the ex-dividend date.
7. Security Lending: The fund may lend its securities to qualified institutional borrowers to earn additional income. Security loans are required to be secured at all times by collateral at least equal to the market value of securities loaned. Daily market fluctuations could cause the value of loaned securities to be more or less than the value of the collateral received. When this occurs, the collateral is adjusted on the next business day. The fund invests cash collateral received in Vanguard Market Liquidity Fund, and records a liability for the return of the collateral, during the period the securities are on loan. Security lending income represents fees charged to borrowers plus income earned on investing cash collateral, less expenses associated with the loan.
8. Other: Dividend income is recorded on the ex-dividend date. Interest income includes income distributions received from Vanguard Market Liquidity Fund and is accrued daily. Security transactions are accounted for on the date securities are bought or sold. Costs used to determine realized gains (losses) on the sale of investment securities are those of the specific securities sold.
Each class of shares has equal rights as to assets and earnings, except that each class separately bears certain class-specific expenses related to maintenance of shareholder accounts (included in Management and Administrative expenses) and shareholder reporting. Marketing and distribution expenses are allocated to each class of shares based on a method approved by the board of trustees. Income, other non-class-specific expenses, and gains and losses on investments are allocated to each class of shares based on its relative net assets.
B. Wellington Management Company, LLP, Jennison Associates LLC, Frontier Capital Management Co., LLC, and Kalmar Investment Advisers each provide investment advisory services to a portion of the fund for a fee calculated at an annual percentage rate of average net assets managed by the advisor. The basic fee of Wellington Management Company, LLP, is subject to quarterly adjustments based on performance for the preceding three years relative to the Russell 3000 Growth Index. The basic fee of Jennison Associates LLC is subject to quarterly adjustments based on performance for the preceding three years relative to the Russell 1000 Growth Index. The basic fees of Frontier Capital Management Co., LLC, and Kalmar Investment Advisers are subject to quarterly adjustments based on performance for the preceding three years relative to the Russell Midcap Growth Index.
24
Morgan Growth Fund
The Vanguard Group provides investment advisory services to a portion of the fund on an at-cost basis; the fund paid Vanguard advisory fees of $400,000 for the six months ended March 31, 2013.
For the six months ended March 31, 2013, the aggregate investment advisory fee represented an effective annual basic rate of 0.17% of the fund’s average net assets, before a decrease of $1,886,000 (0.04%) based on performance.
C. The Vanguard Group furnishes at cost corporate management, administrative, marketing, and distribution services. The costs of such services are allocated to the fund under methods approved by the board of trustees. The fund has committed to provide up to 0.40% of its net assets in capital contributions to Vanguard. At March 31, 2013, the fund had contributed capital of $1,160,000 to Vanguard (included in Other Assets), representing 0.01% of the fund’s net assets and 0.46% of Vanguard’s capitalization. The fund’s trustees and officers are also directors and officers of Vanguard.
D. The fund has asked its investment advisors to direct certain security trades, subject to obtaining the best price and execution, to brokers who have agreed to rebate to the fund part of the commissions generated. Such rebates are used solely to reduce the fund’s management and administrative expenses. For the six months ended March 31, 2013, these arrangements reduced the fund’s expenses by $114,000 (an annual rate of 0.00% of average net assets).
E. Various inputs may be used to determine the value of the fund’s investments. These inputs are summarized in three broad levels for financial statement purposes. The inputs or methodologies used to value securities are not necessarily an indication of the risk associated with investing in those securities.
Level 1—Quoted prices in active markets for identical securities.
Level 2—Other significant observable inputs (including quoted prices for similar securities, interest rates, prepayment speeds, credit risk, etc.).
Level 3—Significant unobservable inputs (including the fund’s own assumptions used to determine the fair value of investments).
The following table summarizes the market value of the fund’s investments as of March 31, 2013, based on the inputs used to value them:
| | | |
| | Level 1 | Level 2 | Level 3 |
| Investments | ($000) | ($000) | ($000) |
| Common Stocks | 9,091,675 | 31,371 | — |
| Temporary Cash Investments | 241,735 | 14,199 | — |
| Futures Contracts—Assets1 | 438 | — | — |
| Futures Contracts—Liabilities1 | (16) | — | — |
| Total | 9,333,832 | 45,570 | — |
| 1 Represents variation margin on the last day of the reporting period. |
25
Morgan Growth Fund
F. At March 31, 2013, the aggregate settlement value of open futures contracts and the related unrealized appreciation (depreciation) were:
| | | | |
| | | | | ($000) |
| | | | Aggregate | |
| | | Number of | Settlement | Unrealized |
| | | Long (Short) | Value | Appreciation |
| Futures Contracts | Expiration | Contracts | Long (Short) | (Depreciation) |
| S&P 500 Index | June 2013 | 204 | 79,698 | 1,071 |
| E-mini S&P 500 Index | June 2013 | 357 | 27,894 | 219 |
Unrealized appreciation (depreciation) on open futures contracts is required to be treated as realized gain (loss) for tax purposes.
G. Distributions are determined on a tax basis and may differ from net investment income and realized capital gains for financial reporting purposes. Differences may be permanent or temporary. Permanent differences are reclassified among capital accounts in the financial statements to reflect their tax character. Temporary differences arise when certain items of income, expense, gain, or loss are recognized in different periods for financial statement and tax purposes; these differences will reverse at some time in the future. Differences in classification may also result from the treatment of short-term gains as ordinary income for tax purposes.
During the six months ended March 31, 2013, the fund realized net foreign currency gains of $11,000, which increased distributable net income for tax purposes; accordingly, such gains have been reclassified from accumulated net realized gains to overdistributed net investment income.
The fund’s tax-basis capital gains and losses are determined only at the end of each fiscal year. For tax purposes, at September 30, 2012, the fund had available capital losses totaling $621,698,000 to offset future net capital gains. Of this amount, $578,633,000 is subject to expiration on September 30, 2018. Capital losses of $43,065,000 realized beginning in fiscal 2012 may be carried forward indefinitely under the Regulated Investment Company Modernization Act of 2010, but must be used before any expiring loss carryforwards. The fund will use these capital losses to offset net taxable capital gains, if any, realized during the year ending September 30, 2013; should the fund realize net capital losses for the year, the losses will be added to the loss carryforward balance above.
At March 31, 2013, the cost of investment securities for tax purposes was $7,327,669,000. Net unrealized appreciation of investment securities for tax purposes was $2,051,311,000, consisting of unrealized gains of $2,193,793,000 on securities that had risen in value since their purchase and $142,482,000 in unrealized losses on securities that had fallen in value since their purchase.
H. During the six months ended March 31, 2013, the fund purchased $2,709,450,000 of investment securities and sold $3,074,533,000 of investment securities, other than temporary cash investments.
26
Morgan Growth Fund
I. Capital share transactions for each class of shares were:
| | | | |
| | Six Months Ended | | Year Ended |
| | March 31, 2013 | September 30, 2012 |
| | Amount | Shares | Amount | Shares |
| | ($000) | (000) | ($000) | (000) |
| Investor Shares | | | | |
| Issued | 151,062 | 7,432 | 640,625 | 33,948 |
| Issued in Lieu of Cash Distributions | 49,772 | 2,519 | 29,253 | 1,660 |
| Redeemed | (694,965) | (34,209) | (1,678,555) | (87,305) |
| Net Increase (Decrease) —Investor Shares | (494,131) | (24,258) | (1,008,677) | (51,697) |
| Admiral Shares | | | | |
| Issued | 532,038 | 8,469 | 1,064,733 | 17,636 |
| Issued in Lieu of Cash Distributions | 39,037 | 638 | 17,720 | 324 |
| Redeemed | (413,203) | (6,522) | (594,526) | (10,104) |
| Net Increase (Decrease)—Admiral Shares | 157,872 | 2,585 | 487,927 | 7,856 |
J. In preparing the financial statements as of March 31, 2013, management considered the impact of subsequent events for potential recognition or disclosure in these financial statements.
27
About Your Fund’s Expenses
As a shareholder of the fund, you incur ongoing costs, which include costs for portfolio management, administrative services, and shareholder reports (like this one), among others. Operating expenses, which are deducted from a fund’s gross income, directly reduce the investment return of the fund.
A fund’s expenses are expressed as a percentage of its average net assets. This figure is known as the expense ratio. The following examples are intended to help you understand the ongoing costs (in dollars) of investing in your fund and to compare these costs with those of other mutual funds. The examples are based on an investment of $1,000 made at the beginning of the period shown and held for the entire period.
The accompanying table illustrates your fund’s costs in two ways:
• Based on actual fund return. This section helps you to estimate the actual expenses that you paid over the period. The ”Ending Account Value“ shown is derived from the fund‘s actual return, and the third column shows the dollar amount that would have been paid by an investor who started with $1,000 in the fund. You may use the information here, together with the amount you invested, to estimate the expenses that you paid over the period.
To do so, simply divide your account value by $1,000 (for example, an $8,600 account value divided by $1,000 = 8.6), then multiply the result by the number given for your fund under the heading ”Expenses Paid During Period.“
• Based on hypothetical 5% yearly return. This section is intended to help you compare your fund‘s costs with those of other mutual funds. It assumes that the fund had a yearly return of 5% before expenses, but that the expense ratio is unchanged. In this case—because the return used is not the fund’s actual return—the results do not apply to your investment. The example is useful in making comparisons because the Securities and Exchange Commission requires all mutual funds to calculate expenses based on a 5% return. You can assess your fund’s costs by comparing this hypothetical example with the hypothetical examples that appear in shareholder reports of other funds.
Note that the expenses shown in the table are meant to highlight and help you compare ongoing costs only and do not reflect transaction costs incurred by the fund for buying and selling securities. Further, the expenses do not include any purchase, redemption, or account service fees described in the fund prospectus. If such fees were applied to your account, your costs would be higher. Your fund does not carry a “sales load.”
The calculations assume no shares were bought or sold during the period. Your actual costs may have been higher or lower, depending on the amount of your investment and the timing of any purchases or redemptions.
You can find more information about the fund’s expenses, including annual expense ratios, in the Financial Statements section of this report. For additional information on operating expenses and other shareholder costs, please refer to your fund’s current prospectus.
28
| | | |
| Six Months Ended March 31, 2013 | | | |
| | Beginning | Ending | Expenses |
| | Account Value | Account Value | Paid During |
| Morgan Growth Fund | 9/30/2012 | 3/31/2013 | Period |
| Based on Actual Fund Return | | | |
| Investor Shares | $1,000.00 | $1,079.03 | $2.02 |
| Admiral Shares | 1,000.00 | 1,079.93 | 1.30 |
| Based on Hypothetical 5% Yearly Return | | | |
| Investor Shares | $1,000.00 | $1,022.99 | $1.97 |
| Admiral Shares | 1,000.00 | 1,023.68 | 1.26 |
The calculations are based on expenses incurred in the most recent six-month period. The fund’s annualized six-month expense ratios for that period are 0.39% for Investor Shares and 0.25% for Admiral Shares. The dollar amounts shown as “Expenses Paid” are equal to the annualized expense ratio multiplied by the average account value over the period, multiplied by the number of days in the most recent six-month period, then divided by the number of days in the most recent 12-month period.
29
Trustees Approve Advisory Arrangements
The board of trustees of Vanguard Morgan Growth Fund has renewed the fund’s investment advisory arrangements with Frontier Capital Management Co., LLC (Frontier), Jennison Associates LLC (Jennison), Kalmar Investment Advisers (Kalmar), Wellington Management Company, LLP (Wellington Management), and The Vanguard Group, Inc. (Vanguard) (through its Equity Investment Group).
The board determined that the retention of the advisors was in the best interests of the fund and its shareholders.
The board based its decisions upon an evaluation of each advisor’s investment staff, portfolio management process, and performance. The trustees considered the factors discussed below, among others. However, no single factor determined whether the board approved the arrangements. Rather, it was the totality of the circumstances that drove the board’s decisions.
Nature, extent, and quality of services
The board considered the quality of the fund’s investment management services over both the short and long term, and took into account the organizational depth and stability of each advisor. The board noted the following:
Frontier. Frontier, founded in 1980, is known for a fundamental, research-intensive investment approach focused on small and midsized stocks. The firm seeks companies with a combination of superior growth potential and attractive valuation. Frontier’s investment process emphasizes companies with understandable business models, good franchises, accelerating sales and margins, and healthy balance sheets. Analysts regularly interact with management and other companies in the supply chain to effectively construct a portfolio of stocks for the fund. Frontier has managed a portion of the fund since 2008.
Jennison. Jennison, founded in 1969, is an indirect, wholly owned subsidiary of Prudential Financial, Inc. The firm currently oversees a wide range of equity and fixed income strategies. The investment team at Jennison Associates uses internal fundamental research and a highly interactive bottom-up stock selection process to identify companies that exhibit above-average growth in units, revenues, earnings, and cash flows. When evaluating a company for purchase or sale, the analysis focuses on the duration of the growth opportunity and seeks to capture inflection points in the company’s growth. Jennison has managed a portion of the fund since 2007.
Kalmar. Kalmar, together with its parent company, Kalmar Investments Inc., founded in 1982, specializes in small- and mid-capitalization growth stocks. Kalmar is a research-driven investment firm that is entirely focused on the management of “growth with value” small- and mid-cap equity portfolios. Kalmar believes that there is a high-reward/low-risk anomaly offered by the equity market in the stocks of solid, well-managed, rapidly growing smaller companies. Through independent fundamental research, Kalmar attempts to discover such companies, buy them at undervalued levels, and own them for the longer term. Kalmar has managed a portion of the fund since 2008.
Wellington Management. Wellington Management, founded in 1928, is among the nation’s oldest and most respected institutional investment managers. The investment team at Wellington Management uses traditional methods of stock selection to identify companies that it believes have above-average growth prospects, particularly those in industries undergoing change. Research focuses on large- and mid-capitalization companies with a proven record of sales and earnings growth, profitability, and cash-flow generation. Wellington Management has advised the fund since 1968.
30
Vanguard. Vanguard has been managing investments for more than three decades. The Equity Investment Group adheres to a sound, disciplined investment management process; the team has considerable experience, stability, and depth. Vanguard has managed a portion of the fund since 1993.
The board concluded that each advisor’s experience, stability, depth, and performance, among other factors, warranted continuation of the advisory arrangements.
Investment performance
The board considered the short- and long-term performance of the fund and each advisor, including any periods of outperformance or underperformance relative to a benchmark index and peer group. The board concluded that the performance was such that each advisory arrangement should continue. Information about the fund’s most recent performance can be found in the Performance Summary section of this report.
Cost
The board concluded that the fund’s expense ratio was well below the average expense ratio charged by funds in its peer group and that the fund’s advisory fee rate was also well below its peer-group average. Information about the fund’s expenses appears in the About Your Fund’s Expenses section of this report as well as in the Financial Statements section, which also includes information about the fund’s advisory fee rate.
The board did not consider profitability of Frontier, Jennison, Kalmar, and Wellington Management in determining whether to approve the advisory fees, because the firms are independent of Vanguard and the advisory fees are the result of arm’s-length negotiations. The board does not conduct a profitability analysis of Vanguard, because of Vanguard’s unique “at-cost” structure. Unlike most other mutual fund management companies, Vanguard is owned by the funds it oversees, and produces “profits” only in the form of reduced expenses for fund shareholders.
The benefit of economies of scale
The board concluded that the fund’s shareholders benefit from economies of scale because of breakpoints in the advisory fee schedules for Frontier, Jennison, Kalmar, and Wellington Management. The breakpoints reduce the effective rate of the fees as the fund’s assets managed by each advisor increase. The board also concluded that the fund’s at-cost arrangement with Vanguard ensures that the fund will realize economies of scale as it grows, with the cost to shareholders declining as fund assets managed by Vanguard increase.
The board will consider whether to renew the advisory arrangements again after a one-year period.
31
Glossary
30-Day SEC Yield. A fund’s 30-day SEC yield is derived using a formula specified by the U.S. Securities and Exchange Commission. Under the formula, data related to the fund’s security holdings in the previous 30 days are used to calculate the fund’s hypothetical net income for that period, which is then annualized and divided by the fund’s estimated average net assets over the calculation period. For the purposes of this calculation, a security’s income is based on its current market yield to maturity (for bonds), its actual income (for asset-backed securities), or its projected dividend yield (for stocks). Because the SEC yield represents hypothetical annualized income, it will differ—at times significantly—from the fund’s actual experience. As a result, the fund’s income distributions may be higher or lower than implied by the SEC yield.
Beta. A measure of the magnitude of a fund’s past share-price fluctuations in relation to the ups and downs of a given market index. The index is assigned a beta of 1.00. Compared with a given index, a fund with a beta of 1.20 typically would have seen its share price rise or fall by 12% when the index rose or fell by 10%. For this report, beta is based on returns over the past 36 months for both the fund and the index. Note that a fund’s beta should be reviewed in conjunction with its R-squared (see definition). The lower the R-squared, the less correlation there is between the fund and the index, and the less reliable beta is as an indicator of volatility.
Dividend Yield. Dividend income earned by stocks, expressed as a percentage of the aggregate market value (or of net asset value, for a fund). The yield is determined by dividing the amount of the annual dividends by the aggregate value (or net asset value) at the end of the period. For a fund, the dividend yield is based solely on stock holdings and does not include any income produced by other investments.
Earnings Growth Rate. The average annual rate of growth in earnings over the past five years for the stocks now in a fund.
Equity Exposure. A measure that reflects a fund’s investments in stocks and stock futures. Any holdings in short-term reserves are excluded.
Expense Ratio. A fund’s total annual operating expenses expressed as a percentage of the fund’s average net assets. The expense ratio includes management and administrative expenses, but does not include the transaction costs of buying and selling portfolio securities.
Foreign Holdings. The percentage of a fund represented by securities or depositary receipts of companies based outside the United States.
Inception Date. The date on which the assets of a fund (or one of its share classes) are first invested in accordance with the fund’s investment objective. For funds with a subscription period, the inception date is the day after that period ends. Investment performance is measured from the inception date.
Median Market Cap. An indicator of the size of companies in which a fund invests; the midpoint of market capitalization (market price x shares outstanding) of a fund’s stocks, weighted by the proportion of the fund’s assets invested in each stock. Stocks representing half of the fund’s assets have market capitalizations above the median, and the rest are below it.
Price/Book Ratio. The share price of a stock divided by its net worth, or book value, per share. For a fund, the weighted average price/book ratio of the stocks it holds.
32
Price/Earnings Ratio. The ratio of a stock’s current price to its per-share earnings over the past year. For a fund, the weighted average P/E of the stocks it holds. P/E is an indicator of market expectations about corporate prospects; the higher the P/E, the greater the expectations for a company’s future growth.
R-Squared. A measure of how much of a fund’s past returns can be explained by the returns from the market in general, as measured by a given index. If a fund’s total returns were precisely synchronized with an index’s returns, its R-squared would be 1.00. If the fund’s returns bore no relationship to the index’s returns, its R-squared would be 0. For this report, R-squared is based on returns over the past 36 months for both the fund and the index.
Return on Equity. The annual average rate of return generated by a company during the past five years for each dollar of shareholder’s equity (net income divided by shareholder’s equity). For a fund, the weighted average return on equity for the companies whose stocks it holds.
Short-Term Reserves. The percentage of a fund invested in highly liquid, short-term securities that can be readily converted to cash.
Turnover Rate. An indication of the fund’s trading activity. Funds with high turnover rates incur higher transaction costs and may be more likely to distribute capital gains (which may be taxable to investors). The turnover rate excludes in-kind transactions, which have minimal impact on costs.
33
This page intentionally left blank.
This page intentionally left blank.
The People Who Govern Your Fund
The trustees of your mutual fund are there to see that the fund is operated and managed in your best interests since, as a shareholder, you are a part owner of the fund. Your fund’s trustees also serve on the board of directors of The Vanguard Group, Inc., which is owned by the Vanguard funds and provides services to them on an at-cost basis.
A majority of Vanguard’s board members are independent, meaning that they have no affiliation with Vanguard or the funds they oversee, apart from the sizable personal investments they have made as private individuals. The independent board members have distinguished backgrounds in business, academia, and public service. Each of the trustees and executive officers oversees 180 Vanguard funds.
The following table provides information for each trustee and executive officer of the fund. More information about the trustees is in the Statement of Additional Information, which can be obtained, without charge, by contacting Vanguard at 800-662-7447, or online at vanguard.com.
| |
| InterestedTrustee1 | and Delphi Automotive LLP (automotive components); |
| | Senior Advisor at New Mountain Capital; Trustee of |
| F. William McNabb III | The Conference Board. |
| Born 1957. Trustee Since July 2009. Chairman of the | |
| Board. Principal Occupation(s) During the Past Five | Amy Gutmann |
| Years: Chairman of the Board of The Vanguard Group, | Born 1949. Trustee Since June 2006. Principal |
| Inc., and of each of the investment companies served | Occupation(s) During the Past Five Years: President |
| by The Vanguard Group, since January 2010; Director | of the University of Pennsylvania; Christopher H. |
| of The Vanguard Group since 2008; Chief Executive | Browne Distinguished Professor of Political Science |
| Officer and President of The Vanguard Group and of | in the School of Arts and Sciences with secondary |
| each of the investment companies served by The | appointments at the Annenberg School for |
| Vanguard Group since 2008; Director of Vanguard | Communication and the Graduate School of Education |
| Marketing Corporation; Managing Director of The | of the University of Pennsylvania; Member of the |
| Vanguard Group (1995–2008). | National Commission on the Humanities and Social |
| | Sciences; Trustee of Carnegie Corporation of New |
| | York and of the National Constitution Center; Chair |
| IndependentTrustees | of the U. S. Presidential Commission for the Study |
| | of Bioethical Issues. |
| Emerson U. Fullwood | |
| Born 1948. Trustee Since January 2008. Principal | JoAnn Heffernan Heisen |
| Occupation(s) During the Past Five Years: Executive | Born 1950. Trustee Since July 1998. Principal |
| Chief Staff and Marketing Officer for North America | Occupation(s) During the Past Five Years: Corporate |
| and Corporate Vice President (retired 2008) of Xerox | Vice President and Chief Global Diversity Officer |
| Corporation (document management products and | (retired 2008) and Member of the Executive |
| services); Executive in Residence and 2010 | Committee (1997–2008) of Johnson & Johnson |
| Distinguished Minett Professor at the Rochester | (pharmaceuticals/medical devices/consumer |
| Institute of Technology; Director of SPX Corporation | products); Director of Skytop Lodge Corporation |
| (multi-industry manufacturing), the United Way of | (hotels), the University Medical Center at Princeton, |
| Rochester, Amerigroup Corporation (managed health | the Robert Wood Johnson Foundation, and the Center |
| care), the University of Rochester Medical Center, | for Talent Innovation; Member of the Advisory Board |
| Monroe Community College Foundation, and North | of the Maxwell School of Citizenship and Public Affairs |
| Carolina A&T University. | at Syracuse University. |
| |
| Rajiv L. Gupta | F. Joseph Loughrey |
| Born 1945. Trustee Since December 2001.2 | Born 1949. Trustee Since October 2009. Principal |
| Principal Occupation(s) During the Past Five Years: | Occupation(s) During the Past Five Years: President |
| Chairman and Chief Executive Officer (retired 2009) | and Chief Operating Officer (retired 2009) of Cummins |
| and President (2006–2008) of Rohm and Haas Co. | Inc. (industrial machinery); Chairman of the Board of |
| (chemicals); Director of Tyco International, Ltd. | Hillenbrand, Inc. (specialized consumer services); |
| (diversified manufacturing and services), Hewlett- | Director of SKF AB (industrial machinery), the Lumina |
| Packard Co. (electronic computer manufacturing), | |
| Foundation for Education, and Oxfam America; | Executive Officers | |
| Chairman of the Advisory Council for the College of | | |
| Arts and Letters and Member of the Advisory Board to | Glenn Booraem | |
| the Kellogg Institute for International Studies at the | Born 1967. Controller Since July 2010. Principal |
| University of Notre Dame. | Occupation(s) During the Past Five Years: Principal |
| | of The Vanguard Group, Inc.; Controller of each of |
| Mark Loughridge | the investment companies served by The Vanguard |
| Born 1953. Trustee Since March 2012. Principal | Group; Assistant Controller of each of the investment |
| Occupation(s) During the Past Five Years: Senior Vice | companies served by The Vanguard Group (2001–2010). |
| President and Chief Financial Officer at IBM (information | | |
| technology services); Fiduciary Member of IBM’s | Thomas J. Higgins | |
| Retirement Plan Committee. | Born 1957. Chief Financial Officer Since September |
| | 2008. Principal Occupation(s) During the Past Five |
| Scott C. Malpass | Years: Principal of The Vanguard Group, Inc.; Chief |
| Born 1962. Trustee Since March 2012. Principal | Financial Officer of each of the investment companies |
| Occupation(s) During the Past Five Years: Chief | served by The Vanguard Group; Treasurer of each of |
| Investment Officer and Vice President at the University | the investment companies served by The Vanguard |
| of Notre Dame; Assistant Professor of Finance at the | Group (1998–2008). | |
| Mendoza College of Business at Notre Dame; Member | | |
| of the Notre Dame 403(b) Investment Committee; | Kathryn J. Hyatt | |
| Director of TIFF Advisory Services, Inc. (investment | Born 1955. Treasurer Since November 2008. Principal |
| advisor); Member of the Investment Advisory | Occupation(s) During the Past Five Years: Principal of |
| Committees of the Financial Industry Regulatory | The Vanguard Group, Inc.; Treasurer of each of the |
| Authority (FINRA) and of Major League Baseball. | investment companies served by The Vanguard |
| | Group; Assistant Treasurer of each of the investment |
| André F. Perold | companies served by The Vanguard Group (1988–2008). |
| Born 1952. Trustee Since December 2004. Principal | | |
| Occupation(s) During the Past Five Years: George | Heidi Stam | |
| Gund Professor of Finance and Banking at the Harvard | Born 1956. Secretary Since July 2005. Principal |
| Business School (retired 2011); Chief Investment | Occupation(s) During the Past Five Years: Managing |
| Officer and Managing Partner of HighVista Strategies | Director of The Vanguard Group, Inc.; General Counsel |
| LLC (private investment firm); Director of Rand | of The Vanguard Group; Secretary of The Vanguard |
| Merchant Bank; Overseer of the Museum of Fine | Group and of each of the investment companies |
| Arts Boston. | served by The Vanguard Group; Director and Senior |
| | Vice President of Vanguard Marketing Corporation. |
| Alfred M. Rankin, Jr. | | |
| Born 1941. Trustee Since January 1993. Principal | | |
| Occupation(s) During the Past Five Years: Chairman, | Vanguard Senior ManagementTeam |
| President, and Chief Executive Officer of NACCO | Mortimer J. Buckley | Chris D. McIsaac |
| Industries, Inc. (housewares/lignite) and of Hyster-Yale | Kathleen C. Gubanich | Michael S. Miller |
| Materials Handling, Inc. (forklift trucks); Director of | Paul A. Heller | James M. Norris |
| the National Association of Manufacturers; Chairman | Martha G. King | Glenn W. Reed |
| of the Board of University Hospitals of Cleveland; | John T. Marcante | |
| Advisory Chairman of the Board of The Cleveland | | |
| Museum of Art. | |
| | |
| Peter F. Volanakis | Chairman Emeritus and Senior Advisor |
| Born 1955. Trustee Since July 2009. Principal | John J. Brennan |
| Occupation(s) During the Past Five Years: President | Chairman, 1996–2009 |
| and Chief Operating Officer (retired 2010) of Corning | Chief Executive Officer and President, 1996–2008 |
| Incorporated (communications equipment); Director | |
| of SPX Corporation (multi-industry manufacturing); | |
| Overseer of the Amos Tuck School of Business | Founder |
| Administration at Dartmouth College; Advisor to the | John C. Bogle |
| Norris Cotton Cancer Center. | Chairman and Chief Executive Officer, 1974–1996 |
1 Mr. McNabb is considered an “interested person,” as defined in the Investment Company Act of 1940, because he is an officer of the Vanguard funds.
2 December 2002 for Vanguard Equity Income Fund, Vanguard Growth Equity Fund, the Vanguard Municipal Bond Funds, and the Vanguard State Tax-Exempt Funds.
|  |
| P.O. Box 2600 |
| Valley Forge, PA 19482-2600 |
| |
Connect with Vanguard® > vanguard.com | |
| CFA® is a trademark owned by CFA Institute. |
Fund Information > 800-662-7447
Direct Investor Account Services > 800-662-2739
Institutional Investor Services > 800-523-1036
Text Telephone for People
With Hearing Impairment > 800-749-7273
This material may be used in conjunction
with the offering of shares of any Vanguard
fund only if preceded or accompanied by
the fund’s current prospectus.
All comparative mutual fund data are from Lipper Inc. or
Morningstar, Inc., unless otherwise noted.
You can obtain a free copy of Vanguard’s proxy voting
guidelines by visiting vanguard.com/proxyreporting or by
calling Vanguard at 800-662-2739. The guidelines are
also available from the SEC’s website, sec.gov. In
addition, you may obtain a free report on how your fund
voted the proxies for securities it owned during the 12
months ended June 30. To get the report, visit either
vanguard.com/proxyreporting or sec.gov.
You can review and copy information about your fund at
the SEC’s Public Reference Room in Washington, D.C. To
find out more about this public service, call the SEC at
202-551-8090. Information about your fund is also
available on the SEC’s website, and you can receive
copies of this information, for a fee, by sending a
request in either of two ways: via e-mail addressed to
publicinfo@sec.gov or via regular mail addressed to the
Public Reference Section, Securities and Exchange
Commission, Washington, DC 20549-1520. | |
| © 2013 The Vanguard Group, Inc.
All rights reserved.
Vanguard Marketing Corporation, Distributor.
Q262 052013 |
Item 2: Code of Ethics.
Not Applicable.
Item 3: Audit Committee Financial Expert.
Not Applicable.
Item 4: Principal Accountant Fees and Services.
Not Applicable.
Item 5: Audit Committee of Listed Registrants.
Not Applicable.
Item 6: Investments.
Not Applicable.
Item 7: Disclosure of Proxy Voting Policies and Procedures for Closed-End Management Investment Companies.
Not Applicable.
Item 8: Portfolio Managers of Closed-End Management Investment Companies.
Not Applicable.
Item 9: Purchase of Equity Securities by Closed-End Management Investment Company and Affiliated Purchasers.
Not Applicable.
Item 10: Submission of Matters to a Vote of Security Holders.
Not Applicable.
Item 11: Controls and Procedures.
(a) Disclosure Controls and Procedures. The Principal Executive and Financial Officers concluded that the Registrant’s Disclosure Controls and Procedures are effective based on their evaluation of the Disclosure Controls and Procedures as of a date within 90 days of the filing date of this report.
(b) Internal Control Over Financial Reporting. There were no significant changes in Registrant’s Internal Control Over Financial Reporting or in other factors that could significantly affect this control subsequent to the date of the evaluation, including any corrective actions with regard to significant deficiencies and material weaknesses.
Item 12: Exhibits.
(a) Certifications.
Pursuant to the requirements of the Securities Exchange Act of 1934 and the Investment Company Act of 1940, the registrant has duly caused this report to be signed on its behalf by the undersigned, thereunto duly authorized.
| |
| | VANGUARD MORGAN GROWTH FUND |
| |
| By: | /s/ F. WILLIAM MCNABB III* |
| | F. WILLIAM MCNABB III |
| | CHIEF EXECUTIVE OFFICER |
| |
| Date: May 17, 2013 |
Pursuant to the requirements of the Securities Exchange Act of 1934 and the Investment Company Act of 1940, this report has been signed below by the following persons on behalf of the registrant and in the capacities and on the dates indicated.
| |
| | VANGUARD MORGAN GROWTH FUND |
| |
| By: | /s/ F. WILLIAM MCNABB III* |
| | F. WILLIAM MCNABB III |
| | CHIEF EXECUTIVE OFFICER |
| |
| Date: May 17, 2013 |
| |
| | VANGUARD MORGAN GROWTH FUND |
| |
| By: | /s/ THOMAS J. HIGGINS* |
| | THOMAS J. HIGGINS |
| | CHIEF FINANCIAL OFFICER |
| |
| Date: May 17, 2013 |
* By: /s/ Heidi Stam
Heidi Stam, pursuant to a Power of Attorney filed on March 27, 2012 see file Number 2-11444, Incorporated by Reference.
