UNITED STATES
SECURITIES AND EXCHANGE COMMISSION
Washington, D.C. 20549
FORM N-CSR
CERTIFIED SHAREHOLDER REPORT
OF
REGISTERED MANAGEMENT INVESTMENT COMPANIES
Investment Company Act file number: 811-1685
Name of Registrant: Vanguard Morgan Growth Fund
Address of Registrant:
P.O. Box 2600
Valley Forge, PA 19482
Name and address of agent for service:
Heidi Stam, Esquire
P.O. Box 876
Valley Forge, PA 19482
Registrant’s telephone number, including area code: (610) 669-1000
Date of fiscal year end: September 30
Date of reporting period: October 1, 2007–March 31, 2008
Item 1: Reports to Shareholders |
> For the half-year ended March 31, 2008, the Investor Shares of Vanguard Morgan Growth Fund returned –12.5%.
> The fund lagged slightly behind its benchmark, which returned –11.2%, but outperformed its peer group, which averaged –13.2%.
> Heavy weightings in information technology, health care, and industrials hindered the fund’s returns for the period.
Contents |
|
|
|
Your Fund’s Total Returns | 1 |
Chairman’s Letter | 2 |
Advisors’ Report | 6 |
Fund Profile | 11 |
Performance Summary | 13 |
Financial Statements | 14 |
About Your Fund’s Expenses | 32 |
Trustees Approve Advisory Arrangements | 34 |
Glossary | 36 |
Please note: The opinions expressed in this report are just that—informed opinions. They should not be considered promises or advice. Also, please keep in mind that the information and opinions cover the period through the date on the cover of this report. Of course, the risks of investing in your fund are spelled out in the prospectus.
Your Fund’s Total Returns
Six Months Ended March 31, 2008 |
|
|
| Ticker | Total |
| Symbol | Returns |
Vanguard Morgan Growth Fund |
|
|
Investor Shares | VMRGX | –12.5% |
Admiral™ Shares1 | VMRAX | –12.4 |
Russell 3000 Growth Index |
| –11.2 |
Average Multi-Cap Growth Fund2 |
| –13.2 |
Your Fund’s Performance at a Glance | ||||
September 30, 2007–March 31, 2008 | ||||
|
|
| Distributions Per Share | |
| Starting | Ending | Income | Capital |
| Share Price | Share Price | Dividends | Gains |
Vanguard Morgan Growth Fund |
|
|
|
|
Investor Shares | $21.45 | $17.37 | $0.175 | $1.361 |
Admiral Shares | 66.58 | 53.90 | 0.641 | 4.220 |
1 A lower-cost class of shares available to many longtime shareholders and to those with significant investments in the fund.
2 Derived from data provided by Lipper Inc.
1

Chairman’s Letter
Dear Shareholder,
In a difficult environment, Vanguard Morgan Growth Fund’s Investor Shares returned –12.5% for the six months ended March 31, 2008. Although the fund fell short of its benchmark, it performed slightly better than its multi-cap growth fund peers. The fund’s returns, although negative, were generally in line with those of the broad stock market. During the period, consumer skepticism and rising oil prices weighed on the fund and the overall market.
Stocks of all sorts sank amid credit-market concerns
The broad U.S. stock market declined –12.4% for the six months ended March 31 as investor sentiment turned bearish amid fears of a U.S. recession, the weakening U.S. dollar, and the tightening of global credit markets in reaction to the subprime-mortgage crisis that began in midsummer 2007.
Large-capitalization stocks fared a bit better than small-caps, growth stocks generally outpaced their value-oriented counterparts, and international stocks again outperformed U.S. stocks over the six months; nonetheless, each stock group posted a negative return.
2
Bond markets were roiled by subprime-mortgage woes
Credit markets seized up as trouble spread from subprime-mortgage-backed securities to other issues. Investors flocked to higher-quality government and corporate bonds, driving U.S. Treasury bond prices higher.
Unlike stocks, the broad taxable bond market pushed forward, posting a total return of 5.2% for the fiscal half-year as lower interest rates depressed yields and bumped up prices. By contrast, tax-exempt municipal bonds returned only 0.7% as fixed income investors moved in droves to Treasuries in search of the highest-quality, most-liquid securities. This, combined with concerns about the financial strength of the insurers backing certain municipal bonds, pushed municipal yields above those of Treasuries.
In response to the tumult in the credit markets and the deteriorating economic outlook, the Federal Reserve Board reduced its target for the federal funds rate aggressively. The Fed continued a series of rate cuts that began late last summer, ending with a 0.75 percentage point cut in March. The target rate stood at 2.25% at the end of the period, the lowest level since early 2005.
A slow economy hindered fund performance
During the past six months, the Morgan Growth Fund’s decline of more than –12% was disappointing. On a relative basis,
Market Barometer |
|
|
|
|
| Total Returns | |
| Periods Ended March 31, 2008 | ||
| Six Months | One Year | Five Years1 |
Stocks |
|
|
|
Russell 1000 Index (Large-caps) | –12.4% | –5.4% | 11.9% |
Russell 2000 Index (Small-caps) | –14.0 | –13.0 | 14.9 |
Dow Jones Wilshire 5000 Index (Entire market) | –12.4 | –5.8 | 12.5 |
MSCI All Country World Index ex USA (International) | –9.6 | 2.6 | 24.0 |
|
|
|
|
|
|
|
|
Bonds |
|
|
|
Lehman U.S. Aggregate Bond Index (Broad taxable market) | 5.2% | 7.7% | 4.6% |
Lehman Municipal Bond Index | 0.7 | 1.9 | 3.9 |
Citigroup 3-Month Treasury Bill Index | 1.7 | 4.2 | 3.0 |
|
|
|
|
|
|
|
|
CPI |
|
|
|
Consumer Price Index | 2.4% | 4.0% | 3.0% |
1 Annualized.
3
however, this amounted to no more than modest underperformance of the fund’s benchmark, the Russell 3000 Growth Index. The fund’s four advisors—Wellington Management Company, Franklin Portfolio Associates, Jennison Associates, and Vanguard Quantitative Equity Group—rely on a mix of fundamental and quantitative investment styles to create a portfolio that seeks above-average growth potential for shareholders. Despite a weak six-month performance, the portfolio’s holdings remained consistent with that objective.
Information technology—the fund’s largest sector, with about 25% of the fund’s assets, on average—was dragged down during the six months by a weakening economy. Google returned –22% as a result of weak online advertising sales. Communications equipment company Cisco Systems fell –27% after a slowdown in sales. Holdings in Apple, Hewlett-Packard, and Microsoft, all down for the period, also impeded the fund’s returns.
In the health care industry, pharmaceuticals continued to suffer from a backlog in the FDA approval process along with other regulatory setbacks. Schering-Plough (–54%) and Merck (–25%), for example, faced questions regarding the effectiveness of Vytorin, a cholesterol-fighting drug. Managed health care companies also suffered during the period. However, some strong holdings in biotechnology and health care equipment—including Genentech, Gilead Sciences, and Intuitive Surgical—helped to limit health care’s negative impact on the fund.
A large stake in industrial stocks also hindered the fund’s performance. Holdings in Boeing and Precision Castparts, down –29% and –31%, respectively, negatively affected returns. Rising oil prices and
Annualized Expense Ratios1 |
|
|
|
Your Fund Compared With Its Peer Group |
|
|
|
|
|
| Average |
| Investor | Admiral | Multi-Cap |
| Shares | Shares | Growth Fund |
Morgan Growth Fund | 0.37% | 0.21% | 1.43% |
1 Fund expense ratios reflect the six months ended March 31, 2008. Peer-group expense ratio is derived from data provided by Lipper Inc. and captures information through year-end 2007.
4
slowed consumer spending took a toll on airline stocks, such as AMR and Continental Airlines. Commercial services, engineering, and machinery stocks were also down for the six-month period.
Two of the portfolio’s smaller sectors—consumer staples and materials—brought positive results during the fiscal half-year. The fund’s modest weighting in consumer discretionary stocks also proved beneficial.
During turbulent times, focus on long-term goals
The past six months have been a tough period for investments of all sorts, and Vanguard Morgan Growth Fund was no exception. However, it’s important to remember that for long-term investors, short-term performance is mostly just noise. We recommend that shareholders focus on investing for the long term and maintaining a well-diversified portfolio.
A balanced portfolio that includes stocks, bonds, and short-term reserves can provide some protection against the market’s volatility, while allowing you to participate in the long-term potential for growth in each asset class. As part of a well-diversified portfolio, Vanguard Morgan Growth Fund can help investors meet their long-term financial goals.
As I close this report to you, it’s my pleasure to introduce the fund’s new president, F. William McNabb III. Bill is a man of great character and integrity who is intimately familiar with all aspects of Vanguard—from how we serve our clients to how we invest for our clients.
Bill and I have worked together very closely for more than two decades. I’m thrilled that the fund’s board elected him president and designated him my successor as chief executive officer, a role he will assume within a year, after an orderly transition. Bill and the rest of our team will serve you and our other clients extremely well in the years ahead.
I would also like to thank John Cone, of Franklin Portfolio Associates, who has done an admirable job advising the Morgan Growth Fund since 1999. John plans to retire in July of this year, leaving Franklin’s portion of the portfolio in the capable hands of Oliver Buckley, Franklin’s chief investment officer.
Thank you for entrusting your assets to Vanguard.
Sincerely,

John J. Brennan
Chairman and Chief Executive Officer
April 11, 2008
5
Advisors’ Report
During the six months ended March 31, 2008, the Investor Shares of Vanguard Morgan Growth Fund returned –12.5%, while the Admiral Shares returned –12.4%. This performance reflects the combined efforts of your fund’s four independent advisors. The use of four advisors provides exposure to distinct, yet complementary, investment approaches, enhancing the fund’s diversification.
The advisors, the percentage of fund assets each manages, and brief descriptions of their investment strategies are presented in the table below. The advisors have also prepared a discussion of the investment environment that existed during the fiscal half-year and of how their portfolio positioning reflects this assessment.
Wellington Management Company, LLP
Portfolio Manager:
Paul E. Marrkand, CFA, Vice President
The weakening economy, deteriorating credit markets, and growing fear of a recession in the United States led to a decline in equity prices in the first half of the year. Concerns of spillover effects from the U.S. slowdown weighed on the rest of the developed markets, as European and Asian equities also declined, although not at the rate of the U.S. market.
6
Vanguard Morgan Growth Fund Investment Advisors | |||
|
|
|
|
| Fund Assets Managed |
| |
Investment Advisor | % | $ Million | Investment Strategy |
Wellington Management | 37 | 3,215 | Traditional methods of stock selection—research and |
Company, LLP |
|
| analysis—that identify companies believed to have |
|
|
| above-average growth prospects, particularly those in |
|
|
| industries undergoing change. Focuses on mid- and |
|
|
| large-capitalization companies with proven records |
|
|
| of sales and earnings growth, profitability, and cash- |
|
|
| flow generation. |
Vanguard Quantitative | 24 | 2,117 | Quantitative management using models that assess |
Equity Group |
|
| valuation, marketplace sentiment, and balance-sheet |
|
|
| characteristics of companies versus their peers. |
Franklin Portfolio | 22 | 1,946 | Quantitative management using a blend of valuation |
Associates, LLC |
|
| and growth/momentum factors to drive stock- |
|
|
| selection decisions for a mid-cap growth subportfolio. |
Jennison Associates LLC | 14 | 1,234 | Research-driven fundamental investment approach |
|
|
| that relies on in-depth company knowledge gleaned |
|
|
| through meetings with management, customers, |
|
|
| and suppliers. |
Cash Investments1 | 3 | 304 | — |
1 These short-term reserves are invested by Vanguard in equity index products to simulate investments in stocks. Each advisor also may maintain a modest cash position.
7
Stock selection was strong in the telecommunication services sector and in the energy sector, which continues to be an area of focus in our portfolio. Our energy holdings include XTO Energy, a rapidly growing U.S.-based natural gas and exploration company that continues to exceed investors’ expectations in its ability to increase its natural gas reserves. In telecommunications, we bought companies like Brasil Telecom, a regional provider of fixed line and wireless services that produced solid financial results primarily driven by its mobile division.
Selection in information technology, industrials, and health care detracted from results. Industrials holding Rockwell Collins, a major aerospace supplier specializing in avionics, suffered from delays in the Boeing 787 program, which caused investor concern and pressured the stock. Shares of Merck—a large U.S. pharmaceutical company with strong allergy, vaccine, diabetes, and cholesterol-fighting franchises—declined after disappointing data from clinical trials raised concerns regarding future growth for the cholesterol drug Vytorin.
Our purchases over the six months were driven by valuation and growth opportunities. New names included Caterpillar, a dominant heavy-equipment manufacturer and leading global mining equipment producer, and Intuitive
Surgical, a robotic-based medical device company focused on prostate and hysterectomy procedures.
We eliminated holdings in NVIDIA, Wyeth, and Bristol-Myers Squibb. At the end of the period, the portfolio’s largest sector positions were in the technology, industrials, and health care sectors.
Vanguard Quantitative Equity Group
Portfolio Manager:
James P. Stetler, Principal
The six-month period ended March 31, 2008, was a difficult time for equity markets, both in the United States and abroad. The U.S. market, as measured by the Russell 3000 Index, was down –12.5%. The over-all decline in the market represented the largest six-month drop since September 2002, when the market fell –28%.
As we’ve described in previous reports to you, our evaluation process uses three independent and distinct stock-selection models to rank companies on their relative valuation, market sentiment, and earnings-quality characteristics. All three evaluation models can either enhance or detract from the portfolio’s results. For this reporting period, both the market sentiment and earnings-quality models failed to add value to our results; the valuation model was the lone positive contributor.
8
Looking within sectors, our stock selections were strongest in technology and health care. Those results were diminished by weak stock selection within the energy and industrial sectors.
Despite our results for this period, we remain confident in our investment process. The portfolio that results from our stock-evaluation models and risk-control process has attractive valuation, profitability, and earnings-growth characteristics relative to the benchmark. We thank you for your trust, and look forward to the remainder of the fiscal year.
Franklin Portfolio Associates, LLC
Portfolio Manager:
John S. Cone, CFA
Our portfolio’s performance was strong over the last three months of the period, but not strong enough to overcome weakness in the first three months. Our stock-selection process tends to result in a portfolio tilted toward stocks with positive momentum (near-term price and earnings growth momentum) and positive valuation (lower price-to-earnings ratios) relative to the Russell Midcap Growth Index. During this period, the tilt toward compelling valuation was severely penalized.
Results for the six months benefited from strong stock selection in technology, including MEMC Electronic Materials (silicon wafers for the semiconductor business), Western Digital (hard disk drives), and Microchip Technology (microcontrollers and other semiconductor products). Other winners included TJX Companies (clothing retailer) and Owens-Illinois (plastic and glass packaging).
Poor stock selection, especially in health care and financial services, hindered performance over the period. Holdings that reduced returns included WellCare Health Plans (a managed-care provider focused on government programs) and First Marblehead (outsourcing services for private education lending). Additional underperformers included National Oilwell Varco (oil services), Wynn Resorts (hotel resorts), and Thomas & Betts (electronic connectors and components).
9
Jennison Associates LLC
Portfolio Manager:
Kathleen A. McCarragher,
Managing Director
We build our portfolio from the bottom up, based on our research of individual company fundamentals. Stock selection in health care contributed most to relative returns for the period, as Gilead Sciences and Genentech advanced. Gilead is solidifying its dominant position in AIDS therapeutics, helping to fund the development of pipeline products. Genentech’s best-selling drug Avastin was approved to treat breast cancer by the FDA. The company could benefit further as data from studies on Avastin in ovarian, prostate, pancreatic, and renal cancers start to come in.
In materials, Monsanto and Potash posted double-digit gains. Monsanto is profiting from a bullish agriculture cycle supported by its leading market position, brand strength, operational performance, and technological innovation. Potash, the world’s largest producer of potash fertilizer, has benefited from increased global demand. As a top performer in consumer discretionary, NIKE is executing well and should gain from solid growth prospects, product and geographic diversification, a strong balance sheet, and healthy cash flow.
During the six months, technology holdings detracted most from return. Research In Motion rose on the strength of its BlackBerry brand, as new subscribers grew at a solid pace and existing users embraced new product designs. However, Google fell on slowing growth in total paid clicks, and Cisco declined on scaled-back growth prospects. Energy holdings also hurt returns: Schlumberger slid after missing earnings projections for the first time in recent memory, and Marathon Oil fell after lowering its forecast for production and reserve growth.
We remain focused on our holdings’ prospects for generating profits and cash flow. Although the slowdown in global economic growth has prompted us to cut earnings projections for some companies in the portfolio, we believe the names we own are well-capitalized and capable of generating earnings-per-share growth at a healthy premium to market averages.
10
Fund Profile
As of March 31, 2008
Portfolio Characteristics |
|
| |
|
| Comparative | Broad |
| Fund | Index1 | Index2 |
Number of Stocks | 350 | 1,936 | 4,811 |
Median Market Cap | $25.7B | $31.8B | $33.8B |
Price/Earnings Ratio | 17.8x | 18.9x | 16.9x |
Price/Book Ratio | 3.5x | 3.6x | 2.4x |
Yield3 |
| 1.2% | 2.0% |
Investor Shares | 0.8% |
|
|
Admiral Shares | 0.9% |
|
|
Return on Equity | 21.0% | 21.7% | 19.5% |
Earnings Growth Rate | 24.9% | 22.3% | 20.0% |
Foreign Holdings | 6.9% | 0.0% | 0.0% |
Turnover Rate | 93%4 | — | — |
Expense Ratio |
| — | — |
Investor Shares | 0.37%4 |
|
|
Admiral Shares | 0.21%4 |
|
|
Short-Term Reserves | 0.6% | — | — |
Sector Diversification (% of equity exposure) | |||
|
| Comparative | Broad |
| Fund | Index1 | Index2 |
Consumer Discretionary | 10.3% | 11.7% | 9.4% |
Consumer Staples | 7.9 | 10.6 | 9.6 |
Energy | 9.9 | 9.1 | 12.7 |
Financials | 5.7 | 6.7 | 17.7 |
Health Care | 15.3 | 15.8 | 11.7 |
Industrials | 15.6 | 13.7 | 12.2 |
Information Technology | 27.2 | 26.6 | 15.6 |
Materials | 5.2 | 3.7 | 4.1 |
Telecommunication |
|
|
|
Services | 1.6 | 0.7 | 3.1 |
Utilities | 1.3 | 1.4 | 3.9 |
Volatility Measures5 |
| |
| Fund Versus | Fund Versus |
| Comparative Index1 | Broad Index2 |
R-Squared | 0.95 | 0.91 |
Beta | 1.02 | 1.10 |
11
Ten Largest Holdings6 (% of total net assets) | ||
|
|
|
Microsoft Corp. | software systems | 3.1% |
Cisco Systems, Inc. | communication |
|
| equipment | 2.4 |
Oracle Corp. | systems software | 1.8 |
PepsiCo, Inc. | soft drinks | 1.6 |
The Boeing Co. | aerospace and |
|
| defense | 1.4 |
Apple Inc. | computer hardware | 1.3 |
Hewlett-Packard Co. | computer hardware | 1.2 |
Merck & Co., Inc. | pharmaceuticals | 1.2 |
Intel Corp. | semiconductors | 1.1 |
Abbott Laboratories | pharmaceuticals | 1.1 |
Top Ten |
| 16.2% |
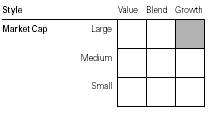
Investment Focus
1 Russell 3000 Growth Index.
2 Dow Jones Wilshire 5000 Index.
3 30-day SEC yield for the fund; annualized dividend yield for the indexes. See the Glossary on pages 36-37.
4 Annualized.
5 For an explanation of R-squared, beta, and other terms used here, see the Glossary on pages 36-37.
6 The holdings listed exclude any temporary cash investments and equity index products.
12
Performance Summary
All of the returns in this report represent past performance, which is not a guarantee of future results that may be achieved by the fund. (Current performance may be lower or higher than the performance data cited. For performance data current to the most recent month-end, visit our website at www.vanguard.com/performance.) Note, too, that both investment returns and principal value can fluctuate widely, so an investor’s shares, when sold, could be worth more or less than their original cost. The returns shown do not reflect taxes that a shareholder would pay on fund distributions or on the sale of fund shares.
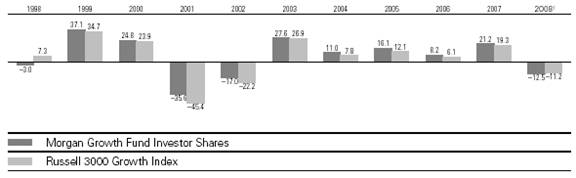
Fiscal-Year Total Returns (%): September 30, 1997–March 31, 2008
Average Annual Total Returns: Periods Ended March 31, 2008 | ||||
|
|
|
|
|
| Inception Date | One Year | Five Years | Ten Years |
Investor Shares2 | 12/31/1968 | –2.52% | 12.40% | 4.02% |
Admiral Shares | 5/14/2001 | –2.33 | 12.58 | 3.283 |
1 Six months ended March 31, 2008.
2 Total returns do not include the account service fee that may be applicable to certain accounts with balances below $10,000.
3 Return since inception.
Note: See Financial Highlights tables on pages 26 and 27 for dividend and capital gains information.
13
Financial Statements (unaudited)
Statement of Net Assets
As of March 31, 2008
The fund provides a complete list of its holdings four times in each fiscal year, at the quarter-ends. For the second and fourth fiscal quarters, the lists appear in the fund’s semiannual and annual reports to shareholders. For the first and third fiscal quarters, the fund files the lists with the Securities and Exchange Commission on Form N-Q. Shareholders can look up the fund’s Forms N-Q on the SEC’s website at www.sec.gov. Forms N-Q may also be reviewed and copied at the SEC’s Public Reference Room (see the back cover of this report for further information).
|
|
| Market |
|
|
| Value• |
|
| Shares | ($000) |
Common Stocks (95.7%)1 |
|
| |
Consumer Discretionary (9.8%) |
|
| |
| NIKE, Inc. Class B | 1,231,100 | 83,715 |
| The Walt Disney Co. | 1,876,600 | 58,888 |
* | Viacom Inc. Class B | 1,290,500 | 51,130 |
| TJX Cos., Inc. | 1,299,000 | 42,958 |
* | GameStop Corp. Class A | 634,800 | 32,826 |
* | AutoZone Inc. | 270,600 | 30,802 |
* | Amazon.com, Inc. | 389,000 | 27,736 |
| Abercrombie & Fitch Co. | 377,300 | 27,596 |
| Sherwin-Williams Co. | 539,400 | 27,531 |
| Tiffany & Co. | 648,300 | 27,125 |
| Burger King Holdings Inc. | 912,700 | 25,245 |
| Yum! Brands, Inc. | 640,700 | 23,840 |
| International Game |
|
|
| Technology | 504,300 | 20,278 |
| Hasbro, Inc. | 713,400 | 19,904 |
| American Eagle |
|
|
| Outfitters, Inc. | 1,078,200 | 18,879 |
* | Expedia, Inc. | 819,221 | 17,933 |
| RadioShack Corp. | 1,098,900 | 17,857 |
| Garmin Ltd. | 304,700 | 16,457 |
* | The Goodyear Tire & |
|
|
| Rubber Co. | 626,900 | 16,174 |
| Regal Entertainment Group |
|
|
| Class A | 817,600 | 15,772 |
| Target Corp. | 297,200 | 15,062 |
| Comcast Corp. Class A | 749,126 | 14,488 |
| Mattel, Inc. | 654,700 | 13,029 |
| Johnson Controls, Inc. | 384,300 | 12,989 |
| Wyndham Worldwide Corp. | 618,600 | 12,793 |
| Wynn Resorts Ltd. | 124,800 | 12,560 |
| McDonald’s Corp. | 214,400 | 11,957 |
| Sotheby’s | 399,900 | 11,561 |
| Omnicom Group Inc. | 250,100 | 11,049 |
* | DreamWorks Animation |
|
|
| SKG, Inc. | 410,000 | 10,570 |
14
| Darden Restaurants Inc. | 319,800 | 10,409 |
| Best Buy Co., Inc. | 239,450 | 9,928 |
| Starwood Hotels & |
|
|
| Resorts Worldwide, Inc. | 189,900 | 9,827 |
| Ctrip.com International Ltd. | 180,300 | 9,560 |
| Meredith Corp. | 244,200 | 9,341 |
| Lowe’s Cos., Inc. | 391,200 | 8,974 |
| News Corp., Class A | 471,500 | 8,841 |
* | Discovery Holding Co. |
|
|
| Class A | 381,300 | 8,091 |
| Gentex Corp. | 440,600 | 7,556 |
* | Hanesbrands Inc. | 235,300 | 6,871 |
* | DISH Network Corp. | 224,700 | 6,456 |
* | Dollar Tree,Inc. | 228,200 | 6,296 |
| Comcast Corp. Special |
|
|
| Class A | 321,034 | 6,090 |
| Autoliv, Inc. | 93,500 | 4,694 |
* | Liberty Media Corp. | 160,800 | 3,641 |
* | DIRECTV Group, Inc. | 138,326 | 3,429 |
* | ITT Educational Services, Inc. | 72,000 | 3,307 |
| News Corp., Class B | 143,400 | 2,730 |
* | NVR, Inc. | 3,500 | 2,091 |
| Time Warner, Inc. | 141,900 | 1,989 |
* | Apollo Group, Inc. Class A | 45,000 | 1,944 |
* | CTC Media, Inc. | 59,800 | 1,659 |
* | Ford Motor Co. | 249,900 | 1,429 |
* | Crocs, Inc. | 81,400 | 1,422 |
* | Las Vegas Sands Corp. | 8,400 | 619 |
* | MGM Mirage, Inc. | 9,251 | 544 |
|
|
| 866,442 |
Consumer Staples (7.4%) |
|
| |
| PepsiCo, Inc. | 1,993,300 | 143,916 |
| Costco Wholesale Corp. | 915,099 | 59,454 |
| Philip Morris |
|
|
| Internaltional Inc. | 1,167,600 | 59,057 |
| Colgate-Palmolive Co. | 662,200 | 51,592 |
| The Coca-Cola Co. | 775,278 | 47,191 |
| Wal-Mart Stores, Inc. | 828,700 | 43,656 |
| The Procter & Gamble Co. | 541,575 | 37,948 |
| CVS/Caremark Corp. | 917,510 | 37,168 |
| Altria Group, Inc. | 1,167,600 | 25,921 |
| Church & Dwight, Inc. | 396,100 | 21,484 |
| The Pepsi Bottling Group, Inc. | 583,100 | 19,773 |
| The Kroger Co. | 761,900 | 19,352 |
| Herbalife Ltd. | 357,100 | 16,962 |
| McCormick & Co., Inc. | 446,100 | 16,492 |
| Walgreen Co. | 257,000 | 9,789 |
| Anheuser-Busch Cos., Inc. | 206,152 | 9,782 |
| Archer-Daniels-Midland Co. | 234,867 | 9,667 |
| ^Whole Foods Market, Inc. | 275,200 | 9,073 |
| Carolina Group | 102,300 | 7,422 |
*^Bare Escentuals, Inc. | 118,100 | 2,766 | |
| The Estee Lauder Cos. Inc. |
|
|
| Class A | 39,300 | 1,802 |
* | Hansen Natural Corp. | 39,300 | 1,387 |
15
| Sysco Corp. | 18,100 | 525 |
|
|
| 652,179 |
Energy (9.4%) |
|
| |
| Diamond Offshore |
|
|
| Drilling, Inc. | 688,800 | 80,176 |
* | National Oilwell Varco Inc. | 1,354,200 | 79,058 |
* | Transocean, Inc. | 536,007 | 72,468 |
| Schlumberger Ltd. | 794,200 | 69,095 |
| XTO Energy, Inc. | 1,056,402 | 65,349 |
| Chesapeake Energy Corp. | 1,159,900 | 53,529 |
| Smith International, Inc. | 620,800 | 39,874 |
| Occidental Petroleum Corp. | 452,900 | 33,139 |
| Williams Cos., Inc. | 882,000 | 29,088 |
* | Forest Oil Corp. | 525,500 | 25,728 |
* | FMC Technologies Inc. | 437,300 | 24,878 |
| Marathon Oil Corp. | 522,100 | 23,808 |
| Holly Corp. | 523,500 | 22,725 |
* | Compagnie Generale de |
|
|
| Geophysique SA ADR | 393,400 | 19,477 |
| Peabody Energy Corp. | 377,700 | 19,263 |
| ConocoPhillips Co. | 236,900 | 18,054 |
| Frontier Oil Corp. | 539,600 | 14,709 |
| Chevron Corp. | 158,500 | 13,530 |
* | Global Industries Ltd. | 721,000 | 11,601 |
* | Southwestern Energy Co. | 343,800 | 11,583 |
| Noble Corp. | 231,606 | 11,504 |
| ENSCO International, Inc. | 160,751 | 10,066 |
| Murphy Oil Corp. | 109,000 | 8,953 |
* | Pride International, Inc. | 253,800 | 8,870 |
| Halliburton Co. | 223,500 | 8,790 |
| Valero Energy Corp. | 151,400 | 7,435 |
| Rowan Cos., Inc. | 175,300 | 7,219 |
| Sunoco, Inc. | 122,600 | 6,433 |
| Patterson-UTI Energy, Inc. | 237,017 | 6,205 |
* | Grant Prideco, Inc. | 117,200 | 5,769 |
| Baker Hughes, Inc. | 71,600 | 4,905 |
| Frontline Ltd. | 89,200 | 4,105 |
* | Weatherford International Ltd. | 52,800 | 3,826 |
| EOG Resources, Inc. | 23,800 | 2,856 |
| Independent Tankers |
|
|
| Corp. Ltd. | 17,840 | 30 |
|
|
| 824,098 |
Financials (5.1%) |
|
| |
| ProLogis REIT | 935,500 | 55,064 |
| The Goldman Sachs |
|
|
| Group, Inc. | 226,100 | 37,395 |
| Invesco, Ltd. | 1,520,200 | 37,032 |
| Charles Schwab Corp. | 1,449,255 | 27,289 |
* | Nasdaq Stock Market Inc. | 662,200 | 25,601 |
| Jones Lang LaSalle Inc. | 301,400 | 23,310 |
| Banco Itau Holding |
|
|
| Financeira SA ADR | 996,300 | 22,676 |
* | TD Ameritrade |
|
|
| Holding Corp. | 1,068,200 | 17,636 |
| Bovespa Holding SA | 1,239,000 | 16,770 |
16
* | Berkshire Hathaway Inc. |
|
|
| Class B | 3,630 | 16,237 |
| Bank of New York |
|
|
| Mellon Corp. | 378,900 | 15,811 |
| Lazard Ltd. Class A | 401,700 | 15,345 |
| American Express Co. | 292,100 | 12,771 |
| Merrill Lynch & Co., Inc. | 307,600 | 12,532 |
| State Street Corp. | 153,900 | 12,158 |
| SEI Investments Co. | 468,200 | 11,560 |
| HCC Insurance Holdings, Inc. | 486,600 | 11,041 |
| AFLAC Inc. | 159,800 | 10,379 |
| Discover Financial Services | 565,200 | 9,252 |
| SL Green Realty Corp. REIT | 110,500 | 9,002 |
| Franklin Resources Corp. | 78,000 | 7,565 |
| CME Group, Inc. | 13,950 | 6,544 |
| Northern Trust Corp. | 98,000 | 6,514 |
* | IntercontinentalExchange Inc. | 46,400 | 6,055 |
| Prudential Financial, Inc. | 64,200 | 5,024 |
| Eaton Vance Corp. | 163,000 | 4,973 |
| Simon Property Group, Inc. |
|
|
| REIT | 49,900 | 4,636 |
| ^The First Marblehead Corp. | 429,300 | 3,203 |
* | CB Richard Ellis Group, Inc. | 117,000 | 2,532 |
| Axis Capital Holdings Ltd. | 57,500 | 1,954 |
* | Arch Capital Group Ltd. | 27,438 | 1,884 |
| Progressive Corp. of Ohio | 58,800 | 945 |
| Forest City Enterprise Class A | 5,200 | 191 |
|
|
| 450,881 |
Health Care (14.7%) |
|
| |
| Merck & Co., Inc. | 2,713,500 | 102,977 |
| Abbott Laboratories | 1,802,030 | 99,382 |
* | Intuitive Surgical, Inc. | 279,200 | 90,559 |
* | Gilead Sciences, Inc. | 1,646,600 | 84,849 |
| Eli Lilly & Co. | 1,630,900 | 84,138 |
* | Genentech, Inc. | 805,499 | 65,390 |
| Teva Pharmaceutical Industries |
|
|
| Ltd. Sponsored ADR | 1,263,500 | 58,361 |
| Baxter International, Inc. | 869,672 | 50,284 |
* | Invitrogen Corp. | 544,900 | 46,573 |
* | St. Jude Medical, Inc. | 824,900 | 35,627 |
* | Elan Corp. PLC ADR | 1,662,500 | 34,680 |
* | Forest Laboratories, Inc. | 800,357 | 32,022 |
| AmerisourceBergen Corp. | 764,400 | 31,325 |
* | Thermo Fisher Scientific, Inc. | 521,600 | 29,648 |
* | Humana Inc. | 621,100 | 27,863 |
* | BioMarin Pharmaceutical Inc. | 767,700 | 27,154 |
| McKesson Corp. | 499,500 | 26,159 |
* | Lincare Holdings, Inc. | 809,400 | 22,752 |
* | Express Scripts Inc. | 338,400 | 21,766 |
| Alcon, Inc. | 148,500 | 21,124 |
* | Patterson Cos. | 544,700 | 19,773 |
* | Kinetic Concepts, Inc. | 426,100 | 19,699 |
| Schering-Plough Corp. | 1,362,120 | 19,628 |
* | Celgene Corp. | 312,300 | 19,141 |
* | Coventry Health Care Inc. | 462,275 | 18,653 |
17
* | Endo Pharmaceuticals |
|
|
| Holdings, Inc. | 772,900 | 18,503 |
| Medtronic, Inc. | 320,999 | 15,527 |
| ^Mylan Inc. | 1,206,000 | 13,990 |
* | Amgen, Inc. | 323,100 | 13,499 |
| UnitedHealth Group Inc. | 387,600 | 13,318 |
| Shionogi & Co., Ltd. | 683,000 | 11,746 |
* | Biogen Idec Inc. | 187,800 | 11,585 |
* | Amylin Pharmaceuticals, Inc. | 344,200 | 10,054 |
* | WellPoint Inc. | 220,572 | 9,734 |
| Aetna Inc. | 208,072 | 8,758 |
| CIGNA Corp. | 191,500 | 7,769 |
* | Warner Chilcott Ltd. | 428,400 | 7,711 |
* | Medco Health Solutions, Inc. | 168,300 | 7,370 |
* | Hospira, Inc. | 166,700 | 7,130 |
* | Genzyme Corp. | 85,800 | 6,396 |
* | AMERIGROUP Corp. | 210,500 | 5,753 |
| UCB SA | 164,653 | 5,719 |
* | Edwards Lifesciences Corp. | 115,500 | 5,146 |
* | Cephalon, Inc. | 79,180 | 5,099 |
| Cardinal Health, Inc. | 80,400 | 4,222 |
| Stryker Corp. | 59,300 | 3,857 |
* | Regeneron |
|
|
| Pharmaceuticals, Inc. | 149,600 | 2,871 |
* | Laboratory Corp. of |
|
|
| America Holdings | 38,900 | 2,866 |
* | HLTH Corp. | 247,200 | 2,358 |
* | Cerner Corp. | 40,600 | 1,514 |
| Beckman Coulter, Inc. | 20,500 | 1,323 |
* | Millennium |
|
|
| Pharmaceuticals, Inc. | 69,800 | 1,079 |
|
|
| 1,294,424 |
Industrials (14.9%) |
|
| |
| The Boeing Co. | 1,627,200 | 121,015 |
| Raytheon Co. | 1,162,900 | 75,135 |
* | Jacobs Engineering |
|
|
| Group Inc. | 991,400 | 72,957 |
| Emerson Electric Co. | 1,380,000 | 71,015 |
| Rockwell Collins, Inc. | 1,099,600 | 62,842 |
| Precision Castparts Corp. | 570,925 | 58,280 |
| Fluor Corp. | 311,200 | 43,929 |
| General Dynamics Corp. | 516,500 | 43,061 |
* | Foster Wheeler Ltd. | 748,800 | 42,397 |
| General Electric Co. | 1,141,600 | 42,251 |
| The Manitowoc Co., Inc. | 932,600 | 38,050 |
* | First Solar, Inc. | 162,100 | 37,468 |
| Parker Hannifin Corp. | 537,600 | 37,240 |
| Caterpillar, Inc. | 474,500 | 37,149 |
| United Technologies Corp. | 496,100 | 34,142 |
| Cummins Inc. | 699,800 | 32,765 |
| Manpower Inc. | 572,900 | 32,231 |
| The Dun & Bradstreet Corp. | 389,100 | 31,665 |
* | Allied Waste Industries, Inc. | 2,788,100 | 30,139 |
* | McDermott International, Inc. | 482,400 | 26,445 |
| Textron, Inc. | 423,200 | 23,454 |
18
| ^Outotec Oyj | 440,274 | 23,418 |
| United Parcel Service, Inc. | 226,600 | 16,546 |
| W.W. Grainger, Inc. | 214,600 | 16,393 |
| Robert Half International, Inc. | 636,600 | 16,386 |
| ^Tata Motors Ltd. | 1,011,800 | 15,804 |
| GATX Corp. | 398,000 | 15,550 |
| 3M Co. | 193,000 | 15,276 |
| Honeywell International Inc. | 267,300 | 15,081 |
* | Thomas & Betts Corp. | 409,300 | 14,886 |
| CSX Corp. | 251,500 | 14,102 |
| Deere & Co. | 167,700 | 13,490 |
| Lockheed Martin Corp. | 135,300 | 13,435 |
| Burlington Northern |
|
|
| Santa Fe Corp. | 138,400 | 12,763 |
| Ingersoll-Rand Co. | 272,500 | 12,148 |
* | Gardner Denver Inc. | 277,700 | 10,303 |
| Dover Corp. | 244,300 | 10,207 |
| Hubbell Inc. Class B | 212,300 | 9,275 |
* | AGCO Corp. | 139,700 | 8,365 |
* | Hansen Transmissions | 2,135,000 | 8,305 |
| Gamesa Corporacion |
|
|
| Tecnologica, SA | 163,963 | 7,485 |
| Harsco Corp. | 129,600 | 7,177 |
| Waste Management, Inc. | 211,300 | 7,091 |
| FedEx Corp. | 69,900 | 6,478 |
| UAL Corp. | 285,500 | 6,147 |
| ^HNI Corp. | 201,000 | 5,405 |
| Illinois Tool Works, Inc. | 104,800 | 5,055 |
| Tyco International, Ltd. | 106,800 | 4,705 |
| Danaher Corp. | 50,700 | 3,855 |
* | AMR Corp. | 247,500 | 2,232 |
|
|
| 1,310,993 |
Information Technology (26.0%) |
| ||
| Communications Equipment (4.9%) |
| |
* | Cisco Systems, Inc. | 8,773,900 | 211,363 |
| QUALCOMM Inc. | 1,234,400 | 50,610 |
| Nokia Corp. ADR | 1,294,300 | 41,198 |
* | Research In Motion Ltd. | 341,800 | 38,360 |
* | Juniper Networks, Inc. | 1,177,600 | 29,440 |
* | Ciena Corp. | 548,900 | 16,923 |
| Harris Corp. | 324,000 | 15,724 |
| Corning, Inc. | 605,000 | 14,544 |
* | JDS Uniphase Corp. | 583,400 | 7,812 |
| Motorola, Inc. | 526,899 | 4,900 |
* | Arris Group Inc. | 661,700 | 3,851 |
| Computers & Peripherals (5.3%) |
| |
* | Apple Inc. | 797,700 | 114,470 |
| Hewlett-Packard Co. | 2,307,300 | 105,351 |
| International Business |
|
|
| Machines Corp. | 799,300 | 92,031 |
* | NetApp, Inc. | 1,995,400 | 40,008 |
* | Emulex Corp. | 1,416,400 | 23,002 |
* | Western Digital Corp. | 700,400 | 18,939 |
* | NCR Corp. | 754,700 | 17,230 |
* | Teradata Corp. | 742,200 | 16,373 |
19
* | Dell Inc. | 609,900 | 12,149 |
* | EMC Corp. | 779,000 | 11,171 |
| Seagate Technology | 379,100 | 7,938 |
* | Sun Microsystems, Inc. | 425,875 | 6,614 |
* | Lexmark International, Inc. | 63,500 | 1,951 |
|
|
|
|
| Electronic Equipment & Instruments (0.9%) | ||
* | Avnet, Inc. | 1,089,800 | 35,669 |
| Amphenol Corp. | 460,500 | 17,154 |
* | Mettler-Toledo |
|
|
| International Inc. | 161,400 | 15,675 |
* | Vishay Intertechnology, Inc. | 676,100 | 6,125 |
* | Arrow Electronics, Inc. | 177,800 | 5,983 |
|
|
|
|
| Internet Software & Services (1.5%) |
| |
* | Google Inc. | 179,200 | 78,932 |
* | VeriSign, Inc. | 577,100 | 19,183 |
* | Yahoo! Inc. | 392,500 | 11,355 |
* | Akamai Technologies, Inc. | 391,000 | 11,011 |
* | eBay Inc. | 353,300 | 10,542 |
|
|
|
|
| IT Services (1.1%) |
|
|
| Accenture Ltd. | 701,444 | 24,670 |
* | Visa Inc. | 374,800 | 23,373 |
| MasterCard, Inc. Class A | 83,300 | 18,575 |
| Western Union Co. | 707,536 | 15,049 |
| Automatic Data |
|
|
| Processing, Inc. | 178,700 | 7,575 |
* | Alliance Data Systems Corp. | 106,300 | 5,050 |
* | Hewitt Associates, Inc. | 64,300 | 2,557 |
|
|
|
|
| Office Electronics (0.1%) |
|
|
* | Zebra Technologies Corp. |
|
|
| Class A | 269,100 | 8,966 |
| Xerox Corp. | 121,600 | 1,820 |
|
|
|
|
| Semiconductors & Semiconductor |
| |
| Equipment (3.8%) |
|
|
| Intel Corp. | 4,708,400 | 99,724 |
| Altera Corp. | 4,490,100 | 82,752 |
* | MEMC Electronic |
|
|
| Materials, Inc. | 940,700 | 66,696 |
| Microchip Technology, Inc. | 693,400 | 22,695 |
* | NVIDIA Corp. | 824,850 | 16,324 |
| Texas Instruments, Inc. | 526,400 | 14,881 |
| KLA-Tencor Corp. | 268,000 | 9,943 |
* | LAM Research Corp. | 200,200 | 7,652 |
| Applied Materials, Inc. | 335,999 | 6,555 |
| Xilinx, Inc. | 243,800 | 5,790 |
| National Semiconductor |
|
|
| Corp. | 291,862 | 5,347 |
|
|
|
|
| Software (8.4%) |
|
|
| Microsoft Corp. | 9,662,675 | 274,227 |
* | Oracle Corp. | 8,187,400 | 160,146 |
20
* | BMC Software, Inc. | 2,793,099 | 90,832 |
|
* | Cadence Design |
|
|
|
| Systems, Inc. | 4,192,600 | 44,777 |
|
* | BEA Systems, Inc. | 1,715,800 | 32,857 |
|
* | Adobe Systems, Inc. | 754,200 | 26,842 |
|
| Nintendo Co. | 42,600 | 22,289 |
|
*^Giant Interactive Group Inc. | 1,753,200 | 22,178 |
| |
* | Shanda Interactive |
|
|
|
| Entertainment, Ltd. | 647,100 | 18,831 |
|
* | Symantec Corp. | 670,200 | 11,139 |
|
| CA, Inc. | 417,400 | 9,392 |
|
* | Intuit, Inc. | 335,600 | 9,065 |
|
* | salesforce.com, inc. | 99,000 | 5,729 |
|
* | Novell, Inc. | 780,800 | 4,911 |
|
* | Activision, Inc. | 130,900 | 3,575 |
|
|
|
| 2,296,365 |
|
Materials (5.0%) |
|
| ||
| Monsanto Co. | 753,457 | 84,010 |
|
| Freeport-McMoRan Copper |
|
|
|
| & Gold, Inc. Class B | 669,700 | 64,439 |
|
* | Owens-Illinois, Inc. | 810,300 | 45,725 |
|
* | The Mosaic Co. | 326,700 | 33,519 |
|
| Potash Corp. |
|
|
|
| of Saskatchewan, Inc. | 202,700 | 31,461 |
|
| Agrium, Inc. | 404,100 | 25,099 |
|
| FMC Corp. | 402,600 | 22,340 |
|
| Yamana Gold, Inc. | 1,431,600 | 20,930 |
|
* | Crown Holdings, Inc. | 821,700 | 20,674 |
|
| Antofagasta PLC | 1,281,384 | 17,840 |
|
| Sealed Air Corp. | 587,300 | 14,829 |
|
| AK Steel Holding Corp. | 244,400 | 13,300 |
|
* | Pactiv Corp. | 420,900 | 11,032 |
|
* | Terra Industries, Inc. | 294,800 | 10,474 |
|
| Celanese Corp. Series A | 190,700 | 7,447 |
|
| Praxair, Inc. | 75,000 | 6,317 |
|
| Allegheny Technologies Inc. | 49,400 | 3,525 |
|
| Air Products & Chemicals, Inc. | 33,900 | 3,119 |
|
| CF Industries Holdings, Inc. | 27,400 | 2,839 |
|
| Steel Dynamics, Inc. | 27,800 | 919 |
|
| Newmont Mining Corp. |
|
|
|
| (Holding Co.) | 14,300 | 648 |
|
|
|
| 440,486 |
|
Telecommunication Services (1.5%) |
|
| ||
| Telefonica SA ADR | 499,600 | 43,220 |
|
| Vodafone Group PLC ADR | 1,457,800 | 43,020 |
|
| Brasil Telecom SA-ADR | 503,000 | 16,493 |
|
| Telephone & Data |
|
|
|
| Systems, Inc. | 355,000 | 13,941 |
|
| Qwest Communications |
|
|
|
| International Inc. | 1,376,500 | 6,236 |
|
* | U.S. Cellular Corp. | 74,200 | 4,081 |
|
* | American Tower Corp. |
|
|
|
| Class A | 101,500 | 3,980 |
|
*^Level 3 Communications, Inc. | 238,500 | 506 |
| |
|
|
| 131,477 |
|
21
Utilities (1.2%) |
|
| |
* | Mirant Corp. | 1,824,300 | 66,386 |
* | NRG Energy, Inc. | 582,900 | 22,727 |
| Sierra Pacific Resources | 981,000 | 12,390 |
* | Reliant Energy, Inc. | 245,400 | 5,804 |
|
|
| 107,307 |
Exchange-Traded Fund (0.7%) |
|
| |
2 | ^Vanguard Growth ETF | 1,044,900 | 60,615 |
Total Common Stocks |
|
| |
(Cost $8,104,678) |
| 8,435,267 | |
Temporary Cash Investments (3.7%)1 |
| ||
Money Market Fund (2.1%) |
|
| |
3 | Vanguard Market |
|
|
| Liquidity Fund, |
|
|
| 2.800% | 129,952,771 | 129,953 |
3 | Vanguard Market |
|
|
| Liquidity Fund, |
|
|
| 2.800%—Note G | 56,552,400 | 56,552 |
|
|
| 186,505 |
|
| Face | Market |
|
| Amount | Value• |
|
| ($000) | ($000) |
Repurchase Agreement (1.4%) |
|
| |
| Bank of America |
|
|
| 2.450%, 4/1/08 (Dated 3/31/08, |
| |
| Repurchase Value |
|
|
| $121,508,000 collateralized |
|
|
| by Federal National Mortgage |
| |
| Assn. 5.000%, 7/1/35) | 121,500 | 121,500 |
|
|
|
|
U.S. Agency Obligations (0.2%) |
|
| |
4 | Federal National Mortgage Assn. |
| |
5 | 2.701%, 4/21/08 | 20,000 | 19,977 |
4 | Federal National Mortgage Assn. |
| |
5 | 2.701%, 4/21/08 | 3,000 | 2,996 |
Total Temporary Cash Investments |
| ||
(Cost $330,971) |
| 330,978 | |
Total Investments (99.4%) |
|
| |
(Cost $8,435,649) |
| 8,766,245 | |
Other Assets and Liabilities (0.6%) |
| ||
Other Assets—Note C |
| 182,359 | |
Liabilities—Note G |
| (132,748) | |
|
|
| 49,611 |
Net Assets (100%) |
| 8,815,856 | |
22
At March 31, 2008, net assets consisted of:6 | |
| Amount |
| ($000) |
Paid-in Capital | 8,627,310 |
Undistributed Net Investment Income | 10,571 |
Accumulated Net Realized Losses | (152,407) |
Unrealized Appreciation (Depreciation) |
|
Investment Securities | 330,596 |
Futures Contracts | (302) |
Foreign Currencies | 88 |
Net Assets | 8,815,856 |
|
|
|
|
Investor Shares—Net Assets |
|
Applicable to 353,612,942 outstanding |
|
$.001 par value shares of beneficial |
|
interest (unlimited authorization) | 6,143,404 |
Net Asset Value Per Share— |
|
Investor Shares | $17.37 |
|
|
|
|
Admiral Shares—Net Assets |
|
Applicable to 49,586,139 outstanding |
|
$.001 par value shares of beneficial |
|
interest (unlimited authorization) | 2,672,452 |
Net Asset Value Per Share— |
|
Admiral Shares | $53.90 |
• See Note A in Notes to Financial Statements.
* Non-income-producing security.
^ Part of security position is on loan to broker-dealers. See Note G in Notes to Financial Statements.
1 The fund invests a portion of its cash reserves in equity markets through the use of index futures contracts. After giving effect to futures investments, the fund’s effective common stock and temporary cash investment positions represent 98.2% and 1.2%, respectively, of net assets. See Note E in Notes to Financial Statements.
2 Considered an affiliated company of the fund as the issuer is another member of The Vanguard Group.
3 Affiliated money market fund available only to Vanguard funds and certain trusts and accounts managed by Vanguard. Rate shown is the 7-day yield.
4 The issuer operates under a congressional charter; its securities are neither issued nor guaranteed by the U.S. government. If needed, access to additional funding from the U.S. Treasury (beyond the issuer’s line of credit) would require congressional action.
5 Securities with a value of $22,973,000 have been segregated as initial margin for open futures contracts.
6 See Note E in Notes to Financial Statements for the tax-basis components of net assets.
ADR—American Depositary Receipt.
REIT—Real Estate Investment Trust.
23
Statement of Operations
| Six Months Ended |
| March 31, 2008 |
| ($000) |
Investment Income |
|
Income |
|
Dividends1,2 | 49,041 |
Interest2 | 10,133 |
Security Lending | 909 |
Total Income | 60,083 |
Expenses |
|
Investment Advisory Fees—Note B |
|
Basic Fee | 5,088 |
Performance Adjustment | (239) |
The Vanguard Group—Note C |
|
Management and Administrative—Investor Shares | 7,769 |
Management and Administrative—Admiral Shares | 1,032 |
Marketing and Distribution—Investor Shares | 651 |
Marketing and Distribution—Admiral Shares | 349 |
Custodian Fees | 55 |
Shareholders’ Reports |
|
Investor Shares | 64 |
Admiral Shares | 14 |
Trustees’ Fees and Expenses | 6 |
Total Expenses | 14,789 |
Expenses Paid Indirectly—Note D | (336) |
Net Expenses | 14,453 |
Net Investment Income | 45,630 |
Realized Net Gain (Loss) |
|
Investment Securities Sold2 | (11,190) |
Futures Contracts | (42,457) |
Foreign Currencies | 18 |
Realized Net Gain (Loss) | (53,629) |
Change in Unrealized Appreciation (Depreciation) |
|
Investment Securities | (1,200,583) |
Futures Contracts | (5,979) |
Foreign Currencies | 50 |
Change in Unrealized Appreciation (Depreciation) | (1,206,512) |
Net Increase (Decrease) in Net Assets Resulting from Operations | (1,214,511) |
1 Dividends are net of foreign withholding taxes of $515,000.
2 Dividend income, interest income, and realized net gain (loss) from affiliated companies of the fund were $303,000, $7,443,000, and $0, respectively.
24
Statement of Changes in Net Assets
| Six Months Ended |
| Year Ended |
| March 31, |
| September 30, |
| 2008 |
| 2007 |
| ($000) |
| ($000) |
Increase (Decrease) In Net Assets |
|
|
|
Operations |
|
|
|
Net Investment Income | 45,630 |
| 89,181 |
Realized Net Gain (Loss) | (53,629) |
| 586,161 |
Change in Unrealized Appreciation (Depreciation) | (1,206,512) |
| 856,394 |
Net Increase (Decrease) in Net Assets Resulting from Operations | (1,214,511) |
| 1,531,736 |
Distributions |
|
|
|
Net Investment Income |
|
|
|
Investor Shares | (54,794) |
| (57,770) |
Admiral Shares | (27,587) |
| (23,226) |
Realized Capital Gain1 |
|
|
|
Investor Shares | (426,143) |
| (140,745) |
Admiral Shares | (181,619) |
| (48,041) |
Total Distributions | (690,143) |
| (269,782) |
Capital Share Transactions—Note H |
|
|
|
Investor Shares | 879,259 |
| 492,866 |
Admiral Shares | 568,432 |
| 656,214 |
Net Increase (Decrease) from Capital Share Transactions | 1,447,691 |
| 1,149,080 |
Total Increase (Decrease) | (456,963) |
| 2,411,034 |
Net Assets |
|
|
|
Beginning of Period | 9,272,819 |
| 6,861,785 |
End of Period2 | 8,815,856 |
| 9,272,819 |
1 Includes fiscal 2008 and 2007 short-term gain distributions totaling $172,817,000 and $11,775,000. Short-term gain distributions are treated as ordinary income dividends for tax purposes.
2 Net Assets—End of Period includes undistributed net investment income of $10,571,000 and $47,304,000.
25
Financial Highlights
Investor Shares |
|
|
|
|
|
|
|
|
|
|
|
|
|
| Six Months |
|
|
|
|
|
| Ended |
|
|
| ||
For a Share Outstanding | March 31, | Year Ended September 30, | ||||
Throughout Each Period | 2008 | 2007 | 2006 | 2005 | 2004 | 2003 |
Net Asset Value, Beginning of Period | $21.45 | $18.34 | $17.04 | $14.77 | $13.34 | $10.49 |
Investment Operations |
|
|
|
|
|
|
Net Investment Income | 0.091 | .207 | .165 | .1291 | .05 | .04 |
Net Realized and Unrealized Gain (Loss) |
|
|
|
|
|
|
on Investments | (2.635) | 3.604 | 1.230 | 2.246 | 1.42 | 2.85 |
Total from Investment Operations | (2.544) | 3.811 | 1.395 | 2.375 | 1.47 | 2.89 |
Distributions |
|
|
|
|
|
|
Dividends from Net Investment Income | (.175) | (.204) | (.095) | (.105) | (.04) | (.04) |
Distributions from Realized Capital Gains | (1.361) | (.497) | — | — | — | — |
Total Distributions | (1.536) | (.701) | (.095) | (.105) | (.04) | (.04) |
Net Asset Value, End of Period | $17.37 | $21.45 | $18.34 | $17.04 | $14.77 | $13.34 |
|
|
|
|
|
|
|
|
|
|
|
|
|
|
Total Return2 | –12.52% | 21.24% | 8.20% | 16.12% | 11.03% | 27.62% |
|
|
|
|
|
|
|
|
|
|
|
|
|
|
Ratios/Supplemental Data |
|
|
|
|
|
|
Net Assets, End of Period (Millions) | $6,143 | $6,590 | $5,171 | $4,539 | $4,115 | $3,329 |
Ratio of Total Expenses to |
|
|
|
|
|
|
Average Net Assets3 | 0.37%* | 0.37% | 0.42% | 0.41% | 0.44% | 0.50% |
Ratio of Net Investment |
|
|
|
|
|
|
Income to Average Net Assets | 0.95%* | 1.06% | 0.95% | 0.82%1 | 0.32% | 0.31% |
Portfolio Turnover Rate | 93%* | 79% | 90% | 88% | 88% | 91% |
1 Net investment income per share and the ratio of net investment income to average net assets include $0.044 and 0.28%, respectively, resulting from a special dividend from Microsoft Corp. in November 2004.
2 Total returns do not include the account service fee that may be applicable to certain accounts with balances below $10,000.
3 Includes performance-based investment advisory fee increases (decreases) of (0.01%), 0.00%, 0.02%, 0.00%, 0.01%, and 0.00%.
* Annualized.
26
Admiral Shares |
|
|
|
|
|
|
|
|
|
|
|
|
|
| Six Months |
|
|
|
|
|
| Ended |
|
|
| ||
For a Share Outstanding | March 31, | Year Ended September 30, | ||||
Throughout Each Period | 2008 | 2007 | 2006 | 2005 | 2004 | 2003 |
Net Asset Value, Beginning of Period | $66.58 | $56.94 | $52.91 | $45.84 | $41.40 | $32.58 |
Investment Operations |
|
|
|
|
|
|
Net Investment Income | 0.331 | .742 | .620 | .5001 | .212 | .17 |
Net Realized and Unrealized Gain (Loss) |
|
|
|
|
|
|
on Investments | (8.150) | 11.184 | 3.808 | 6.956 | 4.416 | 8.83 |
Total from Investment Operations | (7.819) | 11.926 | 4.428 | 7.456 | 4.628 | 9.00 |
Distributions |
|
|
|
|
|
|
Dividends from Net Investment Income | (.641) | (.745) | (.398) | (.386) | (.188) | (.18) |
Distributions from Realized Capital Gains | (4.220) | (1.541) | — | — | — | — |
Total Distributions | (4.861) | (2.286) | (.398) | (.386) | (.188) | (.18) |
Net Asset Value, End of Period | $53.90 | $66.58 | $56.94 | $52.91 | $45.84 | $41.40 |
|
|
|
|
|
|
|
|
|
|
|
|
|
|
Total Return | –12.41% | 21.43% | 8.39% | 16.32% | 11.19% | 27.73% |
|
|
|
|
|
|
|
|
|
|
|
|
|
|
Ratios/Supplemental Data |
|
|
|
|
|
|
Net Assets, End of Period (Millions) | $2,672 | $2,683 | $1,691 | $1,110 | $513 | $390 |
Ratio of Total Expenses to |
|
|
|
|
|
|
Average Net Assets2 | 0.21%* | 0.21% | 0.23% | 0.24% | 0.30% | 0.36% |
Ratio of Net Investment Income to |
|
|
|
|
|
|
Average Net Assets | 1.11%* | 1.22% | 1.14% | 0.96%1 | 0.47% | 0.45% |
Portfolio Turnover Rate | 93%* | 79% | 90% | 88% | 88% | 91% |
1 Net investment income per share and the ratio of net investment income to average net assets include $0.184 and 0.28%, respectively, resulting from a special dividend from Microsoft Corp. in November 2004.
2 Includes performance-based investment advisory fee increases (decreases) of (0.01%), 0.00%, 0.02%, 0.00%, 0.01%, and 0.00%.
* Annualized.
See accompanying Notes, which are an integral part of the Financial Statements.
27
Notes to Financial Statements
Vanguard Morgan Growth Fund is registered under the Investment Company Act of 1940 as an open-end investment company, or mutual fund. The fund offers two classes of shares, Investor Shares and Admiral Shares. Investor Shares are available to any investor who meets the fund’s minimum purchase requirements. Admiral Shares are designed for investors who meet certain administrative, service, tenure, and account-size criteria.
A. The following significant accounting policies conform to generally accepted accounting principles for U.S. mutual funds. The fund consistently follows such policies in preparing its financial statements.
1. Security Valuation: Securities are valued as of the close of trading on the New York Stock Exchange (generally 4 p.m., Eastern time) on the valuation date. Equity securities are valued at the latest quoted sales prices or official closing prices taken from the primary market in which each security trades; such securities not traded on the valuation date are valued at the mean of the latest quoted bid and asked prices. Securities for which market quotations are not readily available, or whose values have been affected by events occurring before the fund’s pricing time but after the close of the securities’ primary markets, are valued at their fair values calculated according to procedures adopted by the board of trustees. These procedures include obtaining quotations from an independent pricing service, monitoring news to identify significant market- or security-specific events, and evaluating changes in the values of foreign market proxies (for example, ADRs, futures contracts, or exchange-traded funds), between the time the foreign markets close and the fund’s pricing time. When fair-value pricing is employed, the prices of securities used by a fund to calculate its net asset value may differ from quoted or published prices for the same securities. Investments in Vanguard Market Liquidity Fund are valued at that fund’s net asset value. Temporary cash investments acquired over 60 days to maturity are valued using the latest bid prices or using valuations based on a matrix system (which considers such factors as security prices, yields, maturities, and ratings), both as furnished by independent pricing services. Other temporary cash investments are valued at amortized cost, which approximates market value.
2. Foreign Currency: Securities and other assets and liabilities denominated in foreign currencies are translated into U.S. dollars using exchange rates obtained from an independent third party as of the fund’s pricing time on the valuation date. Realized gains (losses) and unrealized appreciation (depreciation) on investment securities include the effects of changes in exchange rates since the securities were purchased, combined with the effects of changes in security prices. Fluctuations in the value of other assets and liabilities resulting from changes in exchange rates are recorded as unrealized foreign currency gains (losses) until the assets or liabilities are settled in cash, at which time they are recorded as realized foreign currency gains (losses).
3. Futures Contracts: The fund uses index futures contracts to a limited extent, with the objective of maintaining full exposure to the stock market while maintaining liquidity. The fund may purchase or sell futures contracts to achieve a desired level of investment, whether to accommodate portfolio turnover or cash flows from capital share transactions. The primary risks associated with the use of futures contracts are imperfect correlation between changes in market values of stocks held by the fund and the prices of futures contracts, and the possibility of an illiquid market.
Futures contracts are valued at their quoted daily settlement prices. The aggregate principal amounts of the contracts are not recorded in the Statement of Net Assets. Fluctuations in the value of the contracts are recorded in the Statement of Net Assets as an asset (liability) and in the Statement of Operations as unrealized appreciation (depreciation) until the contracts are closed, when they are recorded as realized futures gains (losses).
28
4. Repurchase Agreements: The fund may invest in repurchase agreements. Securities pledged as collateral for repurchase agreements are held by a custodian bank until the agreements mature. Each agreement requires that the market value of the collateral be sufficient to cover payments of interest and principal; however, in the event of default or bankruptcy by the other party to the agreement, retention of the collateral may be subject to legal proceedings.
5. Federal Income Taxes: The fund intends to continue to qualify as a regulated investment company and distribute all of its taxable income. Management has analyzed the fund’s tax positions taken on federal income tax returns for all open tax years (tax years ended September 30, 2004–2007) and for the period ended March 31, 2008, and has concluded that no provision for federal income tax is required in the fund’s financial statements.
6. Distributions: Distributions to shareholders are recorded on the ex-dividend date.
7. Security Lending: The fund may lend its securities to qualified institutional borrowers to earn additional income. Security loans are required to be secured at all times by collateral at least equal to the market value of securities loaned. The fund invests cash collateral received in Vanguard Market Liquidity Fund, and records a liability for the return of the collateral, during the period the securities are on loan. Security lending income represents the income earned on investing cash collateral, less expenses associated with the loan.
8. Other: Dividend income is recorded on the ex-dividend date. Interest income includes income distributions received from Vanguard Market Liquidity Fund and is accrued daily. Security transactions are accounted for on the date securities are bought or sold. Costs used to determine realized gains (losses) on the sale of investment securities are those of the specific securities sold.
Each class of shares has equal rights as to assets and earnings, except that each class separately bears certain class-specific expenses related to maintenance of shareholder accounts (included in Management and Administrative expenses) and shareholder reporting. Marketing and distribution expenses are allocated to each class of shares based on a method approved by the board of trustees. Income, other non-class-specific expenses, and gains and losses on investments are allocated to each class of shares based on its relative net assets.
B. Wellington Management Company, LLP, Franklin Portfolio Associates, LLC, and Jennison Associates LLC each provide investment advisory services to a portion of the fund for a fee calculated at an annual percentage rate of average net assets managed by the advisor. The basic fee for Wellington Management Company, LLP, is subject to quarterly adjustments based on performance for the preceding three years relative to the Russell 3000 Growth Index; the basic fee of Franklin Portfolio Associates, LLC, is subject to quarterly adjustments based on performance for the preceding three years relative to the Russell Midcap Growth Index; the basic fee of Jennison Associates LLC is subject to quarterly adjustments based on performance since March 31, 2007, relative to the Russell 1000 Growth Index.
The Vanguard Group provides investment advisory services to a portion of the fund on an at-cost basis; the fund paid Vanguard advisory fees of $257,000 for the six months ended March 31, 2008.
For the six months ended March 31, 2008, the aggregate investment advisory fee represented an effective annual basic rate of 0.11% of the fund’s average net assets, before a decrease of $239,000 (0.01%) based on performance.
29
C. The Vanguard Group furnishes at cost corporate management, administrative, marketing, and distribution services. The costs of such services are allocated to the fund under methods approved by the board of trustees. The fund has committed to provide up to 0.40% of its net assets in capital contributions to Vanguard. At March 31, 2008, the fund had contributed capital of $760,000 to Vanguard (included in Other Assets), representing 0.01% of the fund’s net assets and 0.76% of Vanguard’s capitalization. The fund’s trustees and officers are also directors and officers of Vanguard.
D. The fund has asked its investment advisors to direct certain security trades, subject to obtaining the best price and execution, to brokers who have agreed to rebate to the fund part of the commissions generated. Such rebates are used solely to reduce the fund’s management and administrative expenses. The fund’s custodian bank has also agreed to reduce its fees when the fund maintains cash on deposit in the non-interest-bearing custody account. For the six months ended March 31, 2008, these arrangements reduced the fund’s management and administrative expenses by $322,000 and custodian fees by $14,000. The total expense reduction represented an effective annual rate of 0.01% of the fund’s average net assets.
E. Distributions are determined on a tax basis and may differ from net investment income and realized capital gains for financial reporting purposes. Differences may be permanent or temporary. Permanent differences are reclassified among capital accounts in the financial statements to reflect their tax character. Temporary differences arise when certain items of income, expense, gain, or loss are recognized in different periods for financial statement and tax purposes; these differences will reverse at some time in the future. Differences in classification may also result from the treatment of short-term gains as ordinary income for tax purposes. The fund’s tax-basis capital gains and losses are determined only at the end of each fiscal year.
During the six months ended March 31, 2008, the fund realized net foreign currency gains of $18,000, which increased distributable net income for tax purposes; accordingly, such gains have been reclassified from accumulated net realized losses to undistributed net investment income.
At March 31, 2008, the cost of investment securities for tax purposes was $8,435,649,000. Net unrealized appreciation of investment securities for tax purposes was $330,596,000, consisting of unrealized gains of $934,953,000 on securities that had risen in value since their purchase and $604,357,000 in unrealized losses on securities that had fallen in value since their purchase.
At March 31, 2008, the aggregate settlement value of open futures contracts expiring in June 2008 and the related unrealized appreciation (depreciation) were:
|
|
| ($000) |
|
| Aggregate | Unrealized |
| Number of | Settlement | Appreciation |
Futures Contracts | Long Contracts | Value | (Depreciation) |
S&P 500 Index | 318 | 105,258 | (152) |
E-mini S&P 500 Index | 1,774 | 117,439 | (150) |
Unrealized appreciation (depreciation) on open futures contracts is required to be treated as realized gain (loss) for tax purposes.
30
F. During the six months ended March 31, 2008, the fund purchased $4,891,533,000 of investment securities and sold $4,074,735,000 of investment securities, other than temporary cash investments.
G. The market value of securities on loan to broker-dealers at March 31, 2008, was $54,975,000, for which the fund received cash collateral of $56,552,000.
H. Capital share transactions for each class of shares were:
| Six Months Ended |
| Year Ended | ||
| March 31, 2008 |
| September 30, 2007 | ||
| Amount | Shares |
| Amount | Shares |
| ($000) | (000) |
| ($000) | (000) |
Investor Shares |
|
|
|
|
|
Issued | 1,012,170 | 53,008 |
| 1,220,304 | 61,572 |
Issued in Lieu of Cash Distributions | 469,983 | 24,568 |
| 193,647 | 10,112 |
Redeemed | (602,894) | (31,250) |
| (921,085) | (46,368) |
Net Increase (Decrease)—Investor Shares | 879,259 | 46,326 |
| 492,866 | 25,316 |
Admiral Shares |
|
|
|
|
|
Issued | 618,363 | 10,185 |
| 915,586 | 14,803 |
Issued in Lieu of Cash Distributions | 176,658 | 2,979 |
| 58,650 | 988 |
Redeemed | (226,589) | (3,874) |
| (318,022) | (5,190) |
Net Increase (Decrease)—Admiral Shares | 568,432 | 9,290 |
| 656,214 | 10,601 |
31
About Your Fund’s Expenses
As a shareholder of the fund, you incur ongoing costs, which include costs for portfolio management, administrative services, and shareholder reports (like this one), among others. Operating expenses, which are deducted from a fund’s gross income, directly reduce the investment return of the fund.
A fund’s expenses are expressed as a percentage of its average net assets. This figure is known as the expense ratio. The following examples are intended to help you understand the ongoing costs (in dollars) of investing in your fund and to compare these costs with those of other mutual funds. The examples are based on an investment of $1,000 made at the beginning of the period shown and held for the entire period.
The table below illustrates your fund’s costs in two ways:
• Based on actual fund return. This section helps you to estimate the actual expenses that you paid over the period. The “Ending Account Value” shown is derived from the fund’s actual return, and the third column shows the dollar amount that would have been paid by an investor who started with $1,000 in the fund. You may use the information here, together with the amount you invested, to estimate the expenses that you paid over the period.
To do so, simply divide your account value by $1,000 (for example, an $8,600 account value divided by $1,000 = 8.6), then multiply the result by the number given for your fund under the heading “Expenses Paid During Period.”
• Based on hypothetical 5% yearly return. This section is intended to help you compare your fund’s costs with those of other mutual funds. It assumes that the fund had a yearly return of 5% before expenses, but that the expense ratio is unchanged. In this case—because the return used is not the fund’s actual return—the results do not apply to your investment. The example is useful in making comparisons because the Securities and Exchange Commission requires all mutual funds to calculate expenses based on a 5% return. You can assess your fund’s costs by comparing this hypothetical example with the hypothetical examples that appear in shareholder reports of other funds.
Six Months Ended March 31, 2008 |
|
|
|
| Beginning | Ending | Expenses |
| Account Value | Account Value | Paid During |
Morgan Growth Fund | 9/30/2007 | 3/31/2008 | Period1 |
Based on Actual Fund Return |
|
|
|
Investor Shares | $1,000.00 | $874.81 | $1.73 |
Admiral Shares | 1,000.00 | 875.90 | 0.98 |
Based on Hypothetical 5% Yearly Return | |||
Investor Shares | $1,000.00 | $1,023.15 | $1.87 |
Admiral Shares | 1,000.00 | 1,023.95 | 1.06 |
1 The calculations are based on expenses incurred in the most recent six-month period. The fund’s annualized six-month expense ratios for that period are 0.37% for Investor Shares and 0.21% for Admiral Shares. The dollar amounts shown as “Expenses Paid” are equal to the annualized expense ratio multiplied by the average account value over the period, multiplied by the number of days in the most recent six-month period, then divided by the number of days in the most recent 12-month period.
32
Note that the expenses shown in the table on page 26 are meant to highlight and help you compare ongoing costs only and do not reflect transaction costs incurred by the fund for buying and selling securities. Further, the expenses do not include the account service fee described in the prospectus. If such a fee were applied to your account, your costs would be higher. Your fund does not charge transaction fees, such as purchase or redemption fees, nor does it carry a “sales load.”
The calculations assume no shares were bought or sold during the period. Your actual costs may have been higher or lower, depending on the amount of your investment and the timing of any purchases or redemptions.
You can find more information about the fund’s expenses, including annual expense ratios, in the Financial Statements section of this report. For additional information on operating expenses and other shareholder costs, please refer to your fund’s current prospectus.
33
Trustees Approve Advisory Arrangements
The board of trustees of Vanguard Morgan Growth Fund has renewed the fund’s investment advisory arrangements with Wellington Management Company, LLP, Franklin Portfolio Associates, LLC, Jennison Associates LLC, and The Vanguard Group, Inc. (through its Quantitative Equity Group). The board determined that the retention of the advisors was in the best interests of the fund and its shareholders.
The board based its decisions upon an evaluation of each advisor’s investment staff, portfolio management process, and performance. The trustees considered the factors discussed below, among others. However, no single factor determined whether the board approved the arrangements. Rather, it was the totality of the circumstances that drove the board’s decision.
Nature, extent, and quality of services
The board considered the quality of the fund’s investment management over both the short and long term, and took into account the organizational depth and stability of each advisor. The board noted the following:
Wellington Management Company. Wellington Management, which was founded in 1928, is among the nation’s oldest and most respected institutional investment managers. The firm has advised the fund since 1968. The investment team at Wellington Management uses traditional methods of stock selection to identify companies that it believes have above-average growth prospects, particularly those in industries undergoing change.
Franklin Portfolio Associates. Franklin Portfolio Associates, which was founded in 1982, is known for quantitative equity management that combines investment experience and the use of financial databases and computer modeling. In seeking to identify attractive mid-capitalization growth stocks, the investment team employs more than 40 computer models, covering a broad range of public data. The firm has advised the fund since 1990.
Jennison Associates. Jennison Associates, which was founded in 1969, is a fully owned subsidiary of Prudential Financial, Inc. The investment team at Jennison Associates uses internal fundamental research, bottom-up stock selection, and a highly interactive stock selection process to identify companies that exhibit above-average growth in units, revenues, earnings, and cash flows. When analyzing a company for purchase or sale, the team focuses on the duration of the growth opportunity and seeks to capture inflection points in the company’s growth. The firm has advised the fund since January 2007.
The Vanguard Group. Vanguard has been managing investments for more than two decades. George U. Sauter, Vanguard managing director and chief investment officer, has been in the investment management business since 1985. The group adheres to a sound, disciplined investment management process; the team has considerable experience, stability, and depth. Vanguard has managed a portion of the fund since 1993.
The board concluded that each advisor’s experience, stability, depth, and performance, among other factors, warranted continuation of the advisory arrangements.
34
Investment performance
The board considered the short- and long-term performance of the fund, including any periods of outperformance or underperformance of a relevant benchmark and peer group. The board concluded that each advisor has carried out the fund’s investment strategy in disciplined fashion, and that performance results have allowed the fund to remain competitive versus its benchmark and its peer group. Information about the fund’s most recent performance can be found in the Performance Summary section of this report.
Cost
The board concluded that the fund’s expense ratio was far below the average expense ratio charged by funds in its peer group. The board noted that the fund’s advisory fee rate was also well below the peer-group average. Information about the fund’s expense ratio appears in the About Your Fund’s Expenses section of this report as well as in the Financial Statements section, which also includes information about the advisory fee rate.
The board did not consider profitability of Wellington Management, Franklin Portfolio Associates, or Jennison Associates in determining whether to approve the advisory fees, because the firms are independent of Vanguard and the advisory fees are the result of arm’s-length negotiations. The board does not conduct a profitability analysis of Vanguard because of Vanguard’s unique “at-cost” structure. Unlike most other mutual fund management companies, Vanguard is owned by the funds it oversees, and produces “profits” only in the form of reduced expenses for fund shareholders.
The benefit of economies of scale
The board concluded that the fund’s shareholders benefit from economies of scale because of breakpoints in the advisory fee schedules for Wellington Management, Franklin Portfolio Associates, and Jennison Associates. The breakpoints reduce the effective rate of the fees as the fund’s assets managed by the firms increase. The board also concluded that the fund’s low-cost arrangement with Vanguard ensures that the fund will realize economies of scale as it grows, with the cost to shareholders declining as the fund’s assets managed by Vanguard increase.
The board will consider whether to renew the advisory arrangements again after a one-year period.
35
Glossary
Beta. A measure of the magnitude of a fund’s past share-price fluctuations in relation to the ups and downs of a given market index. The index is assigned a beta of 1.00. Compared with a given index, a fund with a beta of 1.20 typically would have seen its share price rise or fall by 12% when the index rose or fell by 10%. For this report, beta is based on returns over the past 36 months for both the fund and the index. Note that a fund’s beta should be reviewed in conjunction with its R-squared (see definition below). The lower the R-squared, the less correlation there is between the fund and the index, and the less reliable beta is as an indicator of volatility.
Earnings Growth Rate. The average annual rate of growth in earnings over the past five years for the stocks now in a fund.
Equity Exposure. A measure that reflects a fund’s investments in stocks and stock futures. Any holdings in short-term reserves are excluded.
Expense Ratio. The percentage of a fund’s average net assets used to pay its annual administrative and advisory expenses. These expenses directly reduce returns to investors.
Foreign Holdings. The percentage of a fund represented by stocks or depositary receipts of companies based outside the United States.
Inception Date. The date on which the assets of a fund (or one of its share classes) are first invested in accordance with the fund’s investment objective. For funds with a subscription period, the inception date is the day after that period ends. Investment performance is measured from the inception date.
Median Market Cap. An indicator of the size of companies in which a fund invests; the midpoint of market capitalization (market price x shares outstanding) of a fund’s stocks, weighted by the proportion of the fund’s assets invested in each stock. Stocks representing half of the fund’s assets have market capitalizations above the median, and the rest are below it.
Price/Book Ratio. The share price of a stock divided by its net worth, or book value, per share. For a fund, the weighted average price/book ratio of the stocks it holds.
Price/Earnings Ratio. The ratio of a stock’s current price to its per-share earnings over the past year. For a fund, the weighted average P/E of the stocks it holds. P/E is an indicator of market expectations about corporate prospects; the higher the P/E, the greater the expectations for a company’s future growth.
R-Squared. A measure of how much of a fund’s past returns can be explained by the returns from the market in general, as measured by a given index. If a fund’s total returns were precisely synchronized with an index’s returns, its R-squared would be 1.00. If the fund’s returns bore no relationship to the index’s returns, its R-squared would be 0. For this report, R-squared is based on returns over the past 36 months for both the fund and the index.
Return on Equity. The annual average rate of return generated by a company during the past five years for each dollar of shareholder’s equity (net income divided by shareholder’s equity). For a fund, the weighted average return on equity for the companies whose stocks it holds.
36
Short-Term Reserves. The percentage of a fund invested in highly liquid, short-term securities that can be readily converted to cash.
Turnover Rate. An indication of the fund’s trading activity. Funds with high turnover rates incur higher transaction costs and may be more likely to distribute capital gains (which may be taxable to investors). The turnover rate excludes in-kind transactions, which have minimal impact on costs.
Yield. A fund’s 30-day SEC yield is derived using a formula specified by the U.S. Securities and Exchange Commission. Under the formula, data related to the fund’s security holdings in the previous 30 days are used to calculate the fund’s hypothetical net income for that period, which is then annualized and divided by the fund’s estimated average net assets over the calculation period. For the purposes of this calculation, a security’s income is based on its current market yield to maturity (in the case of bonds) or its projected dividend yield (for stocks). Because the SEC yield represents hypothetical annualized income, it will differ—at times significantly—from the fund’s actual experience. As a result, the fund’s income distributions may be higher or lower than implied by the SEC yield.
37
The People Who Govern Your Fund
The trustees of your mutual fund are there to see that the fund is operated and managed in your best interests since, as a shareholder, you are a part owner of the fund. Your fund’s trustees also serve on the board of directors of The Vanguard Group, Inc., which is owned by the Vanguard funds and provides services to them on an at-cost basis.
A majority of Vanguard’s board members are independent, meaning that they have no affiliation with Vanguard or the funds they oversee, apart from the sizable personal investments they have made as private individuals.
Our independent board members bring distinguished backgrounds in business, academia, and public service to their task of working with Vanguard officers to establish the policies and oversee the activities of the funds. Among board members’ responsibilities are selecting investment advisors for the funds; monitoring fund operations, performance, and costs; reviewing contracts; nominating and selecting new trustees/directors; and electing Vanguard officers.
Each trustee serves a fund until its termination; or until the trustee’s retirement, resignation, or death; or otherwise as specified in the fund’s organizational documents. Any trustee may be removed at a shareholders’ meeting by a vote representing two-thirds of the net asset value of all shares of the fund together with shares of other Vanguard funds organized within the same trust. The table on these two pages shows information for each trustee and executive officer of the fund. The mailing address of the trustees and officers is P.O. Box 876, Valley Forge, PA 19482.
Chairman of the Board, Chief Executive Officer, and Trustee | |
|
|
John J. Brennan1 |
|
Born 1954 | Principal Occupation(s) During the Past Five Years: Chairman of the Board, Chief Executive |
Trustee since May 1987; | Officer, and Director/Trustee of The Vanguard Group, Inc., and of each of the investment |
Chairman of the Board and | companies served by The Vanguard Group; Director of Vanguard Marketing Corporation. |
Chief Executive Officer |
|
155 Vanguard Funds Overseen |
|
|
|
Independent Trustees |
|
|
|
Charles D. Ellis |
|
Born 1937 | Principal Occupation(s) During the Past Five Years: Applecore Partners (pro bono ventures |
Trustee since January 2001 | in education); Senior Advisor to Greenwich Associates (international business strategy |
155 Vanguard Funds Overseen | consulting); Successor Trustee of Yale University; Overseer of the Stern School of Business |
| at New York University; Trustee of the Whitehead Institute for Biomedical Research. |
|
|
Emerson U. Fullwood |
|
Born 1948 | Principal Occupation(s) During the Past Five Years: Executive Chief Staff and Marketing |
Trustee since January 2008 | Officer for North America since 2004 and Corporate Vice President of Xerox Corporation |
155 Vanguard Funds Overseen | (photocopiers and printers); Director of SPX Corporation (multi-industry manufacturing), |
| of the United Way of Rochester, and of the Boy Scouts of America. |
|
|
Rajiv L. Gupta |
|
Born 1945 | Principal Occupation(s) During the Past Five Years: Chairman, President, and |
Trustee since December 20012 | Chief Executive Officer of Rohm and Haas Co. (chemicals); Board Member of |
155 Vanguard Funds Overseen | the American Chemistry Council; Director of Tyco International, Ltd. (diversified |
| manufacturing and services) since 2005. |
|
|
Amy Gutmann |
|
Born 1949 | Principal Occupation(s) During the Past Five Years: President of the University of |
Trustee since June 2006 | Pennsylvania since 2004; Professor in the School of Arts and Sciences, Annenberg School |
155 Vanguard Funds Overseen | for Communication, and Graduate School of Education of the University of Pennsylvania |
| since 2004; Provost (2001–2004) and Laurance S. Rockefeller Professor of Politics and |
| the University Center for Human Values (1990–2004), Princeton University; Director of |
| Carnegie Corporation of New York since 2005 and of Schuylkill River Development |
| Corporation and Greater Philadelphia Chamber of Commerce since 2004; Trustee of |
| the National Constitution Center since 2007. |
JoAnn Heffernan Heisen |
|
Born 1950 | Principal Occupation(s) During the Past Five Years: Corporate Vice President and |
Trustee since July 1998 | Chief Global Diversity Officer since 2006, Vice President and Chief Information |
155 Vanguard Funds Overseen | Officer (1997–2005), and Member of the Executive Committee of Johnson & |
| Johnson (pharmaceuticals/consumer products); Director of the University Medical |
| Center at Princeton and Women’s Research and Education Institute. |
|
|
André F. Perold |
|
Born 1952 | Principal Occupation(s) During the Past Five Years: George Gund Professor of Finance |
Trustee since December 2004 | and Banking, Harvard Business School; Senior Associate Dean and Director of Faculty |
155 Vanguard Funds Overseen | Recruiting, Harvard Business School; Director and Chairman of UNX, Inc. (equities |
| trading firm); Chair of the Investment Committee of HighVista Strategies LLC (private |
| investment firm) since 2005. |
|
|
Alfred M. Rankin, Jr. |
|
Born 1941 | Principal Occupation(s) During the Past Five Years: Chairman, President, Chief Executive |
Trustee since January 1993 | Officer, and Director of NACCO Industries, Inc. (forklift trucks/housewares/lignite); Director |
155 Vanguard Funds Overseen | of Goodrich Corporation (industrial products/aircraft systems and services). |
|
|
|
|
J. Lawrence Wilson |
|
Born 1936 | Principal Occupation(s) During the Past Five Years: Retired Chairman and Chief Executive |
Trustee since April 1985 | Officer of Rohm and Haas Co. (chemicals); Director of Cummins Inc. (diesel engines) and |
155 Vanguard Funds Overseen | AmerisourceBergen Corp. (pharmaceutical distribution); Trustee of Vanderbilt University |
| and of Culver Educational Foundation. |
|
|
|
|
Executive Officers1 |
|
|
|
Thomas J. Higgins |
|
Born 1957 | Principal Occupation(s) During the Past Five Years: Principal of The Vanguard Group, Inc.; |
Treasurer since July 1998 | Treasurer of each of the investment companies served by The Vanguard Group. |
155 Vanguard Funds Overseen |
|
|
|
|
|
F. William McNabb III |
|
Born 1957 | Principal Occupation(s) During the Past Five Years: President of The Vanguard Group, Inc., |
President since March 2008 | and of each of the investment companies served by The Vanguard Group since 2008; |
155 Vanguard Funds Overseen | Director of Vanguard Marketing Corporation; Managing Director of The Vanguard Group |
| (1995–2008). |
|
|
Heidi Stam |
|
Born 1956 | Principal Occupation(s) During the Past Five Years: Managing Director of The Vanguard |
Secretary since July 2005 | Group, Inc., since 2006; General Counsel of The Vanguard Group since 2005; Secretary of |
155 Vanguard Funds Overseen | The Vanguard Group, and of each of the investment companies served by The Vanguard |
| Group, since 2005; Director and Senior Vice President of Vanguard Marketing Corporation |
| since 2005; Principal of The Vanguard Group (1997–2006). |
Vanguard Senior Management Team |
|
| |
|
|
|
|
R. Gregory Barton | Kathleen C. Gubanich | Michael S. Miller | George U. Sauter |
Mortimer J. Buckley | Paul A. Heller | Ralph K. Packard |
|
Founder |
|
John C. Bogle |
Chairman and Chief Executive Officer, 1974–1996 |
1 Officers of the funds are “interested persons” as defined in the Investment Company Act of 1940.
2 December 2002 for Vanguard Equity Income Fund, Vanguard Growth Equity Fund, the Vanguard Municipal Bond Funds, and the Vanguard State Tax-Exempt Funds.
More information about the trustees is in the Statement of Additional Information, available from The Vanguard Group.

P.O. Box 2600
Valley Forge, PA 19482-2600
Connect with Vanguard® > www.vanguard.com
Fund Information > 800-662-7447 | Vanguard, Admiral, Morgan, Connect with Vanguard, and |
| the ship logo are trademarks of The Vanguard Group, Inc. |
Direct Investor Account Services > 800-662-2739 |
|
| All other marks are the exclusive property of their |
Institutional Investor Services > 800-523-1036 | respective owners. |
|
|
Text Telephone for People |
|
With Hearing Impairment > 800-952-3335 | All comparative mutual fund data are from Lipper Inc. |
| or Morningstar, Inc., unless otherwise noted. |
|
|
|
|
| You can obtain a free copy of Vanguard’s proxy voting |
| guidelines by visiting our website, www.vanguard.com, |
This material may be used in conjunction | and searching for “proxy voting guidelines,” or by |
with the offering of shares of any Vanguard | calling Vanguard at 800-662-2739. The guidelines are |
fund only if preceded or accompanied by | also available from the SEC’s website, www.sec.gov. |
the fund’s current prospectus. | In addition, you may obtain a free report on how your |
| fund voted the proxies for securities it owned during |
| the 12 months ended June 30. To get the report, visit |
| either www.vanguard.com or www.sec.gov. |
|
|
|
|
|
|
| You can review and copy information about your fund |
| at the SEC’s Public Reference Room in Washington, D.C. |
| To find out more about this public service, call the SEC |
| at 202-551-8090. Information about your fund is also |
| available on the SEC’s website, and you can receive |
| copies of this information, for a fee, by sending a |
| request in either of two ways: via e-mail addressed to |
| publicinfo@sec.gov or via regular mail addressed to the |
| Public Reference Section, Securities and Exchange |
| Commission, Washington, DC 20549-0102. |
|
|
|
|
|
|
|
|
|
|
| © 2008 The Vanguard Group, Inc. |
| All rights reserved. |
| Vanguard Marketing Corporation, Distributor. |
|
|
| Q262 052008 |
Item 2: Not Applicable.
Item 3: Not Applicable.
Item 4: Not Applicable.
Item 5: Not Applicable.
Item 6: Not Applicable.
Item 7: Not applicable.
Item 8: Not Applicable.
Item 9: Not Applicable.
Item 10: Not Applicable.
Item 11: Controls and Procedures.
(a) Disclosure Controls and Procedures. The Principal Executive and Financial Officers concluded that the Registrant's Disclosure Controls and Procedures are effective based on their evaluation of the Disclosure Controls and Procedures as of a date within 90 days of the filing date of this report.
(b) Internal Control Over Financial Reporting. There were no significant changes in Registrant’s Internal Control Over Financial Reporting or in other factors that could significantly affect this control subsequent to the date of the evaluation, including any corrective actions with regard to significant deficiencies and material weaknesses.
Item 12: Exhibits.
(a) Certifications.
Pursuant to the requirements of the Securities Exchange Act of 1934 and the Investment Company Act of 1940, the registrant has duly caused this report to be signed on its behalf by the undersigned, thereunto duly authorized.
| VANGUARD MORGAN GROWTH FUND | |
BY: |
| (signature) |
| (HEIDI STAM) | |
| JOHN J. BRENNAN* | |
| CHIEF EXECUTIVE OFFICER | |
Date: May 13, 2008
Pursuant to the requirements of the Securities Exchange Act of 1934 and the Investment Company Act of 1940, this report has been signed below by the following persons on behalf of the registrant and in the capacities and on the dates indicated.
| VANGUARD MORGAN GROWTH FUND | |
BY: |
| (signature) |
| (HEIDI STAM) | |
| JOHN J. BRENNAN* | |
| CHIEF EXECUTIVE OFFICER | |
Date: : May 13, 2008
| VANGUARD MORGAN GROWTH FUND | |
BY: |
| (signature) |
| (HEIDI STAM) | |
| THOMAS J. HIGGINS* | |
| TREASURER | |
Date: : May 13, 2008
*By Power of Attorney. Filed on January 18, 2008, see File Number 2-29601. Incorporated by Reference.