UNITED STATES
SECURITIES AND EXCHANGE COMMISSION
WASHINGTON, D.C. 20549
FORM N-CSR
CERTIFIED SHAREHOLDER REPORT OF REGISTERED MANAGEMENT
INVESTMENT COMPANIES
Investment Company Act file number: 811-00134
ALLIANCEBERNSTEIN BALANCED SHARES, INC.
(Exact name of registrant as specified in charter)
1345 Avenue of the Americas, New York, New York 10105
(Address of principal executive offices) (Zip code)
Joseph J. Mantineo
AllianceBernstein L.P.
1345 Avenue of the Americas
New York, New York 10105
(Name and address of agent for service)
Registrant’s telephone number, including area code: (800) 221-5672
Date of fiscal year end: November 30, 2007
Date of reporting period: November 30, 2007
| ITEM 1. | REPORTS TO STOCKHOLDERS. |
ANNUAL REPORT
AllianceBernstein Balanced Shares

Annual Report
Investment Products Offered
| | • | | Are Not Bank Guaranteed |
The investment return and principal value of an investment in the Fund will fluctuate as the prices of the individual securities in which it invests fluctuate, so that your shares, when redeemed, may be worth more or less than their original cost. You should consider the investment objectives, risks, charges and expenses of the Fund carefully before investing. For a free copy of the Fund’s prospectus, which contains this and other information, visit our web site at www.alliancebernstein.com or call your financial advisor or AllianceBernstein® at (800) 227-4618. Please read the prospectus carefully before you invest.
You may obtain performance information current to the most recent month-end by visiting www.alliancebernstein.com.
This shareholder report must be preceded or accompanied by the Fund’s prospectus for individuals who are not current shareholders of the Fund.
You may obtain a description of the Fund’s proxy voting policies and procedures, and information regarding how the Fund voted proxies relating to portfolio securities during the most recent 12-month period ended June 30, without charge. Simply visit AllianceBernstein’s web site at www.alliancebernstein.com, or go to the Securities and Exchange Commission’s (the “Commission”) web site at www.sec.gov, or call AllianceBernstein at (800) 227-4618.
The Fund files its complete schedule of portfolio holdings with the Commission for the first and third quarters of each fiscal year on Form N-Q. The Fund’s Forms N-Q are available on the Commission’s web site at www.sec.gov. The Fund’s Forms N-Q may also be reviewed and copied at the Commission’s Public Reference Room in Washington, DC; information on the operation of the Public Reference Room may be obtained by calling (800) SEC-0330. AllianceBernstein publishes full portfolio holdings for the Fund monthly at www.alliancebernstein.com.
AllianceBernstein Investments, Inc. is an affiliate of AllianceBernstein L.P., the manager of the AllianceBernstein funds, and is a member of FINRA.
AllianceBernstein® and the AB Logo are registered trademarks and service marks used by permission of the owner, AllianceBernstein L.P.
January 22, 2008
Annual Report
This report provides management’s discussion of fund performance for AllianceBernstein Balanced Shares (the “Fund”) for the annual reporting period ended November 30, 2007.
Investment Objective and Policies
This open-end Fund’s investment objective is total return consistent with reasonable risks through a combination of income and long-term growth of capital. The Fund invests in a diversified portfolio of equity and fixed-income securities. The percentage of the Fund’s assets invested in each type of security will vary. Normally, the Fund’s investments will consist of about 60% in stocks, but stocks may comprise up to 75% of its investments. The Fund will not purchase a security if as a result less than 25% of its total assets will be in fixed-income securities. The Fund may invest up to 20% of its assets in high yield securities (securities rated below BBB- by Standard & Poor’s Rating Services (“S&P”), Moody’s Investors Service, Inc. (“Moody’s”), or Fitch Ratings (“Fitch”). As an operating policy, the Fund will invest no more than 5% of its assets in securities rated CCC- or below.
The Fund may invest in mortgage-related and other asset-backed securities, loan participations, inflation-protected securities, structured securities, variable, floating, and inverse floating rate instruments, preferred stock, and may use other investment techniques. The Fund invests in short- and long-term debt securities in such proportions and of such type as the Adviser deems best
adapted to the current economic and market outlooks. The Fund also may invest in equity and fixed-income securities of non-U.S. issuers located in emerging or developed countries. The Fund may enter into derivatives transactions, such as options, futures, forwards and swap agreements.
Investment Results
The table on page 5 shows the Fund compared to its composite benchmark (the “Composite”), a 60%/40% blend of the Russell 1000 Value Index and the Lehman Brothers (LB) Government/Credit Index, respectively, for the six- and 12-month periods ended November 30, 2007. Also included in the table are returns for the Fund’s peer group, as represented by the Lipper Mixed-Asset Target Allocation Growth Funds Average (the “Lipper Average”). Funds in the Lipper Average have generally similar investment objectives to the Fund, although some may have different investment policies and sales and management fees.
The Fund’s Class A shares without sales charges outperformed the Composite for both the six- and 12-month periods ended November 30, 2007.
The equity allocation of the Fund’s investment portfolio outperformed its equity benchmark, the Russell 1000 Value Index, for both the six- and 12-month periods ended November 30, 2007. Broad-based, strong stock selection drove the Fund’s premium versus the Russell 1000 Value Index. The strong fundamental performance of the Fund’s holdings, as measured
| | |
| ALLIANCEBERNSTEIN BALANCED SHARES • | | 1 |
by superior earnings revisions, also helped as the market rewarded stocks with positive revisions and more predictable business models. On the sector selection side, the Fund’s underweight position in financials, as well as an emphasis on health care, consumer staples and technology, contributed positively to performance.
A broad liquidity crunch stemming from the U.S. subprime mortgage crisis caused the Fund’s fixed-income allocation to underperform its fixed-income benchmark, the LB Government/Credit Index, for both the six- and 12-month periods ended November 30, 2007, as Treasury yields fell and spreads widened across the fixed-income markets. Detracting from relative performance on the fixed-income side were an underweight position in U.S. government debt and exposure to subprime-related asset-backed securities (ABS) and Alt-A mortgage securities, which underperformed. (Alt-A or “alternative” mortgages are home loans made with less than full documentation.) Exposure to collateralized mortgage-backed securities (CMBS), high yield and emerging market debt securities also detracted, while an underweight position in longer maturity corporates helped performance.
In January of 2007, proceeds were received in the Fund resulting from the WorldCom class action settlement. The addition of these proceeds positively impacted relative performance for both the six- and 12-month periods.
Market Review and Investment Strategy
After an extended period of unusual calm, volatility returned with a vengeance to the global capital markets. The catalyst was heightened concern about rising defaults on U.S. subprime mortgages. Initially, this concern depressed valuations of mortgage lenders directly exposed to these mortgages and to a range of complex financial instruments backed by mortgages and other loans. But worry about losses on loan-backed financial instruments soon spread throughout the credit markets and radiated outward. Ultimately, very few segments of the capital markets worldwide were unaffected. As investors flocked to the safety of the highest-quality securities, government bond yields fell worldwide and yield spreads widened across the fixed-income markets.
Serious delinquencies on U.S. subprime mortgage loans began to climb early this year, with the most recent loans—those that originated in 2006 and 2007—experiencing delinquencies at an unprecedented rate. In turn, cumulative loan losses began to rise as well. Many subprime lenders went bankrupt or otherwise closed their doors, making refinancing impossible for many subprime homeowners and all but ensuring losses. Securitizations of subprime debt—whether in the form of ABS or collateralized debt obligations (CDOs)—also dried up with vanished investor demand, draining liquidity out of these markets. Subprime-backed ABS and Alt-A mortgage securities saw significant price deterioration, despite their AAA and AA ratings.
| | |
| 2 | | • ALLIANCEBERNSTEIN BALANCED SHARES |
Central banks—including the European Central Bank, the U.S. Federal Reserve (the “Fed”), the Bank of Japan, the Bank of Canada and the Reserve Bank of Australia—responded by injecting liquidity into the markets via cheap loans to banks; the Fed also cut its discount rate. These measures culminated in the Fed’s dramatic 50-basis-point ease in September and an additional cut of 25 basis points in October, which aimed to restore confidence in the financial markets and put the economy on firmer footing.
The fixed-income markets posted a positive return of 6.23% for the annual period, as represented by the LB Government/Credit Index, with most of that return earned in the final six months. Among fixed-income sectors, Treasury securities significantly outperformed in the recent flight to quality. Treasuries, according to Lehman Brothers, posted a strong return of 8.03%, followed by Agencies at 6.95%. Mortgage-backed securities (MBS) returned 6.31%, while CMBS at 3.53% and ABS at 2.37% posted more modest returns due to subprime mortgage concerns and weakness in the real estate industry. The flight to quality also impacted investment-grade corporates, which returned 3.45%, and high yield corporates, which returned 2.69%, as subprime and global liquidity concerns led to spread widening. For the year, investment-grade corpo-
rate spreads widened 104 basis points to end the period at 193 basis points over neutral-duration Treasuries, while high yield spreads widened 246 basis points to end the period at 556 basis points over Treasuries. Finally, emerging market debt returned 5.44% for the reporting period, as growth in emerging market countries remained quite strong aided by solid commodity prices.
The Fund’s Relative Value Investment Team (the “Team”) continued its year-long migration to greater emphasis on consumer staples and health care stocks, which the Team believed would be likely to do well, even if the U.S. economy were to slow down. The Fund continued to be overweight in technology and underweight in interest-rate sensitive financials, utilities, consumer discretionary and energy stocks.
During the annual reporting period, the Fund continued to be underweight in Treasuries and Agencies. Exposure to non-benchmark opportunities (mortgages, CMBS, ABS, high yield and select emerging market debt) was maintained. As spreads have widened, more opportunities within the corporate sector, especially A-rated and AA-rated banks and brokers, were identified. The Fund’s overall risk positioning remained modest.
| | |
| ALLIANCEBERNSTEIN BALANCED SHARES • | | 3 |
HISTORICAL PERFORMANCE
An Important Note About the Value of Historical Performance
The performance shown on the following pages represents past performance and does not guarantee future results. Current performance may be lower or higher than the performance information shown. You may obtain performance information current to the most recent month-end by visiting www.alliancebernstein.com.
The investment return and principal value of an investment in the Fund will fluctuate, so that your shares, when redeemed, may be worth more or less than their original cost. You should consider the investment objectives, risks, charges and expenses of the Fund carefully before investing. For a free copy of the Fund’s prospectus, which contains this and other information, visit our website at www.alliancebernstein.com or call your financial advisor or AllianceBernstein Investments at 800.227.4618. You should read the prospectus carefully before you invest.
All fees and expenses related to the operation of the Fund have been deducted. NAV returns do not reflect sales charges; if sales charges were reflected, the Fund’s quoted performance would be lower. SEC returns reflect the applicable sales charges for each share class: a 4.25% maximum front-end sales charge for Class A shares; the applicable contingent deferred sales charge for Class B shares (4% year 1, 3% year 2, 2% year 3, 1% year 4); a 1% 1 year contingent deferred sales charge for Class C shares. Returns for the different share classes will vary due to different expenses associated with each class. Performance assumes reinvestment of distributions and does not account for taxes.
Benchmark Disclosure
Neither the unmanaged Russell 1000 Value Index nor the Lehman Brothers (LB) Government/Credit Index reflects fees and expenses associated with the active management of a mutual fund portfolio. The Russell 1000 Value Index contains those securities in the Russell 1000 Index with a less-than-average growth orientation. The unmanaged Russell 1000 Index is composed of 1000 of the largest capitalized companies that are traded in the United States. The unmanaged LB Government/Credit Index represents a combination of two indices: the LB Government Index which is composed of the LB Treasury Index and the LB Agency Index, and the LB Credit Index which includes investment-grade bonds issued by corporations and non-corporate entities. The composite benchmark represents a 60%/40% blend of the Russell 1000 Value Index and the LB Government/Credit Index, respectively. For the six- and 12-month periods ended November 30, 2007, the Lipper Mixed-Asset Target Allocation Growth Funds Average consisted of 674 and 635 funds, respectively. These funds have generally similar investment objectives to the Fund, although some may have different investment policies and sales and management fees. An investor cannot invest directly in an index or average, and their results are not indicative of the performance for any specific investment, including the Fund.
A Word About Risk
The Fund is a “balanced” fund and must invest at least 25% of its total assets in fixed-income securities. Since the Fund invests in both equity and debt securities, it has the risk that the allocation of these investments may have a more significant effect on the Fund’s net asset value when one of these asset classes is performing more poorly than the other. The value of fixed-income securities will change as the general level of interest rates fluctuates. The Fund may invest in high yield bonds (i.e., “junk bonds”) which involves a greater risk of default and price volatility than other bonds. Investing in below-investment grade bonds presents special risks, including credit risk. The Fund can invest in foreign securities, which may magnify fluctuations due to changes in foreign exchange rates and the possibility of substantial volatility due to political and economic uncertainties in foreign countries. The Fund may invest in emerging market securities which may present market, credit, currency, liquidity, legal, political and other risks different from, or greater than, the risks of investing in developed foreign (non-U.S.) countries. In order to achieve its investment objectives, the Fund may at times use certain types of investment derivatives, such as options, futures, forwards and swaps. These instruments involve risks different from, and in certain cases, greater than, the risks presented by more traditional investments. These risks are fully discussed in the Fund’s prospectus.
(Historical Performance continued on next page)
| | |
| 4 | | • ALLIANCEBERNSTEIN BALANCED SHARES |
Historical Performance
HISTORICAL PERFORMANCE
(continued from previous page)
| | | | | | |
| | | | | | |
THE FUND VS. ITS BENCHMARK PERIODS ENDED NOVEMBER 30, 2007 | | Returns | | |
| | 6 Months | | 12 Months | | |
AllianceBernstein Balanced Shares† | | | | | | |
Class A | | -1.98% | | 4.82% | | |
| | | | | | | |
Class B | | -2.35% | | 4.06% | | |
| | | | | | | |
Class C | | -2.34% | | 4.04% | | |
| | | | | | | |
Advisor Class* | | -1.84% | | 5.11% | | |
| | | | | | | |
Class R* | | -2.17% | | 4.47% | | |
| | | | | | | |
Class K* | | -2.00% | | 4.74% | | |
| | | | | | | |
Class I* | | -1.83% | | 5.12% | | |
| | | | | | | |
Russell 1000 Value Index | | -7.33% | | 3.06% | | |
| | | | | | | |
Lehman Brothers Government/Credit Index | | 5.78% | | 6.23% | | |
| | | | | | | |
Composite: 60% Russell 1000 Value Index / 40% Lehman Brothers Government/Credit Index | | -2.18% | | 4.51% | | |
| | | | | | | |
Lipper Mixed-Asset Target Allocation Growth Funds Average | | 0.03% | | 7.95% | | |
| | | | | | | |
† Reflects the positive impact of proceeds related to class action settlements that were originated from individual fund holdings. For further information, please visit: www.alliancebernstein.com/CmsObjectABD/PDF/HistoricalPricing/settlements.pdf |
* Please note that these share classes are for investors purchasing shares through accounts established under certain fee-based programs sponsored and maintained by certain broker-dealers and financial intermediaries, institutional pension plans and/or investment advisory clients of, and certain other persons associated with, the Adviser and its affiliates or the Funds. |
GROWTH OF A $10,000 INVESTMENT IN THE FUND
11/30/97 TO 11/30/07
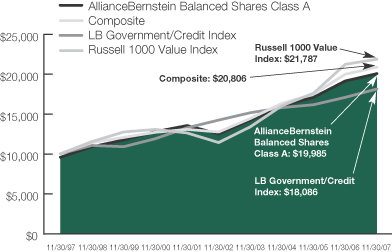
This chart illustrates the total value of an assumed $10,000 investment in AllianceBernstein Balanced Shares Class A shares (from 11/30/97 to 11/30/07) as compared to the performance of its composite benchmark, a 60%/40% blend of the Russell 1000 Value Index and the LB Government/Credit Index, respectively, as well as each index separately. The chart reflects the deduction of the maximum 4.25% sales charge from the initial $10,000 investment in the Fund and assumes the reinvestment of dividends and capital gains distributions.
See Historical Performance and Benchmark disclosures on previous page.
(Historical Performance continued on next page)
| | |
| ALLIANCEBERNSTEIN BALANCED SHARES • | | 5 |
Historical Performance
HISTORICAL PERFORMANCE
(continued from previous page)
| | | | | | |
| AVERAGE ANNUAL RETURNS AS OF NOVEMBER 30, 2007 | |
| | | NAV Returns | | | SEC Returns | |
| | | | | | |
| Class A Shares | | | | | | |
1 Year | | 4.82 | % | | 0.37 | % |
5 Years | | 9.88 | % | | 8.94 | % |
10 Years | | 7.64 | % | | 7.17 | % |
| | | | | | |
| Class B Shares | | | | | | |
1 Year | | 4.06 | % | | 0.07 | % |
5 Years | | 9.09 | % | | 9.09 | % |
10 Years(a) | | 6.99 | % | | 6.99 | % |
| | | | | | |
| Class C Shares | | | | | | |
1 Year | | 4.04 | % | | 3.04 | % |
5 Years | | 9.09 | % | | 9.09 | % |
10 Years | | 6.85 | % | | 6.85 | % |
| | | | | | |
| Advisor Class Shares† | | | | | | |
1 Year | | 5.11 | % | | 5.11 | % |
5 Years | | 10.20 | % | | 10.20 | % |
10 Years | | 7.93 | % | | 7.93 | % |
| | | | | | |
| Class R Shares† | | | | | | |
1 Year | | 4.47 | % | | 4.47 | % |
Since Inception* | | 8.53 | % | | 8.53 | % |
| | | | | | |
| Class K Shares† | | | | | | |
1 Year | | 4.74 | % | | 4.74 | % |
Since Inception* | | 6.91 | % | | 6.91 | % |
| | | | | | |
| Class I Shares† | | | | | | |
1 Year | | 5.12 | % | | 5.12 | % |
Since Inception* | | 7.26 | % | | 7.26 | % |
The Fund’s current prospectus fee table shows the Fund’s total annual operating expense ratios as 0.90%, 1.64%, 1.63%, 0.62%, 1.25%, 0.94% and 0.61% for Class A, Class B, Class C, Advisor Class, Class R, Class K and Class I shares, respectively.
(a) | Assumes conversion of Class B shares into Class A shares after eight years. |
| * | Inception Dates: 11/3/03 for Class R shares; 3/1/05 for Class K and Class I shares. |
| † | These share classes are offered at net asset value (NAV) to eligible investors and their SEC returns are the same as the NAV returns. Please note that these share classes are for investors purchasing shares through accounts established under certain fee-based programs sponsored and maintained by certain broker-dealers and financial intermediaries, institutional pension plans and/or investment advisory clients of, and certain other persons associated with, the Adviser and its affiliates or the Funds. The inception dates for Class R, Class K and Class I are listed above. |
See Historical Performance disclosures on page 4.
(Historical Performance continued on next page)
| | |
| 6 | | • ALLIANCEBERNSTEIN BALANCED SHARES |
Historical Performance
HISTORICAL PERFORMANCE
(continued from previous page)
| | | | | |
SEC AVERAGE ANNUAL RETURNS (WITH ANY APPLICABLE SALES CHARGES) AS OF THE MOST RECENT CALENDAR QUARTER-END (DECEMBER 31, 2007) | |
| | | | | SEC Returns | |
| | | | | |
| Class A Shares | | | | | |
1 Year | | | | -1.43 | % |
5 Years | | | | 9.43 | % |
10 Years | | | | 6.90 | % |
| | | | | |
| Class B Shares | | | | | |
1 Year | | | | -1.50 | % |
5 Years | | | | 9.59 | % |
10 Years(a) | | | | 6.73 | % |
| | | | | |
| Class C Shares | | | | | |
1 Year | | | | 1.27 | % |
5 Years | | | | 9.59 | % |
10 Years | | | | 6.58 | % |
| | | | | |
| Advisor Class Shares† | | | | | |
1 Year | | | | 3.26 | % |
5 Years | | | | 10.73 | % |
10 Years | | | | 7.66 | % |
| | | | | |
| Class R Shares† | | | | | |
1 Year | | | | 2.67 | % |
Since Inception* | | | | 8.29 | % |
| | | | | |
| Class K Shares† | | | | | |
1 Year | | | | 2.90 | % |
Since Inception* | | | | 6.61 | % |
| | | | | |
| Class I Shares† | | | | | |
1 Year | | | | 3.31 | % |
Since Inception* | | | | 6.97 | % |
(a) | Assumes conversion of Class B shares into Class A shares after eight years. |
| * | Inception Dates: 11/3/03 for Class R shares; 3/1/05 for Class K and Class I shares. |
| † | Please note that these share classes are for investors purchasing shares through accounts established under certain fee-based programs sponsored and maintained by certain broker-dealers and financial intermediaries, institutional pension plans and/or investment advisory clients of, and certain other persons associated with, the Adviser and its affiliates or the Funds. The inception dates for Class R, Class K and Class I are listed above. |
See Historical Performance disclosures on page 4.
| | |
| ALLIANCEBERNSTEIN BALANCED SHARES • | | 7 |
Historical Performance
FUND EXPENSES
As a shareholder of the Fund, you incur two types of costs: (1) transaction costs, including sales charges (loads) on purchase payments, contingent deferred sales charges on redemptions and (2) ongoing costs, including management fees; distribution (12b-l) fees; and other Fund expenses. This example is intended to help you understand your ongoing costs (in dollars) of investing in the Bund and to compare these costs with the ongoing costs of investing in other mutual funds.
The Example is based on an investment of $1,000 invested at the beginning of the period and held for the entire period as indicated below.
Actual Expenses
The table below provides information about actual account values and actual expenses. You may use the information, together with the amount you invested, to estimate the expenses that you paid over the period. Simply divide your account value by 31,000 (for example, an 58,600 account value divided by $1,000 = 8.6), then multiply the result by the number under the heading entitled “Expenses Paid During Period” to estimate the expenses you paid on your account during this period.
Hypothetical Example for Comparison Purposes
The table below also provides information about hypothetical account values and hypothetical expenses based on the Fund’s actual expense ratio and an assumed annual rate of return of 5% before expenses, which is not the Fund’s actual return. The hypothetical account values and expenses may not be used to estimate the actual ending account balance or expenses you paid for the period. You may use this information to compare the ongoing costs of investing in the Fund and other fends by comparing this 5% hypothetical example with the 5% hypothetical examples that appear in the shareholder reports of other funds.
Please note that the expenses shown in the table are meant to highlight your ongoing costs only and do not reflect any transactional costs, such as sales charges (loads), or contingent deferred sales charges on redemptions. Therefore, the hypothetical example is useful in comparing ongoing costs only, and will not help you determine the relative total costs of owning different funds. In addition, if these transactional costs were included, your costs would have been higher.
| | | | | | | | | | | | | | | | | | |
| | | Beginning Account Value June 1, 2007 | | Ending Account Value November 30, 2007 | | Expenses Paid During Period* |
| | | Actual | | Hypothetical | | Actual | | Hypothetical** | | Actual | | Hypothetical |
| Class A | | $ | 1,000 | | $ | 1,000 | | $ | 980.23 | | $ | 1,020.46 | | $ | 4.57 | | $ | 4.66 |
| Class B | | $ | 1,000 | | $ | 1,000 | | $ | 976.51 | | $ | 1,016.75 | | $ | 8.23 | | $ | 8.39 |
| Class C | | $ | 1,000 | | $ | 1,000 | | $ | 976.63 | | $ | 1,016.80 | | $ | 8.18 | | $ | 8.34 |
| Advisor Class | | $ | 1,000 | | $ | 1,000 | | $ | 981.62 | | $ | 1,021.91 | | $ | 3.13 | | $ | 3.19 |
| Class R | | $ | 1,000 | | $ | 1,000 | | $ | 978.35 | | $ | 1,018.90 | | $ | 6.10 | | $ | 6.23 |
| Class K | | $ | 1,000 | | $ | 1,000 | | $ | 980.02 | | $ | 1,020.41 | | $ | 4.62 | | $ | 4.71 |
| Class I | | $ | 1,000 | | $ | 1,000 | | $ | 981.66 | | $ | 1,022.11 | | $ | 2.93 | | $ | 2.99 |
| * | Expenses are equal to the classes’ annualized expense ratios of 0.92%, 1.66%, 1.65%, 0.63%, 1.23%, 0.93% and 0.59%, respectively, multiplied by the average account value over the period, multiplied by 183/365 (to reflect the one-half year period). |
| ** | Assumes 5% return before expenses. |
| | |
| 8 | | • ALLIANCEBERNSTEIN BALANCED SHARES |
Fund Expenses
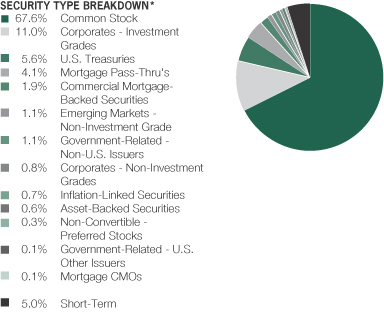
PORTFOLIO SUMMARY
November 30, 2007
PORTFOLIO STATISTICS
Net Assets ($mil): $1,595.3
TEN LARGEST HOLDINGS**
November 30, 2007
| | | | | | |
| Company | | U.S. $ Value | | Percent of Net Assets | |
United States Treasury Bonds | | $ | 72,922,973 | | 4.6 | % |
JP Morgan Chase & Co. | | | 52,077,451 | | 3.3 | |
Altria Group, Inc. | | | 49,956,005 | | 3.1 | |
Exxon Mobil Corp. | | | 45,471,600 | | 2.9 | |
Emerson Electric Co. | | | 41,653,110 | | 2.6 | |
WellPoint, Inc. | | | 40,782,962 | | 2.6 | |
American International Group, Inc. | | | 38,237,914 | | 2.4 | |
UnitedHealth Group, Inc. | | | 36,665,368 | | 2.3 | |
Federal National Mortgage Association | | | 35,952,954 | | 2.3 | |
ACE, Ltd. | | | 32,571,452 | | 2.0 | |
| | $ | 446,291,789 | | 28.1 | % |
| * | All data are as of November 30, 2007. The Fund’s security type breakdown is expressed as a percentage of total investments (excluding security lending collateral) and may vary over time. |
| | |
| ALLIANCEBERNSTEIN BALANCED SHARES • | | 9 |
Portfolio Summary and Ten Largest Holdings
PORTFOLIO OF INVESTMENTS
November 30, 2007
| | | | | |
| Company | | Shares | | U.S. $ Value |
| |
| | | | | |
COMMON STOCKS – 68.1% | | | | | |
Financials – 18.1% | | | | | |
Capital Markets – 4.8% | | | | | |
Bank of New York Mellon Corp. | | 171,793 | | $ | 8,239,192 |
Franklin Resources, Inc. | | 111,200 | | | 13,697,616 |
The Goldman Sachs Group, Inc. | | 15,100 | | | 3,422,264 |
Lehman Brothers Holdings, Inc. | | 206,700 | | | 12,945,621 |
Merrill Lynch & Co., Inc. | | 258,400 | | | 15,488,496 |
Northern Trust Corp.(a) | | 276,400 | | | 22,385,636 |
| | | | | |
| | | | | 76,178,825 |
| | | | | |
Commercial Banks – 0.9% | | | | | |
Wells Fargo & Co.(a) | | 458,000 | | | 14,852,940 |
| | | | | |
| | |
Diversified Financial Services – 5.8% | | | | | |
Bank of America Corp. | | 445,500 | | | 20,550,915 |
Citigroup, Inc. | | 629,294 | | | 20,955,490 |
JPMorgan Chase & Co. | | 1,115,700 | | | 50,898,234 |
| | | | | |
| | | | | 92,404,639 |
| | | | | |
Insurance – 6.1% | | | | | |
ACE Ltd. | | 544,400 | | | 32,571,452 |
American International Group, Inc. | | 657,800 | | | 38,237,914 |
Axis Capital Holdings Ltd. | | 494,400 | | | 18,856,416 |
Willis Group Holdings Ltd. | | 179,600 | | | 7,173,224 |
| | | | | |
| | | | | 96,839,006 |
| | | | | |
Thrifts & Mortgage Finance – 0.5% | | | | | |
Federal National Mortgage Association | | 201,300 | | | 7,733,946 |
| | | | | |
| | | | | 288,009,356 |
| | | | | |
Health Care – 11.3% | | | | | |
Health Care Equipment & Supplies – 0.7% | | | | | |
Becton Dickinson & Co. | | 126,900 | | | 10,498,437 |
| | | | | |
| | |
Health Care Providers & Services – 6.0% | | | | | |
Aetna, Inc. | | 267,000 | | | 14,919,960 |
Laboratory Corp. of America Holdings(a)(b) | | 61,900 | | | 4,498,273 |
UnitedHealth Group, Inc. | | 650,000 | | | 35,750,000 |
WellPoint, Inc.(b) | | 477,400 | | | 40,201,854 |
| | | | | |
| | | | | 95,370,087 |
| | | | | |
Pharmaceuticals – 4.6% | | | | | |
Eli Lilly & Co. | | 350,000 | | | 18,532,500 |
Forest Laboratories, Inc.(b) | | 177,800 | | | 6,854,190 |
Merck & Co., Inc. | | 290,000 | | | 17,214,400 |
Pfizer, Inc. | | 579,000 | | | 13,757,040 |
Schering-Plough Corp. | | 201,800 | | | 6,316,340 |
Wyeth | | 228,600 | | | 11,224,260 |
| | | | | |
| | | | | 73,898,730 |
| | | | | |
| | | | | 179,767,254 |
| | | | | |
| | |
| 10 | | • ALLIANCEBERNSTEIN BALANCED SHARES |
Portfolio of Investments
| | | | | |
| Company | |
Shares | | U.S. $ Value |
| |
| | | | | |
Energy – 9.1% | | | | | |
Energy Equipment & Services – 1.2% | | | | | |
Baker Hughes, Inc. | | 109,500 | | $ | 8,789,565 |
Cameron International Corp.(b) | | 30,200 | | | 2,815,546 |
Nabors Industries Ltd.(b) | | 292,100 | | | 7,857,490 |
| | | | | |
| | | | | 19,462,601 |
| | | | | |
Oil, Gas & Consumable Fuels – 7.9% | | | | | |
Chevron Corp. | | 320,200 | | | 28,103,954 |
ConocoPhillips | | 83,100 | | | 6,651,324 |
Exxon Mobil Corp. | | 510,000 | | | 45,471,600 |
Marathon Oil Corp. | | 100,800 | | | 5,634,720 |
Noble Energy, Inc. | | 145,300 | | | 10,467,412 |
Total SA (ADR) | | 367,600 | | | 29,746,192 |
| | | | | |
| | | | | 126,075,202 |
| | | | | |
| | | | | 145,537,803 |
| | | | | |
Information Technology – 8.7% | | | | | |
Communications Equipment – 0.7% | | | | | |
Cisco Systems, Inc.(b) | | 211,500 | | | 5,926,230 |
Qualcomm, Inc. | | 129,100 | | | 5,264,698 |
| | | | | |
| | | | | 11,190,928 |
| | | | | |
Computers & Peripherals – 3.1% | | | | | |
Hewlett-Packard Co. | | 77,600 | | | 3,970,016 |
International Business Machines Corp. | | 173,400 | | | 18,238,212 |
Sun Microsystems, Inc.(a)(b) | | 1,345,650 | | | 27,962,607 |
| | | | | |
| | | | | 50,170,835 |
| | | | | |
IT Services – 1.1% | | | | | |
Accenture Ltd.-Class A(a) | | 522,900 | | | 18,071,424 |
| | | | | |
| | |
Semiconductors & Semiconductor Equipment – 2.2% | | | | | |
Applied Materials, Inc. | | 347,900 | | | 6,550,957 |
Broadcom Corp.-Class A(b) | | 23,200 | | | 620,368 |
Integrated Device Technology, Inc.(b) | | 417,100 | | | 5,059,423 |
Intel Corp. | | 526,400 | | | 13,728,512 |
Nvidia Corp. (b) | | 263,200 | | | 8,301,328 |
| | | | | |
| | | | | 34,260,588 |
| | | | | |
Software – 1.6% | | | | | |
Microsoft Corp. | | 682,700 | | | 22,938,720 |
Oracle Corp.(b) | | 131,200 | | | 2,647,616 |
| | | | | |
| | | | | 25,586,336 |
| | | | | |
| | | | | 139,280,111 |
| | | | | |
Consumer Staples – 7.2% | | | | | |
Beverages – 0.4% | | | | | |
PepsiCo, Inc. | | 78,700 | | | 6,074,066 |
| | | | | |
| |
Food & Staples Retailing – 0.5% | | | |
Safeway, Inc. | | 244,300 | | | 8,501,640 |
| | | | | |
| | |
| ALLIANCEBERNSTEIN BALANCED SHARES • | | 11 |
Portfolio of Investments
| | | | | |
| Company | |
Shares | | U.S. $ Value |
| |
| | | | | |
| |
Food Products – 0.9% | | | |
HJ Heinz Co. | | 304,600 | | $ | 14,407,580 |
| | | | | |
| |
Household Products – 1.1% | | | |
Procter & Gamble Co. | | 234,600 | | | 17,360,400 |
| | | | | |
| |
Tobacco – 4.3% | | | |
Altria Group, Inc. | | 624,800 | | | 48,459,488 |
Loews Corp. – Carolina Group | | 221,000 | | | 19,657,950 |
| | | | | |
| | | | | 68,117,438 |
| | | | | |
| | | | | 114,461,124 |
| | | | | |
Industrials – 6.3% | | | |
Aerospace & Defense – 2.0% | | | |
Honeywell International, Inc. | | 117,000 | | | 6,624,540 |
United Technologies Corp. | | 346,300 | | | 25,892,851 |
| | | | | |
| | | | | 32,517,391 |
| | | | | |
| |
Commercial Services & Supplies – 0.3% | | | |
Dun & Bradstreet Corp. | | 61,200 | | | 5,460,876 |
| | | | | |
| |
Electrical Equipment – 2.6% | | | |
Emerson Electric Co. | | 730,500 | | | 41,653,110 |
| | | | | |
| |
Industrial Conglomerates – 0.9% | | | |
General Electric Co. | | 353,400 | | | 13,531,686 |
| | | | | |
| |
Machinery – 0.5% | | | |
Danaher Corp. | | 85,300 | | | 7,405,746 |
| | | | | |
| | | | | 100,568,809 |
| | | | | |
Consumer Discretionary – 3.7% | | | |
Media – 2.7% | | | |
Comcast Corp. – Class A(b) | | 140,959 | | | 2,895,298 |
News Corp. – Class A | | 706,500 | | | 14,885,955 |
Time Warner, Inc.(a) | | 945,400 | | | 16,317,604 |
Viacom, Inc.-Class B(b) | | 220,000 | | | 9,244,400 |
| | | | | |
| | | | | 43,343,257 |
| | | | | |
Multiline Retail – 0.8% | | | |
Kohl’s Corp.(b) | | 260,000 | | | 12,812,800 |
| | | | | |
| |
Specialty Retail – 0.2% | | | |
Lowe's Cos, Inc.(a) | | 100,000 | | | 2,441,000 |
| | | | | |
| | | | | 58,597,057 |
| | | | | |
Telecommunication Services – 2.5% | | | |
Diversified Telecommunication
Services – 2.5% | | | |
AT&T, Inc. | | 546,700 | | | 20,889,407 |
CenturyTel, Inc. | | 103,200 | | | 4,399,416 |
Verizon Communications, Inc. | | 340,600 | | | 14,717,326 |
| | | | | |
| | | | | 40,006,149 |
| | | | | |
| | |
| 12 | | • ALLIANCEBERNSTEIN BALANCED SHARES |
Portfolio of Investments
| | | | | | |
| Company | |
Shares | | U.S. $ Value |
| |
| | | | | | |
Materials – 1.2% | | | |
Chemicals – 1.2% | | | |
Air Products & Chemicals, Inc.(a) | | | 162,800 | | $ | 16,123,712 |
Dow Chemical Co. | | | 80,100 | | | 3,359,394 |
| | | | | | |
| | | | | | 19,483,106 |
| | | | | | |
Total Common Stocks
(cost $870,064,217) | | | | | | 1,085,710,769 |
| | | | | | |
| | |
| | | Principal
Amount
(000) | | |
CORPORATES – INVESTMENT
GRADES – 11.1% |
Industrial – 5.7% |
Basic – 0.6% |
The Dow Chemical Co.
7.375%, 11/01/29 | | $ | 95 | | | 103,924 |
Eastman Chemical Co.
7.25%, 1/15/24 | | | 800 | | | 883,882 |
Inco Ltd.
7.75%, 5/15/12 | | | 2,615 | | | 2,913,724 |
Lubrizol Corp.
5.50%, 10/01/14 | | | 1,450 | | | 1,455,555 |
Noranda, Inc.
6.00%, 10/15/15 | | | 1,645 | | | 1,663,533 |
Southern Copper Corp.
7.50%, 7/27/35 | | | 980 | | | 1,049,738 |
Weyerhaeuser Co.
7.375%, 3/15/32 | | | 1,290 | | | 1,295,906 |
| | | | | | |
| | | | | | 9,366,262 |
| | | | | | |
Capital Goods – 0.3% |
CRH America, Inc.
6.00%, 9/30/16 | | | 750 | | | 741,348 |
Hanson Australia Funding Ltd.
5.25%, 3/15/13 | | | 945 | | | 929,221 |
Hutchison Whampoa International Ltd.
7.45%, 11/24/33(c) | | | 500 | | | 563,830 |
Masco Corp.
7.75%, 8/01/29 | | | 1,250 | | | 1,372,349 |
Tyco International Group SA
6.00%, 11/15/13 | | | 1,005 | | | 1,041,240 |
Waste Management, Inc.
6.375%, 11/15/12 | | | 675 | | | 715,493 |
| | | | | | |
| | | | | | 5,363,481 |
| | | | | | |
Communications – Media – 0.6% |
BSKYB Finance UK PLC
5.625%, 10/15/15(c) | | | 680 | | | 682,388 |
Comcast Corp.
7.05%, 3/15/33 | | | 500 | | | 530,100 |
| | |
| ALLIANCEBERNSTEIN BALANCED SHARES • | | 13 |
Portfolio of Investments
| | | | | | |
| Company | | Principal
Amount
(000) | | U.S. $ Value |
| |
| | | | | | |
News America Holdings, Inc.
9.25%, 2/01/13 | | $ | 500 | | $ | 587,911 |
News America, Inc.
5.30%, 12/15/14 | | | 1,500 | | | 1,497,035 |
RR Donnelley & Sons Co.
5.50%, 5/15/15 | | | 1,400 | | | 1,370,775 |
The Thomson Corp.
5.75%, 2/01/08 | | | 400 | | | 400,870 |
Time Warner Cos, Inc.
7.57%, 2/01/24 | | | 535 | | | 575,598 |
Time Warner Entertainment Co.
8.375%, 3/15/23 | | | 2,000 | | | 2,330,034 |
Viacom, Inc.
7.875%, 7/30/30 | | | 325 | | | 351,965 |
WPP Finance Corp.
5.875%, 6/15/14 | | | 1,000 | | | 1,063,801 |
| | | | | | |
| | | | | | 9,390,477 |
| | | | | | |
Communications – Telecommunications – 1.5% | | | |
Bellsouth Capital Funding Corp.
7.12%, 7/15/97 | | | 2,625 | | | 2,744,729 |
BellSouth Corp.
5.20%, 9/15/14 | | | 2,135 | | | 2,120,640 |
Embarq Corp.
6.738%, 6/01/13 | | | 2,000 | | | 2,106,748 |
7.082%, 6/01/16 | | | 2,085 | | | 2,174,509 |
GTE Corp.
8.75%, 11/01/21 | | | 2,175 | | | 2,777,140 |
New Cingular Wireless Services, Inc.
8.75%, 3/01/31 | | | 1,250 | | | 1,615,741 |
Nextel Communications, Inc.
Series F
5.95%, 3/15/14 | | | 1,335 | | | 1,243,564 |
Qwest Corp.
7.50%, 10/01/14 | | | 1,265 | | | 1,280,812 |
7.875%, 9/01/11 | | | 940 | | | 970,550 |
Telefonos de Mexico SAB de CV
4.50%, 11/19/08 | | | 1,137 | | | 1,136,882 |
Telus Corp.
8.00%, 6/01/11 | | | 600 | | | 653,868 |
TPSA Finance BV
Series REGS
7.75%, 12/10/08(c) | | | 200 | | | 205,670 |
Verizon Virginia, Inc.
Series A
4.625%, 3/15/13 | | | 2,915 | | | 2,816,374 |
Vodafone Group PLC
7.875%, 2/15/30 | | | 1,165 | | | 1,378,179 |
| | | | | | |
| | | | | | 23,225,406 |
| | | | | | |
| | |
| 14 | | • ALLIANCEBERNSTEIN BALANCED SHARES |
Portfolio of Investments
| | | | | | |
| Company | | Principal
Amount
(000) | | U.S. $ Value |
| |
| | | | | | |
Consumer Cyclical – Other – 0.1% | | | |
DR Horton, Inc.
6.50%, 4/15/16 | | $ | 450 | | $ | 395,134 |
Starwood Hotels & Resorts Worldwide, Inc.
7.375%, 11/15/15 | | | 1,119 | | | 1,183,352 |
7.875%, 5/01/12 | | | 602 | | | 647,126 |
Toll Brothers Finance Corp.
5.15%, 5/15/15 | | | 210 | | | 185,522 |
| | | | | | |
| | | | | | 2,411,134 |
| | | | | | |
Consumer Non-Cyclical – 1.4% | | | |
Altria Group, Inc.
7.75%, 1/15/27(a) | | | 1,160 | | | 1,496,517 |
Anheuser-Busch Cos, Inc.
6.50%, 2/01/43 | | | 750 | | | 810,426 |
Bristol-Myers Squibb Co.
6.875%, 8/01/97 | | | 2,650 | | | 2,841,258 |
Cadbury Schweppes US Finance LLC
5.125%, 10/01/13(c) | | | 1,415 | | | 1,414,036 |
Fisher Scientific International, Inc.
6.125%, 7/01/15 | | | 3,260 | | | 3,253,239 |
Kraft Foods, Inc.
5.25%, 10/01/13 | | | 1,200 | | | 1,192,361 |
Kroger Co.
6.80%, 4/01/11 | | | 1,500 | | | 1,605,847 |
Reynolds American, Inc.
7.25%, 6/01/12 | | | 1,245 | | | 1,334,955 |
7.625%, 6/01/16 | | | 1,220 | | | 1,331,889 |
Safeway, Inc.
4.95%, 8/16/10 | | | 2,000 | | | 2,014,378 |
5.80%, 8/15/12 | | | 1,240 | | | 1,294,576 |
Sara Lee Corp.
6.125%, 11/01/32 | | | 600 | | | 583,178 |
Wyeth
6.50%, 2/01/34 | | | 2,250 | | | 2,400,422 |
| | | | | | |
| | | | | | 21,573,082 |
| | | | | | |
Energy – 0.5% | | | |
Amerada Hess Corp.
7.30%, 8/15/31 | | | 1,100 | | | 1,253,574 |
Gazprom
6.212%, 11/22/16(c) | | | 2,665 | | | 2,581,586 |
Norsk Hydro
6.36%, 1/15/09 | | | 370 | | | 377,400 |
Transocean, Inc.
7.50%, 4/15/31 | | | 1,185 | | | 1,396,642 |
Valero Energy Corp.
4.75%, 6/15/13 | | | 1,000 | | | 984,255 |
XTO Energy, Inc.
7.50%, 4/15/12 | | | 1,400 | | | 1,554,001 |
| | | | | | |
| | | | | | 8,147,458 |
| | | | | | |
| | |
| ALLIANCEBERNSTEIN BALANCED SHARES • | | 15 |
Portfolio of Investments
| | | | | | |
| Company | | Principal
Amount
(000) | | U.S. $ Value |
| |
| | | | | | |
Services—0.2% | | | |
The Western Union Co.
5.93%, 10/01/16 | | $ | 2,505 | | $ | 2,518,414 |
| | | | | | |
| |
Technology – 0.3% | | | |
Electronic Data Systems Corp.
Series B | | | | | | |
6.50%, 8/01/13 | | | 2,470 | | | 2,528,976 |
Motorola, Inc.
6.50%, 9/01/25 | | | 760 | | | 745,958 |
7.50%, 5/15/25 | | | 125 | | | 134,012 |
Xerox Corp.
7.625%, 6/15/13 | | | 230 | | | 240,336 |
9.75%, 1/15/09 | | | 847 | | | 881,207 |
| | | | | | |
| | | | | | 4,530,489 |
| | | | | | |
Transportation – Airlines – 0.2% | | | |
Southwest Airlines Co.
5.25%, 10/01/14 | | | 3,280 | | | 3,224,306 |
| | | | | | |
| |
Transportation – Railroads – 0.0% | | | |
CSX Corp. | | | | | | |
5.50%, 8/01/13 | | | 400 | | | 402,016 |
Norfolk Southern Corp. | | | | | | |
7.90%, 5/15/97 | | | 330 | | | 387,768 |
| | | | | | |
| | | | | | 789,784 |
| | | | | | |
| | | | | | 90,540,293 |
| | | | | | |
Financial Institutions – 4.4% | | | |
Banking – 2.3% | | | |
Bank of Tokyo-Mitsubishi UFJ L
7.40%, 6/15/11 | | | 1,600 | | | 1,733,565 |
Barclays Bank PLC
8.55%, 6/15/11(c)(d) | | | 1,000 | | | 1,084,429 |
BB&T Capital Trust IV
6.82%, 6/12/57(d) | | | 1,325 | | | 1,188,692 |
Chase Manhattan Corp.
6.00%, 2/15/09 | | | 1,250 | | | 1,262,380 |
The Chuo Mitsui Trust & Banking Co., Ltd.
5.506%, 4/15/15(c)(d) | | | 1,745 | | | 1,600,036 |
Citicorp
6.375%, 11/15/08 | | | 239 | | | 242,144 |
Citigroup, Inc.
3.625%, 2/09/09 | | | 1,290 | | | 1,276,348 |
Dresdner Funding Trust I
8.151%, 6/30/31(c) | | | 2,625 | | | 2,692,447 |
Fuji JGB Investment
9.87%, 6/30/08(c)(d) | | | 390 | | | 401,591 |
HBOS PLC
5.375%, 11/01/13(c)(d) | | | 2,100 | | | 1,921,294 |
6.413%, 10/01/35(c)(d) | | | 3,000 | | | 2,527,551 |
| | |
| 16 | | • ALLIANCEBERNSTEIN BALANCED SHARES |
Portfolio of Investments
| | | | | | |
| Company | | Principal
Amount
(000) | | U.S. $ Value |
| |
| | | | | | |
HSBC Bank USA
5.875%, 11/01/34 | | $ | 2,500 | | $ | 2,216,220 |
Morgan J P & Co., Inc.
6.25%, 1/15/09 | | | 1,164 | | | 1,179,217 |
MUFG Capital Finance 1 Ltd.
6.346%, 7/25/16(d) | | | 1,290 | | | 1,238,537 |
Northern Rock PLC
5.60%, 4/30/14(c)(d) | | | 2,975 | | | 1,814,750 |
Popular North America, Inc.
4.25%, 4/01/08 | | | 385 | | | 383,488 |
Rabobank Capital Funding II
5.26%, 12/31/13(c)(d) | | | 1,100 | | | 1,055,493 |
RBS Capital Trust III
5.512%, 9/30/14(d) | | | 2,740 | | | 2,484,531 |
Regions Financing Trust II
6.625%, 5/15/47(d) | | | 1,290 | | | 1,104,240 |
Resona Preferred Global Securities
7.191%, 7/30/15(c)(d) | | | 1,145 | | | 1,089,497 |
Royal Bank of Scotland Group PLC
7.648%, 9/30/31(d) | | | 1,000 | | | 972,137 |
Sumitomo Mitsui Banking Corp.
5.625%, 10/15/15(c)(d) | | | 550 | | | 513,754 |
UBS Preferred Funding Trust II
7.247%, 6/26/11(d) | | | 1,000 | | | 1,051,931 |
UBS Preferred Funding Trust V
Series 1
6.243%, 5/15/16(d) | | | 2,575 | | | 2,410,563 |
UFJ Finance Aruba AEC
6.75%, 7/15/13 | | | 1,565 | | | 1,702,060 |
Unicredito Italiano Capital Trust II
9.20%, 10/05/10(c)(d) | | | 1,320 | | | 1,442,229 |
Wachovia Capital Trust III
5.80%, 3/15/11(d) | | | 670 | | | 644,553 |
Washington Mutual, Inc.
4.20%, 1/15/10 | | | 105 | | | 96,083 |
| | | | | | |
| | | | | | 37,329,760 |
| | | | | | |
Brokerage – 0.4% | | | |
The Goldman Sachs Group, Inc. | | | | | | |
3.875%, 1/15/09 | | | 1,024 | | | 1,012,622 |
5.70%, 9/01/12 | | | 2,610 | | | 2,682,373 |
7.35%, 10/01/09 | | | 276 | | | 288,998 |
Merrill Lynch & Co., Inc
4.125%, 1/15/09 | | | 371 | | | 365,363 |
Merrill Lynch & Co., Inc.
4.125%, 9/10/09(a) | | | 1,310 | | | 1,289,493 |
| | | | | | |
| | | | | | 5,638,849 |
| | | | | | |
Finance—0.7% | | | |
Capital One Bank
6.50%, 6/13/13 | | | 1,600 | | | 1,587,256 |
| | |
| ALLIANCEBERNSTEIN BALANCED SHARES • | | 17 |
Portfolio of Investments
| | | | | | |
| Company | | Principal
Amount
(000) | | U.S. $ Value |
| |
| | | | | | |
Capital One Financial Corp.
5.50%, 6/01/15 | | $ | 173 | | $ | 158,256 |
CIT Group, Inc.
3.375%, 4/01/09 | | | 1,235 | | | 1,185,914 |
Countrywide Financial Corp.
6.25%, 5/15/16 | | | 2,206 | | | 1,390,023 |
Series MTN | | | | | | |
5.80%, 6/07/12 | | | 512 | | | 383,898 |
Countrywide Home Loans, Inc.
Series MTNL | | | | | | |
4.00%, 3/22/11 | | | 56 | | | 42,591 |
General Electric Capital Corp.
5.875%, 2/15/12 | | | 2,250 | | | 2,359,825 |
International Lease Finance Corp.
6.375%, 3/15/09 | | | 1,245 | | | 1,260,184 |
iStar Financial, Inc.
5.15%, 3/01/12 | | | 230 | | | 198,540 |
6.00%, 12/15/10 | | | 800 | | | 726,792 |
Series B | | | | | | |
5.95%, 10/15/13 | | | 515 | | | 440,674 |
SLM Corp.
5.375%, 1/15/13 | | | 1,335 | | | 1,190,295 |
| | | | | | |
| | | | | | 10,924,248 |
| | | | | | |
Insurance—0.9% | | | |
The Allstate Corp.
6.125%, 5/15/17(a)(d) | | | 1,245 | | | 1,206,578 |
CNA Financial Corp.
5.85%, 12/15/14 | | | 480 | | | 479,841 |
ING Capital Funding Trust III
8.439%, 12/31/10(d) | | | 1,000 | | | 1,061,239 |
ING Groep NV
5.775%, 12/08/15(d) | | | 2,925 | | | 2,688,236 |
Liberty Mutual Group, Inc.
5.75%, 3/15/14(c) | | | 1,600 | | | 1,628,312 |
Lincoln National Corp.
7.00%, 5/17/66(d) | | | 2,755 | | | 2,751,721 |
North Front Pass Through Trust
5.81%, 12/15/24(c)(d) | | | 2,213 | | | 2,124,520 |
UnitedHealth Group, Inc.
5.25%, 3/15/11 | | | 900 | | | 915,368 |
WellPoint, Inc.
5.25%, 1/15/16 | | | 600 | | | 581,108 |
ZFS Finance USA Trust I
6.15%, 12/15/65(c)(d) | | | 1,000 | | | 963,636 |
| | | | | | |
| | | | | | 14,400,559 |
| | | | | | |
REITS – 0.1% | | | |
Regency Centers LP
5.25%, 8/01/15 | | | 1,800 | | | 1,726,024 |
| | | | | | |
| | | | | | 70,019,440 |
| | | | | | |
| | |
| 18 | | • ALLIANCEBERNSTEIN BALANCED SHARES |
Portfolio of Investments
| | | | | | |
| Company | | Principal
Amount
(000) | | U.S. $ Value |
| |
| | | | | | |
Utility – 1.0% | | | | | | |
Electric – 0.5% | | | | | | |
Consumers Energy Co.
Series D
5.375%, 4/15/13 | | $ | 1,700 | | $ | 1,712,225 |
Dominion Resources, Inc./VA
7.50%, 6/30/66(d) | | | 3,120 | | | 3,125,978 |
FPL Group Capital, Inc.
6.35%, 10/01/66(d) | | | 430 | | | 408,582 |
6.65%, 6/15/67(d) | | | 1,290 | | | 1,248,702 |
SPI Electricity & Gas Australia Holdings Pty Ltd.
6.15%, 11/15/13(c) | | | 1,200 | | | 1,234,886 |
| | | | | | |
| | | | | | 7,730,373 |
| | | | | | |
Natural Gas – 0.5% | | | | | | |
CenterPoint Energy Resources Corp.
Series B
7.875%, 4/01/13 | | | 2,300 | | | 2,552,402 |
Enterprise Products Operating LP
Series B
5.60%, 10/15/14 | | | 1,850 | | | 1,871,112 |
Texas Eastern Transmission Corp.
7.30%, 12/01/10(a) | | | 1,700 | | | 1,827,233 |
TransCanada Pipelines Ltd.
6.35%, 5/15/67(d) | | | 1,365 | | | 1,309,991 |
| | | | | | |
| | | | | | 7,560,738 |
| | | | | | |
| | | | | | 15,291,111 |
| | | | | | |
Non Corporate Sectors – 0.0% | | | | | | |
Agencies – Not Government
Guaranteed – 0.0% | | | | | | |
Petronas Capital, Ltd.
7.00%, 5/22/12(c) | | | 850 | | | 930,921 |
| | | | | | |
| | |
Total Corporates – Investment Grades
(cost $179,947,345) | | | | | | 176,781,765 |
| | | | | | |
| | | | | | |
U.S. TREASURIES – 5.6% | | | | | | |
U.S. Treasury Bonds | | | | | | |
4.50%, 2/15/36(a) | | | 31,040 | | | 31,471,642 |
8.75%, 5/15/17 | | | 25,477 | | | 34,853,733 |
11.25%, 2/15/15 | | | 4,503 | | | 6,597,598 |
U.S. Treasury Notes | | | | | | |
4.25%, 11/15/17 | | | 9,900 | | | 10,127,393 |
5.125%, 5/15/16 | | | 6,386 | | | 6,928,810 |
| | | | | | |
| | |
Total U.S. Treasuries
(cost $85,211,604) | | | | | | 89,979,176 |
| | | | | | |
| | |
| ALLIANCEBERNSTEIN BALANCED SHARES • | | 19 |
Portfolio of Investments
| | | | | | |
| Company | | Principal
Amount
(000) | | U.S. $ Value |
| |
| | | | | | |
MORTGAGE PASS-THRU’S – 4.2% | | | | | | |
Fixed Rate 30-Year – 2.9% | | | | | | |
Federal Gold Loan Mortgage Corp.
Series 2006
7.00%, 8/01/36 | | $ | 7,014 | | $ | 7,285,500 |
Federal Home Loan Mortgage Corp.
Series 2006
6.00%, 9/01/36 - 11/01/36 | | | 2,156 | | | 2,188,561 |
Series 2007
5.50%, 7/01/35 | | | 1,948 | | | 1,954,840 |
6.00%, 6/01/37 - 8/01/37 | | | 15,019 | | | 15,247,798 |
Federal National Mortgage Association
Series 2003
5.00%, 11/01/33 | | | 9,293 | | | 9,129,272 |
Series 2004
5.50%, 11/01/34 | | | 293 | | | 294,312 |
Series 2006
6.50%, 9/01/36 | | | 3,898 | | | 4,009,636 |
Series 2007
5.00%, 7/01/36 | | | 2,159 | | | 2,119,865 |
5.50%, 2/01/36 - 9/01/36 | | | 4,230 | | | 4,241,249 |
| | | | | | |
| | | | | | 46,471,033 |
| | | | | | |
Agency ARMS – 1.3% | | | | | | |
Federal Home Loan Mortgage Corp.
Series 2006
5.948%, 1/01/37(e) | | | 654 | | | 663,808 |
6.029%, 9/01/36(e) | | | 3,877 | | | 3,941,321 |
6.161%, 12/01/36(e) | | | 667 | | | 678,790 |
Series 2007
5.79%, 2/01/37(e) | | | 2,421 | | | 2,451,063 |
5.988%, 2/01/37(e) | | | 688 | | | 699,803 |
6.102%, 1/01/37(e) | | | 310 | | | 315,840 |
6.121%, 1/01/37(e) | | | 2,750 | | | 2,801,470 |
Federal National Mortgage Association
Series 2006
4.81%, 1/01/36(e) | | | 650 | | | 651,757 |
6.00%, 5/01/36(e) | | | 1,265 | | | 1,291,494 |
Series 2007
5.747%, 12/01/36(e) | | | 687 | | | 698,059 |
5.79%, 8/01/37(e) | | | 1,667 | | | 1,712,009 |
5.925%, 2/01/37(e) | | | 718 | | | 732,114 |
6.028%, 2/01/37(e) | | | 3,275 | | | 3,339,241 |
| | | | | | |
| | | | | | 19,976,769 |
| | | | | | |
Total Mortgage Pass-Thru’s
(cost $65,162,820) | | | | | | 66,447,802 |
| | | | | | |
| | |
| 20 | | • ALLIANCEBERNSTEIN BALANCED SHARES |
Portfolio of Investments
| | | | | | |
| Company | | Principal
Amount
(000) | | U.S. $ Value |
| |
| | | | | | |
COMMERCIAL MORTGAGE-BACKED SECURITIES – 1.9% | | | | | | |
Non-Agency Fixed Rate CMBS – 1.9% | | | | | | |
Banc of America Commercial Mortgage, Inc.
Series 2001-PB1, Class A2
5.787%, 5/11/35 | | $ | 9,565 | | $ | 9,724,516 |
Bear Stearns Commercial Mortgage
Securities, Inc.
Series 2005-PW10, Class A4
5.405%, 12/11/40 | | | 7,520 | | | 7,471,845 |
Greenwich Capital Commercial Funding Corp.
Series 2003-C2, Class A3
4.533%, 1/05/36 | | | 5,000 | | | 4,925,819 |
GS Mortgage Securities Corp. II
Series 2004-GG2, Class A6
5.396%, 8/10/38 | | | 2,400 | | | 2,400,477 |
LB-UBS Commercial Mortgage Trust
Series 2004-C7, Class A2
3.992%, 10/15/29 | | | 1,095 | | | 1,074,353 |
Series 2007-C7, Class A3
5.866%, 9/15/45 | | | 4,925 | | | 5,020,348 |
| | | | | | |
Total Commercial Mortgage-Backed Securities
(cost $30,773,717) | | | | | | 30,617,358 |
| | | | | | |
| | | | | | |
EMERGING MARKETS – NON-INVESTMENT GRADES – 1.1% | | | | | | |
Non Corporate Sectors – 1.1% | | | |
Sovereign – 1.1% | | | |
Republic of Brazil
8.25%, 1/20/34 | | | 6,330 | | | 7,944,150 |
Republic of Panama
9.375%, 4/01/29 | | | 2,010 | | | 2,701,440 |
Republic of Peru
8.75%, 11/21/33 | | | 3,030 | | | 4,004,145 |
Republic of Philippines
8.25%, 1/15/14 | | | 1,892 | | | 2,098,228 |
8.875%, 3/17/15 | | | 342 | | | 399,798 |
| | | | | | |
| | |
Total Emerging Markets – Non-Investment Grades (cost $17,304,988) | | | | | | 17,147,761 |
| | | | | | |
| | | | | | |
GOVERNMENT - RELATED – NON-U.S. ISSUERS – 1.1% | | | | | | |
Sovereigns – 1.1% | | | |
Republic of South Africa
7.375%, 4/25/12 | | | 3,000 | | | 3,270,000 |
Russian Federation
7.50%, 3/31/30(c)(f) | | | 7,024 | | | 7,982,833 |
| | |
| ALLIANCEBERNSTEIN BALANCED SHARES • | | 21 |
Portfolio of Investments
| | | | | | |
| Company | | Principal
Amount
(000) | | U.S. $ Value |
| |
| | | | | | |
United Mexican States
5.625%, 1/15/17 | | $ | 5,538 | | $ | 5,621,070 |
| | | | | | |
| | |
Total Government-Related – Non-U.S. Issuers
(cost $16,478,651) | | | | | | 16,873,903 |
| | | | | | |
| | | | | | |
CORPORATES – NON-INVESTMENT
GRADES – 0.8% | | | |
Industrial – 0.7% | | | |
Basic – 0.2% | | | |
Freeport-McMoRan Copper & Gold, Inc.
8.25%, 4/01/15 | | | 490 | | | 523,075 |
8.375%, 4/01/17 | | | 490 | | | 529,200 |
Packaging Corp. of America
4.375%, 8/01/08 | | | 1,800 | | | 1,778,562 |
| | | | | | |
| | | | | | 2,830,837 |
| | | | | | |
Capital Goods – 0.0% | | | |
Bombardier, Inc.
6.75%, 5/01/12(c) | | | 525 | | | 528,937 |
| | | | | | |
| |
Communications – Media – 0.2% | | | |
Clear Channel Communications, Inc.
5.50%, 9/15/14 | | | 1,195 | | | 952,824 |
Echostar DBS Corp.
6.625%, 10/01/14 | | | 145 | | | 146,812 |
7.125%, 2/01/16 | | | 375 | | | 390,469 |
RH Donnelley Corp.
Series A-3
8.875%, 1/15/16 | | | 1,100 | | | 1,039,500 |
| | | | | | |
| | | | | | 2,529,605 |
| | | | | | |
Communications – Telecommunications – 0.1% | | | |
Mobile Telesystems Finance SA
Series REGS
9.75%, 1/30/08(c) | | | 1,000 | | | 1,000,060 |
Windstream Corp.
8.125%, 8/01/13 | | | 1,187 | | | 1,221,126 |
| | | | | | |
| | | | | | 2,221,186 |
| | | | | | |
Consumer Cyclical – Automotive – 0.1% | | | |
Ford Motor Credit Co.
4.95%, 1/15/08 | | | 1,065 | | | 1,060,751 |
| | | | | | |
| |
Consumer Cyclical – Other – 0.1% | | | |
Harrah's Operating Co., Inc
5.625%, 6/01/15 | | | 931 | | | 693,595 |
5.75%, 10/01/17 | | | 96 | | | 68,640 |
6.50%, 6/01/16 | | | 298 | | | 226,480 |
MGM Mirage
6.75%, 9/01/12 | | | 440 | | | 426,250 |
| | |
| 22 | | • ALLIANCEBERNSTEIN BALANCED SHARES |
Portfolio of Investments
| | | | | | |
| Company | | Principal
Amount
(000) | | U.S. $ Value |
| |
| | | | | | |
Wynn Las Vegas LLC/Corp.
6.625%, 12/01/14 | | $ | 325 | | $ | 315,250 |
| | | | | | |
| | | | | | 1,730,215 |
| | | | | | |
| | | | | | 10,901,531 |
| | | | | | |
Utility – 0.1% | | | |
Electric – 0.1% | | | |
Dynegy Holdings, Inc.
8.375%, 5/01/16 | | | 565 | | | 543,106 |
Edison Mission Energy
7.00%, 5/15/17 | | | 400 | | | 383,000 |
NRG Energy, Inc.
7.25%, 2/01/14 | | | 525 | | | 513,188 |
Reliant Energy, Inc.
7.625%, 6/15/14 | | | 530 | | | 511,450 |
| | | | | | |
| | | | | | 1,950,744 |
| | | | | | |
Financial Institutions – 0.0% | | | |
Insurance – 0.0% | | | |
Liberty Mutual Group, Inc.
7.80%, 3/15/37(c) | | | 740 | | | 669,108 |
| | | | | | |
| | |
Total Corporates – Non-Investment Grades
(cost $13,939,678) | | | | | | 13,521,383 |
| | | | | | |
INFLATION-LINKED SECURITIES – 0.7% | | | | | | |
U.S. Treasury Notes
2.375%, 4/15/11 (TIPS)
(cost $10,536,754) | | | 10,671 | | | 11,127,065 |
| | | | | | |
ASSET-BACKED SECURITIES – 0.6% | | | | | | |
Home Equity Loans – Floating Rate – 0.4% | | | | | | |
Household Home Equity Loan trust
Series 2007-1, Class M1
5.12%, 3/20/36(e) | | | 2,680 | | | 1,608,000 |
Indymac Residential Asset Backed Trust
Series 2006-D, Class 2A2
4.899%, 11/25/36(e) | | | 1,450 | | | 1,367,758 |
Newcastle Mortgage Securities Trust
Series 2007-1, Class 2A1
4.919%, 4/25/37(e) | | | 2,293 | | | 2,199,195 |
Option One Mortgage Loan Trust
Series 2007-2, Class M1
5.149%, 3/25/37(e) | | | 930 | | | 413,850 |
| | | | | | |
| | | | | | 5,588,803 |
| | | | | | |
Home Equity Loans – Fixed Rate – 0.1% | | | | | | |
Countrywide Asset-Backed Certificates
Series 2007-S1, Class A3
5.81%, 11/25/36 | | | 2,775 | | | 2,318,707 |
| | | | | | |
| | |
| ALLIANCEBERNSTEIN BALANCED SHARES • | | 23 |
Portfolio of Investments
| | | | | | |
| Company | | Principal
Amount
(000) | | U.S. $ Value |
| |
| | | | | | |
Other – Floating Rate – 0.1% | | | | | | |
Ballyrock ABS CDO Ltd.
Series 2007-1A, Class A1B
5.615%, 8/06/47(c)(e)(g) | | $ | 613 | | $ | 91,950 |
Halcyon Securitized Product Investors
Series 2007-1A, Class A2
5.879%, 5/13/46(c)(e)(g) | | | 335 | | | 40,200 |
Libertas Preferred Funding Ltd.
Series 2007-3A, Class 2
5.893%, 4/09/47(c)(e)(g) | | | 1,915 | | | 191,500 |
Neapolitan Segregated Portfolio
Series 2007-1A, Class I
6.32%, 3/30/46(c)(e)(g) | | | 655 | | | 131,000 |
Petra CRE CDO Ltd.
Series 2007-1A, Class C
5.889%, 2/25/47(c)(e) | | | 795 | | | 703,328 |
| | | | | | |
| | | | | | 1,157,978 |
| | | | | | |
Total Asset-Backed Securities
(cost $14,375,307) | | | | | | 9,065,488 |
| | | | | | |
| | |
| | | Shares | | |
NON-CONVERTIBLE – PREFERRED
STOCKS – 0.3% | | | | | | |
Utility – 0.1% | | | |
Electric – 0.1% | | | |
Dte Energy Trust I
7.80% | | | 60,000 | | | 1,498,200 |
| | | | | | |
| |
Industrial – 0.1% | | | |
Communications –
Telecommunications – 0.1% | | | |
Centaur Funding Corp.
9.08%(c) | | | 1,200 | | | 1,386,750 |
| | | | | | |
| |
Financial Institutions – 0.1% | | | |
Banking – 0.1% | | | |
Royal Bank of Scotland Group PLC
5.75% | | | 50,000 | | | 965,000 |
| | | | | | |
| |
Non Corporate Sectors – 0.0% | | | |
Agencies – Government Sponsored – 0.0% | | | |
Federal Home Loan Mortgage Corp.
8.375% | | | 18,050 | | | 460,275 |
| | | | | | |
| | |
Total Non-Convertible – Preferred Stocks
(cost $4,648,340) | | | | | | 4,310,225 |
| | | | | | |
| | |
| 24 | | • ALLIANCEBERNSTEIN BALANCED SHARES |
Portfolio of Investments
| | | | | | | |
| Company | | Principal
Amount
(000) | | U.S. $ Value | |
| | |
| | | | | | | |
GOVERNMENT-RELATED – U.S. OTHER ISSUERS – 0.1% | | | | | | | |
Texas – 0.1% | | | | |
Dallas-Fort Worth Int'l Arpt Fac Impr Corp. MBIA FSA
7.07%, 11/01/24
(cost $2,041,748) | | $ | 2,000 | | $ | 2,073,060 | |
| | | | | | | |
| | | | | | | |
MORTGAGE CMO’S – 0.1% | | | | |
Non-Agency Fixed Rate – 0.1% | | | | |
Deutsche Mortgage Securities, Inc.
Series 2005-WF1, Class 1A1
5.073%, 6/26/35(c) | | | 1,178 | | | 1,168,798 | |
| | | | | | | |
| |
Non-Agency Adjustable Rate – 0.0% | | | | |
Countrywide Alternative Loan Trust
Series 2007-OA3, Class M1
5.099%, 4/25/47(e) | | | 780 | | | 599,001 | |
| | | | | | | |
| | |
Total Mortgage CMO’s
(cost $1,940,639) | | | | | | 1,767,799 | |
| | | | | | | |
| | |
| | | Shares | | | |
SHORT-TERM INVESTMENTS – 5.0% | | | | |
Investment Companies – 5.0% | | | | |
AllianceBernstein Fixed-Income Shares, Inc. – Government STIF Portfolio(h)
(cost $79,853,606) | | | 79,853,606 | | | 79,853,606 | |
| | | | | | | |
| | |
Total Investments Before Security Lending Collateral – 100.7%
(cost $1,392,279,433) | | | | | | 1,605,277,160 | |
| | | | | | | |
| | | | | | | |
INVESTMENT OF CASH COLLATERAL FOR SECURITIES LOANED – 8.2% | | | | | | | |
Short-Terms – 8.2% | | | | |
UBS Private Money Market Fund, LLC
(cost $131,215,758) | | | 131,215,758 | | | 131,215,758 | |
| | | | | | | |
| | |
Total Investments – 108.9%
(cost $1,523,495,191) | | | | | | 1,736,492,918 | |
Other assets less liabilities – (8.9)% | | | | | | (141,199,241 | ) |
| | | | | | | |
| | |
Net Assets – 100.0% | | | | | $ | 1,595,293,677 | |
| | | | | | | |
| | |
| ALLIANCEBERNSTEIN BALANCED SHARES • | | 25 |
Portfolio of Investments
| (a) | Represents entire or partial securities out on loan. See Note E for securities lending information. |
| (b) | Non-income producing security. |
| (c) | Security is exempt from registration under Rule 144A of the Securities Act of 1933. These securities are considered liquid and may be resold in transactions exempt from registration, normally to qualified institutional buyers. At November 30, 2007, the aggregate market value of these securities amounted to $42,367,319 or 2.7% of net assets. |
| (d) | Variable rate coupon, rate shown as of November 30, 2007. |
| (e) | Floating Rate Security. Stated interest rate was in effect at November 30, 2007. |
| (f) | Coupon rate adjusts periodically based upon a predetermined schedule. Stated interest rate in effect at November 30, 2007. |
| (g) | Illiquid security, valued at fair value. (See note A) |
| (h) | Investment in affiliated money market mutual fund. |
The Fund currently owns investments collateralized by subprime mortgage loans. Subprime loans are offered to homeowners who do not have a history of debt or who have had problems meeting their debt obligations. Because repayment is less certain, subprime borrowers pay a higher rate of interest than prime borrowers. As of November 30, 2007, the Fund’s total exposure to subprime investments was 0.52%. These investments are valued in accordance with the Fund’s Valuation Policies (see Note A.1 for additional details).
| ADR | – American Depositary Receipt |
| FSA | – Financial Security Assurance Inc. |
| MBIA | – Municipal Bond Investors Assurance |
| TIPS | – Treasury Inflation Protected Security |
| See | notes to financial statements. |
| | |
| 26 | | • ALLIANCEBERNSTEIN BALANCED SHARES |
Portfolio of Investments
STATEMENT OF ASSETS & LIABILITIES
November 30, 2007
| | | | |
| Assets | | | | |
Investments in securities, at value | | | | |
Unaffiliated issuers (cost $1,443,641,585 — including investment of cash collateral for securities loaned of $131,215,758) | | $ | 1,656,639,312 | (a) |
Affiliated issuers (cost $79,853,606) | | | 79,853,606 | |
Cash | | | 18,126 | |
Receivable for investment securities sold | | | 16,074,707 | |
Dividends and interest receivable | | | 6,962,139 | |
Receivable for capital stock sold | | | 5,365,914 | |
| | | | |
Total assets | | | 1,764,913,804 | |
| | | | |
| Liabilities | | | | |
Payable for collateral received on securities loaned | | | 131,215,758 | |
Payable for investment securities purchased | | | 27,499,839 | |
Payable for capital stock redeemed | | | 9,253,197 | |
Distribution fee payable | | | 667,151 | |
Advisory fee payable | | | 571,292 | |
Transfer Agent fee payable | | | 199,063 | |
Administrative fee payable | | | 25,375 | |
Accrued expenses and other liabilities | | | 188,452 | |
| | | | |
Total liabilities | | | 169,620,127 | |
| | | | |
Net Assets | | $ | 1,595,293,677 | |
| | | | |
| Composition of Net Assets | | | | |
Capital stock, at par | | $ | 889,250 | |
Additional paid-in capital | | | 1,256,818,696 | |
Undistributed net investment income | | | 5,902,789 | |
Accumulated net realized gain on investment transactions | | | 118,690,682 | |
Net unrealized appreciation of investments and foreign currency denominated assets and liabilities | | | 212,992,260 | |
| | | | |
| | $ | 1,595,293,677 | |
| | | | |
Net Asset Value Per Share—21 billion shares of capital stock authorized, $.01 par value
| | | | | | | | | |
| Class | | Net Assets | | Shares
Outstanding | | Net Asset
Value | |
| A | | $ | 956,156,685 | | 52,316,881 | | $ | 18.28 | * |
| | | | | | | | | | |
| B | | $ | 360,547,506 | | 20,880,589 | | $ | 17.27 | |
| | | | | | | | | | |
| C | | $ | 168,495,409 | | 9,713,445 | | $ | 17.35 | |
| | | | | | | | | | |
| Advisor | | $ | 91,198,338 | | 4,978,094 | | $ | 18.32 | |
| | | | | | | | | | |
| R | | $ | 8,432,351 | | 462,548 | | $ | 18.23 | |
| | | | | | | | | | |
| K | | $ | 7,715,095 | | 422,959 | | $ | 18.24 | |
| | | | | | | | | | |
| I | | $ | 2,748,293 | | 150,483 | | $ | 18.26 | |
| | | | | | | | | | |
| * | The maximum offering price per share for Class A shares was $19.09 which reflects a sales charge of 4.25%. |
| (a) | Includes securities on loan with a value of $128,700,958 (see Note E). |
| | See notes to financial statements. |
| | |
| ALLIANCEBERNSTEIN BALANCED SHARES • | | 27 |
Statement of Assets & Liabilities
STATEMENT OF OPERATIONS
Year Ended November 30, 2007
| | | | | | | | |
| Investment Income | | | | | | | | |
Interest | | $ | 27,350,226 | | | | | |
Dividends | | | | | | | | |
Unaffiliated issuers (net of foreign taxes withheld of $17,326) | | | 21,931,875 | | | | | |
Affiliated issuers | | | 1,808,376 | | | $ | 51,090,477 | |
| | | | | | | | |
| Expenses | | | | | | | | |
Advisory fee (see Note B) | | | 7,378,157 | | | | | |
Distribution fee—Class A | | | 2,814,603 | | | | | |
Distribution fee—Class B | | | 4,300,712 | | | | | |
Distribution fee—Class C | | | 1,766,053 | | | | | |
Distribution fee—Class R | | | 29,876 | | | | | |
Distribution fee—Class K | | | 14,685 | | | | | |
Transfer agency—Class A | | | 1,347,341 | | | | | |
Transfer agency—Class B | | | 743,885 | | | | | |
Transfer agency—Class C | | | 288,480 | | | | | |
Transfer agency—Advisor Class | | | 141,704 | | | | | |
Transfer agency—Class R | | | 14,477 | | | | | |
Transfer agency—Class K | | | 10,932 | | | | | |
Transfer agency—Class I | | | 4,298 | | | | | |
Custodian | | | 385,445 | | | | | |
Printing | | | 257,360 | | | | | |
Registration fees | | | 125,517 | | | | | |
Administrative | | | 99,173 | | | | | |
Audit | | | 60,630 | | | | | |
Legal | | | 55,789 | | | | | |
Directors’ fees | | | 46,151 | | | | | |
Miscellaneous | | | 47,022 | | | | | |
| | | | | | | | |
Total expenses | | | 19,932,290 | | | | | |
Less: expense offset arrangement
(see Note B) | | | (104,102 | ) | | | | |
| | | | | | | | |
Net expenses | | | | | | | 19,828,188 | |
| | | | | | | | |
Net investment income | | | | | | | 31,262,289 | |
| | | | | | | | |
Realized and Unrealized Gain (Loss) on
Investment and Foreign Currency Transactions | | | | | | | | |
Net realized gain on investment transactions | | | | | | | 120,363,929 | |
Net change in unrealized
appreciation/depreciation of: | | | | | | | | |
Investments | | | | | | | (75,978,567 | ) |
Foreign currency denominated assets and liabilities | | | | | | | 3,140 | |
| | | | | | | | |
Net gain on investment and foreign currency transactions | | | | | | | 44,388,502 | |
| | | | | | | | |
Contribution from Adviser (see Note B) | | | | | | | 2,424,621 | |
| | | | | | | | |
Net Increase in Net Assets from Operations | | | | | | $ | 78,075,412 | |
| | | | | | | | |
See notes to financial statements.
| | |
| 28 | | • ALLIANCEBERNSTEIN BALANCED SHARES |
Statement of Operations
STATEMENT OF CHANGES IN NET ASSETS
| | | | | | | | |
| | | Year Ended
November 30,
2007 | | | Year Ended
November 30,
2006 | |
| Increase (Decrease) in Net Assets from Operations | | | | | | | | |
Net investment income | | $ | 31,262,289 | | | $ | 29,999,561 | |
Net realized gain on investment transactions and foreign currency transactions | | | 120,363,929 | | | | 51,098,334 | |
Net change in unrealized appreciation/depreciation of investments and foreign currency denominated assets and liabilities | | | (75,975,427 | ) | | | 106,183,896 | |
Contribution from Adviser | | | 2,424,621 | | | | 3,065 | |
| | | | | | | | |
Net increase in net assets from operations | | | 78,075,412 | | | | 187,284,856 | |
| Dividends and Distributions to Shareholders from: | | | | | | | | |
Net investment income | | | | | | | | |
Class A | | | (20,482,150 | ) | | | (17,260,134 | ) |
Class B | | | (6,412,548 | ) | | | (6,376,164 | ) |
Class C | | | (2,571,643 | ) | | | (2,144,241 | ) |
Advisor Class | | | (2,480,598 | ) | | | (2,441,340 | ) |
Class R | | | (102,221 | ) | | | (34,496 | ) |
Class K | | | (110,745 | ) | | | (1,209 | ) |
Class I | | | (94,799 | ) | | | (93,442 | ) |
Net realized gain on investment transactions | | | | | | | | |
Class A | | | (25,846,833 | ) | | | (50,002,078 | ) |
Class B | | | (13,351,567 | ) | | | (31,812,140 | ) |
Class C | | | (4,938,776 | ) | | | (10,145,667 | ) |
Advisor Class | | | (2,829,887 | ) | | | (6,176,472 | ) |
Class R | | | (82,849 | ) | | | (74,994 | ) |
Class K | | | (11,521 | ) | | | (547 | ) |
Class I | | | (104,280 | ) | | | (221,466 | ) |
| Capital Stock Transactions | | | | | | | | |
Net decrease | | | (146,510,004 | ) | | | (127,129,675 | ) |
| | | | | | | | |
Total decrease | | | (147,855,009 | ) | | | (66,629,209 | ) |
| Net Assets | | | | | | | | |
Beginning of period | | | 1,743,148,686 | | | | 1,809,777,895 | |
| | | | | | | | |
End of period (including undistributed net investment income of $5,902,789 and $5,649,335, respectively) | | $ | 1,595,293,677 | | | $ | 1,743,148,686 | |
| | | | | | | | |
See notes to financial statements.
| | |
| ALLIANCEBERNSTEIN BALANCED SHARES • | | 29 |
Statement of Changes in Net Assets
NOTES TO FINANCIAL STATEMENTS
November 30, 2007
NOTE A
Significant Accounting Policies
AllianceBernstein Balanced Shares, Inc. (the “Fund”) is registered under the Investment Company Act of 1940 as a diversified, open-end management investment company. The Fund offers Class A, Class B, Class C, Advisor Class, Class R, Class K and Class I shares. Class A shares are sold with a front-end sales charge of up to 4.25% for purchases not exceeding $1,000,000. With respect to purchases of $1,000,000 or more, Class A shares redeemed within one year of purchase may be subject to a contingent deferred sales charge of 1%. Class B shares are currently sold with a contingent deferred sales charge which declines from 4% to zero depending on the period of time the shares are held. Class B shares will automatically convert to Class A shares eight years after the end of the calendar month of purchase. Class C shares are subject to a contingent deferred sales charge of 1% on redemptions made within the first year after purchase. Class R and Class K shares are sold without an initial or contingent deferred sales charge. Advisor Class and Class I shares are sold without an initial or contingent deferred sales charge and are not subject to ongoing distribution expenses. All seven classes of shares have identical voting, dividend, liquidation and other rights, except that the classes bear different distribution and transfer agency expenses. Each class has exclusive voting rights with respect to its distribution plan. The financial statements have been prepared in conformity with U.S. generally accepted accounting principles which require management to make certain estimates and assumptions that affect the reported amounts of assets and liabilities in the financial statements and amounts of income and expenses during the reporting period. Actual results could differ from those estimates. The following is a summary of significant accounting policies followed by the Fund.
1. Security Valuation
Portfolio securities are valued at their current market value determined on the basis of market quotations or, if market quotations are not readily available or are deemed unreliable, at “fair value” as determined in accordance with procedures established by and under the general supervision of the Fund’s Board of Directors.
In general, the market value of securities which are readily available and deemed reliable are determined as follows. Securities listed on a national securities exchange (other than securities listed on the NASDAQ Stock Market, Inc. (“NASDAQ”)) or on a foreign securities exchange are valued at the last sale price at the close of the exchange or foreign securities exchange. If there has been no sale on such day, the securities are valued at the mean of the closing bid and asked prices on such day. Securities listed on more than one exchange are valued by reference to the principal exchange on which the securities are traded; securities listed only on NASDAQ are valued in accordance with the NASDAQ Official Closing Price; listed put or call options are valued at the last sale price. If there has been no sale on that day, such securities will be valued at the closing bid prices on that day; open futures contracts and options thereon are valued
| | |
| 30 | | • ALLIANCEBERNSTEIN BALANCED SHARES |
Notes to Financial Statements
using the closing settlement price or, in the absence of such a price, the most recent quoted bid price. If there are no quotations available for the day of valuation, the last available closing settlement price is used; securities traded in the over-the-counter market, (“OTC”) are valued at the mean of the current bid and asked prices as reported by the National Quotation Bureau or other comparable sources; U.S. Government securities and other debt instruments having 60 days or less remaining until maturity are valued at amortized cost if their original maturity was 60 days or less; or by amortizing their fair value as of the 61st day prior to maturity if their original term to maturity exceeded 60 days; fixed-income securities, including mortgage backed and asset backed securities, may be valued on the basis of prices provided by a pricing service or at a price obtained from one or more of the major broker/dealers. In cases where broker/dealer quotes are obtained, AllianceBernstein L.P. (the “Adviser”) may establish procedures whereby changes in market yields or spreads are used to adjust, on a daily basis, a recently obtained quoted price on a security; and OTC and other derivatives are valued on the basis of a quoted bid price or spread from a major broker/dealer in such security.
Securities for which market quotations are not readily available (including restricted securities) or are deemed unreliable are valued at fair value. Factors considered in making this determination may include, but are not limited to, information obtained by contacting the issuer, analysts, analysis of the issuer’s financial statements or other available documents. In addition, the Fund may use fair value pricing for securities primarily traded in non-U.S. markets because most foreign markets close well before the Fund values its securities at 4:00 p.m., Eastern Time. The earlier close of these foreign markets gives rise to the possibility that significant events, including broad market moves, may have occurred in the interim and may materially affect the value of those securities. To account for this, the Fund may frequently value many of its foreign equity securities using fair value prices based on third party vendor modeling tools to the extent available.
2. Currency Translation
Assets and liabilities denominated in foreign currencies and commitments under forward currency exchange contracts are translated into U.S. dollars at the mean of the quoted bid and asked prices of such currencies against the U.S. dollar. Purchases and sales of portfolio securities are translated into U.S. dollars at the rates of exchange prevailing when such securities were acquired or sold. Income and expenses are translated into U.S. dollars at rates of exchange prevailing when accrued.
Net realized gain or loss on foreign currency transactions represents foreign exchange gains and losses from sales and maturities of foreign fixed income investments, foreign currency exchange contracts, holding of foreign currencies, currency gains or losses realized between the trade and settlement dates on foreign investment transactions, and the difference between the amounts of dividends,
| | |
| ALLIANCEBERNSTEIN BALANCED SHARES • | | 31 |
Notes to Financial Statements
interest and foreign withholding taxes recorded on the Fund’s books and the U.S. dollar equivalent amounts actually received or paid. Net unrealized currency gains and losses from valuing foreign currency denominated assets and liabilities at period end exchange rates are reflected as a component of net unrealized appreciation or depreciation of investments and foreign currency denominated assets and liabilities.
3. Taxes
It is the Fund’s policy to meet the requirements of the Internal Revenue Code applicable to regulated investment companies and to distribute all of its investment company taxable income and net realized gains, if any, to shareholders. Therefore, no provisions for federal income or excise taxes are required. The Fund may be subject to taxes imposed by countries in which it invests. Such taxes are generally based on income and/or capital gains earned or repatriated. Taxes are accrued and applied to net investment income, net realized gains and net unrealized appreciation/depreciation as such income and/or gains are earned.
4. Investment Income and Investment Transactions
Dividend income is recorded on the ex-dividend date or as soon as the Fund is informed of the dividend. Interest income is accrued daily. Investment transactions are accounted for on the trade date the securities are purchased or sold. Investment gains or losses are determined on the identified cost basis. The Fund amortizes premiums and accretes discounts as adjustments to interest income.
5. Class Allocations
All income earned and expenses incurred by the Fund are borne on a pro-rata basis by each outstanding class of shares, based on the proportionate interest in the Fund represented by the net assets of such class, except for class specific expenses which are allocated to the respective class. Realized and unrealized gains and losses are allocated among the various share classes based on respective net assets.
6. Dividends and Distributions
Dividends and distributions to shareholders, if any, are recorded on the ex-dividend date. Income dividends and capital gains distributions are determined in accordance with federal tax regulations and may differ from those determined in accordance with U.S. generally accepted accounting principles. To the extent these differences are permanent, such amounts are reclassified within the capital accounts based on their federal tax basis treatment; temporary differences do not require such reclassification.
NOTE B
Advisory Fee and Other Transactions With Affiliates
Under the terms of the investment advisory agreement, the Fund pays the Adviser an advisory fee at an annual rate of .60% of the first $200 million, .50% of the next $200 million and .40% in excess of $400 million of the Fund’s average daily net assets. The fee is accrued daily and paid monthly.
| | |
| 32 | | • ALLIANCEBERNSTEIN BALANCED SHARES |
Notes to Financial Statements
During the year ended November 30, 2007, and in response to the Independent Director’s request, the Adviser made a payment of $2,424,621 to the Fund in connection with an error made by the Adviser in processing a claim for class action settlement proceeds on behalf of the Fund.
During the year ended November 30, 2006, the Adviser reimbursed the Fund $3,065 for trading losses incurred due to a trade entry error.
Pursuant to the Advisory agreement, the Fund paid $99,173 to the Adviser representing the cost of certain legal and accounting services provided to the Fund by the Adviser for the year ended November 30, 2007.
The Fund compensates AllianceBernstein Investor Services, Inc. (“ABIS”), a wholly-owned subsidiary of the Adviser, under a Transfer Agency Agreement for providing personnel and facilities to perform transfer agency services for the Fund. ABIS may make payments to intermediaries that provide omnibus account services, sub-accounting services and/or networking services. Such compensation retained by ABIS amounted to $925,364 for the year ended November 30, 2007.
For the year ended November 30, 2007, the Fund’s expenses were reduced by $104,102 under an expense offset arrangement with ABIS.
AllianceBernstein Investments, Inc. (the “Distributor”), a wholly-owned subsidiary of the Adviser, serves as the distributor of the Fund’s shares. The Distributor has advised the Fund that it has retained front-end sales charge of $34,066 from the sale of Class A shares and received $36,204, $253,602 and $8,529 in contingent deferred sales charges imposed upon redemptions by shareholders of Class A, Class B and Class C shares, respectively, for the year ended November 30, 2007.
The Fund may invest in the AllianceBernstein Fixed-Income Shares, Inc.—Prime STIF Portfolio and the AllianceBernstein Fixed-Income Shares, Inc.—Government STIF Portfolio (collectively, the “STIF Portfolios”), open-end management investment companies managed by the Adviser. The STIF Portfolios are offered as cash management options to mutual funds, trusts, and other accounts managed by the Adviser, and are not available for direct purchase by members of the public. The STIF Portfolios pay no investment management fees.
Brokerage commissions paid on investment transactions for the year ended November 30, 2007 amounted to $749,854, of which $34,487 and $0, respectively, was paid to Sanford C. Bernstein & Co. LLC and Sanford C. Bernstein Limited, affiliates of the Adviser.
Accrued expenses includes $4,424 owed to a Director under the Director’s deferred compensation plan.
| | |
| ALLIANCEBERNSTEIN BALANCED SHARES • | | 33 |
Notes to Financial Statements
NOTE C
Distribution Services Agreement
The Fund has adopted a Distribution Services Agreement (the “Agreement”) pursuant to Rule 12b-1 under the Investment Company Act of 1940. Under the Agreement, the Fund pays distribution and servicing fees to the Distributor at an annual rate of up to .30% of the Fund’s average daily net assets attributable to Class A shares, 1% of the Fund’s average daily net assets attributable to both Class B and Class C shares, .50% of the Fund’s average daily net assets attributable to Class R shares and ..25% of the Fund’s average daily net assets attributable to Class K shares. There are no distribution and servicing fees on the Advisor Class and Class I shares. The fees are accrued daily and paid monthly. The Agreement provides that the Distributor will use such payments in their entirety for distribution assistance and promotional activities. The Distributor has incurred expenses in excess of the distribution costs reimbursed by the Fund in the amounts of $5,391,854, $2,923,204, $237,415 and $164,666 for Class B, Class C, Class R and Class K shares, respectively. While such costs may be recovered from the Fund in future periods so long as the Agreement is in effect, the rate of the distribution and servicing fees payable under the Agreement may not be increased without a shareholder vote. In accordance with the Agreement, there is no provision for recovery of unreimbursed distribution costs incurred by the Distributor beyond the current fiscal year for Class A and Class R shares. The Agreement also provides that the Adviser may use its own resources to finance the distribution of the Fund’s shares.
NOTE D
Investment Transactions
Purchases and sales of investment securities (excluding short-term investments) for the year ended November 30, 2007 were as follows:
| | | | | | |
| | | Purchases | | Sales |
Investment securities (excluding
U.S. government securities) | | $ | 658,883,816 | | $ | 760,025,978 |
U.S. government securities | | | 435,720,581 | | | 578,551,066 |
The cost of investments for federal income tax purposes, gross unrealized appreciation and unrealized depreciation are as follows:
| | | | |
Cost | | $ | 1,524,347,317 | |
| | | | |
Gross unrealized appreciation | | $ | 246,694,050 | |
Gross unrealized depreciation | | | (34,548,449 | ) |
| | | | |
Net unrealized appreciation | | $ | 212,145,601 | |
| | | | |
1. Forward Currency Exchange Contracts
The Fund may enter into forward currency exchange contracts in order to hedge its exposure to changes in foreign currency exchange rates on its foreign portfolio holdings, to hedge certain firm purchase and sales commitments denominated
| | |
| 34 | | • ALLIANCEBERNSTEIN BALANCED SHARES |
Notes to Financial Statements
in foreign currencies and for investment purposes. A forward currency exchange contract is a commitment to purchase or sell a foreign currency at a future date at a negotiated forward rate. The gain or loss arising from the difference between the original contract and the closing of such contract would be included in net realized gain or loss on foreign currency transactions.
Fluctuations in the value of open forward currency exchange contracts are recorded for financial reporting purposes as net unrealized appreciation or depreciation by the Fund.
The Fund’s custodian will place and maintain cash not available for investment or other liquid assets in a separate account of the Fund having a value at least equal to the aggregate amount of the Fund’s commitments under forward currency exchange contracts entered into with respect to position hedges. Risks may arise from the potential inability of a counterparty to meet the terms of a contract and from unanticipated movements in the value of a foreign currency relative to the U.S. dollar. The face or contract amount, in U.S. dollars reflects the total exposure the Fund has in that particular currency contract.
2. Option Transactions
For hedging and investment purposes, the Fund may purchase and write (sell) put and call options on U.S. and foreign government securities and foreign currencies that are traded on U.S. and foreign securities exchanges and over-the-counter markets.
The risk associated with purchasing an option is that the Fund pays a premium whether or not the option is exercised. Additionally, the Fund bears the risk of loss of the premium and change in market value should the counterparty not perform under the contract. Put and call options purchased are accounted for in the same manner as portfolio securities. The cost of securities acquired through the exercise of call options is increased by premiums paid. The proceeds from securities sold through the exercise of put options are decreased by the premiums paid.
When the Fund writes an option, the premium received by the Fund is recorded as a liability and is subsequently adjusted to the current market value of the option written. Premiums received from written options which expire unexercised are recorded by the Fund on the expiration date as realized gains from options written. The difference between the premium received and the amount paid on effecting a closing purchase transaction, including brokerage commissions, is also treated as a realized gain, or if the premium received is less than the amount paid for the closing purchase transaction, as a realized loss. If a call option is exercised, the premium received is added to the proceeds from the sale of the underlying security or currency in determining whether the Fund has realized a gain or loss. If a put option is exercised, the premium received reduces the cost basis of the security or currency purchased by the Fund. In writing an
| | |
| ALLIANCEBERNSTEIN BALANCED SHARES • | | 35 |
Notes to Financial Statements
option, the Fund bears the market risk of an unfavorable change in the price of the security or currency underlying the written option. Exercise of an option written by the Fund could result in the Fund selling or buying a security or currency at a price different from the current market value. For the year ended November 30, 2007, the Fund had no transactions in written options.
NOTE E
Securities Lending
The Fund has entered into a securities lending agreement with AG Edwards & Sons, Inc. (the “Lending Agent”). Under the terms of the agreement, the Lending Agent, on behalf of the Fund, administers the lending of portfolio securities to certain broker-dealers. In return, the Fund receives fee income from the lending transactions or it retains a portion of interest on the investment of any cash received as collateral. The Fund also continues to receive dividends or interest on the securities loaned. Under the terms of the securities lending agreement, security voting rights pass to the borrower, although the Fund can at will terminate a loan and regain the right to vote. Unrealized gain or loss on the value of the securities loaned that may occur during the term of the loan will be reflected in the accounts of the Fund. All loans are continuously secured by collateral exceeding the value of the securities loaned. All collateral consists of either cash or U.S. Government securities. The Lending Agent may invest the cash collateral received in accordance with the investment restrictions of the Fund in one or more of the following investments: U.S. government or U.S. government agency obligations, bank obligations, corporate debt obligations, asset-backed securities, investment funds, structured products, repurchase agreements and an eligible money market fund. The Lending Agent will indemnify the Fund for any loss resulting from a borrower’s failure to return a loaned security when due. As of November 30, 2007, the Fund had loaned securities with a value of $128,700,958 and received cash collateral which was invested in short-term securities valued at $131,215,758 as included in the accompanying portfolio of investments. For the year ended November 30, 2007, the Fund earned fee income of $225,385 which is included in interest income in the accompanying statement of operations.
| | |
| 36 | | • ALLIANCEBERNSTEIN BALANCED SHARES |
Notes to Financial Statements
NOTE F
Capital Stock
Each class consists of 3,000,000,000 authorized shares. Transactions in capital shares for each class were as follows:
| | | | | | | | | | | | | | | | | | |
| | | | | | | | | | | | | | | | | | |
| | | Shares | | | | | Amount | | | |
| | | Year Ended
November 30,
2007 | | | Year Ended
November 30,
2006 | | | | | Year Ended
November 30,
2007 | | | Year Ended
November 30,
2006 | | | |
| | | | | |
| Class A | | | | | | | | | | | | | | | | | | |
Shares sold | | 9,414,227 | | | 11,620,241 | | | | | $ | 171,618,845 | | | $ | 198,963,151 | | | |
| | | | |
Shares issued in reinvestment of dividends and distributions | | 2,424,827 | | | 3,748,224 | | | | | | 43,983,074 | | | | 62,969,071 | | | |
| | | | |
Shares converted from Class B | | 3,010,566 | | | 1,341,862 | | | | | | 55,051,173 | | | | 23,074,244 | | | |
| | | | |
Shares redeemed | | (15,737,966 | ) | | (16,642,785 | ) | | | | | (287,531,095 | ) | | | (284,359,760 | ) | | |
| | | | |
Net increase (decrease) | | (888,346 | ) | | 67,542 | | | | | $ | (16,878,003 | ) | | $ | 646,706 | | | |
| | | | |
| | | | | | | | | | | | | | | | | | |
| Class B | | | | | | | | | | | | | | | | | | |
Shares sold | | 1,156,458 | | | 2,113,839 | | | | | $ | 20,022,861 | | | $ | 34,269,380 | | | |
| | | | |
Shares issued in reinvestment of dividends and distributions | | 1,072,724 | | | 2,036,776 | | | | | | 18,377,874 | | | | 32,459,799 | | | |
| | | | |
Shares converted to Class A | | (3,182,985 | ) | | (1,415,594 | ) | | | | | (55,051,173 | ) | | | (23,074,244 | ) | | |
| | | | |
Shares redeemed | | (5,796,686 | ) | | (9,232,081 | ) | | | | | (100,437,790 | ) | | | (149,397,088 | ) | | |
| | | | |
Net decrease | | (6,750,489 | ) | | (6,497,060 | ) | | | | $ | (117,088,228 | ) | | $ | (105,742,153 | ) | | |
| | | | |
| | | | | | | | | | | | | | | | | | |
| Class C | | | | | | | | | | | | | | | | | | |
Shares sold | | 1,044,368 | | | 1,290,112 | | | | | $ | 18,139,189 | | | $ | 20,946,347 | | | |
| | | | |
Shares issued in reinvestment of dividends and distributions | | 394,697 | | | 558,904 | | | | | | 6,796,902 | | | | 8,947,122 | | | |
| | | | |
Shares redeemed | | (1,869,343 | ) | | (2,521,454 | ) | | | | | (32,453,871 | ) | | | (40,956,766 | ) | | |
| | | | |
Net decrease | | (430,278 | ) | | (672,438 | ) | | | | $ | (7,517,780 | ) | | $ | (11,063,297 | ) | | |
| | | | |
| | | | | | | | | | | | | | | | | | |
| Advisor Class | | | | | | | | | | | | | | | | | | |
Shares sold | | 1,182,970 | | | 915,489 | | | | | $ | 21,615,760 | | | $ | 15,645,453 | | | |
| | | | |
Shares issued in reinvestment of dividends and distributions | | 287,358 | | | 473,531 | | | | | | 5,222,526 | | | | 7,969,848 | | | |
| | | | |
Shares redeemed | | (2,365,673 | ) | | (2,084,486 | ) | | | | | (43,336,078 | ) | | | (36,178,679 | ) | | |
| | | | |
Net decrease | | (895,345 | ) | | (695,466 | ) | | | | $ | (16,497,792 | ) | | $ | (12,563,378 | ) | | |
| | | | |
| | |
| ALLIANCEBERNSTEIN BALANCED SHARES • | | 37 |
Notes to Financial Statements
| | | | | | | | | | | | | | | | | | |
| | | | | | | | | | | | | | | | | | |
| | | Shares | | | | | Amount | | | |
| | | Year Ended
November 30,
2007 | | | Year Ended
November 30,
2006 | | | | | Year Ended
November 30,
2007 | | | Year Ended
November 30,
2006 | | | |
| | | | | |
| Class R | | | | | | | | | | | | | | | | | | |
Shares sold | | 772,833 | | | 153,309 | | | | | $ | 14,041,022 | | | $ | 2,608,449 | | | |
Shares issued in reinvestment of dividends and distributions | | 10,173 | | | 3,069 | | | | | | 185,070 | | | | 51,624 | | | |
| | | | |
Shares redeemed | | (495,690 | ) | | (60,416 | ) | | | | | (8,971,167 | ) | | | (1,043,612 | ) | | |
| | | | |
Net increase | | 287,316 | | | 95,962 | | | | | $ | 5,254,925 | | | $ | 1,616,461 | | | |
| | | | |
| | | | | | | | | | | | | | | | | | |
| Class K | | | | | | | | | | | | | | | | | | |
Shares sold | | 548,534 | | | 236,810 | | | | | $ | 10,031,500 | | | $ | 4,011,457 | | | |
| | | | |
Shares issued in reinvestment of dividends and distributions | | 6,615 | | | 61 | | | | | | 121,750 | | | | 1,027 | | | |
| | | | |
Shares redeemed | | (147,767 | ) | | (221,876 | ) | | | | | (2,689,818 | ) | | | (3,776,077 | ) | | |
| | | | |
Net increase | | 407,382 | | | 14,995 | | | | | $ | 7,463,432 | | | $ | 236,407 | | | |
| | | | |
| | | | | | | | | | | | | | | | | | |
| Class I | | | | | | | | | | | | | | | | | | |
Shares sold | | 18,902 | | | 66,754 | | | | | $ | 345,189 | | | $ | 1,123,813 | | | |
| | | | |
Shares issued in reinvestment of dividends and distributions | | 10,983 | | | 18,739 | | | | | | 199,077 | | | | 314,302 | | | |
| | | | |
Shares redeemed | | (96,590 | ) | | (102,886 | ) | | | | | (1,790,824 | ) | | | (1,698,536 | ) | | |
| | | | |
Net decrease | | (66,705 | ) | | (17,393 | ) | | | | $ | (1,246,558 | ) | | $ | (260,421 | ) | | |
| | | | |
NOTE G
Risks Involved in Investing in the Fund
Interest Rate Risk and Credit Risk — Interest rate risk is the risk that changes in interest rates will affect the value of the Fund’s investments in fixed-income debt securities such as bonds or notes. Increases in interest rates may cause the value of the Fund’s investments to decline. Credit risk is the risk that the issuer or guarantor of a debt security, or the counterparty to a derivative contract, will be unable or unwilling to make timely principal and/or interest payments, or to otherwise honor its obligations. The degree of risk for a particular security may be reflected in its credit risk rating. Credit risk is greater for medium quality and lower-rated securities. Lower-rated debt securities and similar unrated securities (commonly known as “junk bonds”) have speculative elements or are predominantly speculative risks.
Foreign Securities Risk — Investing in securities of foreign companies or foreign governments involves special risks which include changes in foreign currency exchange rates and the possibility of future political and economic developments which could adversely affect the value of such securities. Moreover, securities of
| | |
| 38 | | • ALLIANCEBERNSTEIN BALANCED SHARES |
Notes to Financial Statements
many foreign companies or foreign governments and their markets may be less liquid and their prices more volatile than those of comparable U.S. companies or of the U.S. government.
Indemnification Risk — In the ordinary course of business, the Fund enters into contracts that contain a variety of indemnifications. The Fund’s maximum exposure under these arrangements is unknown. However, the Fund has not had prior claims or losses pursuant to these indemnification provisions and expects the risk of loss thereunder to be remote.
NOTE H
Joint Credit Facility
A number of open-end mutual funds managed by the Adviser, including the Fund Code Not Found, participate in a $250 million revolving credit facility (the “Facility”) intended to provide short-term financing if necessary, subject to certain restrictions in connection with abnormal redemption activity. Commitment fees related to the Facility are paid by the participating funds and are included in miscellaneous expenses in the statement of operations. The Fund did not utilize the Facility during the year ended November 30, 2007.
NOTE I
Distributions to Shareholders
The tax character of distributions paid during the fiscal years ended November 30, 2007 and November 30, 2006 were as follows:
| | | | | | |
| | | November 30,
2007 | | November 30,
2006 |
Distributions paid from: | | | | | | |
Ordinary income | | $ | 38,259,389 | | $ | 28,351,026 |
Long-term capital gain | | | 41,161,028 | | | 98,433,364 |
| | | | | | |
Total taxable distributions | | $ | 79,420,417 | | $ | 126,784,390 |
| | | | | | |
Total distributions paid | | $ | 79,420,417 | | $ | 126,784,390 |
| | | | | | |
As of November 30, 2007, the components of accumulated earnings/(deficit) on a tax basis were as follows:
| | | | |
Undistributed ordinary income | | $ | 8,102,931 | |
Undistributed long term gains | | | 117,347,091 | |
Unrealized appreciation/(depreciation) | | | 212,140,134 | (a) |
| | | | |
Total accumulated earnings/(deficit) | | $ | 337,590,156 | (b) |
| | | | |
(a) | The difference between book-basis and tax-basis unrealized appreciation/(depreciation) is attributed primarily to the tax deferral of losses on wash sales and the difference between book tax amortization methods for bond premium. |
(b) | The difference between book-basis and tax-basis components of accumulated earnings/(deficit) is attributable primarily to deferred compensation. |
| | |
| ALLIANCEBERNSTEIN BALANCED SHARES • | | 39 |
Notes to Financial Statements
During the current fiscal year, permanent differences primarily due to premium adjustment on disposition of securities, paydown gain/loss reclassification and consent fee reclassification resulted in a increase in undistributed net investment income and a corresponding decrease in accumulated net realized gain on investment transactions. This reclassification had no effect on net assets.
NOTE J
Legal Proceedings
On October 2, 2003, a purported class action complaint entitled Hindo, et al. v. AllianceBernstein Growth & Income Fund, et al. (“Hindo Complaint”) was filed against the Adviser, Alliance Capital Management Holding L.P. (“Alliance Holding”), Alliance Capital Management Corporation, AXA Financial, Inc., the AllianceBernstein Funds, certain officers of the Adviser (“AllianceBernstein defendants”), and certain other unaffiliated defendants, as well as unnamed Doe defendants. The Hindo Complaint was filed in the United States District Court for the Southern District of New York by alleged shareholders of two of the AllianceBernstein Funds. The Hindo Complaint alleges that certain of the AllianceBernstein defendants failed to disclose that they improperly allowed certain hedge funds and other unidentified parties to engage in “late trading” and “market timing” of AllianceBernstein Fund securities, violating Sections 11 and 15 of the Securities Act, Sections 10(b) and 20(a) of the Exchange Act and Sections 206 and 215 of the Advisers Act. Plaintiffs seek an unspecified amount of compensatory damages and rescission of their contracts with the Adviser, including recovery of all fees paid to the Adviser pursuant to such contracts.
Following October 2, 2003, 43 additional lawsuits making factual allegations generally similar to those in the Hindo Complaint were filed in various federal and state courts against the Adviser and certain other defendants. All state court actions against the Adviser either were voluntarily dismissed or removed to federal court. On February 20, 2004, the Judicial Panel on Multidistrict Litigation transferred all federal actions to the United States District Court for the District of Maryland. On September 29, 2004, plaintiffs filed consolidated amended complaints with respect to four claim types: mutual fund shareholder claims; mutual fund derivative claims; derivative claims brought on behalf of Alliance Holding; and claims brought under ERISA by participants in the Profit Sharing Plan for Employees of the Adviser. All four complaints include substantially identical factual allegations, which appear to be based in large part on the Order of the SEC dated December 18, 2003 as amended and restated January 15, 2004 (“SEC Order”) and the New York State Attorney General Assurance of Discontinuance dated September 1, 2004 (“NYAG Order”).
On April 21, 2006, the Adviser and attorneys for the plaintiffs in the mutual fund shareholder claims, mutual fund derivative claims, and ERISA claims entered into a confidential memorandum of understanding (“MOU”) containing their agreement to settle these claims. The agreement will be documented by a stipulation of settlement and will be submitted for court approval at a later date. The settlement amount ($30 million), which the Adviser previously
| | |
| 40 | | • ALLIANCEBERNSTEIN BALANCED SHARES |
Notes to Financial Statements
accrued and disclosed, has been disbursed. The derivative claims brought on behalf of Alliance Holding, in which plaintiffs seek an unspecified amount of damages, remain pending.
It is possible that these matters and/or other developments resulting from these matters could result in increased redemptions of the AllianceBernstein Mutual Funds’ shares or other adverse consequences to the AllianceBernstein Mutual Funds. This may require the AllianceBernstein Mutual Funds to sell investments held by those funds to provide for sufficient liquidity and could also have an adverse effect on the investment performance of the AllianceBernstein Mutual Funds. However, the Adviser believes that these matters are not likely to have a material adverse effect on its ability to perform advisory services relating to the AllianceBernstein Mutual Funds.
NOTE K
Recent Accounting Pronouncements
On July 13, 2006, the Financial Accounting Standards Board (“FASB”) released FASB Interpretation No. 48 “Accounting for Uncertainty in Income Taxes” (“FIN 48”). FIN 48 provides guidance for how uncertain tax positions should be recognized, measured, presented and disclosed in the financial statements. FIN 48 requires the evaluation of tax positions taken or expected to be taken in the course of preparing a fund’s tax returns to determine whether the tax positions are “more-likely-than-not” of being sustained by the applicable tax authority. Tax positions not deemed to meet the more-likely-than-not threshold would be recorded in the current period. Adoption of FIN 48 is required for fiscal years beginning after December 15, 2006 and is to be applied to all open tax years as of the effective date. On December 22, 2006, the Securities and Exchange Commission notified the industry that the implementation of FIN 48 by registered investment companies could be delayed until the last business day of the first required financial statement reporting period for fiscal years beginning after December 15, 2006. At this time, management is evaluating the implications of FIN 48 and its impact on the financial statements has not yet been determined.
On September 20, 2006, the FASB released Statement of Financial Accounting Standards No. 157 “Fair Value Measurements” (“FAS 157”). FAS 157 establishes an authoritative definition of fair value, sets out a framework for measuring fair value, and requires additional disclosures about fair-value measurements. The application of FAS 157 is required for fiscal years beginning after November 15, 2007 and interim periods within those fiscal years. At this time, management has evaluated the implications of FAS 157 and has determined that the adoption of FAS 157 will not have an impact on the Fund’s financial statements.
| | |
| ALLIANCEBERNSTEIN BALANCED SHARES • | | 41 |
Notes to Financial Statements
FINANCIAL HIGHLIGHTS
Selected Data For A Share Of Capital Stock Outstanding Throughout Each Period
| | | | | | | | | | | | | | | | | | |
| | | Class A | |
| | | Year Ended November 30, | | | August 1,
2003 to
November 30, 2003(a) | | | Year
Ended
July 31, 2003 | |
| | | 2007 | | | 2006 | | | 2005 | | | 2004 | | | |
| | | | | | | | | | | | | | | | | | |
Net asset value, beginning
of period | | $ 18.29 | | | $ 17.60 | | | $ 16.81 | | | $ 15.13 | | | $ 14.54 | | | $ 13.26 | |
| | | | | | | | | | | | | | | | | | |
Income From Investment Operations | | | | | | | | | | | | | | | | | | |
Net investment income(b) | | .38 | | | .34 | | | .28 | | | .31 | (c) | | .09 | | | .28 | |
Net realized and unrealized
gain on investment transactions | | .46 | | | 1.61 | | | .81 | | | 1.61 | | | .58 | | | 1.32 | |
Contribution from Adviser | | .03 | | | -0- | (d) | | -0- | | | -0- | | | -0- | | | -0- | |
| | | | | | | | | | | | | | | | | | |
Net increase in net
asset value from operations | | .87 | | | 1.95 | | | 1.09 | | | 1.92 | | | .67 | | | 1.60 | |
| | | | | | | | | | | | | | | | | | |
Less: Dividends and Distributions | | | | | | | | | | | | | | | | | | |
Dividends from net investment income | | (.39 | ) | | (.32 | ) | | (.30 | ) | | (.24 | ) | | (.08 | ) | | (.29 | ) |
Distributions from net realized gain on investment transactions | | (.49 | ) | | (.94 | ) | | -0- | | | -0- | | | -0- | | | -0- | |
Tax return of capital | | -0- | | | -0- | | | -0- | | | -0- | | | -0- | | | (.03 | ) |
| | | | | | | | | | | | | | | | | | |
Total dividends and distributions | | (.88 | ) | | (1.26 | ) | | (.30 | ) | | (.24 | ) | | (.08 | ) | | (.32 | ) |
| | | | | | | | | | | | | | | | | | |
Net asset value, end of period | | $ 18.28 | | | $ 18.29 | | | $ 17.60 | | | $ 16.81 | | | $ 15.13 | | | $ 14.54 | |
| | | | | | | | | | | | | | | | | | |
Total Return | | | | | | | | | | | | | | | | | | |
Total investment return based on net asset value(e) | | 4.82 | %* | | 11.81 | % | | 6.55 | % | | 12.78 | % | | 4.62 | % | | 12.29 | % |
Ratios/Supplemental Data | | | | | | | | | | | | | | | | | | |
Net assets, end of period (000’s omitted) | | $956,157 | | | $972,991 | | | $935,414 | | | $788,685 | | | $587,685 | | | $525,637 | |
Ratio to average net
assets of: | | | | | | | | | | | | | | | | | | |
Expenses, net of waivers/reimbursements | | .92 | % | | .88 | %(f) | | 1.04 | % | | .97 | % | | 1.07 | %(g) | | 1.12 | % |
Expenses, before waivers/reimbursements | | .92 | % | | .88 | %(f) | | 1.04 | % | | 1.00 | % | | 1.07 | %(g) | | 1.12 | % |
Net investment income | | 2.10 | % | | 2.00 | %(f) | | 1.64 | % | | 1.93 | %(c) | | 1.84 | %(g) | | 2.04 | % |
Portfolio turnover rate | | 66 | % | | 52 | % | | 57 | % | | 58 | % | | 29 | % | | 62 | % |
See footnote summary on page 48.
| | |
| 42 | | • ALLIANCEBERNSTEIN BALANCED SHARES |
Financial Highlights
Selected Data For A Share Of Capital Stock Outstanding Throughout Each Period
| | | | | | | | | | | | | | | | | | |
| | | Class B | |
| | | Year Ended November 30, | | | August 1,
2003 to
November 30, 2003(a) | | | Year
Ended
July 31, 2003 | |
| | | 2007 | | | 2006 | | | 2005 | | | 2004 | | | |
| | | | | | | | | | | | | | | | | | |
Net asset value, beginning of period | | $ 17.32 | | | $ 16.74 | | | $ 16.00 | | | $ 14.41 | | | $ 13.87 | | | $ 12.68 | |
| | | | | | | | | | | | | | | | | | |
Income From Investment Operations | | | | | | | | | | | | | | | | | | |
Net investment income(b) | | .23 | | | .20 | | | .15 | | | .19 | (c) | | .05 | | | .17 | |
Net realized and unrealized gain on investment transactions | | .43 | | | 1.52 | | | .78 | | | 1.53 | | | .55 | | | 1.26 | |
Contribution from Adviser | | .03 | | | -0- | (d) | | -0- | | | -0- | | | -0- | | | -0- | |
| | | | | | | | | | | | | | | | | | |
Net increase in net
asset value from operations | | .69 | | | 1.72 | | | .93 | | | 1.72 | | | .60 | | | 1.43 | |
| | | | | | | | | | | | | | | | | | |
Less: Dividends and Distributions | | | | | | | | | | | | | | | | | | |
Dividends from net investment income | | (.25 | ) | | (.20 | ) | | (.19 | ) | | (.13 | ) | | (.06 | ) | | (.22 | ) |
Distributions from net realized gain on investment transactions | | (.49 | ) | | (.94 | ) | | -0- | | | -0- | | | -0- | | | -0- | |
Return of capital | | -0- | | | -0- | | | -0- | | | -0- | | | -0- | | | (.02 | ) |
| | | | | | | | | | | | | | | | | | |
Total dividends and distributions | | (.74 | ) | | (1.14 | ) | | (.19 | ) | | (.13 | ) | | (.06 | ) | | (.24 | ) |
| | | | | | | | | | | | | | | | | | |
Net asset value, end of period | | $ 17.27 | | | $ 17.32 | | | $ 16.74 | | | $ 16.00 | | | $ 14.41 | | | $ 13.87 | |
| | | | | | | | | | | | | | | | | | |
Total Return | | | | | | | | | | | | | | | | | | |
Total investment return based on net asset value(e) | | 4.06 | %* | | 10.94 | % | | 5.82 | % | | 11.97 | % | | 4.33 | % | | 11.44 | % |
Ratios/Supplemental Data | | | | | | | | | | | | | | | | | | |
Net assets, end of period (000’s omitted) | | $360,548 | | | $478,595 | | | $571,214 | | | $590,890 | | | $534,752 | | | $488,365 | |
Ratio to average net assets of: | | | | | | | | | | | | | | | | | | |
Expenses, net of waivers/reimbursements | | 1.67 | % | | 1.62 | %(f) | | 1.76 | % | | 1.70 | % | | 1.81 | %(g) | | 1.86 | % |
Expenses, before waivers/reimbursements | | 1.67 | % | | 1.62 | %(f) | | 1.76 | % | | 1.73 | % | | 1.81 | %(g) | | 1.86 | % |
Net investment income | | 1.34 | % | | 1.24 | %(f) | | .90 | % | | 1.22 | %(c) | | 1.14 | %(g) | | 1.30 | % |
Portfolio turnover rate | | 66 | % | | 52 | % | | 57 | % | | 58 | % | | 29 | % | | 62 | % |
See footnote summary on page 48.
| | |
| ALLIANCEBERNSTEIN BALANCED SHARES • | | 43 |
Financial Highlights
Selected Data For A Share Of Capital Stock Outstanding Throughout Each Period
| | | | | | | | | | | | | | | | | | |
| | | Class C | |
| | | Year Ended November 30, | | | August 1,
2003 to
November 30, 2003(a) | | | Year
Ended
July 31, 2003 | |
| | | 2007 | | | 2006 | | | 2005 | | | 2004 | | | |
| | | | | | | | | | | | | | | | | | |
Net asset value,
beginning of period | | $ 17.40 | | | $ 16.80 | | | $ 16.06 | | | $ 14.47 | | | $ 13.92 | | | $ 12.72 | |
| | | | | | | | | | | | | | | | | | |
Income From Investment Operations | | | | | | | | | | | | | | | | | | |
Net investment income(b) | | .24 | | | .21 | | | .15 | | | .19 | (c) | | .05 | | | .17 | |
Net realized and unrealized
gain on investment transactions | | .42 | | | 1.53 | | | .78 | | | 1.53 | | | .56 | | | 1.27 | |
Contribution from Adviser | | .03 | | | -0- | (d) | | -0- | | | -0- | | | -0- | | | -0- | |
| | | | | | | | | | | | | | | | | | |
Net increase in net asset value from
operations | | .69 | | | 1.74 | | | .93 | | | 1.72 | | | .61 | | | 1.44 | |
| | | | | | | | | | | | | | | | | | |
Less: Dividends and Distributions | | | | | | | | | | | | | | | | | | |
Dividends from net investment income | | (.25 | ) | | (.20 | ) | | (.19 | ) | | (.13 | ) | | (.06 | ) | | (.22 | ) |
Distributions from net realized gain on investment transactions | | (.49 | ) | | (.94 | ) | | -0- | | | -0- | | | -0- | | | -0- | |
Tax return of capital | | -0- | | | -0- | | | -0- | | | -0- | | | -0- | | | (.02 | ) |
| | | | | | | | | | | | | | | | | | |
Total dividends and distributions | | (.74 | ) | | (1.14 | ) | | (.19 | ) | | (.13 | ) | | (.06 | ) | | (.24 | ) |
| | | | | | | | | | | | | | | | | | |
Net asset value, end of period | | $ 17.35 | | | $ 17.40 | | | $ 16.80 | | | $ 16.06 | | | $ 14.47 | | | $ 13.92 | |
| | | | | | | | | | | | | | | | | | |
Total Return | | | | | | | | | | | | | | | | | | |
Total investment return based on net asset value(e) | | 4.04 | %* | | 11.02 | % | | 5.80 | % | | 11.92 | % | | 4.39 | % | | 11.49 | % |
Ratios/Supplemental Data | | | | | | | | | | | | | | | | | | |
Net assets, end of period (000’s omitted) | | $168,496 | | | $176,454 | | | $181,746 | | | $174,040 | | | $162,243 | | | $150,188 | |
Ratio to average net
assets of: | | | | | | | | | | | | | | | | | | |
Expenses, net of waivers/reimbursements | | 1.66 | % | | 1.61 | %(f) | | 1.76 | % | | 1.69 | % | | 1.80 | %(g) | | 1.85 | % |
Expenses, before waivers/reimbursements | | 1.66 | % | | 1.61 | %(f) | | 1.76 | % | | 1.73 | % | | 1.80 | %(g) | | 1.85 | % |
Net investment income | | 1.36 | % | | 1.27 | %(f) | | .91 | % | | 1.23 | %(c) | | 1.15 | %(g) | | 1.32 | % |
Portfolio turnover rate | | 66 | % | | 52 | % | | 57 | % | | 58 | % | | 29 | % | | 62 | % |
See footnote summary on page 48
| | |
| 44 | | • ALLIANCEBERNSTEIN BALANCED SHARES |
Financial Highlights
Selected Data For A Share Of Capital Stock Outstanding Throughout Each Period
| | | | | | | | | | | | | | | | | | |
| | | Advisor Class | |
| | | Year Ended November 30, | | | August 1,
2003 to
November 30, 2003(a) | | | Year
Ended
July 31, 2003 | |
| | | 2007 | | | 2006 | | | 2005 | | | 2004 | | | |
| | | | | | | | | | | | | | | | | | |
Net asset value,
beginning of period | | $ 18.33 | | | $ 17.64 | | | $ 16.84 | | | $ 15.16 | | | $ 14.56 | | | $ 13.28 | |
| | | | | | | | | | | | | | | | | | |
Income From
Investment
Operations | | | | | | | | | | | | | | | | | | |
Net investment income(b) | | .44 | | | .39 | | | .33 | | | .35 | (c) | | .10 | | | .32 | |
Net realized and unrealized
gain on investment
transactions | | .45 | | | 1.61 | | | .82 | | | 1.61 | | | .59 | | | 1.32 | |
Contribution from
Adviser | | .03 | | | -0- | (d) | | -0- | | | -0- | | | -0- | | | -0- | |
| | | | | | | | | | | | | | | | | | |
Net increase in net
asset value from
operations | | .92 | | | 2.00 | | | 1.15 | | | 1.96 | | | .69 | | | 1.64 | |
| | | | | | | | | | | | | | | | | | |
Less: Dividends and Distributions | | | | | | | | | | | | | | | | | | |
Dividends from net investment income | | (.44 | ) | | (.37 | ) | | (.35 | ) | | (.28 | ) | | (.09 | ) | | (.32 | ) |
Distributions from net
realized gain on investment
transactions | | (.49 | ) | | (.94 | ) | | -0- | | | -0- | | | -0- | | | -0- | |
Tax return of capital | | -0- | | | -0- | | | -0- | | | -0- | | | -0- | | | (.04 | ) |
| | | | | | | | | | | | | | | | | | |
Total dividends and distributions | | (.93 | ) | | (1.31 | ) | | (.35 | ) | | (.28 | ) | | (.09 | ) | | (.36 | ) |
| | | | | | | | | | | | | | | | | | |
Net asset value, end of period | | $ 18.32 | | | $ 18.33 | | | $ 17.64 | | | $ 16.84 | | | $ 15.16 | | | $ 14.56 | |
| | | | | | | | | | | | | | | | | | |
Total Return | | | | | | | | | | | | | | | | | | |
Total investment return
based on net asset value(e) | | 5.11 | %* | | 12.10 | % | | 6.89 | % | | 13.07 | % | | 4.75 | % | | 12.57 | % |
Ratios/Supplemental
Data | | | | | | | | | | | | | | | | | | |
Net assets, end of period (000’s omitted) | | $91,198 | | | $107,657 | | | $115,873 | | | $112,040 | | | $107,440 | | | $105,567 | |
Ratio to average net
assets of: | | | | | | | | | | | | | | | | | | |
Expenses, net of
waivers/reimbursements | | .63 | % | | .60 | %(f) | | .74 | % | | .67 | % | | .78 | %(g) | | .83 | % |
Expenses, before
waivers/reimbursements | | .63 | % | | .60 | %(f) | | .74 | % | | .71 | % | | .78 | %(g) | | .83 | % |
Net investment
income | | 2.38 | % | | 2.28 | %(f) | | 1.92 | % | | 2.19 | %(c) | | 2.11 | %(g) | | 2.36 | % |
Portfolio turnover rate | | 66 | % | | 52 | % | | 57 | % | | 58 | % | | 29 | % | | 62 | % |
See footnote summary on page 48.
| | |
| ALLIANCEBERNSTEIN BALANCED SHARES • | | 45 |
Financial Highlights
Selected Data For A Share Of Capital Stock Outstanding Throughout Each Period
| | | | | | | | | | | | | | | |
| | | Class R | |
| | | Year Ended November 30, | | | November 3,
2003 (h)
to November 30, 2003 | |
| | | 2007 | | | 2006 | | | 2005 | | | 2004 | | |
| | | | | | | | | | | | | | | |
Net asset value,
beginning of period | | $ 18.25 | | | $ 17.58 | | | $ 16.80 | | | $ 15.13 | | | $ 15.09 | |
| | | | | | | | | | | | | | | |
Income From
Investment
Operations | | | | | | | | | | | | | | | |
Net investment income(b) | | .34 | | | .30 | | | .24 | | | .30 | (c) | | .02 | |
Net realized and unrealized gain on investment
transactions | | .43 | | | 1.58 | | | .82 | | | 1.58 | | | .02 | |
Contribution from
Adviser | | .03 | | | -0- | (d) | | -0- | | | -0- | | | -0- | |
| | | | | | | | | | | | | | | |
Net increase in net asset
value from
operations | | .80 | | | 1.88 | | | 1.06 | | | 1.88 | | | .04 | |
| | | | | | | | | | | | | | | |
Less: Dividends and Distributions | | | | | | | | | | | | | | | |
Dividends from net
investment income | | (.33 | ) | | (.27 | ) | | (.28 | ) | | (.21 | ) | | -0- | |
Distributions from net
realized gain on
investment
transactions | | (.49 | ) | | (.94 | ) | | -0- | | | -0- | | | -0- | |
| | | | | | | | | | | | | | | |
Total dividends and distributions | | (.82 | ) | | (1.21 | ) | | (.28 | ) | | (.21 | ) | | -0- | |
| | | | | | | | | | | | | | | |
Net asset value, end of period | | $ 18.23 | | | $ 18.25 | | | $ 17.58 | | | $ 16.80 | | | $ 15.13 | |
| | | | | | | | | | | | | | | |
Total Return | | | | | | | | | | | | | | | |
Total investment return
based on net asset value(e) | | 4.47 | %* | | 11.37 | % | | 6.36 | % | | 12.52 | % | | .27 | % |
Ratios/Supplemental
Data | | | | | | | | | | | | | | | |
Net assets, end of period (000’s omitted) | | $8,432 | | | $3,197 | | | $1,393 | | | $371 | | | $10 | |
Ratio to average net
assets of: | | | | | | | | | | | | | | | |
Expenses, net of
waivers/
reimbursements | | 1.24 | % | | 1.22 | %(f) | | 1.33 | % | | 1.19 | % | | 1.34 | %(g) |
Expenses, before
waivers/
reimbursements | | 1.24 | % | | 1.22 | %(f) | | 1.33 | % | | 1.22 | % | | 1.34 | %(g) |
Net investment
income | | 1.83 | % | | 1.72 | %(f) | | 1.39 | % | | 1.94 | %(c) | | 1.70 | %(g) |
Portfolio turnover rate | | 66 | % | | 52 | % | | 57 | % | | 58 | % | | 29 | % |
See footnote summary on page 48.
| | |
| 46 | | • ALLIANCEBERNSTEIN BALANCED SHARES |
Financial Highlights
Selected Data For A Share Of Capital Stock Outstanding Throughout Each Period
| | | | | | | | | |
| | | Class K | |
| | | Year Ended November 30, | | | March 1,
2005(h) to November 30, 2005 | |
| | | 2007 | | | 2006 | | |
| | | | | | |
Net asset value,
beginning of period | | $ 18.28 | | | $ 17.60 | | | $ 17.34 | |
| | | |
Income From
Investment
Operations | | | | | | | | | |
Net investment income(b) | | .42 | | | .65 | | | .22 | |
Net realized and unrealized
gain on investment
transactions | | .40 | | | 1.29† | | | .24 | |
Contribution from
Adviser | | .03 | | | -0- | (d) | | -0- | |
| | | |
Net increase in net asset
value from
operations | | .85 | | | 1.94 | | | .46 | |
| | | |
Less: Dividends and
Distributions | | | | | | | | | |
Dividends from net
investment income | | (.40 | ) | | (.32 | ) | | (.20 | ) |
Distributions from net
realized gain on
investment
transactions | | (.49 | ) | | (.94 | ) | | -0- | |
| | | |
Total dividends and
distributions | | (.89 | ) | | (1.26 | ) | | (.20 | ) |
| | | |
Net asset value, end of
period | | $ 18.24 | | | $ 18.28 | | | $ 17.60 | |
| | | |
Total Return | | | | | | | | | |
Total investment return
based on net asset value(e) | | 4.74 | %* | | 11.74 | % | | 2.68 | % |
Ratios/Supplemental
Data | | | | | | | | | |
Net assets, end of period
(000’s omitted) | | $7,715 | | | $285 | | | $10 | |
Ratio to average net assets of: | | | | | | | | | |
Expenses | | .93 | % | | .91 | %(f) | | 1.01 | %(g) |
Net investment income | | 2.14 | % | | 2.15 | %(f) | | 1.69 | %(g) |
Portfolio turnover rate | | 66 | % | | 52 | % | | 57 | % |
See footnote summary on page 48.
| | |
| ALLIANCEBERNSTEIN BALANCED SHARES • | | 47 |
Financial Highlights
Selected Data For A Share Of Capital Stock Outstanding Throughout Each Period
| | | | | | | | | |
| | | Class I | |
| | | Year Ended November 30, | | | March 1,
2005(h) to
November 30, 2005 | |
| | | 2007 | | | 2006 | | |
| | | |
Net asset value, beginning of period | | $ 18.27 | | | $ 17.60 | | | $ 17.34 | |
| | | |
Income From Investment Operations | | | | | | | | | |
Net investment income(b) | | .44 | | | .39 | | | .24 | |
Net realized and unrealized gain on investment transactions | | .45 | | | 1.60 | | | .26 | |
Contribution from Adviser | | .03 | | | -0- | (d) | | -0- | |
| | | |
Net increase in net asset value from operations | | .92 | | | 1.99 | | | .50 | |
| | | |
Less: Dividends and Distributions | | | | | | | | | |
Dividends from net investment income | | (.44 | ) | | (.38 | ) | | (.24 | ) |
Distributions from net realized gain on investment transactions | | (.49 | ) | | (.94 | ) | | -0- | |
| | | |
Total dividends and distributions | | (.93 | ) | | (1.32 | ) | | (.24 | ) |
| | | |
Net asset value, end of period | | $ 18.26 | | | $ 18.27 | | | $ 17.60 | |
| | | |
Total Return | | | | | | | | | |
Total investment return based on net asset value(e) | | 5.12 | %* | | 12.07 | % | | 2.93 | % |
Ratios/Supplemental Data | | | | | | | | | |
Net assets, end of period (000’s omitted) | | $2,748 | | | $3,968 | | | $4,128 | |
Ratio to average net assets of: | | | | | | | | | |
Expenses | | .60 | % | | .59 | %(f) | | .81 | %(g) |
Net investment income | | 2.40 | % | | 2.28 | %(f) | | 2.41 | %(g) |
Portfolio turnover rate | | 66 | % | | 52 | % | | 57 | % |
| (a) | The Fund changed its fiscal year end from July 31 to November 30. |
| (b) | Based on average shares outstanding. |
| (c) | Net of expenses waived by the Adviser and Transfer Agent. |
| (d) | Amount is less than $.005. |
| (e) | Total investment return is calculated assuming an initial investment made at the net asset value at the beginning of the period, reinvestment of all dividends and distributions at net asset value during the period, and redemption on the last day of the period. Initial sales charges or contingent deferred sales charges are not reflected in the calculation of total investment return. Total return does not reflect the deduction of taxes that a shareholder would pay on Fund distributions or the redemption of Fund shares. Total investment return calculated for a period of less than one year is not annualized. |
| (f) | The ratio includes expenses attributable to costs of proxy solicitation. |
| (h) | Commencement of distributions. |
| † | Due to the timing of sales and repurchases of capital shares, the net realized and unrealized gain (loss) per share is not in accord with the Fund’s change in net realized and unrealized gain (loss) on investment transactions for the period. |
| * | Includes the impact of proceeds received and credited to the Fund resulting from the Dynergy class action settlement, which enhanced the performance of each share class for the year ended October 31, 2007 by 0.13%. |
| | |
| 48 | | • ALLIANCEBERNSTEIN BALANCED SHARES |
Financial Highlights
REPORT OF INDEPENDENT REGISTERED
PUBLIC ACCOUNTING FIRM
The Board of Directors and Shareholders AllianceBernstein Balanced Shares Fund, Inc.
We have audited the accompanying statement of assets and liabilities, including the portfolio of investments, of AllianceBernstein Balanced Shares Fund, Inc. as of November 30, 2007, and the related statement of operations for the year then ended, and the statements of changes in net assets and the financial highlights for each of the years in the two-year period then ended. These financial statements and financial highlights are the responsibility of the Fund’s management. Our responsibility is to express an opinion on these financial statements and financial highlights based on our audits. The financial highlights for each of the presented years and periods ended prior to December 1, 2005 were audited by other independent registered public accountants whose report thereon, dated January 23, 2006, expressed an unqualified opinion on those financial highlights.
We conducted our audits in accordance with the standards of the Public Company Accounting Oversight Board (United States). Those standards require that we plan and perform the audit to obtain reasonable assurance about whether the financial statements and financial highlights are free of material misstatement. An audit includes examining, on a test basis, evidence supporting the amounts and disclosures in the financial statements. Our procedures included confirmation of securities owned as of November 30, 2007, by correspondence with the custodian and brokers or by other appropriate auditing procedures. An audit also includes assessing the accounting principles used and significant estimates made by management, as well as evaluating the overall financial statement presentation. We believe that our audits provide a reasonable basis for our opinion.
In our opinion, the financial statements and financial highlights referred to above present fairly, in all material respects, the financial position of AllianceBernstein Balanced Shares Fund, Inc. as of November 30, 2007, and the results of its operations for the year then ended, and the changes in its net assets and the financial highlights for each of the years in the two-year period then ended, in conformity with U.S. generally accepted accounting principles.

New York, New York
January 25, 2008
| | |
| ALLIANCEBERNSTEIN BALANCED SHARES • | | 49 |
Report of Independent Registered Public Accounting Firm
TAX INFORMATION
(unaudited)
For the fiscal year ended November 30, 2007 certain dividends paid by the Fund may be subject to a maximum tax rate of 15%, as provided for by the Jobs and Growth Tax Relief Reconciliation Act of 2003. The Fund designates 63.60% of the ordinary income distributions paid in the fiscal year as qualified dividend income which is taxed at a maximum rate of 15%.
For corporate shareholders, 62.26% of the total ordinary income distribution paid during the current fiscal year ended November 30, 2007 qualifies for the corporate dividends received deduction. In addition, the Fund designates $41,161,028 from dividends paid in the fiscal year as long-term capital gains dividends.
For foreign shareholders, the Fund designates 41.09% of its ordinary dividends as qualified interest income.
Shareholders should not use the above information to prepare their tax returns. The information necessary to complete your income tax returns will be included with your Form 1099-DIV which will be sent to you separately in January 2008.
| | |
| 50 | | • ALLIANCEBERNSTEIN BALANCED SHARES |
Tax Information
BOARD OF DIRECTORS
William H. Foulk, Jr.(1), Chairman
Marc O. Mayer, President and Chief Executive Officer
David H. Dievler(1)
John H. Dobkin(1)
Michael J. Downey(1)
D. James Guzy(1)
Nancy P. Jacklin(1)
Marshall C. Turner, Jr.(1)
Earl D. Weiner(1)
OFFICERS(2)
Philip L. Kirstein, Senior Vice President and Independent Compliance Officer
Paul C. Rissman, Senior Vice President
Craig Ayers, Vice President
Frank V. Caruso, Vice President
Aryeh Glatter, Vice President
Shawn E. Keegan, Vice President
Joran Laird, Vice President
Alison M. Martier, Vice President
Douglas J. Peebles, Vice President
Jeffrey S. Phlegar, Vice President
Greg J. Wilensky, Vice President
Emilie D. Wrapp, Secretary
Joseph J. Mantineo, Treasurer and Chief Financial Officer
Vincent S. Noto, Controller
| | |
Custodian State Street Bank and Trust Company One Lincoln Street Boston, MA 02111 Principal Underwriter AllianceBernstein Investments, Inc. 1345 Avenue of the Americas New York, NY 10105 Legal Counsel Seward & Kissel LLP One Battery Park Plaza New York, NY 10004 | | Transfer Agent AllianceBernstein Investor Services, Inc. P.O. Box 786003 San Antonio, TX 78278-6003 Toll-Free (800) 221-5672 Independent Registered Public Accounting Firm KPMG LLP 345 Park Avenue New York, NY 10154 |
| (1) | Member of the Audit Committee, the Governance and Nominating Committee and the Independent Directors Committee. |
| (2) | The management of and investment decisions for the Fund are made by the Balanced Shares Investment Team, comprised of senior members of the Relative Value Investment Team and senior members of the U.S. Core Investment Grade: Core Fixed-Income Investment Team. Messrs. Frank Caruso and Aryeh Glatter are the investment professionals responsible for the day-to-day management of the equity component of the Fund’s portfolio and Messrs. Jeffrey Phlegar, Douglas Peebles, Shawn Keegan, Joran Laird and Greg Wilensky and Ms. Alison Martier are the investment professionals responsible for the day-to-day management of the debt component of the Fund’s portfolio. |
| | |
| ALLIANCEBERNSTEIN BALANCED SHARES • | | 51 |
Board of Directors
MANAGEMENT OF THE FUND
Board of Directors Information
The business and affairs of the Fund are managed under the direction of the Board of Directors. Certain information concerning the Fund’s Directors is set forth below.
| | | | | | |
NAME,
ADDRESS* AND AGE
(FIRST YEAR ELECTED**) | | PRINCIPAL
OCCUPATION(S)
DURING PAST 5 YEARS | | PORTFOLIOS
IN FUND
COMPLEX
OVERSEEN BY
DIRECTOR | | OTHER
DIRECTORSHIPS
HELD BY
DIRECTOR |
| INTERESTED DIRECTOR | | | | |
Marc O. Mayer, † 1345 Avenue of the Americas New York, NY 10105 50 (2003) | | Executive Vice President of AllianceBernstein L.P. (“AllianceBernstein”) since 2001 and Executive Managing Director of AllianceBernstein Investments, Inc. (“ABI”) since 2003; prior there to, he was head of AllianceBernstein Institutional Investments, a unit of AllianceBernstein from 2001-2003. Prior thereto, Chief Executive Officer of Sanford C. Bernstein & Co., LLC (institutional research and brokerage arm of Bernstein & Co., LLC) (“SCB & Co.”) and its predecessor since prior to 2003. | | 103 | | SCB Partners, Inc. and SCB Inc. |
| | | | | | |
| DISINTERESTED DIRECTORS | | | | |
William H. Foulk, Jr.,#, + Chairman of the Board 75 (1992) | | Investment Adviser and an Independent Consultant. He was formerly Senior Manager of Barrett Associates, Inc., a registered investment adviser, with which he had been associated since prior to 2003. He was formerly Deputy Comptroller and Chief Investment Officer of the State of New York and, prior thereto, Chief Investment Officer of the New York Bank for Savings. | | 105 | | None |
| | | | | | |
David H. Dievler, # 78 (1987) | | Independent Consultant. Until December 1994, he was Senior Vice President of AllianceBernstein Corporation (“AB Corp.”) (formerly, Alliance Capital Management Corp- oration) responsible for mutual fund administration. Prior to joining AB Corp. in 1984, he was Chief Financial Officer of Eberstadt Asset Management since 1968. Prior to that, he was a Senior Manager at Price Waterhouse & Co. Member of American Institute of Certified Public Accountants since 1953. | | 104 | | None |
| | |
| 52 | | • ALLIANCEBERNSTEIN BALANCED SHARES |
Management of the Fund
| | | | | | |
NAME,
ADDRESS* AND AGE
(FIRST YEAR ELECTED**) | | PRINCIPAL
OCCUPATION(S)
DURING PAST 5 YEARS | | PORTFOLIOS
IN FUND
COMPLEX
OVERSEEN BY
DIRECTOR | | OTHER
DIRECTORSHIPS
HELD BY
DIRECTOR |
DISINTERESTED DIRECTORS (continued) | | | | |
John H. Dobkin, # 65 (1992) | | Consultant. Formerly, President of Save Venice, Inc. (preservation organization) from 2001-2002, Senior Advisor from June 1999 – June 2000 and President of Historic Hudson Valley (historic preservation) from December 1989 – May 1999. Previously, Director of the National Academy of Design and during 1988-1992, Director and Chairman of the Audit Committee of AB Corp. | | 103 | | None |
| | | | | | |
Michael J. Downey, # 64 (2005) | | Private Investor since January 2004. Formerly, managing partner of Lexington Capital, LLC (investment advisory firm) from December 1997 until December 2003. Prior thereto, Chairman and CEO of Prudential Mutual Fund Management from 1987 to 1993. | | 103 | | Asia Pacific Fund, Inc., The Merger Fund and Prospect Acquisition Corp. (financial services) |
| | | | | | |
D. James Guzy, # 71 (2005) | | Chairman of the Board of PLX Technology (semi-conductors) and of SRC Computers Inc., with which he has been associated since prior to 2003. | | 103 | | Intel Corporation (semi-conductors) and Cirrus Logic Corporation (semi-conductors) |
| | |
| ALLIANCEBERNSTEIN BALANCED SHARES • | | 53 |
Management of the Fund
| | | | | | |
NAME,
ADDRESS* AND AGE
(FIRST YEAR ELECTED**) | | PRINCIPAL
OCCUPATION(S)
DURING PAST 5 YEARS | | PORTFOLIOS
IN FUND
COMPLEX
OVERSEEN BY
DIRECTOR | | OTHER
DIRECTORSHIPS
HELD BY
DIRECTOR |
DISINTERESTED DIRECTORS
(continued) | | | | |
Nancy P. Jacklin, # 59 (2006) | | Formerly, U.S. Executive Director of the International Monetary Fund (December 2002-May 2006); Partner, Clifford Chance (1992-2002); Sector Counsel, International Banking and Finance, and Associate General Counsel, Citicorp (1985-1992); Assistant General Counsel (International), Federal Reserve Board of Governors (1982-1985); and Attorney Advisor, U.S. Department of the Treasury (1973-1982). Member of the Bar of the District of Columbia and of New York; and member of the Council on Foreign Relations. | | 103 | | None |
| | | | | | |
Marshall C. Turner, Jr., # 66 (2005) | | Consultant. Formerly, President and CEO, Toppan Photomasks, Inc., (semi-conductor manufacturing services), 2005-2006, and Chairman and CEO from 2003 until 2005, when the company was acquired and renamed from Dupont Photomasks, Inc. Principal, Turner Venture Associates (venture capital and consulting) 1993-2003. | | 103 | | Xilinx, Inc. (semi-conductors) and MEMC Electronic Materials, Inc. (semi-conductor substrates) |
| | | | | | |
Earl D. Weiner, # 68 (2007) | | Of Counsel, and Partner prior to January 2007, of the law firm Sullivan & Cromwell LLP; member of ABA Federal Regulation of Securities Committee Task Force on Fund Director’s Guidebook; member of Advisory Board of Sustainable Forestry Management Limited. | | 103 | | None |
| * | The address for each of the Fund’s disinterested Directors is AllianceBernstein L.P., c/o Philip L. Kirstein, 1345 Avenue of the Americas, New York, NY 10105. |
| ** | There is no stated term of office for the Fund’s Directors. |
| † | Mr. Mayer is an “interested director”, as defined in the 1940 Act, due to his position as an Executive Vice President of AllianceBernstein. |
| # | Member of the Audit Committee, the Governance and Nominating Committee and the Independent Directors Committee. |
| + | Member of the Fair Value Pricing Committee. |
| | |
| 54 | | • ALLIANCEBERNSTEIN BALANCED SHARES |
Management of the Fund
Officer Information
Certain information concerning the Fund’s Officers is set forth below.
| | | | |
NAME, ADDRESS*
AND AGE | | POSITION(S)
HELD WITH FUND | | PRINCIPAL OCCUPATION
DURING PAST 5 YEARS** |
Marc O. Mayer
50 | | President and Chief Executive Officer
| | See biography above. |
| | | | |
Philip L. Kirstein
62 | | Senior Vice President and Independent Compliance Officer | | Senior Vice President and Independent Compliance Officer of the AllianceBernstein Funds, with which he has been associated since October 2004. Prior thereto, he was Of Counsel to Kirkpatrick & Lockhart, LLP from October 2003 to October 2004, and General Counsel of Merrill Lynch Investment Managers, L.P. since prior to March 2003. |
| | | | |
Paul C. Rissman
51 | | Senior Vice President | | Executive Vice President of AllianceBernstein**, with which he has been associated since prior to 2003. |
| | | | |
Craig Ayers
37 | | Vice President | | Senior Vice President of AllianceBernstein**, with which he has been associated since prior to 2003. |
| | | | |
Frank V. Caruso
51 | | Vice President | | Senior Vice President of AllianceBernstein**, with which he has been associated since prior to 2003. |
| | | | |
Aryeh Glatter
40 | | Vice President | | Senior Vice President of AllianceBernstein**, with which he has been associated since prior to 2003. |
| | | | |
Shawn E Keegan
36 | | Vice President | | Vice President of AllianceBernstein**, with which he has been associated since prior to 2003. |
| | | | |
Joran Laird
32 | | Vice President | | Vice President of AllianceBernstein**, with which he has been associated since prior to 2003. |
| | | | |
Alison M. Martier
51 | | Vice President | | Senior Vice President of AllianceBernstein**, with which she has been associated since prior to 2003. |
| | | | |
Douglas J. Peebles
42 | | Vice President | | Executive Vice President of AllianceBernstein**, with which he has been associated since prior to 2003. |
| | | | |
Jeffrey S. Phlegar
41 | | Vice President | | Executive Vice President of AllianceBernstein**, with which he has been associated since prior to 2003. |
| | | | |
Greg J. Wilensky
40 | | Vice President | | Senior Vice President of AllianceBernstein**, with which he has been associated since prior to 2003. |
| | | | |
Emilie D. Wrapp
52 | | Secretary | | Senior Vice President, Assistant General Counsel and Assistant Secretary of ABI**, with which she has been associated since prior to 2003. |
| | |
| ALLIANCEBERNSTEIN BALANCED SHARES • | | 55 |
Management of the Fund
| | | | |
NAME, ADDRESS*
AND AGE | | POSITION(S)
HELD WITH FUND | | PRINCIPAL OCCUPATION
DURING PAST 5 YEARS** |
| | | | |
Joseph J. Mantineo
48 | | Treasurer and Chief Financial Officer | | Senior Vice President of AllianceBernstein Investor Services, Inc. (“ABIS”)**, with which he has been associated since prior to 2003. |
| | | | |
Vincent S. Noto
43 | | Controller | | Vice President of ABIS**, with which he has been associated since prior to 2003. |
| * | The address for each of the Fund’s Officers is 1345 Avenue of the Americas, New York, NY 10105. |
| ** | AllianceBernstein, ABI, ABIS and SCB & Co. are affiliates of the Fund. |
| | The Fund’s Statement of Additional Information (“SAI”) has additional information about the Fund’s Directors and Officers and is available without charge upon request. Contact your financial representative or AllianceBernstein at (800) 227-4618 for a free prospectus or SAI. |
| | |
| 56 | | • ALLIANCEBERNSTEIN BALANCED SHARES |
Management of the Fund
THE FOLLOWING IS NOT PART OF THE SHAREHOLDER REPORT OR THE FINANCIAL STATEMENTS
SUMMARY OF SENIOR OFFICER’S EVALUATION OF INVESTMENT ADVISORY AGREEMENT1
The following is a summary of the evaluation of the Investment Advisory Agreement between AllianceBernstein L.P. (the “Adviser”) and the AllianceBernstein Balanced Shares, Inc. (the “Fund”).2 The evaluation of the Investment Advisory Agreement was prepared by Philip L. Kirstein, the Senior Officer of the Fund, for the Directors of the Fund, as required by an August 2004 agreement between the Adviser and the New York State Attorney General (the “NYAG”). The Senior Officer’s evaluation of the Investment Advisory Agreement is not meant to diminish the responsibility or authority of the Board of Directors of the Fund to perform its duties pursuant to Section 15 of the Investment Company Act of 1940 (the “40 Act”) and applicable state law. The purpose of the summary is to provide shareholders with a synopsis of the independent evaluation of the reasonableness of the advisory fees proposed to be paid by the Fund which was provided to the Directors in connection with their review of the proposed approval of the continuance of the Investment Advisory Agreement. The Senior Officer’s evaluation considered the following factors:
| | 1. | Advisory fees charged to institutional and other clients of the Adviser for like services; |
| | 2. | Advisory fees charged by other mutual fund companies for like services; |
| | 3. | Costs to the Adviser and its affiliates of supplying services pursuant to the advisory agreement, excluding any intra-corporate profit; |
| | 4. | Profit margins of the Adviser and its affiliates from supplying such services; |
| | 5. | Possible economies of scale as the Fund grows larger; and |
| | 6. | Nature and quality of the Adviser’s services including the performance of the Fund. |
| 1 | It should be noted that the information in the fee summary completed on April 23, 2007 and presented to the Board of Directors on May 1-3, 2007. |
| 2 | Future references to the Fund do not include “AllianceBernstein.” References in the fee summary pertaining to performance and expense ratios refer to the Class A shares of the Fund. |
| | |
| ALLIANCEBERNSTEIN BALANCED SHARES • | | 57 |
FUND ADVISORY FEES, EXPENSE REIMBURSEMENTS & RATIOS
The Adviser proposed that the Fund pay the advisory fee set forth in the table below for receiving the services to be provided pursuant to the Investment Advisory Agreement.3
| | | | |
| Fund | | Net Assets 02/28/07 ($MIL) | | Advisory Fee Based on % of Average Daily Net Assets |
| Balanced Shares, Inc. | | $1,704.2 | | 60 bp on 1st $200 million 50 bp on next $200 million 40 bp on the balance |
The Adviser is reimbursed as specified in the Investment Advisory Agreement for certain clerical, legal, accounting, administrative and other services provided to the Fund. During the Fund’s most recently completed fiscal year, the Adviser received $95,477 (0.005% of the Fund’s average daily net assets) for such services.
Set forth below are the Fund’s total expense ratios for the most recently completed fiscal year:
| | | | | | | |
| Fund | | Total Expense
Ratio | | | Fiscal Year |
| Balanced Shares, Inc. | | Class A
Class B
Class C
Class R
Class K
Class I
Adv. Class | | 0.88
1.62
1.61
1.22
0.91
0.59
0.60 | %
%
%
%
%
%
% | | November 30 |
I. ADVISORY FEES CHARGED TO INSTITUTIONAL AND OTHER CLIENTS
The advisory fees charged to investment companies which the Adviser manages and sponsors are normally higher than those charged to similar sized institutional accounts, including pension plans and sub-advised investment companies. The fee differential reflects, among other things, different services provided to such clients, and different liabilities assumed. Services provided by the Adviser to the Fund that are not provided to non-investment company clients and sub-advised investment companies include providing office space and personnel to serve as Fund Officers, who among other responsibilities make the certifications required under the Sarbanes-Oxley Act of 2002, and coordinating with and monitoring the Fund’s third party service providers such as Fund counsel, auditors, custodians, transfer agents and pricing services. The accounting, administrative, legal and compliance requirements for the Fund are more costly
| 3 | The Fund’s fee schedule was not amended in connection with the Adviser’s settlement with the NYAG in December 2003 since the Fund’s fee schedule already had lower breakpoints than the NYAG related fee schedule for AllianceBernstein Mutual Funds in the “Balanced” category. |
| | |
| 58 | | • ALLIANCEBERNSTEIN BALANCED SHARES |
than those for institutional assets due to the greater complexities and time required for investment companies, although as previously noted, a portion of these expenses are reimbursed by the Fund to the Adviser. Also, retail mutual funds managed by the Adviser are widely held. Servicing the Fund’s investors is more time consuming and labor intensive compared to institutional clients since the Adviser needs to communicate with a more extensive network of financial intermediaries and shareholders. In addition, managing the cash flow of an investment company may be more difficult than managing that of a stable pool of assets, such as an institutional account with little cash movement in either direction, particularly, if a fund is in net redemption and the Adviser is frequently forced to sell securities to raise cash for redemptions. However, managing a fund with positive cash flow may be easier at times than managing a stable pool of assets. Finally, in recent years, investment advisers have been sued by institutional clients and have suffered reputational damage both by the attendant publicity and outcomes other than complete victories. Accordingly, the legal and reputational risks associated with institutional accounts are greater than previously thought, although still not equal to those related to the mutual fund industry.
Notwithstanding the Adviser’s view that managing an investment company is not comparable to managing other institutional accounts because the services provided are different and legal and reputational risks are greater, it is worth considering information regarding the advisory fees charged to institutional accounts with a substantially similar investment style as the Fund. However, with respect to the Fund, the Adviser represented that there is no institutional product that has a somewhat similar investment style as the Fund.
The adviser also manages the AllianceBernstein Variable Products Series Fund, Inc. (“AVPS”), which is available through variable annuity and variable life contracts offered by other financial institutions and offers policyholders the option to utilize certain AVPS portfolios as the investment option underlying their insurance contracts. Set forth below is the fee schedule of the AVPS portfolio that has a substantially similar investment style as the Fund:4
| | | | | | |
| Fund | | AVPS Portfolio | | Fee Schedule | | Effective
AVPS
Adv. Fee |
| Balanced Shares, Inc. | | Balanced Shares Portfolio | | 0.55% on first $2.5 billion 0.45% on next $2.5 billion 0.40% on the balance | | 0.55% |
The Adviser represented that it does not sub-advise any registered investment company with a substantially similar investment style as the Fund.
| 4 | It should be noted that the AVPS portfolio was affected by the settlement between the Adviser and the NYAG. |
| | |
| ALLIANCEBERNSTEIN BALANCED SHARES • | | 59 |
| II. | MANAGEMENT FEES CHARGED BY OTHER MUTUAL FUND COMPANIES FOR LIKE SERVICES. |
Lipper, Inc. (“Lipper”), an analytical service that is not affiliated with the Adviser, compared the fees charged to the Fund with fees charged to other investment companies for similar services offered by other investment advisers. Lipper’s analysis included the Fund’s ranking with respect to the proposed management fee relative to the median of the Fund’s Lipper Expense Group (“EG”)5 at the approximate current asset level of the Fund.6
Lipper describes an EG as a representative sample of comparable funds. Lipper’s standard methodology for screening funds to be included in an EG entails the consideration of several fund criteria, including fund type, investment classification/objective, load type and similar 12b-1/non-12b-1 service fees, asset (size) comparability, expense components and attributes. An EG will typically consist of seven to twenty funds.
| | | | | | |
| Fund | | Contractual
Management
Fee7 | | Lipper Group Median | | Rank |
Balanced Shares, Inc. | | 0.434 | | 0.621 | | 3/9 |
Lipper also analyzed the Fund’s most recently completed fiscal year total expense ratio in comparison to the Fund’s EG and Lipper Expense Universe (“EU”). The EU8 is a broader group compared to the EG, consisting of all funds that have the same investment classification/objective and load type as the subject Fund.
| | | | | | | | | | |
| Fund | | Expense Ratio
(%)9 | | Lipper Group Median
(%) | | Lipper Group Rank | | Lipper Universe Median
(%) | | Lipper
Universe Rank |
Balanced Shares, Inc. | | 0.885 | | 1.112 | | 2/9 | | 1.199 | | 11/73 |
| 5 | It should be noted that Lipper does not consider average account size when constructing EGs. Funds with relatively small average account sizes tend to have higher transfer agent expense ratios than comparable sized funds that have relatively large average account sizes. Note that there are limitations on Lipper expense category data because different funds categorize expenses differently. |
| 6 | The contractual management fee is calculated by Lipper using the Fund’s contractual management fee rate at a hypothetical asset level. The hypothetical asset level is based on the combined net assets of all classes of the Fund, rounded up to the next $25 million. Lipper’s total expense ratio information is based on the most recent annual report except as otherwise noted. A ranking of “1” would mean that the Fund had the lowest effective fee rate in the Lipper peer group. |
| 7 | The contractual management fee does not reflect any expense reimbursements made by the Fund to the Adviser for certain clerical, legal, accounting, administrative and other services. |
| 8 | Except for asset (size) comparability, Lipper uses the same criteria for selecting an EG when selecting an EU. Unlike the EG, the EU allows for the same adviser to be represented by more than just one fund. |
| 9 | Most recently completed fiscal year end Class A total expense ratio. |
| | |
| 60 | | • ALLIANCEBERNSTEIN BALANCED SHARES |
Based on this analysis, the Fund has a more favorable ranking on a total expense ratio basis than it does on a management fee basis.
| III. | COSTS TO THE ADVISER AND ITS AFFILIATES OF SUPPLYING SERVICES PURSUANT TO THE ADVISORY FEE ARRANGEMENT, EXCLUDING ANY INTRA-CORPORATE PROFIT. |
The Adviser utilizes two profitability reporting systems, which operate independently but are aligned with each other, to estimate the Adviser’s profitability in connection with investment advisory services provided to the Fund. The Senior Officer has retained a consultant to provide independent advice regarding the alignment of the two profitability systems as well as the methodologies and allocations utilized by both profitability systems. See Section IV for additional discussion.
| IV. | PROFIT MARGINS OF THE ADVISER AND ITS AFFILIATES FOR SUPPLYING SUCH SERVICES. |
The Fund’s profitability information, prepared by the Adviser for the Board of Directors, was reviewed by the Senior Officer and the consultant. The Adviser’s profitability from providing investment advisory services to the Fund decreased during calendar year 2006, relative to 2005.
In addition to the Adviser’s direct profits from managing the Fund, certain of the Adviser’s affiliates have business relationships with the Fund and may earn a profit from providing other services to the Fund. The courts have referred to this type of business opportunity as “fall-out benefits” to the Adviser and indicated that such benefits should be factored into the evaluation of the total relationship between the Fund and the Adviser. Neither case law nor common business practice precludes the Adviser’s affiliates from earning a reasonable profit on this type of relationship provided the affiliates’ charges and services are competitive. These affiliates provide transfer agent, distribution and brokerage related services to the Fund and receive transfer agent fees, Rule 12b-1 payments, front-end sales loads, contingent deferred sales charges (“CDSC”), and brokerage commissions. In addition, the Adviser benefits from soft dollar arrangements which offset expenses the Adviser would otherwise incur.
AllianceBernstein Investments, Inc. (“ABI”), an affiliate of the Adviser, is the Fund’s principal underwriter. ABI and the Adviser have disclosed in the Fund’s prospectus that they may make revenue sharing payments from their own resources, in addition to resources derived from sales loads and Rule 12b-1 fees, to firms that sell shares of the Fund. In 2006, ABI paid approximately 0.044% of the average monthly assets of the AllianceBernstein Mutual Funds or approximately $20.4 million for distribution services and educational support (revenue sharing payments). For 2007, it is anticipated, ABI will pay approximately 0.04% of the average monthly assets of the AllianceBernstein Mutual Funds or
| | |
| ALLIANCEBERNSTEIN BALANCED SHARES • | | 61 |
approximately $20 million.10 During the Fund’s most recently completed fiscal year, ABI received from the Fund $42,017, $9,614,502 and $577,497 in front-end sales charges, Rule 12b-1 and CDSC fees, respectively.
Fees and reimbursements for out of pocket expenses charged by AllianceBernstein Investor Services, Inc. (“ABIS”), the affiliated transfer agent for the Fund, are charged on a per account basis, based on the level of service provided and the class of share held by the account. ABIS also receives a fee per shareholder sub-account for each account maintained by an intermediary on an omnibus basis. ABIS’ after-tax profitability decreased in 2006 in comparison to 2005. During the Fund’s most recently completed fiscal year, ABIS received $1,067,639 in fees from the Fund.11
The Fund effected brokerage transactions through the Adviser’s affiliate, Sanford C. Bernstein & Co., LLC (“SCB & Co.”) and/or its U.K. affiliate, Sanford C. Bernstein Limited (“SCB Ltd.”), collectively “SCB,” and paid commissions for such transactions during the Fund’s most recently completed fiscal year. The Adviser represented that SCB’s profitability from any business conducted with the Fund is comparable to the profitability of SCB’s dealings with other similar third party clients. In the ordinary course of business, SCB receives and pays liquidity rebates from electronic communications networks (“ECNs”) derived from trading for its clients. These credits and charges are not being passed onto any SCB client, including the Fund. The Adviser also receives certain soft dollar benefits from brokers that execute agency trades for the Fund and other clients. These soft dollar benefits reduce the Adviser’s cost of doing business and increase its profitability.
| V. | POSSIBLE ECONOMIES OF SCALE |
An independent consultant, retained by the Senior Officer, made a presentation to the Board of Directors regarding economies of scale and/or scope. Based on the independent consultant’s initial survey, there was a consensus that fund management companies benefited from economies of scale. However, due to the lack of cost data, researchers had to infer facts about the costs from the behavior of fund expenses; there was a lack of consensus among researchers as to whether economies of scale were being passed on to the shareholders.
| 10 | ABI currently inserts the “Advance” in quarterly account statements and pays the incremental costs associated with the mailing. The incremental cost is less than what an “independent mailing” would cost. |
| 11 | The fees disclosed are net of any expense offsets with ABIS. An expense offset is created by the interest earned on the positive cash balance that occurs within the transfer agent account as there is a one day lag with regards to money movement from the shareholder’s account to the transfer agent’s account and then the transfer agent’s account to the Fund’s account. During the Fund’s most recently completed fiscal year, the fees paid by the Fund to ABIS were reduced by $167,822 under the offset agreement between the Fund and ABIS. |
| | |
| 62 | | • ALLIANCEBERNSTEIN BALANCED SHARES |
The independent consultant conducted further studies of the Adviser’s operations to determine the existence of economies of scale and/or scope within the Adviser. The independent consultant also analyzed patterns related to advisory fees at the industry level. In a recent presentation to the Board of Directors, the independent consultant noted the potential for economies of scale and/or scope through the use of “pooling portfolios” and blend products. The independent consultant also remarked that there may be diseconomies as assets grow in the less liquid and active markets. It was also observed that various factors, including fund size, family size, asset class, and investment style, had an impact on advisory fees.
| VI. | NATURE AND QUALITY OF THE ADVISER’S SERVICES, INCLUDING THE PERFORMANCE OF THE FUND |
With assets under management of approximately $742 billion as of March 31, 2007, the Adviser has the investment experience to manage and provide non-investment services (described in Section I) to the Fund.
The information prepared by Lipper shows the 1, 3, 5 and 10 year performance rankings of the Fund12 relative to its Lipper Performance Group (“PG”) and Lipper Performance Universe (“PU”)13 for the periods ended December 31, 2006.14
| | | | | | | | | | |
Balanced Shares, Inc. | | Fund
Return | | PG Median | | PU Median | | PG Rank | | PU Rank |
1 year | | 13.21 | | 12.15 | | 11.76 | | 3/9 | | 36/121 |
3 year | | 9.06 | | 8.75 | | 8.45 | | 3/7 | | 36/97 |
5 year | | 7.29 | | 5.83 | | 5.92 | | 1/6 | | 18/79 |
10 year | | 9.65 | | 7.03 | | 7.09 | | 1/4 | | 6/49 |
| 12 | The performance rankings are for the Class A shares of the Fund. It should be noted that the performance returns of the Fund shown were provided by the Adviser. Lipper maintains its own database that includes the Fund’s performance returns. Rounding differences may cause the Adviser’s Fund returns to be one or two basis points different from Lipper’s own Fund returns. To maintain consistency, the performance returns of the Fund, as reported by the Adviser, are provided instead of Lipper. |
| 13 | The Fund’s PG is identical to the Fund’s EG. The Fund’s PU is not identical to the Fund’s EU as the criteria for including or excluding a fund in a PU is somewhat different from that of an EU. |
| 14 | Note that the current Lipper investment classification/objective dictates the PG and PU throughout the life of the fund even if a fund had a different investment classification/objective at a different point in time. |
| | |
| ALLIANCEBERNSTEIN BALANCED SHARES • | | 63 |
Set forth below are the 1, 3, 5, 10 year and since inception performance returns of the Fund (in bold)15 versus its benchmark.16 Fund and benchmark volatility and reward-to-variability ratio (“Sharpe Ratio”) information is also shown.17
| | | | | | | | | | | | | | | | |
| | | Periods Ending December 31, 2006
Annualized Performance |
| | | 1 Year
(%) | | 3 Year
(%) | | 5 Year
(%) | | 10 year
(%) | | Since
Inception
(%) | | Annualized | | Risk
Period
(Year) |
| | | | | | | Volatility
(%) | | Sharpe
(%) | |
Balanced Shares, Inc. | | 13.21 | | 9.06 | | 7.29 | | 9.65 | | 9.47 | | 9.97 | | 0.60 | | 10 |
Russell 1000 Value Index | | 22.25 | | 15.09 | | 10.86 | | 11.00 | | N/A | | 14.21 | | 0.54 | | 10 |
Lehman Brothers Government/Credit Bond Index | | 3.78 | | 3.44 | | 5.17 | | 6.26 | | N/A | | 4.20 | | 0.58 | | 10 |
60% Russell 1000 Value Index/ 40% Lehman Brothers Government/Credit Index | | 14.86 | | 10.43 | | 8.58 | | 9.10 | | N/A | | N/A | | N/A | | N/A |
Inception Date: June 8, 1932
CONCLUSION:
Based on the factors discussed above the Senior Officer’s conclusion is that the proposed advisory fee for the Fund is reasonable and within the range of what would have been negotiated at arm’s-length in light of all the surrounding circumstances. This conclusion in respect of the Fund is based on an evaluation of all of these factors and no single factor was dispositive.
Dated: June 4, 2007
| 15 | The performance returns and risk measures shown in the table are for the Class A shares of the Fund. |
| 16 | The Adviser provided Fund and benchmark performance return information for periods through December 31, 2006. It should be noted that the “since inception” performance returns of the Fund’s benchmark goes back only through the nearest month-end after inception date. In contrast, the Fund’s since inception return goes back to the Fund’s actual inception date. |
| 17 | Fund and benchmark volatility and Sharpe Ratio information was obtained through Lipper LANA, a database maintained by Lipper. Volatility is a statistical measure of the tendency of a market price or yield to vary over time. A Sharpe Ratio is a risk adjusted measure of return that divides a fund’s return in excess of the riskless return by the fund’s standard deviation. A fund with a greater volatility would be seen as more risky than a fund with equivalent performance but lower volatility; for that reason, a greater return would be demanded for the more risky fund. A fund with a higher Sharpe Ratio would be viewed as better performing than a fund with a lower Sharpe Ratio. |
| | |
| 64 | | • ALLIANCEBERNSTEIN BALANCED SHARES |
THIS PAGE IS NOT PART OF THE SHAREHOLDER REPORT OR THE FINANCIAL STATEMENTS
ALLIANCEBERNSTEIN FAMILY OF FUNDS
Wealth Strategies Funds
Balanced Wealth Strategy
Wealth Appreciation Strategy
Wealth Preservation Strategy
Tax-Managed Balanced Wealth Strategy
Tax-Managed Wealth Appreciation Strategy
Tax-Managed Wealth Preservation Strategy
Blended Style Funds
U.S. Large Cap Portfolio
International Portfolio
Tax-Managed International Portfolio
Growth Funds
Domestic
Growth Fund
Mid-Cap Growth Fund
Large Cap Growth Fund
Small Cap Growth Portfolio
Global & International
Global Health Care Fund
Global Research Growth Fund
Global Technology Fund
Greater China ‘97 Fund
International Growth Fund
International Research Growth Fund
Value Funds
Domestic
Balanced Shares
Focused Growth & Income Fund
Growth & Income Fund
Small/Mid-Cap Value Fund
Utility Income Fund
Value Fund
Global & International
Global Real Estate Investment Fund*
Global Value Fund
International Value Fund
Taxable Bond Funds
Diversified Yield Fund*
Global Bond Fund*
High Income Fund*
Intermediate Bond Portfolio
Short Duration Portfolio
Municipal Bond Funds
| | |
National
Insured National
Arizona
California
Insured California
Florida
Massachusetts | | Michigan
Minnesota
New Jersey
New York
Ohio
Pennsylvania
Virginia |
Intermediate Municipal Bond Funds
Intermediate California
Intermediate Diversified
Intermediate New York
Closed-End Funds
All-Market Advantage Fund
AllianceBernstein Global High Income Fund
AllianceBernstein Income Fund
AllianceBernstein National Municipal Income Fund*
ACM Managed Dollar Income Fund
California Municipal Income Fund
New York Municipal Income Fund
The Spain Fund
Retirement Strategies Funds
| | | | |
2000 Retirement Strategy | | 2020 Retirement Strategy | | 2040 Retirement Strategy |
2005 Retirement Strategy | | 2025 Retirement Strategy | | 2045 Retirement Strategy |
2010 Retirement Strategy | | 2030 Retirement Strategy | | 2050 Retirement Strategy |
2015 Retirement Strategy | | 2035 Retirement Strategy | | 2055 Retirement Strategy |
We also offer Exchange Reserves,** which serves as the money market fund exchange vehicle for the AllianceBernstein mutual funds.
You should consider the investment objectives, risks, charges and expenses of any AllianceBernstein fund/portfolio carefully before investing. For free copies of our prospectuses, which contain this and other information, visit us online at www.alliancebernstein.com or contact your financial advisor. Please read the prospectus carefully before investing.
| * | | Prior to March 1, 2007, Global Real Estate Investment Fund was named Real Estate Investment Fund. Prior to May 18, 2007, AllianceBernstein National Municipal Income Fund was named National Municipal Income Fund. Prior to November 5, 2007, Diversified Yield Fund was named Global Strategic Income Trust and Global Bond Fund was named Global Government Income Trust. Prior to January 28, 2008, High Income Fund was named Emerging Market Debt Fund. |
| ** | An investment in the Fund is not a deposit in a bank and is not insured or guaranteed by the Federal Deposit Insurance Corporation or any other government agency. Although the Fund seeks to preserve the value of your investment at $1.00 per share, it is possible to lose money by investing in the Fund. |
AllianceBernstein Family of Funds
| | |
| ALLIANCEBERNSTEIN BALANCED SHARES • | | 65 |
ALLIANCEBERNSTEIN BALANCED SHARES
1345 Avenue of the Americas
New York, NY 10105
800.221.5672
| | |
| BAL-0151-1107 | |  |
(a) The registrant has adopted a code of ethics that applies to its principal executive officer, principal financial officer and principal accounting officer. A copy of the registrant’s code of ethics is filed herewith as Exhibit 12(a)(1).
(b) During the period covered by this report, no material amendments were made to the provisions of the code of ethics adopted in 2(a) above.
(c) During the period covered by this report, no implicit or explicit waivers to the provisions of the code of ethics adopted in 2(a) above were granted.
| ITEM 3. | AUDIT COMMITTEE FINANCIAL EXPERT. |
The registrant’s Board of Directors has determined that independent directors David H. Dievler and William H. Foulk, Jr. qualify as audit committee financial experts.
| ITEM 4. | PRINCIPAL ACCOUNTANT FEES AND SERVICES. |
(a) - (c) The following table sets forth the aggregate fees billed by the independent registered public accounting firm KPMG LLP, for the Fund’s last two fiscal years, for professional services rendered for: (i) the audit of the Fund’s annual financial statements included in the Fund’s annual report to stockholders; (ii) assurance and related services that are reasonably related to the performance of the audit of the Fund’s financial statements and are not reported under (i), which include advice and education related to accounting and auditing issues, quarterly press release review (for those Funds that issue quarterly press releases), and preferred stock maintenance testing (for those Funds that issue preferred stock); and (iii) tax compliance, tax advice and tax return preparation.
| | | | | | | | |
| | | Audit Fees | | Audit-Related Fees | | Tax Fees |
| AB Balanced Shares | | 2006 | | $35,000 | | $— | | $9,500 |
| | 2007 | | $36,500 | | $— | | $13,650 |
(d) Not applicable.
(e) (1) Beginning with audit and non-audit service contracts entered into on or after May 6, 2003, the Fund’s Audit Committee policies and procedures require the pre-approval of all audit and non-audit services provided to the Fund by the Fund’s independent registered public accounting firm. The Fund’s Audit Committee policies and procedures also require pre-approval of all audit and non-audit services provided to the Adviser and Service Affiliates to the extent that these services are directly related to the operations or financial reporting of the Fund.
(e) (2) All of the amounts for Audit Fees, Audit-Related Fees and Tax Fees in the table under Item 4 (a) – (c) are for services pre-approved by the Fund’s Audit Committee.
(f) Not applicable.
(g) The following table sets forth the aggregate non-audit services provided to the Fund, the Fund’s Adviser and entities that control, are controlled by or under common control with the Adviser that provide ongoing services to the Fund, which include conducting an annual internal control report pursuant to Statement on Auditing Standards No. 70 (“Service Affiliates”):
| | | | | | |
| | | | | All Fees for Non-Audit Services Provided to the Portfolio, the Adviser and Service Affiliates | | Pre-approved by the Audit Committee (Portion Comprised of Audit Related Fees) (Portion Comprised of Tax Fees) |
| AB Balanced Shares | | 2006 | | $2,151,600 | | $9,500 |
| | | | | | $— |
| | | | | | $(9,500) |
| | 2007 | | $353,057 | | $13,650 |
| | | | | | $— |
| | | | | | $(13,650) |
(h) The Audit Committee of the Fund has considered whether the provision of any non-audit services not pre-approved by the Audit Committee provided by the Fund’s independent registered public accounting firm to the Adviser and Service Affiliates is compatible with maintaining the auditor’s independence.
| ITEM 5. | AUDIT COMMITTEE OF LISTED REGISTRANTS. |
Not applicable to the registrant.
| ITEM 6. | SCHEDULE OF INVESTMENTS. |
Please see Schedule of Investments contained in the Report to Shareholders included under Item 1 of this Form N-CSR.
| ITEM 7. | DISCLOSURE OF PROXY VOTING POLICIES AND PROCEDURES FOR CLOSED-END MANAGEMENT INVESTMENT COMPANIES. |
Not applicable to the registrant.
| ITEM 8. | PORTFOLIO MANAGERS OF CLOSED-END MANAGEMENT INVESTMENT COMPANIES. |
Not applicable to the registrant.
| ITEM 9. | PURCHASES OF EQUITY SECURITIES BY CLOSED-END MANAGEMENT INVESTMENT COMPANY AND AFFILIATED PURCHASERS. |
Not applicable to the registrant.
| ITEM 10. | SUBMISSION OF MATTERS TO A VOTE OF SECURITY HOLDERS. |
There have been no material changes to the procedures by which shareholders may recommend nominees to the Fund’s Board of Directors since the Fund last provided disclosure in response to this item.
| ITEM 11. | CONTROLS AND PROCEDURES. |
(a) The registrant’s principal executive officer and principal financial officer have concluded that the registrant’s disclosure controls and procedures (as defined in Rule 30a-3 (c) under the Investment Company Act of 1940, as amended) are effective at the reasonable assurance level based on their evaluation of these controls and procedures as of a date within 90 days of the filing date of this document.
(b) There were no significant changes in the registrant’s internal controls over financial reporting during the second fiscal quarter of the period that could significantly affect these controls subsequent to the date of their evaluation, including any corrective actions with regard to significant deficiencies and material weaknesses.
The following exhibits are attached to this Form N-CSR:
| | |
EXHIBIT NO. | | DESCRIPTION OF EXHIBIT |
12 (a) (1) | | Code of Ethics that is subject to the disclosure of Item 2 hereof |
| |
12 (b) (1) | | Certification of Principal Executive Officer Pursuant to Section 302 of the Sarbanes-Oxley Act of 2002 |
| |
12 (b) (2) | | Certification of Principal Financial Officer Pursuant to Section 302 of the Sarbanes-Oxley Act of 2002 |
| |
12 (c) | | Certification of Principal Executive Officer and Principal Financial Officer Pursuant to Section 906 of the Sarbanes-Oxley Act of 2002 |
SIGNATURES
Pursuant to the requirements of the Securities Exchange Act of 1934 and the Investment Company Act of 1940, the registrant has duly caused this report to be signed on its behalf by the undersigned, thereunto duly authorized.
(Registrant): AllianceBernstein Balanced Shares, Inc.
| | |
| By: | | /s/ Marc O. Mayer |
| | Marc O. Mayer |
| | President |
| |
| Date: | | January 29, 2008 |
Pursuant to the requirements of the Securities Exchange Act of 1934 and the Investment Company Act of 1940, this report has been signed below by the following persons on behalf of the registrant and in the capacities and on the dates indicated.
| | |
| By: | | /s/ Marc O. Mayer |
| | Marc O. Mayer |
| | President |
| |
| Date: | | January 29, 2008 |
| |
| By: | | /s/ Joseph J. Mantineo |
| | Joseph J. Mantineo |
| | Treasurer and Chief Financial Officer |
| |
| Date: | | January 29, 2008 |