UNITED STATES
SECURITIES AND EXCHANGE COMMISSION
WASHINGTON, D.C. 20549
FORM N-CSR
CERTIFIED SHAREHOLDER REPORT OF REGISTERED
MANAGEMENT INVESTMENT COMPANIES
Investment Company Act file number: 811-00134
ALLIANCEBERNSTEIN BALANCED SHARES, INC.
(Exact name of registrant as specified in charter)
1345 Avenue of the Americas, New York, New York 10105
(Address of principal executive offices) (Zip code)
Joseph J. Mantineo
AllianceBernstein L.P.
1345 Avenue of the Americas
New York, New York 10105
(Name and address of agent for service)
Registrant’s telephone number, including area code: (800) 221-5672
Date of fiscal year end: November 30, 2009
Date of reporting period: November 30, 2009
| ITEM 1. | REPORTS TO STOCKHOLDERS. |
ANNUAL REPORT
AllianceBernstein Balanced Shares

Annual Report
Investment Products Offered
| | • | | Are Not Bank Guaranteed |
The investment return and principal value of an investment in the Fund will fluctuate as the prices of the individual securities in which it invests fluctuate, so that your shares, when redeemed, may be worth more or less than their original cost. You should consider the investment objectives, risks, charges and expenses of the Fund carefully before investing. For a free copy of the Fund’s prospectus, which contains this and other information, visit our web site at www.alliancebernstein.com or call your financial advisor or AllianceBernstein® at (800) 227-4618. Please read the prospectus carefully before you invest.
You may obtain performance information current to the most recent month-end by visiting www.alliancebernstein.com.
This shareholder report must be preceded or accompanied by the Fund’s prospectus for individuals who are not current shareholders of the Fund.
You may obtain a description of the Fund’s proxy voting policies and procedures, and information regarding how the Fund voted proxies relating to portfolio securities during the most recent 12-month period ended June 30, without charge. Simply visit AllianceBernstein’s web site at www.alliancebernstein.com, or go to the Securities and Exchange Commission’s (the “Commission”) web site at www.sec.gov, or call AllianceBernstein at (800) 227-4618.
The Fund files its complete schedule of portfolio holdings with the Commission for the first and third quarters of each fiscal year on Form N-Q. The Fund’s Forms N-Q are available on the Commission’s web site at www.sec.gov. The Fund’s Forms N-Q may also be reviewed and copied at the Commission’s Public Reference Room in Washington, DC; information on the operation of the Public Reference Room may be obtained by calling (800) SEC-0330. AllianceBernstein publishes full portfolio holdings for the Fund monthly at www.alliancebernstein.com.
AllianceBernstein Investments, Inc. (ABI) is the distributor of the AllianceBernstein family of mutual funds. ABI is a member of FINRA and is an affiliate of AllianceBernstein L.P., the manager of the funds.
AllianceBernstein® and the AB Logo are registered trademarks and service marks used by permission of the owner, AllianceBernstein L.P.
January 20, 2010
Annual Report
This report provides management’s discussion of fund performance for AllianceBernstein Balanced Shares (the “Fund”) for the annual reporting period ended November 30, 2009.
Investment Objective and Policies
The Fund’s investment objective is total return consistent with reasonable risks through a combination of income and long-term growth of capital. The Fund invests in a diversified portfolio of equity and fixed-income securities. The percentage of the Fund’s assets invested in each type of security will vary. Normally, the Fund’s investments will consist of about 60% in stocks, but stocks may comprise up to 75% of its investments. The Fund will not purchase a security if, as a result, less than 25% of its total assets will be in fixed-income securities. The Fund may invest up to 20% of its assets in high-yield securities (securities rated below BBB- by Standard & Poor’s Rating Services (“S&P”), Moody’s Investors Service, Inc. (“Moody’s”), or Fitch Ratings (“Fitch”)). As an operating policy, the Fund will invest no more than 5% of its assets in securities rated CCC- or below.
The Fund may invest in mortgage-related and other asset-backed securities, loan participations, inflation-protected securities, structured securities, variable, floating, and inverse floating rate instruments, preferred stock, and may use other investment techniques. The Fund invests in short- and long-term debt securities in such proportions and of such type as AllianceBernstein L.P. (the “Adviser”) deems best adapted to the current economic and
market outlooks. The Fund also may invest in equity and fixed-income securities of non-US issuers located in emerging or developed countries. The Fund may enter into derivatives transactions, such as options, futures, forwards and swap agreements.
Investment Results
The table on page 7 shows the Fund compared with its composite benchmark (the “Composite”), a 60%/40% blend of the Russell 1000 Value Index and the Barclays Capital US Aggregate Bond Index, respectively, for the six- and 12-month periods ended November 30, 2009. Also included in the table are returns for the Fund’s peer group, as represented by the Lipper Mixed-Asset Target Allocation Growth Funds Average (the “Lipper Average”). Funds in the Lipper Average have generally similar investment objectives to the Fund, although some may have different investment policies and sales and management fees.
The Fund’s Class A shares without sales charges underperformed the Composite and the Lipper Average for the six-month period ended November 30, 2009. For the 12-month period, the Fund’s Class A shares without sales charges outperformed the Composite, but underperformed the Lipper Average.
The Fund’s absolute returns were solid for both the six- and 12-month periods as the cumulative effect of monetary and fiscal policy initiatives around the world resuscitated global capital markets. In the equity portion of the Fund, strong sector selection contributed to solid absolute and relative
| | |
| ALLIANCEBERNSTEIN BALANCED SHARES • | | 1 |
performance during the 12-month period. Stock selection benefited primarily from Fund holdings in economically sensitive stocks such as Occidental Petroleum, Joy Global and Goodrich. Occidental Petroleum’s exposure to higher oil prices, and its innovative extraction technology, contributed to solid fundamental and investment performance. Joy Global was a strong performer as monetary and fiscal stimulus initiatives by policy makers around the world contributed to higher confidence in future sales of Joy’s commodity-linked capital products (e.g., coal extraction). The Fund’s investment in Wyeth, which was purchased by Pfizer, and an underweight in AT&T also helped performance.
Meanwhile, underweight positions in Goldman Sachs and JPMorgan, and an overweight in Amgen detracted from performance. An underweight in financials, including Goldman Sachs and JPMorgan Chase, continues to be driven by the Relative Value Investment Team’s perception of fundamental risk and only modestly interesting valuations. On the other hand, Amgen has been executing well and has an interesting product pipeline which the Relative Value Investment Team believes may drive sales and earnings. Many companies with higher quality balance sheets, like Amgen, underperformed during the reporting period as investors chased returns in riskier securities which investors believed would potentially benefit from an improved economy. At the sector level, an overweight in technology and underweight in utilities helped performance during the 12-month reporting period, while an
underweight in materials and financials detracted.
For the six-month period, weak stock selection and modestly negative sector allocation contributed to disappointing relative performance in the equity portion of the Fund. Stock selection benefited primarily from holdings in Medco Health Solutions, Joy Global, Accenture and an underweight position in AT&T. Stock selection was hurt by exposure to Qwest Communications, SAIC Inc., URS Corp, Advanced Auto Parts and Amgen. An underweight position in utilities in addition to an overweight in technology helped performance. An underweight in materials and financials was a modest detractor.
The fixed-income portion of the Fund significantly outperformed its benchmark for both the six- and 12-month periods as investors gained confidence that a sustainable economic recovery was underway and credit sectors rallied. For both periods, an overweight position in investment-grade corporates, commercial mortgage-backed securities (CMBS) and high-yield debt as well as an underweight in mortgages and government securities positively contributed to performance. Corporate security selection was also positive. The Fund’s performance was not affected by leverage during either period.
Market Review and Investment Strategy
Challenges from late 2008 continued into early 2009 as asset prices in many markets continued to fall and policymakers scrambled to combat the severe global economic downturn. By
| | |
| 2 | | • ALLIANCEBERNSTEIN BALANCED SHARES |
the second quarter of 2009, however, signs of a bottoming of the global recession resulted in a significant rally in credit sectors as well as equities. Capital markets rebounded on growing evidence that aggressive policy action on a global scale had been successful at staving off a depression-type scenario. Risk assets continued the rally into the third quarter as evidence mounted that the global economy was emerging from a deep recession and appeared on track for a return to modest economic growth in 2010.
Risky assets rallied substantially over the six-month period as investors gained confidence that the global economy was emerging from a deep recession and appeared on track for a return to economic growth. Generally, stocks and sectors that performed worst during the crisis in 2008 have done best in 2009. Financials and other economically sensitive sectors outperformed defensive sectors. In addition, the most highly leveraged and lowest-quality stocks and those with the worst earnings revisions and momentum outperformed. Corporate bonds, CMBS and other non-government debt also rallied as spreads narrowed.
The annual reporting period ended November 30, 2009, was marked by a historic recovery in many fixed-income sectors after the extreme risk aversion that seized the markets following the bankruptcy of Lehman Brothers in September 2008. The high-yield market staged a historic recovery, posting 64.95% for the 12-month reporting period as spreads tightened
in excess of a thousand basis points from their peak to end the period at 742 basis points over duration-neutral Treasuries. Investment-grade corporates at 27.75% and CMBS at 49.74% also staged rallies as investor risk aversion abated on signs that a sustainable global economic recovery was underway. Corporate earnings appeared to have reached bottom after a two-year plunge, and positive earnings surprises increased. Government securities, which outperformed in the downturn following Lehman Brothers’ collapse, lagged as credit sectors rallied. For the 12-month reporting period, Treasuries posted a gain of only 2.37%, while agencies did marginally better, returning 6.82%.
The global economic recovery has been led by China and other countries in emerging Asia. Many observers wonder if the recovery can be sustained if the US consumer continues to save more and spend less. After all, the American consumer accounts for the majority of nominal US gross domestic product, and in the decade leading up to the recent crisis, the US consumers’ borrowing and consumption binge helped underpin global economic growth.
These concerns are not without foundation. Consumer spending remains depressed by stubbornly high unemployment and continued de-leveraging. But in the view of the Balanced Shares Investment Team (composed of the Relative Value Investment Team and the US Investment Grade Core Fixed-Income Team), these concerns are somewhat
| | |
| ALLIANCEBERNSTEIN BALANCED SHARES • | | 3 |
overstated. First, consumers in the US and other developed markets, while still under financial stress, have made significant progress over the past year in rebuilding their balance sheets. The portion of disposable income eaten up by debt service has fallen sharply in both the US and the UK since the peak of the crisis. In fact, US households have cut this ratio to its lowest level since 2000.
Nevertheless, significant risks and challenges persist for the global economy and financial markets. Many investors worry about how governments and central banks around the world will wind down their massive fiscal and monetary stimulus programs as their economies recover. These concerns notwithstanding, the Relative Value Investment Team is confident that the fundamentally strong and attractively priced equity portion of the Fund offers enormous outperformance potential. Thus, the Relative Value Investment Team continues to stick to its disciplines, confident that the strategies in place may ultimately deliver attractive outperformance.
Within the fixed-income portion of the Fund, the US Investment Grade Core Fixed-Income Team continued to favor investment-grade credit and CMBS securities. After a large rally that saw investment-grade corporate spreads tighten significantly, investment-grade credit is no longer the unparalleled opportunity it once was. The US Investment Grade Core Fixed-Income Team is confident, however, that it still represents a compelling opportunity. Spreads remain wider than at almost any period in recent history, and look attractive relative to fundamental risk, which, in the view of the US Investment Grade Core Fixed-Income Team, is diminishing. As liquidity has returned to the markets, systemic risk has dramatically fallen. The commercial real estate market continues to face fundamental headwinds, as delinquency rates continue to rise. Nevertheless, the sector is expected to continue to gain support from government programs.
| | |
| 4 | | • ALLIANCEBERNSTEIN BALANCED SHARES |
HISTORICAL PERFORMANCE
An Important Note About the Value of Historical Performance
The performance shown on the following pages represents past performance and does not guarantee future results. Current performance may be lower or higher than the performance information shown. You may obtain performance information current to the most recent month-end by visiting www.alliancebernstein.com.
The investment return and principal value of an investment in the Fund will fluctuate, so that your shares, when redeemed, may be worth more or less than their original cost. You should consider the investment objectives, risks, charges and expenses of the Fund carefully before investing. For a free copy of the Fund’s prospectus, which contains this and other information, visit our website at www.alliancebernstein.com or call your financial advisor or AllianceBernstein Investments at 800.227.4618. You should read the prospectus carefully before you invest.
All fees and expenses related to the operation of the Fund have been deducted. NAV returns do not reflect sales charges; if sales charges were reflected, the Fund’s quoted performance would be lower. SEC returns reflect the applicable sales charges for each share class: a 4.25% maximum front-end sales charge for Class A shares; the applicable contingent deferred sales charge for Class B shares (4% year 1, 3% year 2, 2% year 3, 1% year 4); a 1% 1 year contingent deferred sales charge for Class C shares. Returns for the different share classes will vary due to different expenses associated with each class. Performance assumes reinvestment of distributions and does not account for taxes.
Benchmark Disclosure
The unmanaged Russell 1000 Value Index and the unmanaged Barclays Capital US Aggregate Bond Index do not reflect fees and expenses associated with the active management of a mutual fund portfolio. The Russell 1000 Value Index contains those securities in the Russell 1000 Index with a less-than-average growth orientation. The unmanaged Russell 1000 Index is composed of 1000 of the largest capitalized companies that are traded in the United States. The unmanaged Barclays Capital US Aggregate Bond Index covers the US dollar-denominated, investment-grade, fixed-rate, taxable bond market of SEC-registered securities. The index includes bonds from the Treasury, Government-Related, Corporate, MBS, ABS and CMBS sectors. The composite benchmark represents a 60%/40% blend of the Russell 1000 Value Index and the Barclays Capital US Aggregate Bond Index, respectively. For the six-and 12-month periods ended November 30, 2009, the Lipper Mixed-Asset Target Allocation Growth Funds Average consisted of 665 and 645 funds, respectively. These funds have generally similar investment objectives to the Fund, although some may have different investment policies and sales and management fees. An investor cannot invest directly in an index or average, and their results are not indicative of the performance for any specific investment, including the Fund.
(Historical Performance continued on next page)
| | |
| ALLIANCEBERNSTEIN BALANCED SHARES • | | 5 |
Historical Performance
HISTORICAL PERFORMANCE
(continued from previous page)
A Word About Risk
The Fund is a “balanced” fund and must invest at least 25% of its total assets in fixed-income securities. Since the Fund invests in both equity and debt securities, it has the risk that the allocation of these investments may have a more significant effect on the Fund’s net asset value when one of these asset classes is performing more poorly than the other. The value of fixed-income securities will change as the general level of interest rates fluctuates. The Fund may invest in high-yield bonds (i.e., “junk bonds”) which involves a greater risk of default and price volatility than other bonds. Investing in below-investment grade bonds presents special risks, including credit risk. The Fund can invest in foreign securities, which may magnify fluctuations due to changes in foreign exchange rates and the possibility of substantial volatility due to political and economic uncertainties in foreign countries. The Fund may invest in emerging market securities which may present market, credit, currency, liquidity, legal, political and other risks different from, or greater than, the risks of investing in developed foreign (non-US) countries. In order to achieve its investment objectives, the Fund may at times use certain types of investment derivatives, such as options, futures, forwards and swaps. These instruments involve risks different from, and in certain cases, greater than, the risks presented by more traditional investments. These risks are fully discussed in the Fund’s prospectus.
(Historical Performance continued on next page)
| | |
| 6 | | • ALLIANCEBERNSTEIN BALANCED SHARES |
Historical Performance
HISTORICAL PERFORMANCE
(continued from previous page)
| | | | | | |
| | | | | | |
THE FUND VS. ITS BENCHMARK PERIODS ENDED NOVEMBER 30, 2009 | | Returns | | |
| | 6 Months | | 12 Months | | |
AllianceBernstein Balanced Shares* | | | | | | |
Class A | | 13.72% | | 24.43% | | |
| |
Class B** | | 13.20% | | 23.41% | | |
| |
Class C | | 13.31% | | 23.59% | | |
| |
Advisor Class† | | 13.93% | | 24.84% | | |
| |
Class R† | | 13.56% | | 24.15% | | |
| |
Class K† | | 13.76% | | 24.57% | | |
| |
Class I† | | 14.05% | | 25.09% | | |
| |
Composite Benchmark: 60% Russell 1000 Value Index/40% Barclays Capital US Aggregate Bond Index | | 14.52% | | 16.97% | | |
| |
Russell 1000 Value Index | | 20.19% | | 19.24% | | |
| |
Barclays Capital US Aggregate Bond Index | | 6.21% | | 11.63% | | |
| |
Lipper Mixed-Asset Target Allocation Growth Funds Average | | 15.90% | | 27.22% | | |
| |
* Includes the impact of proceeds received and credited to the Fund resulting from class action settlements, which enhanced the Fund’s performance by 0.01% and 0.27% for the six- and 12-month periods ended November 30, 2009, respectively. ** Effective January 31, 2009, Class B shares are no longer available for purchase to new investors. Please see Note A for additional information. † Please note that these share classes are for investors purchasing shares through accounts established under certain fee-based programs sponsored and maintained by certain broker-dealers and financial intermediaries, institutional pension plans and/or investment advisory clients of, and certain other persons associated with, the Adviser and its affiliates or the Funds. |
| | | | | | |
See Historical Performance and Benchmark Disclosures on pages 5-6.
(Historical Performance continued on next page)
| | |
| ALLIANCEBERNSTEIN BALANCED SHARES • | | 7 |
Historical Performance
HISTORICAL PERFORMANCE
(continued from previous page)
GROWTH OF A $10,000 INVESTMENT IN THE FUND
11/30/99 TO 11/30/09
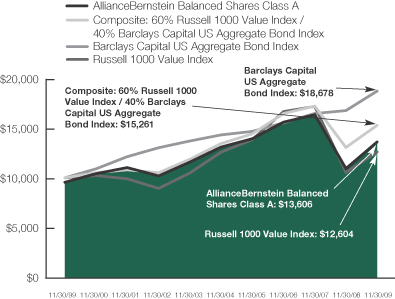
This chart illustrates the total value of an assumed $10,000 investment in AllianceBernstein Balanced Shares Class A shares (from 11/30/99 to 11/30/09) as compared to the performance of the Fund’s Composite benchmark, a 60%/40% blend of the Russell 1000 Value Index and the Barclays Capital US Aggregate Bond Index, respectively, as well as each index separately. The chart reflects the deduction of the maximum 4.25% sales charge from the initial $10,000 investment in the Fund and assumes the reinvestment of dividends and capital gains distributions.
See Historical Performance and Benchmark Disclosures on pages 5-6.
(Historical Performance continued on next page)
| | |
| 8 | | • ALLIANCEBERNSTEIN BALANCED SHARES |
Historical Performance
HISTORICAL PERFORMANCE
(continued from previous page)
| | | | | | |
| AVERAGE ANNUAL RETURNS AS OF NOVEMBER 30, 2009 | |
| | | NAV Returns | | | SEC Returns | |
| | | | | | |
| Class A Shares | | | | | | |
1 Year | | 24.43 | % | | 19.15 | % |
5 Years | | 0.79 | % | | -0.08 | % |
10 Years | | 3.57 | % | | 3.13 | % |
| | | | | | |
| Class B Shares | | | | | | |
1 Year | | 23.41 | % | | 19.41 | % |
5 Years | | 0.03 | % | | 0.03 | % |
10 Years(a) | | 2.96 | % | | 2.96 | % |
| | | | | | |
| Class C Shares | | | | | | |
1 Year | | 23.59 | % | | 22.59 | % |
5 Years | | 0.06 | % | | 0.06 | % |
10 Years | | 2.82 | % | | 2.82 | % |
| | | | | | |
| Advisor Class Shares* | | | | | | |
1 Year | | 24.84 | % | | 24.84 | % |
5 Years | | 1.08 | % | | 1.08 | % |
10 Years | | 3.87 | % | | 3.87 | % |
| | | | | | |
| Class R Shares* | | | | | | |
1 Year | | 24.15 | % | | 24.15 | % |
5 Years | | 0.50 | % | | 0.50 | % |
Since Inception† | | 2.42 | % | | 2.42 | % |
| | | | | | |
| Class K Shares* | | | | | | |
1 Year | | 24.57 | % | | 24.57 | % |
Since Inception† | | 0.04 | % | | 0.04 | % |
| | | | | | |
| Class I Shares* | | | | | | |
1 Year | | 25.09 | % | | 25.09 | % |
Since Inception† | | 0.39 | % | | 0.39 | % |
The Fund’s current prospectus fee table shows the Fund’s total annual operating expense ratios as 1.16%, 1.92%, 1.89%, 0.87%, 1.33%, 1.03% and 0.71% for Class A, Class B, Class C, Advisor, Class R, Class K and Class I shares, respectively. The Financial Highlights section of this report sets forth expense ratio data for the current reporting period; the expense ratios shown above may differ from the expense ratios in the Financial Highlights sections since they are based on different time periods.
| (a) | | Assumes conversion of Class B shares into Class A shares after eight years. |
| * | | These share classes are offered at net asset value (NAV) to eligible investors and their SEC returns are the same as the NAV returns. Please note that these share classes are for investors purchasing shares through accounts established under certain fee-based programs sponsored and maintained by certain broker-dealers and financial intermediaries, institutional pension plans and/or investment advisory clients of, and certain other persons associated with, the Adviser and its affiliates or the Funds. The inception dates for Class R, Class K and Class I are listed below. |
| † | | Inception Dates: 11/3/03 for Class R shares; 3/1/05 for Class K and Class I shares. |
See Historical Performance disclosures on pages 5-6.
(Historical Performance continued on next page)
| | |
| ALLIANCEBERNSTEIN BALANCED SHARES • | | 9 |
Historical Performance
HISTORICAL PERFORMANCE
(continued from previous page)
| | | | | | | |
| SEC AVERAGE ANNUAL RETURNS (WITH ANY APPLICABLE SALES CHARGES) AS OF THE MOST RECENT CALENDAR QUARTER-END (DECEMBER 31, 2009) | |
| | | | | | | SEC Returns | |
| | | | | | | |
| Class A Shares | | | | | | | |
1 Year | | | | | | 14.10 | % |
5 Years | | | | | | -0.38 | % |
10 Years | | | | | | 3.09 | % |
| | | | | | | |
| Class B Shares | | | | | | | |
1 Year | | | | | | 14.24 | % |
5 Years | | | | | | -0.26 | % |
10 Years(a) | | | | | | 2.94 | % |
| | | | | | | |
| Class C Shares | | | | | | | |
1 Year | | | | | | 17.23 | % |
5 Years | | | | | | -0.25 | % |
10 Years | | | | | | 2.79 | % |
| | | | | | | |
| Advisor Class Shares† | | | | | | | |
1 Year | | | | | | 19.43 | % |
5 Years | | | | | | 0.76 | % |
10 Years | | | | | | 3.83 | % |
| | | | | | | |
| Class R Shares† | | | | | | | |
1 Year | | | | | | 18.79 | % |
5 Years | | | | | | 0.20 | % |
Since Inception* | | | | | | 2.59 | % |
| | | | | | | |
| Class K Shares† | | | | | | | |
1 Year | | | | | | 19.10 | % |
Since Inception* | | | | | | 0.28 | % |
| | | | | | | |
| Class I Shares† | | | | | | | |
1 Year | | | | | | 19.71 | % |
Since Inception* | | | | | | 0.65 | % |
| (a) | | Assumes conversion of Class B shares into Class A shares after eight years. |
| * | | Please note that these share classes are for investors purchasing shares through accounts established under certain fee-based programs sponsored and maintained by certain broker-dealers and financial intermediaries, institutional pension plans and/or investment advisory clients of, and certain other persons associated with, the Adviser and its affiliates or the Funds. The inception dates for Class R, Class K and Class I are listed below. |
| † | | Inception Dates: 11/3/03 for Class R shares; 3/1/05 for Class K and Class I shares. |
See Historical Performance disclosures on pages 5-6.
| | |
| 10 | | • ALLIANCEBERNSTEIN BALANCED SHARES |
Historical Performance
FUND EXPENSES
(unaudited)
As a shareholder of the Fund, you incur two types of costs: (1) transaction costs, including sales charges (loads) on purchase payments, contingent deferred sales charges on redemptions and (2) ongoing costs, including management fees; distribution (12b-l) fees; and other Fund expenses. This example is intended to help you understand your ongoing costs (in dollars) of investing in the Fund and to compare these costs with the ongoing costs of investing in other mutual funds.
The Example is based on an investment of $1,000 invested at the beginning of the period and held for the entire period as indicated below.
Actual Expenses
The table below provides information about actual account values and actual expenses. You may use the information, together with the amount you invested, to estimate the expenses that you paid over the period. Simply divide your account value by $1,000 (for example, an $8,600 account value divided by $1,000 = 8.6), then multiply the result by the number under the heading entitled “Expenses Paid During Period” to estimate the expenses you paid on your account during this period.
Hypothetical Example for Comparison Purposes
The table below also provides information about hypothetical account values and hypothetical expenses based on the Fund’s actual expense ratio and an assumed annual rate of return of 5% before expenses, which is not the Fund’s actual return. The hypothetical account values and expenses may not be used to estimate the actual ending account balance or expenses you paid for the period. You may use this information to compare the ongoing costs of investing in the Fund and other funds by comparing this 5% hypothetical example with the 5% hypothetical examples that appear in the shareholder reports of other funds.
Please note that the expenses shown in the table are meant to highlight your ongoing costs only and do not reflect any transactional costs, such as sales charges (loads), or contingent deferred sales charges on redemptions. Therefore, the hypothetical example is useful in comparing ongoing costs only, and will not help you determine the relative total costs of owning different funds. In addition, if these transactional costs were included, your costs would have been higher.
| | | | | | | | | | | | | | | | | | |
| | | Beginning
Account Value
June 1, 2009 | | Ending
Account Value
November 30, 2009 | | Expenses Paid
During Period* |
| | | Actual | | Hypothetical | | Actual | | Hypothetical** | | Actual | | Hypothetical |
| Class A | | $ | 1,000 | | $ | 1,000 | | $ | 1,137.19 | | $ | 1,020.00 | | $ | 5.41 | | $ | 5.11 |
| Class B | | $ | 1,000 | | $ | 1,000 | | $ | 1,132.04 | | $ | 1,016.14 | | $ | 9.51 | | $ | 9.00 |
| Class C | | $ | 1,000 | | $ | 1,000 | | $ | 1,133.12 | | $ | 1,016.34 | | $ | 9.30 | | $ | 8.80 |
| Advisor Class | | $ | 1,000 | | $ | 1,000 | | $ | 1,139.34 | | $ | 1,021.46 | | $ | 3.86 | | $ | 3.65 |
| Class R | | $ | 1,000 | | $ | 1,000 | | $ | 1,135.63 | | $ | 1,018.45 | | $ | 7.07 | | $ | 6.68 |
| Class K | | $ | 1,000 | | $ | 1,000 | | $ | 1,137.65 | | $ | 1,019.95 | | $ | 5.47 | | $ | 5.16 |
| Class I | | $ | 1,000 | | $ | 1,000 | | $ | 1,140.47 | | $ | 1,021.76 | | $ | 3.54 | | $ | 3.35 |
| * | | Expenses are equal to the classes’ annualized expense ratios of 1.01%, 1.78%, 1.74%, 0.72%, 1.32%, 1.02% and 0.66%, respectively, multiplied by the average account value over the period, multiplied by 183/365 (to reflect the one-half year period). |
| ** | | Assumes 5% return before expenses. |
| | |
| ALLIANCEBERNSTEIN BALANCED SHARES • | | 11 |
Fund Expenses
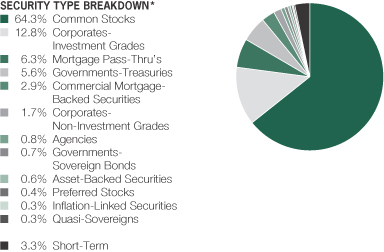
PORTFOLIO SUMMARY
November 30, 2009 (unaudited)
PORTFOLIO STATISTICS
Net Assets ($mil): $755.6
TEN LARGEST HOLDINGS**
November 30, 2009 (unaudited)
| | | | | | |
| Company | | U.S. $ Value | | Percent of
Net Assets | |
Federal National Mortgage Association | | $ | 41,251,387 | | 5.5 | % |
U.S. Treasury Notes | | | 32,863,767 | | 4.3 | |
Exxon Mobil Corp. | | | 24,011,890 | | 3.2 | |
Amgen, Inc. | | | 18,409,545 | | 2.4 | |
Occidental Petroleum Corp. | | | 16,260,199 | | 2.2 | |
Chevron Corp. | | | 14,611,429 | | 1.9 | |
Raytheon Co. | | | 14,526,307 | | 1.9 | |
Philip Morris International, Inc. | | | 13,950,909 | | 1.9 | |
Qwest Communications International, Inc. | | | 13,338,378 | | 1.8 | |
Comcast Corp. – Class A | | | 13,188,550 | | 1.7 | |
| | $ | 202,412,361 | | 26.8 | % |
| * | | All data are as of November 30, 2009. The Fund’s security type breakdown is expressed as a percentage of total investments and may vary over time. |
| ** | | Long-term investments. |
| | |
| 12 | | • ALLIANCEBERNSTEIN BALANCED SHARES |
Portfolio Summary and Ten Largest Holdings
PORTFOLIO OF INVESTMENTS
November 30, 2009
| | | | | |
| Company | | Shares | | U.S. $ Value |
| |
| | | | | |
COMMON STOCKS – 64.6% | | | | | |
Financials – 10.9% | | | | | |
Capital Markets – 2.7% | | | | | |
BlackRock, Inc. – Class A | | 19,200 | | $ | 4,359,936 |
The Goldman Sachs Group, Inc. | | 29,300 | | | 4,971,038 |
Morgan Stanley | | 133,400 | | | 4,212,772 |
SEI Investments Co. | | 100,300 | | | 1,756,253 |
State Street Corp. | | 86,900 | | | 3,588,970 |
TD Ameritrade Holding Corp.(a) | | 92,520 | | | 1,817,093 |
| | | | | |
| | | | | 20,706,062 |
| | | | | |
Diversified Financial Services – 2.3% | | | | | |
Bank of America Corp. | | 245,500 | | | 3,891,175 |
IntercontinentalExchange, Inc.(a) | | 37,600 | | | 4,015,304 |
JP Morgan Chase & Co. | | 226,700 | | | 9,632,483 |
| | | | | |
| | | | | 17,538,962 |
| | | | | |
Insurance – 5.9% | | | | | |
ACE Ltd. | | 129,750 | | | 6,320,122 |
Arch Capital Group Ltd.(a) | | 120,100 | | | 8,387,784 |
Axis Capital Holdings Ltd. | | 428,200 | | | 11,985,318 |
Loews Corp. | | 108,600 | | | 3,846,612 |
RenaissanceRe Holdings Ltd. | | 65,100 | | | 3,468,528 |
Transatlantic Holdings, Inc. | | 58,000 | | | 3,134,320 |
The Travelers Co., Inc. | | 137,800 | | | 7,219,342 |
| | | | | |
| | | | | 44,362,026 |
| | | | | |
| | | | | 82,607,050 |
| | | | | |
Energy – 10.7% | | | | | |
Energy Equipment & Services – 1.2% | | | | | |
Cameron International Corp.(a) | | 93,825 | | | 3,546,585 |
Dresser-Rand Group, Inc.(a) | | 44,300 | | | 1,243,944 |
Noble Corp. | | 105,520 | | | 4,359,031 |
| | | | | |
| | | | | 9,149,560 |
| | | | | |
Oil, Gas & Consumable Fuels – 9.5% | | | | | |
BP PLC (Sponsored ADR) | | 179,300 | | | 10,252,374 |
Chevron Corp. | | 187,230 | | | 14,611,429 |
Exxon Mobil Corp. | | 319,860 | | | 24,011,890 |
Occidental Petroleum Corp. | | 201,265 | | | 16,260,199 |
Total SA (Sponsored ADR) | | 111,445 | | | 6,930,765 |
| | | | | |
| | | | | 72,066,657 |
| | | | | |
| | | | | 81,216,217 |
| | | | | |
Health Care – 10.1% | | | | | |
Biotechnology – 2.4% | | | | | |
Amgen, Inc.(a) | | 326,700 | | | 18,409,545 |
| | | | | |
| | |
Health Care Providers & Services – 3.2% | | | | | |
AmerisourceBergen Corp. – Class A | | 81,780 | | | 2,019,148 |
Cardinal Health, Inc. | | 60,200 | | | 1,940,246 |
Medco Health Solutions, Inc.(a) | | 152,035 | | | 9,602,530 |
| | |
| ALLIANCEBERNSTEIN BALANCED SHARES • | | 13 |
Portfolio of Investments
| | | | | |
| Company | | Shares | | U.S. $ Value |
| |
| | | | | |
Quest Diagnostics, Inc. | | 66,990 | | $ | 3,881,401 |
UnitedHealth Group, Inc. | | 228,700 | | | 6,556,829 |
| | | | | |
| | | | | 24,000,154 |
| | | | | |
Life Sciences Tools & Services – 1.1% | | | | | |
Thermo Fisher Scientific, Inc.(a) | | 179,400 | | | 8,473,062 |
| | | | | |
| | |
Pharmaceuticals – 3.4% | | | | | |
Eli Lilly & Co. | | 207,500 | | | 7,621,475 |
Endo Pharmaceuticals Holdings, Inc.(a) | | 90,990 | | | 2,004,510 |
Forest Laboratories, Inc.(a) | | 126,850 | | | 3,889,221 |
Merck & Co., Inc. | | 120,280 | | | 4,355,339 |
Pfizer, Inc. | | 419,200 | | | 7,616,864 |
| | | | | |
| | | | | 25,487,409 |
| | | | | |
| | | | | 76,370,170 |
| | | | | |
Information Technology – 8.4% | | | | | |
Communications Equipment – 0.3% | | | | | |
F5 Networks, Inc.(a) | | 40,825 | | | 1,920,000 |
| | | | | |
| | |
Computers & Peripherals – 1.7% | | | | | |
Dell, Inc.(a) | | 466,900 | | | 6,592,628 |
EMC Corp.(a) | | 382,100 | | | 6,430,743 |
| | | | | |
| | | | | 13,023,371 |
| | | | | |
Electronic Equipment, Instruments & Components – 0.6% | | | | | |
Arrow Electronics, Inc.(a) | | 171,400 | | | 4,504,392 |
| | | | | |
| | |
Internet Software & Services – 0.6% | | | | | |
Ebay, Inc.(a) | | 174,700 | | | 4,274,909 |
| | | | | |
| | |
IT Services – 3.0% | | | | | |
Accenture PLC | | 96,429 | | | 3,957,446 |
Amdocs Ltd.(a) | | 204,400 | | | 5,402,292 |
Broadridge Financial Solutions, Inc. | | 89,400 | | | 1,965,012 |
Hewitt Associates, Inc. – Class A(a) | | 91,900 | | | 3,692,542 |
SAIC, Inc.(a) | | 436,500 | | | 7,778,430 |
| | | | | |
| | | | | 22,795,722 |
| | | | | |
Semiconductors & Semiconductor Equipment – 1.4% | | | | | |
Texas Instruments, Inc. | | 412,400 | | | 10,429,596 |
| | | | | |
| | |
Software – 0.8% | | | | | |
Sybase, Inc.(a) | | 59,900 | | | 2,410,376 |
Symantec Corp.(a) | | 221,900 | | | 3,938,725 |
| | | | | |
| | | | | 6,349,101 |
| | | | | |
| | | | | 63,297,091 |
| | | | | |
Industrials – 7.5% | | | | | |
Aerospace & Defense – 4.2% | | | | | |
Goodrich Corp. | | 64,040 | | | 3,800,134 |
ITT Corp. | | 53,600 | | | 2,772,192 |
| | |
| 14 | | • ALLIANCEBERNSTEIN BALANCED SHARES |
Portfolio of Investments
| | | | | |
| Company | | Shares | | U.S. $ Value |
| |
| | | | | |
L-3 Communications Holdings, Inc. | | 77,030 | | $ | 6,036,841 |
Raytheon Co. | | 281,900 | | | 14,526,307 |
United Technologies Corp. | | 66,630 | | | 4,480,201 |
| | | | | |
| | | | | 31,615,675 |
| | | | | |
Construction & Engineering – 1.6% | | | | | |
Fluor Corp. | | 35,250 | | | 1,497,420 |
Foster Wheeler AG(a) | | 115,000 | | | 3,431,600 |
URS Corp.(a) | | 181,000 | | | 7,520,550 |
| | | | | |
| | | | | 12,449,570 |
| | | | | |
Electrical Equipment – 0.6% | | | | | |
Hubbell, Inc. – Class B | | 97,870 | | | 4,444,276 |
| | | | | |
| | |
Machinery – 1.1% | | | | | |
Dover Corp. | | 156,200 | | | 6,385,456 |
Joy Global, Inc. | | 33,205 | | | 1,777,796 |
| | | | | |
| | | | | 8,163,252 |
| | | | | |
| | | | | 56,672,773 |
| | | | | |
Consumer Discretionary – 6.9% | | | | | |
Diversified Consumer Services – 0.8% | | | | | |
Apollo Group, Inc. – Class A(a) | | 106,005 | | | 6,049,705 |
| | | | | |
| | |
Media – 4.4% | | | | | |
Comcast Corp. – Class A | | 899,015 | | | 13,188,550 |
Discovery Communications, Inc. – Class A(a) | | 62,000 | | | 1,980,900 |
Time Warner, Inc. | | 288,865 | | | 8,873,933 |
Viacom, Inc. – Class B(a) | | 314,900 | | | 9,333,636 |
| | | | | |
| | | | | 33,377,019 |
| | | | | |
Multiline Retail – 0.7% | | | | | |
Dollar Tree, Inc.(a) | | 62,700 | | | 3,070,419 |
Kohl’s Corp.(a) | | 35,000 | | | 1,859,900 |
| | | | | |
| | | | | 4,930,319 |
| | | | | |
Specialty Retail – 1.0% | | | | | |
Advance Auto Parts, Inc. | | 73,945 | | | 2,906,039 |
Ross Stores, Inc. | | 104,600 | | | 4,600,308 |
| | | | | |
| | | | | 7,506,347 |
| | | | | |
| | | | | 51,863,390 |
| | | | | |
Consumer Staples – 5.1% | | | | | |
Food & Staples Retailing – 0.3% | | | | | |
Wal-Mart Stores, Inc. | | 36,200 | | | 1,974,710 |
| | | | | |
| | |
Food Products – 1.4% | | | | | |
Archer-Daniels-Midland Co. | | 205,800 | | | 6,340,698 |
ConAgra Foods, Inc. | | 132,415 | | | 2,938,289 |
Hormel Foods Corp. | | 36,200 | | | 1,358,224 |
| | | | | |
| | | | | 10,637,211 |
| | | | | |
Household Products – 0.6% | | | | | |
Kimberly-Clark Corp. | | 65,500 | | | 4,321,035 |
| | | | | |
| | |
| ALLIANCEBERNSTEIN BALANCED SHARES • | | 15 |
Portfolio of Investments
| | | | | | |
| Company | | Shares | | U.S. $ Value |
| |
| | | | | | |
Tobacco – 2.8% | | | | | | |
Lorillard, Inc. | | | 98,080 | | $ | 7,641,413 |
Philip Morris International, Inc. | | | 290,100 | | | 13,950,909 |
| | | | | | |
| | | | | | 21,592,322 |
| | | | | | |
| | | | | | 38,525,278 |
| | | | | | |
Telecommunication Services – 3.7% | | | | | | |
Diversified Telecommunication Services – 3.7% | | | | | | |
AT&T, Inc. | | | 311,900 | | | 8,402,586 |
CenturyTel, Inc. | | | 85,635 | | | 3,047,750 |
Qwest Communications International, Inc. | | | 3,654,350 | | | 13,338,378 |
Verizon Communications, Inc. | | | 107,988 | | | 3,397,302 |
| | | | | | |
| | | | | | 28,186,016 |
| | | | | | |
Materials – 0.8% | | | | | | |
Chemicals – 0.7% | | | | | | |
CF Industries Holdings, Inc. | | | 37,500 | | | 3,201,000 |
Terra Industries, Inc. | | | 55,800 | | | 2,152,764 |
| | | | | | |
| | | | | | 5,353,764 |
| | | | | | |
Containers & Packaging – 0.1% | | | | | | |
Sonoco Products Co. | | | 15,300 | | | 431,154 |
| | | | | | |
| | | | | | 5,784,918 |
| | | | | | |
Utilities – 0.5% | | | | | | |
Multi-Utilities – 0.5% | | | | | | |
Public Service Enterprise Group, Inc. | | | 116,300 | | | 3,647,168 |
| | | | | | |
| | |
Total Common Stocks
(cost $429,591,305) | | | | | | 488,170,071 |
| | | | | | |
| | |
| | | Principal
Amount
(000) | | |
CORPORATES - INVESTMENT GRADES – 12.9% | | | | | | |
Industrial – 6.6% | | | | | | |
Basic – 1.1% | | | | | | |
Alcoa, Inc.
6.75%, 7/15/18 | | $ | 265 | | | 272,812 |
ArcelorMittal
6.125%, 6/01/18 | | | 870 | | | 888,108 |
ArcelorMittal USA, Inc.
6.50%, 4/15/14 | | | 400 | | | 429,566 |
BHP Billiton Finance USA Ltd.
7.25%, 3/01/16 | | | 564 | | | 660,777 |
The Dow Chemical Co.
7.375%, 11/01/29 | | | 60 | | | 64,412 |
7.60%, 5/15/14 | | | 365 | | | 414,408 |
8.55%, 5/15/19 | | | 385 | | | 455,014 |
Eastman Chemical
5.50%, 11/15/19 | | | 133 | | | 136,579 |
| | |
| 16 | | • ALLIANCEBERNSTEIN BALANCED SHARES |
Portfolio of Investments
| | | | | | |
| Company | | Principal
Amount
(000) | | U.S. $ Value |
| |
| | | | | | |
EI Du Pont de Nemours & Co.
5.875%, 1/15/14 | | $ | 354 | | $ | 397,354 |
Freeport-McMoRan Copper & Gold, Inc.
8.375%, 4/01/17 | | | 650 | | | 701,187 |
Inco Ltd.
7.75%, 5/15/12 | | | 734 | | | 801,974 |
International Paper Co.
5.30%, 4/01/15 | | | 660 | | | 681,882 |
7.95%, 6/15/18 | | | 490 | | | 567,259 |
PPG Industries, Inc.
5.75%, 3/15/13 | | | 765 | | | 828,449 |
Rio Tinto Finance USA Ltd.
6.50%, 7/15/18 | | | 695 | | | 770,239 |
| | | | | | |
| | | | | | 8,070,020 |
| | | | | | |
Capital Goods – 0.6% | | | | | | |
Allied Waste North America, Inc.
Series B
7.375%, 4/15/14 | | | 114 | | | 118,401 |
Holcim US Finance Sarl & Cie SCS
6.00%, 12/30/19(b) | | | 61 | | | 64,782 |
John Deere Capital Corp.
5.25%, 10/01/12 | | | 605 | | | 662,885 |
Lafarge SA
6.15%, 7/15/11 | | | 629 | | | 659,333 |
Republic Services, Inc.
5.25%, 11/15/21(b) | | | 218 | | | 221,850 |
5.50%, 9/15/19(b) | | | 328 | | | 343,618 |
Tyco International Finance SA
6.00%, 11/15/13 | | | 1,005 | | | 1,110,346 |
8.50%, 1/15/19 | | | 280 | | | 347,285 |
United Technologies Corp.
4.875%, 5/01/15 | | | 362 | | | 400,540 |
Vulcan Materials Co.
5.60%, 11/30/12 | | | 840 | | | 901,778 |
| | | | | | |
| | | | | | 4,830,818 |
| | | | | | |
Communications - Media – 0.8% | | | | | | |
BSKYB Finance UK PLC
5.625%, 10/15/15(b) | | | 480 | | | 533,490 |
CBS Corp.
8.875%, 5/15/19 | | | 625 | | | 726,154 |
Comcast Cable Communications Holdings, Inc.
9.455%, 11/15/22 | | | 440 | | | 574,052 |
DirecTV Holdings LLC / DirecTV Financing Co., Inc.
4.75%, 10/01/14(b) | | | 240 | | | 247,755 |
News America Holdings, Inc.
9.25%, 2/01/13 | | | 150 | | | 177,560 |
Reed Elsevier Capital, Inc.
8.625%, 1/15/19 | | | 290 | | | 363,766 |
| | |
| ALLIANCEBERNSTEIN BALANCED SHARES • | | 17 |
Portfolio of Investments
| | | | | | |
| Company | | Principal
Amount
(000) | | U.S. $ Value |
| |
| | | | | | |
RR Donnelley & Sons Co.
5.50%, 5/15/15 | | $ | 990 | | $ | 980,977 |
Time Warner Cable, Inc.
7.50%, 4/01/14 | | | 245 | | | 284,386 |
Time Warner Entertainment Co.
8.375%, 3/15/23 | | | 725 | | | 863,932 |
WPP Finance UK
5.875%, 6/15/14 | | | 425 | | | 443,301 |
8.00%, 9/15/14 | | | 630 | | | 718,184 |
| | | | | | |
| | | | | | 5,913,557 |
| | | | | | |
Communications - Telecommunications – 0.9% | | | | | | |
AT&T Corp.
7.30%, 11/15/11 | | | 540 | | | 599,552 |
BellSouth Corp.
5.20%, 9/15/14 | | | 860 | | | 939,433 |
British Telecommunications PLC
5.15%, 1/15/13 | | | 625 | | | 662,076 |
Embarq Corp.
7.082%, 6/01/16 | | | 644 | | | 715,654 |
Qwest Corp.
7.50%, 10/01/14 | | | 625 | | | 639,062 |
7.875%, 9/01/11 | | | 660 | | | 685,575 |
Telecom Italia Capital SA
6.175%, 6/18/14 | | | 545 | | | 601,481 |
Telus Corp.
8.00%, 6/01/11 | | | 425 | | | 465,494 |
Verizon Communications, Inc.
4.90%, 9/15/15 | | | 380 | | | 410,176 |
5.25%, 4/15/13 | | | 465 | | | 507,981 |
Vodafone Group PLC
7.75%, 2/15/10 | | | 790 | | | 801,242 |
| | | | | | |
| | | | | | 7,027,726 |
| | | | | | |
Consumer Cyclical - Automotive – 0.2% | | | | | | |
Daimler Finance North America LLC
5.75%, 9/08/11 | | | 240 | | | 254,261 |
7.30%, 1/15/12 | | | 211 | | | 232,080 |
7.75%, 1/18/11 | | | 79 | | | 83,918 |
Harley-Davidson Funding Corp.
5.75%, 12/15/14(b) | | | 270 | | | 272,265 |
Volvo Treasury AB
5.95%, 4/01/15(b) | | | 497 | | | 519,845 |
| | | | | | |
| | | | | | 1,362,369 |
| | | | | | |
Consumer Cyclical - Entertainment – 0.2% | | | | | | |
Time Warner, Inc.
6.875%, 5/01/12 | | | 465 | | | 515,614 |
7.625%, 4/15/31 | | | 600 | | | 695,709 |
| | |
| 18 | | • ALLIANCEBERNSTEIN BALANCED SHARES |
Portfolio of Investments
| | | | | | |
| Company | | Principal
Amount
(000) | | U.S. $ Value |
| |
| | | | | | |
Viacom, Inc.
5.625%, 9/15/19 | | $ | 535 | | $ | 571,206 |
| | | | | | |
| | | | | | 1,782,529 |
| | | | | | |
Consumer Non-Cyclical – 1.1% | | | | | | |
Altria Group, Inc.
9.70%, 11/10/18 | | | 365 | | | 451,617 |
Baxter FinCo BV
4.75%, 10/15/10 | | | 400 | | | 414,709 |
Bottling Group LLC
6.95%, 3/15/14 | | | 525 | | | 617,910 |
Bunge Ltd. Finance Corp.
5.875%, 5/15/13 | | | 415 | | | 442,459 |
Cadbury Schweppes US Finance LLC
5.125%, 10/01/13(b) | | | 590 | | | 624,684 |
Campbell Soup Co.
6.75%, 2/15/11 | | | 505 | | | 541,035 |
Delhaize Group SA
5.875%, 2/01/14 | | | 150 | | | 163,615 |
Diageo Capital PLC
7.375%, 1/15/14 | | | 535 | | | 629,152 |
Fisher Scientific International, Inc.
6.125%, 7/01/15 | | | 840 | | | 871,500 |
Fortune Brands, Inc.
3.00%, 6/01/12 | | | 305 | | | 305,572 |
4.875%, 12/01/13 | | | 355 | | | 366,230 |
Kroger Co.
6.80%, 4/01/11 | | | 580 | | | 620,698 |
Pepsico, Inc.
4.65%, 2/15/13 | | | 570 | | | 619,198 |
Pfizer, Inc.
5.35%, 3/15/15 | | | 600 | | | 671,312 |
The Procter & Gamble Co.
4.70%, 2/15/19 | | | 590 | | | 627,472 |
Whirlpool Corp.
8.60%, 5/01/14 | | | 75 | | | 86,733 |
Wyeth
5.50%, 2/01/14 | | | 480 | | | 533,344 |
| | | | | | |
| | | | | | 8,587,240 |
| | | | | | |
Energy – 0.7% | | | | | | |
Anadarko Petroleum Corp.
5.95%, 9/15/16 | | | 540 | | | 589,209 |
6.45%, 9/15/36 | | | 190 | | | 199,474 |
Apache Corp.
5.25%, 4/15/13 | | | 330 | | | 360,579 |
Baker Hughes, Inc.
6.50%, 11/15/13 | | | 300 | | | 345,503 |
Canadian Natural Resources Ltd.
5.15%, 2/01/13 | | | 250 | | | 269,249 |
Hess Corp.
8.125%, 2/15/19 | | | 87 | | | 107,061 |
| | |
| ALLIANCEBERNSTEIN BALANCED SHARES • | | 19 |
Portfolio of Investments
| | | | | | |
| Company | | Principal
Amount
(000) | | U.S. $ Value |
| |
| | | | | | |
Nabors Industries, Inc.
9.25%, 1/15/19 | | $ | 635 | | $ | 790,919 |
Noble Energy, Inc.
8.25%, 3/01/19 | | | 610 | | | 740,101 |
The Premcor Refining Group, Inc.
7.50%, 6/15/15 | | | 614 | | | 637,942 |
Valero Energy Corp.
6.875%, 4/15/12 | | | 580 | | | 634,859 |
Weatherford International Ltd.
5.15%, 3/15/13 | | | 325 | | | 343,908 |
9.625%, 3/01/19 | | | 280 | | | 349,814 |
| | | | | | |
| | | | | | 5,368,618 |
| | | | | | |
Other Industrial – 0.1% | | | | | | |
Noble Group Ltd.
6.75%, 1/29/20(b) | | | 635 | | | 635,000 |
| | | | | | |
| | |
Services – 0.1% | | | | | | |
The Western Union Co.
5.93%, 10/01/16 | | | 820 | | | 904,531 |
| | | | | | |
| | |
Technology – 0.6% | | | | | | |
Cisco Systems, Inc.
5.25%, 2/22/11 | | | 560 | | | 591,160 |
Computer Sciences Corp.
5.50%, 3/15/13 | | | 465 | | | 501,443 |
Dell, Inc.
5.625%, 4/15/14 | | | 370 | | | 413,798 |
Electronic Data Systems Corp.
Series B
6.00%, 8/01/13 | | | 820 | | | 923,258 |
Motorola, Inc.
6.50%, 9/01/25 | | | 535 | | | 481,639 |
7.50%, 5/15/25 | | | 90 | | | 87,242 |
Oracle Corp.
4.95%, 4/15/13 | | | 391 | | | 427,840 |
Xerox Corp.
8.25%, 5/15/14 | | | 630 | | | 732,951 |
| | | | | | |
| | | | | | 4,159,331 |
| | | | | | |
Transportation - Airlines – 0.1% | | | | | | |
Southwest Airlines Co.
5.25%, 10/01/14 | | | 842 | | | 863,200 |
| | | | | | |
| | |
Transportation - Railroads – 0.1% | | | | | | |
CSX Corp.
5.50%, 8/01/13 | | | 280 | | | 304,427 |
| | | | | | |
| | | | | | 49,809,366 |
| | | | | | |
Financial Institutions – 4.8% | | | | | | |
Banking – 2.5% | | | | | | |
American Express Co.
7.25%, 5/20/14 | | | 270 | | | 308,503 |
8.125%, 5/20/19 | | | 615 | | | 739,004 |
| | |
| 20 | | • ALLIANCEBERNSTEIN BALANCED SHARES |
Portfolio of Investments
| | | | | | |
| Company | | Principal
Amount
(000) | | U.S. $ Value |
| |
| | | | | | |
ANZ National International Ltd.
6.20%, 7/19/13(b) | | $ | 375 | | $ | 414,311 |
Bank of America Corp.
4.50%, 8/01/10 | | | 595 | | | 608,435 |
Barclays Bank PLC
8.55%, 6/15/11(b)(c) | | | 705 | | | 662,700 |
The Bear Stearns Co., Inc.
5.55%, 1/22/17 | | | 1,020 | | | 1,055,563 |
7.625%, 12/07/09 | | | 850 | | | 850,649 |
Citigroup, Inc.
4.625%, 8/03/10 | | | 760 | | | 776,254 |
5.50%, 4/11/13 | | | 575 | | | 594,291 |
8.50%, 5/22/19 | | | 675 | | | 762,329 |
Countrywide Financial Corp.
5.80%, 6/07/12 | | | 382 | | | 408,429 |
6.25%, 5/15/16 | | | 1,278 | | | 1,295,162 |
Countrywide Home Loans, Inc.
Series L
4.00%, 3/22/11 | | | 32 | | | 32,689 |
Credit Agricole SA
8.375%, 10/13/19(b) | | | 373 | | | 391,650 |
Credit Suisse USA, Inc.
5.50%, 8/15/13 | | | 248 | | | 273,291 |
The Goldman Sachs Group, Inc.
4.75%, 7/15/13 | | | 410 | | | 435,625 |
5.125%, 1/15/15 | | | 370 | | | 392,761 |
6.00%, 5/01/14 | | | 295 | | | 325,538 |
7.50%, 2/15/19 | | | 605 | | | 714,460 |
Morgan Stanley
5.05%, 1/21/11 | | | 840 | | | 869,938 |
5.30%, 3/01/13 | | | 280 | | | 299,219 |
6.625%, 4/01/18 | | | 715 | | | 775,714 |
Rabobank Nederland
11.00%, 6/30/19(b)(c) | | | 110 | | | 136,005 |
Regions Financial Corp.
6.375%, 5/15/12 | | | 1,250 | | | 1,201,358 |
Sovereign Bank
5.125%, 3/15/13 | | | 785 | | | 807,586 |
UBS Preferred Funding Trust II
7.247%, 6/26/11(c) | | | 1,000 | | | 881,862 |
Unicredito Italiano Capital Trust II
9.20%, 10/05/10(b)(c) | | | 1,320 | | | 1,240,800 |
Union Bank of California
5.95%, 5/11/16 | | | 405 | | | 412,090 |
Wachovia Corp.
5.50%, 5/01/13 | | | 820 | | | 888,191 |
Wells Fargo & Co.
4.20%, 1/15/10 | | | 445 | | | 446,736 |
5.625%, 12/11/17 | | | 335 | | | 349,558 |
| | | | | | |
| | | | | | 19,350,701 |
| | | | | | |
| | |
| ALLIANCEBERNSTEIN BALANCED SHARES • | | 21 |
Portfolio of Investments
| | | | | | |
| Company | | Principal
Amount
(000) | | U.S. $ Value |
| |
| | | | | | |
Finance – 0.4% | | | | | | |
General Electric Capital Corp.
4.80%, 5/01/13 | | $ | 840 | | $ | 891,271 |
5.625%, 5/01/18 | | | 710 | | | 732,065 |
HSBC Finance Corp.
7.00%, 5/15/12 | | | 365 | | | 400,732 |
SLM Corp. Series A
5.375%, 1/15/13 | | | 1,335 | | | 1,194,324 |
| | | | | | |
| | | | | | 3,218,392 |
| | | | | | |
Insurance – 1.5% | | | | | | |
Aetna, Inc.
6.00%, 6/15/16 | | | 190 | | | 204,745 |
Allied World Assurance Co. Holdings Ltd.
7.50%, 8/01/16 | | | 165 | | | 177,335 |
Assurant, Inc.
5.625%, 2/15/14 | | | 245 | | | 256,392 |
Berkshire Hathaway Finance Corp.
4.20%, 12/15/10 | | | 590 | | | 612,127 |
CNA Financial Corp.
5.85%, 12/15/14 | | | 340 | | | 341,116 |
Coventry Health Care, Inc.
5.95%, 3/15/17 | | | 130 | | | 120,740 |
6.125%, 1/15/15 | | | 55 | | | 53,696 |
6.30%, 8/15/14 | | | 415 | | | 409,003 |
Genworth Financial, Inc.
6.515%, 5/22/18 | | | 825 | | | 729,438 |
Guardian Life Insurance
7.375%, 9/30/39(b) | | | 315 | | | 320,069 |
Humana, Inc.
6.30%, 8/01/18 | | | 90 | | | 88,695 |
6.45%, 6/01/16 | | | 65 | | | 66,028 |
7.20%, 6/15/18 | | | 430 | | | 449,464 |
Liberty Mutual Group, Inc.
5.75%, 3/15/14(b) | | | 795 | | | 802,116 |
Lincoln National Corp.
8.75%, 7/01/19 | | | 172 | | | 200,652 |
Massachusetts Mutual Life Insurance Co.
8.875%, 6/01/39(b) | | | 345 | | | 422,734 |
MetLife, Inc.
7.717%, 2/15/19 | | | 158 | | | 189,461 |
10.75%, 8/01/39 | | | 205 | | | 246,000 |
Nationwide Mutual Insurance Co.
5.81%, 12/15/24(b)(c) | | | 2,213 | | | 1,745,858 |
Principal Financial Group, Inc.
7.875%, 5/15/14 | | | 490 | | | 554,854 |
Prudential Financial, Inc.
5.15%, 1/15/13 | | | 520 | | | 549,801 |
6.20%, 1/15/15 | | | 65 | | | 70,032 |
8.875%, 6/15/68 | | | 250 | | | 257,500 |
Series D
7.375%, 6/15/19 | | | 50 | | | 56,793 |
| | |
| 22 | | • ALLIANCEBERNSTEIN BALANCED SHARES |
Portfolio of Investments
| | | | | | |
| Company | | Principal
Amount
(000) | | U.S. $ Value |
| |
| | | | | | |
UnitedHealth Group, Inc.
5.25%, 3/15/11 | | $ | 635 | | $ | 661,659 |
WellPoint, Inc.
5.25%, 1/15/16 | | | 425 | | | 442,841 |
XL Capital Ltd.
Series E
6.50%, 4/15/17(c) | | | 355 | | | 257,375 |
ZFS Finance USA Trust I
6.15%, 12/15/65(b)(c) | | | 1,000 | | | 885,000 |
| | | | | | |
| | | | | | 11,171,524 |
| | | | | | |
REITS – 0.4% | | | | | | |
ERP Operating LP
5.25%, 9/15/14 | | | 935 | | | 965,338 |
HCP, Inc.
5.95%, 9/15/11 | | | 885 | | | 919,932 |
Simon Property Group LP
5.00%, 3/01/12 | | | 835 | | | 873,818 |
| | | | | | |
| | | | | | 2,759,088 |
| | | | | | |
| | | | | | 36,499,705 |
| | | | | | |
Utility – 1.1% | | | | | | |
Electric – 0.8% | | | | | | |
Allegheny Energy Supply
5.75%, 10/15/19(b) | | | 640 | | | 635,155 |
Ameren Corp.
8.875%, 5/15/14 | | | 335 | | | 378,994 |
FirstEnergy Corp.
Series B
6.45%, 11/15/11 | | | 46 | | | 49,787 |
Series C
7.375%, 11/15/31 | | | 395 | | | 441,565 |
FPL Group Capital, Inc.
6.65%, 6/15/67(c) | | | 1,290 | | | 1,196,475 |
MidAmerican Energy Holdings Co.
5.875%, 10/01/12 | | | 375 | | | 413,623 |
Nisource Finance Corp.
6.80%, 1/15/19 | | | 865 | | | 932,411 |
The Southern Co.
Series A
5.30%, 1/15/12 | | | 229 | | | 246,795 |
SPI Electricity & Gas Australia Holdings Pty Ltd.
6.15%, 11/15/13(b) | | | 1,200 | | | 1,286,309 |
Union Electric Co.
6.70%, 2/01/19 | | | 60 | | | 68,360 |
| | | | | | |
| | | | | | 5,649,474 |
| | | | | | |
Natural Gas – 0.2% | | | | | | |
Enterprise Products Operating LLC
Series G
5.60%, 10/15/14 | | | 465 | | | 505,939 |
| | |
| ALLIANCEBERNSTEIN BALANCED SHARES • | | 23 |
Portfolio of Investments
| | | | | | |
| Company | | Principal
Amount
(000) | | U.S. $ Value |
| |
| | | | | | |
TransCanada Pipelines Ltd.
6.35%, 5/15/67(c) | | $ | 965 | | $ | 902,948 |
Williams Co., Inc.
7.875%, 9/01/21 | | | 368 | | | 410,637 |
| | | | | | |
| | | | | | 1,819,524 |
| | | | | | |
Other Utility – 0.1% | | | | | | |
Veolia Environnement
6.00%, 6/01/18 | | | 555 | | | 605,864 |
| | | | | | |
| | | | | | 8,074,862 |
| | | | | | |
Non Corporate Sectors – 0.4% | | | | | | |
Agencies - Not Government Guaranteed – 0.4% | | | | | | |
Gaz Capital SA
6.212%, 11/22/16(b) | | | 1,265 | | | 1,223,887 |
Petrobras International Finance
5.75%, 1/20/20 | | | 960 | | | 978,000 |
TransCapitalInvest Ltd. for OJSC AK Transneft
8.70%, 8/07/18(b) | | | 690 | | | 779,700 |
| | | | | | |
| | | | | | 2,981,587 |
| | | | | | |
Total Corporates - Investment Grades
(cost $93,056,374) | | | | | | 97,365,520 |
| | | | | | |
| | | | | | |
MORTGAGE PASS-THRU’S – 6.3% | | | | | | |
Agency Fixed Rate 30-Year – 5.5% | | | | | | |
Federal Home Loan Mortgage Corp. Gold
Series 2005
4.50%, 10/01/35 | | | 3,265 | | | 3,360,973 |
5.50%, 1/01/35 | | | 4,522 | | | 4,834,325 |
Series 2008
6.50%, 5/01/35 | | | 891 | | | 972,625 |
Federal National Mortgage Association
6.50%, TBA | | | 720 | | | 777,712 |
Series 2004
6.00%, 11/01/34 | | | 2,531 | | | 2,732,593 |
Series 2006
5.00%, 2/01/36 | | | 5,969 | | | 6,272,458 |
Series 2007
4.50%, 1/01/36 | | | 5,378 | | | 5,558,574 |
Series 2008
5.50%, 8/01/37 | | | 11,317 | | | 12,077,436 |
6.00%, 3/01/37 | | | 4,857 | | | 5,231,809 |
| | | | | | |
| | | | | | 41,818,505 |
| | | | | | |
Agency ARMS – 0.8% | | | | | | |
Federal Home Loan Mortgage Corp.
Series 2006
5.908%, 1/01/37(d) | | | 430 | | | 451,500 |
6.241%, 12/01/36(d) | | | 443 | | | 466,113 |
| | |
| 24 | | • ALLIANCEBERNSTEIN BALANCED SHARES |
Portfolio of Investments
| | | | | | |
| Company | | Principal
Amount
(000) | | U.S. $ Value |
| |
| | | | | | |
Series 2007
5.978%, 2/01/37(d) | | $ | 523 | | $ | 549,803 |
6.074%, 1/01/37(d) | | | 238 | | | 250,501 |
Series 2009
4.741%, 4/01/36(c) | | | 1,549 | | | 1,619,389 |
Federal National Mortgage Association
Series 2007
4.729%, 3/01/34(c) | | | 1,310 | | | 1,367,905 |
4.941%, 8/01/37(c) | | | 582 | | | 610,444 |
5.93%, 2/01/37(d) | | | 431 | | | 454,349 |
| | | | | | |
| | | | | | 5,770,004 |
| | | | | | |
Total Mortgage Pass-Thru’s
(cost $45,402,345) | | | | | | 47,588,509 |
| | | | | | |
| | | | | | |
GOVERNMENTS - TREASURIES – 5.6% | | | | | | |
United States – 5.6% | | | | | | |
U.S. Treasury Bonds
3.75%, 11/15/18 | | | 6,785 | | | 7,115,769 |
4.50%, 2/15/36 | | | 4,690 | | | 4,933,294 |
U.S. Treasury Notes
1.75%, 11/15/11-1/31/14 | | | 14,460 | | | 14,654,344 |
2.375%, 8/31/14 | | | 10,310 | | | 10,533,119 |
2.625%, 7/31/14 | | | 4,910 | | | 5,078,781 |
| | | | | | |
| | |
Total Governments - Treasuries
(cost $41,594,372) | | | | | | 42,315,307 |
| | | | | | |
| | | | | | |
COMMERCIAL MORTGAGE-BACKED SECURITIES – 2.9% | | | | | | |
Non-Agency Fixed Rate CMBS – 2.9% | | | | | | |
Banc of America Commercial Mortgage, Inc.
Series 2007-5, Class A4
5.492%, 2/10/51 | | | 1,510 | | | 1,272,193 |
Commercial Mortgage Pass Through Certificates
Series 2006-C8, Class A4
5.306%, 12/10/46 | | | 1,230 | | | 1,038,886 |
Series 2007-C9, Class A4
6.01%, 12/10/49 | | | 1,710 | | | 1,527,245 |
Credit Suisse Mortgage Capital Certificates
Series 2006-C3, Class A3
6.02%, 6/15/38 | | | 1,325 | | | 1,114,493 |
Greenwich Capital Commercial Funding Corp.
Series 2005-GG5, Class AJ
5.478%, 4/10/37 | | | 360 | | | 235,436 |
Series 2007-GG11, Class A4
5.736%, 12/10/49 | | | 1,300 | | | 1,136,212 |
Series 2007-GG9, Class A4
5.444%, 3/10/39 | | | 1,070 | | | 913,099 |
| | |
| ALLIANCEBERNSTEIN BALANCED SHARES • | | 25 |
Portfolio of Investments
| | | | | | |
| Company | | Principal
Amount
(000) | | U.S. $ Value |
| |
| | | | | | |
JP Morgan Chase Commercial Mortgage Securities Corp.
Series 2006-CB15, Class A4
5.814%, 6/12/43 | | $ | 1,630 | | $ | 1,571,919 |
Series 2006-CB16, Class A4
5.552%, 5/12/45 | | | 1,220 | | | 1,171,229 |
Series 2007-C1, Class A4
5.716%, 2/15/51 | | | 1,720 | | | 1,327,812 |
Series 2007-CB18, Class A4
5.44%, 6/12/47 | | | 1,735 | | | 1,493,202 |
Series 2007-LD11, Class A4
6.006%, 6/15/49 | | | 1,735 | | | 1,496,263 |
LB-UBS Commercial Mortgage Trust
Series 2006-C7, Class A3
5.347%, 11/15/38 | | | 1,020 | | | 962,492 |
Series 2007-C1, Class A4
5.424%, 2/15/40 | | | 1,700 | | | 1,416,718 |
Merrill Lynch/Countrywide Commercial Mortgage Trust
Series 2006-3, Class A4
5.414%, 7/12/46 | | | 1,805 | | | 1,692,121 |
Series 2006-4, Class AM
5.204%, 12/12/49 | | | 435 | | | 314,191 |
Wachovia Bank Commercial Mortgage Trust
Series 2006-C27, Class A3
5.765%, 7/15/45 | | | 1,705 | | | 1,530,482 |
Series 2007-C31, Class A4
5.509%, 4/15/47 | | | 1,730 | | | 1,386,893 |
Series 2007-C32, Class A3
5.929%, 6/15/49 | | | 693 | | | 575,594 |
| | | | | | |
Total Commercial Mortgage-Backed Securities
(cost $24,447,092) | | | | | | 22,176,480 |
| | | | | | |
| | | | | | |
CORPORATES - NON-INVESTMENT GRADES – 1.7% | | | | | | |
Industrial – 0.9% | | | | | | |
Basic – 0.3% | | | | | | |
Steel Capital SA for OAO Severstal
9.75%, 7/29/13(b) | | | 315 | | | 317,772 |
United States Steel Corp.
5.65%, 6/01/13 | | | 770 | | | 750,233 |
Weyerhaeuser Co.
7.375%, 3/15/32 | | | 905 | | | 825,300 |
| | | | | | |
| | | | | | 1,893,305 |
| | | | | | |
Capital Goods – 0.3% | | | | | | |
Bombardier, Inc.
6.75%, 5/01/12(b) | | | 370 | | | 375,550 |
Case New Holland, Inc.
7.125%, 3/01/14 | | | 125 | | | 123,438 |
| | |
| 26 | | • ALLIANCEBERNSTEIN BALANCED SHARES |
Portfolio of Investments
| | | | | | |
| Company | | Principal
Amount
(000) | | U.S. $ Value |
| |
| | | | | | |
Hanson Australia Funding Ltd.
5.25%, 3/15/13 | | $ | 945 | | $ | 907,200 |
Owens Corning, Inc.
6.50%, 12/01/16 | | | 558 | | | 554,862 |
Textron Financial Corp.
4.60%, 5/03/10 | | | 51 | | | 50,964 |
5.40%, 4/28/13 | | | 103 | | | 101,875 |
| | | | | | |
| | | | | | 2,113,889 |
| | | | | | |
Communications - Media – 0.1% | | | | | | |
Clear Channel Communications, Inc.
5.50%, 9/15/14 | | | 840 | | | 428,400 |
CSC Holdings, Inc.
8.50%, 4/15/14(b) | | | 245 | | | 257,556 |
Univision Communications, Inc.
12.00%, 7/01/14(b) | | | 63 | | | 68,513 |
| | | | | | |
| | | | | | 754,469 |
| | | | | | |
Consumer Cyclical - Automotive – 0.0% | | | | | | |
The Goodyear Tire & Rubber Co.
9.00%, 7/01/15 | | | 250 | | | 255,625 |
| | | | | | |
| | |
Consumer Cyclical - Other – 0.1% | | | | | | |
Starwood Hotels & Resorts Worldwide, Inc.
7.875%, 5/01/12 | | | 422 | | | 446,265 |
Wyndham Worldwide Corp.
6.00%, 12/01/16 | | | 666 | | | 620,546 |
| | | | | | |
| | | | | | 1,066,811 |
| | | | | | |
Consumer Non-Cyclical – 0.1% | | | | | | |
Bausch & Lomb, Inc.
9.875%, 11/01/15 | | | 235 | | | 241,462 |
HCA, Inc.
7.875%, 2/15/20(b) | | | 185 | | | 189,625 |
8.50%, 4/15/19(b) | | | 65 | | | 68,575 |
| | | | | | |
| | | | | | 499,662 |
| | | | | | |
Energy – 0.0% | | | | | | |
Tesoro Corp.
6.50%, 6/01/17 | | | 285 | | | 255,788 |
| | | | | | |
| | |
Technology – 0.0% | | | | | | |
Flextronics International Ltd.
6.50%, 5/15/13 | | | 225 | | | 221,625 |
| | | | | | |
| | | | | | 7,061,174 |
| | | | | | |
Financial Institutions – 0.6% | | | | | | |
Banking – 0.3% | | | | | | |
BankAmerica Capital II
Series 2
8.00%, 12/15/26 | | | 559 | | | 519,870 |
NB Capital Trust IV
8.25%, 4/15/27 | | | 485 | | | 464,387 |
| | |
| ALLIANCEBERNSTEIN BALANCED SHARES • | | 27 |
Portfolio of Investments
| | | | | | |
| Company | | Principal
Amount
(000) | | U.S. $ Value |
| |
| | | | | | |
Northern Rock PLC
5.60%, 4/30/14(b)(c) | | $ | 2,975 | | $ | 357,000 |
RBS Capital Trust III
5.512%, 9/30/14(c) | | | 1,100 | | | 492,250 |
| | | | | | |
| | | | | | 1,833,507 |
| | | | | | |
Brokerage – 0.0% | | | | | | |
Lehman Brothers Holdings, Inc.
7.875%, 11/01/09(e) | | | 845 | | | 164,775 |
| | | | | | |
| | |
Finance – 0.1% | | | | | | |
American General Finance Corp.
5.85%, 6/01/13 | | | 890 | | | 700,934 |
Series I
4.875%, 7/15/12 | | | 405 | | | 337,648 |
| | | | | | |
| | | | | | 1,038,582 |
| | | | | | |
Insurance – 0.2% | | | | | | |
ING Capital Funding Trust III
8.439%, 12/31/10(c) | | | 1,000 | | | 847,500 |
Liberty Mutual Group, Inc.
7.80%, 3/15/37(b) | | | 520 | | | 410,800 |
| | | | | | |
| | | | | | 1,258,300 |
| | | | | | |
| | | | | | 4,295,164 |
| | | | | | |
Utility – 0.2% | | | | | | |
Electric – 0.2% | | | | | | |
The AES Corp.
7.75%, 3/01/14-10/15/15 | | | 250 | | | 250,625 |
Dynegy Holdings, Inc.
8.375%, 5/01/16 | | | 395 | | | 362,412 |
Edison Mission Energy
7.00%, 5/15/17 | | | 280 | | | 204,400 |
NRG Energy, Inc.
7.25%, 2/01/14 | | | 365 | | | 368,194 |
RRI Energy, Inc.
7.625%, 6/15/14 | | | 145 | | | 140,650 |
| | | | | | |
| | | | | | 1,326,281 |
| | | | | | |
Total Corporates - Non-Investment Grades
(cost $17,780,067) | | | | | | 12,682,619 |
| | | | | | |
| | | | | | |
AGENCIES – 0.8% | | | | | | |
Agency Debentures – 0.8% | | | | | | |
Federal National Mortgage Association
6.25%, 5/15/29 | | | 4,745 | | | 5,678,916 |
6.625%, 11/15/30 | | | 375 | | | 470,003 |
| | | | | | |
| | |
Total Agencies
(cost $5,942,338) | | | | | | 6,148,919 |
| | | | | | |
| | |
| 28 | | • ALLIANCEBERNSTEIN BALANCED SHARES |
Portfolio of Investments
| | | | | | |
| Company | | Principal
Amount
(000) | | U.S. $ Value |
| |
| | | | | | |
GOVERNMENTS - SOVEREIGN BONDS – 0.7% | | | | | | |
Brazil – 0.2% | | | | | | |
Republic of Brazil
8.25%, 1/20/34 | | $ | 945 | | $ | 1,228,500 |
| | | | | | |
| | |
Croatia – 0.1% | | | | | | |
Republic of Croatia
6.75%, 11/05/19(b) | | | 630 | | | 679,518 |
| | | | | | |
| | |
Lithuania – 0.1% | | | | | | |
Republic of Lithuania
6.75%, 1/15/15(b) | | | 635 | | | 637,762 |
| | | | | | |
| | |
Peru – 0.2% | | | | | | |
Republic of Peru
8.375%, 5/03/16 | | | 385 | | | 471,625 |
9.875%, 2/06/15 | | | 835 | | | 1,064,625 |
| | | | | | |
| | | | | | 1,536,250 |
| | | | | | |
Poland – 0.1% | | | | | | |
Poland Government International Bond
6.375%, 7/15/19 | | | 1,090 | | | 1,199,000 |
| | | | | | |
| | |
Total Governments - Sovereign Bonds
(cost $4,609,686) | | | | | | 5,281,030 |
| | | | | | |
| | | | | | |
ASSET-BACKED SECURITIES – 0.6% | | | | | | |
Home Equity Loans - Floating Rate – 0.4% | | | | | | |
HFC Home Equity Loan Asset Backed Certificates
Series 2007-1, Class M1
0.62%, 3/20/36(d) | | | 2,680 | | | 1,154,630 |
Indymac Residential Asset Backed Trust
Series 2006-D, Class 2A2
0.35%, 11/25/36(d) | | | 1,285 | | | 879,166 |
Newcastle Mortgage Securities Trust
Series 2007-1, Class 2A1
0.37%, 4/25/37(d) | | | 1,516 | | | 913,278 |
Option One Mortgage Loan Trust
Series 2007-2, Class M1
0.60%, 3/25/37(d) | | | 930 | | | 7,798 |
| | | | | | |
| | | | | | 2,954,872 |
| | | | | | |
Credit Cards - Fixed Rate – 0.1% | | | | | | |
Capital One Multi-Asset Execution Trust
Series 2008-A5, Class A5
4.85%, 2/18/14 | | | 925 | | | 969,698 |
| | | | | | |
| | |
| ALLIANCEBERNSTEIN BALANCED SHARES • | | 29 |
Portfolio of Investments
| | | | | | |
| Company | | Principal
Amount
(000) | | U.S. $ Value |
| |
| | | | | | |
Home Equity Loans - Fixed Rate – 0.1% | | | | | | |
Countrywide Asset-Backed Certificates
Series 2007-S1, Class A3
5.81%, 11/25/36 | | $ | 2,219 | | $ | 701,999 |
| | | | | | |
Other ABS - Floating Rate – 0.0% | | | | | | |
Petra CRE CDO Ltd.
Series 2007-1A, Class C
1.344%, 2/25/47(b)(d) | | | 795 | | | 7,950 |
| | | | | | |
| | |
Total Asset-Backed Securities
(cost $10,347,389) | | | | | | 4,634,519 |
| | | | | | |
| | |
| | | Shares | | |
PREFERRED STOCKS – 0.4% | | | | | | |
Industrial – 0.2% | | | | | | |
Communications - Telecommunications – 0.2% | | | | | | |
Centaur Funding Corp.
9.08%(b) | | | 1,200 | | | 1,182,375 |
| | | | | | |
| | | | | | |
Utility – 0.1% | | | | | | |
Other Utility – 0.1% | | | | | | |
Dte Energy Trust I
7.80% | | | 45,000 | | | 1,158,750 |
| | | | | | |
| | | | | | |
Financial Institutions – 0.1% | | | | | | |
Banking – 0.1% | | | | | | |
Royal Bank of Scotland Group PLC
5.75% | | | 50,000 | | | 645,000 |
| | | | | | |
| | | | | | |
Non Corporate Sectors – 0.0% | | | | | | |
Agencies - Government Sponsored – 0.0% | | | | | | |
Federal Home Loan Mortgage Corp.
Series Z
8.375%(c) | | | 18,050 | | | 14,801 |
Federal National Mortgage Association
8.25%(c) | | | 26,650 | | | 19,188 |
| | | | | | |
| | | | | | 33,989 |
| | | | | | |
Total Preferred Stocks
(cost $4,939,590) | | | | | | 3,020,114 |
| | | | | | |
| | |
| | | Principal
Amount
(000) | | |
INFLATION-LINKED SECURITIES – 0.4% | | | | | | |
United States – 0.4% | | | | | | |
U.S. Treasury Notes
3.00%, 7/15/12 (TIPS)
(cost $2,514,707) | | $ | 2,396 | | | 2,597,523 |
| | | | | | |
| | |
| 30 | | • ALLIANCEBERNSTEIN BALANCED SHARES |
Portfolio of Investments
| | | | | | | |
| Company | | Principal
Amount
(000) | | U.S. $ Value | |
| | |
| | | | | | | |
QUASI-SOVEREIGNS – 0.3% | | | | | | | |
Quasi-Sovereign Bonds – 0.3% | | | | | | | |
Russia – 0.3% | | | | | | | |
RSHB Capital SA for OJSC Russian Agricultural Bank
6.299%, 5/15/17(b) | | $ | 1,360 | | $ | 1,349,800 | |
7.75%, 5/29/18(b) | | | 1,040 | | | 1,136,200 | |
| | | | | | | |
| | |
Total Quasi-Sovereigns
(cost $2,339,183) | | | | | | 2,486,000 | |
| | | | | | | |
| | | | | | | |
EMERGING MARKETS - CORPORATE BONDS – 0.0% | | | | | | | |
Industrial – 0.0% | | | | | | | |
Energy – 0.0% | | | | | | | |
Ecopetrol SA
7.625%, 7/23/19
(cost $217,239) | | | 218 | | | 246,078 | |
| | | | | | | |
| | | | | | | |
CMOS – 0.0% | | | | | | | |
Non-Agency ARMS – 0.0% | | | | | | | |
Deutsche Mortgage Securities, Inc.
Series 2005-WF1, Class 1A1
5.152%, 6/26/35(b)(c) | | | 56 | | | 55,417 | |
| | | | | | | |
Non-Agency Floating Rate – 0.0% | | | | | | | |
Countrywide Alternative Loan Trust
Series 2007-OA3, Class M1
0.55%, 4/25/47(d) | | | 780 | | | 2,899 | |
| | | | | | | |
| | |
Total CMOs
(cost $834,154) | | | | | | 58,316 | |
| | | | | | | |
| | |
| | | Shares | | | |
SHORT-TERM INVESTMENTS – 3.3% | | | | | | | |
Investment Companies – 3.3% | | | | | | | |
AllianceBernstein Fixed-Income Shares, Inc. – Government STIF Portfolio, 0.10%(f)
(cost $24,643,358) | | | 24,643,358 | | | 24,643,358 | |
| | | | | | | |
| | |
Total Investments – 100.5%
(cost $708,259,199) | | | | | | 759,414,363 | |
Other assets less liabilities – (0.5)% | | | | | | (3,825,211 | ) |
| | | | | | | |
| | |
Net Assets – 100.0% | | | | | $ | 755,589,152 | |
| | | | | | | |
| | |
| ALLIANCEBERNSTEIN BALANCED SHARES • | | 31 |
Portfolio of Investments
| (a) | | Non-income producing security. |
| (b) | | Security is exempt from registration under Rule 144A of the Securities Act of 1933. These securities are considered liquid and may be resold in transactions exempt from registration, normally to qualified institutional buyers. At November 30, 2009, the aggregate market value of these securities amounted to $21,503,996 or 2.8% of net assets. |
| (c) | | Variable rate coupon, rate shown as of November 30, 2009. |
| (d) | | Floating Rate Security. Stated interest rate was in effect at November 30, 2009. |
| (e) | | Security is in default and is non-income producing. |
| (f) | | Investment in affiliated money market mutual fund. The rate shown represents the 7-day yield as of period end. |
| | | The fund currently owns investments collateralized by subprime mortgage loans. Subprime loans are offered to homeowners who do not have a history of debt or who have had problems meeting their debt obligations. Because repayment is less certain, subprime borrowers pay a higher rate of interest than prime borrowers. As of November 30, 2009, the fund’s total exposure to subprime investments was 0.49% of net assets. These investments are valued in accordance with the fund’s Valuation Policies (see Note A for additional details). |
Glossary:
ABS – Asset-Backed Securities
ADR – American Depositary Receipt
ARMS – Adjustable Rate Mortgages
CDO – Collateralized Debt Obligation
CMBS – Commercial Mortgage-Backed Securities
CMOs – Collateralized Mortgage Obligations
LP – Limited Partnership
OJSC – Open Joint Stock Company
REIT – Real Estate Investment Trust
TBA – To Be Announced
TIPS – Treasury Inflation Protected Security
See notes to financial statements.
| | |
| 32 | | • ALLIANCEBERNSTEIN BALANCED SHARES |
Portfolio of Investments
STATEMENT OF ASSETS & LIABILITIES
November 30, 2009
| | | | |
| Assets | | | | |
Investments in securities, at value | | | | |
Unaffiliated issuers (cost $683,615,841) | | $ | 734,771,005 | |
Affiliated issuers (cost $24,643,358) | | | 24,643,358 | |
Cash | | | 27,241 | |
Interest and dividends receivable | | | 4,068,971 | |
Receivable for capital stock sold | | | 3,174,368 | |
Receivable for investment securities sold | | | 1,875,176 | |
| | | | |
Total assets | | | 768,560,119 | |
| | | | |
| Liabilities | | | | |
Payable for investment securities purchased | | | 8,409,301 | |
Payable for capital stock redeemed | | | 3,725,089 | |
Advisory fee payable | | | 288,730 | |
Distribution fee payable | | | 280,894 | |
Transfer Agent fee payable | | | 61,428 | |
Administrative fee payable | | | 25,250 | |
Accrued expenses | | | 180,275 | |
| | | | |
Total liabilities | | | 12,970,967 | |
| | | | |
Net Assets | | $ | 755,589,152 | |
| | | | |
| Composition of Net Assets | | | | |
Capital stock, at par | | $ | 572,476 | |
Additional paid-in capital | | | 869,373,103 | |
Undistributed net investment income | | | 3,402,840 | |
Accumulated net realized loss on investment transactions | | | (168,914,431 | ) |
Net unrealized appreciation on investments | | | 51,155,164 | |
| | | | |
| | $ | 755,589,152 | |
| | | | |
Net Asset Value Per Share—21 billion shares of capital stock authorized, $.01 par value
| | | | | | | | | |
| Class | | Net Assets | | Shares
Outstanding | | Net Asset
Value | |
| A | | $ | 481,426,648 | | 35,859,864 | | $ | 13.43 | * |
| | |
| B | | $ | 121,871,057 | | 9,676,740 | | $ | 12.59 | |
| | |
| C | | $ | 84,098,479 | | 6,639,887 | | $ | 12.67 | |
| | |
| Advisor | | $ | 56,024,226 | | 4,162,571 | | $ | 13.46 | |
| | |
| R | | $ | 6,645,047 | | 496,532 | | $ | 13.38 | |
| | |
| K | | $ | 3,377,840 | | 252,085 | | $ | 13.40 | |
| | |
| I | | $ | 2,145,855 | | 159,888 | | $ | 13.42 | |
| | |
| * | | The maximum offering price per share for Class A shares was $14.03 which reflects a sales charge of 4.25%. |
See notes to financial statements.
| | |
| ALLIANCEBERNSTEIN BALANCED SHARES • | | 33 |
Statement of Assets & Liabilities
STATEMENT OF OPERATIONS
Year Ended November 30, 2009
| | | | | | | |
| Investment Income | | | | | | | |
Interest | | $ | 14,064,554 | | | | |
Dividends | | | | | | | |
Unaffiliated issuers (net of foreign taxes withheld of $166,103) | | | 11,124,349 | | | | |
Affiliated issuers | | | 47,459 | | $ | 25,236,362 | |
| | | | | | | |
| Expenses | | | | | | | |
Advisory fee (see Note B) | | | 3,585,369 | | | | |
Distribution fee—Class A | | | 1,302,785 | | | | |
Distribution fee—Class B | | | 1,383,678 | | | | |
Distribution fee—Class C | | | 809,190 | | | | |
Distribution fee—Class R | | | 29,528 | | | | |
Distribution fee—Class K | | | 11,963 | | | | |
Transfer agency—Class A | | | 936,529 | | | | |
Transfer agency—Class B | | | 371,620 | | | | |
Transfer agency—Class C | | | 185,708 | | | | |
Transfer agency—Advisor Class | | | 108,870 | | | | |
Transfer agency—Class R | | | 13,996 | | | | |
Transfer agency—Class K | | | 8,886 | | | | |
Transfer agency—Class I | | | 15,131 | | | | |
Custodian | | | 209,875 | | | | |
Printing | | | 156,254 | | | | |
Registration fees | | | 138,829 | | | | |
Administrative | | | 98,250 | | | | |
Audit | | | 53,421 | | | | |
Directors’ fees | | | 49,170 | | | | |
Legal | | | 37,945 | | | | |
Miscellaneous | | | 34,854 | | | | |
| | | | | | | |
Total expenses | | | | | | 9,541,851 | |
| | | | | | | |
Net investment income | | | | | | 15,694,511 | |
| | | | | | | |
| Realized and Unrealized Gain (Loss) on Investment Transactions | | | | | | | |
Net realized loss on investment transactions | | | | | | (77,544,459 | ) |
Net change in unrealized appreciation/depreciation of investments | | | | | | 221,914,904 | |
| | | | | | | |
Net gain on investment transactions | | | | | | 144,370,445 | |
| | | | | | | |
Net Increase in Net Assets from Operations | | | | | $ | 160,064,956 | |
| | | | | | | |
See notes to financial statements.
| | |
| 34 | | • ALLIANCEBERNSTEIN BALANCED SHARES |
Statement of Operations
STATEMENT OF CHANGES IN NET ASSETS
| | | | | | | | |
| | | Year Ended
November 30,
2009 | | | Year Ended
November 30,
2008 | |
| Increase (Decrease) in Net Assets from Operations | | | | | | | | |
Net investment income | | $ | 15,694,511 | | | $ | 26,216,643 | |
Net realized loss on investment transactions | | | (77,544,459 | ) | | | (90,231,960 | ) |
Net change in unrealized appreciation/depreciation of investments | | | 221,914,904 | | | | (383,752,000 | ) |
| | | | | | | | |
Net increase (decrease) in net assets from operations | | | 160,064,956 | | | | (447,767,317 | ) |
| Dividends and Distributions to Shareholders from | | | | | | | | |
Net investment income | | | | | | | | |
Class A | | | (10,906,053 | ) | | | (18,162,850 | ) |
Class B | | | (2,619,342 | ) | | | (4,721,935 | ) |
Class C | | | (1,470,168 | ) | | | (2,273,916 | ) |
Advisor Class | | | (1,410,239 | ) | | | (2,037,633 | ) |
Class R | | | (130,574 | ) | | | (184,388 | ) |
Class K | | | (128,205 | ) | | | (179,051 | ) |
Class I | | | (493,163 | ) | | | (627,657 | ) |
Net realized gain on investment transactions | | | | | | | | |
Class A | | | – 0 | – | | | (68,968,279 | ) |
Class B | | | – 0 | – | | | (27,906,108 | ) |
Class C | | | – 0 | – | | | (12,931,278 | ) |
Advisor Class | | | – 0 | – | | | (6,687,542 | ) |
Class R | | | – 0 | – | | | (660,323 | ) |
Class K | | | – 0 | – | | | (571,991 | ) |
Class I | | | – 0 | – | | | (1,169,102 | ) |
| Capital Stock Transactions | | | | | | | | |
Net decrease | | | (158,605,119 | ) | | | (229,219,286 | ) |
| Capital Contributions | | | | | | | | |
Proceeds from third party regulatory settlement (see Note E) | | | 62,038 | | | | – 0 | – |
| | | | | | | | |
Total decrease | | | (15,635,869 | ) | | | (824,068,656 | ) |
| Net Assets | | | | | | | | |
Beginning of period | | | 771,225,021 | | | | 1,595,293,677 | |
| | | | | | | | |
End of period (including undistributed net investment income of $3,402,840 and $4,732,881, respectively) | | $ | 755,589,152 | | | $ | 771,225,021 | |
| | | | | | | | |
See notes to financial statements.
| | |
| ALLIANCEBERNSTEIN BALANCED SHARES • | | 35 |
Statement of Changes in Net Assets
NOTES TO FINANCIAL STATEMENTS
November 30, 2009
NOTE A
Significant Accounting Policies
AllianceBernstein Balanced Shares, Inc. (the “Fund”) is registered under the Investment Company Act of 1940 as a diversified, open-end management investment company. The Fund offers Class A, Class B, Class C, Advisor Class, Class R, Class K and Class I shares. Class A shares are sold with a front-end sales charge of up to 4.25% for purchases not exceeding $1,000,000. With respect to purchases of $1,000,000 or more, Class A shares redeemed within one year of purchase may be subject to a contingent deferred sales charge of 1%. Class B shares are currently sold with a contingent deferred sales charge which declines from 4% to zero depending on the period of time the shares are held. Effective January 31, 2009, sales of Class B shares of the Fund to new investors were suspended. Class B shares will only be issued (i) upon the exchange of Class B shares from another AllianceBernstein Fund, (ii) for purposes of dividend reinvestment, (iii) through the Fund’s Automatic Investment Program (the “Program”) for accounts that established the Program prior to January 31, 2009, and (iv) for purchases of additional shares by Class B shareholders as of January 31, 2009. The ability to establish a new Program for accounts containing Class B shares was suspended as of January 31, 2009. Class B shares will automatically convert to Class A shares eight years after the end of the calendar month of purchase. Class C shares are subject to a contingent deferred sales charge of 1% on redemptions made within the first year after purchase. Class R and Class K shares are sold without an initial or contingent deferred sales charge. Advisor Class and Class I shares are sold without an initial or contingent deferred sales charge and are not subject to ongoing distribution expenses. All seven classes of shares have identical voting, dividend, liquidation and other rights, except that the classes bear different distribution and transfer agency expenses. Each class has exclusive voting rights with respect to its distribution plan. The financial statements have been prepared in conformity with U.S. generally accepted accounting principles (“U.S. GAAP”) which require management to make certain estimates and assumptions that affect the reported amounts of assets and liabilities in the financial statements and amounts of income and expenses during the reporting period. Actual results could differ from those estimates. The following is a summary of significant accounting policies followed by the Fund.
1. Security Valuation
Portfolio securities are valued at their current market value determined on the basis of market quotations or, if market quotations are not readily available or are deemed unreliable, at “fair value” as determined in accordance with procedures established by and under the general supervision of the Fund’s Board of Directors.
In general, the market value of securities which are readily available and deemed reliable are determined as follows. Securities listed on a national securities exchange (other than securities listed on the NASDAQ Stock Market, Inc.
| | |
| 36 | | • ALLIANCEBERNSTEIN BALANCED SHARES |
Notes to Financial Statements
(“NASDAQ”)) or on a foreign securities exchange are valued at the last sale price at the close of the exchange or foreign securities exchange. If there has been no sale on such day, the securities are valued at the mean of the closing bid and asked prices on such day. Securities listed on more than one exchange are valued by reference to the principal exchange on which the securities are traded; securities listed only on NASDAQ are valued in accordance with the NASDAQ Official Closing Price; listed put or call options are valued at the last sale price. If there has been no sale on that day, such securities will be valued at the closing bid prices on that day; open futures contracts and options thereon are valued using the closing settlement price or, in the absence of such a price, the most recent quoted bid price. If there are no quotations available for the day of valuation, the last available closing settlement price is used; securities traded in the over-the-counter market (“OTC”) are valued at the mean of the current bid and asked prices as reported by the National Quotation Bureau or other comparable sources; U.S. government securities and other debt instruments having 60 days or less remaining until maturity are valued at amortized cost if their original maturity was 60 days or less; or by amortizing their fair value as of the 61st day prior to maturity if their original term to maturity exceeded 60 days; fixed-income securities, including mortgage backed and asset backed securities, may be valued on the basis of prices provided by a pricing service or at a price obtained from one or more of the major broker/dealers. In cases where broker/dealer quotes are obtained, AllianceBernstein L.P. (the “Adviser”) may establish procedures whereby changes in market yields or spreads are used to adjust, on a daily basis, a recently obtained quoted price on a security; and OTC and other derivatives are valued on the basis of a quoted bid price or spread from a major broker/dealer in such security. Investments in money market funds are valued at their net asset value each day.
Securities for which market quotations are not readily available (including restricted securities) or are deemed unreliable are valued at fair value. Factors considered in making this determination may include, but are not limited to, information obtained by contacting the issuer, analysts, analysis of the issuer’s financial statements or other available documents. In addition, the Fund may use fair value pricing for securities primarily traded in non-U.S. markets because most foreign markets close well before the Fund values its securities at 4:00 p.m., Eastern Time. The earlier close of these foreign markets gives rise to the possibility that significant events, including broad market moves, may have occurred in the interim and may materially affect the value of those securities. To account for this, the Fund may frequently value many of its foreign equity securities using fair value prices based on third party vendor modeling tools to the extent available.
2. Fair Value Measurements
In accordance with U.S. GAAP regarding fair value measurements, fair value is defined as the price that the Fund would receive to sell an asset or pay to transfer a liability in an orderly transaction between market participants at the measurement
| | |
| ALLIANCEBERNSTEIN BALANCED SHARES • | | 37 |
Notes to Financial Statements
date. The disclosure requirements also establish a framework for measuring fair value, and a three-level hierarchy for fair value measurements based upon the transparency of inputs to the valuation of an asset or liability. Inputs may be observable or unobservable and refer broadly to the assumptions that market participants would use in pricing the asset or liability. Observable inputs reflect the assumptions market participants would use in pricing the asset or liability based on market data obtained from sources independent of the Fund. Unobservable inputs reflect the Fund’s own assumptions about the assumptions that market participants would use in pricing the asset or liability developed based on the best information available in the circumstances. Each investment is assigned a level based upon the observability of the inputs which are significant to the overall valuation. The three-tier hierarchy of inputs is summarized below.
| | • | | Level 1—quoted prices in active markets for identical investments |
| | • | | Level 2—other significant observable inputs (including quoted prices for similar investments, interest rates, prepayment speeds, credit risk, etc.) |
| | • | | Level 3—significant unobservable inputs (including the Fund’s own assumptions in determining the fair value of investments) |
The following table summarizes the valuation of the Fund’s investments by the above fair value hierarchy levels as of November 30, 2009:
| | | | | | | | | | | | |
Investments in
Securities | | Level 1 | | Level 2 | | Level 3 | | Total |
Common Stocks | | $ | 488,170,071 | | $ | — | | $ | — | | $ | 488,170,071 |
Corporates – Investment Grades | | | — | | | 94,675,357 | | | 2,690,163 | | | 97,365,520 |
Mortgage Pass-Thru’s | | | — | | | 47,588,509 | | | — | | | 47,588,509 |
Governments – Treasuries | | | — | | | 42,315,307 | | | — | | | 42,315,307 |
Commercial Mortgage-Backed Securities | | | — | | | 18,351,357 | | | 3,825,123 | | | 22,176,480 |
Corporates – Non-Investment Grades | | | — | | | 12,364,847 | | | 317,772 | | | 12,682,619 |
Agencies | | | — | | | 6,148,919 | | | — | | | 6,148,919 |
Governments – Sovereign Bonds | | | — | | | 2,853,530 | | | 2,427,500 | | | 5,281,030 |
Asset-Backed Securities | | | — | | | 969,698 | | | 3,664,821 | | | 4,634,519 |
Preferred Stocks | | | — | | | 3,020,114 | | | — | | | 3,020,114 |
Inflation-Linked Securities | | | — | | | 2,597,523 | | | — | | | 2,597,523 |
Quasi-Sovereigns | | | — | | | — | | | 2,486,000 | | | 2,486,000 |
Emerging Markets – Corporate Bonds | | | — | | | 246,078 | | | — | | | 246,078 |
CMOs | | | — | | | — | | | 58,316 | | | 58,316 |
Short-Term Investments | | | 24,643,358 | | | — | | | — | | | 24,643,358 |
| | | | | | | | | | | | |
Total Investments in Securities | | | 512,813,429 | | | 231,131,239 | | | 15,469,695 | | | 759,414,363 |
Other Financial Instruments* | | | — | | | — | | | — | | | — |
| | | | | | | | | | | | |
Total | | $ | 512,813,429 | | $ | 231,131,239 | | $ | 15,469,695 | | $ | 759,414,363 |
| | | | | | | | | | | | |
| * | | Other financial instruments are derivative instruments, such as futures, forwards and swap contracts, which are valued at the unrealized appreciation/depreciation on the instrument. |
| | |
| 38 | | • ALLIANCEBERNSTEIN BALANCED SHARES |
Notes to Financial Statements
Following is a reconciliation of investments in which significant unobservable inputs (Level 3) were used in determining fair value:
| | | | | | | | | | | | | | | |
| | | Corporates -
Investment
Grades | | | Commercial
Mortgage-
Backed
Securities | | Corporates -
Non-Investment
Grades | | | Governments -
Sovereign
Bonds | |
Balance as of 11/30/08 | | $ | 353,576 | | | $ | — | | $ | — | | | $ | 1,724,250 | |
Accrued discounts /premiums | | | 7,422 | | | | 85,196 | | | (184 | ) | | | (1,931 | ) |
Realized gain (loss) | | | (12,997 | ) | | | — | | | — | | | | 94,246 | |
Change in unrealized appreciation/depreciation | | | 931,275 | | | | 792,212 | | | 182,506 | | | | 426,795 | |
Net purchases (sales) | | | 291,253 | | | | 910,000 | | | — | | | | 184,140 | |
Net transfers in and/or out of Level 3 | | | 1,119,634 | | | | 2,037,715 | | | 135,450 | | | | — | |
| | | | | | | | | | | | | | | |
Balance as of 11/30/09 | | $ | 2,690,163 | | | $ | 3,825,123 | | $ | 317,772 | | | $ | 2,427,500 | |
| | | | | | | | | | | | | | | |
Net change in unrealized appreciation/depreciation from Investments held as of 11/30/09* | | $ | 931,275 | | | $ | 792,212 | | $ | 182,506 | | | $ | 426,795 | |
| | | | | | | | | | | | | | | |
| | | | | | | | | | | | | | | | |
| | | Asset-
Backed
Securities | | | Quasi-
Sovereigns | | | CMOs | | | Total | |
Balance as of 11/30/08 | | $ | 5,025,609 | | | $ | 443,450 | | | $ | 652,257 | | | $ | 8,199,142 | |
Accrued discounts /premiums | | | 535 | | | | 4,896 | | | | 254 | | | | 96,188 | |
Realized gain (loss) | | | 137 | | | | 21,372 | | | | 9,660 | | | | 112,418 | |
Change in unrealized appreciation/depreciation | | | (317,361 | ) | | | 1,342,606 | | | | 147,496 | | | | 3,505,529 | |
Net purchases (sales) | | | (1,044,099 | ) | | | (464,769 | ) | | | (751,351 | ) | | | (874,826 | ) |
Net transfers in and/or out of Level 3 | | | — | | | | 1,138,445 | | | | — | | | | 4,431,244 | |
| | | | | | | | | | | | | | | | |
Balance as of 11/30/09 | | $ | 3,664,821 | | | $ | 2,486,000 | | | $ | 58,316 | | | $ | 15,469,695 | |
| | | | | | | | | | | | | | | | |
Net change in unrealized appreciation/depreciation from Investments held as of 11/30/09* | | $ | (317,361 | ) | | $ | 1,342,606 | | | $ | 147,496 | | | $ | 3,505,529 | |
| | | | | | | | | | | | | | | | |
| * | | The unrealized appreciation/depreciation is included in net change in unrealized appreciation/depreciation of investments in the accompanying statement of operations. |
3. Currency Translation
Assets and liabilities denominated in foreign currencies and commitments under forward currency exchange contracts are translated into U.S. dollars at the mean of the quoted bid and asked prices of such currencies against the U.S. dollar. Purchases and sales of portfolio securities are translated into U.S. dollars at the
| | |
| ALLIANCEBERNSTEIN BALANCED SHARES • | | 39 |
Notes to Financial Statements
rates of exchange prevailing when such securities were acquired or sold. Income and expenses are translated into U.S. dollars at rates of exchange prevailing when accrued.
Net realized gain or loss on foreign currency transactions represents foreign exchange gains and losses from sales and maturities of foreign fixed income investments, foreign currency exchange contracts, holding of foreign currencies, currency gains or losses realized between the trade and settlement dates on foreign investment transactions, and the difference between the amounts of dividends, interest and foreign withholding taxes recorded on the Fund’s books and the U.S. dollar equivalent amounts actually received or paid. Net unrealized currency gains and losses from valuing foreign currency denominated assets and liabilities at period end exchange rates are reflected as a component of net unrealized appreciation or depreciation of investments and foreign currency denominated assets and liabilities.
4. Taxes
It is the Fund’s policy to meet the requirements of the Internal Revenue Code applicable to regulated investment companies and to distribute all of its investment company taxable income and net realized gains, if any, to shareholders. Therefore, no provisions for federal income or excise taxes are required. The Fund may be subject to taxes imposed by countries in which it invests. Such taxes are generally based on income and/or capital gains earned or repatriated. Taxes are accrued and applied to net investment income, net realized gains and net unrealized appreciation/depreciation as such income and/or gains are earned.
In accordance with U.S. GAAP requirements regarding accounting for uncertainties in income taxes, management has analyzed the Fund’s tax positions taken on federal and state income tax returns for all open tax years (the current and the prior three tax years) and has concluded that no provision for income tax is required in the Fund’s financial statements.
5. Investment Income and Investment Transactions
Dividend income is recorded on the ex-dividend date or as soon as the Fund is informed of the dividend. Interest income is accrued daily. Investment transactions are accounted for on the date the securities are purchased or sold. Investment gains or losses are determined on the identified cost basis. The Fund amortizes premiums and accretes discounts as adjustments to interest income.
6. Class Allocations
All income earned and expenses incurred by the Fund are borne on a pro-rata basis by each outstanding class of shares, based on the proportionate interest in the Fund represented by the net assets of such class, except for class specific expenses which are allocated to the respective class. Realized and unrealized gains and losses are allocated among the various share classes based on respective net assets.
| | |
| 40 | | • ALLIANCEBERNSTEIN BALANCED SHARES |
Notes to Financial Statements
7. Dividends and Distributions
Dividends and distributions to shareholders, if any, are recorded on the ex-dividend date. Income dividends and capital gains distributions are determined in accordance with federal tax regulations and may differ from those determined in accordance with U.S. GAAP. To the extent these differences are permanent, such amounts are reclassified within the capital accounts based on their federal tax basis treatment; temporary differences do not require such reclassification.
NOTE B
Advisory Fee and Other Transactions with Affiliates
Under the terms of the investment advisory agreement, the Fund pays the Adviser an advisory fee at an annual rate of .60% of the first $200 million, .50% of the next $200 million and .40% in excess of $400 million of the Fund’s average daily net assets. The fee is accrued daily and paid monthly.
Pursuant to the investment advisory agreement, the Fund may reimburse the Adviser for certain legal and accounting services provided to the Fund by the Adviser. For the year ended November 30, 2009, such fee amounted to $98,250.
The Fund compensates AllianceBernstein Investor Services, Inc. (“ABIS”), a wholly-owned subsidiary of the Adviser, under a Transfer Agency Agreement for providing personnel and facilities to perform transfer agency services for the Fund. ABIS may make payments to intermediaries that provide omnibus account services, sub-accounting services and/or networking services. Such compensation retained by ABIS amounted to $693,142 for the year ended November 30, 2009.
AllianceBernstein Investments, Inc. (the “Distributor”), a wholly-owned subsidiary of the Adviser, serves as the distributor of the Fund’s shares. The Distributor has advised the Fund that it has retained front-end sales charges of $7,634 from the sale of Class A shares and received $7,258, $66,174 and $2,235 in contingent deferred sales charges imposed upon redemptions by shareholders of Class A, Class B and Class C shares, respectively, for the year ended November 30, 2009.
The Fund may invest in the AllianceBernstein Fixed-Income Shares, Inc.—Government STIF Portfolio, an open-end management investment company managed by the Adviser. The Government STIF Portfolio is offered as a cash management option to mutual funds and other institutional accounts of the Adviser, and is not available for direct purchase by members of the public. The Government STIF Portfolio pays no investment management fees but does bear
| | |
| ALLIANCEBERNSTEIN BALANCED SHARES • | | 41 |
Notes to Financial Statements
its own expenses. A summary of the Fund’s transactions in shares of the Government STIF Portfolio for the year ended November 30, 2009 is as follows:
| | | | | | | | | | | | |
Market Value November 30, 2008 (000) | | Purchases
at Cost
(000) | | Sales
Proceeds
(000) | | Market Value
November 30, 2009
(000) | | Dividend
Income
(000) |
| $ 9,786 | | $ | 280,947 | | $ | 266,090 | | $ | 24,643 | | $ | 47 |
Brokerage commissions paid on investment transactions for the year ended November 30, 2009 amounted to $1,236,344, of which $128,579 and $0, respectively, was paid to Sanford C. Bernstein & Co. LLC and Sanford C. Bernstein Limited, affiliates of the Adviser.
NOTE C
Distribution Services Agreement
The Fund has adopted a Distribution Services Agreement (the “Agreement”) pursuant to Rule 12b-1 under the Investment Company Act of 1940. Under the Agreement, the Fund pays distribution and servicing fees to the Distributor at an annual rate of up to .30% of the Fund’s average daily net assets attributable to Class A shares, 1% of the Fund’s average daily net assets attributable to both Class B and Class C shares, .50% of the Fund’s average daily net assets attributable to Class R shares and .25% of the Fund’s average daily net assets attributable to Class K shares. There are no distribution and servicing fees on the Advisor Class and Class I shares. The fees are accrued daily and paid monthly. The Agreement provides that the Distributor will use such payments in their entirety for distribution assistance and promotional activities. Since the commencement of the Fund’s operations, the Distributor has incurred expenses in excess of the distribution costs reimbursed by the Fund in the amounts of $2,461,517, $2,978,679, $313,639 and $204,802 for Class B, Class C, Class R and Class K shares, respectively. While such costs may be recovered from the Fund in future periods so long as the Agreement is in effect, the rate of the distribution and servicing fees payable under the Agreement may not be increased without a shareholder vote. In accordance with the Agreement, there is no provision for recovery of unreimbursed distribution costs incurred by the Distributor beyond the current fiscal year for Class A shares. The Agreement also provides that the Adviser may use its own resources to finance the distribution of the Fund’s shares.
NOTE D
Investment Transactions
Purchases and sales of investment securities (excluding short-term investments) for the year ended November 30, 2009 were as follows:
| | | | | | |
| | | Purchases | | Sales |
Investment securities (excluding U.S. government securities) | | $ | 668,665,332 | | $ | 824,339,188 |
U.S. government securities | | | 147,095,012 | | | 143,078,385 |
| | |
| 42 | | • ALLIANCEBERNSTEIN BALANCED SHARES |
Notes to Financial Statements
The cost of investments for federal income tax purposes, gross unrealized appreciation and unrealized depreciation are as follows:
| | | | |
Cost | | $ | 715,170,258 | |
| | | | |
Gross unrealized appreciation | | $ | 68,155,934 | |
Gross unrealized depreciation | | | (23,911,829 | ) |
| | | | |
Net unrealized appreciation | | $ | 44,244,105 | |
| | | | |
1. Derivative Financial Instruments
The Fund may use derivatives to earn income and enhance returns, to hedge or adjust the risk profile of its portfolio, to replace more traditional direct investments, or to obtain exposure to otherwise inaccessible markets. The Fund may also use derivatives for non-hedging purposes as a means of making direct investment in foreign currencies, as described below under “Currency Transactions”.
The principal types of derivatives utilized by the Fund, as well as the methods in which they may be used are:
| | • | | Forward Currency Exchange Contracts |
The Fund may enter into forward currency exchange contracts in order to hedge its exposure to changes in foreign currency exchange rates on its foreign portfolio holdings, to hedge certain firm purchase and sale commitments denominated in foreign currencies and for non-hedging purposes as a means of making direct investments in foreign currencies, as described below under “Currency Transactions.”
A forward currency exchange contract is a commitment to purchase or sell a foreign currency at a future date at a negotiated forward rate. The gain or loss arising from the difference between the original contract and the closing of such contract would be included in net realized gain or loss on foreign currency transactions. Fluctuations in the value of open forward currency exchange contracts are recorded for financial reporting purposes as unrealized appreciation and/or depreciation by the Fund. Risks may arise from the potential inability of a counterparty to meet the terms of a contract and from unanticipated movements in the value of a foreign currency relative to the U.S. dollar. The face or contract amount, in U.S. dollars reflects the total exposure the Fund has in that particular currency contract.
For hedging and investment purposes, the Fund may purchase and write (sell) put and call options on U.S. and foreign securities and foreign currencies that are traded on U.S. and foreign securities exchanges and over-the-counter markets. The Fund may also use options transactions for non-hedging purposes as a means of making direct investments in foreign currencies, as described below under “Currency Transactions”.
| | |
| ALLIANCEBERNSTEIN BALANCED SHARES • | | 43 |
Notes to Financial Statements
The risk associated with purchasing an option is that the Fund pays a premium whether or not the option is exercised. Additionally, the Fund bears the risk of loss of the premium and change in market value should the counterparty not perform under the contract. Put and call options purchased are accounted for in the same manner as portfolio securities. The cost of securities acquired through the exercise of call options is increased by premiums paid. The proceeds from securities sold through the exercise of put options are decreased by the premiums paid.
When the Fund writes an option, the premium received by the Fund is recorded as a liability and is subsequently adjusted to the current market value of the option written. Premiums received from written options which expire unexercised are recorded by the Fund on the expiration date as realized gains from options written. The difference between the premium received and the amount paid on effecting a closing purchase transaction, including brokerage commissions, is also treated as a realized gain, or if the premium received is less than the amount paid for the closing purchase transaction, as a realized loss. If a call option is exercised, the premium received is added to the proceeds from the sale of the underlying security or currency in determining whether the Fund has realized a gain or loss. If a put option is exercised, the premium received reduces the cost basis of the security or currency purchased by the Fund. In writing an option, the Fund bears the market risk of an unfavorable change in the price of the security or currency underlying the written option. Exercise of an option written by the Fund could result in the Fund selling or buying a security or currency at a price different from the current market value.
The Fund did not engage in derivatives transactions for the year ended November 30, 2009.
2. Currency Transactions
The Fund may invest in non-U.S. Dollar securities on a currency hedged or unhedged basis. The Fund may seek investment opportunities by taking long or short positions in currencies through the use of currency-related derivatives, including forward currency exchange contracts, futures and options on futures, swaps, and options. The Fund may enter into transactions for investment opportunities when it anticipates that a foreign currency will appreciate or depreciate in value but securities denominated in that currency are not held by the Fund and do not present attractive investment opportunities. Such transactions may also be used when the Adviser believes that it may be more efficient than a direct investment in a foreign currency-denominated security. The Fund may also conduct currency exchange contracts on a spot basis (i.e., for cash at the spot rate prevailing in the currency exchange market for buying or selling currencies).
| | |
| 44 | | • ALLIANCEBERNSTEIN BALANCED SHARES |
Notes to Financial Statements
3. Dollar Rolls
The Fund may enter into dollar rolls. Dollar rolls involve sales by the Fund of securities for delivery in the current month and the Fund’s simultaneously contracting to repurchase substantially similar (same type and coupon) securities on a specified future date. During the roll period, the Fund forgoes principal and interest paid on the securities. The Fund is compensated by the difference between the current sales price and the lower forward price for the future purchase (often referred to as the “drop”) as well as by the interest earned on the cash proceeds of the initial sale. Dollar rolls involve the risk that the market value of the securities the Fund is obligated to repurchase under the agreement may decline below the repurchase price. Dollar rolls are speculative techniques and may be considered to be borrowings by the Fund. For the year ended November 30, 2009, the Fund earned drop income of $1,737 which is included in interest income in the accompanying statement of operations.
NOTE E
Capital Stock
Each class consists of 3,000,000,000 authorized shares. Transactions in capital shares for each class were as follows:
| | | | | | | | | | | | | | | | | | |
| | | | | | | | | | | | | | | | | | |
| | | Shares | | | | | Amount | | | |
| | | Year Ended
November 30,
2009 | | | Year Ended
November 30,
2008 | | | | | Year Ended
November 30,
2009 | | | Year Ended
November 30,
2008 | | | |
| | | | | |
| Class A | | | | | | | | | | | | | | | | | | |
Shares sold | | 4,570,762 | | | 5,838,765 | | | | | $ | 53,286,824 | | | $ | 87,305,543 | | | |
| | | | |
Shares issued in reinvestment of dividends and distributions | | 857,964 | | | 4,988,402 | | | | | | 10,019,458 | | | | 81,441,109 | | | |
| | | | |
Shares converted from Class B | | 2,529,323 | | | 2,212,498 | | | | | | 30,540,226 | | | | 32,908,138 | | | |
| | | | |
Shares redeemed | | (13,040,621 | ) | | (24,414,110 | ) | | | | | (151,960,151 | ) | | | (354,263,158 | ) | | |
| | | | |
Net decrease | | (5,082,572 | ) | | (11,374,445 | ) | | | | $ | (58,113,643 | ) | | $ | (152,608,368 | ) | | |
| | | | |
| | | | | | | | | | | | | | | | | | |
| Class B | | | | | | | | | | | | | | | | | | |
Shares sold | | 460,951 | | | 577,724 | | | | | $ | 4,968,544 | | | $ | 8,096,275 | | | |
| | | | |
Shares issued in reinvestment of dividends and distributions | | 221,588 | | | 1,956,606 | | | | | | 2,418,173 | | | | 30,278,362 | | | |
| | | | |
Shares converted to Class A | | (2,693,798 | ) | | (2,352,061 | ) | | | | | (30,540,226 | ) | | | (32,908,138 | ) | | |
| | | | |
Shares redeemed | | (3,268,874 | ) | | (6,105,985 | ) | | | | | (35,840,896 | ) | | | (83,476,640 | ) | | |
| | | | |
Net decrease | | (5,280,133 | ) | | (5,923,716 | ) | | | | $ | (58,994,405 | ) | | $ | (78,010,141 | ) | | |
| | | | |
| | |
| ALLIANCEBERNSTEIN BALANCED SHARES • | | 45 |
Notes to Financial Statements
| | | | | | | | | | | | | | | | | | |
| | | | | | | | | | | | | | | | | | |
| | | Shares | | | | | Amount | | | |
| | | Year Ended
November 30,
2009 | | | Year Ended
November 30,
2008 | | | | | Year Ended
November 30,
2009 | | | Year Ended
November 30,
2008 | | | |
| | | | | |
| Class C | | | | | | | | | | | | | | | | | | |
Shares sold | | 668,517 | | | 513,294 | | | | | $ | 7,415,255 | | | $ | 7,059,136 | | | |
| | | | |
Shares issued in reinvestment of dividends and distributions | | 114,440 | | | 876,090 | | | | | | 1,261,223 | | | | 13,612,395 | | | |
| | | | |
Shares redeemed | | (1,987,907 | ) | | (3,257,992 | ) | | | | | (21,881,703 | ) | | | (45,054,181 | ) | | |
| | | | |
Net decrease | | (1,204,950 | ) | | (1,868,608 | ) | | | | $ | (13,205,225 | ) | | $ | (24,382,650 | ) | | |
| | | | |
| | | | | | | | | | | | | | | | | | |
| Advisor Class | | | | | | | | | | | | | | | | | | |
Shares sold | | 633,400 | | | 810,525 | | | | | $ | 7,497,507 | | | $ | 12,598,864 | | | |
| | | | |
Shares issued in reinvestment of dividends and distributions | | 117,663 | | | 516,272 | | | | | | 1,376,725 | | | | 8,422,656 | | | |
| | | | |
Shares redeemed | | (1,259,184 | ) | | (1,634,199 | ) | | | | | (14,739,002 | ) | | | (24,576,885 | ) | | |
| | | | |
Net decrease | | (508,121 | ) | | (307,402 | ) | | | | $ | (5,864,770 | ) | | $ | (3,555,365 | ) | | |
| | | | |
| | | | | | | | | | | | | | | | | | |
| Class R | | | | | | | | | | | | | | | | | | |
Shares sold | | 120,378 | | | 282,607 | | | | | $ | 1,411,661 | | | $ | 4,395,788 | | | |
| | | | |
Shares issued in reinvestment of dividends and distributions | | 11,137 | | | 51,996 | | | | | | 129,787 | | | | 844,713 | | | |
| | | | |
Shares redeemed | | (156,954 | ) | | (275,180 | ) | | | | | (1,820,260 | ) | | | (3,786,574 | ) | | |
| | | | |
Net increase (decrease) | | (25,439 | ) | | 59,423 | | | | | $ | (278,812 | ) | | $ | 1,453,927 | | | |
| | | | |
| | | | | | | | | | | | | | | | | | |
| Class K | | | | | | | | | | | | | | | | | | |
Shares sold | | 81,445 | | | 163,555 | | | | | $ | 952,055 | | | $ | 2,493,446 | | | |
| | | | |
Shares issued in reinvestment of dividends and distributions | | 11,141 | | | 46,271 | | | | | | 128,203 | | | | 750,149 | | | |
| | | | |
Shares redeemed | | (333,387 | ) | | (139,899 | ) | | | | | (3,975,671 | ) | | | (2,004,859 | ) | | |
| | | | |
Net increase (decrease) | | (240,801 | ) | | 69,927 | | | | | $ | (2,895,413 | ) | | $ | 1,238,736 | | | |
| | | | |
| | |
| 46 | | • ALLIANCEBERNSTEIN BALANCED SHARES |
Notes to Financial Statements
| | | | | | | | | | | | | | | | | | |
| | | | | | | | | | | | | | | | | | |
| | | Shares | | | | | Amount | | | |
| | | Year Ended
November 30,
2009 | | | Year Ended
November 30,
2008 | | | | | Year Ended
November 30,
2009 | | | Year Ended
November 30,
2008 | | | |
| | | | | |
| Class I | | | | | | | | | | | | | | | | | | |
Shares sold | | 101,243 | | | 1,879,835 | | | | | $ | 1,168,877 | | | $ | 31,421,843 | | | |
| | | | |
Shares issued in reinvestment of dividends and distributions | | 42,623 | | | 112,524 | | | | | | 493,161 | | | | 1,796,754 | | | |
| | | | |
Shares redeemed | | (1,650,935 | ) | | (475,885 | ) | | | | | (20,914,889 | ) | | | (6,574,022 | ) | | |
| | | | |
Net increase (decrease) | | (1,507,069 | ) | | 1,516,474 | | | | | $ | (19,252,851 | ) | | $ | 26,644,575 | | | |
| | | | |
For the year ended November 30, 2009, the Fund received $62,038 related to a third-party’s settlement of regulatory proceedings involving allegations of improper trading. This amount is presented in the Fund’s statement of changes in net assets. Neither the Fund nor its affiliates were involved in the proceedings or the calculation of the payment.
NOTE F
Risks Involved in Investing in the Fund
Interest Rate Risk and Credit Risk—Interest rate risk is the risk that changes in interest rates will affect the value of the Fund’s investments in fixed-income debt securities such as bonds or notes. Increases in interest rates may cause the value of the Fund’s investments to decline. Credit risk is the risk that the issuer or guarantor of a debt security, or the counterparty to a derivative contract, will be unable or unwilling to make timely principal and/or interest payments, or to otherwise honor its obligations. The degree of risk for a particular security may be reflected in its credit risk rating. Credit risk is greater for medium quality and lower-rated securities. Lower-rated debt securities and similar unrated securities (commonly known as “junk bonds”) have speculative elements or are predominantly speculative risks.
Foreign Securities Risk—Investing in securities of foreign companies or foreign governments involves special risks which include changes in foreign currency exchange rates and the possibility of future political and economic developments which could adversely affect the value of such securities. Moreover, securities of many foreign companies or foreign governments and their markets may be less liquid and their prices more volatile than those of comparable U.S. companies or of the U.S. government.
Currency Risk—This is the risk that changes in foreign currency exchange rates may negatively affect the value of the Fund’s investments or reduce the returns of the Fund. For example, the value of the Fund’s investments in foreign currency-denominated securities or currencies may decrease if the U.S. Dollar is
| | |
| ALLIANCEBERNSTEIN BALANCED SHARES • | | 47 |
Notes to Financial Statements
strong (i.e., gaining value relative to other currencies) and other currencies are weak (i.e., losing value relative to the U.S. Dollar). Currency markets are generally not as regulated as securities markets. Independent of the Fund’s investments denominated in foreign currencies, the Fund’s positions in various foreign currencies may cause the Fund to experience investment losses due to the changes in exchange rates and interest rates.
Derivatives Risk—The Fund may invest in derivatives such as forwards, options, futures and swaps. These investments may be illiquid, difficult to price, and leveraged so that small changes may produce disproportionate losses for the Fund, and subject to counterparty risk to a greater degree than more traditional investments.
Indemnification Risk—In the ordinary course of business, the Fund enters into contracts that contain a variety of indemnifications. The Fund’s maximum exposure under these arrangements is unknown. However, the Fund has not had prior claims or losses pursuant to these indemnification provisions and expects the risk of loss thereunder to be remote. As such, the Fund has not accrued any liability in connection with these indemnification provisions.
NOTE G
Joint Credit Facility
A number of open-end mutual funds managed by the Adviser, including the Fund, participate in a $140 million revolving credit facility (the “Facility”) intended to provide short-term financing, if necessary, subject to certain restrictions in connection with abnormal redemption activity. Commitment fees related to the Facility are paid by the participating funds and are included in miscellaneous expenses in the statement of operations. The Fund did not utilize the Facility during the year ended November 30, 2009.
NOTE H
Distributions to Shareholders
The tax character of distributions paid during the fiscal years ended November 30, 2009 and November 30, 2008 were as follows:
| | | | | | | |
| | | 2009 | | | 2008 |
Distributions paid from: | | | | | | | |
Ordinary income | | $ | 17,157,744 | | | $ | 29,734,963 |
Long-term capital gains | | | – 0 | – | | | 117,347,091 |
| | | | | | | |
Total taxable distributions | | | 17,157,744 | | | | 147,082,054 |
| | | | | | | |
Total distributions paid | | $ | 17,157,744 | | | $ | 147,082,054 |
| | | | | | | |
| | |
| 48 | | • ALLIANCEBERNSTEIN BALANCED SHARES |
Notes to Financial Statements
As of November 30, 2009, the components of accumulated earnings/(deficit) on a tax basis were as follows:
| | | | |
Undistributed ordinary income | | $ | 3,402,843 | |
Accumulated capital and other losses | | | (162,003,369 | )(a) |
Unrealized appreciation/(depreciation) | | | 44,244,105 | (b) |
| | | | |
Total accumulated earnings/(deficit) | | $ | (114,356,421 | ) |
| | | | |
| (a) | | On November 30, 2009, the Fund had a net capital loss carryforward for federal income tax purposes of $162,003,369 of which $85,220,715 expires in the year 2016 and $76,782,654 expires in the year 2017. To the extent future capital gains are offset by capital loss carryforwards, such gains will not be distributed. |
| (b) | | The differences between book-basis and tax-basis unrealized appreciation/(depreciation) is attributed to the tax deferral of losses on wash sales. |
During the current fiscal year, permanent differences primarily due to premium adjustment on disposition of securities, paydown gain/loss reclassification and consent fee reclassification resulted in an increase in undistributed net investment income and a corresponding increase in accumulated net realized loss on investment transactions. This reclassification had no effect on net assets.
NOTE I
Legal Proceedings
On October 2, 2003, a purported class action complaint entitled Hindo, et al. v. AllianceBernstein Growth & Income Fund, et al. (“Hindo Complaint”) was filed against the Adviser, Alliance Capital Management Holding L.P. (“Alliance Holding”), Alliance Capital Management Corporation, AXA Financial, Inc., the AllianceBernstein Funds, certain officers of the Adviser (“AllianceBernstein defendants”), and certain other unaffiliated defendants, as well as unnamed Doe defendants. The Hindo Complaint was filed in the United States District Court for the Southern District of New York by alleged shareholders of two of the AllianceBernstein Funds. The Hindo Complaint alleges that certain of the AllianceBernstein defendants failed to disclose that they improperly allowed certain hedge funds and other unidentified parties to engage in “late trading” and “market timing” of AllianceBernstein Fund securities, violating Sections 11 and 15 of the Securities Act, Sections 10(b) and 20(a) of the Exchange Act and Sections 206 and 215 of the Advisers Act. Plaintiffs seek an unspecified amount of compensatory damages and rescission of their contracts with the Adviser, including recovery of all fees paid to the Adviser pursuant to such contracts.
Following October 2, 2003, 43 additional lawsuits making factual allegations generally similar to those in the Hindo Complaint were filed in various federal and state courts against the Adviser and certain other defendants. On September 29, 2004, plaintiffs filed consolidated amended complaints with respect to four claim types: mutual fund shareholder claims; mutual fund derivative claims; derivative claims brought on behalf of Alliance Holding; and
| | |
| ALLIANCEBERNSTEIN BALANCED SHARES • | | 49 |
Notes to Financial Statements
claims brought under ERISA by participants in the Profit Sharing Plan for Employees of the Adviser. All four complaints include substantially identical factual allegations, which appear to be based in large part on the Order of the SEC dated December 18, 2003 as amended and restated January 15, 2004 (“SEC Order”) and the New York State Attorney General Assurance of Discontinuance dated September 1, 2004 (“NYAG Order”).
On April 21, 2006, the Adviser and attorneys for the plaintiffs in the mutual fund shareholder claims, mutual fund derivative claims, and ERISA claims entered into a confidential memorandum of understanding containing their agreement to settle these claims. The agreement will be documented by a stipulation of settlement and will be submitted for court approval at a later date. The settlement amount ($30 million), which the Adviser previously accrued and disclosed, has been disbursed. The derivative claims brought on behalf of Alliance Holding, in which plaintiffs seek an unspecified amount of damages, remain pending.
It is possible that these matters and/or other developments resulting from these matters could result in increased redemptions of the AllianceBernstein Mutual Funds’ shares or other adverse consequences to the AllianceBernstein Mutual Funds. This may require the AllianceBernstein Mutual Funds to sell investments held by those funds to provide for sufficient liquidity and could also have an adverse effect on the investment performance of the AllianceBernstein Mutual Funds. However, the Adviser believes that these matters are not likely to have a material adverse effect on its ability to perform advisory services relating to the AllianceBernstein Mutual Funds.
NOTE J
Subsequent Events
Management has evaluated subsequent events for possible recognition or disclosure in the financial statements through January 26, 2010, the date the financial statements are issued. Management has determined that there are no material events that would require disclosure in the Fund’s financial statements through this date.
| | |
| 50 | | • ALLIANCEBERNSTEIN BALANCED SHARES |
Notes to Financial Statements
FINANCIAL HIGHLIGHTS
Selected Data For A Share Of Capital Stock Outstanding Throughout Each Period
| | | | | | | | | | | | | | | |
| | | Class A | |
| | | Year Ended November 30, | |
| | | 2009 | | | 2008 | | | 2007 | | | 2006 | | | 2005 | |
| | | |
| | | | | | | | | | | | | | | |
Net asset value, beginning of period | | $ 11.06 | | | $ 18.28 | | | $ 18.29 | | | $ 17.60 | | | $ 16.81 | |
| | | |
Income From Investment Operations | | | | | | | | | | | | | | | |
Net investment income(a) | | .27 | | | .34 | | | .38 | | | .34 | | | .28 | |
Net realized and unrealized gain (loss) on investment transactions | | 2.39 | | | (5.85 | ) | | .46 | | | 1.61 | | | .81 | |
Contributions from Adviser | | – 0 | – | | – 0 | – | | .03 | | | .00 | (b) | | – 0 | – |
| | | |
Net increase (decrease) in net asset value from operations | | 2.66 | | | (5.51 | ) | | .87 | | | 1.95 | | | 1.09 | |
| | | |
Less: Dividends and Distributions | | | | | | | | | | | | | | | |
Dividends from net investment income | | (.29 | ) | | (.36 | ) | | (.39 | ) | | (.32 | ) | | (.30 | ) |
Distributions from net realized gain on investment transactions | | – 0 | – | | (1.35 | ) | | (.49 | ) | | (.94 | ) | | – 0 | – |
| | | |
Total dividends and distributions | | (.29 | ) | | (1.71 | ) | | (.88 | ) | | (1.26 | ) | | (.30 | ) |
| | | |
Net asset value, end of period | | $ 13.43 | | | $ 11.06 | | | $ 18.28 | | | $ 18.29 | | | $ 17.60 | |
| | | |
Total Return | | | | | | | | | | | | | | | |
Total investment return based on net asset value(c) | | 24.43 | %* | | (33.06 | )%* | | 4.82 | %* | | 11.81 | % | | 6.55 | % |
Ratios/Supplemental Data | | | | | | | | | | | | | | | |
Net assets, end of period (000’s omitted) | | $481,427 | | | $452,619 | | | $956,157 | | | $972,991 | | | $935,414 | |
Ratio to average net assets of: | | | | | | | | | | | | | | | |
Expenses | | 1.08 | % | | .97 | % | | .92 | % | | .88 | %(d) | | 1.04 | % |
Net investment income | | 2.30 | % | | 2.30 | % | | 2.10 | % | | 2.00 | %(d) | | 1.64 | % |
Portfolio turnover rate | | 111 | % | | 118 | % | | 66 | % | | 52 | % | | 57 | % |
See footnote summary on page 58.
| | |
| ALLIANCEBERNSTEIN BALANCED SHARES • | | 51 |
Financial Highlights
Selected Data For A Share Of Capital Stock Outstanding Throughout Each Period
| | | | | | | | | | | | | | | |
| | | Class B | |
| | | Year Ended November 30, | |
| | | 2009 | | | 2008 | | | 2007 | | | 2006 | | | 2005 | |
| | | |
| | | | | | | | | | | | | | | |
Net asset value, beginning of period | | $ 10.39 | | | $ 17.27 | | | $ 17.32 | | | $ 16.74 | | | $ 16.00 | |
| | | |
Income From Investment Operations | | | | | | | | | | | | | | | |
Net investment income(a) | | .17 | | | .22 | | | .23 | | | .20 | | | .15 | |
Net realized and unrealized gain (loss) on investment transactions | | 2.23 | | | (5.51 | ) | | .43 | | | 1.52 | | | .78 | |
Contributions from Adviser | | – 0 | – | | – 0 | – | | .03 | | | .00 | (b) | | – 0 | – |
| | | |
Net increase (decrease) in net asset value from operations | | 2.40 | | | (5.29 | ) | | .69 | | | 1.72 | | | .93 | |
| | | |
Less: Dividends and Distributions | | | | | | | | | | | | | | | |
Dividends from net investment income | | (.20 | ) | | (.24 | ) | | (.25 | ) | | (.20 | ) | | (.19 | ) |
Distributions from net realized gain on investment transactions | | – 0 | – | | (1.35 | ) | | (.49 | ) | | (.94 | ) | | – 0 | – |
| | | |
Total dividends and distributions | | (.20 | ) | | (1.59 | ) | | (.74 | ) | | (1.14 | ) | | (.19 | ) |
| | | |
Net asset value, end of period | | $ 12.59 | | | $ 10.39 | | | $ 17.27 | | | $ 17.32 | | | $ 16.74 | |
| | | |
Total Return | | | | | | | | | | | | | | | |
Total investment return based on net asset value(c) | | 23.41 | %* | | (33.56 | )%* | | 4.06 | %* | | 10.94 | % | | 5.82 | % |
Ratios/Supplemental Data | | | | | | | | | | | | | | | |
Net assets, end of period (000’s omitted) | | $121,871 | | | $155,339 | | | $360,548 | | | $478,595 | | | $571,214 | |
Ratio to average net assets of: | | | | | | | | | | | | | | | |
Expenses | | 1.85 | % | | 1.72 | % | | 1.67 | % | | 1.62 | %(d) | | 1.76 | % |
Net investment income | | 1.53 | % | | 1.54 | % | | 1.34 | % | | 1.24 | %(d) | | .90 | % |
Portfolio turnover rate | | 111 | % | | 118 | % | | 66 | % | | 52 | % | | 57 | % |
See footnote summary on page 58.
| | |
| 52 | | • ALLIANCEBERNSTEIN BALANCED SHARES |
Financial Highlights
Selected Data For A Share Of Capital Stock Outstanding Throughout Each Period
| | | | | | | | | | | | | | | |
| | | Class C | |
| | | Year Ended November 30, | |
| | | 2009 | | | 2008 | | | 2007 | | | 2006 | | | 2005 | |
| | | |
| | | | | | | | | | | | | | | |
Net asset value, beginning of period | | $ 10.44 | | | $ 17.35 | | | $ 17.40 | | | $ 16.80 | | | $ 16.06 | |
| | | |
Income From Investment Operations | | | | | | | | | | | | | | | |
Net investment income(a) | | .18 | | | .22 | | | .24 | | | .21 | | | .15 | |
Net realized and unrealized gain (loss) on investment transactions | | 2.25 | | | (5.54 | ) | | .42 | | | 1.53 | | | .78 | |
Contributions from Adviser | | – 0 | – | | – 0 | – | | .03 | | | .00 | (b) | | – 0 | – |
| | | |
Net increase (decrease) in net asset value from operations | | 2.43 | | | (5.32 | ) | | .69 | | | 1.74 | | | .93 | |
| | | |
Less: Dividends and Distributions | | | | | | | | | | | | | | | |
Dividends from net investment income | | (.20 | ) | | (.24 | ) | | (.25 | ) | | (.20 | ) | | (.19 | ) |
Distributions from net realized gain on investment transactions | | – 0 | – | | (1.35 | ) | | (.49 | ) | | (.94 | ) | | – 0 | – |
| | | |
Total dividends and distributions | | (.20 | ) | | (1.59 | ) | | (.74 | ) | | (1.14 | ) | | (.19 | ) |
| | | |
Net asset value, end of period | | $ 12.67 | | | $ 10.44 | | | $ 17.35 | | | $ 17.40 | | | $ 16.80 | |
| | | |
Total Return | | | | | | | | | | | | | | | |
Total investment return based on net asset value(c) | | 23.59 | %* | | (33.58 | )%* | | 4.04 | %* | | 11.02 | % | | 5.80 | % |
Ratios/Supplemental Data | | | | | | | | | | | | | | | |
Net assets, end of period (000’s omitted) | | $84,098 | | | $81,907 | | | $168,496 | | | $176,454 | | | $181,746 | |
Ratio to average net assets of: | | | | | | | | | | | | | | | |
Expenses | | 1.81 | % | | 1.70 | % | | 1.66 | % | | 1.61 | %(d) | | 1.76 | % |
Net investment income | | 1.57 | % | | 1.58 | % | | 1.36 | % | | 1.27 | %(d) | | .91 | % |
Portfolio turnover rate | | 111 | % | | 118 | % | | 66 | % | | 52 | % | | 57 | % |
See footnote summary on page 58.
| | |
| ALLIANCEBERNSTEIN BALANCED SHARES • | | 53 |
Financial Highlights
Selected Data For A Share Of Capital Stock Outstanding Throughout Each Period
| | | | | | | | | | | | | | | |
| | | Advisor Class | |
| | | Year Ended November 30, | |
| | | 2009 | | | 2008 | | | 2007 | | | 2006 | | | 2005 | |
| | | |
| | | | | | | | | | | | | | | |
Net asset value, beginning of period | | $ 11.08 | | | $ 18.32 | | | $ 18.33 | | | $ 17.64 | | | $ 16.84 | |
| | | |
Income From Investment Operations | | | | | | | | | | | | | | | |
Net investment income(a) | | .31 | | | .39 | | | .44 | | | .39 | | | .33 | |
Net realized and unrealized gain (loss) on investment transactions | | 2.39 | | | (5.87 | ) | | .45 | | | 1.61 | | | .82 | |
Contributions from Adviser | | – 0 | – | | – 0 | – | | .03 | | | .00 | (b) | | – 0 | – |
| | | |
Net increase (decrease) in net asset value from operations | | 2.70 | | | (5.48 | ) | | .92 | | | 2.00 | | | 1.15 | |
| | | |
Less: Dividends and Distributions | | | | | | | | | | | | | | | |
Dividends from net investment income | | (.32 | ) | | (.41 | ) | | (.44 | ) | | (.37 | ) | | (.35 | ) |
Distributions from net realized gain on investment transactions | | – 0 | – | | (1.35 | ) | | (.49 | ) | | (.94 | ) | | – 0 | – |
| | | |
Total dividends and distributions | | (.32 | ) | | (1.76 | ) | | (.93 | ) | | (1.31 | ) | | (.35 | ) |
| | | |
Net asset value, end of period | | $ 13.46 | | | $ 11.08 | | | $ 18.32 | | | $ 18.33 | | | $ 17.64 | |
| | | |
Total Return | | | | | | | | | | | | | | | |
Total investment return based on net asset value(c) | | 24.84 | %* | | (32.89 | )%* | | 5.11 | %* | | 12.10 | % | | 6.89 | % |
Ratios/Supplemental Data | | | | | | | | | | | | | | | |
Net assets, end of period (000’s omitted) | | $56,024 | | | $51,761 | | | $91,198 | | | $107,657 | | | $115,873 | |
Ratio to average net assets of: | | | | | | | | | | | | | | | |
Expenses | | .79 | % | | .68 | % | | .63 | % | | .60 | %(d) | | .74 | % |
Net investment income | | 2.59 | % | | 2.61 | % | | 2.38 | % | | 2.28 | %(d) | | 1.92 | % |
Portfolio turnover rate | | 111 | % | | 118 | % | | 66 | % | | 52 | % | | 57 | % |
See footnote summary on page 58.
| | |
| 54 | | • ALLIANCEBERNSTEIN BALANCED SHARES |
Financial Highlights
Selected Data For A Share Of Capital Stock Outstanding Throughout Each Period
| | | | | | | | | | | | | | | |
| | | Class R | |
| | | Year Ended November 30, | |
| | | 2009 | | | 2008 | | | 2007 | | | 2006 | | | 2005 | |
| | | |
| | | | | | | | | | | | | | | |
Net asset value, beginning of period | | $ 11.02 | | | $ 18.23 | | | $ 18.25 | | | $ 17.58 | | | $ 16.80 | |
| | | |
Income From Investment Operations | | | | | | | | | | | | | | | |
Net investment income(a) | | .24 | | | .31 | | | .34 | | | .30 | | | .24 | |
Net realized and unrealized gain (loss) on investment transactions | | 2.38 | | | (5.85 | ) | | .43 | | | 1.58 | | | .82 | |
Contributions from Adviser | | – 0 | – | | – 0 | – | | .03 | | | .00 | (b) | | – 0 | – |
| | | |
Net increase (decrease) in net asset value from operations | | 2.62 | | | (5.54 | ) | | .80 | | | 1.88 | | | 1.06 | |
| | | |
Less: Dividends and Distributions | | | | | | | | | | | | | | | |
Dividends from net investment income | | (.26 | ) | | (.32 | ) | | (.33 | ) | | (.27 | ) | | (.28 | ) |
Distributions from net realized gain on investment transactions | | – 0 | – | | (1.35 | ) | | (.49 | ) | | (.94 | ) | | – 0 | – |
| | | |
Total dividends and distributions | | (.26 | ) | | (1.67 | ) | | (.82 | ) | | (1.21 | ) | | (.28 | ) |
| | | |
Net asset value, end of period | | $ 13.38 | | | $ 11.02 | | | $ 18.23 | | | $ 18.25 | | | $ 17.58 | |
| | | |
Total Return | | | | | | | | | | | | | | | |
Total investment return based on net asset value(c) | | 24.15 | %* | | (33.27 | )%* | | 4.47 | %* | | 11.37 | % | | 6.36 | % |
Ratios/Supplemental Data | | | | | | | | | | | | | | | |
Net assets, end of period (000’s omitted) | | $6,645 | | | $5,753 | | | $8,432 | | | $3,197 | | | $1,393 | |
Ratio to average net assets of: | | | | | | | | | | | | | | | |
Expenses | | 1.32 | % | | 1.25 | % | | 1.24 | % | | 1.22 | %(d) | | 1.33 | % |
Net investment income | | 2.06 | % | | 2.06 | % | | 1.83 | % | | 1.72 | %(d) | | 1.39 | % |
Portfolio turnover rate | | 111 | % | | 118 | % | | 66 | % | | 52 | % | | 57 | % |
See footnote summary on page 58.
| | |
| ALLIANCEBERNSTEIN BALANCED SHARES • | | 55 |
Financial Highlights
Selected Data For A Share Of Capital Stock Outstanding Throughout Each Period
| | | | | | | | | | | | | | | |
| | | Class K | |
| | | Year Ended November 30, | | | March 1,
2005(e) to
November 30,
2005 | |
| | | 2009 | | | 2008 | | | 2007 | | | 2006 | | |
| | | |
| | | | | | | | | | | | | | | |
Net asset value, beginning of period | | $ 11.03 | | | $ 18.24 | | | $ 18.28 | | | $ 17.60 | | | $ 17.34 | |
| | | |
Income From Investment Operations | | | | | | | | | | | | | | | |
Net investment income(a) | | .28 | | | .35 | | | .42 | | | .65 | | | .22 | |
Net realized and unrealized gain (loss) on investment transactions | | 2.38 | | | (5.85 | ) | | .40 | | | 1.29 | † | | .24 | |
Contributions from Adviser | | – 0 | – | | – 0 | – | | .03 | | | .00 | (b) | | – 0 | – |
| | | |
Net increase (decrease) in net asset value from operations | | 2.66 | | | (5.50 | ) | | .85 | | | 1.94 | | | .46 | |
| | | |
Less: Dividends and Distributions | | | | | | | | | | | | | | | |
Dividends from net investment income | | (.29 | ) | | (.36 | ) | | (.40 | ) | | (.32 | ) | | (.20 | ) |
Distributions from net realized gain on investment transactions | | – 0 | – | | (1.35 | ) | | (.49 | ) | | (.94 | ) | | – 0 | – |
| | | |
Total dividends and distributions | | (.29 | ) | | (1.71 | ) | | (.89 | ) | | (1.26 | ) | | (.20 | ) |
| | | |
Net asset value, end of period | | $ 13.40 | | | $ 11.03 | | | $ 18.24 | | | $ 18.28 | | | $ 17.60 | |
| | | |
Total Return | | | | | | | | | | | | | | | |
Total investment return based on net asset value(c) | | 24.57 | %* | | (33.07 | )%* | | 4.74 | %* | | 11.74 | % | | 2.68 | % |
Ratios/Supplemental Data | | | | | | | | | | | | | | | |
Net assets, end of period (000’s omitted) | | $3,378 | | | $5,437 | | | $7,715 | | | $285 | | | $10 | |
Ratio to average net assets of: | | | | | | | | | | | | | | | |
Expenses | | 1.02 | % | | .97 | % | | .93 | % | | .91 | %(d) | | 1.01 | %(f) |
Net investment income | | 2.37 | % | | 2.35 | % | | 2.14 | % | | 2.15 | %(d) | | 1.69 | %(f) |
Portfolio turnover rate | | 111 | % | | 118 | % | | 66 | % | | 52 | % | | 57 | % |
See footnote summary on page 58.
| | |
| 56 | | • ALLIANCEBERNSTEIN BALANCED SHARES |
Financial Highlights
Selected Data For A Share Of Capital Stock Outstanding Throughout Each Period
| | | | | | | | | | | | | | | |
| | | Class I | |
| | | Year Ended November 30, | | | March 1,
2005(e) to
November 30, 2005 | |
| | | 2009 | | | 2008 | | | 2007 | | | 2006 | | |
| | | |
| | | | | | | | | | | | | | | |
Net asset value, beginning of period | | $ 11.04 | | | $ 18.26 | | | $ 18.27 | | | $ 17.60 | | | $ 17.34 | |
| | | |
Income From Investment Operations | | | | | | | | | | | | | | | |
Net investment income(a) | | .33 | | | .42 | | | .44 | | | .39 | | | .24 | |
Net realized and unrealized gain (loss) on investment transactions | | 2.39 | | | (5.87 | ) | | .45 | | | 1.60 | | | .26 | |
Contributions from Adviser | | – 0 | – | | – 0 | – | | .03 | | | .00 | (b) | | – 0 | – |
| | | |
Net increase (decrease) in net asset value from operations | | 2.72 | | | (5.45 | ) | | .92 | | | 1.99 | | | .50 | |
| | | |
Less: Dividends and Distributions | | | | | | | | | | | | | | | |
Dividends from net investment income | | (.34 | ) | | (.42 | ) | | (.44 | ) | | (.38 | ) | | (.24 | ) |
Distributions from net realized gain on investment transactions | | – 0 | – | | (1.35 | ) | | (.49 | ) | | (.94 | ) | | – 0 | – |
| | | |
Total dividends and distributions | | (.34 | ) | | (1.77 | ) | | (.93 | ) | | (1.32 | ) | | (.24 | ) |
| | | |
Net asset value, end of period | | $ 13.42 | | | $ 11.04 | | | $ 18.26 | | | $ 18.27 | | | $ 17.60 | |
| | | |
Total Return | | | | | | | | | | | | | | | |
Total investment return based on net asset value(c) | | 25.09 | %* | | (32.84 | )%* | | 5.12 | %* | | 12.07 | % | | 2.93 | % |
Ratios/Supplemental Data | | | | | | | | | | | | | | | |
Net assets, end of period (000’s omitted) | | $2,146 | | | $18,409 | | | $2,748 | | | $3,968 | | | $4,128 | |
Ratio to average net assets of: | | | | | | | | | | | | | | | |
Expenses | | .69 | % | | .62 | % | | .60 | % | | .59 | %(d) | | .81 | %(f) |
Net investment income | | 2.69 | % | | 2.72 | % | | 2.40 | % | | 2.28 | %(d) | | 2.41 | %(f) |
Portfolio turnover rate | | 111 | % | | 118 | % | | 66 | % | | 52 | % | | 57 | % |
See footnote summary on page 58.
| | |
| ALLIANCEBERNSTEIN BALANCED SHARES • | | 57 |
Financial Highlights
| (a) | | Based on average shares outstanding. |
| (b) | | Amount is less than $.005. |
| (c) | | Total investment return is calculated assuming an initial investment made at the net asset value at the beginning of the period, reinvestment of all dividends and distributions at net asset value during the period, and redemption on the last day of the period. Initial sales charges or contingent deferred sales charges are not reflected in the calculation of total investment return. Total return does not reflect the deduction of taxes that a shareholder would pay on fund distributions or the redemption of fund shares. Total investment return calculated for a period of less than one year is not annualized. |
| (d) | | The ratio includes expenses attributable to costs of proxy solicitation. |
| (e) | | Commencement of distributions. |
| * | | Includes the impact of proceeds received and credited to the Fund resulting from class action settlements, which enhanced the Fund’s performance for the years ended November 30, 2009, November 30, 2008 and November 30, 2007 by 0.27%, 0.05% and 0.13%, respectively. |
| † | | Due to the timing of sales and repurchase of capital shares, the net realized and unrealized gain (loss) per share is not in accord with the Fund’s change in net realized and unrealized gain (loss) on investment transactions for the period. |
See notes to financial statements.
| | |
| 58 | | • ALLIANCEBERNSTEIN BALANCED SHARES |
Financial Highlights
REPORT OF INDEPENDENT REGISTERED
PUBLIC ACCOUNTING FIRM
The Board of Directors and Shareholders AllianceBernstein Balanced Shares Fund, Inc.
We have audited the accompanying statement of assets and liabilities, including the portfolio of investments, of AllianceBernstein Balanced Shares Fund, Inc. as of November 30, 2009, and the related statement of operations for the year then ended, the statement of changes in net assets for each of the years in the two-year period then ended, and the financial highlights for each of the years in the four-year period then ended. These financial statements and financial highlights are the responsibility of the Fund’s management. Our responsibility is to express an opinion on these financial statements and financial highlights based on our audits. The financial highlights for the year or period ended prior to December 1, 2005 were audited by other independent registered public accountants whose report thereon, dated January 23, 2006, expressed an unqualified opinion on those financial highlights.
We conducted our audits in accordance with the standards of the Public Company Accounting Oversight Board (United States). Those standards require that we plan and perform the audit to obtain reasonable assurance about whether the financial statements and financial highlights are free of material misstatement. An audit includes examining, on a test basis, evidence supporting the amounts and disclosures in the financial statements. Our procedures included confirmation of securities owned as of November 30, 2009, by correspondence with the custodian and brokers or by other appropriate auditing procedures where replies from brokers were not received. An audit also includes assessing the accounting principles used and significant estimates made by management, as well as evaluating the overall financial statement presentation. We believe that our audits provide a reasonable basis for our opinion.
In our opinion, the financial statements and financial highlights referred to above present fairly, in all material respects, the financial position of AllianceBernstein Balanced Shares Fund, Inc. as of November 30, 2009, and the results of its operations for the year then ended, the changes in its net assets for each of the years in the two-year period then ended, and the financial highlights for each of the years in the four-year period then ended, in conformity with U.S. generally accepted accounting principles.

New York, New York
January 26, 2010
| | |
| ALLIANCEBERNSTEIN BALANCED SHARES • | | 59 |
Report of Independent Registered Public Accounting Firm
TAX INFORMATION
(unaudited)
For the fiscal year ended November 30, 2009, the Fund designates the maximum amount allowable, but not less than $11,212,117 of the ordinary income dividends paid during the fiscal year as qualified dividend income. The Fund also designates the maximum amount allowable, but not less than $9,968,141 of ordinary income dividends paid during the fiscal year for the dividends received deduction under Section 854 of the Internal Revenue Code. The Fund also designates the maximum amount allowable but not less than $8,256,091 as interest related dividends paid during the fiscal year in accordance with Sections 871(k)(l) and 881(e) of the Internal Revenue Code.
Shareholders should not use the above information to prepare their income tax returns. The information necessary to complete your income tax returns will be included with your Form 1099-DIV which will be sent to you separately in January 2010.
| | |
| 60 | | • ALLIANCEBERNSTEIN BALANCED SHARES |
Tax Information
BOARD OF DIRECTORS
| | |
William H. Foulk, Jr.(1), Chairman John H. Dobkin(1) Michael J. Downey (1) D. James Guzy(1) | | Nancy P. Jacklin(1) Garry L. Moody (1) Marshall C. Turner, Jr.(1) Earl D. Weiner(1) |
OFFICERS
| | |
Robert M. Keith, President and Chief Executive Officer Philip L. Kirstein, Senior Vice President and Independent Compliance Officer Frank V. Caruso(2), Vice President Paul J. DeNoon(2), Vice President Shawn E. Keegan(2), Vice President | | Joran Laird(2), Vice President Alison M. Martier(2), Vice President Douglas J. Peebles(2), Vice President Greg J. Wilensky(2), Vice President Emilie D. Wrapp, Secretary Joseph J. Mantineo, Treasurer and Chief Financial Officer Phyllis J. Clarke, Controller |
| | |
Custodian and Accounting Agent State Street Bank and Trust Company One Lincoln Street Boston, MA 02111 Principal Underwriter AllianceBernstein Investments, Inc. 1345 Avenue of the Americas New York, NY 10105 Legal Counsel Seward & Kissel LLP One Battery Park Plaza New York, NY 10004 | | Transfer Agent AllianceBernstein Investor Services, Inc. P.O. Box 786003 San Antonio, TX 78278-6003 Toll-Free (800) 221-5672 Independent Registered Public Accounting Firm KPMG LLP 345 Park Avenue New York, NY 10154 |
| (1) | | Member of the Audit Committee, the Governance and Nominating Committee and the Independent Directors Committee. Mr. Foulk is the sole member of the Fair Value Pricing Committee. |
| (2) | | The management of, and investment decisions for, the Fund’s portfolio are made by the Balanced Shares Investment Team, comprised of senior members of the Relative Value Investment Team and senior members of the U.S. Investment Grade Core Fixed-Income Team. Mr. Frank Caruso is the investment professional responsible for the day-to-day management of the equity component of the Fund’s portfolio and Messrs. Paul DeNoon, Shawn Keegan, Joran Laird, Douglas Peebles and Greg Wilensky and Ms. Alison Martier are the investment professionals responsible for the day-to-day management of the debt component of the Fund’s portfolio. |
| | |
| ALLIANCEBERNSTEIN BALANCED SHARES • | | 61 |
Board of Directors
MANAGEMENT OF THE FUND
Board of Directors Information
The business and affairs of the Fund are managed under the direction of the Board of Directors. Certain information concerning the Fund’s Directors is set forth below.
| | | | | | |
NAME,
ADDRESS* AND AGE
(FIRST YEAR ELECTED**) | | PRINCIPAL
OCCUPATION(S)
DURING PAST 5 YEARS | | PORTFOLIOS
IN FUND
COMPLEX
OVERSEEN BY
DIRECTOR | | OTHER
DIRECTORSHIPS
HELD BY
DIRECTOR |
| DISINTERESTED DIRECTORS | | | | |
William H. Foulk, Jr.,#, + Chairman of the Board 77 (1992) | | Investment Adviser and an Independent Consultant. Previously, he was Senior Manager of Barrett Associates, Inc., a registered investment adviser, with which he had been associated since prior to 2005. He was formerly Deputy Comptroller and Chief Investment Officer of the State of New York and, prior thereto, Chief Investment Officer of the New York Bank for Savings. | | 87 | | None |
| | | | | | |
John H. Dobkin, # 67 (1992) | | Consultant. Formerly, President of Save Venice, Inc. (preservation organization) from 2001-2002, Senior Advisor from June 1999-June 2000 and President of Historic Hudson Valley (historic preservation) from December 1989-May 1999. Previously, Director of the National Academy of Design. | | 85 | | None |
| | | | | | |
Michael J. Downey, # 66 (2005) | | Private Investor since prior to 2005. Formerly, managing partner of Lexington Capital, LLC (investment advisory firm) from December 1997 until December 2003. From 1987 until 1993, Chairman and CEO of Prudential Mutual Fund Management. | | 85 | | Asia Pacific Fund, Inc. and The Merger Fund |
| | | | | | |
D. James Guzy, # 73 (2005) | | Chairman of the Board of PLX Technology (semi-conductors) and of SRC Computers Inc., with which he has been associated since prior to 2005. He was formerly a Director of the Intel Corporation (semi-conductors) until May 2008. | | 85 | | Cirrus Logic Corporation (semi-conductors) |
| | |
| 62 | | • ALLIANCEBERNSTEIN BALANCED SHARES |
Management of the Fund
| | | | | | |
NAME,
ADDRESS* AND AGE
(FIRST YEAR ELECTED**) | | PRINCIPAL
OCCUPATION(S)
DURING PAST 5 YEARS | | PORTFOLIOS
IN FUND
COMPLEX
OVERSEEN BY
DIRECTOR | | OTHER
DIRECTORSHIPS
HELD BY
DIRECTOR |
DISINTERESTED DIRECTORS
(continued) | | | | |
Nancy P. Jacklin, # 61 (2006) | | Professorial Lecturer at the Johns Hopkins School of Advanced International Studies in the 2009-2010 academic year. Formerly, U.S. Executive Director of the International Monetary Fund (December 2002-May 2006); Partner, Clifford Chance (1992-2002); Sector Counsel, International Banking and Finance, and Associate General Counsel, Citicorp (1985-1992); Assistant General Counsel (International), Federal Reserve Board of Governors (1982-1985); and Attorney Advisor, U.S. Department of the Treasury (1973-1982). Member of the Bar of the District of Columbia and of New York; and member of the Council on Foreign Relations. | | 85 | | None |
| | | | | | |
Garry L. Moody, # 57 (2008) | | Formerly, Partner, Deloitte & Touche LLP, Vice Chairman, and U.S. and Global Managing Partner, Investment Management Services Group 1995-2008. | | 84 | | None |
| | | | | | |
Marshall C. Turner, Jr., # 68 (2005) | | Interim CEO of MEMC Electronic Materials, Inc. (semi-conductor and solar cell substrates) from November 2008 until March 2, 2009. He was Chairman and CEO of Dupont Photomasks, Inc. (components of semi-conductor manufacturing), 2003-2005, and President and CEO, 2005-2006, after the company was renamed Toppan Photomasks, Inc. | | 85 | | Xilinx, Inc. (programmable logic semi-conductors) and MEMC Electronic Materials, Inc. |
| | |
| ALLIANCEBERNSTEIN BALANCED SHARES • | | 63 |
Management of the Fund
| | | | | | |
NAME,
ADDRESS* AND AGE
(FIRST YEAR ELECTED**) | | PRINCIPAL
OCCUPATION(S)
DURING PAST 5 YEARS | | PORTFOLIOS
IN FUND
COMPLEX
OVERSEEN BY
DIRECTOR | | OTHER
DIRECTORSHIPS
HELD BY
DIRECTOR |
DISINTERESTED DIRECTORS
(continued) | | | | |
Earl D. Weiner, # 70 (2007) | | Of Counsel, and Partner prior to January 2007, of the law firm Sullivan & Cromwell LLP and member of ABA Federal Regulation of Securities Committee Task Force on Fund Director’s Guidebook. | | 85 | | None |
| * | | The address for each of the Fund’s disinterested Directors is c/o AllianceBernstein L.P., Attention: Philip L. Kirstein, 1345 Avenue of the Americas, New York, NY 10105. |
| ** | | There is no stated term of office for the Fund’s Directors. |
| # | | Member of the Audit Committee, the Governance and Nominating Committee and the Independent Directors Committee. |
| + | | Member of the Fair Value Pricing Committee. |
| | |
| 64 | | • ALLIANCEBERNSTEIN BALANCED SHARES |
Management of the Fund
Officer Information
Certain information concerning the Fund’s Officers is set forth below.
| | | | |
NAME, ADDRESS*
AND AGE | | POSITION(S)
HELD WITH FUND | | PRINCIPAL OCCUPATION
DURING PAST 5 YEARS** |
Robert M. Keith 49 | | President and Chief Executive Officer | | Executive Vice President of AllianceBernstein L.P. (“AllianceBernstein”)** and the head of AllianceBernstein Investments, Inc. (“ABI”)** since July 2008; Director of ABI, and President of the AllianceBernstein Mutual Funds. Previously, he served as Executive Managing Director of ABI from December 2006 to June 2008. Prior to joining ABI in 2006, Executive Managing Director of Bernstein Global Wealth Management, and prior thereto, Senior Managing Director and Global Head of Client Service and Sales of AllianceBernstein’s institutional investment management business since 2004. Prior thereto, Managing Director and Head of North American Client Service and Sales in AllianceBernstein’s institutional investment management business, with which he had been associated since prior to 2005. |
| | | | |
Philip L. Kirstein
64 | | Senior Vice President and Independent Compliance Officer | | Senior Vice President and Independent Compliance Officer of the AllianceBernstein Funds, with which he has been associated since October 2004. Prior thereto, he was Of Counsel to Kirkpatrick & Lockhart, LLP from October 2003 to October 2004, and General Counsel of Merrill Lynch Investment Managers, L.P. since prior to 2005. |
| | | | |
Frank V. Caruso
53 | | Vice President | | Senior Vice President of AllianceBernstein**, with which he has been associated since prior to 2005. |
| | | | |
Paul J. DeNoon
47 | | Vice President | | Senior Vice President of AllianceBernstein**, with which he has been associated since prior to 2005. |
| | | | |
Shawn E. Keegan
38 | | Vice President | | Vice President of AllianceBernstein**, with which he has been associated since prior to 2005. |
| | | | |
Joran Laird
34 | | Vice President | | Vice President of AllianceBernstein**, with which he has been associated since prior to 2005. |
| | | | |
Alison M. Martier
53 | | Vice President | | Senior Vice President of AllianceBernstein**, with which she has been associated since prior to 2005. |
| | | | |
Douglas J. Peebles
44 | | Vice President | | Executive Vice President of AllianceBernstein**, with which he has been associated since prior to 2005. |
| | |
| ALLIANCEBERNSTEIN BALANCED SHARES • | | 65 |
Management of the Fund
| | | | |
NAME, ADDRESS*
AND AGE | | POSITION(S)
HELD WITH FUND | | PRINCIPAL OCCUPATION
DURING PAST 5 YEARS** |
Greg J. Wilensky
42 | | Vice President | | Senior Vice President of AllianceBernstein**, with which he has been associated since prior to 2005. |
| | | | |
Emilie D. Wrapp
54 | | Secretary | | Senior Vice President, Assistant General Counsel and Assistant Secretary of ABI**, with which she has been associated since prior to 2005. |
| | | | |
Joseph J. Mantineo 50 | | Treasurer and Chief Financial Officer | | Senior Vice President of AllianceBernstein Investor Services, Inc. (“ABIS”)**, with which he has been associated since prior to 2005. |
| | | | |
Phyllis J. Clarke 49 | | Controller | | Vice President of ABIS**, with which she has been associated since prior to 2005. |
| * | | The address for each of the Fund’s Officers is 1345 Avenue of the Americas, New York, NY 10105. |
| ** | | AllianceBernstein, ABI and ABIS are affiliates of the Fund. |
| | | The Fund’s Statement of Additional Information (“SAI”) has additional information about the Fund’s Directors and Officers and is available without charge upon request. Contact your financial representative or AllianceBernstein at (800) 227-4618 for a free prospectus or SAI. |
| | |
| 66 | | • ALLIANCEBERNSTEIN BALANCED SHARES |
Management of the Fund
THE FOLLOWING IS NOT PART OF THE SHAREHOLDER REPORT OR THE FINANCIAL STATEMENTS
SUMMARY OF SENIOR OFFICER’S EVALUATION OF INVESTMENT ADVISORY AGREEMENT1
The following is a summary of the evaluation of the Investment Advisory Agreement between AllianceBernstein L.P. (the “Adviser”) and the AllianceBernstein Balanced Shares, Inc. (the “Fund”).2 The evaluation of the Investment Advisory Agreement was prepared by Philip L. Kirstein, the Senior Officer of the Fund, for the Directors of the Fund, as required by a September 2004 agreement between the Adviser and the New York State Attorney General (the “NYAG”). The Senior Officer’s evaluation of the Investment Advisory Agreement is not meant to diminish the responsibility or authority of the Board of Directors of the Fund to perform its duties pursuant to Section 15 of the Investment Company Act of 1940 (the “40 Act”) and applicable state law. The purpose of the summary is to provide shareholders with a synopsis of the independent evaluation of the reasonableness of the advisory fees proposed to be paid by the Fund which was provided to the Directors in connection with their review of the proposed approval of the continuance of the Investment Advisory Agreement. The Senior Officer’s evaluation considered the following factors:
| | 1. | Advisory fees charged to institutional and other clients of the Adviser for like services; |
| | 2. | Advisory fees charged by other mutual fund companies for like services; |
| | 3. | Costs to the Adviser and its affiliates of supplying services pursuant to the advisory agreement, excluding any intra-corporate profit; |
| | 4. | Profit margins of the Adviser and its affiliates from supplying such services; |
| | 5. | Possible economies of scale as the Fund grows larger; and |
| | 6. | Nature and quality of the Adviser’s services including the performance of the Fund. |
| 1 | | It should be noted that the information in the fee summary was completed on April 23, 2009 and presented to the Board of Directors on May 5-7, 2009. |
| 2 | | Future references to the Fund do not include “AllianceBernstein.” References in the fee summary pertaining to performance and expense ratio rankings refer to the Class A shares of the Fund. |
| | |
| ALLIANCEBERNSTEIN BALANCED SHARES • | | 67 |
FUND ADVISORY FEES, NET ASSETS & EXPENSE RATIOS
The Adviser proposed that the Fund pay the advisory fee set forth in the table below for receiving the services to be provided pursuant to the Investment Advisory Agreement.3
| | | | |
| Fund | | Net Assets 02/28/09 ($MIL) | | Advisory Fee Based on % of Average Daily Net Assets |
| Balanced Shares, Inc. | | $675.3 | | 60 bp on 1st $200 million 50 bp on next $200 million 40 bp on the balance |
The Adviser is reimbursed as specified in the Investment Advisory Agreement for certain clerical, legal, accounting, administrative and other services provided to the Fund. During the Fund’s most recently completed fiscal year, the Adviser received $100,125 (0.01% of the Fund’s average daily net assets) for such services.
Set forth below are the Fund’s total expense ratios for the most recently completed fiscal year:
| | | | | | |
| Fund | | Total Expense
Ratio4 | | Fiscal
Year |
| Balanced Shares, Inc. | | Advisor Class A Class B Class C Class R Class K Class I | | 0.68% 0.97% 1.72% 1.70% 1.25% 0.97% 0.62% | | November 30 |
| I. | MANAGEMENT FEES CHARGED TO INSTITUTIONAL AND OTHER CLIENTS |
The advisory fees charged to investment companies which the Adviser manages and sponsors are normally higher than those charged to similar sized institutional accounts, including pension plans and sub-advised investment companies. The fee differential reflects, among other things, different services provided to such clients, and different liabilities assumed. Services provided by the Adviser to the Fund that are not provided to non-investment company clients and sub-advised investment companies include providing office space and personnel to serve as Fund Officers, who among other responsibilities make the certifications required under the Sarbanes–Oxley Act of 2002, and coordinating with and monitoring the Fund’s third party service providers such as Fund counsel,
| 3 | | The Fund’s fee schedule was not amended in connection with the Adviser’s settlement with the NYAG in December 2003 since the Fund’s fee schedule already had lower breakpoints than the NYAG related fee schedule for AllianceBernstein Mutual Funds in the “Balanced” category. |
| | |
| 68 | | • ALLIANCEBERNSTEIN BALANCED SHARES |
auditors, custodians, transfer agents and pricing services. The accounting, administrative, legal and compliance requirements for the Fund are more costly than those for institutional assets due to the greater complexities and time required for investment companies, although as previously noted, a portion of these expenses are reimbursed by the Fund to the Adviser. Also, retail mutual funds managed by the Adviser are widely held. Servicing the Fund’s investors is more time consuming and labor intensive compared to institutional clients since the Adviser needs to communicate with a more extensive network of financial intermediaries and shareholders. The Adviser also believes that it incurs substantial entrepreneurial risk when offering a new mutual fund since establishing a new mutual fund requires a large upfront investment and it may take a long time for the fund to achieve profitability since the fund must be priced to scale from inception in order to be competitive and assets are acquired one account at a time. In addition, managing the cash flow of an investment company may be more difficult than managing that of a stable pool of assets, such as an institutional account with little cash movement in either direction, particularly, if a fund is in net redemption and the Adviser is frequently forced to sell securities to raise cash for redemptions. However, managing a fund with positive cash flow may be easier at times than managing a stable pool of assets. Finally, in recent years, investment advisers have been sued by institutional clients and have suffered reputational damage both by the attendant publicity and outcomes other than complete victories. Accordingly, the legal and reputational risks associated with institutional accounts are greater than previously thought, although still not equal to those related to the mutual fund industry.
Notwithstanding the Adviser’s view that managing an investment company is not comparable to managing other institutional accounts because the services provided are different and legal and reputational risks are greater, it is worth considering information regarding the advisory fees charged to institutional accounts with a substantially similar investment style as the Fund. However, with respect to the Fund, the Adviser represented that there is no institutional product that has a similar investment style as the Fund.
The Adviser represented that it does not sub-advise any registered investment company with a substantially similar investment style as the Fund.
| II. | MANAGEMENT FEES CHARGED BY OTHER MUTUAL FUND COMPANIES FOR LIKE SERVICES. |
Lipper, Inc. (“Lipper”), an analytical service that is not affiliated with the Adviser, compared the fees charged to the Fund with fees charged to other investment companies for similar services offered by other investment advisers. Lipper’s analysis included the Fund’s ranking with respect to the proposed
| | |
| ALLIANCEBERNSTEIN BALANCED SHARES • | | 69 |
management fee relative to the median of the Fund’s Lipper Expense Group (“EG”)5 at the approximate current asset level of the Fund.6
Lipper describes an EG as a representative sample of comparable funds. Lipper’s standard methodology for screening funds to be included in an EG entails the consideration of several fund criteria, including fund type, investment classification/objective, load type and similar 12b-1/non-12b-1 service fees, asset (size) comparability, expense components and attributes. An EG will typically consist of seven to twenty funds.
| | | | | | |
| Fund | | Contractual
Management
Fee (%)7 | | Lipper
Exp. Group Median (%) | | Rank |
| Balanced Shares, Inc. | | 0.477 | | 0.667 | | 2/9 |
Lipper also analyzed the Fund’s most recently completed fiscal year total expense ratio in comparison to the Fund’s EG and Lipper Expense Universe (“EU”). The EU8 is a broader group compared to the EG, consisting of all funds that have the same investment classification/objective and load type as the subject Fund. It should be noted that Lipper uses expense ratio data from financial statements of the most current fiscal year in their database. This has several implications: the total expense ratio of each fund that Lipper uses in their report is based on each fund’s average net assets during its fiscal year. Since funds have different fiscal year ends, the total expense ratios of the funds may cover different twelve month periods, depending on the funds’ fiscal year ends. This is the process that Lipper utilizes but given market conditions during 2008, especially the last three months of 2008, the effects on the funds’ total expense ratio
| 5 | | It should be noted that Lipper does not consider average account size when constructing EGs. Funds with relatively small average account sizes tend to have higher transfer agent expense ratios than comparable sized funds that have relatively large average account sizes. Note that there are limitations on Lipper expense category data because different funds categorize expenses differently. |
| 6 | | The contractual management fee is calculated by Lipper using the Fund’s contractual management fee rate at a hypothetical asset level. The hypothetical asset level is based on the combined net assets of all classes of the Fund, rounded up to the next $25 million. Lipper’s total expense ratio information is based on the most recent annual report except as otherwise noted. A ranking of “1” would mean that the Fund had the lowest effective fee rate in the Lipper peer group. |
| 7 | | The contractual management fee does not reflect any expense reimbursements made by the Fund to the Adviser for certain clerical, legal, accounting, administrative and other services. |
| 8 | | Except for asset (size) comparability, Lipper uses the same criteria for selecting an EG when selecting an EU. Unlike the EG, the EU allows for the same adviser to be represented by more than just one fund. |
| | |
| 70 | | • ALLIANCEBERNSTEIN BALANCED SHARES |
caused by the differences in fiscal year ends may be more pronounced in 2008 compared to other years under more normal market conditions.9
| | | | | | | | | | |
| Fund | | Expense Ratio (%)10 | | Lipper Exp. Group Median (%) | | Lipper Group Rank | | Lipper Exp. Universe Median (%) | | Lipper
Universe Rank |
| Balanced Shares, Inc. | | 0.973 | | 1.118 | | 3/9 | | 1.210 | | 12/69 |
Based on this analysis, the Fund has a more favorable ranking on a management fee basis than it does on a total expense ratio basis.
| III. | COSTS TO THE ADVISER AND ITS AFFILIATES OF SUPPLYING SERVICES PURSUANT TO THE MANAGEMENT FEE ARRANGEMENT, EXCLUDING ANY INTRA-CORPORATE PROFIT. |
The Adviser utilizes two profitability reporting systems, which operate independently but are aligned with each other, to estimate the Adviser’s profitability in connection with investment advisory services provided to the Fund. The Senior Officer has retained a consultant to provide independent advice regarding the alignment of the two profitability systems as well as the methodologies and allocations utilized by both profitability systems. See Section IV for additional discussion.
| IV. | PROFIT MARGINS OF THE ADVISER AND ITS AFFILIATES FOR SUPPLYING SUCH SERVICES. |
The Fund’s profitability information, prepared by the Adviser for the Board of Directors, was reviewed by the Senior Officer and the consultant. The Adviser’s profitability from providing investment advisory services to the Fund decreased during calendar year 2008, relative to 2007.
In addition to the Adviser’s direct profits from managing the Fund, certain of the Adviser’s affiliates have business relationships with the Fund and may earn a profit from providing other services to the Fund. The courts have referred to this type of business opportunity as “fall-out benefits” to the Adviser and indicated that such benefits should be factored into the evaluation of the total relationship between the Fund and the Adviser. Neither case law nor common business practice precludes the Adviser’s affiliates from earning a reasonable profit on this type of relationship provided the affiliates’ charges and services are competitive and the relationship otherwise complies with the 40 Act restrictions. These affiliates provide transfer agent, distribution and brokerage related services to the Fund and receive transfer agent fees, Rule 12b-1 payments, front-end sales loads, contingent deferred sales charges (“CDSC”) and brokerage commissions. In addition, the Adviser benefits from soft dollar arrangements which offset expenses the Adviser would otherwise incur.
| 9 | | To cite an example, the average net assets and total expense ratio of a fund with a fiscal year end of March 31, 2009 will not be reflective of the market declines that occurred in the second half of 2009, in contrast to a fund with a fiscal year end of December 31, 2009. |
| 10 | | Most recently completed fiscal year end Class A total expense ratio. |
| | |
| ALLIANCEBERNSTEIN BALANCED SHARES • | | 71 |
AllianceBernstein Investments, Inc. (“ABI”), an affiliate of the Adviser, is the Fund’s principal underwriter. ABI and the Adviser have disclosed in the Fund’s prospectus that they may make revenue sharing payments from their own resources, in addition to resources derived from sales loads and Rule 12b-1 fees, to firms that sell shares of the Fund. In 2008, ABI paid approximately 0.04% of the average monthly assets of the AllianceBernstein Mutual Funds or approximately $21 million for distribution services and educational support (revenue sharing payments). During the Fund’s most recently completed fiscal year, ABI received from the Fund $13,735, $6,158,605 and $254,209 in front-end sales charges, Rule 12b-1 and CDSC fees, respectively.
Fees and reimbursements for out of pocket expenses charged by AllianceBernstein Investor Services, Inc. (“ABIS”), the affiliated transfer agent for the Fund, are charged on a per account basis, based on the level of service provided and the class of share held by the account. ABIS also receives a fee per shareholder sub-account for each account maintained by an intermediary on an omnibus basis. During the Fund’s most recently completed fiscal year, ABIS received $802,955 in fees from the Fund.11
The Fund effected brokerage transactions through the Adviser’s affiliate, Sanford C. Bernstein & Co., LLC (“SCB & Co.”) and/or its U.K. affiliate, Sanford C. Bernstein Limited (“SCB Ltd.”), collectively “SCB,” and paid commissions for such transactions during the Fund’s most recently completed fiscal year. The Adviser represented that SCB’s profitability from any business conducted with the Fund is comparable to the profitability of SCB’s dealings with other similar third party clients. In the ordinary course of business, SCB receives and pays liquidity rebates from electronic communications networks (“ECNs”) derived from trading for its clients. These credits and charges are not being passed onto any SCB client, including the Fund. The Adviser also receives certain soft dollar benefits from brokers that execute agency trades for the Fund and other clients. These soft dollar benefits reduce the Adviser’s cost of doing business and increase its profitability.
| V. | POSSIBLE ECONOMIES OF SCALE |
The Adviser has indicated that economies of scale are being shared with shareholders through fee structures,12 subsidies and enhancement to services. Based on some of the professional literature that has considered economies of scale in the mutual fund industry, it is thought that to the extent economies of scale
| 11 | | The fees disclosed are net of any expense offsets with ABIS. An expense offset is created by the interest earned on the positive cash balance that occurs within the transfer agent account as there is a one day lag with regards to money movement from the shareholder’s account to the transfer agent’s account and then the transfer agent’s account to the Fund’s account. During the Fund’s most recently completed fiscal year, the fees paid by the Fund to ABIS were reduced by $30,343 under the offset agreement between the Fund and ABIS. |
| 12 | | Fee structures include fee reductions, pricing at scale and breakpoints in advisory fee schedules. |
| | |
| 72 | | • ALLIANCEBERNSTEIN BALANCED SHARES |
exist, they may more often exist across a fund family as opposed to a specific fund. This is because the costs incurred by the Adviser, such as investment research or technology for trading or compliance systems can be spread across a greater asset base as the fund family increases in size. It is also possible that as the level of services required to operate a successful investment company has increased over time, and advisory firms make such investments in their business to provide services, there may be a sharing of economies of scale without a reduction in advisory fees.
An independent consultant, retained by the Senior Officer, provided the Board of Directors an update of the Deli13 study on advisory fees and various fund characteristics. The independent consultant first reiterated the results of his previous two dimensional comparison analysis (fund size and family size) with the Board of Directors.14 The independent consultant then discussed the results of the regression model that was utilized to study the effects of various factors on advisory fees. The regression model output indicated that the bulk of the variation in fees predicted were explained by various factors, but substantially by fund AUM, family AUM, index fund indicator and investment style. The independent consultant also compared the advisory fees of the AllianceBernstein Mutual Funds to similar funds managed by 19 other large asset managers, regardless of the fund size and each Adviser’s proportion of mutual fund assets to non-mutual fund assets.
| VI. | NATURE AND QUALITY OF THE ADVISER’S SERVICES, INCLUDING THE PERFORMANCE OF THE FUND |
With assets under management of approximately $411 billion as of March 31, 2009, the Adviser has the investment experience to manage and provide non-investment services (described in Section I) to the Fund.
| 13 | | The Deli study was originally published in 2002 based on 1997 data. |
| 14 | | The two dimensional analysis showed patterns of lower advisory fees for funds with larger asset sizes and funds from larger family sizes compared to funds with smaller asset sizes and funds from smaller family sizes, which according to the independent consultant is indicative of a sharing of economies of scale and scope. However, in less liquid and active markets, such is not the case, as the empirical analysis showed potential for diseconomies of scale in those markets. The empirical analysis also showed diminishing economies of scale and scope as funds surpassed a certain high level of assets. |
| | |
| ALLIANCEBERNSTEIN BALANCED SHARES • | | 73 |
The information prepared by Lipper shows the 1, 3, 5 and 10 year performance rankings of the Fund15 relative to its Lipper Performance Group (“PG”) and Lipper Performance Universe (“PU”)16 for the periods ended January 31, 2009.17
| | | | | | | | | | |
| | | Fund Return
(%) | | PG Median
(%) | | PU Median
(%) | | PG Rank | | PU Rank |
1 year | | -28.69 | | -33.39 | | -30.33 | | 4/9 | | 49/133 |
3 year | | -7.57 | | -9.71 | | -8.03 | | 3/9 | | 48/109 |
5 year | | -2.00 | | -3.02 | | -1.73 | | 4/9 | | 49/89 |
10 year | | 1.84 | | -0.33 | | -0.09 | | 1/7 | | 12/62 |
Set forth below are the 1, 3, 5, 10 year and since inception performance returns of the Fund (in bold)18 versus its benchmark.19
| | | | | | | | | | |
| | | Periods Ending January 31, 2009
Annualized Performance |
| | | 1 Year
(%) | | 3 Year
(%) | | 5 Year
(%) | | 10 Year
(%) | | Since
Inception
(%) |
| Balanced Shares, Inc. | | -28.69 | | -7.57 | | -2.00 | | 1.84 | | 8.71 |
| 60% Russell 1000 Value Index/40% Barclays Capital Aggregate Bond Index | | -26.34 | | -5.85 | | -0.21 | | 2.49 | | N/A |
| Russell 1000 Value Index | | -41.78 | | -13.09 | | -3.52 | | 0.05 | | N/A |
| Barclays Capital U.S. Aggregate Index | | 2.59 | | 5.19 | | 4.30 | | 5.46 | | N/A |
| Inception Date: June 8, 1932 | | | | | | | | | | |
CONCLUSION:
Based on the factors discussed above the Senior Officer’s conclusion is that the proposed advisory fee for the Fund is reasonable and within the range of what would have been negotiated at arm’s-length in light of all the surrounding circumstances. This conclusion in respect of the Fund is based on an evaluation of all of these factors and no single factor was dispositive.
Dated: May 29, 2009
| 15 | | The performance rankings are for the Class A shares of the Fund. It should be noted that the performance returns of the Fund shown were provided by the Adviser. Lipper maintains its own database that includes the Fund’s performance returns. Rounding differences may cause the Adviser’s Fund returns to be one or two basis points different from Lipper’s own Fund returns. To maintain consistency, the performance returns of the Fund, as reported by the Adviser, are provided instead of Lipper. |
| 16 | | The Fund’s PG is identical to the Fund’s EG. The Fund’s PU is not identical to the Fund’s EU as the criteria for including or excluding a fund in a PU is somewhat different from that of an EU. |
| 17 | | Note that the current Lipper investment classification/objective dictates the PG and PU throughout the life of the fund even if a fund had a different investment classification/objective at a different point in time. |
| 18 | | The performance returns shown in the table are for the Class A shares of the Fund. |
| 19 | | The Adviser provided Fund and benchmark performance return information for periods through January 31, 2009. |
| | |
| 74 | | • ALLIANCEBERNSTEIN BALANCED SHARES |
THIS PAGE IS NOT PART OF THE SHAREHOLDER REPORT OR THE FINANCIAL STATEMENTS
ALLIANCEBERNSTEIN FAMILY OF FUNDS
Wealth Strategies Funds
Balanced Wealth Strategy
Wealth Appreciation Strategy
Conservative Wealth Strategy*
Tax-Managed Balanced Wealth Strategy
Tax-Managed Wealth Appreciation Strategy
Tax-Managed Conservative Wealth Strategy*
Blended Style Funds
U.S. Large Cap Portfolio
International Portfolio
Tax-Managed International Portfolio
Growth Funds
Domestic
Growth Fund
Large Cap Growth Fund
Small Cap Growth Portfolio
Small/Mid Cap Growth Fund
U.S. Strategic Research Portfolio*
Global & International
Global Growth Fund
Global Thematic Growth Fund
Greater China ‘97 Fund
International Growth Fund
Value Funds
Domestic
Balanced Shares
Focused Growth & Income Fund
Growth & Income Fund
Small/Mid Cap Value Fund
Utility Income Fund
Value Fund
Global & International
Global Real Estate Investment Fund
Global Value Fund
International Value Fund
Taxable Bond Funds
Diversified Yield Fund
Global Bond Fund
High Income Fund
Intermediate Bond Portfolio
Short Duration Portfolio
Municipal Bond Funds
| | |
National Arizona California Massachusetts Michigan Minnesota | | New Jersey New York Ohio Pennsylvania Virginia |
Intermediate Municipal Bond Funds
Intermediate California
Intermediate Diversified
Intermediate New York
Closed-End Funds
AllianceBernstein Global High Income Fund
AllianceBernstein Income Fund
AllianceBernstein National Municipal Income Fund
Alliance California Municipal Income Fund
Alliance New York Municipal Income Fund
The Ibero-America Fund*
Retirement Strategies Funds
| | | | |
2000 Retirement Strategy | | 2020 Retirement Strategy | | 2040 Retirement Strategy |
2005 Retirement Strategy | | 2025 Retirement Strategy | | 2045 Retirement Strategy |
2010 Retirement Strategy | | 2030 Retirement Strategy | | 2050 Retirement Strategy |
2015 Retirement Strategy | | 2035 Retirement Strategy | | 2055 Retirement Strategy |
We also offer Exchange Reserves,** which serves as the money market fund exchange vehicle for the AllianceBernstein mutual funds.
You should consider the investment objectives, risks, charges and expenses of any AllianceBernstein fund/portfolio carefully before investing. For free copies of our prospectuses, which contain this and other information, visit us online at www.alliancebernstein.com or contact your financial advisor. Please read the prospectus carefully before investing.
| * | | Prior to December 31, 2009, Conservative Wealth Strategy was named Wealth Preservation Strategy, and Tax-Managed Conservative Wealth Strategy was named Tax-Managed Wealth Preservation Strategy. U.S. Strategic Research Portfolio was incepted on December 23, 2009. Prior to January 20, 2010, the Ibero-America Fund was named The Spain Fund. |
| ** | An investment in the Fund is not a deposit in a bank and is not insured or guaranteed by the Federal Deposit Insurance Corporation or any other government agency. Although the Fund seeks to preserve the value of your investment at $1.00 per share, it is possible to lose money by investing in the Fund. |
| | |
| ALLIANCEBERNSTEIN BALANCED SHARES • | | 75 |
AllianceBernstein Family of Funds
NOTES
| | |
| 76 | | • ALLIANCEBERNSTEIN BALANCED SHARES |
ALLIANCEBERNSTEIN BALANCED SHARES
1345 Avenue of the Americas
New York, NY 10105
800.221.5672
| | |
| BAL-0151-1109 | |  |
(a) The registrant has adopted a code of ethics that applies to its principal executive officer, principal financial officer and principal accounting officer. A copy of the registrant’s code of ethics is filed herewith as Exhibit 12(a)(1).
(b) During the period covered by this report, no material amendments were made to the provisions of the code of ethics adopted
in 2(a) above.
(c) During the period covered by this report, no implicit or explicit waivers to the provisions of the code of ethics adopted in
2(a) above were granted.
| ITEM 3. | AUDIT COMMITTEE FINANCIAL EXPERT. |
The registrant’s Board of Directors has determined that independent directors Garry L. Moody and William H. Foulk, Jr. qualify as audit committee financial experts.
| ITEM 4. | PRINCIPAL ACCOUNTANT FEES AND SERVICES. |
(a) - (c) The following table sets forth the aggregate fees billed by the independent registered public accounting firm KPMG LLP, for the Fund’s last two fiscal years, for professional services rendered for: (i) the audit of the Fund’s annual financial statements included in the Fund’s annual report to stockholders; (ii) assurance and related services that are reasonably related to the performance of the audit of the Fund’s financial statements and are not reported under (i), which include advice and education related to accounting and auditing issues, quarterly press release review (for those Funds that issue quarterly press releases), and preferred stock maintenance testing (for those Funds that issue preferred stock); and (iii) tax compliance, tax advice and tax return preparation.
| | | | | | | | | | | |
| | | | | Audit Fees | | Audit - Related
Fees | | Tax Fees |
AB Balanced Shares | | 2008 | | $ | 38,000 | | $ | 3,329 | | $ | 6,988 |
| | 2009 | | $ | 33,132 | | $ | — | | $ | 18,025 |
(d) Not applicable.
(e) (1) Beginning with audit and non-audit service contracts entered into on or after May 6, 2003, the Fund’s Audit Committee policies and procedures require the pre-approval of all audit and non-audit services provided to the Fund by the Fund’s independent registered public accounting firm. The Fund’s Audit Committee policies and procedures also require pre-approval of all audit and non-audit services provided to the Adviser and Service Affiliates to the extent that these services are directly related to the operations or financial reporting of the Fund.
(e) (2) All of the amounts for Audit Fees, Audit-Related Fees and Tax Fees in the table under Item 4 (a) – (c) are for services pre-approved by the Fund’s Audit Committee.
(f) Not applicable.
(g) The following table sets forth the aggregate non-audit services provided to the Fund, the Fund’s Adviser and entities that control, are controlled by or under common control with the Adviser that provide ongoing services to the Fund, which include conducting an annual internal control report pursuant to Statement on Auditing Standards No. 70 (“Service Affiliates”):
| | | | | | | | | |
| | | | | All Fees for
Non-Audit Services
Provided to the
Portfolio, the Adviser
and Service Affiliates | | Pre-approved by the
Audit Committee
(Portion Comprised of
Audit Related Fees)
(Portion Comprised of
Tax Fees) | |
AB Balanced Shares | | 2008 | | $ | 387,022 | | $ | 8,672 | |
| | | | | | | $ | (1,684 | ) |
| | | | | | | $ | (6,988 | ) |
| | 2009 | | $ | 177,274 | | $ | 18,025 | |
| | | | | | | $ | — | |
| | | | | | | $ | (18,025 | ) |
(h) The Audit Committee of the Fund has considered whether the provision of any non-audit services not pre-approved by the Audit Committee provided by the Fund’s independent registered public accounting firm to the Adviser and Service Affiliates is compatible with maintaining the auditor’s independence.
| ITEM 5. | AUDIT COMMITTEE OF LISTED REGISTRANTS. |
Not applicable to the registrant.
| ITEM 6. | SCHEDULE OF INVESTMENTS. |
Please see Schedule of Investments contained in the Report to Shareholders included under Item 1 of this Form N-CSR.
| ITEM 7. | DISCLOSURE OF PROXY VOTING POLICIES AND PROCEDURES FOR CLOSED-END MANAGEMENT INVESTMENT COMPANIES. |
Not applicable to the registrant.
| ITEM 8. | PORTFOLIO MANAGERS OF CLOSED-END MANAGEMENT INVESTMENT COMPANIES. |
Not applicable to the registrant.
| ITEM 9. | PURCHASES OF EQUITY SECURITIES BY CLOSED-END MANAGEMENT INVESTMENT COMPANY AND AFFILIATED PURCHASERS. |
Not applicable to the registrant.
| ITEM 10. | SUBMISSION OF MATTERS TO A VOTE OF SECURITY HOLDERS. |
There have been no material changes to the procedures by which shareholders may recommend nominees to the Fund’s Board of Directors since the Fund last provided disclosure in response to this item.
ITEM 11. CONTROLS AND PROCEDURES.
(a) The registrant’s principal executive officer and principal financial officer have concluded that the registrant’s disclosure controls and procedures (as defined in Rule 30a-3 (c) under the Investment Company Act of 1940, as amended) are effective at the reasonable assurance level based on their evaluation of these controls and procedures as of a date within 90 days of the filing date of this document.
(b) There were no changes in the registrant’s internal controls over financial reporting that occurred during the second fiscal quarter of the period that has materially affected, or is reasonably likely to materially affect, the registrant’s internal control over financial reporting.
The following exhibits are attached to this Form N-CSR:
| | |
EXHIBIT
NO. | | DESCRIPTION OF EXHIBIT |
| |
| 12 (a) (1) | | Code of Ethics that is subject to the disclosure of Item 2 hereof |
| |
| 12 (b) (1) | | Certification of Principal Executive Officer Pursuant to Section 302 of the Sarbanes-Oxley Act of 2002 |
| |
| 12 (b) (2) | | Certification of Principal Financial Officer Pursuant to Section 302 of the Sarbanes-Oxley Act of 2002 |
| |
| 12 (c) | | Certification of Principal Executive Officer and Principal Financial Officer Pursuant to Section 906 of the Sarbanes-Oxley Act of 2002 |
SIGNATURES
Pursuant to the requirements of the Securities Exchange Act of 1934 and the Investment Company Act of 1940, the registrant has duly caused this report to be signed on its behalf by the undersigned, thereunto duly authorized.
| | |
| (Registrant): AllianceBernstein Balanced Shares, Inc. |
| |
| By: | | /s/ ROBERT M. KEITH |
| | Robert M. Keith |
| | President |
|
| Date: January 29, 2010 |
Pursuant to the requirements of the Securities Exchange Act of 1934 and the Investment Company Act of 1940, this report has been signed below by the following persons on behalf of the registrant and in the capacities and on the dates indicated.
| | |
By: | | /s/ ROBERT M. KEITH |
| | Robert M. Keith |
| | President |
|
| Date: January 29, 2010 |
| | |
By: | | /s/ JOSEPH J. MANTINEO |
| | Joseph J. Mantineo |
| | Treasurer and Chief Financial Officer |
|
| Date: January 29, 2010 |