UNITED STATES
SECURITIES AND EXCHANGE COMMISSION
WASHINGTON, D.C. 20549
FORM N-CSR
CERTIFIED SHAREHOLDER REPORT OF REGISTERED
MANAGEMENT INVESTMENT COMPANIES
Investment Company Act file number: 811-00134
ALLIANCEBERNSTEIN GLOBAL RISK
ALLOCATION FUND, INC.
(Exact name of registrant as specified in charter)
1345 Avenue of the Americas, New York, New York 10105
(Address of principal executive offices) (Zip code)
Joseph J. Mantineo
AllianceBernstein L.P.
1345 Avenue of the Americas
New York, New York 10105
(Name and address of agent for service)
Registrant’s telephone number, including area code: (800) 221-5672
Date of fiscal year end: November 30, 2012
Date of reporting period: November 30, 2012
ITEM 1. REPORTS TO STOCKHOLDERS.
ANNUAL REPORT
AllianceBernstein Global Risk Allocation Fund
(formerly Balanced Shares)
Annual Report

Investment Products Offered
|
• Are Not FDIC Insured • May Lose Value • Are Not Bank Guaranteed |
Investors should consider the investment objectives, risks, charges and expenses of the Fund carefully before investing. For copies of our prospectus or summary prospectus, which contain this and other information, visit us online at www.alliancebernstein.com or contact your AllianceBernstein Investments representative. Please read the prospectus and/or summary prospectus carefully before investing.
This shareholder report must be preceded or accompanied by the Fund’s prospectus for individuals who are not current shareholders of the Fund.
You may obtain a description of the Fund’s proxy voting policies and procedures, and information regarding how the Fund voted proxies relating to portfolio securities during the most recent 12-month period ended June 30, without charge. Simply visit AllianceBernstein’s website at www.alliancebernstein.com, or go to the Securities and Exchange Commission’s (the “Commission”) website at www.sec.gov, or call AllianceBernstein at (800) 227-4618.
The Fund files its complete schedule of portfolio holdings with the Commission for the first and third quarters of each fiscal year on Form N-Q. The Fund’s Forms N-Q are available on the Commission’s website at www.sec.gov. The Fund’s Forms N-Q may also be reviewed and copied at the Commission’s Public Reference Room in Washington, DC; information on the operation of the Public Reference Room may be obtained by calling (800) SEC-0330. AllianceBernstein publishes full portfolio holdings for the Fund monthly at www.alliancebernstein.com.
AllianceBernstein Investments, Inc. (ABI) is the distributor of the AllianceBernstein family of mutual funds. ABI is a member of FINRA and is an affiliate of AllianceBernstein L.P., the manager of the funds.
AllianceBernstein® and the AB Logo are registered trademarks and service marks used by permission of the owner, AllianceBernstein L.P.
January 23, 2013
Annual Report
This report provides management’s discussion of fund performance for AllianceBernstein Global Risk Allocation Fund (the “Fund”) for the annual reporting period ended November 30, 2012.
Investment Objectives and Policies
Effective October 8, 2012, the Fund changed its name from AllianceBernstein Balanced Shares to AllianceBernstein Global Risk Allocation Fund, eliminated its nonfundamental policies that the Fund’s investments will normally consist of about 60% in stocks and about 40% in fixed-income securities and that fixed-income securities will not normally exceed 60% of the Fund’s investments, and made certain material changes to its investment strategy, including implementation of the tail risk parity strategy described herein. In addition, the Fund’s portfolio management team was changed. The performance information shown is primarily for periods prior to implementation of these changes and may not be representative of performance the Fund will achieve under its current policies.
Under the new investment policies and strategy, the Fund invests dynamically in a number of global asset classes, including equity/credit, fixed-income, and inflation-linked instruments. In making decisions on the allocation of assets among asset classes, AllianceBernstein L.P. (the “Adviser”) will use a tail risk parity strategy. This strategy attempts to provide investors with favorable long-term total return while minimizing exposure to material downside (“tail”) events. To execute
this strategy, an average tail loss for each asset class is calculated based on historical market behavior and on a forward-looking basis through options prices. Fund assets are then allocated among asset classes so that each asset class will contribute equally to the expected tail loss of the Fund. This will generally result in the Fund having greater exposures to lower risk asset classes (such as fixed-income) than to higher risk asset classes. The Adviser will make frequent adjustments to the Fund’s asset class exposures based on these tail risk parity determinations.
The asset classes in which the Fund may invest include:
| • | | equity/credit—equity securities of all types and corporate fixed-income securities (regardless of credit quality, but subject to the limitations on high-yield securities set forth below); |
| • | | fixed-income—fixed-income securities of the U.S. and foreign governments and their agencies and instrumentalities; and |
| • | | inflation-linked—global inflation-linked securities (including Treasury Inflation Protected Securities). |
The Fund’s investments within each asset class are generally index-based—typically, portfolios of individual securities intended to track the performance of the particular asset class and, primarily for certain types of assets such as credit assets, derivatives intended to track such performance. Equity securities will comprise no more than 75% of the Fund’s investments. The Fund may invest in
| | | | |
| ALLIANCEBERNSTEIN GLOBAL RISK ALLOCATION FUND • | | | 1 | |
fixed-income securities with a range of maturities from short- to long-term. The Fund may invest up to 20% of its assets in high-yield securities (securities rated below BBB- by Standard & Poor’s Rating Services (“S&P”), Moody’s Investors Service, Inc. (“Moody’s”), or Fitch Ratings (“Fitch”), which are commonly known as “junk bonds”).
The Fund’s investments in each asset class will generally be global in nature, and will generally include investments in both developed and emerging markets. The Fund typically invests at least 40% of its assets in securities of non-U.S. companies and/or foreign countries and their agencies and instrumentalities unless conditions are not deemed favorable by the Adviser, in which case the Fund will invest at least 30% of its assets in such foreign securities.
Derivatives, particularly futures and swaps, often provide more efficient and economical exposure to market segments than direct investments, and the Fund’s exposure to certain types of assets may at times be achieved partially or substantially through investment in derivatives. Derivatives transactions may also be a quicker and more efficient way to alter the Fund’s exposure than buying and selling direct investments. In determining when and to what extent to enter into derivative transactions, the Adviser will consider factors such as the risk and returns of these investments relative to direct investments and the cost of such transactions. Because derivative transactions frequently require cash outlays that are only a small portion of the
amount of exposure obtained through the derivative, a portion of the Fund’s assets may be held in cash or invested in cash equivalents to cover the Fund’s derivatives obligations, such as short-term U.S. Government and agency securities, repurchase agreements and money market funds.
At times, a combination of direct securities investments and derivatives will be used to gain asset class exposure so that the Fund’s aggregate exposure will substantially exceed its net assets (i.e., so that the Fund is effectively leveraged). Overall Fund exposure and the allocation to equity/credit will typically increase during bull markets, while overall exposure and allocations to equity/credit and inflation-linked securities will typically decrease during bear markets.
Currency exchange rate fluctuations can have a dramatic impact on returns. The Adviser may seek to hedge all or a portion of the currency exposure resulting from Fund investments or decide not to hedge this exposure. To hedge all or a portion of its currency risk, the Fund may invest in currency-related derivatives, including forward currency exchange contracts.
Investment Results
The table on page 7 shows the Fund’s performance compared with its primary benchmark, the Morgan Stanley Capital International (“MSCI”) World Index, the Russell 1000 Value Index, the former primary benchmark, the current composite benchmark (the “Current Composite”), a 60%/40% blend of the MSCI World
| | |
| 2 | | • ALLIANCEBERNSTEIN GLOBAL RISK ALLOCATION FUND |
Index/Barclays Capital (“BC”) Global Aggregate Bond Index, respectively, and its prior composite benchmark (the “Prior Composite”) a 60%/40% blend of the Russell 1000 Value Index and the BC U.S. Aggregate Bond Index, respectively, for the six- and 12-month periods ended November 30, 2012. Also included in the table are the individual performance of each of the indices, and returns for the Fund’s peer group, as represented by the Lipper Mixed-Asset Target Allocation Growth Funds Average (the “Lipper Average”). Funds in the Lipper Average have generally similar investment objectives to the Fund, although some may have different investment policies and sales and management fees.
For the six-month period, the Fund’s Class A shares underperformed the MSCI World Index, and outperformed for the 12-month period, and underperformed the Russell 1000 Value Index, for both periods, before sales charges. The Fund outperformed its Current and Prior Composites, for both the six- and 12-month periods before sales charges. The Fund outperformed the Lipper Average for both periods.
Within the equity segment versus the Russell 1000 Value Index, for the annual period, security and sector selection contributed to performance, helped by the Fund’s specific holdings in the technology and consumer discretionary sectors, although an overweight to the technology sector detracted. For the semi-annual period, sector selection contributed, while security selection detracted. Security
selection detracted in the industrials and consumer staples sectors, while it contributed in the consumer discretionary and technology sectors.
Within the fixed income segment versus the BC U.S. Aggregate Bond Index, for both periods, both sector and security selection were positive. An underweight to U.S. Treasuries and agency mortgages, which underperformed, contributed positively for both periods, as did an overweight to investment-grade corporates and commercial mortgage-backed securities, which outperformed. An overweight to government agencies detracted for both periods while an overweight in asset-backed securities detracted for the semi-annual period. Security selection within the Fund’s corporate holdings was positive for both periods as was selection within the Fund’s asset-backed security holdings. For the annual period, high yield corporate security selection was also positive. Within the Fund’s yield curve positioning, an overweight in the 10-year area of the curve where yields declined most was beneficial for the annual period.
Credit default swaps (“CDS”) were utilized as a hedge against cash positions, which detracted for both periods. For both periods: futures were used for investment purposes, which added to performance; forwards were used for hedging and investment purposes, which had an immaterial impact on performance; interest rate swaps were used for investment purposes, which had an immaterial impact on performance.
| | | | |
| ALLIANCEBERNSTEIN GLOBAL RISK ALLOCATION FUND • | | | 3 | |
As the Fund pursued its new investment strategy during the month of November, inflation-linked securities contributed to returns. High yield CDS were used for investment purposes, and this also contributed to returns.
Market Review and Investment Strategy
The Fund adopted a more flexible asset-allocation approach during the annual reporting period, one designed to preserve long-term growth potential while limiting downside risk. The Fund also moved to a global focus from a U.S. focus in order to capture a broader range of investment opportunities.
These moves were intended to provide greater downside protection and help reduce overall portfolio volatility while preserving long-term growth potential. This approach will seek to better protect the Fund against extreme
losses by balancing risk exposure to such “tail” losses across different asset classes. The Quantitative Investment Team (the “Team”) expects to add value primarily through asset allocation decisions, rather than individual security selection. The changes reflect the ongoing evolution of the asset allocation philosophy of the Team and an alternative to traditional balanced asset allocation strategies.
The Fund will continue to invest in multiple asset classes—primarily global equities, global credit, global inflation-linked bonds and global sovereign debt. The Team will dynamically adjust the Fund’s asset allocations so that each asset class is expected to always contribute an equal amount of downside risk to the portfolio. This approach will seek to maintain appropriate risk diversification throughout all market environments.
| | |
| 4 | | • ALLIANCEBERNSTEIN GLOBAL RISK ALLOCATION FUND |
DISCLOSURES AND RISKS
Benchmark Disclosure
The unmanaged MSCI World Index, Russell 1000® Value Index, BC Global Aggregate Bond Index and BC U.S. Aggregate Bond Index do not reflect fees and expenses associated with the active management of a mutual fund portfolio. The MSCI World Index (free float-adjusted, market capitalization weighted) represents the equity market performance of developed markets. Net returns reflect the reinvestment of dividends after deduction of non-U.S. withholding tax. MSCI makes no express or implied warranties or representations, and shall have no liability whatsoever with respect to any MSCI data contained herein. The MSCI data may not be further redistributed or used as a basis for other indices, any securities or financial products. This report is not approved, reviewed or produced by MSCI. The Russell 1000 Value Index represents the performance of 1,000 large-cap value companies within the U.S. The BC Global Aggregate Bond Index represents the performance of the global investment-grade developed fixed income markets. The BC U.S. Aggregate Bond Index represents the performance of securities within the U.S. investment grade fixed rate bond market, with index components for government and corporate securities, mortgage pass-through securities, asset-backed securities, and commercial mortgage-backed securities. The Current Composite represents a blended performance barometer consisting of a 60%/40% blend of the MSCI World Index and the BC Global Aggregate Bond Index, respectively. The Prior Composite represents a blended performance barometer consisting of a 60%/40% blend of the Russell 1000 Value Index and the BC U.S. Aggregate Bond Index, respectively. An investor cannot invest directly in an index or average, and their results are not indicative of the performance for any specific investment, including the Fund.
A Word About Risk
Market Risk: The value of the Fund’s investments will fluctuate as the stock or bond market fluctuates. The value of its investments may decline, sometimes rapidly and unpredictably, simply because of economic changes or other events that affect large portions of the market.
Allocation Risk: The allocation of investments among asset classes may have a significant effect on the Fund’s net asset value (“NAV”) when the asset classes in which the Fund has invested more heavily perform worse than the asset classes invested in less heavily.
Interest Rate Risk: Changes in interest rates will affect the value of investments in fixed-income securities. When interest rates rise, the value of investments in fixed-income securities tend to fall and this decrease in value may not be offset by higher income from new investments. Interest rate risk is generally greater for fixed-income securities with longer maturities or durations.
Credit Risk: An issuer or guarantor of a fixed-income security, or the counterparty to a derivatives or other contract, may be unable or unwilling to make timely payments of interest or principal, or to otherwise honor its obligations. The issuer or guarantor may default, causing a loss of the full principal amount of a security. The degree of risk for a particular security may be reflected in its credit rating. There is the possibility that the credit rating of a fixed-income security may be downgraded after purchase, which may adversely affect the value of the security. Investments in fixed-income securities with lower ratings tend to have a higher probability that an issuer will default or fail to meet its payment obligations.
High Yield Debt Security Risk: Investments in fixed-income securities with ratings below investment grade, commonly known as “junk bonds”, tend to have a higher probability that an issuer will default or fail to meet its payment obligations. These securities may be subject to greater price volatility due to such factors as specific corporate developments, interest rate sensitivity, negative perceptions of the junk bond market generally and less secondary market liquidity.
(Disclosures, Risks and Note about Historical Performance continued on next page)
| | | | |
| ALLIANCEBERNSTEIN GLOBAL RISK ALLOCATION FUND • | | | 5 | |
Disclosures and Risks
DISCLOSURES AND RISKS
(continued from previous page)
Foreign (Non-U.S.) Risk: Investments in securities of non-U.S. issuers may involve more risk than those of U.S. issuers. These securities may fluctuate more widely in price and may be less liquid due to adverse market, economic, political, regulatory or other factors.
Currency Risk: Fluctuations in currency exchange rates may negatively affect the value of the Fund’s investments or reduce its returns.
Emerging Market Risk: Investments in emerging market countries may have more risk because the markets are less developed and less liquid as well as being subject to increased economic, political, regulatory or other uncertainties.
Derivatives Risk: Investments in derivatives may be illiquid, difficult to price, and leveraged so that small changes may produce disproportionate losses for the Fund, and may be subject to counterparty risk to a greater degree than more traditional investments.
Leverage Risk: Because the Fund uses leveraging techniques, its NAV may be more volatile because leverage tends to exaggerate the effect of changes in interest rates and any increase or decrease in the value of the Fund’s investments.
Management Risk: The Fund is subject to management risk because it is an actively managed investment fund. The Adviser will apply its investment techniques and risk analyses in making investment decisions for the Fund, but there is no guarantee that its techniques will produce the intended results.
These risks are fully discussed in the Fund’s prospectus.
An Important Note About Historical Performance
The investment return and principal value of an investment in the Fund will fluctuate, so that shares, when redeemed, may be worth more or less than their original cost. Performance shown on the following pages represents past performance and does not guarantee future results. Current performance may be lower or higher than the performance information shown. You may obtain performance information current to the most recent month-end by visiting www.alliancebernstein.com.
All fees and expenses related to the operation of the Fund have been deducted. NAV returns do not reflect sales charges; if sales charges were reflected, the Fund’s quoted performance would be lower. SEC returns reflect the applicable sales charges for each share class: a 4.25% maximum front-end sales charge for Class A shares; the applicable contingent deferred sales charge for Class B shares (4% year 1, 3% year 2, 2% year 3, 1% year 4); a 1% 1-year contingent deferred sales charge for Class C shares. Returns for the different share classes will vary due to different expenses associated with each class. Performance assumes reinvestment of distributions and does not account for taxes.
| | |
| 6 | | • ALLIANCEBERNSTEIN GLOBAL RISK ALLOCATION FUND |
Disclosures and Risks
HISTORICAL PERFORMANCE
| | | | | | | | | | |
| | | | | | | | | | |
THE FUND VS. ITS BENCHMARKS
PERIODS ENDED NOVEMBER 30, 2012 | | NAV Returns | | | |
| | 6 Months | | | 12 Months | | | |
AllianceBernstein Global Risk Allocation Fund* | | | | | | | | | | |
Class A | | | 11.03% | | | | 17.37% | | | |
|
Class B** | | | 10.62% | | | | 16.44% | | | |
|
Class C | | | 10.62% | | | | 16.54% | | | |
|
Advisor Class† | | | 11.23% | | | | 17.72% | | | |
|
Class R† | | | 10.85% | | | | 17.08% | | | |
|
Class K† | | | 11.05% | | | | 17.40% | | | |
|
Class I† | | | 11.27% | | | | 17.95% | | | |
|
MSCI World Index | | | 12.81% | | | | 13.62% | | | |
|
Russell 1000 Value Index | | | 11.20% | | | | 17.45% | | | |
|
Current Composite: 60% MSCI World Index/40% BC Global Aggregate Bond Index | | | 9.07% | | | | 10.43% | | | |
|
Prior Composite: 60% Russell 1000 Value Index/40% BC U.S. Aggregate Bond Index | | | 7.46% | | | | 12.69% | | | |
|
BC Global Aggregate Bond Index | | | 3.61% | | | | 5.37% | | | |
|
BC U.S. Aggregate Bond Index | | | 1.99% | | | | 5.51% | | | |
|
Lipper Mixed-Asset Target Allocation Growth Funds Average | | | 8.13% | | | | 11.43% | | | |
|
* Includes the impact of proceeds received and credited to the Fund resulting from class action settlements, which enhanced the performance of all share classes of the Fund for the six- and 12-month periods ended November 30, 2012, by 0.06% and 0.07%, respectively. ** Effective January 31, 2009, Class B shares are no longer available for purchase to new investors. Please see Note A for additional information. † Please note that these share classes are for investors purchasing shares through accounts established under certain fee-based programs sponsored and maintained by certain broker-dealers and financial intermediaries, institutional pension plans and/or investment advisory clients of, and certain other persons associated with, the Adviser and its affiliates or the Fund. Please keep in mind that high, double-digit returns are highly unusual and cannot be sustained. Investors should also be aware that these returns were primarily achieved during favorable market conditions. |
| | | | | | | | | | |
See Disclosures, Risks and Note about Historical Performance on pages 5-6.
(Historical Performance continued on next page)
| | | | |
| ALLIANCEBERNSTEIN GLOBAL RISK ALLOCATION FUND • | | | 7 | |
Historical Performance
HISTORICAL PERFORMANCE
(continued from previous page)
GROWTH OF A $10,000 INVESTMENT IN THE FUND 11/30/02 TO 11/30/12
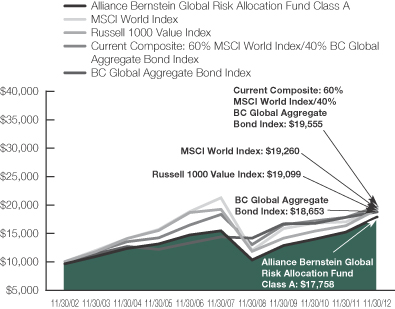
This chart illustrates the total value of an assumed $10,000 investment in AllianceBernstein Global Risk Allocation Fund Class A shares (from 11/30/02 to 11/30/12) as compared to the performance of the Fund’s Composite benchmark as well as each index separately. The chart reflects the deduction of the maximum 4.25% sales charge from the initial $10,000 investment in the Fund and assumes the reinvestment of dividends and capital gains distributions.
See Disclosures, Risks and Note about Historical Performance on pages 5-6.
(Historical Performance continued on next page)
| | |
| 8 | | • ALLIANCEBERNSTEIN GLOBAL RISK ALLOCATION FUND |
Historical Performance
HISTORICAL PERFORMANCE
(continued from previous page)
| | | | | | | | |
| AVERAGE ANNUAL RETURNS AS OF NOVEMBER 30, 2012 | |
| | | NAV Returns | | | SEC Returns | |
| Class A Shares | | | | | | | | |
1 Year | | | 17.37 | % | | | 12.38 | % |
5 Years | | | 2.97 | % | | | 2.08 | % |
10 Years | | | 6.37 | % | | | 5.91 | % |
| | | | | | | | |
| Class B Shares | | | | | | | | |
1 Year | | | 16.44 | % | | | 12.44 | % |
5 Years | | | 2.18 | % | | | 2.18 | % |
10 Years(a) | | | 5.75 | % | | | 5.75 | % |
| | | | | | | | |
| Class C Shares | | | | | | | | |
1 Year | | | 16.54 | % | | | 15.54 | % |
5 Years | | | 2.22 | % | | | 2.22 | % |
10 Years | | | 5.60 | % | | | 5.60 | % |
| | | | | | | | |
| Advisor Class Shares† | | | | | | | | |
1 Year | | | 17.72 | % | | | 17.72 | % |
5 Years | | | 3.27 | % | | | 3.27 | % |
10 Years | | | 6.68 | % | | | 6.68 | % |
| | | | | | | | |
| Class R Shares† | | | | | | | | |
1 Year | | | 17.08 | % | | | 17.08 | % |
5 Years | | | 2.69 | % | | | 2.69 | % |
Since Inception* | | | 5.27 | % | | | 5.27 | % |
| | | | | | | | |
| Class K Shares† | | | | | | | | |
1 Year | | | 17.40 | % | | | 17.40 | % |
5 Years | | | 3.00 | % | | | 3.00 | % |
Since Inception* | | | 4.37 | % | | | 4.37 | % |
| | | | | | | | |
| Class I Shares† | | | | | | | | |
1 Year | | | 17.95 | % | | | 17.95 | % |
5 Years | | | 3.43 | % | | | 3.43 | % |
Since Inception* | | | 4.77 | % | | | 4.77 | % |
The Fund’s current prospectus fee table shows the Fund’s total annual operating expense ratios as 1.12%, 1.89%, 1.85%, 0.83%, 1.40%, 1.09% and 0.66% for Class A, Class B, Class C, Advisor Class, Class R, Class K and Class I shares, respectively. The Financial Highlights section of this report sets forth expense ratio data for the current reporting period; the expense ratios shown above may differ from the expense ratios in the Financial Highlights section since they are based on different time periods.
| (a) | | Assumes conversion of Class B shares into Class A shares after eight years. |
| † | | These share classes are offered at NAV to eligible investors and their SEC returns are the same as the NAV returns. Please note that these share classes are for investors purchasing shares through accounts established under certain fee-based programs sponsored and maintained by certain broker-dealers and financial intermediaries, institutional pension plans and/or investment advisory clients of, and certain other persons associated with, the Adviser and its affiliates or the Fund. The inception dates for Class R, Class K and Class I shares are listed below. |
| * | | Inception dates: 11/3/03 for Class R shares; 3/1/05 for Class K and Class I shares. |
See Disclosures, Risks and Note about Historical Performance on pages 5-6.
(Historical Performance continued on next page)
| | | | |
| ALLIANCEBERNSTEIN GLOBAL RISK ALLOCATION FUND • | | | 9 | |
Historical Performance
HISTORICAL PERFORMANCE
(continued from previous page)
| | | | |
SEC AVERAGE ANNUAL RETURNS (WITH ANY APPLICABLE SALES CHARGES)
AS OF THE MOST RECENT CALENDAR QUARTER-END (DECEMBER 31, 2012) | |
| | | SEC Returns | |
| Class A Shares | | | | |
1 Year | | | 10.98 | % |
5 Years | | | 2.18 | % |
10 Years | | | 6.20 | % |
| | | | |
| Class B Shares | | | | |
1 Year | | | 11.14 | % |
5 Years | | | 2.29 | % |
10 Years(a) | | | 6.04 | % |
| | | | |
| Class C Shares | | | | |
1 Year | | | 14.17 | % |
5 Years | | | 2.33 | % |
10 Years | | | 5.90 | % |
| | | | |
| Advisor Class Shares† | | | | |
1 Year | | | 16.25 | % |
5 Years | | | 3.36 | % |
10 Years | | | 6.98 | % |
| | | | |
| Class R Shares† | | | | |
1 Year | | | 15.67 | % |
5 Years | | | 2.79 | % |
Since Inception* | | | 5.25 | % |
| | | | |
| Class K Shares† | | | | |
1 Year | | | 15.99 | % |
5 Years | | | 3.10 | % |
Since Inception* | | | 4.36 | % |
| | | | |
| Class I Shares† | | | | |
1 Year | | | 16.48 | % |
5 Years | | | 3.53 | % |
Since Inception* | | | 4.76 | % |
| (a) | | Assumes conversion of Class B shares into Class A shares after eight years. |
| † | | Please note that these share classes are for investors purchasing shares through accounts established under certain fee-based programs sponsored and maintained by certain broker-dealers and financial intermediaries, institutional pension plans and/or investment advisory clients of, and certain other persons associated with, the Adviser and its affiliates or the Fund. The inception dates for Class R, Class K and Class I shares are listed below. |
| * | | Inception dates: 11/3/03 for Class R shares; 3/1/05 for Class K and Class I shares. |
See Disclosures, Risks and Note about Historical Performance on pages 5-6.
| | |
| 10 | | • ALLIANCEBERNSTEIN GLOBAL RISK ALLOCATION FUND |
Historical Performance
FUND EXPENSES
(unaudited)
As a shareholder of the Fund, you incur two types of costs: (1) transaction costs, including sales charges (loads) on purchase payments, contingent deferred sales charges on redemptions and (2) ongoing costs, including management fees; distribution (12b-1) fees; and other Fund expenses. This example is intended to help you understand your ongoing costs (in dollars) of investing in the Fund and to compare these costs with the ongoing costs of investing in other mutual funds.
The Example is based on an investment of $1,000 invested at the beginning of the period and held for the entire period as indicated below.
Actual Expenses
The table below provides information about actual account values and actual expenses. You may use the information, together with the amount you invested, to estimate the expenses that you paid over the period. Simply divide your account value by $1,000 (for example, an $8,600 account value divided by $1,000 = 8.6), then multiply the result by the number under the heading entitled “Expenses Paid During Period” to estimate the expenses you paid on your account during this period.
Hypothetical Example for Comparison Purposes
The table below also provides information about hypothetical account values and hypothetical expenses based on the Fund’s actual expense ratio and an assumed annual rate of return of 5% before expenses, which is not the Fund’s actual return. The hypothetical account values and expenses may not be used to estimate the actual ending account balance or expenses you paid for the period. You may use this information to compare the ongoing costs of investing in the Fund and other funds by comparing this 5% hypothetical example with the 5% hypothetical examples that appear in the shareholder reports of other funds.
Please note that the expenses shown in the table are meant to highlight your ongoing costs only and do not reflect any transactional costs, such as sales charges (loads), or contingent deferred sales charges on redemptions. Therefore, the hypothetical example is useful in comparing ongoing costs only, and will not help you determine the relative total costs of owning different funds. In addition, if these transactional costs were included, your costs would have been higher.
| | | | | | | | | | | | | | | | |
| | | Beginning
Account Value
June 1, 2012 | | | Ending
Account Value
November 30, 2012 | | | Expenses Paid
During Period* | | | Annualized
Expense Ratio* | |
| Class A | | | | | | | | | | | | | | | | |
Actual | | $ | 1,000 | | | $ | 1,110.30 | | | $ | 5.70 | | | | 1.08 | % |
Hypothetical** | | $ | 1,000 | | | $ | 1,019.60 | | | $ | 5.45 | | | | 1.08 | % |
| Class B | | | | | | | | | | | | | | | | |
Actual | | $ | 1,000 | | | $ | 1,106.20 | | | $ | 9.69 | | | | 1.84 | % |
Hypothetical** | | $ | 1,000 | | | $ | 1,015.80 | | | $ | 9.27 | | | | 1.84 | % |
| Class C | | | | | | | | | | | | | | | | |
Actual | | $ | 1,000 | | | $ | 1,106.20 | | | $ | 9.48 | | | | 1.80 | % |
Hypothetical** | | $ | 1,000 | | | $ | 1,016.00 | | | $ | 9.07 | | | | 1.80 | % |
| Advisor Class | | | | | | | | | | | | | | | | |
Actual | | $ | 1,000 | | | $ | 1,112.30 | | | $ | 4.12 | | | | 0.78 | % |
Hypothetical** | | $ | 1,000 | | | $ | 1,021.10 | | | $ | 3.94 | | | | 0.78 | % |
| Class R | | | | | | | | | | | | | | | | |
Actual | | $ | 1,000 | | | $ | 1,108.50 | | | $ | 7.27 | | | | 1.38 | % |
Hypothetical** | | $ | 1,000 | | | $ | 1,018.10 | | | $ | 6.96 | | | | 1.38 | % |
| Class K | | | | | | | | | | | | | | | | |
Actual | | $ | 1,000 | | | $ | 1,110.50 | | | $ | 5.65 | | | | 1.07 | % |
Hypothetical** | | $ | 1,000 | | | $ | 1,019.65 | | | $ | 5.40 | | | | 1.07 | % |
| Class I | | | | | | | | | | | | | | | | |
Actual | | $ | 1,000 | | | $ | 1,112.70 | | | $ | 3.38 | | | | 0.64 | % |
Hypothetical** | | $ | 1,000 | | | $ | 1,021.80 | | | $ | 3.23 | | | | 0.64 | % |
| * | | Expenses are equal to the classes’ annualized expense ratios multiplied by the average account value over the period, multiplied by 183/366 (to reflect the one-half year period). |
| ** | | Assumes 5% return before expenses. |
| | | | |
| ALLIANCEBERNSTEIN GLOBAL RISK ALLOCATION FUND • | | | 11 | |
Fund Expenses
PORTFOLIO SUMMARY
November 30, 2012 (unaudited)
PORTFOLIO STATISTICS
Net Assets ($mil): $560.4
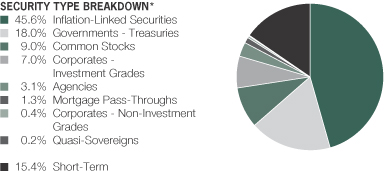
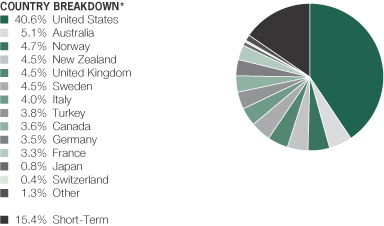
| * | | All data are as of November 30, 2012. The Fund’s security type and country breakdowns are expressed as a percentage of total investments (excluding security lending collateral) and may vary over time. The Fund also enters into derivative transactions, which may be used for hedging or investment purposes (see “Portfolio of Investments” section of the report for additional details) “Other” country weightings represent 0.8% or less in the following countries: Australia, Belgium, Brazil, China, Denmark, Finland, Greece, Hong Kong, Ireland, Israel, Kazakhstan, Luxembourg, Macau, Malaysia, Netherlands, Portugal, Singapore, South Africa and Spain. |
| | |
| 12 | | • ALLIANCEBERNSTEIN GLOBAL RISK ALLOCATION FUND |
Portfolio Summary
TEN LARGEST HOLDINGS*
November 30, 2012 (unaudited)
| | | | | | | | |
| Company | | U.S. $ Value | | | Percent of
Net Assets | |
U.S. Treasury Inflation Index | | $ | 142,336,909 | | | | 25.4 | % |
Norway Government Bond | | | 25,312,718 | | | | 4.5 | |
Australia Government Bond | | | 25,203,769 | | | | 4.5 | |
New Zealand Government Bond | | | 24,966,523 | | | | 4.5 | |
Sweden Government Bond | | | 23,412,815 | | | | 4.2 | |
Italy Buoni Poliennali Del Tesoro | | | 21,151,790 | | | | 3.8 | |
Turkey Government Bond | | | 20,967,817 | | | | 3.7 | |
Deutsche Bundesrepublik Inflation Linked Bond | | | 16,773,198 | | | | 3.0 | |
United Kingdom Gilt Inflation Linked | | | 16,732,196 | | | | 3.0 | |
Canadian Government Bond | | | 16,451,418 | | | | 2.9 | |
| | $ | 333,309,153 | | | | 59.5 | % |
| | | | |
| ALLIANCEBERNSTEIN GLOBAL RISK ALLOCATION FUND • | | | 13 | |
Ten Largest Holdings
PORTFOLIO OF INVESTMENTS
November 30, 2012
| | | | | | | | | | |
| | | | | Principal
Amount
(000) | | | U.S. $ Value | |
| | | | | |
| | | | | | | | | | |
INFLATION-LINKED SECURITIES – 44.7% | | | | | | | | | | |
Canada – 2.9% | | | | | | | | | | |
Canadian Government Bond
4.00%, 12/01/31 | | CAD | | | 5,053 | | | $ | 8,896,007 | |
3.00%, 12/01/36 | | | | | 4,543 | | | | 7,555,411 | |
| | | | | | | | | | |
| | | | | | | | | 16,451,418 | |
| | | | | | | | | | |
France – 2.9% | | | | | | | | | | |
France Government Bond OAT
Series OATI
2.10%, 7/25/23 | | EUR | | | 10,307 | | | | 16,223,205 | |
| | | | | | | | | | |
| | | |
Germany – 3.0% | | | | | | | | | | |
Deutsche Bundesrepublik Inflation Linked Bond
1.75%, 4/15/20 | | | | | 7,957 | | | | 12,197,509 | |
1.50%, 4/15/16 | | | | | 3,241 | | | | 4,575,689 | |
| | | | | | | | | | |
| | | | | | | | | 16,773,198 | |
| | | | | | | | | | |
Italy – 3.8% | | | | | | | | | | |
Italy Buoni Poliennali Del Tesoro
2.10%, 9/15/21 | | | | | 17,313 | | | | 21,151,790 | |
| | | | | | | | | | |
| | | |
Turkey – 3.7% | | | | | | | | | | |
Turkey Government Bond
3.00%, 2/23/22 | | TRY | | | 12,775 | | | | 8,228,835 | |
4.50%, 2/11/15 | | | | | 20,562 | | | | 12,738,982 | |
| | | | | | | | | | |
| | | | | | | | | 20,967,817 | |
| | | | | | | | | | |
United Kingdom – 3.0% | | | | | | | | | | |
United Kingdom Gilt Inflation Linked
Series 3MO
1.25%, 11/22/32 | | GBP | | | 4,757 | | | | 9,649,648 | |
0.75%, 3/22/34(a) | | | | | 3,832 | | | | 7,082,548 | |
| | | | | | | | | | |
| | | | | | | | | 16,732,196 | |
| | | | | | | | | | |
United States – 25.4% | | | | | | | | | | |
U.S. Treasury Inflation Index
1.25%, 7/15/20 (TIPS) | | U.S.$ | | | 10,402 | | | | 12,425,200 | |
1.125%, 1/15/21 (TIPS) | | | | | 44,566 | | | | 52,723,398 | |
0.625%, 7/15/21 (TIPS) | | | | | 44,184 | | | | 50,631,635 | |
0.125%, 7/15/22 (TIPS) | | | | | 24,197 | | | | 26,556,676 | |
| | | | | | | | | | |
| | | | | | | | | 142,336,909 | |
| | | | | | | | | | |
Total Inflation-Linked Securities
(cost $247,473,365) | | | | | | | | | 250,636,533 | |
| | | | | | | | | | |
| | | | | | | | | | |
GOVERNMENTS - TREASURIES – 17.6% | | | | | | | | | | |
Australia – 4.5% | | | | | | | | | | |
Australia Government Bond
Series 124
5.75%, 5/15/21 | | AUD | | | 20,085 | | | | 25,203,769 | |
| | | | | | | | | | |
| | |
| 14 | | • ALLIANCEBERNSTEIN GLOBAL RISK ALLOCATION FUND |
Portfolio of Investments
| | | | | | | | | | |
| | | | | Principal
Amount
(000) | | | U.S. $ Value | |
| | | | | |
| | | | | | | | | | |
New Zealand – 4.4% | | | | | | | | | | |
New Zealand Government Bond
Series 521
6.00%, 5/15/21 | | NZD | | | 25,510 | | | $ | 24,966,523 | |
| | | | | | | | | | |
| | | |
Norway – 4.5% | | | | | | | | | | |
Norway Government Bond
Series 474
3.75%, 5/25/21 | | NOK | | | 125,510 | | | | 25,312,718 | |
| | | | | | | | | | |
| | | |
Sweden – 4.2% | | | | | | | | | | |
Sweden Government Bond
Series 1054
3.50%, 6/01/22 | | SEK | | | 132,275 | | | | 23,412,815 | |
| | | | | | | | | | |
| | | |
Total Governments - Treasuries
(cost $98,779,563) | | | | | | | | | 98,895,825 | |
| | | | | | | | | | |
| | | |
Company | | | | Shares | | | | |
COMMON STOCKS – 8.8% | | | | | | | | | | |
Financials – 1.7% | | | | | | | | | | |
Capital Markets – 0.1% | | | | | | | | | | |
Bank of New York Mellon Corp. (The) | | | | | 3,600 | | | | 86,184 | |
BlackRock, Inc. – Class A | | | | | 500 | | | | 98,520 | |
Charles Schwab Corp. (The) | | | | | 4,900 | | | | 64,190 | |
Deutsche Bank AG (REG) | | | | | 1,890 | | | | 83,367 | |
Franklin Resources, Inc. | | | | | 700 | | | | 92,414 | |
Goldman Sachs Group, Inc. (The) | | | | | 900 | | | | 106,011 | |
Macquarie Group Ltd. | | | | | 1,080 | | | | 36,971 | |
Morgan Stanley | | | | | 4,800 | | | | 80,976 | |
Nomura Holdings, Inc. | | | | | 7,200 | | | | 29,957 | |
State Street Corp. | | | | | 2,100 | | | | 93,324 | |
UBS AG(b) | | | | | 12,140 | | | | 190,374 | |
| | | | | | | | | | |
| | | | | | | | | 962,288 | |
| | | | | | | | | | |
Commercial Banks – 0.7% | | | | | | | | | | |
Australia & New Zealand Banking Group Ltd. | | | | | 5,280 | | | | 134,372 | |
Banco Bilbao Vizcaya Argentaria SA | | | | | 10,600 | | | | 89,936 | |
Banco Espirito Santo SA(b) | | | | | 3,960 | | | | 3,956 | |
Banco Santander SA | | | | | 19,400 | | | | 149,449 | |
Bank Leumi Le-Israel BM(b) | | | | | 5,800 | | | | 19,579 | |
Bank of Montreal | | | | | 1,300 | | | | 78,090 | |
Bank of Nova Scotia | | | | | 2,200 | | | | 124,025 | |
Barclays PLC | | | | | 30,630 | | | | 121,489 | |
BB&T Corp. | | | | | 2,800 | | | | 78,876 | |
BNP Paribas SA | | | | | 1,900 | | | | 106,326 | |
BOC Hong Kong Holdings Ltd. | | | | | 7,500 | | | | 23,023 | |
CaixaBank | | | | | 8,480 | | | | 32,428 | |
Canadian Imperial Bank of Commerce | | | | | 800 | | | | 64,590 | |
Commonwealth Bank of Australia | | | | | 3,140 | | | | 195,740 | |
| | | | |
| ALLIANCEBERNSTEIN GLOBAL RISK ALLOCATION FUND • | | | 15 | |
Portfolio of Investments
| | | | | | | | | | |
| Company | | | |
Shares | | | U.S. $ Value | |
| | | | | |
| | | | | | | | | | |
Credit Agricole SA(b) | | | | | 7,190 | | | $ | 54,636 | |
Danske Bank A/S(b) | | | | | 1,460 | | | | 25,026 | |
DBS Group Holdings Ltd. | | | | | 4,000 | | | | 47,337 | |
DnB ASA | | | | | 2,350 | | | | 29,219 | |
Erste Group Bank AG(b) | | | | | 430 | | | | 12,664 | |
Hang Seng Bank Ltd. | | | | | 1,500 | | | | 22,863 | |
HSBC Holdings PLC | | | | | 35,770 | | | | 365,288 | |
Intesa Sanpaolo SpA | | | | | 20,450 | | | | 34,460 | |
KBC Groep NV | | | | | 510 | | | | 15,384 | |
Lloyds Banking Group PLC(b) | | | | | 177,660 | | | | 132,668 | |
Mitsubishi UFJ Financial Group, Inc. | | | | | 25,100 | | | | 115,445 | |
Mizuho Financial Group, Inc. | | | | | 45,000 | | | | 72,551 | |
National Australia Bank Ltd. | | | | | 4,410 | | | | 111,951 | |
Natixis | | | | | 9,720 | | | | 31,204 | |
Nordea Bank AB | | | | | 5,190 | | | | 47,584 | |
Oversea-Chinese Banking Corp., Ltd. | | | | | 5,000 | | | | 38,530 | |
PNC Financial Services Group, Inc. | | | | | 1,500 | | | | 84,210 | |
Raiffeisen Bank International AG | | | | | 230 | | | | 9,479 | |
Resona Holdings, Inc. | | | | | 5,000 | | | | 20,989 | |
Royal Bank of Canada | | | | | 2,800 | | | | 166,024 | |
Royal Bank of Scotland Group PLC(b) | | | | | 22,530 | | | | 106,754 | |
Skandinaviska Enskilda Banken AB | | | | | 3,110 | | | | 25,063 | |
Societe Generale SA(b) | | | | | 1,710 | | | | 61,988 | |
Standard Chartered PLC | | | | | 5,030 | | | | 117,325 | |
Sumitomo Mitsui Financial Group, Inc. | | | | | 2,600 | | | | 84,163 | |
Sumitomo Mitsui Trust Holdings, Inc. | | | | | 8,000 | | | | 24,392 | |
Svenska Handelsbanken AB | | | | | 970 | | | | 34,522 | |
Swedbank AB | | | | | 1,620 | | | | 29,958 | |
Toronto-Dominion Bank (The) | | | | | 1,800 | | | | 150,364 | |
UniCredit SpA(b) | | | | | 7,980 | | | | 37,195 | |
United Overseas Bank Ltd. | | | | | 3,000 | | | | 45,993 | |
US Bancorp | | | | | 3,700 | | | | 119,362 | |
Wells Fargo & Co. | | | | | 10,100 | | | | 333,401 | |
Westpac Banking Corp. | | | | | 6,020 | | | | 160,341 | |
| | | | | | | | | | |
| | | | | | | | | 3,990,212 | |
| | | | | | | | | | |
Consumer Finance – 0.1% | | | | | | | | | | |
American Express Co. | | | | | 2,000 | | | | 111,800 | |
Capital One Financial Corp. | | | | | 1,500 | | | | 86,400 | |
Discover Financial Services | | | | | 2,200 | | | | 91,542 | |
| | | | | | | | | | |
| | | | | | | | | 289,742 | |
| | | | | | | | | | |
Diversified Financial Services – 0.2% | | | | | | | | | | |
Bank of America Corp. | | | | | 21,200 | | | | 209,032 | |
Citigroup, Inc. | | | | | 5,800 | | | | 200,506 | |
CME Group, Inc. – Class A | | | | | 1,500 | | | | 82,905 | |
Exor SpA | | | | | 1,050 | | | | 25,989 | |
Groupe Bruxelles Lambert SA | | | | | 250 | | | | 19,469 | |
Hong Kong Exchanges and Clearing Ltd. | | | | | 2,000 | | | | 31,860 | |
| | |
| 16 | | • ALLIANCEBERNSTEIN GLOBAL RISK ALLOCATION FUND |
Portfolio of Investments
| | | | | | | | | | |
| Company | | | |
Shares | | | U.S. $ Value | |
| | | | | |
| | | | | | | | | | |
ING Groep NV(b) | | | | | 7,540 | | | $ | 68,131 | |
Investor AB | | | | | 1,180 | | | | 27,360 | |
JPMorgan Chase & Co. | | | | | 7,600 | | | | 312,208 | |
ORIX Corp. | | | | | 210 | | | | 21,160 | |
| | | | | | | | | | |
| | | | | | | | | 998,620 | |
| | | | | | | | | | |
Insurance – 0.4% | | | | | | | | | | |
ACE Ltd. | | | | | 1,100 | | | | 87,153 | |
Aegon NV | | | | | 5,200 | | | | 29,905 | |
Aflac, Inc. | | | | | 1,800 | | | | 95,382 | |
AIA Group Ltd. | | | | | 20,000 | | | | 78,166 | |
Allianz SE | | | | | 900 | | | | 117,081 | |
Allstate Corp. (The) | | | | | 2,100 | | | | 85,008 | |
American International Group, Inc.(b) | | | | | 2,400 | | | | 79,512 | |
AMP Ltd. | | | | | 13,880 | | | | 66,676 | |
AON PLC | | | | | 1,700 | | | | 96,560 | |
Assicurazioni Generali SpA | | | | | 2,300 | | | | 38,637 | |
Berkshire Hathaway, Inc.(b) | | | | | 1,800 | | | | 158,544 | |
Chubb Corp. (The) | | | | | 1,100 | | | | 84,689 | |
Dai-ichi Life Insurance Co., Ltd. (The) | | | | | 82 | | | | 93,515 | |
Great-West Lifeco, Inc. | | | | | 2,300 | | | | 54,458 | |
Manulife Financial Corp. | | | | | 4,200 | | | | 54,035 | |
Marsh & McLennan Cos., Inc. | | | | | 2,600 | | | | 91,572 | |
MetLife, Inc. | | | | | 2,600 | | | | 86,294 | |
MS&AD Insurance Group Holdings | | | | | 1,200 | | | | 20,920 | |
Muenchener Rueckversicherungs AG | | | | | 520 | | | | 88,800 | |
NKSJ Holdings, Inc. | | | | | 1,000 | | | | 19,047 | |
Power Financial Corp. | | | | | 2,100 | | | | 56,044 | |
Prudential Financial, Inc. | | | | | 1,500 | | | | 78,180 | |
Prudential PLC | | | | | 8,680 | | | | 126,180 | |
QBE Insurance Group Ltd. | | | | | 4,590 | | | | 52,447 | |
Sampo Oyj | | | | | 830 | | | | 26,527 | |
Sony Financial Holdings, Inc. | | | | | 1,272 | | | | 21,943 | |
Sun Life Financial, Inc. | | | | | 1,700 | | | | 46,532 | |
Suncorp Group Ltd. | | | | | 6,670 | | | | 67,511 | |
T&D Holdings, Inc. | | | | | 2,050 | | | | 22,148 | |
Tokio Marine Holdings, Inc. | | | | | 1,400 | | | | 36,053 | |
Travelers Cos., Inc. (The) | | | | | 1,300 | | | | 92,066 | |
Vienna Insurance Group AG Wiener Versicherung Gruppe | | | | | 110 | | | | 5,226 | |
Zurich Insurance Group AG(b) | | | | | 500 | | | | 127,723 | |
| | | | | | | | | | |
| | | | | | | | | 2,284,534 | |
| | | | | | | | | | |
Real Estate Investment Trusts (REITs) – 0.1% | | | | | | | | | | |
American Tower Corp. | | | | | 1,200 | | | | 89,916 | |
General Growth Properties, Inc. | | | | | 4,500 | | | | 87,165 | |
HCP, Inc. | | | | | 2,000 | | | | 90,100 | |
Link REIT (The) | | | | | 4,500 | | | | 24,584 | |
Public Storage | | | | | 700 | | | | 98,448 | |
Simon Property Group, Inc. | | | | | 600 | | | | 91,278 | |
| | | | |
| ALLIANCEBERNSTEIN GLOBAL RISK ALLOCATION FUND • | | | 17 | |
Portfolio of Investments
| | | | | | | | | | |
| Company | | | |
Shares | | | U.S. $ Value | |
| | | | | |
| | | | | | | | | | |
Unibail-Rodamco SE | | | | | 260 | | | $ | 61,085 | |
Ventas, Inc. | | | | | 1,400 | | | | 89,110 | |
Westfield Group | | | | | 6,080 | | | | 66,189 | |
| | | | | | | | | | |
| | | | | | | | | 697,875 | |
| | | | | | | | | | |
Real Estate Management & Development – 0.1% | | | | | | | | | | |
Brookfield Asset Management, Inc. | | | | | 1,500 | | | | 52,217 | |
CapitaLand Ltd. | | | | | 7,000 | | | | 20,230 | |
Cheung Kong Holdings Ltd. | | | | | 3,000 | | | | 45,694 | |
City Developments Ltd. | | | | | 2,000 | | | | 19,190 | |
Daito Trust Construction Co., Ltd. | | | | | 200 | | | | 19,432 | |
Daiwa House Industry Co., Ltd. | | | | | 2,000 | | | | 30,664 | |
Global Logistic Properties Ltd. | | | | | 9,000 | | | | 20,706 | |
Hang Lung Properties Ltd. | | | | | 7,000 | | | | 25,596 | |
Henderson Land Development Co., Ltd. | | | | | 3,000 | | | | 21,359 | |
Mitsubishi Estate Co., Ltd. | | | | | 2,000 | | | | 38,712 | |
Mitsui Fudosan Co., Ltd. | | | | | 2,000 | | | | 41,923 | |
New World Development Co., Ltd. | | | | | 14,000 | | | | 22,029 | |
Sino Land Co., Ltd. | | | | | 12,000 | | | | 21,636 | |
Sumitomo Realty & Development Co., Ltd. | | | | | 1,000 | | | | 27,348 | |
Sun Hung Kai Properties Ltd. | | | | | 3,000 | | | | 43,927 | |
Swire Pacific Ltd. | | | | | 2,000 | | | | 24,576 | |
Wharf Holdings Ltd. | | | | | 3,000 | | | | 23,197 | |
| | | | | | | | | | |
| | | | | | | | | 498,436 | |
| | | | | | | | | | |
| | | | | | | | | 9,721,707 | |
| | | | | | | | | | |
Information Technology – 1.1% | | | | | | | | | | |
Communications Equipment – 0.1% | | | | | | | | | | |
Cisco Systems, Inc. | | | | | 10,700 | | | | 202,337 | |
Motorola Solutions, Inc. | | | | | 1,700 | | | | 92,565 | |
Nokia Oyj | | | | | 7,380 | | | | 24,248 | |
QUALCOMM, Inc. | | | | | 3,400 | | | | 216,308 | |
Telefonaktiebolaget LM Ericsson – Class B | | | | | 5,930 | | | | 55,586 | |
| | | | | | | | | | |
| | | | | | | | | 591,044 | |
| | | | | | | | | | |
Computers & Peripherals – 0.3% | | | | | | | | | | |
Apple, Inc. | | | | | 1,900 | | | | 1,112,032 | |
Dell, Inc. | | | | | 9,100 | | | | 87,724 | |
EMC Corp./MA(b) | | | | | 4,100 | | | | 101,762 | |
Fujitsu Ltd. | | | | | 6,000 | | | | 22,809 | |
Hewlett-Packard Co. | | | | | 6,100 | | | | 79,239 | |
Toshiba Corp. | | | | | 8,000 | | | | 27,396 | |
| | | | | | | | | | |
| | | | | | | | | 1,430,962 | |
| | | | | | | | | | |
Electronic Equipment, Instruments &
Components – 0.1% | | | | | | | | | | |
Corning, Inc. | | | | | 6,500 | | | | 79,495 | |
Fujifilm Holdings Corp. | | | | | 1,300 | | | | 23,941 | |
Hexagon AB | | | | | 590 | | | | 14,626 | |
Hitachi Ltd. | | | | | 9,000 | | | | 52,158 | |
Hoya Corp. | | | | | 1,100 | | | | 21,162 | |
| | |
| 18 | | • ALLIANCEBERNSTEIN GLOBAL RISK ALLOCATION FUND |
Portfolio of Investments
| | | | | | | | | | |
| Company | | | |
Shares | | | U.S. $ Value | |
| | | | | |
| | | | | | | | | | |
Keyence Corp. | | | | | 100 | | | $ | 27,994 | |
Kyocera Corp. | | | | | 300 | | | | 27,762 | |
Murata Manufacturing Co., Ltd. | | | | | 400 | | | | 22,755 | |
TDK Corp. | | | | | 500 | | | | 19,659 | |
TE Connectivity Ltd. | | | | | 2,400 | | | | 84,456 | |
| | | | | | | | | | |
| | | | | | | | | 374,008 | |
| | | | | | | | | | |
Internet Software & Services – 0.1% | | | | | | | | | | |
eBay, Inc.(b) | | | | | 2,300 | | | | 121,486 | |
Facebook, Inc.(b) | | | | | 3,750 | | | | 105,000 | |
Google, Inc. – Class A(b) | | | | | 500 | | | | 349,185 | |
Yahoo! Japan Corp. | | | | | 58 | | | | 19,539 | |
Yahoo!, Inc.(b) | | | | | 5,600 | | | | 105,112 | |
| | | | | | | | | | |
| | | | | | | | | 700,322 | |
| | | | | | | | | | |
IT Services – 0.2% | | | | | | | | | | |
Accenture PLC | | | | | 1,300 | | | | 88,296 | |
Amadeus IT Holding SA | | | | | 1,260 | | | | 29,434 | |
Automatic Data Processing, Inc. | | | | | 1,500 | | | | 85,140 | |
CGI Group, Inc.(b) | | | �� | | 1,000 | | | | 22,953 | |
Cognizant Technology Solutions Corp. – Class A(b) | | | | | 1,300 | | | | 87,399 | |
International Business Machines Corp. | | | | | 2,200 | | | | 418,154 | |
Mastercard, Inc. – Class A | | | | | 200 | | | | 97,736 | |
NTT Data Corp. | | | | | 7 | | | | 20,356 | |
Visa, Inc. – Class A | | | | | 1,000 | | | | 149,710 | |
| | | | | | | | | | |
| | | | | | | | | 999,178 | |
| | | | | | | | | | |
Office Electronics – 0.0% | | | | | | | | | | |
Canon, Inc. | | | | | 2,200 | | | | 77,833 | |
Ricoh Co., Ltd. | | | | | 2,000 | | | | 18,645 | |
| | | | | | | | | | |
| | | | | | | | | 96,478 | |
| | | | | | | | | | |
Semiconductors & Semiconductor
Equipment – 0.1% | | | | | | | | | | |
ASM Pacific Technology Ltd. | | | | | 1,000 | | | | 11,673 | |
ASML Holding NV | | | | | 639 | | | | 39,963 | |
Broadcom Corp. – Class A(b) | | | | | 2,600 | | | | 84,188 | |
Infineon Technologies AG | | | | | 6,350 | | | | 48,727 | |
Intel Corp. | | | | | 9,900 | | | | 193,743 | |
Mellanox Technologies Ltd.(b) | | | | | 110 | | | | 8,352 | |
Texas Instruments, Inc. | | | | | 3,100 | | | | 91,357 | |
Tokyo Electron Ltd. | | | | | 500 | | | | 22,399 | |
| | | | | | | | | | |
| | | | | | | | | 500,402 | |
| | | | | | | | | | |
Software – 0.2% | | | | | | | | | | |
Adobe Systems, Inc.(b) | | | | | 2,800 | | | | 96,908 | |
Dassault Systemes SA | | | | | 540 | | | | 61,163 | |
Intuit, Inc. | | | | | 1,500 | | | | 89,865 | |
Microsoft Corp. | | | | | 15,100 | | | | 401,962 | |
Nexon Co., Ltd.(b) | | | | | 1,700 | | | | 19,108 | |
Nintendo Co., Ltd. | | | | | 200 | | | | 24,035 | |
| | | | |
| ALLIANCEBERNSTEIN GLOBAL RISK ALLOCATION FUND • | | | 19 | |
Portfolio of Investments
| | | | | | | | | | |
| Company | | | |
Shares | | | U.S. $ Value | |
| | | | | |
| | | | | | | | | | |
Oracle Corp. | | | | | 8,000 | | | $ | 256,800 | |
Oracle Corp. Japan | | | | | 500 | | | | 21,039 | |
Salesforce.com, Inc.(b) | | | | | 600 | | | | 94,602 | |
SAP AG | | | | | 1,810 | | | | 141,323 | |
VMware, Inc. – Class A(b) | | | | | 1,000 | | | | 90,950 | |
| | | | | | | | | | |
| | | | | | | | | 1,297,755 | |
| | | | | | | | | | |
| | | | | | | | | 5,990,149 | |
| | | | | | | | | | |
Consumer Discretionary – 1.0% | | | | | | | | | | |
Auto Components – 0.1% | | | | | | | | | | |
Aisin Seiki Co., Ltd. | | | | | 800 | | | | 23,764 | |
Bridgestone Corp. | | | | | 1,300 | | | | 31,509 | |
Cie Generale des Etablissements Michelin – Class B | | | | | 660 | | | | 61,512 | |
Denso Corp. | | | | | 1,000 | | | | 33,057 | |
Johnson Controls, Inc. | | | | | 3,400 | | | | 93,636 | |
Magna International, Inc. (Toronto) – Class A | | | | | 900 | | | | 41,994 | |
Nokian Renkaat OYJ | | | | | 310 | | | | 12,960 | |
Toyota Industries Corp. | | | | | 800 | | | | 24,052 | |
| | | | | | | | | | |
| | | | | | | | | 322,484 | |
| | | | | | | | | | |
Automobiles – 0.2% | | | | | | | | | | |
Bayerische Motoren Werke AG | | | | | 1,080 | | | | 95,912 | |
Daihatsu Motor Co., Ltd. | | | | | 1,000 | | | | 17,806 | |
Daimler AG | | | | | 1,790 | | | | 88,531 | |
Ford Motor Co. | | | | | 8,600 | | | | 98,470 | |
Fuji Heavy Industries Ltd. | | | | | 3,000 | | | | 33,827 | |
General Motors Co.(b) | | | | | 3,600 | | | | 93,168 | |
Honda Motor Co., Ltd. | | | | | 3,200 | | | | 106,660 | |
Isuzu Motors Ltd. | | | | | 4,000 | | | | 23,552 | |
Nissan Motor Co., Ltd. | | | | | 4,900 | | | | 47,758 | |
Suzuki Motor Corp. | | | | | 1,000 | | | | 23,814 | |
Toyota Motor Corp. | | | | | 5,400 | | | | 232,508 | |
Volkswagen AG | | | | | 490 | | | | 99,805 | |
Volkswagen AG (Preference Shares) | | | | | 250 | | | | 54,196 | |
| | | | | | | | | | |
| | | | | | | | | 1,016,007 | |
| | | | | | | | | | |
Distributors – 0.0% | | | | | | | | | | |
Jardine Cycle & Carriage Ltd. | | | | | 1,000 | | | | 40,021 | |
Li & Fung Ltd. | | | | | 8,000 | | | | 13,167 | |
| | | | | | | | | | |
| | | | | | | | | 53,188 | |
| | | | | | | | | | |
Hotels, Restaurants & Leisure – 0.1% | | | | | | | | | | |
Carnival Corp. | | | | | 2,300 | | | | 88,918 | |
Compass Group PLC | | | | | 10,950 | | | | 126,549 | |
Crown Ltd. | | | | | 3,390 | | | | 36,286 | |
Galaxy Entertainment Group Ltd.(b) | | | | | 7,000 | | | | 26,633 | |
Las Vegas Sands Corp. | | | | | 1,900 | | | | 88,635 | |
McDonald’s Corp. | | | | | 2,000 | | | | 174,080 | |
OPAP SA | | | | | 430 | | | | 2,797 | |
Oriental Land Co., Ltd./Japan | | | | | 200 | | | | 25,745 | |
Sands China Ltd. | | | | | 6,000 | | | | 25,578 | |
| | |
| 20 | | • ALLIANCEBERNSTEIN GLOBAL RISK ALLOCATION FUND |
Portfolio of Investments
| | | | | | | | | | |
| Company | | | |
Shares | | | U.S. $ Value | |
| | | | | |
| | | | | | | | | | |
SKYCITY Entertainment Group Ltd. | | | | | 1,230 | | | $ | 3,778 | |
Starbucks Corp. | | | | | 1,800 | | | | 93,366 | |
Wynn Macau Ltd. | | | | | 8,000 | | | | 22,804 | |
Yum! Brands, Inc. | | | | | 1,300 | | | | 87,204 | |
| | | | | | | | | | |
| | | | | | | | | 802,373 | |
| | | | | | | | | | |
Household Durables – 0.0% | | | | | | | | | | |
Electrolux AB | | | | | 780 | | | | 20,448 | |
Panasonic Corp. | | | | | 4,300 | | | | 21,205 | |
Sekisui House Ltd. | | | | | 2,000 | | | | 18,804 | |
Sony Corp. | | | | | 2,000 | | | | 19,486 | |
| | | | | | | | | | |
| | | | | | | | | 79,943 | |
| | | | | | | | | | |
Internet & Catalog Retail – 0.0% | | | | | | | | | | |
Amazon.com, Inc.(b) | | | | | 700 | | | | 176,435 | |
priceline.com, Inc.(b) | | | | | 100 | | | | 66,316 | |
Rakuten, Inc. | | | | | 2,299 | | | | 19,382 | |
| | | | | | | | | | |
| | | | | | | | | 262,133 | |
| | | | | | | | | | |
Leisure Equipment & Products – 0.0% | | | | | | | | | | |
Nikon Corp. | | | | | 900 | | | | 25,077 | |
Shimano, Inc. | | | | | 300 | | | | 19,872 | |
| | | | | | | | | | |
| | | | | | | | | 44,949 | |
| | | | | | | | | | |
Media – 0.3% | | | | | | | | | | |
British Sky Broadcasting Group PLC | | | | | 8,000 | | | | 97,358 | |
CBS Corp. – Class B | | | | | 2,600 | | | | 93,548 | |
Comcast Corp. | | | | | 2,500 | | | | 90,100 | |
Comcast Corp. – Class A | | | | | 4,200 | | | | 156,156 | |
Dentsu, Inc. | | | | | 900 | | | | 22,053 | |
DIRECTV(b) | | | | | 1,700 | | | | 84,490 | |
Jupiter Telecommunications Co., Ltd. | | | | | 21 | | | | 27,462 | |
Liberty Global, Inc.(b) | | | | | 1,400 | | | | 78,456 | |
McGraw-Hill Cos., Inc. (The) | | | | | 800 | | | | 42,488 | |
News Corp. – Class A | | | | | 3,500 | | | | 86,240 | |
News Corp. – Class B | | | | | 3,500 | | | | 88,270 | |
Reed Elsevier NV | | | | | 2,210 | | | | 31,960 | |
Thomson Reuters Corp. | | | | | 1,800 | | | | 49,559 | |
Time Warner Cable, Inc. – Class A | | | | | 900 | | | | 85,401 | |
Time Warner, Inc. | | | | | 2,000 | | | | 94,600 | |
Viacom, Inc. – Class B | | | | | 1,600 | | | | 82,576 | |
Walt Disney Co. (The) | | | | | 3,300 | | | | 163,878 | |
WPP PLC | | | | | 4,410 | | | | 60,549 | |
| | | | | | | | | | |
| | | | | | | | | 1,435,144 | |
| | | | | | | | | | |
Multiline Retail – 0.1% | | | | | | | | | | |
Dollar General Corp.(b) | | | | | 1,900 | | | | 95,000 | |
Macy’s, Inc. | | | | | 2,200 | | | | 85,140 | |
PPR | | | | | 330 | | | | 61,615 | |
Target Corp. | | | | | 1,400 | | | | 88,382 | |
| | | | | | | | | | |
| | | | | | | | | 330,137 | |
| | | | | | | | | | |
| | | | |
| ALLIANCEBERNSTEIN GLOBAL RISK ALLOCATION FUND • | | | 21 | |
Portfolio of Investments
| | | | | | | | | | |
| Company | | | |
Shares | | | U.S. $ Value | |
| | | | | |
| | | | | | | | | | |
Specialty Retail – 0.1% | | | | | | | | | | |
Fast Retailing Co., Ltd. | | | | | 100 | | | $ | 22,808 | |
Gap, Inc. (The) | | | | | 2,400 | | | | 82,704 | |
Hennes & Mauritz AB – Class B | | | | | 1,870 | | | | 60,739 | |
Home Depot, Inc. (The) | | | | | 3,000 | | | | 195,210 | |
Inditex SA | | | | | 430 | | | | 59,031 | |
Lowe’s Cos., Inc. | | | | | 2,700 | | | | 97,443 | |
TJX Cos., Inc. | | | | | 2,100 | | | | 93,114 | |
| | | | | | | | | | |
| | | | | | | | | 611,049 | |
| | | | | | | | | | |
Textiles, Apparel & Luxury Goods – 0.1% | | | | | | | | | | |
Christian Dior SA | | | | | 400 | | | | 64,698 | |
Cie Financiere Richemont SA | | | | | 1,920 | | | | 148,193 | |
Coach, Inc. | | | | | 1,600 | | | | 92,544 | |
Luxottica Group SpA | | | | | 770 | | | | 31,667 | |
LVMH Moet Hennessy Louis Vuitton SA | | | | | 500 | | | | 87,795 | |
NIKE, Inc. – Class B | | | | | 900 | | | | 87,732 | |
VF Corp. | | | | | 500 | | | | 80,255 | |
| | | | | | | | | | |
| | | | | | | | | 592,884 | |
| | | | | | | | | | |
| | | | | | | | | 5,550,291 | |
| | | | | | | | | | |
Consumer Staples – 1.0% | | | | | | | | | | |
Beverages – 0.2% | | | | | | | | | | |
Anheuser-Busch InBev NV | | | | | 1,580 | | | | 138,744 | |
Asahi Group Holdings Ltd. | | | | | 900 | | | | 20,254 | |
Carlsberg A/S | | | | | 210 | | | | 20,451 | |
Coca Cola Hellenic Bottling Co. SA(b) | | | | | 400 | | | | 9,302 | |
Coca-Cola Amatil Ltd. | | | | | 2,360 | | | | 33,860 | |
Coca-Cola Co. (The) | | | | | 8,000 | | | | 303,360 | |
Diageo PLC | | | | | 4,930 | | | | 147,048 | |
Heineken Holding NV | | | | | 750 | | | | 40,640 | |
Heineken NV | | | | | 610 | | | | 40,259 | |
Kirin Holdings Co., Ltd. | | | | | 2,000 | | | | 24,588 | |
PepsiCo, Inc. | | | | | 3,100 | | | | 217,651 | |
Pernod-Ricard SA | | | | | 510 | | | | 57,786 | |
SABMiller PLC | | | | | 2,820 | | | | 127,864 | |
| | | | | | | | | | |
| | | | | | | | | 1,181,807 | |
| | | | | | | | | | |
Food & Staples Retailing – 0.2% | | | | | | | | | | |
Aeon Co., Ltd. | | | | | 2,000 | | | | 22,397 | |
Carrefour SA | | | | | 1,310 | | | | 32,332 | |
Colruyt SA | | | | | 330 | | | | 15,191 | |
Costco Wholesale Corp. | | | | | 900 | | | | 93,591 | |
CVS Caremark Corp. | | | | | 2,600 | | | | 120,926 | |
Jeronimo Martins SGPS SA | | | | | 430 | | | | 8,016 | |
Lawson, Inc. | | | | | 300 | | | | 20,309 | |
Loblaw Cos. Ltd. | | | | | 1,500 | | | | 50,541 | |
Seven & I Holdings Co., Ltd. | | | | | 1,500 | | | | 43,714 | |
Sysco Corp. | | | | | 2,800 | | | | 88,620 | |
Tesco PLC | | | | | 20,310 | | | | 105,952 | |
| | |
| 22 | | • ALLIANCEBERNSTEIN GLOBAL RISK ALLOCATION FUND |
Portfolio of Investments
| | | | | | | | | | |
| Company | | | |
Shares | | | U.S. $ Value | |
| | | | | |
| | | | | | | | | | |
Wal-Mart Stores, Inc. | | | | | 3,700 | | | $ | 266,474 | |
Walgreen Co. | | | | | 2,500 | | | | 84,775 | |
Wesfarmers Ltd. | | | | | 1,980 | | | | 73,442 | |
Whole Foods Market, Inc. | | | | | 600 | | | | 56,016 | |
Woolworths Ltd. | | | | | 2,420 | | | | 73,984 | |
| | | | | | | | | | |
| | | | | | | | | 1,156,280 | |
| | | | | | | | | | |
Food Products – 0.2% | | | | | | | | | | |
Ajinomoto Co., Inc. | | | | | 1,000 | | | | 14,301 | |
Archer-Daniels-Midland Co. | | | | | 3,100 | | | | 82,770 | |
Danone SA | | | | | 1,140 | | | | 72,357 | |
General Mills, Inc. | | | | | 2,200 | | | | 90,178 | |
Kellogg Co. | | | | | 1,700 | | | | 94,282 | |
Kerry Group PLC | | | | | 300 | | | | 15,718 | |
Kraft Foods Group, Inc.(b) | | | | | 1,900 | | | | 85,918 | |
Mondelez International, Inc. | | | | | 3,300 | | | | 85,437 | |
Nestle SA | | | | | 6,500 | | | | 425,474 | |
Saputo, Inc. | | | | | 600 | | | | 27,809 | |
Unilever NV | | | | | 3,210 | | | | 121,816 | |
Unilever PLC | | | | | 3,190 | | | | 122,401 | |
Wilmar International Ltd. | | | | | 7,000 | | | | 18,278 | |
Yakult Honsha Co., Ltd. | | | | | 500 | | | | 21,971 | |
| | | | | | | | | | |
| | | | | | | | | 1,278,710 | |
| | | | | | | | | | |
Household Products – 0.1% | | | | | | | | | | |
Colgate-Palmolive Co. | | | | | 900 | | | | 97,650 | |
Kimberly-Clark Corp. | | | | | 1,000 | �� | | | 85,720 | |
Procter & Gamble Co. (The) | | | | | 5,400 | | | | 377,082 | |
Reckitt Benckiser Group PLC | | | | | 2,040 | | | | 128,315 | |
Svenska Cellulosa AB – Class B | | | | | 1,450 | | | | 29,378 | |
Unicharm Corp. | | | | | 400 | | | | 20,448 | |
| | | | | | | | | | |
| | | | | | | | | 738,593 | |
| | | | | | | | | | |
Personal Products – 0.1% | | | | | | | | | | |
Beiersdorf AG | | | | | 960 | | | | 75,290 | |
Estee Lauder Cos., Inc. (The) – Class A | | | | | 1,400 | | | | 81,550 | |
Kao Corp. | | | | | 1,000 | | | | 27,497 | |
L’Oreal SA | | | | | 480 | | | | 65,183 | |
| | | | | | | | | | |
| | | | | | | | | 249,520 | |
| | | | | | | | | | |
Tobacco – 0.2% | | | | | | | | | | |
Altria Group, Inc. | | | | | 4,000 | | | | 135,240 | |
British American Tobacco PLC | | | | | 3,850 | | | | 202,244 | |
Japan Tobacco, Inc. | | | | | 1,773 | | | | 53,163 | |
Philip Morris International, Inc. | | | | | 3,400 | | | | 305,592 | |
Reynolds American, Inc. | | | | | 2,100 | | | | 91,812 | |
Swedish Match AB | | | | | 320 | | | | 11,269 | |
| | | | | | | | | | |
| | | | | | | | | 799,320 | |
| | | | | | | | | | |
| | | | | | | | | 5,404,230 | |
| | | | | | | | | | |
| | | | |
| ALLIANCEBERNSTEIN GLOBAL RISK ALLOCATION FUND • | | | 23 | |
Portfolio of Investments
| | | | | | | | | | |
| Company | | | |
Shares | | | U.S. $ Value | |
| | | | | |
| | | | | | | | | | |
Industrials – 1.0% | | | | | | | | | | |
Aerospace & Defense – 0.2% | | | | | | | | | | |
BAE Systems PLC | | | | | 13,330 | | | $ | 69,952 | |
Boeing Co. (The) | | | | | 1,400 | | | | 103,992 | |
European Aeronautic Defence and Space Co. NV | | | | | 1,650 | | | | 55,622 | |
General Dynamics Corp. | | | | | 1,300 | | | | 86,450 | |
Honeywell International, Inc. | | | | | 1,500 | | | | 91,995 | |
Lockheed Martin Corp. | | | | | 1,000 | | | | 93,300 | |
Northrop Grumman Corp. | | | | | 1,300 | | | | 86,710 | |
Precision Castparts Corp. | | | | | 500 | | | | 91,695 | |
Raytheon Co. | | | | | 1,600 | | | | 91,408 | |
Rolls-Royce Holdings PLC(b) | | | | | 8,550 | | | | 122,118 | |
Safran SA | | | | | 1,300 | | | | 53,300 | |
Singapore Technologies Engineering Ltd. | | | | | 7,000 | | | | 21,037 | |
United Technologies Corp. | | | | | 1,700 | | | | 136,187 | |
| | | | | | | | | | |
| | | | | | | | | 1,103,766 | |
| | | | | | | | | | |
Air Freight & Logistics – 0.1% | | | | | | | | | | |
Deutsche Post AG | | | | | 3,970 | | | | 82,460 | |
FedEx Corp. | | | | | 1,000 | | | | 89,530 | |
United Parcel Service, Inc. – Class B | | | | | 1,400 | | | | 102,354 | |
Yamato Holdings Co., Ltd. | | | | | 1,400 | | | | 21,014 | |
| | | | | | | | | | |
| | | | | | | | | 295,358 | |
| | | | | | | | | | |
Airlines – 0.0% | | | | | | | | | | |
All Nippon Airways Co., Ltd. | | | | | 11,000 | | | | 23,634 | |
Japan Airlines Co., Ltd.(b) | | | | | 500 | | | | 22,988 | |
Singapore Airlines Ltd. | | | | | 2,000 | | | | 17,607 | |
| | | | | | | | | | |
| | | | | | | | | 64,229 | |
| | | | | | | | | | |
Building Products – 0.0% | | | | | | | | | | |
Asahi Glass Co., Ltd. | | | | | 3,000 | | | | 22,937 | |
Assa Abloy AB | | | | | 800 | | | | 28,984 | |
Cie de St-Gobain | | | | | 1,630 | | | | 65,107 | |
Daikin Industries Ltd. | | | | | 900 | | | | 28,377 | |
LIXIL Group Corp. | | | | | 1,000 | | | | 21,237 | |
| | | | | | | | | | |
| | | | | | | | | 166,642 | |
| | | | | | | | | | |
Commercial Services & Supplies – 0.0% | | | | | | | | | | |
Brambles Ltd. | | | | | 9,010 | | | | 68,093 | |
Secom Co., Ltd. | | | | | 400 | | | | 20,529 | |
Waste Management, Inc. | | | | | 2,700 | | | | 87,939 | |
| | | | | | | | | | |
| | | | | | | | | 176,561 | |
| | | | | | | | | | |
Construction & Engineering – 0.0% | | | | | | | | | | |
JGC Corp. | | | | | 1,000 | | | | 33,117 | |
Vinci SA | | | | | 1,260 | | | | 55,689 | |
| | | | | | | | | | |
| | | | | | | | | 88,806 | |
| | | | | | | | | | |
Electrical Equipment – 0.1% | | | | | | | | | | |
ABB Ltd. (REG)(b) | | | | | 8,240 | | | | 160,670 | |
Emerson Electric Co. | | | | | 1,800 | | | | 90,414 | |
| | |
| 24 | | • ALLIANCEBERNSTEIN GLOBAL RISK ALLOCATION FUND |
Portfolio of Investments
| | | | | | | | | | |
| Company | | | |
Shares | | | U.S. $ Value | |
| | | | | |
| | | | | | | | | | |
Mitsubishi Electric Corp. | | | | | 4,000 | | | $ | 31,254 | |
Nidec Corp. | | | | | 300 | | | | 18,254 | |
Schneider Electric SA | | | | | 1,030 | | | | 72,507 | |
Sumitomo Electric Industries Ltd. | | | | | 2,100 | | | | 22,779 | |
| | | | | | | | | | |
| | | | | | | | | 395,878 | |
| | | | | | | | | | |
Industrial Conglomerates – 0.2% | | | | | | | | | | |
3M Co. | | | | | 1,300 | | | | 118,235 | |
Danaher Corp. | | | | | 1,600 | | | | 86,352 | |
Fraser and Neave Ltd. | | | | | 3,000 | | | | 23,161 | |
General Electric Co. | | | | | 21,200 | | | | 447,956 | |
Hutchison Whampoa Ltd. | | | | | 4,000 | | | | 41,071 | |
Keppel Corp., Ltd. | | | | | 3,000 | | | | 26,304 | |
Koninklijke Philips Electronics NV | | | | | 2,050 | | | | 53,015 | |
Orkla ASA | | | | | 1,830 | | | | 14,900 | |
Siemens AG | | | | | 1,620 | | | | 167,486 | |
| | | | | | | | | | |
| | | | | | | | | 978,480 | |
| | | | | | | | | | |
Machinery – 0.2% | | | | | | | | | | |
Alfa Laval AB | | | | | 920 | | | | 18,117 | |
Andritz AG | | | | | 140 | | | | 8,919 | |
Atlas Copco AB | | | | | 1,220 | | | | 28,187 | |
Atlas Copco AB – Class A | | | | | 1,320 | | | | 34,023 | |
Caterpillar, Inc. | | | | | 1,300 | | | | 110,812 | |
Cummins, Inc. | | | | | 1,000 | | | | 98,160 | |
Deere & Co. | | | | | 1,000 | | | | 84,050 | |
Eaton Corp.(c) | | | | | 1,900 | | | | 99,104 | |
FANUC Corp. | | | | | 400 | | | | 67,726 | |
Fiat Industrial SpA | | | | | 3,460 | | | | 36,997 | |
Illinois Tool Works, Inc. | | | | | 1,500 | | | | 92,355 | |
Komatsu Ltd. | | | | | 1,800 | | | | 40,585 | |
Kone Oyj | | | | | 310 | | | | 23,225 | |
Kubota Corp. | | | | | 2,000 | | | | 21,319 | |
Mitsubishi Heavy Industries Ltd. | | | | | 6,000 | | | | 27,966 | |
Sandvik AB | | | | | 1,980 | | | | 29,653 | |
SembCorp Marine Ltd. | | | | | 3,000 | | | | 11,200 | |
SKF AB | | | | | 1,160 | | | | 27,928 | |
SMC Corp./Japan | | | | | 100 | | | | 16,947 | |
Volvo AB – Class B | | | | | 2,740 | | | | 38,878 | |
Wartsila Oyj Abp | | | | | 570 | | | | 24,059 | |
| | | | | | | | | | |
| | | | | | | | | 940,210 | |
| | | | | | | | | | |
Marine – 0.0% | | | | | | | | | | |
AP Moeller – Maersk A/S | | | | | 10 | | | | 71,391 | |
| | | | | | | | | | |
| | | |
Professional Services – 0.0% | | | | | | | | | | |
Experian PLC | | | | | 6,990 | | | | 116,214 | |
| | | | | | | | | | |
| | | |
Road & Rail – 0.1% | | | | | | | | | | |
Canadian National Railway Co. | | | | | 900 | | | | 80,944 | |
Canadian Pacific Railway Ltd. | | | | | 600 | | | | 55,992 | |
| | | | |
| ALLIANCEBERNSTEIN GLOBAL RISK ALLOCATION FUND • | | | 25 | |
Portfolio of Investments
| | | | | | | | | | |
| Company | | | |
Shares | | | U.S. $ Value | |
| | | | | |
| | | | | | | | | | |
Central Japan Railway Co. | | | | | 284 | | | $ | 22,522 | |
CSX Corp. | | | | | 4,200 | | | | 82,992 | |
East Japan Railway Co. | | | | | 700 | | | | 46,016 | |
Hankyu Hanshin Holdings, Inc. | | | | | 4,000 | | | | 21,125 | |
Kintetsu Corp. | | | | | 6,000 | | | | 23,904 | |
MTR Corp., Ltd | | | | | 6,000 | | | | 23,994 | |
Norfolk Southern Corp. | | | | | 1,300 | | | | 78,494 | |
Odakyu Electric Railway Co., Ltd. | | | | | 2,000 | | | | 20,432 | |
Tobu Railway Co., Ltd. | | | | | 4,000 | | | | 20,712 | |
Tokyu Corp. | | | | | 4,000 | | | | 20,547 | |
Union Pacific Corp. | | | | | 900 | | | | 110,502 | |
West Japan Railway Co. | | | | | 518 | | | | 20,738 | |
| | | | | | | | | | |
| | | | | | | | | 628,914 | |
| | | | | | | | | | |
Trading Companies & Distributors – 0.1% | | | | | | | | | | |
ITOCHU Corp. | | | | | 3,000 | | | | 30,091 | |
Marubeni Corp. | | | | | 3,000 | | | | 19,848 | |
Mitsubishi Corp. | | | | | 2,800 | | | | 53,299 | |
Mitsui & Co., Ltd. | | | | | 3,400 | | | | 47,191 | |
Sumitomo Corp. | | | | | 2,200 | | | | 27,404 | |
Toyota Tsusho Corp. | | | | | 1,000 | | | | 23,104 | |
WW Grainger, Inc. | | | | | 300 | | | | 58,206 | |
| | | | | | | | | | |
| | | | | | | | | 259,143 | |
| | | | | | | | | | |
Transportation Infrastructure – 0.0% | | | | | | | | | | |
Abertis Infraestructuras SA | | | | | 2,380 | | | | 34,843 | |
Auckland International Airport Ltd. | | | | | 1,830 | | | | 4,025 | |
Koninklijke Vopak NV | | | | | 420 | | | | 31,047 | |
| | | | | | | | | | |
| | | | | | | | | 69,915 | |
| | | | | | | | | | |
| | | | | | | | | 5,355,507 | |
| | | | | | | | | | |
Health Care – 0.9% | | | | | | | | | | |
Biotechnology – 0.1% | | | | | | | | | | |
Alexion Pharmaceuticals, Inc.(b) | | | | | 800 | | | | 76,816 | |
Amgen, Inc. | | | | | 1,600 | | | | 142,080 | |
Biogen Idec, Inc.(b) | | | | | 600 | | | | 89,454 | |
Celgene Corp.(b) | | | | | 1,100 | | | | 86,449 | |
CSL Ltd. | | | | | 1,350 | | | | 72,814 | |
Gilead Sciences, Inc.(b) | | | | | 1,500 | | | | 112,500 | |
Regeneron Pharmaceuticals, Inc.(b) | | | | | 500 | | | | 88,275 | |
| | | | | | | | | | |
| | | | | | | | | 668,388 | |
| | | | | | | | | | |
Health Care Equipment & Supplies – 0.1% | | | | | | | | | | |
Baxter International, Inc. | | | | | 1,400 | | | | 92,778 | |
Becton Dickinson and Co. | | | | | 1,200 | | | | 92,004 | |
Cie Generale d’Optique Essilor International SA | | | | | 390 | | | | 37,681 | |
Coloplast A/S | | | | | 70 | | | | 16,344 | |
Covidien PLC | | | | | 1,500 | | | | 87,165 | |
Getinge AB | | | | | 730 | | | | 23,549 | |
Intuitive Surgical, Inc.(b) | | | | | 200 | | | | 105,800 | |
Medtronic, Inc. | | | | | 2,100 | | | | 88,431 | |
Stryker Corp. | | | | | 1,700 | | | | 92,072 | |
Terumo Corp. | | | | | 500 | | | | 21,246 | |
| | | | | | | | | | |
| | | | | | | | | 657,070 | |
| | | | | | | | | | |
| | |
| 26 | | • ALLIANCEBERNSTEIN GLOBAL RISK ALLOCATION FUND |
Portfolio of Investments
| | | | | | | | | | |
| Company | | | |
Shares | | | U.S. $ Value | |
| | | | | |
| | | | | | | | | | |
Health Care Providers & Services – 0.1% | | | | | | | | | | |
Express Scripts Holding Co.(b) | | | | | 1,600 | | | $ | 86,160 | |
Fresenius Medical Care AG & Co. KGaA | | | | | 1,140 | | | | 78,276 | |
McKesson Corp. | | | | | 1,000 | | | | 94,470 | |
UnitedHealth Group, Inc. | | | | | 2,100 | | | | 114,219 | |
WellPoint, Inc. | | | | | 1,400 | | | | 78,260 | |
| | | | | | | | | | |
| | | | | | | | | 451,385 | |
| | | | | | | | | | |
Life Sciences Tools & Services – 0.0% | | | | | | | | | | |
Thermo Fisher Scientific, Inc. | | | | | 1,500 | | | | 95,325 | |
| | | | | | | | | | |
| | | |
Pharmaceuticals – 0.6% | | | | | | | | | | |
Abbott Laboratories | | | | | 3,200 | | | | 208,000 | |
Allergan, Inc./United States | | | | | 900 | | | | 83,475 | |
Astellas Pharma, Inc. | | | | | 900 | | | | 45,561 | |
AstraZeneca PLC | | | | | 2,560 | | | | 121,596 | |
Bayer AG | | | | | 1,630 | | | | 147,520 | |
Bristol-Myers Squibb Co. | | | | | 3,400 | | | | 110,942 | |
Chugai Pharmaceutical Co., Ltd. | | | | | 1,100 | | | | 21,837 | |
Daiichi Sankyo Co., Ltd. | | | | | 1,400 | | | | 21,646 | |
Eisai Co., Ltd. | | | | | 500 | | | | 21,016 | |
Elan Corp. PLC(b) | | | | | 990 | | | | 9,897 | |
Eli Lilly & Co. | | | | | 2,100 | | | | 102,984 | |
GlaxoSmithKline PLC | | | | | 9,880 | | | | 211,591 | |
Johnson & Johnson | | | | | 5,400 | | | | 376,542 | |
Merck & Co., Inc. | | | | | 6,100 | | | | 270,230 | |
Mitsubishi Tanabe Pharma Corp. | | | | | 2,000 | | | | 27,221 | |
Novartis AG | | | | | 4,530 | | | | 280,712 | |
Novo Nordisk A/S – Class B | | | | | 800 | | | | 126,808 | |
Ono Pharmaceutical Co., Ltd. | | | | | 200 | | | | 10,955 | |
Orion Oyj | | | | | 500 | | | | 13,392 | |
Otsuka Holdings Co., Ltd. | | | | | 700 | | | | 20,795 | |
Pfizer, Inc. | | | | | 15,000 | | | | 375,300 | |
Roche Holding AG | | | | | 1,380 | | | | 271,853 | |
Sanofi | | | | | 2,340 | | | | 209,003 | |
Shire PLC | | | | | 2,000 | | | | 57,749 | |
Taisho Pharmaceutical Holdings Co., Ltd. | | | | | 300 | | | | 22,122 | |
Takeda Pharmaceutical Co., Ltd. | | | | | 1,600 | | | | 73,244 | |
Teva Pharmaceutical Industries Ltd. | | | | | 1,860 | | | | 75,273 | |
UCB SA | | | | | 210 | | | | 11,932 | |
Valeant Pharmaceuticals International, Inc.(b) | | | | | 900 | | | | 50,139 | |
| | | | | | | | | | |
| | | | | | | | | 3,379,335 | |
| | | | | | | | | | |
| | | | | | | | | 5,251,503 | |
| | | | | | | | | | |
Energy – 0.9% | | | | | | | | | | |
Energy Equipment & Services – 0.1% | | | | | | | | | | |
Baker Hughes, Inc. | | | | | 1,900 | | | | 81,985 | |
Fugro NV | | | | | 280 | | | | 16,815 | |
Halliburton Co. | | | | | 2,500 | | | | 83,375 | |
National Oilwell Varco, Inc. | | | | | 1,100 | | | | 75,130 | |
Saipem SpA | | | | | 390 | | | | 17,380 | |
| | | | |
| ALLIANCEBERNSTEIN GLOBAL RISK ALLOCATION FUND • | | | 27 | |
Portfolio of Investments
| | | | | | | | | | |
| Company | | | |
Shares | | | U.S. $ Value | |
| | | | | |
| | | | | | | | | | |
Schlumberger Ltd. | | | | | 2,600 | | | $ | 186,212 | |
Seadrill Ltd. | | | | | 750 | | | | 28,820 | |
Subsea 7 SA | | | | | 740 | | | | 16,880 | |
Technip SA | | | | | 280 | | | | 32,553 | |
Tenaris SA | | | | | 1,780 | | | | 35,340 | |
| | | | | | | | | | |
| | | | | | | | | 574,490 | |
| | | | | | | | | | |
Oil, Gas & Consumable Fuels – 0.8% | | | | | | | | | | |
Anadarko Petroleum Corp. | | | | | 1,200 | | | | 87,828 | |
Apache Corp. | | | | | 1,000 | | | | 77,090 | |
BG Group PLC | | | | | 6,690 | | | | 114,777 | |
BP PLC | | | | | 37,480 | | | | 260,197 | |
Canadian Natural Resources Ltd. | | | | | 2,200 | | | | 63,319 | |
Canadian Oil Sands Ltd. | | | | | 1,200 | | | | 24,354 | |
Cenovus Energy, Inc. | | | | | 1,500 | | | | 50,375 | |
Chevron Corp. | | | | | 4,000 | | | | 422,760 | |
ConocoPhillips | | | | | 2,400 | | | | 136,656 | |
Crescent Point Energy Corp. | | | | | 1,200 | | | | 47,125 | |
Devon Energy Corp. | | | | | 1,500 | | | | 77,505 | |
Enbridge, Inc. | | | | | 1,500 | | | | 60,734 | |
EnCana Corp. | | | | | 2,300 | | | | 50,244 | |
ENI SpA | | | | | 5,010 | | | | 118,809 | |
EOG Resources, Inc. | | | | | 800 | | | | 94,096 | |
Exxon Mobil Corp. | | | | | 9,400 | | | | 828,516 | |
Galp Energia SGPS SA | | | | | 460 | | | | 7,057 | |
Hess Corp. | | | | | 1,500 | | | | 74,415 | |
Husky Energy, Inc. | | | | | 1,800 | | | | 50,520 | |
Imperial Oil Ltd. | | | | | 1,100 | | | | 46,897 | |
Inpex Corp. | | | | | 4 | | | | 21,510 | |
JX Holdings, Inc. | | | | | 4,000 | | | | 21,422 | |
Kinder Morgan, Inc./Delaware | | | | | 2,500 | | | | 84,525 | |
Lundin Petroleum AB(b) | | | | | 550 | | | | 13,012 | |
Marathon Oil Corp. | | | | | 2,900 | | | | 89,465 | |
Marathon Petroleum Corp. | | | | | 1,600 | | | | 95,264 | |
Nexen, Inc. (Toronto) | | | | | 2,100 | | | | 51,562 | |
Occidental Petroleum Corp. | | | | | 1,600 | | | | 120,336 | |
OMV AG | | | | | 290 | | | | 10,376 | |
Origin Energy Ltd. | | | | | 3,970 | | | | 45,612 | |
Phillips 66 | | | | | 1,900 | | | | 99,503 | |
Repsol SA | | | | | 1,610 | | | | 34,173 | |
Royal Dutch Shell PLC – Class A | | | | | 7,280 | | | | 243,745 | |
Royal Dutch Shell PLC – Class B | | | | | 5,210 | | | | 179,844 | |
Spectra Energy Corp. | | | | | 3,000 | | | | 83,850 | |
Statoil ASA | | | | | 2,200 | | | | 53,748 | |
Suncor Energy, Inc. (Toronto) | | | | | 3,100 | | | | 101,300 | |
Talisman Energy, Inc. | | | | | 4,000 | | | | 45,019 | |
TonenGeneral Sekiyu KK | | | | | 2,000 | | | | 18,597 | |
Total SA | | | | | 4,190 | | | | 209,984 | |
TransCanada Corp. | | | | | 1,400 | | | | 64,803 | |
| | |
| 28 | | • ALLIANCEBERNSTEIN GLOBAL RISK ALLOCATION FUND |
Portfolio of Investments
| | | | | | | | | | |
| Company | | | |
Shares | | | U.S. $ Value | |
| | | | | |
| | | | | | | | | | |
Tullow Oil PLC | | | | | 2,830 | | | $ | 62,464 | |
Williams Cos., Inc. (The) | | | | | 2,500 | | | | 82,100 | |
Woodside Petroleum Ltd. | | | | | 1,870 | | | | 66,025 | |
| | | | | | | | | | |
| | | | | | | | | 4,591,513 | |
| | | | | | | | | | |
| | | | | | | | | 5,166,003 | |
| | | | | | | | | | |
Materials – 0.6% | | | | | | | | | | |
Chemicals – 0.3% | | | | | | | | | | |
Agrium, Inc. (Toronto) | | | | | 500 | | | | 51,060 | |
Air Liquide SA | | | | | 620 | | | | 75,791 | |
Air Products & Chemicals, Inc. | | | | | 600 | | | | 49,764 | |
Akzo Nobel NV | | | | | 580 | | | | 33,183 | |
Asahi Kasei Corp. | | | | | 4,000 | | | | 22,895 | |
BASF SE | | | | | 1,810 | | | | 162,281 | |
Dow Chemical Co. (The) | | | | | 3,000 | | | | 90,570 | |
Ecolab, Inc. | | | | | 1,300 | | | | 93,704 | |
EI du Pont de Nemours & Co. | | | | | 1,800 | | | | 77,652 | |
Israel Chemicals Ltd. | | | | | 1,120 | | | | 13,799 | |
Kuraray Co., Ltd. | | | | | 2,000 | | | | 24,710 | |
Linde AG | | | | | 490 | | | | 84,763 | |
LyondellBasell Industries NV | | | | | 1,600 | | | | 79,568 | |
Mitsubishi Chemical Holdings Corp. | | | | | 5,500 | | | | 24,130 | |
Monsanto Co. | | | | | 1,100 | | | | 100,749 | |
Mosaic Co. (The) | | | | | 1,600 | | | | 86,496 | |
Nitto Denko Corp. | | | | | 500 | | | | 26,113 | |
Novozymes A/S | | | | | 520 | | | | 14,325 | |
Potash Corp. of Saskatchewan, Inc. | | | | | 1,700 | | | | 65,768 | |
PPG Industries, Inc. | | | | | 800 | | | | 99,416 | |
Praxair, Inc. | | | | | 800 | | | | 85,768 | |
Shin-Etsu Chemical Co., Ltd. | | | | | 800 | | | | 47,248 | |
Solvay SA | | | | | 150 | | | | 20,351 | |
Sumitomo Chemical Co., Ltd. | | | | | 8,000 | | | | 22,932 | |
Syngenta AG | | | | | 350 | | | | 140,125 | |
Toray Industries, Inc. | | | | | 4,000 | | | | 23,755 | |
Yara International ASA | | | | | 540 | | | | 27,076 | |
| | | | | | | | | | |
| | | | | | | | | 1,643,992 | |
| | | | | | | | | | |
Construction Materials – 0.0% | | | | | | | | | | |
CRH PLC | | | | | 1,420 | | | | 25,993 | |
Fletcher Building Ltd. | | | | | 1,350 | | | | 8,779 | |
Lafarge SA | | | | | 630 | | | | 36,663 | |
| | | | | | | | | | |
| | | | | | | | | 71,435 | |
| | | | | | | | | | |
Metals & Mining – 0.3% | | | | | | | | | | |
Anglo American PLC | | | | | 3,930 | | | | 109,148 | |
ArcelorMittal (Euronext Amsterdam) | | | | | 2,410 | | | | 36,639 | |
Barrick Gold Corp. | | | | | 2,000 | | | | 69,442 | |
BHP Billiton Ltd. | | | | | 6,350 | | | | 228,678 | |
BHP Billiton PLC | | | | | 4,160 | | | | 131,021 | |
Boliden AB | | | | | 830 | | | | 14,712 | |
Fortescue Metals Group Ltd. | | | | | 13,680 | | | | 55,957 | |
Freeport-McMoRan Copper & Gold, Inc. | | | | | 2,100 | | | | 81,921 | |
| | | | |
| ALLIANCEBERNSTEIN GLOBAL RISK ALLOCATION FUND • | | | 29 | |
Portfolio of Investments
| | | | | | | | | | |
| Company | | | |
Shares | | | U.S. $ Value | |
| | | | | |
| | | | | | | | | | |
Glencore International PLC | | | | | 10,770 | | | $ | 59,647 | |
Goldcorp, Inc. | | | | | 1,600 | | | | 62,351 | |
JFE Holdings, Inc. | | | | | 1,600 | | | | 24,932 | |
Kinross Gold Corp. | | | | | 5,100 | | | | 51,650 | |
Newcrest Mining Ltd. | | | | | 2,330 | | | | 62,274 | |
Newmont Mining Corp. | | | | | 1,600 | | | | 75,344 | |
Nippon Steel & Sumitomo Metal Corp. | | | | | 15,000 | | | | 34,587 | |
Rio Tinto Ltd. | | | | | 1,150 | | | | 70,614 | |
Rio Tinto PLC | | | | | 2,640 | | | | 131,093 | |
Silver Wheaton Corp. | | | | | 1,300 | | | | 47,859 | |
Sumitomo Metal Mining Co., Ltd. | | | | | 2,000 | | | | 27,495 | |
Teck Resources Ltd. | | | | | 1,700 | | | | 57,554 | |
ThyssenKrupp AG | | | | | 1,900 | | | | 38,486 | |
Umicore SA | | | | | 180 | | | | 9,359 | |
Voestalpine AG | | | | | 210 | | | | 6,785 | |
Xstrata PLC | | | | | 7,530 | | | | 124,842 | |
Yamana Gold, Inc. | | | | | 2,700 | | | | 50,882 | |
| | | | | | | | | | |
| | | | | | | | | 1,663,272 | |
| | | | | | | | | | |
| | | |
Paper & Forest Products – 0.0% | | | | | | | | | | |
UPM-Kymmene Oyj | | | | | 1,620 | | | | 18,230 | |
| | | | | | | | | | |
| | | | | | | | | 3,396,929 | |
| | | | | | | | | | |
Telecommunication Services – 0.3% | | | | | | | | | | |
Diversified Telecommunication Services – 0.2% | | | | | |
AT&T, Inc. | | | | | 11,700 | | | | 399,321 | |
BCE, Inc. | | | | | 1,200 | | | | 50,810 | |
Belgacom SA | | | | | 530 | | | | 15,583 | |
Bezeq The Israeli Telecommunication Corp., Ltd. | | | | | 8,820 | | | | 10,784 | |
BT Group PLC | | | | | 17,670 | | | | 66,087 | |
CenturyLink, Inc. | | | | | 2,300 | | | | 89,332 | |
Deutsche Telekom AG | | | | | 5,530 | | | | 60,912 | |
Elisa Oyj | | | | | 510 | | | | 10,836 | |
France Telecom SA | | | | | 4,620 | | | | 49,142 | |
Koninklijke KPN NV | | | | | 2,500 | | | | 14,159 | |
Nippon Telegraph & Telephone Corp. | | | | | 900 | | | | 40,486 | |
Portugal Telecom SGPS SA | | | | | 1,230 | | | | 5,714 | |
Singapore Telecommunications Ltd. | | | | | 16,000 | | | | 43,125 | |
Telecom Corp. of New Zealand Ltd. | | | | | 3,730 | | | | 7,076 | |
Telecom Italia SpA (ordinary shares) | | | | | 28,930 | | | | 26,357 | |
Telefonica SA | | | | | 7,940 | | | | 104,303 | |
Telekom Austria AG | | | | | 620 | | | | 4,029 | |
Telenor ASA | | | | | 1,420 | | | | 28,836 | |
TeliaSonera AB | | | | | 4,260 | | | | 28,596 | |
Telstra Corp., Ltd. | | | | | 8,580 | | | | 38,599 | |
Verizon Communications, Inc. | | | | | 5,700 | | | | 251,484 | |
Vivendi SA | | | | | 2,290 | | | | 49,263 | |
| | | | | | | | | | |
| | | | | | | | | 1,394,834 | |
| | | | | | | | | | |
| | |
| 30 | | • ALLIANCEBERNSTEIN GLOBAL RISK ALLOCATION FUND |
Portfolio of Investments
| | | | | | | | | | |
| Company | | | |
Shares | | | U.S. $ Value | |
| | | | | |
| | | | | | | | | | |
Wireless Telecommunication Services – 0.1% | | | | | | | | | | |
Crown Castle International Corp.(b) | | | | | 1,100 | | | $ | 74,272 | |
KDDI Corp. | | | | | 530 | | | | 39,328 | |
Millicom International Cellular SA | | | | | 240 | | | | 20,608 | |
NTT DoCoMo, Inc. | | | | | 30 | | | | 43,492 | |
Rogers Communications, Inc. | | | | | 600 | | | | 26,498 | |
Softbank Corp. | | | | | 1,700 | | | | 63,941 | |
Vodafone Group PLC | | | | | 97,210 | | | | 250,766 | |
| | | | | | | | | | |
| | | | | | | | | 518,905 | |
| | | | | | | | | | |
| | | | | | | | | 1,913,739 | |
| | | | | | | | | | |
Utilities – 0.3% | | | | | | | | | | |
Electric Utilities – 0.2% | | | | | | | | | | |
American Electric Power Co., Inc. | | | | | 2,000 | | | | 85,300 | |
Cheung Kong Infrastructure Holdings Ltd. | | | | | 2,000 | | | | 12,177 | |
Chubu Electric Power Co., Inc. | | | | | 1,800 | | | | 24,374 | |
Chugoku Electric Power Co., Inc. (The) | | | | | 1,700 | | | | 24,583 | |
CLP Holdings Ltd. | | | | | 3,500 | | | | 30,582 | |
Contact Energy Ltd.(b) | | | | | 910 | | | | 3,977 | |
Duke Energy Corp. | | | | | 1,400 | | | | 89,348 | |
EDP – Energias de Portugal SA | | | | | 3,760 | | | | 9,514 | |
Electricite de France SA | | | | | 1,300 | | | | 23,859 | |
Enel SpA | | | | | 12,970 | | | | 49,192 | |
Exelon Corp. | | | | | 2,400 | | | | 72,528 | |
FirstEnergy Corp. | | | | | 2,000 | | | | 84,920 | |
Fortis, Inc. | | | | | 800 | | | | 26,883 | |
Fortum Oyj | | | | | 880 | | | | 15,840 | |
Iberdrola SA | | | | | 11,780 | | | | 58,534 | |
Kansai Electric Power Co., Inc. (The) | | | | | 2,800 | | | | 26,633 | |
NextEra Energy, Inc. | | | | | 1,200 | | | | 82,452 | |
Power Assets Holdings Ltd. | | | | | 2,500 | | | | 22,087 | |
PPL Corp. | | | | | 3,000 | | | | 88,050 | |
Southern Co. (The) | | | | | 1,900 | | | | 82,745 | |
| | | | | | | | | | |
| | | | | | | | | 913,578 | |
| | | | | | | | | | |
Gas Utilities – 0.0% | | | | | | | | | | |
Hong Kong & China Gas Co., Ltd. | | | | | 10,000 | | | | 27,099 | |
Osaka Gas Co., Ltd. | | | | | 5,000 | | | | 19,658 | |
Snam SpA | | | | | 6,800 | | | | 30,100 | |
Tokyo Gas Co., Ltd. | | | | | 5,000 | | | | 24,546 | |
| | | | | | | | | | |
| | | | | | | | | 101,403 | |
| | | | | | | | | | |
Independent Power Producers & Energy
Traders – 0.0% | | | | | | | | | | |
Electric Power Development Co., Ltd. | | | | | 103 | | | | 2,608 | |
| | | | | | | | | | |
| | | |
Multi-Utilities – 0.1% | | | | | | | | | | |
AGL Energy Ltd. | | | | | 2,170 | | | | 32,567 | |
Centrica PLC | | | | | 15,970 | | | | 83,400 | |
Consolidated Edison, Inc. | | | | | 1,500 | | | | 83,685 | |
Dominion Resources, Inc./VA | | | | | 1,700 | | | | 86,887 | |
| | | | |
| ALLIANCEBERNSTEIN GLOBAL RISK ALLOCATION FUND • | | | 31 | |
Portfolio of Investments
| | | | | | | | | | |
| Company | | | |
Shares | | | U.S. $ Value | |
| | | | | |
| | | | | | | | | | |
E.ON SE | | | | | 3,580 | | | $ | 64,558 | |
GDF Suez | | | | | 2,520 | | | | 56,693 | |
National Grid PLC | | | | | 10,690 | | | | 120,833 | |
PG&E Corp. | | | | | 2,100 | | | | 85,995 | |
Public Service Enterprise Group, Inc. | | | | | 1,400 | | | | 42,126 | |
RWE AG | | | | | 1,020 | | | | 42,548 | |
| | | | | | | | | | |
| | | | | | | | | 699,292 | |
| | | | | | | | | | |
| | | | | | | | | 1,716,881 | |
| | | | | | | | | | |
Total Common Stocks
(cost $48,451,477) | | | | | | | | | 49,466,939 | |
| | | | | | | | | | |
| | | |
| | | | | Principal
Amount
(000) | | | | |
CORPORATES - INVESTMENT
GRADES – 6.9% | | | | | | | | | | |
Industrial – 3.2% | | | | | | | | | | |
Basic – 0.3% | | | | | | | | | | |
Alcoa, Inc.
5.40%, 4/15/21 | | U.S.$ | | | 215 | | | | 227,028 | |
AngloGold Ashanti Holdings PLC
5.375%, 4/15/20 | | | | | 230 | | | | 234,306 | |
Dow Chemical Co. (The)
4.125%, 11/15/21 | | | | | 55 | | | | 59,899 | |
5.25%, 11/15/41 | | | | | 55 | | | | 61,201 | |
7.60%, 5/15/14 | | | | | 140 | | | | 153,430 | |
8.55%, 5/15/19 | | | | | 177 | | | | 239,539 | |
International Paper Co.
7.95%, 6/15/18 | | | | | 370 | | | | 478,976 | |
Vale SA
5.625%, 9/11/42 | | | | | 415 | | | | 448,143 | |
| | | | | | | | | | |
| | | | | | | | | 1,902,522 | |
| | | | | | | | | | |
Capital Goods – 0.2% | | | | | | | | | | |
ADT Corp. (The)
3.50%, 7/15/22(a) | | | | | 66 | | | | 66,234 | |
Embraer SA
5.15%, 6/15/22 | | | | | 111 | | | | 120,435 | |
Owens Corning
6.50%, 12/01/16 | | | | | 353 | | | | 399,079 | |
Republic Services, Inc.
5.25%, 11/15/21 | | | | | 218 | | | | 259,884 | |
5.50%, 9/15/19 | | | | | 153 | | | | 182,436 | |
| | | | | | | | | | |
| | | | | | | | | 1,028,068 | |
| | | | | | | | | | |
Communications - Media – 0.5% | | | | | | | | | | |
CBS Corp.
3.375%, 3/01/22 | | | | | 111 | | | | 114,914 | |
5.75%, 4/15/20 | | | | | 96 | | | | 115,308 | |
| | |
| 32 | | • ALLIANCEBERNSTEIN GLOBAL RISK ALLOCATION FUND |
Portfolio of Investments
| | | | | | | | | | |
| | | | | Principal
Amount
(000) | | | U.S. $ Value | |
| | | | | |
| | | | | | | | | | |
8.875%, 5/15/19 | | U.S.$ | | | 174 | | | $ | 237,084 | |
Comcast Corp.
5.15%, 3/01/20 | | | | | 95 | | | | 113,474 | |
DirecTV Holdings LLC/DirecTV
Financing Co., Inc.
3.80%, 3/15/22 | | | | | 220 | | | | 224,551 | |
4.60%, 2/15/21 | | | | | 175 | | | | 189,693 | |
4.75%, 10/01/14 | | | | | 80 | | | | 85,463 | |
Globo Comunicacao e Participacoes SA
5.307%, 5/11/22(a)(d) | | | | | 365 | | | | 394,200 | |
News America, Inc. | | | | | | | | | | |
6.15%, 3/01/37-2/15/41 | | | | | 276 | | | | 341,476 | |
9.25%, 2/01/13 | | | | | 150 | | | | 151,851 | |
Omnicom Group, Inc.
3.625%, 5/01/22 | | | | | 125 | | | | 130,982 | |
Reed Elsevier Capital, Inc.
8.625%, 1/15/19 | | | | | 290 | | | | 377,508 | |
WPP Finance UK
8.00%, 9/15/14 | | | | | 323 | | | | 358,292 | |
| | | | | | | | | | |
| | | | | | | | | 2,834,796 | |
| | | | | | | | | | |
Communications - Telecommunications – 0.4% | | | | | |
American Tower Corp.
5.05%, 9/01/20 | | | | | 430 | | | | 483,942 | |
AT&T, Inc. | | | | | | | | | | |
3.00%, 2/15/22 | | | | | 115 | | | | 120,312 | |
4.45%, 5/15/21 | | | | | 225 | | | | 262,196 | |
British Telecommunications PLC | | | | | | | | | | |
2.00%, 6/22/15 | | | | | 330 | | | | 339,356 | |
5.95%, 1/15/18 | | | | | 115 | | | | 138,246 | |
Deutsche Telekom International Finance
BV 4.875%, 3/06/42(a) | | | | | 370 | | | | 398,098 | |
Telefonica Emisiones SAU
5.462%, 2/16/21 | | | | | 140 | | | | 142,100 | |
Vodafone Group PLC
6.15%, 2/27/37 | | | | | 285 | | | | 382,723 | |
| | | | | | | | | | |
| | | | | | | | | 2,266,973 | |
| | | | | | | | | | |
Consumer Cyclical - Automotive – 0.1% | | | | | | | | | | |
Harley-Davidson Funding Corp.
5.75%, 12/15/14(a) | | | | | 323 | | | | 353,926 | |
| | | | | | | | | | |
| | |
Consumer Cyclical - Entertainment – 0.0% | | | | | | | | |
Viacom, Inc.
5.625%, 9/15/19 | | | | | 80 | | | | 96,569 | |
| | | | | | | | | | |
| | | |
Consumer Cyclical - Other – 0.1% | | | | | | | | | | |
Marriott International, Inc./DE
3.00%, 3/01/19 | | | | | 327 | | | | 338,142 | |
| | | | | | | | | | |
| | | | |
| ALLIANCEBERNSTEIN GLOBAL RISK ALLOCATION FUND • | | | 33 | |
Portfolio of Investments
| | | | | | | | | | |
| | | | | Principal
Amount
(000) | | | U.S. $ Value | |
| | | | | |
| | | | | | | | | | |
Consumer Cyclical - Retailers – 0.1% | | | | | | | | | | |
CVS Caremark Corp.
6.60%, 3/15/19 | | U.S.$ | | | 255 | | | $ | 332,524 | |
Macy’s Retail Holdings, Inc.
3.875%, 1/15/22 | | | | | 390 | | | | 419,338 | |
| | | | | | | | | | |
| | | | | | | | | 751,862 | |
| | | | | | | | | | |
Consumer Non-Cyclical – 0.4% | | | | | | | | | | |
Ahold Finance USA LLC
6.875%, 5/01/29 | | | | | 325 | | | | 419,614 | |
Bunge Ltd. Finance Corp.
5.875%, 5/15/13 | | | | | 415 | | | | 424,263 | |
Cadbury Schweppes US Finance LLC
5.125%, 10/01/13(a) | | | | | 590 | | | | 608,782 | |
Delhaize Group SA
5.875%, 2/01/14 | | | | | 150 | | | | 157,487 | |
Kroger Co. (The)
3.40%, 4/15/22 | | | | | 297 | | | | 309,154 | |
Laboratory Corp. of America Holdings
2.20%, 8/23/17 | | | | | 52 | | | | 53,668 | |
Tyson Foods, Inc.
4.50%, 6/15/22 | | | | | 187 | | | | 201,436 | |
Watson Pharmaceuticals, Inc.
3.25%, 10/01/22 | | | | | 150 | | | | 154,284 | |
| | | | | | | | | | |
| | | | | | | | | 2,328,688 | |
| | | | | | | | | | |
Energy – 0.5% | | | | | | | | | | |
Encana Corp.
3.90%, 11/15/21 | | | | | 435 | | | | 468,481 | |
Marathon Petroleum Corp. | | | | | | | | | | |
3.50%, 3/01/16 | | | | | 63 | | | | 67,271 | |
5.125%, 3/01/21 | | | | | 239 | | | | 281,044 | |
Nabors Industries, Inc.
9.25%, 1/15/19 | | | | | 302 | | | | 402,353 | |
Noble Energy, Inc.
8.25%, 3/01/19 | | | | | 355 | | | | 469,901 | |
Noble Holding International Ltd.
4.90%, 8/01/20 | | | | | 41 | | | | 46,574 | |
Phillips 66
4.30%, 4/01/22(a) | | | | | 370 | | | | 408,329 | |
Transocean, Inc.
2.50%, 10/15/17 | | | | | 184 | | | | 184,977 | |
Valero Energy Corp.
6.125%, 2/01/20 | | | | | 207 | | | | 252,000 | |
Weatherford International Ltd./Bermuda | | | | | | | | | | |
5.125%, 9/15/20 | | | | | 55 | | | | 57,984 | |
9.625%, 3/01/19 | | | | | 280 | | | | 360,692 | |
| | | | | | | | | | |
| | | | | | | | | 2,999,606 | |
| | | | | | | | | | |
| | |
| 34 | | • ALLIANCEBERNSTEIN GLOBAL RISK ALLOCATION FUND |
Portfolio of Investments
| | | | | | | | | | |
| | | | | Principal
Amount
(000) | | | U.S. $ Value | |
| | | | | |
| | | | | | | | | | |
Technology – 0.2% | | | | | | | | | | |
Agilent Technologies, Inc.
5.00%, 7/15/20 | | U.S.$ | | | 81 | | | $ | 93,702 | |
Hewlett-Packard Co.
4.65%, 12/09/21 | | | | | 167 | | | | 161,553 | |
Intel Corp.
4.80%, 10/01/41 | | | | | 105 | | | | 116,595 | |
Motorola Solutions, Inc.
7.50%, 5/15/25 | | | | | 90 | | | | 116,959 | |
Telefonaktiebolaget LM Ericsson
4.125%, 5/15/22 | | | | | 405 | | | | 419,580 | |
Xerox Corp.
8.25%, 5/15/14 | | | | | 435 | | | | 476,729 | |
| | | | | | | | | | |
| | | | | | | | | 1,385,118 | |
| | | | | | | | | | |
Transportation - Airlines – 0.1% | | | | | | | | | | |
Southwest Airlines Co.
5.25%, 10/01/14 | | | | | 357 | | | | 380,968 | |
| | | | | | | | | | |
| | | |
Transportation - Railroads – 0.1% | | | | | | | | | | |
CSX Corp.
4.75%, 5/30/42 | | | | | 350 | | | | 382,093 | |
| | | | | | | | | | |
| | | |
Transportation - Services – 0.2% | | | | | | | | | | |
Asciano Finance Ltd.
3.125%, 9/23/15(a) | | | | | 440 | | | | 447,836 | |
Con-way, Inc.
6.70%, 5/01/34 | | | | | 267 | | | | 287,993 | |
Ryder System, Inc. | | | | | | | | | | |
5.85%, 11/01/16 | | | | | 164 | | | | 186,922 | |
7.20%, 9/01/15 | | | | | 147 | | | | 169,088 | |
| | | | | | | | | | |
| | | | | | | | | 1,091,839 | |
| | | | | | | | | | |
| | | | | | | | | 18,141,170 | |
| | | | | | | | | | |
Financial Institutions – 2.6% | | | | | | | | | | |
Banking – 1.5% | | | | | | | | | | |
Bank of America Corp. | | | | | | | | | | |
5.625%, 7/01/20 | | | | | 170 | | | | 200,705 | |
5.70%, 1/24/22 | | | | | 425 | | | | 516,997 | |
5.875%, 2/07/42 | | | | | 365 | | | | 461,452 | |
Barclays Bank PLC
5.125%, 1/08/20 | | | | | 260 | | | | 296,906 | |
Citigroup, Inc. | | | | | | | | | | |
5.375%, 8/09/20 | | | | | 192 | | | | 226,575 | |
8.50%, 5/22/19 | | | | | 240 | | | | 321,108 | |
Countrywide Financial Corp.
6.25%, 5/15/16 | | | | | 143 | | | | 157,837 | |
DNB Bank ASA
3.20%, 4/03/17(a) | | | | | 365 | | | | 388,170 | |
Fifth Third Bancorp
3.50%, 3/15/22 | | | | | 141 | | | | 149,467 | |
| | | | |
| ALLIANCEBERNSTEIN GLOBAL RISK ALLOCATION FUND • | | | 35 | |
Portfolio of Investments
| | | | | | | | | | |
| | | | | Principal
Amount
(000) | | | U.S. $ Value | |
| | | | | |
| | | | | | | | | | |
Goldman Sachs Group, Inc. (The) | | | | | | | | | | |
5.75%, 1/24/22 | | U.S.$ | | | 145 | | | $ | 172,113 | |
6.00%, 6/15/20 | | | | | 365 | | | | 432,724 | |
7.50%, 2/15/19 | | | | | 400 | | | | 502,171 | |
HSBC Holdings PLC | | | | | | | | | | |
4.00%, 3/30/22 | | | | | 385 | | | | 423,118 | |
5.10%, 4/05/21 | | | | | 223 | | | | 264,962 | |
ING Bank NV
2.00%, 9/25/15(a) | | | | | 415 | | | | 416,953 | |
JPMorgan Chase & Co.
4.50%, 1/24/22 | | | | | 200 | | | | 226,270 | |
Macquarie Bank Ltd.
5.00%, 2/22/17(a) | | | | | 73 | | | | 79,628 | |
Macquarie Group Ltd.
4.875%, 8/10/17(a) | | | | | 147 | | | | 158,348 | |
Morgan Stanley | | | | | | | | | | |
5.50%, 7/24/20 | | | | | 160 | | | | 180,633 | |
6.625%, 4/01/18 | | | | | 390 | | | | 454,184 | |
Series G | | | | | | | | | | |
5.50%, 7/28/21 | | | | | 208 | | | | 237,864 | |
Nationwide Building Society
6.25%, 2/25/20(a) | | | | | 425 | | | | 503,149 | |
PNC Funding Corp.
5.125%, 2/08/20 | | | | | 190 | | | | 227,308 | |
Societe Generale SA
2.50%, 1/15/14(a) | | | | | 140 | | | | 141,008 | |
UBS AG/Stamford CT
7.625%, 8/17/22 | | | | | 330 | | | | 362,438 | |
Unicredit Luxembourg Finance SA
6.00%, 10/31/17(a) | | | | | 235 | | | | 232,993 | |
Vesey Street Investment Trust I
4.404%, 9/01/16 | | | | | 138 | | | | 149,098 | |
Wachovia Corp.
5.50%, 5/01/13 | | | | | 410 | | | | 418,616 | |
| | | | | | | | | | |
| | | | | | | | | 8,302,795 | |
| | | | | | | | | | |
Finance – 0.1% | | | | | | | | | | |
General Electric Capital Corp.
4.65%, 10/17/21 | | | | | 146 | | | | 165,894 | |
SLM Corp.
7.25%, 1/25/22 | | | | | 160 | | | | 175,600 | |
Series A
5.375%, 1/15/13 | | | | | 306 | | | | 307,232 | |
| | | | | | | | | | |
| | | | | | | | | 648,726 | |
| | | | | | | | | | |
Insurance – 0.7% | | | | | | | | | | |
Allied World Assurance Co., Ltd.
7.50%, 8/01/16 | | | | | 165 | | | | 195,210 | |
American International Group, Inc.
4.875%, 6/01/22 | | | | | 75 | | | | 84,387 | |
6.40%, 12/15/20 | | | | | 340 | | | | 416,864 | |
| | |
| 36 | | • ALLIANCEBERNSTEIN GLOBAL RISK ALLOCATION FUND |
Portfolio of Investments
| | | | | | | | | | |
| | | | | Principal
Amount
(000) | | | U.S. $ Value | |
| | | | | |
| | | | | | | | | | |
Coventry Health Care, Inc.
5.95%, 3/15/17 | | U.S.$ | | | 130 | | | $ | 152,095 | |
6.30%, 8/15/14 | | | | | 260 | | | | 281,803 | |
Guardian Life Insurance Co. of America
7.375%, 9/30/39(a) | | | | | 247 | | | | 338,139 | |
Hartford Financial Services Group, Inc.
4.00%, 3/30/15 | | | | | 120 | | | | 126,552 | |
5.50%, 3/30/20 | | | | | 207 | | | | 237,170 | |
Humana, Inc.
7.20%, 6/15/18 | | | | | 355 | | | | 440,577 | |
Lincoln National Corp.
8.75%, 7/01/19 | | | | | 172 | | | | 228,218 | |
Massachusetts Mutual Life Insurance Co.
8.875%, 6/01/39(a) | | | | | 130 | | | | 199,835 | |
Metlife Capital Trust IV
7.875%, 12/15/37(a) | | | | | 260 | | | | 317,200 | |
MetLife, Inc.
7.717%, 2/15/19 | | | | | 158 | | | | 207,934 | |
Nationwide Mutual Insurance Co.
5.81%, 12/15/24(a) | | | | | 493 | | | | 470,394 | |
WellPoint, Inc.
3.30%, 1/15/23 | | | | | 148 | | | | 152,266 | |
XL Group PLC
5.25%, 9/15/14 | | | | | 68 | | | | 72,403 | |
| | | | | | | | | | |
| | | | | | | | | 3,921,047 | |
| | | | | | | | | | |
Other Finance – 0.1% | | | | | | | | | | |
ORIX Corp.
4.71%, 4/27/15 | | | | | 272 | | | | 289,329 | |
| | | | | | | | | | |
| | | |
REITS – 0.2% | | | | | | | | | | |
ERP Operating LP
5.25%, 9/15/14 | | | | | 355 | | | | 380,534 | |
HCP, Inc.
5.375%, 2/01/21 | | | | | 380 | | | | 437,250 | |
Health Care REIT, Inc.
5.25%, 1/15/22 | | | | | 380 | | | | 428,133 | |
Healthcare Realty Trust, Inc.
5.75%, 1/15/21 | | | | | 230 | | | | 257,534 | |
| | | | | | | | | | |
| | | | | | | | | 1,503,451 | |
| | | | | | | | | | |
| | | | | | | | | 14,665,348 | |
| | | | | | | | | | |
Utility – 1.0% | | | | | | | | | | |
Electric – 0.4% | | | | | | | | | | |
Constellation Energy Group, Inc.
5.15%, 12/01/20 | | | | | 69 | | | | 79,968 | |
FirstEnergy Corp. Series C
7.375%, 11/15/31 | | | | | 395 | | | | 518,257 | |
MidAmerican Energy Holdings Co.
6.125%, 4/01/36 | | | | | 300 | | | | 385,850 | |
Nisource Finance Corp.
6.80%, 1/15/19 | | | | | 355 | | | | 432,989 | |
Pacific Gas & Electric Co.
4.50%, 12/15/41 | | | | | 140 | | | | 154,001 | |
| | | | |
| ALLIANCEBERNSTEIN GLOBAL RISK ALLOCATION FUND • | | | 37 | |
Portfolio of Investments
| | | | | | | | | | |
| | | | | Principal
Amount
(000) | | | U.S. $ Value | |
| | | | | |
| | | | | | | | | | |
SPI Electricity & Gas Australia Holdings Pty Ltd.
6.15%, 11/15/13(a) | | U.S.$ | | | 385 | | | $ | 399,201 | |
TECO Finance, Inc.
4.00%, 3/15/16 | | | | | 135 | | | | 145,066 | |
5.15%, 3/15/20 | | | | | 160 | | | | 187,978 | |
| | | | | | | | | | |
| | | | | | | | | 2,303,310 | |
| | | | | | | | | | |
Natural Gas – 0.6% | | | | | | | | | | |
DCP Midstream LLC
5.35%, 3/15/20(a) | | | | | 181 | | | | 200,427 | |
Energy Transfer Partners LP
6.70%, 7/01/18 | | | | | 370 | | | | 450,505 | |
Enterprise Products Operating LLC
5.20%, 9/01/20 | | | | | 63 | | | | 75,114 | |
EQT Corp.
8.125%, 6/01/19 | | | | | 266 | | | | 332,374 | |
Kinder Morgan Energy Partners LP
3.95%, 9/01/22 | | | | | 362 | | | | 386,019 | |
4.15%, 3/01/22 | | | | | 116 | | | | 124,981 | |
ONEOK, Inc.
4.25%, 2/01/22 | | | | | 360 | | | | 394,091 | |
Talent Yield Investments Ltd.
4.50%, 4/25/22(a) | | | | | 370 | | | | 403,836 | |
TransCanada PipeLines Ltd.
6.35%, 5/15/67 | | | | | 405 | | | | 435,307 | |
Williams Partners LP
5.25%, 3/15/20 | | | | | 293 | | | | 340,877 | |
| | | | | | | | | | |
| | | | | | | | | 3,143,531 | |
| | | | | | | | | | |
| | | | | | | | | 5,446,841 | |
| | | | | | | | | | |
Non Corporate Sectors – 0.1% | | | | | | | | | | |
Agencies - Not Government
Guaranteed – 0.1% | | | | | | | | | | |
Petrobras International Finance Co. – Pifco
5.75%, 1/20/20 | | | | | 330 | | | | 376,986 | |
| | | | | | | | | | |
| | | |
Total Corporates - Investment Grades
(cost $34,621,960) | | | | | | | | | 38,630,345 | |
| | | | | | | | | | |
| | | | | | | | | | |
AGENCIES – 3.1% | | | | | | | | | | |
Agency Debentures – 3.1% | | | | | | | | | | |
Federal Farm Credit Bank
0.258%, 4/26/13(e) | | | | | 5,845 | | | | 5,847,309 | |
0.268%, 6/26/13(e) | | | | | 2,700 | | | | 2,701,539 | |
Federal Home Loan Mortgage Corp.
2.375%, 1/13/22 | | | | | 1,706 | | | | 1,793,068 | |
Federal National Mortgage Association
6.25%, 5/15/29 | | | | | 2,651 | | | | 3,873,845 | |
Residual Funding Corp. Principal Strip
Zero Coupon, 7/15/20 | | | | | 3,475 | | | | 3,094,915 | |
| | | | | | | | | | |
| | | |
Total Agencies
(cost $15,860,200) | | | | | | | | | 17,310,676 | |
| | | | | | | | | | |
| | |
| 38 | | • ALLIANCEBERNSTEIN GLOBAL RISK ALLOCATION FUND |
Portfolio of Investments
| | | | | | | | | | |
| | | | | Principal
Amount
(000) | | | U.S. $ Value | |
| | | | | |
| | | | | | | | | | |
MORTGAGE PASS-THROUGHS – 1.3% | | | | | | | | | | |
Agency Fixed Rate 30-Year – 1.3% | | | | | | | | | | |
Federal National Mortgage Association
3.00%, TBA | | U.S.$ | | | 3,710 | | | $ | 3,903,616 | |
3.50%, TBA | | | | | 3,100 | | | | 3,309,734 | |
| | | | | | | | | | |
Total Mortgage Pass-Throughs
(cost $7,171,949) | | | | | | | | | 7,213,350 | |
| | | | | | | | | | |
| | | | | | | | | | |
CORPORATES - NON-INVESTMENT GRADES – 0.4% | | | | | | | | | | |
Industrial – 0.3% | | | | | | | | | | |
Basic – 0.1% | | | | | | | | | | |
ArcelorMittal USA LLC
6.125%, 6/01/18 | | | | | 158 | | | | 157,740 | |
LyondellBasell Industries NV
5.75%, 4/15/24 | | | | | 400 | | | | 480,000 | |
| | | | | | | | | | |
| | | | | | | | | 637,740 | |
| | | | | | | | | | |
Capital Goods – 0.1% | | | | | | | | | | |
B/E Aerospace, Inc.
5.25%, 4/01/22 | | | | | 220 | | | | 232,100 | |
Ball Corp.
5.00%, 3/15/22 | | | | | 220 | | | | 233,200 | |
| | | | | | | | | | |
| | | | | | | | | 465,300 | |
| | | | | | | | | | |
Consumer Cyclical - Other – 0.1% | | | | | | | | | | |
Host Hotels & Resorts LP
5.25%, 3/15/22 | | | | | 145 | | | | 159,137 | |
Wynn Las Vegas LLC/Wynn Las Vegas Capital Corp.
5.375%, 3/15/22 | | | | | 220 | | | | 233,200 | |
| | | | | | | | | | |
| | | | | | | | | 392,337 | |
| | | | | | | | | | |
Consumer Cyclical - Retailers – 0.0% | | | | | | | | | | |
Dollar General Corp.
4.125%, 7/15/17 | | | | | 69 | | | | 72,450 | |
| | | | | | | | | | |
| | | |
Energy – 0.0% | | | | | | | | | | |
Cimarex Energy Co.
5.875%, 5/01/22 | | | | | 108 | | | | 115,560 | |
| | | | | | | | | | |
| | | | | | | | | 1,683,387 | |
| | | | | | | | | | |
Financial Institutions – 0.1% | | | | | | | | | | |
Other Finance – 0.1% | | | | | | | | | | |
Aviation Capital Group Corp.
7.125%, 10/15/20(a) | | | | | 192 | | | | 202,580 | |
| | | | | | | | | | |
| | | |
Utility – 0.0% | | | | | | | | | | |
Electric – 0.0% | | | | | | | | | | |
CMS Energy Corp.
5.05%, 3/15/22 | | | | | 119 | | | | 132,140 | |
| | | | | | | | | | |
| | | |
Total Corporates - Non-Investment Grades
(cost $1,853,037) | | | | | | | | | 2,018,107 | |
| | | | | | | | | | |
| | | | |
| ALLIANCEBERNSTEIN GLOBAL RISK ALLOCATION FUND • | | | 39 | |
Portfolio of Investments
| | | | | | | | | | |
| | | | | Principal
Amount
(000) | | | U.S. $ Value | |
| | | | | |
| | | | | | | | | | |
QUASI-SOVEREIGNS – 0.2% | | | | | | | | | | |
Quasi-Sovereign Bonds – 0.2% | | | | | | | | | | |
Kazakhstan – 0.1% | | | | | | | | | | |
KazMunayGas National Co.
7.00%, 5/05/20(a) | | U.S.$ | | | 301 | | | $ | 374,679 | |
| | | | | | | | | | |
| | | |
Malaysia – 0.1% | | | | | | | | | | |
Petronas Capital Ltd.
5.25%, 8/12/19(a) | | | | | 435 | | | | 522,872 | |
| | | | | | | | | | |
| | | |
Total Quasi-Sovereigns
(cost $734,157) | | | | | | | | | 897,551 | |
| | | | | | | | | | |
| | | | | | | | | | |
ASSET-BACKED SECURITY – 0.0% | | | | | | | | | | |
Home Equity Loans - Floating Rate – 0.0% | | | | | | | | | | |
Option One Mortgage Loan Trust
Series 2007-2, Class M1
0.568%, 3/25/37(e)(f)
(cost $494,374) | | | | | 494 | | | | 1,196 | |
| | | | | | | | | | |
| | | |
| | | | | Shares | | | | |
PREFERRED STOCKS – 0.0% | | | | | | | | | | |
Industrials – 0.0% | | | | | | | | | | |
Aerospace & Defense – 0.0% | | | | | | | | | | |
Rolls-Royce Holdings PLC
0.00%(b)
(cost $1,036) | | | | | 649,800 | | | | 1,041 | |
| | | | | | | | | | |
| | | | | | | | | | |
SHORT-TERM INVESTMENTS – 15.2% | | | | | | | | | | |
Investment Companies – 15.2% | | | | | | | | | | |
AllianceBernstein Fixed-Income Shares, Inc. -Government STIF Portfolio, 0.15%(g)
(cost $85,027,112) | | | | | 85,027,112 | | | | 85,027,112 | |
| | | | | | | | | | |
Total Investments Before Security Lending Collateral for Securities Loaned – 98.2%
(cost $540,468,230) | | | | | | | | | 550,098,675 | |
| | | | | | | | | | |
| | | | | | | | | | |
INVESTMENTS OF CASH COLLATERAL FOR SECURITIES LOANED – 0.0% | | | | | | | | | | |
Investment Companies – 0.0% | | | | | | | | | | |
| | | |
AllianceBernstein Exchange Reserves - Class I, 0.13%(g)
(cost $101,175) | | | | | 101,175 | | | | 101,175 | |
| | | | | | | | | | |
| | | |
Total Investments – 98.2%
(cost $540,569,405) | | | | | | | | | 550,199,850 | |
Other assets less liabilities – 1.8% | | | | | | | | | 10,193,207 | |
| | | | | | | | | | |
| | | |
Net Assets – 100.0% | | | | | | | | $ | 560,393,057 | |
| | | | | | | | | | |
| | |
| 40 | | • ALLIANCEBERNSTEIN GLOBAL RISK ALLOCATION FUND |
Portfolio of Investments
FUTURES CONTRACTS (see Note D)
| | | | | | | | | | | | | | | | | | | | |
| Type | | Number of
Contracts | | | Expiration Month | | | Original Value | | | Value at November 30, 2012 | | | Unrealized Appreciation/ (Depreciation) | |
Purchased Contracts | |
10 Yr Govt of Canada Bond Futures | | | 326 | | | | March 2013 | | | $ | 44,543,261 | | | $ | 44,865,818 | | | $ | 322,557 | |
10 Yr JGB Mini Futures | | | 135 | | | | December 2012 | | | | 23,606,851 | | | | 23,727,968 | | | | 121,117 | |
Australian T-Bond 10 Yr Futures | | | 151 | | | | December 2012 | | | | 19,700,851 | | | | 19,692,844 | | | | (8,008 | ) |
German Euro Bund Futures | | | 230 | | | | March 2013 | | | | 43,237,365 | | | | 43,226,797 | | | | (10,568 | ) |
MSCI EAFE Mini Index Futures | | | 252 | | | | December 2012 | | | | 19,183,500 | | | | 19,647,180 | | | | 463,680 | |
MSCI Emerging Market Mini Futures | | | 283 | | | | December 2012 | | | | 14,088,544 | | | | 14,224,995 | | | | 136,451 | |
S&P 500 E Mini Index Futures | | | 361 | | | | December 2012 | | | | 25,388,495 | | | | 25,529,920 | | | | 141,425 | |
S&P TSE 60 Index Futures | | | 13 | | | | December 2012 | | | | 1,828,935 | | | | 1,837,157 | | | | 8,223 | |
U.S. T-Note 10 Yr Futures | | | 305 | | | | March 2013 | | | | 40,603,677 | | | | 40,760,390 | | | | 156,713 | |
UK Long Gilt Bond Futures | | | 234 | | | | March 2013 | | | | 44,557,602 | | | | 44,744,705 | | | | 187,103 | |
| | | | | | | | | | | | | | | | | | | | |
| | | | | | | | | | | | | | | | | | $ | 1,518,693 | |
| | | | | | | | | | | | | | | | | | | | |
FORWARD CURRENCY EXCHANGE CONTRACTS (see Note D)
| | | | | | | | | | | | | | | | | | | | | | | | |
| Counterparty | | Contracts to Deliver (000) | | | In Exchange For (000) | | | Settlement
Date | | | Unrealized Appreciation/ (Depreciation) | |
Barclays Bank PLC Wholesale | | | GBP | | | | 254 | | | | USD | | | | 407 | | | | 12/06/12 | | | $ | (642 | ) |
Barclays Bank PLC Wholesale | | | NOK | | | | 141,609 | | | | USD | | | | 24,711 | | | | 12/14/12 | | | | (279,862 | ) |
Barclays Bank PLC Wholesale | | | CAD | | | | 12,888 | | | | USD | | | | 12,949 | | | | 12/20/12 | | | | (19,939 | ) |
BNP Paribas SA | | | EUR | | | | 585 | | | | USD | | | | 748 | | | | 12/06/12 | | | | (12,418 | ) |
Brown Brothers Harriman & Co. | | | USD | | | | 222 | | | | CAD | | | | 223 | | | | 3/15/13 | | | | 1,811 | |
Citibank NA | | | EUR | | | | 509 | | | | USD | | | | 658 | | | | 12/06/12 | | | | (3,798 | ) |
| | | | |
| ALLIANCEBERNSTEIN GLOBAL RISK ALLOCATION FUND • | | | 41 | |
Portfolio of Investments
| | | | | | | | | | | | | | | | | | | | | | | | |
| Counterparty | | Contracts to
Deliver (000) | | | In Exchange
For (000) | | | Settlement
Date | | | Unrealized
Appreciation/
(Depreciation) | |
Citibank NA | | | SEK | | | | 153,169 | | | | USD | | | | 22,845 | | | | 12/14/12 | | | $ | (169,995 | ) |
Deutsche Bank AG London | | | GBP | | | | 5,491 | | | | USD | | | | 8,757 | | | | 12/06/12 | | | | (39,959 | ) |
Deutsche Bank AG London | | | USD | | | | 1,160 | | | | CAD | | | | 1,153 | | | | 12/14/12 | | | | 959 | |
Deutsche Bank AG London | | | CAD | | | | 1,335 | | | | USD | | | | 1,337 | | | | 12/20/12 | | | | (6,173 | ) |
Goldman Sachs Capital Markets LP | | | EUR | | | | 18,270 | | | | USD | | | | 23,710 | | | | 12/06/12 | | | | (51,689 | ) |
Goldman Sachs Capital Markets LP | | | AUD | | | | 24,055 | | | | USD | | | | 25,030 | | | | 1/18/13 | | | | 13,450 | |
JPMorgan Chase Bank NA | | | NOK | | | | 1,210 | | | | USD | | | | 211 | | | | 12/14/12 | | | | (2,792 | ) |
JPMorgan Chase Bank NA | | | SEK | | | | 1,075 | | | | USD | | | | 160 | | | | 12/14/12 | | | | (1,090 | ) |
JPMorgan Chase Bank NA | | | CAD | | | | 3,240 | | | | USD | | | | 3,229 | | | | 12/20/12 | | | | (31,708 | ) |
Royal Bank of Canada | | | EUR | | | | 13,788 | | | | USD | | | | 17,986 | | | | 12/06/12 | | | | 53,235 | |
Royal Bank of Scotland PLC | | | USD | | | | 1,542 | | | | CAD | | | | 1,532 | | | | 12/20/12 | | | | 62 | |
Royal Bank of Scotland PLC | | | TRY | | | | 36,874 | | | | USD | | | | 20,389 | | | | 12/21/12 | | | | (201,924 | ) |
State Street Bank & Trust Co. | | | EUR | | | | 9,128 | | | | USD | | | | 11,625 | | | | 12/06/12 | | | | (247,794 | ) |
State Street Bank & Trust Co. | | | GBP | | | | 5,604 | | | | USD | | | | 8,936 | | | | 12/06/12 | | | | (42,742 | ) |
State Street Bank & Trust Co. | | | USD | | | | 451 | | | | EUR | | | | 347 | | | | 12/06/12 | | | | 1,247 | |
State Street Bank & Trust Co. | | | NOK | | | | 5,092 | | | | USD | | | | 882 | | | | 12/14/12 | | | | (16,719 | ) |
State Street Bank & Trust Co. | | | SEK | | | | 4,790 | | | | USD | | | | 704 | | | | 12/14/12 | | | | (15,854 | ) |
State Street Bank & Trust Co. | | | USD | | | | 350 | | | | NOK | | | | 1,996 | | | | 12/14/12 | | | | 1,723 | |
State Street Bank & Trust Co. | | | USD | | | | 261 | | | | SEK | | | | 1,728 | | | | 12/14/12 | | | | (1,092 | ) |
State Street Bank & Trust Co. | | | CAD | | | | 524 | | | | USD | | | | 525 | | | | 12/20/12 | | | | (2,281 | ) |
State Street Bank & Trust Co. | | | TRY | | | | 4,391 | | | | USD | | | | 2,434 | | | | 12/21/12 | | | | (17,535 | ) |
State Street Bank & Trust Co. | | | USD | | | | 2,150 | | | | TRY | | | | 3,854 | | | | 12/21/12 | | | | 2,474 | |
State Street Bank & Trust Co. | | | AUD | | | | 153 | | | | USD | | | | 159 | | | | 1/18/13 | | | | (110 | ) |
State Street Bank & Trust Co. | | | USD | | | | 387 | | | | CAD | | | | 387 | | | | 3/15/13 | | | | 1,766 | |
UBS AG | | | EUR | | | | 3,564 | | | | USD | | | | 4,590 | | | | 12/06/12 | | | | (45,907 | ) |
Westpac Banking Corp. | | | NZD | | | | 30,627 | | | | USD | | | | 25,063 | | | | 1/18/13 | | | | (6,678 | ) |
| | | | | | | | | | | | | | | | | | | | | | | | |
| | | | | | | | | | | | | | | | | | | | | | $ | (1,141,974 | ) |
| | | | | | | | | | | | | | | | | | | | | | | | |
INTEREST RATE SWAP CONTRACTS (see Note D)
| | | | | | | | | | | | | | | | | | | | | | | | |
| | | | | | | | | | | | Rate Type | | | | |
Swap
Counterparty | | Notional
Amount (000) | | | Termination
Date | | | Payments
made by the Fund | | | Payments
received
by the
Fund | | | Unrealized
Appreciation/
(Depreciation) | |
Barclays Bank PLC | | | NOK | | | | 12,150 | | | | 11/23/22 | | | | 6 Month NIBOR | | | | 3.198 | % | | $ | 13,991 | |
Barclays Bank PLC | | | NZD | | | | 4,240 | | | | 11/30/22 | | | | 3 Month LIBOR | | | | 3.673 | % | | | (2,094 | ) |
| | |
| 42 | | • ALLIANCEBERNSTEIN GLOBAL RISK ALLOCATION FUND |
Portfolio of Investments
| | | | | | | | | | | | | | | | | | |
| | | | | | | | | | Rate Type | | | | |
Swap
Counterparty | | Notional
Amount (000) | | | Termination
Date | | Payments
made by the Fund | | Payments
received
by the
Fund | | | Unrealized
Appreciation/
(Depreciation) | |
Barclays Bank PLC | | SEK | | | 16,660 | | | 11/30/22 | | 3 Month STIBOR | | | 2.043 | % | | $ | (4,848 | ) |
Citibank, NA | | NOK | | | 4,970 | | | 11/19/22 | | 6 Month NIBOR | | | 3.125 | % | | | 440 | |
Citibank, NA | | SEK | | | 19,750 | | | 11/19/22 | | 3 Month STIBOR | | | 2.023 | % | | | (10,255 | ) |
Citibank, NA | | NZD | | | 3,940 | | | 11/23/22 | | 3 Month LIBOR | | | 3.715 | % | | | 10,756 | |
Citibank, NA | | SEK | | | 13,600 | | | 11/23/22 | | 3 Month STIBOR | | | 2.085 | % | | | 4,462 | |
Citibank, NA | | NOK | | | 16,180 | | | 11/30/22 | | 6 Month NIBOR | | | 3.12 | % | | | (1,349 | ) |
Morgan Stanley Capital Services LLC | | NZD | | | 16,100 | | | 10/24/22 | | 3 Month LIBOR | | | 3.67 | % | | | 13,106 | |
Morgan Stanley Capital Services LLC | | NOK | | | 74,480 | | | 10/24/22 | | 6 Month NIBOR | | | 3.255 | % | | | 168,803 | |
Morgan Stanley Capital Services LLC | | SEK | | | 86,550 | | | 10/24/22 | | 3 Month STIBOR | | | 2.185 | % | | | 156,671 | |
| | | | | | | | | | | | | | | | | | |
| | | | | | | | | | | | | | | | $ | 349,683 | |
| | | | | | | | | | | | | | | | | | |
CREDIT DEFAULT SWAP CONTRACTS (see Note D)
| | | | | | | | | | | | | | | | | | | | | | | | |
Swap Counterparty &
Referenced Obligation | | Fixed
Rate
(Pay)
Receive | | | Implied
Credit
Spread at
November 30,
2012 | | | Notional
Amount
(000) | | | Market
Value | | | Upfront
Premiums
Paid
(Received) | | | Unrealized
Appreciation/
(Depreciation) | |
Sale Contracts | | | | | | | | | | | | | | | | | | | | | | | | |
Bank of America, NA CDX-NAHYS19V1-
5 Year, 12/20/17* | | | 5.00 | % | | | 5.00 | % | | $ | 7,360 | | | $ | 73,600 | | | $ | 36,038 | | | $ | 37,562 | |
iTraxx-XOVERS18V1-
5 Year, 12/20/17* | | | 5.00 | | | | 4.96 | | | EUR | 310 | | | | 4,593 | | | | (7,577 | ) | | | 12,170 | |
Barclays Bank PLC CDX-NAHYS19V1-
5 Year, 12/20/17* | | | 5.00 | | | | 5.00 | | | $ | 2,030 | | | | 20,300 | | | | (28,078 | ) | | | 48,378 | |
iTraxx-XOVERS18V1-
5 Year, 12/20/17* | | | 5.00 | | | | 4.96 | | | EUR | 350 | | | | 5,241 | | | | (3,141 | ) | | | 8,382 | |
Citibank, NA CDX-NAHYS19V1-
5 Year, 12/20/17* | | | 5.00 | | | | 5.00 | | | $ | 970 | | | | 9,700 | | | | (26,759 | ) | | | 36,459 | |
iTraxx-XOVERS18V1-
5 Year, 12/20/17* | | | 5.00 | | | | 4.96 | | | EUR | 2,420 | | | | 36,250 | | | | 6,458 | | | | 29,792 | |
Goldman Sachs Bank USA CDX-NAHYS19V1-
5 Year, 12/20/17* | | | 5.00 | | | | 5.00 | | | $ | 1,040 | | | | 10,400 | | | | (11,142 | ) | | | 21,542 | |
iTraxx-XOVERS18V1-
5 Year, 12/20/17* | | | 5.00 | | | | 4.96 | | | EUR | 680 | | | | 10,105 | | | | (6,399 | ) | | | 16,504 | |
| | | | | | | | | | | | | | | | | | | | | | | | |
| | | | | | | | | | | | | | $ | 170,189 | | | $ | (40,600 | ) | | $ | 210,789 | |
| | | | | | | | | | | | | | | | | | | | | | | | |
| | | | |
| ALLIANCEBERNSTEIN GLOBAL RISK ALLOCATION FUND • | | | 43 | |
Portfolio of Investments
| (a) | | Security is exempt from registration under Rule 144A of the Securities Act of 1933. These securities are considered liquid and may be resold in transactions exempt from registration, normally to qualified institutional buyers. At November 30, 2012, the aggregate market value of these securities amounted to $15,109,365 or 2.7% of net assets. |
| (b) | | Non-income producing security. |
| (c) | | Represents entire or partial securities out on loan. See Note E for securities lending information. |
| (d) | | Coupon rate adjusts periodically based upon a predetermined schedule. Stated interest rate in effect at November 30, 2012. |
| (e) | | Floating Rate Security. Stated interest rate was in effect at November 30, 2012. |
| (g) | | Investment in affiliated money market mutual fund. The rate shown represents the 7-day yield as of period end. |
Currency Abbreviation:
AUD – Australian Dollar
CAD – Canadian Dollar
EUR – Euro
GBP – Great British Pound
NOK – Norwegian Krone
NZD – New Zealand Dollar
SEK – Swedish Krona
TRY – Turkish Lira
USD – United States Dollar
Glossary:
CDX-NAHY – North American High Yield Credit Default Swap Index
LIBOR – London Interbank Offered Rates
NIBOR – Norwegian Interbank Offered Rate
REG – Registered Shares
STIBOR – Stockholm Interbank Offered Rate
TBA – To Be Announced
TIPS – Treasury Inflation Protected Security
See notes to financial statements.
| | |
| 44 | | • ALLIANCEBERNSTEIN GLOBAL RISK ALLOCATION FUND |
Portfolio of Investments
STATEMENT OF ASSETS & LIABILITIES
November 30, 2012
| | | | |
| Assets | | | | |
Investments in securities, at value | | | | |
Unaffiliated issuers (cost $455,441,118) | | $ | 465,071,563 | (a) |
Affiliated issuers (cost $85,128,287—including investment of cash collateral for securities loaned of $101,175) | | | 85,128,287 | |
Cash | | | 6,676,059 | (b) |
Foreign currencies, at value (cost $56,714) | | | 55,659 | |
Receivable for investment securities sold and foreign
currency transactions | | | 10,387,035 | |
Interest and dividends receivable | | | 2,673,010 | |
Receivable for capital stock sold | | | 1,765,443 | |
Unrealized appreciation on interest rate swap contracts | | | 368,229 | |
Unrealized appreciation on credit default swap contracts | | | 210,789 | |
Receivable for variation margin on futures contracts | | | 147,253 | |
Unrealized appreciation of forward currency
exchange contracts | | | 76,727 | |
Premium paid on credit default swap contracts | | | 42,496 | |
| | | | |
Total assets | | | 572,602,550 | |
| | | | |
| Liabilities | | | | |
Payable for investment securities purchased and foreign
currency transactions | | | 7,180,063 | |
Payable for capital stock redeemed | | | 2,910,342 | |
Unrealized depreciation of forward currency
exchange contracts | | | 1,218,701 | |
Advisory fee payable | | | 230,528 | |
Distribution fee payable | | | 186,608 | |
Payable for collateral received on securities loaned | | | 101,175 | |
Premium received on credit default swap contracts | | | 83,096 | |
Transfer Agent fee payable | | | 56,807 | |
Unrealized depreciation on interest rate swap contracts | | | 18,546 | |
Administrative fee payable | | | 17,246 | |
Accrued expenses | | | 206,381 | |
| | | | |
Total liabilities | | | 12,209,493 | |
| | | | |
Net Assets | | $ | 560,393,057 | |
| | | | |
| Composition of Net Assets | | | | |
Capital stock, at par | | $ | 320,234 | |
Additional paid-in capital | | | 511,145,255 | |
Undistributed net investment income | | | 2,573,992 | |
Accumulated net realized gain on investment
and foreign currency transactions | | | 35,770,749 | |
Net unrealized appreciation on investments
and foreign currency denominated assets and liabilities | | | 10,582,827 | |
| | | | |
| | $ | 560,393,057 | |
| | | | |
| (a) | | Includes securities on loan with a value of $99,104 (see Note E). |
| (b) | | An amount of $6,673,973 has been segregated to collateralize margin requirements for open futures contracts outstanding at November 30, 2012. |
See notes to financial statements.
| | | | |
| ALLIANCEBERNSTEIN GLOBAL RISK ALLOCATION FUND • | | | 45 | |
Statement of Assets & Liabilities
Net Asset Value Per Share—21 billion shares of capital stock authorized, $.01 par value
| | | | | | | | | | | | |
| Class | | Net Assets | | | Shares
Outstanding | | | Net Asset
Value | |
| |
| A | | $ | 400,684,933 | | | | 22,615,781 | | | $ | 17.72 | * |
| |
| B | | $ | 35,786,149 | | | | 2,159,307 | | | $ | 16.57 | |
| |
| C | | $ | 72,294,608 | | | | 4,339,594 | | | $ | 16.66 | |
| |
| Advisor | | $ | 42,277,958 | | | | 2,379,632 | | | $ | 17.77 | |
| |
| R | | $ | 5,703,795 | | | | 322,999 | | | $ | 17.66 | |
| |
| K | | $ | 2,691,758 | | | | 152,236 | | | $ | 17.68 | |
| |
| I | | $ | 953,856 | | | | 53,840 | | | $ | 17.72 | |
| |
| * | | The maximum offering price per share for Class A shares was $18.51 which reflects a sales charge of 4.25%. |
See notes to financial statements.
| | |
| 46 | | • ALLIANCEBERNSTEIN GLOBAL RISK ALLOCATION FUND |
Statement of Assets & Liabilities
STATEMENT OF OPERATIONS
Year Ended November 30, 2012
| | | | | | | | |
| Investment Income | | | | | | | | |
Dividends | | | | | | | | |
Unaffiliated issuers (net of foreign taxes withheld of $3,904) | | $ | 7,348,123 | | | | | |
Affiliated issuers | | | 49,162 | | | | | |
Interest | | | 5,881,805 | | | | | |
Securities lending income | | | 7,363 | | | $ | 13,286,453 | |
| | | | | | | | |
| Expenses | | | | | | | | |
Advisory fee (see Note B) | | | 2,820,203 | | | | | |
Distribution fee—Class A | | | 1,137,233 | | | | | |
Distribution fee—Class B | | | 437,265 | | | | | |
Distribution fee—Class C | | | 707,625 | | | | | |
Distribution fee—Class R | | | 29,765 | | | | | |
Distribution fee—Class K | | | 6,928 | | | | | |
Transfer agency—Class A | | | 711,826 | | | | | |
Transfer agency—Class B | | | 102,146 | | | | | |
Transfer agency—Class C | | | 137,636 | | | | | |
Transfer agency—Advisor Class | | | 68,424 | | | | | |
Transfer agency—Class R | | | 15,478 | | | | | |
Transfer agency—Class K | | | 5,542 | | | | | |
Transfer agency—Class I | | | 177 | | | | | |
Custodian | | | 204,227 | | | | | |
Registration fees | | | 121,342 | | | | | |
Administrative | | | 80,701 | | | | | |
Directors’ fees | | | 56,387 | | | | | |
Audit | | | 53,194 | | | | | |
Printing | | | 43,629 | | | | | |
Legal | | | 40,571 | | | | | |
Miscellaneous | | | 25,952 | | | | | |
| | | | | | | | |
Total expenses | | | | | | | 6,806,251 | |
| | | | | | | | |
Net investment income | | | | | | | 6,480,202 | |
| | | | | | | | |
| Realized and Unrealized Gain (Loss) on Investment and Foreign Currency Transactions | | | | | | | | |
Net realized gain (loss) on: | | | | | | | | |
Investment transactions | | | | | | | 107,234,243 | |
Futures contracts | | | | | | | 1,258,588 | |
Swap contracts | | | | | | | (433,581 | ) |
Foreign currency transactions | | | | | | | 593,207 | |
Net change in unrealized appreciation/depreciation of: | | | | | | | | |
Investments | | | | | | | (28,722,736 | ) |
Futures contracts | | | | | | | 1,518,693 | |
Swap contracts | | | | | | | 642,881 | |
Foreign currency denominated assets and liabilities | | | | | | | (1,126,783 | ) |
| | | | | | | | |
Net gain on investment and foreign currency transactions | | | | | | | 80,964,512 | |
| | | | | | | | |
Net Increase in Net Assets from Operations | | | | | | $ | 87,444,714 | |
| | | | | | | | |
See notes to financial statements.
| | | | |
| ALLIANCEBERNSTEIN GLOBAL RISK ALLOCATION FUND • | | | 47 | |
Statement of Operations
STATEMENT OF CHANGES IN NET ASSETS
| | | | | | | | |
| | | Year Ended
November 30,
2012 | | | Year Ended
November 30,
2011 | |
Increase (Decrease) in Net Assets
from Operations | | | | | | | | |
Net investment income | | $ | 6,480,202 | | | $ | 8,677,220 | |
Net realized gain on investment and foreign currency transactions | | | 108,652,457 | | | | 46,359,869 | |
Net change in unrealized appreciation/depreciation of investments and foreign currency denominated assets and liabilities | | | (27,687,945 | ) | | | (7,366,865 | ) |
| | | | | | | | |
Net increase in net assets from operations | | | 87,444,714 | | | | 47,670,224 | |
| Dividends to Shareholders from | | | | | | | | |
Net investment income | | | | | | | | |
Class A | | | (5,695,790 | ) | | | (6,964,919 | ) |
Class B | | | (359,155 | ) | | | (753,943 | ) |
Class C | | | (605,513 | ) | | | (836,134 | ) |
Advisor Class | | | (615,005 | ) | | | (601,071 | ) |
Class R | | | (67,478 | ) | | | (98,608 | ) |
Class K | | | (40,422 | ) | | | (48,477 | ) |
Class I | | | (16,248 | ) | | | (25,053 | ) |
| Capital Stock Transactions | | | | | | | | |
Net decrease | | | (54,313,489 | ) | | | (100,081,948 | ) |
| | | | | | | | |
Total increase (decrease) | | | 25,731,614 | | | | (61,739,929 | ) |
| Net Assets | | | | | | | | |
Beginning of period | | | 534,661,443 | | | | 596,401,372 | |
| | | | | | | | |
End of period (including undistributed net investment income of $2,573,992 and $1,742,013, respectively) | | $ | 560,393,057 | | | $ | 534,661,443 | |
| | | | | | | | |
See notes to financial statements.
| | |
| 48 | | • ALLIANCEBERNSTEIN GLOBAL RISK ALLOCATION FUND |
Statement of Changes in Net Assets
NOTES TO FINANCIAL STATEMENTS
November 30, 2012
NOTE A
Significant Accounting Policies
AllianceBernstein Global Risk Allocation Fund, Inc. (formerly, known as AllianceBernstein Balanced Shares, Inc.) (the “Fund”) is registered under the Investment Company Act of 1940 as a diversified, open-end management investment company. The Fund offers Class A, Class B, Class C, Advisor Class, Class R, Class K and Class I shares. Class A shares are sold with a front-end sales charge of up to 4.25% for purchases not exceeding $1,000,000. With respect to purchases of $1,000,000 or more, Class A shares redeemed within one year of purchase may be subject to a contingent deferred sales charge of 1%. Class B shares are currently sold with a contingent deferred sales charge which declines from 4% to zero depending on the period of time the shares are held. Effective January 31, 2009, sales of Class B shares of the Fund to new investors were suspended. Class B shares will only be issued (i) upon the exchange of Class B shares from another AllianceBernstein Mutual Fund, (ii) for purposes of dividend reinvestment, (iii) through the Fund’s Automatic Investment Program (the “Program”) for accounts that established the Program prior to January 31, 2009, and (iv) for purchases of additional shares by Class B shareholders as of January 31, 2009. The ability to establish a new Program for accounts containing Class B shares was suspended as of January 31, 2009. Class B shares will automatically convert to Class A shares eight years after the end of the calendar month of purchase. Class C shares are subject to a contingent deferred sales charge of 1% on redemptions made within the first year after purchase. Class R and Class K shares are sold without an initial or contingent deferred sales charge. Advisor Class and Class I shares are sold without an initial or contingent deferred sales charge and are not subject to ongoing distribution expenses. All seven classes of shares have identical voting, dividend, liquidation and other rights, except that the classes bear different distribution and transfer agency expenses. Each class has exclusive voting rights with respect to its distribution plan. The financial statements have been prepared in conformity with U.S. generally accepted accounting principles (“U.S. GAAP”) which require management to make certain estimates and assumptions that affect the reported amounts of assets and liabilities in the financial statements and amounts of income and expenses during the reporting period. Actual results could differ from those estimates. The following is a summary of significant accounting policies followed by the Fund.
1. Security Valuation
Portfolio securities are valued at their current market value determined on the basis of market quotations or, if market quotations are not readily available or are deemed unreliable, at “fair value” as determined in accordance with procedures established by and under the general supervision of the Fund’s Board of Directors.
In general, the market value of securities which are readily available and deemed reliable are determined as follows: Securities listed on a national securities exchange (other than securities listed on the NASDAQ Stock Market, Inc.
| | | | |
| ALLIANCEBERNSTEIN GLOBAL RISK ALLOCATION FUND • | | | 49 | |
Notes to Financial Statements
(“NASDAQ”)) or on a foreign securities exchange are valued at the last sale price at the close of the exchange or foreign securities exchange. If there has been no sale on such day, the securities are valued at the last traded price from the previous day. Securities listed on more than one exchange are valued by reference to the principal exchange on which the securities are traded; securities listed only on NASDAQ are valued in accordance with the NASDAQ Official Closing Price; listed or over the counter (“OTC”) market put or call options are valued at the mid level between the current bid and ask prices. If either a current bid or current ask price is unavailable, AllianceBernstein L.P. (the “Adviser”) will have discretion to determine the best valuation (e.g. last trade price in the case of listed options); open futures contracts are valued using the closing settlement price or, in the absence of such a price, the most recent quoted bid price. If there are no quotations available for the day of valuation, the last available closing settlement price is used; U.S. government securities and other debt instruments having 60 days or less remaining until maturity are valued at amortized cost if their original maturity was 60 days or less; or by amortizing their fair value as of the 61st day prior to maturity if their original term to maturity exceeded 60 days; fixed-income securities, including mortgage backed and asset backed securities, may be valued on the basis of prices provided by a pricing service or at a price obtained from one or more of the major broker/dealers. In cases where broker/dealer quotes are obtained, the Adviser may establish procedures whereby changes in market yields or spreads are used to adjust, on a daily basis, a recently obtained quoted price on a security. Swaps and other derivatives are valued daily, primarily using independent pricing services, independent pricing models using market inputs, as well as third party broker-dealers or counterparties. Investments in money market funds are valued at their net asset value each day.
Securities for which market quotations are not readily available (including restricted securities) or are deemed unreliable are valued at fair value. Factors considered in making this determination may include, but are not limited to, information obtained by contacting the issuer, analysts, analysis of the issuer’s financial statements or other available documents. In addition, the Fund may use fair value pricing for securities primarily traded in non-U.S. markets because most foreign markets close well before the Fund values its securities at 4:00 p.m., Eastern Time. The earlier close of these foreign markets gives rise to the possibility that significant events, including broad market moves, may have occurred in the interim and may materially affect the value of those securities. To account for this, the Fund may frequently value many of its foreign equity securities using fair value prices based on third party vendor modeling tools to the extent available.
2. Fair Value Measurements
In accordance with U.S. GAAP regarding fair value measurements, fair value is defined as the price that the Fund would receive to sell an asset or pay to transfer a liability in an orderly transaction between market participants at the measurement date. U.S. GAAP establishes a framework for measuring fair value, and a
| | |
| 50 | | • ALLIANCEBERNSTEIN GLOBAL RISK ALLOCATION FUND |
Notes to Financial Statements
three-level hierarchy for fair value measurements based upon the transparency of inputs to the valuation of an asset (including those valued based on their market values as described in Note 1 above) or liability. Inputs may be observable or unobservable and refer broadly to the assumptions that market participants would use in pricing the asset or liability. Observable inputs reflect the assumptions market participants would use in pricing the asset or liability based on market data obtained from sources independent of the Fund. Unobservable inputs reflect the Fund’s own assumptions about the assumptions that market participants would use in pricing the asset or liability based on the best information available in the circumstances. Each investment is assigned a level based upon the observability of the inputs which are significant to the overall valuation. The three-tier hierarchy of inputs is summarized below.
| | • | | Level 1—quoted prices in active markets for identical investments |
| | • | | Level 2—other significant observable inputs (including quoted prices for similar investments, interest rates, prepayment speeds, credit risk, etc.) |
| | • | | Level 3—significant unobservable inputs (including the Fund’s own assumptions in determining the fair value of investments) |
The fair value of debt instruments, such as bonds, and over-the-counter derivatives is generally based on market price quotations, recently executed market transactions (where observable) or industry recognized modeling techniques and are generally classified as Level 2. Pricing vendor inputs to Level 2 valuations may include quoted prices for similar investments in active markets, interest rates, coupon rates, yield curves, option adjusted spreads, default rates, credit spreads and other unique security features in order to estimate the relevant cash flows which is then discounted to calculate fair values. If these inputs are unobservable and significant to the fair value, these investments will be classified as Level 3.
Where readily available market prices or relevant bid prices are not available for certain equity investments, such investments may be valued based on similar publicly traded investments, movements in relevant indices since last available prices or based upon underlying company fundamentals and comparable company data (such as multiples to earnings or other multiples to equity). Where an investment is valued using an observable input, by pricing vendors, such as another publicly traded security, the investment will be classified as Level 2. If management determines that an adjustment is appropriate based on restrictions on resale, illiquidity or uncertainty, and such adjustment is a significant component of the valuation, the investment will be classified as Level 3. An investment will also be classified as Level 3 where management uses company fundamentals and other significant inputs to determine the valuation.
Valuations of mortgage-backed or other asset backed securities, by pricing vendors, are based on both proprietary and industry recognized models and discounted cash flow techniques. Significant inputs to the valuation of these
| | | | |
| ALLIANCEBERNSTEIN GLOBAL RISK ALLOCATION FUND • | | | 51 | |
Notes to Financial Statements
instruments are value of the collateral, the rates and timing of delinquencies, the rates and timing of prepayments, and default and loss expectations, which are driven in part by housing prices for residential mortgages. Significant inputs are determined based on relative value analyses, which incorporate comparisons to instruments with similar collateral and risk profiles, including relevant indices. Mortgage and asset backed securities for which management has collected current observable data through brokers or pricing services are generally categorized within Level 2. Those investments for which current data has not been provided are classified as Level 3.
Other fixed income investments, including non-U.S. government and corporate debt, are generally valued using quoted market prices, if available, which are typically impacted by current interest rates, maturity dates and any perceived credit risk of the issuer. Additionally, in the absence of quoted market prices, these inputs are used by pricing vendors to derive a valuation based upon industry or proprietary models which incorporate issuer specific data with relevant yield/spread comparisons with more widely quoted bonds with similar key characteristics. Those investments for which there are observable inputs are classified as Level 2. Where the inputs are not observable, the investments are classified as Level 3.
The following table summarizes the valuation of the Fund’s investments by the above fair value hierarchy levels as of November 30, 2012:
| | | | | | | | | | | | | | | | |
Investments in Securities: | | Level 1 | | | Level 2 | | | Level 3 | | | Total | |
Assets: | | | | | | | | | | | | | | | | |
Inflation-Linked Securities | | $ | – 0 | – | | $ | 250,636,533 | | | $ | – 0 | – | | $ | 250,636,533 | |
Governments – Treasuries | | | – 0 | – | | | 98,895,825 | | | | – 0 | – | | | 98,895,825 | |
Common Stocks: | | | | | | | | | | | | | | | | |
Financials | | | 4,759,217 | | | | 4,962,490 | | | | – 0 | – | | | 9,721,707 | |
Information Technology | | | 5,086,464 | | | | 903,685 | | | | – 0 | – | | | 5,990,149 | |
Consumer Discretionary | | | 3,322,970 | | | | 2,227,321 | | | | – 0 | – | | | 5,550,291 | |
Consumer Staples | | | 2,948,014 | | | | 2,456,216 | | | | – 0 | – | | | 5,404,230 | |
Industrials | | | 2,779,116 | | | | 2,576,391 | | | | – 0 | – | | | 5,355,507 | |
Health Care | | | 3,199,870 | | | | 2,051,633 | | | | – 0 | – | | | 5,251,503 | |
Energy | | | 3,536,863 | | | | 1,629,140 | | | | – 0 | – | | | 5,166,003 | |
Materials | | | 1,377,518 | | | | 2,019,411 | | | | – 0 | – | | | 3,396,929 | |
Telecommunication Services | | | 897,431 | | | | 1,016,308 | | | | – 0 | – | | | 1,913,739 | |
Utilities | | | 910,919 | | | | 805,962 | | | | – 0 | – | | | 1,716,881 | |
Corporates – Investment Grades | | | – 0 | – | | | 38,630,345 | | | | – 0 | – | | | 38,630,345 | |
Agencies | | | – 0 | – | | | 17,310,676 | | | | – 0 | – | | | 17,310,676 | |
Mortgage Pass-Throughs | | | – 0 | – | | | 7,213,350 | | | | – 0 | – | | | 7,213,350 | |
Corporates – Non-Investment Grades | | | – 0 | – | | | 2,018,107 | | | | – 0 | – | | | 2,018,107 | |
Quasi-Sovereigns | | | – 0 | – | | | 897,551 | | | | – 0 | – | | | 897,551 | |
Asset-Backed Security | | | – 0 | – | | | – 0 | – | | | 1,196 | | | | 1,196 | |
Preferred Stocks | | | – 0 | – | | | – 0 | – | | | 1,041 | | | | 1,041 | |
Short-Term Investments | | | 85,027,112 | | | | – 0 | – | | | – 0 | – | | | 85,027,112 | |
Investments of Cash Collateral for Securities Loaned in Affiliated Money Market Fund | | | 101,175 | | | | – 0 | – | | | – 0 | – | | | 101,175 | |
| | | | | | | | | | | | | | | | |
Total Investments in Securities | | | 113,946,669 | | | | 436,250,944 | + | | | 2,237 | | | | 550,199,850 | |
| | |
| 52 | | • ALLIANCEBERNSTEIN GLOBAL RISK ALLOCATION FUND |
Notes to Financial Statements
| | | | | | | | | | | | | | | | |
Investments in Securities: | | Level 1 | | | Level 2 | | | Level 3 | | | Total | |
Other Financial Instruments* : | | | | | | | | | | | | | | | | |
Assets: | | | | | | | | | | | | | | | | |
Futures Contracts | | $ | 1,537,269 | | | $ | – 0 | – | | $ | – 0 | – | | $ | 1,537,269 | # |
Forward Currency Exchange Contracts | | | – 0 | – | | | 76,727 | | | | – 0 | – | | | 76,727 | |
Interest Rate Swap Contracts | | | – 0 | – | | | 368,229 | | | | – 0 | – | | | 368,229 | |
Credit Default Swap Contracts | | | – 0 | – | | | 210,789 | | | | – 0 | – | | | 210,789 | |
Liabilities: | | | | | | | | | | | | | | | | |
Futures Contracts | | | (18,576 | ) | | | – 0 | – | | | – 0 | – | | | (18,576 | )# |
Forward Currency Exchange Contracts | | | – 0 | – | | | (1,218,701 | ) | | | – 0 | – | | | (1,218,701 | ) |
Interest Rate Swap Contracts | | | – 0 | – | | | (18,546 | ) | | | – 0 | – | | | (18,546 | ) |
| | | | | | | | | | | | | | | | |
Total^ | | $ | 115,465,362 | | | $ | 435,669,442 | | | $ | 2,237 | | | $ | 551,137,041 | |
| | | | | | | | | | | | | | | | |
| * | | Other financial instruments are derivative instruments, such as futures, forwards and swap contracts, which are valued at the unrealized appreciation/depreciation on the instrument. |
| + | | A significant portion of the Fund’s foreign equity investments are categorized as Level 2 investments since they are valued using fair value prices based on third party vendor modeling tools to the extent available, see Note A.1. |
| # | | Only variation margin receivable/payable at period end is reported within the statement of assets and liabilities. This amount reflects cumulative appreciation/(depreciation) of futures contracts as reported in the portfolio of investments. |
| ^ | | There were no transfers between Level 1 and Level 2 during the reporting period. |
The Fund recognizes all transfers between levels of the fair value hierarchy and assumes the financial instruments were transferred at the beginning of the reporting period.
Following is a reconciliation of investments in which significant unobservable inputs (Level 3) were used in determining fair value.
| | | | | | | | | | | | |
| | | Asset-Backed
Securities | | | Preferred
Stocks | | | Commercial
Mortgage-Backed
Securities | |
Balance as of 11/30/11 | | $ | 2,725,292 | | | $ | – 0 | – | | $ | 1,377,909 | |
Accrued discounts/(premiums) | | | 6 | | | | – 0 | – | | | 35,914 | |
Realized gain (loss) | | | (955,136 | ) | | | – 0 | – | | | 230,462 | |
Change in unrealized appreciation/depreciation | | | 1,175,317 | | | | 5 | | | | (60,622 | ) |
Purchases | | | – 0 | – | | | 1,036 | | | | – 0 | – |
Sales | | | (2,944,283 | ) | | | – 0 | – | | | (1,583,663 | ) |
Transfers in to Level 3 | | | – 0 | – | | | – 0 | – | | | – 0 | – |
Transfers out of Level 3 | | | – 0 | – | | | – 0 | – | | | – 0 | – |
| | | | | | | | | | | | |
Balance as of 11/30/12 | | $ | 1,196 | | | $ | 1,041 | | | $ | – 0 | – |
| | | | | | | | | | | | |
Net change in unrealized appreciation/depreciation from investments held as of 11/30/12* | | $ | 433,558 | | | $ | 5 | | | $ | – 0 | – |
| | | | |
| ALLIANCEBERNSTEIN GLOBAL RISK ALLOCATION FUND • | | | 53 | |
Notes to Financial Statements
| | | | | | | | | | |
| | | |
| | | Collateralized
Mortgage Obligations | | | Total | | | |
Balance as of 11/30/11 | | $ | 1,554 | | | $ | 4,104,755 | | | |
Accrued discounts/(premiums) | | | 3 | | | | 35,923 | | | |
Realized gain (loss) | | | (480,949 | ) | | | (1,205,623 | ) | | |
Change in unrealized appreciation/depreciation | | | 479,392 | | | | 1,594,092 | | | |
Purchases | | | – 0 | – | | | 1,036 | | | |
Sales | | | – 0 | – | | | (4,527,946 | ) | | |
Transfers in to Level 3 | | | – 0 | – | | | – 0 | –�� | | |
Transfers out of Level 3 | | | – 0 | – | | | – 0 | – | | |
| | | | | | | | | | |
Balance as of 11/30/12 | | $ | – 0 | – | | $ | 2,237 | | | |
| | | | | | | | | | |
Net change in unrealized appreciation/depreciation from Investments held as of 11/30/12* | | $ | – 0 | – | | $ | 433,563 | | | |
| * | | The unrealized appreciation/depreciation is included in net change in unrealized appreciation/depreciation of investments in the accompanying statement of operations. |
The Adviser has established a Valuation Committee (the “Committee”) which is responsible for overseeing the pricing and valuation of all securities held in the Fund. The Committee operates under pricing and valuation policies and procedures established by the Adviser and approved by the Board, including pricing policies which set forth the mechanisms and processes to be employed on a daily basis to implement these policies and procedures. In particular, the pricing policies describe how to determine market quotations for securities and other instruments. The Committee’s responsibilities include: 1) fair value and liquidity determinations (and oversight of any third parties to whom any responsibility for fair value and liquidity determinations is delegated), and 2) regular monitoring of the Adviser’s pricing and valuation policies and procedures and modification or enhancement of these policies and procedures (or recommendation of the modification of these policies and procedures) as the Committee believes appropriate.
The Committee is also responsible for monitoring the implementation of the pricing policies by the Adviser’s Pricing Group (the “Pricing Group”) and a third party which performs certain pricing functions in accordance with the pricing policies. The Pricing Group is responsible for the oversight of the third party on a day-to-day basis. The Committee and the Pricing Group perform a series of activities to provide reasonable comfort over the accuracy of prices including: 1) periodic vendor due diligence meetings, review methodologies, new developments, process at vendors, 2) daily compare of security valuation versus prior day for securities that exceed established thresholds, 3) daily review of unpriced, stale, and variance reports with exceptions reviewed by senior management and the Committee.
In addition, there are several processes outside of the pricing process that are used to monitor valuation issues including: 1) performance and performance attribution reports are monitored for anomalous impacts based upon benchmark performance, and 2) portfolio managers review all portfolios for performance and analytics (which are generated using the Adviser’s prices).
| | |
| 54 | | • ALLIANCEBERNSTEIN GLOBAL RISK ALLOCATION FUND |
Notes to Financial Statements
3. Currency Translation
Assets and liabilities denominated in foreign currencies and commitments under forward currency exchange contracts are translated into U.S. dollars at the mean of the quoted bid and ask prices of such currencies against the U.S. dollar. Purchases and sales of portfolio securities are translated into U.S. dollars at the rates of exchange prevailing when such securities were acquired or sold. Income and expenses are translated into U.S. dollars at rates of exchange prevailing when accrued.
Net realized gain or loss on foreign currency transactions represents foreign exchange gains and losses from sales and maturities of foreign fixed income investments, foreign currency exchange contracts, holding of foreign currencies, currency gains or losses realized between the trade and settlement dates on foreign investment transactions, and the difference between the amounts of dividends, interest and foreign withholding taxes recorded on the Fund’s books and the U.S. dollar equivalent amounts actually received or paid. Net unrealized currency gains and losses from valuing foreign currency denominated assets and liabilities at period end exchange rates are reflected as a component of net unrealized appreciation or depreciation of foreign currency denominated assets and liabilities.
4. Taxes
It is the Fund’s policy to meet the requirements of the Internal Revenue Code applicable to regulated investment companies and to distribute all of its investment company taxable income and net realized gains, if any, to shareholders. Therefore, no provisions for federal income or excise taxes are required. The Fund may be subject to taxes imposed by countries in which it invests. Such taxes are generally based on income and/or capital gains earned or repatriated. Taxes are accrued and applied to net investment income, net realized gains and net unrealized appreciation/depreciation as such income and/or gains are earned.
In accordance with U.S. GAAP requirements regarding accounting for uncertainties in income taxes, management has analyzed the Fund’s tax positions taken or expected to be taken on federal and state income tax returns for all open tax years (the current and the prior three tax years) and has concluded that no provision for income tax is required in the Fund’s financial statements.
5. Investment Income and Investment Transactions
Dividend income is recorded on the ex-dividend date or as soon as the Fund is informed of the dividend. Interest income is accrued daily. Investment transactions are accounted for on the date the securities are purchased or sold. Investment gains or losses are determined on the identified cost basis. The Fund amortizes premiums and accretes discounts as adjustments to interest income.
| | | | |
| ALLIANCEBERNSTEIN GLOBAL RISK ALLOCATION FUND • | | | 55 | |
Notes to Financial Statements
6. Class Allocations
All income earned and expenses incurred by the Fund are borne on a pro-rata basis by each outstanding class of shares, based on the proportionate interest in the Fund represented by the net assets of such class, except for class specific expenses which are allocated to the respective class. Realized and unrealized gains and losses are allocated among the various share classes based on respective net assets.
7. Dividends and Distributions
Dividends and distributions to shareholders, if any, are recorded on the ex-dividend date. Income dividends and capital gains distributions are determined in accordance with federal tax regulations and may differ from those determined in accordance with U.S. GAAP. To the extent these differences are permanent, such amounts are reclassified within the capital accounts based on their federal tax basis treatment; temporary differences do not require such reclassification.
NOTE B
Advisory Fee and Other Transactions with Affiliates
Under the terms of the investment advisory agreement, the Fund pays the Adviser an advisory fee at an annual rate of .60% of the first $200 million, .50% of the next $200 million and .40% in excess of $400 million of the Fund’s average daily net assets. The fee is accrued daily and paid monthly.
Pursuant to the investment advisory agreement, the Fund may reimburse the Adviser for certain legal and accounting services provided to the Fund by the Adviser. For the year ended November 30, 2012, the reimbursement for such services amounted to $80,701.
The Fund compensates AllianceBernstein Investor Services, Inc. (“ABIS”), a wholly-owned subsidiary of the Adviser, under a Transfer Agency Agreement for providing personnel and facilities to perform transfer agency services for the Fund. ABIS may make payments to intermediaries that provide omnibus account services, sub-accounting services and/or networking services. Such compensation retained by ABIS amounted to $432,711 for the year ended November 30, 2012.
AllianceBernstein Investments, Inc. (the “Distributor”), a wholly-owned subsidiary of the Adviser, serves as the distributor of the Fund’s shares. The Distributor has advised the Fund that it has retained front-end sales charges of $9,143 from the sale of Class A shares and received $16,587, $8,595 and $2,215 in contingent deferred sales charges imposed upon redemptions by shareholders of Class A, Class B and Class C shares, respectively, for the year ended November 30, 2012.
The Fund may invest in the AllianceBernstein Fixed-Income Shares, Inc. – Government STIF Portfolio (“Government STIF Portfolio”), an open-end management investment company managed by the Adviser. The Government
| | |
| 56 | | • ALLIANCEBERNSTEIN GLOBAL RISK ALLOCATION FUND |
Notes to Financial Statements
STIF Portfolio is offered as a cash management option to mutual funds and other institutional accounts of the Adviser, and is not available for direct purchase by members of the public. The Government STIF Portfolio pays no investment management fees but does bear its own expenses. A summary of the Fund’s transactions in shares of the Government STIF Portfolio for the year ended November 30, 2012 is as follows:
| | | | | | | | | | | | | | | | |
Market Value November 30, 2011 (000) | | Purchases
at Cost
(000) | | | Sales
Proceeds
(000) | | | Market Value
November 30, 2012
(000) | | | Dividend
Income
(000) | |
| $ 24,489 | | $ | 515,041 | | | $ | 454,503 | | | $ | 85,027 | | | $ | 42 | |
Brokerage commissions paid on investment transactions for the year ended November 30, 2012 amounted to $540,726, of which $443 and $0, respectively, was paid to Sanford C. Bernstein & Co. LLC and Sanford C. Bernstein Limited, affiliates of the Adviser.
NOTE C
Distribution Services Agreement
The Fund has adopted a Distribution Services Agreement (the “Agreement”) pursuant to Rule 12b-1 under the Investment Company Act of 1940. Under the Agreement, the Fund pays distribution and servicing fees to the Distributor at an annual rate of up to .30% of the Fund’s average daily net assets attributable to Class A shares, 1% of the Fund’s average daily net assets attributable to both Class B and Class C shares, .50% of the Fund’s average daily net assets attributable to Class R shares and .25% of the Fund’s average daily net assets attributable to Class K shares. There are no distribution and servicing fees on the Advisor Class and Class I shares. The fees are accrued daily and paid monthly. Payments under the Class A plan are currently limited to .29% of the Fund’s average daily net assets attributable to Class A shares. The Agreement provides that the Distributor will use such payments in their entirety for distribution assistance and promotional activities. Since the commencement of the Fund’s operations, the Distributor has incurred expenses in excess of the distribution costs reimbursed by the Fund in the amounts of $1,068,676, $3,161,030, $381,616 and $235,773 for Class B, Class C, Class R and Class K shares, respectively. While such costs may be recovered from the Fund in future periods so long as the Agreement is in effect, the rate of the distribution and servicing fees payable under the Agreement may not be increased without a shareholder vote. In accordance with the Agreement, there is no provision for recovery of unreimbursed distribution costs incurred by the Distributor beyond the current fiscal year for Class A shares. The Agreement also provides that the Adviser may use its own resources to finance the distribution of the Fund’s shares.
| | | | |
| ALLIANCEBERNSTEIN GLOBAL RISK ALLOCATION FUND • | | | 57 | |
Notes to Financial Statements
NOTE D
Investment Transactions
Purchases and sales of investment securities (excluding short-term investments) for the year ended November 30, 2012 were as follows:
| | | | | | | | |
| | | Purchases | | | Sales | |
Investment securities (excluding
U.S. government securities) | | $ | 546,029,187 | | | $ | 759,327,497 | |
U.S. government securities | | | 312,709,180 | | | | 213,774,807 | �� |
The cost of investments for federal income tax purposes, gross unrealized appreciation and unrealized depreciation (excluding futures, foreign currency and swap transactions) are as follows:
| | | | |
Cost | | $ | 540,642,105 | |
| | | | |
Gross unrealized appreciation | | | 11,418,620 | |
Gross unrealized depreciation | | | (1,860,875 | ) |
| | | | |
Net unrealized appreciation | | $ | 9,557,745 | |
| | | | |
1. Derivative Financial Instruments
The Fund may use derivatives in an effort to earn income and enhance returns, to replace more traditional direct investments, to obtain exposure to otherwise inaccessible markets (collectively, “investment purposes”), or to hedge or adjust the risk profile of its portfolio.
The principal types of derivatives utilized by the Fund, as well as the methods in which they may be used are:
The Fund may buy or sell futures contracts for investment purposes or for the purpose of hedging its portfolio against adverse effects of potential movements in the market or for investment purposes. The Fund bears the market risk that arises from changes in the value of these instruments and the imperfect correlation between movements in the price of the futures contracts and movements in the price of the assets, reference rates or indices which they are designed to track. Among other things, the Fund may purchase or sell futures contracts for foreign currencies or options thereon for non-hedging purposes as a means of making direct investment in foreign currencies, as described below under “Currency Transactions”.
At the time the Fund enters into a futures contract, the Fund deposits and maintains as collateral an initial margin with the broker, as required by the exchange on which the transaction is effected. Pursuant to the contract, the Fund agrees to receive from or pay to the broker an amount of cash equal to the daily fluctuation in the value of the contract. Such receipts or payments are known as variation margin and are recorded by the Fund as unrealized gains or losses. Risks may arise from the potential inability of a
| | |
| 58 | | • ALLIANCEBERNSTEIN GLOBAL RISK ALLOCATION FUND |
Notes to Financial Statements
counterparty to meet the terms of the contract. The credit/counterparty risk for exchange-traded futures contracts is generally less than privately negotiated futures contracts, since the clearinghouse, which is the issuer or counterparty to each exchange-traded future, provides a guarantee of performance. This guarantee is supported by a daily payment system (i.e., margin requirements). When the contract is closed, the Fund records a realized gain or loss equal to the difference between the value of the contract at the time it was opened and the time it was closed.
Use of long futures contracts subjects the Fund to risk of loss in excess of the amounts shown on the statement of assets and liabilities, up to the notional value of the futures contracts. Use of short futures contracts subjects the Fund to unlimited risk of loss. Under some circumstances, futures exchanges may establish daily limits on the amount that the price of a futures contract can vary from the previous day’s settlement price, which could effectively prevent liquidation of unfavorable positions.
During the year ended November 30, 2012, the Fund held futures contracts for non-hedging purposes.
| | • | | Forward Currency Exchange Contracts |
The Fund may enter into forward currency exchange contracts in order to hedge its exposure to changes in foreign currency exchange rates on its foreign portfolio holdings, to hedge certain firm purchase and sale commitments denominated in foreign currencies and for non-hedging purposes as a means of making direct investments in foreign currencies, as described below under “Currency Transactions”.
A forward currency exchange contract is a commitment to purchase or sell a foreign currency at a future date at a negotiated forward rate. The gain or loss arising from the difference between the original contract and the closing of such contract would be included in net realized gain or loss on foreign currency transactions. Fluctuations in the value of open forward currency exchange contracts are recorded for financial reporting purposes as unrealized appreciation and/or depreciation by the Fund. Risks may arise from the potential inability of a counterparty to meet the terms of a contract and from unanticipated movements in the value of a foreign currency relative to the U.S. dollar.
During the year ended November 30, 2012, the Fund held forward currency exchange contracts for hedging and non-hedging purposes.
The Fund may enter into swaps to hedge its exposure to interest rates, credit risk, or currencies. The Fund may also enter into swaps for non-hedging purposes as a means of gaining market exposures, including by making direct investments in foreign currencies, as described below under “Currency Transactions”. A swap is an agreement that obligates two
| | | | |
| ALLIANCEBERNSTEIN GLOBAL RISK ALLOCATION FUND • | | | 59 | |
Notes to Financial Statements
parties to exchange a series of cash flows at specified intervals based upon or calculated by reference to changes in specified prices or rates for a specified amount of an underlying asset. The payment flows are usually netted against each other, with the difference being paid by one party to the other. In addition, collateral may be pledged or received by the Fund in accordance with the terms of the respective swap agreements to provide value and recourse to the Fund or its counterparties in the event of default, bankruptcy or insolvency by one of the parties to the swap agreement.
Risks may arise as a result of the failure of the counterparty to the swap contract to comply with the terms of the swap contract. The loss incurred by the failure of a counterparty is generally limited to the net interim payment to be received by the Fund, and/or the termination value at the end of the contract. Therefore, the Fund considers the creditworthiness of each counterparty to a swap contract in evaluating potential counterparty risk. This risk is mitigated by having a netting arrangement between the Fund and the counterparty and by the posting of collateral by the counterparty to the Fund to cover the Fund’s exposure to the counterparty. Additionally, risks may arise from unanticipated movements in interest rates or in the value of the underlying securities. The Fund accrues for the interim payments on swap contracts on a daily basis, with the net amount recorded within unrealized appreciation/depreciation of swap contracts on the statement of assets and liabilities, where applicable. Once the interim payments are settled in cash, the net amount is recorded as realized gain/(loss) on swaps on the statement of operations, in addition to any realized gain/(loss) recorded upon the termination of swap contracts. Upfront premiums paid or received are recognized as cost or proceeds on the statement of assets and liabilities and are amortized on a straight line basis over the life of the contract. Amortized upfront premiums are included in net realized gain/(loss) from swaps on the statement of operations. Fluctuations in the value of swap contracts are recorded as a component of net change in unrealized appreciation/depreciation of swap contracts on the statement of operations.
Interest Rate Swaps:
The Fund is subject to interest rate risk exposure in the normal course of pursuing its investment objectives. Because the Fund holds fixed rate bonds, the value of these bonds may decrease if interest rates rise. To help hedge against this risk and to maintain its ability to generate income at prevailing market rates, the Fund may enter into interest rate swap contracts. Interest rate swaps are agreements between two parties to exchange cash flows based on a notional amount. The Fund may elect to pay a fixed rate and receive a floating rate, or, receive a fixed rate and pay a floating rate on a notional amount.
In addition, the Fund may also enter into interest rate swap transactions to preserve a return or spread on a particular investment or portion of its
| | |
| 60 | | • ALLIANCEBERNSTEIN GLOBAL RISK ALLOCATION FUND |
Notes to Financial Statements
portfolio, or protecting against an increase in the price of securities the Fund anticipates purchasing at a later date. Interest rate swaps involve the exchange by a Fund with another party of their respective commitments to pay or receive interest (e.g., an exchange of floating rate payments for fixed rate payments) computed based on a contractually-based principal (or “notional”) amount. Interest rate swaps are entered into on a net basis (i.e., the two payment streams are netted out, with the Fund receiving or paying, as the case may be, only the net amount of the two payments).
During the year ended November 30, 2012, the Fund held interest rate swap contracts for non-hedging purposes.
Credit Default Swaps:
The Fund may enter into credit default swaps, including to manage its exposure to the market or certain sectors of the market, to reduce its risk exposure to defaults by corporate and sovereign issuers held by the Fund, or to create exposure to corporate or sovereign issuers to which it is not otherwise exposed. The Fund may purchase credit protection (“Buy Contract”) or provide credit protection (“Sale Contract”) on the referenced obligation of the credit default swap. During the term of the swap agreement, the Fund receives/(pays) fixed payments from/(to) the respective counterparty, calculated at the agreed upon rate applied to the notional amount. If the Fund is a buyer/(seller) of protection and a credit event occurs, as defined under the terms of the swap agreement, the Fund will either (i) receive from the seller/(pay to the buyer) of protection an amount equal to the notional amount of the swap contract (the “Maximum Payout Amount”) and deliver/(take delivery of) the referenced obligation or (ii) receive/(pay) a net settlement amount in the form of cash or securities equal to the notional amount of the swap less the recovery value of the referenced obligation.
Credit default swaps may involve greater risks than if a Fund had invested in the referenced obligation directly. Credit default swaps are subject to general market risk, liquidity risk, counterparty risk and credit risk. If the Fund is a buyer of protection and no credit event occurs, it will lose the payments it made to its counterparty. If the Fund is a seller of protection and a credit event occurs, the value of the referenced obligation received by the Fund coupled with the periodic payments previously received, may be less than the Maximum Payout Amount it pays to the buyer, resulting in a net loss to the Fund.
During the year ended November 30, 2012, the Fund held credit default swap contracts for non-hedging purposes.
Implied credit spreads utilized in determining the market value of credit default swaps on issuers as of period end are disclosed in the portfolio of investments. The implied spreads serve as an indicator of the current status
| | | | |
| ALLIANCEBERNSTEIN GLOBAL RISK ALLOCATION FUND • | | | 61 | |
Notes to Financial Statements
of the payment/performance risk and typically reflect the likelihood of default by the issuer of the referenced obligation. The implied credit spread of a particular reference obligation also reflects the cost of buying/selling protection and may reflect upfront payments required to be made to enter into the agreement. Widening credit spreads typically represent a deterioration of the referenced obligation’s credit soundness and greater likelihood of default or other credit event occurring as defined under the terms of the agreement. A credit spread identified as “Defaulted” indicates a credit event has occurred for the referenced obligation.
At November 30, 2012, the Fund had Sale Contracts outstanding with a Maximum Payout Amount of $16,290,071, with net unrealized appreciation of $210,789, and a term of less than 6 years, as reflected in the portfolio of investments.
In certain circumstances Maximum Payout Amounts may be partially offset by recovery values of the respective referenced obligations, upfront premium received upon entering into the agreement, or net amounts received from settlement of buy protection credit default swap agreements entered into by the Fund for the same reference obligation with the same counterparty. As of November 30, 2012, the Fund did not have Buy Contracts outstanding with respect to the same referenced obligation and same counterparty for its Sale Contracts outstanding.
Documentation governing the Fund’s OTC derivatives may contain provisions for early termination of such transaction in the event the net assets of the Fund decline below specific levels set forth in the documentation (“net asset contingent features”). If these levels are triggered, the Fund’s counterparty has the right to terminate such transaction and require the Fund to pay or receive a settlement amount in connection with the terminated transaction. As of November 30, 2012, the Fund had OTC derivatives with contingent features in net liability positions in the amount of $757,004. If a trigger event had occurred at November 30, 2012, for those derivatives in a net liability position, an amount of $757,004 would be required to be posted by the Fund.
At November 30, 2012, the Fund had entered into the following derivatives:
| | | | | | | | | | | | |
| | | Asset Derivatives | | | Liability Derivatives | |
Derivative Type | | Statement of
Assets and
Liabilities
Location | | Fair Value | | | Statement of
Assets and
Liabilities
Location | | Fair Value | |
Foreign exchange contracts | |
Unrealized appreciation of forward currency exchange contracts | |
$ |
76,727 |
| |
Unrealized depreciation of forward currency exchange contracts | |
$ |
1,218,701 |
|
| | |
| 62 | | • ALLIANCEBERNSTEIN GLOBAL RISK ALLOCATION FUND |
Notes to Financial Statements
| | | | | | | | | | | | |
| | | Asset Derivatives | | | Liability Derivatives | |
Derivative Type | | Statement of
Assets and
Liabilities
Location | | Fair Value | | | Statement of
Assets and
Liabilities
Location | | Fair Value | |
| | | | |
Interest rate contracts | |
Receivable/Payable for variation margin on futures contracts | |
$ |
768,914 |
* | | | | | | |
| | | | |
Interest rate contracts | |
Unrealized appreciation on interest rate swap contracts | |
|
368,229 |
| |
Unrealized depreciation on interest rate swap contracts | |
$ |
18,546 |
|
| | | | |
Credit contracts | | Unrealized appreciation on credit default swap contracts | | | 210,789 | | | | | | | |
| | | | |
Equity contracts | | Receivable/Payable for variation margin on futures contracts | | | 749,779 | * | | | | | | |
| | | | | | | | | | | | |
Total | | | | $ | 2,174,438 | | | | | $ | 1,237,247 | |
| | | | | | | | | | | | |
| * | | Only variation margin receivable/payable at period end is reported within the statement of assets and liabilities. This amount reflects cumulative appreciation/(depreciation) of futures contracts as reported in the portfolio of investments. |
The effect of derivative instruments on the statement of operations for the year ended November 30, 2012:
| | | | | | | | | | |
Derivative Type | | Location of Gain
or (Loss) on
Derivatives | | Realized Gain
or (Loss) on
Derivatives | | | Change in
Unrealized
Appreciation or
(Depreciation) | |
Foreign exchange contracts | |
Net realized gain (loss) on foreign currency transactions; Net change in unrealized appreciation/depreciation of foreign currency denominated assets and liabilities | |
$ |
2,737 |
| |
$ |
(1,141,974 |
) |
| | | |
Interest rate contracts | | Net realized gain (loss) on swap contracts; Net change in unrealized appreciation/depreciation of swap contracts | | | 220 | | | | 349,683 | |
| | | |
Interest rate contracts | | Net realized gain (loss) on futures contracts; Net change in unrealized appreciation/depreciation of futures contracts | | | 1,258,588 | | | | 768,914 | |
| | | | |
| ALLIANCEBERNSTEIN GLOBAL RISK ALLOCATION FUND • | | | 63 | |
Notes to Financial Statements
| | | | | | | | | | |
Derivative Type | | Location of Gain
or (Loss) on
Derivatives | | Realized Gain
or (Loss) on
Derivatives | | | Change in
Unrealized
Appreciation or
(Depreciation) | |
Credit contracts | | Net realized gain (loss) on swap contracts; Net change in unrealized appreciation/depreciation of swap contracts | | $ | (433,801 | ) | | $ | 293,198 | |
| | | |
Equity contracts | | Net realized gain (loss) on futures contracts; Net change in unrealized appreciation/depreciation of futures contracts | | | – 0 | – | | | 749,779 | |
| | | | | | | | | | |
Total | | | | $ | 827,744 | | | $ | 1,019,600 | |
| | | | | | | | | | |
The following table represents the volume of the Fund’s derivative transactions during the year ended November 30, 2012:
| | | | |
Forward Currency Exchange Contracts: | | | | |
Average principal amount of buy contracts | | $ | 4,065,963 | (a) |
Average principal amount of sale contracts | | $ | 191,571,355 | (a) |
| |
Futures Contracts: | | | | |
Average original value of buy contracts | | $ | 232,925,589 | (a) |
| |
Interest Rate Swap Contracts: | | | | |
Average notional amount | | $ | 49,419,015 | (a) |
| |
Credit Default Swap Contracts: | | | | |
Average notional amount of buy contracts | | $ | 4,187,577 | (b) |
Average notional amount of sale contracts | | $ | 2,137,442 | (c) |
| (a) | | Positions were open two months during the year. |
| (b) | | Positions were open ten months during the year. |
| (c) | | Positions were open four months during the year. |
The Fund may invest in non-U.S. Dollar securities on a currency hedged or unhedged basis. The Fund may seek investment opportunities by taking long or short positions in currencies through the use of currency-related derivatives, including forward currency exchange contracts, futures and options on futures, swaps, and other options. The Fund may enter into transactions for investment opportunities when it anticipates that a foreign currency will appreciate or depreciate in value but securities denominated in that currency are not held by the Fund and do not present attractive investment opportunities. Such transactions may also be used when the Adviser believes that it may be more efficient than a direct investment in a foreign currency-denominated security. The Fund may also conduct currency exchange contracts on a spot basis (i.e., for cash at the spot rate prevailing in the currency exchange market for buying or selling currencies).
| | |
| 64 | | • ALLIANCEBERNSTEIN GLOBAL RISK ALLOCATION FUND |
Notes to Financial Statements
The Fund may enter into dollar rolls. Dollar rolls involve sales by the Fund of securities for delivery in the current month and the Fund’s simultaneously contracting to repurchase substantially similar (same type and coupon) securities on a specified future date. During the roll period, the Fund forgoes principal and interest paid on the securities. The Fund is compensated by the difference between the current sales price and the lower forward price for the future purchase (often referred to as the “drop”) as well as by the interest earned on the cash proceeds of the initial sale. Dollar rolls involve the risk that the market value of the securities the Fund is obligated to repurchase under the agreement may decline below the repurchase price. Dollar rolls are speculative techniques and may be considered to be borrowings by the Fund. For the year ended November 30, 2012, the Fund earned drop income of $100,118 which is included in interest income in the accompanying statement of operations.
NOTE E
Securities Lending
The Fund may enter into securities lending transactions. Under the Fund’s securities lending program, all loans of securities will be collateralized continually by cash. The Fund will be compensated for the loan from a portion of the net return from the income earned on cash collateral after a rebate is paid to the borrower (in some cases, this rebate may be a “negative rebate” or fee paid by the borrower to the Fund in connection with the loan), and payments are made for fees of the securities lending agent and for certain other administrative expenses. It is the policy of the Fund to receive collateral consisting of cash in an amount exceeding the value of the securities loaned. The Fund will have the right to call a loan and obtain the securities loaned at any time on notice to the borrower within the normal and customary settlement time for the securities. While the securities are on loan, the borrower is obligated to pay the Fund amounts equal to any income or other distributions from the securities. The Fund will not have the right to vote any securities during the existence of a loan, but will have the right to regain ownership of loaned securities in order to exercise voting or other ownership rights. The lending agent has agreed to indemnify the Fund in the case of default of any securities borrower. Collateral received and securities loaned are marked to market daily to ensure that the securities loaned are secured by collateral. The lending agent will invest the cash collateral received in AllianceBernstein Exchange Reserves, an eligible money market vehicle, in accordance with the investment restrictions of the Fund, and as approved by the Fund’s Board of Directors. The collateral received on securities loaned is recorded as an asset as well as a corresponding liability in the statement of assets and liabilities. When the Fund lends securities, its investment performance will continue to reflect changes in the value of the securities loaned. At November 30, 2012, the Fund had securities on loan with a value of $99,104 and had received cash collateral which has been invested into AllianceBernstein Exchange Reserves of $101,175. The cash collateral will be adjusted on the next
| | | | |
| ALLIANCEBERNSTEIN GLOBAL RISK ALLOCATION FUND • | | | 65 | |
Notes to Financial Statements
business day to maintain the required collateral amount. The Fund earned securities lending income of $7,363 and $6,698 from the borrowers and AllianceBernstein Exchange Reserves, respectively, for the year ended November 30, 2012; these amounts are reflected in the statement of operations. A principal risk of lending portfolio securities is that the borrower will fail to return the loaned securities upon termination of the loan and that the collateral will not be sufficient to replace the loaned securities. A summary of the Fund’s transactions in shares of AllianceBernstein Exchange Reserves for the year ended November 30, 2012 is as follows:
| | | | | | | | | | | | | | | | |
Market Value November 30, 2011 (000) | | Purchases
at Cost
(000) | | | Sales
Proceeds
(000) | | | Market Value
November 30, 2012
(000) | | | Dividend
Income
(000) | |
| $ 5,825 | | $ | 52,251 | | | $ | 57,975 | | | $ | 101 | | | $ | 7 | |
NOTE F
Capital Stock
Each class consists of 3,000,000,000 authorized shares. Transactions in capital shares for each class were as follows:
| | | | | | | | | | | | | | | | | | | | |
| | | | | | | | | | | | | | | | | | | | |
| | | Shares | | | | | Amount | | | |
| | | Year Ended
November 30,
2012 | | | Year Ended
November 30,
2011 | | | | | Year Ended
November 30,
2012 | | | Year Ended
November 30,
2011 | | | |
| | | | | | |
| Class A | | | | | | | | | | | | | | | | | | | | |
Shares sold | | | 3,290,533 | | | | 3,179,105 | | | | | $ | 54,569,788 | | | $ | 48,594,884 | | | |
| | | |
Shares issued in reinvestment of dividends | | | 319,921 | | | | 419,554 | | | | | | 5,195,429 | | | | 6,306,562 | | | |
| | | |
Shares converted from Class B | | | 988,777 | | | | 1,364,952 | | | | | | 16,466,809 | | | | 20,965,446 | | | |
| | | |
Shares redeemed | | | (6,815,248 | ) | | | (7,958,910 | ) | | | | | (112,743,569 | ) | | | (120,644,228 | ) | | |
| | | |
Net decrease | | | (2,216,017 | ) | | | (2,995,299 | ) | | | | $ | (36,511,543 | ) | | $ | (44,777,336 | ) | | |
| | | |
| | | | | | | | | | | | | | | | | | | | |
| Class B | | | | | | | | | | | | | | | | | | | | |
Shares sold | | | 113,519 | | | | 155,549 | | | | | $ | 1,753,746 | | | $ | 2,218,288 | | | |
| | | |
Shares issued in reinvestment of dividends | | | 22,369 | | | | 49,830 | | | | | | 335,841 | | | | 701,142 | | | |
| | | |
Shares converted to Class A | | | (1,056,068 | ) | | | (1,456,621 | ) | | | | | (16,466,809 | ) | | | (20,965,446 | ) | | |
| | | |
Shares redeemed | | | (464,023 | ) | | | (1,068,137 | ) | | | | | (7,174,680 | ) | | | (15,237,272 | ) | | |
| | | |
Net decrease | | | (1,384,203 | ) | | | (2,319,379 | ) | | | | $ | (21,551,902 | ) | | $ | (33,283,288 | ) | | |
| | | |
| | | | | | | | | | | | | | | | | | | | |
| Class C | | | | | | | | | | | | | | | | | | | | |
Shares sold | | | 372,190 | | | | 336,189 | | | | | $ | 5,773,562 | | | $ | 4,826,214 | | | |
| | | |
Shares issued in reinvestment of dividends | | | 33,798 | | | | 49,927 | | | | | | 513,822 | | | | 707,339 | | | |
| | | |
Shares redeemed | | | (788,554 | ) | | | (1,205,745 | ) | | | | | (12,288,998 | ) | | | (17,301,547 | ) | | |
| | | |
Net decrease | | | (382,566 | ) | | | (819,629 | ) | | | | $ | (6,001,614 | ) | | $ | (11,767,994 | ) | | |
| | | |
| | | | | | | | | | | | | | | | | | | | |
| | |
| 66 | | • ALLIANCEBERNSTEIN GLOBAL RISK ALLOCATION FUND |
Notes to Financial Statements
| | | | | | | | | | | | | | | | | | | | |
| | | | | | | | | | | | | | | | | | | | |
| | | Shares | | | | | Amount | | | |
| | | Year Ended
November 30,
2012 | | | Year Ended
November 30,
2011 | | | | | Year Ended
November 30,
2012 | | | Year Ended
November 30,
2011 | | | |
| | | | | | |
| Advisor Class | | | | | | | | | | | | | | | | | | | | |
Shares sold | | | 2,610,749 | | | | 427,214 | | | | | $ | 43,626,010 | | | $ | 6,531,708 | | | |
| | | |
Shares issued in reinvestment of dividends | | | 29,746 | | | | 37,841 | | | | | | 489,819 | | | | 569,275 | | | |
| | | |
Shares redeemed | | | (1,977,262 | ) | | | (985,224 | ) | | | | | (33,293,584 | ) | | | (15,145,828 | ) | | |
| | | |
Net increase (decrease) | | | 663,233 | | | | (520,169 | ) | | | | $ | 10,822,245 | | | $ | (8,044,845 | ) | | |
| | | |
| | | | | | | | | | | | | | | | | | | | |
| Class R | | | | | | | | | | | | | | | | | | | | |
Shares sold | | | 187,636 | | | | 89,544 | | | | | $ | 3,068,833 | | | $ | 1,348,008 | | | |
| | | |
Shares issued in reinvestment of dividends | | | 4,164 | | | | 6,574 | | | | | | 67,452 | | | | 98,608 | | | |
| | | |
Shares redeemed | | | (216,518 | ) | | | (194,897 | ) | | | | | (3,567,775 | ) | | | (2,919,116 | ) | | |
| | | |
Net decrease | | | (24,718 | ) | | | (98,779 | ) | | | | $ | (431,490 | ) | | $ | (1,472,500 | ) | | |
| | | |
| | | | | | | | | | | | | | | | | | | | |
| Class K | | | | | | | | | | | | | | | | | | | | |
Shares sold | | | 38,119 | | | | 87,717 | | | | | $ | 630,480 | | | $ | 1,320,401 | | | |
| | | |
Shares issued in reinvestment of dividends | | | 2,500 | | | | 3,232 | | | | | | 40,421 | | | | 48,476 | | | |
| | | |
Shares redeemed | | | (79,697 | ) | | | (96,360 | ) | | | | | (1,296,785 | ) | | | (1,444,762 | ) | | |
| | | |
Net decrease | | | (39,078 | ) | | | (5,411 | ) | | | | $ | (625,884 | ) | | $ | (75,885 | ) | | |
| | | |
| | | | | | | | | | | | | | | | | | | | |
| Class I | | | | | | | | | | | | | | | | | | | | |
Shares sold | | | 4,880 | | | | 4,010 | | | | | $ | 81,319 | | | $ | 61,092 | | | |
| | | |
Shares issued in reinvestment of dividends | | | 997 | | | | 1,670 | | | | | | 16,247 | | | | 25,053 | | | |
| | | |
Shares redeemed | | | (6,830 | ) | | | (47,609 | ) | | | | | (110,867 | ) | | | (746,245 | ) | | |
| | | |
Net decrease | | | (953 | ) | | | (41,929 | ) | | | | $ | (13,301 | ) | | $ | (660,100 | ) | | |
| | | |
NOTE G
Risks Involved in Investing in the Fund
Allocation Risk—The allocation of investments among asset classes may have a significant effect on the Fund’s NAV when the asset classes in which the Fund has invested more heavily perform worse than the asset classes invested in less heavily.
Interest Rate Risk and Credit Risk—Interest rate risk is the risk that changes in interest rates will affect the value of the Fund’s investments in fixed-income debt securities such as bonds or notes. Increases in interest rates may cause the value of the Fund’s investments to decline. Credit risk is the risk that the issuer or guarantor of a debt security, or the counterparty to a derivative contract, will be unable or unwilling to make timely principal and/or interest payments, or to
| | | | |
| ALLIANCEBERNSTEIN GLOBAL RISK ALLOCATION FUND • | | | 67 | |
Notes to Financial Statements
otherwise honor its obligations. The degree of risk for a particular security may be reflected in its credit risk rating. Credit risk is greater for medium quality and lower-rated securities. Lower-rated debt securities and similar unrated securities (commonly known as “junk bonds”) have speculative elements or are predominantly speculative risks.
Foreign Securities Risk—Investing in securities of foreign companies or foreign governments involves special risks which include changes in foreign currency exchange rates and the possibility of future political and economic developments which could adversely affect the value of such securities. Moreover, securities of many foreign companies or foreign governments and their markets may be less liquid and their prices more volatile than those of comparable U.S. companies or of the U.S. government.
Currency Risk—This is the risk that changes in foreign currency exchange rates may negatively affect the value of the Fund’s investments or reduce the returns of the Fund. For example, the value of the Fund’s investments in foreign currency-denominated securities or currencies may decrease if the U.S. Dollar is strong (i.e., gaining value relative to other currencies) and other currencies are weak (i.e., losing value relative to the U.S. Dollar). Currency markets are generally not as regulated as securities markets. Independent of the Fund’s investments denominated in foreign currencies, the Fund’s positions in various foreign currencies may cause the Fund to experience investment losses due to the changes in exchange rates and interest rates.
Derivatives Risk—The Fund may enter into derivative transactions such as forwards, options, futures and swaps. Derivatives may be illiquid, difficult to price, and leveraged so that small changes may produce disproportionate losses for the Fund, and subject to counterparty risk to a greater degree than more traditional investments. Derivatives may result in significant losses, including losses that are far greater than the value of the derivatives reflected in the statement of assets and liabilities.
Leverage Risk—Because the Fund uses leveraging techniques, its NAV may be more volatile because leverage tends to exaggerate the effect of changes in interest rates and any increase or decrease in the value of the Fund’s investments.
Indemnification Risk—In the ordinary course of business, the Fund enters into contracts that contain a variety of indemnifications. The Fund’s maximum exposure under these arrangements is unknown. However, the Fund has not had prior claims or losses pursuant to these indemnification provisions and expects the risk of loss thereunder to be remote. Therefore, the Fund has not accrued any liability in connection with these indemnification provisions.
| | |
| 68 | | • ALLIANCEBERNSTEIN GLOBAL RISK ALLOCATION FUND |
Notes to Financial Statements
NOTE H
Joint Credit Facility
A number of open-end mutual funds managed by the Adviser, including the Fund, participate in a $140 million revolving credit facility (the “Facility”) intended to provide short-term financing, if necessary, subject to certain restrictions in connection with abnormal redemption activity. Commitment fees related to the Facility are paid by the participating funds and are included in miscellaneous expenses in the statement of operations. The Fund did not utilize the Facility during the year ended November 30, 2012.
NOTE I
Distributions to Shareholders
The tax character of distributions paid during the fiscal years ended November 30, 2012 and November 30, 2011 were as follows:
| | | | | | | | |
| | | 2012 | | | 2011 | |
Distributions paid from: | | | | | | | | |
Ordinary income | | $ | 7,399,611 | | | $ | 9,328,205 | |
| | | | | | | | |
Total taxable distributions paid | | $ | 7,399,611 | | | $ | 9,328,205 | |
| | | | | | | | |
As of November 30, 2012, the components of accumulated earnings/(deficit) on a tax basis were as follows:
| | | | |
Undistributed ordinary income | | $ | 2,478,467 | |
Undistributed capital gain | | | 36,106,828 | (a) |
Unrealized appreciation/(depreciation) | | | 10,342,273 | (b) |
| | | | |
Total accumulated earnings/(deficit) | | $ | 48,927,568 | |
| | | | |
| (a) | | During the fiscal year ended November 30, 2012, the Fund utilized $67,834,289 of capital loss carryforwards to offset current year net realized gains. As of November 30, 2012, the cumulative deferred loss on straddles was $789,185. |
| (b) | | The differences between book-basis and tax-basis unrealized appreciation/(depreciation) are attributable primarily to the tax deferral of losses on wash sales, the tax treatment of swaps and passive foreign investment companies (PFICs), and the realization for tax purposes of gains/losses on certain derivative instruments. |
For tax purposes, net capital losses may be carried over to offset future capital gains, if any. Under the Regulated Investment Company Modernization Act of 2010, funds are permitted to carry forward capital losses incurred in taxable years beginning after December 22, 2010 for an indefinite period. These post-enactment capital losses must be utilized prior to the pre-enactment capital losses, which are subject to expiration. Post-enactment capital loss carryforwards will retain their character as either short-term or long-term capital losses rather than being considered short-term as under previous regulation. As of November 30, 2012, the Fund did not have any capital loss carryforwards.
During the current fiscal year, permanent differences primarily due to reclassifications of foreign currency, paydown gains/losses and consent fees, and the tax treatment of swaps and Treasury inflation-protected securities
| | | | |
| ALLIANCEBERNSTEIN GLOBAL RISK ALLOCATION FUND • | | | 69 | |
Notes to Financial Statements
resulted in a net increase in undistributed net investment income and a net decrease in accumulated net realized gain on investment and foreign currency transactions. These reclassifications had no effect on net assets.
NOTE J
Recent Accounting Pronouncement
In December 2011, the Financial Accounting Standards Board issued an Accounting Standards Update (“ASU”) related to disclosures about offsetting assets and liabilities in financial statements. The amendments in this update require an entity to disclose both gross and net information for derivatives and other financial instruments that are either offset in the statement of assets and liabilities or subject to an enforceable master netting arrangement or similar agreement. The ASU is effective during interim or annual reporting periods beginning on or after January 1, 2013. At this time, management is evaluating the implication of this ASU and its impact on the financial statements has not been determined.
NOTE K
Subsequent Events
Management has evaluated subsequent events for possible recognition or disclosure in the financial statements through the date the financial statements are issued. Management has determined that there are no material events that would require disclosure in the Fund’s financial statements through this date.
| | |
| 70 | | • ALLIANCEBERNSTEIN GLOBAL RISK ALLOCATION FUND |
Notes to Financial Statements
FINANCIAL HIGHLIGHTS
Selected Data For A Share Of Capital Stock Outstanding Throughout Each Period
| | | | | | | | | | | | | | | | | | | | |
| | | Class A | |
| | | Year Ended November 30, | |
| | | 2012 | | | 2011 | | | 2010 | | | 2009 | | | 2008 | |
| | | | |
| | | | | | | | | | | | | | | | | | | | |
Net asset value, beginning of period | | | $ 15.32 | | | | $ 14.36 | | | | $ 13.43 | | | | $ 11.06 | | | | $ 18.28 | |
| | | | |
Income From Investment Operations | | | | | | | | | | | | | | | | | | | | |
Net investment income(a) | | | .22 | | | | .25 | | | | .25 | | | | .27 | | | | .34 | |
Net realized and unrealized gain (loss) on investment transactions | | | 2.42 | | | | .97 | | | | .95 | | | | 2.39 | | | | (5.85 | ) |
| | | | |
Net increase (decrease) in net asset value from operations | | | 2.64 | | | | 1.22 | | | | 1.20 | | | | 2.66 | | | | (5.51 | ) |
| | | | |
Less: Dividends and Distributions | | | | | | | | | | | | | | | | | | | | |
Dividends from net investment income | | | (.24 | ) | | | (.26 | ) | | | (.27 | ) | | | (.29 | ) | | | (.36 | ) |
Distributions from net realized gain on investment transactions | | | – 0 | – | | | – 0 | – | | | – 0 | – | | | – 0 | – | | | (1.35 | ) |
| | | | |
Total dividends and distributions | | | (.24 | ) | | | (.26 | ) | | | (.27 | ) | | | (.29 | ) | | | (1.71 | ) |
| | | | |
Net asset value, end of period | | | $ 17.72 | | | | $ 15.32 | | | | $ 14.36 | | | | $ 13.43 | | | | $ 11.06 | |
| | | | |
Total Return | | | | | | | | | | | | | | | | | | | | |
Total investment return based on net asset value(b)* | | | 17.37 | % | | | 8.57 | % | | | 9.04 | % | | | 24.43 | % | | | (33.06 | )% |
Ratios/Supplemental Data | | | | | | | | | | | | | | | | | | | | |
Net assets, end of period (000’s omitted) | | | $400,685 | | | | $380,338 | | | | $399,687 | | | | $481,427 | | | | $452,619 | |
Ratio to average net
assets of: | | | | | | | | | | | | | | | | | | | | |
Expenses | | | 1.09 | % | | | 1.08 | % | | | 1.14 | %(c) | | | 1.08 | % | | | .97 | % |
Net investment income | | | 1.30 | % | | | 1.67 | % | | | 1.83 | %(c) | | | 2.30 | % | | | 2.30 | % |
Portfolio turnover rate | | | 163 | % | | | 87 | % | | | 69 | % | | | 111 | % | | | 118 | % |
See footnote summary on page 78.
| | | | |
| ALLIANCEBERNSTEIN GLOBAL RISK ALLOCATION FUND • | | | 71 | |
Financial Highlights
Selected Data For A Share Of Capital Stock Outstanding Throughout Each Period
| | | | | | | | | | | | | | | | | | | | |
| | | Class B | |
| | | Year Ended November 30, | |
| | | 2012 | | | 2011 | | | 2010 | | | 2009 | | | 2008 | |
| | | | |
| | | | | | | | | | | | | | | | | | | | |
Net asset value, beginning of period | | | $ 14.34 | | | | $ 13.46 | | | | $ 12.59 | | | | $ 10.39 | | | | $ 17.27 | |
| | | | |
Income From Investment Operations | | | | | | | | | | | | | | | | | | | | |
Net investment income(a) | | | .08 | | | | .13 | | | | .14 | | | | .17 | | | | .22 | |
Net realized and unrealized gain (loss) on investment transactions | | | 2.27 | | | | .90 | | | | .90 | | | | 2.23 | | | | (5.51 | ) |
| | | | |
Net increase (decrease) in net asset value from operations | | | 2.35 | | | | 1.03 | | | | 1.04 | | | | 2.40 | | | | (5.29 | ) |
| | | | |
Less: Dividends and Distributions | | | | | | | | | | | | | | | | | | | | |
Dividends from net investment income | | | (.12 | ) | | | (.15 | ) | | | (.17 | ) | | | (.20 | ) | | | (.24 | ) |
Distributions from net realized gain on investment
transactions | | | – 0 | – | | | – 0 | – | | | – 0 | – | | | – 0 | – | | | (1.35 | ) |
| | | | |
Total dividends and distributions | | | (.12 | ) | | | (.15 | ) | | | (.17 | ) | | | (.20 | ) | | | (1.59 | ) |
| | | | |
Net asset value, end of period | | | $ 16.57 | | | | $ 14.34 | | | | $ 13.46 | | | | $ 12.59 | | | | $ 10.39 | |
| | | | |
Total Return | | | | | | | | | | | | | | | | | | | | |
Total investment return based on net asset value(b)* | | | 16.44 | % | | | 7.68 | % | | | 8.34 | % | | | 23.41 | % | | | (33.56 | )% |
Ratios/Supplemental Data | | | | | | | | | | | | | | | | | | | | |
Net assets, end of period (000’s omitted) | | | $35,786 | | | | $50,797 | | | | $78,888 | | | | $121,871 | | | | $155,339 | |
Ratio to average net
assets of: | | | | | | | | | | | | | | | | | | | | |
Expenses | | | 1.85 | % | | | 1.85 | % | | | 1.90 | %(c) | | | 1.85 | % | | | 1.72 | % |
Net investment income | | | .50 | % | | | .91 | % | | | 1.07 | %(c) | | | 1.53 | % | | | 1.54 | % |
Portfolio turnover rate | | | 163 | % | | | 87 | % | | | 69 | % | | | 111 | % | | | 118 | % |
See footnote summary on page 78.
| | |
| 72 | | • ALLIANCEBERNSTEIN GLOBAL RISK ALLOCATION FUND |
Financial Highlights
Selected Data For A Share Of Capital Stock Outstanding Throughout Each Period
| | | | | | | | | | | | | | | | | | | | |
| | | Class C | |
| | | Year Ended November 30, | |
| | | 2012 | | | 2011 | | | 2010 | | | 2009 | | | 2008 | |
| | | | |
| | | | | | | | | | | | | | | | | | | | |
Net asset value, beginning of period | | | $ 14.42 | | | | $ 13.54 | | | | $ 12.67 | | | | $ 10.44 | | | | $ 17.35 | |
| | | | |
Income From Investment Operations | | | | | | | | | | | | | | | | | | | | |
Net investment income(a) | | | .09 | | | | .14 | | | | .14 | | | | .18 | | | | .22 | |
Net realized and unrealized gain (loss) on investment transactions | | | 2.28 | | | | .90 | | | | .90 | | | | 2.25 | | | | (5.54 | ) |
| | | | |
Net increase (decrease) in net asset value from operations | | | 2.37 | | | | 1.04 | | | | 1.04 | | | | 2.43 | | | | (5.32 | ) |
| | | | |
Less: Dividends and Distributions | | | | | | | | | | | | | | | | | | | | |
Dividends from net investment income | | | (.13 | ) | | | (.16 | ) | | | (.17 | ) | | | (.20 | ) | | | (.24 | ) |
Distributions from net realized gain on investment
transactions | | | – 0 | – | | | – 0 | – | | | – 0 | – | | | – 0 | – | | | (1.35 | ) |
| | | | |
Total dividends and distributions | | | (.13 | ) | | | (.16 | ) | | | (.17 | ) | | | (.20 | ) | | | (1.59 | ) |
| | | | |
Net asset value, end of period | | | $ 16.66 | | | | $ 14.42 | | | | $ 13.54 | | | | $ 12.67 | | | | $ 10.44 | |
| | | | |
Total Return | | | | | | | | | | | | | | | | | | | | |
Total investment return based on net asset value(b)* | | | 16.54 | % | | | 7.71 | % | | | 8.29 | % | | | 23.59 | % | | | (33.58 | )% |
Ratios/Supplemental Data | | | | | | | | | | | | | | | | | | | | |
Net assets, end of period (000’s omitted) | | | $72,294 | | | | $68,095 | | | | $75,021 | | | | $84,098 | | | | $81,907 | |
Ratio to average net
assets of: | | | | | | | | | | | | | | | | | | | | |
Expenses | | | 1.82 | % | | | 1.80 | % | | | 1.86 | %(c) | | | 1.81 | % | | | 1.70 | % |
Net investment income | | | .58 | % | | | .94 | % | | | 1.10 | %(c) | | | 1.57 | % | | | 1.58 | % |
Portfolio turnover rate | | | 163 | % | | | 87 | % | | | 69 | % | | | 111 | % | | | 118 | % |
See footnote summary on page 78.
| | | | |
| ALLIANCEBERNSTEIN GLOBAL RISK ALLOCATION FUND • | | | 73 | |
Financial Highlights
Selected Data For A Share Of Capital Stock Outstanding Throughout Each Period
| | | | | | | | | | | | | | | | | | | | |
| | | Advisor Class | |
| | | Year Ended November 30, | |
| | | 2012 | | | 2011 | | | 2010 | | | 2009 | | | 2008 | |
| | | | |
| | | | | | | | | | | | | | | | | | | | |
Net asset value, beginning of period | | | $ 15.36 | | | | $ 14.40 | | | | $ 13.46 | | | | $ 11.08 | | | | $ 18.32 | |
| | | | |
Income From Investment Operations | | | | | | | | | | | | | | | | | | | | |
Net investment income(a) | | | .27 | | | | .30 | | | | .29 | | | | .31 | | | | .39 | |
Net realized and unrealized gain (loss) on investment transactions | | | 2.43 | | | | .97 | | | | .96 | | | | 2.39 | | | | (5.87 | ) |
| | | | |
Net increase (decrease) in net asset value from operations | | | 2.70 | | | | 1.27 | | | | 1.25 | | | | 2.70 | | | | (5.48 | ) |
| | | | |
Less: Dividends and Distributions | | | | | | | | | | | | | | | | | | | | |
Dividends from net investment income | | | (.29 | ) | | | (.31 | ) | | | (.31 | ) | | | (.32 | ) | | | (.41 | ) |
Distributions from net realized gain on investment
transactions | | | – 0 | – | | | – 0 | – | | | – 0 | – | | | – 0 | – | | | (1.35 | ) |
| | | | |
Total dividends and distributions | | | (.29 | ) | | | (.31 | ) | | | (.31 | ) | | | (.32 | ) | | | (1.76 | ) |
| | | | |
Net asset value, end of period | | | $ 17.77 | | | | $ 15.36 | | | | $14.40 | | | | $13.46 | | | | $11.08 | |
| | | | |
Total Return | | | | | | | | | | | | | | | | | | | | |
Total investment return based on net asset value(b)* | | | 17.72 | % | | | 8.85 | % | | | 9.41 | % | | | 24.84 | % | | | (32.89 | )% |
Ratios/Supplemental Data | | | | | | | | | | | | | | | | | | | | |
Net assets, end of period (000’s omitted) | | | $42,278 | | | | $26,360 | | | | $32,205 | | | | $56,024 | | | | $51,761 | |
Ratio to average net
assets of: | | | | | | | | | | | | | | | | | | | | |
Expenses | | | .79 | % | | | .79 | % | | | .84 | %(c) | | | .79 | % | | | .68 | % |
Net investment income | | | 1.64 | % | | | 1.96 | % | | | 2.12 | %(c) | | | 2.59 | % | | | 2.61 | % |
Portfolio turnover rate | | | 163 | % | | | 87 | % | | | 69 | % | | | 111 | % | | | 118 | % |
See footnote summary on page 78.
| | |
| 74 | | • ALLIANCEBERNSTEIN GLOBAL RISK ALLOCATION FUND |
Financial Highlights
Selected Data For A Share Of Capital Stock Outstanding Throughout Each Period
| | | | | | | | | | | | | | | | | | | | |
| | | Class R | |
| | | Year Ended November 30, | |
| | | 2012 | | | 2011 | | | 2010 | | | 2009 | | | 2008 | |
| | | | |
| | | | | | | | | | | | | | | | | | | | |
Net asset value, beginning of period | | | $ 15.26 | | | | $ 14.31 | | | | $ 13.38 | | | | $ 11.02 | | | | $ 18.23 | |
| | | | |
Income From Investment Operations | | | | | | | | | | | | | | | | | | | | |
Net investment income(a) | | | .17 | | | | .21 | | | | .21 | | | | .24 | | | | .31 | |
Net realized and unrealized gain (loss) on investment transactions | | | 2.42 | | | | .96 | | | | .96 | | | | 2.38 | | | | (5.85 | ) |
| | | | |
Net increase (decrease) in net asset value from operations | | | 2.59 | | | | 1.17 | | | | 1.17 | | | | 2.62 | | | | (5.54 | ) |
| | | | |
Less: Dividends and Distributions | | | | | | | | | | | | | | | | | | | | |
Dividends from net investment income | | | (.19 | ) | | | (.22 | ) | | | (.24 | ) | | | (.26 | ) | | | (.32 | ) |
Distributions from net realized gain on investment
transactions | | | – 0 | – | | | – 0 | – | | | – 0 | – | | | – 0 | – | | | (1.35 | ) |
| | | | |
Total dividends and distributions | | | (.19 | ) | | | (.22 | ) | | | (.24 | ) | | | (.26 | ) | | | (1.67 | ) |
| | | | |
Net asset value, end of period | | | $ 17.66 | | | | $ 15.26 | | | | $ 14.31 | | | | $ 13.38 | | | | $ 11.02 | |
| | | | |
Total Return | | | | | | | | | | | | | | | | | | | | |
Total investment return based on net asset value(b)* | | | 17.08 | % | | | 8.19 | % | | | 8.81 | % | | | 24.15 | % | | | (33.27 | )% |
Ratios/Supplemental Data | | | | | | | | | | | | | | | | | | | | |
Net assets, end of period (000’s omitted) | | | $5,704 | | | | $5,308 | | | | $6,391 | | | | $6,645 | | | | $5,753 | |
Ratio to average net
assets of: | | | | | | | | | | | | | | | | | | | | |
Expenses | | | 1.38 | % | | | 1.38 | % | | | 1.39 | %(c) | | | 1.32 | % | | | 1.25 | % |
Net investment income | | | 1.01 | % | | | 1.38 | % | | | 1.57 | %(c) | | | 2.06 | % | | | 2.06 | % |
Portfolio turnover rate | | | 163 | % | | | 87 | % | | | 69 | % | | | 111 | % | | | 118 | % |
See footnote summary on page 78.
| | | | |
| ALLIANCEBERNSTEIN GLOBAL RISK ALLOCATION FUND • | | | 75 | |
Financial Highlights
Selected Data For A Share Of Capital Stock Outstanding Throughout Each Period
| | | | | | | | | | | | | | | | | | | | |
| | | Class K | |
| | | Year Ended November 30, | |
| | | 2012 | | | 2011 | | | 2010 | | | 2009 | | | 2008 | |
| | | | |
| | | | | | | | | | | | | | | | | | | | |
Net asset value, beginning of period | | | $ 15.28 | | | | $ 14.34 | | | | $ 13.40 | | | | $ 11.03 | | | | $ 18.24 | |
| | | | |
Income From Investment Operations | | | | | | | | | | | | | | | | | | | | |
Net investment income(a) | | | .21 | | | | .25 | | | | .26 | | | | .28 | | | | .35 | |
Net realized and unrealized gain (loss) on investment transactions | | | 2.43 | | | | .96 | | | | .95 | | | | 2.38 | | | | (5.85 | ) |
| | | | |
Net increase (decrease) in net asset value from operations | | | 2.64 | | | | 1.21 | | | | 1.21 | | | | 2.66 | | | | (5.50 | ) |
| | | | |
Less: Dividends and Distributions | | | | | | | | | | | | | | | | | | | | |
Dividends from net investment income | | | (.24 | ) | | | (.27 | ) | | | (.27 | ) | | | (.29 | ) | | | (.36 | ) |
Distributions from net realized gain on investment
transactions | | | – 0 | – | | | – 0 | – | | | – 0 | – | | | – 0 | – | | | (1.35 | ) |
| | | | |
Total dividends and distributions | | | (.24 | ) | | | (.27 | ) | | | (.27 | ) | | | (.29 | ) | | | (1.71 | ) |
| | | | |
Net asset value, end of period | | | $ 17.68 | | | | $ 15.28 | | | | $ 14.34 | | | | $ 13.40 | | | | $ 11.03 | |
| | | | |
Total Return | | | | | | | | | | | | | | | | | | | | |
Total investment return based on net asset value(b)* | | | 17.40 | % | | | 8.48 | % | | | 9.18 | % | | | 24.57 | % | | | (33.07 | )% |
Ratios/Supplemental Data | | | | | | | | | | | | | | | | | | | | |
Net assets, end of period (000’s omitted) | | | $2,692 | | | | $2,924 | | | | $2,820 | | | | $3,378 | | | | $5,437 | |
Ratio to average net
assets of: | | | | | | | | | | | | | | | | | | | | |
Expenses | | | 1.07 | % | | | 1.07 | % | | | 1.09 | %(c) | | | 1.02 | % | | | .97 | % |
Net investment income | | | 1.31 | % | | | 1.68 | % | | | 1.88 | %(c) | | | 2.37 | % | | | 2.35 | % |
Portfolio turnover rate | | | 163 | % | | | 87 | % | | | 69 | % | | | 111 | % | | | 118 | % |
See footnote summary on page 78.
| | |
| 76 | | • ALLIANCEBERNSTEIN GLOBAL RISK ALLOCATION FUND |
Financial Highlights
Selected Data For A Share Of Capital Stock Outstanding Throughout Each Period
| | | | | | | | | | | | | | | | | | | | |
| | | Class I | |
| | | Year Ended November 30, | |
| | | 2012 | | | 2011 | | | 2010 | | | 2009 | | | 2008 | |
| | | | | | | | | | | | | | | | | | | | |
| | | | |
| | | | | | | | | | | | | | | | | | | | |
Net asset value, beginning of period | | | $ 15.31 | | | | $ 14.36 | | | | $ 13.42 | | | | $ 11.04 | | | | $ 18.26 | |
| | | | |
Income From Investment Operations | | | | | | | | | | | | | | | | | | | | |
Net investment income(a) | | | .29 | | | | .33 | | | | .32 | | | | .33 | | | | .42 | |
Net realized and unrealized gain (loss) on investment transactions | | | 2.43 | | | | .95 | | | | .95 | | | | 2.39 | | | | (5.87 | ) |
| | | | |
Net increase (decrease) in net asset value from operations | | | 2.72 | | | | 1.28 | | | | 1.27 | | | | 2.72 | | | | (5.45 | ) |
| | | | |
Less: Dividends and Distributions | | | | | | | | | | | | | | | | | | | | |
Dividends from net investment income | | | (.31 | ) | | | (.33 | ) | | | (.33 | ) | | | (.34 | ) | | | (.42 | ) |
Distributions from net realized gain on investment
transactions | | | – 0 | – | | | – 0 | – | | | – 0 | – | | | – 0 | – | | | (1.35 | ) |
| | | | |
Total dividends and distributions | | | (.31 | ) | | | (.33 | ) | | | (.33 | ) | | | (.34 | ) | | | (1.77 | ) |
| | | | |
Net asset value, end of period | | | $ 17.72 | | | | $ 15.31 | | | | $ 14.36 | | | | $ 13.42 | | | | $ 11.04 | |
| | | | |
Total Return | | | | | | | | | | | | | | | | | | | | |
Total investment return based on net asset value(b)* | | | 17.95 | % | | | 8.97 | % | | | 9.64 | % | | | 25.09 | % | | | (32.84 | )% |
Ratios/Supplemental Data | | | | | | | | | | | | | | | | | | | | |
Net assets, end of period (000’s omitted) | | | $954 | | | | $839 | | | | $1,389 | | | | $2,146 | | | | $18,409 | |
Ratio to average net
assets of: | | | | | | | | | | | | | | | | | | | | |
Expenses | | | .64 | % | | | .64 | % | | | .66 | %(c) | | | .69 | % | | | .62 | % |
Net investment income | | | 1.76 | % | | | 2.13 | % | | | 2.30 | %(c) | | | 2.69 | % | | | 2.72 | % |
Portfolio turnover rate | | | 163 | % | | | 87 | % | | | 69 | % | | | 111 | % | | | 118 | % |
See footnote summary on page 78.
| | | | |
| ALLIANCEBERNSTEIN GLOBAL RISK ALLOCATION FUND • | | | 77 | |
Financial Highlights
| (a) | | Based on average shares outstanding. |
| (b) | | Total investment return is calculated assuming an initial investment made at the net asset value at the beginning of the period, reinvestment of all dividends and distributions at net asset value during the period, and redemption on the last day of the period. Initial sales charges or contingent deferred sales charges are not reflected in the calculation of total investment return. Total return does not reflect the deduction of taxes that a shareholder would pay on fund distributions or the redemption of fund shares. Total investment return calculated for a period of less than one year is not annualized. |
| (c) | | The ratio includes expenses attributable to costs of proxy solicitation. |
| * | | Includes the impact of proceeds received and credited to the Fund resulting from class action settlements, which enhanced the Fund’s performance for the years ended November 30, 2012, November 30, 2011, November 30, 2010, November 30, 2009 and November 30, 2008 by 0.07%, 0.03%, 0.20%, 0.27% and 0.05%, respectively. |
See notes to financial statements.
| | |
| 78 | | • ALLIANCEBERNSTEIN GLOBAL RISK ALLOCATION FUND |
Financial Highlights
REPORT OF INDEPENDENT REGISTERED
PUBLIC ACCOUNTING FIRM
To the Board of Directors and Shareholders of AllianceBernstein Global Risk Allocation Fund
We have audited the accompanying statement of assets and liabilities of AllianceBernstein Global Risk Allocation Fund, Inc. (formerly AllianceBernstein Balanced Shares, Inc.) (the “Fund”), including the portfolio of investments, as of November 30, 2012, and the related statement of operations for the year then ended, the statements of changes in net assets for each of the two years in the period then ended, and the financial highlights for each of the three years in the period then ended. These financial statements and financial highlights are the responsibility of the Fund’s management. Our responsibility is to express an opinion on these financial statements and financial highlights based on our audits. The financial highlights for each of the periods presented prior to December 1, 2009 were audited by other auditors whose report dated January 26, 2010 expressed an unqualified opinion on those financial highlights.
We conducted our audits in accordance with the standards of the Public Company Accounting Oversight Board (United States). Those standards require that we plan and perform the audit to obtain reasonable assurance about whether the financial statements and financial highlights are free of material misstatement. We were not engaged to perform an audit of the Fund’s internal control over financial reporting. Our audits included consideration of internal control over financial reporting as a basis for designing audit procedures that are appropriate in the circumstances, but not for the purpose of expressing an opinion on the effectiveness of the Fund’s internal control over financial reporting. Accordingly, we express no such opinion. An audit also includes examining, on a test basis, evidence supporting the amounts and disclosures in the financial statements and financial highlights, assessing the accounting principles used and significant estimates made by management, and evaluating the overall financial statement presentation. Our procedures included confirmation of securities owned as of November 30, 2012 by correspondence with the custodian and others or by other appropriate auditing procedures where replies from others were not received. We believe that our audits provide a reasonable basis for our opinion.
In our opinion, the financial statements and financial highlights referred to above present fairly, in all material respects, the financial position of AllianceBernstein Global Risk Allocation Fund, Inc. at November 30, 2012, the results of its operations for the year then ended, the changes in its net assets for each of the two years in the period then ended, and the financial highlights for each of the three years in the period then ended, in conformity with U.S. generally accepted accounting principles.

New York, New York
January 25, 2013
| | | | |
| ALLIANCEBERNSTEIN GLOBAL RISK ALLOCATION FUND • | | | 79 | |
Report of Independent Registered Public Accounting Firm
2012 FEDERAL TAX INFORMATION
(unaudited)
For Federal income tax purposes, the following information is furnished with respect to the distributions paid by the Fund during the taxable year ended November 30, 2012. For corporate shareholders, 89.81% of dividends paid qualify for the dividends received deduction. For foreign shareholders, 33.64% of ordinary income dividends paid may be considered to be qualifying to be taxed as interest-related dividends.
For the taxable year ended November 30, 2012, the Fund designates $6,521,820 as the maximum amount that may be considered qualified dividend income for individual shareholders.
Shareholders should not use the above information to prepare their income tax returns. The information necessary to complete your income tax returns will be included with your Form 1099-DIV which will be sent to you separately in January 2013.
| | |
| 80 | | • ALLIANCEBERNSTEIN GLOBAL RISK ALLOCATION FUND |
2012 Federal Tax Information
BOARD OF DIRECTORS
| | |
William H. Foulk, Jr.(1) , Chairman John H. Dobkin(1) Michael J. Downey(1) D. James Guzy(1) Nancy P. Jacklin(1) | | Robert M. Keith, President and Chief Executive Officer Garry L. Moody(1) Marshall C. Turner, Jr.(1) Earl D. Weiner(1) |
OFFICERS
| | |
Philip L. Kirstein, Senior Vice President and Independent Compliance Officer Ashwin G. Alankar(2), Vice President Michael DePalma(2), Vice President Leon Zhu(2), Vice President | | Emilie D. Wrapp, Secretary Joseph J. Mantineo, Treasurer and Chief Financial Officer Phyllis J. Clarke, Controller |
| | |
Custodian and Accounting Agent State Street Bank and Trust Company One Lincoln Street Boston, MA 02111 Principal Underwriter AllianceBernstein Investments, Inc. 1345 Avenue of the Americas New York, NY 10105 Legal Counsel Seward & Kissel LLP One Battery Park Plaza New York, NY 10004 | | Transfer Agent AllianceBernstein Investor Services, Inc. P.O. Box 786003 San Antonio, TX 78278-6003 Toll-Free (800) 221-5672 Independent Registered Public Accounting Firm Ernst & Young LLP 5 Times Square New York, NY 10036 |
| (1) | | Member of the Audit Committee, the Governance and Nominating Committee and the Independent Directors Committee. Mr. Foulk is the sole member of the Fair Value Pricing Committee. |
| (2) | | The management of, and investment decisions for, the Fund’s portfolio are made by the Adviser’s Quantitative Investment Team. Messrs. Alankar, DePalma and Zhu are the investment professionals with the most significant responsibilities for the day-to-day management of the Fund’s portfolio. |
| | | | |
| ALLIANCEBERNSTEIN GLOBAL RISK ALLOCATION FUND • | | | 81 | |
Board of Directors
MANAGEMENT OF THE FUND
Board of Directors Information
The business and affairs of the Fund are managed under the direction of the Board of Directors. Certain information concerning the Fund’s Directors is set forth below.
| | | | | | | | |
NAME,
ADDRESS* AND AGE
(FIRST YEAR ELECTED**) | | PRINCIPAL
OCCUPATION(S)
DURING PAST FIVE YEARS
AND OTHER RELEVANT
QUALIFICATIONS*** | | PORTFOLIOS
IN FUND
COMPLEX
OVERSEEN BY
DIRECTOR | | | OTHER
DIRECTORSHIPS
HELD BY
DIRECTOR IN THE
PAST FIVE YEARS |
| INTERESTED DIRECTOR | | | | | | |
Robert M. Keith,+ 1345 Avenue of the Americas New York, NY 10105 52
(2010) | | Senior Vice President of AllianceBernstein L.P. (the “Adviser”) and head of AllianceBernstein Investments, Inc. (“ABI”) since July 2008; Director of ABI, and President of the AllianceBernstein Mutual Funds. Previously, he served as Executive Managing Director of ABI from December 2006 to June 2008. Prior to joining ABI in 2006, Executive Managing Director of Bernstein Global Wealth Management, and prior thereto, Senior Managing Director and Global Head of Client Service and Sales of the Adviser’s institutional investment management business since 2004. Prior thereto, he was Managing Director and Head of North American Client Service and Sales in the Adviser’s institutional investment management business, with which he had been associated since prior to 2004. | | | 101 | | | None |
| | |
| 82 | | • ALLIANCEBERNSTEIN GLOBAL RISK ALLOCATION FUND |
Management of the Fund
| | | | | | | | |
NAME,
ADDRESS* AND AGE
(FIRST YEAR ELECTED**) | | PRINCIPAL
OCCUPATION(S)
DURING PAST FIVE YEARS
AND OTHER RELEVANT
QUALIFICATIONS*** | | PORTFOLIOS
IN FUND
COMPLEX
OVERSEEN BY
DIRECTOR | | | OTHER
DIRECTORSHIPS
HELD BY
DIRECTOR IN THE
PAST FIVE YEARS |
| DISINTERESTED DIRECTORS | | | | | | |
William H. Foulk, Jr.,#, ## Chairman of the Board 80 (1992) | | Investment Adviser and an Independent Consultant since prior to 2008. Previously, he was Senior Manager of Barrett Associates, Inc., a registered investment adviser. He was formerly Deputy Comptroller and Chief Investment Officer of the State of New York and, prior thereto, Chief Investment Officer of the New York Bank for Savings. He has served as a director or trustee of various AllianceBernstein Funds since 1983 and has been Chairman of the AllianceBernstein Funds and of the Independent Directors Committee of such Funds since 2003. He is also active in a number of mutual fund related organizations and committees. | | | 101 | | | None |
| | | | | | | | |
John H. Dobkin, # 70 (1992) | | Independent Consultant since prior to 2008. Formerly, President of Save Venice, Inc. (preservation organization) from 2001-2002; Senior Advisor from June 1999-June 2000 and President of Historic Hudson Valley (historic preservation) from December 1989-May 1999. Previously, Director of the National Academy of Design. He has served as a director or trustee of various AllianceBernstein Funds since 1992, and as Chairman of the Audit Committees of a number of such Funds from 2001-2008. | | | 101 | | | None |
| | | | |
| ALLIANCEBERNSTEIN GLOBAL RISK ALLOCATION FUND • | | | 83 | |
Management of the Fund
| | | | | | | | |
NAME,
ADDRESS* AND AGE
(FIRST YEAR ELECTED**) | | PRINCIPAL
OCCUPATION(S)
DURING PAST FIVE YEARS
AND OTHER RELEVANT
QUALIFICATIONS*** | | PORTFOLIOS
IN FUND
COMPLEX
OVERSEEN BY
DIRECTOR | | | OTHER
DIRECTORSHIPS
HELD BY
DIRECTOR IN THE
PAST FIVE YEARS |
DISINTERESTED DIRECTORS
(continued) | | | | | | |
Michael J. Downey, # 69 (2005) | | Private Investor since prior to 2008. Formerly, managing partner of Lexington Capital, LLC (investment advisory firm) from December 1997 until December 2003. From 1987 until 1993, Chairman and CEO of Prudential Mutual Fund Management, director of the Prudential mutual funds, and member of the Executive Committee of Prudential Securities, Inc. He has served as a director or trustee of the AllianceBernstein Funds since 2005 and is a director of two other registered investment companies (and Chairman of one of them). | | | 101 | | | Asia Pacific Fund, Inc. and The Merger Fund since prior to 2008 and Prospect Acquisition Corp. (financial services) from 2007 until 2009 |
| | | | | | | | |
D. James Guzy, # 76 (2005) | | Chairman of the Board of PLX Technology (semi-conductors) and of SRC Computers Inc., with which he has been associated since prior to 2008. He was a director of Intel Corporation (semi-conductors) from 1969 until 2008 and served as Chairman of the Finance Committee of such company for several years until May 2008. He has served as a director or trustee of one or more of the AllianceBernstein Funds since 1982. | | | 101 | | | Cirrus Logic Corporation (semi-conductors) and PLX Technology (semi-conductors) since prior to 2008 and Intel Corporation (semi-conductors) until 2008 |
| | |
| 84 | | • ALLIANCEBERNSTEIN GLOBAL RISK ALLOCATION FUND |
Management of the Fund
| | | | | | | | |
NAME,
ADDRESS* AND AGE
(FIRST YEAR ELECTED**) | | PRINCIPAL
OCCUPATION(S)
DURING PAST FIVE YEARS
AND OTHER RELEVANT
QUALIFICATIONS*** | | PORTFOLIOS
IN FUND
COMPLEX
OVERSEEN BY
DIRECTOR | | | OTHER
DIRECTORSHIPS
HELD BY
DIRECTOR IN THE
PAST FIVE YEARS |
DISINTERESTED DIRECTORS
(continued) | | | | | | |
Nancy P. Jacklin, # 64 (2006) | | Professorial Lecturer at the Johns Hopkins School of Advanced International Studies since 2008. Formerly, U.S. Executive Director of the International Monetary Fund (December 2002-May 2006); Partner, Clifford Chance (1992-2002); Sector Counsel, International Banking and Finance, and Associate General Counsel, Citicorp (1985-1992); Assistant General Counsel (International), Federal Reserve Board of Governors (1982-1985); and Attorney Advisor, U.S. Department of the Treasury (1973-1982). Member of the Bar of the District of Columbia and of New York; and member of the Council on Foreign Relations. She has served as a director or trustee of the AllianceBernstein Funds since 2006. | | | 101 | | | None |
| | | | |
| ALLIANCEBERNSTEIN GLOBAL RISK ALLOCATION FUND • | | | 85 | |
Management of the Fund
| | | | | | | | |
NAME,
ADDRESS* AND AGE
(FIRST YEAR ELECTED**) | | PRINCIPAL
OCCUPATION(S)
DURING PAST FIVE YEARS
AND OTHER RELEVANT
QUALIFICATIONS*** | | PORTFOLIOS
IN FUND
COMPLEX
OVERSEEN BY
DIRECTOR | | | OTHER
DIRECTORSHIPS
HELD BY
DIRECTOR IN THE
PAST FIVE YEARS |
DISINTERESTED DIRECTORS
(continued) | | | | | | |
Garry L. Moody, # 60 (2008) | | Independent Consultant. Formerly, Partner, Deloitte & Touche LLP, (1995-2008) where he held a number of senior positions, including Vice Chairman, and U.S. and Global Investment Management Practice Managing Partner; President, Fidelity Accounting and Custody Services Company (1993-1995); and Partner, Ernst & Young LLP (1975-1993), where he served as the National Director of Mutual Fund Tax Services. He is also a member of the Governing Council of the Independent Directors Council (IDC), an organization of independent directors of mutual funds. He has served as a director or trustee, and as Chairman of the Audit Committee, of the AllianceBernstein Funds since 2008. | | | 101 | | | None |
| | |
| 86 | | • ALLIANCEBERNSTEIN GLOBAL RISK ALLOCATION FUND |
Management of the Fund
| | | | | | | | |
NAME,
ADDRESS* AND AGE
(FIRST YEAR ELECTED**) | | PRINCIPAL
OCCUPATION(S)
DURING PAST FIVE YEARS
AND OTHER RELEVANT
QUALIFICATIONS*** | | PORTFOLIOS
IN FUND
COMPLEX
OVERSEEN BY
DIRECTOR | | | OTHER
DIRECTORSHIPS
HELD BY
DIRECTOR IN THE
PAST FIVE YEARS |
DISINTERESTED DIRECTORS
(continued) | | | | | | |
Marshall C. Turner, Jr., # 71 (2005) | | Private Investor since prior to 2008. Interim CEO of MEMC Electronic Materials, Inc. (semi-conductor and solar cell substrates) from November 2008 until March 2009. He was Chairman and CEO of Dupont Photomasks, Inc. (components of semi-conductor manufacturing), 2003-2005, and President and CEO, 2005-2006, after the company was acquired and renamed Toppan Photomasks, Inc. He has extensive experience in venture capital investing including prior service as general partner of three institutional venture capital partnerships, and serves on the boards of a number of education and science-related non-profit organizations. He has served as a director or trustee of one or more of the AllianceBernstein Funds since 1992. | | | 101 | | | Xilinx, Inc. (programmable logic semi-conductors) and MEMC Electronic Materials, Inc. (semi-conductor and solar cell substrates) since prior to 2008 |
| | | | |
| ALLIANCEBERNSTEIN GLOBAL RISK ALLOCATION FUND • | | | 87 | |
Management of the Fund
| | | | | | | | |
NAME,
ADDRESS* AND AGE
(FIRST YEAR ELECTED**) | | PRINCIPAL
OCCUPATION(S)
DURING PAST FIVE YEARS
AND OTHER RELEVANT
QUALIFICATIONS*** | | PORTFOLIOS
IN FUND
COMPLEX
OVERSEEN BY
DIRECTOR | | | OTHER
DIRECTORSHIPS
HELD BY
DIRECTOR IN THE
PAST FIVE YEARS |
DISINTERESTED DIRECTORS
(continued) | | | | | | |
Earl D. Weiner, # 73 (2007) | | Of Counsel, and Partner prior to January 2007, of the law firm Sullivan & Cromwell LLP and member of ABA Federal Regulation of Securities Committee Task Force to draft editions of the Fund Director’s Guidebook. He also serves as a director or trustee of various non-profit organizations and has served as Chairman or Vice Chairman of a number of them. He has served as a director or trustee of the AllianceBernstein Funds since 2007 and is Chairman of the Governance and Nominating Committees of the Funds. | | | 101 | | | None |
| * | | The address for each of the Fund’s disinterested Directors is c/o AllianceBernstein L.P., Attention: Philip L. Kirstein, 1345 Avenue of the Americas, New York, NY 10105. |
| ** | | There is no stated term of office for the Fund’s Directors. |
| *** | | The information above includes each Director’s principal occupation during the last five years and other information relating to the experience, attributes, and skills relevant to each Director’s qualifications to serve as a Director, which led to the conclusion that each Director should serve as a Director for the Fund. |
| + | | Mr. Keith is an “interested person” of the Fund, as defined in the 1940 Act, due to his position as a Senior Vice President of the Adviser. |
| # | | Member of the Audit Committee, the Governance and Nominating Committee and the Independent Directors Committee. |
| ## | | Member of the Fair Value Pricing Committee. |
| | |
| 88 | | • ALLIANCEBERNSTEIN GLOBAL RISK ALLOCATION FUND |
Management of the Fund
Officer Information
Certain information concerning the Fund’s Officers is set forth below.
| | | | |
NAME, ADDRESS*
AND AGE | | POSITION(S)
HELD WITH FUND | | PRINCIPAL OCCUPATION
DURING PAST FIVE YEARS |
Robert M. Keith
52 | | President and Chief Executive Officer | | See biography above. |
| | | | |
Philip L. Kirstein
67 | | Senior Vice President and Independent Compliance Officer | | Senior Vice President and Independent Compliance Officer of the AllianceBernstein Funds, with which he has been associated since October 2004. Prior thereto, he was Of Counsel to Kirkpatrick & Lockhart, LLP from October 2003 to October 2004, and General Counsel of Merrill Lynch Investment Managers, L.P. since prior to March 2003. |
| | | | |
Ashwin G. Alankar
39 | | Vice President | | Senior Vice President of the Adviser**, since 2010. Prior thereto, he was associated with Platinum Grove Asset Management, a hedge fund in New York, where he was responsible for equity trading and research since prior to 2008. |
| | | | |
Michael DePalma
45 | | Vice President | | Senior Vice President of the Adviser**, with which he has been associated since prior to 2008. |
| | | | |
Leon Zhu
45 | | Vice President | | Senior Vice President of the Adviser**, with which he has been associated since prior to 2008. |
| | | | |
Emilie D. Wrapp
57 | | Secretary | | Senior Vice President, Assistant General Counsel and Assistant Secretary of ABI**, with which she has been associated since prior to 2008. |
| | | | |
Joseph J. Mantineo 53 | | Treasurer and Chief Financial Officer | | Senior Vice President of AllianceBernstein Investor Services, Inc. (“ABIS”)**, with which he has been associated since prior to 2008. |
| | | | |
Phyllis J. Clarke 52 | | Controller | | Vice President of ABIS**, with which she has been associated since prior to 2008. |
| * | | The address for each of the Fund’s Officers is 1345 Avenue of the Americas, New York, NY 10105. |
| ** | | The Adviser, ABI and ABIS are affiliates of the Fund. |
| | | The Fund’s Statement of Additional Information (“SAI”) has additional information about the Fund’s Directors and Officers and is available without charge upon request. Contact your financial representative or AllianceBernstein at (800) 227-4618, or visit www.alliancebernstein.com, for a free prospectus or SAI. |
| | | | |
| ALLIANCEBERNSTEIN GLOBAL RISK ALLOCATION FUND • | | | 89 | |
Management of the Fund
THE FOLLOWING IS NOT PART OF THE SHAREHOLDER REPORT OR THE FINANCIAL STATEMENTS
SUMMARY OF SENIOR OFFICER’S EVALUATION OF INVESTMENT ADVISORY AGREEMENT1
The following is a summary of the evaluation of the Investment Advisory Agreement between AllianceBernstein L.P. (the “Adviser”) and the AllianceBernstein Balanced Shares, Inc. (the “Fund”),2 prepared by Philip L. Kirstein, the Senior Officer of the Fund for the Directors of the Fund, as required by the August 2004 agreement between the Adviser and the New York State Attorney General (the “NYAG”). The Senior Officer’s evaluation of the Investment Advisory Agreement is not meant to diminish the responsibility or authority of the Board of Directors to perform its duties pursuant to Section 15 of the Investment Company Act of 1940 (the “40 Act”) and applicable state law. The purpose of the summary is to provide shareholders with a synopsis of the independent evaluation of the reasonableness of the advisory fees proposed to be paid by the Fund which was provided to the Directors in connection with their review of the proposed approval of the continuance of the Investment Advisory Agreement.
The Senior Officer’s evaluation considered the following factors:
| | 1. | Advisory fees charged to institutional and other clients of the Adviser for like services; |
| | 2. | Advisory fees charged by other mutual fund companies for like services; |
| | 3. | Costs to the Adviser and its affiliates of supplying services pursuant to the advisory agreement, excluding any intra-corporate profit; |
| | 4. | Profit margins of the Adviser and its affiliates from supplying such services; |
| | 5. | Possible economies of scale as the Fund grows larger; and |
| | 6. | Nature and quality of the Adviser’s services including the performance of the Fund. |
These factors, with the exception of the first factor, are generally referred to as the “Gartenberg factors,” which were articulated by the United States Court of Appeals for the Second Circuit in 1982. Gartenberg v. Merrill Lynch Asset Management, Inc., 694 F. 2d 923 (2d Cir. 1982). On March 30, 2010, the Supreme Court held the Gartenberg decision was correct in its basic formulation of what §36(b) requires: to face liability under §36(b), “an investment adviser must charge a fee that is so disproportionately large that it bears no reasonable relationship to the services rendered and could not have
| 1 | | The information in the fee evaluation was completed on April 19, 2012 and discussed with the Board of Directors on May 1-3, 2012. |
| 2 | | Future references to the Fund do not include “AllianceBernstein.” References in the fee summary pertaining to performance and expense ratio rankings refer to the Class A shares of the Fund. |
| | |
| 90 | | • ALLIANCEBERNSTEIN GLOBAL RISK ALLOCATION FUND |
been the product of arm’s length bargaining.” Jones v. Harris Associates L.P., 130 S. Ct. 1418 (2010). In Jones, the Court stated the Gartenberg approach fully incorporates the correct understanding of fiduciary duty within the context of section 36(b) and noted with approval that “Gartenberg insists that all relevant circumstances be taken into account” and “uses the range of fees that might result from arm’s length bargaining as the benchmark for reviewing challenged fees.”3
FUND ADVISORY FEES, NET ASSETS & EXPENSE RATIOS
The Adviser proposed that the Fund pay the advisory fee set forth in the table below for receiving the services to be provided pursuant to the Investment Advisory Agreement.
| | | | |
| Fund | | Net Assets 3/31/12 ($MIL) | | Advisory Fee Based on % of Average Daily Net Assets |
| Balanced Shares, Inc.4 | | $555.6 | | 60 bp on 1st $200 million 50 bp on next $200 million 40 bp on the balance |
The Adviser is reimbursed as specified in the Investment Advisory Agreement for certain clerical, legal, accounting, administrative and other services provided to the Fund. During the Fund’s most recently completed fiscal year, the Adviser received $56,856 (0.01% of the Fund’s average daily net assets) for such services.
Set forth below are the Fund’s total expense ratios for the most recently completed fiscal year:
| | | | | | | | |
| Fund | | Total Expense
Ratio | | | Fiscal Year |
| Balanced Shares, Inc. | | Advisor Class A Class B Class C Class R Class K Class I | |
| 0.84
1.14 1.90 1.86 1.39 1.09 0.66 | %
% % % % % % | | November 30 |
| I. | ADVISORY FEES CHARGED TO INSTITUTIONAL AND OTHER CLIENTS |
The advisory fees charged to investment companies which the Adviser manages and sponsors are normally higher than those charged to similar sized institutional accounts, including pension plans and sub-advised investment companies. The fee differential reflects, among other things, different services provided to such clients, and different liabilities assumed. Services to be provided by the Adviser to the Fund that are not provided to non-investment company clients
| 3 | | Jones v. Harris at 1427. |
| 4 | | The Fund was not affected by the Adviser’s settlement with the NYAG since the Fund had lower breakpoints than the applicable NYAG related fee schedule. |
| | | | |
| ALLIANCEBERNSTEIN GLOBAL RISK ALLOCATION FUND • | | | 91 | |
include providing office space and personnel to serve as Fund Officers, who among other responsibilities make the certifications required under the Sarbanes–Oxley Act of 2002, and coordinating with and monitoring the Fund’s third party service providers such as Fund counsel, auditors, custodians, transfer agents and pricing services. The accounting, administrative, legal and compliance requirements for the Fund are more costly than those for institutional client assets due to the greater complexities and time required for investment companies, although as previously noted, the Adviser is reimbursed for providing such services. The Adviser also believes that it incurs substantial entrepreneurial risk when offering a new mutual fund, since establishing a new mutual fund requires a large upfront investment and it may take a long time for the fund to achieve profitability since the fund must be priced to scale from inception in order to be competitive and assets are acquired one account at a time. In addition, managing the cash flow of an investment company may be more difficult than managing that of a stable pool of assets, such as an institutional account with little cash movement in either direction, particularly, if a fund is in net redemption and the Adviser is frequently forced to sell securities to raise cash for redemptions. However, managing a fund with positive cash flow may be easier at times than managing a stable pool of assets. Finally, in recent years, investment advisers have been sued by institutional clients and have suffered reputational damage both by the attendant publicity and outcomes other than complete victories. Accordingly, the legal and reputational risks associated with institutional accounts are greater than previously thought, although still not equal to those related to the mutual fund industry.
Notwithstanding the Adviser’s view that managing an investment company is not comparable to managing other institutional accounts because the services provided are different, the Supreme Court has indicated consideration should be given to the advisory fees charged to institutional accounts with a similar investment style as the Fund.5 However, with respect to the Fund, the Adviser represented that there is no institutional product that has a similar investment style as the Fund.
The Adviser represented that it does not sub-advise any registered investment company with a substantially similar investment style as the Fund.
| 5 | | The Supreme Court stated that “courts may give such comparisons the weight that they merit in light of the similarities and differences between the services that the clients in question require, but the courts must be wary of inapt comparisons.” Among the significant differences the Supreme Court noted that may exist between services provided to mutual funds and institutional accounts are “higher marketing costs.” Jones v. Harris at 1428. |
| | |
| 92 | | • ALLIANCEBERNSTEIN GLOBAL RISK ALLOCATION FUND |
| II. | MANAGEMENT FEES CHARGED BY OTHER MUTUAL FUND COMPANIES FOR LIKE SERVICES. |
Lipper, Inc. (“Lipper”), an analytical service that is not affiliated with the Adviser, compared the fees charged to the Fund with fees charged to other investment companies for similar services offered by other investment advisers.6 Lipper’s analysis included the comparison of the Fund’s contractual management fee, estimated at the approximate current asset level of the Fund, to the median of the Fund’s Lipper Expense Group (“EG”)7 and the Fund’s contractual management fee ranking.8
Lipper describes an EG as a representative sample of comparable funds. Lipper’s standard methodology for screening funds to be included in an EG entails the consideration of several fund criteria, including fund type, investment classification/objective, load type and similar 12b-1/non-12b-1 service fees, asset (size) comparability, expense components and attributes. An EG will typically consist of seven to twenty funds.
| | | | | | | | | | | | |
| Fund | | Contractual
Management
Fee (%)9 | | | Lipper Exp. Group Median (%) | | | Rank | |
| Balanced Shares, Inc. | | | 0.509 | | | | 0.661 | | | | 2/12 | |
Lipper also compared the Fund’s total expense ratio to the medians of the Fund’s EG and Lipper Expense Universe (“EU”). The EU is a broader group compared to the EG, consisting of all funds that have the same investment classifications/objective and load type as the subject Fund. Set forth below is Lipper’s comparison of the Fund’s total expense ratio and the medians of the Fund’s EG and EU. The Fund’s total expense ratio rankings are also shown.
| 6 | | The Supreme Court cautioned against accepting mutual fund fee comparisons without careful scrutiny since “these comparisons are problematic because these fees, like those challenged, may not be the product of negotiations conducted at arm’s length.” Jones v. Harris at 1429. |
| 7 | | Lipper does not consider average account size when constructing EGs. Funds with relatively small average account sizes tend to have higher transfer agent expense ratio than comparable sized funds that have relatively large average account sizes. Note that there are limitations on Lipper expense category data because different funds categorize expenses differently. |
| 8 | | The contractual management fee is calculated by Lipper using the Fund’s contractual management fee rate at a hypothetical asset level. The hypothetical asset level is based on the combined net assets of all classes of the Fund, rounded up to the next $25 million. Lipper’s total expense ratio information is based on the most recent annual report except as otherwise noted. A ranking of “1” would mean that the Fund had the lowest effective fee rate in the Lipper peer group. |
| 9 | | The contractual management fee rate does not reflect any expense reimbursement payments made by the Fund to the Adviser for certain clerical, legal, accounting, administrative, and other services. |
| | | | |
| ALLIANCEBERNSTEIN GLOBAL RISK ALLOCATION FUND • | | | 93 | |
| | | | | | | | | | | | | | | | | | | | |
| Fund | | Expense Ratio
(%)10 | | | Lipper Exp. Group
Median (%) | | | Lipper Group Rank | | | Lipper Exp. Universe Median (%) | | | Lipper
Universe Rank | |
| Balanced Shares, Inc. | | | 1.084 | | | | 1.082 | | | | 7/12 | | | | 1.204 | | | | 12/48 | |
Based on this analysis, the Fund has a more favorable ranking on a management fee basis than on a total expense ratio basis.
| III. | COSTS TO THE ADVISER AND ITS AFFILIATES OF SUPPLYING SERVICES PURSUANT TO THE MANAGEMENT FEE ARRANGEMENT, EXCLUDING ANY INTRA-CORPORATE PROFIT. |
The Adviser utilizes two profitability reporting systems, which operate independently but are aligned with each other, to estimate the Adviser’s profitability in connection with investment advisory services provided to the Fund. The Senior Officer has retained a consultant to provide independent advice regarding the alignment of the two profitability systems as well as the methodologies and allocations utilized by both profitability systems. See Section IV for additional discussion.
| IV. | PROFIT MARGINS OF THE ADVISER AND ITS AFFILIATES FOR SUPPLYING SUCH SERVICES. |
The Fund’s profitability information, prepared by the Adviser for the Board of Directors, was reviewed by the Senior Officer and the consultant. The Adviser’s profitability from providing investment advisory services to the Fund decreased during calendar year 2011, relative to 2010.
In addition to the Adviser’s direct profits from managing the Fund, certain of the Adviser’s affiliates have business relationships with the Fund and may earn a profit from providing other services to the Fund. The courts have referred to this type of business opportunity as “fall-out benefits” to the Adviser and indicated that such benefits should be factored into the evaluation of the total relationship between the Fund and the Adviser. Neither case law nor common business practice precludes the Adviser’s affiliates from earning a reasonable profit on this type of relationship provided the affiliates’ charges and services are competitive and the relationship otherwise complies with the 40 Act restrictions. These affiliates provide transfer agent, distribution and brokerage related services to the Fund and receive transfer agent fees, Rule 12b-1 payments, front-end sales loads, contingent deferred sales charges (“CDSC”) and brokerage commissions. In addition, the Adviser benefits from soft dollar arrangements which offset expenses the Adviser would otherwise incur.
| 10 | | Most recently completed fiscal year end Class A total expense ratio. |
| | |
| 94 | | • ALLIANCEBERNSTEIN GLOBAL RISK ALLOCATION FUND |
AllianceBernstein Investments, Inc. (“ABI”), an affiliate of the Adviser, is the Fund’s principal underwriter. ABI and the Adviser have disclosed in the Fund’s prospectus that they may make revenue sharing payments from their own resources, in addition to resources derived from sales loads and Rule 12b-1 fees, to firms that sell shares of the Fund. In 2011, ABI paid approximately 0.04% of the average monthly assets of the AllianceBernstein Mutual Funds or approximately $17.0 million for distribution services and educational support (revenue sharing payments).
During the Fund’s most recently completed fiscal year, ABI received from the Fund $6,204, $2,604,775 and $27,244 in front-end sales charges, Rule 12b-1 and CDSC fees, respectively.
Fees and reimbursements for out of pocket expenses charged by AllianceBernstein Investor Services, Inc. (“ABIS”), the affiliated transfer agent for the Fund, are charged on a per account basis, based on the level of service provided and the class of share held by the account. ABIS also receives a fee per shareholder sub-account for each account maintained by an intermediary on an omnibus basis. During the Fund’s most recently completed fiscal year, ABIS received $485,550 in fees from the Fund.11
The Fund did not effect brokerage transactions through the Adviser’s affiliate, Sanford C. Bernstein & Co., LLC (“SCB & Co.”) nor its U.K. affiliate, Sanford C. Bernstein Limited (“SCB Ltd.”), collectively “SCB”, and pay commissions for such transactions during the Fund’s most recently completed fiscal year. The Adviser represented that SCB’s profitability from any future business conducted with the Fund would be comparable to the profitability of SCB’s dealings with other similar third party clients. In the ordinary course of business, SCB receives and pays liquidity rebates from electronic communications networks (“ECNs”) derived from trading for its clients. These credits and charges are not being passed onto any SCB client. The Adviser also receives certain soft dollar benefits from brokers that execute agency trades for its clients. These soft dollar benefits reduce the Adviser’s cost of doing business and increase its profitability.
| 11 | | The fees disclosed are net of any expense offsets with ABIS. An expense offset is created by the interest earned on the positive cash balance that occurs within the transfer agent account as there is a one day lag with regards to money movement from the shareholder’s account to the transfer agent’s account and then the transfer agent’s account to the Fund’s account. Due to lower average balances and interest rates during the Fund’s most recently completed fiscal year, monthly fees exceeded interest credits, resulting in zero expense offsets for the period. |
| | | | |
| ALLIANCEBERNSTEIN GLOBAL RISK ALLOCATION FUND • | | | 95 | |
| V. | POSSIBLE ECONOMIES OF SCALE |
The Adviser has indicated that economies of scale are being shared with shareholders through fee structures,12 subsidies and enhancement to services. Based on some of the professional literature that has considered economies of scale in the mutual fund industry, it is thought that to the extent economies of scale exist, they may more often exist across a fund family as opposed to a specific fund. This is because the costs incurred by the Adviser, such as investment research or technology for trading or compliance systems can be spread across a greater asset base as the fund family increases in size. It is also possible that as the level of services required to operate a successful investment company has increased over time, and advisory firms make such investments in their business to provide services, there may be a sharing of economies of scale without a reduction in advisory fees.
An independent consultant, retained by the Senior Officer, provided the Board of Directors information on the Adviser’s firm-wide average costs from 2005 through 2011 and potential economies of scale. The independent consultant noted that from 2005 through 2007 the Adviser experienced significant growth in assets under management (“AUM”). During this period, operating expenses increased, in part to keep up with growth, and in part reflecting market returns. However, from 2008 through the first quarter of 2009, AUM rapidly and significantly decreased. Some operating expenses, including base compensation and office space, adjusted more slowly during this period, resulting in an increase in average costs. Since 2009, AUM has moved within a range of $400 to $500 million ending 2011 with an average of $411 million in the fourth quarter. The independent consultant noted that changes in operating expenses reflect changes in business composition and business practices in response to changes in financial markets. Finally, the independent consultant concluded that the increase in average cost and the decline in net operating margin across the company since 2008 are inconsistent with the view that there are currently “economies of scale” to be shared with clients through lower fees.
In February 2008, the independent consultant provided the Board of Directors an update of the Deli13 study on advisory fees and various fund characteristics.14 The independent consultant first reiterated the results of his previous two
| 12 | | Fee structures include fee reductions, pricing at scale and breakpoints in advisory fee schedules. |
| 13 | | The Deli study, originally published in 2002 based on 1997 data and updated for the February 2008 Presentation, may be of diminished value due to the age of data used in the presentation and the changes experienced in the industry over the last four years. |
| 14 | | The Supreme Court cautioned against accepting mutual fund fee comparisons without careful scrutiny since the fees may not be the product of negotiations conducted at arm’s length. See Jones V. Harris at 1429. |
| | |
| 96 | | • ALLIANCEBERNSTEIN GLOBAL RISK ALLOCATION FUND |
dimensional comparison analysis (fund size and family size) with the Board of Directors.15 The independent consultant then discussed the results of the regression model that was utilized to study the effects of various factors on advisory fees. The regression model output indicated that the bulk of the variation in fees predicted were explained by various factors, but substantially by fund AUM, family AUM, index fund indicator and investment style. The independent consultant also compared the advisory fees of the AllianceBernstein Mutual Funds to similar funds managed by 19 other large asset managers, regardless of the fund size and each Adviser’s proportion of mutual fund assets to non-mutual fund assets.
| VI. | NATURE AND QUALITY OF THE ADVISER’S SERVICES, INCLUDING THE PERFORMANCE OF THE FUND |
With assets under management of approximately $419 billion as of March 31, 2012, the Adviser has the investment experience to manage and provide non-investment services (described in Section I) to the Fund.
The information prepared by Lipper shows the 1, 3, 5 and 10 year performance returns and rankings16 of the Fund relative to its Lipper Performance Group (“PG”) and Lipper Performance Universe (“PU”)17 for the periods ended February 29, 2012.18
| | | | | | | | | | | | | | | | |
| | | Fund
Return (%) | | | PG
Median (%) | | | PU
Median (%) | | | PG Rank | | PU Rank |
1 year | | | 9.19 | | | | 4.19 | | | | 1.81 | | | 1/12 | | 1/110 |
3 year | | | 19.58 | | | | 19.64 | | | | 20.02 | | | 7/12 | | 56/101 |
5 year | | | 2.15 | | | | 2.29 | | | | 2.13 | | | 7/12 | | 43/90 |
10 year | | | 4.99 | | | | 4.29 | | | | 5.13 | | | 4/9 | | 28/49 |
| 15 | | The two dimensional analysis showed patterns of lower advisory fees for funds with larger asset sizes and funds from larger family sizes compared to funds with smaller asset sizes and funds from smaller family sizes, which according to the independent consultant is indicative of a sharing of economies of scale and scope. However, in less liquid and active markets, such is not the case, as the empirical analysis showed potential for diseconomies of scale in those markets. The empirical analysis also showed diminishing economies of scale and scope as funds surpassed a certain high level of assets. |
| 16 | | The performance returns and rankings of the Fund are for the Fund’s Class A shares. The Fund’s performance returns were provided by Lipper. |
| 17 | | The Fund’s PG is identical to the Fund’s EG. The Fund’s PU is not identical to the Fund’s EU as the criteria for including/excluding a fund from a PU is somewhat different from that of an EU. |
| 18 | | The current Lipper investment classification/objective dictates the PG and PU throughout the life of the Fund even if a Fund had a different investment classification/objective at a different point in time. |
| | | | |
| ALLIANCEBERNSTEIN GLOBAL RISK ALLOCATION FUND • | | | 97 | |
Set forth below are the 1, 3, 5 and 10 year and since inception performance returns of the Fund (in bold)19 versus its benchmarks.20 Fund and benchmark volatility and reward-to-variability ratio (“Sharpe Ratio”) information is also shown.21
| | | | | | | | | | | | | | | | | | | | | | | | | | | | | | | | |
| | | Periods Ending February 29, 2012 Annualized Performance | |
| | | | | | | | | | | | | | | Since
Inception
(%) | | | Annualized | | | Risk
Period
(Year) | |
| | | 1 Year
(%) | | | 3 Year
(%) | | | 5 Year
(%) | | | 10 Year
(%) | | | | Volatility
(%) | | | Sharpe
(%) | | |
| Balanced Shares, Inc. | | | 9.19 | | | | 19.58 | | | | 2.15 | | | | 4.99 | | | | 9.19 | | | | 11.31 | | | | 0.32 | | | | 10 | |
| 60% Russell 1000 Value Index / 40% Barclays Capital Aggregate Bond Index | | | 5.00 | | | | 18.17 | | | | 2.34 | | | | 5.51 | | | | 5.00 | | | | 10.06 | | | | 0.39 | | | | 10 | |
| Russell 1000 Value Index | | | 2.18 | | | | 25.01 | | | | -1.08 | | | | 4.75 | | | | 2.18 | | | | N/A | | | | N/A | | | | N/A | |
| Barclays Capital U.S. Aggregate Index | | | 8.37 | | | | 7.52 | | | | 6.36 | | | | 5.68 | | | | 8.37 | | | | N/A | | | | N/A | | | | N/A | |
| Inception Date: June 8, 1932 | |
Based on the factors discussed above the Senior Officer’s conclusion is that the proposed fee for the Fund is reasonable and within the range of what would have been negotiated at arm’s-length in light of all the surrounding circumstances. This conclusion in respect of the Fund is based on an evaluation of all of these factors and no single factor was dispositive.
May 25, 2012
| 19 | | The performance returns and risk measures shown in the table are for the Class A shares of the Fund. |
| 20 | | The Adviser provided Fund and benchmark performance return information for periods through February 29, 2012. |
| 21 | | Fund and benchmark volatility and Sharpe Ratio information was obtained through Lipper LANA, a database maintained by Lipper. Volatility is a statistical measure of the tendency of a market price or yield to vary over time. A Sharpe Ratio is a risk adjusted measure of return that divides a fund’s return in excess of the riskless return by the fund’s standard deviation. A fund with a greater volatility would be viewed as more risky than a fund with equivalent performance but lower volatility; for that reason, a greater return would be demanded for the more risky fund. A fund with a higher Sharpe Ratio would be viewed as better performing than a fund with a lower Sharpe Ratio. |
| | |
| 98 | | • ALLIANCEBERNSTEIN GLOBAL RISK ALLOCATION FUND |
THIS PAGE IS NOT PART OF THE SHAREHOLDER REPORT OR THE FINANCIAL STATEMENTS
ALLIANCEBERNSTEIN FAMILY OF FUNDS
Wealth Strategies
Balanced Wealth Strategy
Conservative Wealth Strategy
Wealth Appreciation Strategy
Tax-Managed Balanced Wealth Strategy
Tax-Managed Conservative Wealth Strategy
Tax-Managed Wealth Appreciation Strategy
Asset Allocation/Multi-Asset Funds
Dynamic All Market Fund
Emerging Markets Multi-Asset Portfolio
International Portfolio
Tax-Managed International Portfolio
Growth Funds
Domestic
Discovery Growth Fund**
Growth Fund
Large Cap Growth Fund
Select US Equity Portfolio
Small Cap Growth Portfolio
U.S. Strategic Research Portfolio
Global & International
Global Thematic Growth Fund
International Discovery Equity Portfolio
International Focus 40 Portfolio
International Growth Fund
Value Funds
Domestic
Core Opportunities Fund
Discovery Value Fund**
Equity Income Fund
Growth & Income Fund
Value Fund
Global & International
Emerging Markets Equity Portfolio
Global Real Estate Investment Fund
Global Value Fund
International Value Fund
Taxable Bond Funds
Bond Inflation Strategy
Global Bond Fund
High Income Fund
Intermediate Bond Portfolio
Limited Duration High Income Portfolio
Short Duration Portfolio
Municipal Bond Funds
| | |
Arizona Portfolio California Portfolio High Income Portfolio Massachusetts Portfolio Michigan Portfolio Minnesota Portfolio Municipal Bond Inflation Strategy | | National Portfolio New Jersey Portfolio New York Portfolio Ohio Portfolio Pennsylvania Portfolio Virginia Portfolio |
Intermediate Municipal Bond Funds
Intermediate California Portfolio
Intermediate Diversified Portfolio
Intermediate New York Portfolio
Closed-End Funds
Alliance California Municipal Income Fund
Alliance New York Municipal Income Fund
AllianceBernstein Global High Income Fund
AllianceBernstein Income Fund
AllianceBernstein National Municipal Income Fund
Alternatives
Global Risk Allocation Fund**
Market Neutral Strategy-Global
Market Neutral Strategy-U.S.
Real Asset Strategy
Select US Long/Short Portfolio
Unconstrained Bond Fund
Retirement Strategies
| | | | |
2000 Retirement Strategy | | 2020 Retirement Strategy | | 2040 Retirement Strategy |
2005 Retirement Strategy | | 2025 Retirement Strategy | | 2045 Retirement Strategy |
2010 Retirement Strategy | | 2030 Retirement Strategy | | 2050 Retirement Strategy |
2015 Retirement Strategy | | 2035 Retirement Strategy | | 2055 Retirement Strategy |
We also offer Exchange Reserves,* which serves as the money market fund exchange vehicle for the AllianceBernstein mutual funds.
Investors should consider the investment objectives, risks, charges and expenses of the Fund carefully before investing. For copies of our prospectus or summary prospectus, which contain this and other information, visit us online at www.alliancebernstein.com or contact your AllianceBernstein investments representative. Please read the prospectus and/or summary prospectus carefully before investing.
| * | | An investment in the Fund is not a deposit in a bank and is not insured or guaranteed by the Federal Deposit Insurance Corporation or any other government agency. Although the Fund seeks to preserve the value of your investment at $1.00 per share, it is possible to lose money by investing in the Fund. |
| ** | Prior to October 8, 2012, Global Risk Allocation Fund was named Balanced Shares. Prior to November 1, 2012, Discovery Growth Fund was named Small/Mid Cap Growth Fund and Discovery Value Fund was named Small/Mid Cap Value Fund. |
| | | | |
| ALLIANCEBERNSTEIN GLOBAL RISK ALLOCATION FUND • | | | 99 | |
AllianceBernstein Family of Funds
NOTES
| | |
| 100 | | • ALLIANCEBERNSTEIN GLOBAL RISK ALLOCATION FUND |
ALLIANCEBERNSTEIN GLOBAL RISK ALLOCATION FUND
(formerly Balanced Shares)
1345 Avenue of the Americas
New York, NY 10105
800.221.5672
| | |
| |
| GRA-0151-1112 | |  |
ITEM 2. CODE OF ETHICS.
(a) The registrant has adopted a code of ethics that applies to its principal executive officer, principal financial officer and principal accounting officer. A copy of the registrant’s code of ethics is filed herewith as Exhibit 12(a)(1).
(b) During the period covered by this report, no material amendments were made to the provisions of the code of ethics adopted in 2(a) above.
(c) During the period covered by this report, no implicit or explicit waivers to the provisions of the code of ethics adopted in 2(a) above were granted.
ITEM 3. AUDIT COMMITTEE FINANCIAL EXPERT.
The registrant’s Board of Directors has determined that independent directors Garry L. Moody and William H. Foulk, Jr. qualify as audit committee financial experts.
ITEM 4. PRINCIPAL ACCOUNTANT FEES AND SERVICES.
(a)—(c) The following table sets forth the aggregate fees billed by the independent registered public accounting firm Ernst & Young, for the Fund’s last two fiscal years, for professional services rendered for: (i) the audit of the Fund’s annual financial statements included in the Fund’s annual report to stockholders; (ii) assurance and related services that are reasonably related to the performance of the audit of the Fund’s financial statements and are not reported under (i), which include advice and education related to accounting and auditing issues, quarterly press release review (for those Funds that issue quarterly press releases), and preferred stock maintenance testing (for those Funds that issue preferred stock); and (iii) tax compliance, tax advice and tax return preparation.
| | | | | | | | | | | | | | |
| | | | | Audit Fees | | | Audit-Related
Fees | | | Tax Fees | |
AB Global Risk Allocation | | 2011 | | $ | 32,500 | | | $ | 41 | | | $ | 19,731 | |
| | 2012 | | $ | 48,000 | | | $ | 326 | | | $ | 20,635 | |
(e) (1) Beginning with audit and non-audit service contracts entered into on or after May 6, 2003, the Fund’s Audit Committee policies and procedures require the pre-approval of all audit and non-audit services provided to the Fund by the Fund’s independent registered public accounting firm. The Fund’s Audit Committee policies and procedures also require pre-approval of all audit and non-audit services provided to the Adviser and Service Affiliates to the extent that these services are directly related to the operations or financial reporting of the Fund.
(e) (2) All of the amounts for Audit Fees, Audit-Related Fees and Tax Fees in the table under Item 4 (a) – (c) are for services pre-approved by the Fund’s Audit Committee.
(g) The following table sets forth the aggregate non-audit services provided to the Fund, the Fund’s Adviser and entities that control, are controlled by or under common control with the Adviser that provide ongoing services to the Fund:
| | | | | | | | | | |
| | | | | All Fees for
Non-Audit Services
Provided to the
Portfolio, the Adviser
and Service Affiliates | | | Total Amount of
Foregoing Column Pre-
approved by the Audit
Committee
(Portion Comprised of
Audit Related Fees)
(Portion Comprised of
Tax Fees) | |
AB Global Risk Allocation | | 2011 | | $ | 689,481 | | | $ | 19,772 | |
| | | | | | | | $ | (41 | ) |
| | | | | | | | $ | (19,731 | ) |
| | 2012 | | $ | 674,726 | | | $ | 20,961 | |
| | | | | | | | $ | (326 | ) |
| | | | | | | | $ | (20,635 | ) |
(h) The Audit Committee of the Fund has considered whether the provision of any non-audit services not pre-approved by the Audit Committee provided by the Fund’s independent registered public accounting firm to the Adviser and Service Affiliates is compatible with maintaining the auditor’s independence.
ITEM 5. AUDIT COMMITTEE OF LISTED REGISTRANTS.
Not applicable to the registrant.
ITEM 6. SCHEDULE OF INVESTMENTS.
Please see Schedule of Investments contained in the Report to Shareholders included under Item 1 of this Form N-CSR.
ITEM 7. DISCLOSURE OF PROXY VOTING POLICIES AND PROCEDURES FOR CLOSED-END MANAGEMENT INVESTMENT COMPANIES.
Not applicable to the registrant.
ITEM 8. PORTFOLIO MANAGERS OF CLOSED-END MANAGEMENT INVESTMENT COMPANIES.
Not applicable to the registrant.
ITEM 9. PURCHASES OF EQUITY SECURITIES BY CLOSED-END MANAGEMENT INVESTMENT COMPANY AND AFFILIATED PURCHASERS.
Not applicable to the registrant.
ITEM 10. SUBMISSION OF MATTERS TO A VOTE OF SECURITY HOLDERS.
There have been no material changes to the procedures by which shareholders may recommend nominees to the Fund’s Board of Directors since the Fund last provided disclosure in response to this item.
ITEM 11. CONTROLS AND PROCEDURES.
(a) The registrant’s principal executive officer and principal financial officer have concluded that the registrant’s disclosure controls and procedures (as defined in Rule 30a-3 (c) under the Investment Company Act of 1940, as amended) are effective at the reasonable assurance level based on their evaluation of these controls and procedures as of a date within 90 days of the filing date of this document.
(b) There were no changes in the registrant’s internal controls over financial reporting that occurred during the second fiscal quarter of the period that has materially affected, or is reasonably likely to materially affect, the registrant’s internal control over financial reporting.
ITEM 12. EXHIBITS.
The following exhibits are attached to this Form N-CSR:
| | |
EXHIBIT NO. | | DESCRIPTION OF EXHIBIT |
| |
| 12 (a) (1) | | Code of Ethics that is subject to the disclosure of Item 2 hereof |
| |
| 12 (b) (1) | | Certification of Principal Executive Officer Pursuant to Section 302 of the Sarbanes-Oxley Act of 2002 |
| |
| 12 (b) (2) | | Certification of Principal Financial Officer Pursuant to Section 302 of the Sarbanes-Oxley Act of 2002 |
| |
| 12 (c) | | Certification of Principal Executive Officer and Principal Financial Officer Pursuant to Section 906 of the Sarbanes-Oxley Act of 2002 |
SIGNATURES
Pursuant to the requirements of the Securities Exchange Act of 1934 and the Investment Company Act of 1940, the registrant has duly caused this report to be signed on its behalf by the undersigned, thereunto duly authorized.
(Registrant): AllianceBernstein Global Risk Allocation Fund, Inc.
| | |
| |
| By: | | /s/ Robert M. Keith |
| | Robert M. Keith |
| | President |
Date: January 22, 2013
Pursuant to the requirements of the Securities Exchange Act of 1934 and the Investment Company Act of 1940, this report has been signed below by the following persons on behalf of the registrant and in the capacities and on the dates indicated.
| | |
| |
| By: | | /s/ Robert M. Keith |
| | Robert M. Keith |
| | President |
Date: January 22, 2013
| | |
| |
| By: | | /s/ Joseph J. Mantineo |
| | Joseph J. Mantineo |
| | Treasurer and Chief Financial Officer |
Date: January 22, 2013