UNITED STATES
SECURITIES AND EXCHANGE COMMISSION
WASHINGTON, D.C. 20549
FORM N-CSR
CERTIFIED SHAREHOLDER REPORT OF REGISTERED
MANAGEMENT INVESTMENT COMPANIES
Investment Company Act file number: 811-00134
AB GLOBAL RISK ALLOCATION FUND, INC.
(Exact name of registrant as specified in charter)
1345 Avenue of the Americas, New York, New York 10105
(Address of principal executive offices) (Zip code)
Stephen M. Woetzel
AllianceBernstein L.P.
1345 Avenue of the Americas
New York, New York 10105
(Name and address of agent for service)
Registrant’s telephone number, including area code: (800) 221-5672
Date of fiscal year end: November 30, 2024
Date of reporting period: May 31, 2024
ITEM 1. REPORTS TO STOCKHOLDERS.
1
Please scan QR code for
Fund Information
AB Global Risk Allocation Fund
Semi-Annual Shareholder Report
This semi-annual shareholder report contains important information about the AB Global Risk Allocation Fund (the “Fund”) for the period of December 1, 2023 to May 31, 2024. You can find additional information about the Fund at https://www.abfunds.com/link/AB/CBSYX-S. You can also request this information by contacting us at (800) 227 4618.
What were the Fund costs for last six months?
(Based on a hypothetical $10,000 investment)
| Class Name | Cost of a $10,000 investment | Costs paid as a percentage of a $10,000 investment |
|---|
| Advisor Class | $58 | 1.12% |
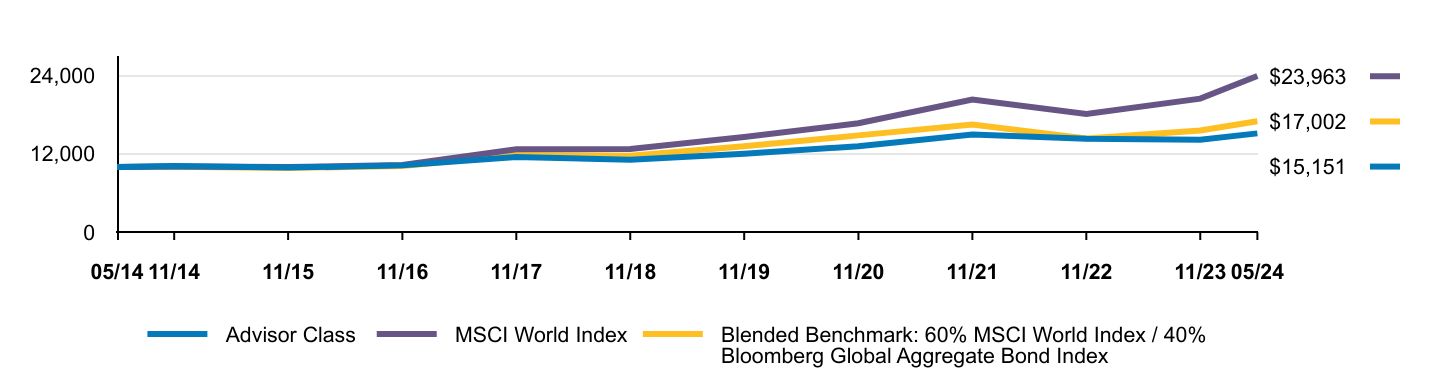
The following graph shows the performance of hypothetical $10,000 investments in the Fund and a broad-based securities market index over the most recently completed 10 fiscal years of the Fund. The Fund's performance reflects sales charges and assumes the reinvestment of dividends.
| Advisor Class | MSCI World Index | Blended Benchmark: 60% MSCI World Index / 40% Bloomberg Global Aggregate Bond Index |
|---|
| 05/14 | $10,000 | $10,000 | $10,000 |
| 11/14 | $10,126 | $10,045 | $10,022 |
| 11/15 | $9,897 | $9,972 | $9,825 |
| 11/16 | $10,235 | $10,287 | $10,149 |
| 11/17 | $11,517 | $12,720 | $11,829 |
| 11/18 | $11,105 | $12,737 | $11,718 |
| 11/19 | $12,023 | $14,588 | $13,171 |
| 11/20 | $13,187 | $16,706 | $14,844 |
| 11/21 | $14,991 | $20,345 | $16,509 |
| 11/22 | $14,318 | $18,136 | $14,353 |
| 11/23 | $14,183 | $20,490 | $15,588 |
| 05/24 | $15,151 | $23,963 | $17,002 |
Average Annual Total Returns
| 6 Months | 1 Year | 5 Years | 10 Years |
|---|
| Advisor Class (without sales charge) | 6.83% | 9.08% | 5.58% | 4.24% |
| Advisor Class (with sales charge) | 6.83% | 9.08% | 5.58% | 4.24% |
| MSCI World Index | 14.89% | 24.92% | 12.76% | 9.13% |
| Blended Benchmark: 60% MSCI World Index / 40% Bloomberg Global Aggregate Bond Index | 9.07% | 14.80% | 7.04% | 5.45% |
The Fund’s past performance is not a good predictor of the Fund’s future performance.
The graph and table do not reflect the deduction of taxes that a shareholder would pay on Fund distributions or redemption of Fund shares.
Visit https://www.abfunds.com/link/AB/CBSYX-S for the most recent performance information.
2
| Net Assets | $175,391,926 |
| # of Portfolio Holdings | 454 |
| Portfolio Turnover Rate | 24% |
| Total Advisory Fees Paid | $533,337 |
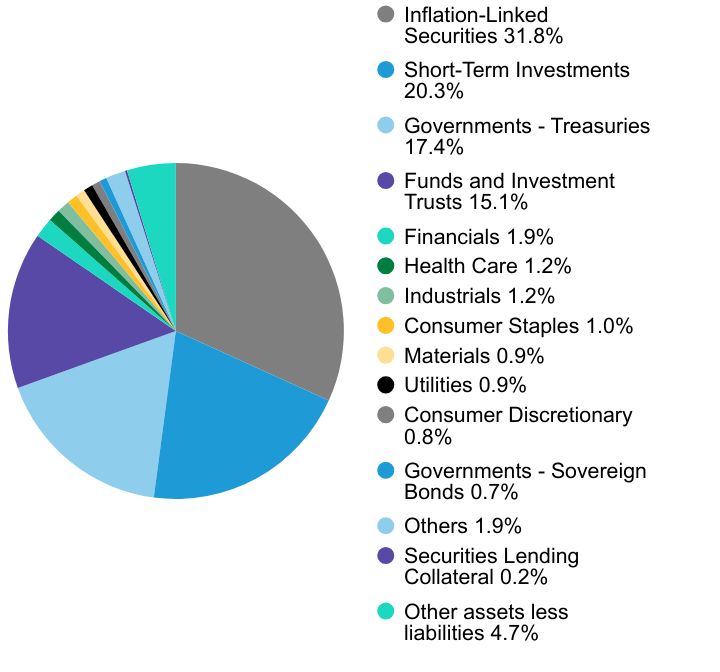
Graphical Representation of Holdings
| Value | Value |
|---|
| Inflation-Linked Securities | 31.8% |
| Short-Term Investments | 20.3% |
| Governments - Treasuries | 17.4% |
| Funds and Investment Trusts | 15.1% |
| Financials | 1.9% |
| Health Care | 1.2% |
| Industrials | 1.2% |
| Consumer Staples | 1.0% |
| Materials | 0.9% |
| Utilities | 0.9% |
| Consumer Discretionary | 0.8% |
| Governments - Sovereign Bonds | 0.7% |
| Others | 1.9% |
| Securities Lending Collateral | 0.2% |
| Other assets less liabilities | 4.7% |
| Company | U.S. $ Value | % of Net Assets |
|---|
| U.S. Treasury Inflation Index, 0.38%, due 07/15/25 | $30,520,576 | 17.4% |
| Vanguard S&P 500 ETF | $22,011,440 | 12.5% |
| U.S. Treasury Inflation Index, 0.50%, due 01/15/28 | $18,417,026 | 10.5% |
| U.S. Treasury Inflation Index, 0.38%, due 01/15/27 | $6,900,487 | 3.9% |
| VanEck JPMorgan EM Local Currency Bond ETF | $2,376,985 | 1.4% |
| iShares MSCI Emerging Markets ex China ETF | $2,128,060 | 1.2% |
| Mexico Government International Bond, 4.13%, due 01/21/26 | $1,147,585 | 0.7% |
| State Street SecLending Cash Collateral | $366,822 | 0.2% |
| Novo Nordisk A/S - Class B | $347,933 | 0.2% |
| ASML Holding NV | $257,371 | 0.2% |
| Total | $84,474,285 | 48.2% |
| Value | Value |
|---|
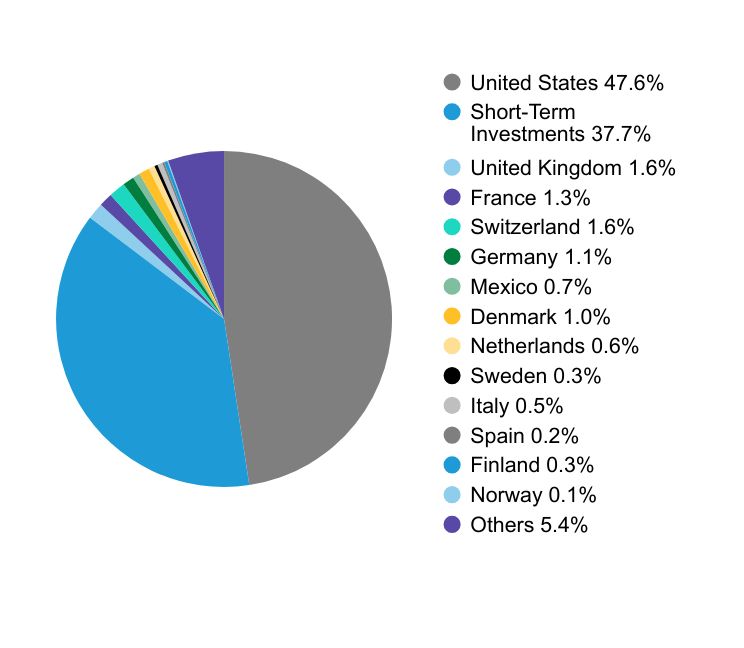
| United States | 47.6% |
| Short-Term Investments | 37.7% |
| United Kingdom | 1.6% |
| France | 1.3% |
| Switzerland | 1.6% |
| Germany | 1.1% |
| Mexico | 0.7% |
| Denmark | 1.0% |
| Netherlands | 0.6% |
| Sweden | 0.3% |
| Italy | 0.5% |
| Spain | 0.2% |
| Finland | 0.3% |
| Norway | 0.1% |
| Others | 5.4% |
3
Availability of Additional Information
You can find additional information on the Fund’s website at https://www.abfunds.com/link/AB/CBSYX-S, including the Fund's:
• Prospectus
• Financial information
• Fund holdings
• Proxy voting information
You can also request this information by contacting us at (800) 227 4618.
Shareholders who have consented to receive a single annual or semi-annual shareholder report at a shared address may revoke this consent by contacting us at (800) 227 4618.
Information Regarding the Review and Approval of the Fund’s Advisory Agreement
Information regarding the Fund’s Board of Directors’/Trustees’ review of the advisory agreement is available on the Fund’s website https://www.abfunds.com/link/AB/CBSYX-S. You can request this information, free of charge, by contacting us at (800) 227 4618 or by scanning the QR code below.
The [A/B] logo is a registered service mark of AllianceBernstein and AllianceBernstein® is a registered service mark used by permission of the owner, AllianceBernstein L.P.
Please scan QR code for
Fund Information
1
Please scan QR code for
Fund Information
AB Global Risk Allocation Fund
Semi-Annual Shareholder Report
This semi-annual shareholder report contains important information about the AB Global Risk Allocation Fund (the “Fund”) for the period of December 1, 2023 to May 31, 2024. You can find additional information about the Fund at https://www.abfunds.com/link/AB/CABNX-S. You can also request this information by contacting us at (800) 227 4618.
What were the Fund costs for last six months?
(Based on a hypothetical $10,000 investment)
| Class Name | Cost of a $10,000 investment | Costs paid as a percentage of a $10,000 investment |
|---|
| Class A | $71 | 1.38% |
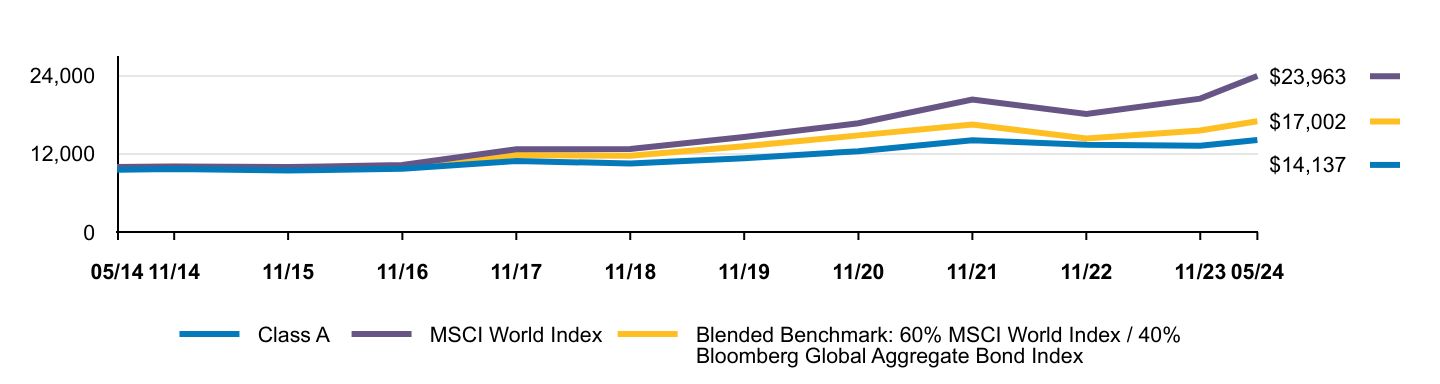
The following graph shows the performance of hypothetical $10,000 investments in the Fund and a broad-based securities market index over the most recently completed 10 fiscal years of the Fund. The Fund's performance reflects sales charges and assumes the reinvestment of dividends.
| Class A | MSCI World Index | Blended Benchmark: 60% MSCI World Index / 40% Bloomberg Global Aggregate Bond Index |
|---|
| 05/14 | $9,575 | $10,000 | $10,000 |
| 11/14 | $9,680 | $10,045 | $10,022 |
| 11/15 | $9,432 | $9,972 | $9,825 |
| 11/16 | $9,735 | $10,287 | $10,149 |
| 11/17 | $10,923 | $12,720 | $11,829 |
| 11/18 | $10,507 | $12,737 | $11,718 |
| 11/19 | $11,346 | $14,588 | $13,171 |
| 11/20 | $12,412 | $16,706 | $14,844 |
| 11/21 | $14,081 | $20,345 | $16,509 |
| 11/22 | $13,407 | $18,136 | $14,353 |
| 11/23 | $13,247 | $20,490 | $15,588 |
| 05/24 | $14,137 | $23,963 | $17,002 |
Average Annual Total Returns
| 6 Months | 1 Year | 5 Years | 10 Years |
|---|
| Class A (without sales charge) | 6.72% | 8.80% | 5.33% | 3.97% |
| Class A (with sales charge) | 2.18% | 4.15% | 4.41% | 3.52% |
| MSCI World Index | 14.89% | 24.92% | 12.76% | 9.13% |
| Blended Benchmark: 60% MSCI World Index / 40% Bloomberg Global Aggregate Bond Index | 9.07% | 14.80% | 7.04% | 5.45% |
The Fund’s past performance is not a good predictor of the Fund’s future performance.
The graph and table do not reflect the deduction of taxes that a shareholder would pay on Fund distributions or redemption of Fund shares.
Visit https://www.abfunds.com/link/AB/CABNX-S for the most recent performance information.
2
| Net Assets | $175,391,926 |
| # of Portfolio Holdings | 454 |
| Portfolio Turnover Rate | 24% |
| Total Advisory Fees Paid | $533,337 |
Graphical Representation of Holdings
| Value | Value |
|---|
| Inflation-Linked Securities | 31.8% |
| Short-Term Investments | 20.3% |
| Governments - Treasuries | 17.4% |
| Funds and Investment Trusts | 15.1% |
| Financials | 1.9% |
| Health Care | 1.2% |
| Industrials | 1.2% |
| Consumer Staples | 1.0% |
| Materials | 0.9% |
| Utilities | 0.9% |
| Consumer Discretionary | 0.8% |
| Governments - Sovereign Bonds | 0.7% |
| Others | 1.9% |
| Securities Lending Collateral | 0.2% |
| Other assets less liabilities | 4.7% |
| Company | U.S. $ Value | % of Net Assets |
|---|
| U.S. Treasury Inflation Index, 0.38%, due 07/15/25 | $30,520,576 | 17.4% |
| Vanguard S&P 500 ETF | $22,011,440 | 12.5% |
| U.S. Treasury Inflation Index, 0.50%, due 01/15/28 | $18,417,026 | 10.5% |
| U.S. Treasury Inflation Index, 0.38%, due 01/15/27 | $6,900,487 | 3.9% |
| VanEck JPMorgan EM Local Currency Bond ETF | $2,376,985 | 1.4% |
| iShares MSCI Emerging Markets ex China ETF | $2,128,060 | 1.2% |
| Mexico Government International Bond, 4.13%, due 01/21/26 | $1,147,585 | 0.7% |
| State Street SecLending Cash Collateral | $366,822 | 0.2% |
| Novo Nordisk A/S - Class B | $347,933 | 0.2% |
| ASML Holding NV | $257,371 | 0.2% |
| Total | $84,474,285 | 48.2% |
| Value | Value |
|---|
| United States | 47.6% |
| Short-Term Investments | 37.7% |
| United Kingdom | 1.6% |
| France | 1.3% |
| Switzerland | 1.6% |
| Germany | 1.1% |
| Mexico | 0.7% |
| Denmark | 1.0% |
| Netherlands | 0.6% |
| Sweden | 0.3% |
| Italy | 0.5% |
| Spain | 0.2% |
| Finland | 0.3% |
| Norway | 0.1% |
| Others | 5.4% |
3
Availability of Additional Information
You can find additional information on the Fund’s website at https://www.abfunds.com/link/AB/CABNX-S, including the Fund's:
• Prospectus
• Financial information
• Fund holdings
• Proxy voting information
You can also request this information by contacting us at (800) 227 4618.
Shareholders who have consented to receive a single annual or semi-annual shareholder report at a shared address may revoke this consent by contacting us at (800) 227 4618.
Information Regarding the Review and Approval of the Fund’s Advisory Agreement
Information regarding the Fund’s Board of Directors’/Trustees’ review of the advisory agreement is available on the Fund’s website https://www.abfunds.com/link/AB/CABNX-S. You can request this information, free of charge, by contacting us at (800) 227 4618 or by scanning the QR code below.
The [A/B] logo is a registered service mark of AllianceBernstein and AllianceBernstein® is a registered service mark used by permission of the owner, AllianceBernstein L.P.
Please scan QR code for
Fund Information
1
Please scan QR code for
Fund Information
AB Global Risk Allocation Fund
Semi-Annual Shareholder Report
This semi-annual shareholder report contains important information about the AB Global Risk Allocation Fund (the “Fund”) for the period of December 1, 2023 to May 31, 2024. You can find additional information about the Fund at https://www.abfunds.com/link/AB/CBACX-S. You can also request this information by contacting us at (800) 227 4618.
What were the Fund costs for last six months?
(Based on a hypothetical $10,000 investment)
| Class Name | Cost of a $10,000 investment | Costs paid as a percentage of a $10,000 investment |
|---|
| Class C | $110 | 2.14% |
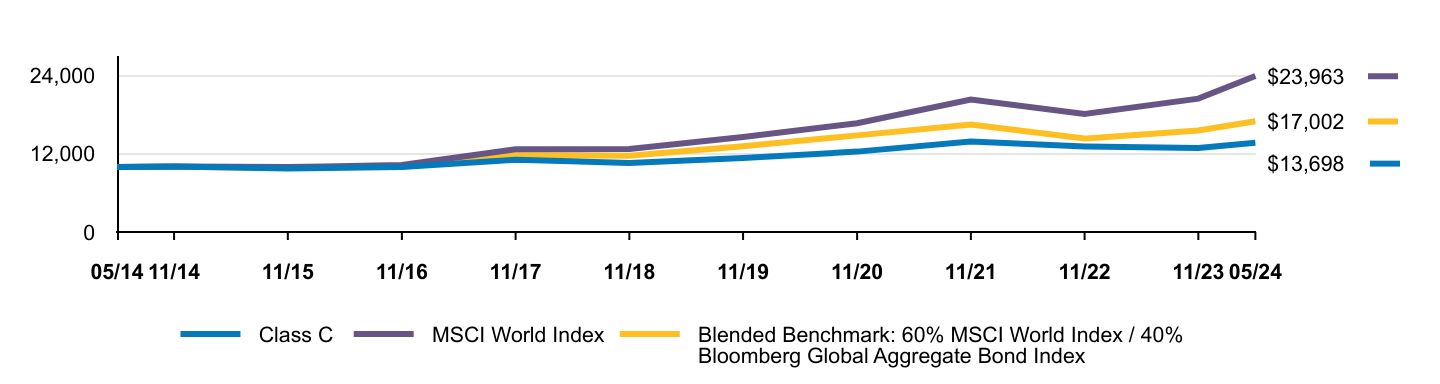
The following graph shows the performance of hypothetical $10,000 investments in the Fund and a broad-based securities market index over the most recently completed 10 fiscal years of the Fund. The Fund's performance reflects sales charges and assumes the reinvestment of dividends.
| Class C | MSCI World Index | Blended Benchmark: 60% MSCI World Index / 40% Bloomberg Global Aggregate Bond Index |
|---|
| 05/14 | $10,000 | $10,000 | $10,000 |
| 11/14 | $10,075 | $10,045 | $10,022 |
| 11/15 | $9,745 | $9,972 | $9,825 |
| 11/16 | $9,981 | $10,287 | $10,149 |
| 11/17 | $11,113 | $12,720 | $11,829 |
| 11/18 | $10,613 | $12,737 | $11,718 |
| 11/19 | $11,373 | $14,588 | $13,171 |
| 11/20 | $12,348 | $16,706 | $14,844 |
| 11/21 | $13,899 | $20,345 | $16,509 |
| 11/22 | $13,139 | $18,136 | $14,353 |
| 11/23 | $12,890 | $20,490 | $15,588 |
| 05/24 | $13,698 | $23,963 | $17,002 |
Average Annual Total Returns
| 6 Months | 1 Year | 5 Years | 10 Years |
|---|
| Class C (without sales charge) | 6.26% | 7.94% | 4.53% | 3.20% |
| Class C (with sales charge) | 5.26% | 6.94% | 4.53% | 3.20% |
| MSCI World Index | 14.89% | 24.92% | 12.76% | 9.13% |
| Blended Benchmark: 60% MSCI World Index / 40% Bloomberg Global Aggregate Bond Index | 9.07% | 14.80% | 7.04% | 5.45% |
The Fund’s past performance is not a good predictor of the Fund’s future performance.
The graph and table do not reflect the deduction of taxes that a shareholder would pay on Fund distributions or redemption of Fund shares.
Visit https://www.abfunds.com/link/AB/CBACX-S for the most recent performance information.
2
| Net Assets | $175,391,926 |
| # of Portfolio Holdings | 454 |
| Portfolio Turnover Rate | 24% |
| Total Advisory Fees Paid | $533,337 |
Graphical Representation of Holdings
| Value | Value |
|---|
| Inflation-Linked Securities | 31.8% |
| Short-Term Investments | 20.3% |
| Governments - Treasuries | 17.4% |
| Funds and Investment Trusts | 15.1% |
| Financials | 1.9% |
| Health Care | 1.2% |
| Industrials | 1.2% |
| Consumer Staples | 1.0% |
| Materials | 0.9% |
| Utilities | 0.9% |
| Consumer Discretionary | 0.8% |
| Governments - Sovereign Bonds | 0.7% |
| Others | 1.9% |
| Securities Lending Collateral | 0.2% |
| Other assets less liabilities | 4.7% |
| Company | U.S. $ Value | % of Net Assets |
|---|
| U.S. Treasury Inflation Index, 0.38%, due 07/15/25 | $30,520,576 | 17.4% |
| Vanguard S&P 500 ETF | $22,011,440 | 12.5% |
| U.S. Treasury Inflation Index, 0.50%, due 01/15/28 | $18,417,026 | 10.5% |
| U.S. Treasury Inflation Index, 0.38%, due 01/15/27 | $6,900,487 | 3.9% |
| VanEck JPMorgan EM Local Currency Bond ETF | $2,376,985 | 1.4% |
| iShares MSCI Emerging Markets ex China ETF | $2,128,060 | 1.2% |
| Mexico Government International Bond, 4.13%, due 01/21/26 | $1,147,585 | 0.7% |
| State Street SecLending Cash Collateral | $366,822 | 0.2% |
| Novo Nordisk A/S - Class B | $347,933 | 0.2% |
| ASML Holding NV | $257,371 | 0.2% |
| Total | $84,474,285 | 48.2% |
| Value | Value |
|---|
| United States | 47.6% |
| Short-Term Investments | 37.7% |
| United Kingdom | 1.6% |
| France | 1.3% |
| Switzerland | 1.6% |
| Germany | 1.1% |
| Mexico | 0.7% |
| Denmark | 1.0% |
| Netherlands | 0.6% |
| Sweden | 0.3% |
| Italy | 0.5% |
| Spain | 0.2% |
| Finland | 0.3% |
| Norway | 0.1% |
| Others | 5.4% |
3
Availability of Additional Information
You can find additional information on the Fund’s website at https://www.abfunds.com/link/AB/CBACX-S, including the Fund's:
• Prospectus
• Financial information
• Fund holdings
• Proxy voting information
You can also request this information by contacting us at (800) 227 4618.
Shareholders who have consented to receive a single annual or semi-annual shareholder report at a shared address may revoke this consent by contacting us at (800) 227 4618.
Information Regarding the Review and Approval of the Fund’s Advisory Agreement
Information regarding the Fund’s Board of Directors’/Trustees’ review of the advisory agreement is available on the Fund’s website https://www.abfunds.com/link/AB/CBACX-S. You can request this information, free of charge, by contacting us at (800) 227 4618 or by scanning the QR code below.
The [A/B] logo is a registered service mark of AllianceBernstein and AllianceBernstein® is a registered service mark used by permission of the owner, AllianceBernstein L.P.
Please scan QR code for
Fund Information
1
Please scan QR code for
Fund Information
AB Global Risk Allocation Fund
Semi-Annual Shareholder Report
This semi-annual shareholder report contains important information about the AB Global Risk Allocation Fund (the “Fund”) for the period of December 1, 2023 to May 31, 2024. You can find additional information about the Fund at https://www.abfunds.com/link/AB/CABIX-S. You can also request this information by contacting us at (800) 227 4618.
What were the Fund costs for last six months?
(Based on a hypothetical $10,000 investment)
| Class Name | Cost of a $10,000 investment | Costs paid as a percentage of a $10,000 investment |
|---|
| Class I | $57 | 1.10% |
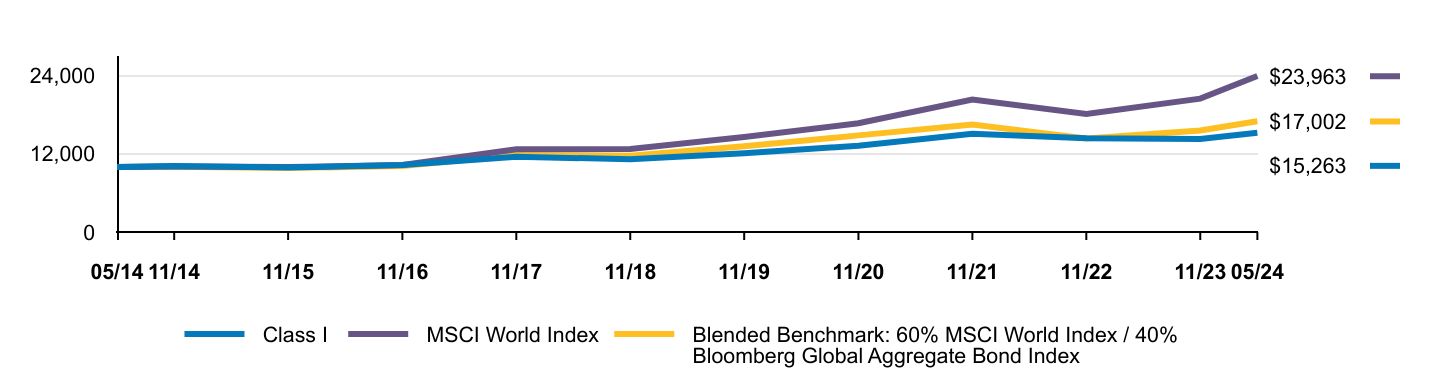
The following graph shows the performance of hypothetical $10,000 investments in the Fund and a broad-based securities market index over the most recently completed 10 fiscal years of the Fund. The Fund's performance reflects sales charges and assumes the reinvestment of dividends.
| Class I | MSCI World Index | Blended Benchmark: 60% MSCI World Index / 40% Bloomberg Global Aggregate Bond Index |
|---|
| 05/14 | $10,000 | $10,000 | $10,000 |
| 11/14 | $10,126 | $10,045 | $10,022 |
| 11/15 | $9,911 | $9,972 | $9,825 |
| 11/16 | $10,277 | $10,287 | $10,149 |
| 11/17 | $11,572 | $12,720 | $11,829 |
| 11/18 | $11,165 | $12,737 | $11,718 |
| 11/19 | $12,089 | $14,588 | $13,171 |
| 11/20 | $13,263 | $16,706 | $14,844 |
| 11/21 | $15,090 | $20,345 | $16,509 |
| 11/22 | $14,416 | $18,136 | $14,353 |
| 11/23 | $14,281 | $20,490 | $15,588 |
| 05/24 | $15,263 | $23,963 | $17,002 |
Average Annual Total Returns
| 6 Months | 1 Year | 5 Years | 10 Years |
|---|
| Class I (without sales charge) | 6.88% | 9.07% | 5.62% | 4.32% |
| Class I (with sales charge) | 6.88% | 9.07% | 5.62% | 4.32% |
| MSCI World Index | 14.89% | 24.92% | 12.76% | 9.13% |
| Blended Benchmark: 60% MSCI World Index / 40% Bloomberg Global Aggregate Bond Index | 9.07% | 14.80% | 7.04% | 5.45% |
The Fund’s past performance is not a good predictor of the Fund’s future performance.
The graph and table do not reflect the deduction of taxes that a shareholder would pay on Fund distributions or redemption of Fund shares.
Visit https://www.abfunds.com/link/AB/CABIX-S for the most recent performance information.
2
| Net Assets | $175,391,926 |
| # of Portfolio Holdings | 454 |
| Portfolio Turnover Rate | 24% |
| Total Advisory Fees Paid | $533,337 |
Graphical Representation of Holdings
| Value | Value |
|---|
| Inflation-Linked Securities | 31.8% |
| Short-Term Investments | 20.3% |
| Governments - Treasuries | 17.4% |
| Funds and Investment Trusts | 15.1% |
| Financials | 1.9% |
| Health Care | 1.2% |
| Industrials | 1.2% |
| Consumer Staples | 1.0% |
| Materials | 0.9% |
| Utilities | 0.9% |
| Consumer Discretionary | 0.8% |
| Governments - Sovereign Bonds | 0.7% |
| Others | 1.9% |
| Securities Lending Collateral | 0.2% |
| Other assets less liabilities | 4.7% |
| Company | U.S. $ Value | % of Net Assets |
|---|
| U.S. Treasury Inflation Index, 0.38%, due 07/15/25 | $30,520,576 | 17.4% |
| Vanguard S&P 500 ETF | $22,011,440 | 12.5% |
| U.S. Treasury Inflation Index, 0.50%, due 01/15/28 | $18,417,026 | 10.5% |
| U.S. Treasury Inflation Index, 0.38%, due 01/15/27 | $6,900,487 | 3.9% |
| VanEck JPMorgan EM Local Currency Bond ETF | $2,376,985 | 1.4% |
| iShares MSCI Emerging Markets ex China ETF | $2,128,060 | 1.2% |
| Mexico Government International Bond, 4.13%, due 01/21/26 | $1,147,585 | 0.7% |
| State Street SecLending Cash Collateral | $366,822 | 0.2% |
| Novo Nordisk A/S - Class B | $347,933 | 0.2% |
| ASML Holding NV | $257,371 | 0.2% |
| Total | $84,474,285 | 48.2% |
| Value | Value |
|---|
| United States | 47.6% |
| Short-Term Investments | 37.7% |
| United Kingdom | 1.6% |
| France | 1.3% |
| Switzerland | 1.6% |
| Germany | 1.1% |
| Mexico | 0.7% |
| Denmark | 1.0% |
| Netherlands | 0.6% |
| Sweden | 0.3% |
| Italy | 0.5% |
| Spain | 0.2% |
| Finland | 0.3% |
| Norway | 0.1% |
| Others | 5.4% |
3
Availability of Additional Information
You can find additional information on the Fund’s website at https://www.abfunds.com/link/AB/CABIX-S, including the Fund's:
• Prospectus
• Financial information
• Fund holdings
• Proxy voting information
You can also request this information by contacting us at (800) 227 4618.
Shareholders who have consented to receive a single annual or semi-annual shareholder report at a shared address may revoke this consent by contacting us at (800) 227 4618.
Information Regarding the Review and Approval of the Fund’s Advisory Agreement
Information regarding the Fund’s Board of Directors’/Trustees’ review of the advisory agreement is available on the Fund’s website https://www.abfunds.com/link/AB/CABIX-S. You can request this information, free of charge, by contacting us at (800) 227 4618 or by scanning the QR code below.
The [A/B] logo is a registered service mark of AllianceBernstein and AllianceBernstein® is a registered service mark used by permission of the owner, AllianceBernstein L.P.
Please scan QR code for
Fund Information
ITEM 2. CODE OF ETHICS.
Not applicable when filing a semi-annual report to shareholders.
ITEM 3. AUDIT COMMITTEE FINANCIAL EXPERT.
Not applicable when filing a semi-annual report to shareholders.
ITEM 4. PRINCIPAL ACCOUNTANT FEES AND SERVICES.
Not applicable when filing a semi-annual report to shareholders.
ITEM 5. AUDIT COMMITTEE OF LISTED REGISTRANTS.
Not applicable to the registrant.
ITEM 6. INVESTMENTS.
Please see Schedule of Investments contained in the Financial Statements included under Item 7 of this Form N-CSR.
ITEM 7. FINANCIAL STATEMENTS AND FINANCIAL HIGHLIGHTS FOR OPEN-END MANAGEMENT INVESTMENT COMPANIES.
MAY 05.31.24

SEMI-ANNUAL REPORT
AB GLOBAL RISK ALLOCATION FUND

| | |
| |
| Investment Products Offered | | • Are Not FDIC Insured • May Lose Value • Are Not Bank Guaranteed |
Investors should consider the investment objectives, risks, charges and expenses of the Fund carefully before investing. For copies of our prospectus or summary prospectus, which contain this and other information, visit us online at www.abfunds.com or contact your AB representative. Please read the prospectus and/or summary prospectus carefully before investing.
This shareholder report must be preceded or accompanied by the Fund’s prospectus for individuals who are not current shareholders of the Fund.
You may obtain a description of the Fund’s proxy voting policies and procedures, and information regarding how the Fund voted proxies relating to portfolio securities during the most recent 12-month period ended June 30, without charge. Simply visit AB’s website at www.abfunds.com, or go to the Securities and Exchange Commission’s (the “Commission”) website at www.sec.gov, or call AB at (800) 227 4618.
The Fund files its complete schedule of portfolio holdings with the Commission for the first and third quarters of each fiscal year as an exhibit to its reports on Form N-PORT. The Fund’s Form N-PORT reports are available on the Commission’s website at www.sec.gov. AB publishes full portfolio holdings for the Fund monthly at www.abfunds.com.
AllianceBernstein Investments, Inc. (ABI) is the distributor of the AB family of mutual funds. ABI is a member of FINRA and is an affiliate of AllianceBernstein L.P., the Adviser of the funds.
The [A/B] logo is a registered service mark of AllianceBernstein and AllianceBernstein® is a registered service mark used by permission of the owner, AllianceBernstein L.P.
CONSOLIDATED PORTFOLIO OF INVESTMENTS
May 31, 2024 (unaudited)
| | | | | | | | | | | | |
| | | | | | Principal
Amount
(000) | | | U.S. $ Value | |
| |
INFLATION-LINKED SECURITIES – 31.8% | | | | | | | | | | | | |
United States – 31.8% | | | | | | | | | | | | |
U.S. Treasury Inflation Index | | | | | | | | | | | | |
0.375%, 07/15/2025 (TIPS) | | | U.S.$ | | | | 31,313 | | | $ | 30,520,576 | |
0.375%, 01/15/2027 (TIPS) | | | | | | | 7,280 | | | | 6,900,487 | |
0.50%, 01/15/2028 (TIPS) | | | | | | | 19,642 | | | | 18,417,026 | |
| | | | | | | | | | | | |
| | | |
Total Inflation-Linked Securities
(cost $57,578,964) | | | | | | | | | | | 55,838,089 | |
| | | | | | | | | | | | |
| | | | | | | | | | | | |
GOVERNMENTS - TREASURIES – 17.4% | | | | | | | | | | | | |
Japan – 17.4% | | | | | | | | | | | | |
Japan Treasury Discount Bill | | | | | | | | | | | | |
Series 1232
Zero Coupon, 08/19/2024
(cost $30,732,438) | | | JPY | | | | 4,800,000 | | | | 30,519,289 | |
| | | | | | | | | | | | |
| | | |
| | | | | | Shares | | | | |
INVESTMENT COMPANIES – 15.1% | | | | | | | | | | | | |
Funds and Investment Trusts – 15.1%(a) | | | | | | | | | | | | |
Altaba, Inc.(b)(c)(d) | | | | | | | 1,120 | | | | – 0 | – |
iShares MSCI Emerging Markets ex China ETF(e) | | | | | | | 37,400 | | | | 2,128,060 | |
VanEck JPMorgan EM Local Currency Bond ETF – Class E(e) | | | | | | | 98,020 | | | | 2,376,985 | |
Vanguard S&P 500 ETF | | | | | | | 45,420 | | | | 22,011,440 | |
| | | | | | | | | | | | |
| | | |
Total Investment Companies
(cost $25,260,031) | | | | | | | | | | | 26,516,485 | |
| | | | | | | | | | | | |
| | | | | | | | | | | | |
COMMON STOCKS – 9.8% | | | | | | | | | | | | |
Financials – 1.9% | | | | | | | | | | | | |
Banks – 0.5% | | | | | | | | | | | | |
ABN AMRO Bank NV (CVA) | | | | | | | 1,125 | | | | 19,244 | |
Banco Bilbao Vizcaya Argentaria SA | | | | | | | 3,189 | | | | 34,605 | |
Banco de Sabadell SA | | | | | | | 16,277 | | | | 34,382 | |
Banco Santander SA | | | | | | | 3,967 | | | | 20,921 | |
Bank of Ireland Group PLC | | | | | | | 2,334 | | | | 26,825 | |
Bankinter SA | | | | | | | 3,395 | | | | 29,989 | |
Barclays PLC | | | | | | | 10,110 | | | | 28,554 | |
BNP Paribas SA | | | | | | | 331 | | | | 24,433 | |
CaixaBank SA | | | | | | | 8,772 | | | | 50,238 | |
Commerzbank AG | | | | | | | 2,045 | | | | 34,723 | |
Credit Agricole SA | | | | | | | 1,641 | | | | 26,700 | |
Danske Bank A/S | | | | | | | 858 | | | | 26,376 | |
DNB Bank ASA | | | | | | | 1,818 | | | | 35,541 | |
Erste Group Bank AG | | | | | | | 821 | | | | 40,344 | |
| | |
| |
| abfunds.com | | AB GLOBAL RISK ALLOCATION FUND | 1 |
CONSOLIDATED PORTFOLIO OF INVESTMENTS (continued)
| | | | | | | | |
| Company | |
Shares | | | U.S. $ Value | |
| |
HSBC Holdings PLC | | | 5,317 | | | $ | 47,390 | |
ING Groep NV | | | 1,574 | | | | 28,120 | |
Intesa Sanpaolo SpA | | | 18,206 | | | | 71,718 | |
KBC Group NV | | | 411 | | | | 30,015 | |
Lloyds Banking Group PLC | | | 36,308 | | | | 25,919 | |
NatWest Group PLC | | | 6,427 | | | | 25,999 | |
Nedbank Group Ltd. | | | 441 | | | | 5,364 | |
Nordea Bank Abp (Helsinki) | | | 88 | | | | 1,082 | |
Nordea Bank Abp (Stockholm) | | | 3,090 | | | | 37,999 | |
Raiffeisen Bank International AG | | | 1,044 | | | | 19,309 | |
Skandinaviska Enskilda Banken AB – Class A | | | 3,315 | | | | 47,228 | |
Societe Generale SA | | | 422 | | | | 12,640 | |
Standard Chartered PLC | | | 2,940 | | | | 29,284 | |
Svenska Handelsbanken AB – Class A | | | 2,923 | | | | 27,507 | |
Swedbank AB – Class A | | | 1,696 | | | | 35,313 | |
UniCredit SpA | | | 1,079 | | | | 42,958 | |
| | | | | | | | |
| | | | | | | 920,720 | |
| | | | | | | | |
Capital Markets – 0.4% | |
3i Group PLC | | | 4,463 | | | | 164,448 | |
abrdn PLC | | | 11,793 | | | | 23,466 | |
Deutsche Bank AG (REG) | | | 1,113 | | | | 18,521 | |
Deutsche Boerse AG | | | 355 | | | | 70,743 | |
Hargreaves Lansdown PLC | | | 1,868 | | | | 25,359 | |
Investec PLC | | | 4,737 | | | | 31,698 | |
Julius Baer Group Ltd. | | | 634 | | | | 38,085 | |
London Stock Exchange Group PLC | | | 1,249 | | | | 146,403 | |
Ninety One PLC | | | 3,019 | | | | 6,620 | |
Partners Group Holding AG | | | 68 | | | | 91,516 | |
Quilter PLC(f) | | | 2,789 | | | | 4,187 | |
Schroders PLC | | | 5,552 | | | | 28,007 | |
St. James’s Place PLC | | | 2,130 | | | | 13,724 | |
UBS Group AG (REG) | | | 1,888 | | | | 60,064 | |
| | | | | | | | |
| | | | | | | 722,841 | |
| | | | | | | | |
Consumer Finance – 0.0% | |
Vanquis Banking Group PLC | | | 1,368 | | | | 947 | |
| | | | | | | | |
|
Financial Services – 0.3% | |
Edenred SE | | | 463 | | | | 21,604 | |
Eurazeo SE | | | 635 | | | | 53,601 | |
EXOR NV(b)(c) | | | 480 | | | | 53,593 | |
Groupe Bruxelles Lambert NV | | | 600 | | | | 46,012 | |
Industrivarden AB – Class A | | | 44 | | | | 1,566 | |
Industrivarden AB – Class C | | | 1,828 | | | | 64,212 | |
Investor AB – Class B | | | 3,608 | | | | 97,904 | |
Jackson Financial, Inc. – Class A | | | 38 | | | | 927 | |
Kinnevik AB – Class B(d) | | | 1,368 | | | | 15,940 | |
L E Lundbergforetagen AB – Class B | | | 856 | | | | 43,551 | |
| | |
| |
2 | AB GLOBAL RISK ALLOCATION FUND | | abfunds.com |
CONSOLIDATED PORTFOLIO OF INVESTMENTS (continued)
| | | | | | | | |
| Company | |
Shares | | | U.S. $ Value | |
| |
M&G PLC | | | 1,555 | | | $ | 3,976 | |
Wendel SE | | | 294 | | | | 29,165 | |
Worldline SA/France(d) | | | 725 | | | | 9,691 | |
| | | | | | | | |
| | | | | | | 441,742 | |
| | | | | | | | |
Insurance – 0.7% | |
Admiral Group PLC | | | 1,243 | | | | 43,126 | |
Aegon Ltd. | | | 4,545 | | | | 29,480 | |
Ageas SA/NV | | | 832 | | | | 41,507 | |
Allianz SE (REG) | | | 222 | | | | 64,988 | |
Assicurazioni Generali SpA | | | 1,915 | | | | 49,289 | |
Aviva PLC | | | 3,940 | | | | 24,200 | |
Baloise Holding AG (REG) | | | 288 | | | | 49,759 | |
Direct Line Insurance Group PLC | | | 8,791 | | | | 24,144 | |
Gjensidige Forsikring ASA | | | 2,409 | | | | 42,275 | |
Hannover Rueck SE | | | 383 | | | | 95,217 | |
Legal & General Group PLC | | | 13,473 | | | | 43,210 | |
Linea Directa Aseguradora SA Cia de Seguros y Reaseguros(d) | | | 3,395 | | | | 4,266 | |
Mandatum Oyj | | | 886 | | | | 3,982 | |
Mapfre SA | | | 8,898 | | | | 21,426 | |
Muenchener Rueckversicherungs-Gesellschaft AG in Muenchen (REG) | | | 212 | | | | 105,724 | |
NN Group NV | | | 985 | | | | 45,959 | |
Old Mutual Ltd. | | | 9,763 | | | | 5,592 | |
Poste Italiane SpA | | | 5,111 | | | | 70,210 | |
Prudential PLC | | | 1,555 | | | | 14,895 | |
Sampo Oyj – Class A | | | 886 | | | | 37,925 | |
SCOR SE | | | 791 | | | | 22,862 | |
Swiss Life Holding AG (REG) | | | 132 | | | | 92,284 | |
Swiss Re AG | | | 469 | | | | 59,811 | |
Tryg A/S | | | 4,038 | | | | 83,134 | |
UnipolSai Assicurazioni SpA | | | 12,165 | | | | 33,509 | |
Zurich Insurance Group AG | | | 154 | | | | 81,051 | |
| | | | | | | | |
| | | | | | | 1,189,825 | |
| | | | | | | | |
| | | | | | | 3,276,075 | |
| | | | | | | | |
Health Care – 1.2% | |
Biotechnology – 0.1% | |
Genmab A/S(d) | | | 279 | | | | 78,750 | |
Grifols SA(d) | | | 2,271 | | | | 23,083 | |
Idorsia Ltd.(d) | | | 213 | | | | 607 | |
| | | | | | | | |
| | | | | | | 102,440 | |
| | | | | | | | |
Health Care Equipment & Supplies – 0.3% | |
Alcon, Inc. | | | 184 | | | | 16,528 | |
Arjo AB – Class B | | | 2,759 | | | | 12,174 | |
Coloplast A/S – Class B | | | 742 | | | | 89,246 | |
Demant A/S(d) | | | 2,432 | | | | 116,887 | |
| | |
| |
| abfunds.com | | AB GLOBAL RISK ALLOCATION FUND | 3 |
CONSOLIDATED PORTFOLIO OF INVESTMENTS (continued)
| | | | | | | | |
| Company | |
Shares | | | U.S. $ Value | |
| |
EssilorLuxottica SA | | | 493 | | | $ | 110,557 | |
Getinge AB – Class B | | | 2,759 | | | | 49,367 | |
Koninklijke Philips NV(d) | | | 526 | | | | 14,368 | |
Smith & Nephew PLC | | | 4,175 | | | | 52,828 | |
Sonova Holding AG (REG) | | | 435 | | | | 138,208 | |
| | | | | | | | |
| | | | | | | 600,163 | |
| | | | | | | | |
Health Care Providers & Services – 0.0% | |
Fresenius Medical Care AG | | | 755 | | | | 32,204 | |
Fresenius SE & Co. KGaA(d) | | | 693 | | | | 22,111 | |
| | | | | | | | |
| | | | | | | 54,315 | |
| | | | | | | | |
Life Sciences Tools & Services – 0.2% | |
Eurofins Scientific SE | | | 1,160 | | | | 70,021 | |
Lonza Group AG (REG) | | | 278 | | | | 150,912 | |
QIAGEN NV(d) | | | 1,475 | | | | 63,151 | |
| | | | | | | | |
| | | | | | | 284,084 | |
| | | | | | | | |
Pharmaceuticals – 0.6% | |
AstraZeneca PLC | | | 729 | | | | 113,322 | |
Bayer AG (REG) | | | 526 | | | | 16,183 | |
Euroapi SA(d) | | | 26 | | | | 102 | |
GSK PLC | | | 2,919 | | | | 65,497 | |
Hikma Pharmaceuticals PLC | | | 2,641 | | | | 65,295 | |
Merck KGaA | | | 536 | | | | 97,418 | |
Novartis AG (REG) | | | 923 | | | | 95,529 | |
Novo Nordisk A/S – Class B | | | 2,568 | | | | 347,933 | |
Orion Oyj – Class B | | | 948 | | | | 38,553 | |
Roche Holding AG (Genusschein) | | | 268 | | | | 68,425 | |
Sandoz Group AG | | | 184 | | | | 6,509 | |
Sanofi SA | | | 604 | | | | 59,133 | |
Takeda Pharmaceutical Co., Ltd. (Sponsored ADR)(e) | | | 1,184 | | | | 15,806 | |
UCB SA | | | 558 | | | | 78,271 | |
| | | | | | | | |
| | | | | | | 1,067,976 | |
| | | | | | | | |
| | | | | | | 2,108,978 | |
| | | | | | | | |
Industrials – 1.2% | |
Aerospace & Defense – 0.2% | |
Airbus SE | | | 181 | | | | 30,788 | |
Babcock International Group PLC | | | 1,434 | | | | 10,353 | |
BAE Systems PLC | | | 2,639 | | | | 46,990 | |
Dassault Aviation SA | | | 110 | | | | 23,874 | |
Leonardo SpA(d) | | | 684 | | | | 17,594 | |
Melrose Industries PLC | | | 2,943 | | | | 23,288 | |
Rolls-Royce Holdings PLC(d) | | | 5,507 | | | | 32,166 | |
Safran SA | | | 174 | | | | 40,752 | |
Thales SA | | | 192 | | | | 34,869 | |
| | | | | | | | |
| | | | | | | 260,674 | |
| | | | | | | | |
| | |
| |
4 | AB GLOBAL RISK ALLOCATION FUND | | abfunds.com |
CONSOLIDATED PORTFOLIO OF INVESTMENTS (continued)
| | | | | | | | |
| Company | |
Shares | | | U.S. $ Value | |
| |
Air Freight & Logistics – 0.1% | |
DHL Group | | | 500 | | | $ | 21,050 | |
DSV A/S | | | 295 | | | | 45,421 | |
International Distributions Services PLC(d) | | | 3,581 | | | | 15,449 | |
| | | | | | | | |
| | | | | | | 81,920 | |
| | | | | | | | |
Building Products – 0.1% | |
Assa Abloy AB – Class B | | | 848 | | | | 24,920 | |
Cie de Saint-Gobain SA | | | 254 | | | | 22,426 | |
Geberit AG (REG) | | | 50 | | | | 30,754 | |
| | | | | | | | |
| | | | | | | 78,100 | |
| | | | | | | | |
Commercial Services & Supplies – 0.0% | |
G4S PLC(b)(c)(d) | | | 3,969 | | | | 12,391 | |
ISS A/S | | | 413 | | | | 8,011 | |
Pluxee NV(d) | | | 224 | | | | 6,987 | |
Securitas AB – Class B | | | 2,207 | | | | 22,713 | |
Societe BIC SA(d) | | | 160 | | | | 11,972 | |
| | | | | | | | |
| | | | | | | 62,074 | |
| | | | | | | | |
Construction & Engineering – 0.1% | |
ACS Actividades de Construccion y Servicios SA | | | 601 | | | | 26,908 | |
Bouygues SA | | | 319 | | | | 12,501 | |
Eiffage SA | | | 192 | | | | 21,243 | |
Epiroc AB – Class A | | | 436 | | | | 9,152 | |
Epiroc AB – Class B | | | 520 | | | | 9,767 | |
Ferrovial SE | | | 1,093 | | | | 43,196 | |
HOCHTIEF AG | | | 79 | | | | 8,623 | |
Orascom Construction PLC | | | 173 | | | | 977 | |
Skanska AB – Class B | | | 763 | | | | 13,477 | |
Vinci SA | | | 175 | | | | 21,838 | |
| | | | | | | | |
| | | | | | | 167,682 | |
| | | | | | | | |
Electrical Equipment – 0.1% | |
ABB Ltd. (REG) | | | 788 | | | | 43,447 | |
Accelleron Industries AG | | | 39 | | | | 1,580 | |
Legrand SA | | | 296 | | | | 32,141 | |
Prysmian SpA | | | 537 | | | | 35,318 | |
Schneider Electric SE | | | 198 | | | | 49,397 | |
Siemens Energy AG(d) | | | 59 | | | | 1,607 | |
Vestas Wind Systems A/S(d) | | | 760 | | | | 21,324 | |
| | | | | | | | |
| | | | | | | 184,814 | |
| | | | | | | | |
Industrial Conglomerates – 0.0% | |
DCC PLC | | | 173 | | | | 12,634 | |
Siemens AG (REG) | | | 118 | | | | 22,744 | |
Smiths Group PLC | | | 1,381 | | | | 30,558 | |
| | | | | | | | |
| | | | | | | 65,936 | |
| | | | | | | | |
| | |
| |
| abfunds.com | | AB GLOBAL RISK ALLOCATION FUND | 5 |
CONSOLIDATED PORTFOLIO OF INVESTMENTS (continued)
| | | | | | | | |
| Company | |
Shares | | | U.S. $ Value | |
| |
Machinery – 0.2% | |
Alfa Laval AB | | | 849 | | | $ | 39,456 | |
Alstom SA | | | 671 | | | | 13,208 | |
ANDRITZ AG | | | 354 | | | | 21,261 | |
Atlas Copco AB – Class A | | | 1,744 | | | | 33,597 | |
Atlas Copco AB – Class B | | | 2,080 | | | | 34,533 | |
CNH Industrial NV | | | 1,193 | | | | 12,537 | |
Daimler Truck Holding AG | | | 174 | | | | 7,445 | |
Electrolux Professional AB – Class B | | | 748 | | | | 4,966 | |
GEA Group AG | | | 378 | | | | 15,824 | |
Husqvarna AB – Class B | | | 2,521 | | | | 20,992 | |
IMI PLC | | | 1,187 | | | | 28,371 | |
Iveco Group NV | | | 238 | | | | 2,854 | |
Kone Oyj – Class B | | | 326 | | | | 16,632 | |
Metso Oyj | | | 1,685 | | | | 20,606 | |
Sandvik AB | | | 907 | | | | 20,027 | |
Schindler Holding AG | | | 78 | | | | 20,291 | |
Schindler Holding AG (REG) | | | 81 | | | | 20,539 | |
SKF AB – Class B | | | 706 | | | | 15,511 | |
Valmet Oyj | | | 128 | | | | 3,445 | |
Volvo AB – Class B | | | 910 | | | | 24,493 | |
Wartsila OYJ Abp | | | 732 | | | | 15,348 | |
Weir Group PLC (The) | | | 503 | | | | 13,746 | |
| | | | | | | | |
| | | | | | | 405,682 | |
| | | | | | | | |
Marine Transportation – 0.0% | |
AP Moller – Maersk A/S – Class A | | | 10 | | | | 17,548 | |
AP Moller – Maersk A/S – Class B | | | 9 | | | | 16,363 | |
Kuehne + Nagel International AG (REG) | | | 139 | | | | 39,421 | |
| | | | | | | | |
| | | | | | | 73,332 | |
| | | | | | | | |
Passenger Airlines – 0.0% | |
Deutsche Lufthansa AG (REG) | | | 1,312 | | | | 9,189 | |
easyJet PLC | | | 1,301 | | | | 7,695 | |
International Consolidated Airlines Group SA – Class DI(d) | | | 4,711 | | | | 10,346 | |
| | | | | | | | |
| | | | | | | 27,230 | |
| | | | | | | | |
Professional Services – 0.2% | |
Adecco Group AG (REG) | | | 233 | | | | 8,842 | |
Bureau Veritas SA | | | 963 | | | | 29,003 | |
Capita PLC(d) | | | 1,612 | | | | 293 | |
Experian PLC | | | 1,125 | | | | 52,130 | |
Intertek Group PLC | | | 254 | | | | 15,589 | |
Randstad NV | | | 258 | | | | 13,636 | |
RELX PLC (Amsterdam) | | | 1,139 | | | | 49,968 | |
RELX PLC (London) | | | 1,122 | | | | 49,219 | |
SGS SA (REG) | | | 250 | | | | 23,281 | |
Wolters Kluwer NV | | | 490 | | | | 78,150 | |
| | | | | | | | |
| | | | | | | 320,111 | |
| | | | | | | | |
| | |
| |
6 | AB GLOBAL RISK ALLOCATION FUND | | abfunds.com |
CONSOLIDATED PORTFOLIO OF INVESTMENTS (continued)
| | | | | | | | |
| Company | |
Shares | | | U.S. $ Value | |
| |
Trading Companies & Distributors – 0.1% | |
AerCap Holdings NV | | | 317 | | | $ | 29,389 | |
Ashtead Group PLC | | | 560 | | | | 41,016 | |
Brenntag SE | | | 322 | | | | 23,196 | |
Bunzl PLC | | | 677 | | | | 25,452 | |
Ferguson PLC | | | 296 | | | | 60,583 | |
Rexel SA | | | 970 | | | | 29,478 | |
Travis Perkins PLC | | | 697 | | | | 7,690 | |
| | | | | | | | |
| | | | | | | 216,804 | |
| | | | | | | | |
Transportation Infrastructure – 0.1% | |
Aena SME SA | | | 131 | | | | 25,619 | |
Aeroports de Paris SA | | | 132 | | | | 18,915 | |
Fraport AG Frankfurt Airport Services Worldwide(d) | | | 264 | | | | 15,315 | |
Getlink SE | | | 1,705 | | | | 30,046 | |
Svitzer A/S(d) | | | 38 | | | | 1,490 | |
| | | | | | | | |
| | | | | | | 91,385 | |
| | | | | | | | |
| | | | | | | 2,035,744 | |
| | | | | | | | |
Consumer Staples – 1.0% | | | | | | | | |
Beverages – 0.2% | | | | | | | | |
Anheuser-Busch InBev SA/NV | | | 336 | | | | 21,199 | |
Carlsberg AS – Class B | | | 434 | | | | 58,881 | |
Coca-Cola Europacific Partners PLC | | | 1,012 | | | | 73,791 | |
Coca-Cola HBC AG – Class DI | | | 1,304 | | | | 44,251 | |
Diageo PLC | | | 1,525 | | | | 51,343 | |
Heineken Holding NV | | | 450 | | | | 36,933 | |
Heineken NV | | | 502 | | | | 50,370 | |
Pernod Ricard SA | | | 347 | | | | 51,964 | |
Remy Cointreau SA | | | 337 | | | | 31,554 | |
| | | | | | | | |
| | | | | | | 420,286 | |
| | | | | | | | |
Consumer Staples Distribution & Retail – 0.2% | | | | | | | | |
Carrefour SA | | | 1,249 | | | | 20,368 | |
Casino Guichard Perrachon SA(d) | | | 448 | | | | 19 | |
Colruyt Group NV | | | 915 | | | | 46,798 | |
Distribuidora Internacional de Alimentacion SA(d) | | | 54,700 | | | | 789 | |
J Sainsbury PLC | | | 10,711 | | | | 37,975 | |
Jeronimo Martins SGPS SA | | | 2,095 | | | | 47,001 | |
Koninklijke Ahold Delhaize NV | | | 1,925 | | | | 59,700 | |
Marks & Spencer Group PLC | | | 4,897 | | | | 18,945 | |
METRO AG | | | 963 | | | | 5,140 | |
Tesco PLC | | | 11,257 | | | | 44,779 | |
| | | | | | | | |
| | | | | | | 281,514 | |
| | | | | | | | |
Food Products – 0.3% | |
Aryzta AG(d) | | | 6,292 | | | | 12,609 | |
Associated British Foods PLC | | | 933 | | | | 30,483 | |
| | |
| |
| abfunds.com | | AB GLOBAL RISK ALLOCATION FUND | 7 |
CONSOLIDATED PORTFOLIO OF INVESTMENTS (continued)
| | | | | | | | |
| Company | |
Shares | | | U.S. $ Value | |
| |
Barry Callebaut AG (REG) | | | 33 | | | $ | 57,360 | |
Chocoladefabriken Lindt & Spruengli AG | | | 9 | | | | 104,747 | |
Chocoladefabriken Lindt & Spruengli AG (REG) | | | 1 | | | | 118,749 | |
Danone SA | | | 580 | | | | 37,404 | |
Kerry Group PLC – Class A | | | 503 | | | | 42,615 | |
Mowi ASA | | | 1,945 | | | | 34,976 | |
Nestle SA (REG) | | | 608 | | | | 64,537 | |
Orkla ASA | | | 3,826 | | | | 30,633 | |
Tate & Lyle PLC | | | 4,015 | | | | 35,717 | |
| | | | | | | | |
| | | | | | | 569,830 | |
| | | | | | | | |
Household Products – 0.1% | |
Essity AB – Class B | | | 1,288 | | | | 33,092 | |
Henkel AG & Co. KGaA | | | 338 | | | | 27,084 | |
Henkel AG & Co. KGaA (Preference Shares) | | | 356 | | | | 32,229 | |
Reckitt Benckiser Group PLC | | | 499 | | | | 28,559 | |
| | | | | | | | |
| | | | | | | 120,964 | |
| | | | | | | | |
Personal Care Products – 0.2% | |
Beiersdorf AG | | | 471 | | | | 73,842 | |
Haleon PLC | | | 3,649 | | | | 15,163 | |
L’Oreal SA | | | 228 | | | | 112,541 | |
Unilever PLC (Amsterdam) | | | 860 | | | | 47,053 | |
Unilever PLC (London) | | | 811 | | | | 44,413 | |
| | | | | | | | |
| | | | | | | 293,012 | |
| | | | | | | | |
Tobacco – 0.0% | |
British American Tobacco PLC | | | 579 | | | | 17,905 | |
Imperial Brands PLC | | | 987 | | | | 24,526 | |
| | | | | | | | |
| | | | | | | 42,431 | |
| | | | | | | | |
| | | | | | | 1,728,037 | |
| | | | | | | | |
Materials – 0.9% | |
Chemicals – 0.5% | |
Air Liquide SA | | | 491 | | | | 96,665 | |
Akzo Nobel NV | | | 408 | | | | 28,618 | |
Arkema SA | | | 294 | | | | 30,128 | |
BASF SE | | | 444 | | | | 23,499 | |
Covestro AG(d) | | | 458 | | | | 24,677 | |
Croda International PLC | | | 632 | | | | 36,920 | |
DSM BV(b)(c)(d) | | | 642 | | | | 63,718 | |
EMS-Chemie Holding AG (REG) | | | 47 | | | | 38,949 | |
Evonik Industries AG | | | 1,232 | | | | 27,139 | |
FUCHS SE (Preference Shares) | | | 915 | | | | 44,433 | |
Givaudan SA (REG) | | | 25 | | | | 117,857 | |
Johnson Matthey PLC | | | 1,127 | | | | 25,246 | |
K+S AG (REG) | | | 1,009 | | | | 14,859 | |
LANXESS AG | | | 442 | | | | 11,975 | |
Novonesis (Novozymes) B | | | 1,277 | | | | 76,162 | |
| | |
| |
8 | AB GLOBAL RISK ALLOCATION FUND | | abfunds.com |
CONSOLIDATED PORTFOLIO OF INVESTMENTS (continued)
| | | | | | | | |
| Company | |
Shares | | | U.S. $ Value | |
| |
Sika AG (REG) | | | 360 | | | $ | 109,745 | |
Solvay SA | | | 330 | | | | 12,110 | |
Syensqo SA | | | 330 | | | | 33,028 | |
Symrise AG | | | 710 | | | | 84,810 | |
Umicore SA | | | 1,130 | | | | 22,381 | |
Yara International ASA | | | 866 | | | | 26,929 | |
| | | | | | | | |
| | | | | | | 949,848 | |
| | | | | | | | |
Construction Materials – 0.1% | |
CRH PLC (London) | | | 1,075 | | | | 84,835 | |
Heidelberg Materials AG | | | 356 | | | | 37,335 | |
Holcim AG | | | 595 | | | | 52,271 | |
Imerys SA | | | 563 | | | | 22,064 | |
| | | | | | | | |
| | | | | | | 196,505 | |
| | | | | | | | |
Metals & Mining – 0.2% | |
Alleima AB | | | 181 | | | | 1,237 | |
Anglo American PLC | | | 1,415 | | | | 45,811 | |
Antofagasta PLC | | | 2,036 | | | | 57,752 | |
ArcelorMittal SA | | | 987 | | | | 26,040 | |
BHP Group Ltd. | | | 1,449 | | | | 43,248 | |
Boliden AB | | | 977 | | | | 34,247 | |
Fresnillo PLC | | | 1,276 | | | | 10,200 | |
Glencore PLC | | | 5,705 | | | | 35,164 | |
Norsk Hydro ASA | | | 4,362 | | | | 29,538 | |
Rio Tinto PLC | | | 669 | | | | 47,096 | |
thyssenkrupp AG | | | 1,007 | | | | 4,991 | |
voestalpine AG | | | 636 | | | | 18,615 | |
| | | | | | | | |
| | | | | | | 353,939 | |
| | | | | | | | |
Paper & Forest Products – 0.1% | |
Mondi PLC | | | 1,717 | | | | 34,153 | |
Stora Enso Oyj – Class R | | | 2,477 | | | | 36,287 | |
Svenska Cellulosa AB SCA – Class B | | | 1,288 | | | | 19,764 | |
UPM-Kymmene Oyj | | | 1,348 | | | | 51,530 | |
| | | | | | | | |
| | | | | | | 141,734 | |
| | | | | | | | |
| | | | | | | 1,642,026 | |
| | | | | | | | |
Utilities – 0.9% | |
Electric Utilities – 0.4% | |
EDP – Energias de Portugal SA | | | 19,584 | | | | 79,688 | |
Endesa SA | | | 3,408 | | | | 67,877 | |
Enel SpA | | | 10,639 | | | | 77,247 | |
Fortum Oyj | | | 4,004 | | | | 61,177 | |
Iberdrola SA | | | 9,470 | | | | 124,992 | |
Orsted AS(d) | | | 1,497 | | | | 91,821 | |
Redeia Corp. SA | | | 3,748 | | | | 67,545 | |
SSE PLC | | | 3,489 | | | | 78,489 | |
Terna – Rete Elettrica Nazionale | | | 13,636 | | | | 114,767 | |
| | | | | | | | |
| | | | | | | 763,603 | |
| | | | | | | | |
| | |
| |
| abfunds.com | | AB GLOBAL RISK ALLOCATION FUND | 9 |
CONSOLIDATED PORTFOLIO OF INVESTMENTS (continued)
| | | | | | | | |
| Company | |
Shares | | | U.S. $ Value | |
| |
Gas Utilities – 0.1% | |
Enagas SA | | | 3,496 | | | $ | 53,764 | |
Naturgy Energy Group SA | | | 2,625 | | | | 70,400 | |
Snam SpA | | | 22,765 | | | | 108,014 | |
| | | | | | | | |
| | | | | | | 232,178 | |
| | | | | | | | |
Independent Power and Renewable Electricity Producers – 0.1% | | | | | | | | |
Orron Energy AB(d) | | | 2,787 | | | | 2,441 | |
RWE AG | | | 2,734 | | | | 103,903 | |
| | | | | | | | |
| | | | | | | 106,344 | |
| | | | | | | | |
Multi-Utilities – 0.2% | | | | | | | | |
Centrica PLC | | | 23,244 | | | | 42,190 | |
E.ON SE | | | 6,694 | | | | 89,647 | |
Engie SA | | | 3,398 | | | | 57,568 | |
National Grid PLC | | | 4,604 | | | | 52,163 | |
Veolia Environnement SA | | | 3,120 | | | | 104,448 | |
| | | | | | | | |
| | | | | | | 346,016 | |
| | | | | | | | |
Water Utilities – 0.1% | | | | | | | | |
Severn Trent PLC | | | 2,353 | | | | 71,900 | |
United Utilities Group PLC | | | 6,181 | | | | 80,513 | |
| | | | | | | | |
| | | | | | | 152,413 | |
| | | | | | | | |
| | | | | | | 1,600,554 | |
| | | | | | | | |
Consumer Discretionary – 0.8% | | | | | | | | |
Automobile Components – 0.0% | | | | | | | | |
Cie Generale des Etablissements Michelin SCA | | | 796 | | | | 32,282 | |
Continental AG | | | 107 | | | | 7,293 | |
Dowlais Group PLC | | | 2,943 | | | | 2,615 | |
Forvia SE (Milan)(d) | | | 27 | | | | 443 | |
Forvia SE (Paris)(d) | | | 35 | | | | 575 | |
Nokian Renkaat Oyj | | | 578 | | | | 5,312 | |
Schaeffler AG (Preference Shares) | | | 1,288 | | | | 8,330 | |
Valeo SE | | | 282 | | | | 3,488 | |
Vitesco Technologies Group AG – Class A | | | 21 | | | | 1,467 | |
| | | | | | | | |
| | | | | | | 61,805 | |
| | | | | | | | |
Automobiles – 0.2% | | | | | | | | |
Bayerische Motoren Werke AG | | | 252 | | | | 25,705 | |
Bayerische Motoren Werke AG (Preference Shares) | | | 288 | | | | 27,843 | |
Ferrari NV | | | 303 | | | | 124,861 | |
Mercedes-Benz Group AG | | | 349 | | | | 25,330 | |
Porsche Automobil Holding SE (Preference Shares) | | | 377 | | | | 20,802 | |
Renault SA | | | 203 | | | | 11,924 | |
Stellantis NV (France) | | | 1,735 | | | | 38,473 | |
Stellantis NV (Milan) | | | 1,290 | | | | 28,581 | |
| | |
| |
10 | AB GLOBAL RISK ALLOCATION FUND | | abfunds.com |
CONSOLIDATED PORTFOLIO OF INVESTMENTS (continued)
| | | | | | | | |
| Company | |
Shares | | | U.S. $ Value | |
| |
Volkswagen AG | | | 151 | | | $ | 21,651 | |
Volkswagen AG (Preference Shares) | | | 138 | | | | 17,341 | |
| | | | | | | | |
| | | | | | | 342,511 | |
| | | | | | | | |
Broadline Retail – 0.1% | | | | | | | | |
Cie Financiere Richemont SA (REG) | | | 285 | | | | 45,861 | |
Next PLC | | | 400 | | | | 47,908 | |
| | | | | | | | |
| | | | | | | 93,769 | |
| | | | | | | | |
Diversified Consumer Services – 0.0% | | | | | | | | |
Pearson PLC | | | 1,740 | | | | 21,155 | |
| | | | | | | | |
| | |
Hotels, Restaurants & Leisure – 0.1% | | | | | | | | |
Accor SA(d) | | | 515 | | | | 22,468 | |
Amadeus IT Group SA | | | 787 | | | | 56,178 | |
Carnival PLC(d) | | | 409 | | | | 5,617 | |
Compass Group PLC | | | 1,758 | | | | 49,358 | |
Flutter Entertainment PLC(d) | | | 226 | | | | 43,490 | |
InterContinental Hotels Group PLC | | | 470 | | | | 47,728 | |
Sodexo SA | | | 224 | | | | 20,863 | |
TUI AG(d) | | | 1,650 | | | | 11,421 | |
Whitbread PLC | | | 756 | | | | 28,669 | |
| | | | | | | | |
| | | | | | | 285,792 | |
| | | | | | | | |
Household Durables – 0.1% | | | | | | | | |
Barratt Developments PLC | | | 2,559 | | | | 16,594 | |
Berkeley Group Holdings PLC | | | 507 | | | | 34,213 | |
Electrolux AB – Class B(d) | | | 748 | | | | 7,168 | |
Persimmon PLC | | | 763 | | | | 14,254 | |
SEB SA | | | 178 | | | | 22,064 | |
Taylor Wimpey PLC | | | 9,372 | | | | 17,743 | |
| | | | | | | | |
| | | | | | | 112,036 | |
| | | | | | | | |
Leisure Products – 0.0% | | | | | | | | |
Viaplay Group AB – Class B(d) | | | 65 | | | | 6 | |
| | | | | | | | |
| | |
Specialty Retail – 0.1% | | | | | | | | |
Avolta AG | | | 127 | | | | 5,157 | |
CECONOMY AG(d) | | | 963 | | | | 3,270 | |
Currys PLC(d) | | | 4,868 | | | | 4,804 | |
H & M Hennes & Mauritz AB – Class B | | | 936 | | | | 16,551 | |
Industria de Diseno Textil SA | | | 757 | | | | 35,996 | |
Kingfisher PLC | | | 6,282 | | | | 21,267 | |
Wickes Group PLC | | | 782 | | | | 1,392 | |
Zalando SE(d) | | | 758 | | | | 20,132 | |
| | | | | | | | |
| | | | | | | 108,569 | |
| | | | | | | | |
Textiles, Apparel & Luxury Goods – 0.2% | | | | | | | | |
adidas AG | | | 138 | | | | 34,951 | |
Burberry Group PLC | | | 981 | | | | 13,012 | |
Christian Dior SE | | | 102 | | | | 78,055 | |
Hermes International SCA | | | 67 | | | | 159,032 | |
HUGO BOSS AG | | | 261 | | | | 13,816 | |
Kering SA | | | 75 | | | | 25,929 | |
| | |
| |
| abfunds.com | | AB GLOBAL RISK ALLOCATION FUND | 11 |
CONSOLIDATED PORTFOLIO OF INVESTMENTS (continued)
| | | | | | | | |
| Company | |
Shares | | | U.S. $ Value | |
| |
LVMH Moet Hennessy Louis Vuitton SE | | | 90 | | | $ | 71,977 | |
Pandora A/S | | | 240 | | | | 39,422 | |
Puma SE | | | 60 | | | | 3,116 | |
Swatch Group AG (The) (BR) | | | 56 | | | | 11,996 | |
Swatch Group AG (The) (REG) | | | 301 | | | | 12,532 | |
| | | | | | | | |
| | | | | | | 463,838 | |
| | | | | | | | |
| | | | | | | 1,489,481 | |
| | | | | | | | |
Energy – 0.6% | | | | | | | | |
Energy Equipment & Services – 0.0% | | | | | | | | |
Petrofac Ltd.(b)(c)(d) | | | 6,919 | | | | 926 | |
Saipem SpA(d) | | | 1,728 | | | | 4,316 | |
Tenaris SA | | | 3,797 | | | | 62,735 | |
| | | | | | | | |
| | | | | | | 67,977 | |
| | | | | | | | |
Oil, Gas & Consumable Fuels – 0.6% | | | | | | | | |
Aker BP ASA | | | 2,650 | | | | 68,416 | |
BP PLC | | | 13,599 | | | | 85,068 | |
Eni SpA | | | 4,936 | | | | 77,961 | |
Equinor ASA | | | 4,590 | | | | 133,237 | |
Galp Energia SGPS SA | | | 4,711 | | | | 99,068 | |
Koninklijke Vopak NV | | | 1,705 | | | | 70,089 | |
Neste Oyj | | | 4,680 | | | | 98,253 | |
OMV AG | | | 1,553 | | | | 78,486 | |
Shell PLC | | | 6,226 | | | | 224,726 | |
Thungela Resources Ltd. | | | 141 | | | | 1,013 | |
TotalEnergies SE | | | 1,632 | | | | 119,568 | |
Woodside Energy Group Ltd. | | | 261 | | | | 4,809 | |
| | | | | | | | |
| | | | | | | 1,060,694 | |
| | | | | | | | |
| | | | | | | 1,128,671 | |
| | | | | | | | |
Information Technology – 0.6% | | | | | | | | |
Communications Equipment – 0.0% | | | | | | | | |
Nokia Oyj | | | 5,115 | | | | 20,007 | |
Telefonaktiebolaget LM Ericsson – Class B | | | 4,594 | | | | 28,306 | |
| | | | | | | | |
| | | | | | | 48,313 | |
| | | | | | | | |
Electronic Equipment, Instruments & Components – 0.0% | | | | | | | | |
Hexagon AB – Class B | | | 5,852 | | | | 64,459 | |
| | | | | | | | |
| | |
IT Services – 0.1% | | | | | | | | |
Atos SE(d) | | | 247 | | | | 452 | |
Capgemini SE | | | 360 | | | | 72,937 | |
| | | | | | | | |
| | | | | | | 73,389 | |
| | | | | | | | |
Semiconductors & Semiconductor Equipment – 0.3% | | | | | | | | |
ASML Holding NV | | | 269 | | | | 257,371 | |
Infineon Technologies AG | | | 1,599 | | | | 64,693 | |
NXP Semiconductors NV | | | 516 | | | | 140,404 | |
| | |
| |
12 | AB GLOBAL RISK ALLOCATION FUND | | abfunds.com |
CONSOLIDATED PORTFOLIO OF INVESTMENTS (continued)
| | | | | | | | |
| Company | |
Shares | | | U.S. $ Value | |
| |
STMicroelectronics NV | | | 1,365 | | | $ | 57,642 | |
| | | | | | | | |
| | | | | | | 520,110 | |
| | | | | | | | |
Software – 0.2% | | | | | | | | |
Dassault Systemes SE | | | 3,230 | | | | 131,273 | |
Sage Group PLC (The) | | | 5,404 | | | | 70,985 | |
SAP SE | | | 466 | | | | 84,979 | |
| | | | | | | | |
| | | | | | | 287,237 | |
| | | | | | | | |
| | | | | | | 993,508 | |
| | | | | | | | |
Communication Services – 0.5% | | | | | | | | |
Diversified Telecommunication Services – 0.2% | | | | | | | | |
Altice USA, Inc. – Class A(d) | | | 713 | | | | 1,768 | |
BT Group PLC | | | 7,665 | | | | 12,833 | |
Deutsche Telekom AG (REG) | | | 2,256 | | | | 54,853 | |
Elisa Oyj | | | 1,116 | | | | 52,001 | |
Eutelsat Communications SACA(d) | | | 1,132 | | | | 5,729 | |
Koninklijke KPN NV | | | 12,242 | | | | 45,899 | |
Orange SA | | | 2,176 | | | | 25,408 | |
Proximus SADP | | | 1,770 | | | | 13,954 | |
Swisscom AG (REG) | | | 114 | | | | 63,243 | |
Telecom Italia SpA/Milano(d) | | | 31,583 | | | | 8,326 | |
Telecom Italia SpA/Milano (Savings Shares)(d) | | | 39,625 | | | | 11,342 | |
Telefonica SA | | | 3,993 | | | | 18,661 | |
Telenet Group Holding NV(b)(c)(d) | | | 522 | | | | 11,894 | |
Telenor ASA | | | 2,325 | | | | 27,112 | |
Telia Co. AB | | | 12,753 | | | | 33,183 | |
United Internet AG (REG) | | | 623 | | | | 14,767 | |
| | | | | | | | |
| | | | | | | 400,973 | |
| | | | | | | | |
Entertainment – 0.0% | |
Bollore SE | | | 3,319 | | | | 22,354 | |
Modern Times Group MTG AB – Class B(d) | | | 90 | | | | 804 | |
Universal Music Group NV | | | 1,098 | | | | 34,218 | |
| | | | | | | | |
| | | | | | | 57,376 | |
| | | | | | | | |
Interactive Media & Services – 0.1% | |
Adevinta ASA(d) | | | 2,027 | | | | 22,054 | |
Auto Trader Group PLC | | | 4,579 | | | | 48,169 | |
| | | | | | | | |
| | | | | | | 70,223 | |
| | | | | | | | |
Media – 0.1% | |
ITV PLC | | | 7,799 | | | | 7,944 | |
JCDecaux SE(d) | | | 889 | | | | 21,078 | |
Lagardere SA | | | 819 | | | | 19,461 | |
ProSiebenSat.1 Media SE | | | 638 | | | | 5,303 | |
Publicis Groupe SA | | | 351 | | | | 39,426 | |
RTL Group SA | | | 319 | | | | 10,687 | |
Schibsted ASA – Class A | | | 973 | | | | 28,181 | |
Schibsted ASA – Class B | | | 1,054 | | | | 28,478 | |
| | |
| |
| abfunds.com | | AB GLOBAL RISK ALLOCATION FUND | 13 |
CONSOLIDATED PORTFOLIO OF INVESTMENTS (continued)
| | | | | | | | | | | | |
| Company | | | | |
Shares | | | U.S. $ Value | |
| |
SES SA (GDR) | | | | | | | 1,380 | | | $ | 7,892 | |
Vivendi SE | | | | | | | 1,098 | | | | 12,091 | |
WPP PLC | | | | | | | 1,472 | | | | 15,407 | |
| | | | | | | | | | | | |
| | | | | | | | | | | 195,948 | |
| | | | | | | | | | | | |
Wireless Telecommunication Services – 0.1% | | | | | | | | | | | | |
Millicom International Cellular SA (SDR)(d) | | | | | | | 591 | | | | 14,845 | |
Tele2 AB – Class B | | | | | | | 4,849 | | | | 47,423 | |
Vodafone Group PLC | | | | | | | 17,886 | | | | 17,292 | |
| | | | | | | | | | | | |
| | | | | | | | | | | 79,560 | |
| | | | | | | | | | | | |
| | | | | | | | | | | 804,080 | |
| | | | | | | | | | | | |
Real Estate – 0.2% | |
Diversified REITs – 0.1% | |
British Land Co. PLC (The) | | | | | | | 5,156 | | | | 28,999 | |
Covivio SA/France | | | | | | | 424 | | | | 22,068 | |
ICADE | | | | | | | 547 | | | | 16,869 | |
Land Securities Group PLC | | | | | | | 3,092 | | | | 25,956 | |
| | | | | | | | | | | | |
| | | | | | | | | | | 93,892 | |
| | | | | | | | | | | | |
Industrial REITs – 0.0% | |
Segro PLC | | | | | | | 5,086 | | | | 59,727 | |
| | | | | | | | | | | | |
| | | |
Office REITs – 0.0% | | | | | | | | | | | | |
Gecina SA | | | | | | | 296 | | | | 31,949 | |
| | | | | | | | | | | | |
| | | |
Real Estate Management & Development – 0.1% | | | | | | | | | | | | |
Deutsche Wohnen SE | | | | | | | 1,099 | | | | 21,470 | |
Swiss Prime Site AG (REG) | | | | | | | 732 | | | | 67,798 | |
Unibail-Rodamco-Westfield | | | | | | | 156 | | | | 13,745 | |
Vonovia SE | | | | | | | 1,666 | | | | 52,372 | |
| | | | | | | | | | | | |
| | | | | | | | | | | 155,385 | |
| | | | | | | | | | | | |
Retail REITs – 0.0% | | | | | | | | | | | | |
Hammerson PLC | | | | | | | 28,225 | | | | 10,042 | |
Klepierre SA | | | | | | | 1,062 | | | | 30,825 | |
| | | | | | | | | | | | |
| | | | | | | | | | | 40,867 | |
| | | | | | | | | | | | |
| | | | | | | | | | | 381,820 | |
| | | | | | | | | | | | |
Total Common Stocks
(cost $12,753,504) | | | | | | | | | | | 17,188,974 | |
| | | | | | | | | | | | |
| | | |
| | | | | | Principal
Amount
(000) | | | | |
GOVERNMENTS – SOVEREIGN BONDS – 0.7% | | | | | | | | | | | | |
Mexico – 0.7% | | | | | | | | | | | | |
Mexico Government International Bond
| | | | | | | | | | | | |
4.125%, 01/21/2026
(cost $1,173,268) | | U.S.$ | | | | | 1,174 | | | | 1,147,585 | |
| | | | | | | | | | | | |
| | |
| |
14 | AB GLOBAL RISK ALLOCATION FUND | | abfunds.com |
CONSOLIDATED PORTFOLIO OF INVESTMENTS (continued)
| | | | | | | | | | | | |
| Company | | | | |
Shares | | | U.S. $ Value | |
| |
RIGHTS – 0.0% | | | | | | | | | | | | |
Industrials – 0.0% | | | | | | | | | | | | |
Machinery – 0.0% | | | | | | | | | | | | |
Alstom SA, expiring 06/06/2024(d)
(cost $0) | | | | | | | 671 | | | $ | 720 | |
| | | | | | | | | | | | |
| | | | | | | | | | | | |
WARRANTS – 0.0% | | | | | | | | | | | | |
Software – 0.0% | | | | | | | | | | | | |
Constellation Software, Inc., expiring 03/31/2040(b)(c)(d)
(cost $0) | | | | | | | 53 | | | | – 0 | – |
| | | | | | | | | | | | |
| | | |
| | | | | | Principal
Amount
(000) | | | | |
SHORT-TERM INVESTMENTS – 20.3% | | | | | | | | | | | | |
U.S. Treasury Bills – 12.7% | | | | | | | | | | | | |
United States – 12.7% | | | | | | | | | | | | |
U.S. Treasury Bill
| | | | | | | | | | | | |
Zero Coupon, 06/13/2024
(cost $22,267,526) | | U.S.$ | | | | | 22,300 | | | | 22,267,448 | |
| | | | | | | | | | | | |
Investment Companies – 7.6% | | | | | | | | | | | | |
AB Fixed Income Shares, Inc. – Government Money Market Portfolio – Class AB, 5.22%(a)(g)(h)
(cost $13,309,575) | | | | | | | 13,309,575 | | | | 13,309,575 | |
| | | | | | | | | | | | |
Total Investments Before Security Lending Collateral for Securities Loaned – 95.1%
(cost $163,075,306) | | | | | | | | | | | 166,788,165 | |
| | | | | | | | | | | | |
INVESTMENTS OF CASH COLLATERAL FOR SECURITIES LOANED – 0.2% | | | | | | | | | | | | |
Investment Companies – 0.2% | | | | | | | | | | | | |
AB Fixed Income Shares, Inc. – Government Money Market Portfolio – Class AB, 5.22%(a)(g)(h)
(cost $366,822) | | | | | | | 366,822 | | | | 366,822 | |
| | | | | | | | | | | | |
| | | |
Total Investments – 95.3%
(cost $163,442,128) | | | | | | | | | | | 167,154,987 | |
Other assets less liabilities – 4.7% | | | | | | | | | | | 8,236,939 | |
| | | | | | | | | | | | |
| | | |
Net Assets – 100.0% | | | | | | | | | | $ | 175,391,926 | |
| | | | | | | | | | | | |
| | |
| |
| abfunds.com | | AB GLOBAL RISK ALLOCATION FUND | 15 |
CONSOLIDATED PORTFOLIO OF INVESTMENTS (continued)
FUTURES (see Note D)
| | | | | | | | | | | | | | | | |
| Description | | Number of
Contracts | | | Expiration
Month | | | Current
Notional | | | Value and
Unrealized
Appreciation
(Depreciation) | |
Purchased Contracts | |
Brent Crude Futures | | | 18 | | | | July 2024 | | | $ | 1,455,660 | | | $ | (74,914 | ) |
Canadian 5 Yr Bond Futures | | | 93 | | | | September 2024 | | | | 7,518,060 | | | | (6,525 | ) |
Canadian 10 Yr Bond Futures | | | 113 | | | | September 2024 | | | | 9,856,150 | | | | (29,200 | ) |
Coffee Robusta Futures | | | 3 | | | | July 2024 | | | | 123,600 | | | | 8,667 | |
Coffee ‘C’ Futures | | | 7 | | | | September 2024 | | | | 580,781 | | | | 67,349 | |
Copper Futures | | | 40 | | | | September 2024 | | | | 4,610,500 | | | | (164,811 | ) |
Corn Futures | | | 36 | | | | December 2024 | | | | 840,600 | | | | 614 | |
Cotton No. 2 Futures | | | 9 | | | | December 2024 | | | | 337,995 | | | | (10,734 | ) |
E-Mini Russell 1000 Futures | | | 62 | | | | June 2024 | | | | 5,400,820 | | | | 45,724 | |
Euro STOXX 50 Index Futures | | | 6 | | | | June 2024 | | | | 324,473 | | | | (2,602 | ) |
Euro-Bund Futures | | | 42 | | | | June 2024 | | | | 5,894,292 | | | | (174,131 | ) |
Euro-OAT Futures | | | 17 | | | | June 2024 | | | | 2,300,934 | | | | (53,142 | ) |
Gasoline RBOB Futures | | | 5 | | | | August 2024 | | | | 496,839 | | | | (34,659 | ) |
Gold 100 OZ Futures | | | 19 | | | | August 2024 | | | | 4,457,020 | | | | (214,369 | ) |
Hang Seng Index Futures | | | 3 | | | | June 2024 | | | | 345,424 | | | | (13,609 | ) |
KC HRW Wheat Futures | | | 9 | | | | December 2024 | | | | 333,787 | | | | 69,075 | |
Lean Hogs Futures | | | 13 | | | | August 2024 | | | | 501,800 | | | | (48,330 | ) |
Live Cattle Futures | | | 8 | | | | October 2024 | | | | 578,560 | | | | 18,604 | |
LME Lead Futures | | | 3 | | | | September 2024 | | | | 171,155 | | | | 4,756 | |
LME Nickel Futures | | | 3 | | | | September 2024 | | | | 355,796 | | | | 8,997 | |
LME Primary Aluminum Futures | | | 15 | | | | September 2024 | | | | 999,364 | | | | 24,142 | |
LME Zinc Futures | | | 6 | | | | September 2024 | | | | 446,632 | | | | 15,136 | |
Long Gilt Futures | | | 152 | | | | September 2024 | | | | 18,655,844 | | | | (95,077 | ) |
Low SU Gasoil Futures | | | 7 | | | | September 2024 | | | | 518,350 | | | | (32,767 | ) |
MSCI Emerging Markets Futures | | | 108 | | | | June 2024 | | | | 5,705,100 | | | | 50,873 | |
MSCI Singapore IX ETS Futures | | | 11 | | | | June 2024 | | | | 251,473 | | | | (2,619 | ) |
NASDAQ 100 E-Mini Futures | | | 6 | | | | June 2024 | | | | 2,230,920 | | | | 2,657 | |
Natural Gas Futures | | | 46 | | | | August 2024 | | | | 1,219,460 | | | | 73,988 | |
NY Harbor ULSD Futures | | | 4 | | | | August 2024 | | | | 406,896 | | | | (27,449 | ) |
S&P 500 E-Mini Futures | | | 93 | | | | June 2024 | | | | 24,624,075 | | | | 306,200 | |
S&P Mid 400 E-Mini Futures | | | 1 | | | | June 2024 | | | | 299,190 | | | | (1,169 | ) |
S&P/TSX 60 Index Futures | | | 6 | | | | June 2024 | | | | 1,174,863 | | | | 11,920 | |
Silver Futures | | | 7 | | | | July 2024 | | | | 1,065,400 | | | | 62,842 | |
Soybean Futures | | | 18 | | | | November 2024 | | | | 1,066,050 | | | | 4,522 | |
Soybean Meal Futures | | | 19 | | | | December 2024 | | | | 682,860 | | | | 35,270 | |
Soybean Oil Futures | | | 21 | | | | December 2024 | | | | 580,356 | | | | (35,145 | ) |
SPI 200 Futures | | | 7 | | | | June 2024 | | | | 898,772 | | | | (1,527 | ) |
Sugar 11 (World) Futures | | | 25 | | | | September 2024 | | | | 512,120 | | | | (37,167 | ) |
TOPIX Index Futures | | | 26 | | | | June 2024 | | | | 4,582,838 | | | | 141,810 | |
U.S. T-Note 2 Yr (CBT) Futures | | | 48 | | | | September 2024 | | | | 9,777,750 | | | | 1,790 | |
| | |
| |
16 | AB GLOBAL RISK ALLOCATION FUND | | abfunds.com |
CONSOLIDATED PORTFOLIO OF INVESTMENTS (continued)
| | | | | | | | | | | | | | | | |
| Description | | Number of
Contracts | | | Expiration
Month | | | Current
Notional | | | Value and
Unrealized
Appreciation
(Depreciation) | |
U.S. T-Note 5 Yr (CBT) Futures | | | 283 | | | | September 2024 | | | $ | 29,940,516 | | | $ | (48,628 | ) |
U.S. T-Note 10 Yr (CBT) Futures | | | 207 | | | | September 2024 | | | | 22,520,953 | | | | (45,538 | ) |
Wheat (CBT) Futures | | | 14 | | | | December 2024 | | | | 506,450 | | | | 84,546 | |
WTI Crude Futures | | | 19 | | | | August 2024 | | | | 1,451,600 | | | | (72,274 | ) |
| | | | | | | | | | | | | | | | |
Sold Contracts | | | | | | | | | | | | | | | | |
10 Yr Japan Bond (OSE) Futures | | | 21 | | | | June 2024 | | | | 19,093,823 | | | | 359,385 | |
Bloomberg Commodity Index Futures | | | 170 | | | | June 2024 | | | | 1,750,830 | | | | 1,751 | |
MSCI China (USD) Index Futures | | | 26 | | | | June 2024 | | | | 592,020 | | | | (37,678 | ) |
OMXS 30 Index Futures | | | 11 | | | | June 2024 | | | | 272,754 | | | | 2,490 | |
| | | | | | | | | | | | | | | | |
| | | | | | | | | | | | | | $ | 139,044 | |
| | | | | | | | | | | | | | | | |
FORWARD CURRENCY EXCHANGE CONTRACTS (see Note D)
| | | | | | | | | | | | | | | | | | | | |
| Counterparty | | Contracts to
Deliver
(000) | | | In Exchange
For
(000) | | | Settlement
Date | | | Unrealized
Appreciation
(Depreciation) | |
Bank of America, NA | | BRL | | | 34,496 | | | USD | | | 6,605 | | | | 06/04/2024 | | | $ | 35,292 | |
Bank of America, NA | | USD | | | 6,627 | | | BRL | | | 34,496 | | | | 06/04/2024 | | | | (57,292 | ) |
Bank of America, NA | | EUR | | | 1,283 | | | USD | | | 1,399 | | | | 06/12/2024 | | | | 6,945 | |
Bank of America, NA | | USD | | | 8,139 | | | EUR | | | 7,457 | | | | 06/12/2024 | | | | (45,296 | ) |
Bank of America, NA | | CAD | | | 3,675 | | | USD | | | 2,718 | | | | 06/13/2024 | | | | 20,811 | |
Bank of America, NA | | INR | | | 54,220 | | | USD | | | 651 | | | | 06/14/2024 | | | | 1,723 | |
Bank of America, NA | | INR | | | 298,712 | | | USD | | | 3,573 | | | | 06/14/2024 | | | | (5,920 | ) |
Bank of America, NA | | USD | | | 1,154 | | | INR | | | 96,443 | | | | 06/14/2024 | | | | 1,677 | |
Bank of America, NA | | USD | | | 1,277 | | | INR | | | 106,041 | | | | 06/14/2024 | | | | (5,931 | ) |
Bank of America, NA | | USD | | | 704 | | | ZAR | | | 13,035 | | | | 06/14/2024 | | | | (11,148 | ) |
Bank of America, NA | | CNY | | | 12,662 | | | USD | | | 1,778 | | | | 06/20/2024 | | | | (2,062 | ) |
Bank of America, NA | | USD | | | 390 | | | BRL | | | 2,051 | | | | 07/02/2024 | | | | (728 | ) |
Bank of America, NA | | COP | | | 586,383 | | | USD | | | 152 | | | | 07/19/2024 | | | | 910 | |
Bank of America, NA | | IDR | | | 10,849,654 | | | USD | | | 668 | | | | 07/19/2024 | | | | 1,653 | |
Bank of America, NA | | IDR | | | 28,370,703 | | | USD | | | 1,740 | | | | 07/19/2024 | | | | (3,046 | ) |
Bank of America, NA | | NOK | | | 56,513 | | | USD | | | 5,146 | | | | 07/19/2024 | | | | (244,188 | ) |
Bank of America, NA | | SEK | | | 37,803 | | | USD | | | 3,478 | | | | 07/19/2024 | | | | (122,286 | ) |
Bank of America, NA | | USD | | | 261 | | | CLP | | | 232,511 | | | | 07/19/2024 | | | | (7,922 | ) |
Bank of America, NA | | USD | | | 1,690 | | | IDR | | | 27,122,427 | | | | 07/19/2024 | | | | (24,090 | ) |
Bank of America, NA | | USD | | | 4,069 | | | NOK | | | 44,109 | | | | 07/19/2024 | | | | 137,704 | |
Bank of America, NA | | USD | | | 3,627 | | | SEK | | | 39,429 | | | | 07/19/2024 | | | | 127,544 | |
Bank of America, NA | | CNH | | | 42,204 | | | USD | | | 5,847 | | | | 07/23/2024 | | | | 16,064 | |
Bank of America, NA | | NZD | | | 8,553 | | | USD | | | 5,220 | | | | 07/25/2024 | | | | (37,691 | ) |
Bank of America, NA | | PHP | | | 129,863 | | | USD | | | 2,240 | | | | 07/25/2024 | | | | 22,420 | |
Bank of America, NA | | USD | | | 2,573 | | | NZD | | | 4,217 | | | | 07/25/2024 | | | | 18,583 | |
Bank of America, NA | | USD | | | 414 | | | PHP | | | 23,690 | | | | 07/25/2024 | | | | (9,406 | ) |
Barclays Bank PLC | | BRL | | | 28,527 | | | USD | | | 5,493 | | | | 06/04/2024 | | | | 60,072 | |
Barclays Bank PLC | | USD | | | 5,503 | | | BRL | | | 28,527 | | | | 06/04/2024 | | | | (70,682 | ) |
Barclays Bank PLC | | USD | | | 1,839 | | | EUR | | | 1,708 | | | | 06/12/2024 | | | | 15,181 | |
| | |
| |
| abfunds.com | | AB GLOBAL RISK ALLOCATION FUND | 17 |
CONSOLIDATED PORTFOLIO OF INVESTMENTS (continued)
| | | | | | | | | | | | | | | | | | | | |
| Counterparty | | Contracts to
Deliver
(000) | | | In Exchange
For
(000) | | | Settlement
Date | | | Unrealized
Appreciation
(Depreciation) | |
Barclays Bank PLC | | USD | | | 2,699 | | | CAD | | | 3,672 | | | | 06/13/2024 | | | $ | (4,761 | ) |
Barclays Bank PLC | | GBP | | | 3,510 | | | USD | | | 4,364 | | | | 06/20/2024 | | | | (108,518 | ) |
Barclays Bank PLC | | USD | | | 4,209 | | | GBP | | | 3,385 | | | | 06/20/2024 | | | | 104,665 | |
Barclays Bank PLC | | BRL | | | 7,672 | | | USD | | | 1,487 | | | | 07/02/2024 | | | | 30,031 | |
Barclays Bank PLC | | USD | | | 2,522 | | | BRL | | | 13,013 | | | | 07/02/2024 | | | | (50,938 | ) |
Barclays Bank PLC | | KRW | | | 1,386,808 | | | USD | | | 1,020 | | | | 07/18/2024 | | | | 14,740 | |
Barclays Bank PLC | | IDR | | | 39,329,595 | | | USD | | | 2,451 | | | | 07/19/2024 | | | | 35,638 | |
Barclays Bank PLC | | PEN | | | 954 | | | USD | | | 256 | | | | 07/19/2024 | | | | 6 | |
Barclays Bank PLC | | PEN | | | 993 | | | USD | | | 265 | | | | 07/19/2024 | | | | (2,000 | ) |
Barclays Bank PLC | | SEK | | | 8,587 | | | USD | | | 791 | | | | 07/19/2024 | | | | (26,923 | ) |
Barclays Bank PLC | | USD | | | 142 | | | CLP | | | 130,052 | | | | 07/19/2024 | | | | (49 | ) |
Barclays Bank PLC | | USD | | | 211 | | | COP | | | 827,849 | | | | 07/19/2024 | | | | 1,211 | |
Barclays Bank PLC | | USD | | | 2,374 | | | IDR | | | 37,999,679 | | | | 07/19/2024 | | | | (40,070 | ) |
Barclays Bank PLC | | PHP | | | 299,937 | | | USD | | | 5,239 | | | | 07/25/2024 | | | | 117,155 | |
Barclays Bank PLC | | USD | | | 5,674 | | | PHP | | | 323,895 | | | | 07/25/2024 | | | | (143,294 | ) |
Barclays Bank PLC | | JPY | | | 4,806,976 | | | USD | | | 31,202 | | | | 08/16/2024 | | | | 298,131 | |
Barclays Bank PLC | | USD | | | 651 | | | JPY | | | 100,722 | | | | 08/16/2024 | | | | (3,154 | ) |
Barclays Bank PLC | | MYR | | | 15,728 | | | USD | | | 3,375 | | | | 08/21/2024 | | | | 15,411 | |
Barclays Bank PLC | | MYR | | | 27,650 | | | USD | | | 5,866 | | | | 08/21/2024 | | | | (40,228 | ) |
Barclays Bank PLC | | USD | | | 12,842 | | | MYR | | | 60,612 | | | | 08/21/2024 | | | | 103,553 | |
Barclays Bank PLC | | USD | | | 1,136 | | | TWD | | | 36,542 | | | | 08/23/2024 | | | | (8,312 | ) |
BNP Paribas SA | | USD | | | 2,467 | | | ZAR | | | 46,540 | | | | 06/14/2024 | | | | 8,206 | |
BNP Paribas SA | | EUR | | | 774 | | | HUF | | | 298,318 | | | | 07/11/2024 | | | | (11,786 | ) |
BNP Paribas SA | | COP | | | 1,628,007 | | | USD | | | 422 | | | | 07/19/2024 | | | | 4,060 | |
Citibank, NA | | CAD | | | 4,971 | | | USD | | | 3,695 | | | | 06/13/2024 | | | | 46,894 | |
Citibank, NA | | USD | | | 1,961 | | | CAD | | | 2,687 | | | | 06/13/2024 | | | | 11,624 | |
Citibank, NA | | USD | | | 4,989 | | | CAD | | | 6,712 | | | | 06/13/2024 | | | | (63,320 | ) |
Citibank, NA | | GBP | | | 887 | | | EUR | | | 1,041 | | | | 06/20/2024 | | | | 231 | |
Deutsche Bank AG | | BRL | | | 3,055 | | | USD | | | 583 | | | | 06/04/2024 | | | | 1,032 | |
Deutsche Bank AG | | USD | | | 597 | | | BRL | | | 3,055 | | | | 06/04/2024 | | | | (15,030 | ) |
Deutsche Bank AG | | EUR | | | 7,793 | | | USD | | | 8,543 | | | | 06/12/2024 | | | | 84,148 | |
Deutsche Bank AG | | EUR | | | 1,697 | | | USD | | | 1,810 | | | | 06/12/2024 | | | | (32,773 | ) |
Deutsche Bank AG | | USD | | | 737 | | | EUR | | | 687 | | | | 06/12/2024 | | | | 8,916 | |
Deutsche Bank AG | | INR | | | 325,905 | | | USD | | | 3,902 | | | | 06/14/2024 | | | | (3,063 | ) |
Deutsche Bank AG | | USD | | | 5,673 | | | INR | | | 471,890 | | | | 06/14/2024 | | | | (18,115 | ) |
Deutsche Bank AG | | USD | | | 693 | | | ZAR | | | 12,689 | | | | 06/14/2024 | | | | (17,983 | ) |
Deutsche Bank AG | | ZAR | | | 11,233 | | | USD | | | 603 | | | | 06/14/2024 | | | | 5,327 | |
Deutsche Bank AG | | USD | | | 686 | | | GBP | | | 550 | | | | 06/20/2024 | | | | 15,194 | |
Deutsche Bank AG | | USD | | | 3,100 | | | AUD | | | 4,636 | | | | 06/27/2024 | | | | (13,537 | ) |
Deutsche Bank AG | | COP | | | 1,299,567 | | | USD | | | 329 | | | | 07/19/2024 | | | | (4,760 | ) |
Deutsche Bank AG | | IDR | | | 41,748,717 | | | USD | | | 2,612 | | | | 07/19/2024 | | | | 47,816 | |
Deutsche Bank AG | | SEK | | | 7,521 | | | USD | | | 705 | | | | 07/19/2024 | | | | (10,886 | ) |
Deutsche Bank AG | | USD | | | 1,923 | | | COP | | | 7,594,064 | | | | 07/19/2024 | | | | 27,816 | |
Deutsche Bank AG | | USD | | | 2,167 | | | IDR | | | 34,602,321 | | | | 07/19/2024 | | | | (41,293 | ) |
Deutsche Bank AG | | USD | | | 871 | | | SEK | | | 9,300 | | | | 07/19/2024 | | | | 14,859 | |
Deutsche Bank AG | | USD | | | 1,202 | | | CHF | | | 1,077 | | | | 08/08/2024 | | | | 94 | |
Deutsche Bank AG | | JPY | | | 600,604 | | | USD | | | 3,889 | | | | 08/16/2024 | | | | 27,640 | |
Deutsche Bank AG | | USD | | | 3,340 | | | JPY | | | 516,266 | | | | 08/16/2024 | | | | (21,405 | ) |
Deutsche Bank AG | | TWD | | | 43,805 | | | USD | | | 1,366 | | | | 08/23/2024 | | | | 13,446 | |
Deutsche Bank AG | | USD | | | 113 | | | TWD | | | 3,618 | | | | 08/23/2024 | | | | (1,079 | ) |
Goldman Sachs Bank USA | | USD | | | 1,110 | | | CAD | | | 1,524 | | | | 06/13/2024 | | | | 8,402 | |
Goldman Sachs Bank USA | | USD | | | 3,535 | | | ZAR | | | 67,963 | | | | 06/14/2024 | | | | 79,975 | |
| | |
| |
18 | AB GLOBAL RISK ALLOCATION FUND | | abfunds.com |
CONSOLIDATED PORTFOLIO OF INVESTMENTS (continued)
| | | | | | | | | | | | | | | | | | | | |
| Counterparty | | Contracts to
Deliver
(000) | | | In Exchange
For
(000) | | | Settlement
Date | | | Unrealized
Appreciation
(Depreciation) | |
Goldman Sachs Bank USA | | USD | | | 1,273 | | | GBP | | | 1,002 | | | | 06/20/2024 | | | $ | 4,319 | |
Goldman Sachs Bank USA | | PEN | | | 757 | | | USD | | | 203 | | | | 07/19/2024 | | | | (591 | ) |
Goldman Sachs Bank USA | | USD | | | 148 | | | COP | | | 576,980 | | | | 07/19/2024 | | | | 405 | |
Goldman Sachs Bank USA | | MXN | | | 31,769 | | | USD | | | 1,898 | | | | 07/25/2024 | | | | 40,499 | |
Goldman Sachs Bank USA | | PHP | | | 25,866 | | | USD | | | 458 | | | | 07/25/2024 | | | | 16,686 | |
Goldman Sachs Bank USA | | USD | | | 3,579 | | | MXN | | | 59,906 | | | | 07/25/2024 | | | | (76,367 | ) |
Goldman Sachs Bank USA | | USD | | | 825 | | | PHP | | | 47,018 | | | | 07/25/2024 | | | | (21,978 | ) |
Goldman Sachs Bank USA | | CHF | | | 3,228 | | | USD | | | 3,606 | | | | 08/08/2024 | | | | 1,577 | |
Goldman Sachs Bank USA | | JPY | | | 211,897 | | | USD | | | 1,381 | | | | 08/16/2024 | | | | 18,635 | |
Goldman Sachs Bank USA | | USD | | | 1,271 | | | JPY | | | 197,430 | | | | 08/16/2024 | | | | (1,278 | ) |
Goldman Sachs Bank USA | | MYR | | | 1,326 | | | USD | | | 280 | | | | 08/21/2024 | | | | (3,636 | ) |
HSBC Bank USA | | EUR | | | 841 | | | USD | | | 897 | | | | 06/12/2024 | | | | (16,234 | ) |
HSBC Bank USA | | USD | | | 1,759 | | | EUR | | | 1,629 | | | | 06/12/2024 | | | | 8,399 | |
HSBC Bank USA | | USD | | | 2,930 | | | AUD | | | 4,562 | | | | 06/27/2024 | | | | 108,120 | |
HSBC Bank USA | | CLP | | | 767,603 | | | USD | | | 847 | | | | 07/19/2024 | | | | 10,958 | |
HSBC Bank USA | | USD | | | 1,047 | | | IDR | | | 16,658,236 | | | | 07/19/2024 | | | | (23,731 | ) |
JPMorgan Chase Bank, NA | | BRL | | | 3,335 | | | USD | | | 651 | | | | 06/04/2024 | | | | 15,789 | |
JPMorgan Chase Bank, NA | | USD | | | 636 | | | BRL | | | 3,335 | | | | 06/04/2024 | | | | (1,127 | ) |
JPMorgan Chase Bank, NA | | USD | | | 3,149 | | | EUR | | | 2,950 | | | | 06/12/2024 | | | | 52,814 | |
JPMorgan Chase Bank, NA | | CAD | | | 2,756 | | | USD | | | 2,008 | | | | 06/13/2024 | | | | (14,946 | ) |
JPMorgan Chase Bank, NA | | INR | | | 166,150 | | | USD | | | 2,000 | | | | 06/14/2024 | | | | 9,295 | |
JPMorgan Chase Bank, NA | | USD | | | 1,417 | | | INR | | | 118,363 | | | | 06/14/2024 | | | | 1,141 | |
JPMorgan Chase Bank, NA | | USD | | | 931 | | | INR | | | 77,326 | | | | 06/14/2024 | | | | (4,381 | ) |
JPMorgan Chase Bank, NA | | USD | | | 606 | | | ZAR | | | 11,188 | | | | 06/14/2024 | | | | (10,770 | ) |
JPMorgan Chase Bank, NA | | ZAR | | | 22,091 | | | USD | | | 1,197 | | | | 06/14/2024 | | | | 22,150 | |
JPMorgan Chase Bank, NA | | ZAR | | | 25,651 | | | USD | | | 1,348 | | | | 06/14/2024 | | | | (16,713 | ) |
JPMorgan Chase Bank, NA | | CNY | | | 6,375 | | | USD | | | 893 | | | | 06/20/2024 | | | | (2,845 | ) |
JPMorgan Chase Bank, NA | | GBP | | | 1,333 | | | USD | | | 1,668 | | | | 06/20/2024 | | | | (31,003 | ) |
JPMorgan Chase Bank, NA | | CZK | | | 27,745 | | | USD | | | 1,193 | | | | 07/11/2024 | | | | (26,979 | ) |
JPMorgan Chase Bank, NA | | USD | | | 669 | | | CZK | | | 15,204 | | | | 07/11/2024 | | | | (279 | ) |
JPMorgan Chase Bank, NA | | USD | | | 504 | | | PLN | | | 2,019 | | | | 07/11/2024 | | | | 7,927 | |
JPMorgan Chase Bank, NA | | USD | | | 642 | | | PLN | | | 2,514 | | | | 07/11/2024 | | | | (3,944 | ) |
JPMorgan Chase Bank, NA | | USD | | | 1,282 | | | KRW | | | 1,762,561 | | | | 07/18/2024 | | | | (4,730 | ) |
JPMorgan Chase Bank, NA | | CLP | | | 183,356 | | | USD | | | 203 | | | | 07/19/2024 | | | | 3,855 | |
JPMorgan Chase Bank, NA | | IDR | | | 4,970,454 | | | USD | | | 306 | | | | 07/19/2024 | | | | 324 | |
JPMorgan Chase Bank, NA | | PEN | | | 2,489 | | | USD | | | 666 | | | | 07/19/2024 | | | | (1,637 | ) |
JPMorgan Chase Bank, NA | | SEK | | | 24,674 | | | USD | | | 2,260 | | | | 07/19/2024 | | | | (89,405 | ) |
JPMorgan Chase Bank, NA | | CNH | | | 16,900 | | | USD | | | 2,341 | | | | 07/23/2024 | | | | 5,737 | |
JPMorgan Chase Bank, NA | | USD | | | 989 | | | CHF | | | 896 | | | | 08/08/2024 | | | | 11,094 | |
Morgan Stanley Capital Services, Inc. | | BRL | | | 5,208 | | | USD | | | 1,014 | | | | 06/04/2024 | | | | 21,695 | |
Morgan Stanley Capital Services, Inc. | | USD | | | 994 | | | BRL | | | 5,208 | | | | 06/04/2024 | | | | (1,760 | ) |
Morgan Stanley Capital Services, Inc. | | EUR | | | 6,259 | | | USD | | | 6,691 | | | | 06/12/2024 | | | | (102,833 | ) |
Morgan Stanley Capital Services, Inc. | | USD | | | 1,437 | | | EUR | | | 1,340 | | | | 06/12/2024 | | | | 16,430 | |
Morgan Stanley Capital Services, Inc. | | USD | | | 1,215 | | | EUR | | | 1,117 | | | | 06/12/2024 | | | | (2,296 | ) |
Morgan Stanley Capital Services, Inc. | | CAD | | | 2,436 | | | USD | | | 1,778 | | | | 06/13/2024 | | | | (9,755 | ) |
| | |
| |
| abfunds.com | | AB GLOBAL RISK ALLOCATION FUND | 19 |
CONSOLIDATED PORTFOLIO OF INVESTMENTS (continued)
| | | | | | | | | | | | | | | | | | | | |
| Counterparty | | Contracts to
Deliver
(000) | | | In Exchange
For
(000) | | | Settlement
Date | | | Unrealized
Appreciation
(Depreciation) | |
Morgan Stanley Capital Services, Inc. | | USD | | | 3,148 | | | CAD | | | 4,328 | | | | 06/13/2024 | | | $ | 27,958 | |
Morgan Stanley Capital Services, Inc. | | USD | | | 207 | | | INR | | | 17,286 | | | | 06/14/2024 | | | | 112 | |
Morgan Stanley Capital Services, Inc. | | USD | | | 138 | | | INR | | | 11,475 | | | | 06/14/2024 | | | | (589 | ) |
Morgan Stanley Capital Services, Inc. | | ZAR | | | 79,994 | | | USD | | | 4,185 | | | | 06/14/2024 | | | | (69,666 | ) |
Morgan Stanley Capital Services, Inc. | | GBP | | | 538 | | | USD | | | 673 | | | | 06/20/2024 | | | | (12,616 | ) |
Morgan Stanley Capital Services, Inc. | | USD | | | 2,917 | | | AUD | | | 4,495 | | | | 06/27/2024 | | | | 75,643 | |
Morgan Stanley Capital Services, Inc. | | HUF | | | 1,439,246 | | | USD | | | 3,868 | | | | 07/11/2024 | | | | (133,977 | ) |
Morgan Stanley Capital Services, Inc. | | USD | | | 3,528 | | | HUF | | | 1,312,588 | | | | 07/11/2024 | | | | 122,187 | |
Morgan Stanley Capital Services, Inc. | | USD | | | 558 | | | HUF | | | 200,526 | | | | 07/11/2024 | | | | (701 | ) |
Morgan Stanley Capital Services, Inc. | | KRW | | | 742,576 | | | USD | | | 543 | | | | 07/18/2024 | | | | 4,594 | |
Morgan Stanley Capital Services, Inc. | | USD | | | 2,192 | | | KRW | | | 2,988,639 | | | | 07/18/2024 | | | | (25,551 | ) |
Morgan Stanley Capital Services, Inc. | | CLP | | | 3,178,302 | | | USD | | | 3,406 | | | | 07/19/2024 | | | | (53,747 | ) |
Morgan Stanley Capital Services, Inc. | | SEK | | | 7,947 | | | USD | | | 749 | | | | 07/19/2024 | | | | (7,932 | ) |
Morgan Stanley Capital Services, Inc. | | USD | | | 3,846 | | | CLP | | | 3,588,289 | | | | 07/19/2024 | | | | 60,680 | |
Morgan Stanley Capital Services, Inc. | | USD | | | 1,400 | | | PEN | | | 5,193 | | | | 07/19/2024 | | | | (5,795 | ) |
Morgan Stanley Capital Services, Inc. | | CHF | | | 4,004 | | | USD | | | 4,450 | | | | 08/08/2024 | | | | (20,211 | ) |
Morgan Stanley Capital Services, Inc. | | USD | | | 713 | | | CHF | | | 645 | | | | 08/08/2024 | | | | 7,606 | |
Morgan Stanley Capital Services, Inc. | | MYR | | | 13,359 | | | USD | | | 2,832 | | | | 08/21/2024 | | | | (20,890 | ) |
Morgan Stanley Capital Services, Inc. | | TWD | | | 142,992 | | | USD | | | 4,487 | | | | 08/23/2024 | | | | 73,690 | |
Morgan Stanley Capital Services, Inc. | | USD | | | 7,398 | | | TWD | | | 235,731 | | | | 08/23/2024 | | | | (121,481 | ) |
Standard Chartered Bank | | AUD | | | 7,962 | | | USD | | | 5,112 | | | | 06/27/2024 | | | | (188,802 | ) |
State Street Bank & Trust Co. | | EUR | | | 260 | | | USD | | | 284 | | | | 06/12/2024 | | | | 1,763 | |
State Street Bank & Trust Co. | | EUR | | | 913 | | | USD | | | 973 | | | | 06/12/2024 | | | | (17,666 | ) |
State Street Bank & Trust Co. | | USD | | | 2,997 | | | EUR | | | 2,798 | | | | 06/12/2024 | | | | 39,889 | |
State Street Bank & Trust Co. | | USD | | | 157 | | | EUR | | | 143 | | | | 06/12/2024 | | | | (1,604 | ) |
State Street Bank & Trust Co. | | CAD | | | 2,718 | | | USD | | | 2,000 | | | | 06/13/2024 | | | | 5,693 | |
State Street Bank & Trust Co. | | CAD | | | 159 | | | USD | | | 117 | | | | 06/13/2024 | | | | (14 | ) |
State Street Bank & Trust Co. | | USD | | | 279 | | | CAD | | | 377 | | | | 06/13/2024 | | | | (2,600 | ) |
State Street Bank & Trust Co. | | USD | | | 887 | | | ZAR | | | 16,332 | | | | 06/14/2024 | | | | (18,276 | ) |
State Street Bank & Trust Co. | | ZAR | | | 3,393 | | | USD | | | 184 | | | | 06/14/2024 | | | | 3,342 | |
State Street Bank & Trust Co. | | GBP | | | 91 | | | USD | | | 116 | | | | 06/20/2024 | | | | 76 | |
| | |
| |
20 | AB GLOBAL RISK ALLOCATION FUND | | abfunds.com |
CONSOLIDATED PORTFOLIO OF INVESTMENTS (continued)
| | | | | | | | | | | | | | | | | | | | | | |
| Counterparty | | Contracts to
Deliver
(000) | | | In Exchange
For
(000) | | | Settlement
Date | | | Unrealized
Appreciation
(Depreciation) | |
State Street Bank & Trust Co. | | GBP | | | 400 | | | | USD | | | | 499 | | | | 06/20/2024 | | | $ | (11,145 | ) |
State Street Bank & Trust Co. | | AUD | | | 678 | | | | USD | | | | 446 | | | | 06/27/2024 | | | | (5,692 | ) |
State Street Bank & Trust Co. | | USD | | | 732 | | | | AUD | | | | 1,121 | | | | 06/27/2024 | | | | 14,625 | |
State Street Bank & Trust Co. | | USD | | | 374 | | | | AUD | | | | 558 | | | | 06/27/2024 | | | | (1,962 | ) |
State Street Bank & Trust Co. | | CZK | | | 53,151 | | | | USD | | | | 2,263 | | | | 07/11/2024 | | | | (73,981 | ) |
State Street Bank & Trust Co. | | HUF | | | 34,003 | | | | USD | | | | 96 | | | | 07/11/2024 | | | | 1,072 | |
State Street Bank & Trust Co. | | HUF | | | 216,384 | | | | USD | | | | 589 | | | | 07/11/2024 | | | | (12,609 | ) |
State Street Bank & Trust Co. | | USD | | | 916 | | | | CZK | | | | 21,622 | | | | 07/11/2024 | | | | 34,798 | |
State Street Bank & Trust Co. | | USD | | | 205 | | | | HUF | | | | 76,266 | | | | 07/11/2024 | | | | 7,167 | |
State Street Bank & Trust Co. | | USD | | | 2,039 | | | | PLN | | | | 8,211 | | | | 07/11/2024 | | | | 44,574 | |
State Street Bank & Trust Co. | | THB | | | 125,618 | | | | USD | | | | 3,434 | | | | 07/12/2024 | | | | 9,384 | |
State Street Bank & Trust Co. | | USD | | | 1,215 | | | | THB | | | | 44,265 | | | | 07/12/2024 | | | | (8,020 | ) |
| State Street Bank & Trust Co. | | NOK | | | 3,337 | | | | USD | | | | 319 | | | | 07/19/2024 | | | | 741 | |
| State Street Bank & Trust Co. | | NOK | | | 2,868 | | | | USD | | | | 262 | | | | 07/19/2024 | | | | (12,027 | ) |
| State Street Bank & Trust Co. | | SEK | | | 11,169 | | | | USD | | | | 1,034 | | | | 07/19/2024 | | | | (29,371 | ) |
| State Street Bank & Trust Co. | | USD | | | 1,012 | | | | NOK | | | | 10,982 | | | | 07/19/2024 | | | | 35,831 | |
| State Street Bank & Trust Co. | | USD | | | 1,575 | | | | SEK | | | | 17,075 | | | | 07/19/2024 | | | | 51,490 | |
| State Street Bank & Trust Co. | | USD | | | 303 | | | | SEK | | | | 3,182 | | | | 07/19/2024 | | | | (203 | ) |
| State Street Bank & Trust Co. | | SGD | | | 982 | | | | USD | | | | 731 | | | | 07/25/2024 | | | | 2,583 | |
| State Street Bank & Trust Co. | | USD | | | 105 | | | | NZD | | | | 171 | | | | 07/25/2024 | | | | 253 | |
| State Street Bank & Trust Co. | | CHF | | | 399 | | | | USD | | | | 446 | | | | 08/08/2024 | | | | 191 | |
| State Street Bank & Trust Co. | | CHF | | | 138 | | | | USD | | | | 153 | | | | 08/08/2024 | | | | (788 | ) |
| State Street Bank & Trust Co. | | USD | | | 153 | | | | CHF | | | | 138 | | | | 08/08/2024 | | | | 643 | |
| State Street Bank & Trust Co. | | USD | | | 317 | | | | CHF | | | | 284 | | | | 08/08/2024 | | | | (111 | ) |
| State Street Bank & Trust Co. | | USD | | | 432 | | | | JPY | | | | 66,157 | | | | 08/16/2024 | | | | (7,138 | ) |
| UBS AG | | BRL | | | 4,037 | | | | USD | | | | 786 | | | | 06/04/2024 | | | | 17,230 | |
| UBS AG | | USD | | | 770 | | | | BRL | | | | 4,037 | | | | 06/04/2024 | | | | (1,364 | ) |
| UBS AG | | EUR | | | 1,672 | | | | USD | | | | 1,827 | | | | 06/12/2024 | | | | 12,678 | |
| UBS AG | | USD | | | 565 | | | | AUD | | | | 853 | | | | 06/27/2024 | | | | 2,735 | |
| UBS AG | | USD | | | 1,005 | | | | NOK | | | | 11,055 | | | | 07/19/2024 | | | | 49,462 | |
| | | | | | | | | | | | | | | | | | | | | | |
| | | | | | | | | | | | | | | | | | | | $ | 12,627 | |
| | | | | | | | | | | | | | | | | | | | | | |
CENTRALLY CLEARED CREDIT DEFAULT SWAPS (see Note D)
| | | | | | | | | | | | | | | | | | | | | | | | | | | | | | | | | | |
| Description | | Fixed
Rate
(Pay)
Receive | | | Payment
Frequency | | | Implied
Credit
Spread
at
May 31,
2024 | | | Notional
Amount
(000) | | | Market
Value | | | Upfront
Premiums
Paid (Received) | | | Unrealized
Appreciation
(Depreciation) | |
Sale Contracts | |
CDX-NAHY Series 42,
5 Year Index, 06/20/2029* | | | 5.00 | % | | | Quarterly | | | | 3.34 | % | | | USD | | | | 8,680 | | | $ | 678,161 | | | $ | 586,088 | | | $ | 92,073 | |
| | |
| |
| abfunds.com | | AB GLOBAL RISK ALLOCATION FUND | 21 |
CONSOLIDATED PORTFOLIO OF INVESTMENTS (continued)
CENTRALLY CLEARED INTEREST RATE SWAPS (see Note D)
| | | | | | | | | | | | | | | | | | | | | | | | | | | | | | | | |
| | | | | | | | | Rate Type | | | | |
Notional Amount (000) | | | Termination
Date | | | Payments
made
by the
Fund | | | Payments
received
by the
Fund | | | Payment
Frequency
Paid/
Received | | | Market
Value | | | Upfront
Premiums
Paid
(Received) | | | Unrealized
Appreciation
(Depreciation) | |
| AUD | | | 15,000 | | | | 07/09/2025 | | |
| 6 Month
BBSW |
| | | 3.168% | | |
| Semi-
Annual |
| | $ | (194,600 | ) | | $ | 209,143 | | | $ | (403,743 | ) |
| AUD | | | 4,740 | | | | 02/23/2027 | | |
| 6 Month
BBSW |
| | | 3.040% | | |
| Semi-
Annual |
| | | (118,652 | ) | | | 117,715 | | | | (236,367 | ) |
| NZD | | | 20,260 | | | | 02/24/2027 | | |
| 3 Month
BKBM |
| | | 3.508% | | |
| Quarterly/
Semi-
Annual |
| | | (335,665 | ) | | | 333,433 | | | | (669,098 | ) |
| AUD | | | 9,490 | | | | 02/27/2027 | | |
| 6 Month
BBSW |
| | | 2.975% | | |
| Semi-
Annual |
| | | (248,288 | ) | | | 223,984 | | | | (472,272 | ) |
| NZD | | | 7,750 | | | | 02/28/2027 | | |
| 3 Month
BKBM |
| | | 3.445% | | |
| Quarterly/
Semi-
Annual |
| | | (136,971 | ) | | | 118,759 | | | | (255,730 | ) |
| USD | | | 30,190 | | | | 05/13/2027 | | |
| 1 Day
SOFR |
| | | 2.682% | | | | Annual | | | | (1,581,535 | ) | | | – 0 | – | | | (1,581,535 | ) |
| GBP | | | 3,170 | | | | 10/26/2028 | | |
| 1 Day
SONIA |
| | | 4.627% | | | | Annual | | | | 42,984 | | | | – 0 | – | | | 42,984 | |
| AUD | | | 3,130 | | | | 11/13/2030 | | |
| 6 Month
BBSW |
| | | 0.872% | | |
| Semi-
Annual |
| | | (421,254 | ) | | | (162,282 | ) | | | (258,972 | ) |
| USD | | | 4,800 | | | | 05/13/2032 | | | | 1.603% | | |
| 1 Day
SOFR |
| | | Annual | | | | 834,715 | | | | 373,247 | | | | 461,468 | |
| NZD | | | 5,540 | | | | 10/03/2033 | | |
| 3 Month
BKBM |
| | | 5.128% | | |
| Quarterly/
Semi-
Annual |
| | | 122,091 | | | | – 0 | – | | | 122,091 | |
| | | | | | | | | | | | | | | | | | | | | | | | | | | | | | | | |
| | | | | | | | | | | | | | | | | | | | | | $ | (2,037,175 | ) | | $ | 1,213,999 | | | $ | (3,251,174 | ) |
| | | | | | | | | | | | | | | | | | | | | | | | | | | | | | | | |
| (a) | To obtain a copy of the fund’s shareholder report, please go to the Securities and Exchange Commission’s website at www.sec.gov. Additionally, shareholder reports for AB funds can be obtained by calling AB at (800) 227-4618. |
| (b) | Fair valued by the Adviser. |
| (c) | Security in which significant unobservable inputs (Level 3) were used in determining fair value. |
| (d) | Non-income producing security. |
| (e) | Represents entire or partial securities out on loan. See Note E for securities lending information. |
| (f) | Security is exempt from registration under Rule 144A or Regulation S of the Securities Act of 1933. This security is considered restricted, but liquid and may be resold in transactions exempt from registration. At May 31, 2024, the market value of this security amounted to $4,187 or 0.0% of net assets. |
| (g) | Affiliated investments. |
| (h) | The rate shown represents the 7-day yield as of period end. |
| | |
| |
22 | AB GLOBAL RISK ALLOCATION FUND | | abfunds.com |
CONSOLIDATED PORTFOLIO OF INVESTMENTS (continued)
Currency Abbreviation:
AUD – Australian Dollar
BRL – Brazilian Real
CAD – Canadian Dollar
CHF – Swiss Franc
CLP – Chilean Peso
CNH – Chinese Yuan Renminbi (Offshore)
CNY – Chinese Yuan Renminbi
COP – Colombian Peso
CZK – Czech Koruna
EUR – Euro
GBP – Great British Pound
HUF – Hungarian Forint
IDR – Indonesian Rupiah
INR – Indian Rupee
JPY – Japanese Yen
KRW – South Korean Won
MXN – Mexican Peso
MYR – Malaysian Ringgit
NOK – Norwegian Krone
NZD – New Zealand Dollar
PEN – Peruvian Sol
PHP – Philippine Peso
PLN – Polish Zloty
SEK – Swedish Krona
SGD – Singapore Dollar
THB – Thailand Baht
TWD – New Taiwan Dollar
USD – United States Dollar
ZAR – South African Rand
Glossary:
ADR – American Depositary Receipt
BBSW – Bank Bill Swap Reference Rate (Australia)
BKBM – Bank Bill Benchmark (New Zealand)
BR – Bearer
CBT – Chicago Board of Trade
CDX-NAHY – North American High Yield Credit Default Swap Index
ETF – Exchange Traded Fund
ETS – Emission Trading Scheme
GDR – Global Depositary Receipt
KC HRW – Kansas City Hard Red Winter
LME – London Metal Exchange
MSCI – Morgan Stanley Capital International
NASDAQ – National Association of Securities Dealers Automated Quotations
OAT – Obligations Assimilables du Trésor
OMXS – Stockholm Stock Exchange
OSE – Osaka Securities Exchange
RBOB – Reformulated Gasoline Blend-Stock for Oxygen Blending (Unleaded Gas)
REG – Registered Shares
REIT – Real Estate Investment Trust
SDR – Swedish Depositary Receipt
SOFR – Secured Overnight Financing Rate
SONIA – Sterling Overnight Index Average
SPI – Share Price Index
TIPS – Treasury Inflation Protected Security
TOPIX – Tokyo Price Index
TSX – Toronto Stock Exchange
ULSD – Ultra-Low Sulfur Diesel
WTI – West Texas Intermediate
See notes to financial statements.
| | |
| |
| abfunds.com | | AB GLOBAL RISK ALLOCATION FUND | 23 |
CONSOLIDATED STATEMENT OF ASSETS & LIABILITIES
May 31, 2024 (unaudited)
| | | | |
| Assets | | | | |
Investments in securities, at value | | | | |
Unaffiliated issuers (cost $149,765,731) | | $ | 153,478,590 | (a) |
Affiliated issuers (cost $13,676,397 - including investment of cash collateral for securities loaned of $366,822) | | | 13,676,397 | |
Cash collateral due from broker | | | 8,000,779 | |
Foreign currencies, at value (cost $505,773) | | | 512,559 | |
Unrealized appreciation on forward currency exchange contracts | | | 2,679,339 | |
Receivable for variation margin on futures | | | 447,035 | |
Unaffiliated dividends and interest receivable | | | 220,215 | |
Receivable for variation margin on centrally cleared swaps | | | 92,916 | |
Affiliated dividends receivable | | | 49,612 | |
Receivable for capital stock sold | | | 3,521 | |
Receivable for investment securities sold | | | 2,452 | |
Receivable due from Adviser | | | 1,684 | |
Other assets | | | 1,803 | |
| | | | |
Total assets | | | 179,166,902 | |
| | | | |
| Liabilities | |
Unrealized depreciation on forward currency exchange contracts | | | 2,666,712 | |
Custody and accounting fees payable | | | 395,835 | |
Payable for collateral received on securities loaned | | | 366,822 | |
Advisory fee payable | | | 95,592 | |
Payable for capital stock redeemed | | | 51,954 | |
Administrative fee payable | | | 42,120 | |
Distribution fee payable | | | 38,447 | |
Transfer Agent fee payable | | | 17,222 | |
Directors’ fees payable | | | 5,698 | |
Accrued expenses | | | 94,574 | |
| | | | |
Total liabilities | | | 3,774,976 | |
| | | | |
Net Assets | | $ | 175,391,926 | |
| | | | |
| Composition of Net Assets | |
Capital stock, at par | | $ | 105,940 | |
Additional paid-in capital | | | 190,287,586 | |
Accumulated loss | | | (15,001,600 | ) |
| | | | |
Net Assets | | $ | 175,391,926 | |
| | | | |
Net Asset Value Per Share—24 billion shares of capital stock authorized, $.01 par value
| | | | | | | | | | | | |
| Class | | Net Assets | | | Shares
Outstanding | | | Net Asset
Value | |
| |
| A | | $ | 160,818,105 | | | | 9,707,484 | | | $ | 16.57 | * |
| |
| C | | $ | 2,116,128 | | | | 142,894 | | | $ | 14.81 | |
| |
| Advisor | | $ | 11,186,933 | | | | 667,665 | | | $ | 16.76 | |
| |
| I | | $ | 1,270,760 | | | | 75,996 | | | $ | 16.72 | |
| |
| (a) | Includes securities on loan with a value of $390,996 (see Note E). |
| * | The maximum offering price per share for Class A shares was $17.31 which reflects a sales charge of 4.25%. |
See notes to consolidated financial statements.
| | |
| |
24 | AB GLOBAL RISK ALLOCATION FUND | | abfunds.com |
CONSOLIDATED STATEMENT OF OPERATIONS
Six Months Ended May 31, 2024 (unaudited)
| | | | | | | | |
| Investment Income | | | | | | | | |
Interest | | $ | 1,518,689 | | | | | |
Dividends | | | | | | | | |
Unaffiliated issuers (net of foreign taxes withheld of $56,775) | | | 537,070 | | | | | |
Affiliated issuers | | | 379,951 | | | | | |
Securities lending income | | | 3,567 | | | $ | 2,439,277 | |
| | | | | | | | |
| Expenses | | | | | | | | |
Advisory fee (see Note B) | | | 544,757 | | | | | |
Distribution fee—Class A | | | 206,057 | | | | | |
Distribution fee—Class C | | | 10,303 | | | | | |
Distribution fee—Class R | | | 417 | | | | | |
Distribution fee—Class K | | | 804 | | | | | |
Transfer agency—Class A | | | 130,299 | | | | | |
Transfer agency—Class C | | | 1,716 | | | | | |
Transfer agency—Advisor Class | | | 9,942 | | | | | |
Transfer agency—Class R | | | 223 | | | | | |
Transfer agency—Class K | | | 666 | | | | | |
Transfer agency—Class I | | | 816 | | | | | |
Custody and accounting | | | 88,036 | | | | | |
Audit and tax | | | 57,462 | | | | | |
Registration fees | | | 52,078 | | | | | |
Administrative | | | 51,714 | | | | | |
Printing | | | 26,258 | | | | | |
Legal | | | 21,492 | | | | | |
Directors’ fees | | | 11,380 | | | | | |
Miscellaneous | | | 31,146 | | | | | |
| | | | | | | | |
Total expenses before bank overdraft expense | | | 1,245,566 | | | | | |
Bank overdraft expense | | | 5,415 | | | | | |
| | | | | | | | |
Total expenses | | | 1,250,981 | | | | | |
Less: expenses waived and reimbursed by the Adviser (see Notes B & E) | | | (11,420 | ) | | | | |
| | | | | | | | |
Net expenses | | | | | | | 1,239,561 | |
| | | | | | | | |
Net investment income | | | | | | | 1,199,716 | |
| | | | | | | | |
| Realized and Unrealized Gain (Loss) on Investment and Foreign Currency Transactions | | | | | | | | |
Net realized gain (loss) on: | | | | | | | | |
Investment transactions | | | | | | | 14,865,569 | |
Forward currency exchange contracts | | | | | | | 1,530,772 | |
Futures | | | | | | | 4,007,805 | |
Options written | | | | | | | 77,437 | |
Swaps | | | | | | | (290,714 | ) |
Foreign currency transactions | | | | | | | (1,195,683 | ) |
Net change in unrealized appreciation (depreciation) of: | | | | | | | | |
Investments | | | | | | | (9,809,097 | ) |
Forward currency exchange contracts | | | | | | | 927,458 | |
Futures | | | | | | | (275,375 | ) |
Swaps | | | | | | | 652,671 | |
Foreign currency denominated assets and liabilities | | | | | | | (32,977 | ) |
| | | | | | | | |
Net gain on investment and foreign currency transactions | | | | | | | 10,457,866 | |
| | | | | | | | |
Net Increase in Net Assets from Operations | | | | | | $ | 11,657,582 | |
| | | | | | | | |
See notes to consolidated financial statements.
| | |
| |
| abfunds.com | | AB GLOBAL RISK ALLOCATION FUND | 25 |
CONSOLIDATED STATEMENT OF CHANGES IN NET ASSETS
| | | | | | | | |
| | | Six Months Ended
May 31, 2024
(unaudited) | | | Year Ended
November 30,
2023 | |
| Increase (Decrease) in Net Assets from Operations | | | | | | | | |
Net investment income | | $ | 1,199,716 | | | $ | 4,181,331 | |
Net realized gain (loss) on investment and foreign currency transactions | | | 18,995,186 | | | | (2,310,161 | ) |
Net change in unrealized appreciation (depreciation) of investments and foreign currency denominated assets and liabilities | | | (8,537,320 | ) | | | (4,234,632 | ) |
| | | | | | | | |
Net increase (decrease) in net assets from operations | | | 11,657,582 | | | | (2,363,462 | ) |
Distributions to Shareholders | | | | | | | | |
Class A | | | (2,310,531 | ) | | | (16,389,921 | ) |
Class C | | | (25,123 | ) | | | (186,826 | ) |
Advisor Class | | | (214,999 | ) | | | (1,343,971 | ) |
Class R | | | (2,480 | ) | | | (26,240 | ) |
Class K | | | (8,873 | ) | | | (58,331 | ) |
Class I | | | (20,265 | ) | | | (156,841 | ) |
| Capital Stock Transactions | | | | | | | | |
Net decrease | | | (13,123,158 | ) | | | (38,675,085 | ) |
| | | | | | | | |
Total decrease | | | (4,047,847 | ) | | | (59,200,677 | ) |
| Net Assets | | | | | | | | |
Beginning of period | | | 179,439,773 | | | | 238,640,450 | |
| | | | | | | | |
End of period | | $ | 175,391,926 | | | $ | 179,439,773 | |
| | | | | | | | |
See notes to consolidated financial statements.
| | |
| |
26 | AB GLOBAL RISK ALLOCATION FUND | | abfunds.com |
NOTES TO CONSOLIDATED FINANCIAL STATEMENTS
May 31, 2024 (unaudited)
NOTE A
Significant Accounting Policies
AB Global Risk Allocation Fund, Inc. (the “Fund”) is registered under the Investment Company Act of 1940 (the “1940 Act”) as a diversified, open-end management investment company. As part of the Fund’s investment strategy, the Fund seeks to gain exposure to commodities and commodities-related instruments and derivatives primarily through investments in AllianceBernstein Global Risk Allocation Fund (Cayman), Ltd., a wholly-owned subsidiary of the Fund organized under the laws of the Cayman Islands (the “Subsidiary”). The Fund is the sole shareholder of the Subsidiary and it is intended that the Fund will remain the sole shareholder and will continue to control the Subsidiary. Under the Articles of Association of the Subsidiary, shares issued by the Subsidiary confer upon a shareholder the right to receive notice of, to attend and to vote at general meetings of the Subsidiary and shall confer upon the shareholder rights in a winding-up or repayment of capital and the right to participate in the profits or assets of the Subsidiary. As of May 31, 2024, net assets of the Fund were $175,391,926, of which $9,394,329, or 5%, represented the Fund’s ownership of all issued shares and voting rights of the Subsidiary. This report presents the consolidated financial statements of the Fund and the Subsidiary. All inter-company transactions and balances have been eliminated in consolidation. The Fund offers Class A, Class C, Advisor Class, and Class I. Class B, Class R, Class K, and Class T shares have been authorized but currently are not offered. Effective May 20, 2024, Class R and Class K were liquidated. Class A shares are sold with a front-end sales charge of up to 4.25% for purchases not exceeding $1,000,000. With respect to purchases of $1,000,000 or more, Class A shares redeemed within one year of purchase may be subject to a contingent deferred sales charge of 1%. Class C shares are subject to a contingent deferred sales charge of 1% on redemptions made within the first year after purchase, and 0% after the first year of purchase. Class C shares automatically convert to Class A shares eight years after the end of the calendar month of purchase. Advisor Class and Class I shares are sold without an initial or contingent deferred sales charge and are not subject to ongoing distribution expenses. All eight classes of shares have identical voting, dividend, liquidation and other rights, except that the classes bear different distribution and transfer agency expenses. Each class has exclusive voting rights with respect to its distribution plan. The consolidated financial statements have been prepared in conformity with U.S. generally accepted accounting principles (“U.S. GAAP”), which require management to make certain estimates and assumptions that affect the reported amounts of assets and liabilities in the consolidated financial statements and amounts of income and expenses during the reporting period. Actual results could differ from those estimates. The Fund is an investment company under U.S. GAAP and follows the accounting and
| | |
| |
| abfunds.com | | AB GLOBAL RISK ALLOCATION FUND | 27 |
NOTES TO CONSOLIDATED FINANCIAL STATEMENTS (continued)
reporting guidance applicable to investment companies. The following is a summary of significant accounting policies followed by the Fund.
1. Security Valuation
Portfolio securities are valued at market value determined on the basis of market quotations or, if market quotations are not readily available or are unreliable, at “fair value” as determined in accordance with procedures approved by and under the oversight of the Fund’s Board of Directors (the “Board”). Pursuant to these procedures, AllianceBernstein L.P. (the “Adviser”) serves as the Fund’s valuation designee pursuant to Rule 2a-5 of the 1940 Act. In this capacity, the Adviser is responsible, among other things, for making all fair value determinations relating to the Fund’s portfolio investments, subject to the Board’s oversight.
In general, the market values of securities which are readily available and deemed reliable are determined as follows: securities listed on a national securities exchange (other than securities listed on the NASDAQ Stock Market, Inc. (“NASDAQ”)) or on a foreign securities exchange are valued at the last sale price at the close of the exchange or foreign securities exchange. If there has been no sale on such day, the securities are valued at the last traded price from the previous day. Securities listed on more than one exchange are valued by reference to the principal exchange on which the securities are traded; securities listed only on NASDAQ are valued in accordance with the NASDAQ Official Closing Price; listed or over the counter (“OTC”) market put or call options are valued at the mid level between the current bid and ask prices. If either a current bid or current ask price is unavailable, the Adviser will have discretion to determine the best valuation (e.g., last trade price in the case of listed options); open futures are valued using the closing settlement price or, in the absence of such a price, the most recent quoted bid price. If there are no quotations available for the day of valuation, the last available closing settlement price is used; U.S. Government securities and any other debt instruments having 60 days or less remaining until maturity are generally valued at market by an independent pricing vendor, if a market price is available. If a market price is not available, the securities are valued at amortized cost. This methodology is commonly used for short term securities that have an original maturity of 60 days or less, as well as short term securities that had an original term to maturity that exceeded 60 days. In instances when amortized cost is utilized, the Valuation Committee (the “Committee”) must reasonably conclude that the utilization of amortized cost is approximately the same as the fair value of the security. Factors the Committee will consider include, but are not limited to, an impairment of the creditworthiness of the issuer or material changes in interest rates. Fixed-income securities, including mortgage-backed and asset-backed securities, may be valued on the basis of prices provided by a pricing service or at a price obtained from one or more of the major broker-dealers. In cases where broker-dealer quotes
| | |
| |
28 | AB GLOBAL RISK ALLOCATION FUND | | abfunds.com |
NOTES TO CONSOLIDATED FINANCIAL STATEMENTS (continued)
are obtained, the Adviser may establish procedures whereby changes in market yields or spreads are used to adjust, on a daily basis, a recently obtained quoted price on a security. Swaps and other derivatives are valued daily, primarily using independent pricing services, independent pricing models using market inputs, as well as third party broker-dealers or counterparties. Open-end mutual funds are valued at the closing net asset value per share, while exchange-traded funds are valued at the closing market price per share.
Securities for which market quotations are not readily available (including restricted securities) or are deemed unreliable are valued at fair value as deemed appropriate by the Adviser. Factors considered in making this determination may include, but are not limited to, information obtained by contacting the issuer, analysts, analysis of the issuer’s financial statements or other available documents. In addition, the Fund may use fair value pricing for securities primarily traded in non-U.S. markets because most foreign markets close well before the Fund values its securities at 4:00 p.m., Eastern Time. The earlier close of these foreign markets gives rise to the possibility that significant events, including broad market moves, may have occurred in the interim and may materially affect the value of those securities. To account for this, the Fund generally values many of its foreign equity securities using fair value prices based on third party vendor modeling tools to the extent available.
2. Fair Value Measurements
In accordance with U.S. GAAP regarding fair value measurements, fair value is defined as the price that the Fund would receive to sell an asset or pay to transfer a liability in an orderly transaction between market participants at the measurement date. U.S. GAAP establishes a framework for measuring fair value, and a three-level hierarchy for fair value measurements based upon the transparency of inputs to the valuation of an asset or liability (including those valued based on their market values as described in Note A.1 above). Inputs may be observable or unobservable and refer broadly to the assumptions that market participants would use in pricing the asset or liability. Observable inputs reflect the assumptions market participants would use in pricing the asset or liability based on market data obtained from sources independent of the Fund. Unobservable inputs reflect the Fund’s own assumptions about the assumptions that market participants would use in pricing the asset or liability based on the best information available in the circumstances. Each investment is assigned a level based upon the observability of the inputs which are significant to the overall valuation. The three-tier hierarchy of inputs is summarized below.
| | • | | Level 1—quoted prices in active markets for identical investments |
| | • | | Level 2—other significant observable inputs (including quoted prices for similar investments, interest rates, prepayment speeds, credit risk, etc.) |
| | |
| |
| abfunds.com | | AB GLOBAL RISK ALLOCATION FUND | 29 |
NOTES TO CONSOLIDATED FINANCIAL STATEMENTS (continued)
| | • | | Level 3—significant unobservable inputs (including the Fund’s own assumptions in determining the fair value of investments) |
The fair value of debt instruments, such as bonds, and over-the-counter derivatives is generally based on market price quotations, recently executed market transactions (where observable) or industry recognized modeling techniques and are generally classified as Level 2. Pricing vendor inputs to Level 2 valuations may include quoted prices for similar investments in active markets, interest rate curves, coupon rates, currency rates, yield curves, option adjusted spreads, default rates, credit spreads and other unique security features in order to estimate the relevant cash flows which are then discounted to calculate fair values. If these inputs are unobservable and significant to the fair value, these investments will be classified as Level 3.
Where readily available market prices or relevant bid prices are not available for certain equity investments, such investments may be valued based on similar publicly traded investments, movements in relevant indices since last available prices or based upon underlying company fundamentals and comparable company data (such as multiples to earnings or other multiples to equity). Where an investment is valued using an observable input, such as another publicly traded security, the investment will be classified as Level 2. If management determines that an adjustment is appropriate based on restrictions on resale, illiquidity or uncertainty, and such adjustment is a significant component of the valuation, the investment will be classified as Level 3. An investment will also be classified as Level 3 where management uses company fundamentals and other significant inputs to determine the valuation.
Valuations of mortgage-backed or other asset-backed securities, by pricing vendors, are based on both proprietary and industry recognized models and discounted cash flow techniques. Significant inputs to the valuation of these instruments are value of the collateral, the rates and timing of delinquencies, the rates and timing of prepayments, and default and loss expectations, which are driven in part by housing prices for residential mortgages. Significant inputs are determined based on relative value analyses, which incorporate comparisons to instruments with similar collateral and risk profiles, including relevant indices. Mortgage and asset-backed securities for which management has collected current observable data through pricing services are generally categorized within Level 2. Those investments for which current observable data has not been provided are classified as Level 3.
Other fixed income investments, including non-U.S. government and corporate debt, are generally valued using quoted market prices, if available,
| | |
| |
30 | AB GLOBAL RISK ALLOCATION FUND | | abfunds.com |
NOTES TO CONSOLIDATED FINANCIAL STATEMENTS (continued)
which are typically impacted by current interest rates, maturity dates and any perceived credit risk of the issuer. Additionally, in the absence of quoted market prices, these inputs are used by pricing vendors to derive a valuation based upon industry or proprietary models which incorporate issuer specific data with relevant yield/spread comparisons with more widely quoted bonds with similar key characteristics. Those investments for which there are observable inputs are classified as Level 2. Where the inputs are not observable, the investments are classified as Level 3.
The following table summarizes the valuation of the Fund’s investments by the above fair value hierarchy levels as of May 31, 2024:
| | | | | | | | | | | | | | | | |
Investments in
Securities: | | Level 1 | | | Level 2 | | | Level 3 | | | Total | |
Assets: | |
Inflation-Linked Securities | | $ | – 0 | – | | $ | 55,838,089 | | | $ | – 0 | – | | $ | 55,838,089 | |
Governments – Treasuries | | | – 0 | – | | | 30,519,289 | | | | – 0 | – | | | 30,519,289 | |
Investment Companies | | | 26,516,485 | | | | – 0 | – | | | 0 | (a) | | | 26,516,485 | |
Common Stocks: | | | | | | | | | | | | | | | | |
Financials | | | 51,232 | | | | 3,171,250 | | | | 53,593 | | | | 3,276,075 | |
Health Care | | | 54,359 | | | | 2,054,619 | | | | – 0 | – | | | 2,108,978 | |
Industrials | | | 39,136 | | | | 1,984,217 | | | | 12,391 | | | | 2,035,744 | |
Consumer Staples | | | 808 | | | | 1,727,229 | | | | – 0 | – | | | 1,728,037 | |
Materials | | | 59,399 | | | | 1,518,909 | | | | 63,718 | | | | 1,642,026 | |
Utilities | | | – 0 | – | | | 1,600,554 | | | | – 0 | – | | | 1,600,554 | |
Consumer Discretionary | | | 6 | | | | 1,489,475 | | | | – 0 | – | | | 1,489,481 | |
Energy | | | 1,013 | | | | 1,126,732 | | | | 926 | | | | 1,128,671 | |
Information Technology | | | 140,404 | | | | 853,104 | | | | – 0 | – | | | 993,508 | |
Communication Services | | | 139,397 | | | | 652,789 | | | | 11,894 | | | | 804,080 | |
Real Estate | | | 10,042 | | | | 371,778 | | | | – 0 | – | | | 381,820 | |
Governments – Sovereign Bonds | | | – 0 | – | | | 1,147,585 | | | | – 0 | – | | | 1,147,585 | |
Rights | | | 720 | | | | – 0 | – | | | – 0 | – | | | 720 | |
Warrants | | | – 0 | – | | | – 0 | – | | | 0 | (a) | | | – 0 | – |
Short-Term Investments: | | | | | | | | | | | | | | | | |
U.S. Treasury Bills | | | – 0 | – | | | 22,267,448 | | | | – 0 | – | | | 22,267,448 | |
Investment Companies | | | 13,309,575 | | | | – 0 | – | | | – 0 | – | | | 13,309,575 | |
Investments of Cash Collateral for Securities Loaned in Affiliated Money Market Fund | | | 366,822 | | | | – 0 | – | | | – 0 | – | | | 366,822 | |
| | | | | | | | | | | | | | | | |
Total Investments in Securities | | | 40,689,398 | | | | 126,323,067 | | | | 142,522 | (a) | | | 167,154,987 | |
Other Financial Instruments(b): | | | | | | | | | | | | | | | | |
Assets: | |
Futures | | | 1,403,108 | | | | – 0 | – | | | – 0 | – | | | 1,403,108 | (c) |
Forward Currency Exchange Contracts | | | – 0 | – | | | 2,679,339 | | | | – 0 | – | | | 2,679,339 | |
Centrally Cleared Credit Default Swaps | | | – 0 | – | | | 678,161 | | | | – 0 | – | | | 678,161 | (c) |
Centrally Cleared Interest Rate Swaps | | | – 0 | – | | | 999,790 | | | | – 0 | – | | | 999,790 | (c) |
| | |
| |
| abfunds.com | | AB GLOBAL RISK ALLOCATION FUND | 31 |
NOTES TO CONSOLIDATED FINANCIAL STATEMENTS (continued)
| | | | | | | | | | | | | | | | |
Investments in
Securities: | | Level 1 | | | Level 2 | | | Level 3 | | | Total | |
Liabilities: | |
Futures | | $ | (1,264,064 | ) | | $ | – 0 | – | | $ | – 0 | – | | $ | (1,264,064 | )(c) |
Forward Currency Exchange Contracts | | | – 0 | – | | | (2,666,712 | ) | | | – 0 | – | | | (2,666,712 | ) |
Centrally Cleared Interest Rate Swaps | | | – 0 | – | | | (3,036,965 | ) | | | – 0 | – | | | (3,036,965 | )(c) |
| | | | | | | | | | | | | | | | |
Total | | $ | 40,828,442 | | | $ | 124,976,680 | | | $ | 142,522 | (a) | | $ | 165,947,644 | |
| | | | | | | | | | | | | | | | |
| (a) | The Fund held securities with zero market value at period end. |
| (b) | Other financial instruments include reverse repurchase agreements and derivative instruments, such as futures, forwards and swaps. Derivative instruments are valued at the unrealized appreciation (depreciation) on the instrument. Other financial instruments may also include swaps with upfront premiums, written options and written swaptions which are valued at market value. |
| (c) | Only variation margin receivable (payable) at period end is reported within the consolidated statement of assets and liabilities. This amount reflects cumulative unrealized appreciation (depreciation) on futures and centrally cleared swaps as reported in the consolidated portfolio of investments. Where applicable, centrally cleared swaps with upfront premiums are presented here at market value. |
3. Currency Translation
Assets and liabilities denominated in foreign currencies and commitments under forward currency exchange contracts are translated into U.S. dollars at the mean of the quoted bid and ask prices of such currencies against the U.S. dollar. Purchases and sales of portfolio securities are translated into U.S. dollars at the rates of exchange prevailing when such securities were acquired or sold. Income and expenses are translated into U.S. dollars at rates of exchange prevailing when accrued.
Net realized gain or loss on foreign currency transactions represents foreign exchange gains and losses from sales and maturities of foreign fixed income investments, holding of foreign currencies, currency gains or losses realized between the trade and settlement dates on foreign investment transactions, and the difference between the amounts of dividends, interest and foreign withholding taxes recorded on the Fund’s books and the U.S. dollar equivalent amounts actually received or paid. Net unrealized currency gains and losses from valuing foreign currency denominated assets and liabilities at period end exchange rates are reflected as a component of net unrealized appreciation or depreciation of foreign currency denominated assets and liabilities.
4. Taxes
It is the Fund’s policy to meet the requirements of the Internal Revenue Code applicable to regulated investment companies and to distribute all of its investment company taxable income and net realized gains, if any, to shareholders. Therefore, no provisions for federal income or excise taxes are required. The Fund may be subject to taxes imposed by countries in which it invests. Such taxes are generally based on income and/or capital gains earned or repatriated. Taxes are accrued and applied to net investment income, net realized gains and net unrealized appreciation/depreciation as such income and/or gains are earned.
| | |
| |
32 | AB GLOBAL RISK ALLOCATION FUND | | abfunds.com |
NOTES TO CONSOLIDATED FINANCIAL STATEMENTS (continued)
If, during a taxable year, the Subsidiary’s taxable losses (and other deductible items) exceed its income and gains, the net loss will not pass through to the Fund as a deductible amount for federal income tax purposes. Note that the loss from the Subsidiary’s contemplated activities also cannot be carried forward to reduce future Subsidiary’s income in subsequent years. However, if the Subsidiary’s taxable gains exceed its losses and other deductible items during a taxable year, the net gain will pass through to the Fund as income for federal income tax purposes.
In accordance with U.S. GAAP requirements regarding accounting for uncertainties in income taxes, management has analyzed the Fund’s tax positions taken or expected to be taken on federal and state income tax returns for all open tax years (the current and the prior three tax years) and has concluded that no provision for income tax is required in the Fund’s consolidated financial statements.
5. Investment Income and Investment Transactions
Dividend income is recorded on the ex-dividend date or as soon as the Fund is informed of the dividend. Interest income is accrued daily. Investment transactions are accounted for on the date the securities are purchased or sold. Investment gains or losses are determined on the identified cost basis. Non-cash dividends, if any, are recorded on the ex-dividend date at the fair value of the securities received. The Fund amortizes premiums and accretes discounts as adjustments to interest income. The Fund accounts for distributions received from real estate investment trust (“REIT”) investments or from regulated investment companies as dividend income, realized gain, or return of capital based on information provided by the REIT or the investment company.
6. Class Allocations
All income earned and expenses incurred by the Fund are borne on a pro-rata basis by each outstanding class of shares, based on the proportionate interest in the Fund represented by the net assets of such class, except for class specific expenses which are allocated to the respective class. Realized and unrealized gains and losses are allocated among the various share classes based on respective net assets.
7. Dividends and Distributions
Dividends and distributions to shareholders, if any, are recorded on the ex-dividend date. Income dividends and capital gains distributions are determined in accordance with federal tax regulations and may differ from those determined in accordance with U.S. GAAP. To the extent these differences are permanent, such amounts are reclassified within the capital accounts based on their federal tax basis treatment; temporary differences do not require such reclassification.
| | |
| |
| abfunds.com | | AB GLOBAL RISK ALLOCATION FUND | 33 |
NOTES TO CONSOLIDATED FINANCIAL STATEMENTS (continued)
8. Cash and Short-Term Investments
Cash and short-term investments include cash on hand and short-term investments with maturities of less than one year when purchased.
NOTE B
Advisory Fee and Other Transactions with Affiliates
Under the terms of the investment advisory agreement, the Fund pays the Adviser an advisory fee at an annual rate of .60% of the first $200 million, .50% of the next $200 million and .40% in excess of $400 million of the Fund’s average daily net assets. The fee is accrued daily and paid monthly.
The Subsidiary has entered into a separate agreement with the Adviser for the management of the Subsidiary’s portfolio. The Adviser receives no compensation from the Subsidiary for its services under the agreement.
Pursuant to the investment advisory agreement, the Fund may reimburse the Adviser for certain legal and accounting services provided to the Fund by the Adviser. For the six months ended May 31, 2024, the reimbursement for such services amounted to $51,714.
The Fund compensates AllianceBernstein Investor Services, Inc. (“ABIS”), a wholly-owned subsidiary of the Adviser, under a Transfer Agency Agreement for providing personnel and facilities to perform transfer agency services for the Fund. ABIS may make payments to intermediaries that provide omnibus account services, sub-accounting services and/or networking services. Such compensation retained by ABIS amounted to $52,594 for the six months ended May 31, 2024.
AllianceBernstein Investments, Inc. (the “Distributor”), a wholly-owned subsidiary of the Adviser, serves as the distributor of the Fund’s shares. The Distributor has advised the Fund that it has retained front-end sales charges of $712 from the sale of Class A shares and received $91 and $0 in contingent deferred sales charges imposed upon redemptions by shareholders of Class A and Class C shares, respectively, for the six months ended May 31, 2024.
The Fund may invest in AB Government Money Market Portfolio (the “Government Money Market Portfolio”) which has a contractual annual advisory fee rate of .20% of the portfolio’s average daily net assets and bears its own expenses. The Adviser had contractually agreed to waive .10% of the advisory fee of Government Money Market Portfolio (resulting in a net advisory fee of .10%) until August 31, 2023. Effective September 1, 2023, the Adviser has contractually agreed to waive .05% of the advisory fee of Government Money Market Portfolio (resulting in a net
| | |
| |
34 | AB GLOBAL RISK ALLOCATION FUND | | abfunds.com |
NOTES TO CONSOLIDATED FINANCIAL STATEMENTS (continued)
advisory fee of .15%) until August 31, 2024. In connection with the investment by the Fund in Government Money Market Portfolio, the Adviser has contractually agreed to waive its advisory fee from the Fund in an amount equal to the Fund’s pro rata share of the effective advisory fee of Government Money Market Portfolio, as borne indirectly by the Fund as an acquired fund fee and expense. For the six months ended May 31, 2024, such waiver amounted to $10,582.
A summary of the Fund’s transactions in AB mutual funds for the six months ended May 31, 2024 is as follows:
| | | | | | | | | | | | | | | | | | | | |
Fund | | Market Value
11/30/23
(000) | | | Purchases
at Cost
(000) | | | Sales
Proceeds
(000) | | | Market Value
5/31/24
(000) | | | Dividend
Income
(000) | |
Government Money Market Portfolio | | $ | 15,016 | | | $ | 66,235 | | | $ | 67,942 | | | $ | 13,309 | | | $ | 380 | |
Government Money Market Portfolio* | | | 72 | | | | 52,340 | | | | 52,045 | | | | 367 | | | | 2 | |
| | | | | | | | | | | | | | | | | | | | |
Total | | | | | | | | | | | | | | $ | 13,676 | | | $ | 382 | |
| | | | | | | | | | | | | | | | | | | | |
| * | Investments of cash collateral for securities lending transactions (see Note E). |
NOTE C
Distribution Services Agreement
The Fund has adopted a Distribution Services Agreement (the “Agreement”) pursuant to Rule 12b-1 under the 1940 Act. Under the Agreement, the Fund pays distribution and servicing fees to the Distributor at an annual rate of up to .30% of the Fund’s average daily net assets attributable to Class A shares, 1% of the Fund’s average daily net assets attributable to Class C shares, .50% of the Fund’s average daily net assets attributable to Class R shares and .25% of the Fund’s average daily net assets attributable to Class K shares. There are no distribution and servicing fees on the Advisor Class and Class I shares. The fees are accrued daily and paid monthly. Payments under the Agreement in respect of Class A shares are currently limited to an annual rate of .25% of Class A shares’ average daily net assets. The Agreement provides that the Distributor will use such payments in their entirety for distribution assistance and promotional activities. Since the commencement of the Fund’s operations, the Distributor has incurred expenses in excess of the distribution costs reimbursed by the Fund in the amounts of $3,499,876, $427,530 and $260,946 for Class C, Class R and Class K shares, respectively. While such costs may be recovered from the Fund in future periods so long as the Agreement is in effect, the rate of the distribution and servicing fees payable under the Agreement may not be
| | |
| |
| abfunds.com | | AB GLOBAL RISK ALLOCATION FUND | 35 |
NOTES TO CONSOLIDATED FINANCIAL STATEMENTS (continued)
increased without a shareholder vote. In accordance with the Agreement, there is no provision for recovery of unreimbursed distribution costs incurred by the Distributor beyond the current fiscal year for Class A shares. The Agreement also provides that the Adviser may use its own resources to finance the distribution of the Fund’s shares.
NOTE D
Investment Transactions
Purchases and sales of investment securities (excluding short-term investments) for the six months ended May 31, 2024 were as follows:
| | | | | | | | |
| | | Purchases | | | Sales | |
Investment securities (excluding U.S. government securities) | | $ | 27,869,553 | | | $ | 32,372,907 | |
U.S. government securities | | | – 0 | – | | | 30,167,854 | |
The cost of investments for federal income tax purposes was substantially the same as the cost for financial reporting purposes. Accordingly, gross unrealized appreciation and unrealized depreciation are as follows:
| | | | |
Gross unrealized appreciation | | $ | 12,916,473 | |
Gross unrealized depreciation | | | (12,211,044 | ) |
| | | | |
Net unrealized appreciation | | $ | 705,429 | |
| | | | |
1. Derivative Financial Instruments
The Fund may use derivatives in an effort to earn income and enhance returns, to replace more traditional direct investments, to obtain exposure to otherwise inaccessible markets (collectively, “investment purposes”), or to hedge or adjust the risk profile of its portfolio.
The principal types of derivatives utilized by the Fund, as well as the methods in which they may be used are:
The Fund may buy or sell futures for investment purposes or for the purpose of hedging its portfolio against adverse effects of potential movements in the market. The Fund bears the market risk that arises from changes in the value of these instruments and the imperfect correlation between movements in the price of the futures and movements in the price of the assets, reference rates or indices which they are designed to track. Among other things, the Fund may purchase or sell futures for foreign currencies or options thereon for non-hedging purposes as a means of making direct investment in foreign currencies, as described below under “Currency Transactions”.
| | |
| |
36 | AB GLOBAL RISK ALLOCATION FUND | | abfunds.com |
NOTES TO CONSOLIDATED FINANCIAL STATEMENTS (continued)
At the time the Fund enters into futures, the Fund deposits with the broker or segregates at its custodian cash or securities as collateral to satisfy initial margin requirements set by the exchange on which the transaction is effected. Pursuant to the contract, with respect to cash collateral, the Fund agrees to receive from or pay to the broker an amount of cash equal to the daily fluctuation in the value of the contract; in the case of securities collateral, the Fund agrees to adjust the securities position held in the segregated account accordingly. Such receipts, payments or adjustments are known as variation margin and are recorded by the Fund as unrealized gains or losses. Risks may arise from the potential inability of a counterparty to meet the terms of the contract. The credit/counterparty risk for exchange-traded futures is generally less than privately negotiated futures, since the clearinghouse, which is the issuer or counterparty to each exchange-traded future, has robust risk mitigation standards, including the requirement to provide initial and variation margin. When the contract is closed, the Fund records a realized gain or loss equal to the difference between the value of the contract at the time it was opened and the time it was closed.
Use of long futures subjects the Fund to risk of loss in excess of the amounts shown on the consolidated statement of assets and liabilities, up to the notional value of the futures. Use of short futures subjects the Fund to unlimited risk of loss. Under some circumstances, futures exchanges may establish daily limits on the amount that the price of futures can vary from the previous day’s settlement price, which could effectively prevent liquidation of unfavorable positions.
During the six months ended May 31, 2024, the Fund held futures for hedging and non-hedging purposes.
| | • | | Forward Currency Exchange Contracts |
The Fund may enter into forward currency exchange contracts in order to hedge its exposure to changes in foreign currency exchange rates on its foreign portfolio holdings, to hedge certain firm purchase and sale commitments denominated in foreign currencies and for non-hedging purposes as a means of making direct investments in foreign currencies, as described below under “Currency Transactions”.
A forward currency exchange contract is a commitment to purchase or sell a foreign currency at a future date at a negotiated forward rate. The gain or loss arising from the difference between the original contract and the closing of such contract would be included in net realized gain or loss on forward currency exchange contracts. Fluctuations in the value of open forward currency exchange contracts are recorded for financial reporting purposes as unrealized appreciation and/or depreciation by the Fund. Risks may arise from the
| | |
| |
| abfunds.com | | AB GLOBAL RISK ALLOCATION FUND | 37 |
NOTES TO CONSOLIDATED FINANCIAL STATEMENTS (continued)
potential inability of a counterparty to meet the terms of a contract and from unanticipated movements in the value of a foreign currency relative to the U.S. dollar.
During the six months ended May 31, 2024, the Fund held forward currency exchange contracts for hedging and non-hedging purposes.
For hedging and investment purposes, the Fund may purchase and write (sell) put and call options on U.S. and foreign securities, including government securities, and foreign currencies that are traded on U.S. and foreign securities exchanges and over-the-counter markets. Among other things, the Fund may use options transactions for non-hedging purposes as a means of making direct investments in foreign currencies, as described below under “Currency Transactions” and may use options strategies involving the purchase and/or writing of various combinations of call and/or put options, for hedging and investment purposes.
The risk associated with purchasing an option is that the Fund pays a premium whether or not the option is exercised. Additionally, the Fund bears the risk of loss of the premium and change in market value should the counterparty not perform under the contract. If a put or call purchased option by the Fund were permitted to expire without being sold or exercised, its premium would represent a loss to the Fund. Put and call purchased options are accounted for in the same manner as portfolio securities. The cost of securities acquired through the exercise of call options is increased by premiums paid. The proceeds from securities sold through the exercise of put options are decreased by the premiums paid.
When the Fund writes an option, the premium received by the Fund is recorded as a liability and is subsequently adjusted to the current market value of the written option. The Fund’s maximum payment for written put options equates to the number of shares multiplied by the strike price. In certain circumstances maximum payout amounts may be partially offset by recovery values of the respective referenced assets and upfront premium received upon entering into the contract. Premiums received from written options which expire unexercised are recorded by the Fund on the expiration date as realized gains from written options. The difference between the premium received and the amount paid on effecting a closing purchase transaction, including brokerage commissions, is also treated as a realized gain, or if the premium received is less than the amount paid for the closing purchase transaction, as a realized loss. If a call option is exercised, the premium received is added to the proceeds from the sale of the underlying security or currency in determining whether the Fund has
| | |
| |
38 | AB GLOBAL RISK ALLOCATION FUND | | abfunds.com |
NOTES TO CONSOLIDATED FINANCIAL STATEMENTS (continued)
realized a gain or loss. If a put option is exercised, the premium received reduces the cost basis of the security or currency purchased by the Fund. In writing an option, the Fund bears the market risk of an unfavorable change in the price of the security or currency underlying the written option. Exercise of the written option by the Fund could result in the Fund selling or buying a security or currency at a price different from the current market value.
During the six months ended May 31, 2024, the Fund held purchased options for hedging and non-hedging purposes. During the six months ended May 31, 2024, the Fund held written options for hedging and non-hedging purposes.
The Fund may enter into swaps for investment purposes or to hedge its exposure to interest rates, credit risk or inflation, equity markets or currencies. The Fund may also enter into swaps for non-hedging purposes as a means of gaining market exposures, making direct investments in foreign currencies, as described below under “Currency Transactions.” A swap is an agreement that obligates two parties to exchange a series of cash flows at specified intervals based upon or calculated by reference to changes in specified prices, rates or indexes for a specified amount of an underlying asset or inflation. The payment flows are usually netted against each other, with the difference being paid by one party to the other. In addition, collateral may be pledged or received by the Fund in accordance with the terms of the respective swaps to provide value and recourse to the Fund or its counterparties in the event of default, bankruptcy or insolvency by one of the parties to the swap.
Risks may arise as a result of the failure of the counterparty to the swap to comply with the terms of the swap. The loss incurred by the failure of a counterparty is generally limited to the net interim payment to be received by the Fund, and/or the termination value at the end of the contract. Therefore, the Fund considers the creditworthiness of each counterparty to a swap in evaluating potential counterparty risk. This risk is mitigated by having a netting arrangement between the Fund and the counterparty and by the posting of collateral by the counterparty to the Fund to cover the Fund’s exposure to the counterparty. Additionally, risks may arise from unanticipated movements in interest rates, inflation or in the value of the underlying securities. The Fund accrues for the interim payments on swaps on a daily basis, with the net amount recorded within unrealized appreciation/(depreciation) of swaps on the consolidated statement of assets and liabilities, where applicable. Once the interim payments are settled in cash, the net amount is recorded as realized gain/(loss) on
| | |
| |
| abfunds.com | | AB GLOBAL RISK ALLOCATION FUND | 39 |
NOTES TO CONSOLIDATED FINANCIAL STATEMENTS (continued)
swaps on the consolidated statement of operations, in addition to any realized gain/(loss) recorded upon the termination of swaps. Upfront premiums paid or received for swaps are recognized as cost or proceeds on the consolidated statement of assets and liabilities and are amortized on a straight line basis over the life of the contract. Amortized upfront premiums are included in net realized gain/(loss) from swaps on the consolidated statement of operations. Fluctuations in the value of swaps are recorded as a component of net change in unrealized appreciation/depreciation of swaps on the consolidated statement of operations.
Certain standardized swaps, including certain interest rate swaps and credit default swaps, are subject to mandatory central clearing. Cleared swaps are transacted through futures commission merchants (“FCMs”) that are members of central clearinghouses, with the clearinghouse serving as central counterparty, similar to transactions in futures contracts. Centralized clearing will be required for additional categories of swaps on a phased-in basis based on requirements published by the Securities and Exchange Commission and Commodity Futures Trading Commission.
At the time the Fund enters into a centrally cleared swap, the Fund deposits with the broker or segregates at its custodian cash or securities as collateral to satisfy initial margin requirements set by the clearinghouse on which the transaction is effected. Pursuant to the contract, with respect to cash collateral, the Fund agrees to receive from or pay to the broker an amount of cash equal to the daily fluctuation in the value of the contract; in the case of securities collateral, the Fund agrees to adjust the securities position held in the segregated account accordingly. Such receipts, payments or adjustments are known as variation margin and are recorded by the Fund as unrealized gains or losses. Risks may arise from the potential inability of a counterparty to meet the terms of the contract. The credit/counterparty risk for centrally cleared swaps is generally less than non-centrally cleared swaps, since the clearinghouse, which is the issuer or counterparty to each centrally cleared swap, has robust risk mitigation standards, including the requirement to provide initial and variation margin. When the contract is closed, the Fund records a realized gain or loss equal to the difference between the value of the contract at the time it was opened and the time it was closed.
Interest Rate Swaps:
The Fund is subject to interest rate risk exposure in the normal course of pursuing its investment objectives. Because the Fund holds fixed rate bonds, the value of these bonds may decrease if interest rates rise. To help hedge against this risk and to maintain its ability to
| | |
| |
40 | AB GLOBAL RISK ALLOCATION FUND | | abfunds.com |
NOTES TO CONSOLIDATED FINANCIAL STATEMENTS (continued)
generate income at prevailing market rates, the Fund may enter into interest rate swaps. Interest rate swaps are agreements between two parties to exchange cash flows based on a notional amount. The Fund may elect to pay a fixed rate and receive a floating rate, or, receive a fixed rate and pay a floating rate on a notional amount.
In addition, the Fund may also enter into interest rate swap transactions to preserve a return or spread on a particular investment or portion of its portfolio, or protecting against an increase in the price of securities the Fund anticipates purchasing at a later date. Interest rate swaps involve the exchange by the Fund with another party of their respective commitments to pay or receive interest (e.g., an exchange of floating rate payments for fixed rate payments) computed based on a contractually-based principal (or “notional”) amount. Interest rate swaps are entered into on a net basis (i.e., the two payment streams are netted out, with the Fund receiving or paying, as the case may be, only the net amount of the two payments).
During the six months ended May 31, 2024, the Fund held interest rate swaps for hedging and non-hedging purposes.
Credit Default Swaps:
The Fund may enter into credit default swaps, including to manage its exposure to the market or certain sectors of the market, to reduce its risk exposure to defaults by corporate and sovereign issuers held by the Fund, or to create exposure to corporate or sovereign issuers to which it is not otherwise exposed. The Fund may purchase credit protection (“Buy Contract”) or provide credit protection (“Sale Contract”) on the referenced obligation of the credit default swap. During the term of the swap, the Fund receives/(pays) fixed payments from/(to) the respective counterparty, calculated at the agreed upon rate applied to the notional amount. If the Fund is a buyer/(seller) of protection and a credit event occurs, as defined under the terms of the swap, the Fund will either (i) receive from the seller/(pay to the buyer) of protection an amount equal to the notional amount of the swap (the “Maximum Payout Amount”) and deliver/(take delivery of) the referenced obligation or (ii) receive/(pay) a net settlement amount in the form of cash or securities equal to the notional amount of the swap less the recovery value of the referenced obligation. In certain circumstances Maximum Payout Amounts may be partially offset by recovery values of the respective referenced obligations, upfront premium received upon entering into the agreement, or net amounts received from settlement of buy protection credit default swaps entered into by the Fund for the same referenced obligations with the same counterparty.
Credit default swaps may involve greater risks than if the Fund had invested in the referenced obligation directly. Credit default swaps are
| | |
| |
| abfunds.com | | AB GLOBAL RISK ALLOCATION FUND | 41 |
NOTES TO CONSOLIDATED FINANCIAL STATEMENTS (continued)
subject to general market risk, liquidity risk, counterparty risk and credit risk. If the Fund is a buyer of protection and no credit event occurs, it will lose the payments it made to its counterparty. If the Fund is a seller of protection and a credit event occurs, the value of the referenced obligation received by the Fund coupled with the periodic payments previously received, may be less than the Maximum Payout Amount it pays to the buyer, resulting in a net loss to the Fund.
Implied credit spreads over U.S. Treasuries of comparable maturity utilized in determining the market value of credit default swaps on issuers as of period end are disclosed in the portfolio of investments. The implied spreads serve as an indicator of the current status of the payment/performance risk and typically reflect the likelihood of default by the issuer of the referenced obligation. The implied credit spread of a particular reference obligation also reflects the cost of buying/selling protection and may reflect upfront payments required to be made to enter into the agreement. Widening credit spreads typically represent a deterioration of the referenced obligation’s credit soundness and greater likelihood of default or other credit event occurring as defined under the terms of the agreement. A credit spread identified as “Defaulted” indicates a credit event has occurred for the referenced obligation.
During the six months ended May 31, 2024, the Fund held credit default swaps for hedging and non-hedging purposes.
The Fund typically enters into International Swaps and Derivatives Association, Inc. Master Agreements (“ISDA Master Agreement”) with its OTC derivative contract counterparties in order to, among other things, reduce its credit risk to OTC counterparties. ISDA Master Agreements include provisions for general obligations, representations, collateral and events of default or termination. Under an ISDA Master Agreement, the Fund typically may offset with the OTC counterparty certain derivative financial instruments’ payables and/or receivables with collateral held and/or posted and create one single net payment (close-out netting) in the event of default or termination. In the event of a default by an OTC counterparty, the return of collateral with market value in excess of the Fund’s net liability, held by the defaulting party, may be delayed or denied.
The Fund’s ISDA Master Agreements may contain provisions for early termination of OTC derivative transactions in the event the net assets of the Fund decline below specific levels (“net asset contingent features”). If these levels are triggered, the Fund’s OTC counterparty has the right to terminate such transaction and require the Fund to pay or receive a settlement amount in connection with the terminated transaction. If OTC
| | |
| |
42 | AB GLOBAL RISK ALLOCATION FUND | | abfunds.com |
NOTES TO CONSOLIDATED FINANCIAL STATEMENTS (continued)
derivatives were held at period end, please refer to netting arrangements by the OTC counterparty table below for additional details.
During the six months ended May 31, 2024, the Fund had entered into the following derivatives:
| | | | | | | | | | | | |
| | | Asset Derivatives | | | Liability Derivatives | |
Derivative Type | | Consolidated
Statement of
Assets and
Liabilities
Location | | Fair Value | | | Consolidated
Statement of
Assets and
Liabilities
Location | | Fair Value | |
Interest rate contracts | | Receivable for variation margin on futures | | $ | 361,175 | * | | Payable for variation margin on futures | | $ | 452,241 | * |
| | | | |
Equity contracts | | Receivable for variation margin on futures | | | 561,674 | * | | Payable for variation margin on futures | | | 59,204 | * |
| | | | |
Commodity contracts | | Receivable for variation margin on futures | | | 480,259 | * | | Payable for variation margin on futures | | | 752,619 | * |
| | | | |
Credit contracts | | Receivable for variation margin on centrally cleared swaps | | | 92,073 | * | | | | | | |
| | | | |
Interest rate contracts | | Receivable for variation margin on centrally cleared swaps | | | 626,543 | * | | Payable for variation margin on centrally cleared swaps | | | 3,877,717 | * |
| | | | |
Foreign currency contracts | | Unrealized appreciation on forward currency exchange contracts | | | 2,679,339 | | | Unrealized depreciation on forward currency exchange contracts | | | 2,666,712 | |
| | | | | | | | | | | | |
Total | | | | $ | 4,801,063 | | | | | $ | 7,808,493 | |
| | | | | | | | | | | | |
| | | | | | |
* Only variation margin receivable/payable at period end is reported within the consolidated statement of assets and liabilities. This amount reflects cumulative unrealized appreciation (depreciation) on futures and centrally cleared swaps as reported in the consolidated portfolio of investments. |
| | |
| |
| abfunds.com | | AB GLOBAL RISK ALLOCATION FUND | 43 |
NOTES TO CONSOLIDATED FINANCIAL STATEMENTS (continued)
| | | | | | | | | | |
Derivative Type | | Location of
Gain or (Loss)
on Derivatives
Within Consolidated
Statement of
Operations | | Realized Gain
or (Loss) on
Derivatives | | | Change in
Unrealized
Appreciation or
(Depreciation) | |
Interest rate contracts | | Net realized gain (loss) on futures; Net change in unrealized appreciation (depreciation) of futures | | $ | (1,097,010 | ) | | $ | (688,397 | ) |
| | | |
Equity contracts | | Net realized gain (loss) on futures; Net change in unrealized appreciation (depreciation) of futures | | | 4,642,979 | | | | 378,953 | |
| | | |
Commodity contracts | | Net realized gain (loss) on futures; Net change in unrealized appreciation (depreciation) of futures | | | 461,836 | | | | 34,069 | |
| | | |
Foreign currency contracts | | Net realized gain (loss) on forward currency exchange contracts; Net change in unrealized appreciation (depreciation) of forward currency exchange contracts | | | 1,530,772 | | | | 927,458 | |
| | | |
Equity contracts | | Net realized gain (loss) on investment transactions; Net change in unrealized appreciation (depreciation) of investments | | | (155,373 | ) | | | – 0 | – |
| | | |
Equity contracts | | Net realized gain (loss) on options written; Net change in unrealized appreciation (depreciation) of options written | | | 77,437 | | | | – 0 | – |
| | | |
Interest rate contracts | | Net realized gain (loss) on swaps; Net change in unrealized appreciation (depreciation) of swaps | | | (1,734,802 | ) | | | 1,252,422 | |
| | | |
Credit contracts | | Net realized gain (loss) on swaps; Net change in unrealized appreciation (depreciation) of swaps | | | 1,444,088 | | | | (599,751 | ) |
| | | | | | | | | | |
Total | | | | $ | 5,169,927 | | | $ | 1,304,754 | |
| | | | | | | | | | |
| | |
| |
44 | AB GLOBAL RISK ALLOCATION FUND | | abfunds.com |
NOTES TO CONSOLIDATED FINANCIAL STATEMENTS (continued)
The following table represents the average monthly volume of the Fund’s derivative transactions during the six months ended May 31, 2024:
| | | | |
Futures: | | | | |
Average notional amount of buy contracts | | $ | 171,028,810 | |
Average notional amount of sale contracts | | $ | 20,602,488 | |
Forward Currency Exchange Contracts: | | | | |
Average principal amount of buy contracts | | $ | 160,294,307 | |
Average principal amount of sale contracts | | $ | 207,340,842 | |
Purchased Options: | | | | |
Average notional amount | | $ | 14,337,500 | (a) |
Options Written: | | | | |
Average notional amount | | $ | 13,795,000 | (a) |
Centrally Cleared Interest Rate Swaps: | | | | |
Average notional amount | | $ | 83,741,531 | |
Centrally Cleared Credit Default Swaps: | | | | |
Average notional amount of sale contracts | | $ | 14,665,257 | |
| (a) | Positions were open for two months during the period. |
For financial reporting purposes, the Fund does not offset derivative assets and derivative liabilities that are subject to netting arrangements in the consolidated statement of assets and liabilities.
All OTC derivatives held at period end were subject to netting arrangements. The following table presents the Fund’s derivative assets and liabilities by OTC counterparty net of amounts available for offset under ISDA Master Agreements (“MA”) and net of the related collateral received/pledged by the Fund as of May 31, 2024. Exchange-traded derivatives and centrally cleared swaps are not subject to netting arrangements and as such are excluded from the table.
AB GLOBAL RISK ALLOCATION FUND
| | | | | | | | | | | | | | | | | | | | |
Counterparty | | Derivative
Assets
Subject to a
MA | | | Derivatives
Available
for Offset | | | Cash
Collateral
Received* | | | Security
Collateral
Received* | | | Net Amount
of Derivative
Assets | |
Bank of America, NA | | $ | 391,326 | | | $ | (391,326 | ) | | $ | – 0 | – | | $ | – 0 | – | | $ | – 0 | – |
Barclays Bank PLC | | | 795,794 | | | | (498,929 | ) | | | – 0 | – | | | – 0 | – | | | 296,865 | |
BNP Paribas SA | | | 12,266 | | | | (11,786 | ) | | | – 0 | – | | | – 0 | – | | | 480 | |
Citibank, NA | | | 58,749 | | | | (58,749 | ) | | | – 0 | – | | | – 0 | – | | | – 0 | – |
Deutsche Bank AG | | | 246,288 | | | | (179,924 | ) | | | – 0 | – | | | – 0 | – | | | 66,364 | |
Goldman Sachs Bank USA | | | 170,498 | | | | (103,850 | ) | | | – 0 | – | | | – 0 | – | | | 66,648 | |
HSBC Bank USA | | | 127,477 | | | | (39,965 | ) | | | – 0 | – | | | – 0 | – | | | 87,512 | |
JPMorgan Chase Bank, NA | | | 130,126 | | | | (130,126 | ) | | | – 0 | – | | | – 0 | – | | | – 0 | – |
Morgan Stanley Capital Services, Inc. | | | 410,595 | | | | (410,595 | ) | | | – 0 | – | | | – 0 | – | | | – 0 | – |
State Street Bank & Trust Co. | | | 254,115 | | | | (203,207 | ) | | | – 0 | – | | | – 0 | – | | | 50,908 | |
| | |
| |
| abfunds.com | | AB GLOBAL RISK ALLOCATION FUND | 45 |
NOTES TO CONSOLIDATED FINANCIAL STATEMENTS (continued)
| | | | | | | | | | | | | | | | | | | | |
Counterparty | | Derivative
Assets
Subject to a
MA | | | Derivatives
Available
for Offset | | | Cash
Collateral
Received* | | | Security
Collateral
Received* | | | Net Amount
of Derivative
Assets | |
UBS AG | | $ | 82,105 | | | $ | (1,364 | ) | | $ | – 0 | – | | $ | – 0 | – | | $ | 80,741 | |
| | | | | | | | | | | | | | | | | | | | |
Total | | $ | 2,679,339 | | | $ | (2,029,821 | ) | | $ | – 0 | – | | $ | – 0 | – | | $ | 649,518 | ^ |
| | | | | | | | | | | | | | | | | | | | |
| | | | | |
Counterparty | | Derivative
Liabilities
Subject to a
MA | | | Derivatives
Available
for Offset | | | Cash
Collateral
Pledged* | | | Security
Collateral
Pledged* | | | Net Amount
of Derivative
Liabilities | |
Bank of America, NA | | $ | 577,006 | | | $ | (391,326 | ) | | $ | – 0 | – | | $ | – 0 | – | | $ | 185,680 | |
Barclays Bank PLC | | | 498,929 | | | | (498,929 | ) | | | – 0 | – | | | – 0 | – | | | – 0 | – |
BNP Paribas SA | | | 11,786 | | | | (11,786 | ) | | | – 0 | – | | | – 0 | – | | | – 0 | – |
Citibank, NA | | | 63,320 | | | | (58,749 | ) | | | – 0 | – | | | – 0 | – | | | 4,571 | |
Deutsche Bank AG | | | 179,924 | | | | (179,924 | ) | | | – 0 | – | | | – 0 | – | | | – 0 | – |
Goldman Sachs Bank USA | | | 103,850 | | | | (103,850 | ) | | | – 0 | – | | | – 0 | – | | | – 0 | – |
HSBC Bank USA | | | 39,965 | | | | (39,965 | ) | | | – 0 | – | | | – 0 | – | | | – 0 | – |
JPMorgan Chase Bank, NA | | | 205,914 | | | | (130,126 | ) | | | – 0 | – | | | – 0 | – | | | 75,788 | |
Morgan Stanley Capital Services, Inc. | | | 589,800 | | | | (410,595 | ) | | | – 0 | – | | | – 0 | – | | | 179,205 | |
Standard Chartered Bank | | | 188,802 | | | | – 0 | – | | | – 0 | – | | | – 0 | – | | | 188,802 | |
State Street Bank & Trust Co. | | | 203,207 | | | | (203,207 | ) | | | – 0 | – | | | – 0 | – | | | – 0 | – |
UBS AG | | | 1,364 | | | | (1,364 | ) | | | – 0 | – | | | – 0 | – | | | – 0 | – |
| | | | | | | | | | | | | | | | | | | | |
Total | | $ | 2,663,867 | | | $ | (2,029,821 | ) | | $ | – 0 | – | | $ | – 0 | – | | $ | 634,046 | ^ |
| | | | | | | | | | | | | | | | | | | | |
| * | The actual collateral received/pledged may be more than the amount reported due to over-collateralization. |
| ^ | Net amount represents the net receivable/payable that would be due from/to the counterparty in the event of default or termination. The net amount from OTC financial derivative instruments can only be netted across transactions governed under the same master agreement with the same counterparty. |
AB CAYMAN GLOBAL RISK ALLOCATION FUND
| | | | | | | | | | | | | | | | | | | | |
Counterparty | | Derivative
Liabilities
Subject to a
MA | | | Derivatives
Available
for Offset | | | Cash
Collateral
Pledged* | | | Security
Collateral
Pledged* | | | Net Amount
of Derivative
Liabilities | |
JPMorgan Chase Bank, NA | | $ | 2,845 | | | $ | – 0 | – | | $ | – 0 | – | | $ | – 0 | – | | $ | 2,845 | |
| | | | | | | | | | | | | | | | | | | | |
Total | | $ | 2,845 | | | $ | – 0 | – | | $ | – 0 | – | | $ | – 0 | – | | $ | 2,845 | ^ |
| | | | | | | | | | | | | | | | | | | | |
| * | The actual collateral received/pledged may be more than the amount reported due to over-collateralization. |
| ^ | Net amount represents the net receivable/payable that would be due from/to the counterparty in the event of default or termination. The net amount from OTC financial derivative instruments can only be netted across transactions governed under the same master agreement with the same counterparty. |
2. Currency Transactions
The Fund may invest in non-U.S. Dollar-denominated securities on a currency hedged or unhedged basis. The Fund may seek investment opportunities by taking long or short positions in currencies through the use of currency-related derivatives, including forward currency exchange contracts, futures and options on futures, swaps, and other options. The Fund may enter into transactions for
| | |
| |
46 | AB GLOBAL RISK ALLOCATION FUND | | abfunds.com |
NOTES TO CONSOLIDATED FINANCIAL STATEMENTS (continued)
investment opportunities when it anticipates that a foreign currency will appreciate or depreciate in value but securities denominated in that currency are not held by the Fund and do not present attractive investment opportunities. Such transactions may also be used when the Adviser believes that it may be more efficient than a direct investment in a foreign currency-denominated security. The Fund may also conduct currency exchange contracts on a spot basis (i.e., for cash at the spot rate prevailing in the currency exchange market for buying or selling currencies).
NOTE E
Securities Lending
The Fund may enter into securities lending transactions. Under the Fund’s securities lending program, all loans of securities will be collateralized continually by cash collateral and/or non-cash collateral. Non-cash collateral will include only securities issued or guaranteed by the U.S. government or its agencies or instrumentalities. If the Fund cannot sell or repledge any non-cash collateral, such collateral will not be reflected in the portfolio of investments. If a loan is collateralized by cash, the Fund will be compensated for the loan from a portion of the net return from the income earned on cash collateral after a rebate is paid to the borrower (in some cases, this rebate may be a “negative rebate” or fee paid by the borrower to the Fund in connection with the loan), and payments are made for fees of the securities lending agent and for certain other administrative expenses. If the Fund receives non-cash collateral, the Fund will receive a fee from the borrower generally equal to a negotiated percentage of the market value of the loaned securities. The Fund will have the right to call a loan and obtain the securities loaned at any time on notice to the borrower within the normal and customary settlement time for the securities. While the securities are on loan, the borrower is obligated to pay the Fund amounts equal to any dividend income or other distributions from the securities; however, these distributions will not be afforded the same preferential tax treatment as qualified dividends. The Fund will not be able to exercise voting rights with respect to any securities during the existence of a loan, but will have the right to regain ownership of loaned securities in order to exercise voting or other ownership rights. Collateral received and securities loaned are marked to market daily to ensure that the securities loaned are secured by collateral. The lending agent currently invests the cash collateral received in Government Money Market Portfolio, an eligible money market vehicle, in accordance with the investment restrictions of the Fund, and as approved by the Board. The collateral received on securities loaned is recorded as an asset as well as a corresponding liability in the consolidated statement of assets and liabilities. The collateral will be adjusted the next business day to maintain the required collateral amount. The amounts of securities lending income from the borrowers and Government Money Market Portfolio are reflected in the consolidated statement of
| | |
| |
| abfunds.com | | AB GLOBAL RISK ALLOCATION FUND | 47 |
NOTES TO CONSOLIDATED FINANCIAL STATEMENTS (continued)
operations. When the Fund earns net securities lending income from Government Money Market Portfolio, the income is inclusive of a rebate expense paid to the borrower. In connection with the cash collateral investment by the Fund in Government Money Market Portfolio, the Adviser has agreed to waive a portion of the Fund’s share of the advisory fees of Government Money Market Portfolio, as borne indirectly by the Fund as an acquired fund fee and expense. When the Fund lends securities, its investment performance will continue to reflect changes in the value of the securities loaned. A principal risk of lending portfolio securities is that the borrower may fail to return the loaned securities upon termination of the loan and that the collateral will not be sufficient to replace the loaned securities. The lending agent has agreed to indemnify the Fund in the case of default of any securities borrower.
A summary of the Fund’s transactions surrounding securities lending for the six months ended May 31, 2024 is as follows:
| | | | | | | | | | | | | | | | | | | | | | |
| | | | | | | | | | | | | Government Money
Market Portfolio | |
Market
Value of
Securities on Loan* | | | Cash
Collateral* | | | Market
Value of
Non-Cash
Collateral* | | | Income from
Borrowers | | | Income
Earned | | | Advisory Fee
Waived | |
| $ | 390,996 | | | $ | 366,822 | | | $ | 34,600 | | | $ | 1,787 | | | $ | 1,780 | | | $ | 838 | |
NOTE F
Capital Stock
Each class consists of 3,000,000,000 authorized shares. Transactions in capital shares for each class were as follows:
| | | | | | | | | | | | | | | | | | | | | | | | |
| | | | | | | | | | | | | | | | | | | | | | | | |
| | | Shares | | | | | | Amount | | | | |
| | | Six Months Ended
May 31, 2024
(unaudited) | | | Year Ended
November 30,
2023 | | | | | | Six Months Ended
May 31, 2024
(unaudited) | | | Year Ended
November 30,
2023 | | | | |
| | | | | | | | |
| Class A | | | | | |
Shares sold | | | 98,717 | | | | 1,026,060 | | | | | | | $ | 1,603,584 | | | $ | 15,851,463 | | | | | |
| | | | | |
Shares issued in reinvestment of dividends and distributions | | | 133,902 | | | | 798,854 | | | | | | | | 2,092,894 | | | | 12,573,958 | | | | | |
| | | | | |
Shares converted from Class C | | | 3,378 | | | | 31,682 | | | | | | | | 54,458 | | | | 497,876 | | | | | |
| | | | | |
Shares redeemed | | | (830,208 | ) | | | (4,052,576 | ) | | | | | | | (13,462,807 | ) | | | (63,825,234 | ) | | | | |
| | | | | |
Net decrease | | | (594,211 | ) | | | (2,195,980 | ) | | | | | | $ | (9,711,871 | ) | | $ | (34,901,937 | ) | | | | |
| | | | | |
| | |
| |
48 | AB GLOBAL RISK ALLOCATION FUND | | abfunds.com |
NOTES TO CONSOLIDATED FINANCIAL STATEMENTS (continued)
| | | | | | | | | | | | | | | | | | | | | | | | |
| | | | | | | | | | | | | | | | | | | | | | | | |
| | | Shares | | | | | | Amount | | | | |
| | | Six Months Ended
May 31, 2024
(unaudited) | | | Year Ended
November 30,
2023 | | | | | | Six Months Ended
May 31, 2024
(unaudited) | | | Year Ended
November 30,
2023 | | | | |
| | | | | | | | | | | | | | | | | | | | | | | | |
| Class C | | | | | |
Shares sold | | | 19,920 | | | | 37,743 | | | | | | | $ | 287,984 | | | $ | 540,411 | | | | | |
| | | | | |
Shares issued in reinvestment of dividends and distributions | | | 1,656 | | | | 12,082 | | | | | | | | 23,215 | | | | 171,686 | | | | | |
| | | | | |
Shares converted to Class A | | | (3,771 | ) | | | (35,244 | ) | | | | | | | (54,458 | ) | | | (497,876 | ) | | | | |
| | | | | |
Shares redeemed | | | (11,987 | ) | | | (30,446 | ) | | | | | | | (172,731 | ) | | | (428,751 | ) | | | | |
| | | | | |
Net increase (decrease) | | | 5,818 | | | | (15,865 | ) | | | | | | $ | 84,010 | | | $ | (214,530 | ) | | | | |
| | | | | |
| | | | | | | | | | | | | | | | | | | | | | | | |
| Advisor Class | | | | | | | | | | | | | | | | | | | | | | | | |
Shares sold | | | 36,823 | | | | 417,368 | | | | | | | $ | 603,881 | | | $ | 6,729,993 | | | | | |
| | | | | |
Shares issued in reinvestment of dividends and distributions | | | 10,931 | | | | 66,962 | | | | | | | | 172,498 | | | | 1,064,694 | | | | | |
| | | | | |
Shares redeemed | | | (197,503 | ) | | | (668,792 | ) | | | | | | | (3,245,495 | ) | | | (10,645,899 | ) | | | | |
| | | | | |
Net decrease | | | (149,749 | ) | | | (184,462 | ) | | | | | | $ | (2,469,116 | ) | | $ | (2,851,212 | ) | | | | |
| | | | | |
| | | | | | | | | | | | | | | | | | | | | | | | |
| Class R | | | | | |
Shares sold | | | 63 | | | | 499 | | | | | | | $ | 1,048 | | | $ | 13,985 | | | | | |
| | | | | |
Shares issued in reinvestment of dividends and distributions | | | 154 | | | | 1,665 | | | | | | | | 2,480 | | | | 26,240 | | | | | |
| | | | | |
Shares redeemed | | | (13,715 | ) | | | (10,633 | ) | | | | | | | (235,106 | ) | | | (168,086 | ) | | | | |
| | | | | |
Net decrease | | | (13,498 | ) | | | (8,469 | ) | | | | | | $ | (231,578 | ) | | $ | (127,861 | ) | | | | |
| | | | | |
| | | | | | | | | | | | | | | | | | | | | | | | |
| Class K | | | | | | | | | | | | | | | | | | | | | | | | |
Shares sold | | | 871 | | | | 5,604 | | | | | | | $ | 14,203 | | | $ | 90,355 | | | | | |
| | | | | |
Shares issued in reinvestment of dividends and distributions | | | 567 | | | | 3,708 | | | | | | | | 8,872 | | | | 58,326 | | | | | |
| | | | | |
Shares redeemed | | | (49,703 | ) | | | (6,725 | ) | | | | | | | (822,852 | ) | | | (105,237 | ) | | | | |
| | | | | |
Net increase (decrease) | | | (48,265 | ) | | | 2,587 | | | | | | | $ | (799,777 | ) | | $ | 43,444 | | | | | |
| | | | | |
| | | | | | | | | | | | | | | | | | | | | | | | |
| Class I | | | | | |
Shares sold | | | 9,371 | | | | 19,026 | | | | | | | $ | 152,663 | | | $ | 303,333 | | | | | |
| | | | | |
Shares issued in reinvestment of dividends and distributions | | | 1,287 | | | | 9,882 | | | | | | | | 20,264 | | | | 156,837 | | | | | |
| | | | | |
Shares redeemed | | | (10,289 | ) | | | (69,346 | ) | | | | | | | (167,753 | ) | | | (1,083,159 | ) | | | | |
| | | | | |
Net increase (decrease) | | | 369 | | | | (40,438 | ) | | | | | | $ | 5,174 | | | $ | (622,989 | ) | | | | |
| | | | | |
| | |
| |
| abfunds.com | | AB GLOBAL RISK ALLOCATION FUND | 49 |
NOTES TO CONSOLIDATED FINANCIAL STATEMENTS (continued)
NOTE G
Risks Involved in Investing in the Fund
Market Risk—The value of the Fund’s assets will fluctuate as the market or markets in which the Fund invests fluctuates. The value of the Fund’s investments may decline, sometimes rapidly and unpredictably, simply because of economic changes or other events, including public health crises (including the occurrence of a contagious disease or illness) and regional and global conflicts, that affect large portions of the market. It includes the risk that a particular style of investing may be underperforming the market generally.
Allocation Risk—The allocation of investments among asset classes may have a significant effect on the Fund’s net asset value, or NAV, when the asset classes in which the Fund has invested more heavily perform worse than the asset classes invested in less heavily.
Interest-Rate Risk—Changes in interest rates will affect the value of investments in fixed-income securities. When interest rates rise, the value of existing investments in fixed-income securities tends to fall and this decrease in value may not be offset by higher income from new investments. Interest-rate risk is generally greater for fixed-income securities with longer maturities or durations. The Fund may be subject to a greater risk of rising interest rates than would normally be the case due to the recent end of a period of historically low rates and the effects of potential central bank monetary policy, and government fiscal policy, initiatives and market reactions to those initiatives.
Credit Risk—An issuer or guarantor of a fixed-income security, or the counterparty to a derivatives or other contract, may be unable or unwilling to make timely payments of interest or principal, or to otherwise honor its obligations. The issuer or guarantor may default, causing a loss of the full principal amount of a security and accrued interest. The degree of risk for a particular security may be reflected in its credit rating. There is the possibility that the credit rating of a fixed-income security may be downgraded after purchase, which may adversely affect the value of the security.
Commodity Risk—Investing in commodities and commodity-linked derivative instruments, either directly or through the Subsidiary, may subject the Fund to greater volatility than investments in traditional securities. The value of commodity-linked derivative instruments may be affected by changes in overall market movements, commodity index volatility, changes in interest rates, or factors affecting a particular industry or commodity, such as drought, floods, weather, livestock disease, embargoes, tariffs and international economic, political and regulatory developments.
| | |
| |
50 | AB GLOBAL RISK ALLOCATION FUND | | abfunds.com |
NOTES TO CONSOLIDATED FINANCIAL STATEMENTS (continued)
Below Investment-Grade Securities Risk—Investments in fixed-income securities with ratings below investment grade, commonly known as “junk bonds”, tend to have a higher probability that an issuer will default or fail to meet its payment obligations. These securities may be subject to greater price volatility due to such factors as specific corporate developments, interest rate sensitivity and negative perceptions of the junk bond market generally and may be more difficult to trade or dispose of than other types of securities.
Foreign (Non-U.S.) Risk—Investments in securities of non-U.S. issuers may involve more risk than those of U.S. issuers. These securities may fluctuate more widely in price and may be more difficult to trade due to adverse market, economic, political, regulatory or other factors.
Currency Risk—Fluctuations in currency exchange rates may negatively affect the value of the Fund’s investments or reduce its returns.
Emerging-Market Risk—Investments in emerging market countries may have more risk because the markets are less developed and less liquid as well as being subject to increased economic, political, regulatory or other uncertainties.
Subsidiary Risk—By investing in the Subsidiary, the Fund is indirectly exposed to the risks associated with the Subsidiary. The derivatives and other investments held by the Subsidiary are generally similar to those that are permitted to be held by the Fund and are subject to the same risks that apply to similar investments if held directly by the Fund. The Subsidiary is not registered under the Investment Company Act of 1940, as amended (the “1940 Act”), and, unless otherwise noted in the Fund’s Prospectus, is not subject to all of the investor protections of the 1940 Act. However, the Fund wholly owns and controls the Subsidiary, and the Fund and the Subsidiary are managed by the Adviser, making it unlikely the Subsidiary will take actions contrary to the interests of the Fund or its shareholders. In addition, changes in federal tax laws applicable to the Fund or interpretations thereof could limit the Fund’s ability to gain exposure to commodities investments through investments in the Subsidiary.
Derivatives Risk—Derivatives may be difficult to price or unwind and leveraged so that small changes may produce disproportionate losses for the Fund. A short position in a derivative instrument involves the risk of a theoretically unlimited increase in the value of the underlying asset, reference rate or index, which could cause the Fund to suffer a potentially unlimited loss. Derivatives, especially over-the-counter derivatives, are also subject to counterparty risk, which is the risk that the counterparty (the party on the
| | |
| |
| abfunds.com | | AB GLOBAL RISK ALLOCATION FUND | 51 |
NOTES TO CONSOLIDATED FINANCIAL STATEMENTS (continued)
other side of the transaction) on a derivative transaction will be unable or unwilling to honor its contractual obligations to the Fund.
Leverage Risk—When the Fund borrows money or otherwise leverages its investments, its performance may be volatile because leverage tends to exaggerate the effect of any increase or decrease in the value of the Fund’s investments. The Fund may create leverage through the use of reverse repurchase arrangements, forward currency exchange contracts, forward commitments, dollar rolls or futures or by borrowing money. The use of other types of derivative instruments by the Fund, such as options and swaps, may also result in a form of leverage. Leverage may result in higher returns to the Fund than if the Fund were not leveraged, but may also adversely affect returns, particularly if the market is declining.
Inflation Risk—This is the risk that the value of assets or income from investments will be less in the future as inflation decreases the value of money. As inflation increases, the value of the Fund’s assets can decline as can the value of the Fund’s distributions. This risk is significantly greater for fixed-income securities with longer maturities.
LIBOR Replacement Risk—The Fund may be exposed to debt securities, derivatives or other financial instruments that recently transitioned from the London Interbank Offered Rate (“LIBOR”) as a benchmark or reference rate for various interest rate calculations. The use of LIBOR was phased out in June 2023 and transitioned to the Secured Overnight Financing Rate (“SOFR”). SOFR is a broad measure of the cost of borrowing cash overnight collateralized by U.S. Treasury securities in the repurchase agreement (repo) market. There can be no assurance that instruments linked to SOFR will have the same volume or liquidity as did the market for LIBOR-linked financial instruments prior to LIBOR’s discontinuance or unavailability.
Indemnification Risk—In the ordinary course of business, the Fund enters into contracts that contain a variety of indemnifications. The Fund’s maximum exposure under these arrangements is unknown. However, the Fund has not had prior claims or losses pursuant to these indemnification provisions and expects the risk of loss thereunder to be remote. Therefore, the Fund has not accrued any liability in connection with these indemnification provisions.
Management Risk—The Fund is subject to management risk because it is an actively-managed investment fund. The Adviser will apply its investment techniques and risk analyses in making investment decisions, but there is no guarantee that its techniques will produce the intended results. Some of these techniques may incorporate, or rely upon, quantitative models, but there is no
| | |
| |
52 | AB GLOBAL RISK ALLOCATION FUND | | abfunds.com |
NOTES TO CONSOLIDATED FINANCIAL STATEMENTS (continued)
guarantee that these models will generate accurate forecasts, reduce risk or otherwise perform as expected.
NOTE H
Joint Credit Facility
A number of open-end mutual funds managed by the Adviser, including the Fund, participate in a $325 million revolving credit facility (the “Facility”) intended to provide short-term financing related to redemptions and other short term liquidity requirements, subject to certain restrictions. Commitment fees related to the Facility are paid by the participating funds and are included in miscellaneous expenses in the consolidated statement of operations. The Fund did not utilize the Facility during the six months ended May 31, 2024.
NOTE I
Distributions to Shareholders
The tax character of distributions to be paid for the year ending November 30, 2024 will be determined at the end of the current fiscal year. The tax character of distributions paid during the fiscal years ended November 30, 2023 and November 30, 2022 were as follows:
| | | | | | | | |
| | | 2023 | | | 2022 | |
Distributions paid from: | | | | | | | | |
Ordinary income | | $ | 12,986,910 | | | $ | 20,574,730 | |
Net long-term capital gains | | | 5,175,220 | | | | – 0 | – |
| | | | | | | | |
Total distributions paid | | $ | 18,162,130 | | | $ | 20,574,730 | |
| | | | | | | | |
As of November 30, 2023, the components of accumulated earnings (deficit) on a tax basis were as follows:
| | | | |
Undistributed capital gains | | $ | 1,701,874 | (a) |
Other losses | | | (72,332 | )(b) |
Unrealized appreciation (depreciation) | | | (18,486,377 | ) |
| | | | |
Total accumulated earnings (deficit) | | $ | (16,856,835 | ) |
| | | | |
| (a) | During the fiscal year, the Fund utilized $307,130 of capital loss carry forwards to offset current year net realized gains. |
| (b) | As of November 30, 2023, the cumulative deferred loss on straddles was $72,332. |
| (c) | The differences between book-basis and tax-basis unrealized appreciation (depreciation) are attributable primarily to the recognition for tax purposes of unrealized gains (losses) on certain derivative instruments, the tax treatment of passive foreign investment companies (PFICs), the tax treatment of earnings from the Subsidiary, the tax treatment of swaps, and the tax deferral of losses on wash sales. |
For tax purposes, net realized capital losses may be carried over to offset future capital gains, if any. Funds are permitted to carry forward capital losses for an indefinite period, and such losses will retain their character as either short-term or long-term capital losses. As of November 30, 2023, the Fund did not have any capital loss carryforwards.
| | |
| |
| abfunds.com | | AB GLOBAL RISK ALLOCATION FUND | 53 |
NOTES TO CONSOLIDATED FINANCIAL STATEMENTS (continued)
NOTE J
Recent Accounting Pronouncements
In December 2022, the Financial Accounting Standards Board issued an Accounting Standards Update, ASU 2022-06, “Reference Rate Reform (Topic 848) – Deferral of the Sunset Date of Topic 848”. ASU 2022-06 is an amendment to ASU 2020-04, which provided optional guidance to ease the potential accounting burden due to the discontinuation of the LIBOR and other interbank-offered based reference rates and which was effective as of March 12, 2020 through December 31, 2022. ASU 2022-06 extends the effective period through December 31, 2024. Management is currently evaluating the impact, if any, of applying ASU 2022-06.
NOTE K
Subsequent Events
Management has evaluated subsequent events for possible recognition or disclosure in the consolidated financial statements through the date the consolidated financial statements are issued. Management has determined that there are no material events that would require disclosure in the Fund’s consolidated financial statements through this date.
| | |
| |
54 | AB GLOBAL RISK ALLOCATION FUND | | abfunds.com |
CONSOLIDATED FINANCIAL HIGHLIGHTS
Selected Data For A Share Of Capital Stock Outstanding Throughout Each Period
| | | | | | | | | | | | | | | | | | | | | | | | |
| | | Class A | |
| | | Six Months
Ended
May 31,
2024 (unaudited) | | | Year Ended November 30, | |
| | | 2023 | | | 2022 | | | 2021 | | | 2020 | | | 2019 | |
| | | | |
Net asset value, beginning of period | | | $ 15.75 | | | | $ 17.25 | | | | $ 19.91 | | | | $ 18.11 | | | | $ 16.77 | | | | $ 15.62 | |
| | | | |
Income From Investment Operations | | | | | | | | | | | | | | | | | | | | | | | | |
| | | | | | |
Net investment income (loss)(a)(b) | | | .11 | | | | .34 | | | | .47 | | | | .29 | | | | (.01 | ) | | | .08 | |
| | | | | | |
Net realized and unrealized gain (loss) on investment and foreign currency transactions | | | .93 | | | | (.53 | ) | | | (1.33 | ) | | | 2.06 | | | | 1.58 | | | | 1.16 | |
| | | | | | |
Contributions from Affiliates | | | – 0 | – | | | – 0 | – | | | – 0 | – | | | – 0 | – | | | .00 | (c) | | | – 0 | – |
| | | | |
Net increase (decrease) in net asset value from operations | | | 1.04 | | | | (.19 | ) | | | (.86 | ) | | | 2.35 | | | | 1.57 | | | | 1.24 | |
| | | | |
Less: Dividends and Distributions | | | | | | | | | | | | | | | | | | | | | | | | |
| | | | | | |
Dividends from net investment income | | | (.04 | ) | | | (1.05 | ) | | | (1.80 | ) | | | (.55 | ) | | | (.21 | ) | | | (.09 | ) |
| | | | | | |
Distributions from net realized gain on investment transactions | | | (.18 | ) | | | (.26 | ) | | | – 0 | – | | | – 0 | – | | | (.02 | ) | | | – 0 | – |
| | | | |
Total dividends and distributions | | | (.22 | ) | | | (1.31 | ) | | | (1.80 | ) | | | (.55 | ) | | | (.23 | ) | | | (.09 | ) |
| | | | |
Net asset value, end of period | | | $ 16.57 | | | | $ 15.75 | | | | $ 17.25 | | | | $ 19.91 | | | | $ 18.11 | | | | $ 16.77 | |
| | | | |
|
Total Return | |
| | | | | | |
Total investment return based on net asset value(d)* | | | 6.72 | % | | | (1.19 | )% | | | (4.90 | )%+ | | | 13.45 | % | | | 9.39 | % | | | 7.99 | % |
| | | | | | |
Ratios/Supplemental Data | | | | | | | | | | | | | | | | | | | | | | | | |
| | | | | | |
Net assets, end of period
(000’s omitted) | | $ | 160,818 | | | $ | 162,288 | | | $ | 215,597 | | | $ | 207,089 | | | $ | 190,591 | | | $ | 194,924 | |
|
Ratio to average net assets of: | |
| | | | | | |
Expenses, net of waivers/reimbursements(e)(f) | | | 1.38 | %^ | | | 1.39 | % | | | 1.29 | % | | | 1.27 | % | | | 1.36 | % | | | 1.37 | % |
| | | | | | |
Expenses, before waivers/reimbursements(e)(f) | | | 1.39 | %^ | | | 1.40 | % | | | 1.30 | % | | | 1.27 | % | | | 1.37 | % | | | 1.37 | % |
| | | | | | |
Net investment income (loss)(b) | | | 1.32 | %^ | | | 2.17 | % | | | 2.66 | % | | | 1.50 | % | | | (.06 | )% | | | .47 | % |
| | | | | | |
Portfolio turnover rate | | | 24 | % | | | 13 | % | | | 1 | % | | | 7 | % | | | 20 | % | | | 3 | % |
| | | | | | | | | | | | | | | | | | | | | | | | |
| |
‡ Expense ratios exclude the estimated acquired fund fees of the affiliated/unaffiliated underlying | |
portfolios | | | .03 | %^ | | | .03 | % | | | .03 | % | | | .02 | % | | | .02 | % | | | .00 | % |
See footnote summary on page 59.
| | |
| |
| abfunds.com | | AB GLOBAL RISK ALLOCATION FUND | 55 |
CONSOLIDATED FINANCIAL HIGHLIGHTS (continued)
Selected Data For A Share Of Capital Stock Outstanding Throughout Each Period
| | | | | | | | | | | | | | | | | | | | | | | | |
| | | Class C | |
| | | Six Months
Ended
May 31,
2024 (unaudited) | | | Year Ended November 30, | |
| | | 2023 | | | 2022 | | | 2021 | | | 2020 | | | 2019 | |
| | | | |
| | | | | | | | | | | | | | | | | | | | | | | | |
Net asset value, beginning of period | | $ | 14.12 | | | $ | 15.57 | | | $ | 18.09 | | | $ | 16.50 | | | $ | 15.26 | | | $ | 14.24 | |
| | | | |
Income From Investment Operations | | | | | | | | | | | | | | | | | | | | | | | | |
| | | | | | |
Net investment income (loss)(a)(b) | | | .05 | | | | .20 | | | | .31 | | | | .12 | | | | (.15 | ) | | | (.04 | ) |
| | | | | | |
Net realized and unrealized gain (loss) on investment and foreign currency transactions | | | .82 | | | | (.47 | ) | | | (1.20 | ) | | | 1.89 | | | | 1.46 | | | | 1.06 | |
| | | | | | |
Contributions from Affiliates | | | – 0 | – | | | – 0 | – | | | – 0 | – | | | – 0 | – | | | 00 | (c) | | | – 0 | – |
| | | | |
Net increase (decrease) in net asset value from operations | | | .87 | | | | (.27 | ) | | | (.89 | ) | | | 2.01 | | | | 1.31 | | | | 1.02 | |
| | | | |
Less: Dividends and Distributions | | | | | | | | | | | | | | | | | | | | | | | | |
| | | | | | |
Dividends from net investment income | | | – 0 | – | | | (.92 | ) | | | (1.63 | ) | | | (.42 | ) | | | (.05 | ) | | | – 0 | – |
| | | | | | |
Distributions from net realized gain on investment transactions | | | (.18 | ) | | | (.26 | ) | | | – 0 | – | | | – 0 | – | | | (.02 | ) | | | – 0 | – |
| | | | |
Total dividends and distributions | | | (.18 | ) | | | (1.18 | ) | | | (1.63 | ) | | | (.42 | ) | | | (.07 | ) | | | – 0 | – |
| | | | |
Net asset value, end of period | | $ | 14.81 | | | $ | 14.12 | | | $ | 15.57 | | | $ | 18.09 | | | $ | 16.50 | | | $ | 15.26 | |
| | | | |
| | | | | | |
Total Return | | | | | | | | | | | | | | | | | | | | | | | | |
| | | | | | |
Total investment return based on net asset value(d)* | | | 6.26 | % | | | (1.89 | )% | | | (5.59 | )%+ | | | 12.57 | % | | | 8.57 | % | | | 7.16 | % |
| | | | | | |
Ratios/Supplemental Data | | | | | | | | | | | | | | | | | | | | | | | | |
| | | | | | |
Net assets, end of period (000’s omitted) | | | $2,116 | | | | $1,935 | | | | $2,382 | | | | $2,669 | | | | $3,382 | | | | $4,115 | |
| | | | | | |
Ratio to average net assets of: | | | | | | | | | | | | | | | | | | | | | | | | |
| | | | | | |
Expenses, net of waivers/reimbursements(e)(f) | | | 2.14 | %^ | | | 2.15 | % | | | 2.05 | % | | | 2.03 | % | | | 2.12 | % | | | 2.13 | % |
| | | | | | |
Expenses, before waivers/reimbursements(e)(f) | | | 2.15 | %^ | | | 2.16 | % | | | 2.06 | % | | | 2.03 | % | | | 2.13 | % | | | 2.13 | % |
| | | | | | |
Net investment income (loss)(b) | | | .65 | %^ | | | 1.43 | % | | | 1.92 | % | | | .69 | % | | | (1.02 | )% | | | (.30 | )% |
| | | | | | |
Portfolio turnover rate | | | 24 | % | | | 13 | % | | | 1 | % | | | 7 | % | | | 20 | % | | | 3 | % |
| | | | | | | | | | | | | | | | | | | | | | | | |
| |
‡ Expense ratios exclude the estimated acquired fund fees of the affiliated/unaffiliated underlying | |
portfolios | | | .03 | %^ | | | .03 | % | | | .03 | % | | | .02 | % | | | .02 | % | | | .00 | % |
| See | footnote summary on page 59. |
| | |
| |
56 | AB GLOBAL RISK ALLOCATION FUND | | abfunds.com |
CONSOLIDATED FINANCIAL HIGHLIGHTS (continued)
Selected Data For A Share Of Capital Stock Outstanding Throughout Each Period
| | | | | | | | | | | | | | | | | | | | | | | | |
| | | Advisor Class | |
| | | Six Months
Ended
May 31,
2024 (unaudited) | | | Year Ended November 30, | |
| | | 2023 | | | 2022 | | | 2021 | | | 2020 | | | 2019 | |
| | | | |
| | | | | | | | | | | | | | | | | | | | | | | | |
Net asset value, beginning of period | | | $ 15.95 | | | | $ 17.45 | | | | $ 20.12 | | | | $ 18.29 | | | | $ 16.93 | | | | $ 15.77 | |
| | | | |
Income From Investment Operations | | | | | | | | | | | | | | | | | | | | | | | | |
| | | | | | |
Net investment income(a)(b) | | | .12 | | | | .39 | | | | .52 | | | | .35 | | | | .01 | | | | .12 | |
| | | | | | |
Net realized and unrealized gain (loss) on investment and foreign currency transactions | | | .95 | | | | (.54 | ) | | | (1.34 | ) | | | 2.07 | | | | 1.62 | | | | 1.17 | |
| | | | | | |
Contributions from Affiliates | | | – 0 | – | | | – 0 | – | | | – 0 | – | | | – 0 | – | | | 00 | (c) | | | – 0 | – |
| | | | |
Net increase (decrease) in net asset value from operations | | | 1.07 | | | | (.15 | ) | | | (.82 | ) | | | 2.42 | | | | 1.63 | | | | 1.29 | |
| | | | |
Less: Dividends and Distributions | | | | | | | | | | | | | | | | | | | | | | | | |
| | | | | | |
Dividends from net investment income | | | (.08 | ) | | | (1.09 | ) | | | (1.85 | ) | | | (.59 | ) | | | (.25 | ) | | | (.13 | ) |
| | | | | | |
Distributions from net realized gain on investment transactions | | | (.18 | ) | | | (.26 | ) | | | – 0 | – | | | – 0 | – | | | (.02 | ) | | | – 0 | – |
| | | | |
Total dividends and distributions | | | (.26 | ) | | | (1.35 | ) | | | (1.85 | ) | | | (.59 | ) | | | (.27 | ) | | | (.13 | ) |
| | | | |
Net asset value, end of period | | | $ 16.76 | | | | $ 15.95 | | | | $ 17.45 | | | | $ 20.12 | | | | $ 18.29 | | | | $ 16.93 | |
| | | | |
| | | | | | |
Total Return | | | | | | | | | | | | | | | | | | | | | | | | |
| | | | | | |
Total investment return based on net asset value(d)* | | | 6.83 | % | | | (.95 | )% | | | (4.65 | )%+ | | | 13.69 | % | | | 9.68 | % | | | 8.27 | % |
| | | | | | |
Ratios/Supplemental Data | | | | | | | | | | | | | | | | | | | | | | | | |
| | | | | | |
Net assets, end of period (000’s omitted) | | | $11,187 | | | | $13,036 | | | | $17,477 | | | | $13,604 | | | | $12,153 | | | | $14,632 | |
| | | | | | |
Ratio to average net assets of: | | | | | | | | | | | | | | | | | | | | | | | | |
| | | | | | |
Expenses, net of waivers/reimbursements(e)(f) | | | 1.12 | %^ | | | 1.14 | % | | | 1.04 | % | | | 1.02 | % | | | 1.12 | % | | | 1.12 | % |
| | | | | | |
Expenses, before waivers/reimbursements(e)(f) | | | 1.14 | %^ | | | 1.15 | % | | | 1.05 | % | | | 1.02 | % | | | 1.12 | % | | | 1.12 | % |
| | | | | | |
Net investment income(b) | | | 1.49 | %^ | | | 2.47 | % | | | 2.90 | % | | | 1.78 | % | | | .06 | % | | | .72 | % |
| | | | | | |
Portfolio turnover rate | | | 24 | % | | | 13 | % | | | 1 | % | | | 7 | % | | | 20 | % | | | 3 | % |
| | | | | | | | | | | | | | | | | | | | | | | | |
| |
‡ Expense ratios exclude the estimated acquired fund fees of the affiliated/unaffiliated underlying | |
portfolios | | | .03 | %^ | | | .03 | % | | | .03 | % | | | .02 | % | | | .02 | % | | | .00 | % |
See footnote summary on page 59.
| | |
| |
| abfunds.com | | AB GLOBAL RISK ALLOCATION FUND | 57 |
CONSOLIDATED FINANCIAL HIGHLIGHTS (continued)
Selected Data For A Share Of Capital Stock Outstanding Throughout Each Period
| | | | | | | | | | | | | | | | | | | | | | | | |
| | | Class I | |
| | | Six Months
Ended
May 31,
2024 (unaudited) | | | Year Ended November 30, | |
| | | 2023 | | | 2022 | | | 2021 | | | 2020 | | | 2019 | |
| | | | |
| | | | | | | | | | | | | | | | | | | | | | | | |
Net asset value, beginning of period | | | $ 15.92 | | | | $ 17.41 | | | | $ 20.09 | | | | $ 18.27 | | | | $ 16.91 | | | | $ 15.76 | |
| | | | |
Income From Investment Operations | | | | | | | | | | | | | | | | | | | | | | | | |
| | | | | | |
Net investment income(a)(b) | | | .13 | | | | .39 | | | | .53 | | | | .35 | | | | .04 | | | | .13 | |
| | | | | | |
Net realized and unrealized gain (loss) on investment and foreign currency transactions | | | .93 | | | | (.53 | ) | | | (1.35 | ) | | | 2.07 | | | | 1.60 | | | | 1.16 | |
| | | | | | |
Contributions from Affiliates | | | – 0 | – | | | – 0 | – | | | – 0 | – | | | – 0 | – | | | 00 | (c) | | | – 0 | – |
| | | | |
| | | | | | |
Net increase (decrease) in net asset value from operations | | | 1.06 | | | | (.14 | ) | | | (.82 | ) | | | 2.42 | | | | 1.64 | | | | 1.29 | |
| | | | |
Less: Dividends and Distributions | | | | | | | | | | | | | | | | | | | | | | | | |
| | | | | | |
Dividends from net investment income | | | (.08 | ) | | | (1.09 | ) | | | (1.86 | ) | | | (.60 | ) | | | (.26 | ) | | | (.14 | ) |
| | | | | | |
Distributions from net realized gain on investment transactions | | | (.18 | ) | | | (.26 | ) | | | – 0 | – | | | – 0 | – | | | (.02 | ) | | | – 0 | – |
| | | | |
Total dividends and distributions | | | (.26 | ) | | | (1.35 | ) | | | (1.86 | ) | | | (.60 | ) | | | (.28 | ) | | | (.14 | ) |
| | | | |
Net asset value, end of period | | | $ 16.72 | | | | $ 15.92 | | | | $ 17.41 | | | | $ 20.09 | | | | $ 18.27 | | | | $ 16.91 | |
| | | | |
| | | | | | |
Total Return | | | | | | | | | | | | | | | | | | | | | | | | |
| | | | | | |
Total investment return based on net asset value(d)* | | | 6.88 | % | | | (.94 | )% | | | (4.63 | )%+ | | | 13.78 | % | | | 9.72 | % | | | 8.27 | % |
| | | | | | |
Ratios/Supplemental Data | | | | | | | | | | | | | | | | | | | | | | | | |
| | | | | | |
Net assets, end of period (000’s omitted) | | | $1,271 | | | | $1,204 | | | | $2,021 | | | | $2,390 | | | | $2,063 | | | | $3,095 | |
| | | | | | |
Ratio to average net assets of: | | | | | | | | | | | | | | | | | | | | | | | | |
| | | | | | |
Expenses, net of waivers/reimbursements(e)(f) | | | 1.10 | %^ | | | 1.13 | % | | | 1.02 | % | | | .99 | % | | | 1.06 | % | | | 1.07 | % |
| | | | | | |
Expenses, before waivers/reimbursements(e)(f) | | | 1.11 | %^ | | | 1.14 | % | | | 1.03 | % | | | 1.00 | % | | | 1.07 | % | | | 1.07 | % |
| | | | | | |
Net investment income(b) | | | 1.62 | %^ | | | 2.46 | % | | | 2.95 | % | | | 1.77 | % | | | .21 | % | | | .78 | % |
| | | | | | |
Portfolio turnover rate | | | 24 | % | | | 13 | % | | | 1 | % | | | 7 | % | | | 20 | % | | | 3 | % |
| | | | | | | | | | | | | | | | | | | | | | | | |
| |
‡ Expense ratios exclude the estimated acquired fund fees of the affiliated/unaffiliated underlying | |
portfolios | | | .03 | %^ | | | .03 | % | | | .03 | % | | | .02 | % | | | .02 | % | | | .00 | % |
See footnote summary on page 59.
| | |
| |
58 | AB GLOBAL RISK ALLOCATION FUND | | abfunds.com |
CONSOLIDATED FINANCIAL HIGHLIGHTS (continued)
Selected Data For A Share Of Capital Stock Outstanding Throughout Each Period
| (a) | Based on average shares outstanding. |
| (b) | Net of expenses waived/reimbursed by the Adviser. |
| (c) | Amount is less than $.005. |
| (d) | Total investment return is calculated assuming an initial investment made at the net asset value at the beginning of the period, reinvestment of all dividends and distributions at net asset value during the period, and redemption on the last day of the period. Initial sales charges or contingent deferred sales charges are not reflected in the calculation of total investment return. Total return does not reflect the deduction of taxes that a shareholder would pay on fund distributions or the redemption of fund shares. Total investment return calculated for a period of less than one year is not annualized. |
| (e) | In connection with the Fund’s investments in affiliated underlying portfolios, the Fund incurs no direct expenses, but bears proportionate shares of the fees and expenses (i.e., operating, administrative and investment advisory fees) of the affiliated underlying portfolios. The Adviser has contractually agreed to waive its fees from the Fund in an amount equal to the Fund’s pro rata share of certain acquired fund fees and expenses, and for the six months ended May 31, 2024 and the years ended November 30, 2023, November 30, 2022, November 30, 2021 and November 30, 2020, such waiver amounted to .01% (annualized), .01%, .01%, .02% and .01%, respectively. |
| (f) | The expense ratios presented below exclude interest/bank overdraft expense: |
| | | | | | | | | | | | | | | | | | | | | | | | |
| | | Six Months
Ended
May 31, 2024
(unaudited) | | | Year Ended November 30, | |
| | | 2023 | | | 2022 | | | 2021 | | | 2020 | | | 2019 | |
Class A | |
Net of waivers/reimbursements | | | 1.37 | %^ | | | 1.38 | % | | | 1.29 | % | | | 1.27 | % | | | 1.36 | % | | | 1.35 | % |
Before waivers/reimbursements | | | 1.38 | %^ | | | 1.39 | % | | | 1.30 | % | | | 1.27 | % | | | 1.37 | % | | | 1.36 | % |
Class C | |
Net of waivers/reimbursements | | | 2.13 | %^ | | | 2.14 | % | | | 2.05 | % | | | 2.03 | % | | | 2.12 | % | | | 2.11 | % |
Before waivers/reimbursements | | | 2.14 | %^ | | | 2.15 | % | | | 2.06 | % | | | 2.03 | % | | | 2.13 | % | | | 2.11 | % |
Advisor Class | |
Net of waivers/reimbursements | | | 1.12 | %^ | | | 1.13 | % | | | 1.04 | % | | | 1.02 | % | | | 1.12 | % | | | 1.10 | % |
Before waivers/reimbursements | | | 1.13 | %^ | | | 1.14 | % | | | 1.05 | % | | | 1.02 | % | | | 1.12 | % | | | 1.11 | % |
Class I | |
Net of waivers/reimbursements | | | 1.09 | %^ | | | 1.12 | % | | | 1.02 | % | | | .99 | % | | | 1.06 | % | | | 1.05 | % |
Before waivers/reimbursements | | | 1.10 | %^ | | | 1.14 | % | | | 1.03 | % | | | 1.00 | % | | | 1.07 | % | | | 1.05 | % |
| * | Includes the impact of proceeds received and credited to the Fund resulting from class action settlements, which enhanced the Fund’s performance for the years ended November 30, 2020 and November 30, 2019 by .01% and .31%, respectively. |
| + | The net asset value and total return include adjustments in accordance with accounting principles generally accepted in the United States of America for financial reporting purposes. As such, the net asset value and total return for shareholder transactions may differ from financial statements. |
See notes to consolidated financial statements.
| | |
| |
| abfunds.com | | AB GLOBAL RISK ALLOCATION FUND | 59 |
Information Regarding the Review and Approval of the Fund’s Advisory Agreement
The disinterested directors (the “directors”) of AB Global Risk Allocation Fund, Inc. (the “Fund”) unanimously approved the continuance of the Advisory Agreement with the Adviser at a meeting held in-person on October 31-November 2, 2023 (the “Meeting”).
Prior to approval of the continuance of the Advisory Agreement, the directors had requested from the Adviser, and received and evaluated, extensive materials. They reviewed the proposed continuance of the Advisory Agreement with the Adviser and with experienced counsel who are independent of the Adviser, who advised on the relevant legal standards. The directors also reviewed additional materials, including comparative analytical data prepared by the Senior Vice President of the Fund. The directors also discussed the proposed continuance in private sessions with counsel.
The directors considered their knowledge of the nature and quality of the services provided by the Adviser to the Fund gained from their experience as directors or trustees of most of the registered investment companies advised by the Adviser, their overall confidence in the Adviser’s integrity and competence they have gained from that experience, the Adviser’s initiative in identifying and raising potential issues with the directors and its responsiveness, frankness and attention to concerns raised by the directors in the past, including the Adviser’s willingness to consider and implement organizational and operational changes designed to improve investment results and the services provided to the AB Funds. The directors noted that they have four regular meetings each year, at each of which they review extensive materials and information from the Adviser, including information on the investment performance of the Fund and the money market fund advised by the Adviser in which the Fund invests a portion of its net assets.
The directors also considered all factors they believed relevant, including the specific matters discussed below. During the course of their deliberations, the directors evaluated, among other things, the reasonableness of the advisory fee. The directors did not identify any particular information that was all-important or controlling, and different directors may have attributed different weights to the various factors. The directors determined that the selection of the Adviser to manage the Fund and the overall arrangements between the Fund and the Adviser, as provided in the Advisory Agreement, including the advisory fee, were fair and reasonable in light of the services performed, expenses incurred and such other matters as the directors considered relevant in the exercise of their business
| | |
| |
60 | AB GLOBAL RISK ALLOCATION FUND | | abfunds.com |
judgment. The material factors and conclusions that formed the basis for the directors’ determinations included the following:
Nature, Extent and Quality of Services Provided
The directors considered the scope and quality of services provided by the Adviser under the Advisory Agreement, including the quality of the investment research capabilities of the Adviser and the other resources it has dedicated to performing services for the Fund. The directors noted that the Adviser from time to time reviews the Fund’s investment strategies and from time to time proposes changes intended to improve the Fund’s relative or absolute performance for the directors’ consideration. They also noted the professional experience and qualifications of the Fund’s portfolio management team and other senior personnel of the Adviser. The directors also considered that the Advisory Agreement provides that the Fund will reimburse the Adviser for the cost to it of providing certain clerical, accounting, administrative and other services to the Fund by employees of the Adviser or its affiliates. Requests for these reimbursements are made on a quarterly basis and subject to approval by the directors. Reimbursements, to the extent requested and paid, result in a higher rate of total compensation from the Fund to the Adviser than the fee rate stated in the Advisory Agreement. The directors noted that the methodology used to determine the reimbursement amounts had been reviewed by an independent consultant at the request of the directors. The quality of administrative and other services, including the Adviser’s role in coordinating the activities of the Fund’s other service providers, also was considered. The directors concluded that, overall, they were satisfied with the nature, extent and quality of services provided to the Fund under the Advisory Agreement.
Costs of Services Provided and Profitability
The directors reviewed a schedule of the revenues and expenses and related notes indicating the profitability of the Fund to the Adviser for calendar years 2021 and 2022 that had been prepared with an expense allocation methodology arrived at in consultation with an independent consultant at the request of the directors. The directors noted the assumptions and methods of allocation used by the Adviser in preparing fund-specific profitability data and understood that there are a number of potentially acceptable allocation methodologies for information of this type. The directors noted that the profitability information reflected all revenues and expenses of the Adviser’s relationship with the Fund, including those relating to its subsidiaries that provide transfer agency, distribution and brokerage services to the Fund. The directors recognized that it is difficult to make comparisons of the profitability of the Advisory Agreement with the profitability of fund advisory contracts for unaffiliated funds because comparative information is not generally publicly available and is affected by numerous factors. The directors focused on the profitability of the Adviser’s relationship with the Fund before taxes and distribution
| | |
| |
| abfunds.com | | AB GLOBAL RISK ALLOCATION FUND | 61 |
expenses. The directors noted that the Fund was not profitable to the Adviser in the periods reviewed.
Fall-Out Benefits
The directors considered the other benefits to the Adviser and its affiliates from their relationships with the Fund and the money market fund advised by the Adviser in which the Fund invests, including, but not limited to, benefits relating to soft dollar arrangements (whereby investment advisers receive brokerage and research services from brokers that execute agency transactions for their clients); 12b-1 fees and sales charges received by the Fund’s principal underwriter (which is a wholly owned subsidiary of the Adviser) in respect of certain classes of the Fund’s shares; brokerage commissions paid by the Fund to brokers affiliated with the Adviser; and transfer agency fees paid by the Fund to a wholly owned subsidiary of the Adviser. The directors recognized that the Fund’s unprofitability to the Adviser would be exacerbated without these benefits. The directors understood that the Adviser also might derive reputational and other benefits from its association with the Fund.
Investment Results
In addition to the information reviewed by the directors in connection with the Meeting, the directors receive detailed performance information for the Fund at each regular Board meeting during the year.
At the Meeting, the directors reviewed performance information prepared by an independent service provider (the “15(c) service provider”), showing the performance of the Advisor Class shares of the Fund against a group of similar funds (“peer group”) and a larger group of similar funds (“peer universe”), each selected by the 15(c) service provider, and information prepared by the Adviser showing performance of the Advisor Class shares against a broad-based securities market index, in each case for the 1-, 3-, 5- and 10-year periods ended July 31, 2023. Based on their review, the directors concluded that the Fund’s investment performance was acceptable.
Advisory Fees and Other Expenses
The directors considered the advisory fee rate payable by the Fund to the Adviser and information prepared by the 15(c) service provider concerning advisory fee rates payable by other funds in the same category as the Fund. The directors recognized that it is difficult to make comparisons of advisory fees because there are variations in the services that are included in the fees paid by other funds. The directors compared the Fund’s contractual effective advisory fee rate with a peer group median and noted that it was lower than the median. They also noted that the Adviser’s total rate of compensation, taking into account the impact of the administrative expense reimbursement paid to the Adviser in the latest fiscal year, was lower than the median.
| | |
| |
62 | AB GLOBAL RISK ALLOCATION FUND | | abfunds.com |
The directors also considered the Adviser’s fee schedule for other clients utilizing investment strategies similar to those of the Fund. For this purpose, they reviewed the relevant advisory fee information from the Adviser’s Form ADV and in a report from the Fund’s Senior Vice President and noted the differences between the Fund’s fee schedule, on the one hand, and the Adviser’s institutional fee schedule and the schedule of fees charged by the Adviser to any offshore funds and for services to any sub-advised funds utilizing investment strategies similar to those of the Fund, on the other. The directors noted that the Adviser may, in some cases, agree to fee rates with large institutional clients that are lower than those reviewed by the directors and that they had previously discussed with the Adviser its policies in respect of such arrangements.
The Adviser reviewed with the directors the significantly greater scope of the services it provides to the Fund relative to institutional, offshore fund and sub-advised fund clients. In this regard, the Adviser noted, among other things, that, compared to institutional and offshore or sub-advisory accounts, the Fund (i) demands considerably more portfolio management, research and trading resources due to significantly higher daily cash flows; (ii) has more tax and regulatory restrictions and compliance obligations; (iii) must prepare and file or distribute regulatory and other communications about fund operations; and (iv) must provide shareholder servicing to retail investors. The Adviser also reviewed the greater legal risks presented by the large and changing population of Fund shareholders who may assert claims against the Adviser in individual or class actions, and the greater entrepreneurial risk in offering new fund products, which require substantial investment to launch, may not succeed, and generally must be priced to compete with larger, more established funds resulting in lack of profitability to the Adviser until a new fund achieves scale. In light of the substantial differences in services rendered by the Adviser to institutional, offshore fund and sub-advised fund clients as compared to the Fund, and the different risk profile, the directors considered these fee comparisons inapt and did not place significant weight on them in their deliberations.
In connection with their review of the Fund’s advisory fee, the directors also considered the total expense ratio of the Advisor Class shares of the Fund in comparison to a peer group and a peer universe selected by the 15(c) service provider. The Advisor Class expense ratio of the Fund was based on the Fund’s latest fiscal year. The directors noted that it was likely that the expense ratios of some of the other funds in the Fund’s category were lowered by waivers or reimbursements by those funds’ investment advisers, which in some cases might be voluntary or temporary. The directors view expense ratio information as relevant to their evaluation of the Adviser’s services because the Adviser is responsible for coordinating services provided to the Fund by others. Based on their review, the directors concluded that the Fund’s expense ratio was acceptable.
| | |
| |
| abfunds.com | | AB GLOBAL RISK ALLOCATION FUND | 63 |
Economies of Scale
The directors noted that the advisory fee schedule for the Fund contains breakpoints that reduce the fee rates on assets above specified levels. The directors took into consideration prior presentations by an independent consultant on economies of scale in the mutual fund industry and for the AB Funds, and presentations from time to time by the Adviser concerning certain of its views on economies of scale. The directors also had requested and received from the Adviser certain updates on economies of scale in advance of the Meeting. The directors believe that economies of scale may be realized (if at all) by the Adviser across a variety of products and services, and not only in respect of a single fund. The directors noted that there is no established methodology for setting breakpoints that give effect to the fund-specific services provided by a fund’s adviser and to the economies of scale that an adviser may realize in its overall mutual fund business or those components of it which directly or indirectly affect a fund’s operations. The directors observed that in the mutual fund industry as a whole, as well as among funds similar to the Fund, there is no uniformity or pattern in the fees and asset levels at which breakpoints (if any) apply. The directors also noted that the advisory agreements for many funds do not have breakpoints at all. Having taken these factors into account, the directors concluded that the Fund’s shareholders would benefit from a sharing of economies of scale in the event the Fund’s net assets exceed a breakpoint in the future.
| | |
| |
64 | AB GLOBAL RISK ALLOCATION FUND | | abfunds.com |
AB GLOBAL RISK ALLOCATION FUND
1345 Avenue of the Americas
New York, NY 10105
800 221 5672
GRA-0152-0524 
ITEM 8. CHANGES IN AND DISAGREEMENTS WITH ACCOUNTANTS FOR OPEN-END MANAGEMENT INVESTMENT COMPANIES.
There were no disagreements with accountants during the reporting period.
ITEM 9. PROXY DISCLOSURES FOR OPEN-END MANAGEMENT INVESTMENT COMPANIES
There were no shareholder meetings during the reporting period.
ITEM 10. REMUNERATION PAID TO DIRECTORS, OFFICERS, AND OTHERS OF OPEN-END MANAGEMENT INVESTMENT COMPANIES.
Aggregate remuneration paid to all Directors and advisory board members are included within the Financial Statements under Item 7 of this Form N-CSR.
ITEM 11. STATEMENT REGARDING BASIS FOR APPROVAL OF INVESTMENT ADVISORY CONTRACT.
Statement regarding basis for Approval of Investment Advisory Contract included within the Financial Statements under Item 7 of this Form N-CSR.
ITEM 12. DISCLOSURE OF PROXY VOTING POLICIES AND PROCEDURES FOR CLOSED-END MANAGEMENT INVESTMENT COMPANIES.
Not applicable to the registrant.
ITEM 13. PORTFOLIO MANAGERS OF CLOSED-END MANAGEMENT INVESTMENT COMPANIES
Not applicable to the registrant.
ITEM 14. PURCHASES OF EQUITY SECURITIES BY CLOSED-END MANAGEMENT INVESTMENT COMPANY AND AFFILIATED PURCHASERS.
Not applicable to the registrant
ITEM 15. SUBMISSION OF MATTERS TO A VOTE OF SECURITY HOLDERS.
There have been no material changes to the procedures by which shareholders may recommend nominees to the Fund’s Board of Directors since the Fund last provided disclosure in response to this item.
ITEM 16. CONTROLS AND PROCEDURES.
(a) The registrant’s principal executive officer and principal financial officer have concluded that the registrant’s disclosure controls and procedures (as defined in Rule 30a-2(c) under the Investment Company Act of 1940, as amended) are effective at the reasonable assurance level based on their evaluation of these controls and procedures as of a date within 90 days of the filing date of this document.
(b) There were no changes in the registrant’s internal controls over financial reporting that occurred during the period covered by this report that has materially affected, or is reasonably likely to materially affect, the registrant’s internal control over financial reporting.
ITEM 17. DISCLOSURE OF SECURITIES LENDING ACTIVITIES FOR CLOSED-END MANAGEMENT INVESTMENT COMPANIES.
Not applicable to the registrant
ITEM 18. RECOVERY OF ERRONEOUSLY AWARDED COMPENSATION.
Not applicable to the registrant
ITEM 19. EXHIBITS.
The following exhibits are attached to this Form N-CSR:
SIGNATURES
Pursuant to the requirements of the Securities Exchange Act of 1934 and the Investment Company Act of 1940, the registrant has duly caused this report to be signed on its behalf by the undersigned, thereunto duly authorized.
(Registrant): AB Global Risk Allocation Fund, Inc.
| | |
| By: | | /s/ Onur Erzan |
| | Onur Erzan |
| | President |
| |
| Date: | | July 26, 2024 |
Pursuant to the requirements of the Securities Exchange Act of 1934 and the Investment Company Act of 1940, this report has been signed below by the following persons on behalf of the registrant and in the capacities and on the dates indicated.
| | |
| By: | | /s/ Onur Erzan |
| | Onur Erzan |
| | President |
| |
| Date: | | July 26, 2024 |
| |
| By: | | /s/ Stephen M. Woetzel |
| | Stephen M. Woetzel |
| | Treasurer and Chief Financial Officer |
| |
| Date: | | July 26, 2024 |