Text of Presentation - November 18, 2008 - 3:25 p.m.
National Penn Bancshares, Inc.
Engineered for Success
B. Riley & Co., LLC
New York Bank Conference
November 2008
Thank you to B. Riley and Company for inviting us to present today and good afternoon to all of you.
I’m Glenn Moyer, President and CEO of National Penn Bancshares.
I am joined by Scott Fainor, our Chief Operating Officer and Mike Reinhard, our Chief Financial Officer, who will also provide their comments.
NEXT SLIDE
Investor Relations Information
l The following information can be found on our Investor
Relations Web site at www.nationalpennbancshares.com
l SEC Filings
l Corporate News
l Analyst Estimates
l and much more
l Contact information
– Michael R. Reinhard, Chief Financial Officer
610.369.6342 | mike.reinhard@nationalpenn.com
– Michelle H. Debkowski, Investor Relations Officer
l 610.369.6461 | michelle.debkowski@nationalpenn.com
We try to do our part to help save the environment. In that regard, we have minimized the materials that we’ve provided today, but note here that our website contains all the information about National Penn that you could possibly desire.
NEXT SLIDE
Safe Harbor
Regarding Forward-Looking Statements
This presentation contains forward-looking information about National Penn Bancshares, Inc. that is intended to be
covered by the safe harbor for forward-looking statements provided by the Private Securities Litigation Reform Act of
1995. Forward-looking statements are statements that are not historical facts. These statements can be identified by
the use of forward-looking terminology such as "believe," "expect," "may," "will," "should,'' "project," "plan,'' "seek,"
"intend,'' or "anticipate'' or the negative thereof or comparable terminology, and include discussions of strategy,
financial projections and estimates and their underlying assumptions, statements regarding plans, objectives,
expectations or consequences of announced transactions, and statements about the future performance, operations,
products and services of National Penn Bancshares and its subsidiaries. National Penn Bancshares cautions readers
not to place undue reliance on these statements.
National Penn Bancshares' business and operations are subject to a variety of risks, uncertainties and other factors.
Consequently, actual results and experience may materially differ from those contained in any forward-looking
statements. Such risks, uncertainties and other factors that could cause actual results and experience to differ from
those projected include, but are not limited to, the following: ineffectiveness of National Penn's business strategy due to
changes in current or future market conditions; the effects of competition, and of changes in laws and regulations on
competition, including industry consolidation and development of competing financial products and services; interest
rate movements; inability to achieve merger-related synergies; difficulties in integrating distinct business operations,
including information technology difficulties; disruption from announced transactions, and resulting difficulties in
maintaining relationships with customers and employees; and challenges in establishing and maintaining operations in
new markets. The foregoing review of important factors should be read in conjunction with the other cautionary
statements that are included in National Penn Bancshares' Annual Report on Form 10-K for the fiscal year ended
December 31, 2007, as well as in other documents filed by National Penn Bancshares after the date thereof. National
Penn Bancshares makes no commitment to revise or update any forward-looking statements in order to reflect events
or circumstances occurring or existing after the date any forward-looking statement is made.
This slide contains our legal disclaimers related to forward-looking information. Please note that all of our slides will be available on our web site, as well as filed with the SEC following this presentation.
While you’re reviewing this slide, I’ll also note that detailed information regarding our most recent financial performance is also posted on the investor relations page of our website at: www.nationalpennbancshares.com.
NEXT SLIDE
Today’s Discussion
l National Penn Overview
l National Penn’s Focus
l Investment Considerations
For today’s discussion, I will begin with an overview of National Penn, Scott will provide a broad look at some of the historical and recent results provided by our consistent business strategies, Mike will review our strategic focus, and then I’ll return for a wrap-up of investment considerations.
NEXT SLIDE
National Penn Overview
Profile as of September 30, 2008
l Founded 1874, headquartered in southeast PA
l NASDAQ ticker is NPBC
l $9.3 billion in total assets
l 127 community offices
l Part of S&P SmallCap 600 Index
– $1 Billion+ Market Cap
l National Penn’s acquisitions in the past 18 years
– 11 community banks and thrifts
– 5 branch transactions
– 5 insurance agencies
– 1 wealth entity
National Penn is 134 years old and is based in Boyertown, Pennsylvania – a short drive from Philadelphia. Our 127 community offices are spread throughout Eastern Pennsylvania and Northern Delaware. Our market capitalization ranges in the $1.2 billion to $1.4 billion range. Our institutional ownership percentage has steadily increased over the past year, and now stands at 48.7%. We’ve also seen enhanced liquidity in our stock, as evidenced by an increase in our trading volume from a one-year average of 681 thousand shares, to a one-month average of 759 thousand shares as of October 31, 2008.
NEXT SLIDE
National Penn Overview
Primary Market
Pennsylvania is at the crossroads of one of the most attractive financial services markets in the country. Mega banks, such as M&T, TD Banknorth, Citizens, PNC, Bank of America, and Wells Fargo have all moved into the area, and more recently, de novo banks have established themselves as well. National Penn is fortunate to be able to do a significant amount of business in some of the strongest counties demographically in Pennsylvania, and now in the desirable state of Delaware with our acquisition of Christiana Bank and Trust in January of this year.
We continue to build upon our solid community banking foundation, as well as to further diversify our fee income lines of business including insurance and wealth management. Our acquisition of Christiana, as well as our February acquisition of KNBT Bancorp, were important catalysts to this strategic goal.
We feel that our Company is now, more than ever, strategically positioned to continue to compete with the larger, and smaller, institutions that have joined our market.
NEXT SLIDE
National Penn Overview
Business Organization
l 5 geographic regions
– each lead by a Regional President
l Interaction between regions and business lines
l Client contact is highly decentralized
l Support activities are highly centralized
l Relationship approach
– client perceives bank as locally run
– broad array of products and services
– responsive, focused, deepen relationships
National Penn’s strategic differentiator is our relationship-based business model. Our company is organized around 5 geographic regions as the cornerstone of this strategy. Our regional presidents, who have a great deal of decision-making autonomy, create the look and feel of a locally run bank. The hidden strength of this model is the centralized operational support that allows the regional relationship managers to concentrate on their clients and work with our specialized business units to deliver the products and services that their clients need. In this way, we offer personalized and responsive service with all the products and services offered by our larger competitors, in a cost effective manner.
NEXT SLIDE
Scope of Operations
l Eastern PA and Delaware
l 127 Community Offices
l 146 ATMs
Market Focus
l Retail clients in footprint
l Commercial clients in
footprint
l Government and not-for-
profit clients
National Penn Overview
Banking, Insurance, Investments, Trust
National Penn delivers banking, insurance, and wealth products and services to its clients. Within our banking segment, our loans are roughly split two-thirds commercial and one-third consumer, and our deposit mix is roughly two-thirds consumer and one-third commercial.
NEXT SLIDE
Scope of Operations
l Primarily eastern PA, but
licensed in 27 states
l 8 locations and 25 agents
l $300 million in annual
premiums
Market Focus
l Personal lines products
l Commercial lines
products
l Employer Sponsored
Employee Benefit
Programs
National Penn Overview
Banking, Insurance, Investments, Trust
Our insurance group is directly licensed with over 50 carriers, writes over $300 million in premiums per year, and contributes approximately $16 million of revenue on an annualized basis. 58% of their business is from health and benefit program sales and the remaining 42% is from property and casualty insurance. One unique and profitable feature of our insurance group is a wholesale health, life, and disability unit that serves as a preferred provider for Capital Blue Cross, Highmark Blue Shield, and United Health Care in the state of Pennsylvania.
NEXT SLIDE
Scope of Operations
l Primarily national with a growing
international business
l Full array of wealth management
products and services
l Assets under management or
administration = $8.5 billion
Market Focus
A collection of boutique wealth
management companies who
specialize in a specific segment:
l Individuals, institutions in
need of wealth
management
l “Delaware Advantage”
l 401k Plan Advisory
National Penn Overview
Banking, Insurance, Investments, Trust
Our wealth group serves clients throughout the nation using a network of attorneys and other referral sources. These sources, to the extent that they have international connections, also refer business around the globe to their clients who can take advantage of the State of Delaware’s unique regulatory and legal climate. This makes a Delaware trust company the choice for corporations and individuals wishing to accumulate assets and manage wealth – something we’re calling the “Delaware Advantage”. Our wealth unit also has a satellite office in Nevada, a state that also provides much the same advantages as Delaware.
At this time, I’m pleased to ask Scott to provide you with a bit more detailed picture of our Company. Scott?
NEXT SLIDE
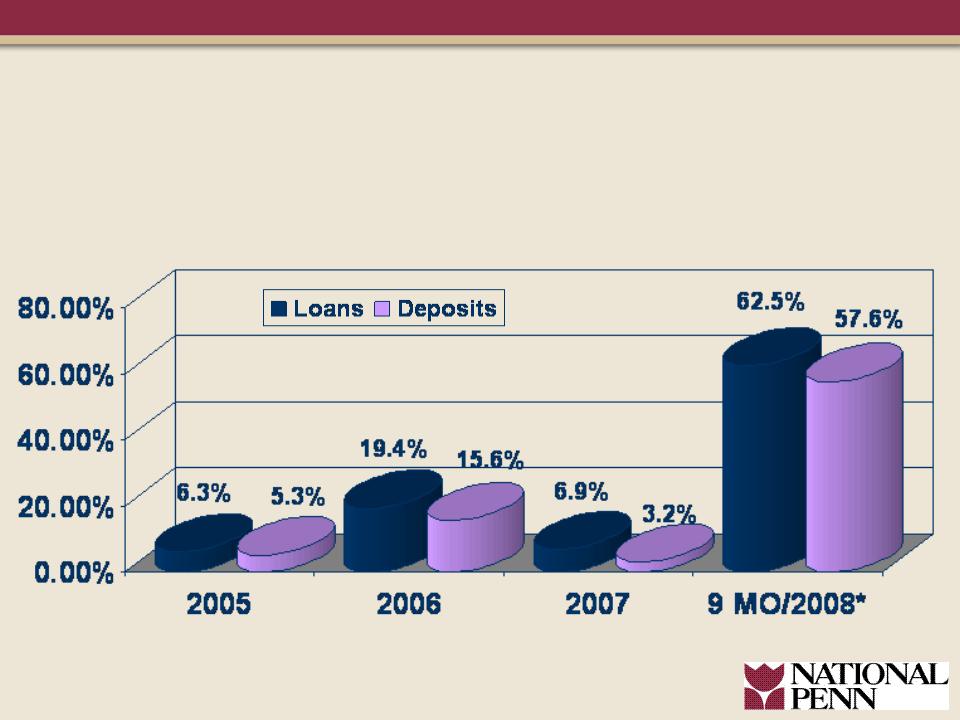
*9-Month percentage change not annualized.
National Penn Overview
Loan and Deposit Growth
Thank you Glenn.
We have benefited from solid total asset growth over the past 5 years of 15.3%.
Our overall strategy has been to balance organic growth and growth through acquisition – and we are challenged by our board to do both. Prior to our most recent acquisitions this year, over the past 5 years we have reflected about a 50/50 balance of organic to acquisition growth.
Through our acquisitive periods, we maintain our focus on organic growth. This slide depicts loan and deposit growth. National Penn has historically focused on quality loan growth funded by reasonably priced local deposits. To the extent that loan growth exceeds deposit growth, and as you can see this usually occurs as we maintain a strict deposit pricing discipline, we make ample use of overnight fed funds combined with opportunistic use of term wholesale funding during times of attractive pricing.
NEXT SLIDE
| | Northampton | Lehigh | Berks | Centre | Chester |
% of
National
Penn
deposits | 17.7% | 9.0% | 20.4% | 5.3% | 14.1% |
Market
Rank | 1 | 2 | 2 | 2 | 3 |
Market
Share | 22.5% | 9.4% | 14.2% | 16.5% | 9.2% |
# Offices | 23 | 16 | 20 | 5 | 19 |
National Penn Overview
Strong Market Share in Core Counties
We have achieved a strong share of market in the counties at the heart of our footprint. Our ultimate goal, in the specific counties that we target, is to achieve a market share of at least top five. Not that market share is necessarily the goal, but if we’re doing the right things in a targeted market, a dominant market position will be the result.
NEXT SLIDE
Excludes net gains from fair value
adjustments and non-recurring loss
Total
Revenues
$288.2
Million
Wealth 8.4%
Insurance 4.1%
Other 6.4%
Deposit Fees 10.1%
9 Months ending
September 30, 2008
Net Interest Income 71.0%
National Penn Overview
Diverse Sources of Revenue
Through the nine months ended September 30, 2008, Net Interest Income was 71% of total revenue. One of our strategic goals is to diversify our sources of revenue. We have made steady progress toward this goal. In 2003, Net Interest Income was 75% of total revenue. Most of this improvement occurred in our Wealth management business.
NEXT SLIDE
71.7%
71.7%
70.4%
70.4%
70.7%
70.7%
71.0%
71.0%
71.3%
71.3%
28.3%
28.3%
29.6%
29.6%
29.3%
29.3%
29.0%
29.0%
28.7%
28.7%
$60,322
$63,745
$86,222
$100,216
$101,741
Net Interest Income
Non Interest Income
National Penn Overview
Total Revenue - Quarterly Growth
Dollars of total revenue is up significantly since last year due primarily to the acquisitions of KNBT and Christiana. In addition to the growth through acquisitions, total revenue shows a steady increase through organic growth.
NEXT SLIDE
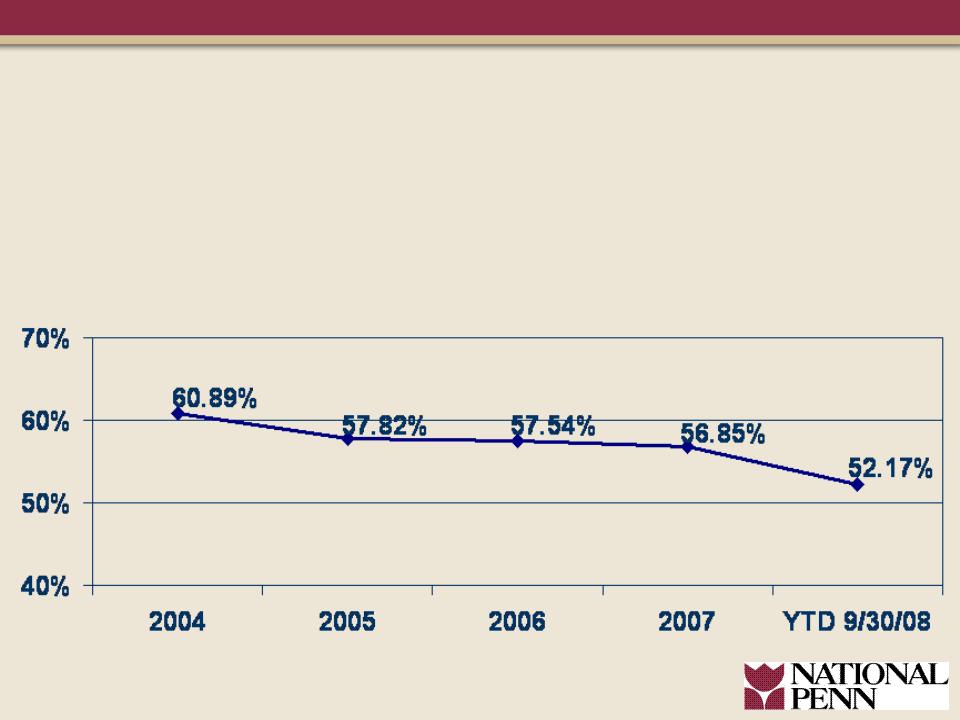
Efficiency Ratio
Source: SNL Financial
National Penn Overview
Focus on Cost Control
National Penn is very focused on cost control, and we are pleased to report that we are on target to achieve the stated expense reductions from our two acquisitions this year. Our efficiency ratio has declined significantly over the past few years, and stood at 52.17% for the nine months ended September 30, 2008. We believe that this record is especially impressive given the growth of our Wealth and Insurance units which typically tend to increase the efficiency ratio due to their lower profit margin than core banking.
NEXT SLIDE
Consistent Business Strategies
l Balanced organic and acquisition growth
l Superior asset quality and prudent risk
management practices
l Community banking market niche
l Profitable relationship development
l Diversified revenue streams
l Focus on shareholder value
National Penn’s consistent business strategies are key to its history of success.
If we leave you with anything about National Penn today, I hope you will remember these strategies as they truly represent who we are:
| • | Proven community banking delivery methods |
| • | A responsible credit culture |
| • | A balanced organic and acquisition growth strategy, and |
| • | Continued diversification of revenue streams. |
These are all important elements of an overarching goal of creating sustainable, profitable growth for longer term rewards for shareholders.
To speak more about National Penn is our CFO, Mike Reinhard. Mike?
NEXT SLIDE
National Penn’s Focus
l Capital Management
l Liquidity Management
l Credit Quality Management
Thank you Scott.
National Penn has a long history of consistent earnings growth with solid asset quality. This has been our primary focus. Our earnings growth strategy has included leveraging capital and liquidity. In the current environment, we are more focused on building capital and liquidity, and maintaining our solid asset quality. Therefore, I’ll spend my time today addressing those three factors.
NEXT SLIDE
National Penn’s Focus
Capital Management
Cash Dividends
l Dividend payout generally in the range of 45% to
50% of net income
l Current Yield = 4.07%
l Cash dividend paid every year since 1874
l 31 consecutive years of increase in annual cash
dividend
Fundamental to National Penn’s capital management is the belief that the cash dividend is a meaningful reward to shareholders for consistent earnings. So even in a year where dividend cuts are more common in our industry than dividend increases, last month our Board of Directors approved an increase in our cash dividend. We believe that this action was warranted since our earnings growth has been strong relative to peers. This marks the 31st consecutive year of an increase in our cash dividend. Additionally, National Penn has paid a cash dividend every year since 1874, the year of our founding.
NEXT SLIDE
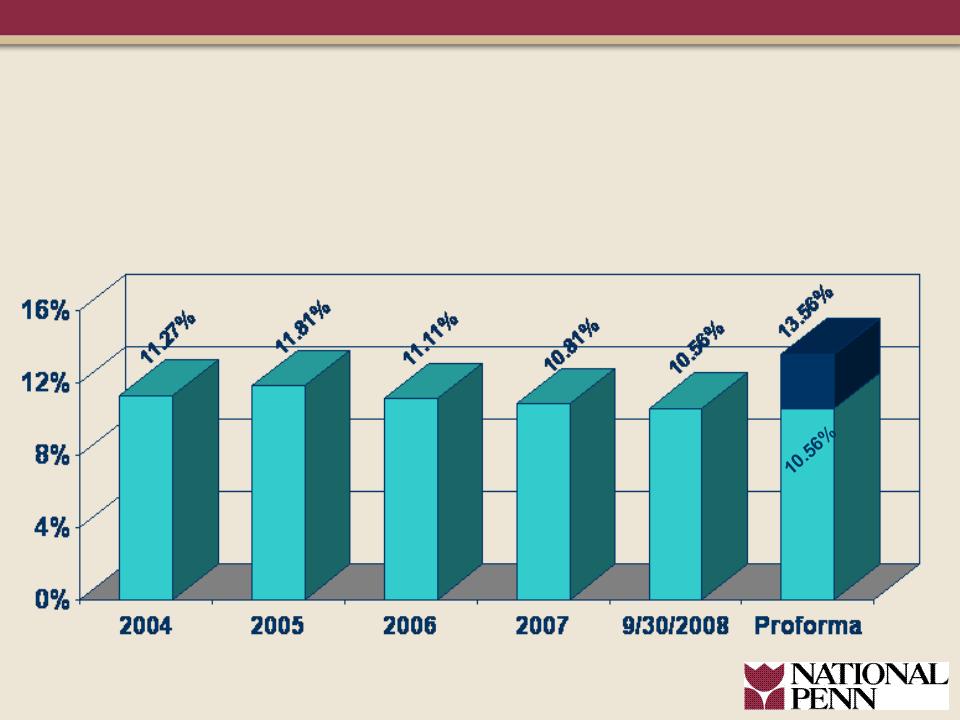
Total Risk Based Capital Ratio
Proforma includes up to the maximum investment
from Treasury Capital Purchase Program
National Penn’s Focus
Capital Management
At September 30, 2008, National Penn was in compliance with all applicable regulatory capital requirements. National Penn and our primary banks, National Penn Bank and Christiana Bank and Trust, are all considered “well capitalized” as defined by banking regulators.
While our most recent strategic use of capital to acquire quality partners has leveraged our capital ratios, we also understand the need for retaining and replenishing capital to support shareholder value for the longer-term. Therefore, in the context of the current environment, our focus has changed from leveraging our capital to providing an even stronger capital base.
With that in mind, we recently announced that we applied for $150 million dollars under the Treasury Department’s Capital Purchase Program. This $150 million dollars provides capital to supplement our regulatory capital ratios and will also provide capital for the opportunities that we see in this market. We expect that these will be in the form of acquisitions and organic growth due to the challenges of some of our larger competitors in our marketplace.
NEXT SLIDE
| | NPBC | Peers |
Loans/Deposits | 99.8% | 95.6% |
Non-Core Funding
Dependence | 32.96% | 32.25% |
Average Securities/
Average Assets | 24.6% | 18.19% |
NPBC Unused Borrowing Capacity in excess of $1 Billion
Peer Comparison - 3Q 2008 Liquidity Measure
Source: Peer information from SNL Financial
National Penn’s Focus
Liquidity Management
Our overarching goal in funds management is to generate reasonably priced deposits while maintaining our core deposit positions and overall liquidity to support loan growth. While our loan to deposit ratio is higher than our peers, our use of non-core funding is in line with peers and we have a larger securities portfolio from which to draw liquidity if necessary. National Penn also has varied sources of wholesale funding and at the current time, we have ample sources of funding to cover our anticipated asset growth.
NEXT SLIDE
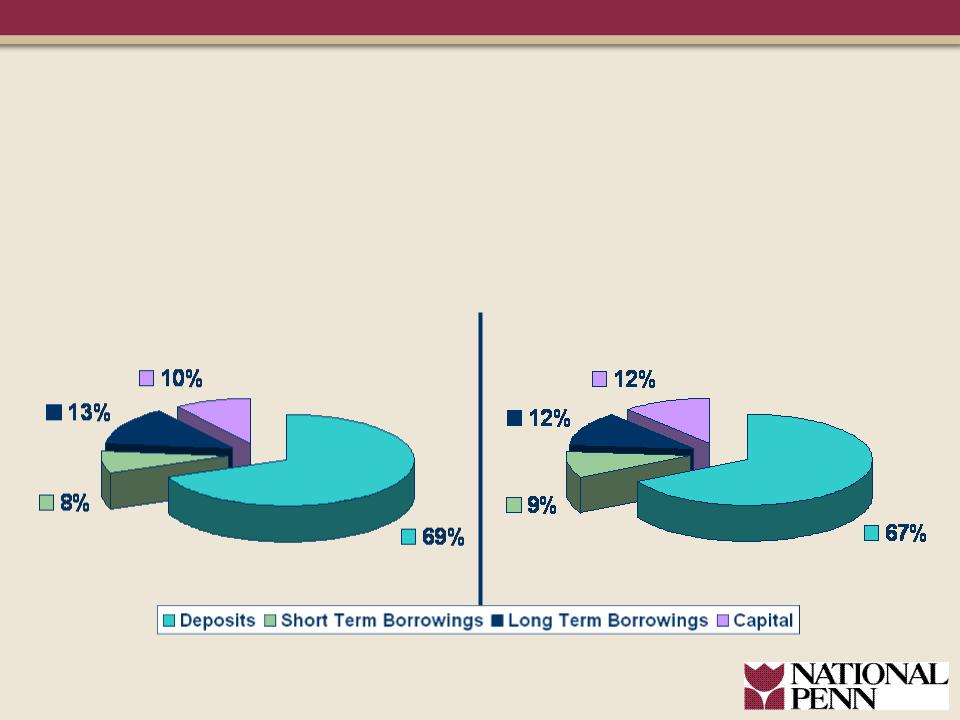
Diversified Sources of Funding
9/30/2007 - - $5.7 Billion 9/30/2008 - - $9.3 Billion
National Penn’s Focus
Liquidity Management
Our sources of funding are little changed from a year ago despite the disruptions in our market and the transformational nature of our two acquisitions earlier this year. The most significant change over the past year is a greater use of capital in our funding mix.
NEXT SLIDE
National Penn’s Focus
Credit Quality Management
l Conservative approach to risk management
l Diversification by industry and customer
segments
l Adequate reserves - strong coverage of
non-performing assets
l Mid-Atlantic region faring better than most
regions
Our culture of responsible lending and strong risk management practices continue to serve us well. We continue to review and manage our concentrations by loan type and borrower on a regular basis. Although our legal lending limit is over $100 million dollars, our largest commercial relationship – consisting of multiple credits – was $36 million dollars and the average loan size in our commercial portfolio was approximately $300,000 dollars.
Regarding the health of our region, while the real estate environment continues to play out, our market to date has weathered this challenge relatively well in that it did not experience the dramatic upswings and downturns seen in other areas of the country. However, as we are seeing a slowing in the sales pace of both new and existing homes, we continue to closely monitor this and the resultant economic drag that may impact our business owners and residential developers.
NEXT SLIDE
Commercial
67.4%
Consumer
32.6%
Loan Portfolio as of September 30, 2008
Total Loans = $6.21 Billion
National Penn’s Focus
Credit Quality Management
Our loan portfolio was $6.2 billion at September 30, 2008. Our portfolio is fairly balanced between commercial and industrial loans, commercial real estate, and consumer loans. We are focused on maintaining our momentum of quality loan growth throughout our market area.
NEXT SLIDE
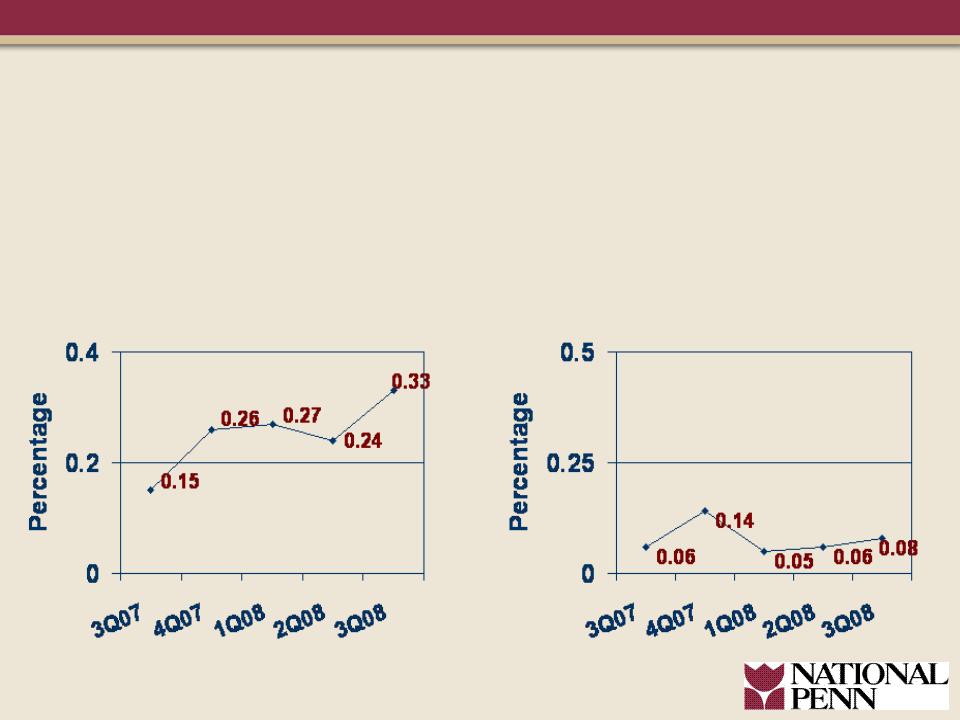
Non-Performing Assets
as a percentage of total assets
Net Charge-offs
to average loans (non-annualized)
National Penn’s Focus
Credit Quality Management
Our non-performing assets as a percentage of total assets was 33 basis points at September 30, 2008. While this level is elevated from most recent quarters, we find that it is consistent with the trends in our slowing economy. Year-to-date net charge-offs are 19 basis points.
It is important to note that National Penn’s non-performing assets and charge-offs are not a result of a consumer loan or residential mortgage issue, nor do they reflect any repercussions from subprime exposure. Our current charge-offs were driven by credits in the commercial and residential development segments of our portfolio. Currently, our loan portfolio remains in generally good condition and we will continue to monitor our portfolio’s risk exposure diligently.
NEXT SLIDE
Relative Credit Quality
Source: Peer information from SNL Financial
National Penn
Peers
Non-performing assets
to total assets
Net Charge-offs to
average loans
(last 12 months)
Allowance for loan
loss to loans
Allowance for loan loss
to non-performing assets
National Penn’s Focus
Credit Quality Management
While our non-performing assets and net charge-offs are elevated from historically low levels, our measures are better than peers and our reserves for loan losses are higher than peers. We especially focus on reserve coverage of non-performing assets. Our coverage of 2.75 times non-performing assets well exceeds our peer coverage of only .89.
NEXT SLIDE
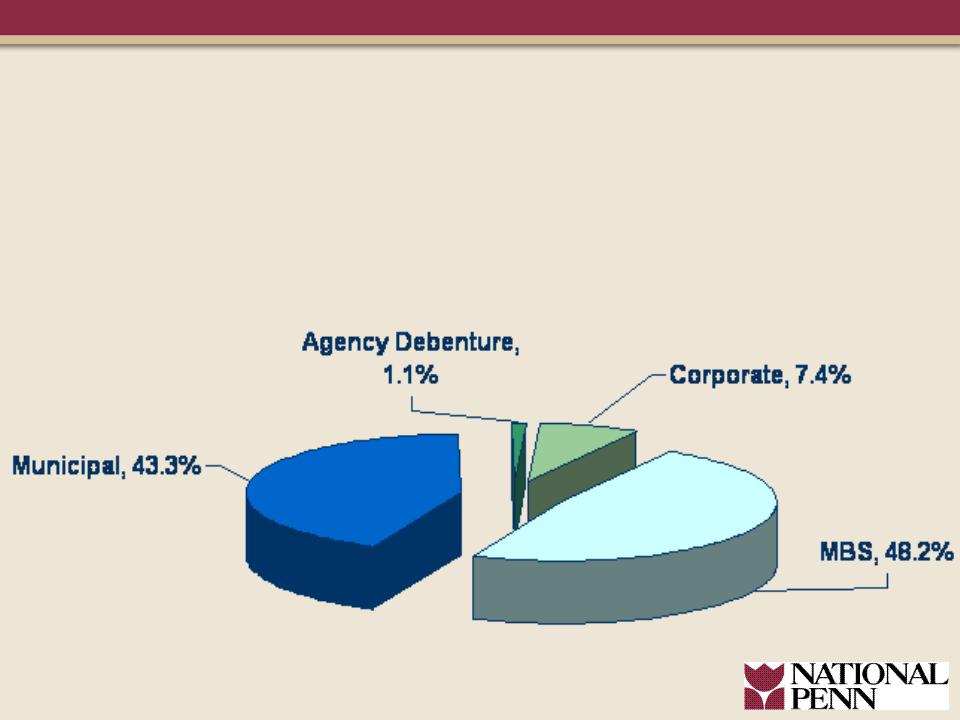
Total Investments = $1.98 Billion
Investment Portfolio
as of September 30, 2008
Our roughly $2 billion investment portfolio is predominantly split between mortgage-backed securities and municipal bonds, with a smaller percentage allocation to corporate credits. The corporate credits are trust preferred issues of banks and insurance companies. As we preferred to use our allotted time today to provide you with a fairly comprehensive picture of National Penn, we’ll note that we spoke about this specific topic in some detail in both our third quarter and second quarter 2008 earnings webcasts. The transcript of those webcasts are available on the investor relations page of our website.
I’ll now turn our presentation back to Glenn to offer his concluding comments. Glenn?
NEXT SLIDE
Investment Considerations
l Mid-Atlantic location of franchise
l Knowledgeable and experienced management team
l Prudent risk management practices
l Strong credit quality relative to peers
l Current focus on capital management, liquidity and
overall asset quality
l Leveraging of customer base and market disruption
opportunities across recently expanded footprint by
cross selling a full array of banking, insurance,
and trust offerings
Thank you Mike.
We are pleased that we have been able to continue to report strong relative performance, however we clearly acknowledge that we, and most others in our industry, are operating in troubling times. Recognizing this, I would like to recap some of the current and prospective reasons to consider including National Penn Bancshares in your portfolio:
| • | First, a terrific market area in the mid-Atlantic region, |
| • | A leadership team of financial industry professionals who are experienced and prepared to weather this latest challenging environment, |
| • | A culture of responsible decision-making that has supported National Penn's consistently solid performance, |
| • | An outstanding history of increased earnings per share and cash dividends, and a strong dividend payout ratio while striving for above-market price appreciation over the longer term, |
| • | The opportunities for future success provided by our recent acquisitions, and, |
| • | Our strategic focus on diversified earnings growth and cost containment efforts that will allow us to continue to build shareholder value. |
The earnings performance of financial institutions will likely continue to be challenged for the foreseeable future. With the additions of Christiana Bank and Trust and KNBT, we believe that we are well-positioned for success in this environment.
Our team is working very hard to overcome the challenges of this period, with a particular focus on maintaining credit quality, liquidity management, growth of capital, and cost control, in addition to leveraging the increased organic growth opportunities of our larger market area.
We believe that our total returns over the longer term is one of the best measures of how National Penn enhances shareholder value. We see a bright future for National Penn and hope you agree.
Thank you for your time today. We would be pleased to answer any questions you may have.