UNITED STATES
SECURITIES AND EXCHANGE COMMISSION
Washington, D.C. 20549
FORM N-CSR
CERTIFIED SHAREHOLDER REPORT OF REGISTERED
MANAGEMENT INVESTMENT COMPANIES
Investment Company Act file number: 811-3416
THE CALVERT FUND
(Exact name of registrant as specified in charter)
4550 Montgomery Avenue
Suite 1000N
Bethesda, Maryland 20814
(Address of Principal Executive Offices)
William M. Tartikoff, Esq.
4550 Montgomery Avenue
Suite 1000N
Bethesda, Maryland 20814
(Name and Address of Agent for Service)
Registrant's telephone number, including area code: (301) 951-4800
Date of fiscal year end: September 30
Date of reporting period: Six months ended March 31, 2011
Item 1. Report to Stockholders.
INFORMATION REGARDING CALVERT OPERATING COMPANY
NAME CHANGES
Effective on April 30, 2011, the following Calvert operating companies will be renamed as indicated:
| | |
| Current Company Name | Company Name on 4/30/11 | Company Description |
| |
| Calvert Group, Ltd. | Calvert Investments, Inc. | Corporate parent of each |
| | | operating company listed |
| | | below |
| |
| Calvert Asset Management | Calvert Investment | Investment advisor to the |
| Company, Inc. | Management, Inc. | Calvert Funds |
| |
| Calvert Distributors, Inc. | Calvert Investment Distributors, | Principal underwriter |
| | Inc. | and distributor for the |
| | | Calvert Funds |
| |
| Calvert Administrative | Calvert Investment | Administrative services |
| Services Company | Administrative Services, Inc. | provider for the Calvert |
| | | Funds |
| |
| Calvert Shareholder | Calvert Investment Services, | Shareholder servicing |
| Services, Inc. | Inc. | provider for the Calvert |
| | | Funds |
Choose Planet-friendly E-delivery!
Sign up now for on-line statements, prospectuses, and fund reports. In less than five minutes you can help reduce paper mail and lower fund costs.
Just go to www.calvert.com. If you already have an online account at Calvert, click on My Account, and select the documents you would like to receive via e-mail.
If you’re new to online account access, click on Login/Register to open an online account. Once you’re in, click on the E-delivery sign-up at the bottom of the Account Portfolio page and follow the quick, easy steps. Note: if your shares are not held directly at Calvert but through a brokerage firm, you must contact your broker for electronic delivery options available through their firm.
Dear Shareholder:
The financial markets ended the six-month period on a high note. The Federal Reserve’s announcement in the fall of 2010 of a second round of quantitative easing (QE2) and the extension in December of the Bush-era tax cuts for all income levels helped buoy the markets and pushed Treasury yields higher. The resulting increase in U.S. consumer spending and confidence helped drive a year-end rally.
This calm lasted until new storms arrived in the beginning of 2011. Civil and political unrest in the Middle East and North Africa sent the price of crude soaring and heightened energy security concerns in many countries around the world. In March, the tragic earthquake and tsunami struck Japan. Our sympathies go out to the people of Japan who lost loved ones in this disaster. The earthquake—and its impact on the country’s nuclear reactors—roiled global financial markets. The cumulative effect of these events sparked a brief sell-off in corporate bonds as investors moved into the relative safety of U.S. Treasuries.
Fixed-Income Markets Continue to be Volatile
Investment-grade corporate bonds edged down slightly for the reporting period, with the Barclays Capital U.S. Credit Index returning -0.98%, while high-yield bonds, as measured by the BofA Merrill Lynch U.S. High Yield Master II Index, returned 7.09%. Money-market returns remained flat, reflecting the Fed’s efforts to keep its target interest rate very low.
Corporate bonds continued to benefit from generally strong corporate earnings and lower default expectations during the fourth quarter of 2010. This trend continued during the first quarter of 2011 as investors became more comfortable moving into riskier asset classes to chase yield. However, most fixed-income sectors experienced significant volatility as investors reacted to the turmoil in the Middle East and the ensuing climb in oil prices as well as the disaster in Japan—which prompted some investors to move back into the relative safety of Treasuries as noted above.
Municipal bond returns suffered greatly in the final months of 2010 due to heavy municipal debt issuance, record municipal bond fund redemptions by retail investors, and fear of massive municipal debt defaults, which appears to be unfounded. Fortunately, prices steadied after the turn of the year due to slowing investor outflows and minimal new debt issuance.
Opportunities and Challenges Ahead
Overall, we are optimistic and expect a slow, gradual economic recovery to continue, which we believe should help sustain a corporate bond rally through the remainder of 2011. A low core inflation rate (which excludes food and energy prices) will likely
www.calvert.com CALVERT INCOME FUND SEMI-ANNUAL REPORT (UNAUDITED) 4
facilitate economic growth, while continued debt reduction, lingering high unemployment, and a struggling housing market will limit gains. Energy prices will remain a challenge until we see more resolution of the events in the Middle East and North Africa. Of course, more geopolitical crises, rising commodity prices, and inflation spikes could certainly dampen the markets.
In short, we believe the markets, the global economy, and your Calvert funds can successfully navigate through any temporary setbacks.
Discuss Your Portfolio Allocations with Your Advisor
Given the market shifts we have experienced, your overall portfolio asset allocation and investment strategy may no longer match your needs. Therefore, we recommend reviewing these with your financial advisor to ensure that your target mix of U.S. and international stocks, bonds, and cash is well-diversified and appropriate given your financial goals, time horizon, and risk tolerance.
We encourage you to visit our website, www.calvert.com, for fund information and updates as well as market and economic commentary from Calvert professionals.
As noted elsewhere in this report, the Calvert operating companies that provide services to the funds will change their names effective April 30, 2011. As part of the changes, Calvert Group, Ltd. will be known as Calvert Investments, Inc., and the funds’ advisor, Calvert Asset Management Company, Inc., will be known as Calvert Investment Management, Inc.
As always, we appreciate your investing with Calvert.

Barbara J. Krumsiek
President and CEO
Calvert Investments, Inc.
April 2011
www.calvert.com CALVERT INCOME FUND SEMI-ANNUAL REPORT (UNAUDITED) 5
PORTFOLIO MANAGEMENT DISCUSSION

Gregory Habeeb
Senior Vice President and Senior Portfolio Manager
of Calvert Investment Management, Inc.
Performance
For the six-month period ended March 31, 2011, Calvert Income Fund (Class A shares at NAV) returned 1.14%. Its benchmark index, the Barclays Capital U.S. Credit Index, returned -0.98% for the period. The Fund’s short relative duration strategy was primarily responsible for its outperformance. Duration is a measure of a portfolio’s sensitivity to changes in interest rates. The longer the duration, the greater the change in price relative to interest rate movements. The Fund’s allocation to high-yield bonds also helped relative returns.
Investment Climate
The six-month reporting period was characterized by four clear phases in interest-rate movements. The first was a steady and strong upward movement in interest rates. The 10-year Treasury yield increased from 2.33% in early October to 3.57% by mid-December. The Federal Reserve’s (Fed) announcement of new Treasury purchases in November did little to slow the advance as economic data improved. In December, many analysts raised their forecasts for eco-
| CALVERT INCOME FUND |
| MARCH 31, 2011 |
| | | | |
| Investment Performance | | | |
| (total return at NAV*) | | | | |
| | 6 Months | | 12 Months | |
| | ended | | ended | |
| | 3/31/11 | | 3/31/11 | |
| Class A | 1.14 | % | 5.57 | % |
| Class B | 0.66 | % | 4.75 | % |
| Class C | 0.72 | % | 4.87 | % |
| Class I | 1.45 | % | 6.36 | % |
| Class R | 0.96 | % | 5.33 | % |
| Class Y | 1.28 | % | 5.96 | % |
| Barclays Capital U.S. | | | | |
| Credit Index | -0.98 | % | 7.01 | % |
| Lipper BBB-Rated Corp | | | |
| Debt Funds Average | 0.80 | % | 8.15 | % |
| |
| SEC YIELDS | | | | |
| | 30 days ended | |
| | 3/31/11 | | 9/30/10 | |
| Class A | 2.86 | % | 2.75 | % |
| Class B | 2.11 | % | 1.98 | % |
| Class C | 2.27 | % | 2.16 | % |
| Class I | 3.67 | % | 3.54 | % |
| Class R | 2.76 | % | 2.64 | % |
| Class Y | 3.34 | % | 3.27 | % |
* Investment performance/return at NAV does not reflect the deduction of the Fund’s maximum 3.75% front-end sales charge or any deferred sales charge.
www.calvert.com CALVERT INCOME FUND SEMI-ANNUAL REPORT (UNAUDITED) 6
| | |
| Portfolio Statistics | |
| March 31, 2011 | | |
| | % of Total | |
| ECONOMIC SECTORS | Investments | |
| Asset-Backed Securities | 0.8 | % |
| Basic Materials | 1.0 | % |
| Communications | 3.7 | % |
| Consumer, Cyclical | 2.7 | % |
| Consumer, Non-cyclical | 3.7 | % |
| Diversified | 0.4 | % |
| Energy | 6.0 | % |
| Financials | 42.0 | % |
| Government | 24.7 | % |
| Industrials | 7.6 | % |
| Insurance | 0.2 | % |
| Mortgage Securities | 2.6 | % |
| Technology | 1.1 | % |
| Utilities | 3.5 | % |
| Total | 100 | % |
nomic growth, and stocks rallied as a larger-than-expected fiscal stimulus package was passed. The second phase featured a fairly quiet trading range. During phase three, from early to mid-February, yields rose again as the unemployment rate fell sharply, boosting confidence in the economy and triggering a rally in stocks. The 10-year Treasury yield peaked at 3.74%.
In the final phase, yields began to fall as turmoil in the Middle East pushed up the price of oil and raised doubts about the strength of the young economic expansion. Volatility increased in global financial markets. Doubt, uncertainty, and volatility were amplified by the terrible March 11 earthquake and tsunami in Japan. Treasury yields continued to fall, with the 10-year yield bottoming at 3.14% a few days after the disaster. After the shock wore off, stocks regained their footing and Treasury yields recovered some ground. The 10-year Treasury yield ended the reporting period near 3.5%, which was close to the
middle of the range over the full reporting period.1
During the reporting period, we estimate that the U.S. economy grew at an annualized rate of 3.3%.2 This is very near the 50-year average growth rate, but remains below the rate seen at a similar point in the business cycle after prior deep recessions in the post-WWII era. The core consumer price inflation (CPI) rate increased from 0.6% to 1.1% during the reporting period,3 so the Fed’s concern about unwanted disinflation abated. While the inflation rate was trending up, the level of both core and headline inflation rates remained below long-run averages. Market expectations for inflation in coming years increased to a level more in line with long-term averages.
Portfolio Strategy
The Fund benefitted from higher interest rates across the yield curve. The yields on two- and 10-year Treasuries increased by 35 and 91 basis points, respectively, over the six-month reporting period. The Fund’s allocation to high-yield bonds also helped relative performance. At the start of the reporting period, 12.89% of the Fund was allocated to high-yield bonds. Over the reporting period, the Barclays U.S. Corporate High Yield Index returned 7.23%, while the more broadly based Barclays Capital U.S. Credit
www.calvert.com CALVERT INCOME FUND SEMI-ANNUAL REPORT (UNAUDITED) 7
GROWTH OF $10,000
The graph below shows the value of a hypothetical $10,000 investment in the fund over the past 10 fiscal year periods. The results shown are for Class A shares and reflect the deduction of the maximum front-end sales charge of 3.75%, and assume the reinvestment of dividends. The result is compared with benchmarks that include a broad based market index and a Lipper peer group average. Market indexes are unmanaged and their results do not reflect the effect of expenses or sales charges. The Lipper average reflects the deduction of the category’s average front-end sales charge. The value of an investment in a different share class would be different.
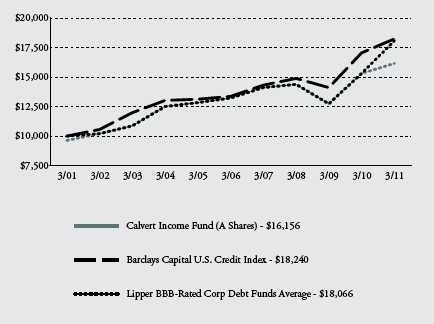
All performance data shown, including the graph above and the adjacent table, represents past performance, does not guarantee future results, assumes reinvestment of dividends and distributions and does not reflect the deduction of taxes that a shareholder would pay on the Fund’s/Portfolio’s distributions or the redemption of the Fund/Portfolio shares. The investment return and principal value of an investment will fluctuate so that an investor’s shares, when redeemed, may be worth more or less than their original cost. Current performance may be lower or higher than the performance data quoted; for current performance data visit www.calvert.com. The gross expense ratio from the current prospectus for Class A shares is 1.23%. This number may differ from the expense ratio shown elsewhere in this report because it is based on a different time period and, if applicable, does not include fee or expense waivers. Performance data quoted already reflects the deduction of the Fund’s/Portfolio’s operating expenses.
www.calvert.com CALVERT INCOME FUND SEMI-ANNUAL REPORT (UNAUDITED) 8
Index returned -0.98%.
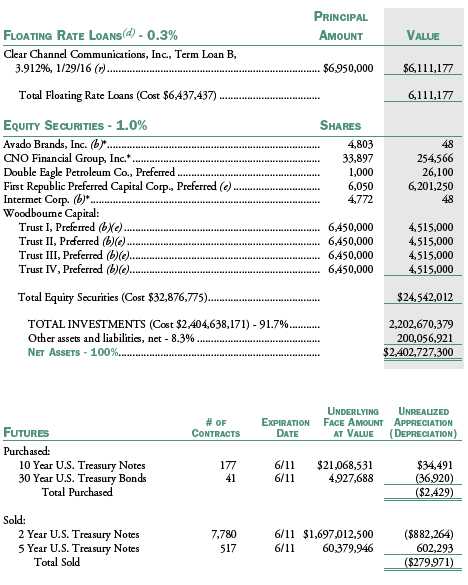
The Fund employed a yield-curve-flattening strategy. This had a mixed effect as some portions of the yield curve narrowed while others widened. The Fund was positioned to benefit from a narrowing of the yield differential between the 10- and 30-year U.S. Treasuries, which helped performance, as this section of the yield curve narrowed from 160 basis points to 104 basis points. However, the Fund also was positioned to benefit from narrowing of the yield differential between two- and 10- year Treasuries. This section of the yield curve widened from 209 to 265 basis points during the reporting period, which hurt performance. The Fund uses Treasury futures to hedge its interest rate position.
Outlook
The U.S. economy continues to recover from severe financial crisis. Deleveraging in household and financial sectors continues, suggesting moderate, not heated, growth and consumer price inflation. We believe monetary policy will remain easy in coming quarters while federal, state, and local fiscal stimuli continue to recede or contract. The impact from the long stretch of extraordinarily easy Fed policy, with its near-zero percent short-term interest rates and government bond purchases, is clear in the higher prices of stocks, bonds, and commodities, but not in consumer price indices.
CALVERT INCOME FUND
MARCH 31, 2011
AVERAGE ANNUAL TOTAL RETURNS
| class A shares | (with max load) | |
| One year | 1.62 | % |
| Five year | 3.31 | % |
| Ten year | 4.91 | % |
| |
| class B shares | (with max load) | |
| One year | 0.75 | % |
| Five year | 3.24 | % |
| Ten year | 4.48 | % |
| | |
| class C shares | (with max load) | |
| One year | 3.87 | % |
| Five year | 3.38 | % |
| Ten year | 4.57 | % |
| | |
| class I shares | | |
| One year | 6.36 | % |
| Five year | 4.79 | % |
| Ten year | 5.98 | % |
| | |
| class R shares* | | |
| One year | 5.33 | % |
| Five year | 3.85 | % |
| Ten year | 5.19 | % |
| | |
| class Y shares** | | |
| One year | 5.96 | % |
| Five year | 4.35 | % |
| Ten year | 5.45 | % |
* Performance results for Class R shares prior to October 31, 2006 reflect the performance of Class A shares at net asset value (NAV). Actual Class R share performance would have been lower than Class A share performance because of higher Rule 12b-1 fees and other class-specific expenses that apply to the Class R shares.
** Performance for Class Y Shares prior to February 29, 2008 reflects the performance of Class A shares at net asset value (NAV). Actual Class Y share performance would have been different.
www.calvert.com CALVERT INCOME FUND SEMI-ANNUAL REPORT (UNAUDITED) 9
Once again, events external to the United States created more uncertainty about the outlook for U.S. growth, inflation, and monetary policy. In addition to geopolitical tensions in the Middle East and natural disaster in Japan, deepening eurozone debt troubles have put Portugal on the brink of a bailout from the European Union/International Monetary Fund rescue facility. If the country does require a financial rescue package, Portugal would become the third eurozone member to receive a bailout. The rescue facility can accommodate Greece, Ireland, and Portugal, but a debt crisis in Spain would disrupt financial markets worldwide. The Spanish government’s interest rates, while elevated, are not near crisis levels. Spain will remain under pressure, however, and has the potential to unnerve investors from time to time.
Despite increased uncertainty in recent months, we expect the Fed to conclude its Treasury purchases by the end of June. This would complete the easing cycle and, apart from some minor operations, move the Fed to the sidelines for the remainder of the year. There are monetary policy scenarios that could move bond yields quite sharply, including the small chance that the Fed will tighten faster than expected if core inflation increases rapidly. In addition, in light of the recent international turmoil, there also is a chance—perhaps small—that the Fed will ease yet again if the economy weakens later this year. In uncertain times, we expect market volatility to erupt from time to time.
April 2011
1 Interest rate data sources: Chicago Board Options Exchange and Federal Reserve
2 According to Bureau of Economic Analysis data and forecasts from the Wall Street Journal Survey of Professional Forecasters
3 Latest data as of February 2011 from the Bureau of Labor Statistics
www.calvert.com CALVERT INCOME FUND SEMI-ANNUAL REPORT (UNAUDITED) 10
SHAREHOLDER EXPENSE EXAMPLE
As a shareholder of the Fund, you incur two types of costs: (1) transaction costs, including sales charges (loads) and redemption fees and (2) ongoing costs, including management fees; distribution (12b-1) fees; and other Fund expenses. This Example is intended to help you understand your ongoing costs (in dollars) of investing in the Fund and to compare these costs with the ongoing costs of investing in other mutual funds.
This Example is based on an investment of $1,000 invested at the beginning of the period and held for the entire period (October 1, 2010 to March 31, 2011).
Actual Expenses
The first line of the table below provides information about actual account values and actual expenses. You may use the information in this line, together with the amount you invested, to estimate the expenses that you paid over the period. Simply divide your account value by $1,000 (for example, an $8,600 account value divided by $1,000 = 8.6), then multiply the result by the number in the first line under the heading entitled “Expenses Paid During Period” to estimate the expenses you paid on your account during this period.
Hypothetical Example for Comparison Purposes
The second line of the table below provides information about hypothetical account values and hypothetical expenses based on the Fund’s actual expense ratio and an assumed rate of return of 5% per year before expenses, which is not the Fund’s actual return. The hypothetical account values and expenses may not be used to estimate the actual ending account balance or expenses you paid for the period. You may use this information to compare the ongoing costs of investing in the Fund and other funds. To do so, compare the 5% hypothetical example with the 5% hypothetical examples that appear in the shareholder reports of the other funds.
Please note that the expenses shown in the table are meant to highlight your ongoing costs only and do not reflect any transactional costs, such as sales charges (loads) or redemption fees. Therefore, the second line of the table is useful in comparing ongoing costs only, and will not help you determine the relative total costs of owning different funds. In addition, if these transactional costs were included, your costs would have been higher.
www.calvert.com CALVERT INCOME FUND SEMI-ANNUAL REPORT (UNAUDITED) 11
| | | | | | |
| | | BEGINNING | | ENDING ACCOUNT | | EXPENSES PAID |
| | | ACCOUNT VALUE | | VALUE | | DURING PERIOD* |
| | | 10/1/10 | | 3/31/11 | | 10/1/10 - 3/31/11 |
| class A | | | | | | |
| Actual | $ | 1,000.00 | $ | 1,012.70 | $ | 6.30 |
| Hypothetical | $ | 1,000.00 | $ | 1,018.67 | $ | 6.32 |
| (5% return per year before expenses) |
|
| | | | | | |
| class B | | | | | | |
| Actual | $ | 1,000.00 | $ | 1,008.50 | $ | 10.61 |
| Hypothetical | $ | 1,000.00 | $ | 1,014.37 | $ | 10.64 |
| (5% return per year before expenses) |
|
| | | | | | |
| class c | | | | | | |
| Actual | $ | 1,000.00 | $ | 1,009.10 | $ | 9.77 |
| Hypothetical | $ | 1,000.00 | $ | 1,015.20 | $ | 9.80 |
| (5% return per year before expenses) |
|
| | | | | | |
| class I | | | | | | |
| Actual | $ | 1,000.00 | $ | 1,016.30 | $ | 2.81 |
| Hypothetical | $ | 1,000.00 | $ | 1,022.14 | $ | 2.82 |
| (5% return per year before expenses) |
|
| |
| class R | | | | | | |
| Actual | $ | 1,000.00 | $ | 1,011.40 | $ | 7.37 |
| Hypothetical | $ | 1,000.00 | $ | 1,017.60 | $ | 7.39 |
| (5% return per year before expenses) |
|
| |
| class Y | | | | | | |
| Actual | $ | 1,000.00 | $ | 1,014.70 | $ | 4.45 |
| Hypothetical | $ | 1,000.00 | $ | 1,020.51 | $ | 4.47 |
| (5% return per year before expenses) |
|
* Expenses are equal to the Fund’s annualized expense ratio of 1.26%, 2.12%, 1.95%, 0.56%, 1.47% and 0.89% for Class A, Class B, Class C, Class I, Class R and Class Y, respectively, multiplied by the average account value over the period, mutliplied by 182/365 (to reflect the one-half year period).
www.calvert.com CALVERT INCOME FUND SEMI-ANNUAL REPORT (UNAUDITED) 12
| | | | | |
| SCHEDULE OF INVESTMENTS |
| MARCH 31, 2011 |
| |
| |
| | | | PRINCIPAL | | |
| Asset-Backed Securities - 0.7% | | AMOUNT | | VALUE |
| | ACLC Business Loan Receivables Trust, 0.905%, 10/15/21 (e)(r) | $ | 272,209 | $ | 269,800 |
| | Capital One Auto Finance Trust, 0.285%, 4/15/14 (r) | | 6,702,534 | | 6,658,273 |
| | Captec Franchise Trust, 8.155%, 6/15/13 (e) | | 3,969,194 | | 4,005,579 |
| | Centex Home Equity, 7.36%, 7/25/32 (r) | | 120,536 | | 15,384 |
| | Countrywide Asset-Backed Certificates, 0.70%, 11/25/34 (r) | | 3,012,758 | | 2,657,786 |
| | Fifth Third Auto Trust, 4.81%, 1/15/13 | | 3,029,606 | | 3,064,417 |
| | FMAC Loan Receivables Trust: | | | | |
| | 1.35%, 11/15/18 (e)(r)(u) | | 824,982 | | 9,797 |
| | 6.74%, 11/15/20 (e) | | 400,066 | | 277,695 |
| |
| | Total Asset-Backed Securities (Cost $17,520,470) | | | | 16,958,731 |
| |
| |
| | collateralIzed Mortgage-Backed | | | | |
| | obligatIons (Privately originated) - 0.9% | | | | |
| | Banc of America Mortgage Securities, Inc., 0.279%, 1/25/34 (r) | | 63,539,075 | | 240,953 |
| | Countrywide Home Loan Mortgage Pass Through Trust, | | | | |
| | 0.59%, 6/25/35 (e)(r) | | 1,765,077 | | 1,309,722 |
| | GMAC Mortgage Corp. Loan Trust, 5.00%, 5/25/18 (e) | | 116,771 | | 61,603 |
| | Impac CMB Trust: | | | | |
| | 0.89%, 9/25/34 (r) | | 959,729 | | 749,103 |
| | 0.77%, 4/25/35 (r) | | 5,176,518 | | 4,207,873 |
| | 0.87%, 4/25/35 (r) | | 1,854,919 | | 1,010,821 |
| | 0.79%, 5/25/35 (r) | | 2,428,526 | | 1,898,515 |
| | 0.57%, 8/25/35 (r) | | 5,440,705 | | 4,151,187 |
| | Salomon Brothers Mortgage Securities VII, Inc., | | | | |
| | 3.199%, 9/25/33 (r) | | 193,250 | | 75,375 |
| | Structured Asset Securities Corp., 5.50%, 6/25/35 | | 4,291,000 | | 3,227,670 |
| | WaMu Mortgage Pass Through Certificates, 2.725%, 10/25/35 (r) | | 5,697,000 | | 4,709,247 |
| |
| | Total Collateralized Mortgage-Backed Obligations | | | | |
| | (Privately Originated) (Cost $22,614,175) | | | | 21,642,069 |
| |
| |
| |
| | commercial Mortgage-Backed securItIes - 0.2% | | | | |
| | Bank of America-First Union NB Commercial Mortgage, | | | | |
| | 5.464%, 4/11/37 | | 3,031,154 | | 3,052,111 |
| | JP Morgan Chase Commercial Mortgage Securities Corp., | | | | |
| | 6.429%, 4/15/35 | | 2,103,163 | | 2,115,73 |
| |
| | Total Commercial Mortgage-Backed Securities (Cost $5,236,607) | | | | 5,167,844 |
www.calvert.com CALVERT INCOME FUND SEMI-ANNUAL REPORT (UNAUDITED) 13
| | | | |
| | | PRINCIPAL | | |
| corporate Bonds - 65.9% | | AMOUNT | | VALUE |
| Affiliated Computer Services, Inc., 5.20%, 6/1/15 | $ | 7,000,000 | $ | 7,535,993 |
| Alcoa, Inc., 6.15%, 8/15/20 | | 4,000,000 | | 4,229,413 |
| Alliance Mortgage Investments: | | | | |
| 12.61%, 6/1/10 (b)(r)(x)* | | 3,077,944 | | - |
| 15.36%, 12/1/10 (b)(r)(x)* | | 17,718,398 | | - |
| Ally Financial, Inc.: | | | | |
| 6.00%, 12/15/11 | | 1,075,000 | | 1,093,813 |
| 6.00%, 12/15/11 | | 15,000,000 | | 15,262,500 |
| American Airlines Pass Through Trust: | | | | |
| Series 2001-2, Class A, 7.858%, 4/1/13 | | 4,000,000 | | 4,105,000 |
| Series 2001-2, Class B, 8.608%, 10/1/12 | | 7,000,000 | | 7,000,000 |
| American Express Bank FSB, 0.406%, 6/12/12 (r) | | 5,000,000 | | 4,986,203 |
| ANZ National International Ltd., 1.309%, 12/20/13 (e)(r) | | 10,000,000 | | 10,000,111 |
| APL Ltd., 8.00%, 1/15/24 (b) | | 21,057,000 | | 18,920,978 |
| ArcelorMittal, 5.50%, 3/1/21 | | 10,100,000 | | 9,932,119 |
| Asciano Finance Ltd., 4.625%, 9/23/20 (e) | | 6,750,000 | | 6,182,146 |
| Asian Development Bank, 6.22%, 8/15/27 | | 2,470,000 | | 2,783,063 |
| Atlantic Marine Corp. Communities LLC, 6.158%, 12/1/51 (e) | | 23,670,000 | | 21,907,951 |
| Atlantic Mutual Insurance Co., 8.15%, 2/15/28 (b)(e)(p)* | | 53,561,000 | | - |
| BAC Capital Trust XV, 1.111%, 6/1/56 (r) | | 36,870,000 | | 25,723,140 |
| Bank of America Corp., 5.875%, 1/5/21 | | 1,000,000 | | 1,041,545 |
| Bank of Nova Scotia, 2.90%, 3/29/16 | | 12,000,000 | | 11,930,700 |
| Bank of Tokyo-Mitsubishi UFJ Ltd., 0.973%, 2/24/14 (e)(r) | | 3,000,000 | | 3,000,035 |
| Bayfront Regional Development Corp. VRDN, 0.27%, 11/1/27 (r) | | 1,000,000 | | 1,000,000 |
| Bayview Research Center Finance Trust, 6.33%, 1/15/37 (b)(e) | | 20,919,247 | | 20,500,862 |
| BNSF Funding Trust I, 6.613% to 1/15/26, floating rate | | | | |
| thereafter to 12/15/55 (r) | | 37,001,000 | | 38,434,789 |
| Bochasanwais Shree Akshar Purushottam Swaminarayan Sanstha, Inc. | | | | |
| VRDN, 0.35%, 6/1/22 (r) | | 185,000 | | 185,000 |
| C8 Capital SPV Ltd., 6.64% to 12/31/14, floating rate | | | | |
| thereafter to 12/29/49 (b)(e)(r) | | 15,850,000 | | 12,259,975 |
| C10 Capital SPV Ltd., 6.722% to 12/31/16, floating rate | | | | |
| thereafter to 12/31/49 (b)(e)(r) | | 8,300,000 | | 6,453,250 |
| Calpine Corp. Escrow, (b)* | | 375,000 | | - |
| Cantor Fitzgerald LP, 7.875%, 10/15/19 (e) | | 12,450,000 | | 12,746,354 |
| Cellco Partnership, 2.914%, 5/20/11 (r) | | 33,500,000 | | 33,602,869 |
| Cemex SAB de CV, 5.301%, 9/30/15 (e)(r) | | 6,000,000 | | 5,951,967 |
| Charter One Bank, 6.375%, 5/15/12 | | 10,000,000 | | 10,461,498 |
| Chase Capital VI, 0.929%, 8/1/28 (r) | | 7,250,000 | | 6,117,194 |
| Citigroup Funding, Inc., 0.634%, 4/30/12 (r) | | 33,170,000 | | 33,315,882 |
| Citigroup, Inc.: | | | | |
| 2.312%, 8/13/13 (r) | | 15,500,000 | | 15,957,103 |
| 0.435%, 3/7/14 (r) | | 5,020,000 | | 4,904,059 |
| Comcast Corp.: | | | | |
| 5.90%, 3/15/16 | | 1,500,000 | | 1,666,744 |
| 6.55%, 7/1/39 | | 8,800,000 | | 9,087,343 |
| Corn Products International, Inc.: | | | | |
| 4.625%, 11/1/20 | | 2,900,000 | | 2,854,350 |
| 6.625%, 4/15/37 | | 1,000,000 | | 1,038,659 |
| Credit Suisse USA, Inc., 0.514%, 8/16/11 (r) | | 3,000,000 | | 3,001,033 |
| Crown Castle Towers LLC: | | | | |
| 4.174%, 8/15/17 (e) | | 2,825,000 | | 2,810,875 |
| 4.883%, 8/15/20 (e) | | 4,558,000 | | 4,552,303 |
www.calvert.com CALVERT INCOME FUND SEMI-ANNUAL REPORT (UNAUDITED) 14
| | | | |
| | | PRINCIPAL | | |
| CORPORATE BONDS - CONT’D | | AMOUNT | | VALUE |
| CVS Pass-Through Trust: | | | | |
| 5.789%, 1/10/26 (e) | $ | 3,916,152 | $ | 4,057,821 |
| 5.88%, 1/10/28 | | 232,221 | | 234,039 |
| 6.036%, 12/10/28 | | 8,044,044 | | 8,396,507 |
| 6.943%, 1/10/30 | | 3,592,708 | | 3,913,034 |
| 8.353%, 7/10/31 (e) | | 3,399,646 | | 4,004,180 |
| 7.507%, 1/10/32 (e) | | 3,329,708 | | 3,818,976 |
| Dell, Inc., 0.91%, 4/1/14 (r) | | 4,000,000 | | 4,008,416 |
| Delta Air Lines Pass Through Trust, 6.75%, 5/23/17 | | 2,500,000 | | 2,418,750 |
| Deutsche Bank AG, 0.953%, 1/18/13 (r) | | 7,000,000 | | 7,024,150 |
| Deutsche Bank Capital Funding Trust VII, 5.628% to 1/19/16, | | | | |
| floating rate thereafter to 1/29/49 (e)(r) | | 3,000,000 | | 2,730,000 |
| Developers Diversified Realty Corp., 4.75%, 4/15/18 | | 4,700,000 | | 4,582,500 |
| Discover Bank, 7.00%, 4/15/20 | | 2,500,000 | | 2,752,465 |
| Discover Financial Services: | | | | |
| 6.45%, 6/12/17 | | 1,375,000 | | 1,491,580 |
| 10.25%, 7/15/19 | | 5,604,000 | | 7,185,006 |
| DnB NOR Boligkreditt AS, 2.10%, 10/14/16 (e) | | 6,930,000 | | 6,652,071 |
| Dominion Resources, Inc., 6.30% to 9/30/11, floating rate | | | | |
| thereafter to 9/30/66 (r) | | 23,665,000 | | 23,369,188 |
| Enterprise Products Operating LLC, 7.034% to 1/15/18, | | | | |
| floating rate thereafter to 1/15/68 (r) | | 52,375,000 | | 54,339,064 |
| FBG Finance Ltd., 5.125%, 6/15/15 (e) | | 4,000,000 | | 4,224,830 |
| Fifth Third Bank, 0.424%, 5/17/13 (r) | | 10,000,000 | | 9,805,684 |
| First Niagara Financial Group, Inc., 6.75%, 3/19/20 | | 3,000,000 | | 3,228,979 |
| First Republic Bank, 7.75%, 9/15/12 | | 500 | | 531 |
| Fleet Capital Trust V, 1.309%, 12/18/28 (r) | | 10,600,000 | | 8,067,594 |
| Ford Motor Credit Co. LLC: | | | | |
| 5.56%, 6/15/11 (r) | | 16,350,000 | | 16,390,875 |
| 3.053%, 1/13/12(r) | | 7,550,000 | | 7,616,138 |
| 7.80%, 6/1/12 | | 2,250,000 | | 2,385,000 |
| 7.00%, 4/15/15 | | 12,000,000 | | 12,930,000 |
| 8.00%, 12/15/16 | | 2,000,000 | | 2,260,000 |
| 5.75%, 2/1/21 | | 1,500,000 | | 1,473,750 |
| Fort Knox Military Housing: | | | | |
| 5.815%, 2/15/52 (e) | | 2,975,000 | | 2,814,380 |
| 5.915%, 2/15/52 (b)(e) | | 10,455,000 | | 9,218,069 |
| Foster’s Finance Corp., 6.875%, 6/15/11 (e) | | 5,921,000 | | 5,978,453 |
| General Electric Capital Corp.: | | | | |
| 0.429%, 6/20/13 (r) | | 7,000,000 | | 6,911,324 |
| 5.40%, 2/15/17 | | 3,000,000 | | 3,248,212 |
| Glitnir Banki HF: | | | | |
| 3.046%, 4/20/10 (e)(r)(y)* | | 42,295,000 | | 12,899,975 |
| 3.226%, 1/21/11 (e)(r)(y)* | | 32,920,000 | | 9,546,800 |
| 6.375%, 9/25/12 (e)(y)* | | 600,000 | | 183,000 |
| 6.693% to 6/15/11, floating rate thereafter to 6/15/16 (b)(e)(r)(y)* | | 8,400,000 | | 84,000 |
| GMAC Commercial Mortgage Asset Corp., 6.107%, 8/10/52 (e) | | 37,050,000 | | 30,160,182 |
| Golden State Petroleum Transport Corp., 8.04%, 2/1/19 | | 9,992,927 | | 9,783,637 |
| Goldman Sachs Capital III, 1.081%, 9/29/49 (r) | | 4,250,000 | | 3,354,031 |
www.calvert.com CALVERT INCOME FUND SEMI-ANNUAL REPORT (UNAUDITED) 15
| | | | |
| | | PRINCIPAL | | |
| CORPORATE BONDS - CONT’D | | AMOUNT | | VALUE |
| Goldman Sachs Group, Inc.: | | | | |
| 3.625%, 2/7/16 | $ | 3,000,000 | $ | 2,969,608 |
| 6.15%, 4/1/18 | | 10,500,000 | | 11,351,507 |
| 6.00%, 6/15/20 | | 1,500,000 | | 1,580,900 |
| 6.75%, 10/1/37 | | 1,930,000 | | 1,925,220 |
| Great River Energy, 5.829%, 7/1/17 (e) | | 40,187,968 | | 43,767,860 |
| Health Care REIT, Inc., 5.25%, 1/15/22 | | 2,000,000 | | 1,953,224 |
| Hertz Corp., 6.75%, 4/15/19 (e) | | 2,000,000 | | 1,980,000 |
| Hewlett-Packard Co., 1.361%, 5/27/11 (r) | | 7,200,000 | | 7,211,302 |
| Home Depot, Inc., 4.40%, 4/1/21 | | 2,950,000 | | 2,940,154 |
| HSBC Bank plc, 1.103%, 1/17/14 (e)(r) | | 4,000,000 | | 3,997,773 |
| Hyundai Motor Manufacturing, 4.50%, 4/15/15 (e) | | 2,500,000 | | 2,561,850 |
| ING Bank NV, 4.00%, 3/15/16 (e) | | 7,000,000 | | 6,985,674 |
| International Lease Finance Corp., 7.125%, 9/1/18 (e) | | 3,100,000 | | 3,324,750 |
| JET Equipment Trust, 7.63%, 8/15/12 (b)(e)(w)* | | 109,297 | | 601 |
| Jones Group, Inc., 6.875%, 3/15/19 | | 2,000,000 | | 1,965,000 |
| JPMorgan Chase & Co., 0.559%, 12/26/12 (r) | | 2,330,000 | | 2,341,433 |
| JPMorgan Chase Capital XXI, 1.254%, 2/2/37 (r) | | 6,899,000 | | 5,657,000 |
| JPMorgan Chase Capital XXIII, 1.313%, 5/15/77 (r) | | 21,800,000 | | 18,043,969 |
| Kansas City Southern de Mexico SA de CV, 7.375%, 6/1/14 | | 150,000 | | 156,000 |
| Kaupthing Bank HF, 3.491%, 1/15/10 (b)(e)(r)(y)* | | 39,000,000 | | 11,310,000 |
| Kern River Funding Corp., 6.676%, 7/31/16 (e) | | 81,177 | | 91,746 |
| Kinder Morgan Finance Co. LLC, 6.00%, 1/15/18 (e) | | 2,220,000 | | 2,300,475 |
| Land O’Lakes Capital Trust I, 7.45%, 3/15/28 (e) | | 56,569,000 | | 51,194,945 |
| Leucadia National Corp., 8.125%, 9/15/15 | | 7,320,000 | | 8,084,660 |
| LL & P Wind Energy, Inc. Washington Revenue Bonds: | | | | |
| 5.733%, 12/1/17 (e) | | 8,060,000 | | 8,109,327 |
| 5.983%, 12/1/22 (e) | | 14,695,000 | | 14,230,197 |
| 6.192%, 12/1/27 (e) | | 3,925,000 | | 3,688,754 |
| Lumbermens Mutual Casualty Co.: | | | | |
| 9.15%, 7/1/26 (e)(m)* | | 51,271,000 | | 446,058 |
| 8.30%, 12/1/37 (e)(m)* | | 33,720,000 | | 293,364 |
| 8.45%, 12/1/49 (e)(m)* | | 1,000,000 | | 8,700 |
| Masco Corp.: | | | | |
| 4.80%, 6/15/15 | | 4,540,000 | | 4,506,441 |
| 7.125%, 3/15/20 | | 10,600,000 | | 10,957,750 |
| MBNA Capital, 1.104%, 2/1/27 (r) | | 900,000 | | 692,666 |
| McGuire Air Force Base Military Housing Project, | | | | |
| 5.611%, 9/15/51 (e) | | 11,420,000 | | 9,695,580 |
| MetLife Institutional Funding II: | | | | |
| 0.709%, 3/27/12 (e)(r) | | 10,000,000 | | 10,000,124 |
| 0.703%, 7/12/12 (e)(r) | | 23,700,000 | | 23,744,935 |
| Metropolitan Life Global Funding I: | | | | |
| 2.303%, 4/14/11 (e)(r) | | 12,280,000 | | 12,282,468 |
| 0.703%, 7/13/11 (e)(r) | | 13,350,000 | | 13,349,630 |
| MMA Financial Holdings, Inc., 0.75%, 5/3/34 (b) | | 50,800,000 | | 10,160,000 |
www.calvert.com CALVERT INCOME FUND SEMI-ANNUAL REPORT (UNAUDITED) 16
| | | | |
| | | PRINCIPAL | | |
| CORPORATE BONDS - CONT’D | | AMOUNT | | VALUE |
| Morgan Stanley: | | | | |
| 0.592%, 2/10/12 (r) | $ | 5,770,000 | $ | 5,784,481 |
| 6.00%, 4/28/15 | | 3,000,000 | | 3,255,025 |
| 5.375%, 10/15/15 | | 2,000,000 | | 2,124,265 |
| 0.753%, 10/18/16 (r) | | 6,500,000 | | 6,079,176 |
| 6.25%, 8/28/17 | | 7,000,000 | | 7,537,240 |
| 7.30%, 5/13/19 | | 5,000,000 | | 5,616,035 |
| 5.50%, 1/26/20 | | 6,000,000 | | 6,019,562 |
| Motors Liquidation Co.: | | | | |
| 7.125%, 7/15/13 (ii)* | | 5,000,000 | | 1,412,500 |
| 7.70%, 4/15/16 (ii)* | | 10,000,000 | | 2,800,000 |
| 8.25%, 7/15/23 (ii)* | | 5,000,000 | | 1,412,500 |
| 8.10%, 6/15/24 (ii)* | | 7,150,000 | | 1,984,125 |
| 7.40%, 9/1/25 (ii)* | | 2,950,000 | | 818,625 |
| National Fuel Gas Co., 6.50%, 4/15/18 | | 4,800,000 | | 5,239,491 |
| National Semiconductor Corp., 3.95%, 4/15/15 | | 5,745,000 | | 5,853,054 |
| NationsBank Cap Trust III, 0.853%, 1/15/27 (r) | | 1,677,000 | | 1,292,747 |
| Nationwide Health Properties, Inc.: | | | | |
| 6.90%, 10/1/37 | | 10,460,000 | | 10,745,767 |
| 6.59%, 7/7/38 | | 4,023,000 | | 4,161,339 |
| NextEra Energy Capital Holdings, Inc., 0.712%, 11/9/12 (r) | | 1,300,000 | | 1,303,157 |
| Ohana Military Communities LLC: | | | | |
| 5.88%, 10/1/51 (b)(e) | | 23,440,000 | | 20,400,535 |
| 6.15%, 10/1/51 (b)(e) | | 10,000,000 | | 8,993,200 |
| OPTI Canada, Inc.: | | | | |
| 9.00%, 12/15/12 (e) | | 4,000,000 | | 4,035,000 |
| 9.75%, 8/15/13 (e) | | 5,350,000 | | 5,343,313 |
| 8.25%, 12/15/14 | | 1,000,000 | | 532,500 |
| Orkney Re II plc, Series B, 6.096%, 12/21/35 (b)(e)(r)(w)* | | 19,550,000 | | - |
| Osprey Properties Company, LLC VRDN, 0.28%, 6/1/27 (r) | | 1,000,000 | | 1,000,000 |
| Overseas Shipholding Group, Inc.: | | | | |
| 8.125%, 3/30/18 | | 3,600,000 | | 3,537,000 |
| 7.50%, 2/15/24 | | 5,080,000 | | 4,330,700 |
| Pacific Pilot Funding Ltd., 1.053%, 10/20/16 (e)(r) | | 5,604,466 | | 5,157,991 |
| Pioneer Natural Resources Co.: | | | | |
| 5.875%, 7/15/16 | | 25,840,000 | | 27,132,000 |
| 6.65%, 3/15/17 | | 2,295,000 | | 2,472,863 |
| 7.20%, 1/15/28 | | 1,000,000 | | 1,035,000 |
| Potlatch Corp., 7.50%, 11/1/19 | | 1,200,000 | | 1,270,500 |
| PPF Funding, Inc., 5.50%, 1/15/14 (e) | | 500,000 | | 522,781 |
| Prudential Holdings LLC, 7.245%, 12/18/23 (e) | | 3,900,000 | | 4,401,697 |
| Public Steers Trust, 6.646%, 11/15/18 (b) | | 3,521,956 | | 3,816,427 |
| Senior Housing Properties Trust, 8.625%, 1/15/12 | | 3,000,000 | | 3,138,750 |
| Skyway Concession Co. LLC, 0.587%, 6/30/17 (e)(r) | | 10,140,000 | | 9,241,079 |
| Southern Co., 0.703%, 10/21/11 (r) | | 2,600,000 | | 2,606,029 |
| SPARCS Trust 99-1, STEP, 0.00% to 4/15/19, 7.697% | | | | |
| thereafter to 10/15/97 (b)(e)(r) | | 26,500,000 | | 9,657,130 |
| Stadshypotek AB, 0.857%, 9/30/13 (e)(r) | | 23,000,000 | | 23,000,213 |
| State Street Bank and Trust Co., 0.51%, 9/15/11 (r) | | 8,795,000 | | 8,804,395 |
| Steelcase, Inc., 6.375%, 2/15/21 | | 1,500,000 | | 1,518,755 |
www.calvert.com CALVERT INCOME FUND SEMI-ANNUAL REPORT (UNAUDITED) 17
| | | | |
| | | PRINCIPAL | | |
| CORPORATE BONDS - CONT’D | | AMOUNT | | VALUE |
| SunTrust Bank: | | | | |
| 0.424%, 5/21/12 (r) | $ | 9,150,000 | $ | 9,130,187 |
| 0.603%, 8/24/15 (r) | | 3,350,000 | | 3,164,599 |
| Systems 2001 AT LLC, 6.664%, 9/15/13 (e) | | 30,468,580 | | 32,525,209 |
| Telecom Italia Capital SA, 6.20%, 7/18/11 | | 4,550,000 | | 4,615,727 |
| Telefonica Emisiones SAU: | | | | |
| 3.992%, 2/16/16 | | 3,000,000 | | 3,008,622 |
| 5.134%, 4/27/20 | | 6,500,000 | | 6,449,812 |
| 5.462%, 2/16/21 | | 4,000,000 | | 4,048,499 |
| TIERS Trust: | | | | |
| 8.45%, 12/1/17 (b)(e)(n)* | | 8,559,893 | | 8,560 |
| STEP, 0.00% to 10/15/33, 7.697% thereafter to 10/15/97 (b)(e)(r) | | 12,295,000 | | 1,119,583 |
| 7.697%, 10/15/97 (b)(e)(r) | | 11,001,000 | | 4,411,401 |
| Time Warner, Inc., 4.75%, 3/29/21 | | 1,500,000 | | 1,484,538 |
| Toll Road Investors Partnership II LP, Zero Coupon: | | | | |
| 2/15/28 (e) | | 16,737,000 | | 3,460,482 |
| 2/15/29 (e) | | 12,600,000 | | 2,372,634 |
| 2/15/43 (b)(e) | | 196,950,000 | | 51,951,471 |
| 2/15/45 (b)(e) | | 534,547,145 | | 81,502,403 |
| Total Capital Canada Ltd., 0.684%, 1/17/14 (r) | | 2,000,000 | | 2,001,680 |
| Travelers Insurance Company Ltd., 0.553%, 12/8/11 (r) | | 3,250,000 | | 3,240,136 |
| University of Notre Dame, 4.90%, 3/1/41 | | 2,000,000 | | 1,903,560 |
| US Bank, 3.778% to 4/29/15, floating rate thereafter to 4/29/20 (r) | | 34,500,000 | | 35,088,179 |
| Vale Overseas Ltd.: | | | | |
| 6.25%, 1/23/17 | | 2,000,000 | | 2,239,180 |
| 6.875%, 11/10/39 | | 3,200,000 | | 3,416,262 |
| Verizon Communications, Inc.: | | | | |
| 0.919%, 3/28/14 (r) | | 5,000,000 | | 5,016,468 |
| 4.60%, 4/1/21 | | 5,000,000 | | 4,971,597 |
| 6.00%, 4/1/41 | | 2,500,000 | | 2,486,673 |
| Volkswagen International Finance NV, 0.917%, 4/1/14 (e)(r) | | 5,000,000 | | 4,996,028 |
| Wachovia Capital Trust III, 5.57% to 3/15/11, | | | | |
| floating rate thereafter to 3/29/49 (r) | | 38,400,000 | | 35,232,000 |
| Westpac Banking Corp., 0.603%, 10/21/11 (e)(r) | | 2,000,000 | | 2,000,551 |
| Williams Partners LP, 7.50%, 6/15/11 | | 7,560,000 | | 7,660,000 |
| Willis Group Holdings plc, 5.75%, 3/15/21 | | 2,000,000 | | 1,978,843 |
| Willis North America, Inc., 5.625%, 7/15/15 | | 2,430,000 | | 2,579,205 |
| Windsor Petroleum Transport Corp., 7.84%, 1/15/21 (e) | | 22,081,453 | | 19,997,616 |
| Wm. Wrigley Jr. Co., 1.684%, 6/28/11 (e)(r) | | 13,000,000 | | 13,005,439 |
| |
| Total Corporate Bonds (Cost $1,756,119,668) | | | | 1,584,395,746 |
| |
| |
| |
| MUNICIPAL OBLIGATIONS - 10.0% | | | | |
| Azusa California Redevelopment Agency Tax Allocation Bonds, | | | | |
| 5.765%, 8/1/17 | | 3,375,000 | | 3,367,507 |
| Baltimore Maryland General Revenue Bonds: | | | | |
| 5.05%, 7/1/14 | | 1,520,000 | | 1,652,118 |
| 5.07%, 7/1/15 | | 1,340,000 | | 1,456,540 |
| Boynton Beach Florida Community Redevelopment Agency | | | | |
| Tax Allocation Bonds, 5.10%, 10/1/15 | | 965,000 | | 983,441 |
www.calvert.com CALVERT INCOME FUND SEMI-ANNUAL REPORT (UNAUDITED) 18
| | | | |
| PRINCIPAL | | |
| MUNICIPAL OBLIGATIONS - CONT’D | | AMOUNT | | VALUE |
| Burlingame California PO Revenue Bonds, 5.285%, 6/1/12 | $ | 1,775,000 | $ | 1,823,422 |
| California Statewide Communities Development | | | | |
| Authority Revenue Bonds, Zero Coupon: | | | | |
| 6/1/15 | | 3,425,000 | | 2,713,114 |
| 6/1/15 | | 1,205,000 | | 954,541 |
| 6/1/16 | | 2,620,000 | | 1,911,159 |
| 6/1/17 | | 1,835,000 | | 1,212,972 |
| 6/1/17 | | 2,710,000 | | 1,804,996 |
| 6/1/18 | | 2,810,000 | | 1,700,219 |
| 6/1/19 | | 1,975,000 | | 1,095,197 |
| Chelsea Michigan Economic Development Corp. | | | | |
| LO Revenue VRDN, 0.27%, 10/1/36 (r) | | 1,000,000 | | 1,000,000 |
| College Park Georgia Revenue Bonds, 5.658%, 1/1/12 | | 2,500,000 | | 2,554,425 |
| Colorado State HFA Revenue VRDN, 0.21%, 10/15/16 (r) | | 2,000,000 | | 2,000,000 |
| District of Columbia GO VRDN, 0.23%, 6/1/27 (r) | | 2,500,000 | | 2,500,000 |
| Eugene Oregon Electric Utilities Revenue Bonds, Zero Coupon, 8/1/25 | | 1,500,000 | | 594,450 |
| Fairfield California PO Revenue Bonds, 5.34%, 6/1/25 | | 1,960,000 | | 1,612,061 |
| Florida State First Governmental Financing | | | | |
| Commission Revenue Bonds: | | | | |
| 5.05%, 7/1/14 | | 285,000 | | 302,770 |
| 5.10%, 7/1/15 | | 300,000 | | 315,036 |
| Grant County Washington Public Utility District No. 2 | | | | |
| Revenue Bonds, 5.48%, 1/1/21 | | 990,000 | | 986,862 |
| Illinois GO Bonds, 5.877%, 3/1/19 | | 8,500,000 | | 8,497,875 |
| Inglewood California Pension Funding Revenue Bonds: | | | | |
| 4.79%, 9/1/11 | | 235,000 | | 237,099 |
| 4.82%, 9/1/12 | | 250,000 | | 256,188 |
| 4.90%, 9/1/13 | | 260,000 | | 264,724 |
| 4.94%, 9/1/14 | | 275,000 | | 277,162 |
| 4.95%, 9/1/15 | | 285,000 | | 281,723 |
| King County Washington Housing Authority Revenue Bonds, | | | | |
| 6.375%, 12/31/46 | | 1,990,000 | | 1,999,870 |
| La Mesa California COPs, 6.32%, 8/1/26 | | 1,305,000 | | 1,333,827 |
| La Verne California Revenue Bonds, 5.62%, 6/1/16 | | 1,000,000 | | 1,031,520 |
| Lancaster Pennsylvania Parking Authority Revenue Bonds, | | | | |
| 5.95%, 12/1/25 | | 2,450,000 | | 2,421,482 |
| Long Beach California Bond Finance Authority Revenue Bonds: | | | | |
| 5.34%, 8/1/35 | | 5,000,000 | | 3,311,450 |
| 5.44%, 8/1/40 | | 5,000,000 | | 3,265,000 |
| Metropolitan Washington DC Airport Authority System | | | | |
| Revenue Bonds: | | | | |
| 5.59%, 10/1/25 | | 500,000 | | 504,940 |
| 5.69%, 10/1/30 | | 2,835,000 | | 2,743,316 |
| Michigan State Hospital Finance Authority Revenue VRDN, | | | | |
| 0.25%, 3/1/30 (r) | | 1,000,000 | | 1,000,000 |
| Moreno Valley California Public Financing Authority | | | | |
| Revenue Bonds, 5.549%, 5/1/27 | | 4,385,000 | | 3,982,238 |
| Nevada State Department of Business & Industry Lease | | | | |
| Revenue Bonds, 5.87%, 6/1/27 | | 1,210,000 | | 863,045 |
| Nevada State Housing Division Revenue VRDN, 0.26%, 4/15/39 (r) | | 1,200,000 | | 1,200,000 |
| New York City Housing Development Corp. MFH Revenue VRDN, | | | | |
| 0.24%, 6/15/34 (r) | | 500,000 | | 500,000 |
www.calvert.com CALVERT INCOME FUND SEMI-ANNUAL REPORT (UNAUDITED) 19
| | | | |
| | | PRINCIPAL | | |
| MUNICIPAL OBLIGATIONS - CONT’D | | AMOUNT | | VALUE |
| New York City IDA Revenue Bonds, 6.027%, 1/1/46 | $ | 11,835,000 | $ | 8,470,901 |
| New York State Housing Finance Agency Revenue VRDN, | | | | |
| 0.23%, 5/15/37 (r) | | 5,900,000 | | 5,900,000 |
| Oakland California Redevelopment Agency Tax Allocation Bonds: | | | | |
| 5.252%, 9/1/16 | | 1,375,000 | | 1,372,938 |
| 5.653%, 9/1/21 | | 19,635,000 | | 18,573,728 |
| Oceanside California PO Revenue Bonds: | | | | |
| 4.95%, 8/15/16 | | 2,215,000 | | 2,124,672 |
| 5.14%, 8/15/18 | | 2,760,000 | | 2,595,145 |
| 5.20%, 8/15/19 | | 3,070,000 | | 2,839,443 |
| 5.25%, 8/15/20 | | 3,395,000 | | 3,109,277 |
| Philadelphia Pennsylvania IDA Revenue Bonds, | | | | |
| Zero Coupon, 4/15/19 | | 3,375,000 | | 1,914,401 |
| Pomona California Public Financing Authority Revenue Bonds, | | | | |
| 5.718%, 2/1/27 | | 6,015,000 | | 5,574,281 |
| Richfield Minnesota MFH Revenue VRDN, 0.27%, 3/1/34 (r) | | 1,800,000 | | 1,800,000 |
| Riverside California Public Financing Authority Tax Allocation Bonds: | | | | |
| 5.19%, 8/1/17 | | 1,490,000 | | 1,450,023 |
| 5.24%, 8/1/17 | | 2,280,000 | | 2,212,238 |
| Sacramento City California Financing Authority Tax | | | | |
| Allocation Bonds, 5.54%, 12/1/20 | | 8,940,000 | | 8,251,709 |
| San Bernardino California Joint Powers Financing Authority Tax | | | | |
| Allocation Bonds, 5.625%, 5/1/16 | | 5,430,000 | | 5,453,892 |
| San Diego California Redevelopment Agency Tax Allocation Bonds, | | | | |
| 6.00%, 9/1/21 | | 2,515,000 | | 2,411,558 |
| San Francisco California City & County Redevelopment Agency | | | | |
| Revenue VRDN, 0.24%, 6/15/34 (r) | | 5,000,000 | | 5,000,000 |
| San Jose California Redevelopment Agency Tax Allocation Bonds: | | | | |
| 4.54%, 8/1/12 | | 3,105,000 | | 3,175,390 |
| 5.10%, 8/1/20 | | 3,960,000 | | 3,634,052 |
| 5.46%, 8/1/35 | | 5,300,000 | | 4,059,588 |
| Santa Cruz County California Redevelopment Agency Tax | | | | |
| Allocation Bonds, 5.60%, 9/1/25 | | 815,000 | | 718,463 |
| Santa Fe Springs California Community Development Commission | | | | |
| Tax Allocation Bonds, 5.35%, 9/1/18 | | 1,265,000 | | 1,203,938 |
| Sonoma County California PO Revenue Bonds, 6.625%, 6/1/13 | | 4,490,000 | | 4,667,355 |
| Thousand Oaks California Redevelopment Agency Tax Allocation Bonds: | | |
| 5.00%, 12/1/12 | | 675,000 | | 685,739 |
| 5.00%, 12/1/13 | | 710,000 | | 716,120 |
| 5.00%, 12/1/14 | | 745,000 | | 742,482 |
| 5.125%, 12/1/15 | | 785,000 | | 765,289 |
| 5.125%, 12/1/16 | | 830,000 | | 797,779 |
| 5.25%, 12/1/21 | | 5,070,000 | | 4,438,177 |
| 5.375%, 12/1/21 | | 4,880,000 | | 4,317,336 |
| Utah State Housing Corp. Military Housing Revenue Bonds: | | | | |
| 5.392%, 7/1/50 | | 11,735,000 | | 10,067,456 |
| 5.442%, 7/1/50 | | 3,990,000 | | 3,447,559 |
| Wells Fargo Bank NA Custodial Receipts Revenue Bonds: | | | | |
| 6.584%, 9/1/27 (e) | | 6,080,000 | | 6,087,965 |
| 6.734%, 9/1/27 (e) | | 37,970,000 | | 38,038,726 |
www.calvert.com CALVERT INCOME FUND SEMI-ANNUAL REPORT (UNAUDITED) 20
| | | | |
| | | PrIncIPal | | |
| MUNICIPAL OBLIGATIONS - CONT’D | | aMount | | value |
| West Contra Costa California Unified School District COPs: | | | | |
| 5.03%, 1/1/20 | $ | 3,190,000 | $ | 2,934,449 |
| 5.15%, 1/1/24 | | 3,630,000 | | 3,174,907 |
| |
| Total Municipal Obligations (Cost $256,000,161) | | | | 239,239,265 |
| |
| |
| U.S. GOVERNMENT AGENCIES AND INSTRUMENTALITIES - 4.2% | | |
| AgFirst FCB: | | | | |
| 8.393% to 12/15/11, floating rate thereafter to 12/15/16 (r) | | 9,175,000 | | 9,542,000 |
| 6.585% to 6/15/12, floating rate thereafter to 6/29/49 (e)(r) | | 73,280,000 | | 58,624,000 |
| New Valley Generation II, 5.572%, 5/1/20 | | 4,609,351 | | 4,830,785 |
| Overseas Private Investment Corp., 4.05%, 11/15/14 | | 1,068,800 | | 1,100,148 |
| Premier Aircraft Leasing EXIM 1 Ltd.: | | | | |
| 3.576%, 2/6/22 | | 9,309,443 | | 9,282,911 |
| 3.547%, 4/10/22 | | 7,381,152 | | 7,350,742 |
| Sterling Equipment, Inc., 6.125%, 9/28/19 | | 252,967 | | 277,449 |
| US AgBank FCB, 6.11% to 7/10/12, floating rate | | | | |
| thereafter to 12/31/49 (e)(r) | | 3,000,000 | | 2,010,000 |
| Vessel Management Services, Inc., 5.125%, 4/16/35 | | 7,053,000 | | 7,418,769 |
| |
| Total U.S. Government Agencies and Instrumentalities | | | | |
| (Cost $104,157,628) | | | | 100,436,804 |
| |
| |
| |
| U.S. GOVERNMENT AGENCY | | | | |
| MORTGAGE-BACKED SECURITIES - 0.0% | | | | |
| Ginnie Mae, 11.00%, 10/15/15 | | 369 | | 424 |
| Government National Mortgage Association, 5.50%, 1/16/32 (b) | | 4,974,396 | | 275,213 |
| |
| Total U.S. Government Agency Mortgage-Backed | | | | |
| Securities (Cost $634,988) | | | | 275,637 |
| |
| |
| U.S. TREASURY - 8.5% | | | | |
| United States Treasury Bonds: | | | | |
| 4.375%, 11/15/39 | | 27,130,000 | | 26,536,531 |
| 3.875%, 8/15/40 | | 14,435,000 | | 12,914,814 |
| 4.25%, 11/15/40 | | 51,740,000 | | 49,468,291 |
| 4.75%, 2/15/41 | | 16,145,000 | | 16,780,709 |
| United States Treasury Notes: | | | | |
| 2.125%, 2/29/16 | | 5,412,000 | | 5,394,242 |
| 2.625%, 11/15/20 | | 41,825,000 | | 39,034,488 |
| 3.625%, 2/15/21 | | 53,010,000 | | 53,772,019 |
| |
| Total U.S. Treasury (Cost $203,040,262) | | | | 203,901,094 |
www.calvert.com CALVERT INCOME FUND SEMI-ANNUAL REPORT (UNAUDITED) 21
www.calvert.com CALVERT INCOME FUND SEMI-ANNUAL REPORT (UNAUDITED) 22
| (b) | This security was valued by the Board of Trustees. See Note A. |
|
|
(d) | Remaining maturities of floating rate loans may be less than the stated maturities shown as a result of contractual or optional prepayments by the borrower. Such prepayments cannot be predicted with cer- tainty. Floating rate loans generally pay interest at rates which are periodically re-determined at a margin above the London InterBank Offered Rate (“LIBOR”) or other short-term rates. The rate shown is the rate in effect at period end. Floating rate loans are generally considered restrictive in that the Fund is ordinarily contractually obligated to receive consent from the Agent Bank and/or Borrower prior to dispo- sition of a floating rate loan. |
| |
| (e) | Security is exempt from registration under Rule 144A of the Securities Act of 1933. These securities may be resold in transactions exempt from registration, normally to qualified institutional buyers. |
| |
| (m) | The Illinois Insurance Department prohibited Lumbermens from making interest payments. This security is no longer accruing interest. |
| |
| (n) | The Illinois Insurance Department prohibited Lumbermens from making interest payments. This TIERS security is based on interest payments from Lumbermens. This security is no longer accruing interest. |
| |
| (p) | The State of New York Insurance Department has prohibited Atlantic Mutual Insurance Co. from mak- ing interest payments. This security is no longer accruing interest. |
| |
| (r) | The coupon rate shown on floating or adjustable rate securities represents the rate at period end. |
| |
| (u) | This security is no longer accruing interest. |
| |
| (w) | Security is in default and is no longer accruing interest. |
| |
| (x) | Alliance Bancorp and its affiliates filed for Chapter 7 bankruptcy on July 13, 2007. This security is no longer accruing interest. |
| |
| (y) | The government of Iceland took control of Glitnir Banki HF and Kaupthing Bank HF (the “Banks”) on October 8, 2008 and October 9, 2008, respectively. The government has prohibited the Banks from pay- ing any claims owed to foreign entities. These securities are no longer accruing interest. |
| |
| (ii) | General Motors filed for Chapter 11 bankruptcy on June 1, 2009. This security is no longer accruing interest. Subsequent to period end, the Fund received a distribution of new GM stock and new GM war- rants in exchange for the Motors Liquidation Co. Notes. |
| |
| * | Non-income producing security. |
Abbreviations:
COPs: Certificates of Participation
FCB: Farm Credit Bank
FSB: Federal Savings Bank
GO: General Obligation
HFA: Housing Finance Authority
IDA: Industrial Development Authority
LLC: Limited Liability Corporation
LO: Limited Obligation
LP: Limited Partnership
MFH: Multi-Family Housing
PO: Pension Obligation
STEP: Stepped coupon bond for which the coupon rate of interest will adjust on specified future date(s)
VRDN: Variable Rate Demand Notes
See notes to financial statements.
www.calvert.com CALVERT INCOME FUND SEMI-ANNUAL REPORT (UNAUDITED) 23
STATEMENT OF ASSETS AND LIABILITIES
MARCH 31, 2011
| | | |
| ASSETS | | | |
| Investments in securities, at value (Cost $2,404,638,171) - | | | |
| see accompanying schedule | $ | 2,202,670,379 | |
| Cash | | 197,745,866 | |
| Receivable for securities sold | | 68,841,698 | |
| Receivable for shares sold | | 2,001,756 | |
| Interest and dividends receivable | | 20,492,292 | |
| Collateral at broker (cash) | | 6,365,370 | |
| Other assets | | 94,551 | |
| Total assets | | 2,498,211,912 | |
| |
| |
| LIABILITIES | | | |
| Payable for securities purchased | | 63,401,651 | |
| Payable for shares redeemed | | 28,721,352 | |
| Payable for futures variation margin | | 471,286 | |
| Payable to Calvert Asset Management Company, Inc. | | 1,358,329 | |
| Payable to Calvert Administrative Services Company | | 593,995 | |
| Payable to Calvert Shareholder Services, Inc. | | 54,691 | |
| Payable to Calvert Distributors, Inc. | | 648,117 | |
| Accrued expenses and other liabilities | | 235,191 | |
| Total liabilities | | 95,484,612 | |
| |
| net assets | $ | 2,402,727,300 | |
| |
| |
| net assets consIst of: | | | |
| Paid-in capital applicable to the following shares of beneficial interest, | | | |
| unlimited number of no par value shares authorized: | | | |
| Class A: 115,302,002 shares outstanding | $ | 2,354,484,163 | |
| Class B: 1,779,213 shares outstanding | | 45,922,686 | |
| Class C: 15,835,442 shares outstanding | | 297,550,816 | |
| Class I: 11,125,272 shares outstanding | | 208,795,099 | |
| Class R: 698,731 shares outstanding | | 10,702,429 | |
| Class Y: 5,043,858 shares outstanding | | 78,721,944 | |
| Undistributed net investment income (loss) | | (955,740 | ) |
| Accumulated net realized gain (loss) on investments | | (390,243,905 | ) |
| Net unrealized appreciation (depreciation) on investments | | (202,250,192 | ) |
| |
| NET ASSETS | $ | 2,402,727,300 | |
| |
| NET ASSET VALUE PER SHARE | | | |
| Class A (based on net assets of $1,848,915,890) | $ | 16.04 | |
| Class B (based on net assets of $28,390,859) | $ | 15.96 | |
| Class C (based on net assets of $253,856,605) | $ | 16.03 | |
| Class I (based on net assets of $178,560,469) | $ | 16.05 | |
| Class R (based on net assets of $11,273,897) | $ | 16.13 | |
| Class Y (based on net assets of $81,729,580) | $ | 16.20 | |
See notes to financial statements.
www.calvert.com CALVERT INCOME FUND SEMI-ANNUAL REPORT (UNAUDITED) 24
STATEMENT OF OPERATIONS
SIX MONTHS ENDED
MARCH 31, 2011
| | | |
| NET INVESTMENT INCOME | | | |
| Investment Income: | | | |
| Interest income | $ | 61,543,287 | |
| Dividend income | | 704,011 | |
| Total investment income | | 62,247,298 | |
| |
| Expenses: | | | |
| Investment advisory fee | | 5,353,827 | |
| Administrative fees | | 3,854,236 | |
| Transfer agency fees and expenses | | 2,985,614 | |
| Distribution Plan expenses: | | | |
| Class A | | 2,600,331 | |
| Class B | | 166,017 | |
| Class C | | 1,383,398 | |
| Class R | | 29,331 | |
| Trustees’ fees and expenses | | 72,985 | |
| Custodian fees | | 137,855 | |
| Registration fees | | 51,382 | |
| Reports to shareholders | | 349,452 | |
| Professional fees | | 47,221 | |
| Accounting fees | | 148,111 | |
| Miscellaneous | | 68,600 | |
| Total expenses | | 17,248,360 | |
| Reimbursement from Advisor: | | | |
| Class R | | (3,872 | ) |
| Fees paid indirectly | | (4,181 | ) |
| Net expenses | | 17,240,307 | |
| |
| |
| NET INVESTMENT INCOME | | 45,006,991 | |
| |
| REALIZED AND UNREALIZED GAIN (LOSS) | | | |
| Net realized gain (loss) on: | | | |
| Investments | | (21,776,711 | ) |
| Futures | | 2,511,771 | |
| | | (19,264,940 | ) |
| Change in unrealized appreciation (depreciation) on: | | | |
| Investments | | (7,748,027 | ) |
| Futures | | 6,483,735 | |
| | | (1,264,292 | ) |
| |
| |
| NET REALIZED AND UNREALIZED GAIN | | | |
| (LOSS) | | (20,529,232 | ) |
| |
| INCREASE (DECREASE) IN NET ASSETS | | | |
| RESULTING FROM OPERATIONS | $ | 24,477,759 | |
See notes to financial statements.
www.calvert.com CALVERT INCOME FUND SEMI-ANNUAL REPORT (UNAUDITED) 25
STATEMENTS OF CHANGES IN NET ASSETS
| | | | | | |
| | | SIX MONTHS ENDED | | | YEAR ENDED | |
| | | MARCH
31, | | | SEPTEMBER 30, | |
| INCREASE (DECREASE) IN NET ASSETS | | 2011 | | | 2010 | |
| Operations: | | | | | | |
| Net investment income | $ | 45,006,991 | | $ | 112,802,291 | |
| Net realized gain (loss) | | (19,264,940 | ) | | (99,827,582 | ) |
| Change in unrealized appreciation (depreciation) | | (1,264,292 | ) | | 252,457,110 | |
| |
| |
| INCREASE (DECREASE) IN NET ASSETS | | | | | | |
| RESULTING FROM OPERATIONS | | 24,477,759 | | | 265,431,819 | |
| |
| Distributions to shareholders from: | | | | | | |
| Net investment income: | | | | | | |
| Class A shares | | (33,621,735 | ) | | (87,321,849 | ) |
| Class B shares | | (393,292 | ) | | (1,143,445 | ) |
| Class C shares | | (3,494,299 | ) | | (8,573,601 | ) |
| Class I shares | | (4,514,720 | ) | | (11,731,464 | ) |
| Class R shares | | (177,332 | ) | | (364,752 | ) |
| Class Y shares | | (1,648,660 | ) | | (1,642,386 | ) |
| Total distributions | | (43,850,038 | ) | | (110,777,497 | ) |
| |
| Capital share transactions: | | | | | | |
| Shares sold: | | | | | | |
| Class A shares | | 107,158,906 | | | 337,647,283 | |
| Class B shares | | 196,010 | | | 1,768,921 | |
| Class C shares | | 5,413,709 | | | 21,597,368 | |
| Class I shares | | 18,930,901 | | | 64,809,450 | |
| Class R shares | | 1,016,357 | | | 3,975,814 | |
| Class Y shares | | 8,626,281 | | | 99,009,402 | |
| Reinvestment of distributions: | | | | | | |
| Class A shares | | 29,124,006 | | | 73,497,466 | |
| Class B shares | | 304,475 | | | 874,262 | |
| Class C shares | | 1,965,096 | | | 4,696,400 | |
| Class I shares | | 3,385,139 | | | 9,434,414 | |
| Class R shares | | 139,433 | | | 278,016 | |
| Class Y shares | | 339,386 | | | 689,019 | |
| Redemption fees: | | | | | | |
| Class A shares | | 14,228 | | | 35,622 | |
| Class B shares | | — | | | 906 | |
| Class C shares | | 217 | | | 1,578 | |
| Class I shares | | 12 | | | 177 | |
| Class Y shares | | 883 | | | 1,015 | |
| Shares redeemed: | | | | | | |
| Class A shares | | (594,106,994 | ) | | (1,251,128,456 | ) |
| Class B shares | | (10,624,214 | ) | | (25,126,285 | ) |
| Class C shares | | (55,305,577 | ) | | (110,768,385 | ) |
| Class I shares | | (103,542,660 | ) | | (134,029,773 | ) |
| Class R shares | | (2,118,923 | ) | | (4,079,776 | ) |
| Class Y shares | | (31,222,409 | ) | | (17,610,330 | ) |
| Total capital share transactions | | (620,305,738 | ) | | (924,425,892 | ) |
| |
| |
| total Increase (decrease) In net assets | | (639,678,017 | ) | | (769,771,570 | ) |
See notes to financial statements.
www.calvert.com CALVERT INCOME FUND SEMI-ANNUAL REPORT (UNAUDITED) 26
STATEMENTS OF CHANGES IN NET ASSETS
| | | | | | |
| | | SIX MONTHS ENDED | | | YEAR ENDED | |
| | | MARCH
31, | | | SEPTEMBER 30, | |
| NET ASSETS | | 2011 | | | 2010 | |
| Beginning of period | $ | 3,042,405,317 | | $ | 3,812,176,887 | |
| End of period (including distributions in excess of net investment | | | | | | |
| income of $955,740 and $2,112,693, respectively) | $ | 2,402,727,300 | | $ | 3,042,405,317 | |
| |
| |
| CAPITAL SHARE ACTIVITY | | | | | | |
| Shares sold: | | | | | | |
| Class A shares | | 6,711,207 | | | 21,572,895 | |
| Class B shares | | 12,378 | | | 113,732 | |
| Class C shares | | 338,945 | | | 1,380,271 | |
| Class I shares | | 1,183,751 | | | 4,135,392 | |
| Class R shares | | 63,328 | | | 252,422 | |
| Class Y shares | | 534,968 | | | 6,235,068 | |
| Reinvestment of distributions: | | | | | | |
| Class A shares | | 1,826,088 | | | 4,690,453 | |
| Class B shares | | 19,179 | | | 56,069 | |
| Class C shares | | 123,224 | | | 299,692 | |
| Class I shares | | 211,983 | | | 601,338 | |
| Class R shares | | 8,690 | | | 17,623 | |
| Class Y shares | | 21,059 | | | 43,543 | |
| Shares redeemed: | | | | | | |
| Class A shares | | (37,237,387 | ) | | (79,871,602 | ) |
| Class B shares | | (668,628 | ) | | (1,612,215 | ) |
| Class C shares | | (3,466,796 | ) | | (7,076,289 | ) |
| Class I shares | | (6,476,795 | ) | | (8,523,652 | ) |
| Class R shares | | (132,043 | ) | | (258,918 | ) |
| Class Y shares | | (1,937,244 | ) | | (1,099,953 | ) |
| Total capital share activity | | (38,864,093 | ) | | (59,044,131 | ) |
See notes to financial statements.
www.calvert.com CALVERT INCOME FUND SEMI-ANNUAL REPORT (UNAUDITED) 27
NOTES TO FINANCIAL STATEMENTS
NOTE A –– SIGNIFICANT ACCOUNTING POLICIES
General: The Calvert Income Fund (the “Fund”), a series of The Calvert Fund, is registered under the Investment Company Act of 1940 as a non-diversified, open-end management investment company. The operations of each series are accounted for separately. The Fund offers six classes of shares of beneficial interest. Class A shares are sold with a maximum front-end sales charge of 3.75%. Class B shares are sold without a front-end sales charge. With certain exceptions, the Fund will impose a deferred sales charge at the time of redemption, depending on how long investors have owned the shares. Effective March 1, 2010, Class B shares are no longer offered for purchase, except through reinvestment of dividends and/or distributions and through certain exchanges. Class C shares are sold without a front-end sales charge. With certain exceptions, the Fund will impose a deferred sales charge on shares sold within one year of purchase. Class B and Class C shares have higher levels of expenses than Class A shares. Class I shares require a minimum account balance of $1,000,000. The $1 million minimum initial investment may be waived for certain institutional accounts, where it is believed to be in the best interest of the Fund and its shareholders. Class I shares have no front-end or deferred sales charge and have lower levels of expenses than Class A shares. Class R shares are generally only available to certain retirement plans where plan level or omnibus accounts are held on the books of the Fund. Class R shares have no front-end or deferred sales charge and have a higher level of expenses than Class A Shares. Class Y shares are generally only available to wrap or similar fee-based programs offered by financial intermediaries that have entered into an agreement with the Fund’s Distributor to offer Class Y shares. Class Y shares have no front-end or deferred sales charge and have lower levels of expenses than Class A shares. Each class has different: (a) dividend rates due to differences in Distribution Plan expenses and other class specific expenses, (b)exchange privileges and (c) class specific voting rights.
Security Valuation: Net asset value per share is determined every business day as of the close of the regular session of the New York Stock Exchange (generally 4:00 p.m. Eastern time). The Fund uses independent pricing services approved by the Board of Trustees to value its investments wherever possible. Investments for which market quotations are not available or deemed not reliable are fair valued in good faith under the direction of the Board of Trustees. In determining fair value, the Board considers all relevant qualitative and quantitative information available. These factors are subject to change over time and are reviewed periodically. The values assigned to fair value investments are based on available information and do not necessarily represent amounts that might ultimately be realized. Further, because of the inherent uncertainty of valuation, those estimated values may differ significantly from the values that would have been used had a ready market for the investments existed, and the differences could be material.
At March 31, 2011, securities valued at $289,103,754 or 12.0% of net assets were fair valued in good faith under the direction of the Board of Trustees.
The Fund utilizes various methods to measure the fair value of its investments. Generally Accepted Accounting Principles (GAAP) establishes a disclosure hierarchy that categorizes the inputs to valuation techniques used to value assets and liabilities at mea-
www.calvert.com CALVERT INCOME FUND SEMI-ANNUAL REPORT (UNAUDITED) 28
surement date. These inputs are summarized in the three broad levels listed below: Level 1 – quoted prices in active markets for identical securities Level 2 – other significant observable inputs (including quoted prices for similar securities, interest rates, prepayment speeds, credit risk, etc.) Level 3 – significant unobservable inputs (including the Fund’s own assumptions in determining the fair value of investments) The inputs or methodology used for valuing securities are not necessarily an indication of the risk associated with investing in those securities.
Changes in valuation techniques may result in transfers in or out of an investment’s assigned level within the hierarchy during the period. Valuation techniques used to value the Fund’s investments by major category are as follows.
Debt securities, including restricted securities, are valued based on evaluated prices received from independent pricing services or from dealers who make markets in such securities. For corporate bonds, floating rate loans, municipal securities, and U.S. government and government agency obligations, pricing services utilize matrix pricing which considers yield or price of bonds of comparable quality, coupon, maturity and type as well as dealer supplied prices and are generally categorized as Level 2 in the hierarchy. For asset backed securities, collateralized mortgage obligations, commercial mortgage securities and U.S. government agency mortgage securities, pricing services utilize matrix pricing which considers prepayment speed assumptions, attributes of the collateral, yield or price of bonds of comparable quality, coupon, maturity and type as well as dealer supplied prices and, accordingly, such securities are generally categorized as Level 2 in the hierarchy. Short-term securities with remaining maturities of sixty days or less for which quotations are not readily available are valued at amortized cost, which approximates fair value, and are categorized as Level 2 in the hierarchy.
When independent prices are unavailable or unreliable, debt securities may be valued utilizing pricing matrices which consider similar factors that would be used by independent pricing services. These are generally categorized as Level 2 in the hierarchy but may be Level 3 depending on the circumstances.
Equity securities, including restricted securities, for which market quotations are readily available, are valued at the last reported sale price or official closing price as reported by an independent pricing service on the primary market or exchange on which they are traded and are categorized as Level 1 in the hierarchy. Foreign securities are valued based on quotations from the principle market in which such securities are normally traded. If events occur after the close of the principle market in which foreign securities are traded, and before the close of business of the Fund, that are expected to materially affect the value of those securities, then they are valued at their fair value taking these events into account. For restricted securities and private placements where observable inputs are limited, assumptions about market activity and risk are used and are categorized as Level 3 in the hierarchy.
www.calvert.com CALVERT INCOME FUND SEMI-ANNUAL REPORT (UNAUDITED) 29
The following is a summary of the inputs used to value the Fund’s net assets as of March 31, 2011:
| | | | | | | | | | |
| | | | | | valuation Inputs | | | |
| Investments In securItIes | | level 1 | | | level 2 | | level 3 | | total | |
| Equity securities | $ | 6,481,916 | | | - | $ | 18,060,096 | $ | 24,542,012 | |
| Asset-backed securities | | - | | $ | 16,958,731 | | - | | 16,958,012 | |
| Collateralized mortgage-backed | | | | | | | | | | |
| obligations | | - | | | 21,642,069 | | - | | 21,642,069 | |
| Commercial mortgage-backed | | | | | | | | | | |
| securities | | - | | | 5,167,844 | | - | | 5,167,844 | |
| Corporate debt | | - | | | 1,434,213,801 | | 150,181,945 | | 1,584,395,746 | |
| Municipal obligations | | - | | | 239,239,265 | | - | | 239,239,265 | |
| U.S. government obligations | | - | | | 304,613,535 | | - | | 304,613,535 | |
| Other debt obligations | | | | | 6,111,177 | | - | | 6,111,177 | |
| TOTAL | $ | 6,481,916 | | $ | 2,027,946,422 | $ | 168,242,041 | $ | 2,202,670,379 | |
| |
| Other financial instruments* | ($ | 282,400 | ) | | - | | - | ($ | 282,400 | ) |
* Other financial instruments are derivative instruments not reflected in the Portfolio of Investments, such as futures, which are valued at the unrealized appreciation/depreciation on the instrument.
Following is a reconciliation of Level 3 assets for which significant unobservable inputs were used to determine fair value:
| | | | | | EQUITY | |
| | | | | | SECURITIES | |
| Balance as of 9/30/10 | | | | $ | 17,286,096 | |
| Accrued discounts/premiums | | | | | — | |
| Realized gain (loss) | | | | | — | |
| Change in unrealized appreciation (depreciation) | | | | | 774,000 | |
| Purchases | | | | | — | |
| Sales | | | | | — | |
| Transfers in and/ or out of Level 31 | | | | | — | |
| Balance as of 3/31/11 | | | | $ | 18,060,096 | |
| |
| | | | | | U.S. | |
| | | CORPORATE | | | GOVERNMENT | |
| | | DEBT | | | OBLIGATIONS | |
| Balance as of 9/30/10 | $ | 122,146,057 | | $ | 475,082 | |
| Accrued discounts/premiums | | 1,052,424 | | | — | |
| Realized gain (loss) | | 60,592 | | | — | |
| Change in unrealized appreciation (depreciation) | | (3,751,155 | ) | | (3,241 | ) |
| Purchases | | 1,885,781 | | | — | |
| Sales | | (657,130 | ) | | (471,841 | ) |
| Transfers in and/ or out of Level 31 | | 29,445,3762 | | | — | |
| Balance as of 3/31/11 | $ | 150,181,945 | | $ | 0 | |
www.calvert.com CALVERT INCOME FUND SEMI-ANNUAL REPORT (UNAUDITED) 30
| | | |
| | | TOTAL | |
| Balance as of 9/30/10 | $ | 139,907,235 | |
| Accrued discounts/premiums | | 1,052,424 | |
| Realized gain (loss) | | 60,592 | |
| Change in unrealized appreciation (depreciation) | | (2,980,396 | ) |
| Purchases | | 1,885,781 | |
| Sales | | (1,128,971 | ) |
| Transfers in and/ or out of Level 31 | | 29,445,376 | |
| Balance as of 3/31/11 | $ | 168,242,041 | |
1 The Fund’s policy is to recognize transfers into and transfers out of Level 3 as of the end of the reporting period.
2 Transferred from Level 2 to Level 3 because fair values were determined using valuation techniques utilizing unobservable inputs due to observable inputs being unavailable.
For the six months ended March 31, 2011, total change in unrealized gain (loss) on Level 3 securities included in the change in net assets was ($5,246,975). Total unrealized gain (loss) for all securities (including Level 1 and Level 2) can be found on the accompanying Statement of Operations.
Repurchase Agreements: The Fund may enter into repurchase agreements with recognized financial institutions or registered broker/dealers and, in all instances, holds underlying securities with a value exceeding the total repurchase price, including accrued interest. Although risk is mitigated by the collateral, the Fund could experience a delay in recovering its value and a possible loss of income or value if the counterparty fails to perform in accordance with the terms of the agreement.
Loan Participations and Assignments: The Fund may invest in direct debt instruments which are interests in amounts owed to lenders or lending syndicates by corporate, governmental, or other borrowers. A Fund’s investments in loans may be in the form of participations in loans or assignments of all or a portion of loans from third parties. A loan is often administered by a bank or other financial institution (the “lender”) that acts as agent for all holders. The agent administers the terms of the loan, as specified in the loan agreement. A Fund may invest in multiple series or tranches of a loan, which may have varying terms and carry different associated risks. A Fund generally has no right to enforce compliance with the terms of the loan agreement with the borrower. As a result, a Fund may be subject to the credit risk of both the borrower and the lender that is selling the loan agreement. When a Fund purchases assignments from lenders it acquires direct rights against the borrower of the loan. When investing in a loan participation, a Fund has the right to receive payments of principal, interest and any fees to which it is entitled only from the lender selling the loan agreement and only upon receipt of payments by the lender from the borrower.
Futures Contracts: The Fund may purchase and sell futures contracts, but only when, in the judgment of the Advisor, such a position acts as a hedge. The Fund may not enter into futures contracts for the purpose of speculation or leverage. These futures contracts may include, but are not limited to, futures contracts based on U.S. Government obligations. The Fund is subject to interest rate risk in the normal course of pursuing its investment objectives. The Fund may use futures contracts to hedge against changes in the value of interest rates. The Fund may enter into futures contracts agreeing to buy or
www.calvert.com CALVERT INCOME FUND SEMI-ANNUAL REPORT (UNAUDITED) 31
sell a financial instrument for a set price at a future date. Initial margin deposits of either cash or securities as required by the broker are made upon entering into the contract. While the contract is open, daily variation margin payments are made to or received from the broker reflecting the daily change in market value of the contract and are recorded for financial reporting purposes as unrealized gains or losses by the Fund. When a futures contract is closed, a realized gain or loss is recorded equal to the difference between the opening and closing value of the contract. The risks associated with entering into futures contracts may include the possible illiquidity of the secondary market which would limit the Fund’s ability to close out a futures contract prior to the settlement date, an imperfect correlation between the value of the contracts and the underlying financial instruments, or that the counterparty will fail to perform its obligations under the contracts’ terms. Futures contracts are designed by boards of trade which are designated “contracts markets” by the Commodities Futures Trading Commission. Futures contracts trade on the contracts markets in a manner that is similar to the way a stock trades on a stock exchange and the boards of trade, through their clearing corporations, guarantee the futures contracts against default. As a result, there is minimal counterparty credit risk to the Fund. During the period, the Fund used U.S. Treasury futures contracts to hedge against interest rate changes and to manage overall duration of the Fund.
Short Sales: The Fund may use a hedging technique that involves short sales of U.S. Treasury securities for the purposes of managing the duration of the Fund. Any short sales are covered with an equivalent amount of high-quality, liquid securities.
Security Transactions and Net Investment Income: Security transactions are accounted for on trade date. Realized gains and losses are recorded on an identified cost basis and may include proceeds from litigation. Dividend income is recorded on the ex-dividend date or, in the case of dividends on certain foreign securities, as soon as the Fund is informed of the ex-dividend date. Distributions received on securities that represent a return of capital or capital gain are recorded as a reduction of cost of investments and/or as a realized gain. Interest income, which includes amortization of premium and accretion of discount on debt securities, is accrued as earned. Investment income and realized and unrealized gains and losses are allocated to separate classes of shares based upon the relative net assets of each class. Debt obligations may be placed on non-accrual status and related interest income may be reduced by ceasing current accruals and writing off interest receivables when the collection of all or a portion of interest has become doubtful based on consistently applied procedures. (See the Schedule of Investments footnotes on page 23.) A debt obligation may be removed from non-accrual status when the issuer resumes interest payments or when collectibility of interest is reasonably assured. Expenses arising in connection with a class are charged directly to that class. Expenses common to the classes are allocated to each class in proportion to their relative net assets. Withholding taxes on foreign dividends have been provided for in accordance with the Fund’s understanding of the applicable country’s tax rules and rates. The Fund earns certain fees in connection with its floating rate loan purchasing activities. These fees are in addition to interest payments earned and may include amendment fees, consent fees and prepayment fees. These fees are recorded as income in the accompanying financial statements.
www.calvert.com CALVERT INCOME FUND SEMI-ANNUAL REPORT (UNAUDITED) 32
Foreign Currency Transactions: The Fund’s accounting records are maintained in U.S. dollars. For valuation of assets and liabilities on each date of net asset value determination, foreign denominations are converted into U.S. dollars using the current exchange rate. Security transactions, income and expenses are translated at the prevailing rate of exchange on the date of the event. The effect of changes in foreign exchange rates on securities and foreign currencies is included in the net realized and unrealized gain or loss on securities and foreign currencies.
Distributions to Shareholders: Distributions to shareholders are recorded by the Fund on ex-dividend date. Dividends from net investment income are paid monthly. Distributions from net realized capital gains, if any, are paid at least annually. Distributions are determined in accordance with income tax regulations which may differ from generally accepted accounting principles; accordingly, periodic reclassifications are made within the Fund’s capital accounts to reflect income and gains available for distribution under income tax regulations.
Estimates: The preparation of the financial statements in conformity with accounting principles generally accepted in the United States requires management to make estimates and assumptions that affect the reported amounts of assets and liabilities and disclosure of contingent assets and liabilities at the date of the financial statements and the reported amounts of income and expenses during the reported period. Actual results could differ from those estimates.
Redemption Fees: The Fund charges a 2% redemption fee on redemptions, including exchanges, made within 30 days of purchase in the same Fund (within seven days for Class I and Class R shares). The redemption fee is paid to the Class of the Fund from which the redemption is made, and is accounted for as an addition to paid-in capital. The fee is intended to discourage market-timers by ensuring that short-term trading costs are borne by the investors making the transactions and not the shareholders already in the Fund.
Expense Offset Arrangements: The Fund has arrangements with its custodian banks whereby the custodian’s fees may be paid indirectly by credits earned on the Fund’s cash on deposit with the banks. These credits are used to reduce the Fund’s expenses. Such deposit arrangements may be an alternative to overnight investments.
Federal Income Taxes: No provision for federal income or excise tax is required since the Fund intends to continue to qualify as a regulated investment company under the Internal Revenue Code and to distribute substantially all of its taxable earnings.
Management has analyzed the Fund’s tax positions taken for all open federal income tax years and has concluded that no provision for federal income tax is required in the Fund’s financial statements. A Fund’s federal tax return is subject to examination by the Internal Revenue Service for a period of three years
NOTE B — RELATED PARTY TRANSACTIONS
Calvert Asset Management Company, Inc. (the Advisor) is wholly-owned by Calvert Group, Ltd. (Calvert), which is indirectly wholly-owned by UNIFI Mutual Holding
www.calvert.com CALVERT INCOME FUND SEMI-ANNUAL REPORT (UNAUDITED) 33
Company. The Advisor provides investment advisory services and pays the salaries and fees of officers and Trustees of the Fund who are employees of the Advisor or its affiliates. For its services, the Advisor receives an annual fee, payable monthly based on the following annual rates of average daily net assets: .40% on the first $2 billion, .375% on the next $5.5 billion, .35% on the next $2.5 billion and .325% over $10 billion.
The Advisor has contractually agreed to limit net annual fund operating expenses through January 31, 2012 for Class I, R and Y. The contractual expense caps are .84%, 1.47% and 1.09%, respectively. For the purposes of this expense limit, operating expenses do not include interest expense, brokerage commissions, taxes and extraordinary expenses. To the extent any expense offset credits are earned, the Advisor’s obligation under the contractual limitation may be reduced and the Advisor may benefit from the expense offset arrangement.
Calvert Administrative Services Company, an affiliate of the Advisor, provides administrative services to the Fund for an annual fee, payable monthly. Classes A, B, C, R and Y shares pay an annual rate of .30% on the first $3 billion, .25% on the next $2 billion, and .225% over $5 billion of the combined assets of all classes of the Fund. Class I shares pay an annual rate of .10%, based on their average daily net assets.
Calvert Distributors, Inc., an affiliate of the Advisor, is the distributor and principal underwriter for the Fund. Distribution Plans, adopted by Class A, B, C and R shares, allow the Fund to pay the Distributor for expenses and services associated with the distribution of shares. The expenses paid may not exceed .50%, 1.00%, 1.00% and .75% annually of the Fund’s average daily net assets of Class A, B, C and R, respectively. The amount actually paid by the Fund is an annualized fee, payable monthly of .25%, 1.00%, 1.00% and .50% of the Fund’s average daily net assets of Class A, B, C, and R, respectively. Class I and Y shares do not have Distribution Plan expenses.
The Distributor received $30,626 as its portion of commissions charged on sales of the Fund’s Class A shares for the six months ended March 31, 2011.
Calvert Shareholder Services, Inc. (CSSI), an affiliate of the Advisor, is the shareholder servicing agent for the Fund. For its services, CSSI received a fee of $345,024 for the six months ended March 31, 2011. Boston Financial Data Services, Inc. is the transfer and dividend disbursing agent.
Each Trustee of the Fund who is not an employee of the Advisor or its affiliates receives an annual retainer of $45,000 plus up to $2,000 for each Board and Committee meeting attended. The Board chair and Committee chairs each receive an additional $5,000 annual retainer. Trustee’s fees are allocated to each of the funds served.
NOTE C — INVESTMENT ACTIVITY
During the period, the cost of purchases and proceeds from sales of investments, other than short-term and U.S. government securities, were $1,044,727,690 and $1,464,237,058, respectively. U.S. government security purchases and sales were $2,171,450,180 and $2,223,130,078, respectively.
www.calvert.com CALVERT INCOME FUND SEMI-ANNUAL REPORT (UNAUDITED) 34
CAPITAL LOSS CARRYFORWARDS
EXPIRATION DATE
| 30-Sep-13 | ($ 141,901 | ) |
| 30-Sep-14 | (336,178 | ) |
| 30-Sep-16 | (12,997,968 | ) |
| 30-Sep-17 | (1,783,942 | ) |
| 30-Sep-18 | (265,587,678 | ) |
Capital losses may be utilized to offset future capital gains until expiration. The Fund’s use of net capital loss carryforwards acquired from Summit Apex Bond Fund may be limited under certain tax provisions. Under the recently enacted Regulated Investment Company Modernization Act of 2010, the Funds will be permitted to carry forward capital losses incurred in taxable years beginning after December 22, 2010 for an unlimited period. Losses incurred during those future years will be required to be utilized prior to the losses incurred in pre-enactment taxable years. As a result of this ordering rule, pre-enactment capital loss carryforwards may more likely expire unused. Also, post-enactment capital losses that are carried forward will retain their character as either short-term or long-term capital losses rather than being considered all short-term as under previous law.
The Fund intends to elect to defer net capital losses of $92,373,734 incurred from November 1, 2009 through September 30, 2010 and treat them as arising in the fiscal period ending September 30, 2011.
As of March 31, 2011, the tax basis components of unrealized appreciation/ (depreciation) and the federal tax cost were as follows:
| Unrealized appreciation | $ | 91,895,367 | |
| Unrealized (depreciation) | | (308,928,248 | ) |
| Net unrealized appreciation/(depreciation) | ($ | 217,032,881 | ) |
| Federal income tax cost of investments | $ | 2,419,703,260 | |
The Fund may sell or purchase securities to and from other funds managed by the Advisor, typically short-term variable rate demand notes. Interportfolio transactions are primarily used for cash management purposes. Interportfolio transactions are made pursuant to Rule 17a-7 of the Investment Company Act of 1940. For the six months ended March 31, 2011, such purchase and sales transactions were $52,770,000 and $116,647,500, respectively. The realized loss on the sales transactions was $2,053.
www.calvert.com CALVERT INCOME FUND SEMI-ANNUAL REPORT (UNAUDITED) 35
NOTE D — LINE OF CREDIT
A financing agreement is in place with all Calvert Group Funds and State Street Corporation (“SSC”). Under the agreement, SSC provides an unsecured line of credit facility, in the aggregate amount of $50 million ($25 million committed and $25 million uncommitted), accessible by the Funds for temporary or emergency purposes only. Borrowings under the committed facility bear interest at the higher of the London Interbank Offered Rate, (LIBOR) or the overnight Federal Funds Rate plus 1.25% per annum. A commitment fee of .125% per annum is incurred on the unused portion of the committed facility, which is allocated to all participating funds. The Fund had no loans outstanding pursuant to this line of credit at March 31, 2011. For the six months ended March 31, 2011, borrowings by the Fund under the Agreement were as follows:
| | | WEIGHTED | | | MONTH OF |
| | AVERAGE | AVERAGE | | MAXIMUM | MAXIMUM |
| | DAILY | INTEREST | | AMOUNT | AMOUNT |
| | BALANCE | RATE | | BORROWED | BORROWED |
| $ 338,068 | 1.50% | | $ 14,753,454 | March 2011 |
NOTE E — SUBSEQUENT EVENTSIn preparing the financial statements as of March 31, 2011, no subsequent events or transactions occurred that would have materially impacted the financial statements as presented.
Effective April 30, 2011, the Calvert operating companies will be renamed as follows: Calvert Group, Ltd. will be renamed Calvert Investments, Inc., Calvert Asset Management Company, Inc. will be renamed Calvert Investment Management, Inc., Calvert Distributors, Inc. will be renamed Calvert Investment Distributors, Inc., Calvert Administrative Services Company will be renamed Calvert Investment Administrative Services, Inc., and Calvert Shareholder Services, Inc. will be renamed Calvert Investment Services, Inc.
www.calvert.com CALVERT INCOME FUND SEMI-ANNUAL REPORT (UNAUDITED) 36
| | | | | | | | | |
| FINANCIAL HIGHLIGHTS |
| |
| | | | | | Periods ended | | | | |
| | | MARCH
31, | | | SEPTEMBER 30, | | | SEPTEMBER 30, | |
| class A shares | | 2011 | | | 2010 | | | 2009 | |
| Net asset value, beginning | $ | 16.12 | | $ | 15.39 | | $ | 15.19 | |
| Income from investment operations: | | | | | | | | | |
| Net investment income | | .27 | | | .53 | | | .63 | |
| Net realized and unrealized gain (loss) | | (.09 | ) | | .72 | | | .24 | |
| Total from investment operations | | .18 | | | 1.25 | | | .87 | |
| Distributions from: | | | | | | | | | |
| Net investment income | | (.26 | ) | | (.52 | ) | | (.62 | ) |
| Net realized gain | | — | | | — | | | (.05 | ) |
| Total distributions | | (.26 | ) | | (.52 | ) | | (.67 | ) |
| Total increase (decrease) in net asset value | | (.08 | ) | | .73 | | | .20 | |
| Net asset value, ending | $ | 16.04 | | $ | 16.12 | | $ | 15.39 | |
| |
| Total return* | | 1.14 | % | | 8.27 | % | | 6.24 | % |
| Ratios to average net assets: A | | | | | | | | | |
| Net investment income | | 3.32 | % (a) | | 3.33 | % | | 4.45 | % |
| Total expenses | | 1.26 | % (a) | | 1.23 | % | | 1.24 | % |
| Expenses before offsets | | 1.26 | % (a) | | 1.23 | % | | 1.24 | % |
| Net expenses | | 1.26 | % (a) | | 1.23 | % | | 1.23 | % |
| Portfolio turnover | | 130 | % | | 259 | % | | 793 | % |
| Net assets, ending (in thousands) | $ | 1,848,916 | | $ | 2,321,499 | | $ | 3,041,314 | |
| |
| |
| | | | | | Years ended | | | | |
| | | SEPTEMBER 30, | | | SEPTEMBER 30, | | | SEPTEMBER 30, | |
| class A shares | | 2008 | (z) | | 2007 | (z) | | 2006 | |
| Net asset value, beginning | $ | 16.72 | | $ | 16.72 | | $ | 17.03 | |
| Income from investment operations: | | | | | | | | | |
| Net investment income | | .79 | | | .77 | | | .75 | |
| Net realized and unrealized gain (loss) | | (1.25 | ) | | .01 | | | (.09 | ) |
| Total from investment operations | | (.46 | ) | | .78 | | | .66 | |
| Distributions from: | | | | | | | | | |
| Net investment income | | (.79 | ) | | (.78 | ) | | (.75 | ) |
| Net realized gain | | (.28 | ) | | — | | | (.22 | ) |
| Total distributions | | (1.07 | ) | | (.78 | ) | | (.97 | ) |
| Total increase (decrease) in net asset value | | (1.53 | ) | | — | | | (.31 | ) |
| Net asset value, ending | $ | 15.19 | | $ | 16.72 | | $ | 16.72 | |
| |
| Total return* | | (3.01 | %) | | 4.74 | % | | 4.02 | % |
| Ratios to average net assets: A | | | | | | | | | |
| Net investment income | | 4.86 | % | | 4.60 | % | | 4.54 | % |
| Total expenses | | 1.16 | % | | 1.19 | % | | 1.20 | % |
| Expenses before offsets | | 1.16 | % | | 1.19 | % | | 1.20 | % |
| Net expenses | | 1.16 | % | | 1.18 | % | | 1.20 | % |
| Portfolio turnover | | 982 | % | | 877 | % | | 578 | % |
| Net assets, ending (in thousands) | $ | 4,462,549 | | $ | 5,024,998 | | $ | 3,860,160 | |
See notes to financial highlights.
www.calvert.com CALVERT INCOME FUND SEMI-ANNUAL REPORT (UNAUDITED) 37
| | | | | | | | | |
| FINANCIAL HIGHLIGHTS |
| |
| | | | | | Periods ended | | | | |
| | | MARCH
31, | | | SEPTEMBER 30, | | | SEPTEMBER 30, | |
| class B shares | | 2011 | | | 2010 | | | 2009 | |
| Net asset value, beginning | $ | 16.05 | | $ | 15.32 | | $ | 15.12 | |
| Income from investment operations: | | | | | | | | | |
| Net investment income | | .19 | | | .39 | | | .50 | |
| Net realized and unrealized gain (loss) | | (.09 | ) | | .72 | | | .24 | |
| Total from investment operations | | .10 | | | 1.11 | | | .74 | |
| Distributions from: | | | | | | | | | |
| Net investment income | | (.19 | ) | | (.38 | ) | | (.49 | ) |
| Net realized gain | | — | | | — | | | (.05 | ) |
| Total distributions | | (.19 | ) | | (.38 | ) | | (.54 | ) |
| Total increase (decrease) in net asset value | | (.09 | ) | | .73 | | | .20 | |
| Net asset value, ending | $ | 15.96 | | $ | 16.05 | | $ | 15.32 | |
| |
| Total return* | | .66 | % | | 7.36 | % | | 5.33 | % |
| Ratios to average net assets: A | | | | | | | | | |
| Net investment income | | 2.45 | % (a) | | 2.43 | % | | 3.60 | % |
| Total expenses | | 2.12 | % (a) | | 2.10 | % | | 2.13 | % |
| Expenses before offsets | | 2.12 | % (a) | | 2.10 | % | | 2.13 | % |
| Net expenses | | 2.12 | % (a) | | 2.10 | % | | 2.12 | % |
| Portfolio turnover | | 130 | % | | 259 | % | | 793 | % |
| Net assets, ending (in thousands) | $ | 28,391 | | $ | 38,770 | | $ | 59,127 | |
| |
| |
| | | | | | Years ended | | | | |
| | | SEPTEMBER
30, | | | SEPTEMBER 30, | | | SEPTEMBER 30, | |
| class B shares | | 2008 | (z) | | 2007 | (z) | | 2006 | |
| Net asset value, beginning | $ | 16.68 | | $ | 16.69 | | $ | 17.01 | |
| Income from investment operations: | | | | | | | | | |
| Net investment income | | .67 | | | .64 | | | .63 | |
| Net realized and unrealized gain (loss) | | (1.28 | ) | | .01 | | | (.10 | ) |
| Total from investment operations | | (.61 | ) | | .65 | | | .53 | |
| Distributions from: | | | | | | | | | |
| Net investment income | | (.67 | ) | | (.66 | ) | | (.63 | ) |
| Net realized gain | | (.28 | ) | | — | | | (.22 | ) |
| Total distributions | | (.95 | ) | | (.66 | ) | | (.85 | ) |
| Total increase (decrease) in net asset value | | (1.56 | ) | | (.01 | ) | | (.32 | ) |
| Net asset value, ending | $ | 15.12 | | $ | 16.68 | | $ | 16.69 | |
| |
| Total return* | | (3.89 | %) | | 3.94 | % | | 3.25 | % |
| Ratios to average net assets: A | | | | | | | | | |
| Net investment income | | 4.07 | % | | 3.82 | % | | 3.74 | % |
| Total expenses | | 2.00 | % | | 1.96 | % | | 1.95 | % |
| Expenses before offsets | | 2.00 | % | | 1.96 | % | | 1.95 | % |
| Net expenses | | 2.00 | % | | 1.95 | % | | 1.94 | % |
| Portfolio turnover | | 982 | % | | 877 | % | | 578 | % |
| Net assets, ending (in thousands) | $ | 94,880 | | $ | 206,805 | | $ | 285,301 | |
See notes to financial highlights.
www.calvert.com CALVERT INCOME FUND SEMI-ANNUAL REPORT (UNAUDITED) 38
| | | | | | | | | |
| FINANCIAL HIGHLIGHTS |
| |
| | | | | | Periods ended | | | | |
| | | MARCH
31, | | | SEPTEMBER 30, | | | SEPTEMBER 30, | |
| class c shares | | 2011 | | | 2010 | | | 2009 | |
| Net asset value, beginning | $ | 16.12 | | $ | 15.38 | | $ | 15.18 | |
| Income from investment operations: | | | | | | | | | |
| Net investment income | | .21 | | | .42 | | | .52 | |
| Net realized and unrealized gain (loss) | | (.10 | ) | | .73 | | | .25 | |
| Total from investment operations | | .11 | | | 1.15 | | | .77 | |
| Distributions from: | | | | | | | | | |
| Net investment income | | (.20 | ) | | (.41 | ) | | (.52 | ) |
| Net realized gain | | — | | | — | | | (.05 | ) |
| Total distributions | | (.20 | ) | | (.41 | ) | | (.57 | ) |
| Total increase (decrease) in net asset value | | (.09 | ) | | .74 | | | .20 | |
| Net asset value, ending | $ | 16.03 | | $ | 16.12 | | $ | 15.38 | |
| |
| Total return* | | .72 | % | | 7.56 | % | | 5.48 | % |
| Ratios to average net assets: A | | | | | | | | | |
| Net investment income | | 2.62 | % (a) | | 2.62 | % | | 3.74 | % |
| Total expenses | | 1.95 | % (a) | | 1.93 | % | | 1.93 | % |
| Expenses before offsets | | 1.95 | % (a) | | 1.93 | % | | 1.93 | % |
| Net expenses | | 1.95 | % (a) | | 1.93 | % | | 1.93 | % |
| Portfolio turnover | | 130 | % | | 259 | % | | 793 | % |
| Net assets, ending (in thousands) | $ | 253,857 | | $ | 303,615 | | $ | 372,838 | |
| |
| |
| | | | | | Years ended | | | | |
| | | SEPTEMBER
30, | | | SEPTEMBER 30, | | | SEPTEMBER 30, | |
| class c shares | | 2008 | (z) | | 2007 | (z) | | 2006 | |
| Net asset value, beginning | $ | 16.71 | | $ | 16.70 | | $ | 17.02 | |
| Income from investment operations: | | | | | | | | | |
| Net investment income | | .68 | | | .65 | | | .63 | |
| Net realized and unrealized gain (loss) | | (1.25 | ) | | .02 | | | (.10 | ) |
| Total from investment operations | | .57 | | | .67 | | | .53 | |
| Distributions from: | | | | | | | | | |
| Net investment income | | (.68 | ) | | (.66 | ) | | (.63 | ) |
| Net realized gain | | (.28 | ) | | — | | | (.22 | ) |
| Total distributions | | (.96 | ) | | (.66 | ) | | (.85 | ) |
| Total increase (decrease) in net asset value | | (1.53 | ) | | .01 | | | (.32 | ) |
| Net asset value, ending | $ | 15,18 | | $ | 16.71 | | $ | 16.70 | |
| |
| Total return* | | (3.69 | %) | | 4.09 | % | | 3.24 | % |
| Ratios to average net assets: A | | | | | | | | | |
| Net investment income | | 4.16 | % | | 3.93 | % | | 3.86 | % |
| Total expenses | | 1.85 | % | | 1.87 | % | | 1.90 | % |
| Expenses before offsets | | 1.85 | % | | 1.87 | % | | 1.90 | % |
| Net expenses | | 1.85 | % | | 1.86 | % | | 1.89 | % |
| Portfolio turnover | | 982 | % | | 877 | % | | 578 | % |
| Net assets, ending (in thousands) | $ | 478,073 | | $ | 504,417 | | $ | 390,620 | |
See notes to financial highlights.
www.calvert.com CALVERT INCOME FUND SEMI-ANNUAL REPORT (UNAUDITED) 39
| | | | | | | | | |
| FINANCIAL HIGHLIGHTS |
| |
| | | | | | Periods ended | | | | |
| | | MARCH
31, | | | SEPTEMBER 30, | | | SEPTMEBER 30, | |
| class I shares | | 2011 | | | 2010 | | | 2009 | |
| Net asset value, beginning | $ | 16.14 | | $ | 15.40 | | $ | 15.20 | |
| Income from investment operations: | | | | | | | | | |
| Net investment income | | .32 | | | .63 | | | .72 | |
| Net realized and unrealized gain (loss) | | (.09 | ) | | .73 | | | .24 | |
| Total from investment operations | | .23 | | | 1.36 | | | .96 | |
| Distributions from: | | | | | | | | | |
| Net investment income | | (.32 | ) | | (.62 | ) | | (.71 | ) |
| Net realized gain | | — | | | — | | | (.05 | ) |
| Total distributions | | (.32 | ) | | (.62 | ) | | (.76 | ) |
| Total increase (decrease) in net asset value | | (.09 | ) | | .74 | | | .20 | |
| Net asset value, ending | $ | 16.05 | | $ | 16.14 | | $ | 15.40 | |
| |
| Total return* | | 1.45 | % | | 9.05 | % | | 6.94 | % |
| Ratios to average net assets: A | | | | | | | | | |
| Net investment income | | 4.02 | % (a) | | 4.01 | % | | 5.14 | % |
| Total expenses | | .56 | % (a) | | .55 | % | | .55 | % |
| Expenses before offsets | | .56 | % (a) | | .55 | % | | .55 | % |
| Net expenses | | .56 | % (a) | | .55 | % | | .55 | % |
| Portfolio turnover | | 130 | % | | 259 | % | | 793 | % |
| Net assets, ending (in thousands) | $ | 178,560 | | $ | 261,542 | | $ | 307,978 | |
| |
| | | | | | Years ended | | | | |
| | | SEPTEMBER
30, | | | SEPTEMBER 30, | | | EPTEMBER 30, | |
| class I shares | | 2008 | (z) | | 2007 | (z) | | 2006 | |
| Net asset value, beginning | $ | 16.72 | | $ | 16.70 | | $ | 17.02 | |
| Income from investment operations: | | | | | | | | | |
| Net investment income | | .89 | | | .87 | | | .85 | |
| Net realized and unrealized gain (loss) | | (1.24 | ) | | .01 | | | (.10 | ) |
| Total from investment operations | | (.35 | ) | | .88 | | | .75 | |
| Distributions from: | | | | | | | | | |
| Net investment income | | (.89 | ) | | (.86 | ) | | (.85 | ) |
| Net realized gain | | (.28 | ) | | — | | | (.22 | ) |
| Total distributions | | (1.17 | ) | | (.86 | ) | | (1.07 | ) |
| Total increase (decrease) in net asset value | | (1.52 | ) | | .02 | | | (.32 | ) |
| Net asset value, ending | $ | 15.20 | | $ | 16.72 | | $ | 16.70 | |
| |
| Total return* | | (2.36 | %) | | 5.40 | % | | 4.65 | % |
| Ratios to average net assets: A | | | | | | | | | |
| Net investment income | | 5.47 | % | | 5.24 | % | | 5.18 | % |
| Total expenses | | .53 | % | | .55 | % | | .56 | % |
| Expenses before offsets | | .53 | % | | .55 | % | | .56 | % |
| Net expenses | | .53 | % | | .54 | % | | .55 | % |
| Portfolio turnover | | 982 | % | | 877 | % | | 578 | % |
| Net assets, ending (in thousands) | $ | 355,103 | | $ | 312,520 | | $ | 76,362 | |
See notes to financial highlights.
www.calvert.com CALVERT INCOME FUND SEMI-ANNUAL REPORT (UNAUDITED) 40
| | | | | | | | | |
| FINANCIAL HIGHLIGHTS |
| |
| |
| | | | | | PerIods ended | | | | |
| | | MARCH
31, | | | SEPTEMBER 30, | | | SEPTEMBER 30, | |
| class R shares | | 2011 | | | 2010 | | | 2009 | |
| Net asset value, beginning | $ | 16.22 | | $ | 15.48 | | $ | 15.25 | |
| Income from investment operations: | | | | | | | | | |
| Net investment income | | .25 | | | .49 | | | .58 | |
| Net realized and unrealized gain (loss) | | (.10 | ) | | .73 | | | .27 | |
| Total from investment operations | | .15 | | | 1.22 | | | .85 | |
| Distributions from: | | | | | | | | | |
| Net investment income | | (.24 | ) | | (.48 | ) | | (.57 | ) |
| Net realized gain | | — | | | — | | | (.05 | ) |
| Total distributions | | (.24 | ) | | (.48 | ) | | (.62 | ) |
| Total increase (decrease) in net asset value | | (.09 | ) | | .74 | | | .23 | |
| Net asset value, ending | $ | 16.13 | | $ | 16.22 | | $ | 15.48 | |
| |
| Total return* | | .96 | % | | 8.01 | % | | 6.05 | % |
| Ratios to average net assets: A | | | | | | | | | |
| Net investment income | | 3.11 | % (a) | | 3.11 | % | | 4.06 | % |
| Total expenses | | 1.54 | % (a) | | 1.45 | % | | 1.51 | % |
| Expenses before offsets | | 1.47 | % (a) | | 1.45 | % | | 1.48 | % |
| Net expenses | | 1.47 | % (a) | | 1.45 | % | | 1.47 | % |
| Portfolio turnover | | 130 | % | | 259 | % | | 793 | % |
| Net assets, ending (in thousands) | $ | 11,274 | | $ | 12,306 | | $ | 11,571 | |
| |
| | | | | | PerIods ended | |
| | | | | | sePteMBer 30, | | | sePteMBer 30, | |
| class R shares | | | | | 2008 | (z) | | 2007 | #(z) |
| Net asset value, beginning | | | | $ | 16.75 | | $ | 16.78 | |
| Income from investment operations: | | | | | | | | | |
| Net investment income | | | | | .71 | | | .51 | |
| Net realized and unrealized gain (loss) | | | | | (1.23 | ) | | .09 | |
| Total from investment operations | | | | | (.52 | ) | | .60 | |
| Distributions from: | | | | | | | | | |
| Net investment income | | | | | (.70 | ) | | (.63 | ) |
| Net realized gain | | | | | (.28 | ) | | — | |
| Total distributions | | | | | (.98 | ) | | (.63 | ) |
| Total increase (decrease) in net asset value | | | | | (1.50 | ) | | (.03 | ) |
| Net asset value, ending | | | | $ | 15.25 | | $ | 16.75 | |
| |
| Total return* | | | | | (3.33 | %) | | 3.66 | % |
| Ratios to average net assets: A | | | | | | | | | |
| Net investment income | | | | | 4.44 | % | | 4.41 | % (a) |
| Total expenses | | | | | 1.78 | % | | 10.44 | % (a) |
| Expenses before offsets | | | | | 1.47 | % | | 1.48 | % (a) |
| Net expenses | | | | | 1.47 | % | | 1.47 | % (a) |
| Portfolio turnover | | | | | 982 | % | | 814 | % |
| Net assets, ending (in thousands) | | | | $ | 6,179 | | $ | 1,304 | |
See notes to financial highlights.
www.calvert.com CALVERT INCOME FUND SEMI-ANNUAL REPORT (UNAUDITED) 41
| | | | | | |
| FINANCIAL HIGHLIGHTS |
| |
| | | Periods ended | |
| | | MARCH
31, | | | SEPTEMBER 30, | |
| class Y shares | | 2011 | | | 2010 | |
| Net asset value, beginning | $ | 16.29 | | $ | 15.53 | |
| Income from investment operations: | | | | | | |
| Net investment income | | .30 | | | .56 | |
| Net realized and unrealized gain (loss) | | (.10 | ) | | .76 | |
| Total from investment operations | | .20 | | | 1.32 | |
| Distributions from: | | | | | | |
| Net investment income | | (.29 | ) | | (.56 | ) |
| Net realized gain | | — | | | — | |
| Total distributions | | (.29 | ) | | (.56 | ) |
| Total increase (decrease) in net asset value | | (.09 | ) | | .76 | |
| Net asset value, ending | $ | 16.20 | | $ | 16.29 | |
| |
| Total return* | | 1.28 | % | | 8.65 | % |
| Ratios to average net assets: A | | | | | | |
| Net investment income | | 3.69 | % (a) | | 3.76 | % |
| Total expenses | | .89 | % (a) | | .83 | % |
| Expenses before offsets | | .89 | % (a) | | .83 | % |
| Net expenses | | .89 | % (a) | | .83 | % |
| Portfolio turnover | | 130 | % | | 259 | % |
| Net assets, ending (in thousands) | $ | 81,730 | | $ | 104,674 | |
| |
| |
| | | PerIods ended | |
| | | SEPTEMBER 30, | | | SEPTEMBER 30, | |
| class Y shares | | 2009 | | | 2008 | ## (z) |
| Net asset value, beginning | $ | 15.29 | | $ | 16.38 | |
| Income from investment operations: | | | | | | |
| Net investment income | | .67 | | | .31 | |
| Net realized and unrealized gain (loss) | | .27 | | | (1.02 | ) |
| Total from investment operations | | .94 | | | (.71 | ) |
| Distributions from: | | | | | | |
| Net investment income | | (.65 | ) | | (.38 | ) |
| Net realized gain | | (.05 | ) | | — | |
| Total distributions | | (.70 | ) | | (.38 | ) |
| Total increase (decrease) in net asset value | | .24 | | | (1.09 | ) |
| Net asset value, ending | $ | 15.53 | | $ | 15.29 | |
| |
| Total return* | | 6.73 | % | | (4.41 | %) |
| Ratios to average net assets: A | | | | | | |
| Net investment income | | 4.71 | % | | 4.48 | % (a) |
| Total expenses | | .84 | % | | 2.34 | % (a) |
| Expenses before offsets | | .84 | % | | .90 | % (a) |
| Net expenses | | .83 | % | | .90 | % (a) |
| Portfolio turnover | | 793 | % | | 529 | % |
| Net assets, ending (in thousands) | $ | 19,351 | | $ | 10,481 | |
See notes to financial highlights.
www.calvert.com CALVERT INCOME FUND SEMI-ANNUAL REPORT (UNAUDITED) 42
| A | Total expenses do not reflect amounts reimbursed and/or waived by the Advisor or reductions from expense offset arrangements. Expenses before offsets reflect expenses after reimbursement and/or waiver by the Advisor but prior to reductions from expense offset arrangements. Net expenses are net of all reductions and represent the net expenses paid by the Fund. |
| * | Total return is not annualized for periods less than one year and does not reflect deduction of any front-end or deferred sales charge. |
| # | From October 31, 2006, inception. |
| ## | From February 29, 2008, inception. |
| (a) | Annualized. |
| (z) | Per share figures are calculated using the Average Shares Method. |
See notes to financial statements.
www.calvert.com CALVERT INCOME FUND SEMI-ANNUAL REPORT (UNAUDITED) 43
EXPLANATION OF FINANCIAL TABLES
SCHEDULE OF INVESTMENTS
The Schedule of Investments is a snapshot of all securities held in the fund at their market value, on the last day of the reporting period. Securities are listed by asset type (e.g., common stock, corporate bonds, U.S. government obligations) and may be further broken down into sub-groups and by industry classification.
STATEMENT OF ASSETS AND LIABILITIES
The Statement of Assets and Liabilities is often referred to as the fund’s balance sheet. It lists the value of what the fund owns, is due and owes on the last day of the reporting period. The fund’s assets include the market value of securities owned, cash, receivables for securities sold and shareholder subscriptions, and receivables for dividends and interest payments that have been earned, but not yet received. The fund’s liabilities include payables for securities purchased and shareholder redemptions, and expenses owed but not yet paid. The statement also reports the fund’s net asset value (NAV) per share on the last day of the reporting period. The NAV is calculated by dividing the fund’s net assets (assets minus liabilities) by the number of shares outstanding. This statement is accompanied by a Schedule of Investments. Alternatively, if certain conditions are met, a Statement of Net Assets may be presented in lieu of this statement and the Schedule of Investments.
STATEMENT OF NET ASSETS
The Statement of Net Assets provides a detailed list of the fund’s holdings, including each security’s market value on the last day of the reporting period. The Statement of Net Assets includes a Schedule of Investments. Other assets are added and other liabilities subtracted from the investments total to calculate the fund’s net assets. Finally, net assets are divided by the outstanding shares of the fund to arrive at its share price, or Net Asset Value (NAV) per share.
At the end of the Statement of Net Assets is a table displaying the composition of the fund’s net assets. Paid in Capital is the money invested by shareholders and represents the bulk of net assets. Undistributed Net Investment Income and Accumulated Net Realized Gains usually approximate the amounts the fund had available to distribute to shareholders as of the statement date. Accumulated Realized Losses will appear as negative balances. Unrealized Appreciation (Depreciation) is the difference between the market value of the fund’s investments and their cost, and reflects the gains (losses) that would be realized if the fund were to sell all of its investments at their statement-date values.
www.calvert.com CALVERT INCOME FUND SEMI-ANNUAL REPORT (UNAUDITED) 44
STATEMENT OF OPERATIONS
The Statement of Operations summarizes the fund’s investment income earned and expenses incurred in operating the fund. Investment income includes dividends earned from stocks and interest earned from interest-bearing securities in the fund. Expenses incurred in operating the fund include the advisory fee paid to the investment advisor, administrative services fees, distribution plan expenses (if applicable), transfer agent fees, shareholder servicing expenses, custodial, legal, and audit fees, and the printing and postage expenses related to shareholder reports. Expense offsets (fees paid indirectly) are also shown. Credits earned from offset arrangements are used to reduce the fund’s expenses. This statement also shows net gains (losses) realized on the sale of investments and the increase or decrease in the unrealized appreciation (depreciation) on investments held during the period.
STATEMENT OF CHANGES IN NET ASSETS
The Statement of Changes in Net Assets shows how the fund’s total net assets changed during the two most recent reporting periods. Changes in the fund’s net assets are attributable to investment operations, distributions and capital share transactions.
The Operations section of the report summarizes information detailed in the Statement of Operations. The Distribution section shows the dividend and capital gain distributions made to shareholders. The amounts shown as distributions in this section may not match the net investment income and realized gains amounts shown in the Operations section because distributions are determined on a tax basis and certain investments or transactions may be treated differently for financial statement and tax purposes. The Capital Share Transactions section shows the amount shareholders invested in the fund, either by purchasing shares or by reinvesting distributions, and the amounts redeemed. The corresponding numbers of shares issued, reinvested and redeemed are shown at the end of the report.
FINANCIAL HIGHLIGHTS
The Financial Highlights table provides a per-share breakdown per class of the components that affect the fund’s net asset value for current and past reporting periods. The table provides total return, total distributions, expense ratios, portfolio turnover and net assets for the applicable period. Total return is a measure of a fund’s performance that encompasses all elements of return: dividends, capital gain distributions and changes in net asset value. Total return is the change in value of an investment over a given period, assuming reinvestment of any dividends and capital gain distributions, expressed as a percentage of the initial investment. Total distributions include distributions from net investment income and net realized gains. Long-term gains are earned on securities held in the fund more than one year. Short-term gains, on the sale of securities held less than one year, are treated as ordinary dividend income for tax purposes. The expense ratio is a fund’s cost of doing business, expressed as a percentage of net assets. These expenses directly reduce returns to shareholders. Portfolio turnover measures the trading activity in a fund’s investment portfolio – how often securities are bought and sold by a fund. Portfolio turnover is affected by market conditions, changes in the size of the fund, the nature of the fund’s investments and the investment style of the portfolio manager.
www.calvert.com CALVERT INCOME FUND SEMI-ANNUAL REPORT (UNAUDITED) 45
PROXY VOTING
The Proxy Voting Guidelines of the Calvert Funds that the Fund uses to determine how to vote proxies relating to portfolio securities are provided as an Appendix to the Fund’s Statement of Additional Information. The Statement of Additional Information can be obtained free of charge by calling the Fund at 1-800-368-2745, by visiting the Calvert website at www.calvert.com; or by visiting the SEC’s website at www.sec.gov.
Information regarding how the Fund voted proxies relating to portfolio securities during the most recent 12-month period ended June 30 is available on the Fund’s website at www.calvert.com and on the SEC’s website at www.sec.gov.
AVAILABILITY OF QUARTERLY PORTFOLIO HOLDINGS
The Fund files its complete schedule of portfolio holdings with the SEC for the first and third quarters of each fiscal year on Form N-Q. The Fund’s Form N-Q is available on the SEC’s website at www.sec.gov. The Fund’s Form N-Q may be reviewed and copied at the SEC’s Public Reference Room in Washington, DC; information on the operation of the Public Reference Room may be obtained by calling 1-800-SEC-0330.
BASIS FOR BOARD’S APPROVAL OF INVESTMENT ADVISORY CONTRACT
At a meeting held on December 8, 2010, the Board of Trustees, and by a separate vote, the disinterested Trustees, approved the continuance of the Investment Advisory Agreement between The Calvert Fund and the Advisor with respect to the Fund.
In evaluating the Investment Advisory Agreement, the Board considered a variety of information relating to the Fund and the Advisor. The disinterested Trustees reviewed a report prepared by the Advisor regarding various services provided to the Fund by the Advisor and its affiliates. Such report included, among other data, information regarding the Advisor’s personnel and the Advisor’s revenue and cost of providing services to the Fund, and a separate report prepared by an independent third party, which provided a statistical analysis comparing the Fund’s investment performance, expenses, and fees to comparable mutual funds.
The disinterested Trustees were separately represented by independent legal counsel with respect to their consideration of the reapproval of the Investment Advisory Agreement. Prior to voting, the disinterested Trustees reviewed the proposed continuance of the Investment Advisory Agreement with management and also met in private sessions with their counsel at which no representatives of management were present.
In the course of its deliberations regarding the Investment Advisory Agreement, the Board considered the following factors, among others: the nature, extent and quality of the services provided by the Advisor, including the personnel providing such services; the Advisor’s financial condition; the level and method of computing the Fund’s advisory
www.calvert.com CALVERT INCOME FUND SEMI-ANNUAL REPORT (UNAUDITED) 46
fee; comparative performance, fee and expense information for the Fund; the profitability of the Calvert Group of Funds to the Advisor and its affiliates; the direct and indirect benefits, if any, derived by the Advisor and its affiliates from their relationship with the Fund; the effect of the Fund’s growth and size on the Fund’s performance and expenses; the affiliated distributor’s process for monitoring sales load breakpoints; the Advisor’s compliance programs and policies; the Advisor’s performance of substantially similar duties for other funds; and any possible conflicts of interest.
In considering the nature, extent and quality of the services provided by the Advisor under the Investment Advisory Agreement, the Board reviewed information provided by the Advisor relating to its operations and personnel, including, among other information, biographical information on the Advisor’s investment, supervisory and professional staff and descriptions of its organizational and management structure. The Board also took into account similar information provided periodically throughout the previous year by the Advisor as well as the Board’s familiarity with management through Board of Trustees’ meetings, discussions and other reports. The Board considered the Advisor’s management style and its performance in employing its investment strategies, as well as its current level of staffing and overall resources. The Advisor’s administrative capabilities, including its ability to supervise the other service providers for the Fund, were also considered. The Board concluded that it was satisfied with the nature, extent and quality of services provided to the Fund by the Advisor under the Investment Advisory Agreement.
In considering the Fund’s performance, the Board noted that it reviewed on a quarterly basis detailed information about the Fund’s performance results, portfolio composition and investment strategies. In addition, the Board took into account overall financial market conditions. The Board also reviewed various comparative data provided to it in connection with its consideration of the renewal of the Investment Advisory Agreement, including, among other information, a comparison of the Fund’s total return with its Lipper index and with that of other mutual funds deemed to be in its peer group by an independent third party in its report. This comparison indicated that the Fund performed below the median of its peer group for the one-, three- and five-year periods ended June 30, 2010. The data also indicated that the Fund underperformed its Lipper index for the one-, three- and five-year periods ended June 30, 2010. The Board took into account management’s discussion of the Fund’s performance and management’s continued monitoring of the Fund’s performance. Based upon its review, the Board concluded that appropriate action was being taken with respect to the Fund’s performance.
In considering the Fund’s fees and expenses, the Board compared the Fund’s fees and total expense ratio with various comparative data for the funds in its peer group. Among other findings, the data indicated that the Fund’s advisory fee was below the median of its peer group and that total expenses were above the median of its peer group. The Board noted that the allocation of advisory and administrative fees may vary among the Fund’s peer group. The Board also took into account the Advisor’s current undertaking to maintain expense limitations for the Fund’s Class I, Class R and Class Y shares. Based upon its review, the Board determined that the advisory fee was reasonable in view of the quality of services provided by the Advisor and the other factors considered.
www.calvert.com CALVERT INCOME FUND SEMI-ANNUAL REPORT (UNAUDITED) 47
The Board reviewed the Advisor’s profitability on a fund-by-fund basis. In reviewing the overall profitability of the advisory fee to the Fund’s Advisor, the Board also considered the fact that affiliates of the Advisor provided shareholder servicing and administrative services to the Fund for which they received compensation. The information considered by the Board included Calvert’s operating profit margin information both before and after tax expenses with respect to the services that the Advisor and its affiliates provided to the Calvert Group of Funds complex. The Board reviewed the profitability of the Advisor’s relationship with the Fund in terms of the total amount of annual advisory fees it received with respect to the Fund and whether the Advisor had the financial wherewithal to continue to provide a high level of services to the Fund. The Board noted the Advisor’s current undertaking to maintain expense limitations for the Fund’s Class I, Class R and Class Y shares. The Board also considered that the Advisor derived benefits to its reputation and other indirect benefits from its relationship with the Fund. Based upon its review, the Board concluded that the Advisor’s and its affiliates’ level of profitability from their relationship with the Fund was reasonable.
The Board considered the effect of the Fund’s current size and potential growth on its performance and fees. The Board took into account that the Fund’s advisory fee schedule contained breakpoints that would reduce the advisory fee rate on assets above specified levels as the Fund’s assets increased. The Board noted that the Fund was currently realizing economies of scale in its advisory fee. The Board also noted that if the Fund’s assets increased over time, the Fund might realize other economies of scale if assets increased proportionally more than certain other expenses.
In reapproving the Investment Advisory Agreement, the Board, including the disinterested Trustees, did not identify any single factor as controlling, and each Trustee may have attributed different weight to various factors.
Conclusions
The Board reached the following conclusions regarding the Investment Advisory Agreement, among others: (a) the Advisor has demonstrated that it possesses the capability and resources to perform the duties required of it under the Investment Advisory Agreement; (b) the Advisor maintains appropriate compliance programs; (c) appropriate action is being taken with respect to the performance of the Fund; (d) the Advisor is likely to execute its investment strategies consistently over time; and (e) the Fund’s advisory fee is reasonable relative to those of similar funds and to the services to be provided by the Advisor. Based on its conclusions, the Board determined that reapproval of the Investment Advisory Agreement would be in the best interests of the Fund and its shareholders.
www.calvert.com CALVERT INCOME FUND SEMI-ANNUAL REPORT (UNAUDITED) 48
To Open an Account
800-368-2748
Yields and Prices
Calvert Information Network
(24 hours, 7 days a week)
800-368-2745
Service for Existing Account
Shareholders: 800-368-2745
Brokers: 800-368-2746
TDD for Hearing Impaired
800-541-1524
Branch Office
4550 Montgomery Avenue
Suite 1000 North
Bethesda, Maryland 20814
Registered, Certified or Overnight Mail
Calvert Investments
c/o BFDS,
330 West 9th Street
Kansas City, MO 64105
Web Site
www.calvert.com
Principal Underwriter
Calvert Investment Distributors, Inc.
4550 Montgomery Avenue
Suite 1000 North
Bethesda, Maryland 20814
| | |
| CALVERT | CALVERT’S | Equity Funds |
| INCOME | FAMILY OF FUNDS | Enhanced Equity Portfolio |
| FUND | | Equity Portfolio |
| | Tax-Exempt Money | Large Cap Growth Fund |
| | Market Funds | Large Cap Value Fund |
| | CTFR Money Market Portfolio | Social Index Fund |
| | | Capital Accumulation Fund |
| | Taxable Money Market | International Equity Fund |
| | Funds | Small Cap Fund |
| | First Government Money Market | Global Alternative Energy Fund |
| | Fund | Global Water Fund |
| | Money Market Portfolio | International Opportunities Fund |
| |
| | Municipal Funds | Balanced and Asset |
| | Tax-Free Bond Fund | Allocation Funds |
| | | Balanced Portfolio |
| | Taxable Bond Funds | Conservative Allocation Fund |
| | Bond Portfolio | Moderate Allocation Fund |
| | Income Fund | Aggressive Allocation Fund |
| | Short Duration Income Fund | |
| | Long-Term Income Fund | |
| | Ultra-Short Income Fund | |
| | Government Fund | |
| | High-Yield Bond Fund | |
This report is intended to provide fund information to shareholders. It is not authorized for distribution to prospective investors unless preceded or accompanied by a prospectus.
Note: The information on our website is not incorporated by reference into this report; our website address is included as an inactive textual reference only.
Investors should carefully consider the investment objectives, risks, charges and expenses of the Calvert Funds. This and other important information is contained in the fund’s summary prospectus and prospectus, which can be obtained from your financial professional and should be read carefully before investing. You may also call Calvert at 800/368-2745 or visit www. calvert.com.
INFORMATION REGARDING CALVERT OPERATING COMPANY
NAME CHANGES
Effective on April 30, 2011, the following Calvert operating companies will be renamed as indicated:
| | |
| Current Company Name | Company Name on 4/30/11 | Company Description |
| |
| Calvert Group, Ltd. | Calvert Investments, Inc. | Corporate parent of each |
| | | operating company listed |
| | | below |
| |
| Calvert Asset Management | Calvert Investment | Investment advisor to the |
| Company, Inc. | Management, Inc. | Calvert Funds |
| |
| Calvert Distributors, Inc. | Calvert Investment Distributors, | Principal underwriter |
| | Inc. | and distributor for the |
| | | Calvert Funds |
| |
| Calvert Administrative | Calvert Investment | Administrative services |
| Services Company | Administrative Services, Inc. | provider for the Calvert |
| | | Funds |
| |
| Calvert Shareholder | Calvert Investment Services, | Shareholder servicing |
| Services, Inc. | Inc. | provider for the Calvert |
| | | Funds |
Choose Planet-friendly E-delivery!
Sign up now for on-line statements, prospectuses, and fund reports. In less than five minutes you can help reduce paper mail and lower fund costs.
Just go to www.calvert.com. If you already have an online account at Calvert, click on My Account, and select the documents you would like to receive via e-mail.
If you’re new to online account access, click on Login/Register to open an online account. Once you’re in, click on the E-delivery sign-up at the bottom of the Account Portfolio page and follow the quick, easy steps. Note: if your shares are not held directly at Calvert but through a brokerage firm, you must contact your broker for electronic delivery options available through their firm.

TABLE
OFCONTENTS
| 4 | President’s Letter |
| 6 | Portfolio Management Discussion |
| 11 | Shareholder Expense Example |
| 13 | Schedule of Investments |
| 29 | Statement of Assets and Liabilities |
| 30 | Statement of Operations |
| 31 | Statements of Changes in Net Assets |
| 33 | Notes to Financial Statements |
| 41 | Financial Highlights |
| 46 | Explanation of Financial Tables |
| 48 | Proxy Voting and Availability of Quarterly Portfolio Holdings |
| 48 | Basis for Board’s Approval of Investment Advisory Contract |
Dear Shareholder:
The financial markets ended the six-month period on a high note. The Federal Reserve’s announcement in the fall of 2010 of a second round of quantitative easing (QE2) and the extension in December of the Bush-era tax cuts for all income levels helped buoy the markets and pushed Treasury yields higher. The resulting increase in U.S. consumer spending and confidence helped drive a year-end rally.
This calm lasted until new storms arrived in the beginning of 2011. Civil and political unrest in the Middle East and North Africa sent the price of crude soaring and heightened energy security concerns in many countries around the world. In March, the tragic earthquake and tsunami struck Japan. Our sympathies go out to the people of Japan who lost loved ones in this disaster. The earthquake—and its impact on the country’s nuclear reactors—roiled global financial markets. The cumulative effect of these events sparked a brief sell-off in corporate bonds as investors moved into the relative safety of U.S. Treasuries.
Fixed-Income Markets Continue to be Volatile
Investment-grade corporate bonds edged down slightly for the reporting period, with the Barclays Capital U.S. Credit Index returning -0.98%, while high-yield bonds, as measured by the BofA Merrill Lynch U.S. High Yield Master II Index, returned 7.09%. Money-market returns remained flat, reflecting the Fed’s efforts to keep its target interest rate very low.
Corporate bonds continued to benefit from generally strong corporate earnings and lower default expectations during the fourth quarter of 2010. This trend continued during the first quarter of 2011 as investors became more comfortable moving into riskier asset classes to chase yield. However, most fixed-income sectors experienced significant volatility as investors reacted to the turmoil in the Middle East and the ensuing climb in oil prices as well as the disaster in Japan—which prompted some investors to move back into the relative safety of Treasuries as noted above.
Municipal bond returns suffered greatly in the final months of 2010 due to heavy municipal debt issuance, record municipal bond fund redemptions by retail investors, and fear of massive municipal debt defaults, which appears to be unfounded. Fortunately, prices steadied after the turn of the year due to slowing investor outflows and minimal new debt issuance.
Opportunities and Challenges Ahead
Overall, we are optimistic and expect a slow, gradual economic recovery to continue, which we believe should help sustain a corporate bond rally through the remainder of 2011. A low core inflation rate (which excludes food and energy prices) will likely facilitate economic growth, while continued debt reduction, lingering high unemployment, and a struggling housing market will limit gains. Energy prices will
| www. | calvert.com CALVERT SHORT DURATION INCOME FUND SEMI-ANNUAL REPORT (UNAUDITED) 4 |
remain a challenge until we see more resolution of the events in the Middle East and North Africa. Of course, more geopolitical crises, rising commodity prices, and inflation spikes could certainly dampen the markets.
In short, we believe the markets, the global economy, and your Calvert funds can successfully navigate through any temporary setbacks.
Discuss Your Portfolio Allocations with Your Advisor
Given the market shifts we have experienced, your overall portfolio asset allocation and investment strategy may no longer match your needs. Therefore, we recommend reviewing these with your financial advisor to ensure that your target mix of U.S. and international stocks, bonds, and cash is well-diversified and appropriate given your financial goals, time horizon, and risk tolerance.
We encourage you to visit our website, www.calvert.com, for fund information and updates as well as market and economic commentary from Calvert professionals.
As noted elsewhere in this report, the Calvert operating companies that provide services to the funds will change their names effective April 30, 2011. As part of the changes, Calvert Group, Ltd. will be known as Calvert Investments, Inc., and the funds’ advisor, Calvert Asset Management Company, Inc., will be known as Calvert Investment Management, Inc.
As always, we appreciate your investing with Calvert.

Barbara J. Krumsiek
President and CEO
Calvert Investments, Inc.
April 2011
| www. | calvert.com CALVERT SHORT DURATION INCOME FUND SEMI-ANNUAL REPORT (UNAUDITED) 5 |
PORTFOLIO MANAGEMENT DISCUSSION

Gregory Habeeb
Senior Vice President and Senior Portfolio Manager
of Calvert Investment Management, Inc.
Performance
For the six-month period ended March 31, 2011, Calvert Short Duration Income Fund (Class A shares at NAV) returned 1.02%. Its benchmark index, the Barclays Capital 1-5 Year U.S. Credit Index, returned 0.27% for the period. The Fund’s short relative duration strategy was primarily responsible for the portfolio’s outperformance. Duration is a measure of a portfolio’s sensitivity to changes in interest rates. The longer the duration, the greater the change in price relative to interest rate movements. The Fund’s allocation to high-yield bonds also helped relative returns.
CALVERT SHORT DURATION INCOME FUND
MARCH 31, 2011
INVESTMENT PERFORMANCE
(TOTAL RETURN AT NAV*)
| | 6 Months | | 12 Months | |
| | ended | | ended | |
| | 3/31/11 | | 3/31/11 | |
| Class A | 1.02 | % | 3.69 | % |
| Class C | 0.59 | % | 2.86 | % |
| Class I | 1.29 | % | 4.29 | % |
| Class Y | 1.11 | % | 3.96 | % |
| Barclays Capital 1-5 | | | | |
| Year U.S. Credit | | | | |
| Index | 0.27 | % | 4.36 | % |
| Lipper Short Investment | | | |
| Grade Debt Funds | | | | |
| Average | 0.53 | % | 3.03 | % |
| |
| SEC YIELDS | | | | |
| | 30 days ended | |
| | 3/31/11 | | 9/30/10 | |
| Class A | 1.82 | % | 1.82 | % |
| Class C | 1.16 | % | 1.15 | % |
| Class I | 2.46 | % | 2.44 | % |
| Class Y | 2.17 | % | 2.14 | % |
Investment Climate
The six-month reporting period was characterized by four clear phases in interest-rate movements. The first was a steady and strong upward movement in interest rates. The 10-year Treasury yield increased from 2.33% in early October to 3.57% by mid-December. The Federal Reserve’s (Fed) announcement of new Treasury purchases in November did little to slow the advance as economic data improved. In December, many analysts raised their forecasts for economic growth, and stocks rallied as a larger-than-expected fiscal stimulus package was passed. The second phase featured a fairly quiet trading range. During phase three, from early to mid-February, yields rose as the unemployment rate fell sharply, boosting confidence in the economy and triggering a rally in stocks. The
* Investment performance/return at NAV does not reflect the deduction of the Fund’s maximum 2.75% front-end sales charge or any deferred sales charge.
www.calvert.com CALVERT SHORT DURATION INCOME FUND SEMI-ANNUAL REPORT (UNAUDITED) 6
| | | |
| | % of Total | |
| ECONOMIC SECTORS | Investments | |
| Asset Backed Securities | 3.3 | % |
| Basic Materials | 1.8 | % |
| Communications | 3.7 | % |
| Consumer, Cyclical | 4.0 | % |
| Consumer, Non-cyclical | 3.2 | % |
| Diversified | 0.6 | % |
| Energy | 4.1 | % |
| Financials | 43.2 | % |
| Government | 15.2 | % |
| Industrials | 5.4 | % |
| Insurance | 0.1 | % |
| Mortgage Securities | 11.0 | % |
| Technology | 1.5 | % |
| Utilities | 2.9 | % |
| Total | 100 | % |
10-year Treasury yield peaked at 3.74%.
In the final phase, yields began to fall as turmoil in the Middle East pushed up the price of oil and raised doubts about the strength of the young economic expansion. Volatility increased in global financial markets. Doubt, uncertainty, and volatility were amplified by the terrible March 11 earthquake and tsunami in Japan. Treasury yields continued to fall, with the 10-year yield bottoming at 3.14% a few days after the disaster. After the shock wore off, stocks regained their footing and Treasury yields recovered some ground. The 10-year Treasury yield ended the reporting period near 3.5%, which was close to the middle of the range over the full reporting period.1
During the reporting period, we estimate that the U.S. economy grew at an annualized rate of 3.3%.2 This is very near the 50-year average growth rate, but remains below the rate seen, at a similar point in the business cycle, after prior deep recessions in the post-WWII era. The core consumer price inflation (CPI) rate increased from 0.6% to 1.1% during the reporting period,3 so the Fed’s concern about unwanted disinflation abated. While the inflation rate was trending up, the level of both core and headline inflation rates remained below long-run averages. Market expectations for inflation in coming years increased to a level more in line with long-term averages.
Portfolio Strategy
The Fund benefitted from higher interest rates across the yield curve. The yields on two- and 10-year Treasuries increased by 35 and 91 basis points, respectively, over the six-month reporting period. The Fund’s allocation to high-yield bonds also helped relative performance. At the start of the reporting period, 13.56% of the Fund was allocated to high-yield bonds. Over the reporting period, the Barclays U.S. Corporate High Yield Index returned 7.23%, while the more broadly based Barclays Capital U.S. Credit Index returned -0.98%.
The Fund employed a yield-curve-flattening strategy. This had a mixed effect as some portions of the yield curve narrowed while others widened. The Fund was positioned to benefit from a narrowing of the yield differential between the 10- and 30-year U.S. Treasuries, which helped performance, as this section of the yield curve narrowed from 160 basis points to 104 basis points. However, the Fund also was positioned to benefit from narrowing of the yield differential between two- and 10- year Treasuries. This section of the yield curve widened from 209 to 265 basis points during the reporting period, which hurt performance. The Fund uses Treasury futures to hedge its interest rate position.
www. calvert.com CALVERT SHORT DURATION INCOME FUND SEMI-ANNUAL REPORT (UNAUDITED) 7
GROWTH OF $10,000
The graph below shows the value of a hypothetical $10,000 investment in the fund over the past 10 fiscal year periods or since inception (for funds without 10-year records). The results shown are for Class A shares and reflect the deduction of the maximum front-end sales charge of 2.75%, and assume the reinvestment of dividends. The result is compared with benchmarks that include a broad based market index and a Lipper peer group average. Market indexes are unmanaged and their results do not reflect the effect of expenses or sales charges. The Lipper average reflects the deduction of the category’s average front-end sales charge. The value of an investment in a different share class would be different.
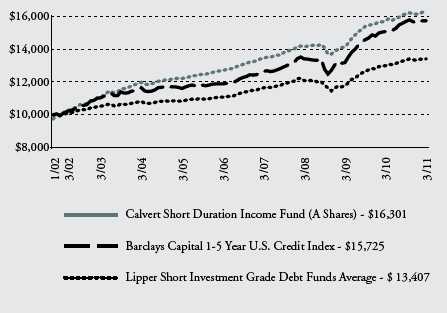
All performance data shown, including the graph above and the adjacent table, represents past performance, does not guarantee future results, assumes reinvestment of dividends and distributions and does not reflect the deduction of taxes that a shareholder would pay on the Fund’s/Portfolio’s distributions or the redemption of the Fund/Portfolio shares. The investment return and principal value of an investment will fluctuate so that an investor’s shares, when redeemed, may be worth more or less than their original cost. Current performance may be lower or higher than the performance data quoted; for current performance data visit www.calvert.com. The gross expense ratio from the current prospectus for Class A shares is 1.14%. This number may differ from the expense ratio shown elsewhere in this report because it is based on a different time period and, if applicable, does not include fee or expense waivers. Performance data quoted already reflects the deduction of the Fund’s/Portfolio’s operating expenses.
www. calvert.com CALVERT SHORT DURATION INCOME FUND SEMI-ANNUAL REPORT (UNAUDITED) 8
Outlook
The U.S. economy continues to recover from severe financial crisis. Deleveraging in household and financial sectors continues, suggesting moderate, not heated, growth and consumer price inflation. Monetary policy should remain easy in coming quarters as federal, state, and local fiscal stimuli continue to recede or contract. The impact from the long stretch of extraordinarily easy Fed policy, with its near-zero percent short-term interest rates and government bond purchases, is clear in the higher prices of stocks, bonds, and commodities, but not in consumer price indices.
Once again, events external to the United States created more uncertainty about the outlook for U.S. growth, inflation, and monetary policy. In addition to geopolitical tensions in the Middle East and natural disaster in Japan, deepening eurozone debt troubles have put Portugal on the brink of a bailout from the European Union/International Monetary Fund rescue facility. If the country does require a financial rescue package, Portugal would become the third eurozone member to receive a bailout. The rescue facility can accommodate Greece, Ireland, and Portugal but a debt crisis in Spain would disrupt financial markets worldwide. The Spanish government’s interest rates, while elevated, are not near crisis levels. Spain will remain under pressure, however, and has the potential to unnerve investors from time to time.
Despite increased uncertainty in recent months, we expect the Fed to conclude its Treasury purchases by the end of June. This would complete the easing cycle and, apart from some minor operations, move the Fed to the sidelines for the remainder of the year. There are monetary policy scenarios that
CALVERT SHORT DURATION INCOME FUND
MARCH 31, 2011 |
| AVERAGE ANNUAL TOTAL RETURNS |
| | | |
| class A shares | (with max. load) | |
| One year | | 0.86 | % |
| Five year | | 4.54 | % |
| Since inception (1/31/2002) | | 5.48 | % |
| | |
| class C shares | (with max. load) | |
| One year | | 1.86 | % |
| Five year | | 4.30 | % |
| Since inception (10/1/2002) | 4.31 | % |
| |
| class I shares* | | | |
| One year | | 4.29 | % |
| Five year | | 5.57 | % |
| Since inception (2/26/2002) | | 5.97 | % |
| | | |
| class Y shares** | | | |
| One year | | 3.96 | % |
| Five year | | 5.26 | % |
| Since inception (1/31/2002) | | 5.87 | % |
*Note Regarding Class I Shares Total Returns: There were times during the reporting period when there were no shareholders in Class I. For purposes of reporting Average Annual Total Return, Class A performance at NAV (i.e. does not reflect deduction of the Class A front-end sales charge) is used during these periods in which there were no shareholders in Class I. For purposes of this Average Annual Total Return, the Class A performance at NAV was used during the period November 7, 2005 through April 21, 2006.
** Calvert Short Duration Income Fund first offered Class Y shares beginning on February 29, 2008. Performance prior to February 29, 2008 reflects the performance of Class A shares at net asset value (NAV). Actual Class Y share performance would have been different.
www. calvert.com CALVERT SHORT DURATION INCOME FUND SEMI-ANNUAL REPORT (UNAUDITED) 9
could move bond yields quite sharply, including the small chance that the Fed will tighten faster than expected if core inflation increases rapidly. In addition, in light of the recent international turmoil, there also is a chance—perhaps small—that the Fed will ease yet again if the economy weakens later this year. In uncertain times, we expect market volatility to erupt from time to time.
April 2011
1 Interest rate data sources: Chicago Board Options Exchange and Federal Reserve
2 According to Bureau of Economic Analysis data and forecasts from the Wall Street Journal Survey of Professional Forecasters
3 Latest data as of February 2011 from the Bureau of Labor Statistics
www. calvert.com CALVERT SHORT DURATION INCOME FUND SEMI-ANNUAL REPORT (UNAUDITED) 10
SHAREHOLDER EXPENSE EXAMPLE
As a shareholder of the Fund, you incur two types of costs: (1) transaction costs, including sales charges and redemption fees; and (2) ongoing costs, including management fees; distribution (12b-1) fees; and other Fund expenses. This Example is intended to help you understand your ongoing costs (in dollars) of investing in the Fund and to compare these costs with the ongoing costs of investing in other mutual funds.
This Example is based on an investment of $1,000 invested at the beginning of the period and held for the entire period (October 1, 2010 to March 31, 2011).
Actual Expenses
The first line of the table below provides information about actual account values and actual expenses. You may use the information in this line, together with the amount you invested, to estimate the expenses that you paid over the period. Simply divide your account value by $1,000 (for example, an $8,600 account value divided by $1,000 = 8.6), then multiply the result by the number in the first line under the heading entitled “Expenses Paid During Period” to estimate the expenses you paid on your account during this period.
Hypothetical Example for Comparison Purposes
The second line of the table below provides information about hypothetical account values and hypothetical expenses based on the Fund’s actual expense ratio and an assumed rate of return of 5% per year before expenses, which is not the Fund’s actual return. The hypothetical account values and expenses may not be used to estimate the actual ending account balance or expenses you paid for the period. You may use this information to compare the ongoing costs of investing in the Fund and other funds. To do so, compare the 5% hypothetical example with the 5% hypothetical examples that appear in the shareholder reports of the other funds.
Please note that the expenses shown in the table are meant to highlight your ongoing costs only and do not reflect any transactional costs, such as sales charges (loads) or redemption fees. Therefore, the second line of the table is useful in comparing ongoing costs only, and will not help you determine the relative total costs of owning different funds. In addition, if these transactional costs were included, your costs would have been higher.
www. calvert.com CALVERT SHORT DURATION INCOME FUND SEMI-ANNUAL REPORT (UNAUDITED) 11
| | | | | | |
| | | BEGINNING | | ENDING ACCOUNT | | EXPENSES PAID |
| | | ACCOUNT VALUE | | VALUE | | DURING PERIOD* |
| | | 10/1/10 | | 3/31/11 | | 10/1/10 - 3/31/11 |
| class A | | | | | | |
| Actual | $ | 1,000.00 | $ | 1,010.20 | $ | 5.41 |
| Hypothetical | $ | 1,000.00 | $ | 1,019.55 | $ | 5.44 |
| (5% return per year before expenses) |
|
| |
| class c | | | | | | |
| Actual | $ | 1,000.00 | $ | 1,005.90 | $ | 9.00 |
| Hypothetical | $ | 1,000.00 | $ | 1,015.96 | $ | 9.04 |
| (5% return per year before expenses) |
|
| |
| class I | | | | | | |
| Actual | $ | 1,000.00 | $ | 1,012.90 | $ | 2.46 |
| Hypothetical | $ | 1,000.00 | $ | 1,022.49 | $ | 2.47 |
| (5% return per year before expenses) |
|
| |
| class Y | | | | | | |
| Actual | $ | 1,000.00 | $ | 1,011.10 | $ | 3.94 |
| Hypothetical | $ | 1,000.00 | $ | 1,021.01 | $ | 3.96 |
| (5% return per year before expenses) |
|
* Expenses are equal to the Fund’s annualized expense ratio of 1.08%, 1.80%, 0.49%, and 0.79% for Class A, Class C, Class I, and Class Y, respectively, multiplied by the average account value over the period, multiplied by 182/365 (to reflect the one-half year period).
www. calvert.com CALVERT SHORT DURATION INCOME FUND SEMI-ANNUAL REPORT (UNAUDITED) 12
| | | | |
| SCHEDULE OF INVESTMENTS |
| MARCH 31, 2011 |
| |
| |
| | | PRINCIPAL | | |
| Asset-Backed Securities - 3.2% | | AMOUNT | | VALUE |
| ACLC Business Loan Receivables Trust, 0.905%, 10/15/21 (e)(r) | $ | 24,196 | $ | 23,982 |
| AmeriCredit Automobile Receivables Trust: | | | | |
| 2.26%, 5/15/12 | | 632,166 | | 634,062 |
| 0.31%, 12/6/13 (r) | | 5,793,386 | | 5,790,534 |
| 5.53%, 1/6/14 | | 3,518,917 | | 3,545,454 |
| 1.18%, 2/6/14 | | 2,340,943 | | 2,340,532 |
| 5.26%, 1/6/15 (r) | | 6,251,775 | | 6,338,712 |
| Bear Stearns Asset Backed Securities Trust: | | | | |
| 0.47%, 12/25/35 (r) | | 7,793,437 | | 7,581,534 |
| 0.37%, 4/25/37 (r) | | 2,025,300 | | 1,923,865 |
| Capital Auto Receivables Asset Trust: | | | | |
| 5.01%, 4/16/12 | | 2,085,017 | | 2,101,267 |
| 5.31%, 6/15/12 | | 4,761,274 | | 4,812,065 |
| 5.15%, 9/17/12 | | 3,198,000 | | 3,283,421 |
| Capital One Auto Finance Trust, 5.23%, 7/15/14 | | 13,695,692 | | 14,001,010 |
| Captec Franchise Trust, 8.155%, 6/15/13 (e) | | 716,979 | | 723,551 |
| CIT Equipment Collateral, 6.59%, 12/22/14 | | 6,299,485 | | 6,407,210 |
| CNH Equipment Trust, 2.97%, 3/15/13 | | 497,971 | | 498,440 |
| Countrywide Asset-Backed Certificates, 0.70%, 11/25/34 (r) | | 102,421 | | 90,354 |
| CPS Auto Trust: | | | | |
| 6.48%, 7/15/13 (e) | | 20,253,460 | | 20,917,559 |
| 5.60%, 1/15/14 (e) | | 4,166,588 | | 4,257,935 |
| Enterprise Mortgage Acceptance Co. LLC, 7.449%, 1/15/27 (e)(r) | | 6,836,599 | | 4,238,691 |
| Fifth Third Auto Trust, 4.81%, 1/15/13 | | 13,633,228 | | 13,789,879 |
| FMAC Loan Receivables Trust: | | | | |
| 1.35%, 11/15/18 (e)(r)(u) | | 805,389 | | 9,564 |
| 0.014%, 4/15/19 (e)(r) | | 9,069,451 | | 283,420 |
| Ford Credit Auto Owner Trust, 4.28%, 5/15/12 | | 795,932 | | 802,300 |
| World Omni Automobile Lease Securitization Trust, | | | | |
| 1.02%, 1/16/12 | | 1,333,136 | | 1,333,701 |
| |
| Total Asset-Backed Securities (Cost $105,531,215) | | | | 105,729,042 |
| |
| |
| COLLATERALIZED MORTGAGE-BACKED | | | | |
| OBLIGATIONS (PRIVATELY ORIGINATED) - 1.5% | | | | |
| Banc of America Mortgage Securities, Inc., 6.25%, 10/25/36 | | 1,842,287 | | 287,064 |
| Chase Mortgage Finance Corp.: | | | | |
| 0.295%, 12/25/35 (r) | | 366,511 | | 356,576 |
| 2.875%, 2/25/37 (r) | | 525,261 | | 501,324 |
| 2.887%, 2/25/37 (r) | | 1,047,571 | | 1,000,401 |
| 2.905%, 2/25/37 (r) | | 3,486,521 | | 3,136,826 |
| CS First Boston Mortgage Securities Corp.: | | | | |
| 2.785%, 12/25/33 (r) | | 2,308,181 | | 654,282 |
| 5.25%, 12/25/35 | | 1,791,268 | | 1,783,389 |
| GMAC Mortgage Corp. Loan Trust, 5.50%, 10/25/33 | | 3,178,048 | | 3,207,083 |
www. calvert.com CALVERT SHORT DURATION INCOME FUND SEMI-ANNUAL REPORT (UNAUDITED) 13
| | | | |
| COLLATERALIZED MORTGAGE-BACKED | | PRINCIPAL | | |
| OBLIGATIONS (PRIVATELY ORIGINATED) - CONT’D | | AMOUNT | | VALUE |
| Impac CMB Trust: | | | | |
| 0.89%, 9/25/34 (r) | $ | 68,552 | $ | 53,508 |
| 0.99%, 11/25/34 (r) | | 46,839 | | 41,085 |
| 0.77%, 4/25/35 (r) | | 629,810 | | 511,958 |
| 0.87%, 4/25/35 (r) | | 215,688 | | 117,537 |
| 0.79%, 5/25/35 (r) | | 1,928,097 | | 1,507,301 |
| 0.57%, 8/25/35 (r) | | 459,131 | | 350,311 |
| JP Morgan Mortgage Trust: | | | | |
| 3.081%, 7/25/35 (r) | | 380,737 | | 357,925 |
| 5.279%, 7/25/35 (r) | | 5,368,628 | | 5,231,986 |
| Merrill Lynch Mortgage Investors, Inc.: | | | | |
| 2.636%, 2/25/35 (r) | | 1,310,674 | | 1,253,134 |
| 2.669%, 12/25/35 (r) | | 5,052,661 | | 5,010,693 |
| Residential Accredit Loans, Inc., 0.234%, 5/25/19 (r) | | 45,252,822 | | 261,620 |
| Structured Asset Mortgage Investments, Inc.: | | | | |
| 0.43%, 7/25/46 (r) | | 1,018,946 | | 602,005 |
| 0.44%, 9/25/47 (r) | | 3,790,083 | | 2,262,145 |
| WaMu Mortgage Pass Through Certificates: | | | | |
| 2.725%, 10/25/35 (r) | | 18,000,000 | | 14,879,137 |
| 2.582%, 1/25/36 (r) | | 1,190,908 | | 1,139,087 |
| 1.712%, 4/25/44 (r) | | 10,877 | | 8,863 |
| Wells Fargo Mortgage Backed Securities Trust: | | | | |
| 5.055%, 9/25/35 (r) | | 4,275,383 | | 4,166,891 |
| 0.193%, 10/25/36 | | 41,300,681 | | 115,249 |
| |
| Total Collateralized Mortgage-Backed Obligations | | | | |
| (Privately Originated) (Cost $48,250,508) | | | | 48,797,380 |
| |
| |
| |
| |
| COMMERCIAL MORTGAGE-BACKED SECURITIES - 9.1% | | | | |
| Banc of America Commercial Mortgage, Inc.: | | | | |
| 6.186%, 6/11/35 | | 30,661,935 | | 31,423,693 |
| 5.45%, 6/10/39 (r) | | 2,092,500 | | 2,237,585 |
| 4.576%, 7/10/42 | | 2,892,000 | | 2,913,464 |
| 4.161%, 12/10/42 | | 816,518 | | 816,454 |
| 5.118%, 7/11/43 | | 3,366,400 | | 3,440,434 |
| Bank of America-First Union NB Commercial Mortgage: | | | | |
| 5.464%, 4/11/37 | | 21,448,444 | | 21,596,741 |
| 5.761%, 4/11/37 | | 2,475,000 | | 2,439,809 |
| Bear Stearns Commercial Mortgage Securities, 5.61%, 11/15/33 | | 12,114,997 | | 12,250,817 |
| Commercial Mortgage Pass Through Certificates, | | | | |
| 5.234%, 7/10/37 (r) | | 10,956,000 | | 11,208,502 |
| Credit Suisse First Boston Mortgage Securities Corp.: | | | | |
| 5.435%, 9/15/34 | | 3,534,718 | | 3,564,542 |
| 6.387%, 8/15/36 | | 4,842,655 | | 4,929,861 |
| 6.133%, 4/15/37 | | 1,900,232 | | 1,957,684 |
| First Union National Bank Commercial Mortgage, | | | | |
| 6.141%, 2/12/34 | | 15,151,116 | | 15,580,793 |
| GE Capital Commercial Mortgage Corp., 6.531%, 5/15/33 | | 153,840 | | 153,759 |
www. calvert.com CALVERT SHORT DURATION INCOME FUND SEMI-ANNUAL REPORT (UNAUDITED) 14
| | | | |
| | | PRINCIPAL | | |
| COMMERCIAL MORTGAGE-BACKED SECURITIES - CONT’D | | AMOUNT | | VALUE |
| GMAC Commercial Mortgage Securities, Inc.: | | | | |
| 6.70%, 4/15/34 | $ | 3,668,379 | $ | 3,679,556 |
| 6.278%, 11/15/39 | | 30,319,399 | | 30,796,693 |
| Greenwich Capital Commercial Funding Corp., 4.883%, 6/10/36 | | 7,249,133 | | 7,387,886 |
| JP Morgan Chase Commercial Mortgage Securities Corp.: | | | | |
| 6.162%, 5/12/34 | | 36,557,000 | | 37,663,705 |
| 6.429%, 4/15/35 | | 8,948,117 | | 9,001,596 |
| 5.857%, 10/12/35 | | 30,638,577 | | 30,735,521 |
| 6.465%, 11/15/35 | | 4,930,089 | | 4,997,108 |
| 6.786%, 11/15/35 (e)(r) | | 2,500,000 | | 2,585,684 |
| 5.299%, 6/12/41 (r) | | 2,148,381 | | 2,199,070 |
| LB-UBS Commercial Mortgage Trust, 4.51%, 12/15/29 | | 13,799,441 | | 13,913,178 |
| Morgan Stanley Capital I, 5.007%, 1/14/42 | | 8,967,257 | | 9,136,093 |
| Morgan Stanley Dean Witter Capital I: | | | | |
| 6.55%, 7/15/33 | | 7,480,000 | | 7,555,677 |
| 5.98%, 1/15/39 | | 8,923,503 | | 9,273,472 |
| Prudential Mortgage Capital Funding LLC, 6.605%, 5/10/34 | | 2,342,821 | | 2,343,289 |
| Salomon Brothers Mortgage Securities VII, Inc.: | | | | |
| 4.467%, 3/18/36 | | 6,596,085 | | 6,719,504 |
| 6.499%, 11/13/36 | | 6,372,421 | | 6,466,265 |
| Wachovia Bank Commercial Mortgage Trust, 6.287%, 4/15/34 | | 3,590,000 | | 3,706,395 |
| |
| Total Commercial Mortgage-Backed Securities | | | | |
| (Cost $306,208,363) | | | | 302,674,830 |
| |
| |
| |
| CORPORATE BONDS - 67.5% | | | | |
| Achmea Hypotheekbank NV: | | | | |
| 0.661%, 11/3/14 (e)(r) | | 4,665,000 | | 4,665,025 |
| 3.20%, 11/3/14 (e) | | 7,000,000 | | 7,170,665 |
| Affiliated Computer Services, Inc., 5.20%, 6/1/15 | | 3,000,000 | | 3,229,711 |
| Agilent Technologies, Inc., 2.50%, 7/15/13 | | 4,000,000 | | 4,033,273 |
| Alcoa, Inc., 6.15%, 8/15/20 | | 3,800,000 | | 4,017,942 |
| Alliance Mortgage Investments: | | | | |
| 12.61%, 6/1/10 (b)(r)(x)* | | 385,345 | | - |
| 15.36%, 12/1/10 (b)(r)(x)* | | 259,801 | | - |
| Ally Financial, Inc.: | | | | |
| 6.00%, 4/1/11 | | 3,498,000 | | 3,497,650 |
| 6.00%, 12/15/11 | | 16,508,000 | | 16,796,890 |
| 1.75%, 10/30/12 | | 3,970,000 | | 4,034,442 |
| 0.309%, 12/19/12 (r) | | 3,360,000 | | 3,361,204 |
| 4.50%, 2/11/14 | | 875,000 | | 872,813 |
| American Airlines Pass Through Trust: | | | | |
| Series 2001-2, Class A, 7.858%, 4/1/13 | | 21,922,000 | | 22,497,452 |
| Series 2001-2, Class B, 8.608%, 10/1/12 | | 18,020,000 | | 18,020,000 |
| American Express Bank FSB: | | | | |
| 0.378%, 5/29/12 (r) | | 6,000,000 | | 5,980,499 |
| 0.406%, 6/12/12 (r) | | 18,515,000 | | 18,463,911 |
| American Express Centurion Bank, 0.406%, 6/12/12 (r) | | 2,022,000 | | 2,015,936 |
| American Express Travel, 0.461%, 6/1/11 (r) | | 3,500,000 | | 3,494,565 |
| American Honda Finance Corp., 1.059%, 6/20/11 (e)(r) | | 11,900,000 | | 11,910,178 |
www. calvert.com CALVERT SHORT DURATION INCOME FUND SEMI-ANNUAL REPORT (UNAUDITED) 15
| | | | |
| | | PRINCIPAL | | |
| CORPORATE BONDS - CONT’D | | AMOUNT | | VALUE |
| American Tower Corp., 4.50%, 1/15/18 | $ | 2,420,000 | $ | 2,371,233 |
| Amphenol Corp., 4.75%, 11/15/14 | | 6,450,000 | | 6,891,946 |
| Anadarko Petroleum Corp., 5.75%, 6/15/14 | | 10,000 | | 10,948 |
| Analog Devices, Inc.: | | | | |
| 5.00%, 7/1/14 | | 5,000,000 | | 5,434,268 |
| 3.00%, 4/15/16 | | 4,000,000 | | 3,982,282 |
| Anheuser-Busch InBev Worldwide, Inc.: | | | | |
| 1.039%, 3/26/13 (r) | | 4,000,000 | | 4,051,489 |
| 0.854%, 1/27/14 (r) | | 6,000,000 | | 6,044,141 |
| ANZ National International Ltd., 1.309%, 12/20/13 (e)(r) | | 13,000,000 | | 13,000,145 |
| APL Ltd., 8.00%, 1/15/24 (b) | | 3,915,000 | | 3,517,862 |
| ArcelorMittal: | | | | |
| 3.75%, 3/1/16 | | 1,000,000 | | 997,514 |
| 5.50%, 3/1/21 | | 13,800,000 | | 13,570,617 |
| Arrow Electronics, Inc.: | | | | |
| 3.375%, 11/1/15 | | 4,000,000 | | 3,946,423 |
| 6.00%, 4/1/20 | | 3,347,000 | | 3,541,826 |
| Asciano Finance Ltd.: | | | | |
| 3.125%, 9/23/15 (e) | | 6,225,000 | | 5,951,138 |
| 5.00%, 4/7/18 (e) | | 1,000,000 | | 994,580 |
| 4.625%, 9/23/20 (e) | | 2,000,000 | | 1,831,747 |
| Atlantic Mutual Insurance Co., 8.15%, 2/15/28 (b)(e)(p)* | | 350,000 | | - |
| Australia & New Zealand Banking Group Ltd., | | | | |
| 0.603%, 10/21/11 (e)(r) | | 4,450,000 | | 4,457,351 |
| BAC Capital Trust XV, 1.111%, 6/1/56 (r) | | 22,340,000 | | 15,585,976 |
| Bank of America Corp.: | | | | |
| 0.588%, 4/30/12 (r) | | 18,470,000 | | 18,545,321 |
| 1.723%, 1/30/14 (r) | | 8,750,000 | | 8,870,451 |
| 5.875%, 1/5/21 | | 2,000,000 | | 2,083,091 |
| Bank of America NA, 0.59%, 6/15/16 (r) | | 3,000,000 | | 2,780,207 |
| Bank of Montreal, 2.85%, 6/9/15 (e) | | 25,000,000 | | 25,249,707 |
| Bank of Nova Scotia: | | | | |
| 1.65%, 10/29/15 (e) | | 3,000,000 | | 2,869,163 |
| 2.90%, 3/29/16 | | 10,200,000 | | 10,141,095 |
| Bank of Tokyo-Mitsubishi UFJ Ltd., 0.973%, 2/24/14 (e)(r) | | 17,000,000 | | 17,000,195 |
| BankAmerica Capital III, 0.873%, 1/15/27 (r) | | 8,230,000 | | 6,324,115 |
| BankBoston Capital Trust III, 1.06%, 6/15/27 (r) | | 1,450,000 | | 1,125,114 |
| Barclays Bank plc, 2.50%, 9/21/15 (e) | | 8,450,000 | | 8,212,488 |
| Barnett Capital III, 0.929%, 2/1/27 (r) | | 1,100,000 | | 847,025 |
| Beckman Coulter, Inc., 6.00%, 6/1/15 | | 4,000,000 | | 4,376,025 |
| Bemis Co., Inc., 5.65%, 8/1/14 | | 2,000,000 | | 2,166,595 |
| Berkshire Hathaway Finance Corp., 0.428%, 1/13/12 (r) | | 1,250,000 | | 1,250,245 |
| Berkshire Hathaway, Inc., 0.742%, 2/11/13 (r) | | 15,000,000 | | 15,092,955 |
| BNSF Funding Trust I, 6.613% to 1/15/26, | | | | |
| floating rate thereafter to 12/15/55 (r) | | 8,869,000 | | 9,212,674 |
| Bunge Ltd. Finance Corp., 5.35%, 4/15/14 | | 5,000,000 | | 5,317,746 |
| Burger King Corp., 9.875%, 10/15/18 | | 1,500,000 | | 1,578,750 |
| C8 Capital SPV Ltd., 6.64% to 12/31/14, | | | | |
| floating rate thereafter to 12/29/49 (b)(e)(r) | | 12,660,000 | | 9,792,510 |
| Canadian Imperial Bank of Commerce, 2.75%, 1/27/16 (e) | | 4,940,000 | | 4,908,229 |
www. calvert.com CALVERT SHORT DURATION INCOME FUND SEMI-ANNUAL REPORT (UNAUDITED) 16
| | | | |
| | | PRINCIPAL | | |
| CORPORATE BONDS - CONT’D | | AMOUNT | | VALUE |
| Cantor Fitzgerald LP: | | | | |
| 6.375%, 6/26/15 (e) | $ | 3,000,000 | $ | 3,022,693 |
| 7.875%, 10/15/19 (e) | | 11,100,000 | | 11,364,220 |
| Capital One Financial Corp.: | | | | |
| 4.80%, 2/21/12 | | 2,000,000 | | 2,066,468 |
| 6.15%, 9/1/16 | | 3,800,000 | | 4,136,525 |
| CareFusion Corp.: | | | | |
| 4.125%, 8/1/12 | | 2,000,000 | | 2,069,330 |
| 5.125%, 8/1/14 | | 2,000,000 | | 2,155,318 |
| Caterpillar Financial Services Corp., 0.559%, 12/16/11 (r) | | 10,000,000 | | 10,016,920 |
| Cellco Partnership, 2.914%, 5/20/11 (r) | | 15,000,000 | | 15,046,061 |
| Cemex SAB de CV, 5.301%, 9/30/15 (e)(r) | | 28,550,000 | | 28,321,442 |
| Charter One Bank: | | | | |
| 5.50%, 4/26/11 | | 16,500,000 | | 16,540,249 |
| 6.375%, 5/15/12 | | 5,000,000 | | 5,230,749 |
| Chase Capital II, 0.804%, 2/1/27 (r) | | 3,282,000 | | 2,757,158 |
| Chase Capital VI, 0.929%, 8/1/28 (r) | | 1,500,000 | | 1,265,626 |
| Church & Dwight Co., Inc., 3.35%, 12/15/15 | | 2,000,000 | | 1,996,003 |
| Citibank: | | | | |
| 0.303%, 7/12/11 (r) | | 4,875,000 | | 4,874,337 |
| 0.341%, 5/7/12 (r) | | 5,550,000 | | 5,554,939 |
| Citigroup Funding, Inc.: | | | | |
| 0.634%, 4/30/12 (r) | | 15,000,000 | | 15,065,970 |
| 0.353%, 7/12/12 (r) | | 8,500,000 | | 8,505,874 |
| Citigroup, Inc.: | | | | |
| 2.312%, 8/13/13 (r) | | 26,000,000 | | 26,766,754 |
| 0.435%, 3/7/14 (r) | | 13,750,000 | | 13,432,432 |
| 5.50%, 10/15/14 | | 3,000,000 | | 3,236,662 |
| 4.587%, 12/15/15 | | 4,000,000 | | 4,120,855 |
| Cliffs Natural Resources, Inc., 4.875%, 4/1/21 | | 1,000,000 | | 986,245 |
| CNL, Inc.ome Properties, Inc., 7.25%, 4/15/19 (e) | | 1,000,000 | | 992,490 |
| Columbia University, 6.83%, 12/15/20 | | 322,581 | | 354,048 |
| Comcast Corp., 5.90%, 3/15/16 | | 4,951,000 | | 5,501,368 |
| Con-way, Inc., 7.25%, 1/15/18 | | 4,650,000 | | 5,044,091 |
| Cooperatieve Centrale Raiffeisen-Boerenleenbank BA: | | | | |
| 4.20%, 5/13/14 (e) | | 2,000,000 | | 2,114,262 |
| 2.125%, 10/13/15 | | 6,000,000 | | 5,792,929 |
| Corn Products International, Inc., 3.20%, 11/1/15 | | 5,000,000 | | 4,990,251 |
| Credit Suisse USA, Inc., 0.514%, 8/16/11 (r) | | 5,850,000 | | 5,852,014 |
| Crown Castle Towers LLC: | | | | |
| 4.523%, 1/15/15 (e) | | 4,250,000 | | 4,393,438 |
| 4.174%, 8/15/17 (e) | | 3,000,000 | | 2,985,000 |
| 4.883%, 8/15/20 (e) | | 2,960,000 | | 2,956,300 |
| 3.214%, 8/15/35 (e) | | 3,000,000 | | 2,996,250 |
| 5.495%, 1/15/37 (e) | | 4,000,000 | | 4,240,000 |
| CVS Caremark Corp., 6.302% to 6/1/12, | | | | |
| floating rate thereafter to 6/1/62 (r) | | 14,539,000 | | 14,245,212 |
| CVS Pass-Through Trust: | | | | |
| 5.789%, 1/10/26 (e) | | 5,560,460 | | 5,761,612 |
| 5.298%, 1/11/27 (e) | | 1,009,555 | | 1,020,132 |
| 6.036%, 12/10/28 | | 12,781,092 | | 13,341,117 |
| 6.943%, 1/10/30 | | 1,933,818 | | 2,106,237 |
| 7.507%, 1/10/32 (e) | | 2,154,517 | | 2,471,102 |
www. calvert.com CALVERT SHORT DURATION INCOME FUND SEMI-ANNUAL REPORT (UNAUDITED) 17
| | | | |
| | | PRINCIPAL | | |
| CORPORATE BONDS - CONT’D | | AMOUNT | | VALUE |
| Dell, Inc., 0.91%, 4/1/14 (r) | $ | 9,450,000 | $ | 9,469,882 |
| Delta Air Lines Pass Through Trust, 6.75%, 5/23/17 | | 2,750,000 | | 2,660,625 |
| Deutsche Bank AG, 0.953%, 1/18/13 (r) | | 16,000,000 | | 16,055,200 |
| Deutsche Bank Capital Trust, 4.901%, 12/29/49 (b)(r) | | 2,600,000 | | 2,132,000 |
| Developers Diversified Realty Corp.: | | | | |
| 5.25%, 4/15/11 | | 6,000,000 | | 6,001,500 |
| 4.75%, 4/15/18 | | 4,000,000 | | 3,900,000 |
| Discover Bank, 8.70%, 11/18/19 | | 8,890,000 | | 10,617,434 |
| Discover Financial Services, 6.45%, 6/12/17 | | 1,375,000 | | 1,491,580 |
| DISH DBS Corp., 6.375%, 10/1/11 | | 2,450,000 | | 2,499,000 |
| DnB NOR Boligkreditt AS, 2.10%, 10/14/16 (e) | | 15,000,000 | | 14,398,423 |
| Dominion Resources, Inc., 6.30% to 9/30/11, | | | | |
| floating rate thereafter to 9/30/66 (r) | | 27,470,000 | | 27,126,625 |
| Dow Chemical Co., 2.562%, 8/8/11 (r) | | 9,500,000 | | 9,558,002 |
| EI du Pont de Nemours & Co., Zero Coupon, 12/27/39 (r) | | 1,600,000 | | 1,585,245 |
| Enterprise Products Operating LLC: | | | | |
| 7.625%, 2/15/12 | | 12,000,000 | | 12,688,380 |
| 3.20%, 2/1/16 | | 14,000,000 | | 13,915,395 |
| 7.034% to 1/15/18, floating rate thereafter to 1/15/68 (r) | | 12,655,000 | | 13,129,562 |
| Equity One, Inc., 6.25%, 12/15/14 | | 5,500,000 | | 5,902,026 |
| Express Scripts, Inc., 5.25%, 6/15/12 | | 5,000,000 | | 5,236,478 |
| FBG Finance Ltd., 5.125%, 6/15/15 (e) | | 6,150,000 | | 6,495,677 |
| Fifth Third Bank, 0.424%, 5/17/13 (r) | | 24,175,000 | | 23,705,242 |
| First Niagara Financial Group, Inc., 6.75%, 3/19/20 | | 1,500,000 | | 1,614,490 |
| Fleet Capital Trust V, 1.309%, 12/18/28 (r) | | 3,200,000 | | 2,435,500 |
| Ford Motor Credit Co. LLC: | | | | |
| 5.56%, 6/15/11 (r) | | 36,150,000 | | 36,240,375 |
| 9.875%, 8/10/11 | | 3,000,000 | | 3,075,000 |
| 7.25%, 10/25/11 | | 533,000 | | 546,325 |
| 3.053%, 1/13/12 (r) | | 33,305,000 | | 33,596,752 |
| 7.80%, 6/1/12 | | 2,000,000 | | 2,120,000 |
| 8.00%, 12/15/16 | | 1,500,000 | | 1,695,000 |
| Foster’s Finance Corp.: | | | | |
| 6.875%, 6/15/11 (e) | | 10,000,000 | | 10,097,033 |
| 4.875%, 10/1/14 (e) | | 8,880,000 | | 9,399,300 |
| Four Fishers LLC VRDN, 0.49%, 4/1/24 (r) | | 3,770,000 | | 3,770,000 |
| GameStop Corp., 8.00%, 10/1/12 | | 5,689,000 | | 5,795,669 |
| General Electric Capital Corp.: | | | | |
| 0.61%, 6/8/12 (r) | | 4,830,000 | | 4,851,522 |
| 0.429%, 6/20/13 (r) | | 22,000,000 | | 21,721,304 |
| 5.40%, 2/15/17 | | 2,000,000 | | 2,165,474 |
| 0.581%, 8/7/18 (r) | | 3,317,000 | | 3,082,110 |
| GenOn Americas Generation LLC, 8.30%, 5/1/11 | | 21,024,000 | | 21,076,560 |
| Georgia-Pacific LLC, 8.125%, 5/15/11 | | 7,000,000 | | 7,052,500 |
| Glitnir Banki HF: | | | | |
| 2.95%, 10/15/08 (b)(y)* | | 10,440,000 | | 3,210,300 |
| 3.046%, 4/20/10 (e)(r)(y)* | | 10,830,000 | | 3,303,150 |
| 3.226%, 1/21/11 (e)(r)(y)* | | 1,000,000 | | 290,000 |
| 6.33%, 7/28/11 (e)(y)* | | 180,000 | | 54,900 |
| GMAC Commercial Mortgage Asset Corp., 6.107%, 8/10/52 (e) | | 1,000,000 | | 814,040 |
| Goldman Sachs Capital III, 1.081%, 9/29/49 (r) | | 8,000,000 | | 6,313,470 |
www. calvert.com CALVERT SHORT DURATION INCOME FUND SEMI-ANNUAL REPORT (UNAUDITED) 18
| | | | |
| | | PRINCIPAL | | |
| CORPORATE BONDS - CONT’D | | AMOUNT | | VALUE |
| Goldman Sachs Group, Inc.: | | | | |
| 0.562%, 11/9/11 (r) | $ | 12,470,000 | $ | 12,494,466 |
| 0.51%, 3/15/12 (r) | | 4,620,000 | | 4,629,938 |
| 3.625%, 2/7/16 | | 4,000,000 | | 3,959,477 |
| 0.759%, 3/22/16 (r) | | 23,000,000 | | 22,176,054 |
| 5.625%, 1/15/17 | | 5,000,000 | | 5,255,598 |
| 6.00%, 6/15/20 | | 2,300,000 | | 2,424,047 |
| Great River Energy, 5.829%, 7/1/17 (e) | | 16,062,853 | | 17,493,712 |
| Greif, Inc., 6.75%, 2/1/17 | | 300,000 | | 318,000 |
| Harley-Davidson Financial Services, Inc., 3.875%, 3/15/16 (e) | | 2,000,000 | | 1,999,866 |
| HCP, Inc., 5.95%, 9/15/11 | | 10,391,000 | | 10,631,510 |
| Health Care REIT, Inc., 3.625%, 3/15/16 | | 1,000,000 | | 991,020 |
| Hertz Corp., 6.75%, 4/15/19 (e) | | 4,750,000 | | 4,702,500 |
| Hewlett-Packard Co., 1.361%, 5/27/11 (r) | | 10,000,000 | | 10,015,697 |
| HSBC Bank plc, 1.103%, 1/17/14 (e)(r) | | 9,500,000 | | 9,494,710 |
| Hyundai Capital America, 3.75%, 4/6/16 (e) | | 1,000,000 | | 976,989 |
| Hyundai Motor Manufacturing, 4.50%, 4/15/15 (e) | | 3,200,000 | | 3,279,168 |
| ING Bank NV, 4.00%, 3/15/16 (e) | | 17,000,000 | | 16,965,209 |
| International Lease Finance Corp.: | | | | |
| 5.75%, 6/15/11 | | 3,000,000 | | 3,015,000 |
| 6.50%, 9/1/14 (e) | | 5,000,000 | | 5,312,500 |
| 6.75%, 9/1/16 (e) | | 5,000,000 | | 5,312,500 |
| Irwin Land LLC: | | | | |
| 4.51%, 12/15/15 (e) | | 1,030,000 | | 1,022,265 |
| 5.03%, 12/15/25 (e) | | 900,000 | | 881,973 |
| Jefferies Group, Inc., 3.875%, 11/9/15 | | 4,500,000 | | 4,514,802 |
| John Deere Capital Corp., 1.06%, 6/10/11 (r) | | 4,700,000 | | 4,706,340 |
| Jones Group, Inc., 6.875%, 3/15/19 | | 3,770,000 | | 3,704,025 |
| JPMorgan Chase & Co.: | | | | |
| 0.433%, 4/1/11 (r) | | 9,115,000 | | 9,115,000 |
| 0.54%, 6/15/12 (r) | | 4,370,000 | | 4,385,575 |
| 0.559%, 12/26/12 (r) | | 23,170,000 | | 23,283,695 |
| 2.60%, 1/15/16 | | 15,000,000 | | 14,418,953 |
| JPMorgan Chase Bank, 0.64%, 6/13/16 (r) | | 16,285,000 | | 15,409,212 |
| JPMorgan Chase Capital XXIII, 1.313%, 5/15/77 (r) | | 7,114,000 | | 5,888,293 |
| KeyBank, 5.80%, 7/1/14 | | 7,500,000 | | 8,179,344 |
| Kinder Morgan Finance Co. LLC, 6.00%, 1/15/18 (e) | | 3,000,000 | | 3,108,750 |
| Lafarge SA, 6.15%, 7/15/11 | | 9,523,000 | | 9,662,120 |
| Leucadia National Corp., 8.125%, 9/15/15 | | 18,450,000 | | 20,377,319 |
| LL & P Wind Energy, Inc. Washington Revenue Bonds: | | | | |
| 5.217%, 12/1/12 (e) | | 1,780,000 | | 1,797,747 |
| 5.733%, 12/1/17 (e) | | 2,000,000 | | 2,012,240 |
| Lumbermens Mutual Casualty Co., 8.30%, 12/1/37 (e)(m)* | | 300,000 | | 2,610 |
| Marsh & McLennan Co.’s, Inc., 6.25%, 3/15/12 | | 4,250,000 | | 4,411,701 |
| Masco Corp.: | | | | |
| 5.875%, 7/15/12 | | 2,690,000 | | 2,813,544 |
| 4.80%, 6/15/15 | | 10,500,000 | | 10,422,386 |
| 7.125%, 3/15/20 | | 5,210,000 | | 5,385,838 |
| MBNA Capital, 1.104%, 2/1/27 (r) | | 12,000,000 | | 9,235,549 |
| Merrill Lynch & Co., Inc.: | | | | |
| 5.70%, 5/2/17 | | 5,000,000 | | 5,155,959 |
| 1.07%, 9/15/26 (r) | | 4,200,000 | | 3,275,764 |
www. calvert.com CALVERT SHORT DURATION INCOME FUND SEMI-ANNUAL REPORT (UNAUDITED) 19
| | | | |
| | | PRINCIPAL | | |
| CORPORATE BONDS - CONT’D | | AMOUNT | | VALUE |
| MetLife Institutional Funding II: | | | | |
| 0.709%, 3/27/12 (e)(r) | $ | 13,000,000 | $ | 13,000,161 |
| 0.703%, 7/12/12 (e)(r) | | 25,000,000 | | 25,047,400 |
| MetLife, Inc.: | | | | |
| 0.628%, 6/29/12 (r) | | 13,250,000 | | 13,294,839 |
| 1.561%, 8/6/13 (r) | | 8,000,000 | | 8,084,212 |
| Metropolitan Life Global Funding I: | | | | |
| 2.303%, 4/14/11 (e)(r) | | 12,280,000 | | 12,282,468 |
| 0.703%, 7/13/11 (e)(r) | | 10,000,000 | | 9,999,723 |
| 0.803%, 4/10/12 (e)(r) | | 2,500,000 | | 2,499,999 |
| Morgan Stanley: | | | | |
| 0.553%, 1/9/12 (r) | | 3,168,000 | | 3,164,330 |
| 0.592%, 2/10/12 (r) | | 3,000,000 | | 3,007,529 |
| 4.20%, 11/20/14 | | 3,000,000 | | 3,085,157 |
| 6.00%, 4/28/15 | | 3,000,000 | | 3,255,025 |
| 5.375%, 10/15/15 | | 3,000,000 | | 3,186,398 |
| 3.45%, 11/2/15 | | 9,000,000 | | 8,825,823 |
| 0.753%, 10/18/16 (r) | | 1,400,000 | | 1,309,361 |
| 6.25%, 8/28/17 | | 22,200,000 | | 23,903,819 |
| 5.50%, 1/26/20 | | 3,500,000 | | 3,511,411 |
| Motors Liquidation Co., 7.125%, 7/15/13 (ii)* | | 14,816,000 | | 4,185,520 |
| National Semiconductor Corp., 3.95%, 4/15/15 | | 8,260,000 | | 8,415,357 |
| Nationwide Building Society, 0.494%, 5/17/12 (e)(r) | | 5,400,000 | | 5,399,296 |
| Nationwide Health Properties, Inc.: | | | | |
| 6.90%, 10/1/37 | | 8,890,000 | | 9,132,875 |
| 6.59%, 7/7/38 | | 1,300,000 | | 1,344,703 |
| Nevada Power Co., 8.25%, 6/1/11 | | 9,966,000 | | 10,084,390 |
| New York Life Global Funding, 1.85%, 12/13/13 (e) | | 5,000,000 | | 5,025,726 |
| NextEra Energy Capital Holdings, Inc., 0.712%, 11/9/12 (r) | | 12,700,000 | | 12,730,845 |
| Nissan Motor Acceptance Corp., 4.50%, 1/30/15 (e) | | 2,000,000 | | 2,085,699 |
| North Fork Bancorporation, Inc., 5.875%, 8/15/12 | | 6,375,000 | | 6,671,727 |
| Northwest Airlines Pass Through Trust, 6.841%, 10/1/12 | | 200,000 | | 200,000 |
| Offshore Group Investments Ltd., 11.50%, 8/1/15 | | 500,000 | | 554,754 |
| Ohana Military Communities LLC: | | | | |
| 5.462%, 10/1/26 (e) | | 21,750,000 | | 22,076,467 |
| 5.88%, 10/1/51 (b)(e) | | 3,845,000 | | 3,346,419 |
| OPTI Canada, Inc.: | | | | |
| 9.00%, 12/15/12 (e) | | 6,000,000 | | 6,052,500 |
| 9.75%, 8/15/13 (e) | | 7,935,000 | | 7,925,081 |
| 8.25%, 12/15/14 | | 1,000,000 | | 532,500 |
| Orkney Re II plc, Series B, 6.096%, 12/21/35 (b)(e)(r)(w)* | | 1,400,000 | | - |
| Overseas Shipholding Group, Inc., 8.125%, 3/30/18 | | 3,000,000 | | 2,947,500 |
| Pacific Pilot Funding Ltd., 1.053%, 10/20/16 (e)(r) | | 437,849 | | 402,968 |
| Pioneer Natural Resources Co., 5.875%, 7/15/16 | | 39,900,000 | | 41,895,000 |
| PNC Funding Corp.: | | | | |
| 0.444%, 1/31/12 (r) | | 9,415,000 | | 9,404,804 |
| 0.503%, 4/1/12 (r) | | 6,970,000 | | 6,989,272 |
| Procter & Gamble - ESOP, 0.023%, 11/15/39 (r) | | 1,000,000 | | 991,538 |
| Prudential Holdings LLC, 1.184%, 12/18/17 (e)(r) | | 7,940,000 | | 7,416,237 |
| Quest Diagnostics, Inc., 3.20%, 4/1/16 | | 2,000,000 | | 1,990,330 |
| Rabobank Nederland NV, 0.511%, 8/5/11 (e)(r) | | 2,200,000 | | 2,199,641 |
www. calvert.com CALVERT SHORT DURATION INCOME FUND SEMI-ANNUAL REPORT (UNAUDITED) 20
| | | | |
| | | PRINCIPAL | | |
| CORPORATE BONDS - CONT’D | | AMOUNT | | VALUE |
| Rio Tinto Alcan, Inc.: | | | | |
| 4.50%, 5/15/13 | $ | 3,400,000 | $ | 3,614,291 |
| 5.20%, 1/15/14 | | 1,282,000 | | 1,360,683 |
| 5.00%, 6/1/15 | | 4,000,000 | | 4,319,047 |
| Ryder System, Inc.: | | | | |
| 3.15%, 3/2/15 | | 4,000,000 | | 4,012,228 |
| 3.60%, 3/1/16 | | 5,000,000 | | 5,034,444 |
| SBA Tower Trust, 4.254%, 4/15/40 (e) | | 4,500,000 | | 4,721,778 |
| Senior Housing Properties Trust, 8.625%, 1/15/12 | | 13,352,000 | | 13,969,530 |
| Skyway Concession Co. LLC, 0.587%, 6/30/17 (e)(r) | | 2,500,000 | | 2,278,373 |
| Southern Co., 0.703%, 10/21/11 (r) | | 3,000,000 | | 3,006,957 |
| Southwestern Energy Co., 7.50%, 2/1/18 | | 1,000,000 | | 1,130,000 |
| St. Jude Medical, Inc., 2.50%, 1/15/16 | | 920,000 | | 904,635 |
| Stadshypotek AB, 0.857%, 9/30/13 (e)(r) | | 22,940,000 | | 22,940,212 |
| State Street Bank and Trust Co., 0.51%, 9/15/11 (r) | | 10,000,000 | | 10,010,682 |
| Steel Dynamics, Inc., 7.375%, 11/1/12 | | 4,000,000 | | 4,260,000 |
| Steelcase, Inc., 6.375%, 2/15/21 | | 1,500,000 | | 1,518,755 |
| Sunoco, Inc., 6.75%, 4/1/11 | | 3,148,000 | | 3,147,877 |
| SunTrust Bank: | | | | |
| 0.424%, 5/21/12 (r) | | 26,863,000 | | 26,804,832 |
| 0.603%, 8/24/15 (r) | | 5,650,000 | | 5,337,308 |
| SunTrust Banks, Inc., 3.60%, 4/15/16 | | 2,500,000 | | 2,483,377 |
| SunTrust Capital I, 0.983%, 5/15/27 (r) | | 1,000,000 | | 777,740 |
| Svenska Handelsbanken AB, 1.31%, 9/14/12 (e)(r) | | 11,800,000 | | 11,901,350 |
| Systems 2001 AT LLC: | | | | |
| 7.156%, 12/15/11 (e) | | 283,805 | | 290,559 |
| 6.664%, 9/15/13 (e) | | 20,928,574 | | 22,341,253 |
| TCM Sub LLC, 3.55%, 1/15/15 (e) | | 3,000,000 | | 3,070,759 |
| TD Ameritrade Holding Corp.: | | | | |
| 2.95%, 12/1/12 | | 1,000,000 | | 1,021,019 |
| 4.15%, 12/1/14 | | 2,180,000 | | 2,271,435 |
| Telecom Italia Capital SA, 6.20%, 7/18/11 | | 13,699,000 | | 13,896,888 |
| Telefonica Emisiones SAU: | | | | |
| 5.984%, 6/20/11 | | 3,997,000 | | 4,039,233 |
| 3.992%, 2/16/16 | | 1,700,000 | | 1,704,886 |
| 6.421%, 6/20/16 | | 8,944,000 | | 9,909,934 |
| 5.134%, 4/27/20 | | 2,500,000 | | 2,480,697 |
| 5.462%, 2/16/21 | | 1,000,000 | | 1,012,125 |
| The Bank of Tokyo-Mitsubishi UFJ Ltd., 7.40%, 6/15/11 | | 9,525,000 | | 9,667,875 |
| TIERS Trust, 8.45%, 12/1/17 (b)(e)(n)* | | 658,859 | | 659 |
| Time Warner, Inc., 4.75%, 3/29/21 | | 3,500,000 | | 3,463,923 |
| Toll Road Investors Partnership II LP, Zero Coupon: | | | | |
| 2/15/43 (b)(e) | | 131,530,000 | | 34,694,983 |
| 2/15/45 (b)(e) | | 143,653,305 | | 21,902,819 |
| Toronto-Dominion Bank, 2.20%, 7/29/15 (e) | | 7,000,000 | | 6,910,221 |
| Total Capital Canada Ltd., 0.684%, 1/17/14 (r) | | 5,800,000 | | 5,804,872 |
| Travelers Insurance Company Ltd., 0.553%, 12/8/11 (r) | | 1,500,000 | | 1,495,448 |
| US Bank, 3.778% to 4/29/15, floating rate thereafter to 4/29/20 (r) | | 55,479,000 | | 56,424,843 |
| Verizon Communications, Inc.: | | | | |
| 0.919%, 3/28/14 (r) | | 21,000,000 | | 21,069,165 |
| 3.00%, 4/1/16 | | 20,000,000 | | 19,875,489 |
www. calvert.com CALVERT SHORT DURATION INCOME FUND SEMI-ANNUAL REPORT (UNAUDITED) 21
| | | | |
| | | PRINCIPAL | | |
| CORPORATE BONDS - CONT’D | | AMOUNT | | VALUE |
| Volkswagen International Finance NV: | | | | |
| 0.757%, 10/1/12 (e)(r) | $ | 12,000,000 | $ | 11,996,504 |
| 0.917%, 4/1/14 (e)(r) | | 12,100,000 | | 12,090,388 |
| Wachovia Capital Trust III, 5.57% to 3/15/11, | | | | |
| floating rate thereafter to 3/29/49 (r) | | 44,887,000 | | 41,183,822 |
| Wal-Mart Stores, Inc., 8.07%, 12/21/12 | | 256,899 | | 263,534 |
| Wells Fargo & Co., 0.53%, 6/15/12 (r) | | 1,830,000 | | 1,835,566 |
| Western Express, Inc., 12.50%, 4/15/15 (e) | | 3,160,000 | | 3,073,100 |
| Westpac Banking Corp.: | | | | |
| 0.603%, 10/21/11 (e)(r) | | 7,250,000 | | 7,251,998 |
| 1.037%, 3/31/14 (e)(r) | | 14,000,000 | | 14,000,129 |
| Williams Partners LP, 7.50%, 6/15/11 | | 11,405,000 | | 11,555,859 |
| Willis North America, Inc.: | | | | |
| 5.625%, 7/15/15 | | 14,261,000 | | 15,136,645 |
| 6.20%, 3/28/17 | | 1,000,000 | | 1,061,062 |
| Windsor Petroleum Transport Corp., 7.84%, 1/15/21 (e) | | 23,471,891 | | 21,256,838 |
| Wm. Wrigley Jr. Co., 1.684%, 6/28/11 (e)(r) | | 25,000,000 | | 25,010,460 |
| Woodside Finance Ltd., 4.50%, 11/10/14 (e) | | 5,000,000 | | 5,285,182 |
| Xerox Corp., 6.875%, 8/15/11 | | 7,650,000 | | 7,824,945 |
| Yale University, 2.90%, 10/15/14 | | 5,300,000 | | 5,471,628 |
| Yara International ASA, 5.25%, 12/15/14 (e) | | 5,250,000 | | 5,534,671 |
| |
| Total Corporate Bonds (Cost $2,181,834,978) | | | | 2,235,360,360 |
| |
| |
| |
| MUNICIPAL OBLIGATIONS - 9.8% | | | | |
| Alameda California Corridor Transportation Authority | | | | |
| Revenue Bonds, Zero Coupon, 10/1/11 | | 11,000,000 | | 10,613,240 |
| Allegheny County Pennsylvania Hospital Development Authority | | | | |
| Revenue VRDN, 0.27%, 7/15/28 (r) | | 1,150,000 | | 1,150,000 |
| Allegheny County Pennsylvania IDA Revenue VRDN, | | | | |
| 0.25%, 6/1/38 (r) | | 1,600,000 | | 1,600,000 |
| Boynton Beach Florida Community Redevelopment Agency | | | | |
| Tax Allocation Bonds, 5.10%, 10/1/15 | | 460,000 | | 468,791 |
| Bridgeview Illinois GO Bonds, 4.62%, 12/1/11 | | 490,000 | | 496,733 |
| Burlingame California PO Revenue Bonds, 5.255%, 6/1/11 | | 1,000,000 | | 1,004,460 |
| Butler Pennsylvania Redevelopment Authority Tax | | | | |
| Allocation Bonds, 5.25%, 12/1/13 | | 505,000 | | 511,030 |
| Calhoun County Alabama Economic Development Council | | | | |
| Revenue VRDN, 0.46%, 4/1/21 (r) | | 4,100,000 | | 4,100,000 |
| California State Housing Finance Agency Revenue VRDN, | | | | |
| 0.22%, 8/1/33 (r) | | 2,430,000 | | 2,430,000 |
| California State Industry Sales Tax Revenue Bonds, 5.00%, 1/1/12 | | 2,900,000 | | 2,938,889 |
| California State Infrastructure & Economic Development Bank | | | | |
| Revenue VRDN, 0.24%, 4/1/42 (r) | | 10,615,000 | | 10,615,000 |
| California Statewide Communities Development Authority | | | | |
| Revenue Bonds, Zero Coupon, 6/1/13 | | 3,190,000 | | 2,868,065 |
Canyon Texas Regional Water Authority Revenue Bonds, | | | | |
| 5.70%, 8/1/12 | | 165,000 | | 170,174 |
| Chelsea Michigan Economic Development Corp. | | | | |
| LO Revenue VRDN, 0.27%, 10/1/36 (r) | | 1,975,000 | | 1,975,000 |
www. calvert.com CALVERT SHORT DURATION INCOME FUND SEMI-ANNUAL REPORT (UNAUDITED) 22
| | | | |
| | | PRINCIPAL | | |
| MUNICIPAL OBLIGATIONS - CONT’D | | AMOUNT | | VALUE |
| Collier County Florida MFH Finance Authority Revenue VRDN, | | | | |
| 0.26%, 7/15/34 (r) | $ | 2,900,000 | $ | 2,900,000 |
| Colorado State HFA Revenue VRDN: | | | | |
| Hamptons Apts. Project, 0.21%, 10/15/16 (r) | | 1,000,000 | | 1,000,000 |
| Silver Apts. Project, 0.21%, 10/15/16 (r) | | 500,000 | | 500,000 |
| Cook County Illinois School District GO Bonds: | | | | |
| No. 089 Maywood, Zero Coupon, 12/1/12 | | 2,135,000 | | 2,022,315 |
| No. 095 Brookfield, 5.45%, 12/1/11 | | 200,000 | | 204,644 |
| No. 170 Chicago Heights, Zero Coupon, 12/1/12 | | 380,000 | | 359,944 |
| Corte Madera California COPs, 5.447%, 2/1/16 | | 965,000 | | 962,973 |
| District of Columbia Housing Finance Agency MFH | | | | |
| Revenue VRDN, 0.25%, 11/1/38 (r) | | 1,295,000 | | 1,295,000 |
| District of Columbia Revenue VRDN, 0.22%, 4/1/38 (r) | | 3,000,000 | | 3,000,000 |
| East Baton Rouge Parish Industrial Development Board, Inc. | | | | |
| Revenue VRDN, 0.15%, 8/1/35 (r) | | 48,000,000 | | 48,000,000 |
| Englewood Colorado MFH Revenue VRDN, 0.24%, 12/1/26 (r) | | 600,000 | | 600,000 |
| Escondido California Joint Powers Financing Authority Lease | | | | |
| Revenue Bonds, 5.53%, 9/1/18 | | 1,535,000 | | 1,504,730 |
| Fall Creek Wisconsin School District GO Bonds, 5.91%, 3/1/19 | | 605,000 | | 630,295 |
| Franklin County Ohio Health Care Revenue VRDN, | | | | |
| 0.24%, 11/1/34 (r) | | 1,500,000 | | 1,500,000 |
| Frisco Texas Economic Development Corp. Sales Tax | | | | |
| Revenue Bonds, 5.619%, 2/15/17 | | 880,000 | | 907,174 |
| Hills City Iowa Health Facilities Revenue VRDN, 0.21%, 8/1/35 (r) | | 4,725,000 | | 4,725,000 |
| Hillsborough County Florida Port District Revenue Bonds, | | | | |
| Zero Coupon: | | | | |
| 6/1/11 | | 1,230,000 | | 1,222,497 |
| 12/1/11 | | 1,230,000 | | 1,200,185 |
| Illinois GO Bonds, 4.961%, 3/1/16 | | 34,000,000 | | 34,020,740 |
| Illinois State MFH Development Authority Revenue Bonds, | | | | |
| 5.662%, 7/1/17 | | 1,590,000 | | 1,641,007 |
| Iron County Wisconsin GO Bonds, 5.26%, 3/1/19 | | 490,000 | | 511,638 |
| Kansas City Missouri IDA & MFH Revenue VRDN, | | | | |
| 0.27%, 9/15/32 (r) | | 1,400,000 | | 1,400,000 |
| La Verne California PO Revenue Bonds, 5.49%, 6/1/11 | | 350,000 | | 351,922 |
| Louisiana Public Facilities Authority Revenue VRDN, | | | | |
| 0.25%, 8/1/23 (r) | | 2,485,000 | | 2,485,000 |
| Maryland Community Development Administration | | | | |
| Revenue VRDN, 0.27%, 12/1/37 (r) | | 1,000,000 | | 1,000,000 |
| Maryland State Health & Higher Educational Facilities Authority | | | | |
| Revenue VRDN, 0.25%, 7/1/34 (r) | | 1,000,000 | | 1,000,000 |
| Maryland State Transportation Authority Revenue Bonds, | | | | |
| 5.164%, 7/1/25 | | 2,250,000 | | 2,237,265 |
| Massachusetts State Development Finance Agency | | | | |
| Revenue VRDN, 0.27%, 9/1/16 (r) | | 2,200,000 | | 2,200,000 |
| Michigan State Hospital Finance Authority | | | | |
| Revenue VRDN, 0.25%, 3/1/30 (r) | | 5,900,000 | | 5,900,000 |
| Midpeninsula California Regional Open Space District | | | | |
| Financing Authority Revenue Bonds, 5.15%, 9/1/12 | | 1,075,000 | | 1,090,050 |
| Mississippi State Business Finance Corp. Revenue VRDN, | | | | |
| 0.25%, 3/1/17 (r) | | 1,835,000 | | 1,835,000 |
www. calvert.com CALVERT SHORT DURATION INCOME FUND SEMI-ANNUAL REPORT (UNAUDITED) 23
| | | | |
| | | PRINCIPAL | | |
| MUNICIPAL OBLIGATIONS - CONT’D | | AMOUNT | | VALUE |
| Missouri State Health & Educational Facilities Authority | | | | |
| Revenue VRDN, 0.23%, 11/1/32 (r) | $ | 1,000,000 | $ | 1,000,000 |
| Mobile Alabama Industrial Development Board Pollution | | | | |
| Revenue VRDN, 0.25%, 6/1/34 (r) | | 28,800,000 | | 28,800,000 |
| Montgomery County Maryland Housing Opportunities | | | | |
| Commission Revenue VRDN, 0.21%, 12/1/30 (r) | | 7,700,000 | | 7,700,000 |
| Montgomery County Pennsylvania Redevelopment Authority | | | | |
| MFH Revenue VRDN: | | | | |
| Forge Gate Apts. Project, 0.26%, 8/15/31 (r) | | 1,325,000 | | 1,325,000 |
| Kingswood Apts. Project, 0.26%, 8/15/31 (r) | | 1,150,000 | | 1,150,000 |
| Morehead Kentucky League of Cities Funding Trust Lease Program | | | | |
| Revenue VRDN, 0.26%, 6/1/34 (r) | | 6,812,500 | | 6,812,500 |
| Nashville & Davidson County Tennessee Water & Sewage | | | | |
| Revenue Bonds, 4.74%, 1/1/15 | | 1,585,000 | | 1,639,889 |
| Nevada State Department of Business & Industry Lease | | | | |
| Revenue Bonds, 5.32%, 6/1/17 | | 935,000 | | 864,810 |
| Nevada State Housing Division Revenue VRDN, 0.26%, 4/15/39 (r) | | 4,800,000 | | 4,800,000 |
| New Britain Connecticut GO Revenue VRDN, 0.34%, 2/1/26 (r) | | 2,200,000 | | 2,200,000 |
| New Jersey State Health Care Facilities Financing Authority | | | | |
| Revenue VRDN, 0.23%, 7/1/33 (r) | | 2,200,000 | | 2,200,000 |
| New York City Housing Development Corp. MFH | | | | |
| Revenue VRDN: | | | | |
| 0.24%, 6/15/34 (r) | | 200,000 | | 200,000 |
| 0.24%, 12/1/35 (r) | | 185,000 | | 185,000 |
| New York Metropolitan Transportation Authority | | | | |
| Revenue VRDN, 0.23%, 11/1/35 (r) | | 7,900,000 | | 7,900,000 |
| New York State Housing Finance Agency Revenue VRDN: | | | | |
| 0.25%, 5/15/33 (r) | | 300,000 | | 300,000 |
| 0.27%, 5/15/33 (r) | | 10,200,000 | | 10,200,000 |
| 0.24%, 5/15/34 (r) | | 4,100,000 | | 4,100,000 |
| 0.27%, 5/15/36 (r) | | 200,000 | | 200,000 |
| 0.23%, 5/15/37 (r) | | 500,000 | | 500,000 |
| 0.23%, 5/1/42 (r) | | 2,480,000 | | 2,480,000 |
| New York State Urban Development Corp. Revenue Bonds: | | | | |
| 4.38%, 12/15/11 | | 2,300,000 | | 2,361,916 |
| 2.626%, 12/15/14 | | 12,000,000 | | 12,083,520 |
| Oakland California Redevelopment Agency Tax Allocation Bonds: | | | | |
| 5.268%, 9/1/11 | | 2,860,000 | | 2,891,946 |
| 5.252%, 9/1/16 | | 1,495,000 | | 1,492,757 |
| 5.263%, 9/1/16 | | 1,920,000 | | 1,904,794 |
| Oakland City California PO Revenue Bonds, | | | | |
| Zero Coupon, 12/15/12 | | 1,680,000 | | 1,600,032 |
| Orange County California PO Revenue Bonds, | | | | |
| Zero Coupon, 9/1/11 | | 6,100,000 | | 6,066,633 |
| Oregon State School Boards Association GO Bonds, | | | | |
| Zero Coupon, 6/30/12 | | 2,000,000 | | 1,957,900 |
| Osprey Property Co., LLC VRDN, 0.28%, 6/1/27 (r) | | 1,000,000 | | 1,000,000 |
| Palm Springs California Community Redevelopment Agency | | | | |
| Tax Allocation Bonds, 5.59%, 9/1/17 | | 1,020,000 | | 1,021,316 |
| Pittsburg California Redevelopment Agency Tax | | | | |
| Allocation Bonds, 5.115%, 8/1/16 | | 1,285,000 | | 1,195,885 |
| Placer County California Redevelopment Agency Tax | | | | |
| Allocation Bonds, 5.75%, 8/1/15 | | 530,000 | | 545,434 |
www. calvert.com CALVERT SHORT DURATION INCOME FUND SEMI-ANNUAL REPORT (UNAUDITED) 24
| | | | |
| | | PRINCIPAL | | |
| MUNICIPAL OBLIGATIONS - CONT’D | | AMOUNT | | VALUE |
| Richfield Minnesota MFH Revenue VRDN, 0.27%, 3/1/34 (r) | $ | 1,000,000 | $ | 1,000,000 |
| Riverside California Public Financing Authority Tax | | | | |
| Allocation Bonds, 5.24%, 8/1/17 | | 1,405,000 | | 1,363,243 |
| Roseville California Redevelopment Agency Tax | | | | |
| Allocation Bonds, 5.31%, 9/1/13 | | 315,000 | | 318,824 |
| Rural Electric Co-op Grantor Trust Certificates VRDN, | | | | |
| 0.60%, 12/18/17 (r) | | 1,320,000 | | 1,320,000 |
| San Diego California Redevelopment Agency Tax | | | | |
| Allocation Bonds, 5.66%, 9/1/16 | | 1,035,000 | | 1,038,188 |
| Santa Fe Springs California Community Development | | | | |
| Commission Tax Allocation Bonds, 5.18%, 9/1/11 | | 425,000 | | 425,238 |
| Shorewood Wisconsin School District GO Bonds, 5.30%, 4/1/16 | | 240,000 | | 253,850 |
| South Bend County Indiana Economic Development Income | | | | |
| Tax Revenue Bonds, 5.20%, 2/1/14 | | 995,000 | | 1,073,167 |
| South Dakota State Housing Development Authority | | | | |
| Revenue VRDN, 0.27%, 1/1/44 (r) | | 1,500,000 | | 1,500,000 |
| St. Louis Park Minnesota MFH Revenue VRDN, 0.27%, 8/1/34 (r) | | 1,800,000 | | 1,800,000 |
| St. Paul Minnesota Sales Tax Revenue Bonds, 5.30%, 11/1/12 | | 925,000 | | 969,067 |
| Stanislaus County California Revenue Bonds, 7.15%, 8/15/13 | | 300,000 | | 310,068 |
| Tarrant County Texas Industrial Development Corp. | | | | |
| Revenue VRDN, 0.39%, 9/1/27 (r) | | 3,680,000 | | 3,680,000 |
| Texas State Transportation Commission Revenue Bonds, | | | | |
| 5.028%, 4/1/26 | | 1,000,000 | | 986,330 |
| Tift County Georgia IDA Revenue VRDN, 0.28%, 2/1/28 (r) | | 5,000,000 | | 5,000,000 |
| Tuscaloosa County Alabama IDA Gulf Opportunity Zone | | | | |
| Revenue VRDN, 0.31%, 3/1/27 (r) | | 1,500,000 | | 1,500,000 |
| Wisconsin Health & Educational Facilities Authority | | | | |
| Revenue VRDN, 0.22%, 4/1/35 (r) | | 14,005,000 | | 14,005,000 |
| Ypsilanti Michigan GO Bonds, 5.55%, 5/1/12 | | 335,000 | | 343,197 |
| |
| Total Municipal Obligations (Cost $324,032,355) | | | | 324,714,265 |
| |
| |
| |
| |
| U.S. GOVERNMENT AGENCIES | | | | |
| AND INSTRUMENTALITIES - 3.3% | | | | |
| AgFirst FCB: | | | | |
| 8.393% to 12/15/11, floating rate thereafter to 12/15/16 (r) | | 30,445,000 | | 31,662,800 |
| 6.585% to 6/15/12, floating rate thereafter to 6/29/49 (e)(r) | | 5,000,000 | | 4,000,000 |
| COP I LLC: | | | | |
| 3.613%, 12/5/21 | | 4,312,895 | | 4,451,201 |
| 3.65%, 12/5/21 | | 6,104,254 | | 6,067,724 |
| Fannie Mae, 0.375%, 12/28/12 | | 1,250,000 | | 1,242,344 |
| New Valley Generation I, 7.299%, 3/15/19 | | 2,421,036 | | 2,791,318 |
| New Valley Generation II, 5.572%, 5/1/20 | | 3,580,253 | | 3,752,249 |
| New Valley Generation V, 4.929%, 1/15/21 | | 3,496,627 | | 3,800,589 |
| Overseas Private Investment Corp.: | | | | |
| 0.22%, 8/15/17 (b)(r) | | 1,800,000 | | 1,800,000 |
| 0.22%, 8/15/17 (r) | | 4,000,000 | | 4,000,000 |
| Premier Aircraft Leasing EXIM 1 Ltd.: | | | | |
| 3.576%, 2/6/22 | | 7,168,271 | | 7,147,842 |
| 3.547%, 4/10/22 | | 12,278,068 | | 12,227,482 |
www. calvert.com CALVERT SHORT DURATION INCOME FUND SEMI-ANNUAL REPORT (UNAUDITED) 25
| | | | |
| U.S. GOVERNMENT AGENCIES | | PRINCIPAL | | |
| AND INSTRUMENTALITIES - CONT’D | | AMOUNT | | VALUE |
| Private Export Funding Corp., 3.05%, 10/15/14 | $ | 10,000,000 | $ | 10,361,566 |
| Tunisia Government AID Bonds, Guaranteed by the United States | | | | |
| Agency of International Development, 9.375%, 8/1/16 | | 449,999 | | 515,933 |
| US AgBank FCB, 6.11% to 7/10/12, floating rate thereafter | | | | |
| to 12/31/49 (e)(r) | | 7,910,000 | | 5,299,700 |
| Vessel Management Services, Inc., 5.85%, 5/1/27 | | 8,667,000 | | 9,512,813 |
| |
| Total U.S. Government Agencies and Instrumentalities | | | | |
| (Cost $104,353,470) | | | | 108,633,561 |
| |
| |
| U.S. GOVERNMENT AGENCY | | | | |
| MORTGAGE-BACKED SECURITIES - 0.0% | | | | |
| Government National Mortgage Association: | | | | |
| 5.50%, 1/16/32 (b) | | 1,699,350 | | 94,018 |
| 5.50%, 5/20/32 (b) | | 1,457,367 | | 66,899 |
| |
| Total U.S. Government Agency Mortgage-Backed | | | | |
| Securities (Cost $466,116) | | | | 160,917 |
| |
| |
| U.S. TREASURY - 1.7% | | | | |
| United States Treasury Bonds: | | | | |
| 4.25%, 11/15/40 | | 1,490,000 | | 1,424,580 |
| 4.75%, 2/15/41 | | 25,290,000 | | 26,285,794 |
| United States Treasury Notes: | | | | |
| 0.625%, 1/31/13 | | 4,980,000 | | 4,970,662 |
| 0.625%, 2/28/13 | | 2,550,000 | | 2,543,625 |
| 1.00%, 1/15/14 | | 2,050,000 | | 2,039,750 |
| 1.25%, 3/15/14 | | 5,640,000 | | 5,638,237 |
| 2.125%, 2/29/16 | | 11,468,000 | | 11,430,371 |
| 3.625%, 2/15/21 | | 885,000 | | 897,722 |
| |
| Total U.S. Treasury (Cost $55,576,576) | | | | 55,230,741 |
| |
| |
| FLOATING RATE LOANS (D) - 0.3% | | | | |
| Clear Channel Communications, Inc., Term Loan B, | | | | |
| 3.912%, 1/29/16 (r) | | 9,640,253 | | 8,476,733 |
| |
| Total Floating Rate Loans (Cost $8,953,788) | | | | 8,476,733 |
www. calvert.com CALVERT SHORT DURATION INCOME FUND SEMI-ANNUAL REPORT (UNAUDITED) 26
| | | | | | | |
| EQUITY SECURITIES - 0.2% | | | | shares | | value | |
| Woodbourne Capital: | | | | | | | |
| Trust I, Preferred (b)(e) | | | | 2,125,000 | $ | 1,487,500 | |
| Trust II, Preferred (b)(e) | | | | 2,125,000 | | 1,487,500 | |
| Trust III, Preferred (b)(e) | | | | 3,125,000 | | 2,187,500 | |
| Trust IV, Preferred (b)(e) | | | | 3,125,000 | | 2,187,500 | |
| |
| Total Equity Securities (Cost $5,920,000) | | | | | 7,350,000 | |
| |
| TOTAL INVESTMENTS (Cost $3,141,127,369) - 96.6% | | | | 3,197,127,829 | |
| Other assets and liabilities, net - 3.4% | | | | | 114,040,272 | |
| Net assets - 100% | | | | | $ | 3,311,168,101 | |
| |
| |
| |
| |
| | | | | UNDERLYING | | UNREALIZED | |
| | # OF | EXPIRATION | | FACE AMOUNT | | APPRECIATION | |
| Futures | CONTRACTS | DATE | | AT VALUE | | (DEPRECIATION) | |
| Purchased: | | | | | | | |
| 5 Year U.S. Treasury Notes | 86 | 6/11 | $ | 10,043,859 | $ | 5,215 | |
| 10 Year U.S. Treasury Notes | 151 | 6/11 | | 17,973,719 | | 25,935 | |
| 30 Year U.S. Treasury Bonds | 1,019 | 6/11 | | 122,471,063 | | 11,588 | |
| Total Purchased | | | | | $ | 42,738 | |
| |
| Sold: | | | | | | | |
| 2 Year U.S. Treasury Notes | 9,014 | 6/11 | $ | 1,966,178,750 | ($ | 1,131,806 | ) |
www. calvert.com CALVERT SHORT DURATION INCOME FUND SEMI-ANNUAL REPORT (UNAUDITED) 27
| (b) | This security was valued by the Board of Trustees. See Note A. |
| |
| (d) | Remaining maturities of floating rate loans may be less than the stated maturities shown as a result of contrac- tual or optional prepayments by the borrower. Such prepayments cannot be predicted with certainty. Floating rate loans generally pay interest rates which are periodically redetermined at a margin above the London InterBank Offered Rate (“LIBOR”) or other short-term rates. The rate shown is the rate in effect at period end. Floating rate loans are generally considered restrictive in that the Fund is ordinarily contractually obli- gated to receive consent from the Agent Bank and/or Borrower prior to disposition of a floating rate loan. |
| |
| (e) | Security is exempt from registration under Rule 144A of the Securities Act of 1933. These securities may be resold in transactions exempt from registration, normally to qualified institutional buyers. |
| |
| (m) | The Illinois Insurance Department prohibited Lumbermens from making interest payments. This security is no longer accruing interest. |
| |
| (n) | The Illinois Insurance Department prohibited Lumbermens from making interest payments. This TIERS security is based on interest payments from Lumbermens. This security is no longer accruing interest. |
| |
| (p) | The State of New York Insurance Department has prohibited Atlantic Mutual Insurance Co. from making interest payments. This security is no longer accruing interest. |
| |
| (r) | The coupon rate shown on floating or adjustable rate securities represents the rate at period end. |
| |
| (u) | This security is no longer accruing interest. |
| |
| (w) | Security is in default and is no longer accruing interest. |
| |
| (x) | Alliance Bancorp and its affiliates filed for Chapter 7 bankruptcy on July 13, 2007. This security is no longer accruing interest. |
| |
| (y) | The government of Iceland took control of Glitnir Banki HF (the “Bank”) on October 8, 2008. The govern- ment has prohibited the Bank from paying any claims owed to foreign entities. This security is no longer accruing interest. |
| |
| (ii) | General Motors filed for Chapter 11 bankruptcy on June 1, 2009. This security is no longer accuring inter- est. Subsequent to period end, the Fund received a distribution of new GM stock and new GM warrants in exchange for the Motors Liquidation Co. Notes. |
| |
| * | Non-income producing security. |
Abbreviations:
COPs: Certificates of Participation
FCB: Farm Credit Bank
FSB: Federal Savings Bank
GO: General Obligation
HFA: Housing Finance Authority
IDA: Industrial Development Authority
LLC: Limited Liability Corporation
LO: Limited Obligation
LP: Limited Partnership
MFH: Multi-Family Housing
PO: Pension Obligation
VRDN: Variable Rate Demand Note
See notes to financial statements.
www. calvert.com CALVERT SHORT DURATION INCOME FUND SEMI-ANNUAL REPORT (UNAUDITED) 28
STATEMENT OF ASSETS AND LIABILITIES
MARCH 31, 2011
| | | | |
| ASSETS | | | |
| Investments in securities, at value (Cost $3,141,127,369) - see accompanying | | | |
| schedule | $ | 3,197,127,829 | |
| Cash | | | 119,542,429 | |
| Receivable for securities sold | | 35,001,257 | |
| Receivable for shares sold | | 20,964,915 | |
| Interest and dividends receivable | | 22,825,916 | |
| Other assets | | 6,565,635 | |
| Total assets | | 3,402,027,981 | |
| |
| |
| LIABILITIES | | | |
| Payable for securities purchased | | 79,382,011 | |
| Payable for shares redeemed | | 7,685,645 | |
| Receivable for futures variation margin | | 579,085 | |
| Payable to Calvert Asset Management Company, Inc. | | 1,421,442 | |
| Payable to Calvert Administrative Services Company | | 791,682 | |
| Payable to Calvert Shareholder Services, Inc. | | 63,160 | |
| Payable to Calvert Distributors, Inc. | | 670,094 | |
| Accrued expenses and other liabilities | | 266,761 | |
| Total liabilities | | 90,859,880 | |
| |
| |
| NET ASSETS | $ | 3,311,168,101 | |
| |
| |
| NET ASSETS CONSIST OF: | | | |
| Paid-in capital applicable to the following shares of beneficial interest, | | | |
| unlimited number of no par value shares authorized: | | | |
| Class A: 111,503,106 shares outstanding | $ | 1,788,295,061 | |
| Class C: 20,044,355 shares outstanding | | 321,276,613 | |
| Class I: 5,137,654 shares outstanding | | 83,337,939 | |
| Class Y: 63,638,696 shares outstanding | | 1,050,872,740 | |
| Undistributed net investment income (loss) | | (2,754,086 | ) |
| Accumulated net realized gain (loss) on investments | | 15,228,442 | |
| Net unrealized appreciation (depreciation) on investments | | 54,911,392 | |
| |
| |
| NET ASSETS | $ | 3,311,168,101 | |
| |
| NET ASSET VALUE PER SHARE | | | |
| Class A (based on net assets of $1,838,351,212) | $ | 16.49 | |
| Class C (based on net assets of $329,210,119) | $ | 16.42 | |
| Class I | (based on net assets of $85,056,484) | $ | 16.56 | |
| Class Y | (based on net assets of $1,058,550,286) | $ | 16.63 | |
See notes to financial statements.
www. calvert.com CALVERT SHORT DURATION INCOME FUND SEMI-ANNUAL REPORT (UNAUDITED) 29
STATEMENT OF OPERATIONS
SIX MONTHS ENDED
MARCH 31, 2011
| | | |
| NET INVESTMENT INCOME | | | |
| Investment Income: | | | |
| Interest income | $ | 55,942,639 | |
| Dividend income (net of foreign taxes withheld of $40) | | 144,239 | |
| Other income | | 51,361 | |
| Total investment income | | 56,138,239 | |
| |
| Expenses: | | | |
| Investment advisory fee | | 5,309,088 | |
| Administrative fees | | 4,726,904 | |
| Transfer agency fees and expenses | | 3,204,973 | |
| Distribution Plan expenses: | | | |
| Class A | | 2,397,082 | |
| Class C | | 1,657,166 | |
| Trustees’ fees and expenses | | 51,897 | |
| Custodian fees | | 156,314 | |
| Registration fees | | 59,136 | |
| Reports to shareholders | | 436,247 | |
| Professional fees | | 37,274 | |
| Accounting fees | | 181,340 | |
| Miscellaneous | | 44,131 | |
| Total expenses | | 18,261,552 | |
| Reimbursement from Advisor: | | | |
| Class A | | (683,693 | ) |
| Fees paid indirectly | | (6,930 | ) |
| Net expenses | | 17,570,929 | |
| |
| |
| NET INVESTMENT INCOME | | 38,567,310 | |
| |
| REALIZED AND UNREALIZED GAIN (LOSS) | | | |
| Net realized gain (loss) on: | | | |
| Investments | | 27,046,184 | |
| Futures | | (8,653,000 | ) |
| | | 18,393,184 | |
| |
| Change in unrealized appreciation (depreciation) on: | | | |
| Investments | | (27,037,567 | ) |
| Futures | | 3,262,127 | |
| | | (23,775,440 | ) |
| |
| NET REALIZED AND UNREALIZED GAIN | | | |
| (LOSS) | | (5,382,256 | ) |
| |
| INCREASE (DECREASE) IN NET ASSETS | | | |
| RESULTING FROM OPERATIONS | $ | 33,185,054 | |
See notes to financial statements.
www. calvert.com CALVERT SHORT DURATION INCOME FUND SEMI-ANNUAL REPORT (UNAUDITED) 30
STATEMENTS OF CHANGES IN NET ASSETS
| | | | | | |
| | | SIX MONTHS ENDED | | | YEAR ENDED | |
| | | MARCH
31, | | | SEPTEMBER 30, | |
| INCREASE (DECREASE) IN NET ASSETS | | 2011 | | | 2010 | |
| Operations: | | | | | | |
| Net investment income | $ | 38,567,310 | | $ | 69,937,815 | |
| Net realized gain (loss) | | 18,393,184 | | | 27,883,419 | |
| Change in unrealized appreciation (depreciation) | | (23,775,440 | ) | | 38,955,349 | |
| |
| |
| INCREASE (DECREASE) IN NET ASSETS | | | | | | |
| RESULTING FROM OPERATIONS | | 33,185,054 | | | 136,776,583 | |
| |
| Distributions to shareholders from: | | | | | | |
| Net investment income: | | | | | | |
| Class A shares | | (22,642,899 | ) | | (50,841,178 | ) |
| Class C shares | | (2,718,288 | ) | | (4,819,780 | ) |
| Class I shares | | (1,030,189 | ) | | (1,390,470 | ) |
| Class Y shares | | (13,744,143 | ) | | (9,600,945 | ) |
| Net realized gain: | | | | | | |
| Class A shares | | (14,395,126 | ) | | (25,667,341 | ) |
| Class C shares | | (2,459,898 | ) | | (3,427,548 | ) |
| Class I shares | | (501,603 | ) | | (608,217 | ) |
| Class Y shares | | (7,441,834 | ) | | (2,269,326 | ) |
| Total distributions | | (64,933,980 | ) | | (98,624,805 | ) |
| |
| Capital share transactions: | | | | | | |
| Shares sold: | | | | | | |
| Class A shares | | 318,553,786 | | | 1,750,468,710 | |
| Class C shares | | 44,553,946 | | | 172,515,257 | |
| Class I shares | | 32,716,814 | | | 48,004,269 | |
| Class Y shares | | 274,111,965 | | | 1,046,422,544 | |
| Reinvestment of distributions: | | | | | | |
| Class A shares | | 32,928,396 | | | 63,089,910 | |
| Class C shares | | 2,699,849 | | | 4,456,409 | |
| Class I shares | | 1,454,017 | | | 1,969,169 | |
| Class Y shares | | 3,917,814 | | | 6,580,437 | |
| Redemption fees: | | | | | | |
| Class A shares | | 24,207 | | | 117,240 | |
| Class C shares | | 1,656 | | | 4,978 | |
| Class I shares | | — | | | 231 | |
| Class Y shares | | 31,489 | | | 27,570 | |
| Shares redeemed: | | | | | | |
| Class A shares | | (496,873,724 | ) | | (1,592,581,449 | ) |
| Class C shares | | (52,779,515 | ) | | (62,242,634 | ) |
| Class I shares | | (7,847,631 | ) | | (19,187,534 | ) |
| Class Y shares | | (272,636,458 | ) | | (150,869,284 | ) |
| Total capital share transactions | | (119,143,389 | ) | | 1,268,775,823 | |
| |
| |
| TOTAL INCREASE (DECREASE) IN NET ASSETS | ($ | 150,892,315 | ) | $ | 1,306,927,601 | |
See notes to financial statements.
www. calvert.com CALVERT SHORT DURATION INCOME FUND SEMI-ANNUAL REPORT (UNAUDITED) 31
STATEMENTS OF CHANGES IN NET ASSETS
| | | | | | |
| INCREASE (DECREASE) IN NET ASSETS - (CONT’D) | | | | | | |
| | | SIX MONTHS ENDED | | | YEAR
ENDED | |
| | | MARCH
31, | | | SEPTEMBER 30, | |
| NET ASSETS | | 2011 | | | 2010 | |
| Beginning of period | $ | 3,462,060,416 | | $ | 2,155,132,815 | |
| End of period (including distributions in excess of net investment | | | | | | |
| income of $2,754,086 and $1,185,877, respectively) | $ | 3,311,168,101 | | $ | 3,462,060,416 | |
| |
| |
| |
| CAPITAL SHARE ACTIVITY | | | | | | |
| Shares sold: | | | | | | |
| Class A shares | | 19,290,230 | | | 106,435,139 | |
| Class C shares | | 2,708,619 | | | 10,539,144 | |
| Class I shares | | 1,970,557 | | | 2,901,160 | |
| Class Y shares | | 16,462,511 | | | 62,975,873 | |
| Reinvestment of distributions: | | | | | | |
| Class A shares | | 1,997,755 | | | 3,849,255 | |
| Class C shares | | 164,504 | | | 273,145 | |
| Class I shares | | 87,872 | | | 119,678 | |
| Class Y shares | | 235,596 | | | 398,467 | |
| Shares redeemed: | | | | | | |
| Class A shares | | (30,110,959 | ) | | (96,697,876 | ) |
| Class C shares | | (3,209,501 | ) | | (3,797,564 | ) |
| Class I shares | | (473,286 | ) | | (1,165,179 | ) |
| Class Y shares | | (16,341,069 | ) | | (9,079,124 | ) |
| Total capital share activity | | (7,217,171 | ) | | 76,752,118 | |
See notes to financial statements.
www. calvert.com CALVERT SHORT DURATION INCOME FUND SEMI-ANNUAL REPORT (UNAUDITED) 32
NOTES TO FINANCIAL STATEMENTS
NOTE A –– SIGNIFICANT ACCOUNTING POLICIES
General: The Calvert Short Duration Income Fund (the “Fund”), a series of The Calvert Fund, is registered under the Investment Company Act of 1940 as a non-diversified, open-end management investment company. The operations of each series are accounted for separately. The Fund currently offers four classes of shares of beneficial interest. Class A shares are sold with a maximum front-end sales charge of 2.75%. Class C shares are sold without a front-end sales change and, with certain exceptions, will be charged a deferred sales charge on shares sold within one year of purchase. Class C shares have a higher expense ratio than Class A shares. Class I shares require a minimum account balance of $1,000,000. The $1 million minimum initial investment may be waived for certain institutional accounts, where it is believed to be in the best interest of the Fund and its shareholders. Class I shares have no front-end or deferred sales charge and have lower levels of expenses than Class A shares. Class Y shares are generally only available to wrap or similar fee-based programs offered by financial intermediaries that have entered into an agreement with the Fund’s Distributor to offer Class Y shares. Class Y shares have no front-end or deferred sales charge and have lower levels of expenses than Class A shares. Each class has different: (a) dividend rates due to differences in Distribution Plan expenses and other class specific expenses, (b) exchange privileges and (c) class specific voting rights.
Security Valuation: Net asset value per share is determined every business day as of the close of the regular session of the New York Stock Exchange (generally 4:00 p.m. Eastern time). The Fund uses independent pricing services approved by the Board of Trustees to value its investments wherever possible. Investments for which market quotations are not available or deemed not reliable are fair valued in good faith under the direction of the Board of Trustees. In determining fair value, the Board considers all relevant qualitative and quantitative information available. These factors are subject to change over time and are reviewed periodically. The values assigned to fair value investments are based on available information and do not necessarily represent amounts that might ultimately be realized. Further, because of the inherent uncertainty of valuation, those estimated values may differ significantly from the values that would have been used had a ready market for the investments existed, and the differences could be material.
At March 31, 2011, securities valued at $87,908,469 or 2.7% of net assets were fair valued in good faith under the direction of the Board of Trustees.
The Fund utilizes various methods to measure the fair value of its investments. Generally Accepted Accounting Principles (GAAP) establishes a disclosure hierarchy that categorizes the inputs to valuation techniques used to value assets and liabilities at measurement date. These inputs are summarized in the three broad levels listed below: Level 1 – quoted prices in active markets for identical securities Level 2 – other significant observable inputs (including quoted prices for similar securities, interest rates, prepayment speeds, credit risk, etc.) Level 3 – significant unobservable inputs (including the Fund’s own assumptions in determining the fair value of investments)
www. calvert.com CALVERT SHORT DURATION INCOME FUND SEMI-ANNUAL REPORT (UNAUDITED) 33
The inputs or methodology used for valuing securities are not necessarily an indication of the risk associated with investing in those securities.
Changes in valuation techniques may result in transfers in or out of an investment’s assigned level within the hierarchy during the period. Valuation techniques used to value the Fund’s investments by major category are as follows.
Debt securities, including restricted securities, are valued based on evaluated prices received from independent pricing services or from dealers who make markets in such securities. For corporate bonds, floating rate loans, municipal securities, and U.S. government and government agency obligations, pricing services utilize matrix pricing which considers yield or price of bonds of comparable quality, coupon, maturity and type as well as dealer supplied prices and are generally categorized as Level 2 in the hierarchy. For asset backed securities, collateralized mortgage obligations, commercial mortgage securities and U.S. government agency mortgage securities, pricing services utilize matrix pricing which considers prepayment speed assumptions, attributes of the collateral, yield or price of bonds of comparable quality, coupon, maturity and type as well as dealer supplied prices and, accordingly, such securities are generally categorized as Level 2 in the hierarchy. Short-term securities with remaining maturities of sixty days or less for which quotations are not readily available are valued at amortized cost, which approximates fair value, and are categorized as Level 2 in the hierarchy.
When independent prices are unavailable or unreliable, debt securities may be valued utilizing pricing matrices which consider similar factors that would be used by independent pricing services. These are generally categorized as Level 2 in the hierarchy but may be Level 3 depending on the circumstances.
Equity securities, including restricted securities, for which market quotations are readily available, are valued at the last reported sale price or official closing price as reported by an independent pricing service on the primary market or exchange on which they are traded and are categorized as Level 1 in the hierarchy. Foreign securities are valued based on quotations from the principle market in which such securities are normally traded. If events occur after the close of the principle market in which foreign securities are traded, and before the close of business of the Fund, that are expected to materially affect the value of those securities, then they are valued at their fair value taking these events into account. For restricted securities and private placements where observable inputs are limited, assumptions about market activity and risk are used and are categorized as Level 3 in the hierarchy.
www. calvert.com CALVERT SHORT DURATION INCOME FUND SEMI-ANNUAL REPORT (UNAUDITED) 34
The following is a summary of the inputs used to value the Fund’s net assets as of March 31, 2011:
| | | | | | | | | | | |
| | valuatIon InPuts |
| InvestMents In securItIes | | level 1 | | | level 2 | | level 3 | | | total | |
| Equity securities | | - | | | - | $ | 7,350,000 | | $ | 7,350,000 | |
| Asset backed securities | | - | | $ | 105,729,042 | | - | | | 105,729,042 | |
| Collateralized mortgage-backed | | | | | | | | | | | |
| obligations | | - | | | 48,797,380 | | - | | | 48,797,380 | |
| Commercial mortgage-backed | | | | | | | | | | | |
| securities | | - | | | 302,674,830 | | - | | | 302,674,830 | |
| Corporate debt | | - | | | 2,204,596,719 | | 30,763,641 | | | 2,235,360,360 | |
| Municipal obligations | | - | | | 324,714,265 | | - | | | 324,714,265 | |
| U.S. government obligations | | - | | | 162,225,219 | | 1,800,000 | | | 164,025,219 | |
| Other debt obligations | | - | | | 8,476,733 | | - | | | 8,476,733 | |
| TOTAL | | - | | $ | 3,157,214,188 | | $39,913,641 | ** | $ | 3,197,127,829 | |
| Other financial instruments* | ($ | 1,089,068 | ) | | - | | - | | ($ | 1,089,068 | ) |
* Other financial instruments are derivative instruments not reflected in the Portfolio of Investments, such as futures, which are valued at the unrealized appreciation/depreciation on the instrument.
** Level 3 securities represent 1.2% of net assets.
Repurchase Agreements: The Fund may enter into repurchase agreements with recognized financial institutions or registered broker/dealers and, in all instances, holds underlying securities with a value exceeding the total repurchase price, including accrued interest. Although risk is mitigated by the collateral, the Fund could experience a delay in recovering its value and a possible loss of income or value if the counterparty fails to perform in accordance with the terms of the agreement.
Loan Participations and Assignments: The Fund may invest in direct debt instruments which are interests in amounts owed to lenders or lending syndicates by corporate, governmental, or other borrowers. A Fund’s investments in loans may be in the form of participations in loans or assignments of all or a portion of loans from third parties. A loan is often administered by a bank or other financial institution (the “lender”) that acts as agent for all holders. The agent administers the terms of the loan, as specified in the loan agreement. A Fund may invest in multiple series or tranches of a loan, which may have varying terms and carry different associated risks. A Fund generally has no right to enforce compliance with the terms of the loan agreement with the borrower. As a result, a Fund may be subject to the credit risk of both the borrower and the lender that is selling the loan agreement. When a Fund purchases assignments from lenders it acquires direct rights against the borrower of the loan. When investing in a loan participation, a Fund has the right to receive payments of principal, interest and any fees to which it is entitled only from the lender selling the loan agreement and only upon receipt of payments by the lender from the borrower.
Futures Contracts: The Fund may purchase and sell futures contracts, but only when, in the judgment of the Advisor, such a position acts as a hedge. The Fund may not enter into futures contracts for the purpose of speculation or leverage. These futures contracts may include, but are not limited to, futures contracts based on U.S. Government obli-
www. calvert.com CALVERT SHORT DURATION INCOME FUND SEMI-ANNUAL REPORT (UNAUDITED) 35
gations. The Fund is subject to interest rate risk in the normal course of pursuing its investment objectives. The Fund may use futures contracts to hedge against changes in the value of interest rates. The Fund may enter into futures contracts agreeing to buy or sell a financial instrument for a set price at a future date. Initial margin deposits of either cash or securities as required by the broker are made upon entering into the contract. While the contract is open, daily variation margin payments are made to or received from the broker reflecting the daily change in market value of the contract and are recorded for financial reporting purposes as unrealized gains or losses by the Fund. When a futures contract is closed, a realized gain or loss is recorded equal to the difference between the opening and closing value of the contract. The risks associated with entering into futures contracts may include the possible illiquidity of the secondary market which would limit the Fund’s ability to close out a futures contract prior to the settlement date, an imperfect correlation between the value of the contracts and the underlying financial instruments, or that the counterparty will fail to perform its obligations under the contracts’ terms. Futures contracts are designed by boards of trade which are designated “contracts markets” by the Commodities Futures Trading Commission. Futures contracts trade on the contracts markets in a manner that is similar to the way a stock trades on a stock exchange and the boards of trade, through their clearing corporations, guarantee the futures contracts against default. As a result, there is minimal counterparty credit risk to the Fund. During the period, the Fund used U.S. Treasury futures contracts to hedge against interest rate changes and to manage overall duration of the Fund.
Short Sales: The Fund may use a hedging technique that involves short sales of U.S. Treasury securities for the purposes of managing the duration of the Fund. Any short sales are “covered” with an equivalent amount of high quality, liquid securities.
Security Transactions and Net Investment Income: Security transactions are accounted for on trade date. Realized gains and losses are recorded on an identified cost basis and may include proceeds from litigation. Dividend income is recorded on the ex-dividend date or, in the case of dividends on certain foreign securities, as soon as the Fund is informed of the ex-dividend date. Distributions received on securities that represent a return of capital or capital gain are recorded as a reduction of cost of investments and/or as a realized gain. Interest income, which includes amortization of premium and accretion of discount on debt securities, is accrued as earned. Investment income and realized and unrealized gains and losses are allocated to separate classes of shares based upon the relative net assets of each class. Debt obligations may be placed on non-accrual status and related interest income may be reduced by ceasing current accruals and writing off interest receivables when the collection of all or a portion of interest has become doubtful based on consistently applied procedures. (See the Schedule of Investments footnotes on page 28.) A debt obligation may be removed from non-accrual status when the issuer resumes interest payments or when collectability of interest is reasonably assured. Expenses arising in connection with a class are charged directly to that class. Expenses common to the classes are allocated to each class in proportion to their relative net assets. Withholding taxes on foreign dividends have been provided for in accordance with the Fund’s understanding of the applicable country’s tax rules and rates. The Fund earns certain fees in connection with its floating rate loan purchasing activities. These fees are in addition to interest payments earned and may include amendment fees, consent fees and prepayment fees. These fees are recorded as Income in the accompanying financial
www. calvert.com CALVERT SHORT DURATION INCOME FUND SEMI-ANNUAL REPORT (UNAUDITED) 36
statements.
Foreign Currency Transactions: The Fund’s accounting records are maintained in U.S. dollars. For valuation of assets and liabilities on each date of net asset value determination, foreign denominations are translated into U.S. dollars using the current exchange rate. Security transactions, income and expenses are translated at the prevailing rate of exchange on the date of the event. The effect of changes in foreign exchange rates on securities and foreign currencies is included in the net realized and unrealized gain or loss on securities and foreign currencies.
Distributions to Shareholders: Distributions to shareholders are recorded by the Fund on ex-dividend date. Dividends from net investment income are paid monthly. Distributions from net realized capital gains, if any, are paid at least annually. Distributions are determined in accordance with income tax regulations which may differ from generally accepted accounting principles; accordingly, periodic reclassifications are made within the Fund’s capital accounts to reflect income and gains available for distribution under income tax regulations.
Estimates: The preparation of the financial statements in conformity with accounting principles generally accepted in the United States requires management to make estimates and assumptions that affect the reported amounts of assets and liabilities and disclosure of contingent assets and liabilities at the date of the financial statements and the reported amounts of income and expenses during the reported period. Actual results could differ from those estimates.
Redemption Fees: The Fund charges a 2% redemption fee on redemptions, including exchanges, made within 30 days of purchase in the same Fund (within seven days for Class I shares). The redemption fee is paid to the Class of the Fund from which the redemption is made, and is accounted for as an addition to paid-in capital. The fee is intended to discourage market-timers by ensuring that short-term trading costs are borne by the investors making the transactions and not the shareholders already in the Fund.
Expense Offset Arrangements: The Fund has an arrangement with its custodian bank whereby the custodian’s fees may be paid indirectly by credits earned on the Fund’s cash on deposit with the bank. These credits are used to reduce the Fund’s expenses. Such a deposit arrangement may be an alternative to overnight investments.
Federal Income Taxes: No provision for federal income or excise tax is required since the Fund intends to continue to qualify as a regulated investment company under the Internal Revenue Code and to distribute substantially all of its taxable earnings.
Management has analyzed the Fund’s tax positions taken for all open federal income tax years and has concluded that no provision for federal income tax is required in the Fund’s financial statements. A Fund’s federal tax return is subject to examination by the Internal Revenue Service for a period of three years.
NOTE B — RELATED PARTY TRANSACTIONS
Calvert Asset Management Company, Inc. (the “Advisor”) is wholly-owned by Calvert Group, Ltd. (“Calvert”), which is indirectly wholly-owned by UNIFI Mutual Holding Company.
www. calvert.com CALVERT SHORT DURATION INCOME FUND SEMI-ANNUAL REPORT (UNAUDITED) 37
The Advisor provides investment advisory services and pays the salaries and fees of officers and Trustees of the Fund who are employees of the Advisor or its affiliates. For its services, the Advisor receives an annual fee, payable monthly, based on the following annual rates of average net assets: .35% on the first $750 million, .325% next $750 million, .30% next $2 billion, and .275% over $3.5 billion (.30% over $1.5 billion prior to February 1, 2011).
The Advisor has contractually agreed to limit net annual fund operating expenses through January 31, 2012. The contractual expense cap is 1.08% for Class A, .75% for Class I, and .95% for Class Y. For the purposes of this expense limit, operating expenses do not include interest expense, brokerage commissions, taxes, and extraordinary expenses. To the extent that any expense offset credits are earned, the Advisor’s obligation under the contractual limitation may be reduced and the Advisor may benefit from the expense offset arrangement.
Calvert Administrative Services Company, an affiliate of the Advisor, provides administrative services to the Fund for an annual fee, payable monthly. Class A, Class C and Class Y shares pay an annual rate of .30% on the first $1.5 billion and .275% over $1.5 billion of the combined assets of all classes of the Fund. Class I shares pay an annual rate of .10%, based on their average daily net assets.
Calvert Distributors, Inc., an affiliate of the Advisor, is the distributor and principal underwriter for the Fund. Distribution Plans, adopted by Class A and Class C shares, allow the Fund to pay the Distributor for expenses and services associated with the distribution of shares. The expenses paid may not exceed .50% and 1.00% annually of the Fund’s average daily net assets of Class A and Class C, respectively. The amount actually paid by the Fund is an annualized fee, payable monthly of .25% and 1.00% of the Fund’s average daily net assets of Class A and Class C, respectively. Class I and Y shares do not have Distribution Plan expenses.
The Distributor received $69,408 as its portion of the commissions charged on sales of the Fund’s Class A shares for the six months ended March 31, 2011.
Calvert Shareholder Services, Inc. (“CSSI”), an affiliate of the Advisor, is the shareholder servicing agent for the Fund. For its services, CSSI received a fee of $383,241 for the six months ended March 31, 2011. Boston Financial Data Services, Inc. is the transfer and dividend disbursing agent.
Each Trustee of the Fund who is not an employee of the Advisor or its affiliates receives an annual fee of $45,000 plus up to $2,000 for each Board and Committee meeting attended. The Board chair and Committee chairs each receive an additional $5,000 annual retainer. Trustee’s fees are allocated to each of the funds served.
NOTE C — INVESTMENT ACTIVITY
During the period, the cost of purchases and proceeds from sales of investments, other than short-term and U.S. government securities, were $1,931,965,601 and $1,576,678,009, respectively. U.S. government security purchases and sales were $1,850,314,053 and $1,844,149,809, respectively.
The Fund intends to elect to defer net capital losses of $6,599,090 incurred from November 1, 2009 through September 30, 2010 and treat them as arising in the fiscal year ending September 30, 2011.
www. calvert.com CALVERT SHORT DURATION INCOME FUND SEMI-ANNUAL REPORT (UNAUDITED) 38
As of March 31, 2011, the tax basis components of unrealized appreciation/ (depreciation) and the federal tax cost were as follows:
| Unrealized appreciation | $ | 85,628,307 | |
| Unrealized (depreciation) | | (32,043,691 | ) |
| Net unrealized appreciation/(depreciation) | $ | 53,584,616 | |
| Federal income tax cost of investments | $ | 3,143,543,213 | |
The Fund may sell or purchase securities to and from other funds managed by the Advisor, typically short-term variable rate demand notes. Interportfolio transactions are primarily used for cash management purposes. Interportfolio transactions are made pursuant to Rule 17a-7 of the Investment Company Act of 1940. For the six months ended March 31, 2011, such purchase and sales transactions were $223,486,992 and $215,005,000, respectively.
NOTE D — LINE OF CREDIT
A financing agreement is in place with all Calvert Group Funds and State Street Corporation (“SSC”). Under the agreement, SSC provides an unsecured line of credit facility, in the aggregate amount of $50 million ($25 million committed and $25 million uncommitted), accessible by the Funds for temporary or emergency purposes only. Borrowings under this committed facility bear interest at the higher of the London Interbank Offered Rate, (LIBOR) or the overnight Federal Funds Rate plus 1.25% per annum. A commitment fee of .125% per annum is incurred on the unused portion of the committed facility, which is allocated to all participating funds. The Fund had no loans outstanding pursuant to this line of credit at March 31, 2011. For the six months ended March 31, 2011, borrowings by the Fund under the Agreement were as follows:
| | WEIGHTED | | MONTH OF |
| AVERAGE | AVERAGE | MAXIMUM | MAXIMUM |
| DAILY | INTEREST | AMOUNT | AMOUNT |
| BALANCE | RATE | BORROWED | BORROWED |
| $580,815 | 1.51% | $20,220,062 | January 2011 |
NOTE E — SUBSEQUENT EVENTSIn preparing the financial statements as of March 31, 2011, no subsequent events or transactions occurred that would have materially impacted the financial statements as presented.
www. calvert.com CALVERT SHORT DURATION INCOME FUND SEMI-ANNUAL REPORT (UNAUDITED) 39
Effective April 30, 2011, the Calvert operating companies will be renamed as follows: Calvert Group, Ltd. will be renamed Calvert Investments, Inc., Calvert Asset Management Company, Inc. will be renamed Calvert Investment Management, Inc., Calvert Distributors, Inc. will be renamed Calvert Investment Distributors, Inc., Calvert Administrative Services Company will be renamed Calvert Investment Administrative Services, Inc., and Calvert Shareholder Services, Inc. will be renamed Calvert Investment Services, Inc.
www. calvert.com CALVERT SHORT DURATION INCOME FUND SEMI-ANNUAL REPORT (UNAUDITED) 40
| | | | | | | | | |
| FINANCIAL HIGHLIGHTS |
| |
| | | | | | Periods ended | | | | |
| | | MARCH
31, | | | SEPTEMBER 30, | | | SEPTEMBER 30, | |
| class A shares | | 2011 | | | 2010 | | | 2009 | (z) |
| Net asset value, beginning | $ | 16.64 | | $ | 16.48 | | $ | 15.70 | |
| Income from investment operations: | | | | | | | | | |
| Net investment income | | .19 | | | .42 | | | .52 | |
| Net realized and unrealized gain (loss) | | (.02 | ) | | .37 | | | .88 | |
| Total from investment operations | | .17 | | | .79 | | | 1.40 | |
| Distributions from: | | | | | | | | | |
| Net investment income | | (.20 | ) | | (.40 | ) | | (.49 | ) |
| Net realized gain | | (.12 | ) | | (.23 | ) | | (.13 | ) |
| Total distributions | | (.32 | ) | | (.63 | ) | | (.62 | ) |
| Total increase (decrease) in net asset value | | (.15 | ) | | .16 | | | .78 | |
| Net asset value, ending | $ | 16.49 | | $ | 16.64 | | $ | 16.48 | |
| |
| Total return* | | 1.02 | % | | 4.90 | % | | 9.27 | % |
| Ratios to average net assets: A | | | | | | | | | |
| Net investment income | | 2.27 | % (a) | | 2.53 | % | | 3.34 | % |
| Total expenses | | 1.15 | % (a) | | 1.14 | % | | 1.19 | % |
| Expenses before offsets | | 1.08 | % (a) | | 1.08 | % | | 1.09 | % |
| Net expenses | | 1.08 | % (a) | | 1.08 | % | | 1.08 | % |
| Portfolio turnover | | 124 | % | | 226 | % | | 359 | % |
| Net assets, ending (in thousands) | $ | 1,838,351 | | $ | 2,002,449 | | $ | 1,758,619 | |
| |
| |
| | | | | | Years ended | | | | |
| | | SEPTEMBER 30, | | | SEPTEMBER 30, | | | SEPTEMBER 30, | |
| class A shares | | 2008 | (z) | | 2007 | (z) | | 2006 | (z) |
| Net asset value, beginning | $ | 16.17 | | $ | 16.11 | | $ | 16.13 | |
| Income from investment operations: | | | | | | | | | |
| Net investment income | | .71 | | | .73 | | | .65 | |
| Net realized and unrealized gain (loss) | | (.36 | ) | | .13 | | | .11 | |
| Total from investment operations | | .35 | | | .86 | | | .76 | |
| Distributions from: | | | | | | | | | |
| Net investment income | | (.70 | ) | | (.71 | ) | | (.64 | ) |
| Net realized gain | | (.12 | ) | | (.09 | ) | | (.14 | ) |
| Total distributions | | (.82 | ) | | (.80 | ) | | (.78 | ) |
| Total increase (decrease) in net asset value | | (.47 | ) | | .06 | | | (.02 | ) |
| Net asset value, ending | $ | 15.70 | | $ | 16.17 | | $ | 16.11 | |
| |
| Total return* | | 2.13 | % | | 5.47 | % | | 4.86 | % |
| Ratios to average net assets: A | | | | | | | | | |
| Net investment income | | 4.47 | % | | 4.54 | % | | 4.12 | % |
| Total expenses | | 1.17 | % | | 1.22 | % | | 1.19 | % |
| Expenses before offsets | | 1.08 | % | | 1.09 | % | | 1.09 | % |
| Net expenses | | 1.08 | % | | 1.08 | % | | 1.08 | % |
| Portfolio turnover | | 495 | % | | 533 | % | | 524 | % |
| Net assets, ending (in thousands) | $ | 1,284,673 | | $ | 604,790 | | $ | 390,947 | |
See notes to financial highlights.
www. calvert.com CALVERT SHORT DURATION INCOME FUND SEMI-ANNUAL REPORT (UNAUDITED) 41
| | | | | | | | | |
| FINANCIAL HIGHLIGHTS |
| |
| | | | | | Periods ended | | | | |
| | | MARCH
31, | | | SEPTEMBER 30, | | | SEPTEMBER 30, | |
| class c shares | | 2011 | | | 2010 | | | 2009 | (z) |
| Net asset value, beginning | $ | 16.58 | | $ | 16.41 | | $ | 15.64 | |
| Income from investment operations: | | | | | | | | | |
| Net investment income | | .13 | | | .29 | | | .39 | |
| Net realized and unrealized gain (loss) | | (.03 | ) | | .38 | | | .88 | |
| Total from investment operations | | .10 | | | .67 | | | 1.27 | |
| Distributions from: | | | | | | | | | |
| Net investment income | | (.14 | ) | | (.27 | ) | | (.37 | ) |
| Net realized gain | | (.12 | ) | | (.23 | ) | | (.13 | ) |
| Total distributions | | (.26 | ) | | (.50 | ) | | (.50 | ) |
| Total increase (decrease) in net asset value | | (.16 | ) | | .17 | | | .77 | |
| Net asset value, ending | $ | 16.42 | | $ | 16.58 | | $ | 16.41 | |
| Total return* | | .59 | % | | 4.18 | % | | 8.37 | % |
| Ratios to average net assets: A | | | | | | | | | |
| Net investment income | | 1.55 | % (a) | | 1.79 | % | | 2.51 | % |
| Total expenses | | 1.80 | % (a) | | 1.80 | % | | 1.86 | % |
| Expenses before offsets | | 1.80 | % (a) | | 1.80 | % | | 1.86 | % |
| Net expenses | | 1.80 | % (a) | | 1.80 | % | | 1.85 | % |
| Portfolio turnover | | 124 | % | | 226 | % | | 359 | % |
| Net assets, ending (in thousands) | $ | 329,210 | | $ | 337,866 | | $ | 219,342 | |
| |
| |
| | | | | | Years ended | | | | |
| | | SEPTEMBER
30, | | | SEPTEMBER 30, | | | SEPTEMBER 30, | |
| class c shares | | 2008 | (z) | | 2007 | (z) | | 2006 | (z) |
| Net asset value, beginning | $ | 16.11 | | $ | 16.06 | | $ | 16.08 | |
| Income from investment operations: | | | | | | | | | |
| Net investment income | | .58 | | | .59 | | | .52 | |
| Net realized and unrealized gain (loss) | | (.36 | ) | | .13 | | | .11 | |
| Total from investment operations | | .22 | | | .72 | | | .63 | |
| Distributions from: | | | | | | | | | |
| Net investment income | | (.57 | ) | | (.58 | ) | | (.51 | ) |
| Net realized gain | | (.12 | ) | | (.09 | ) | | (.14 | ) |
| Total distributions | | (.69 | ) | | (.67 | ) | | (.65 | ) |
| Total increase (decrease) in net asset value | | (.47 | ) | | .05 | | | (.02 | ) |
| Net asset value, ending | $ | 15.64 | | $ | 16.11 | | $ | 16.06 | |
| |
| Total return* | | 1.35 | % | | 4.59 | % | | 4.05 | % |
| Ratios to average net assets: A | | | | | | | | | |
| Net investment income | | 3.70 | % | | 3.72 | % | | 3.28 | % |
| Total expenses | | 1.88 | % | | 1.90 | % | | 1.92 | % |
| Expenses before offsets | | 1.88 | % | | 1.90 | % | | 1.92 | % |
| Net expenses | | 1.87 | % | | 1.89 | % | | 1.91 | % |
| Portfolio turnover | | 495 | % | | 533 | % | | 524 | % |
| Net assets, ending (in thousands) | $ | 92,235 | | $ | 49,984 | | $ | 39,612 | |
See notes to financial highlights.
www. calvert.com CALVERT SHORT DURATION INCOME FUND SEMI-ANNUAL REPORT (UNAUDITED) 42
| | | | | | | | | |
| FINANCIAL HIGHLIGHTS |
| |
| | | | | | Periods ended | | | | |
| | | MARCH
31, | | | SEPTEMBER 30, | | | SEPTEMBER 30, | |
| class I shares | | 2011 | | | 2010 | | | 2009 | (z) |
| Net asset value, beginning | $ | 16.71 | | $ | 16.53 | | $ | 15.74 | |
| Income from investment operations: | | | | | | | | | |
| Net investment income | | .24 | | | .50 | | | .57 | |
| Net realized and unrealized gain (loss) | | (.03 | ) | | .39 | | | .89 | |
| Total from investment operations | | .21 | | | .89 | | | 1.46 | |
| Distributions from: | | | | | | | | | |
| Net investment income | | (.24 | ) | | (.48 | ) | | (.54 | ) |
| Net realized gain | | (.12 | ) | | (.23 | ) | | (.13 | ) |
| Total distributions | | (.36 | ) | | (.71 | ) | | (.67 | ) |
| Total increase (decrease) in net asset value | | (.15 | ) | | .18 | | | .79 | |
| Net asset value, ending | $ | 16.56 | | $ | 16.71 | | $ | 16.53 | |
| Total return* | | 1.29 | % | | 5.53 | % | | 9.68 | % |
| Ratios to average net assets: A | | | | | | | | | |
| Net investment income | | 2.86 | % (a) | | 3.07 | % | | 3.39 | % |
| Total expenses | | .49 | % (a) | | .51 | % | | .62 | % |
| Expenses before offsets | | .49 | % (a) | | .51 | % | | .62 | % |
| Net expenses | | .49 | % (a) | | .51 | % | | .61 | % |
| Portfolio turnover | | 124 | % | | 226 | % | | 359 | % |
| Net assets, ending (in thousands) | $ | 85,056 | | $ | 59,348 | | $ | 28,045 | |
| |
| |
| | | | | | Periods ended | | | | |
| | | SEPTEMBER 30, | | | SEPTEMBER 30, | | | SEPTEMBER 30, | |
| class I shares | | 2008 | (z) | | 2007 | (z) | | 2006 | (y)(z) |
| Net asset value, beginning | $ | 16.19 | | $ | 16.13 | | $ | 16.04 | |
| Income from investment operations: | | | | | | | | | |
| Net investment income | | .67 | | | .79 | | | .33 | |
| Net realized and unrealized gain (loss) | | (.27 | ) | | .12 | | | .12 | |
| Total from investment operations | | .40 | | | .91 | | | .45 | |
| Distributions from: | | | | | | | | | |
| Net investment income | | (.73 | ) | | (.76 | ) | | (.36 | ) |
| Net realized gain | | (.12 | ) | | (.09 | ) | | — | |
| Total distributions | | (.85 | ) | | (.85 | ) | | (.36 | ) |
| Total increase (decrease) in net asset value | | (.45 | ) | | .06 | | | .09 | |
| Net asset value, ending | $ | 15.74 | | $ | 16.19 | | $ | 16.13 | |
| |
| Total return* | | 2.49 | % | | 5.78 | % | | 2.84 | % |
| Ratios to average net assets: A | | | | | | | | | |
| Net investment income | | 4.58 | % | | 4.91 | % | | 4.73 | % (a) |
| Total expenses | | 2.64 | % | | 6.11 | % | | .63 | % (a) |
| Expenses before offsets | | .75 | % | | .76 | % | | .62 | % (a) |
| Net expenses | | .75 | % | | .75 | % | | .61 | % (a) |
| Portfolio turnover | | 495 | % | | 533 | % | | 209 | % |
| Net assets, ending (in thousands) | $ | 1,503 | | $ | 282 | | $ | 82 | |
See notes to financial highlights.
www. calvert.com CALVERT SHORT DURATION INCOME FUND SEMI-ANNUAL REPORT (UNAUDITED) 43
| | | | | | |
| FINANCIAL HIGHLIGHTS |
| |
| | | Periods ended | |
| | | MARCH 31, | | | SEPTEMBER 30, | |
| class Y shares | | 2011 | | | 2010 | |
| Net asset value, beginning | $ | 16.79 | | $ | 16.59 | |
| Income from investment operations: | | | | | | |
| Net investment income | | .21 | | | .43 | |
| Net realized and unrealized gain (loss29 | | (.03 | ) | | .42 | |
| Total from investment operations | | .18 | | | .85 | |
| Distributions from: | | | | | | |
| Net investment income | | (.22 | ) | | (.42 | ) |
| Net realized gain | | (.12 | ) | | (.23 | ) |
| Total distributions | | (.34 | ) | | (.65 | ) |
| Total increase (decrease) in net asset value | | (.16 | ) | | .20 | |
| Net asset value, ending | $ | 16.63 | | $ | 16.79 | |
| |
| Total return* | | 1.11 | % | | 5.24 | % |
| |
| Ratios to average net assets: A | | | | | | |
| Net investment income | | 2.57 | % (a) | | 2.72 | % |
| Total expenses | | .79 | % (a) | | .80 | % |
| Expenses before offsets | | .79 | % (a) | | .80 | % |
| Net expenses | | .79 | % (a) | | .80 | % |
| Portfolio turnover | | 124 | % | | 226 | % |
| Net assets, ending (in thousands) | $ | 1,058,550 | | $ | 1,062,397 | |
| |
| |
| | | PerIods ended | |
| | | SEPTEMBER 30, | | | SEPTEMBER 30, | |
| class Y shares | | 2009 | (z) | | 2008 | (z)^ |
| Net asset value, beginning | $ | 15.80 | | $ | 16.19 | |
| Income from investment operations: | | | | | | |
| Net investment income | | .50 | | | .31 | |
| Net realized and unrealized gain (loss) | | .92 | | | (.40 | ) |
| Total from investment operations | | 1.42 | | | (.09 | ) |
| Distributions from: | | | | | | |
| Net investment income | | (.50 | ) | | (.30 | ) |
| Net realized gain | | (.13 | ) | | — | |
| Total distributions | | (.63 | ) | | (.30 | ) |
| Total increase (decrease) in net asset value | | .79 | | | (.39 | ) |
| Net asset value, ending | $ | 16.59 | | $ | 15.80 | |
| |
| Total return* | | 9.35 | % | | (.58 | %) |
| |
| Ratios to average net assets: A | | | | | | |
| Net investment income | | 3.14 | % | | 4.00 | % (a) |
| Total expenses | | .88 | % | | 1.13 | % (a) |
| Expenses before offsets | | .88 | % | | .93 | % (a) |
| Net expenses | | .87 | % | | .93 | % (a) |
| Portfolio turnover | | 359 | % | | 215 | % |
| Net assets, ending (in thousands) | $ | 149,126 | | $ | 31,224 | |
See notes to financial highlights.
www. calvert.com CALVERT SHORT DURATION INCOME FUND SEMI-ANNUAL REPORT (UNAUDITED) 44
| A | Total expenses do not reflect amounts reimbursed and/or waived by the Advisor or reductions from expense offset arrangements. Expenses before offsets reflect expenses after reimbursement and/or waiver by the Advisor but prior to reductions from expense offset arrangements. Net expenses are net of all reductions and represent the net expenses paid by the Fund. |
| (a) | Annualized. |
| (y) | Class I resumed upon shareholder investment on April 21, 2006. |
| (z) | Per share figures are calculated using the Average Share Method. |
| * | Total return is not annualized for periods less than one year and does not reflect deduction of any front-end or deferred sales charge. |
| ^ | From February 29, 2008, inception. |
See notes to financial statements.
www.calvert.com CALVERT SHORT DURATION INCOME FUND SEMI-ANNUAL REPORT (UNAUDITED) 45
EXPLANATION OF FINANCIAL TABLES
SCHEDULE OF INVESTMENTS
The Schedule of Investments is a snapshot of all securities held in the fund at their market value, on the last day of the reporting period. Securities are listed by asset type (e.g., common stock, corporate bonds, U.S. government obligations) and may be further broken down into sub-groups and by industry classification.
STATEMENT OF ASSETS AND LIABILITIES
The Statement of Assets and Liabilities is often referred to as the fund’s balance sheet. It lists the value of what the fund owns, is due and owes on the last day of the reporting period. The fund’s assets include the market value of securities owned, cash, receivables for securities sold and shareholder subscriptions, and receivables for dividends and interest payments that have been earned, but not yet received. The fund’s liabilities include payables for securities purchased and shareholder redemptions, and expenses owed but not yet paid. The statement also reports the fund’s net asset value (NAV) per share on the last day of the reporting period. The NAV is calculated by dividing the fund’s net assets (assets minus liabilities) by the number of shares outstanding. This statement is accompanied by a Schedule of Investments. Alternatively, if certain conditions are met, a Statement of Net Assets may be presented in lieu of this statement and the Schedule of Investments.
STATEMENT OF NET ASSETS
The Statement of Net Assets provides a detailed list of the fund’s holdings, including each security’s market value on the last day of the reporting period. The Statement of Net Assets includes a Schedule of Investments. Other assets are added and other liabilities subtracted from the investments total to calculate the fund’s net assets. Finally, net assets are divided by the outstanding shares of the fund to arrive at its share price, or Net Asset Value (NAV) per share.
At the end of the Statement of Net Assets is a table displaying the composition of the fund’s net assets. Paid in Capital is the money invested by shareholders and represents the bulk of net assets. Undistributed Net Investment Income and Accumulated Net Realized Gains usually approximate the amounts the fund had available to distribute to shareholders as of the statement date. Accumulated Realized Losses will appear as negative balances. Unrealized Appreciation (Depreciation) is the difference between the market value of the fund’s investments and their cost, and reflects the gains (losses) that would be realized if the fund were to sell all of its investments at their statement-date values.
STATEMENT OF OPERATIONS
The Statement of Operations summarizes the fund’s investment income earned and expenses incurred in operating the fund. Investment income includes dividends earned from stocks and interest earned from interest-bearing securities in the fund. Expenses incurred in operating the fund include the advisory fee paid to the investment advisor,
www.calvert.com CALVERT SHORT DURATION INCOME FUND SEMI-ANNUAL REPORT (UNAUDITED) 46
administrative services fees, distribution plan expenses (if applicable), transfer agent fees, shareholder servicing expenses, custodial, legal, and audit fees, and the printing and postage expenses related to shareholder reports. Expense offsets (fees paid indirectly) are also shown. Credits earned from offset arrangements are used to reduce the fund’s expenses. This statement also shows net gains (losses) realized on the sale of investments and the increase or decrease in the unrealized appreciation (depreciation) on investments held during the period.
STATEMENT OF CHANGES IN NET ASSETS
The Statement of Changes in Net Assets shows how the fund’s total net assets changed during the two most recent reporting periods. Changes in the fund’s net assets are attributable to investment operations, distributions and capital share transactions.
The Operations section of the report summarizes information detailed in the Statement of Operations. The Distribution section shows the dividend and capital gain distributions made to shareholders. The amounts shown as distributions in this section may not match the net investment income and realized gains amounts shown in the Operations section because distributions are determined on a tax basis and certain investments or transactions may be treated differently for financial statement and tax purposes. The Capital Share Transactions section shows the amount shareholders invested in the fund, either by purchasing shares or by reinvesting distributions, and the amounts redeemed. The corresponding numbers of shares issued, reinvested and redeemed are shown at the end of the report.
FINANCIAL HIGHLIGHTS
The Financial Highlights table provides a per-share breakdown per class of the components that affect the fund’s net asset value for current and past reporting periods. The table provides total return, total distributions, expense ratios, portfolio turnover and net assets for the applicable period. Total return is a measure of a fund’s performance that encompasses all elements of return: dividends, capital gain distributions and changes in net asset value. Total return is the change in value of an investment over a given period, assuming reinvestment of any dividends and capital gain distributions, expressed as a percentage of the initial investment. Total distributions include distributions from net investment income and net realized gains. Long-term gains are earned on securities held in the fund more than one year. Short-term gains, on the sale of securities held less than one year, are treated as ordinary dividend income for tax purposes. The expense ratio is a fund’s cost of doing business, expressed as a percentage of net assets. These expenses directly reduce returns to shareholders. Portfolio turnover measures the trading activity in a fund’s investment portfolio – how often securities are bought and sold by a fund. Portfolio turnover is affected by market conditions, changes in the size of the fund, the nature of the fund’s investments and the investment style of the portfolio manager.
www.calvert.com CALVERT SHORT DURATION INCOME FUND SEMI-ANNUAL REPORT (UNAUDITED) 47
PROXY VOTING
The Proxy Voting Guidelines of the Calvert Funds that the Fund uses to determine how to vote proxies relating to portfolio securities are provided as an Appendix to the Fund’s Statement of Additional Information. The Statement of Additional Information can be obtained free of charge by calling the Fund at 1-800-368-2745, by visiting the Calvert website at www.calvert.com; or by visiting the SEC’s website at www.sec.gov.
Information regarding how the Fund voted proxies relating to portfolio securities during the most recent 12-month period ended June 30 is available on the Fund’s website at www.calvert.com and on the SEC’s website at www.sec.gov.
AVAILABILITY OF QUARTERLY PORTFOLIO HOLDINGS
The Fund files its complete schedule of portfolio holdings with the SEC for the first and third quarters of each fiscal year on Form N-Q. The Fund’s Form N-Q is available on the SEC’s website at www.sec.gov. The Fund’s Form N-Q may be reviewed and copied at the SEC’s Public Reference Room in Washington, DC; information on the operation of the Public Reference Room may be obtained by calling 1-800-SEC-0330.
BASIS FOR BOARD’S APPROVAL OF INVESTMENT ADVISORY CONTRACT
At a meeting held on December 8, 2010, the Board of Trustees, and by a separate vote, the disinterested Trustees, approved the continuance of the Investment Advisory Agreement between The Calvert Fund and the Advisor with respect to the Fund.
In evaluating the Investment Advisory Agreement, the Board considered a variety of information relating to the Fund and the Advisor. The disinterested Trustees reviewed a report prepared by the Advisor regarding various services provided to the Fund by the Advisor and its affiliates. Such report included, among other data, information regarding the Advisor’s personnel and the Advisor’s revenue and cost of providing services to the Fund, and a separate report prepared by an independent third party, which provided a statistical analysis comparing the Fund’s investment performance, expenses, and fees to comparable mutual funds.
The disinterested Trustees were separately represented by independent legal counsel with respect to their consideration of the reapproval of the Investment Advisory Agreement. Prior to voting, the disinterested Trustees reviewed the proposed continuance of the Investment Advisory Agreement with management and also met in private sessions with their counsel at which no representatives of management were present.
In the course of its deliberations regarding the Investment Advisory Agreement, the Board considered the following factors, among others: the nature, extent and quality of the services provided by the Advisor, including the personnel providing such services; the
www.calvert.com CALVERT SHORT DURATION INCOME FUND SEMI-ANNUAL REPORT (UNAUDITED) 48
Advisor’s financial condition; the level and method of computing the Fund’s advisory fee; comparative performance, fee and expense information for the Fund; the profitability of the Calvert Group of Funds to the Advisor and its affiliates; the direct and indirect benefits, if any, derived by the Advisor and its affiliates from their relationship with the Fund; the effect of the Fund’s growth and size on the Fund’s performance and expenses; the affiliated distributor’s process for monitoring sales load breakpoints; the Advisor’s compliance programs and policies; the Advisor’s performance of substantially similar duties for other funds; and any possible conflicts of interest.
In considering the nature, extent and quality of the services provided by the Advisor under the Investment Advisory Agreement, the Board reviewed information provided by the Advisor relating to its operations and personnel, including, among other information, biographical information on the Advisor’s investment, supervisory and professional staff and descriptions of its organizational and management structure. The Board also took into account similar information provided periodically throughout the previous year by the Advisor as well as the Board’s familiarity with management through Board of Trustees’ meetings, discussions and other reports. The Board considered the Advisor’s management style and its performance in employing its investment strategies, as well as its current level of staffing and overall resources. The Advisor’s administrative capabilities, including its ability to supervise the other service providers for the Fund, were also considered. The Board concluded that it was satisfied with the nature, extent and quality of services provided to the Fund by the Advisor under the Investment Advisory Agreement.
In considering the Fund’s performance, the Board noted that it reviewed on a quarterly basis detailed information about the Fund’s performance results, portfolio composition and investment strategies. In addition, the Board took into account overall financial market conditions. The Board also reviewed various comparative data provided to it in connection with its consideration of the renewal of the Investment Advisory Agreement, including, among other information, a comparison of the Fund’s total return with its Lipper index and with that of other mutual funds deemed to be in its peer group by an independent third party in its report. This comparison indicated that the Fund performed below the median of its peer group for the one-year period ended June 30, 2010, and above the median of its peer group for the three- and five-year periods ended June 30, 2010. The data also indicated that the Fund underperformed its Lipper index for the one-year period ended June 30, 2010, and outperformed its Lipper index for the three-and five-year periods ended June 30, 2010. Based upon its review, the Board concluded that the Fund’s performance was satisfactory.
In considering the Fund’s fees and expenses, the Board compared the Fund’s fees and total expense ratio with various comparative data for the funds in its peer group. Among other findings, the data indicated that the Fund’s advisory fee (after taking into account waivers and/or reimbursements) was below the median of its peer group and that total expenses (net of waivers and/or reimbursements) were above the median of its peer group. The Board noted that the allocation of advisory and administrative fees may vary among the Fund’s peer group. The Board took into account the Advisor’s current undertaking to maintain expense limitations for the Fund’s Class A, Class I and Class Y shares. The
www. calvert.com CALVERT SHORT DURATION INCOME FUND SEMI-ANNUAL REPORT (UNAUDITED) 49
Board also noted management’s discussion of the Fund’s expenses and certain factors that affected the level of such expenses. The Board also took into account the reduction in one of the breakpoints in the advisory fee schedule. Based upon its review, the Board determined that the advisory fee was reasonable in view of the quality of services provided by the Advisor and the other factors considered.
The Board reviewed the Advisor’s profitability on a fund-by-fund basis. In reviewing the overall profitability of the advisory fee to the Fund’s Advisor, the Board also considered the fact that affiliates of the Advisor provided shareholder servicing and administrative services to the Fund for which they received compensation. The information considered by the Board included Calvert’s operating profit margin information both before and after tax expenses with respect to the services that the Advisor and its affiliates provided to the Calvert Group of Funds complex. The Board reviewed the profitability of the Advisor’s relationship with the Fund in terms of the total amount of annual advisory fees it received with respect to the Fund and whether the Advisor had the financial wherewithal to continue to provide a high level of services to the Fund. The Board noted that the Advisor had reimbursed expenses of the Fund for some classes. The Board also noted the Advisor’s current undertaking to maintain expense limitations for the Fund’s Class A, Class I and Class Y shares. The Board also considered that the Advisor derived benefits to its reputation and other indirect benefits from its relationship with the Fund. Based upon its review, the Board concluded that the Advisor’s and its affiliates’ level of profitability from their relationship with the Fund was reasonable.
The Board considered the effect of the Fund’s current size and potential growth on its performance and fees. The Board took into account that the Fund’s advisory fee schedule contained breakpoints that would reduce the advisory fee rate on assets above specified levels as the Fund’s assets increased. The Board noted that the Fund was currently realizing economies of scale in its advisory fee. The Board also noted that if the Fund’s assets increased over time, the Fund might realize other economies of scale if assets increased proportionally more than certain other expenses. The Board also took into account the reduction in one of breakpoints in the advisory fee schedule.
In reapproving the Investment Advisory Agreement, the Board, including the disinterested Trustees, did not identify any single factor as controlling, and each Trustee may have attributed different weight to various factors.
CONCLUSIONS
The Board reached the following conclusions regarding the Investment Advisory Agreement, among others: (a) the Advisor has demonstrated that it possesses the capability and resources to perform the duties required of it under the Investment Advisory Agreement; (b) the Advisor maintains appropriate compliance programs; (c) performance of the Fund is satisfactory relative to the performance of funds with similar investment objectives and to relevant indices; (d) the Advisor is likely to execute its investment strategies consistently over time; and (e) the Fund’s advisory fee is reasonable relative to those of similar funds and to the services to be provided by the Advisor. Based on its conclusions, the Board determined that reapproval of the Investment Advisory Agreement would be in the best interests of the Fund and its shareholders.
calvert.com CALVERT SHORT DURATION INCOME FUND SEMI-ANNUAL REPORT (UNAUDITED) 50
To Open an Account
800-368-2748
Yields and Prices
Calvert Information Network
(24 hours, 7 days a week)
800-368-2745
Service for Existing Account
Shareholders: 800-368-2745
Brokers: 800-368-2746
TDD for Hearing Impaired
800-541-1524
Branch Office
4550 Montgomery Avenue
Suite 1000 North
Bethesda, Maryland 20814
Registered, Certified or Overnight Mail
Calvert Investments
c/o BFDS,
330 West 9th Street
Kansas City, MO 64105
Web Site
www.calvert.com
Principal Underwriter
Calvert Investment Distributors, Inc.
4550 Montgomery Avenue
Suite 1000 North
Bethesda, Maryland 20814
| | |
| CALVERT | CALVERT’S | Equity Funds |
| SHORT | FAMILY OF FUNDS | Enhanced Equity Portfolio |
| DURATION | | Equity Portfolio |
| INCOME FUND | Tax-Exempt Money | Large Cap Growth Fund |
| | Market Funds | Large Cap Value Fund |
| | CTFR Money Market Portfolio | Social Index Fund |
| | | Capital Accumulation Fund |
| | Taxable Money Market | International Equity Fund |
| | Funds | Small Cap Fund |
| | First Government Money Market | Global Alternative Energy Fund |
| | Fund | Global Water Fund |
| | Money Market Portfolio | International Opportunities Fund |
| |
| | Municipal Funds | Balanced and Asset |
| | Tax-Free Bond Fund | Allocation Funds |
| | | Balanced Portfolio |
| | Taxable Bond Funds | Conservative Allocation Fund |
| | Bond Portfolio | Moderate Allocation Fund |
| | Income Fund | Aggressive Allocation Fund |
| | Short Duration Income Fund | |
| | Long-Term Income Fund | |
| | Ultra-Short Income Fund | |
| | Government Fund | |
| | High-Yield Bond Fund | |
This report is intended to provide fund information to shareholders. It is not authorized for distribution to prospective investors unless preceded or accompanied by a prospectus.
Note: The information on our website is not incorporated by reference into this report; our website address is included as an inactive textual reference only.
Investors should carefully consider the investment objectives, risks, charges and expenses of the Calvert Funds. This and other important information is contained in the fund’s summary prospectus and prospectus, which can be obtained from your financial professional and should be read carefully before investing. You may also call Calvert at 800/368-2745 or visit www. calvert.com.
INFORMATION REGARDING CALVERT OPERATING COMPANY
NAME CHANGES
Effective on April 30, 2011, the following Calvert operating companies will be renamed as indicated:
| | |
| Current Company Name | Company Name on 4/30/11 | Company Description |
| |
| Calvert Group, Ltd. | Calvert Investments, Inc. | Corporate parent of each |
| | | operating company listed |
| | | below |
| |
| Calvert Asset Management | Calvert Investment | Investment advisor to the |
| Company, Inc. | Management, Inc. | Calvert Funds |
| |
| Calvert Distributors, Inc. | Calvert Investment Distributors, | Principal underwriter |
| | Inc. | and distributor for the |
| | | Calvert Funds |
| |
| Calvert Administrative | Calvert Investment | Administrative services |
| Services Company | Administrative Services, Inc. | provider for the Calvert |
| | | Funds |
| |
| Calvert Shareholder | Calvert Investment Services, | Shareholder servicing |
| Services, Inc. | Inc. | provider for the Calvert |
| | | Funds |
Choose Planet-friendly E-delivery!
Sign up now for on-line statements, prospectuses, and fund reports. In less than five minutes you can help reduce paper mail and lower fund costs.
Just go to www.calvert.com. If you already have an online account at Calvert, click on My Account, and select the documents you would like to receive via e-mail.
If you’re new to online account access, click on Login/Register to open an online account. Once you’re in, click on the E-delivery sign-up at the bottom of the Account Portfolio page and follow the quick, easy steps. Note: if your shares are not held directly at Calvert but through a brokerage firm, you must contact your broker for electronic delivery options available through their firm.
Dear Shareholder:
The financial markets ended the six-month period on a high note. The Federal Reserve’s announcement in the fall of 2010 of a second round of quantitative easing (QE2) and the extension in December of the Bush-era tax cuts for all income levels helped buoy the markets and pushed Treasury yields higher. The resulting increase in U.S. consumer spending and confidence helped drive a year-end rally.
This calm lasted until new storms arrived in the beginning of 2011. Civil and political unrest in the Middle East and North Africa sent the price of crude soaring and heightened energy security concerns in many countries around the world. In March, the tragic earthquake and tsunami struck Japan. Our sympathies go out to the people of Japan who lost loved ones in this disaster. The earthquake—and its impact on the country’s nuclear reactors—roiled global financial markets. The cumulative effect of these events sparked a brief sell-off in corporate bonds as investors moved into the relative safety of U.S. Treasuries.
Fixed-Income Markets Continue to be Volatile
Investment-grade corporate bonds edged down slightly for the reporting period, with the Barclays Capital U.S. Credit Index returning -0.98%, while high-yield bonds, as measured by the BofA Merrill Lynch U.S. High Yield Master II Index, returned 7.09%. Money-market returns remained flat, reflecting the Fed’s efforts to keep its target interest rate very low.
Corporate bonds continued to benefit from generally strong corporate earnings and lower default expectations during the fourth quarter of 2010. This trend continued during the first quarter of 2011 as investors became more comfortable moving into riskier asset classes to chase yield. However, most fixed-income sectors experienced significant volatility as investors reacted to the turmoil in the Middle East and the ensuing climb in oil prices as well as the disaster in Japan—which prompted some investors to move back into the relative safety of Treasuries as noted above.
Municipal bond returns suffered greatly in the final months of 2010 due to heavy municipal debt issuance, record municipal bond fund redemptions by retail investors, and fear of massive municipal debt defaults, which appears to be unfounded. Fortunately, prices steadied after the turn of the year due to slowing investor outflows and minimal new debt issuance.
Opportunities and Challenges Ahead
Overall, we are optimistic and expect a slow, gradual economic recovery to continue, which we believe should help sustain a corporate bond rally through the remainder of 2011. A low core inflation rate (which excludes food and energy prices) will likely facilitate economic growth, while continued debt reduction, lingering high unemployment, and a struggling housing market will limit gains. Energy prices will remain a challenge until we see more resolution of the events in the Middle East and North Africa. Of course, more geopolitical
www.calvert.com CALVERT LONG-TERM INCOME FUND SEMI-ANNUAL REPORT (UNAUDITED) 4
crises, rising commodity prices, and inflation spikes could certainly dampen the markets.
In short, we believe the markets, the global economy, and your Calvert funds can successfully navigate through any temporary setbacks.
Discuss Your Portfolio Allocations with Your Advisor
Given the market shifts we have experienced, your overall portfolio asset allocation and investment strategy may no longer match your needs. Therefore, we recommend reviewing these with your financial advisor to ensure that your target mix of U.S. and international stocks, bonds, and cash is well-diversified and appropriate given your financial goals, time horizon, and risk tolerance.
We encourage you to visit our website, www.calvert.com, for fund information and updates as well as market and economic commentary from Calvert professionals.
As noted elsewhere in this report, the Calvert operating companies that provide services to the funds will change their names effective April 30, 2011. As part of the changes, Calvert Group, Ltd. will be known as Calvert Investments, Inc., and the funds’ advisor, Calvert Asset Management Company, Inc., will be known as Calvert Investment Management, Inc.
As always, we appreciate your investing with Calvert.

Barbara J. Krumsiek
President and CEO
Calvert Investments, Inc.
April 2011
www.calvert.com CALVERT LONG-TERM INCOME FUND SEMI-ANNUAL REPORT (UNAUDITED) 5
www.calvert.com CALVERT LONG-TERM INCOME FUND SEMI-ANNUAL REPORT (UNAUDITED) 6
fairly quiet trading range. In the next phase, from early to mid-February, yields rose as the unemployment rate fell sharply, boosting confidence in the economy and triggering a rally in stocks. The 10-year Treasury yield peaked at 3.74%.
In the final phase, yields started to fall as turmoil in the Middle East pushed up the price of oil and raised doubts about the strength of the young economic expansion. Volatility increased in global financial markets. Doubt, uncertainty, and volatility jumped after the terrible March 11 earthquake and tsunami in Japan. Treasury yields continued to fall, with the 10-year yield bottoming at 3.14% a few days after the disaster. After the shock wore off, stocks regained their footing and Treasury yields retraced some of the drop with the 10-year yield ending the reporting period near 3.5%, which was close to the middle of the range over the reporting period.1 During the reporting period, we estimate that the U.S. economy grew at an annual rate of 3.3%,2 very near the 50-year average pace, but below that seen at a similar point in the business cycle after prior deep recessions in the post-WWII era. The core consumer price inflation (CPI) rate increased from 0.6% to 1.1%,3 so the Fed’s concern about unwanted disinflation abated. While the inflation rate was trending up, the level of both core and headline inflation rates remained below long-run averages. Market expectations for inflation in coming years increased to a level more in line with long-term averages.
Portfolio Strategy
The Fund benefitted from higher interest rates across the yield curve. The yields on two- and 10-year Treasuries increased by 35 and 91 basis points, respectively, over the six-month reporting period. The Fund’s allocation to high-yield bonds also helped relative performance. At the start of the reporting period, 14.89% of the Fund was allocated to high-yield bonds. Over the reporting period, the Barclays U.S. Corporate High Yield Index returned 7.23%, while the more broadly based Barclays Capital U.S. Credit Index returned -0.98%.
The Fund employed a yield-curve-flattening strategy. This had a mixed effect as some portions of the yield curve narrowed while others widened. The Fund was positioned to benefit from a narrowing of the yield differential between the 10- and 30-year U.S. Treasuries, which helped performance, as this section of the yield curve narrowed from 160 basis points to 104 basis points. However, the Fund also was positioned to benefit from narrowing of the yield differential between two- and 10-year Treasuries. This section of the yield curve widened from 209 to 265 basis points during the reporting period, which hurt performance. The Fund uses Treasury futures to hedge its interest rate position.
Outlook
The U.S. economy continues to recover from severe financial crisis. Deleveraging in household and financial sectors continues, suggesting moderate, not heated, growth and consumer price inflation. Monetary policy should remain easy in coming quarters as federal, state, and local fiscal stimuli continue to recede or contract. The impact from the long stretch of extraordinarily easy Fed policy, with its near-zero percent short-
www.calvert.com CALVERT LONG-TERM INCOME FUND SEMI-ANNUAL REPORT (UNAUDITED) 7
GROWTH OF $10,000
The graph below shows the value of a hypothetical $10,000 investment in the fund over the past 10 fiscal year periods or since inception (for funds without 10-year records). The results shown reflect the deduction of the maximum front-end sales charge of 3.75% and assume the reinvestment of dividends. The result is compared with benchmarks that include a broad based market index and a Lipper peer group average. Market indexes are unmanaged and their results do not reflect the effect of expenses or sales charges. The Lipper average reflects the deduction of the category’s average front-end sales charge. The value of an investment in a different share class would be different.
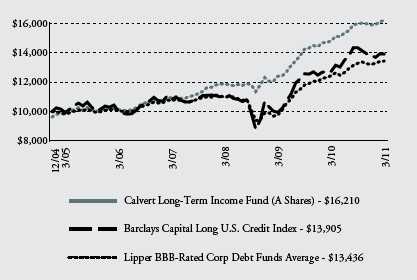
All performance data shown, including the graph above and the adjacent table, represents past performance, does not guarantee future results, assumes reinvestment of dividends and distributions and does not reflect the deduction of taxes that a shareholder would pay on the Fund’s/Portfolio’s distributions or the redemption of the Fund/Portfolio shares. The investment return and principal value of an investment will fluctuate so that an investor’s shares, when redeemed, may be worth more or less than their original cost. Current performance may be lower or higher than the performance data quoted; for current performance data visit www.calvert.com. The gross expense ratio from the current prospectus for Class A shares is 1.40%. This number may differ from the expense ratio shown elsewhere in this report because it is based on a different time period and, if applicable, does not include fee or expense waivers. Performance data quoted already reflects the deduction of the Fund’s/Portfolio’s operating expenses.
www.calvert.com CALVERT LONG-TERM INCOME FUND SEMI-ANNUAL REPORT (UNAUDITED) 8
| |
CALVERT LONG-TERM
INCOME FUND
MARCH 31, 2011 |
| AVERAGE ANNUAL TOTAL RETURNS |
| | |
| class A | (wIth Max. load) |
| One year | 5.32% |
| Five year | 9.00% |
| Since inception (12/31/2004) | 8.04% |
term interest rates and government bond purchases, is clear in the higher prices of stocks, bonds, and commodities, but not in consumer price indices.
Once again, events external to the United States created more uncertainty about the outlook for U.S. growth, inflation, and monetary policy. In addition to geopolitical tensions in the Middle East and natural
disaster in Japan, deepening eurozone debt troubles have put Portugal on the brink of a bailout from the European Union/ International Monetary Fund rescue facility. If the country does require a financial rescue package, Portugal would become the third eurozone member to receive a bailout. The rescue facility can accommodate Greece, Ireland, and Portugal but a debt crisis in Spain would disrupt financial markets worldwide. The Spanish government’s interest rates, while elevated, are not near crisis levels. Spain will remain under pressure, however, and has the potential to unnerve investors from time to time.
Despite increased uncertainty in recent months, we expect the Fed to conclude its Treasury purchases by the end of June. This would complete the easing cycle and, apart from some minor operations, move the Fed to the sidelines for the remainder of the year. There are monetary policy scenarios that could move bond yields quite sharply, including the small chance that the Fed will tighten faster than expected if core inflation increases rapidly. In addition, in light of the recent international turmoil, there also is a chance—perhaps small—that the Fed will ease yet again if the economy weakens later this year. In uncertain times, we expect market volatility to erupt from time to time.
April 2011
| 1 | Interest rate data sources: Chicago Board Options Exchange and Federal Reserve |
| 2 | According to Bureau of Economic Analysis data and forecasts from the Wall Street Journal Survey of Professional Forecasters |
| 3 | Latest data as of February 2011 from the Bureau of Labor Statistics |
www.calvert.com CALVERT LONG-TERM INCOME FUND SEMI-ANNUAL REPORT (UNAUDITED) 9
SHAREHOLDER EXPENSE EXAMPLE
As a shareholder of the Fund, you incur two types of costs: (1) transaction costs, including sales charges (loads) and redemption fees and (2) ongoing costs, including management fees; distribution (12b-1) fees; and other Fund expenses. This Example is intended to help you understand your ongoing costs (in dollars) of investing in the Fund and to compare these costs with the ongoing costs of investing in other mutual funds.
This Example is based on an investment of $1,000 invested at the beginning of the period and held for the entire period (October 1, 2010 to March 31, 2011).
Actual Expenses
The first line of the table below provides information about actual account values and actual expenses. You may use the information in this line, together with the amount you invested, to estimate the expenses that you paid over the period. Simply divide your account value by $1,000 (for example, an $8,600 account value divided by $1,000 = 8.6), then multiply the result by the number in the first line under the heading entitled “Expenses Paid During Period” to estimate the expenses you paid on your account during this period.
Hypothetical Example for Comparison Purposes
The second line of the table below provides information about hypothetical account values and hypothetical expenses based on the Fund’s actual expense ratio and an assumed rate of return of 5% per year before expenses, which is not the Fund’s actual return. The hypothetical account values and expenses may not be used to estimate the actual ending account balance or expenses you paid for the period. You may use this information to compare the ongoing costs of investing in the Fund and other funds. To do so, compare the 5% hypothetical example with the 5% hypothetical examples that appear in the shareholder reports of the other funds.
Please note that the expenses shown in the table are meant to highlight your ongoing costs only and do not reflect any transactional costs, such as sales charges (loads) or redemption fees. Therefore, the second line of the table is useful in comparing ongoing costs only, and will not help you determine the relative total costs of owning different funds. In addition, if these transactional costs were included, your costs would have been higher.
www.calvert.com CALVERT LONG-TERM INCOME FUND SEMI-ANNUAL REPORT (UNAUDITED) 10
| | | | | | |
| | | BEGINNING | | ENDING ACCOUNT | | EXPENSES PAID |
| | | ACCOUNT VALUE | | VALUE | | DURING PERIOD* |
| | | 10/1/10 | | 3/31/11 | | 10/1/10 - 3/31/11 |
| Actual | $ | 1,000.00 | $ | 1,015.00 | $ | 6.28 |
| Hypothetical | $ | 1,000.00 | $ | 1,018.70 | $ | 6.29 |
| (5% return per year before expenses) |
|
* Expenses are equal to the Fund’s annualized expense ratio of 1.25%, multiplied by the average account value over the period, multiplied by 182/365 (to reflect the one-half year period).
www.calvert.com CALVERT LONG-TERM INCOME FUND SEMI-ANNUAL REPORT (UNAUDITED) 11
| | | | |
| SCHEDULE OF INVESTMENTS |
| MARCH 31, 2011 |
| |
| | | PRINCIPAL | | |
| ASSET-BACKED SECURITIES - 1.1% | | AMOUNT | | VALUE |
| AmeriCredit Automobile Receivables Trust: | | | | |
| 2.26%, 5/15/12 | $ | 25,287 | $ | 25,362 |
| 0.31%, 12/6/13 (r) | | 840,041 | | 839,627 |
| CNH Equipment Trust, 2.97%, 3/15/13 | | 61,138 | | 61,196 |
| Fifth Third Auto Trust, 4.81%, 1/15/13 | | 605,921 | | 612,884 |
| |
| Total Asset-Backed Securities (Cost $1,539,081) | | | | 1,539,069 |
| |
| |
| COLLATERIZLIED MORTGAGE-BACKED | | | | |
| OBLIGATIONS (PRIVATELY ORIGINATED) - 0.8% | | | | |
| Countrywide Home Loan Mortgage Pass Through Trust, | | | | |
| 0.59%, 6/25/35 (e)(r) | | 115,472 | | 85,683 |
| CS First Boston Mortgage Securities Corp., 5.25%, 12/25/35 | | 106,835 | | 106,365 |
| Impac CMB Trust, 0.79%, 5/25/35 (r) | | 133,214 | | 104,141 |
| JP Morgan Mortgage Trust, 5.279%, 7/25/35 (r) | | 89,969 | | 87,679 |
| Structured Asset Securities Corp., 5.50%, 6/25/35 | | 1,000,000 | | 752,195 |
| |
| Total Collateralized Mortgage-Backed Obligations | | | | |
| (Privately Originated) (Cost $766,572) | | | | 1,136,063 |
| |
| |
| COMMERCIAL MORTGAGE-BACKED SECURITIES - 4.0% | | | | |
| Banc of America Commercial Mortgage, Inc., | | | | |
| 4.161%, 12/10/42 | | 314,045 | | 314,021 |
| GMAC Commercial Mortgage Securities, Inc., 6.278%, 11/15/39 | | 877,247 | | 891,057 |
| JP Morgan Chase Commercial Mortgage Securities Corp.: | | | | |
| 6.162%, 5/12/34 | | 1,000,000 | | 1,030,274 |
| 5.857%, 10/12/35 | | 2,051,929 | | 2,058,421 |
| 5.299%, 6/12/41 (r) | | 716,127 | | 733,023 |
| Morgan Stanley Dean Witter Capital I, 5.98%, 1/15/39 | | 187,804 | | 195,169 |
| Prudential Mortgage Capital Funding LLC, 6.605%, 5/10/34 | | 342,018 | | 342,086 |
| Wachovia Bank Commercial Mortgage Trust, 5.23%, 7/15/41 (r). | | 200,000 | | 202,531 |
| |
| Total Commercial Mortgage-Backed Securities (Cost $5,836,976) | | | | 5,766,582 |
| |
| CORPORATE BONDS - 64.4% | | | | |
| Alcoa, Inc., 6.15%, 8/15/20 | | 1,000,000 | | 1,057,353 |
| Alliance Mortgage Investments, 12.61%, 6/1/10 (b)(r)(x)* | | 4,817 | | - |
| American Airlines Equipment Trust 1990, 10.62%, 9/4/11 | | 1,000,000 | | 1,002,500 |
| American Airlines Pass Through Trust: | | | | |
| Series 2001-2, Class A, 7.858%, 4/1/13 | | 500,000 | | 513,125 |
| Series 2001-2, Class B, 8.608%, 10/1/12 | | 1,500,000 | | 1,500,000 |
| American Express Bank FSB, 0.406%, 6/12/12 (r) | | 1,000,000 | | 997,241 |
| American Tower Corp., 4.50%, 1/15/18 | | 1,000,000 | | 979,848 |
| ANZ National International Ltd., 1.309%, 12/20/13 (e)(r) | | 1,000,000 | | 1,000,011 |
| APL Ltd., 8.00%, 1/15/24 (b) | | 1,230,000 | | 1,105,229 |
www.calvert.com CALVERT LONG-TERM INCOME FUND SEMI-ANNUAL REPORT (UNAUDITED) 12
| | | | |
| | | PRINCIPAL | | |
| CORPORATE BONDS - CONT’D | | AMOUNT | | VALUE |
| ArcelorMittal, 5.50%, 3/1/21 | $ | 1,000,000 | $ | 983,378 |
| Asciano Finance Ltd., 4.625%, 9/23/20 (e) | | 1,930,000 | | 1,767,636 |
| Asian Development Bank, 6.22%, 8/15/27 | | 30,000 | | 33,802 |
| Atlantic Marine Corp. Communities LLC: | | | | |
| 5.343%, 12/1/50 (b)(e) | | 625,000 | | 536,613 |
| 6.158%, 12/1/51 (e) | | 60,000 | | 55,533 |
| Atlantic Mutual Insurance Co., 8.15%, 2/15/28 (b)(e)(p)* | | 30,000 | | - |
| Bank of America Corp., 5.875%, 1/5/21 | | 1,000,000 | | 1,041,545 |
| BankAmerica Capital III, 0.873%, 1/15/27 (r) | | 975,000 | | 749,212 |
| Barclays Bank plc, 2.50%, 9/21/15 (e) | | 500,000 | | 485,946 |
| Bemis Co., Inc., 6.80%, 8/1/19 | | 500,000 | | 567,842 |
| BNSF Funding Trust I, 6.613% to 1/15/26, | | | | |
| floating rate thereafter to 12/15/55 (r) | | 1,500,000 | | 1,558,125 |
| Cantor Fitzgerald LP, 7.875%, 10/15/19 (e) | | 1,250,000 | | 1,279,754 |
| Cellco Partnership, 2.914%, 5/20/11 (r) | | 500,000 | | 501,535 |
| Chase Capital II, 0.804%, 2/1/27 (r) | | 500,000 | | 420,042 |
| Chase Capital VI, 0.929%, 8/1/28 (r) | | 500,000 | | 421,875 |
| Citigroup Funding, Inc., 0.353%, 7/12/12 (r) | | 500,000 | | 500,346 |
| Citigroup, Inc., 2.312%, 8/13/13 (r) | | 1,000,000 | | 1,029,491 |
| Cliffs Natural Resources, Inc., 4.875%, 4/1/21 | | 1,000,000 | | 986,245 |
| Comcast Corp.: | | | | |
| 5.90%, 3/15/16 | | 1,000,000 | | 1,111,163 |
| 6.55%, 7/1/39 | | 750,000 | | 774,489 |
| Corn Products International, Inc., 6.625%, 4/15/37 | | 1,000,000 | | 1,038,659 |
| Credit Suisse USA, Inc., 0.514%, 8/16/11 (r) | | 500,000 | | 500,172 |
| Crown Castle Towers LLC, 4.883%, 8/15/20 (e) | | 1,000,000 | | 998,750 |
| CVS Pass-Through Trust: | | | | |
| 5.88%, 1/10/28 | | 339,666 | | 342,326 |
| 6.036%, 12/10/28 | | 688,213 | | 718,368 |
| 6.943%, 1/10/30 | | 465,980 | | 507,527 |
| 7.507%, 1/10/32 (e) | | 979,326 | | 1,123,228 |
| Deutsche Bank Capital Funding Trust VII, 5.628% to 1/19/16, | | | | |
| floating rate thereafter to 1/29/49 (e)(r) | | 1,000,000 | | 910,000 |
| Developers Diversified Realty Corp., 4.75%, 4/15/18 | | 1,000,000 | | 975,000 |
| Discover Bank: | | | | |
| 8.70%, 11/18/19 | | 500,000 | | 597,156 |
| 7.00%, 4/15/20 | | 500,000 | | 550,493 |
| Dominion Resources, Inc., 6.30% to 9/30/11, | | | | |
| floating rate thereafter to 9/30/66 (r) | | 1,000,000 | | 987,500 |
| Enterprise Products Operating LLC, 7.034% to 1/15/18, | | | | |
| floating rate thereafter to 1/15/68 (r) | | 840,000 | | 871,500 |
| Fifth Third Bank, 0.424%, 5/17/13 (r) | | 400,000 | | 392,227 |
| First Niagara Financial Group, Inc., 6.75%, 3/19/20 | | 1,000,000 | | 1,076,326 |
| Fleet Capital Trust V, 1.309%, 12/18/28 (r) | | 1,000,000 | | 761,094 |
| Ford Motor Credit Co. LLC: | | | | |
| 5.56%, 6/15/11 (r) | | 1,000,000 | | 1,002,500 |
| 3.053%, 1/13/12 (r) | | 1,200,000 | | 1,210,512 |
| 8.00%, 12/15/16 | | 500,000 | | 565,000 |
| 5.75%, 2/1/21 | | 1,500,000 | | 1,473,750 |
| Fort Knox Military Housing, 5.915%, 2/15/52 (b)(e) | | 130,000 | | 114,620 |
www.calvert.com CALVERT LONG-TERM INCOME FUND SEMI-ANNUAL REPORT (UNAUDITED) 13
| | | | | |
| | | | PRINCIPAL | | |
| CORPORATE BONDS - CONT’D | | | AMOUNT | | VALUE |
| Glitnir Banki HF: | | | | | |
| 3.046%, 4/20/10 (e)(r)(y)* | | $ | 75,000 | $ | 22,875 |
| 6.693% to 6/15/11, floating rate thereafter to | | | | | |
| 6/15/16 (b) (e)(r)(y)* | | | 150,000 | | 1,500 |
| Goldman Sachs Group, Inc.: | | | | | |
| 6.15%, 4/1/18 | | | 1,000,000 | | 1,081,096 |
| 6.75%, 10/1/37 | | | 980,000 | | 977,573 |
| Greif, Inc., 6.75%, 2/1/17 | | | 500,000 | | 530,000 |
| Hertz Corp., 6.75%, 4/15/19 (e) | | | 1,000,000 | | 990,000 |
| Home Depot, Inc., 5.95%, 4/1/41 | | | 1,000,000 | | 995,807 |
| Hyundai Motor Manufacturing, 4.50%, 4/15/15 (e) | | | 1,000,000 | | 1,024,740 |
| International Lease Finance Corp., 7.125%, 9/1/18 (e) | | | 1,250,000 | | 1,340,625 |
| Irwin Land LLC: | | | | | |
| 5.03%, 12/15/25 (e) | | | 758,000 | | 742,817 |
| 5.30%, 12/15/35 (e) | | | 100,000 | | 87,097 |
| 5.40%, 12/15/47 (e) | | | 125,000 | | 99,025 |
| Jones Group, Inc., 6.875%, 3/15/19 | | | 1,000,000 | | 982,500 |
| JPMorgan Chase & Co., 0.559%, 12/26/12 (r) | | | 500,000 | | 502,453 |
| JPMorgan Chase Capital XXIII, 1.313%, 5/15/77 (r) | | | 1,500,000 | | 1,241,559 |
| Kinder Morgan Finance Co. LLC, 6.00%, 1/15/18 (e) | | | 1,000,000 | | 1,036,250 |
| Land O’Lakes Capital Trust I, 7.45%, 3/15/28 (e) | | | 2,100,000 | | 1,900,500 |
| LL & P Wind Energy, Inc. Washington Revenue Bonds, | | | | | |
| 6.192%, 12/1/27 (e) | | | 100,000 | | 93,981 |
| Masco Corp., 7.125%, 3/15/20 | | | 1,250,000 | | 1,292,189 |
| Massachusetts Institute of Technology, 7.25%, 11/2/96 | | | 200,000 | | 231,816 |
| McGuire Air Force Base Military Housing Project, 5.611%, | | | | | |
| 9/15/51 (e) | | | 2,075,000 | | 1,761,675 |
| MetLife Institutional Funding II, 0.709%, 3/27/12 (e)(r) | | | 1,000,000 | | 1,000,012 |
| MetLife, Inc., 0.628%, 6/29/12 (r) | | | 300,000 | | 301,015 |
| Metropolitan Life Global Funding I, 2.303%, 4/14/11 (e)(r) | | | 190,000 | | 190,038 |
| Morgan Stanley: | | | | | |
| 0.753%, 10/18/16 (r) | | | 1,000,000 | | 935,258 |
| 6.25%, 8/28/17 | | | 500,000 | | 538,374 |
| 5.50%, 1/26/20 | | | 500,000 | | 501,630 |
| Motors Liquidation Co.: | | | | | |
| 8.25%, 7/15/23 (ii)* | | | 200,000 | | 56,500 |
| 7.40%, 9/1/25 (ii)* | | | 200,000 | | 55,500 |
| 8.375%, 7/15/33 (ii)* | | | 500,000 | | 147,500 |
| National Fuel Gas Co., 6.50%, 4/15/18 | | | 100,000 | | 109,156 |
| NationsBank Cap Trust III, 0.853%, 1/15/27 (r) | | | 65,000 | | 50,106 |
| Nationwide Health Properties, Inc.: | | | | | |
| 6.90%, 10/1/37 | | | 390,000 | | 400,655 |
| 6.59%, 7/7/38 | | | 30,000 | | 31,032 |
| New York University, 5.236%, 7/1/32 | | | 850,000 | | 832,672 |
| Nordea Bank AB, 4.875%, 1/14/21 (e) | | | 1,000,000 | | 1,017,316 |
| Offshore Group Investments Ltd., 11.50%, 8/1/15 | | | 500,000 | | 554,754 |
| Ohana Military Communities LLC: | | | | | |
| 5.675%, 10/1/26 (e) | | | 70,000 | | 70,299 |
| 6.193%, 4/1/49 (b)(e) | | | 195,000 | | 184,380 |
| 5.88%, 10/1/51 (b)(e) | | | 1,500,000 | | 1,305,495 |
| OPTI Canada, Inc., 9.75%, 8/15/13 (e) | | | 1,000,000 | | 998,750 |
| Overseas Shipholding Group, Inc., 7.50%, 2/15/24 | | | 150,000 | | 127,875 |
| Pacific Beacon LLC, 5.628%, 7/15/51 (e) | | | 40,000 | | 29,938 |
www.calvert.com CALVERT LONG-TERM INCOME FUND SEMI-ANNUAL REPORT (UNAUDITED) 14
| | | | |
| | | PRINCIPAL | | |
| CORPORATE BONDS - CONT’D | | AMOUNT | | VALUE |
| Pioneer Natural Resources Co.: | | | | |
| 5.875%, 7/15/16 | $ | 700,000 | $ | 735,000 |
| 7.20%, 1/15/28 | | 600,000 | | 621,000 |
| Potlatch Corp., 7.50%, 11/1/19 | | 500,000 | | 529,375 |
| PPL Montana LLC, 8.903%, 7/2/20 | | 18,219 | | 20,451 |
| Prudential Holdings LLC, 7.245%, 12/18/23 (e) | | 500,000 | | 564,320 |
| Quest Diagnostics, Inc., 4.70%, 4/1/21 | | 1,000,000 | | 984,971 |
| Redstone Arsenal Military Housing, 5.45%, 9/1/26 (e) | | 25,000 | | 23,157 |
| Ryder System, Inc., 3.60%, 3/1/16 | | 1,000,000 | | 1,006,889 |
| Senior Housing Properties Trust, 8.625%, 1/15/12 | | 500,000 | | 523,125 |
| Simon Property Group LP, 10.35%, 4/1/19 | | 320,000 | | 437,937 |
| Skyway Concession Co. LLC, 0.587%, 6/30/17 (e)(r) | | 100,000 | | 91,135 |
| Sunoco, Inc., 6.75%, 4/1/11 | | 143,000 | | 142,994 |
| SunTrust Bank, 0.603%, 8/24/15 (r) | | 975,000 | | 921,040 |
| SunTrust Capital I, 0.983%, 5/15/27 (r) | | 1,000,000 | | 777,740 |
| Svenska Handelsbanken AB, 1.31%, 9/14/12 (e)(r) | | 500,000 | | 504,295 |
| Systems 2001 AT LLC, 6.664%, 9/15/13 (e) | | 729,158 | | 778,376 |
| Telefonica Emisiones SAU, 5.134%, 4/27/20 | | 1,000,000 | | 992,279 |
| Time Warner, Inc., 6.25%, 3/29/41 | | 1,500,000 | | 1,483,933 |
| Toll Road Investors Partnership II LP, Zero Coupon: | | | | |
| 2/15/28 (e) | | 135,000 | | 27,912 |
| 2/15/31 (e) | | 196,000 | | 30,614 |
| 2/15/43 (b)(e) | | 5,950,000 | | 1,569,491 |
| 2/15/45 (b)(e) | | 7,046,377 | | 1,074,361 |
| University of Notre Dame, 4.90%, 3/1/41 | | 1,000,000 | | 951,780 |
| US Bank, 3.778% to 4/29/15, floating rate thereafter | | | | |
| to 4/29/20 (r) | | 2,000,000 | | 2,034,097 |
| Vale Overseas Ltd., 6.875%, 11/10/39 | | 1,500,000 | | 1,601,373 |
| Valmont Industries, Inc., 6.625%, 4/20/20 | | 1,000,000 | | 1,032,418 |
| Verizon Communications, Inc., 6.00%, 4/1/41 | | 2,000,000 | | 1,989,338 |
| Wachovia Capital Trust III, 5.57% to 3/15/11, | | | | |
| floating rate thereafter to 3/29/49 (r) | | 1,700,000 | | 1,559,750 |
| Willis Group Holdings plc, 5.75%, 3/15/21 | | 1,000,000 | | 989,422 |
| Windsor Petroleum Transport Corp., 7.84%, 1/15/21 (e) | | 956,943 | | 866,636 |
| Yara International ASA, 7.875%, 6/11/19 (e) | | 950,000 | | 1,145,562 |
| |
| Total Corporate Bonds (Cost $87,347,039) | | | | 92,061,691 |
| |
| MUNICIPAL OBLIGATIONS - 3.6% | | | | |
| Adams-Friendship Area Wisconsin School District GO | | | | |
| Bonds, 5.47%, 3/1/18 | | 30,000 | | 32,567 |
| Connecticut State Special Tax Obligation Revenue Bonds, | | | | |
| 5.459%, 11/1/30 | | 1,000,000 | | 975,180 |
| Cook County Illinois School District GO Bonds, | | | | |
| Zero Coupon, 12/1/24 | | 25,000 | | 8,540 |
| East Lansing Michigan GO Bonds, 5.00%, 4/1/14 | | 85,000 | | 91,283 |
| Fairfield California PO Revenue Bonds: | | | | |
| 5.22%, 6/1/20 | | 15,000 | | 13,261 |
| 5.34%, 6/1/25 | | 15,000 | | 12,337 |
| Florida State First Governmental Financing Commission | | | | |
| Revenue Bonds, 5.30%, 7/1/19 | | 25,000 | | 25,358 |
www.calvert.com CALVERT LONG-TERM INCOME FUND SEMI-ANNUAL REPORT (UNAUDITED) 15
| | | | |
| | | PRINCIPAL | | |
| MUNICIPAL OBLIGATIONS - CONT’D | | AMOUNT | | VALUE |
| Grant County Washington Public Utility District | | | | |
| No. 2 Revenue Bonds, 5.48%, 1/1/21 | $ | 10,000 | $ | 9,968 |
| Illinois GO Bonds, 5.877%, 3/1/19 | | 1,500,000 | | 1,499,625 |
| Illinois State MFH Development Authority Revenue Bonds, | | | | |
| 6.537%, 1/1/33 | | 70,000 | | 67,455 |
| Jackson & Williamson Counties Illinois Community | | | | |
| High School District GO Bonds, Zero Coupon, 12/1/21 | | 180,000 | | 91,179 |
| Kern County California PO Revenue Bonds, | | | | |
| Zero Coupon, 8/15/20 | | 125,000 | | 61,289 |
| La Mesa California COPs, 6.32%, 8/1/26 | | 30,000 | | 30,663 |
| Lancaster Pennsylvania Parking Authority Revenue Bonds, | | | | |
| 5.95%, 12/1/25 | | 50,000 | | 49,418 |
| Leland Stanford Jr. University California Revenue Bonds, | | | | |
| 6.875%, 2/1/24 | | 100,000 | | 121,526 |
| Linden New Jersey GO Bonds, 5.63%, 4/1/21 | | 60,000 | | 56,368 |
| Metropolitan Washington DC Airport Authority System | | | | |
| Revenue Bonds, 5.69%, 10/1/30 | | 15,000 | | 14,515 |
| Moreno Valley California Public Financing Authority | | | | |
| Revenue Bonds, 5.549%, 5/1/27 | | 50,000 | | 45,408 |
| Nashville & Davidson County Tennessee Water & Sewage | | | | |
| Revenue Bonds, 4.74%, 1/1/15 | | 80,000 | | 82,770 |
| Nevada State Department of Business & Industry Lease | | | | |
| Revenue Bonds, 5.87%, 6/1/27 | | 50,000 | | 35,663 |
| New York City IDA Revenue Bonds, 6.027%, 1/1/46 | | 30,000 | | 22,650 |
| Oakland California PO Revenue Bonds, | | | | |
| Zero Coupon, 12/15/20 | | 120,000 | | 61,866 |
| Oakland California Redevelopment Agency Tax | | | | |
| Allocation Bonds, 5.411%, 9/1/21 | | 30,000 | | 26,695 |
| Orange County California PO Revenue Bonds, | | | | |
| Zero Coupon, 9/1/14 | | 95,000 | | 84,340 |
| Oregon State Local Governments GO Bonds, | | | | |
| Zero Coupon, 6/1/18 | | 100,000 | | 67,009 |
| Oregon State School Boards Association GO Bonds, | | | | |
| Zero Coupon, 6/30/16 | | 25,000 | | 19,599 |
| Philadelphia Pennsylvania IDA Revenue Bonds, | | | | |
| Zero Coupon, 4/15/20 | | 25,000 | | 12,457 |
| Redlands California PO Revenue Bonds, Zero Coupon: | | | | |
| 8/1/27 | | 250,000 | | 68,307 |
| 8/1/28 | | 175,000 | | 43,654 |
| San Bernardino California Joint Powers Financing Authority | | | | |
| Tax Allocation Bonds, 5.625%, 5/1/16 | | 40,000 | | 40,176 |
| San Jose California Redevelopment Agency Tax | | | | |
| Allocation Bonds, 5.10%, 8/1/20 | | 15,000 | | 13,765 |
| Santa Cruz County California Redevelopment Agency | | | | |
| Tax Allocation Bonds, 5.50%, 9/1/20 | | 40,000 | | 37,320 |
| Schenectady New York Metroplex Development Authority | | | | |
| Revenue Bonds, 5.36%, 8/1/16 | | 40,000 | | 42,877 |
| Texas State Transportation Commission Revenue Bonds, | | | | |
| 5.178%, 4/1/30 | | 1,000,000 | | 984,330 |
| Thorp Wisconsin School District GO Bonds, 6.15%, 4/1/26 | | 40,000 | | 41,317 |
| Thousand Oaks California Redevelopment Agency | | | | |
| Tax Allocation Bonds, 5.25%, 12/1/21 | | 50,000 | | 43,769 |
www.calvert.com CALVERT LONG-TERM INCOME FUND SEMI-ANNUAL REPORT (UNAUDITED) 16
| | | | |
| | | PRINCIPAL | | |
| MUNICIPAL OBLIGATIONS - CONT’D | | AMOUNT | | VALUE |
| Utah State Housing Corp. Military Housing Revenue Bonds: | | | | |
| 5.392%, 7/1/50 | $ | 15,000 | $ | 12,869 |
| 5.442%, 7/1/50 | | 10,000 | | 8,641 |
| Wells Fargo Bank NA Custodial Receipts Revenue Bonds: | | | | |
| 6.584%, 9/1/27 (e) | | 100,000 | | 100,131 |
| 6.734%, 9/1/27 (e) | | 100,000 | | 100,181 |
| West Contra Costa California Unified School District COPs, | | | | |
| 5.03%, 1/1/20 | | 15,000 | | 13,798 |
| West Covina California Public Financing Authority Lease | | | | |
| Revenue Bonds, 6.05%, 6/1/26 | | 40,000 | | 34,743 |
| |
| Total Municipal Obligations (Cost $5,335,228) | | | | 5,204,867 |
| |
| |
| U.S. GOVERNMENT AGENCIES AND INSTRUMENTALITIES - 2.7% | | |
| AgFirst FCB, 8.393% to 12/15/11, floating rate | | | | |
| thereafter to 12/15/16 (r) | | 300,000 | | 312,000 |
| Federal Home Loan Bank, 5.00%, 11/17/17 | | 400,000 | | 448,644 |
| Freddie Mac, 5.25%, 4/18/16 | | 700,000 | | 792,628 |
| New Valley Generation V, 4.929%, 1/15/21 | | 33,429 | | 36,336 |
| Premier Aircraft Leasing EXIM 1 Ltd.: | | | | |
| 3.576%, 2/6/22 | | 465,472 | | 464,146 |
| 3.547%, 4/10/22 | | 566,680 | | 564,345 |
| Sterling Equipment, Inc., 6.125%, 9/28/19 | | 379,450 | | 416,173 |
| US AgBank FCB, 6.11% to 7/10/12, floating rate | | | | |
| thereafter to 12/31/49 (e)(r) | | 400,000 | | 268,000 |
| Vessel Management Services, Inc., 5.85%, 5/1/27 | | 472,000 | | 518,062 |
| |
| Total U.S. Government Agencies and Instrumentalities | | | | |
| (Cost $3,589,775) | | | | 3,820,334 |
| |
| |
| U.S. TREASURY - 16.5% | | | | |
| United States Treasury Bonds: | | | | |
| 3.875%, 8/15/40 | | 4,260,000 | | 3,811,369 |
| 4.25%, 11/15/40 | | 2,375,000 | | 2,270,723 |
| 4.75%, 2/15/41 | | 9,240,000 | | 9,603,825 |
| United States Treasury Notes: | | | | |
| 2.125%, 2/29/16 | | 830,000 | | 827,276 |
| 3.625%, 2/15/21 | | 6,935,000 | | 7,034,691 |
| |
| Total U.S. Treasury (Cost $23,511,326) | | | | 23,547,884 |
| |
| FLOATING RATE LOANS(d) - 0.3% | | | | |
| Clear Channel Communications, Inc., Term Loan B, | | | | |
| 3.912%, 1/29/16 (r) | | 500,000 | | 439,653 |
| |
| Total Floating Rate Loans (Cost $463,125) | | | | 439,653 |
www.calvert.com CALVERT LONG-TERM INCOME FUND SEMI-ANNUAL REPORT (UNAUDITED) 17
| | | | | | | |
| EQUITY SECURITIES - 0.9% | | | | SHARES | | VALUE | |
| First Republic Preferred Capital Corp., Preferred (e) | | | 500 | $ | 512,500 | |
| Woodbourne Capital, Trust I, Preferred (b)(e) | | | 1,000,000 | | 700,000 | |
| |
| Total Equity Securities (Cost $825,000) | | | | | | 1,212,500 | |
| |
| |
| TOTAL INVESTMENTS (Cost $129,214,122) - 94.3% | | | | 134,728,643 | |
| Other assets and liabilities, net - 5.7% | | | | | 8,217,771 | |
| net assets - 100% | | | | | $ | 142,946,414 | |
| |
| |
| | | | | UNDERLYING | | UNREALIZED | |
| | # OF | EXPIRATION | | FACE AMOUNT | | APPRECIATION | |
| FUTURES | CONTRACTS | DATE | | AT VALUE | | (DEPRECIATION) | |
| Purchased: | | | | | | | |
| 10 Year U.S. Treasury Notes | 33 | 6/11 | $ | 3,928,031 | $ | 5,995 | |
| Sold: | | | | | | | |
| 2 Year U.S. Treasury Notes | 395 | 6/11 | $ | 86,159,375 | ($ | 31,507 | ) |
| 5 Year U.S. Treasury Notes | 18 | 6/11 | | 2,102,203 | | 11,370 | |
| 30 Year U.S. Treasury Bonds | 26 | 6/11 | | 3,124,875 | | 44,659 | |
| Total Sold | | | | | $ | 24,522 | |
www.calvert.com CALVERT LONG-TERM INCOME FUND SEMI-ANNUAL REPORT (UNAUDITED) 18
| (b) | This security was valued by the Board of Trustees. See Note A. |
| |
| (d) | Remaining maturities of floating rate loans may be less than the stated maturities shown as a result of contrac- tual or optional prepayments by the borrower. Such prepayments cannot be predicted with certainty. Floating rate loans generally pay interest at rates which are periodically re-determined at a margin above the London InterBank Offered Rate (LIBOR) or other short-term rates. The rate shown is the rate in effect at period end. |
| | Floating rate loans are generally considered restrictive in that the Fund is ordinarily contractually obligated to receive consent from the Agent Bank and/or Borrower prior to disposition of a floating rate loan. |
| |
| (e) | Security is exempt from registration under Rule 144A of the Securities Act of 1933. These securities may be resold in transactions exempt from registration, normally to qualified institutional buyers. |
| |
| (p) | The State of New York Insurance Department has prohibited Atlantic Mutual Insurance Co. from making interest payments. This security is no longer accruing interest. |
| |
| (r) | The coupon rate shown on floating or adjustable rate securities represents the rate at period end. |
| |
| (x) | Alliance Bancorp and its affiliates filed for Chapter 7 bankruptcy on July 13, 2007. This security is no longer accruing interest. |
| |
| (y) | The government of Iceland took control of Glitnir Banki HF (the “Bank”) on October 8, 2008. The govern- ment has prohibited the Bank from paying any claims owed to foreign entities. These securities are no longer accruing interest. |
| |
| (ii) | General Motors filed for Chapter 11 bankruptcy on June 1, 2009. This security is no longer accruing interest. Subsequent to period end, the Fund received a distribution of new GM stock and new GM warrants in exchange for the Motors Liquidation Co. Notes. |
| |
| * | Non-income producing security. |
Abbreviations:
COPs: Certificates of Participation
FCB: Farm Credit Bank
FSB: Federal Savings Bank
GO: General Obligation
IDA: Industrial Development Authority
LLC: Limited Liability Corporation
LP: Limited Partnership
MFH: Multi-Family Housing
PO: Pension Obligation
See notes to financial statements.
www.calvert.com CALVERT LONG-TERM INCOME FUND SEMI-ANNUAL REPORT (UNAUDITED) 19
STATEMENT OF ASSETS AND LIABILITIES
MARCH 31, 2011
| | | |
| ASSETS | | | |
| Investments in securities, at value (Cost $129,214,122) - | | | |
| see accompanying schedule | $ | 134,728,643 | |
| Cash | | 7,302,926 | |
| Receivable for securities sold | | 7,341,336 | |
| Receivable for shares sold | | 688,903 | |
| Interest and dividends receivable | | 1,288,059 | |
| Other assets | | 383,280 | |
| Total assets | | 151,733,147 | |
| |
| |
| LIABILITIES | | | |
| Payable for securities purchased | | 8,323,898 | |
| Payable for shares redeemed | | 253,684 | |
| Payable for futures variation margin | | 26,937 | |
| Payable to Calvert Asset Management Company, Inc. | | 82,591 | |
| Payable to Calvert Administrative Services Company | | 33,385 | |
| Payable to Calvert Shareholder Services, Inc. | | 4,607 | |
| Payable to Calvert Distributors, Inc. | | 30,350 | |
| Accrued expenses and other liabilities | | 31,281 | |
| Total liabilities | | 8,786,733 | |
| |
| NET ASSETS | $ | 142,946,414 | |
| |
| |
| NET ASSETS CONSIST OF: | | | |
| Paid-in capital applicable to 8,292,594 shares of | | | |
| beneficial interest, unlimited number of no par value shares authorized | $ | 136,360,871 | |
| Undistributed net investment income (loss) | | (15,735 | ) |
| Accumulated net realized gain (loss) on investments | | 1,056,240 | |
| Net unrealized appreciation (depreciation) on investments | | 5,545,038 | |
| |
| net assets | $ | 142,946,414 | |
| |
| net asset value Per share | $ | 17.24 | |
See notes to financial statements.
www.calvert.com CALVERT LONG-TERM INCOME FUND SEMI-ANNUAL REPORT (UNAUDITED) 20
| | | |
| STATEMENT OF OPERATIONS |
| SIX MONTHS ENDED MARCH 31, 2011 |
| |
| |
| NET INVESTMENT INCOME | | | |
| Investment Income: | | | |
| Interest income | $ | 3,216,592 | |
| Dividend income | | 55,020 | |
| Total investment income | | 3,271,612 | |
| |
| Expenses: | | | |
| Investment advisory fee | | 280,834 | |
| Administrative fees | | 204,900 | |
| Transfer agency fees and expenses | | 195,824 | |
| Distribution Plan expenses | | 175,522 | |
| Trustees’ fees and expenses | | 3,462 | |
| Custodian fees | | 25,843 | |
| Accounting fees | | 11,535 | |
| Registration fees | | 11,407 | |
| Reports to shareholders | | 32,150 | |
| Professional fees | | 10,431 | |
| Miscellaneous | | 5,087 | |
| Total expenses | | 956,995 | |
| Reimbursement from Advisor | | (78,995 | ) |
| Fees paid indirectly | | (392 | ) |
| Net expenses | | 877,608 | |
| |
| |
| NET INVESTMENT INCOME | | 2,394,004 | |
| |
| |
| REALIZED AND UNREALIZED GAIN (LOSS) | | | |
| Net realized gain (loss) on: | | | |
| Investments | | 1,085,219 | |
| Futures | | 49,535 | |
| | | 1,134,754 | |
| |
| Change in unrealized appreciation (depreciation) on: | | | |
| Investments | | (1,822,947 | ) |
| Futures | | 292,371 | |
| | | (1,530,576 | ) |
| |
| |
| NET REALIZED AND UNREALIZED GAIN | | | |
| (LOSS) | | (395,822 | ) |
| |
| INCREASE (DECREASE) IN NET ASSETS | | | |
| RESULTING FROM OPERATIONS | $ | 1,998,182 | |
See notes to financial statements.
www.calvert.com CALVERT LONG-TERM INCOME FUND SEMI-ANNUAL REPORT (UNAUDITED) 21
STATEMENTS OF CHANGES IN NET ASSETS
| | | | | | |
| | | SIX MONTHS ENDED | | | YEAR
ENDED | |
| | | MARCH
31, | | | SEPTEMBER 30, | |
| INCREASE (DECREASE) IN NET ASSETS | | 2011 | | | 2010 | |
| Operations: | | | | | | |
| Net investment income | $ | 2,394,004 | | $ | 3,509,307 | |
| Net realized gain (loss) | | 1,134,754 | | | 6,056,147 | |
| Change in unrealized appreciation (depreciation) | | (1,530,576 | ) | | 2,727,974 | |
| |
| |
| INCREASE (DECREASE) IN NET ASSETS | | | | | | |
| RESULTING FROM OPERATIONS | | 1,998,182 | | | 12,293,428 | |
| |
| Distributions to shareholders from: | | | | | | |
| Net investment income | | (2,417,077 | ) | | (3,410,544 | ) |
| Net realized gain | | (5,562,393 | ) | | (4,288,221 | ) |
| Total distributions | | (7,979,470 | ) | | (7,698,765 | ) |
| |
| Capital share transactions: | | | | | | |
| Shares sold | | 59,249,502 | | | 105,838,274 | |
| Reinvestment of distributions | | 7,065,566 | | | 6,803,821 | |
| Redemption fees | | 10,244 | | | 7,422 | |
| Shares redeemed | | (57,298,122 | ) | | (54,980,406 | ) |
| Total capital share transactions | | 9,027,190 | | | 57,669,111 | |
| |
| TOTAL INCREASE (DECREASE) IN NET ASSETS | | 3,045,902 | | | 62,263,774 | |
| |
| |
| NET ASSETS | | | | | | |
| Beginning of period | | 139,900,512 | | | 77,636,738 | |
| End of period (including distributions in excess of net investment | | | | | | |
| income of $15,735 and undistributed net investment income of | | | | | | |
| $7,338, respectively) | $ | 142,946,414 | | $ | 139,900,512 | |
| |
| |
| CAPITAL SHARE ACTIVITY | | | | | | |
| Shares sold | | 3,390,694 | | | 6,141,535 | |
| Reinvestment of distributions | | 411,816 | | | 401,842 | |
| Shares redeemed | | (3,298,094 | ) | | (3,210,108 | ) |
| Total capital share activity | | 504,416 | | | 3,333,269 | |
See notes to financial statements.
www.calvert.com CALVERT LONG-TERM INCOME FUND SEMI-ANNUAL REPORT (UNAUDITED) 22
NOTES TO FINANCIAL STATEMENTS
NOTE A –– SIGNIFICANT ACCOUNTING POLICIES
General: The Calvert Long-Term Income Fund (the “Fund”), a series of The Calvert Fund, is registered under the Investment Company Act of 1940 as a non-diversified, open-end management investment company. The operations of each series are accounted for separately. The Fund offers Class A shares which are sold with a maximum front-end sales charge of 3.75%.
Security Valuation: Net asset value per share is determined every business day as of the close of the regular session of the New York Stock Exchange (generally 4:00 p.m. Eastern time). The Fund uses independent pricing services approved by the Board of Trustees to value its investments wherever possible. Investments for which market quotations are not available or deemed not reliable are fair valued in good faith under the direction of the Board of Trustees. In determining fair value, the Board considers all relevant qualitative and quantitative information available. These factors are subject to change over time and are reviewed periodically. The values assigned to fair value investments are based on available information and do not necessarily represent amounts that might ultimately be realized. Further, because of the inherent uncertainty of valuation, those estimated values may differ significantly from the values that would have been used had a ready market for the investments existed, and the differences could be material.
At March 31, 2011, securities valued at $6,591,689 or 4.6% of net assets were fair valued in good faith under the direction of the Board of Trustees.
The Fund utilizes various methods to measure the fair value of its investments. Generally Accepted Accounting Principles (GAAP) establishes a disclosure hierarchy that categorizes the inputs to valuation techniques used to value assets and liabilities at measurement date. These inputs are summarized in the three broad levels listed below: Level 1 – quoted prices in active markets for identical securities Level 2 – other significant observable inputs (including quoted prices for similar securities, interest rates, prepayment speeds, credit risk, etc.) Level 3 – significant unobservable inputs (including the Fund’s own assumptions in determining the fair value of investments) The inputs or methodology used for valuing securities are not necessarily an indication of the risk associated with investing in those securities.
Changes in valuation techniques may result in transfers in or out of an investment’s assigned level within the hierarchy during the period. Valuation techniques used to value the Fund’s investments by major category are as follows.
Debt securities, including restricted securities, are valued based on evaluated prices received from independent pricing services or from dealers who make markets in such securities. For corporate bonds, floating rate loans, municipal securities, and U.S. government and government agency obligations, pricing services utilize matrix pricing which considers yield or price of bonds of comparable quality, coupon, maturity and type as
www.calvert.com CALVERT LONG-TERM INCOME FUND SEMI-ANNUAL REPORT (UNAUDITED) 23
well as dealer supplied prices and are generally categorized as Level 2 in the hierarchy. For asset backed securities, collateralized mortgage obligations, and commercial mortgage securities, pricing services utilize matrix pricing which considers prepayment speed assumptions, attributes of the collateral, yield or price of bonds of comparable quality, coupon, maturity and type as well as dealer supplied prices and, accordingly, such securities are generally categorized as Level 2 in the hierarchy. Short-term securities with remaining maturities of sixty days or less for which quotations are not readily available are valued at amortized cost, which approximates fair value, and are categorized as Level 2 in the hierarchy.
When independent prices are unavailable or unreliable, debt securities may be valued utilizing pricing matrices which consider similar factors that would be used by independent pricing services. These are generally categorized as Level 2 in the hierarchy but may be Level 3 depending on the circumstances.
Equity securities, including restricted securities, for which market quotations are readily available, are valued at the last reported sale price or official closing price as reported by an independent pricing service on the primary market or exchange on which they are traded and are categorized as Level 1 in the hierarchy. Foreign securities are valued based on quotations from the principle market in which such securities are normally traded. If events occur after the close of the principle market in which foreign securities are traded, and before the close of business of the Fund, that are expected to materially affect the value of those securities, then they are valued at their fair value taking these events into account. For restricted securities and private placements where observable inputs are limited, assumptions about market activity and risk are used and are categorized as Level 3 in the hierarchy.
The following is a summary of the inputs used to value the Fund’s net assets as of March 31, 2011:
| | | | | | | | |
| | | VALUATION INPUTS |
| InvestMents In securItIes | | level 1 | | level 2 | | level 3 | | total |
| Equity securities | $ | 512,500 | | - | $ | 700,000 | $ | 1,212,500 |
| Asset-backed securities | | - | $ | 1,539,069 | | - | | 1,539,069 |
| Collateralized mortgage-backed | | | | | | | | |
| obligations | | - | | 1,136,063 | | - | | 1,136,063 |
| Commercial mortgage-backed | | | | | | | | |
| securities | | - | | 5,766,582 | | - | | 5,766,582 |
| Corporate debt | | - | | 89,343,988 | | 2,717,703 | | 92,061,691 |
| Municipal obligations | | - | | 5,204,867 | | - | | 5,204,867 |
| U.S. government obligations | | - | | 27,368,218 | | - | | 27,368,218 |
| Other debt obligations | | - | | 439,653 | | - | | 439,653 |
| TOTAL | $ | 512,500 | $ | 130,798,440 | $ | 3,417,703 | $ | 134,728,643 |
| Other financial instruments* | $ | 30,517 | | - | | - | $ | 30,517 |
* Other financial instruments are derivative instruments not reflected in the Portfolio of Investments, such as futures, which are valued at the unrealized appreciation/ depreciation on the instrument.
www.calvert.com CALVERT LONG-TERM INCOME FUND SEMI-ANNUAL REPORT (UNAUDITED) 24
Following is a reconciliation of Level 3 assets for which significant unobservable inputs were used to determine fair value:
| | | EQUITY | | CORPORATE | | | | |
| | | SECURITIES | | DEBT | | | TOTAL | |
| Balance as of 9/30/10 | $ | 670,000 | $ | 2,214,488 | | $ | 2,884,488 | |
| Accrued discounts/premiums | | - | | 13,306 | | | 13,306 | |
| Realized gain (loss) | | - | | 2,547 | | | 2,547 | |
| Change in unrealized appreciation (depreciation) | | 30,000 | | 108,332 | | | 138,332 | |
| Purchases | | - | | 245,972 | | | 245,972 | |
| Sales | | - | | (19,134 | ) | | (19,134 | ) |
| Transfers in and/ or out of Level 31 | | - | | 152,1922 | | | 152,192 | |
| Balance as of 3/31/11 | $ | 700,000 | $ | 2,717,703 | | $ | 3,417,703 | |
1 The Fund’s policy is to recognize transfers into and transfers out of Level 3 as of the end of the reporting period.
2 Transferred from Level 2 to Level 3 because fair values were determined using valuation techniques utilizing unobservable inputs due to observable inputs being unavailable.
For the period ended March 31, 2011, total change in unrealized gain (loss) on Level 3 securities included in the change in net assets was $38,105. Total unrealized gain (loss) for all securities (including Level 1 and Level 2) can be found on the accompanying Statement of Operations.
Repurchase Agreements: The Fund may enter into repurchase agreements with recognized financial institutions or registered broker/dealers and, in all instances, holds underlying securities with a value exceeding the total repurchase price, including accrued interest. Although risk is mitigated by the collateral, the Fund could experience a delay in recovering its value and a possible loss of income or value if the counterparty fails to perform in accordance with the terms of the agreement.
Loan Participations and Assignments: The Fund may invest in direct debt instruments which are interests in amounts owed to lenders or lending syndicates by corporate, governmental, or other borrowers. A Fund’s investments in loans may be in the form of participations in loans or assignments of all or a portion of loans from third parties. A loan is often administered by a bank or other financial institution (the “lender”) that acts as agent for all holders. The agent administers the terms of the loan, as specified in the loan agreement. A Fund may invest in multiple series or tranches of a loan, which may have varying terms and carry different associated risks. A Fund generally has no right to enforce compliance with the terms of the loan agreement with the borrower. As a result, a Fund may be subject to the credit risk of both the borrower and the lender that is selling the loan agreement. When a Fund purchases assignments from lenders it acquires direct rights against the borrower of the loan. When investing in a loan participation, a Fund has the right to receive payments of principal, interest and any fees to which it is entitled only from the lender selling the loan agreement and only upon receipt of payments by the lender from the borrower.
Futures Contracts: The Fund may purchase and sell futures contracts, but only when, in the judgment of the Advisor, such a position acts as a hedge. The Fund may not enter into futures contracts for the purpose of speculation or leverage. These futures contracts may
www.calvert.com CALVERT LONG-TERM INCOME FUND SEMI-ANNUAL REPORT (UNAUDITED) 25
include, but are not limited to, futures contracts based on U.S. Government obligations. The Fund is subject to interest rate risk in the normal course of pursuing its investment objectives. The Fund may use futures contracts to hedge against changes in the value of interest rates. The Fund may enter into futures contracts agreeing to buy or sell a financial instrument for a set price at a future date. Initial margin deposits of either cash or securities as required by the broker are made upon entering into the contract. While the contract is open, daily variation margin payments are made to or received from the broker reflecting the daily change in market value of the contract and are recorded for financial reporting purposes as unrealized gains or losses by the Fund. When a futures contract is closed, a realized gain or loss is recorded equal to the difference between the opening and closing value of the contract. The risks associated with entering into futures contracts may include the possible illiquidity of the secondary market which would limit the Fund’s ability to close out a futures contract prior to the settlement date, an imperfect correlation between the value of the contracts and the underlying financial instruments, or that the counterparty will fail to perform its obligations under the contracts’ terms. Futures contracts are designed by boards of trade which are designated “contracts markets” by the Commodities Futures Trading Commission. Futures contracts trade on the contracts markets in a manner that is similar to the way a stock trades on a stock exchange and the boards of trade, through their clearing corporations, guarantee the futures contracts against default. As a result, there is minimal counterparty credit risk to the Fund. During the period, the Fund used U.S. Treasury futures contracts to hedge against interest rate changes and to manage overall duration of the Fund.
Short Sales: The Fund may use a hedging technique that involves short sales of U.S. Treasury securities for the purposes of managing the duration of the Fund. Any short sales are “covered” with an equivalent amount of high-quality, liquid securities.
Security Transactions and Net Investment Income: Security transactions are accounted for on trade date. Realized gains and losses are recorded on an identified cost basis and may include proceeds from litigation. Dividend income is recorded on the ex-dividend date or, in the case of dividends on certain foreign securities, as soon as the Fund is informed of the ex-dividend date. Withholding taxes on foreign dividends have been provided for in accordance with the Fund’s understanding of the applicable country’s tax rules and rates. Distributions received on securities that represent a return of capital or capital gain are recorded as a reduction of cost of investments and/or as a realized gain. Interest income, which includes amortization of premium and accretion of discount on debt securities, is accrued as earned. Debt obligations may be placed on non-accrual status and related interest income may be reduced by ceasing current accruals and writing off interest receivables when the collection of all or a portion of interest has become doubtful based on consistently applied procedures. (See Schedule of Investments footnotes on page 19.) A debt obligation may be removed from non-accrual status when the issuer resumes interest payments or when collectibility of interest is reasonably assured. The Fund earns certain fees in connection with its floating rate loan purchasing activities. These fees are in addition to interest payments earned and may include amendment fees, consent fees and prepayment fees. These fees are recorded as income in the accompanying financial statements.
Foreign Currency Transactions: The Fund’s accounting records are maintained in U.S. dollars. For valuation of assets and liabilities on each date of net asset value determination, foreign denominations are translated into U.S. dollars using the current exchange rate. Security transactions, income and expenses are translated at the prevailing rate of exchange
www.calvert.com CALVERT LONG-TERM INCOME FUND SEMI-ANNUAL REPORT (UNAUDITED) 26
on the date of the event. The effect of changes in foreign exchange rates on securities and foreign currencies is included in the net realized and unrealized gain or loss on securities and foreign currencies.
Distributions to Shareholders: Distributions to shareholders are recorded by the Fund on ex-dividend date. Dividends from net investment income are paid monthly. Distributions from net realized capital gains, if any, are paid at least annually. Distributions are determined in accordance with income tax regulations which may differ from generally accepted accounting principles; accordingly, periodic reclassifications are made within the Fund’s capital accounts to reflect income and gains available for distribution under income tax regulations.
Estimates: The preparation of the financial statements in conformity with accounting principles generally accepted in the United States requires management to make estimates and assumptions that affect the reported amounts of assets and liabilities and disclosure of contingent assets and liabilities at the date of the financial statements and the reported amounts of income and expenses during the reported period. Actual results could differ from those estimates.
Redemption Fees: The Fund charges a 2% redemption fee on redemptions, including exchanges, made within 30 days of purchase in the same Fund. The redemption fee is accounted for as an addition to paid-in capital. The fee is intended to discourage market-timers by ensuring that short-term trading costs are borne by the investors making the transactions and not the shareholders already in the Fund.
Expense Offset Arrangements: The Fund has an arrangement with its custodian bank whereby the custodian’s fees may be paid indirectly by credits earned on the Fund’s cash on deposit with the bank. These credits are used to reduce the Fund’s expenses. Such a deposit arrangement may be an alternative to overnight investments.
Federal Income Taxes: No provision for federal income or excise tax is required since the Fund intends to continue to qualify as a regulated investment company under the Internal Revenue Code and to distribute substantially all of its taxable earnings.
Management has analyzed the Fund’s tax positions taken for all open federal income tax years and has concluded that no provision for federal income tax is required in the Fund’s financial statements. A Fund’s federal tax return is subject to examination by the Internal Revenue Service for a period of three years.
NOTE B — RELATED PARTY TRANSACTIONS
Calvert Asset Management Company, Inc. (the “Advisor”) is wholly-owned by Calvert Group, Ltd. (“Calvert”), which is indirectly wholly-owned by UNIFI Mutual Holding Company. The Advisor provides investment advisory services and pays the salaries and fees of officers and Trustees of the Fund who are employees of the Advisor or its affiliates. For its services, the Advisor receives a monthly fee based on an annual rate of .40% of the Fund’s average daily net assets.
The Advisor has contractually agreed to limit net annual fund operating expenses through January 31, 2012. The contractual expense cap is 1.25%. For the purposes of this expense limit, operating expenses do not include interest expense, brokerage commissions, taxes, and extraordinary expenses. To the extent any expense offset credits are
www.calvert.com CALVERT LONG-TERM INCOME FUND SEMI-ANNUAL REPORT (UNAUDITED) 27
earned, the Advisor’s obligation under the contractual limitation may be reduced and the Advisor may benefit from the expense offset arrangement.
Calvert Administrative Services Company, an affiliate of the Advisor, provides administrative services to the Fund for an annual fee, payable monthly, of .275% (.30% prior to February 1, 2011) of the average daily net assets.
Calvert Distributors, Inc., an affiliate of the Advisor, is the distributor and principal underwriter for the Fund. The Distribution Plan, adopted by Class A shares, allows the Fund to pay the Distributor for expenses and services associated with the distribution of shares. The expenses paid may not exceed .50% annually of the Fund’s average daily net assets of Class A. The amount actually paid by the Fund is an annualized fee, payable monthly of .25% of the Fund’s average daily net assets of Class A.
The Distributor received $40,196 as its portion of the commissions charged on sales of the Fund’s Class A shares for the six months ended March 31, 2011.
Calvert Shareholder Services, Inc. (“CSSI”), an affiliate of the Advisor, is the shareholder servicing agent for the Fund. For its services, CSSI received a fee of $28,123 for the six months ended March 31, 2011. Boston Financial Data Services, Inc., is the transfer and dividend disbursing agent.
Each Trustee of the Fund who is not an employee of the Advisor or its affiliates receives an annual retainer of $45,000 plus up to $2,000 for each Board and Committee meeting attended. The Board chair and Committee chairs each receive an additional $5,000 annual retainer. Trustee’s fees are allocated to each of the funds served.
NOTE C — INVESTMENT ACTIVITY
During the period, the cost of purchases and proceeds from sales of investments, other than short-term and U.S. government securities, were $144,698,064 and $132,662,347, respectively. U.S. government security purchases and sales were $215,613,905 and $208,150,142, respectively.
The Fund intends to elect to defer net capital losses of $73,172 incurred from November 1, 2009 through September 30, 2010 and treat them as arising in the fiscal year ending September 30, 2011.
As of March 31, 2011, the tax basis components of unrealized appreciation/ (depreciation) and the federal tax cost were as follows
| Unrealized appreciation | $ | 6,573,389 | |
| Unrealized (depreciation) | | (1,673,664 | ) |
| Net unrealized appreciation/(depreciation) | $ | 4,899,725 | |
| Federal income tax cost of investments | $ | 129,828,918 | |
www.calvert.com CALVERT LONG-TERM INCOME FUND SEMI-ANNUAL REPORT (UNAUDITED) 28
The Fund may sell or purchase securities to and from other Funds managed by the Advisor, typically short-term variable demand notes. Interportfolio transactions are primarily used for cash management purposes. Interportfolio transactions are made pursuant to Rule 17a-7 of the Investment Company Act of 1940. For the six months ended March 31, 2011, such purchase transactions were $453,750.
NOTE D — LINE OF CREDIT
A financing agreement is in place with all Calvert Group Funds and State Street Corporation (“SSC”). Under the agreement, SSC provides an unsecured line of credit facility, in the aggregate amount of $50 million ($25 million committed and $25 million uncommitted), accessible by the Funds for temporary or emergency purposes only. Borrowings under the committed facility bear interest at the higher of the London Interbank Offered Rate, (LIBOR) or the overnight Federal Funds Rate plus 1.25% per annum. A commitment fee of .125% per annum is incurred on the unused portion of the committed facility, which is allocated to all participating funds. The Fund had no loans outstanding pursuant to this line of credit at March 31, 2011. For the six months ended March 31, 2011, borrowings by the Fund under the Agreement were as follows:
| | WEIGHTED | | MONTH OF |
| AVERAGE | AVERAGE | MAXIMUM | MAXIMUM |
| DAILY | INTEREST | AMOUNT | AMOUNT |
| BALANCE | RATE | BORROWED | BORROWED |
| $55,809 | 1.48% | $1,738,732 | March 2011 |
NOTE E — SUBSEQUENT EVENTS
In preparing the financial statements as of March 31, 2011, no subsequent events or transactions occurred that would have materially impacted the financial statements as presented.
Effective April 30, 2011, the Calvert operating companies will be renamed as follows: Calvert Group, Ltd. will be renamed Calvert Investments, Inc., Calvert Asset Management Company, Inc. will be renamed Calvert Investment Management, Inc., Calvert Distributors, Inc. will be renamed Calvert Investment Distributors, Inc., Calvert Administrative Services Company will be renamed Calvert Investment Administrative Services, Inc., and Calvert Shareholder Services, Inc. will be renamed Calvert Investment Services, Inc.
www.calvert.com CALVERT LONG-TERM INCOME FUND SEMI-ANNUAL REPORT (UNAUDITED) 29
| | | | | | | | | |
| FINANCIAL HIGHLIGHTS |
| |
| | PERIODS ENDED |
| | | MARCH
31, | | | SEPTEMBER 30, | | | SEPTEMBER 30 | |
| class A shares | | 2011 | | | 2010 | | | 2009 | |
| Net asset value, beginning | $ | 17.96 | | $ | 17.43 | | $ | 15.44 | |
| Income from investment operations: | | | | | | | | | |
| Net investment income | | .29 | | | .58 | | | .54 | |
| Net realized and unrealized gain (loss) | | (.04 | ) | | 1.40 | | | 2.46 | |
| Total from investment operations | | .25 | | | 1.98 | | | 3.00 | |
| Distributions from: | | | | | | | | | |
| Net investment income | | (.30 | ) | | (.57 | ) | | (.52 | ) |
| Net realized gain | | (.67 | ) | | (.88 | ) | | (.49 | ) |
| Total distributions | | (.97 | ) | | (1.45 | ) | | (1.01 | ) |
| Total increase (decrease) in net asset value | | (.72 | ) | | .53 | | | 1.99 | |
| Net asset value, ending | $ | 17.24 | | $ | 17.96 | | $ | 17.43 | |
| |
| Total return* | | 1.50 | % | | 12.13 | % | | 20.58 | % |
| Ratios to average net assets: A | | | | | | | | | |
| Net investment income | | 3.41 | % (a) | | 3.47 | % | | 3.45 | % |
| Total expenses | | 1.36 | % (a) | | 1.42 | % | | 1.46 | % |
| Expenses before offsets | | 1.25 | % (a) | | 1.25 | % | | 1.27 | % |
| Net expenses | | 1.25 | % (a) | | 1.25 | % | | 1.25 | % |
| Portfolio turnover | | 273 | % | | 596 | % | | 781 | % |
| Net assets, ending (in thousands) | $ | 142,946 | | $ | 139,901 | | $ | 77,637 | |
| |
| |
| |
| | | | | | Years ended | | | | |
| | | SEPTEMBER
30, | | | SEPTEMBER 30, | | | SEPTEMBER 30, | |
| class A shares | | 2008 | | | 2007 | | | 2006 | |
| Net asset value, beginning | $ | 15.62 | | $ | 15.36 | | $ | 15.52 | |
| Income from investment operations: | | | | | | | | | |
| Net investment income | | .62 | | | .62 | | | .58 | |
| Net realized and unrealized gain (loss) | | .20 | | | .27 | | | .08 | |
| Total from investment operations | | .82 | | | .89 | | | .66 | |
| Distributions from: | | | | | | | | | |
| Net investment income | | (.61 | ) | | (.61 | ) | | (.58 | ) |
| Net realized gain | | (.39 | ) | | (.02 | ) | | (.24 | ) |
| Total distributions | | (1.00 | ) | | (.63 | ) | | (.82 | ) |
| Total increase (decrease) in net asset value | | (.18 | ) | | .26 | | | (.16 | ) |
| Net asset value, ending | $ | 15.44 | | $ | 15.62 | | $ | 15.36 | |
| |
| Total return* | | 5.31 | % | | 5.92 | % | | 4.49 | % |
| Ratios to average net assets: A | | | | | | | | | |
| Net investment income | | 3.96 | % | | 4.09 | % | | 4.04 | % |
| Total expenses | | 1.66 | % | | 2.03 | % | | 3.76 | % |
| Expenses before offsets | | 1.28 | % | | 1.30 | % | | 1.55 | % |
| Net expenses | | 1.25 | % | | 1.25 | % | | 1.25 | % |
| Portfolio turnover | | 604 | % | | 767 | % | | 547 | % |
| Net assets, ending (in thousands) | $ | 29,532 | | $ | 12,139 | | $ | 4,995 | |
See notes to financial highlights.
www.calvert.com CALVERT LONG-TERM INCOME FUND SEMI-ANNUAL REPORT (UNAUDITED) 30
| A | Total expenses do not reflect amounts reimbursed and/or waived by the Advisor or reductions from expense offset arrangements. Expenses before offsets reflect expenses after reimbursement and/or waiver by the Advisor but prior to reductions from expense offset arrangements. Net expenses are net of all reductions and represent the net expenses paid by the Fund. |
| (a) | Annualized. |
| * | Total return is not annualized for periods less than one year and does not reflect deduction of any front-end or deferred sales charge. |
See notes to financial statements.
www.calvert.com CALVERT LONG-TERM INCOME FUND SEMI-ANNUAL REPORT (UNAUDITED) 31
EXPLANATION OF FINANCIAL TABLES
SCHEDULE OF INVESTMENTS
The Schedule of Investments is a snapshot of all securities held in the fund at their market value, on the last day of the reporting period. Securities are listed by asset type (e.g., common stock, corporate bonds, U.S. government obligations) and may be further broken down into sub-groups and by industry classification.
STATEMENT OF ASSETS AND LIABILITIES
The Statement of Assets and Liabilities is often referred to as the fund’s balance sheet. It lists the value of what the fund owns, is due and owes on the last day of the reporting period. The fund’s assets include the market value of securities owned, cash, receivables for securities sold and shareholder subscriptions, and receivables for dividends and interest payments that have been earned, but not yet received. The fund’s liabilities include payables for securities purchased and shareholder redemptions, and expenses owed but not yet paid. The statement also reports the fund’s net asset value (NAV) per share on the last day of the reporting period. The NAV is calculated by dividing the fund’s net assets (assets minus liabilities) by the number of shares outstanding. This statement is accompanied by a Schedule of Investments. Alternatively, if certain conditions are met, a Statement of Net Assets may be presented in lieu of this statement and the Schedule of Investments.
STATEMENT OF NET ASSETS
The Statement of Net Assets provides a detailed list of the fund’s holdings, including each security’s market value on the last day of the reporting period. The Statement of Net Assets includes a Schedule of Investments. Other assets are added and other liabilities subtracted from the investments total to calculate the fund’s net assets. Finally, net assets are divided by the outstanding shares of the fund to arrive at its share price, or Net Asset Value (NAV) per share.
At the end of the Statement of Net Assets is a table displaying the composition of the fund’s net assets. Paid in Capital is the money invested by shareholders and represents the bulk of net assets. Undistributed Net Investment Income and Accumulated Net Realized Gains usually approximate the amounts the fund had available to distribute to shareholders as of the statement date. Accumulated Realized Losses will appear as negative balances. Unrealized Appreciation (Depreciation) is the difference between the market value of the fund’s investments and their cost, and reflects the gains (losses) that would be realized if the fund were to sell all of its investments at their statement-date values.
www.calvert.com CALVERT LONG-TERM INCOME FUND SEMI-ANNUAL REPORT (UNAUDITED) 32
STATEMENT OF OPERATIONS
The Statement of Operations summarizes the fund’s investment income earned and expenses incurred in operating the fund. Investment income includes dividends earned from stocks and interest earned from interest-bearing securities in the fund. Expenses incurred in operating the fund include the advisory fee paid to the investment advisor, administrative services fees, distribution plan expenses (if applicable), transfer agent fees, shareholder servicing expenses, custodial, legal, and audit fees, and the printing and postage expenses related to shareholder reports. Expense offsets (fees paid indirectly) are also shown. Credits earned from offset arrangements are used to reduce the fund’s expenses. This statement also shows net gains (losses) realized on the sale of investments and the increase or decrease in the unrealized appreciation (depreciation) on investments held during the period.
STATEMENT OF CHANGES IN NET ASSETS
The Statement of Changes in Net Assets shows how the fund’s total net assets changed during the two most recent reporting periods. Changes in the fund’s net assets are attributable to investment operations, distributions and capital share transactions.
The Operations section of the report summarizes information detailed in the Statement of Operations. The Distribution section shows the dividend and capital gain distributions made to shareholders. The amounts shown as distributions in this section may not match the net investment income and realized gains amounts shown in the Operations section because distributions are determined on a tax basis and certain investments or transactions may be treated differently for financial statement and tax purposes. The Capital Share Transactions section shows the amount shareholders invested in the fund, either by purchasing shares or by reinvesting distributions, and the amounts redeemed. The corresponding numbers of shares issued, reinvested and redeemed are shown at the end of the report.
FINANCIAL HIGHLIGHTS
The Financial Highlights table provides a per-share breakdown per class of the components that affect the fund’s net asset value for current and past reporting periods. The table provides total return, total distributions, expense ratios, portfolio turnover and net assets for the applicable period. Total return is a measure of a fund’s performance that encompasses all elements of return: dividends, capital gain distributions and changes in net asset value. Total return is the change in value of an investment over a given period, assuming reinvestment of any dividends and capital gain distributions, expressed as a percentage of the initial investment. Total distributions include distributions from net investment income and net realized gains. Long-term gains are earned on securities held in the fund more than one year. Short-term gains, on the sale of securities held less than one year, are treated as ordinary dividend income for tax purposes. The expense ratio is a fund’s cost of doing business, expressed as a percentage of net assets. These expenses directly reduce returns to shareholders. Portfolio turnover measures the trading activity in a fund’s investment portfolio – how often securities are bought and sold by a fund. Portfolio turnover is affected by market conditions, changes in the size of the fund, the nature of the fund’s investments and the investment style of the portfolio manager.
www.calvert.com CALVERT LONG-TERM INCOME FUND SEMI-ANNUAL REPORT (UNAUDITED) 33
PROXY VOTING
The Proxy Voting Guidelines of the Calvert Funds that the Fund uses to determine how to vote proxies relating to portfolio securities are provided as an Appendix to the Fund’s Statement of Additional Information. The Statement of Additional Information can be obtained free of charge by calling the Fund at 1-800-368-2745, by visiting the Calvert website at www.calvert.com; or by visiting the SEC’s website at www.sec.gov.
Information regarding how the Fund voted proxies relating to portfolio securities during the most recent 12-month period ended June 30 is available on the Fund’s website at www.calvert.com and on the SEC’s website at www.sec.gov.
AVAILABILITY OF QUARTERLY PORTFOLIO HOLDINGS
The Fund files its complete schedule of portfolio holdings with the SEC for the first and third quarters of each fiscal year on Form N-Q. The Fund’s Form N-Q is available on the SEC’s website at www.sec.gov. The Fund’s Form N-Q may be reviewed and copied at the SEC’s Public Reference Room in Washington, DC; information on the operation of the Public Reference Room may be obtained by calling 1-800-SEC-0330.
BASIS FOR BOARD’S APPROVAL OF INVESTMENT ADVISORY CONTRACT
At a meeting held on December 8, 2010, the Board of Trustees, and by a separate vote, the disinterested Trustees, approved the continuance of the Investment Advisory Agreement between The Calvert Fund and the Advisor with respect to the Fund.
In evaluating the Investment Advisory Agreement, the Board considered a variety of information relating to the Fund and the Advisor. The disinterested Trustees reviewed a report prepared by the Advisor regarding various services provided to the Fund by the Advisor and its affiliates. Such report included, among other data, information regarding the Advisor’s personnel and the Advisor’s revenue and cost of providing services to the Fund, and a separate report prepared by an independent third party, which provided a statistical analysis comparing the Fund’s investment performance, expenses and fees to comparable mutual funds.
The disinterested Trustees were separately represented by independent legal counsel with respect to their consideration of the reapproval of the Investment Advisory Agreement. Prior to voting, the disinterested Trustees reviewed the proposed continuance of the Investment Advisory Agreement with management and also met in private sessions with their counsel at which no representatives of management were present.
In the course of its deliberations regarding the Investment Advisory Agreement, the Board considered the following factors, among others: the nature, extent and quality of the services provided by the Advisor, including the personnel providing such services; the Advisor’s financial condition; the level and method of computing the Fund’s advisory
www.calvert.com CALVERT LONG-TERM INCOME FUND SEMI-ANNUAL REPORT (UNAUDITED) 34
fee; comparative performance, fee and expense information for the Fund; the profitability of the Calvert Group of Funds to the Advisor and its affiliates; the direct and indirect benefits, if any, derived by the Advisor and its affiliates from their relationship with the Fund; the effect of the Fund’s growth and size on the Fund’s performance and expenses; the affiliated distributor’s process for monitoring sales load breakpoints; the Advisor’s compliance programs and policies; the Advisor’s performance of substantially similar duties for other funds; and any possible conflicts of interest.
In considering the nature, extent and quality of the services provided by the Advisor under the Investment Advisory Agreement, the Board reviewed information provided by the Advisor relating to its operations and personnel, including, among other information, biographical information on the Advisor’s investment, supervisory and professional staff and descriptions of its organizational and management structure. The Board also took into account similar information provided periodically throughout the previous year by the Advisor as well as the Board’s familiarity with management through Board of Trustees’ meetings, discussions and other reports. The Board considered the Advisor’s management style and its performance in employing its investment strategies, as well as its current level of staffing and overall resources. The Advisor’s administrative capabilities, including its ability to supervise the other service providers for the Fund, were also considered. The Board concluded that it was satisfied with the nature, extent and quality of services provided to the Fund by the Advisor under the Investment Advisory Agreement.
In considering the Fund’s performance, the Board noted that it reviewed on a quarterly basis detailed information about the Fund’s performance results, portfolio composition and investment strategies. In addition, the Board took into account overall financial market conditions. The Board also reviewed various comparative data provided to it in connection with its consideration of the renewal of the Investment Advisory Agreement, including, among other information, a comparison of the Fund’s total return with its Lipper index and with that of other mutual funds deemed to be in its Lipper peer group by an independent third party in its report. This comparison indicated that the Fund performed above the median of its peer group for the one-, three- and five-year periods ended June 30, 2010. The data also indicated that the Fund outperformed its Lipper index for the one-, three- and five-year periods ended June 30, 2010. Based upon its review, the Board concluded that the Fund’s performance was satisfactory.
In considering the Fund’s fees and expenses, the Board compared the Fund’s fees and total expense ratio with various comparative data for the funds in its peer group. Among other findings, the data indicated that the Fund’s advisory fee (after taking into account waivers and/or reimbursements) was below the median of its peer group and that total expenses (net of waivers and/or reimbursements) were above the median of its peer group. The Board noted that the allocation of advisory and administrative fees may vary among the Fund’s peer group. The Board took into account the Advisor’s current undertaking to maintain expense limitations for the Fund’s Class A shares. The Board also noted management’s discussion of the Fund’s expenses and certain factors that affected the level of such expenses. The Board also took into account the reduction in the administrative fee. Based upon its review, the Board concluded that the advisory fee was reasonable in view of the quality of services provided by the Advisor and the other factors considered.
www.calvert.com CALVERT LONG-TERM INCOME FUND SEMI-ANNUAL REPORT (UNAUDITED) 35
The Board reviewed the Advisor’s profitability on a fund-by-fund basis. In reviewing the overall profitability of the advisory fee to the Fund’s Advisor, the Board also considered the fact that affiliates of the Advisor provided shareholder servicing and administrative services to the Fund for which they received compensation. The information considered by the Board included Calvert’s operating profit margin information both before and after tax expenses with respect to the services that the Advisor and its affiliates provided to the Calvert Group of Funds complex. The Board reviewed the profitability of the Advisor’s relationship with the Fund in terms of the total amount of annual advisory fees it received with respect to the Fund and whether the Advisor had the financial wherewithal to continue to provide a high level of services to the Fund. The Board noted that the Advisor had reimbursed expenses of the Fund. The Board also noted the Advisor’s current undertaking to maintain expense limitations for the Fund’s Class A shares. The Board also considered that the Advisor derived benefits to its reputation and other indirect benefits from its relationship with the Fund. Based upon its review, the Board concluded that the Advisor’s and its affiliates’ level of profitability from their relationship with the Fund was reasonable.
The Board considered the effect of the Fund’s current size and potential growth on its performance and expenses. The Board concluded that adding breakpoints to the advisory fee at specified asset levels would not be appropriate at this time given the Fund’s current size. The Board noted that if the Fund’s assets increased over time, the Fund might realize other economies of scale if assets increased proportionally more than certain other expenses. The Board also took into account the reduction in the administrative fee.
In reapproving the Investment Advisory Agreement, the Board, including the disinterested Trustees, did not identify any single factor as controlling, and each Trustee may have attributed different weight to various factors.
Conclusions
The Board reached the following conclusions regarding the Investment Advisory Agreement, among others: (a) the Advisor has demonstrated that it possesses the capability and resources to perform the duties required of it under the Investment Advisory Agreement; (b) the Advisor maintains appropriate compliance programs; (c) performance of the Fund is satisfactory relative to the performance of funds with similar investment objectives and to relevant indices; (d) the Advisor is likely to execute its investment strategies consistently over time; and (e) the Fund’s advisory fee is reasonable relative to those of similar funds and to the services to be provided by the Advisor. Based on its conclusions, the Board determined that reapproval of the Investment Advisory Agreement would be in the best interests of the Fund and its shareholders.
www.calvert.com CALVERT LONG-TERM INCOME FUND SEMI-ANNUAL REPORT (UNAUDITED) 36
To Open an Account
800-368-2748
Yields and Prices
Calvert Information Network
(24 hours, 7 days a week)
800-368-2745
Service for Existing Account
Shareholders: 800-368-2745
Brokers: 800-368-2746
TDD for Hearing Impaired
800-541-1524
Branch Office
4550 Montgomery Avenue
Suite 1000 North
Bethesda, Maryland 20814
Registered, Certified or Overnight Mail
Calvert Investments
c/o BFDS,
330 West 9th Street
Kansas City, MO 64105
Web Site
www.calvert.com
Principal Underwriter
Calvert Investment Distributors, Inc.
4550 Montgomery Avenue
Suite 1000 North
Bethesda, Maryland 20814
| | |
| CALVERT | CALVERT’S | Equity Funds |
| LONG-TERM | FAMILY OF FUNDS | Enhanced Equity Portfolio |
| INCOME FUND | | Equity Portfolio |
| | Tax-Exempt Money | Large Cap Growth Fund |
| | Market Funds | Large Cap Value Fund |
| | CTFR Money Market Portfolio | Social Index Fund |
| | | Capital Accumulation Fund |
| | Taxable Money Market | International Equity Fund |
| | Funds | Small Cap Fund |
| | First Government Money Market | Global Alternative Energy Fund |
| | Fund | Global Water Fund |
| | Money Market Portfolio | International Opportunities Fund |
| |
| | Municipal Funds | Balanced and Asset |
| | Tax-Free Bond Fund | Allocation Funds |
| | | Balanced Portfolio |
| | Taxable Bond Funds | Conservative Allocation Fund |
| | Bond Portfolio | Moderate Allocation Fund |
| | Income Fund | Aggressive Allocation Fund |
| | Short Duration Income Fund | |
| | Long-Term Income Fund | |
| | Ultra-Short Income Fund | |
| | Government Fund | |
| | High-Yield Bond Fund | |
This report is intended to provide fund information to shareholders. It is not authorized for distribution to prospective investors unless preceded or accompanied by a prospectus.
Note: The information on our website is not incorporated by reference into this report; our website address is included as an inactive textual reference only.
Investors should carefully consider the investment objectives, risks, charges and expenses of the Calvert Funds. This and other important information is contained in the fund’s summary prospectus and prospectus, which can be obtained from your financial professional and should be read carefully before investing. You may also call Calvert at 800/368-2745 or visit www. calvert.com.
INFORMATION REGARDING CALVERT OPERATING COMPANY
NAME CHANGES
Effective on April 30, 2011, the following Calvert operating companies will be renamed as indicated:
| | |
| Current Company Name | Company Name on 4/30/11 | Company Description |
| |
| Calvert Group, Ltd. | Calvert Investments, Inc. | Corporate parent of each |
| | | operating company listed |
| | | below |
| |
| Calvert Asset Management | Calvert Investment | Investment advisor to the |
| Company, Inc. | Management, Inc. | Calvert Funds |
| |
| Calvert Distributors, Inc. | Calvert Investment Distributors, | Principal underwriter |
| | Inc. | and distributor for the |
| | | Calvert Funds |
| |
| Calvert Administrative | Calvert Investment | Administrative services |
| Services Company | Administrative Services, Inc. | provider for the Calvert |
| | | Funds |
| |
| Calvert Shareholder | Calvert Investment Services, | Shareholder servicing |
| Services, Inc. | Inc. | provider for the Calvert |
| | | Funds |
Choose Planet-friendly E-delivery!
Sign up now for on-line statements, prospectuses, and fund reports. In less than five minutes you can help reduce paper mail and lower fund costs.
Just go to www.calvert.com. If you already have an online account at Calvert, click on My Account, and select the documents you would like to receive via e-mail.
If you’re new to online account access, click on Login/Register to open an online account. Once you’re in, click on the E-delivery sign-up at the bottom of the Account Portfolio page and follow the quick, easy steps. Note: if your shares are not held directly at Calvert but through a brokerage firm, you must contact your broker for electronic delivery options available through their firm.
Dear Shareholder:
The financial markets ended the six-month period on a high note. The Federal Reserve’s announcement in the fall of 2010 of a second round of quantitative easing (QE2) and the extension in December of the Bush-era tax cuts for all income levels helped buoy the markets and pushed Treasury yields higher. The resulting increase in U.S. consumer spending and confidence helped drive a year-end rally.
This calm lasted until new storms arrived in the beginning of 2011. Civil and political unrest in the Middle East and North Africa sent the price of crude soaring and heightened energy security concerns in many countries around the world. In March, the tragic earthquake and tsunami struck Japan. Our sympathies go out to the people of Japan who lost loved ones in this disaster. The earthquake—and its impact on the country’s nuclear reactors—roiled global financial markets. The cumulative effect of these events sparked a brief sell-off in corporate bonds as investors moved into the relative safety of U.S. Treasuries.
Fixed-Income Markets Continue to be Volatile
Investment-grade corporate bonds edged down slightly for the reporting period, with the Barclays Capital U.S. Credit Index returning -0.98%, while high-yield bonds, as measured by the BofA Merrill Lynch U.S. High Yield Master II Index, returned 7.09%. Money-market returns remained flat, reflecting the Fed’s efforts to keep its target interest rate very low.
Corporate bonds continued to benefit from generally strong corporate earnings and lower default expectations during the fourth quarter of 2010. This trend continued during the first quarter of 2011 as investors became more comfortable moving into riskier asset classes to chase yield. However, most fixed-income sectors experienced significant volatility as investors reacted to the turmoil in the Middle East and the ensuing climb in oil prices as well as the disaster in Japan—which prompted some investors to move back into the relative safety of Treasuries as noted above.
Municipal bond returns suffered greatly in the final months of 2010 due to heavy municipal debt issuance, record municipal bond fund redemptions by retail investors, and fear of massive municipal debt defaults, which appears to be unfounded. Fortunately, prices steadied after the turn of the year due to slowing investor outflows and minimal new debt issuance.
Opportunities and Challenges Ahead
Overall, we are optimistic and expect a slow, gradual economic recovery to continue, which we believe should help sustain a corporate bond rally through the remainder of 2011. A low core inflation rate (which excludes food and energy prices) will likely facilitate economic growth, while continued debt reduction, lingering high unemployment, and a struggling housing market will limit gains. Energy prices will remain a challenge
www.calvert.com CALVERT ULTRA-SHORT INCOME FUND SEMI-ANNUAL REPORT (UNAUDITED) 4
until we see more resolution of the events in the Middle East and North Africa. Of course, more geopolitical crises, rising commodity prices, and inflation spikes could certainly dampen the markets.
In short, we believe the markets, the global economy, and your Calvert funds can successfully navigate through any temporary setbacks.
Discuss Your Portfolio Allocations with Your Advisor
Given the market shifts we have experienced, your overall portfolio asset allocation and investment strategy may no longer match your needs. Therefore, we recommend reviewing these with your financial advisor to ensure that your target mix of U.S. and international stocks, bonds, and cash is well-diversified and appropriate given your financial goals, time horizon, and risk tolerance.
We encourage you to visit our website, www.calvert.com, for fund information and updates as well as market and economic commentary from Calvert professionals.
As noted elsewhere in this report, the Calvert operating companies that provide services to the funds will change their names effective April 30, 2011. As part of the changes, Calvert Group, Ltd. will be known as Calvert Investments, Inc., and the funds’ advisor, Calvert Asset Management Company, Inc., will be known as Calvert Investment Management, Inc.
As always, we appreciate your investing with Calvert.

Barbara J. Krumsiek
President and CEO
Calvert Investments, Inc.
April 2011
www.calvert.com CALVERT ULTRA-SHORT INCOME FUND SEMI-ANNUAL REPORT (UNAUDITED) 5

Performance
For the six-month period ended March 31, 2011, Calvert Ultra-Short Income Fund (Class A shares at NAV) returned 0.97%. Its benchmark index, the Barclays Capital 9-12 Months Short Treasury Index, returned 0.21% for the period. The Fund’s short relative duration strategy was primarily responsible for the portfolio’s outperformance. Duration is a measure of a portfolio’s sensitivity to changes in interest rates. The longer the duration, the greater the change in price relative to interest rate movements. The Fund’s allocation to high-yield bonds also helped relative performance.
Investment Climate
The six-month reporting period was characterized by four clear phases in interest-rate movements. The first was a steady and strong upward movement in interest rates. The 10-year Treasury yield increased from 2.33% in early October to 3.57% by mid-December. The Federal Reserve’s (Fed) announcement of new Treasury purchases in November did little to slow the advance as
*Investment performance/return at NAV does not reflect the deduction of the Fund’s maximum 1.25% front-end sales charge or any deferred sales charge. ** See note on page 7 regarding Class Y shares.
CALVERT ULTRA-SHORT INCOME FUND
MARCH 31, 2011
INVESTMENT PERFORMANCE
(TOTAL RETURN AT NAV*)
| | 6 Months | | 12 Months | |
| | ended | | ended | |
| | 3/31/11 | | 3/31/11 | |
| Class A | 0.97 | % | 2.26 | % |
| Class Y** | 1.05 | % | 2.43 | % |
| Barclays Capital Short | | | | |
| Treasury Index | | | | |
| 9-12 Months | 0.21 | % | 0.60 | % |
| Lipper Ultra-Short | | | | |
| Obligations | | | | |
| Funds Average | 0.52 | % | 1.26 | % |
| |
| SEC YIELD | | | | |
| | 30 DAYS ENDED | |
| | 3/31/11 | | 9/30/10 | |
| Class A | 1.49 | % | 1.64 | % |
| Class Y | 1.70 | % | 1.74 | % |
| | | | |
| | | | % of Total | |
| ECONOMIC SECTORS | | | Investments | |
| Asset-Backed Securities | | | 10.1 | % |
| Basic Materials | | | 3.3 | % |
| Communications | | | 3.4 | % |
| Consumer, Cyclical | | | 3.8 | % |
| Consumer, Non-cyclical | | | 4.1 | % |
| Diversified | | | 0.1 | % |
| Energy | | | 2.5 | % |
| Financials | | | 30.8 | % |
| Government | | | 6.7 | % |
| Industrials | | | 2.1 | % |
| Insurance | | | 0.1 | % |
| Mortgage Securities | | | 27.3 | % |
| Technology | | | 2.3 | % |
| Telecommunication Services | | 0.3 | % |
| Utilities | | | 3.1 | % |
| Total | | | 100 | % |
www.calvert.com CALVERT ULTRA-SHORT INCOME FUND SEMI-ANNUAL REPORT (UNAUDITED) 6
economic data improved. In December, many analysts raised their forecasts for economic growth, and stocks rallied as a larger-than-expected fiscal stimulus package was passed. The second phase featured a fairly quiet trading range. During phase three, from early to mid-February, yields rose as the unemployment rate fell sharply, boosting confidence in the economy and triggering a rally in stocks. The 10-year Treasury yield peaked at 3.74%.
In the final phase, yields began to fall as turmoil in the Middle East pushed up the price of oil and raised doubts about the strength of the young economic expansion. Volatility increased in global financial markets. Doubt, uncertainty, and volatility were amplified by the terrible March 11 earthquake and tsunami in Japan. Treasury yields continued to fall, with the 10-year yield bottoming at 3.14% a few days after the disaster. After the shock wore off, stocks regained their footing and Treasury yields recovered some ground. The 10-year Treasury yield ended the reporting period near 3.5%, which was close to the middle of the range over the full reporting period.1 During the reporting period, we estimate that the U.S. economy grew at an annualized rate of 3.3%.2 This is very near the 50-year average growth rate, but remains below the rate seen, at a similar point in the business cycle, after prior deep recessions in the post-WWII era. The core consumer price inflation (CPI) rate increased from 0.6% to 1.1% during the reporting period,3 so the Fed’s concern about unwanted disinflation abated. While the inflation rate was trending up, the level of both core and headline inflation rates remained below long-run averages. Market expectations for inflation in coming years increased to a level more in line with long-term averages.
Portfolio Strategy
The Fund benefitted from higher interest rates across the yield curve. The yields on two- and 10-year Treasuries increased by 35 and 91 basis points, respectively, over the six-month reporting period. The Fund’s allocation to high-yield bonds also helped relative performance. At the start of the reporting period, 10.13% of the Fund was allocated to high-yield bonds. Over the reporting period, the Barclays U.S. Corporate High Yield Index returned 7.23%, while the more broadly-based Barclays Capital U.S. Credit Index returned -0.98%.
The Fund employed a yield-curve-flattening strategy. This had a mixed effect as some portions of the yield curve narrowed while others widened. For example, the Fund was positioned to benefit from a narrowing of the yield differential between two- and 10-year Treasuries. This section of the yield curve instead widened from 209 to 265 basis points during the reporting period, which hurt performance. The Fund uses Treasury futures to hedge its interest rate position.
Outlook
The U.S. economy continues to recover from severe financial crisis. Deleveraging in household and financial sectors continues, suggesting moderate, not heated, growth and
www.calvert.com CALVERT ULTRA-SHORT INCOME FUND SEMI-ANNUAL REPORT (UNAUDITED) 7
Growth of $10,000
The graph below shows the value of a hypothetical $10,000 investment in the fund over the past 10 fiscal year periods or since inception (for funds without 10-year records). The results shown are for Class A shares and reflect the deduction of the maximum front-end sales charge of 1.25%, and assume the reinvestment of dividends. The result is compared with benchmarks that include a broad based market index and a Lipper peer group average. Market indexes are unmanaged and their results do not reflect the effect of expenses or sales charges. The Lipper average reflects the deduction of the category’s average front-end sales charge. The value of an investment in a different share class would be different.

All performance data shown, including the graph above and the adjacent table, represents past performance, does not guarantee future results, assumes reinvestment of dividends and distributions and does not reflect the deduction of taxes that a shareholder would pay on the Fund’s/Portfolio’s distributions or the redemption of the Fund/Portfolio shares. The investment return and principal value of an investment will fluctuate so that an investor’s shares, when redeemed, may be worth more or less than their original cost. Current performance may be lower or higher than the performance data quoted; for current performance data visit www.calvert.com. The gross expense ratio from the current prospectus for Class A shares is 1.08%. This number may differ from the expense ratio shown elsewhere in this report because it is based on a different time period and, if applicable, does not include fee or expense waivers. Performance data quoted already reflects the deduction of the Fund’s/Portfolio’s operating expenses.
www.calvert.com CALVERT ULTRA-SHORT INCOME FUND SEMI-ANNUAL REPORT (UNAUDITED) 8
consumer price inflation. Monetary policy should remain easy in coming quarters as federal, state, and local fiscal stimuli continue to recede or contract. The impact from the long stretch of extraordinarily easy Fed policy, with its near-zero percent short-term interest rates and government bond purchases, is clear in the higher prices of stocks, bonds, and commodities, but not in consumer price indices.
Once again, events external to the United States created more uncertainty about the outlook for U.S. growth, inflation, and monetary policy. In addition to geopolitical tensions in the Middle East and natural disaster in Japan, deepening eurozone debt troubles have put Portugal on the brink
CALVERT ULTRA-SHORT INCOME FUND
March 31, 2011
AVERAGE ANNUAL TOTAL RETURNS
| class A shares | (wIth Max. load) | |
| One year | 0.97 | % |
| Since inception (10/31/2006) | 4.03 | % |
| | |
| class Y shares* | | |
| One year | 2.43 | % |
| Since inception (10/31/2006) | 4.37 | % |
*Calvert Ultra-Short Income Fund first offered Class Y shares on May 28, 2010. Performance prior to that date reflects the performance of Class A shares at net asset value (NAV). Actual Class Y share performance would have been different.
of a bailout from the European Union/International Monetary Fund rescue facility. If the country does require a financial rescue package, Portugal would become the third eurozone member to receive a bailout. The rescue facility can accommodate Greece, Ireland, and Portugal but a debt crisis in Spain would disrupt financial markets worldwide. The Spanish government’s interest rates, while elevated, are not near crisis levels. Spain will remain under pressure, however, and has the potential to unnerve investors from time to time.
Despite increased uncertainty in recent months, we expect the Fed to conclude its Treasury purchases by the end of June. This would complete the easing cycle and, apart from some minor operations, move the Fed to the sidelines for the remainder of the year. There are monetary policy scenarios that could move bond yields quite sharply, including the small chance that the Fed will tighten faster than expected if core inflation increases rapidly. In addition, in light of the recent international turmoil, there also is a chance—perhaps small—that the Fed will ease yet again if the economy weakens later this year. In uncertain times, we expect market volatility to erupt from time to time.
April 2011
1 Interest rate data sources: Chicago Board Options Exchange and Federal Reserve
2 According to Bureau of Economic Analysis data and forecasts from the Wall Street Journal Survey of Professional Forecasters
3 Latest data as of February 2011 from the Bureau of Labor Statistics
www.calvert.com CALVERT ULTRA-SHORT INCOME FUND SEMI-ANNUAL REPORT (UNAUDITED) 9
SHAREHOLDER EXPENSE EXAMPLE
As a shareholder of the Fund, you incur two types of costs: (1) transaction costs, including sales charges (loads) and redemption fees and (2) ongoing costs, including management fees; distribution (12b-1) fees; and other Fund expenses. This Example is intended to help you understand your ongoing costs (in dollars) of investing in the Fund and to compare these costs with the ongoing costs of investing in other mutual funds.
This Example is based on an investment of $1,000 invested at the beginning of the period and held for the entire period (October 1, 2010 to March 31, 2011).
Actual Expenses
The first line of the table below provides information about actual account values and actual expenses. You may use the information in this line, together with the amount you invested, to estimate the expenses that you paid over the period. Simply divide your account value by $1,000 (for example, an $8,600 account value divided by $1,000 = 8.6), then multiply the result by the number in the first line under the heading entitled “Expenses Paid During Period” to estimate the expenses you paid on your account during this period.
Hypothetical Example for Comparison Purposes
The second line of the table below provides information about hypothetical account values and hypothetical expenses based on the Fund’s actual expense ratio and an assumed rate of return of 5% per year before expenses, which is not the Fund’s actual return. The hypothetical account values and expenses may not be used to estimate the actual ending account balance or expenses you paid for the period. You may use this information to compare the ongoing costs of investing in the Fund and other funds. To do so, compare the 5% hypothetical example with the 5% hypothetical examples that appear in the shareholder reports of the other funds.
Please note that the expenses shown in the table are meant to highlight your ongoing costs only and do not reflect any transactional costs, such as sales charges (loads) or redemption fees. Therefore, the second line of the table is useful in comparing ongoing costs only, and will not help you determine the relative total costs of owning different funds. In addition, if these transactional costs were included, your costs would have been higher.
www.calvert.com CALVERT ULTRA-SHORT INCOME FUND SEMI-ANNUAL REPORT (UNAUDITED) 10
| | | | | | |
| | | BEGINNING | | ENDING ACCOUNT | | EXPENSES PAID |
| | | ACCOUNT VALUE | | VALUE | | DURING PERIOD* |
| | | 10/1/10 | | 3/31/11 | | 10/1/10 - 3/31/11 |
| class A | | | | | | |
| Actual | $ | 1,000.00 | $ | 1,009.70 | $ | 4.46 |
| Hypothetical | $ | 1,000.00 | $ | 1,020.49 | $ | 4.48 |
| (5% return per year before expenses) |
|
| |
| class Y | | | | | | |
| Actual | $ | 1,000.00 | $ | 1,010.50 | $ | 3.48 |
| Hypothetical | $ | 1,000.00 | $ | 1,021.47 | $ | 3.49 |
| (5% return per year before expenses) |
|
*Expenses are equal to the Fund’s annualized expense ratio of 0.89% and 0.69% for Class A and Class Y respectively, multiplied by the average account value over the period, multiplied by 182/365 (to reflect the one-half year period).
www.calvert.com CALVERT ULTRA-SHORT INCOME FUND SEMI-ANNUAL REPORT (UNAUDITED) 11
| | | | |
| SCHEDULE OF INVESTMENTS |
| MARCH 31, 2011 |
| |
| |
| | | PRINCIPAL | | |
| ASSET-BACKED SECURITIES - 9.3% | | AMOUNT | | VALUE |
| AmeriCredit Automobile Receivables Trust: | | | | |
| 2.26%, 5/15/12 | $ | 164,363 | $ | 164,856 |
| 5.68%, 12/12/12 | | 94,101 | | 94,685 |
| 5.21%, 9/6/13 | | 1,220,483 | | 1,240,495 |
| 0.31%, 12/6/13 (r) | | 3,805,675 | | 3,803,802 |
| 5.53%, 1/6/14 | | 700,980 | | 706,266 |
| 1.18%, 2/6/14 | | 1,872,754 | | 1,872,425 |
| 5.26%, 1/6/15 (r) | | 2,262,403 | | 2,293,864 |
| Americredit Prime Automobile Receivable, 0.29%, 4/8/13 (r) | | 609,684 | | 609,639 |
| Bear Stearns Asset Backed Securities Trust, 0.47%, 12/25/35 (r) | | 1,351,244 | | 1,314,504 |
| Capital Auto Receivables Asset Trust: | | | | |
| 5.01%, 4/16/12 | | 78,188 | | 78,797 |
| 5.31%, 6/15/12 | | 952,255 | | 962,413 |
| 5.15%, 9/17/12 | | 2,500,000 | | 2,566,777 |
| 0.535%, 2/18/14 (r) | | 59,398 | | 59,386 |
| Capital One Auto Finance Trust: | | | | |
| 0.285%, 5/15/13 (r) | | 2,901,986 | | 2,885,550 |
| 0.285%, 4/15/14 (r) | | 1,896,553 | | 1,884,029 |
| 5.23%, 7/15/14 | | 3,534,372 | | 3,613,164 |
| CarMax Auto Owner Trust, 5.34%, 10/15/12 | | 920,000 | | 933,114 |
| Caterpillar Financial Asset Trust, 4.94%, 4/25/14 | | 378,465 | | 379,288 |
| Chase Funding Mortgage Loan Asset-Backed Certificates, | | | | |
| 4.396%, 2/25/30 | | 354,200 | | 352,435 |
| CIT Equipment Collateral: | | | | |
| 1.51%, 5/15/12 (e) | | 885,943 | | 887,406 |
| 6.59%, 12/22/14 | | 1,450,527 | | 1,475,332 |
| 3.07%, 8/15/16 (e) | | 458,304 | | 461,718 |
| CitiFinancial Auto Issuance Trust, 1.83%, 11/15/12 (e) | | 175,214 | | 175,652 |
| CNH Equipment Trust, 2.97%, 3/15/13 | | 122,277 | | 122,392 |
| CPS Auto Trust, 6.48%, 7/15/13 (e) | | 2,592,167 | | 2,677,162 |
| Daimler Chrysler Auto Trust, 3.70%, 6/8/12 | | 5,149 | | 5,150 |
| Fifth Third Auto Trust, 4.81%, 1/15/13 | | 1,211,842 | | 1,225,767 |
| Ford Credit Auto Owner Trust, 4.28%, 5/15/12 | | 289,430 | | 291,745 |
| Household Automotive Trust, 5.34%, 9/17/13 | | 2,182,482 | | 2,186,050 |
| JPMorgan Auto Receivables Trust: | | | | |
| 5.14%, 12/15/14 (e) | | 185,566 | | 186,150 |
| 5.22%, 7/15/15 (e) | | 719,932 | | 724,960 |
| Prestige Auto Receivables Trust, 5.58%, 8/15/14 (e) | | 681,652 | | 690,681 |
| World Omni Automobile Lease Securitization Trust, 1.02%, 1/16/12 | | 529,372 | | 529,597 |
| |
| Total Asset-Backed Securities (Cost $37,499,292) | | | | 37,455,251 |
www.calvert.com CALVERT ULTRA-SHORT INCOME FUND SEMI-ANNUAL REPORT (UNAUDITED) 12
| | | | |
| COLLATERALIZED MORTGAGE-BACKED OBLIGATIONS | | PRINCIPAL | | |
| (PRIVATELY ORIGINATED) - 0.7% | | AMOUNT | | VALUE |
| Adjustable Rate Mortgage Trust, 1.05%, 2/25/35 (r) | $ | 2,625 | $ | 2,415 |
| Chase Mortgage Finance Corp.: | | | | |
| 2.875%, 2/25/37 (r) | | 262,630 | | 250,662 |
| 2.903%, 2/25/37 (r) | | 426,745 | | 399,325 |
| Impac CMB Trust: | | | | |
| 1.03%, 10/25/34 (r) | | 3,446 | | 3,012 |
| 0.99%, 11/25/34 (r) | | 24,797 | | 21,751 |
| 0.77%, 4/25/35 (r) | | 4,314 | | 3,506 |
| 0.79%, 5/25/35 (r) | | 307,619 | | 240,483 |
| JP Morgan Mortgage Trust, 5.279%, 7/25/35 (r) | | 215,926 | | 210,430 |
| Merrill Lynch Mortgage Investors, Inc., 2.669%, 12/25/35 (r) | | 217,138 | | 215,334 |
| MLCC Mortgage Investors, Inc.: | | | | |
| 0.62%, 3/25/28 (r) | | 22,816 | | 20,106 |
| 0.48%, 4/25/29 (r) | | 338,341 | | 322,060 |
| 0.81%, 7/25/29 (r) | | 14,292 | | 13,071 |
| 0.48%, 3/25/30 (r) | | 6,275 | | 5,708 |
| Sequoia Mortgage Trust, 0.574%, 11/20/34 (r) | | 29,625 | | 26,217 |
| Structured Asset Mortgage Investments, Inc., 0.44%, 9/25/47 (r) | | 344,553 | | 205,649 |
| WaMu Mortgage Pass Through Certificates, 2.725%, 10/25/35 (r) | | 1,000,000 | | 826,619 |
| |
| Total Collateralized Mortgage-Backed Obligations | | | | |
| (Privately Originated) (Cost $2,475,856) | | | | 2,766,348 |
| |
| |
| |
| COMMERCIAL MORTGAGE-BACKED | | | | |
| SECURITIES - 24.4% | | | | |
| Banc of America Commercial Mortgage, Inc.: | | | | |
| 5.787%, 5/11/35 | | 2,639,052 | | 2,654,206 |
| 6.186%, 6/11/35 | | 5,114,197 | | 5,241,253 |
| 4.576%, 7/10/42 | | 1,000,000 | | 1,007,422 |
| Bank of America-First Union NB Commercial Mortgage, | | | | |
| 5.464%, 4/11/37 | | 3,547,662 | | 3,572,191 |
| Bear Stearns Commercial Mortgage Securities: | | | | |
| 5.61%, 11/15/33 | | 2,505,610 | | 2,533,701 |
| 6.46%, 10/15/36 | | 2,421,563 | | 2,495,534 |
| Credit Suisse First Boston Mortgage Securities Corp.: | | | | |
| 5.435%, 9/15/34 | | 1,402,295 | | 1,414,127 |
| 4.70%, 8/15/36 | | 697,863 | | 707,295 |
| 6.387%, 8/15/36 | | 3,384,603 | | 3,445,552 |
| First Union National Bank Commercial Mortgage: | | | | |
| 6.423%, 8/15/33 | | 972,870 | | 976,138 |
| 6.223%, 12/12/33 | | 1,215,834 | | 1,234,736 |
| 6.141%, 2/12/34 | | 3,532,423 | | 3,632,601 |
| GE Capital Commercial Mortgage Corp.: | | | | |
| 6.531%, 5/15/33 | | 87,049 | | 87,003 |
| 6.29%, 8/11/33 | | 1,087,997 | | 1,094,245 |
| 6.07%, 6/10/38 | | 470,436 | | 478,632 |
| GMAC Commercial Mortgage Securities, Inc.: | | | | |
| 6.70%, 4/15/34 | | 2,489,991 | | 2,497,577 |
| 6.278%, 11/15/39 | | 6,108,093 | | 6,204,248 |
| 4.646%, 4/10/40 | | 76,495 | | 78,411 |
www.calvert.com CALVERT ULTRA-SHORT INCOME FUND SEMI-ANNUAL REPORT (UNAUDITED) 13
| | | | |
| COMMERCIAL MORTGAGE-BACKED | | PRINCIPAL | | |
| SECURITIES - CONT’D | | AMOUNT | | VALUE |
| Greenwich Capital Commercial Funding Corp., 4.883%, 6/10/36 | $ | 655,042 | $ | 667,580 |
| JP Morgan Chase Commercial Mortgage Securities Corp.: | | | | |
| 6.162%, 5/12/34 | | 7,500,000 | | 7,727,050 |
| 6.429%, 4/15/35 | | 3,627,956 | | 3,649,639 |
| 5.857%, 10/12/35 | | 7,657,798 | | 7,682,028 |
| 6.465%, 11/15/35 | | 10,901,420 | | 11,049,612 |
| 4.275%, 1/12/37 | | 2,067,397 | | 2,113,186 |
| LB-UBS Commercial Mortgage Trust: | | | | |
| 6.365%, 12/15/28 | | 2,255,767 | | 2,262,376 |
| 4.51%, 12/15/29 | | 1,877,475 | | 1,892,949 |
| Merrill Lynch Mortgage Trust, 4.892%, 2/12/42 | | 961,994 | | 981,647 |
| Morgan Stanley Capital I: | | | | |
| 4.52%, 12/13/41 | | 1,976,479 | | 1,995,472 |
| 5.007%, 1/14/42 | | 935,093 | | 952,699 |
| Morgan Stanley Dean Witter Capital I: | | | | |
| 6.55%, 7/15/33 | | 1,000,000 | | 1,010,117 |
| 6.51%, 4/15/34 | | 1,657,105 | | 1,699,827 |
| 5.98%, 1/15/39 | | 3,239,617 | | 3,366,671 |
| Prudential Mortgage Capital Funding LLC, 6.605%, 5/10/34 | | 550,648 | | 550,759 |
| Salomon Brothers Mortgage Securities VII, Inc.: | | | | |
| 4.467%, 3/18/36 | | 2,411,290 | | 2,456,408 |
| 6.499%, 11/13/36 | | 5,861,254 | | 5,947,570 |
| Wachovia Bank Commercial Mortgage Trust: | | | | |
| 6.287%, 4/15/34 | | 2,000,000 | | 2,064,844 |
| 5.23%, 7/15/41 (r) | | 185,000 | | 187,341 |
| 4.612%, 5/15/44 | | 487,000 | | 489,777 |
| |
| Total Commercial Mortgage-Backed Securities (Cost $99,301,792) . | | 98,102,424 |
| |
| |
| corPorate Bonds - 50.3% | | | | |
| Achmea Hypotheekbank NV, 0.661%, 11/3/14 (e)(r) | | 750,000 | | 750,004 |
| Agilent Technologies, Inc., 2.50%, 7/15/13 | | 1,000,000 | | 1,008,318 |
| Allegheny Technologies, Inc., 8.375%, 12/15/11 | | 1,240,000 | | 1,302,000 |
| Ally Financial, Inc.: | | | | |
| 6.00%, 4/1/11 | | 1,000,000 | | 999,900 |
| 6.00%, 12/15/11 | | 3,000,000 | | 3,052,500 |
| 1.75%, 10/30/12 | | 1,000,000 | | 1,016,232 |
| 0.309%, 12/19/12 (r) | | 600,000 | | 600,215 |
| American Airlines Equipment Trust 1990, 10.62%, 9/4/11 | | 1,000,000 | | 1,002,500 |
| American Airlines Pass Through Trust: | | | | |
| Series 2001-2, Class A, 7.858%, 4/1/13 | | 3,000,000 | | 3,078,750 |
| Series 2001-2, Class B, 8.608%, 10/1/12 | | 3,000,000 | | 3,000,000 |
| American Express Bank FSB: | | | | |
| 0.378%, 5/29/12 (r) | | 1,000,000 | | 996,750 |
| 0.406%, 6/12/12 (r) | | 1,500,000 | | 1,495,861 |
| American Express Credit Corp.: | | | | |
| 0.414%, 6/16/11 (r) | | 100,000 | | 99,962 |
| 0.368%, 2/24/12 (r) | | 380,000 | | 379,044 |
| American Express Travel, 0.461%, 6/1/11 | | 180,000 | | 179,720 |
| American Express Travel Related Services Co., Inc., 5.25%, | | | | |
| 11/21/11 (e) | | 185,000 | | 189,069 |
www.calvert.com CALVERT ULTRA-SHORT INCOME FUND SEMI-ANNUAL REPORT (UNAUDITED) 14
| | | | |
| | | PRINCIPAL | | |
| CORPORATE BONDS - CONT’D | | AMOUNT | | VALUE |
| American Honda Finance Corp., 1.059%, 6/20/11 (e)(r) | $ | 1,000,000 | $ | 1,000,855 |
| Anheuser-Busch InBev Worldwide, Inc., 0.854%, 1/27/14 (r) | | 1,500,000 | | 1,511,035 |
| ANZ National International Ltd.: | | | | |
| 0.491%, 8/5/11 (e)(r) | | 500,000 | | 500,198 |
| 1.309%, 12/20/13 (e)(r) | | 1,000,000 | | 1,000,011 |
| ArcelorMittal, 3.75%, 3/1/16 | | 1,000,000 | | 997,514 |
| Arrow Electronics, Inc., 3.375%, 11/1/15 | | 1,000,000 | | 986,606 |
| Australia & New Zealand Banking Group Ltd., 0.603%, | | | | |
| 10/21/11 (e)(r) | | 1,000,000 | | 1,001,652 |
| BAC Capital Trust XV, 1.111%, 6/1/56 (r) | | 1,000,000 | | 697,671 |
| Bank of America Corp., 0.588%, 4/30/12 (r) | | 500,000 | | 502,039 |
| Bank of America NA, 0.59%, 6/15/16 (r) | | 2,000,000 | | 1,853,472 |
| Bank of Nova Scotia, 2.90%, 3/29/16 | | 1,000,000 | | 994,225 |
| BankAmerica Capital III, 0.873%, 1/15/27 (r) | | 500,000 | | 384,211 |
| Barclays Bank plc, 1.11%, 3/5/12 (e)(r) | | 425,000 | | 425,791 |
| Barnett Capital III, 0.929%, 2/1/27 (r) | | 500,000 | | 385,012 |
| Bear Stearns Co.’s LLC, 0.501%, 11/28/11 (r) | | 225,000 | | 224,973 |
| Berkshire Hathaway Finance Corp., 0.428%, 1/13/12 (r) | | 2,000,000 | | 2,000,392 |
| Cantor Fitzgerald LP, 6.375%, 6/26/15 (e) | | 820,000 | | 826,203 |
| Capital One Financial Corp., 4.80%, 2/21/12 | | 935,000 | | 966,074 |
| Cellco Partnership, 2.914%, 5/20/11 (r) | | 1,000,000 | | 1,003,071 |
| Charter One Bank, 5.50%, 4/26/11 | | 4,985,000 | | 4,997,160 |
| Chase Capital II, 0.804%, 2/1/27 (r) | | 1,000,000 | | 840,085 |
| Chase Capital VI, 0.929%, 8/1/28 (r) | | 250,000 | | 210,938 |
| Citibank: | | | | |
| 0.303%, 7/12/11 (r) | | 500,000 | | 499,932 |
| 0.341%, 5/7/12 (r) | | 250,000 | | 250,222 |
| Citigroup Funding, Inc., 0.634%, 4/30/12 (r) | | 500,000 | | 502,199 |
| Citigroup, Inc.: | | | | |
| 2.312%, 8/13/13 (r) | | 2,500,000 | | 2,573,726 |
| 0.435%, 3/7/14 (r) | | 1,250,000 | | 1,221,130 |
| 4.587%, 12/15/15 | | 1,000,000 | | 1,030,214 |
| Continental Airlines Pass Through Trust, 8.499%, 5/1/11 | | 851,085 | | 851,085 |
| Cooperatieve Centrale Raiffeisen-Boerenleenbank BA, | | | | |
| 4.20%, 5/13/14 (e) | | 1,000,000 | | 1,057,131 |
| Credit Agricole SA, 0.49%, 6/7/11 (e)(r) | | 400,000 | | 399,712 |
| Credit Suisse USA, Inc., 0.514%, 8/16/11 (r) | | 1,100,000 | | 1,100,379 |
| CVS Caremark Corp., 6.302% to 6/1/12, | | | | |
| floating rate thereafter to 6/1/62 (r) | | 500,000 | | 489,897 |
| CVS Pass-Through Trust, 7.77%, 1/10/12 (e) | | 298,522 | | 311,465 |
| Dell, Inc., 0.91%, 4/1/14 (r) | | 2,000,000 | | 2,004,208 |
| Deutsche Bank AG, 0.953%, 1/18/13 (r) | | 2,000,000 | | 2,006,900 |
| Deutsche Bank Capital Trust, 4.901%, 12/29/49 (b)(r) | | 200,000 | | 164,000 |
| Developers Diversified Realty Corp., 5.25%, 4/15/11 | | 1,500,000 | | 1,500,375 |
| DISH DBS Corp., 6.375%, 10/1/11 | | 500,000 | | 510,000 |
| Dominion Resources, Inc., 6.30% to 9/30/11, | | | | |
| floating rate thereafter to 9/30/66 (r) | | 3,797,000 | | 3,749,537 |
| Dow Chemical Co.: | | | | |
| 2.562%, 8/8/11 (r) | | 500,000 | | 503,053 |
| 4.85%, 8/15/12 | | 1,250,000 | | 1,309,538 |
www.calvert.com CALVERT ULTRA-SHORT INCOME FUND SEMI-ANNUAL REPORT (UNAUDITED) 15
| | | | |
| | | PRINCIPAL | | |
| CORPORATE BONDS - CONT’D | | AMOUNT | | VALUE |
| Dr Pepper Snapple Group, Inc., 2.35%, 12/21/12 | $ | 1,000,000 | $ | 1,019,294 |
| Enterprise Products Operating LLC, 3.20%, 2/1/16 | | 1,000,000 | | 993,957 |
| Fifth Third Bank, 0.424%, 5/17/13 (r) | | 2,560,000 | | 2,510,255 |
| Fleet Capital Trust V, 1.309%, 12/18/28 (r) | | 1,000,000 | | 761,094 |
| Ford Motor Credit Co. LLC: | | | | |
| 5.56%, 6/15/11 (r) | | 2,250,000 | | 2,255,625 |
| 7.25%, 10/25/11 | | 1,000,000 | | 1,025,000 |
| 3.053%, 1/13/12 (r) | | 3,055,000 | | 3,081,762 |
| 7.80%, 6/1/12 | | 500,000 | | 530,000 |
| Foster’s Finance Corp., 6.875%, 6/15/11 (e) | | 2,300,000 | | 2,322,318 |
| GameStop Corp., 8.00%, 10/1/12 | | 883,000 | | 899,556 |
| General Electric Capital Corp.: | | | | |
| 0.61%, 6/8/12 (r) | | 150,000 | | 150,668 |
| 0.429%, 6/20/13 (r) | | 1,000,000 | | 987,332 |
| GenOn Americas Generation LLC, 8.30%, 5/1/11 | | 4,000,000 | | 4,010,000 |
| Georgia-Pacific LLC, 8.125%, 5/15/11 | | 3,000,000 | | 3,022,500 |
| Glitnir Banki HF: | | | | |
| 2.95%, 10/15/08 (b)(y)* | | 120,000 | | 36,900 |
| 3.046%, 4/20/10 (e)(r)(y)* | | 50,000 | | 15,250 |
| 3.226%, 1/21/11 (e)(r)(y)* | | 30,000 | | 8,700 |
| Goldman Sachs Capital III, 1.081%, 9/29/49 (r) | | 500,000 | | 394,592 |
| Goldman Sachs Group, Inc.: | | | | |
| 0.562%, 11/9/11 (r) | | 500,000 | | 500,981 |
| 0.51%, 3/15/12 (r) | | 300,000 | | 300,645 |
| 1.311%, 2/7/14 (r) | | 2,000,000 | | 2,010,788 |
| 0.759%, 3/22/16 (r) | | 2,000,000 | | 1,928,353 |
| HCP, Inc., 5.95%, 9/15/11 | | 3,000,000 | | 3,069,438 |
| Hewlett-Packard Co., 1.361%, 5/27/11 (r) | | 800,000 | | 801,256 |
| HSBC Bank plc, 1.103%, 1/17/14 (e)(r) | | 1,500,000 | | 1,499,165 |
| ING Bank NV: | | | | |
| 1.623%, 10/18/13 (e)(r) | | 2,000,000 | | 1,999,996 |
| 4.00%, 3/15/16 (e) | | 1,000,000 | | 997,953 |
| International Business Machines Corp., 0.351%, 11/4/11 (r) | | 1,000,000 | | 1,000,538 |
| International Lease Finance Corp., 5.75%, 6/15/11 | | 1,000,000 | | 1,005,000 |
| John Deere Capital Corp., 1.06%, 6/10/11 (r) | | 300,000 | | 300,405 |
| JPMorgan Chase & Co.: | | | | |
| 0.433%, 4/1/11 (r) | | 500,000 | | 500,000 |
| 0.54%, 6/15/12 (r) | | 300,000 | | 301,069 |
| 0.559%, 12/26/12 (r) | | 500,000 | | 502,453 |
| JPMorgan Chase Bank, 0.64%, 6/13/16 (r) | | 3,500,000 | | 3,311,774 |
| JPMorgan Chase Capital XXIII, 1.313%, 5/15/77 (r) | | 1,000,000 | | 827,705 |
| Lafarge SA, 6.15%, 7/15/11 | | 2,000,000 | | 2,029,218 |
| Leucadia National Corp., 8.125%, 9/15/15 | | 500,000 | | 552,231 |
| Manufacturers & Traders Trust Co., 1.803%, 4/1/13 (r) | | 2,700,000 | | 2,694,660 |
| Masco Corp., 4.80%, 6/15/15 | | 750,000 | | 744,456 |
| MBNA Capital, 1.104%, 2/1/27 (r) | | 250,000 | | 192,407 |
| Medco Health Solutions, Inc., 7.25%, 8/15/13 | | 75,000 | | 84,033 |
| Medtronic, Inc., 1.25%, 9/15/21 | | 420,000 | | 416,850 |
| Merrill Lynch & Co., Inc.: | | | | |
| 0.763%, 1/15/15 (r) | | 206,000 | | 199,311 |
| 1.07%, 9/15/26 (r) | | 300,000 | | 233,983 |
www.calvert.com CALVERT ULTRA-SHORT INCOME FUND SEMI-ANNUAL REPORT (UNAUDITED) 16
| | | | |
| | | PRINCIPAL | | |
| CORPORATE BONDS - CONT’D | | AMOUNT | | VALUE |
| MetLife Institutional Funding II: | | | | |
| 0.709%, 3/27/12 (e)(r) | $ | 1,000,000 | $ | 1,000,012 |
| 0.703%, 7/12/12 (e)(r) | | 1,000,000 | | 1,001,896 |
| MetLife, Inc.: | | | | |
| 0.628%, 6/29/12 (r) | | 600,000 | | 602,030 |
| 1.561%, 8/6/13 (r) | | 2,000,000 | | 2,021,053 |
| Metropolitan Life Global Funding I: | | | | |
| 2.303%, 4/14/11 (e)(r) | | 250,000 | | 250,050 |
| 0.703%, 7/13/11 (e)(r) | | 1,650,000 | | 1,649,954 |
| 0.56%, 3/15/12 (e)(r) | | 800,000 | | 796,961 |
| Morgan Stanley: | | | | |
| 0.592%, 2/10/12 (r) | | 200,000 | | 200,502 |
| 3.45%, 11/2/15 | | 1,000,000 | | 980,647 |
| 0.753%, 10/18/16 (r) | | 1,000,000 | | 935,258 |
| Motors Liquidation Co., 8.375%, 7/15/33 (ii)* | | 500,000 | | 147,500 |
| NationsBank Cap Trust III, 0.853%, 1/15/27 (r) | | 930,000 | | 716,908 |
| Nationwide Building Society, 0.494%, 5/17/12 (e)(r) | | 600,000 | | 599,922 |
| Nevada Power Co., 8.25%, 6/1/11 | | 2,000,000 | | 2,023,759 |
| NextEra Energy Capital Holdings, Inc., 0.712%, 11/9/12 (r) | | 800,000 | | 801,943 |
| Nissan Motor Acceptance Corp., 3.25%, 1/30/13 (e) | | 1,000,000 | | 1,020,281 |
| Offshore Group Investments Ltd., 11.50%, 8/1/15 | | 250,000 | | 277,377 |
| OPTI Canada, Inc., 9.00%, 12/15/12 (e) | | 1,000,000 | | 1,008,750 |
| PNC Funding Corp.: | | | | |
| 0.444%, 1/31/12 (r) | | 1,000,000 | | 998,917 |
| 0.503%, 4/1/12 (r) | | 500,000 | | 501,383 |
| 0.504%, 1/31/14 (r) | | 1,000,000 | | 990,099 |
| Pricoa Global Funding I, 0.404%, 1/30/12 (e)(r) | | 400,000 | | 397,681 |
| Prudential Holdings LLC, 1.184%, 12/18/17 (e)(r) | | 1,000,000 | | 934,035 |
| Quest Diagnostics, Inc., 1.159%, 3/24/14 (r) | | 1,000,000 | | 1,001,911 |
| Rabobank Nederland NV, 0.511%, 8/5/11 (e)(r) | | 800,000 | | 799,869 |
| Rio Tinto Alcan, Inc., 4.50%, 5/15/13 | | 1,000,000 | | 1,063,027 |
| SABMiller plc, 6.20%, 7/1/11 (e) | | 150,000 | | 151,800 |
| Sanofi-Aventis SA, 0.358%, 3/28/12 (r) | | 3,000,000 | | 3,000,031 |
| Seagate Technology HDD Holdings, 6.375%, 10/1/11 | | 2,100,000 | | 2,142,000 |
| Senior Housing Properties Trust, 8.625%, 1/15/12 | | 2,650,000 | | 2,772,562 |
| Skyway Concession Co. LLC, 0.587%, 6/30/17 (e)(r) | | 60,000 | | 54,681 |
| Southern Co., 0.703%, 10/21/11 (r) | | 1,000,000 | | 1,002,319 |
| Stadshypotek AB, 0.857%, 9/30/13 (e)(r) | | 2,000,000 | | 2,000,019 |
| State Street Bank and Trust Co., 0.51%, 9/15/11 (r) | | 500,000 | | 500,534 |
| Steel Dynamics, Inc., 7.375%, 11/1/12 | | 1,000,000 | | 1,065,000 |
| Steelcase, Inc., 6.50%, 8/15/11 | | 1,195,000 | | 1,215,902 |
| Sunoco, Inc., 6.75%, 4/1/11 | | 2,385,000 | | 2,384,907 |
| SunTrust Bank: | | | | |
| 0.424%, 5/21/12 (r) | | 2,000,000 | | 1,995,669 |
| 0.603%, 8/24/15 (r) | | 750,000 | | 708,492 |
| SunTrust Banks, Inc., 3.60%, 4/15/16 | | 500,000 | | 496,675 |
| SunTrust Capital I, 0.983%, 5/15/27 (r) | | 1,000,000 | | 777,740 |
| Svenska Handelsbanken AB, 1.31%, 9/14/12 (e)(r) | | 700,000 | | 706,012 |
| Systems 2001 AT LLC: | | | | |
| 7.156%, 12/15/11 (e) | | 833,332 | | 853,166 |
| 6.664%, 9/15/13 (e) | | 1,541,094 | | 1,645,118 |
| TD Ameritrade Holding Corp., 2.95%, 12/1/12 | | 1,000,000 | | 1,021,019 |
| Telecom Italia Capital SA, 6.20%, 7/18/11 | | 2,500,000 | | 2,536,114 |
www.calvert.com CALVERT ULTRA-SHORT INCOME FUND SEMI-ANNUAL REPORT (UNAUDITED) 17
| | | | |
| | | PRINCIPAL | | |
| CORPORATE BONDS - CONT’D | | AMOUNT | | VALUE |
| Telefonica Emisiones SAU, 5.984%, 6/20/11 | $ | 2,000,000 | $ | 2,021,132 |
| TELUS Corp., 8.00%, 6/1/11 | | 599,000 | | 606,000 |
| The Bank of Tokyo-Mitsubishi UFJ Ltd., 7.40%, 6/15/11 | | 2,000,000 | | 2,030,000 |
| Toll Road Investors Partnership II LP, Zero Coupon: | | | | |
| 2/15/43 (b)(e) | | 500,000 | | 131,890 |
| 2/15/45 (b)(e) | | 551,416 | | 84,074 |
| Total Capital Canada Ltd., 0.684%, 1/17/14 (r) | | 2,000,000 | | 2,001,680 |
| Travelers Insurance Company Ltd., 0.553%, 12/8/11 (r) | | 250,000 | | 249,241 |
| Union Pacific Railroad Co. 2004 Pass Through Trust, 5.214%, | | | | |
| 9/30/14 (e) | | 370,000 | | 393,639 |
| US Bank, 3.778% to 4/29/15, floating rate thereafter to 4/29/20 (r) | | 1,500,000 | | 1,525,573 |
| Verizon Communications, Inc., 0.919%, 3/28/14 (r) | | 4,000,000 | | 4,013,174 |
| Volkswagen International Finance NV, 0.757%, 10/1/12 (e)(r) | | 3,000,000 | | 2,999,126 |
| Wachovia Capital Trust III, 5.57% to 3/15/11, floating rate | | | | |
| thereafter to 3/29/49 (r) | | 3,000,000 | | 2,752,500 |
| Wells Fargo & Co., 0.53%, 6/15/12 (r) | | 500,000 | | 501,521 |
| Western Union Co., 0.89%, 3/7/13 (r) | | 3,000,000 | | 3,004,090 |
| Westpac Banking Corp.: | | | | |
| 0.603%, 10/21/11 (e)(r) | | 750,000 | | 750,207 |
| 1.037%, 3/31/14 (e)(r) | | 2,500,000 | | 2,500,023 |
| Williams Partners LP, 7.50%, 6/15/11 | | 2,794,000 | | 2,830,958 |
| Wm. Wrigley Jr. Co., 1.684%, 6/28/11 (e)(r) | | 2,500,000 | | 2,501,046 |
| Xerox Corp., 6.875%, 8/15/11 | | 2,400,000 | | 2,454,885 |
| Xstrata Finance Canada Ltd., 5.50%, 11/16/11 (e) | | 2,000,000 | | 2,038,358 |
| Yara International ASA, 5.25%, 12/15/14 (e) | | 995,000 | | 1,048,952 |
| |
| Total Corporate Bonds (Cost $199,906,326) | | | | 202,713,741 |
| |
| |
| U.S. GOVERNMENT AGENCIES | | | | |
| AND INSTRUMENTALITIES - 2.1% | | | | |
| AgFirst FCB, 8.393% to 12/15/11, | | | | |
| floating rate thereafter to 12/15/16 (r) | | 4,655,000 | | 4,841,200 |
| Overseas Private Investment Corp.: | | | | |
| 0.22%, 8/15/17 (b)(r) | | 2,000,000 | | 2,000,000 |
| 0.22%, 8/15/17 (b)(r) | | 1,500,000 | | 1,500,000 |
| US AgBank FCB, 6.11% to 7/10/12, | | | | |
| floating rate thereafter to 12/31/49 (e)(r) | | 300,000 | | 201,000 |
| |
| Total U.S. Government Agencies and Instrumentalities | | | | |
| (Cost $8,333,499) | | | | 8,542,200 |
| |
| |
| U.S. TREASURY - 1.6% | | | | |
| United States Treasury Notes: | | | | |
| 1.25%, 3/15/14 | | 360,000 | | 359,888 |
| 2.125%, 2/29/16 | | 1,111,000 | | 1,107,355 |
| 3.625%, 2/15/21 | | 5,000,000 | | 5,071,875 |
| |
| Total U.S. Treasury (Cost $6,600,930) | | | | 6,539,118 |
www.calvert.com CALVERT ULTRA-SHORT INCOME FUND SEMI-ANNUAL REPORT (UNAUDITED) 18
| | | | | | | |
| | | | | PRINCIPAL | | | |
| MUNICIPAL OBLIGATIONS - 2.4% | | | | AMOUNT | | VALUE | |
| California State Pollution Control Financing Authority Revenue | | | | | |
| VRDN, 0.23%, 11/1/26 (r) | | | $ | 8,490,000 | $ | 8,490,000 | |
| CIDC-Hudson House LLC New York Revenue | | | | | | |
| VRDN, 0.80%, 12/1/34 (r) | | | | 50,000 | | 50,000 | |
| Illinois State GO Bonds, 4.961%, 3/1/16 | | | | 1,000,000 | | 1,000,610 | |
| |
| Total Municipal Obligations (Cost $9,540,000) | | | | | 9,540,610 | |
| |
| |
| FLOATING RATE LOANS(d) - 0.7% | | | | | | | |
| Clear Channel Communications, Inc., Term Loan B, | | | | | | |
| 3.912%, 1/29/16 (r) | | | | 2,000,000 | | 1,758,612 | |
| Syniverse Holdings, Inc., Term Loan, 5.25%, 12/21/17 (r) | | | 1,000,000 | | 1,006,825 | |
| |
| Total Floating Rate Loans (Cost $2,842,808) | | | | | 2,765,437 | |
| |
| |
| EQUITY SECURITIES - 0.2% | | | | SHARES | | | |
| Woodbourne Capital, Trust II, Preferred (b)(e) | | | 1,000,000 | | 700,000 | |
| |
| Total Equity Securities (Cost $450,000) | | | | | 700,000 | |
| |
| |
| TOTAL INVESTMENTS (Cost $366,950,503) - 91.7% | | | | 369,125,129 | |
| Other assets and liabilities, net - 8.3% | | | | | 33,332,175 | |
| NET ASSETS - 100% | | | | | $ | 402,457,304 | |
| |
| |
| | | | | UNDERLYING | | UNREALIZED | |
| | # OF | EXPIRATION | | FACE AMOUNT | | APPRECIATION | |
| FUTURES | CONTRACTS | DATE | | AT VALUE | | (DEPRECIATION) | |
| Purchased: | | | | | | | |
| 10 Year U.S. Treasury Notes | 65 | 6/11 | $ | 7,737,031 | | $ 10,131 | |
| 30 Year U.S. Treasury Bonds | 14 | 6/11 | | 1,682,625 | | 1,297 | |
| Total Purchased | | | | | | $ 11,428 | |
| |
| Sold: | | | | | | | |
| 2 Year U.S. Treasury Notes | 462 | 6/11 | $ | 100,773,750 | | ($ 39,141 | ) |
| 5 Year U.S. Treasury Notes | 9 | 6/11 | | 1,051,102 | | 6,670 | |
| Total Sold | | | | | | ($ 32,471 | ) |
See notes to financial statements.
www.calvert.com CALVERT ULTRA-SHORT INCOME FUND SEMI-ANNUAL REPORT (UNAUDITED) 19
| (b) | This security was valued by the Board of Trustees. See Note A. |
| |
| (d) | Remaining maturities of floating rate loans may be less than the stated maturities shown as a result of contrac- tual or optional prepayments by the borrower. Such prepayments cannot be predicted with certainty. Floating rate loans generally pay interest at rates which are periodically re-determined at a margin above the London InterBank Offered Rate (LIBOR) or other short-term rates. The rate shown is the rate in effect at period end. |
| | Floating rate loans are generally considered restrictive in that the Fund is ordinarily contractually obligated to receive consent from the Agent Bank and/or Borrower prior to disposition of a floating rate loan. |
| |
| (e) | Security is exempt from registration under Rule 144A of the Securities Act of 1933. These securities may be resold in transactions exempt from registration, normally to qualified institutional buyers. |
| |
| (r) | The coupon rate shown on floating or adjustable rate securities represents the rate at period end. |
| |
| (y) | The government of Iceland took control of Glitnir Banki HF (the “Bank”) on October 8, 2008. The government has prohibited the Bank from paying any claims owed to foreign entities. These securities are no longer accruing interest. |
| |
| (ii) | General Motors filed for Chapter 11 bankruptcy on June 1, 2009. This security is no longer accruing interest. Subsequent to period end, the Fund received a distribution of new GM stock and new GM war- rants in exchange for the Motors Liquidation Co. Notes. |
| |
| * | Non-income producing security. |
Abbreviations:
FCB: Farm Credit Bank
FSB: Federal Savings Bank
GO: General Obligation
LLC: Limited Liability Corporation
LP: Limited Partnership
VRDN: Variable Rate Demand Notes
See notes to financial statements.
www.calvert.com CALVERT ULTRA-SHORT INCOME FUND SEMI-ANNUAL REPORT (UNAUDITED) 20
STATEMENT OF ASSETS AND LIABILITIES
MARCH 31, 2011
| ASSETS | | | |
| Investments in securities, at value (Cost $366,950,503) - | | | |
| see accompanying schedule | $ | 369,125,129 | |
| Cash | | 27,824,092 | |
| Receivable for securities sold | | 5,425,564 | |
| Receivable for shares sold | | 9,202,290 | |
| Interest and dividends receivable | | 2,677,755 | |
| Other assets | | 351,421 | |
| Total assets | | 414,606,251 | |
| |
| |
| LIABILITIES | | | |
| Payable for securities purchased | | 9,252,994 | |
| Payable for shares redeemed | | 2,551,841 | |
| Payable for futures variation margin | | 34,547 | |
| Payable to Calvert Asset Management Company, Inc. | | 117,825 | |
| Payable to Calvert Administrative Services Company | | 80,256 | |
| Payable to Calvert Shareholder Services, Inc. | | 5,964 | |
| Payable to Calvert Distributors, Inc. | | 68,222 | |
| Accrued expenses and other liabilities | | 37,298 | |
| Total liabilities | | 12,148,947 | |
| |
| NET ASSETS | $ | 402,457,304 | |
| |
| |
| NET ASSETS CONSIST OF: | | | |
| Paid-in capital applicable to the following shares of beneficial interest, | | | |
| unlimited number of no par value shares authorized: | | | |
| Class A: 21,667,530 shares outstanding | $ | 336,306,515 | |
| Class Y: 4,021,410 shares outstanding | | 63,257,828 | |
| Undistributed net investment income (loss) | | (876,834 | ) |
| Accumulated net realized gain (loss) on investments | | 1,616,212 | |
| Net unrealized appreciation (depreciation) on investments | | 2,153,583 | |
| |
| |
| NET ASSETS | $ | 402,457,304 | |
| |
| NET ASSET VALUE PER SHARE: | | | |
| Class A (based on net assets of $339,318,542) | $ | 15.66 | |
| Class Y (based on net assets of $63,138,762) | $ | 15.70 | |
See notes to financial statements.
www.calvert.com CALVERT ULTRA-SHORT INCOME FUND SEMI-ANNUAL REPORT (UNAUDITED) 21
| | | |
| STATEMENT OF OPERATIONS |
| SIX MONTHS ENDED MARCH 31, 2011 |
| |
| |
| NET INVESTMENT INCOME | | | |
| Investment Income: | | | |
| Interest income | $ | 4,279,955 | |
| Dividend income (net of foreign taxes withheld of $7) | | 12,866 | |
| Total investment income | | 4,292,821 | |
| |
| Expenses: | | | |
| Investment advisory fee | | 486,151 | |
| Administrative fees | | 405,125 | |
| Transfer agency fees and expenses | | 267,281 | |
| Distribution Plan expenses: | | | |
| Class A | | 346,120 | |
| Trustees’ fees and expenses | | 8,114 | |
| Custodian fees | | 34,151 | |
| Accounting fees | | 24,918 | |
| Registration fees | | 27,090 | |
| Reports to shareholders | | 39,321 | |
| Professional fees | | 12,088 | |
| Miscellaneous | | 7,694 | |
| Total expenses | | 1,658,053 | |
| Reimbursement from Advisor: | | | |
| Class A | | (261,037 | ) |
| Fees paid indirectly | | (1,154 | ) |
| Net expenses | | 1,395,862 | |
| |
| NET INVESTMENT INCOME | | 2,896,959 | |
| |
| REALIZED AND UNREALIZED GAIN (LOSS) | | | |
| Net realized gain (loss) on: | | | |
| Investments | | 1,404,512 | |
| Futures | | 109,496 | |
| | | 1,514,008 | |
| |
| Change in unrealized appreciation (depreciation) on: | | | |
| Investments | | (1,388,551 | ) |
| Futures | | 180,221 | |
| | | (1,208,330 | ) |
| |
| NET REALIZED AND UNREALIZED GAIN | | | |
| (LOSS) | | 305,678 | |
| |
| INCREASE (DECREASE) IN NET ASSETS | | | |
| RESULTING FROM OPERATIONS | $ | 3,202,637 | |
See notes to financial statements.
www.calvert.com CALVERT ULTRA-SHORT INCOME FUND SEMI-ANNUAL REPORT (UNAUDITED) 22
STATEMENTS OF CHANGES IN NET ASSETS
| | | SIX MONTHS ENDED | | | YEAR ENDED | |
| | | MARCH
31, | | | SEPTEMBER 30, | |
| INCREASE (DECREASE) IN NET ASSETS | | 2011 | | | 2010 | |
| Operations: | | | | | | |
| Net investment income | $ | 2,896,959 | | $ | 3,051,099 | |
| Net realized gain (loss) on investments | | 1,514,008 | | | 1,574,203 | |
| Change in unrealized appreciation (depreciation) | | (1,208,330 | ) | | 1,413,311 | |
| |
| INCREASE (DECREASE) IN NET ASSETS | | | | | | |
| RESULTING FROM OPERATIONS | | 3,202,637 | | | 6,038,613 | |
| |
| Distributions to shareholders from: | | | | | | |
| Net investment income: | | | | | | |
| Class A shares | | (3,208,297 | ) | | (2,657,904 | ) |
| Class Y shares | | (593,114 | ) | | (138,380 | ) |
| Net realized gain: | | | | | | |
| Class A shares | | (1,414,272 | ) | | (728,246 | ) |
| Class Y shares | | (231,350 | ) | | — | |
| Total distributions | | (5,447,033 | ) | | (3,524,530 | ) |
| |
| Capital share transactions: | | | | | | |
| Shares sold: | | | | | | |
| Class A shares | | 182,699,339 | | | 263,983,680 | |
| Class Y shares | | 42,348,901 | | | 43,789,323 | |
| Reinvestment of distributions: | | | | | | |
| Class A shares | | 4,002,540 | | | 2,918,935 | |
| Class Y shares | | 438,324 | | | 67,565 | |
| Redemption fees: | | | | | | |
| Class A shares | | 1,236 | | | 2,171 | |
| Class Y shares | | 2,688 | | | 1,592 | |
| Shares redeemed: | | | | | | |
| Class A shares | | (86,705,956 | ) | | (121,841,396 | ) |
| Class Y shares | | (16,608,919 | ) | | (6,782,437 | ) |
| Total capital share transactions | | 126,178,153 | | | 182,139,433 | |
| |
| |
| TOTAL INCREASE (DECREASE) IN NET ASSETS | | 123,933,757 | | | 184,653,516 | |
See notes to financial statements.
www.calvert.com CALVERT ULTRA-SHORT INCOME FUND SEMI-ANNUAL REPORT (UNAUDITED) 23
STATEMENTS OF CHANGES IN NET ASSETS
| | | | | | |
| INCREASE (DECREASE) IN NET ASSETS - (CONT’D) | | | | | | |
| | | SIX MONTHS ENDED | | | YEAR
ENDED | |
| | | MARCH
31, | | | SEPTEMBER 30, | |
| NET ASSETS | | 2011 | | | 2010 | |
| Beginning of period | $ | 278,523,547 | | $ | 93,870,031 | |
| End of period (including distributions in excess of net investment | | | | | | |
| income and undistributed net investment income | | | | | | |
| of $876,834 and $27,618, respectively) | $ | 402,457,304 | | $ | 278,523,547 | |
| |
| |
| CAPITAL SHARE ACTIVITY | | | | | | |
| Shares sold: | | | | | | |
| Class A shares | | 11,641,667 | | | 16,841,241 | |
| Class Y shares | | 2,691,194 | | | 2,782,351 | |
| Reinvestment of distributions: | | | | | | |
| Class A shares | | 255,332 | | | 186,214 | |
| Class Y shares | | 27,898 | | | 4,278 | |
| Shares redeemed: | | | | | | |
| Class A shares | | (5,524,107 | ) | | (7,758,030 | ) |
| Class Y shares | | (1,055,065 | ) | | (429,246 | ) |
| Total capital share activity | | 8,036,919 | | | 11,626,808 | |
See notes to financial statements.
www.calvert.com CALVERT ULTRA-SHORT INCOME FUND SEMI-ANNUAL REPORT (UNAUDITED) 24
NOTES TO FINANCIAL STATEMENTS
NOTE A –– SIGNIFICANT ACCOUNTING POLICIES
General: The Calvert Ultra-Short Income Fund (the “Fund”), a series of The Calvert Fund, is registered under the Investment Company Act of 1940 as a non-diversified, open-end management investment company. The operations of each series are accounted for separately. The Fund offers Class A and Class Y shares of beneficial interest. Class Y shares commenced operations on May 28, 2010. Class A shares are sold with a maximum front-end sales charge of 1.25%. Class Y shares are generally only available to wrap or similar fee-based programs offered by financial intermediaries that have entered into an agreement with the Fund’s Distributor to offer Class Y shares. Class Y shares have no front-end or deferred sales charge and have lower levels of expenses than Class A shares. Each class has different: (a) dividend rates due to differences in Distribution Plan expenses and other class specific expenses, (b) exchange privileges and (c) class specific voting rights.
Security Valuation: Net asset value per share is determined every business day as of the close of the regular session of the New York Stock Exchange (generally 4:00 p.m. Eastern time). The Fund uses independent pricing services approved by the Board of Trustees to value its investments wherever possible. Investments for which market quotations are not available or deemed not reliable are fair valued in good faith under the direction of the Board of Trustees. In determining fair value, the Board considers all relevant qualitative and quantitative information available. These factors are subject to change over time and are reviewed periodically. The values assigned to fair value investments are based on available information and do not necessarily represent amounts that might ultimately be realized. Further, because of the inherent uncertainty of valuation, those estimated values may differ significantly from the values that would have been used had a ready market for the investments existed, and the differences could be material.
At March 31, 2011, securities valued at $4,616,864 or 1.1% of net assets were fair valued in good faith under the direction of the Board of Trustees.
The Fund utilizes various methods to measure the fair value of its investments. Generally Accepted Accounting Principles (GAAP) establishes a disclosure hierarchy that categorizes the inputs to valuation techniques used to value assets and liabilities at measurement date. These inputs are summarized in the three broad levels listed below: Level 1 – quoted prices in active markets for identical securities Level 2 – other significant observable inputs (including quoted prices for similar securities, interest rates, prepayment speeds, credit risk, etc.) Level 3 – significant unobservable inputs (including the Fund’s own assumptions in determining the fair value of investments) The inputs or methodology used for valuing securities are not necessarily an indication of the risk associated with investing in those securities.
Changes in valuation techniques may result in transfers in or out of an investment’s assigned level within the hierarchy during the period. Valuation techniques used to value the Fund’s investments by major category are as follows.
www.calvert.com CALVERT ULTRA-SHORT INCOME FUND SEMI-ANNUAL REPORT (UNAUDITED) 25
Debt securities, including restricted securities, are valued based on evaluated prices received from independent pricing services or from dealers who make markets in such securities. For corporate bonds, floating rate loans, municipal securities, and U.S. government and government agency obligations, pricing services utilize matrix pricing which considers yield or price of bonds of comparable quality, coupon, maturity and type as well as dealer supplied prices and are generally categorized as Level 2 in the hierarchy. For asset backed securities, collateralized mortgage obligations, and commercial mortgage securities, pricing services utilize matrix pricing which considers prepayment speed assumptions, attributes of the collateral, yield or price of bonds of comparable quality, coupon, maturity and type as well as dealer supplied prices and, accordingly, such securities are generally categorized as Level 2 in the hierarchy. Short-term securities with remaining maturities of sixty days or less for which quotations are not readily available are valued at amortized cost, which approximates fair value, and are categorized as Level 2 in the hierarchy.
When independent prices are unavailable or unreliable, debt securities may be valued utilizing pricing matrices which consider similar factors that would be used by independent pricing services. These are generally categorized as Level 2 in the hierarchy but may be Level 3 depending on the circumstances.
Equity securities, including restricted securities, for which market quotations are readily available, are valued at the last reported sale price or official closing price as reported by an independent pricing service on the primary market or exchange on which they are traded and are categorized as Level 1 in the hierarchy. Foreign securities are valued based on quotations from the principle market in which such securities are normally traded. If events occur after the close of the principle market in which foreign securities are traded, and before the close of business of the Fund, that are expected to materially affect the value of those securities, then they are valued at their fair value taking these events into account. For restricted securities and private placements where observable inputs are limited, assumptions about market activity and risk are used and are categorized as Level 3 in the hierarchy.
The following is a summary of the inputs used to value the Fund’s net assets as of March 31, 2011:
| | | | | | | | | | | |
| | valuatIonInPuts |
| InvestMents In securItIes | | level 1 | | | level 2 | | level 3 | | | total | |
| Equity securities | | - | | | - | $ | 700,000 | | $ | 700,000 | |
| Asset-backed securities | | - | | $ | 37,455,251 | | - | | | 37,455,251 | |
| Collateralized mortgage-backed | | | | | | | | | | | |
| obligations | | - | | | 2,766,348 | | - | | | 2,766,348 | |
| Commercial mortgage-backed | | | | | | | | | | | |
| securities | | - | | | 98,102,424 | | - | | | 98,102,424 | |
| Corporate debt | | - | | | 202,428,767 | | 284,974 | | | 202,713,741 | |
| Municipal obligations | | - | | | 9,540,610 | | - | | | 9,540,610 | |
| U.S. government obligations | | - | | | 11,581,318 | | 3,500,000 | | | 15,081,318 | |
| Other debt obligations | | - | | | 2,765,437 | | - | | | 2,765,437 | |
| TOTAL | | - | | $ | 364,640,155 | $ | 4,484,974 | ** | $ | 369,125,129 | |
| Other financial instruments* | ($ | 21,043 | ) | | - | | - | | ($ | 21,043 | ) |
www.calvert.com CALVERT ULTRA-SHORT INCOME FUND SEMI-ANNUAL REPORT (UNAUDITED) 26
* Other financial instruments are derivative instruments not reflected in the Portfolio of Investments, such as futures, which are valued at the unrealized appreciation/depreciation on the instrument.
**Level 3 securities represent 1.1% of net assets.
Repurchase Agreements: The Fund may enter into repurchase agreements with recognized financial institutions or registered broker/dealers and, in all instances, holds underlying securities with a value exceeding the total repurchase price, including accrued interest. Although risk is mitigated by the collateral, the Fund could experience a delay in recovering its value and a possible loss of income or value if the counterparty fails to perform in accordance with the terms of the agreement.
Loan Participations and Assignments: The Fund may invest in direct debt instruments which are interests in amounts owed to lenders or lending syndicates by corporate, governmental, or other borrowers. A Fund’s investments in loans may be in the form of participations in loans or assignments of all or a portion of loans from third parties. A loan is often administered by a bank or other financial institution (the “lender”) that acts as agent for all holders. The agent administers the terms of the loan, as specified in the loan agreement. A Fund may invest in multiple series or tranches of a loan, which may have varying terms and carry different associated risks. A Fund generally has no right to enforce compliance with the terms of the loan agreement with the borrower. As a result, a Fund may be subject to the credit risk of both the borrower and the lender that is selling the loan agreement. When a Fund purchases assignments from lenders it acquires direct rights against the borrower of the loan. When investing in a loan participation, a Fund has the right to receive payments of principal, interest and any fees to which it is entitled only from the lender selling the loan agreement and only upon receipt of payments by the lender from the borrower.
Futures Contracts: The Fund may purchase and sell futures contracts, but only when, in the judgment of the Advisor, such a position acts as a hedge. The Fund may not enter into futures contracts for the purpose of speculation or leverage. These futures contracts may include, but are not limited to, futures contracts based on U.S. Government obligations. The Fund is subject to interest rate risk in the normal course of pursuing its investment objectives. The Fund may use futures contracts to hedge against changes in the value of interest rates. The Fund may enter into futures contracts agreeing to buy or sell a financial instrument for a set price at a future date. Initial margin deposits of either cash or securities as required by the broker are made upon entering into the contract. While the contract is open, daily variation margin payments are made to or received from the broker reflecting the daily change in market value of the contract and are recorded for financial reporting purposes as unrealized gains or losses by the Fund. When a futures contract is closed, a realized gain or loss is recorded equal to the difference between the opening and closing value of the contract. The risks associated with entering into futures contracts may include the possible illiquidity of the secondary market which would limit the Fund’s ability to close out a futures contract prior to the settlement date, an imperfect correlation between the value of the contracts and the underlying financial instruments, or that the counterparty will fail to perform its obligations under the contracts’ terms. Futures contracts are designed by boards of trade which
www.calvert.com CALVERT ULTRA-SHORT INCOME FUND SEMI-ANNUAL REPORT (UNAUDITED) 27
are designated “contracts markets” by the Commodities Futures Trading Commission. Futures contracts trade on the contracts markets in a manner that is similar to the way a stock trades on a stock exchange and the boards of trade, through their clearing corporations, guarantee the futures contracts against default. As a result, there is minimal counterparty credit risk to the Fund. During the period, the Fund used U.S. Treasury futures contracts to hedge against interest rate changes and to manage overall duration of the Fund.
Short Sales: The Fund may use a hedging technique that involves short sales of U.S. Treasury securities for the purposes of managing the duration of the Fund. Any short sales are “covered” with an equivalent amount of high-quality, liquid securities.
Security Transactions and Net Investment Income: Security transactions are accounted for on trade date. Realized gains and losses are recorded on an identified cost basis and may include proceeds from litigation. Dividend income is recorded on the ex-dividend date or, in the case of dividends on certain foreign securities, as soon as the Fund is informed of the ex-dividend date. Withholding taxes on foreign dividends have been provided for in accordance with the Fund’s understanding of the applicable country’s tax rules and rates. Distributions received on securities that represent a return of capital or capital gain are recorded as a reduction of cost of investments and/or as a realized gain. Interest income, which includes amortization of premium and accretion of discount on debt securities, is accrued as earned. Debt obligations may be placed on non-accrual status and related interest income may be reduced by ceasing current accruals and writing off interest receivables when the collection of all or a portion of interest has become doubtful based on consistently applied procedures. (See Schedule of Investments footnotes on page 20.) A debt obligation may be removed from non-accrual status when the issuer resumes interest payments or when collectability of interest is reasonably assured. The Fund earns certain fees in connection with its floating rate loan purchasing activities. These fees are in addition to interest payments earned and may include amendment fees, consent fees and prepayment fees. These fees are recorded as income in the accompanying financial statements.
Distributions to Shareholders: Distributions to shareholders are recorded by the Fund on ex-dividend date. Dividends from net investment income are paid monthly. Distributions from net realized capital gains, if any, are paid at least annually. Distributions are determined in accordance with income tax regulations which may differ from generally accepted accounting principles; accordingly, periodic reclassifications are made within the Fund’s capital accounts to reflect income and gains available for distribution under income tax regulations.
Estimates: The preparation of the financial statements in conformity with accounting principles generally accepted in the United States requires management to make estimates and assumptions that affect the reported amounts of assets and liabilities and disclosure of contingent assets and liabilities at the date of the financial statements and the reported amounts of income and expenses during the reported period. Actual results could differ from those estimates.
www.calvert.com CALVERT ULTRA-SHORT INCOME FUND SEMI-ANNUAL REPORT (UNAUDITED) 28
Redemption Fees: The Fund charges a 2% redemption fee on redemptions, including exchanges, made within 7 days of purchase in the same Fund. The redemption fee is paid to the Class of the Fund from which the redemption is made, and is accounted for as an addition to paid-in capital. The fee is intended to discourage market-timers by ensuring that short-term trading costs are borne by the investors making the transactions and not the shareholders already in the Fund.
Expense Offset Arrangements: The Fund has an arrangement with its custodian bank whereby the custodian’s fees may be paid indirectly by credits earned on the Fund’s cash on deposit with the bank. These credits are used to reduce the Fund’s expenses. Such a deposit arrangement may be an alternative to overnight investments.
Federal Income Taxes: No provision for federal income or excise tax is required since the Fund intends to continue to qualify as a regulated investment company under the Internal Revenue Code and to distribute substantially all of its taxable earnings.
Management has analyzed the Fund’s tax positions taken for all open federal income tax years and has concluded that no provision for federal income tax is required in the Fund’s financial statements. A Fund’s federal tax return is subject to examination by the Internal Revenue Service for a period of three years.
NOTE B — RELATED PARTY TRANSACTIONS
Calvert Asset Management Company, Inc. (the “Advisor”) is wholly-owned by Calvert Group, Ltd. (“Calvert”), which is indirectly wholly-owned by UNIFI Mutual Holding Company. The Advisor provides investment advisory services and pays the salaries and fees of officers and Trustees of the Fund who are employees of the Advisor or its affiliates. For its services, the Advisor receives a monthly fee based on an annual rate of .30% of the first $1 billion of the Fund’s average daily net assets, and .29% of all assets above $1 billion.
The Advisor has contractually agreed to limit net annual fund operating expenses through January 31, 2012. The contractual expense cap is .89% for Class A and .84% for Class Y. For the purposes of this expense limit, operating expenses do not include interest expense, brokerage commissions, taxes, and extraordinary expenses. To the extent any expense offset credits are earned, the Advisor’s obligation under the contractual limitation may be reduced and the Advisor may benefit from the expense offset arrangement.
Calvert Administrative Services Company, an affiliate of the Advisor, provides administrative services to the Fund for an annual fee, payable monthly, of .25% for Classes A and Y based on their average daily net assets.
Calvert Distributors, Inc., an affiliate of the Advisor, is the distributor and principal underwriter for the Fund. The Distribution Plan, adopted by Class A shares, allows the Fund to pay the Distributor for expenses and services associated with the distribution of shares. The expenses paid may not exceed .50% annually of the Fund’s average daily net assets of Class A. The amount actually paid by the Fund is an annualized fee, payable monthly of .25% of the Fund’s average daily net assets of Class A. Class Y shares do not have Distribution Plan expenses.
The Distributor received $42,867 as its portion of the commissions charged on sales of
www.calvert.com CALVERT ULTRA-SHORT INCOME FUND SEMI-ANNUAL REPORT (UNAUDITED) 29
the Fund’s Class A shares for the six months ended March 31, 2011.
Calvert Shareholder Services, Inc. (“CSSI”), an affiliate of the Advisor, is the shareholder servicing agent for the Fund. For its services, CSSI received a fee of $31,066 for the six months ended March 31, 2011. Boston Financial Data Services, Inc., is the transfer and dividend disbursing agent.
Each Trustee of the Fund who is not an employee of the Advisor or its affiliates receives an annual retainer of $45,000 plus up to $2,000 for each Board and Committee meeting attended. The Board chair and Committee chairs each receive an additional $5,000 annual retainer. Trustee’s fees are allocated to each of the funds served.
NOTE C — INVESTMENT ACTIVITY
During the period, the cost of purchases and proceeds from sales of investments, other than short-term and U.S. government securities, were $317,395,900 and $157,234,021, respectively. U.S. government security purchases and sales were $97,988,936 and $102,264,735, respectively.
As of March 31, 2011, the tax basis components of unrealized appreciation/ (depreciation) and the federal tax cost were as follows:
| Unrealized appreciation | $ | 3,965,521 | |
| Unrealized (depreciation) | | (1,831,478 | ) |
| Net unrealized appreciation/(depreciation) | $ | 2,134,043 | |
| Federal income tax cost of investments | $ | 366,991,086 | |
NOTE D — LINE OF CREDITA financing agreement is in place with all Calvert Group Funds and State Street Corporation (“SSC”). Under the agreement, SSC provides an unsecured line of credit facility, in the aggregate amount of $50 million ($25 million committed and $25 million uncommitted), accessible by the Funds for temporary or emergency purposes only. Borrowings under the committed facility bear interest at the higher of the London Interbank Offered Rate, (LIBOR) or the overnight Federal Funds Rate plus 1.25% per annum. A commitment fee of .125% per annum is incurred on the unused portion of the committed facility, which is allocated to all participating funds. The Fund had no loans outstanding pursuant to this line of credit at March 31, 2011. For the six months ended March 31, 2011, borrowings by the Fund under the Agreement were as follows:
| | WEIGHTED | | MONTH OF |
| AVERAGE | AVERAGE | MAXIMUM | MAXIMUM |
| DAILY | INTEREST | AMOUNT | AMOUNT |
| BALANCE | RATE | BORROWED | BORROWED |
| $31,200 | 1.50% | $1,458,867 | January 2011 |
www.calvert.com CALVERT ULTRA-SHORT INCOME FUND SEMI-ANNUAL REPORT (UNAUDITED) 30
NOTE E – SUBSEQUENT EVENTS
In preparing the financial statements as of March 31, 2011, no subsequent events or transactions occurred that would have materially impacted the financial statements as presented.
Effective April 30, 2011, the Calvert operating companies will be renamed as follows: Calvert Group, Ltd. will be renamed Calvert Investments, Inc., Calvert Asset Management Company, Inc. will be renamed Calvert Investment Management, Inc., Calvert Distributors, Inc. will be renamed Calvert Investment Distributors, Inc., Calvert Administrative Services Company will be renamed Calvert Investment Administrative Services, Inc., and Calvert Shareholder Services, Inc. will be renamed Calvert Investment Services, Inc.
www.calvert.com CALVERT ULTRA-SHORT INCOME FUND SEMI-ANNUAL REPORT (UNAUDITED) 31
| | | | | | | | | |
| FINANCIAL HIGHLIGHTS |
| |
| | | | | | Periods ended | |
| | | | | | MARCH
31, | | | SEPTEMBER 30, | |
| class A shares | | | | | 2011 | | | 2010 | |
| Net asset value, beginning | | | | $ | 15.77 | | $ | 15.58 | |
| Income from investment operations: | | | | | | | | | |
| Net investment income | | | | | .14 | | | .21 | |
| Net realized and unrealized gain (loss) | | | | | .01 | | | .27 | |
| Total from investment operations | | | | | .15 | | | .48 | |
| Distributions from: | | | | | | | | | |
| Net investment income | | | | | (.18 | ) | | (.20 | ) |
| Net realized gain | | | | | (.08 | ) | | (.09 | ) |
| Total distributions | | | | | (.26 | ) | | (.29 | ) |
| Total increase (decrease) in net asset value | | | | | (.11 | ) | | .19 | |
| Net asset value, ending | | | | $ | 15.66 | | $ | 15.77 | |
| |
| Total return* | | | | | .97 | % | | 3.07 | % |
| Ratios to average net assets: A | | | | | | | | | |
| Net investment income | | | | | 1.76 | % (a) | | 1.46 | % |
| Total expenses | | | | | 1.08 | % (a) | | 1.08 | % |
| Expenses before offsets | | | | | .89 | % (a) | | .89 | % |
| Net expenses | | | | | .89 | % (a) | | .89 | % |
| Portfolio turnover | | | | | 98 | % | | 268 | % |
| Net assets, ending (in thousands) | | | | $ | 339,319 | | $ | 241,254 | |
| |
| | | Periods ended | |
| | | SEPTEMBER 30, | | | SEPTEMBER 30, | | | SEPTEMBER 30, | |
| class A shares | | 2009 | | | 2008 | | | 2007 | ^ |
| Net asset value, beginning | $ | 14.97 | | $ | 15.04 | | $ | 15.00 | |
| Income from investment operations: | | | | | | | | | |
| Net investment income | | .34 | | | .60 | | | .61 | |
| Net realized and unrealized gain (loss) | | .60 | | | .04 | | | .03 | |
| Total from investment operations | | .94 | | | .64 | | | .64 | |
| Distributions from: | | | | | | | | | |
| Net investment income | | (.30 | ) | | (.61 | ) | | (.60 | ) |
| Net realized gain | | (.03 | ) | | (.10 | ) | | — | |
| Total distributions | | (.33 | ) | | (.71 | ) | | (.60 | ) |
| Total increase (decrease) in net asset value | | .61 | | | (.07 | ) | | .04 | |
| Net asset value, ending | $ | 15.58 | | $ | 14.97 | | $ | 15.04 | |
| |
| Total return* | | 6.42 | % | | 4.34 | % | | 4.34 | % |
| Ratios to average net assets: A | | | | | | | | | |
| Net investment income | | 2.36 | % | | 3.57 | % | | 4.52 | % (a) |
| Total expenses | | 1.26 | % | | 2.09 | % | | 3.90 | % (a) |
| Expenses before offsets | | .93 | % | | .92 | % | | 1.05 | % (a) |
| Net expenses | | .89 | % | | .89 | % | | .89 | % (a) |
| Portfolio turnover | | 300 | % | | 475 | % | | 506 | % |
| Net assets, ending (in thousands) | $ | 93,870 | | $ | 27,333 | | $ | 3,256 | |
See notes to financial highlights.
www.calvert.com CALVERT ULTRA-SHORT INCOME FUND SEMI-ANNUAL REPORT (UNAUDITED) 32
| | | | | | |
| FINANCIAL HIGHLIGHTS |
| |
| | | Periods ended | |
| | | MARCH
31, | | | SEPTEMBER
30, | |
| class Y shares | | 2011 | | | 2010 | ^^ |
| Net asset value, beginning | $ | 15.81 | | $ | 15.67 | |
| Income from investment operations: | | | | | | |
| Net investment income | | .15 | | | .07 | |
| Net realized and unrealized gain (loss) | | .01 | | | .14 | |
| Total from investment operations | | .16 | | | .21 | |
| Distributions from: | | | | | | |
| Net investment income | | (.19 | ) | | (.07 | ) |
| Net realized gain | | (.08 | ) | | — | |
| Total distributions | | (.27 | ) | | (.07 | ) |
| Total increase (decrease) in net asset value | | (.11 | ) | | .14 | |
| Net asset value, ending | $ | 15.70 | | $ | 15.81 | |
| |
| Total return* | | 1.05 | % | | 1.35 | % |
| Ratios to average net assets: A | | | | | | |
| Net investment income | | 1.95 | % (a) | | 1.69 | % (a) |
| Total expenses | | .69 | % (a) | | .75 | % (a) |
| Expenses before offsets | | .69 | % (a) | | .75 | % (a) |
| Net expenses | | .69 | % (a) | | .75 | % (a) |
| Portfolio turnover | | 98 | % | | 62 | % |
| Net assets, ending (in thousands) | $ | 63,139 | | $ | 37,270 | |
| A | Total expenses do not reflect amounts reimbursed and/or waived by the Advisor or reductions from expense offset arrangements. Expenses before offsets reflect expenses after reimbursement and/or waiver by the Advisor but prior to reductions from expense offset arrangements. Net expenses are net of all reductions and represent the net expenses paid by the Fund. |
| (a) | Annualized. |
| * | Total return is not annualized for periods less than one year and does not reflect deduction of any front-end sales charge. |
| ^ | From October 31, 2006, inception. |
| ^^ | From May 28, 2010, inception. |
See notes to financial statements.
www.calvert.com CALVERT ULTRA-SHORT INCOME FUND SEMI-ANNUAL REPORT (UNAUDITED) 33
EXPLANATION OF FINANCIAL TABLES
SCHEDULE OF INVESTMENTS
The Schedule of Investments is a snapshot of all securities held in the fund at their market value, on the last day of the reporting period. Securities are listed by asset type (e.g., common stock, corporate bonds, U.S. government obligations) and may be further broken down into sub-groups and by industry classification.
STATEMENT OF ASSETS AND LIABILITIES
The Statement of Assets and Liabilities is often referred to as the fund’s balance sheet. It lists the value of what the fund owns, is due and owes on the last day of the reporting period. The fund’s assets include the market value of securities owned, cash, receivables for securities sold and shareholder subscriptions, and receivables for dividends and interest payments that have been earned, but not yet received. The fund’s liabilities include payables for securities purchased and shareholder redemptions, and expenses owed but not yet paid. The statement also reports the fund’s net asset value (NAV) per share on the last day of the reporting period. The NAV is calculated by dividing the fund’s net assets (assets minus liabilities) by the number of shares outstanding. This statement is accompanied by a Schedule of Investments. Alternatively, if certain conditions are met, a Statement of Net Assets may be presented in lieu of this statement and the Schedule of Investments.
STATEMENT OF NET ASSETS
The Statement of Net Assets provides a detailed list of the fund’s holdings, including each security’s market value on the last day of the reporting period. The Statement of Net Assets includes a Schedule of Investments. Other assets are added and other liabilities subtracted from the investments total to calculate the fund’s net assets. Finally, net assets are divided by the outstanding shares of the fund to arrive at its share price, or Net Asset Value (NAV) per share.
At the end of the Statement of Net Assets is a table displaying the composition of the fund’s net assets. Paid in Capital is the money invested by shareholders and represents the bulk of net assets. Undistributed Net Investment Income and Accumulated Net Realized Gains usually approximate the amounts the fund had available to distribute to shareholders as of the statement date. Accumulated Realized Losses will appear as negative balances. Unrealized Appreciation (Depreciation) is the difference between the market value of the fund’s investments and their cost, and reflects the gains (losses) that would be realized if the fund were to sell all of its investments at their statement-date values.
www.calvert.com CALVERT ULTRA-SHORT INCOME FUND SEMI-ANNUAL REPORT (UNAUDITED) 34
STATEMENT OF OPERATIONS
The Statement of Operations summarizes the fund’s investment income earned and expenses incurred in operating the fund. Investment income includes dividends earned from stocks and interest earned from interest-bearing securities in the fund. Expenses incurred in operating the fund include the advisory fee paid to the investment advisor, administrative services fees, distribution plan expenses (if applicable), transfer agent fees, shareholder servicing expenses, custodial, legal, and audit fees, and the printing and postage expenses related to shareholder reports. Expense offsets (fees paid indirectly) are also shown. Credits earned from offset arrangements are used to reduce the fund’s expenses. This statement also shows net gains (losses) realized on the sale of investments and the increase or decrease in the unrealized appreciation (depreciation) on investments held during the period.
STATEMENT OF CHANGES IN NET ASSETS
The Statement of Changes in Net Assets shows how the fund’s total net assets changed during the two most recent reporting periods. Changes in the fund’s net assets are attributable to investment operations, distributions and capital share transactions.
The Operations section of the report summarizes information detailed in the Statement of Operations. The Distribution section shows the dividend and capital gain distributions made to shareholders. The amounts shown as distributions in this section may not match the net investment income and realized gains amounts shown in the Operations section because distributions are determined on a tax basis and certain investments or transactions may be treated differently for financial statement and tax purposes. The Capital Share Transactions section shows the amount shareholders invested in the fund, either by purchasing shares or by reinvesting distributions, and the amounts redeemed. The corresponding numbers of shares issued, reinvested and redeemed are shown at the end of the report.
FINANCIAL HIGHLIGHTS
The Financial Highlights table provides a per-share breakdown per class of the components that affect the fund’s net asset value for current and past reporting periods. The table provides total return, total distributions, expense ratios, portfolio turnover and net assets for the applicable period. Total return is a measure of a fund’s performance that encompasses all elements of return: dividends, capital gain distributions and changes in net asset value. Total return is the change in value of an investment over a given period, assuming reinvestment of any dividends and capital gain distributions, expressed as a percentage of the initial investment. Total distributions include distributions from net investment income and net realized gains. Long-term gains are earned on securities held in the fund more than one year. Short-term gains, on the sale of securities held less than one year, are treated as ordinary dividend income for tax purposes. The expense ratio is a fund’s cost of doing business, expressed as a percentage of net assets. These expenses directly reduce returns to shareholders. Portfolio turnover measures the trading activity in a fund’s investment portfolio – how often securities are bought and sold by a fund. Portfolio turnover is affected by market conditions, changes in the size of the fund, the nature of the fund’s investments and the investment style of the portfolio manager.
www.calvert.com CALVERT ULTRA-SHORT INCOME FUND SEMI-ANNUAL REPORT (UNAUDITED) 35
PROXY VOTING
The Proxy Voting Guidelines of the Calvert Funds that the Fund uses to determine how to vote proxies relating to portfolio securities are provided as an Appendix to the Fund’s Statement of Additional Information. The Statement of Additional Information can be obtained free of charge by calling the Fund at 1-800-368-2745, by visiting the Calvert website at www.calvert.com; or by visiting the SEC’s website at www.sec.gov.
Information regarding how the Fund voted proxies relating to portfolio securities during the most recent 12-month period ended June 30 is available on the Fund’s website at www.calvert.com and on the SEC’s website at www.sec.gov.
AVAILABILITY OF QUARTERLY PORTFOLIO HOLDINGS
The Fund files its complete schedule of portfolio holdings with the SEC for the first and third quarters of each fiscal year on Form N-Q. The Fund’s Form N-Q is available on the SEC’s website at www.sec.gov. The Fund’s Form N-Q may be reviewed and copied at the SEC’s Public Reference Room in Washington, DC; information on the operation of the Public Reference Room may be obtained by calling 1-800-SEC-0330.
BASIS FOR BOARD’S APPROVAL OF INVESTMENT ADVISORY CONTRACT
At a meeting held on December 8, 2010, the Board of Trustees, and by a separate vote, the disinterested Trustees, approved the continuance of the Investment Advisory Agreement between The Calvert Fund and the Advisor with respect to the Fund.
In evaluating the Investment Advisory Agreement, the Board considered a variety of information relating to the Fund and the Advisor. The disinterested Trustees reviewed a report prepared by the Advisor regarding various services provided to the Fund by the Advisor and its affiliates. Such report included, among other data, information regarding the Advisor’s personnel and the Advisor’s revenue and cost of providing services to the Fund, and a separate report prepared by an independent third party, which provided a statistical analysis comparing the Fund’s investment performance, expenses, and fees to comparable mutual funds.
The disinterested Trustees were separately represented by independent legal counsel with respect to their consideration of the reapproval of the Investment Advisory Agreement. Prior to voting, the disinterested Trustees reviewed the proposed continuance of the Investment Advisory Agreement with management and also met in private sessions with their counsel at which no representatives of management were present.
In the course of its deliberations regarding the Investment Advisory Agreement, the Board considered the following factors, among others: the nature, extent and quality of the services provided by the Advisor, including the personnel providing such services; the Advisor’s financial condition; the level and method of computing the Fund’s advisory fee;
www.calvert.com CALVERT ULTRA-SHORT INCOME FUND SEMI-ANNUAL REPORT (UNAUDITED) 36
comparative performance, fee and expense information for the Fund; the profitability of the Calvert Group of Funds to the Advisor and its affiliates; the direct and indirect benefits, if any, derived by the Advisor and its affiliates from their relationship with the Fund; the effect of the Fund’s growth and size on the Fund’s performance and expenses; the affiliated distributor’s process for monitoring sales load breakpoints; the Advisor’s compliance programs and policies; the Advisor’s performance of substantially similar duties for other funds; and any possible conflicts of interest.
In considering the nature, extent and quality of the services provided by the Advisor under the Investment Advisory Agreement, the Board reviewed information provided by the Advisor relating to its operations and personnel, including, among other information, biographical information on the Advisor’s investment, supervisory and professional staff and descriptions of its organizational and management structure. The Board also took into account similar information provided periodically throughout the previous year by the Advisor as well as the Board’s familiarity with management through Board of Trustees’ meetings, discussions and other reports. The Board considered the Advisor’s management style and its performance in employing its investment strategies as well as its current level of staffing and overall resources. The Advisor’s administrative capabilities, including its ability to supervise the other service providers for the Fund, were also considered. The Board concluded that it was satisfied with the nature, extent and quality of services provided to the Fund by the Advisor under the Investment Advisory Agreement.
In considering the Fund’s performance, the Board noted that it reviewed on a quarterly basis detailed information about the Fund’s performance results, portfolio composition and investment strategies. In addition, the Board took into account overall financial market conditions. The Board also reviewed various comparative data provided to it in connection with its consideration of the renewal of the Investment Advisory Agreement, including, among other information, a comparison of the Fund’s total return with its Lipper index and with that of other mutual funds deemed to be in its peer universe by an independent third party in its report. This comparison indicated that the Fund performed at the median of its peer universe for the one-year period ended June 30, 2010, and above the median of its peer universe for the three-year period ended June 30, 2010. The data also indicated that the Fund outperformed its Lipper index for the same one- and three-year periods. Based upon its review, the Board concluded that the Fund’s performance was satisfactory.
In considering the Fund’s fees and expenses, the Board compared the Fund’s fees and total expense ratio with various comparative data for the funds in its peer group. Among other findings, the data indicated that the Fund’s advisory fee (after taking into account waivers and/or reimbursements) and total expenses (net of waivers and/or reimbursements) were below the median of its peer group. The Board noted that the allocation of advisory and administrative fees may vary among the Fund’s peer group. The Board took into account the Advisor’s current undertaking to maintain expense limitations for the Fund’s Class A and Class Y shares. The Board also noted management’s discussion of the Fund’s expenses and certain factors that affected the level of such expenses. Based upon its review, the Board concluded that the advisory fee was reasonable in view of the quality of services provided by the Advisor.
www.calvert.com CALVERT ULTRA-SHORT INCOME FUND SEMI-ANNUAL REPORT (UNAUDITED) 37
The Board reviewed the Advisor’s profitability on a fund-by-fund basis. In reviewing the overall profitability of the advisory fee to the Fund’s Advisor, the Board also considered the fact that affiliates of the Advisor provided shareholder servicing and administrative services to the Fund for which they received compensation. The information considered by the Board included Calvert’s operating profit margin information both before and after tax expenses with respect to the services that the Advisor and its affiliates provided to the Calvert Group of Funds complex. The Board reviewed the profitability of the Advisor’s relationship with the Fund in terms of the total amount of annual advisory fees it received with respect to the Fund and whether the Advisor had the financial wherewithal to continue to provide a high level of services to the Fund. The Board noted that the Advisor had reimbursed expenses of the Fund for some classes. The Board also noted the Advisor’s current undertaking to maintain expense limitations for the Fund’s Class A and Class Y shares. The Trustees also considered that the Advisor derived benefits to its reputation and other indirect benefits from its relationship with the Fund. Based upon its review, the Board concluded that the Advisor’s and its affiliates’ level of profitability from its relationship with the Fund was reasonable.
The Board considered the effect of the Fund’s current size and potential growth on its performance and fees. The Board took into account that the Fund’s advisory fee schedule contained breakpoints that would reduce the advisory fee rate on assets above specified levels as the Fund’s assets increased. The Board noted that the Fund had not yet reached the specified asset level at which a breakpoint to its advisory fee would be triggered. The Board also noted that if the Fund’s assets increased over time, the Fund might realize other economies of scale if assets increased proportionally more than certain other expenses.
In reapproving the Investment Advisory Agreement, the Board, including the disinterested Trustees, did not identify any single factor as controlling, and each Trustee may have attributed different weight to various factors.
CONCLUSIONS
The Board reached the following conclusions regarding the Investment Advisory Agreement, among others: (a) the Advisor has demonstrated that it possesses the capability and resources to perform the duties required of it under the Investment Advisory Agreement; (b) the Advisor maintains appropriate compliance programs; (c) performance of the Fund is satisfactory relative to the performance of funds with similar investment objectives and to relevant indices; (d) the Advisor is likely to execute its investment strategies consistently over time; and (e) the Fund’s advisory fee is reasonable relative to those of similar funds and to the services to be provided by the Advisor. Based on its conclusions, the Board determined that reapproval of the Investment Advisory Agreement would be in the best interests of the Fund and its shareholders.
www.calvert.com CALVERT ULTRA-SHORT INCOME FUND SEMI-ANNUAL REPORT (UNAUDITED) 38
To Open an Account
800-368-2748
Yields and Prices
Calvert Information Network
(24 hours, 7 days a week)
800-368-2745
Service for Existing Account
Shareholders: 800-368-2745
Brokers: 800-368-2746
TDD for Hearing Impaired
800-541-1524
Branch Office
4550 Montgomery Avenue
Suite 1000 North
Bethesda, Maryland 20814
Registered, Certified or Overnight Mail
Calvert Investments
c/o BFDS,
330 West 9th Street
Kansas City, MO 64105
Web Site
www.calvert.com
Principal Underwriter
Calvert Investment Distributors, Inc.
4550 Montgomery Avenue
Suite 1000 North
Bethesda, Maryland 20814
| | |
| CALVERT | CALVERT’S | Equity Funds |
| ULTRA-SHORT | FAMILY OF FUNDS | Enhanced Equity Portfolio |
| INCOME FUND | | Equity Portfolio |
| | Tax-Exempt Money | Large Cap Growth Fund |
| | Market Funds | Large Cap Value Fund |
| | CTFR Money Market Portfolio | Social Index Fund |
| | | Capital Accumulation Fund |
| | Taxable Money Market | International Equity Fund |
| | Funds | Small Cap Fund |
| | First Government Money Market | Global Alternative Energy Fund |
| | Fund | Global Water Fund |
| | Money Market Portfolio | International Opportunities Fund |
| |
| | Municipal Funds | Balanced and Asset |
| | Tax-Free Bond Fund | Allocation Funds |
| | | Balanced Portfolio |
| | Taxable Bond Funds | Conservative Allocation Fund |
| | Bond Portfolio | Moderate Allocation Fund |
| | Income Fund | Aggressive Allocation Fund |
| | Short Duration Income Fund | |
| | Long-Term Income Fund | |
| | Ultra-Short Income Fund | |
| | Government Fund | |
| | High-Yield Bond Fund | |
This report is intended to provide fund information to shareholders. It is not authorized for distribution to prospective investors unless preceded or accompanied by a prospectus.
Note: The information on our website is not incorporated by reference into this report; our website address is included as an inactive textual reference only.
Investors should carefully consider the investment objectives, risks, charges and expenses of the Calvert Funds. This and other important information is contained in the fund’s summary prospectus and prospectus, which can be obtained from your financial professional and should be read carefully before investing. You may also call Calvert at 800/368-2745 or visit www. calvert.com.
INFORMATION REGARDING CALVERT OPERATING COMPANY
NAME CHANGES
Effective on April 30, 2011, the following Calvert operating companies will be renamed as indicated:
| | |
| Current Company Name | Company Name on 4/30/11 | Company Description |
| |
| Calvert Group, Ltd. | Calvert Investments, Inc. | Corporate parent of each |
| | | operating company listed |
| | | below |
| |
| Calvert Asset Management | Calvert Investment | Investment advisor to the |
| Company, Inc. | Management, Inc. | Calvert Funds |
| |
| Calvert Distributors, Inc. | Calvert Investment Distributors, | Principal underwriter |
| | Inc. | and distributor for the |
| | | Calvert Funds |
| |
| Calvert Administrative | Calvert Investment | Administrative services |
| Services Company | Administrative Services, Inc. | provider for the Calvert |
| | | Funds |
| |
| Calvert Shareholder | Calvert Investment Services, | Shareholder servicing |
| Services, Inc. | Inc. | provider for the Calvert |
| | | Funds |
Choose Planet-friendly E-delivery!
Sign up now for on-line statements, prospectuses, and fund reports. In less than five minutes you can help reduce paper mail and lower fund costs.
Just go to www.calvert.com. If you already have an online account at Calvert, click on My Account, and select the documents you would like to receive via e-mail.
If you’re new to online account access, click on Login/Register to open an online account. Once you’re in, click on the E-delivery sign-up at the bottom of the Account Portfolio page and follow the quick, easy steps. Note: if your shares are not held directly at Calvert but through a brokerage firm, you must contact your broker for electronic delivery options available through their firm.
Dear Shareholder:
The financial markets ended the six-month period on a high note. The Federal Reserve’s announcement in the fall of 2010 of a second round of quantitative easing (QE2) and the extension in December of the Bush-era tax cuts for all income levels helped buoy the markets and pushed Treasury yields higher. The resulting increase in U.S. consumer spending and confidence helped drive a year-end rally.
This calm lasted until new storms arrived in the beginning of 2011. Civil and political unrest in the Middle East and North Africa sent the price of crude soaring and heightened energy security concerns in many countries around the world. In March, the tragic earthquake and tsunami struck Japan. Our sympathies go out to the people of Japan who lost loved ones in this disaster. The earthquake—and its impact on the country’s nuclear reactors—roiled global financial markets. The cumulative effect of these events sparked a brief sell-off in corporate bonds as investors moved into the relative safety of U.S. Treasuries.
Fixed-Income Markets Continue to be Volatile
Investment-grade corporate bonds edged down slightly for the reporting period, with the Barclays Capital U.S. Credit Index returning -0.98%, while high-yield bonds, as measured by the BofA Merrill Lynch U.S. High Yield Master II Index, returned 7.09%. Money-market returns remained flat, reflecting the Fed’s efforts to keep its target interest rate very low.
Corporate bonds continued to benefit from generally strong corporate earnings and lower default expectations during the fourth quarter of 2010. This trend continued during the first quarter of 2011 as investors became more comfortable moving into riskier asset classes to chase yield. However, most fixed-income sectors experienced significant volatility as investors reacted to the turmoil in the Middle East and the ensuing climb in oil prices as well as the disaster in Japan—which prompted some investors to move back into the relative safety of Treasuries as noted above.
Municipal bond returns suffered greatly in the final months of 2010 due to heavy municipal debt issuance, record municipal bond fund redemptions by retail investors, and fear of massive municipal debt defaults, which appears to be unfounded. Fortunately, prices steadied after the turn of the year due to slowing investor outflows and minimal new debt issuance.
Opportunities and Challenges Ahead
Overall, we are optimistic and expect a slow, gradual economic recovery to continue, which we believe should help sustain a corporate bond rally through the remainder of 2011. A low core inflation rate (which excludes food and energy prices) will likely facilitate economic growth, while continued debt reduction, lingering high unem-
www.calvert.com CALVERT GOVERNMENT FUND SEMI-ANNUAL REPORT (UNAUDITED) 4
ployment, and a struggling housing market will limit gains. Energy prices will remain a challenge until we see more resolution of the events in the Middle East and North Africa. Of course, more geopolitical crises, rising commodity prices, and inflation spikes could certainly dampen the markets.
In short, we believe the markets, the global economy, and your Calvert funds can successfully navigate through any temporary setbacks.
Discuss Your Portfolio Allocations with Your Advisor
Given the market shifts we have experienced, your overall portfolio asset allocation and investment strategy may no longer match your needs. Therefore, we recommend reviewing these with your financial advisor to ensure that your target mix of U.S. and international stocks, bonds, and cash is well-diversified and appropriate given your financial goals, time horizon, and risk tolerance.
We encourage you to visit our website, www.calvert.com, for fund information and updates as well as market and economic commentary from Calvert professionals.
As noted elsewhere in this report, the Calvert operating companies that provide services to the funds will change their names effective April 30, 2011. As part of the changes, Calvert Group, Ltd. will be known as Calvert Investments, Inc., and the funds’ advisor, Calvert Asset Management Company, Inc., will be known as Calvert Investment Management, Inc.
As always, we appreciate your investing with Calvert.

Barbara J. Krumsiek
President and CEO
Calvert Investments, Inc.
April 2011
www.calvert.com CALVERT GOVERNMENT FUND SEMI-ANNUAL REPORT (UNAUDITED) 5

Investment Climate
The six-month reporting period was characterized by four clear phases in interest-rate movements. The first was a steady and strong upward movement in interest rates. The 10-year Treasury yield increased from 2.33% in early October to 3.57% by mid-Decem-ber. The Federal Reserve’s (Fed) announcement of new Treasury purchases in November did little to slow the advance as economic data improved. In December, many analysts raised their forecasts for economic growth, and stocks rallied as a larger-than-expected fiscal stimulus package was passed. The second phase featured a fairly quiet trading range. During phase three, from early to mid-February of 2011, yields rose as the unemployment rate fell sharply, boosting confidence in the economy and triggering a rally in stocks. The 10-year Treasury yield peaked at 3.74%.
*Investment performance/return of NAV does not reflect the deduction of the Fund’s maximum 3.75% front-end sales charge or any deferred sales charge.
www.calvert.com CALVERT GOVERNMENT FUND SEMI-ANNUAL REPORT (UNAUDITED) 6
| | |
| CALVERT | | |
| GOVERNMENT FUND | |
| MARCH 31, 2011 | | |
| | % of Total | |
| ECONOMIC SECTORS | Investments | |
| Communications | 0.9 | % |
| Consumer, Cyclical | 2.3 | % |
| Energy | 0.7 | % |
| Financials | 24.1 | % |
| Government | 64.4 | % |
| Industrials | 1.3 | % |
| Mortgage Securities | 3.4 | % |
| Technology | 0.8 | % |
| Total | 100 | % |
In the final phase, yields began to fall as turmoil in the Middle East pushed up the price of oil and raised doubts about the strength of the young economic expansion. Volatility increased in global financial markets. Doubt, uncertainty, and volatility were amplified by the terrible March 11 earthquake and tsunami in Japan. Treasury yields continued to fall, with the 10-year yield bottoming at 3.14% a few days after the disaster. After the shock wore off, stocks regained their footing and Treasury yields recovered some ground. The 10-year Treasury yield ended the reporting period near 3.5%, which was close to the mid-
dle of the range over the full reporting period.1
During the reporting period, we estimate that Utilities 2.1% the U.S. economy grew at an annualized rate of 3.3%.2 This is very near the 50-year average growth rate, but remains below the rate seen, at a similar point in the business cycle, after prior deep recessions in the post-WWII era. The core consumer price inflation (CPI) rate increased from 0.6% to 1.1% during the reporting period,3 so the Fed’s concern about unwanted disinflation abated. While the inflation rate was trending up, the level of both core and headline inflation rates remained below long-run averages. Market expectations for inflation in coming years increased to a level more in line with long-term averages.
Portfolio Strategy
The Fund benefitted from higher interest rates across the yield curve. The yields on two- and 10-year Treasuries increased by 35 and 91 basis points, respectively, over the six-month reporting period. The Fund’s allocation to non-government sectors, including asset-backed securities and corporate bonds, which comprised 17.91% of the Fund at the start of the reporting period, helped boost relative returns.
The Fund employed a yield-curve-flattening strategy. This had a mixed effect as some portions of the yield curve narrowed while others widened. The Fund was positioned to benefit from a narrowing of the yield differential between the 10- and 30-year U.S. Treasuries, which helped performance, as this section of the yield curve narrowed from 160 basis points to 104 basis points. However, the Fund also was positioned to benefit from narrowing of the yield differential between two- and 10-year Treasuries. This section of the yield curve widened from 209 to 265 basis points during the reporting period, which hurt performance. The Fund uses Treasury futures to hedge its interest rate position.
www.calvert.com CALVERT GOVERNMENT FUND SEMI-ANNUAL REPORT (UNAUDITED) 7
Growth of $10,000
The graph below shows the value of a hypothetical $10,000 investment in the fund over the past 10 fiscal year periods or since inception (for funds without 10-year records). The results shown are for Classes A and C shares and reflect the deduction of the maximum front-end Class A sales charge of 3.75%, or deferred sales charge, as applicable and assume the reinvestment of dividends. The result is compared with benchmarks that include a broad based market index and a Lipper peer group average. Market indexes are unmanaged and their results do not reflect the effect of expenses or sales charges. The Lipper average reflects the deduction of the category’s average front-end sales charge. The value of an investment in a different share class would be different.
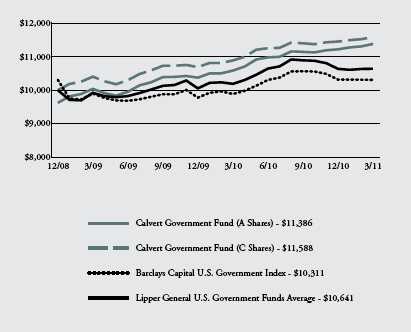
All performance data shown, including the graph above and the adjacent table, represents past performance, does not guarantee future results, assumes reinvestment of dividends and distributions and does not reflect the deduction of taxes that a shareholder would pay on the Fund’s/Portfolio’s distributions or the redemption of the Fund/Portfolio shares. The investment return and principal value of an investment will fluctuate so that an investor’s shares, when redeemed, may be worth more or less than their original cost. Current performance may be lower or higher than the performance data quoted; for current performance data visit www.calvert.com. The gross expense ratio from the current prospectus for Class A shares is 3.81%. This number may differ from the expense ratio shown elsewhere in this report because it is based on a different time period and, if applicable, does not include fee or expense waivers. Performance data quoted already reflects the deduction of the Fund’s/Portfolio’s operating expenses.
www.calvert.com CALVERT GOVERNMENT FUND SEMI-ANNUAL REPORT (UNAUDITED) 8
| | | | | Outlook
The U.S. economy continues to recover
from severe financial crisis. Deleveraging
in household and financial sectors contin-
ues, suggesting that both growth and price
inflation are moderate and not heated.
Monetary policy should remain easy in
coming quarters as federal, state, and local
fiscal stimuli continue to recede and con-
tract. The impact from the long stretch
of extraordinarily easy Fed policy, with its
near-zero percent short-term interest rates
and government bond purchases, is clear
in the higher prices of stocks, bonds, and
commodities, but not in consumer price
indices. |
| CALVERT | | | |
| GOVERNMENT FUND | | |
| MARCH 31, 2011 | | | |
| AVERAGE ANNUAL TOTAL RETURNS | | |
| | | | | |
| | | | | |
| Class A Shares | (with max. load) | |
| One year | | 3.49 | % | |
| Since inception (12/31/2008) | 5.96 | % | |
| | | | | |
| Class C Shares | (with max. load) | |
| One year | | 5.41 | % | |
| Since inception (12/31/2008) | 6.78 | % | |
| | | | | |
Once again, events outside the United States created more uncertainty about the outlook for U.S. growth, inflation, and monetary policy. In addition to geopolitical tensions in the Middle East and natural disaster in Japan, deepening eurozone debt troubles have put Portugal on the brink of a bailout from the European Union/International Monetary Fund rescue facility. If the country does require a financial rescue package, Portugal would become the third eurozone member to receive a bailout. The rescue facility can accommodate Greece, Ireland, and Portugal but a debt crisis in Spain would cause a great stress on the facility and could disrupt financial markets worldwide. The Spanish government’s interest rates, while elevated, are not near crisis levels. Spain will remain under pressure, however, and has the potential to unnerve investors from time to time.
Despite increased uncertainty in recent months, we expect the Fed to conclude its Treasury purchases by the end of June. This would complete the easing cycle and, apart from some minor operations, move the Fed to the sidelines for the remainder of the year. There are monetary policy scenarios that could move bond yields quite sharply, including the small chance that the Fed will tighten faster than expected if core inflation increases rapidly. In addition, in light of the recent international turmoil, there is a chance—perhaps small—that the Fed will ease yet again if the economy weakens later this year. In uncertain times, we expect market volatility to erupt periodically.
April 2011
| 1 | Interest rate data sources: Chicago Board Options Exchange and Federal Reserve |
| 2 | According to Bureau of Economic Analysis data and forecasts from the Wall Street Journal Survey of Professional Forecasters |
| 3 | Latest data as of February 2011 from the Bureau of Labor Statistics |
www.calvert.com CALVERT GOVERNMENT FUND SEMI-ANNUAL REPORT (UNAUDITED) 9
SHAREHOLDER EXPENSE EXAMPLE
As a shareholder of the Fund, you incur two types of costs: (1) transaction costs, including sales charges (loads) and redemption fees and (2) ongoing costs, including management fees; distribution (12b-1) fees; and other Fund expenses. This Example is intended to help you understand your ongoing costs (in dollars) of investing in the Fund and to compare these costs with the ongoing costs of investing in other mutual funds.
This Example is based on an investment of $1,000 invested at the beginning of the period and held for the entire period (October 1, 2010 to March 31, 2011).
Actual Expenses
The first line of the table below provides information about actual account values and actual expenses. You may use the information in this line, together with the amount you invested, to estimate the expenses that you paid over the period. Simply divide your account value by $1,000 (for example, an $8,600 account value divided by $1,000 = 8.6), then multiply the result by the number in the first line under the heading entitled “Expenses Paid During Period” to estimate the expenses you paid on your account during this period.
Hypothetical Example for Comparison Purposes
The second line of the table below provides information about hypothetical account values and hypothetical expenses based on the Fund’s actual expense ratio and an assumed rate of return of 5% per year before expenses, which is not the Fund’s actual return. The hypothetical account values and expenses may not be used to estimate the actual ending account balance or expenses you paid for the period. You may use this information to compare the ongoing costs of investing in the Fund and other funds. To do so, compare the 5% hypothetical example with the 5% hypothetical examples that appear in the shareholder reports of the other funds.
Please note that the expenses shown in the table are meant to highlight your ongoing costs only and do not reflect any transactional costs, such as sales charges (loads) or redemption fees. Therefore, the second line of the table is useful in comparing ongoing costs only, and will not help you determine the relative total costs of owning different funds. In addition, if these transactional costs were included, your costs would have been higher.
www.calvert.com CALVERT GOVERNMENT FUND SEMI-ANNUAL REPORT (UNAUDITED) 10
| | | | | | |
| | | BEGINNING | | ENDING ACCOUNT | | EXPENSES PAID |
| | | ACCOUNT VALUE | | VALUE | | DURING PERIOD* |
| | | 10/1/10 | | 3/31/11 | | 10/1/10 - 3/31/11 |
| class A | | | | | | |
| Actual | $ | 1,000.00 | $ | 1,021.50 | $ | 5.24 |
| Hypothetical | $ | 1,000.00 | $ | 1,019.75 | $ | 5.24 |
| (5% return per year before expenses) |
|
| |
| class c | | | | | | |
| Actual | $ | 1,000.00 | $ | 1,016.10 | $ | 10.25 |
| Hypothetical | $ | 1,000.00 | $ | 1,014.76 | $ | 10.25 |
| (5% return per year before expenses) |
|
* Expenses are equal to the Fund’s annualized expense ratio of 1.04% and 2.04% for Class A and Class C respectively, multiplied by the average account value over the period, multiplied by 182/365 (to reflect the one-half year period).
www.calvert.com CALVERT GOVERNMENT FUND SEMI-ANNUAL REPORT (UNAUDITED) 11
| | | | |
| CALVERT GOVERNMENT FUND |
| SCHEDULE OF INVESTMENTS |
| MARCH 31, 2011 |
| |
| |
| | | PRINCIPAL | | |
| FDIC GUARANTEED CORPORATE BONDS - 8.4% | | AMOUNT | | VALUE |
| Ally Financial, Inc.: | | | | |
| 1.75%, 10/30/12 | $ | 30,000 | $ | 30,487 |
| 0.309%, 12/19/12 (r) | | 40,000 | | 40,014 |
| Bank of America Corp., 0.588%, 4/30/12 (r) | | 30,000 | | 30,122 |
| BankBoston Capital Trust III, 1.06%, 6/15/27 (r) | | 50,000 | | 38,797 |
| Citibank, 0.303%, 7/12/11 (r) | | 25,000 | | 24,997 |
| Citigroup Funding, Inc., 0.634%, 4/30/12 (r) | | 30,000 | | 30,132 |
| General Electric Capital Corp., 0.61%, 6/8/12 (r) | | 20,000 | | 20,089 |
| Goldman Sachs Group, Inc.: | | | | |
| 0.562%, 11/9/11 (r) | | 30,000 | | 30,059 |
| 0.51%, 3/15/12 (r) | | 80,000 | | 80,172 |
| JPMorgan Chase & Co.: | | | | |
| 0.433%, 4/1/11 (r) | | 15,000 | | 15,000 |
| 0.54%, 6/15/12 (r) | | 30,000 | | 30,107 |
| MetLife, Inc., 0.628%, 6/29/12 (r) | | 50,000 | | 50,169 |
| Morgan Stanley, 0.592%, 2/10/12 (r) | | 30,000 | | 30,075 |
| PNC Funding Corp., 0.503%, 4/1/12 (r) | | 30,000 | | 30,083 |
| State Street Bank and Trust Co., 0.51%, 9/15/11 (r) | | 35,000 | | 35,037 |
| Wells Fargo & Co., 0.53%, 6/15/12 (r) | | 30,000 | | 30,091 |
| |
| Total FDIC Guaranteed Corporate Bonds (Cost $527,662) | | | | 545,431 |
| |
| |
| |
| COLLATERALIZED MORTGAGE-BACKED | | | | |
| OBLIGATIONS (PRIVATELY ORIGINATED) - 0.4% | | | | |
| JP Morgan Mortgage Trust, 5.279%, 7/25/35 (r) | | 8,997 | | 8,768 |
| Merrill Lynch Mortgage Investors, Inc., 2.669%, 12/25/35 (r) | | 15,510 | | 15,381 |
| |
| Total Collateralized Mortgage-Backed Obligations | | | | |
| (Privately Originated) (Cost $23,754) | | | | 24,149 |
| |
| |
| COMMERCIAL MORTGAGE-BACKED SECURITIES - 2.8% | | | | |
| Citigroup Commercial Mortgage Trust, 4.38%, 10/15/41 | | 70,673 | | 71,060 |
| Wachovia Bank Commercial Mortgage Trust, 5.23%, 7/15/41 (r) | | 110,000 | | 111,392 |
| |
| Total Commercial Mortgage-Backed Securities (Cost $183,497) | | | | 182,452 |
| |
| CORPORATE BONDS - 21.5% | | | | |
| American Express Travel Related Services Co., Inc., 5.25%, | | | | |
| 11/21/11 (e) | | 15,000 | | 15,330 |
| APL Ltd., 8.00%, 1/15/24 (b) | | 25,000 | | 22,464 |
| Comcast Corp., 6.55%, 7/1/39 | | 50,000 | | 51,633 |
www.calvert.com CALVERT GOVERNMENT FUND SEMI-ANNUAL REPORT (UNAUDITED) 12
| | | | |
| | | PRINCIPAL | | |
| CORPORATE BONDS - CONT’D | | AMOUNT | | VALUE |
| Cooperatieve Centrale Raiffeisen-Boerenleenbank BA, | | | | |
| 4.20%, 5/13/14 (e) | $ | 51,000 | $ | 53,914 |
| Crown Castle Towers LLC, 4.883%, 8/15/20 (e) | | 40,000 | | 39,950 |
| CVS Caremark Corp., 6.302% to 6/1/12, floating rate | | | | |
| thereafter to 6/1/62 (r) | | 30,000 | | 29,394 |
| CVS Pass-Through Trust: | | | | |
| 6.036%, 12/10/28 | | 26,813 | | 27,988 |
| 8.353%, 7/10/31 (e) | | 29,140 | | 34,322 |
| Dominion Resources, Inc., 6.30% to 9/30/11, | | | | |
| floating rate thereafter to 9/30/66 (r) | | 80,000 | | 79,000 |
| Dun & Bradstreet Corp., 2.875%, 11/15/15 | | 50,000 | | 48,980 |
| Fifth Third Bank, 0.424%, 5/17/13 (r) | | 40,000 | | 39,223 |
| GenOn Americas Generation LLC, 8.30%, 5/1/11 | | 50,000 | | 50,125 |
| Goldman Sachs Group, Inc., 6.75%, 10/1/37 | | 60,000 | | 59,852 |
| Home Depot, Inc., 5.95%, 4/1/41 | | 50,000 | | 49,790 |
| Main & Walton Development Co. VRDN, 0.39%, 9/1/26 (r) | | 500,000 | | 500,000 |
| McGuire Air Force Base Military Housing Project, | | | | |
| 5.611%, 9/15/51 (e) | | 35,000 | | 29,715 |
| Ohana Military Communities LLC, 5.462%, 10/1/26 (e) | | 15,000 | | 15,225 |
| OPTI Canada, Inc., 9.75%, 8/15/13 (e) | | 40,000 | | 39,950 |
| Senior Housing Properties Trust, 8.625%, 1/15/12 | | 60,000 | | 62,775 |
| Systems 2001 AT LLC, 6.664%, 9/15/13 (e) | | 51,076 | | 54,524 |
| Toll Road Investors Partnership II LP, Zero Coupon: | | | | |
| 2/15/43 (b)(e) | | 70,000 | | 18,465 |
| 2/15/45 (b)(e) | | 202,295 | | 30,844 |
| Wachovia Capital Trust III, 5.57% to 3/15/11, floating rate | | | | |
| thereafter to 3/29/49 (r) | | 40,000 | | 36,700 |
| |
| Total Corporate Bonds (Cost $1,349,919) | | | | 1,390,163 |
| |
| |
| U.S. GOVERNMENT AGENCIES | | | | |
| AND INSTRUMENTALITIES - 39.7% | | | | |
| AgFirst FCB, 6.585% to 6/15/12, floating rate | | | | |
| thereafter to 6/29/49 (e)(r) | | 50,000 | | 40,000 |
| COP I LLC, 3.613%, 12/5/21 | | 91,764 | | 94,707 |
| Fannie Mae: | | | | |
| 0.375%, 12/28/12 | | 750,000 | | 745,406 |
| 1.25%, 8/20/13 | | 500,000 | | 502,001 |
| Federal Home Loan Bank, 5.00%, 11/17/17 | | 60,000 | | 67,297 |
| Freddie Mac, 1.125%, 7/27/12 | | 300,000 | | 302,390 |
| New Valley Generation I, 7.299%, 3/15/19 | | 64,218 | | 74,040 |
| New Valley Generation II, 5.572%, 5/1/20 | | 35,982 | | 37,711 |
| New Valley Generation V, 4.929%, 1/15/21 | | 46,800 | | 50,868 |
| Overseas Private Investment Corp., 0.22%, 8/15/17 (b)(r) | | 200,000 | | 200,000 |
| Premier Aircraft Leasing EXIM 1 Ltd.: | | | | |
| 3.576%, 2/6/22 | | 93,094 | | 92,829 |
| 3.547%, 4/10/22 | | 47,223 | | 47,029 |
| Private Export Funding Corp.: | | | | |
| 4.90%, 12/15/11 | | 30,000 | | 30,833 |
| 3.05%, 10/15/14 | | 70,000 | | 72,531 |
| 4.55%, 5/15/15 | | 30,000 | | 32,521 |
www.calvert.com CALVERT GOVERNMENT FUND SEMI-ANNUAL REPORT (UNAUDITED) 13
| | | | |
| U.S. GOVERNMENT AGENCIES | | | PRINCIPAL | |
| AND INSTRUMENTALITIES - CONT’D | | AMOUNT | VALUE |
| Tennessee Valley Authority, 4.375%, 6/15/15 | | 100,000 | 109,038 |
| US AgBank FCB, 6.11% to 7/10/12, floating rate | | | |
| thereafter to 12/31/49 (e)(r) | | | 40,000 | 26,800 |
| Vessel Management Services, Inc., 5.85%, 5/1/27 | | 46,000 | 50,489 |
| |
| Total U.S. Government Agencies and Instrumentalities | | |
| (Cost $2,529,335) | | | | 2,576,490 |
| |
| |
| |
| U.S. TREASURY - 19.9% | | | | |
| United States Treasury Bonds: | | | | |
| 3.875%, 8/15/40 | | | 55,000 | 49,208 |
| 4.25%, 11/15/40 | | | 201,000 | 192,175 |
| 4.75%, 2/15/41 | | | 825,000 | 857,484 |
| United States Treasury Notes, 3.625%, 2/15/21 | | 190,000 | 192,731 |
| |
| Total U.S. Treasury (Cost $1,288,697) | | | 1,291,598 |
| |
| |
| TOTAL INVESTMENTS (Cost $5,902,864) - 92.7% | | 6,010,283 |
| Other assets and liabilities, net - 7.3% | | | 475,476 |
| NET ASSETS - 100% | | | | 6,485,759 |
| |
| |
| |
| |
| | | | UNDERLYING | UNREALIZED |
| | # OF | EXPIRATION | FACEAMOUNT | APPRECIATION |
| FUTURES | CONTRACTS | DATE | AT VALUE | (DEPRECIATION) |
| Sold: | | | | |
| 2 Year U.S. Treasury Notes | 16 | 6/11 | $3,490,000 | ($1,356) |
| 30 Year U.S. Treasury Bonds | 10 | 6/11 | 1,201,875 | 4,895 |
| Total Sold | | | | $3,539 |
| (b) | This security was valued by the Board of Trustees. See Note A. |
| (e) | Security is exempt from registration under Rule 144A of the Securities Act of 1933. These securities may be resold in transactions exempt from registration, normally to qualified institutional buyers. |
| (r) | The coupon rate shown on floating or adjustable rate securities represents the rate at period end. |
Abbreviations:
FCB: Farm Credit Bank
LLC: Limited Liability Corporation
LP: Limited Partnership
VRDN: Variable Rate Demand Note
See notes to financial statements.
www.calvert.com CALVERT GOVERNMENT FUND SEMI-ANNUAL REPORT (UNAUDITED) 14
STATEMENT OF ASSETS AND LIABILITIES
MARCH 31, 2011
| | |
| ASSETS | | |
| Investments in securities, at value (Cost $5,902,864) | | |
| see accompanying schedule | $ | 6,010,283 |
| Cash | | 457,177 |
| Receivable for securities sold | | 315,036 |
| Receivable for shares sold | | 5 |
| Interest and dividends receivable | | 32,420 |
| Other assets | | 54,985 |
| Total assets | | 6,869,906 |
| |
| |
| LIABILITIES | | |
| Payable for securities purchased | | 363,764 |
| Payable for future variation margin | | 1,000 |
| Payable to Calvert Asset Management Company, Inc. | | 2,105 |
| Payable to Calvert Administrative Services Company | | 804 |
| Payable to Calvert Shareholder Services, Inc. | | 201 |
| Payable to Calvert Distributors, Inc. | | 2,432 |
| Accrued expenses and other liabilities | | 13,841 |
| Total liabilities | | 384,147 |
| |
| NET ASSETS | $ | 6,485,759 |
| |
| |
| NET ASSETS CONSIST OF: | | |
| Paid-in capital applicable to the following shares of beneficial interest, | | |
| unlimited number of no par value shares authorized: | | |
| Class A: 282,158 shares outstanding | $ | 4,483,056 |
| Class C: 107,285 shares outstanding | | 1,758,104 |
| Undistributed net investment income | | 495 |
| Accumulated net realized gain (loss) on investments | | 133,146 |
| Net unrealized appreciation (depreciation) on investments | | 110,958 |
| |
| NET ASSETS | $ | 6,485,759 |
| |
| |
| NET ASSET VALUE PER SHARE | | |
| Class A (based on net assets of $4,702,945) | $ | 16.67 |
| Class C (based on net assets of $1,782,814) | $ | 16.62 |
See notes to financial statements.
www.calvert.com CALVERT GOVERNMENT FUND SEMI-ANNUAL REPORT (UNAUDITED) 15
| | | |
| STATEMENT OF OPERATIONS |
| SIX MONTHS ENDED MARCH 31, 2011 |
| |
| |
| NET INVESTMENT INCOME | | | |
| Investment Income: | | | |
| Interest income | $ | 57,608 | |
| Total investment income | | 57,608 | |
| |
| Expenses: | | | |
| Investment advisory fee | | 11,379 | |
| Transfer agency fees and expenses | | 14,975 | |
| Administrative fees | | 4,267 | |
| Distribution Plan expenses: | | | |
| Class A | | 5,141 | |
| Class C | | 7,884 | |
| Trustees’ fees and expenses | | 146 | |
| Custodian fees | | 11,371 | |
| Registration fees | | 12,177 | |
| Reports to shareholders | | 3,766 | |
| Professional fees | | 11,697 | |
| Accounting fees | | 480 | |
| Miscellaneous | | 3,561 | |
| Total expenses | | 86,844 | |
| Reimbursement from Advisor: | | | |
| Class A | | (36,946 | ) |
| Class C | | (12,097 | ) |
| Fees paid indirectly | | (332 | ) |
| Net expenses | | 37,469 | |
| |
| NET INVESTMENT INCOME | | 20,139 | |
| |
| |
| REALIZED AND UNREALIZED GAIN (LOSS) | | | |
| Net realized gain (loss) on: | | | |
| Investments | | 94,688 | |
| Futures | | 46,786 | |
| | | 141,474 | |
| |
| Change in unrealized appreciation (depreciation) on: | | | |
| Investments | | (55,786 | ) |
| Futures | | 13,183 | |
| | | (42,603 | ) |
| |
| NET REALIZED AND UNREALIZED GAIN | | | |
| (LOSS) | | 98,871 | |
| |
| INCREASE (DECREASE) IN NET ASSETS | | | |
| RESULTING FROM OPERATIONS | $ | 119,010 | |
See notes to financial statements.
www.calvert.com CALVERT GOVERNMENT FUND SEMI-ANNUAL REPORT (UNAUDITED) 16
STATEMENTS OF CHANGES IN NET ASSETS
| | | | | | |
| | | SIX MONTHS ENDED | | | YEAR ENDED | |
| | | MARCH
31, | | | SEPTEMBER 30, | |
| INCREASE (DECREASE) IN NET ASSETS | | 2011 | | | 2010 | |
| Operations: | | | | | | |
| Net investment income | $ | 20,139 | | $ | 40,297 | |
| Net realized gain (loss) | | 141,474 | | | 72,343 | |
| Change in unrealized appreciation (depreciation) | | (42,603 | ) | | 83,002 | |
| |
| INCREASE (DECREASE) IN NET ASSETS | | | | | | |
| RESULTING FROM OPERATIONS | | 119,010 | | | 195,642 | |
| |
| |
| Distributions to shareholders from: | | | | | | |
| Net investment income: | | | | | | |
| Class A shares | | (20,236 | ) | | (34,076 | ) |
| Class C shares | | — | | | (1,244 | ) |
| Net realized gain: | | | | | | |
| Class A shares | | (53,461 | ) | | (49,649 | ) |
| Class C shares | | (22,483 | ) | | (3,894 | ) |
| Total distributions | | (96,180 | ) | | (88,863 | ) |
| |
| |
| Capital share transactions: | | | | | | |
| Shares sold: | | | | | | |
| Class A shares | | 1,606,422 | | | 2,278,717 | |
| Class C shares | | 899,710 | | | 1,007,963 | |
| Reinvestment of distributions: | | | | | | |
| Class A shares | | 71,120 | | | 83,267 | |
| Class C shares | | 16,146 | | | 958 | |
| Redemption fees: | | | | | | |
| Class A shares | | — | | | 616 | |
| Shares redeemed: | | | | | | |
| Class A shares | | (942,987 | ) | | (383,619 | ) |
| Class C shares | | (292,734 | ) | | (13,341 | ) |
| Total capital share transactions | | 1,357,677 | | | 2,974,561 | |
| |
| |
| TOTAL INCREASE (DECREASE) IN NET ASSETS | | 1,380,507 | | | 3,081,340 | |
| |
| |
| NET ASSETS | | | | | | |
| Beginning of period | | 5,105,252 | | | 2,023,912 | |
| End of period (including undistributed net investment income | | | | | | |
| of $495 and $592, respectively) | $ | 6,485,759 | | $ | 5,105,252 | |
See notes to financial statements.
www.calvert.com CALVERT GOVERNMENT FUND SEMI-ANNUAL REPORT (UNAUDITED) 17
STATEMENTS OF CHANGES IN NET ASSETS
| | SIX MONTHS
ENDED | | YEAR ENDED | |
| | MARCH
31, | | SEPTEMBER 30, | |
| CAPITAL SHARE ACTIVITY | 2011 | | 2010 | |
| Shares sold: | | | | |
| Class A shares | 97,181 | | 139,241 | |
| Class C shares | 54,467 | | 61,536 | |
| Reinvestment of distributions: | | | | |
| Class A shares | 4,324 | | 5,250 | |
| Class C shares | 988 | | 60 | |
| Shares redeemed: | | | | |
| Class A shares | (56,981 | ) | (23,445 | ) |
| Class C shares | (17,790 | ) | (837 | ) |
| Total capital share activity | 82,189 | | 181,805 | |
See notes to financial statements.
www.calvert.com CALVERT GOVERNMENT FUND SEMI-ANNUAL REPORT (UNAUDITED) 18
NOTES TO FINANCIAL STATEMENTS
NOTE A –– SIGNIFICANT ACCOUNTING POLICIES
General: The Calvert Government Fund (the “Fund”), a series of The Calvert Fund, is registered under the Investment Company Act of 1940 as a non-diversified, open-end management investment company. The operations of each series are accounted for separately. The Fund commenced operations on December 31, 2008 and offers two classes of shares of beneficial interest. Class A shares of the Fund are sold with a maximum front-end sales charge of 3.75%. Class C shares are sold without a front-end sales charge. With certain exceptions, the Fund will impose a deferred sales charge on shares sold within one year of purchase. Class C shares have higher levels of expenses than Class A shares. Each class has different: (a) dividend rates due to differences in Distribution Plan expenses and other class specific expenses, (b) exchange privileges and (c) class specific voting rights.
Security Valuation: Net asset value per share is determined every business day as of the close of the regular session of the New York Stock Exchange (generally 4:00 p.m. Eastern time). The Fund uses independent pricing services approved by the Board of Trustees to value its investments wherever possible. Investments for which market quotations are not available or deemed not reliable are fair valued in good faith under the direction of the Board of Trustees. In determining fair value, the Board considers all relevant qualitative and quantitative information available. These factors are subject to change over time and are reviewed periodically. The values assigned to fair value investments are based on available information and do not necessarily represent amounts that might ultimately be realized. Further, because of the inherent uncertainty of valuation, those estimated values may differ significantly from the values that would have been used had a ready market for the investments existed, and the differences could be material.
At March 31, 2011, securities valued at $271,773 or 4.2% of net assets were fair valued in good faith under the direction of the Board of Trustees.
The Fund utilizes various methods to measure the fair value of its investments. Generally Accepted Accounting Principles (GAAP) establishes a disclosure hierarchy that categorizes the inputs to valuation techniques used to value assets and liabilities at measurement date. These inputs are summarized in the three broad levels listed below: Level 1 – quoted prices in active markets for identical securities Level 2 – other significant observable inputs (including quoted prices for similar securities, interest rates, prepayment speeds, credit risk, etc.) Level 3 – significant unobservable inputs (including the Fund’s own assumptions in determining the fair value of investments) The inputs or methodology used for valuing securities are not necessarily an indication of the risk associated with investing in those securities.
Changes in valuation techniques may result in transfers in or out of an investment’s assigned level within the hierarchy during the period. Valuation techniques used to value the Fund’s investments by major category are as follows.
Debt securities, including restricted securities, are valued based on evaluated prices received from independent pricing services or from dealers who make markets in such
www.calvert.com CALVERT GOVERNMENT FUND SEMI-ANNUAL REPORT (UNAUDITED) 19
securities. For corporate bonds and U.S. government and government agency obligations, pricing services utilize matrix pricing which considers yield or price of bonds of comparable quality, coupon, maturity and type as well as dealer supplied prices and are generally categorized as Level 2 in the hierarchy. For collateralized mortgage obligations and commercial mortgage securities, pricing services utilize matrix pricing which considers prepayment speed assumptions, attributes of the collateral, yield or price of bonds of comparable quality, coupon, maturity and type as well as dealer supplied prices and, accordingly, such securities are generally categorized as Level 2 in the hierarchy. Short-term securities with remaining maturities of sixty days or less for which quotations are not readily available are valued at amortized cost, which approximates fair value, and are categorized as Level 2 in the hierarchy.
When independent prices are unavailable or unreliable, debt securities may be valued utilizing pricing matrices which consider similar factors that would be used by independent pricing services. These are generally categorized as Level 2 in the hierarchy but may be Level 3 depending on the circumstances.
The following is a summary of the inputs used to value the Fund’s net assets as of March 31, 2011:
| | | | | | | | |
| | | VALUATION INPUTS |
| InvestMents In securItIes | | level 1 | | level 2 | | level 3 | | total |
| Corporate debt | | - | $ | 1,882,286 | $ | 53,308 | $ | 1,935,594 |
| Collateralized mortgage-backed | | | | | | | | |
| obligations | | - | | 24,149 | | - | | 24,149 |
| Commercial mortgage-backed | | | | | | | | |
| securities | | - | | 182,452 | | - | | 182,452 |
| U.S. government obligations | | - | | 3,668,088 | | 200,000 | | 3,868,088 |
| TOTAL | | - | $ | 5,756,975 | $ | 253,308 | $ | 6,010,283 |
| Other financial instruments* | $ | 3,539 | | - | | - | $ | 3,539 |
* Other financial instruments are derivative instruments not reflected in the Portfolio of Investments, such as futures, which are valued at the unrealized appreciation/depreciation on the instrument.
Following is a reconciliation of Level 3 assets for which significant unobservable inputs were used to determine fair value:
| | | | | U.S. | | |
| | | CORPORATE | | GOVERNMENT | | |
| | | DEBT | | OBLIGATIONS | | TOTAL |
| Balance as of 9/30/10 | $ | 20,000 | $ | 200,000 | $ | 220,000 |
| Accrued discounts/premiums | | 105 | | — | | — |
| Realized gain (loss) | | — | | — | | — |
| Change in unrealized appreciation | | | | | | |
| (depreciation) | | 2,359 | | — | | 2,359 |
| Purchases | | — | | — | | — |
| Sales | | — | | — | | — |
| Transfers in and/or out of Level 31 | | 30,8442 | | — | | 30,844 |
| Balance as of 3/31/11 | $ | 53,308 | $ | 200,000 | $ | 253,308 |
www.calvert.com CALVERT GOVERNMENT FUND SEMI-ANNUAL REPORT (UNAUDITED) 20
1 The Fund’s policy is to recognize transfers into and transfers out of Level 3 as of the end of the reporting period.
2 Transferred from Level 2 to Level 3 because fair values were determined using valuation techniques utilizing unobservable inputs due to observable inputs being unavailable.
For the period ended March 31, 2011, total change in unrealized gain (loss) on Level 3 securities included in the change in net assets was ($377). Total unrealized gain (loss) for all securities (including Level 1 and Level 2) can be found on the accompanying Statement of Operations.
Repurchase Agreements: The Fund may enter into repurchase agreements with recognized financial institutions or registered broker/dealers and, in all instances, holds underlying securities with a value exceeding the total repurchase price, including accrued interest. Although risk is mitigated by the collateral, the Fund could experience a delay in recovering its value and a possible loss of income or value if the counterparty fails to perform in accordance with the terms of the agreement.
Futures Contracts: The Fund may purchase and sell futures contracts, but only when, in the judgment of the Advisor, such a position acts as a hedge. The Fund may not enter into futures contracts for the purpose of speculation or leverage. These futures contracts may include, but are not limited to, futures contracts based on U.S. Government obligations. The Fund is subject to interest rate risk in the normal course of pursuing its investment objectives. The Fund may use futures contracts to hedge against changes in the value of interest rates. The Fund may enter into futures contracts agreeing to buy or sell a financial instrument for a set price at a future date. Initial margin deposits of either cash or securities as required by the broker are made upon entering into the contract. While the contract is open, daily variation margin payments are made to or received from the broker reflecting the daily change in market value of the contract and are recorded for financial reporting purposes as unrealized gains or losses by the Fund. When a futures contract is closed, a realized gain or loss is recorded equal to the difference between the opening and closing value of the contract. The risks associated with entering into futures contracts may include the possible illiquidity of the secondary market which would limit the Fund’s ability to close out a futures contract prior to the settlement date, an imperfect correlation between the value of the contracts and the underlying financial instruments, or that the counterparty will fail to perform its obligations under the contracts’ terms. Futures contracts are designed by boards of trade which are designated “contracts markets” by the Commodities Futures Trading Commission. Futures contracts trade on the contracts markets in a manner that is similar to the way a stock trades on a stock exchange and the boards of trade, through their clearing corporations, guarantee the futures contracts against default. As a result, there is minimal counterparty credit risk to the Fund. During the period, the Fund used U.S. Treasury futures contracts to hedge against interest rate changes and to manage overall duration of the Fund.
Short Sales: The Fund may use a hedging technique that involves short sales of U.S. Treasury securities for the purposes of managing the duration of the Fund. Any short sales are “covered” with an equivalent amount of high-quality, liquid securities.
Security Transactions and Net Investment Income: Security transactions are accounted for on trade date. Realized gains and losses are recorded on an identified cost basis and may include proceeds from litigation. Dividend income is recorded on the ex-dividend date. Distributions received on securities that represent a return of capital or capital gain
www.calvert.com CALVERT GOVERNMENT FUND SEMI-ANNUAL REPORT (UNAUDITED) 21
are recorded as a reduction of cost of investments and/or as a realized gain. Interest income, which includes amortization of premium and accretion of discount on debt securities, is accrued as earned. Investment income and realized and unrealized gains and losses are allocated to separate classes of shares based upon the relative net assets of each class. Expenses arising in connection with a class are charged directly to that class. Expenses common to the classes are allocated to each class in proportion to their relative net assets.
Distributions to Shareholders: Distributions to shareholders are recorded by the Fund on ex-dividend date. Dividends from net investment income are paid monthly. Distributions from net realized capital gains, if any, are paid at least annually. Distributions are determined in accordance with income tax regulations which may differ from generally accepted accounting principles; accordingly, periodic reclassifications are made within the Fund’s capital accounts to reflect income and gains available for distribution under income tax regulations.
Estimates: The preparation of the financial statements in conformity with accounting principles generally accepted in the United States requires management to make estimates and assumptions that affect the reported amounts of assets and liabilities and disclosure of contingent assets and liabilities at the date of the financial statements and the reported amounts of income and expenses during the reported period. Actual results could differ from those estimates.
Redemption Fees: The Fund charges a 2% redemption fee on redemptions, including exchanges, made within 30 days of purchase in the same Fund. The redemption fee is paid to the Class of the Fund from which the redemption is made, and is accounted for as an addition to paid-in capital. The fee is intended to discourage market-timers by ensuring that short-term trading costs are borne by the investors making the transactions and not the shareholders already in the Fund.
Expense Offset Arrangements: The Fund has an arrangement with its custodian bank whereby the custodian’s fees may be paid indirectly by credits earned on the Fund’s cash on deposit with the bank. These credits are used to reduce the Fund’s expenses. Such a deposit arrangement may be an alternative to overnight investments.
Federal Income Taxes: No provision for federal income or excise tax is required since the Fund intends to continue to qualify as a regulated investment company under the Internal Revenue Code and to distribute substantially all of its taxable earnings.
Management has analyzed the Fund’s tax positions taken for all open federal income tax years and has concluded that no provision for federal income tax is required in the Fund’s financial statements. A Fund’s federal tax return is subject to examination by the Internal Revenue Service for a period of three years.
NOTE B — RELATED PARTY TRANSACTIONS
Calvert Asset Management Company, Inc. (the “Advisor”) is wholly-owned by Calvert Group, Ltd. (“Calvert”), which is indirectly wholly-owned by UNIFI Mutual Holding Company. The Advisor provides investment advisory services and pays the salaries and fees of officers and Trustees of the Fund who are employees of the Advisor or its affiliates. For its services, the Advisor receives an annual fee, payable monthly, of .40% of the Fund’s average daily net assets.
www.calvert.com CALVERT GOVERNMENT FUND SEMI-ANNUAL REPORT (UNAUDITED) 22
The Advisor has contractually agreed to limit net annual fund operating expenses through January 31, 2012. The contractual expense cap is 1.04% for Class A and 2.04% for Class C. For the purposes of this expense limit, operating expenses do not include interest expense, brokerage commissions, taxes, and extraordinary expenses. To the extent any expense offset credits are earned, the Advisor’s obligation under the contractual limitation may be reduced and the Advisor may benefit from the expense offset arrangement.
Calvert Administrative Services Company, an affiliate of the Advisor, provides administrative services to the Fund for an annual fee, payable monthly, of .15% for Class A and Class C based on their average daily net assets.
Calvert Distributors, Inc., an affiliate of the Advisor, is the distributor and principal underwriter for the Fund. The Distribution Plan, adopted by Class A and C shares, allows the Fund to pay the Distributor for expenses and services associated with the distribution of shares. The expenses paid may not exceed .50% and 1.00% annually of the Fund’s average daily net assets of Class A and Class C, respectively. The amount actually paid by the Fund is an annualized fee, payable monthly of .25% and 1.00%, of the Fund’s average daily net assets of Class A and Class C, respectively.
The Distributor received $3,014 as its portion of the commissions charged on sales of the Fund’s Class A shares for the six months ended March 31, 2011.
Calvert Shareholder Services, Inc. (“CSSI”), an affiliate of the Advisor, is the shareholder servicing agent for the Fund. For its services, CSSI received a fee of $1,017 for the six months ended March 31, 2011. Boston Financial Data Services, Inc., is the transfer and dividend disbursing agent.
Each Trustee of the Fund who is not an employee of the Advisor or its affiliates receives an annual retainer of $45,000 plus up to $2,000 for each Board and Committee meeting attended. The Board chair and Committee chairs each receive an additional $5,000 annual retainer. Trustee’s fees are allocated to each of the funds served
NOTE C — INVESTMENT ACTIVITY
During the period, the cost of purchases and proceeds from sales of investments, other than short-term and U.S. government securities, were $3,324,590 and $2,184,027, respectively. U.S. government security purchases and sales were $16,695,043 and $15,723,091, respectively.
The Fund intends to elect to defer net capital losses of $17,118 incurred from November 1, 2009 through September 30, 2010 and treat them as arising in the fiscal year ending September 30, 2011.
As of March 31, 2011, the tax basis components of unrealized appreciation/(depreciation) and the federal tax cost were as follows:
| Unrealized appreciation | $ | 122,004 | |
| Unrealized (depreciation) | | (15,770 | ) |
| Net unrealized appreciation/(depreciation) | $ | 106,234 | |
| Federal income tax cost of investments | $ | 5,904,049 | |
www.calvert.com CALVERT GOVERNMENT FUND SEMI-ANNUAL REPORT (UNAUDITED) 23
The Fund may sell or purchase securities to and from other funds managed by the Advisor, typically short-term variable rate demand notes. Interportfolio transactions are primarily used for cash management purposes. Interportfolio transactions are made pursuant to Rule 17a-7 of the Investment Company Act of 1940. For the six months ended March 31, 2011, such purchase and sales transactions were $1,500,000 and $1,000,000, respectively.
NOTE D — LINE OF CREDIT
A financing agreement is in place with all Calvert Group Funds and State Street Corporation (“SSC”). Under the agreement, SSC provides an unsecured line of credit facility, in the aggregate amount of $50 million ($25 million committed and $25 million uncommitted), accessible by the Funds for temporary or emergency purposes only. Borrowings under this committed facility bear interest at the higher of the London Interbank Offered Rate, (LIBOR) or the overnight Federal Funds Rate plus 1.25% per annum. A commitment fee of .125% per annum is incurred on the unused portion of the committed facility, which is allocated to all participating funds. The Fund had no loans outstanding pursuant to this line of credit at March 31, 2011. For the six months ended March 31, 2011, borrowings by the Fund under the Agreement were as follows:
| | WEIGHTED | | MONTH OF |
| AVERAGE | AVERAGE | MAXIMUM | MAXIMUM |
| DAILY | INTEREST | AMOUNT | AMOUNT |
| BALANCE | RATE | BORROWED | BORROWED |
| $2,323 | 1.51% | $192,794 | January 2011 |
NOTE E – SUBSEQUENT EVENTS
In preparing the financial statements as of March 31, 2011, no subsequent events or transactions occurred that would have materially impacted the financial statements as presented.
Effective April 30, 2011, the Calvert operating companies will be renamed as follows: Calvert Group, Ltd. will be renamed Calvert Investments, Inc., Calvert Asset Management Company, Inc. will be renamed Calvert Investment Management, Inc., Calvert Distributors, Inc. will be renamed Calvert Investment Distributors, Inc., Calvert Administrative Services Company will be renamed Calvert Investment Administrative Services, Inc., and Calvert Shareholder Services, Inc. will be renamed Calvert Investment Services, Inc.
www.calvert.com CALVERT GOVERNMENT FUND SEMI-ANNUAL REPORT (UNAUDITED) 24
| | | | | | | | | |
| FINANCIAL HIGHLIGHTS |
| |
| |
| | | Periods ended | |
| | | MARCH
31, | | | SEPTEMBER 30, | | | SEPTEMBER 30, | |
| class A shares | | 2011 | | | 2010 | | | 2009 | # |
| Net asset value, beginning | $ | 16.63 | | $ | 16.14 | | $ | 15.00 | |
| Income from investment operations: | | | | | | | | | |
| Net investment income | | .08 | | | .26 | | | .06 | |
| Net realized and unrealized gain (loss) | | .27 | | | .88 | | | 1.14 | |
| Total from investment operations | | .35 | | | 1.14 | | | 1.20 | |
| Distributions from: | | | | | | | | | |
| Net investment income | | (.08 | ) | | (.24 | ) | | (.06 | ) |
| Net realized gain | | (.23 | ) | | (.41 | ) | | — | |
| Total ditributions | | (.31 | ) | | (.65 | ) | | (.06 | ) |
| Total increase (decrease) in net asset value | | 0.04 | | | 0.49 | | | 1.14 | |
| Net asset value, ending | $ | 16.67 | | $ | 16.63 | | $ | 16.14 | |
| Total return* | | 2.15 | % | | 7.31 | % | | 7.98 | % |
| Ratios to average net assets:A | | | | | | | | | |
| Net investment income | | .99 | % (a) | | 1.60 | % | | .63 | % (a) |
| Total expenses | | 2.85 | % (a) | | 3.81 | % | | 5.67 | % (a) |
| Expenses before offsets | | 1.05 | % (a) | | 1.05 | % | | 1.04 | % (a) |
| Net expenses | | 1.04 | % (a) | | 1.04 | % | | 1.04 | % (a) |
| Portfolio turnover | | 429 | % | | 401 | % | | 428 | % |
| Net assets, ending (in thousands) | $ | 4,703 | | $ | 3,951 | | $ | 1,881 | |
See notes to financial highlights.
www.calvert.com CALVERT GOVERNMENT FUND SEMI-ANNUAL REPORT (UNAUDITED) 25
| | | | | | | | | |
| FINANCIAL HIGHLIGHTS |
| |
| |
| | | | | | Periods ended | | | | |
| | | MARCH
31, | | | SEPTEMBER 30, | | | SEPTEMBER 30, | |
| class c shares | | 2011 | | | 2010 | | | 2009 | # |
| Net asset value, beginning | $ | 16.58 | | $ | 16.10 | | $ | 15.00 | |
| Income from investment operations: | | | | | | | | | |
| Net investment income | | *** | | | .09 | | | ** | |
| Net realized and unrealized gain (loss) | | .27 | | | .89 | | | 1.10 | |
| Total from investment operations | | .27 | | | .98 | | | 1.10 | |
| Distributions from: | | | | | | | | | |
| Net investment income | | — | | | (.09 | ) | | — | |
| Net realized gain | | (.23 | ) | | (.41 | ) | | — | |
| Total ditributions | | (.23 | ) | | (.50 | ) | | — | |
| Total increase (decrease) in net asset value | | 0.04 | | | 0.48 | | | 1.10 | |
| Net asset value, ending | $ | 16.62 | | $ | 16.58 | | $ | 16.10 | |
| |
| Total return* | | 1.67 | % | | 6.25 | % | | 7.33 | % |
| Ratios to average net assets:A | | | | | | | | | |
| Net investment income | | (.02 | %) (a) | | .37 | % | | .03 | % (a) |
| Total expenses | | 3.59 | % (a) | | 7.13 | % | | 41.41 | % (a) |
| Expenses before offsets | | 2.05 | % (a) | | 2.05 | % | | 2.04 | % (a) |
| Net expenses | | 2.04 | % (a) | | 2.04 | % | | 2.04 | % (a) |
| Portfolio turnover | | 429 | % | | 401 | % | | 428 | % |
| Net assets, ending (in thousands) | $ | 1,783 | | $ | 1,154 | | $ | 143 | |
| A | Total expenses do not reflect amounts reimbursed and/or waived by the Advisor or reductions from expense offset arrangements. Expenses before offsets reflect expenses after reimbursement and/or waiver by the Advisor but prior to reductions from expense offset arrangements. Net expenses are net of all reductions and represent the net expenses paid by the Fund. |
| * | Total return is not annualized for periods less than one year and does not reflect deduction of any front-end or deferred sales charge. |
| ** | Less than $.01 per share. |
| *** | Net investment loss was $.002 per share. |
| # | From December 31, 2008 inception. |
| (a) | Annualized. |
See notes to financial statements.
www.calvert.com CALVERT GOVERNMENT FUND SEMI-ANNUAL REPORT (UNAUDITED) 26
EXPLANATION OF FINANCIAL TABLES
SCHEDULE OF INVESTMENTS
The Schedule of Investments is a snapshot of all securities held in the fund at their market value, on the last day of the reporting period. Securities are listed by asset type (e.g., common stock, corporate bonds, U.S. government obligations) and may be further broken down into sub-groups and by industry classification.
STATEMENT OF ASSETS AND LIABILITIES
The Statement of Assets and Liabilities is often referred to as the fund’s balance sheet. It lists the value of what the fund owns, is due and owes on the last day of the reporting period. The fund’s assets include the market value of securities owned, cash, receivables for securities sold and shareholder subscriptions, and receivables for dividends and interest payments that have been earned, but not yet received. The fund’s liabilities include payables for securities purchased and shareholder redemptions, and expenses owed but not yet paid. The statement also reports the fund’s net asset value (NAV) per share on the last day of the reporting period. The NAV is calculated by dividing the fund’s net assets (assets minus liabilities) by the number of shares outstanding. This statement is accompanied by a Schedule of Investments. Alternatively, if certain conditions are met, a Statement of Net Assets may be presented in lieu of this statement and the Schedule of Investments.
STATEMENT OF NET ASSETS
The Statement of Net Assets provides a detailed list of the fund’s holdings, including each security’s market value on the last day of the reporting period. The Statement of Net Assets includes a Schedule of Investments. Other assets are added and other liabilities subtracted from the investments total to calculate the fund’s net assets. Finally, net assets are divided by the outstanding shares of the fund to arrive at its share price, or Net Asset Value (NAV) per share.
At the end of the Statement of Net Assets is a table displaying the composition of the fund’s net assets. Paid in Capital is the money invested by shareholders and represents the bulk of net assets. Undistributed Net Investment Income and Accumulated Net Realized Gains usually approximate the amounts the fund had available to distribute to shareholders as of the statement date. Accumulated Realized Losses will appear as negative balances. Unrealized Appreciation (Depreciation) is the difference between the market value of the fund’s investments and their cost, and reflects the gains (losses) that would be realized if the fund were to sell all of its investments at their statement-date values.
www.calvert.com CALVERT GOVERNMENT FUND SEMI-ANNUAL REPORT (UNAUDITED) 27
STATEMENT OF OPERATIONS
The Statement of Operations summarizes the fund’s investment income earned and expenses incurred in operating the fund. Investment income includes dividends earned from stocks and interest earned from interest-bearing securities in the fund. Expenses incurred in operating the fund include the advisory fee paid to the investment advisor, administrative services fees, distribution plan expenses (if applicable), transfer agent fees, shareholder servicing expenses, custodial, legal, and audit fees, and the printing and postage expenses related to shareholder reports. Expense offsets (fees paid indirectly) are also shown. Credits earned from offset arrangements are used to reduce the fund’s expenses. This statement also shows net gains (losses) realized on the sale of investments and the increase or decrease in the unrealized appreciation (depreciation) on investments held during the period.
STATEMENT OF CHANGES IN NET ASSETS
The Statement of Changes in Net Assets shows how the fund’s total net assets changed during the two most recent reporting periods. Changes in the fund’s net assets are attributable to investment operations, distributions and capital share transactions.
The Operations section of the report summarizes information detailed in the Statement of Operations. The Distribution section shows the dividend and capital gain distributions made to shareholders. The amounts shown as distributions in this section may not match the net investment income and realized gains amounts shown in the Operations section because distributions are determined on a tax basis and certain investments or transactions may be treated differently for financial statement and tax purposes. The Capital Share Transactions section shows the amount shareholders invested in the fund, either by purchasing shares or by reinvesting distributions, and the amounts redeemed. The corresponding numbers of shares issued, reinvested and redeemed are shown at the end of the report.
FINANCIAL HIGHLIGHTS
The Financial Highlights table provides a per-share breakdown per class of the components that affect the fund’s net asset value for current and past reporting periods. The table provides total return, total distributions, expense ratios, portfolio turnover and net assets for the applicable period. Total return is a measure of a fund’s performance that encompasses all elements of return: dividends, capital gain distributions and changes in net asset value. Total return is the change in value of an investment over a given period, assuming reinvestment of any dividends and capital gain distributions, expressed as a percentage of the initial investment. Total distributions include distributions from net investment income and net realized gains. Long-term gains are earned on securities held in the fund more than one year. Short-term gains, on the sale of securities held less than one year, are treated as ordinary dividend income for tax purposes. The expense ratio is a fund’s cost of doing business, expressed as a percentage of net assets. These expenses directly reduce returns to shareholders. Portfolio turnover measures the trading activity in a fund’s investment portfolio – how often securities are bought and sold by a fund. Portfolio turnover is affected by market conditions, changes in the size of the fund, the nature of the fund’s investments and the investment style of the portfolio manager.
www.calvert.com CALVERT GOVERNMENT FUND SEMI-ANNUAL REPORT (UNAUDITED) 28
PROXY VOTING
The Proxy Voting Guidelines of the Calvert Funds that the Fund uses to determine how to vote proxies relating to portfolio securities are provided as an Appendix to the Fund’s Statement of Additional Information. The Statement of Additional Information can be obtained free of charge by calling the Fund at 1-800-368-2745, by visiting the Calvert website at www.calvert.com; or by visiting the SEC’s website at www.sec.gov.
Information regarding how the Fund voted proxies relating to portfolio securities during the most recent 12-month period ended June 30 is available on the Fund’s website at www.calvert.com and on the SEC’s website at www.sec.gov.
AVAILABILITY OF QUARTERLY PORTFOLIO HOLDINGS
The Fund files its complete schedule of portfolio holdings with the SEC for the first and third quarters of each fiscal year on Form N-Q. The Fund’s Form N-Q is available on the SEC’s website at www.sec.gov. The Fund’s Form N-Q may be reviewed and copied at the SEC’s Public Reference Room in Washington, DC; information on the operation of the Public Reference Room may be obtained by calling 1-800-SEC-0330.
BASIS FOR BOARD’S APPROVAL OF INVESTMENT ADVISORY CONTRACT
At a meeting held on December 8, 2010, the Board of Trustees, and by a separate vote, the disinterested Trustees, approved the continuance of the Investment Advisory Agreement between The Calvert Fund and the Advisor with respect to the Fund.
In evaluating the Investment Advisory Agreement, the Board considered a variety of information relating to the Fund and the Advisor. The disinterested Trustees reviewed a report prepared by the Advisor regarding various services provided to the Fund by the Advisor and its affiliates. Such report included, among other data, information regarding the Advisor’s personnel and the Advisor’s revenue and cost of providing services to the Fund, and a separate report prepared by an independent third party, which provided a statistical analysis comparing the Fund’s investment performance, expenses, and fees to comparable mutual funds.
The disinterested Trustees were separately represented by independent legal counsel with respect to their consideration of the reapproval of the Investment Advisory Agreement. Prior to voting, the disinterested Trustees reviewed the proposed continuance of the Investment Advisory Agreement with management and also met in private sessions with their counsel at which no representatives of management were present.
www.calvert.com CALVERT GOVERNMENT FUND SEMI-ANNUAL REPORT (UNAUDITED) 29
In the course of its deliberations regarding the Investment Advisory Agreement, the Board considered the following factors, among others: the nature, extent and quality of the services provided by the Advisor, including the personnel providing such services; the Advisor’s financial condition; the level and method of computing the Fund’s advisory fee; comparative performance, fee and expense information for the Fund; the profitability of the Calvert Group of Funds to the Advisor and its affiliates; the direct and indirect benefits, if any, derived by the Advisor and its affiliates from their relationship with the Fund; the effect of the Fund’s growth and size on the Fund’s performance and expenses; the affiliated distributor’s process for monitoring sales load breakpoints; the Advisor’s compliance programs and policies; the Advisor’s performance of substantially similar duties for other funds; and any possible conflicts of interest.
In considering the nature, extent and quality of the services provided by the Advisor under the Investment Advisory Agreement, the Board reviewed information provided by the Advisor relating to its operations and personnel, including, among other information, biographical information on the Advisor’s investment, supervisory and professional staff and descriptions of its organizational and management structure. The Board also took into account similar information provided periodically throughout the previous year by the Advisor as well as the Board’s familiarity with management through Board of Trustees’ meetings, discussions and other reports. The Board considered the Advisor’s management style and its performance in employing its investment strategies as well as its current level of staffing and overall resources. The Advisor’s administrative capabilities, including its ability to supervise the other service providers for the Fund, were also considered. The Board concluded that it was satisfied with the nature, extent and quality of services provided to the Fund by the Advisor under the Investment Advisory Agreement.
In considering the Fund’s performance, the Board noted that it reviewed on a quarterly basis detailed information about the Fund’s performance results, portfolio composition and investment strategies. In addition, the Board took into account overall financial market conditions. The Board also reviewed various comparative data provided to it in connection with its consideration of the renewal of the Investment Advisory Agreement, including, among other information, a comparison of the Fund’s total return with its benchmark and with that of comparable mutual funds. This comparison indicated that the Fund performed above the median of its peer universe for the one-year period ended June 30, 2010. The data also indicated that the Fund outperformed its benchmark for the one-year period ended June 30, 2010. Based upon its review, the Board concluded that the Fund’s performance was satisfactory.
In considering the Fund’s fees and expenses, the Board compared the Fund’s fees and total expense ratio with various comparative data for the funds in its peer group. Among other findings, the data indicated that the Fund’s advisory fee (after taking into account waivers and/or reimbursements) was below the median of its peer group and that total expenses (net of waivers and/or reimbursements) were above the median of its peer group. The Board noted that the allocation of advisory and administrative fees may vary among the Fund’s peer group. The Board took into account the Advisor’s current undertaking to maintain expense limitations for the Fund’s Class A and Class C shares. Based upon its review, the Board concluded that the advisory fee was reasonable in view of the quality of services provided by the Advisor and the other factors considered.
www.calvert.com CALVERT GOVERNMENT FUND SEMI-ANNUAL REPORT (UNAUDITED) 30
The Board reviewed the Advisor’s profitability on a fund-by-fund basis. In reviewing the overall profitability of the advisory fee to the Fund’s Advisor, the Board also considered the fact that affiliates of the Advisor provided shareholder servicing and administrative services to the Fund for which they received compensation. The information considered by the Board included Calvert’s operating profit margin information both before and after tax expenses with respect to the services that the Advisor and its affiliates provided to the Calvert Group of Funds complex. The Board reviewed the profitability of the Advisor’s relationship with the Fund in terms of the total amount of annual advisory fees it received with respect to the Fund and whether the Advisor had the financial wherewithal to continue to provide a high level of services to the Fund. The Board noted that the Advisor had reimbursed expenses of the Fund. The Board also noted the Advisor’s current undertaking to maintain expense limitations for the Fund’s Class A and Class C shares. The Board also considered that the Advisor derived benefits to its reputation and other indirect benefits from its relationship with the Fund. Based upon its review, the Board concluded that the Advisor’s and its affiliates’ level of profitability from their relationship with the Fund was reasonable.
The Board considered the effect of the Fund’s current size and potential growth on its performance and expenses. The Board concluded that adding breakpoints to the advisory fee at specified asset levels would not be appropriate at this time given the Fund’s current size. The Board noted that if the Fund’s assets increased over time, the Fund might realize other economies of scale if assets increased proportionally more than certain other expenses.
In reapproving the Investment Advisory Agreement, the Board, including the disinterested Trustees, did not identify any single factor as controlling, and each Trustee may have attributed different weight to various factors.
Conclusions
The Board reached the following conclusions regarding the Investment Advisory Agreement, among others: (a) the Advisor has demonstrated that it possesses the capability and resources to perform the duties required of it under the Investment Advisory Agreement; (b) the Advisor maintains appropriate compliance programs; (c) performance of the Fund is satisfactory relative to the performance of funds with similar investment objectives and to relevant indices; (d) the Advisor is likely to execute its investment strategies consistently over time; and (e) the Fund’s advisory fee is reasonable relative to those of similar funds and to the services to be provided by the Advisor. Based on its conclusions, the Board determined that reapproval of the Investment Advisory Agreement would be in the best interests of the Fund and its shareholders.
www.calvert.com CALVERT GOVERNMENT FUND SEMI-ANNUAL REPORT (UNAUDITED) 31
To Open an Account
800-368-2748
Yields and Prices
Calvert Information Network
(24 hours, 7 days a week)
800-368-2745
Service for Existing Account
Shareholders: 800-368-2745
Brokers: 800-368-2746
TDD for Hearing Impaired
800-541-1524
Branch Office
4550 Montgomery Avenue
Suite 1000 North
Bethesda, Maryland 20814
Registered, Certified or Overnight Mail
Calvert Investments
c/o BFDS,
330 West 9th Street
Kansas City, MO 64105
Web Site
www.calvert.com
Principal Underwriter
Calvert Investment Distributors, Inc.
4550 Montgomery Avenue
Suite 1000 North
Bethesda, Maryland 20814
| | |
| CALVERT | CALVERT’S | Equity Funds |
| GOVERNMENT | FAMILY OF FUNDS | Enhanced Equity Portfolio |
| FUND | | Equity Portfolio |
| | Tax-Exempt Money | Large Cap Growth Fund |
| | Market Funds | Large Cap Value Fund |
| | CTFR Money Market Portfolio | Social Index Fund |
| | | Capital Accumulation Fund |
| | Taxable Money Market | International Equity Fund |
| | Funds | Small Cap Fund |
| | First Government Money Market | Global Alternative Energy Fund |
| | Fund | Global Water Fund |
| | Money Market Portfolio | International Opportunities Fund |
| |
| | Municipal Funds | Balanced and Asset |
| | Tax-Free Bond Fund | Allocation Funds |
| | | Balanced Portfolio |
| | Taxable Bond Funds | Conservative Allocation Fund |
| | Bond Portfolio | Moderate Allocation Fund |
| | Income Fund | Aggressive Allocation Fund |
| | Short Duration Income Fund | |
| | Long-Term Income Fund | |
| | Ultra-Short Income Fund | |
| | Government Fund | |
| | High-Yield Bond Fund | |
This report is intended to provide fund information to shareholders. It is not authorized for distribution to prospective investors unless preceded or accompanied by a prospectus.
Note: The information on our website is not incorporated by reference into this report; our website address is included as an inactive textual reference only.
Investors should carefully consider the investment objectives, risks, charges and expenses of the Calvert Funds. This and other important information is contained in the fund’s summary prospectus and prospectus, which can be obtained from your financial professional and should be read carefully before investing. You may also call Calvert at 800/368-2745 or visit www. calvert.com.

INFORMATION REGARDING CALVERT OPERATING COMPANY
NAME CHANGES
Effective on April 30, 2011, the following Calvert operating companies will be renamed as indicated:
| | |
| Current Company Name | Company Name on 4/30/11 | Company Description |
| |
| Calvert Group, Ltd. | Calvert Investments, Inc. | Corporate parent of each |
| | | operating company listed |
| | | below |
| |
| Calvert Asset Management | Calvert Investment | Investment advisor to the |
| Company, Inc. | Management, Inc. | Calvert Funds |
| |
| Calvert Distributors, Inc. | Calvert Investment Distributors, | Principal underwriter |
| | Inc. | and distributor for the |
| | | Calvert Funds |
| |
| Calvert Administrative | Calvert Investment | Administrative services |
| Services Company | Administrative Services, Inc. | provider for the Calvert |
| | | Funds |
| |
| Calvert Shareholder | Calvert Investment Services, | Shareholder servicing |
| Services, Inc. | Inc. | provider for the Calvert |
| | | Funds |
Choose Planet-friendly E-delivery!
Sign up now for on-line statements, prospectuses, and fund reports. In less than five minutes you can help reduce paper mail and lower fund costs.
Just go to www.calvert.com. If you already have an online account at Calvert, click on My Account, and select the documents you would like to receive via e-mail.
If you’re new to online account access, click on Login/Register to open an online account. Once you’re in, click on the E-delivery sign-up at the bottom of the Account Portfolio page and follow the quick, easy steps. Note: if your shares are not held directly at Calvert but through a brokerage firm, you must contact your broker for electronic delivery options available through their firm.

Dear Shareholder:
The financial markets ended the six-month period on a high note. The Federal Reserve’s announcement in the fall of 2010 of a second round of quantitative easing (QE2) and the extension in December of the Bush-era tax cuts for all income levels helped buoy the markets and pushed Treasury yields higher. The resulting increase in U.S. consumer spending and confidence helped drive a year-end rally.
This calm lasted until new storms arrived in the beginning of 2011. Civil and political unrest in the Middle East and North Africa sent the price of crude soaring and heightened energy security concerns in many countries around the world. In March, the tragic earthquake and tsunami struck Japan. Our sympathies go out to the people of Japan who lost loved ones in this disaster. The earthquake—and its impact on the country’s nuclear reactors—roiled global financial markets. The cumulative effect of these events sparked a brief sell-off in corporate bonds as investors moved into the relative safety of U.S. Treasuries.
Fixed-Income Markets Continue to be Volatile
Investment-grade corporate bonds edged down slightly for the reporting period, with the Barclays Capital U.S. Credit Index returning -0.98%, while high-yield bonds, as measured by the BofA Merrill Lynch U.S. High Yield Master II Index, returned 7.09%. Money-market returns remained flat, reflecting the Fed’s efforts to keep its target interest rate very low.
Corporate bonds continued to benefit from generally strong corporate earnings and lower default expectations during the fourth quarter of 2010. This trend continued during the first quarter of 2011 as investors became more comfortable moving into riskier asset classes to chase yield. However, most fixed-income sectors experienced significant volatility as investors reacted to the turmoil in the Middle East and the ensuing climb in oil prices as well as the disaster in Japan—which prompted some investors to move back into the relative safety of Treasuries as noted above.
Municipal bond returns suffered greatly in the final months of 2010 due to heavy municipal debt issuance, record municipal bond fund redemptions by retail investors, and fear of massive municipal debt defaults, which appears to be unfounded. Fortunately, prices steadied after the turn of the year due to slowing investor outflows and minimal new debt issuance.
Opportunities and Challenges Ahead
Overall, we are optimistic and expect a slow, gradual economic recovery to continue, which we believe should help sustain a corporate bond rally through the remainder of 2011. A low core inflation rate (which excludes food and energy prices) will likely
www.calvert.com CALVERT HIGH YIELD BOND FUND SEMI-ANNUAL REPORT (UNAUDITED) 4
facilitate economic growth, while continued debt reduction, lingering high unemployment, and a struggling housing market will limit gains. Energy prices will remain a challenge until we see more resolution of the events in the Middle East and North Africa. Of course, more geopolitical crises, rising commodity prices, and inflation spikes could certainly dampen the markets.
In short, we believe the markets, the global economy, and your Calvert funds can successfully navigate through any temporary setbacks.
Discuss Your Portfolio Allocations with Your Advisor
Given the market shifts we have experienced, your overall portfolio asset allocation and investment strategy may no longer match your needs. Therefore, we recommend reviewing these with your financial advisor to ensure that your target mix of U.S. and international stocks, bonds, and cash is well-diversified and appropriate given your financial goals, time horizon, and risk tolerance.
We encourage you to visit our website, www.calvert.com, for fund information and updates as well as market and economic commentary from Calvert professionals.
As noted elsewhere in this report, the Calvert operating companies that provide services to the funds will change their names effective April 30, 2011. As part of the changes, Calvert Group, Ltd. will be known as Calvert Investments, Inc., and the funds’ advisor, Calvert Asset Management Company, Inc., will be known as Calvert Investment Management, Inc.
As always, we appreciate your investing with Calvert.

Barbara J. Krumsiek
President and CEO
Calvert Investments, Inc.
April 2011
www.calvert.com CALVERT HIGH YIELD BOND FUND SEMI-ANNUAL REPORT (UNAUDITED) 5
PORTFOLIO MANAGEMENT DISCUSSION

Gregory Habeeb
Senior Vice President and Senior Portfolio
Manager of
Calvert Investment
Management, Inc.
Performance
For the six-month period ended March 31, 2011, Calvert High-Yield Bond Fund (Class A shares at NAV) returned 7.84%. Its benchmark index, the BofA Merrill Lynch High Yield Master II Index, returned 7.09% for the period. Security selection was the primary reason for the Fund’s outperformance.
CALVERT HIGH YIELD BOND FUND
MARCH 31, 2011
INVESTMENT PERFORMANCE
(TOTAL RETURN AT NAV*)
| | 6 Months | | 12 Months | |
| | ended | | ended | |
| | 3/31/11 | | 3/31/11 | |
| Class A | 7.84 | % | 15.81 | % |
| Class I | 8.20 | % | 16.61 | % |
| BofA Merrill Lynch High | | | |
| Yield Master II Index | 7.09 | % | 14.18 | % |
| Lipper High Current | | | | |
| Yield Funds Average | 7.31 | % | 13.57 | % |
| |
| SEC YIELDS | | | | |
| | 30 days ended | |
| | 3/31/11 | | 9/30/10 | |
| Class A | 4.85 | % | 5.79 | % |
| Class I | 5.73 | % | 6.70 | % |
Investment Climate
The six-month reporting period was characterized by four clear phases in interest-rate movements. The first was a steady and strong upward movement in interest rates. The 10-year Treasury yield increased from 2.33% in early October to 3.57% by mid-Decem-ber. The Federal Reserve’s (Fed) announcement of new Treasury purchases in November did little to slow the advance as economic data improved. In December, many analysts raised their forecasts for economic growth, and stocks rallied as a larger-than-expected fiscal stimulus package was passed. The second phase featured a fairly quiet trading range. During phase three, from early to mid-February, yields rose as the unemployment rate fell sharply, boosting confidence in the economy and triggering a rally in stocks. The 10-year Treasury yield peaked at 3.74%.
In the final phase, yields began to fall as turmoil in the Middle East pushed up the price of oil and raised doubts about the strength of the young economic expansion. Volatility increased in global financial markets. Doubt, uncertainty, and volatility were amplified by the terrible March 11 earthquake and tsunami in Japan. Treasury yields continued to fall, with the 10-year yield bottoming at 3.14% a few days after the disaster. After
| * | Investment performance/return at NAV does not reflect the deduction of the Fund’s maximum 3.75% front-end sales charge or any deferred sales charge. |
www.calvert.com CALVERT HIGH YIELD BOND FUND SEMI-ANNUAL REPORT (UNAUDITED) 6
| | |
| | % of Total | |
| ECONOMIC SECTORS | Investments | |
| Basic Materials | 4.5 | % |
| Communications | 15.7 | % |
| Consumer, Cyclical | 15.6 | % |
| Consumer, Non-cyclical | 21.4 | % |
| Diversified | 0.5 | % |
| Energy | 5.6 | % |
| Financials | 14.2 | % |
| Government | 0.7 | % |
| Industrials | 15.2 | % |
| Technology | 3.0 | % |
| Telecommunication Services | 0.4 | % |
| Utilities | 3.2 | % |
| Total | 100 | % |
the shock wore off, stocks regained their footing and Treasury yields recovered some ground. The 10-year Treasury yield ended the reporting period near 3.5%, which was close to the middle of the range over the full reporting period.1
During the reporting period, we estimate that the U.S. economy grew at an annualized rate of 3.3%.2 This is very near the 50-year average growth rate, but remains below the rate seen, at a similar point in the
business cycle, after prior deep recessions in the post-WWII era. The core consumer price inflation (CPI) rate increased from 0.6% to 1.1% during the reporting period,3 so the Fed’s concern about unwanted disinflation abated. While the inflation rate was trending up, the level of both core and headline inflation rates remained below long-run averages. Market expectations for inflation in coming years increased to a level more in line with long-term averages.
Portfolio Strategy
The high yield bond market has performed well since March 2009. Record new bond issuance has been supported by robust cash flows. Investors have flocked to the sector, attracted by low default rates and appealing yields. Our strong performance during the reporting period was the result of better bond selection and increasing exposure to bonds in more cyclical parts of the market, including the industrial, consumer, and financial sectors. We avoided credits with European and Japan exposure, while seeking bonds with higher yields than the index yield, which was approximately 7.5% during the reporting period. The portfolio is underweight BB rated bonds which, in our opinion, offer poor relative value as they yield less than six percent on average. Twenty-five percent of the portfolio was invested in BB rated issues while 38% of the index was invested there. Notably, the Fund has a significant out-of-index play with 4.5% allocated to investment-grade bonds, which we believe have strong total return potential.
Outlook
The U.S. economy continues to recover from severe financial crisis. Deleveraging in household and financial sectors continues, suggesting moderate, not heated, growth and consumer price inflation. Monetary policy should remain easy in coming quarters as federal, state, and local fiscal stimuli continue to recede or contract. The impact from the long stretch of extraordinarily easy Fed policy, with its near-zero percent short-term interest rates and government bond purchases, is clear in the higher prices of stocks, bonds, and commodities, but not in consumer price indices.
www.calvert.com CALVERT HIGH YIELD BOND FUND SEMI-ANNUAL REPORT (UNAUDITED) 7
Growth of $10,000
The graph below shows the value of a hypothetical $10,000 investment in the fund over the past 10 fiscal year periods or since inception (for funds without 10-year records). The results shown are for Classes A and I shares and reflect the deduction of Class A’s maximum front-end sales charge of 3.75%, and assume the reinvestment of dividends. The result is compared with benchmarks that include a broad based market index and a Lipper peer group average. Market indexes are unmanaged and their results do not reflect the effect of expenses or sales charges. The Lipper average reflects the deduction of the category’s average front-end sales charge. The value of an investment in a different share class would be different.
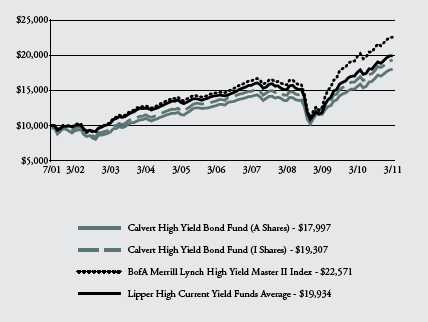
All performance data shown, including the graph above and the adjacent table, represents past performance, does not guarantee future results, assumes reinvestment of dividends and distributions and does not reflect the deduction of taxes that a shareholder would pay on the Fund’s/Portfolio’s distributions or the redemption of the Fund/Portfolio shares. The investment return and principal value of an investment will fluctuate so that an investor’s shares, when redeemed, may be worth more or less than their original cost. Current performance may be lower or higher than the performance data quoted; for current performance data visit www.calvert.com. The gross expense ratio from the current prospectus for Class A shares is 1.91%. This number may differ from the expense ratio shown elsewhere in this report because it is based on a different time period and, if applicable, does not include fee or expense waivers. Performance data quoted already reflects the deduction of the Fund’s/Portfolio’s operating expenses.
www.calvert.com CALVERT HIGH YIELD BOND FUND SEMI-ANNUAL REPORT (UNAUDITED) 8
Once again, events external to the United States created more uncertainty about the outlook for U.S. growth, inflation, and monetary policy. In addition to geopolitical tensions in the Middle East and natural disaster in Japan, deepening eurozone debt troubles have put Portugal on the brink of a bailout from the European Union/International Monetary Fund rescue facility. If the country does require a financial rescue package, Portugal would become the third eurozone member to receive a bailout. The rescue facility can accommodate Greece, Ireland, and Portugal but a debt crisis in Spain would disrupt financial markets worldwide. The Spanish government’s interest rates, while elevated, are not near crisis levels. Spain will remain under pressure, however, and has the potential to unnerve investors from time to time.
Despite increased uncertainty in recent months, we expect the Fed to conclude its Treasury purchases by the end of June. This would complete the easing cycle and, apart from some minor operations, move the Fed to the sidelines for the remainder of the year. There are monetary policy scenarios that could move bond yields quite sharply, including the small chance that the Fed will tighten faster than expected if core inflation increases rapidly. In addition, in light of the recent international turmoil, there also is a chance—perhaps small—that the Fed will ease yet again if the economy weakens later this year. In uncertain times, we expect market volatility to erupt from time to time.
April 2011
CALVERT HIGH YIELD BOND FUND
MARCH 31, 2011
AVERAGE ANNUAL TOTAL RETURNS
| Class A shares* | (with max. load) | |
| One year | 11.46 | % |
| Five year | 6.20 | % |
| Since inception (7/9/2001) | 6.23 | % |
| |
| Class I shares | | |
| One year | 16.61 | % |
| Five year | 7.45 | % |
| Since inception (7/9/2001) | 6.99 | % |
* Pursuant to an Agreement and Plan of Reorganization, Class A shares of Calvert High Yield Bond Fund, a series of Summit Mutual Funds, Inc. (“SMF Calvert High Yield Bond Fund”), were reorganized into the Class A shares of an identical and newly created series of The Calvert Fund, Calvert High Yield Bond Fund, which commenced operations on September 18, 2009. The performance results prior to September 18, 2009, for Class A shares reflect the performance of SMF Calvert High Yield Bond Fund. In addition, performance results for Class A shares prior to February 1, 2007, the inception date for Class A shares of SMF Calvert High Yield Bond Fund, reflect the performance of Class I shares of SMF Calvert High Yield Bond Fund, adjusted for the 12b-1 distribution fees applicable to Class A.
www.calvert.com CALVERT HIGH YIELD BOND FUND SEMI-ANNUAL REPORT (UNAUDITED) 9
1 Interest rate data sources: Chicago Board Options Exchange and Federal Reserve
2 According to Bureau of Economic Analysis data and forecasts from the Wall Street Journal Survey of Professional Forecasters
3 Latest data as of February 2011 from the Bureau of Labor Statistics
www.calvert.com CALVERT HIGH YIELD BOND FUND SEMI-ANNUAL REPORT (UNAUDITED) 10
SHAREHOLDER EXPENSE EXAMPLE
As a shareholder of the Fund, you incur two types of costs: (1) transaction costs, including sales charges and redemption fees; and (2) ongoing costs, including management fees; distribution (12b-1) fees; and other Fund expenses. This Example is intended to help you understand your ongoing costs (in dollars) of investing in the Fund and to compare these costs with the ongoing costs of investing in other mutual funds.
This Example is based on an investment of $1,000 invested at the beginning of the period and held for the entire period (October 1, 2010 to March 31, 2011).
Actual Expenses
The first line of the table below provides information about actual account values and actual expenses. You may use the information in this line, together with the amount you invested, to estimate the expenses that you paid over the period. Simply divide your account value by $1,000 (for example, an $8,600 account value divided by $1,000 = 8.6), then multiply the result by the number in the first line under the heading entitled “Expenses Paid During Period” to estimate the expenses you paid on your account during this period.
Hypothetical Example for Comparison Purposes
The second line of the table below provides information about hypothetical account values and hypothetical expenses based on the Fund’s actual expense ratio and an assumed rate of return of 5% per year before expenses, which is not the Fund’s actual return. The hypothetical account values and expenses may not be used to estimate the actual ending account balance or expenses you paid for the period. You may use this information to compare the ongoing costs of investing in the Fund and other funds. To do so, compare the 5% hypothetical example with the 5% hypothetical examples that appear in the shareholder reports of the other funds.
Please note that the expenses shown in the table are meant to highlight your ongoing costs only and do not reflect any transactional costs, such as sales charges (loads) or redemption fees. Therefore, the second line of the table is useful in comparing ongoing costs only, and will not help you determine the relative total costs of owning different funds. In addition, if these transactional costs were included, your costs would have been higher.
www.calvert.com CALVERT HIGH YIELD BOND FUND SEMI-ANNUAL REPORT (UNAUDITED) 11
| | | | | | |
| | | BEGINNING | | ENDING ACCOUNT | | EXPENSES PAID |
| | | ACCOUNT VALUE | | VALUE | | DURING PERIOD* |
| | | 10/1/10 | | 3/31/11 | | 10/1/10 - 3/31/11 |
| class A | | | | | | |
| Actual | $ | 1,000.00 | $ | 1,078.80 | $ | 8.37 |
| Hypothetical | $ | 1,000.00 | $ | 1,016.88 | $ | 8.12 |
| (5% return per year before expenses) |
|
| |
| class I | | | | | | |
| Actual | $ | 1,000.00 | $ | 1,082.40 | $ | 5.00 |
| Hypothetical | $ | 1,000.00 | $ | 1,020.13 | $ | 4.85 |
| (5% return per year before expenses) |
|
* Expenses are equal to the Fund’s annualized expense ratio of 1.61% and 0.96% for Class A and Class I respectively, multiplied by the average account value over the period, multiplied by 182/365 (to reflect the one-half year period).
www.calvert.com CALVERT HIGH YIELD BOND FUND SEMI-ANNUAL REPORT (UNAUDITED) 12
| | | | |
| SCHEDULE OF INVESTMENTS |
| MARCH 31, 2011 |
| |
| |
| | | PRINCIPAL | | |
| CORPORATE BONDS - 94.8% | | AMOUNT | | VALUE |
| Accellent, Inc., 8.375%, 2/1/17 | $ | 250,000 | $ | 268,125 |
| Acquisition Co. Lanza Parent, 10.00%, 6/1/17 (e) | | 750,000 | | 828,750 |
| AES Corp., 9.75%, 4/15/16 | | 500,000 | | 573,750 |
| Alere, Inc., 7.875%, 2/1/16 (b) | | 250,000 | | 261,250 |
| Ally Financial, Inc., 4.50%, 2/11/14 | | 850,000 | | 847,875 |
| Altra Holdings, Inc., 8.125%, 12/1/16 | | 250,000 | | 268,125 |
| American Axle & Manufacturing Holdings, Inc., | | | | |
| 9.25%, 1/15/17 (e) | | 200,000 | | 221,500 |
| APL Ltd., 8.00%, 1/15/24 (b) | | 500,000 | | 449,280 |
| Apria Healthcare Group, Inc., 12.375%, 11/1/14 | | 500,000 | | 546,250 |
| Associated Materials LLC, 9.125%, 11/1/17 (e) | | 250,000 | | 265,625 |
| Avis Budget Car Rental LLC/Avis Budget Finance, Inc., | | | | |
| 9.625%, 3/15/18 | | 250,000 | | 276,250 |
| Bausch & Lomb, Inc., 9.875%, 11/1/15 | | 250,000 | | 268,750 |
| BE Aerospace, Inc., 6.875%, 10/1/20 | | 500,000 | | 516,875 |
| Beverages & More, Inc., 9.625%, 10/1/14 (e) | | 500,000 | | 525,000 |
| Boise Paper Holdings LLC/Boise Finance Co., 9.00%, 11/1/17 | | 250,000 | | 277,500 |
| Buccaneer Merger Sub, Inc., 9.125%, 1/15/19 (e) | | 250,000 | | 265,625 |
| Burger King Corp., 9.875%, 10/15/18 | | 500,000 | | 526,250 |
| C8 Capital SPV Ltd., 6.64% to 12/31/14, floating rate | | | | |
| thereafter to 12/29/49 (b)(e)(r) | | 250,000 | | 193,375 |
| Cablevision Systems Corp.: | | | | |
| 8.625%, 9/15/17 | | 250,000 | | 276,875 |
| 8.00%, 4/15/20 | | 250,000 | | 272,500 |
| Calpine Corp. Escrow (b)* | | 500,000 | | - |
| Cantor Fitzgerald LP, 7.875%, 10/15/19 (e) | | 250,000 | | 255,951 |
| CapitalSource, Inc., 12.75%, 7/15/14 (e) | | 250,000 | | 298,750 |
| Case New Holland, Inc., 7.75%, 9/1/13 | | 500,000 | | 544,375 |
| Cemex Finance LLC, 9.50%, 12/14/16 (e) | | 250,000 | | 269,199 |
| Cemex SAB de CV, 5.301%, 9/30/15 (e)(r) | | 250,000 | | 247,999 |
| Central Garden and Pet Co., 8.25%, 3/1/18 | | 250,000 | | 261,250 |
| Cincinnati Bell, Inc., 8.375%, 10/15/20 | | 250,000 | | 245,625 |
| CIT Group, Inc.: | | | | |
| 5.25%, 4/1/14 (e) | | 500,000 | | 502,722 |
| 7.00%, 5/1/14 | | 750,000 | | 765,000 |
| CKE Restaurants, Inc., 11.375%, 7/15/18 | | 250,000 | | 275,625 |
| Commercial Barge Line Co., 12.50%, 7/15/17 | | 250,000 | | 290,000 |
| Constellation Brands, Inc., 7.25%, 9/1/16 | | 500,000 | | 541,875 |
| Cott Beverages, Inc., 8.375%, 11/15/17 | | 500,000 | | 540,000 |
| CPM Holdings, Inc., 10.625%, 9/1/14 (e) | | 250,000 | | 270,000 |
| Delta Air Lines Pass Through Trust, 6.75%, 5/23/17 | | 250,000 | | 241,875 |
| Developers Diversified Realty Corp., 4.75%, 4/15/18 | | 250,000 | | 243,750 |
| Digicel Group Ltd., 10.50%, 4/15/18 (e) | | 250,000 | | 285,937 |
| Digicel Ltd., 8.25%, 9/1/17 (e) | | 250,000 | | 265,000 |
| Discover Bank, 7.00%, 4/15/20 | | 250,000 | | 275,246 |
| Drummond Co., Inc., 9.00%, 10/15/14 (e) | | 250,000 | | 265,000 |
| DuPont Fabros Technology LP, 8.50%, 12/15/17 | | 250,000 | | 275,313 |
| Dynegy Holdings, Inc., 8.375%, 5/1/16 | | 500,000 | | 417,500 |
www.calvert.com CALVERT HIGH YIELD BOND FUND SEMI-ANNUAL REPORT (UNAUDITED) 13
| | | | |
| | | PRINCIPAL | | |
| CORPORATE BONDS - CONT’D | | AMOUNT | | VALUE |
| E*Trade Financial Corp., 7.375%, 9/15/13 | $ | 500,000 | $ | 503,750 |
| Edison Mission Energy, 7.50%, 6/15/13 | | 250,000 | | 248,125 |
| Empire Today LLC / Empire Today Finance Corp., | | | | |
| 11.375%, 2/1/17 (e) | | 250,000 | | 264,375 |
| Enterprise Products Operating LLC, 7.034% to 1/15/18, | | | | |
| floating rate thereafter to 1/15/68 (r) | | 250,000 | | 259,375 |
| Ferrellgas LP/Ferrellgas Finance Corp., 9.125%, 10/1/17 | | 500,000 | | 557,500 |
| First Data Corp., 9.875%, 9/24/15 | | 550,000 | | 566,500 |
| Ford Motor Credit Co. LLC: | | | | |
| 5.56%, 6/15/11 (r) | | 250,000 | | 250,625 |
| 7.25%, 10/25/11 | | 250,000 | | 256,250 |
| 7.80%, 6/1/12 | | 250,000 | | 265,000 |
| 7.50%, 8/1/12 | | 250,000 | | 266,250 |
| 8.70%, 10/1/14 | | 250,000 | | 282,500 |
| Freescale Semiconductor, Inc., 10.125%, 3/15/18 (e) | | 250,000 | | 279,375 |
| Frontier Communications Corp.: | | | | |
| 7.875%, 4/15/15 | | 250,000 | | 268,750 |
| 8.25%, 4/15/17 | | 250,000 | | 268,750 |
| Giant Funding Corp., 8.25%, 2/1/18 (e) | | 500,000 | | 512,500 |
| Gibson Energy ULC, 10.00%, 1/15/18 | | 500,000 | | 525,000 |
| Global Aviation Holdings, Inc., 14.00%, 8/15/13 | | 500,000 | | 586,250 |
| Goodyear Tire & Rubber Co., 10.50%, 5/15/16 | | 500,000 | | 560,625 |
| Griffon Corp., 7.125%, 4/1/18 (e) | | 250,000 | | 255,000 |
| Hanesbrands, Inc., 8.00%, 12/15/16 | | 250,000 | | 269,375 |
| Harland Clarke Holdings Corp., 9.50%, 5/15/15 | | 250,000 | | 246,875 |
| HCA, Inc.: | | | | |
| 9.25%, 11/15/16 | | 500,000 | | 537,500 |
| 9.625%, 11/15/16 | | 125,000 | | 134,688 |
| Hertz Corp.: | | | | |
| 8.875%, 1/1/14 | | 92,000 | | 94,070 |
| 6.75%, 4/15/19 (e) | | 500,000 | | 495,000 |
| HOA Restaurant Group LLC / HOA Finance Corp., | | | | |
| 11.25%, 4/1/17 (e) | | 500,000 | | 508,750 |
| Huntington BancShares, Inc., 7.00%, 12/15/20 | | 250,000 | | 274,869 |
| Ineos Finance plc, 9.00%, 5/15/15 (e) | | 500,000 | | 547,500 |
| Ineos Group Holdings plc, 8.50%, 2/15/16 (e) | | 250,000 | | 253,125 |
| Ingles Markets, Inc., 8.875%, 5/15/17 | | 500,000 | | 536,875 |
| Integra Telecom Holdings, Inc., 10.75%, 4/15/16 (e) | | 250,000 | | 271,250 |
| Intelsat Jackson Holdings Ltd., 11.25%, 6/15/16 | | 450,000 | | 480,375 |
| Intelsat Jackson Holdings SA, 7.25%, 4/1/19 (e) | | 250,000 | | 250,625 |
| Interactive Data Corp., 10.25%, 8/1/18 (e) | | 500,000 | | 561,250 |
| International Lease Finance Corp.: | | | | |
| 5.875%, 5/1/13 | | 250,000 | | 255,000 |
| 7.125%, 9/1/18 (e) | | 250,000 | | 268,125 |
| Jarden Corp., 7.50%, 5/1/17 | | 500,000 | | 532,500 |
| JET Equipment Trust, 7.63%, 8/15/12 (b)(e)(w)* | | 109,297 | | 601 |
| Jones Group, Inc., 6.875%, 3/15/19 | | 500,000 | | 491,250 |
| Kennedy-Wilson, Inc., 8.75%, 4/1/19 (e) | | 500,000 | | 496,485 |
| Kinder Morgan Finance Co. LLC, 6.00%, 1/15/18 (e) | | 500,000 | | 518,125 |
| Koppers, Inc., 7.875%, 12/1/19 | | 500,000 | | 542,500 |
| Lamar Media Corp., 9.75%, 4/1/14 | | 250,000 | | 288,750 |
| Land O’Lakes Capital Trust I, 7.45%, 3/15/28 (e) | | 754,000 | | 682,370 |
| Leucadia National Corp., 8.125%, 9/15/15 | | 250,000 | | 276,115 |
www.calvert.com CALVERT HIGH YIELD BOND FUND SEMI-ANNUAL REPORT (UNAUDITED) 14
| | | | |
| | | PRINCIPAL | | |
| CORPORATE BONDS - CONT’D | | AMOUNT | | VALUE |
| Level 3 Communications, Inc., 11.875%, 2/1/19 (e) | $ | 500,000 | $ | 470,000 |
| Level 3 Financing, Inc., 9.25%, 11/1/14 | | 250,000 | | 255,625 |
| Ltd Brands, Inc.: | | | | |
| 6.90%, 7/15/17 | | 250,000 | | 268,125 |
| 6.625%, 4/1/21 | | 250,000 | | 255,000 |
| MBNA Capital, 1.104%, 2/1/27 (r) | | 250,000 | | 192,407 |
| MetroPCS Wireless, Inc., 7.875%, 9/1/18 | | 250,000 | | 267,500 |
| MGM Resorts International, 6.75%, 9/1/12 | | 500,000 | | 508,750 |
| Mylan, Inc., 7.625%, 7/15/17 (e) | | 250,000 | | 268,750 |
| NFR Energy LLC, 9.75%, 2/15/17 (e) | | 500,000 | | 495,000 |
| NII Capital Corp., 8.875%, 12/15/19 | | 500,000 | | 553,750 |
| Novelis, Inc., 8.375%, 12/15/17 (e) | | 500,000 | | 542,500 |
| NRG Energy, Inc., 7.375%, 2/1/16 | | 500,000 | | 518,125 |
| Offshore Group Investments Ltd., 11.50%, 8/1/15 | | 500,000 | | 554,754 |
| OPTI Canada, Inc., 8.25%, 12/15/14 | | 750,000 | | 399,375 |
| OSI Restaurant Partners LLC, 10.00%, 6/15/15 | | 500,000 | | 520,000 |
| Overseas Shipholding Group, Inc., 8.125%, 3/30/18 | | 500,000 | | 491,250 |
| Packaging Dynamics Corp., 8.75%, 2/1/16 (e) | | 650,000 | | 664,625 |
| Penske Automotive Group, Inc., 7.75%, 12/15/16 | | 125,000 | | 129,063 |
| Petco Animal Supplies, Inc., 9.25%, 12/1/18 (e) | | 500,000 | | 535,000 |
| PharmaNet Development Group, Inc., 10.875%, 4/15/17 (e) | | 300,000 | | 330,000 |
| Pilgrim’s Pride Corp., 7.875%, 12/15/18 (e) | | 500,000 | | 481,250 |
| Pioneer Natural Resources Co., 5.875%, 7/15/16 | | 250,000 | | 262,500 |
| Potlatch Corp., 7.50%, 11/1/19 | | 300,000 | | 317,625 |
| RailAmerica, Inc., 9.25%, 7/1/17 | | 400,000 | | 443,000 |
| Reliance Intermediate Holdings LP, 9.50%, 12/15/19 (e) | | 250,000 | | 272,439 |
| Reynolds Group Issuer Inc / Reynolds Group Issuer LLC: | | | | |
| 7.125%, 4/15/19 (e) | | 500,000 | | 508,750 |
| 9.00%, 4/15/19 (e) | | 250,000 | | 258,125 |
| Rock-Tenn Co., 9.25%, 3/15/16 | | 250,000 | | 275,000 |
| SandRidge Energy, Inc., 8.75%, 1/15/20 | | 350,000 | | 381,500 |
| Scientific Games International, Inc.: | | | | |
| 7.875%, 6/15/16 (e) | | 250,000 | | 261,875 |
| 9.25%, 6/15/19 | | 250,000 | | 275,625 |
| Sealy Mattress Co., 10.875%, 4/15/16 (e) | | 225,000 | | 255,656 |
| Simmons Foods, Inc., 10.50%, 11/1/17 (e) | | 500,000 | | 542,500 |
| Smithfield Foods, Inc., 10.00%, 7/15/14 | | 250,000 | | 295,625 |
| Southern States Cooperative, Inc., 11.25%, 5/15/15 (e) | | 500,000 | | 546,250 |
| Sprint Nextel Corp., 6.00%, 12/1/16 | | 500,000 | | 500,000 |
| Standard Pacific Corp., 10.75%, 9/15/16 | | 250,000 | | 291,250 |
| STATS ChipPAC Ltd., 7.50%, 8/12/15 (e) | | 500,000 | | 545,000 |
| Steel Dynamics, Inc., 7.625%, 3/15/20 | | 500,000 | | 540,000 |
| SunGard Data Systems, Inc., 10.25%, 8/15/15 | | 250,000 | | 262,500 |
| Telcordia Technologies, Inc., 11.00%, 5/1/18 (e) | | 500,000 | | 555,000 |
| Triumph Group, Inc., 8.625%, 7/15/18 | | 250,000 | | 275,625 |
| TRW Automotive, Inc.: | | | | |
| 7.25%, 3/15/17 (e) | | 250,000 | | 271,875 |
| 8.875%, 12/1/17 (e) | | 250,000 | | 280,000 |
| Uncle Acquisition 2010 Corp., 8.625%, 2/15/19 (e) | | 250,000 | | 265,625 |
| United Rentals North America, Inc.: | | | | |
| 10.875%, 6/15/16 | | 250,000 | | 288,750 |
| 9.25%, 12/15/19 | | 250,000 | | 278,750 |
www.calvert.com CALVERT HIGH YIELD BOND FUND SEMI-ANNUAL REPORT (UNAUDITED) 15
| | | | |
| | | PRINCIPAL | | |
| CORPORATE BONDS - CONT’D | | AMOUNT | | VALUE |
| Valeant Pharmaceuticals International, 6.50%, 7/15/16 (e) | $ | 500,000 | $ | 494,375 |
| Videotron Ltd., 9.125%, 4/15/18 | | 500,000 | | 561,250 |
| Virgin Media Finance plc, 9.50%, 8/15/16 | | 250,000 | | 283,750 |
| Visant Corp., 10.00%, 10/1/17 | | 500,000 | | 540,000 |
| West Corp., 7.875%, 1/15/19 (e) | | 500,000 | | 510,000 |
| Western Express, Inc., 12.50%, 4/15/15 (e) | | 750,000 | | 729,375 |
| Windsor Petroleum Transport Corp., 7.84%, 1/15/21 (e) | | 717,707 | | 649,977 |
| Windstream Corp.: | | | | |
| 7.875%, 11/1/17 | | 250,000 | | 268,125 |
| 7.75%, 10/15/20 (e) | | 250,000 | | 255,625 |
| |
| Total Corporate Bonds (Cost $51,245,811) | | | | 54,542,141 |
| |
| |
| FLOATING RATE LOANS(d) - 0.8% | | | | |
| Clear Channel Communications, Inc., Term Loan B, | | | | |
| 3.912%, 1/29/16 (r) | | 250,000 | | 219,827 |
| CommScope, Inc., Term Loan B: | | | | |
| 5.00%, 1/14/18 (r) | | 25,000 | | 25,156 |
| 5.00%, 1/14/18 (r) | | 225,000 | | 226,406 |
| |
| Total Floating Rate Loans (Cost $480,339) | | | | 471,389 |
| |
| |
| U.S. GOVERNMENT AGENCIES | | | | |
| AND INSTRUMENTALITIES - 0.7% | | | | |
| AgFirst FCB, 6.585% to 6/15/12, floating rate | | | | |
| thereafter to 6/29/49 (e)(r) | | 500,000 | | 400,000 |
| |
| Total U.S. Government Agencies and | | | | |
| Instrumentalities (Cost $196,403) | | | | 400,000 |
| |
| EQUITY SECURITIES - 0.0% | | SHARES | | |
| Avado Brands, Inc. (b)* | | 9,462 | | 95 |
| Intermet Corp. (b)* | | 6,346 | | 63 |
| Paging Network Do Brazil Holding Co. LLC, Class B (b)(e)* | | 1,000 | | - |
| |
| Total Equity Securities (Cost $282,378) | | | | 158 |
| |
| |
| |
| TOTAL INVESTMENTS (Cost $52,204,931) - 96.3% | | | | 55,413,688 |
| Other assets and liabilities, net - 3.7% | | | | 2,107,063 |
| NET ASSETS - 100% | | | $ | 57,520,751 |
www.calvert.com CALVERT HIGH YIELD BOND FUND SEMI-ANNUAL REPORT (UNAUDITED) 16
| (b) | This security was valued by the Board of Trustees. See Note A. |
| (d) | Remaining maturities of floating rate loans may be less than the stated maturities shown as a result of contrac- tual or optional prepayments by the borrower. Such prepayments cannot be predicted with certainty. Floating rate loans generally pay interest at rates which are periodically re-determined at a margin above the London InterBank Offered Rate (LIBOR) or other short-term rates. The rate shown is the rate in effect at period end. |
| | Floating rate loans are generally considered restrictive in that the Fund is ordinarily contractually obligated to receive consent from the Agent Bank and/or Borrower prior to disposition of a floating rate loan. |
| (e) | Security is exempt from registration under Rule 144A of the Securities Act of 1933. These securities may be resold in transactions exempt from registration, normally to qualified institutional buyers. |
| (r) | The coupon rate shown on floating or adjustable rate securities represents the rate at period end. |
| (w) | Security is in default and is no longer accruing interest. |
| * | Non-income producing security. |
Abbreviations:
FCB: Farm Credit Bank
LLC: Limited Liability Corporation
LP: Limited Partnership
ULC: Unlimited Liability Corporation
See notes to financial statements.
www.calvert.com CALVERT HIGH YIELD BOND FUND SEMI-ANNUAL REPORT (UNAUDITED) 17
STATEMENT OF ASSETS AND LIABILITIES
MARCH 31, 2011
| | | |
| ASSETS | | | |
| Investments in securities, at value (Cost $52,204,931, respectively) - | | | |
| see accompanying schedule | $ | 55,413,688 | |
| Cash | | 7,976,622 | |
| Receivable for securities sold | | 2,757,187 | |
| Receivable for shares sold | | 186,184 | |
| Interest and dividends receivable | | 1,209,440 | |
| Other assets | | 11,983 | |
| Total assets | | 67,555,104 | |
| |
| |
| LIABILITIES | | | |
| Payable for securities purchased | | 6,499,529 | |
| Payable for shares purchased | | 3,466,932 | |
| Payable to Calvert Asset Management Company, Inc | | 41,090 | |
| Payable to Calvert Administrative Services Company | | 4,686 | |
| Payable to Calvert Shareholder Services, Inc. | | 883 | |
| Payable to Calvert Distributors, Inc. | | 3,863 | |
| Accrued expenses and other liabilities | | 17,370 | |
| Total liabilities | | 10,034,353 | |
| |
| NET ASSETS | $ | 57,520,751 | |
| |
| |
| NET ASSETS CONSIST OF: | | | |
| Paid-in capital applicable to the following shares of beneficial interest, | | | |
| unlimited number of no par value shares authorized: | | | |
| Class A: 695,615 shares outstanding | $ | 14,665,173 | |
| Class I: 1,330,916 shares outstanding | | 42,823,532 | |
| Undistributed net investment income (loss) | | (32,999 | ) |
| Accumulated net realized gain (loss) on investments | | (3,143,712 | ) |
| Net unrealized appreciation (depreciation) on investments | | 3,208,757 | |
| |
| NET ASSETS | $ | 57,520,751 | |
| |
| NET ASSET VALUE PER SHARE | | | |
| Class A (based on net assets of $19,890,413) | $ | 28.59 | |
| Class I (based on net assets of $37,630,338) | $ | 28.27 | |
See notes to financial statements.
www.calvert.com CALVERT HIGH YIELD BOND FUND SEMI-ANNUAL REPORT (UNAUDITED) 18
| | | |
| STATEMENT OF OPERATIONS |
| SIX MONTHS ENDED MARCH 31, 2011 |
| |
| |
| NET INVESTMENT INCOME | | | |
| Investment Income: | | | |
| Interest income | $ | 2,038,279 | |
| Total investment income | | 2,038,279 | |
| |
| Expenses: | | | |
| Investment advisory fee | | 163,941 | |
| Administrative fees | | 25,222 | |
| Transfer agency fees and expenses | | 27,169 | |
| Distribution Plan expenses: | | | |
| Class A | | 17,630 | |
| Trustees’ fees and expenses | | 1,050 | |
| Custodian fees | | 15,310 | |
| Registration fees | | 12,618 | |
| Reports to shareholders | | 6,469 | |
| Professional fees | | 10,599 | |
| Accounting fees | | 4,130 | |
| Miscellaneous | | 4,790 | |
| Total expenses | | 288,928 | |
| Fees paid indirectly | | (265 | ) |
| Net expenses | | 288,663 | |
| |
| |
| NET INVESTMENT INCOME | | 1,749,616 | |
| |
| REALIZED AND UNREALIZED GAIN (LOSS) ON INVESTMENTS | | | |
| Net realized gain (loss) | | 917,382 | |
| Change in unrealized appreciation (depreciation) | | 1,233,762 | |
| |
| |
| NET REALIZED AND UNREALIZED GAIN (LOSS) ON INVESTMENTS | | 2,151,144 | |
| |
| |
| INCREASE (DECREASE) IN NET ASSETS | | | |
| RESULTING FROM OPERATIONS | $ | 3,900,760 | |
See notes to financial statements.
www.calvert.com CALVERT HIGH YIELD BOND FUND SEMI-ANNUAL REPORT (UNAUDITED) 19
stateMents of changes in net assets
| | | | | | |
| | | SIX MONTHS ENDED | | | YEAR
ENDED | |
| | | MARCH
31, | | | SEPTEMBER 30, | |
| INCREASE (DECREASE) IN NET ASSETS | | 2011 | | | 2010 | |
| Operations: | | | | | | |
| Net investment income | $ | 1,749,616 | | $ | 3,007,731 | |
| Net realized gain (loss) | | 917,382 | | | 1,192,406 | |
| Change in unrealized appreciation (depreciation) | | 1,233,762 | | | 2,478,024 | |
| |
| INCREASE (DECREASE) IN NET ASSETS | | | | | | |
| RESULTING FROM OPERATIONS | | 3,900,760 | | | 6,678,161 | |
| |
| Distributions to shareholders from: | | | | | | |
| Net investment income: | | | | | | |
| Class A shares | | (466,808 | ) | | (483,889 | ) |
| Class I shares | | (1,323,746 | ) | | (2,425,117 | ) |
| Total distributions | | (1,790,554 | ) | | (2,909,006 | ) |
| |
| Capital share transactions: | | | | | | |
| Shares sold: | | | | | | |
| Class A shares | | 11,486,823 | | | 4,985,796 | |
| Class I shares | | 9,555,512 | | | 9,704,420 | |
| Reinvestment of distributions: | | | | | | |
| Class A shares | | 343,890 | | | 423,919 | |
| Class I shares | | 1,163,868 | | | 1,931,636 | |
| Redemption fees: | | | | | | |
| Class A shares | | 1,148 | | | 240 | |
| Shares redeemed: | | | | | | |
| Class A shares | | (1,935,777 | ) | | (3,874,415 | ) |
| Class I shares | | (11,049,708 | ) | | (12,971,539 | ) |
| Total capital share transactions | | 9,565,756 | | | 200,057 | |
| |
| TOTAL INCREASE (DECREASE) IN NET ASSETS | | 11,675,962 | | | 3,969,212 | |
| |
| NET ASSETS | | | | | | |
| Beginning of period | | 45,844,789 | | | 41,875,577 | |
| End of period (including distributions in excess of net investment | | | | | | |
| income of $32,999 and undistributed net investment | | | | | | |
| income of $7,939, respectively) | $ | 57,520,751 | | $ | 45,844,789 | |
| |
| CAPITAL SHARE ACTIVITY | | | | | | |
| |
| Shares sold: | | | | | | |
| Class A shares | | 407,441 | | | 190,092 | |
| Class I shares | | 339,804 | | | 372,219 | |
| Reinvestment of distributions: | | | | | | |
| Class A shares | | 12,204 | | | 16,180 | |
| Class I shares | | 41,821 | | | 74,543 | |
| Shares redeemed: | | | | | | |
| Class A shares | | (68,614 | ) | | (151,186 | ) |
| Class I shares | | (395,462 | ) | | (506,026 | ) |
| Total capital share activity | | 337,194 | | | (4,178 | ) |
See notes to financial statements.
www.calvert.com CALVERT HIGH YIELD BOND FUND SEMI-ANNUAL REPORT (UNAUDITED) 20
NOTES TO FINANCIAL STATEMENTS
NOTE A –– SIGNIFICANT ACCOUNTING POLICIES
General: The Calvert High Yield Bond Fund (the “Fund”), a series of The Calvert Fund, is registered under the Investment Company Act of 1940 as a non-diversified, open-end management investment company. The operations of each series are accounted for separately. Prior to September 18, 2009, the Fund was a series of Summit Mutual Funds, Inc. The Fund offers two classes of shares. Class A shares are sold with a maximum front-end sales charge of 3.75%. Class I shares require a minimum account balance of $1,000,000. The $1 million minimum initial investment may be waived for certain institutional accounts, where it is believed to be in the best interest of the Fund and its shareholders. Class I shares have no front-end or deferred sales charge and have lower levels of expenses than Class A shares. Each class has different: (a) dividend rates due to differences in Distribution Plan expenses and other class specific expenses, (b) exchange privileges and (c) class specific voting rights.
Security Valuation: Net asset value per share is determined every business day as of the close of the regular session of the New York Stock Exchange (generally 4:00 p.m. Eastern time). The Fund uses independent pricing services approved by the Board of Trustees to value its investments wherever possible. Investments for which market quotations are not available or deemed not reliable are fair valued in good faith under the direction of the Board of Trustees. In determining fair value, the Board considers all relevant qualitative and quantitative information available. These factors are subject to change over time and are reviewed periodically. The values assigned to fair value investments are based on available information and do not necessarily represent amounts that might ultimately be realized. Further, because of the inherent uncertainty of valuation, those estimated values may differ significantly from the values that would have been used had a ready market for the investments existed, and the differences could be material.
At March 31, 2011, securities valued at $904,664 or 1.6% of net assets were fair valued in good faith under the direction of the Board of Trustees.
The Fund utilizes various methods to measure the fair value of its investments. Generally Accepted Accounting Principles (GAAP) establishes a disclosure hierarchy that categorizes the inputs to valuation techniques used to value assets and liabilities at measurement date. These inputs are summarized in the three broad levels listed below: Level 1 – quoted prices in active markets for identical securities Level 2 – other significant observable inputs (including quoted prices for similar securities, interest rates, prepayment speeds, credit risk, etc.) Level 3 – significant unobservable inputs (including the Fund’s own assumptions in determining the fair value of investments) The inputs or methodology used for valuing securities are not necessarily an indication of the risk associated with investing in those securities.
www.calvert.com CALVERT HIGH YIELD BOND FUND SEMI-ANNUAL REPORT (UNAUDITED) 21
Changes in valuation techniques may result in transfers in or out of an investment’s assigned level within the hierarchy during the period. Valuation techniques used to value the Fund’s investments by major category are as follows.
Debt securities, including restricted securities, are valued based on evaluated prices received from independent pricing services or from dealers who make markets in such securities. For corporate bonds, floating rate loans, and U.S. government and government agency obligations, pricing services utilize matrix pricing which considers yield or price of bonds of comparable quality, coupon, maturity and type as well as dealer supplied prices and are generally categorized as Level 2 in the hierarchy. Short-term securities with remaining maturities of sixty days or less for which quotations are not readily available are valued at amortized cost, which approximates fair value, and are categorized as Level 2 in the hierarchy.
When independent prices are unavailable or unreliable, debt securities may be valued utilizing pricing matrices which consider similar factors that would be used by independent pricing services. These are generally categorized as Level 2 in the hierarchy but may be Level 3 depending on the circumstances.
Equity securities, including restricted securities, for which market quotations are readily available, are valued at the last reported sale price or official closing price as reported by an independent pricing service on the primary market or exchange on which they are traded and are categorized as Level 1 in the hierarchy. Foreign securities are valued based on quotations from the principle market in which such securities are normally traded. If events occur after the close of the principle market in which foreign securities are traded, and before the close of business of the Fund, that are expected to materially affect the value of those securities, then they are valued at their fair value taking these events into account. For restricted securities and private placements where observable inputs are limited, assumptions about market activity and risk are used and are categorized as Level 3 in the hierarchy.
The following is a summary of the inputs used to value the Fund’s net assets as of March 31, 2011:
| | | | | | | | |
| | VALUATION INPUTS |
| |
| INVESTMENTS IN SECURITIES | level 1 | | level 2 | | level 3 | | | total |
| Equity securities | - | | - | $ | 158 | | $ | 158 |
| Corporate debt | - | $ | 54,092,260 | | 449,881 | | | 54,542,141 |
| Other debt obligations | - | | 471,389 | | - | | | 471,389 |
| U.S. government obligations | - | | 400,000 | | - | | | 400,000 |
| TOTAL | - | $ | 54,963,649 | $ | 450,039 | * | $ | 55,413,688 |
*Level 3 securities represent 0.8% of net assets.www.calvert.com CALVERT HIGH YIELD BOND FUND SEMI-ANNUAL REPORT (UNAUDITED) 22
Repurchase Agreements: The Fund may enter into repurchase agreements with recognized financial institutions or registered broker/dealers and, in all instances, holds underlying securities with a value exceeding the total repurchase price, including accrued interest. Although risk is mitigated by the collateral, the Fund could experience a delay in recovering its value and a possible loss of income or value if the counterparty fails to perform in accordance with the terms of the agreement.
Loan Participations and Assignments: The Fund may invest in direct debt instruments which are interests in amounts owed to lenders or lending syndicates by corporate, governmental, or other borrowers. A Fund’s investments in loans may be in the form of participations in loans or assignments of all or a portion of loans from third parties. A loan is often administered by a bank or other financial institution (the “lender”) that acts as agent for all holders. The agent administers the terms of the loan, as specified in the loan agreement. A Fund may invest in multiple series or tranches of a loan, which may have varying terms and carry different associated risks. A Fund generally has no right to enforce compliance with the terms of the loan agreement with the borrower. As a result, a Fund may be subject to the credit risk of both the borrower and the lender that is selling the loan agreement. When a Fund purchases assignments from lenders it acquires direct rights against the borrower of the loan. When investing in a loan participation, a Fund has the right to receive payments of principal, interest and any fees to which it is entitled only from the lender selling the loan agreement and only upon receipt of payments by the lender from the borrower.
Security Transactions and Net Investment Income: Security transactions are accounted for on trade date. Realized gains and losses are recorded on an identified cost basis and may include proceeds from litigation. Dividend income is recorded on the ex-dividend date or, in the case of dividends on certain foreign securities, as soon as the Fund is informed of the ex-dividend date. Distributions received on securities that represent a return of capital or capital gain are recorded as a reduction of cost of investments and/or as a realized gain. Interest income, which includes amortization of premium and accretion of discount on debt securities, is accrued as earned. Investment income and realized and unrealized gains and losses are allocated to separate classes of shares based upon the relative net assets of each class. Debt obligations may be placed on non-accrual status and related interest income may be reduced by ceasing current accruals and writing off interest receivables when the collection of all or a portion of interest has become doubtful based on consistently applied procedures. (See the Schedule of Investments footnotes on page 17.) A debt obligation may be removed from non-accrual status when the issuer resumes interest payments or when collectibility of interest is reasonably assured. Expenses arising in connection with a class are charged directly to that class. Expenses common to the classes are allocated to each class in proportion to their relative net assets. Withholding taxes on foreign dividends have been provided for in accordance with the Fund’s understanding of the applicable country’s tax rules and rates. The Fund earns certain fees in connection with its floating rate loan purchasing activities. These fees are in addition to interest payments earned and may include amendment fees, consent fees and prepayment fees. These fees are recorded as income in the accompanying financial statements.
www.calvert.com CALVERT HIGH YIELD BOND FUND SEMI-ANNUAL REPORT (UNAUDITED) 23
Foreign Currency Transactions: The Fund’s accounting records are maintained in U.S. dollars. For valuation of assets and liabilities on each date of net asset value determination, foreign denominations are translated into U.S. dollars using the current exchange rate. Security transactions, income and expenses are translated at the prevailing rate of exchange on the date of the event. The effect of changes in foreign exchange rates on securities and foreign currencies is included in the net realized and unrealized gain or loss on securities and foreign currencies.
Distributions to Shareholders: Distributions to shareholders are recorded by the Fund on ex-dividend date. Dividends from net investment income are paid monthly. Distributions from net realized capital gains, if any, are paid at least annually. Distributions are determined in accordance with income tax regulations which may differ from generally accepted accounting principles; accordingly, periodic reclassifications are made within the Fund’s capital accounts to reflect income and gains available for distribution under income tax regulations.
Estimates: The preparation of the financial statements in conformity with accounting principles generally accepted in the United States requires management to make estimates and assumptions that affect the reported amounts of assets and liabilities and disclosure of contingent assets and liabilities at the date of the financial statements and the reported amounts of income and expenses during the reported period. Actual results could differ from those estimates.
Redemption Fees: The Fund charges a 2% redemption fee on redemptions, including exchanges, made within 30 days of purchase in the same Fund (within seven days for Class I shares). The redemption fee is paid to the Class of the Fund from which the redemption is made, and is accounted for as an addition to paid-in capital. The fee is intended to discourage market-timers by ensuring that short-term trading costs are borne by the investors making the transactions and not the shareholders already in the Fund.
Expense Offset Arrangements: The Fund has an arrangement with its custodian bank whereby the custodian’s fees may be paid indirectly by credits earned on the Fund’s cash on deposit with the bank. These credits are used to reduce the Fund’s expenses. Such a deposit arrangement may be an alternative to overnight investments.
Federal Income Taxes: No provision for federal income or excise tax is required since the Fund intends to continue to qualify as a regulated investment company under the Internal Revenue Code and to distribute substantially all of its taxable earnings.
Management has analyzed the Fund’s tax positions taken for all open federal income tax years and has concluded that no provision for federal income tax is required in the Fund’s financial statements. A Fund’s federal tax return is subject to examination by the Internal Revenue Service for a period of three years.
NOTE B — RELATED PARTY TRANSACTIONS
Calvert Asset Management Company, Inc. (the “Advisor”) is wholly-owned by Calvert Group, Ltd. (“Calvert”), which is indirectly wholly-owned by UNIFI Mutual Holding Company. The Advisor provides investment advisory services and pays the salaries and fees of officers and Trustees of the Fund who are employees of the Advisor or its affiliates. For its services, the
www.calvert.com CALVERT HIGH YIELD BOND FUND SEMI-ANNUAL REPORT (UNAUDITED) 24
Advisor receives an annual fee, payable monthly, of .65% of the Fund’s average daily net assets.
The Advisor has contractually agreed to limit net annual fund operating expenses through January 31, 2012. The contractual expense cap is 1.65% for Class A and 1.40% for Class I. For the purposes of this expense limit, operating expenses do not include interest expense, brokerage commissions, taxes, and extraordinary expenses. To the extent that any expense offset credits are earned, the Advisor’s obligation under the contractual limitation may be reduced and the Advisor may benefit from the expense offset arrangement.
Calvert Administrative Services Company, an affiliate of the Advisor, provides administrative services to the Fund for an annual fee, payable monthly, of .10% for Class A and Class I based on their average daily net assets.
Calvert Distributors, Inc. (“CDI”), an affiliate of the Advisor, is the distributor and principal underwriter for the Fund. Pursuant to Rule 12b-1 under the Investment Company Act of 1940, the Fund has adopted a Distribution Plan that permits the Fund to pay certain expenses associated with the distribution and servicing of its shares. The expenses paid may not exceed .25% annually of the average daily net assets of Class A. The amount actually paid by the Fund is an annualized fee, payable monthly, of .25% of the average daily net assets of Class A. Class I shares do not have Distribution Plan expenses.
CDI received $12,871 as its portion of the commissions charged on sales of the Fund’s Class A shares for the six months ended March 31, 2011.
Calvert Shareholder Services, Inc. (“CSSI”), an affiliate of the Advisor, is the shareholder servicing agent for the Fund. For its services, CSSI received a fee of $4,078 for the six months ended March 31, 2011. Boston Financial Data Services, Inc. is the transfer and dividend disbursing agent.
Each Trustee of the Fund who is not an employee of the Advisor or its affiliates receives an annual retainer of $45,000 plus up to $2,000 for each Board and Committee meeting attended. The Board chair and Committee chairs each receive an additional $5,000 annual retainer. Trustee’s fees are allocated to each of the funds served
NOTE C — INVESTMENT ACTIVITY
During the period, the cost of purchases and proceeds from sales of investments, other than short-term securities, were $83,918,562 and $74,822,490, respectively.
| CAPITAL LOSS CARRYFORWARDS | | | |
| EXPIRATION DATE | | | |
| 30-Sept-11 | ($ | 1,025,886 | ) |
| 30-Sept-12 | | (791,075 | ) |
| 30-Sept-15 | | (476,585 | ) |
| 30-Sept-17 | | (924,312 | ) |
| 30-Sept-18 | | (15,613 | ) |
www.calvert.com CALVERT HIGH YIELD BOND FUND SEMI-ANNUAL REPORT (UNAUDITED) 25
Capital losses may be utilized to offset future capital gains until expiration. Under the recently enacted Regulated Investment Company Modernization Act of 2010, the Funds will be permitted to carry forward capital losses incurred in taxable years beginning after December 22, 2010 for an unlimited period. Losses incurred during those future years will be required to be utilized prior to the losses incurred in pre-enactment taxable years. As a result of this ordering rule, pre-enactment capital loss carryforwards may more likely expire unused. Also, post-enactment capital losses that are carried forward will retain their character as either short-term or long-term capital losses rather than being considered all short-term as under previous law.
The Fund intends to elect to defer net capital losses of $816,267 incurred from November 1, 2009 through September 30, 2010 and treat them as arising in the fiscal year ending September 30, 2011.
As of March 31, 2011, the tax basis components of unrealized appreciation/(depreciation) and the federal tax cost were as follows:
| Unrealized appreciation | $ | 3,660,814 | |
| Unrealized (depreciation) | | (641,397 | ) |
| Net unrealized appreciation/(depreciation) | $ | 3,019,417 | |
| Federal income tax cost of investments | $ | 52,394,271 | |
NOTE D — LINE OF CREDITA financing agreement is in place with all Calvert Group Funds and State Street Corporation (“SSC”). Under the agreement, SSC provides an unsecured line of credit facility, in the aggregate amount of $50 million ($25 million committed and $25 million uncommitted), accessible by the Funds for temporary or emergency purposes only. Borrowings under the committed facility bear interest at the higher of London Interbank Offered Rate, (LIBOR) or the overnight Federal Funds Rate plus 1.25% per annum. A commitment fee of .125% per annum is incurred on the unused portion of the committed facility, which is allocated to all participating funds. The Fund had no loans outstanding pursuant to this line of credit at March 31, 2011. For the six months ended March 31, 2011, borrowings by the Fund under the Agreement were as follows:
| | WEIGHTED | | MONTH OF |
| AVERAGE | AVERAGE | MAXIMUM | MAXIMUM |
| DAILY | INTEREST | AMOUNT | AMOUNT |
| BALANCE | RATE | BORROWED | BORROWED |
| $30,525 | 1.51% | $1,387,703 | December 2010 |
www.calvert.com CALVERT HIGH YIELD BOND FUND SEMI-ANNUAL REPORT (UNAUDITED) 26
NOTE E – SUBSEQUENT EVENTS
In preparing the financial statements as of March 31, 2011, no subsequent events or transactions occurred that would have materially impacted the financial statements as presented.
Effective April 30, 2011, the Calvert operating companies will be renamed as follows: Calvert Group, Ltd. will be renamed Calvert Investments, Inc., Calvert Asset Management Company, Inc. will be renamed Calvert Investment Management, Inc., Calvert Distributors, Inc. will be renamed Calvert Investment Distributors, Inc., Calvert Administrative Services Company will be renamed Calvert Investment Administrative Services, Inc., and Calvert Shareholder Services, Inc. will be renamed Calvert Investment Services, Inc.
www.calvert.com CALVERT HIGH YIELD BOND FUND SEMI-ANNUAL REPORT (UNAUDITED) 27
| | | | | | | | | |
| FINANCIAL HIGHLIGHTS |
| |
| | | | | | Periods ended | | | | |
| | | MARCH
31, | | | SEPTEMBER 30, | | | SEPTEMBER 30, | |
| class A shares | | 2011 | | | 2010 | | | 2009 | (z) |
| Net asset value, beginning | $ | 27.36 | | $ | 24.92 | | $ | 24.03 | |
| Income from investment operations: | | | | | | | | | |
| Net investment income | | .87 | | | 1.80 | | | 1.54 | |
| Net realized and unrealized gain (loss) | | 1.25 | | | 2.39 | | | .95 | |
| Total from investment operations | | 2.12 | | | 4.19 | | | 2.49 | |
| Distributions from: | | | | | | | | | |
| Net investment income | | (.89 | ) | | (1.75 | ) | | (1.60 | ) |
| Total distributions | | (.89 | ) | | (1.75 | ) | | (1.60 | ) |
| Total increase (decrease) in net asset value | | 1.23 | | | 2.44 | | | .89 | |
| Net asset value, ending | $ | 28.59 | | $ | 27.36 | | $ | 24.92 | |
| |
| Total return* | | 7.84 | % | | 17.35 | % | | 11.68 | % |
| Ratios to average net assets:A | | | | | | | | | |
| Net investment income | | 6.44 | % (a) | | 6.98 | % | | 6.87 | % |
| Total expenses | | 1.62 | % (a) | | 1.91 | % | | 2.30 | % |
| Expenses before offsets | | 1.62 | % (a) | | 1.65 | % | | 1.65 | % |
| Net expenses | | 1.61 | % (a) | | 1.65 | % | | 1.65 | % |
| Portfolio turnover | | 158 | % | | 233 | % | | 156 | % |
| Net assets, ending (in thousands) | $ | 19,890 | | $ | 9,427 | | $ | 7,213 | |
| |
| | | | | | Periods ended | |
| | | | | | SEPTEMBER 30, | | | SEPTEMBER 30, | |
| class A shares | | | | | 2008 | (z) | | 2007 | ^ |
| Net asset value, beginning | | | | $ | 28.55 | | $ | 29.18 | |
| Income from investment operations: | | | | | | | | | |
| Net investment income | | | | | 1.77 | | | .96 | |
| Net realized and unrealized gain (loss) | | | | | (4.45 | ) | | (.63 | ) |
| Total from investment operations | | | | | (2.68 | ) | | .33 | |
| Distributions from: | | | | | | | | | |
| Net investment income | | | | | (1.84 | ) | | (.96 | ) |
| Total distributions | | | | | (1.84 | ) | | (.96 | ) |
| Total increase (decrease) in net asset value | | | | | (4.52 | ) | | (.63 | ) |
| Net asset value, ending | | | | $ | 24.03 | | $ | 28.55 | |
| |
| Total return* | | | | | (9.91 | %) | | 1.16 | % |
| Ratios to average net assets: A | | | | | | | | | |
| Net investment income | | | | | 6.65 | % | | 6.50 | % (a) |
| Total expenses | | | | | 1.49 | % | | 1.54 | % (a) |
| Expenses before offsets | | | | | 1.49 | % | | 1.54 | % (a) |
| Net expenses | | | | | 1.49 | % | | 1.54 | % (a) |
| Portfolio turnover | | | | | 67 | % | | 97 | % |
| Net assets, ending (in thousands) | | | | $ | 444 | | $ | 225 | |
See notes to financial highlights.
www.calvert.com CALVERT HIGH YIELD BOND FUND SEMI-ANNUAL REPORT (UNAUDITED) 28
| | | | | | | | | |
| FINANCIAL HIGHLIGHTS |
| |
| | | | | | Periods ended | | | | |
| | | MARCH
31, | | | SEPTEMBER 30, | | | SEPTEMBER 30, | |
| class I shares | | 2011 | | | 2010 | | | 2009 | (z) |
| Net asset value, beginning | $ | 27.08 | | $ | 24.69 | | $ | 23.94 | |
| Income from investment operations: | | | | | | | | | |
| Net investment income | | .98 | | | 1.99 | | | 1.63 | |
| Net realized and unrealized gain (loss) | | 1.21 | | | 2.33 | | | .90 | |
| Total from investment operations | | 2.19 | | | 4.32 | | | 2.53 | |
| Distributions from: | | | | | | | | | |
| Net investment income | | (1.00 | ) | | (1.93 | ) | | (1.78 | ) |
| Total distributions | | (1.00 | ) | | (1.93 | ) | | (1.78 | ) |
| Total increase (decrease) in net asset value | | 1.19 | | | 2.39 | | | .75 | |
| Net asset value, ending | $ | 28.27 | | $ | 27.08 | | $ | 24.69 | |
| Total return* | | 8.20 | % | | 18.14 | % | | 12.07 | % |
| Ratios to average net assets: A | | | | | | | | | |
| Net investment income | | 7.13 | % (a) | | 7.68 | % | | 7.70 | % |
| Total expenses | | .96 | % (a) | | .97 | % | | 1.22 | % |
| Expenses before offsets | | .96 | % (a) | | .97 | % | | 1.22 | % |
| Net expenses | | .96 | % (a) | | .97 | % | | 1.22 | % |
| Portfolio turnover | | 158 | % | | 233 | % | | 156 | % |
| Net assets, ending (in thousands) | $ | 37,630 | | $ | 36,418 | | $ | 34,663 | |
| |
| |
| | | | | | Years ended | | | | |
| | | SEPTEMBER 30, | | | SEPTEMBER 30, | | | SEPTEMBER 30, | |
| class I shares | | 2008 | (z) | | 2007 | | | 2006 | |
| Net asset value, beginning | $ | 28.43 | | $ | 28.75 | | $ | 28.69 | |
| Income from investment operations: | | | | | | | | | |
| Net investment income | | 1.85 | | | 1.81 | | | 1.94 | |
| Net realized and unrealized gain (loss) | | (4.44 | ) | | (.30 | ) | | .13 | |
| Total from investment operations | | (2.59 | ) | | 1.51 | | | 2.07 | |
| Distributions from: | | | | | | | | | |
| Net investment income | | (1.90 | ) | | (1.83 | ) | | (2.01 | ) |
| Total distributions | | (1.90 | ) | | (1.83 | ) | | (2.01 | ) |
| Total increase (decrease) in net asset value | | (4.49 | ) | | (.32 | ) | | .06 | |
| Net asset value, ending | $ | 23.94 | | $ | 28.43 | | $ | 28.75 | |
| |
| Total return* | | (9.63 | %) | | 5.40 | % | | 7.52 | % |
| Ratios to average net assets: A | | | | | | | | | |
| Net investment income | | 6.90 | % | | 6.68 | % | | 7.17 | % |
| Total expenses | | 1.24 | % | | 1.25 | % | | 1.17 | % |
| Expenses before offsets | | 1.24 | % | | 1.25 | % | | 1.17 | % |
| Net expenses | | 1.24 | % | | 1.25 | % | | 1.17 | % |
| Portfolio turnover | | 67 | % | | 97 | % | | 100 | % |
| Net assets, ending (in thousands) | $ | 19,919 | | $ | 24,300 | | $ | 19,942 | |
See notes to financial highlights.
www.calvert.com CALVERT HIGH YIELD BOND FUND SEMI-ANNUAL REPORT (UNAUDITED) 29
| A | Total expenses do not reflect amounts reimbursed and/or waived by the Advisor or reductions from expense offset arrangements. Expenses before offsets reflect expenses after reimbursement and/or waiver by the Advisor but prior to reductions from expense offset arrangements. Net expenses are net of all reductions and represent the net expenses paid by the Fund. |
| (a) | Annualized. |
| (z) | Per share figures are calculated using the Average Share Method. |
| * | Total return is not annualized for periods less than one year and does not reflect deduction of any front-end or deferred sales charge. |
| ^ | From February 1, 2007, inception. |
See notes to financial statements.
www.calvert.com CALVERT HIGH YIELD BOND FUND SEMI-ANNUAL REPORT (UNAUDITED) 30
EXPLANATION OF FINANCIAL TABLES
SCHEDULE OF INVESTMENTS
The Schedule of Investments is a snapshot of all securities held in the fund at their market value, on the last day of the reporting period. Securities are listed by asset type (e.g., common stock, corporate bonds, U.S. government obligations) and may be further broken down into sub-groups and by industry classification.
STATEMENT OF ASSETS AND LIABILITIES
The Statement of Assets and Liabilities is often referred to as the fund’s balance sheet. It lists the value of what the fund owns, is due and owes on the last day of the reporting period. The fund’s assets include the market value of securities owned, cash, receivables for securities sold and shareholder subscriptions, and receivables for dividends and interest payments that have been earned, but not yet received. The fund’s liabilities include payables for securities purchased and shareholder redemptions, and expenses owed but not yet paid. The statement also reports the fund’s net asset value (NAV) per share on the last day of the reporting period. The NAV is calculated by dividing the fund’s net assets (assets minus liabilities) by the number of shares outstanding. This statement is accompanied by a Schedule of Investments. Alternatively, if certain conditions are met, a Statement of Net Assets may be presented in lieu of this statement and the Schedule of Investments.
STATEMENT OF NET ASSETS
The Statement of Net Assets provides a detailed list of the fund’s holdings, including each security’s market value on the last day of the reporting period. The Statement of Net Assets includes a Schedule of Investments. Other assets are added and other liabilities subtracted from the investments total to calculate the fund’s net assets. Finally, net assets are divided by the outstanding shares of the fund to arrive at its share price, or Net Asset Value (NAV) per share.
At the end of the Statement of Net Assets is a table displaying the composition of the fund’s net assets. Paid in Capital is the money invested by shareholders and represents the bulk of net assets. Undistributed Net Investment Income and Accumulated Net Realized Gains usually approximate the amounts the fund had available to distribute to shareholders as of the statement date. Accumulated Realized Losses will appear as negative balances. Unrealized Appreciation (Depreciation) is the difference between the market value of the fund’s investments and their cost, and reflects the gains (losses) that would be realized if the fund were to sell all of its investments at their statement-date values.
STATEMENT OF OPERATIONS
The Statement of Operations summarizes the fund’s investment income earned and expenses incurred in operating the fund. Investment income includes dividends earned from stocks and interest earned from interest-bearing securities in the fund. Expenses incurred in operating the fund include the advisory fee paid to the investment advisor,
www.calvert.com CALVERT HIGH YIELD BOND FUND SEMI-ANNUAL REPORT (UNAUDITED) 31
administrative services fees, distribution plan expenses (if applicable), transfer agent fees, shareholder servicing expenses, custodial, legal, and audit fees, and the printing and postage expenses related to shareholder reports. Expense offsets (fees paid indirectly) are also shown. Credits earned from offset arrangements are used to reduce the fund’s expenses. This statement also shows net gains (losses) realized on the sale of investments and the increase or decrease in the unrealized appreciation (depreciation) on investments held during the period.
STATEMENT OF CHANGES IN NET ASSETS
The Statement of Changes in Net Assets shows how the fund’s total net assets changed during the two most recent reporting periods. Changes in the fund’s net assets are attributable to investment operations, distributions and capital share transactions.
The Operations section of the report summarizes information detailed in the Statement of Operations. The Distribution section shows the dividend and capital gain distributions made to shareholders. The amounts shown as distributions in this section may not match the net investment income and realized gains amounts shown in the Operations section because distributions are determined on a tax basis and certain investments or transactions may be treated differently for financial statement and tax purposes. The Capital Share Transactions section shows the amount shareholders invested in the fund, either by purchasing shares or by reinvesting distributions, and the amounts redeemed. The corresponding numbers of shares issued, reinvested and redeemed are shown at the end of the report.
FINANCIAL HIGHLIGHTS
The Financial Highlights table provides a per-share breakdown per class of the components that affect the fund’s net asset value for current and past reporting periods. The table provides total return, total distributions, expense ratios, portfolio turnover and net assets for the applicable period. Total return is a measure of a fund’s performance that encompasses all elements of return: dividends, capital gain distributions and changes in net asset value. Total return is the change in value of an investment over a given period, assuming reinvestment of any dividends and capital gain distributions, expressed as a percentage of the initial investment. Total distributions include distributions from net investment income and net realized gains. Long-term gains are earned on securities held in the fund more than one year. Short-term gains, on the sale of securities held less than one year, are treated as ordinary dividend income for tax purposes. The expense ratio is a fund’s cost of doing business, expressed as a percentage of net assets. These expenses directly reduce returns to shareholders. Portfolio turnover measures the trading activity in a fund’s investment portfolio – how often securities are bought and sold by a fund. Portfolio turnover is affected by market conditions, changes in the size of the fund, the nature of the fund’s investments and the investment style of the portfolio manager.
www.calvert.com CALVERT HIGH YIELD BOND FUND SEMI-ANNUAL REPORT (UNAUDITED) 32
PROXY VOTING
The Proxy Voting Guidelines of the Calvert Funds that the Fund uses to determine how to vote proxies relating to portfolio securities are provided as an Appendix to the Fund’s Statement of Additional Information. The Statement of Additional Information can be obtained free of charge by calling the Fund at 1-800-368-2745, by visiting the Calvert website at www.calvert.com; or by visiting the SEC’s website at www.sec.gov.
Information regarding how the Fund voted proxies relating to portfolio securities during the most recent 12-month period ended June 30 is available on the Fund’s website at www.calvert.com and on the SEC’s website at www.sec.gov.
AVAILABILITY OF QUARTERLY PORTFOLIO HOLDINGS
The Fund files its complete schedule of portfolio holdings with the SEC for the first and third quarters of each fiscal year on Form N-Q. The Fund’s Form N-Q is available on the SEC’s website at www.sec.gov. The Fund’s Form N-Q may be reviewed and copied at the SEC’s Public Reference Room in Washington, DC; information on the operation of the Public Reference Room may be obtained by calling 1-800-SEC-0330.
BASIS FOR BOARD’S APPROVAL OF INVESTMENT ADVISORY CONTRACT
At a meeting held on December 8, 2010, the Board of Trustees, and by a separate vote, the disinterested Trustees, approved the continuance of the Investment Advisory Agreement between The Calvert Fund and the Advisor with respect to the Fund.
In evaluating the Investment Advisory Agreement, the Board considered a variety of information relating to the Fund and the Advisor. The disinterested Trustees reviewed a report prepared by the Advisor regarding various services provided to the Fund by the Advisor and its affiliates. Such report included, among other data, information regarding the Advisor’s personnel and the Advisor’s revenue and cost of providing services to the Fund, and a separate report prepared by an independent third party, which provided a statistical analysis comparing the Fund’s investment performance, expenses, and fees to comparable mutual funds.
The disinterested Trustees were separately represented by independent legal counsel with respect to their consideration of the reapproval of the Investment Advisory Agreement. Prior to voting, the disinterested Trustees reviewed the proposed continuance of the Investment Advisory Agreement with management and also met in private sessions with their counsel at which no representatives of management were present.
In the course of its deliberations regarding the Investment Advisory Agreement, the Board considered the following factors, among others: the nature, extent and quality of the services provided by the Advisor, including the personnel providing such services;
www.calvert.com CALVERT HIGH YIELD BOND FUND SEMI-ANNUAL REPORT (UNAUDITED) 33
the Advisor’s financial condition; the level and method of computing the Fund’s advisory fee; comparative performance, fee and expense information for the Fund; the profitability of the Calvert Group of Funds to the Advisor and its affiliates; the direct and indirect benefits, if any, derived by the Advisor and its affiliates from their relationship with the Fund; the effect of the Fund’s growth and size on the Fund’s performance and expenses; the affiliated distributor’s process for monitoring sales load breakpoints; the Advisor’s compliance programs and policies; the Advisor’s performance of substantially similar duties for other funds; and any possible conflicts of interest.
In considering the nature, extent and quality of the services provided by the Advisor under the Investment Advisory Agreement, the Board reviewed information provided by the Advisor relating to its operations and personnel, including, among other information, biographical information on the Advisor’s investment, supervisory and professional staff and descriptions of its organizational and management structure. The Board also took into account similar information provided periodically throughout the previous year by the Advisor as well as the Board’s familiarity with management through Board of Trustees’ meetings, discussions and other reports. The Board considered the Advisor’s management style and its performance in employing its investment strategies as well as its current level of staffing and overall resources. The Advisor’s administrative capabilities, including its ability to supervise the other service providers for the Fund, were also considered. The Board concluded that it was satisfied with the nature, extent and quality of services provided to the Fund by the Advisor under the Investment Advisory Agreement.
In considering the Fund’s performance, the Board noted that it reviewed on a quarterly basis detailed information about the Fund’s performance results, portfolio composition and investment strategies. In addition, the Board took into account overall financial market conditions. The Board also reviewed various comparative data provided to it in connection with its consideration of the renewal of the Investment Advisory Agreement, including, among other information, a comparison of the Fund’s total return with its Lipper index and with that of other mutual funds deemed to be in its peer group by an independent third party in its report. This comparison indicated that the Fund performed below the median of its peer group for the one-year period ended June 30, 2010, and at the median of its peer group for the three-year period ended June 30, 2010. The data also indicated that the Fund underperformed its Lipper index for the one-year period ended June 30, 2010 and outperformed its Lipper index for the three-year period ended June 30, 2010. Based upon its review, the Board concluded that the Fund’s performance was satisfactory.
In considering the Fund’s fees and expenses, the Board compared the Fund’s fees and total expense ratio with various comparative data for the funds in its peer group. Among other findings, the data indicated that the Fund’s advisory fee (after taking into account waivers and/or reimbursements) was below the median of its peer group and that total expenses (net of waivers and/or reimbursements) were above the median of its peer group. The Board noted that the allocation of advisory and administrative fees may vary among the Fund’s peer group. The Board took into account the Advisor’s current undertaking to maintain expense limitations for the Fund’s shares. The Board
www.calvert.com CALVERT HIGH YIELD BOND FUND SEMI-ANNUAL REPORT (UNAUDITED) 34
also noted management’s discussion of the Fund’s expenses and certain factors that affected the level of such expenses. Based upon its review, the Board concluded that the advisory fee was reasonable in view of the quality of services provided by the Advisor.
The Board reviewed the Advisor’s profitability on a fund-by-fund basis. In reviewing the overall profitability of the advisory fee to the Fund’s Advisor, the Board also considered the fact that affiliates of the Advisor provided shareholder servicing and administrative services to the Fund for which they received compensation. The information considered by the Board included Calvert’s operating profit margin information both before and after tax expenses with respect to the services that the Advisor and its affiliates provided to the Calvert Group of Funds complex. The Board reviewed the profitability of the Advisor’s relationship with the Fund in terms of the total amount of annual advisory fees it received with respect to the Fund and whether the Advisor had the financial wherewithal to continue to provide a high level of services to the Fund. The Board noted that the Advisor had reimbursed expenses of the Fund for some classes. The Board also noted the Advisor’s current undertaking to maintain expense limitations for the Fund’s shares. The Trustees also considered that the Advisor derived benefits to its reputation and other indirect benefits from its relationship with the Fund. Based upon its review, the Board concluded that the Advisor’s and its affiliates’ level of profitability from their relationship with the Fund was reasonable.
The Board considered the effect of the Fund’s current size and its potential growth on its performance and expenses. The Board concluded that adding breakpoints to the advisory fee at specified asset levels would not be appropriate at this time given the Fund’s current size. The Board noted that if the Fund’s assets increased over time, the Fund might realize other economies of scale if assets increased proportionally more than certain other expenses.
In reapproving the Investment Advisory Agreement, the Board, including the disinterested Trustees, did not identify any single factor as controlling, and each Trustee may have attributed different weight to various factors.
CONCLUSIONS
The Board reached the following conclusions regarding the Investment Advisory Agreement, among others: (a) the Advisor has demonstrated that it possesses the capability and resources to perform the duties required of it under the Investment Advisory Agreement; (b) the Advisor maintains appropriate compliance programs; (c) performance of the Fund is satisfactory relative to the performance of funds with similar investment objectives and to relevant indices; (d) the Advisor is likely to execute its investment strategies consistently over time; and (e) the Fund’s advisory fee is reasonable relative to those of similar funds and to the services to be provided by the Advisor. Based on its conclusions, the Board determined that reapproval of the Investment Advisory Agreement would be in the best interests of the Fund and its shareholders.
www.calvert.com CALVERT HIGH YIELD BOND FUND SEMI-ANNUAL REPORT (UNAUDITED) 35
To Open an Account
800-368-2748
Yields and Prices
Calvert Information Network
(24 hours, 7 days a week)
800-368-2745
Service for Existing Account
Shareholders: 800-368-2745
Brokers: 800-368-2746
TDD for Hearing Impaired
800-541-1524
Branch Office
4550 Montgomery Avenue
Suite 1000 North
Bethesda, Maryland 20814
Registered, Certified or Overnight Mail
Calvert Investments
c/o BFDS,
330 West 9th Street
Kansas City, MO 64105
Web Site
www.calvert.com
Principal Underwriter
Calvert Investment Distributors, Inc.
4550 Montgomery Avenue
Suite 1000 North
Bethesda, Maryland 20814
| | |
| CALVERT | CALVERT’S | Equity Funds |
| HIGH YIELD | FAMILY OF FUNDS | Enhanced Equity Portfolio |
| BOND FUND | | Equity Portfolio |
| | Tax-Exempt Money | Large Cap Growth Fund |
| | Market Funds | Large Cap Value Fund |
| | CTFR Money Market Portfolio | Social Index Fund |
| | | Capital Accumulation Fund |
| | Taxable Money Market | International Equity Fund |
| | Funds | Small Cap Fund |
| | First Government Money Market | Global Alternative Energy Fund |
| | Fund | Global Water Fund |
| | Money Market Portfolio | International Opportunities Fund |
| |
| | Municipal Funds | Balanced and Asset |
| | Tax-Free Bond Fund | Allocation Funds |
| | | Balanced Portfolio |
| | Taxable Bond Funds | Conservative Allocation Fund |
| | Bond Portfolio | Moderate Allocation Fund |
| | Income Fund | Aggressive Allocation Fund |
| | Short Duration Income Fund | |
| | Long-Term Income Fund | |
| | Ultra-Short Income Fund | |
| | Government Fund | |
| | High-Yield Bond Fund | |
This report is intended to provide fund information to shareholders. It is not authorized for distribution to prospective investors unless preceded or accompanied by a prospectus.
Note: The information on our website is not incorporated by reference into this report; our website address is included as an inactive textual reference only.
Investors should carefully consider the investment objectives, risks, charges and expenses of the Calvert Funds. This and other important information is contained in the fund’s summary prospectus and prospectus, which can be obtained from your financial professional and should be read carefully before investing. You may also call Calvert at 800/368-2745 or visit www. calvert.com.
INFORMATION REGARDING CALVERT OPERATING COMPANY
NAME CHANGES
Effective on April 30, 2011, the following Calvert operating companies will be renamed as indicated:
| | |
| Current Company Name | Company Name on 4/30/11 | Company Description |
| |
| Calvert Group, Ltd. | Calvert Investments, Inc. | Corporate parent of each |
| | | operating company listed |
| | | below |
| |
| Calvert Asset Management | Calvert Investment | Investment advisor to the |
| Company, Inc. | Management, Inc. | Calvert Funds |
| |
| Calvert Distributors, Inc. | Calvert Investment Distributors, | Principal underwriter |
| | Inc. | and distributor for the |
| | | Calvert Funds |
| |
| Calvert Administrative | Calvert Investment | Administrative services |
| Services Company | Administrative Services, Inc. | provider for the Calvert |
| | | Funds |
| |
| Calvert Shareholder | Calvert Investment Services, | Shareholder servicing |
| Services, Inc. | Inc. | provider for the Calvert |
| | | Funds |
Choose Planet-friendly E-delivery!
Sign up now for on-line statements, prospectuses, and fund reports. In less than five minutes you can help reduce paper mail and lower fund costs.
Just go to www.calvert.com. If you already have an online account at Calvert, click on My Account, and select the documents you would like to receive via e-mail.
If you’re new to online account access, click on Login/Register to open an online account. Once you’re in, click on the E-delivery sign-up at the bottom of the Account Portfolio page and follow the quick, easy steps. Note: if your shares are not held directly at Calvert but through a brokerage firm, you must contact your broker for electronic delivery options available through their firm.
Dear Shareholder:
The financial markets ended the six-month period on a high note. The Federal Reserve’s announcement in the fall of 2010 of a second round of quantitative easing (QE2) and the extension in December of the Bush-era tax cuts for all income levels helped buoy the markets and pushed Treasury yields higher. The resulting increase in U.S. consumer spending and confidence helped drive a year-end rally.
This calm lasted until new storms arrived in the beginning of 2011. Civil and political unrest in the Middle East and North Africa sent the price of crude soaring and heightened energy security concerns in many countries around the world. In March, the tragic earthquake and tsunami struck Japan. Our sympathies go out to the people of Japan who lost loved ones in this disaster. The earthquake—and its impact on the country’s nuclear reactors—roiled global financial markets. The cumulative effect of these events sparked a brief sell-off in corporate bonds as investors moved into the relative safety of U.S. Treasuries.
Fixed-Income Markets Continue to be Volatile
Investment-grade corporate bonds edged down slightly for the reporting period, with the Barclays Capital U.S. Credit Index returning -0.98%, while high-yield bonds, as measured by the BofA Merrill Lynch U.S. High Yield Master II Index, returned 7.09%. Money-market returns remained flat, reflecting the Fed’s efforts to keep its target interest rate very low.
Corporate bonds continued to benefit from generally strong corporate earnings and lower default expectations during the fourth quarter of 2010. This trend continued during the first quarter of 2011 as investors became more comfortable moving into riskier asset classes to chase yield. However, most fixed-income sectors experienced significant volatility as investors reacted to the turmoil in the Middle East and the ensuing climb in oil prices as well as the disaster in Japan—which prompted some investors to move back into the relative safety of Treasuries as noted above.
Municipal bond returns suffered greatly in the final months of 2010 due to heavy municipal debt issuance, record municipal bond fund redemptions by retail investors, and fear of massive municipal debt defaults, which appears to be unfounded. Fortunately, prices steadied after the turn of the year due to slowing investor outflows and minimal new debt issuance.
Opportunities and Challenges Ahead
Overall, we are optimistic and expect a slow, gradual economic recovery to continue, which we believe should help sustain a corporate bond rally through the remainder of 2011. A low core inflation rate (which excludes food and energy prices) will likely facilitate economic growth, while continued debt reduction, lingering high unemploy-
www.calvert.com CALVERT SHORT-TERM GOVERNMENT FUND SEMI-ANNUAL REPORT (UNAUDITED) 4
ment, and a struggling housing market will limit gains. Energy prices will remain a challenge until we see more resolution of the events in the Middle East and North Africa. Of course, more geopolitical crises, rising commodity prices, and inflation spikes could certainly dampen the markets.
In short, we believe the markets, the global economy, and your Calvert funds can successfully navigate through any temporary setbacks.
Discuss Your Portfolio Allocations with Your Advisor
Given the market shifts we have experienced, your overall portfolio asset allocation and investment strategy may no longer match your needs. Therefore, we recommend reviewing these with your financial advisor to ensure that your target mix of U.S. and international stocks, bonds, and cash is well-diversified and appropriate given your financial goals, time horizon, and risk tolerance.
We encourage you to visit our website, www.calvert.com, for fund information and updates as well as market and economic commentary from Calvert professionals.
As noted elsewhere in this report, the Calvert operating companies that provide services to the funds will change their names effective April 30, 2011. As part of the changes, Calvert Group, Ltd. will be known as Calvert Investments, Inc., and the funds’ advisor, Calvert Asset Management Company, Inc., will be known as Calvert Investment Management, Inc.
As always, we appreciate your investing with Calvert.

Barbara J. Krumsiek
President and CEO
Calvert Investments, Inc.
April 2011
www.calvert.com CALVERT SHORT-TERM GOVERNMENT FUND SEMI-ANNUAL REPORT (UNAUDITED) 5
| | | |
| ECONOMIC SECTORS |
| MARCH 31, 2011 |
| |
| | | % OF TOTAL | |
| | | INVESTMENTS | |
| Financials | | 39.9 | % |
| Government | | 48.3 | % |
| Mortgage Securities | | 11.8 | % |
| Total | | 100 | % |
www.calvert.com CALVERT SHORT-TERM GOVERNMENT FUND SEMI-ANNUAL REPORT (UNAUDITED) 6
SHAREHOLDER EXPENSE EXAMPLE
As a shareholder of the Fund, you incur two types of costs: (1) transaction costs, including sales charges (loads) and redemption fees and (2) ongoing costs, including management fees; distribution (12b-1) fees; and other Fund expenses. This Example is intended to help you understand your ongoing costs (in dollars) of investing in the Fund and to compare these costs with the ongoing costs of investing in other mutual funds.
This Example is based on an investment of $1,000 invested at the beginning of the period and held for the entire period (October 1, 2010 to March 31, 2011).
Actual Expenses
The first line of the table below provides information about actual account values and actual expenses. You may use the information in this line, together with the amount you invested, to estimate the expenses that you paid over the period. Simply divide your account value by $1,000 (for example, an $8,600 account value divided by $1,000 = 8.6), then multiply the result by the number in the first line under the heading entitled “Expenses Paid During Period” to estimate the expenses you paid on your account during this period.
Hypothetical Example for Comparison Purposes
The second line of the table below provides information about hypothetical account values and hypothetical expenses based on the Fund’s actual expense ratio and an assumed rate of return of 5% per year before expenses, which is not the Fund’s actual return. The hypothetical account values and expenses may not be used to estimate the actual ending account balance or expenses you paid for the period. You may use this information to compare the ongoing costs of investing in the Fund and other funds. To do so, compare the 5% hypothetical example with the 5% hypothetical examples that appear in the shareholder reports of the other funds.
Please note that the expenses shown in the table are meant to highlight your ongoing costs only and do not reflect any transactional costs, such as sales charges (loads) or redemption fees. Therefore, the second line of the table is useful in comparing ongoing costs only, and will not help you determine the relative total costs of owning different funds. In addition, if these transactional costs were included, your costs would have been higher.
www.calvert.com CALVERT SHORT-TERM GOVERNMENT FUND SEMI-ANNUAL REPORT (UNAUDITED) 7
| | | | | | |
| | | BEGINNING | | ENDING ACCOUNT | | EXPENSES PAID |
| | | ACCOUNT VALUE | | VALUE | | DURING PERIOD* |
| | | 10/1/10 | | 3/31/11 | | 10/1/10 - 3/31/11 |
| class A | | | | | | |
| Actual | $ | 1,000.00 | $ | 1,000.10 | $ | 4.89 |
| Hypothetical | $ | 1,000.00 | $ | 1,020.04 | $ | 4.94 |
| (5% return per year before expenses) |
|
| |
| class I | | | | | | |
| Actual | $ | 1,000.00 | $ | 1,001.10 | $ | 3.64 |
| Hypothetical | $ | 1,000.00 | $ | 1,021.29 | $ | 3.68 |
| (5% return per year before expenses) |
|
* Expenses are equal to the Fund’s annualized expense ratio of 0.98% and 0.73% for Class A and Class I, respectively, mult iplied by the average account value over the period, mutliplied by 182/365 (to reflect the one-half year period).
www.calvert.com CALVERT SHORT-TERM GOVERNMENT FUND SEMI-ANNUAL REPORT (UNAUDITED) 8
| | | | |
| SCHEDULE OF INVESTMENTS |
| MARCH 31, 2011 |
| |
| |
| | | PRINCIPAL | | |
| FDIC GUARANTEED CORPORATE BONDS - 36.9% | | AMOUNT | | VALUE |
| Ally Financial, Inc., 0.309%, 12/19/12 (r) | $ | 1,000,000 | $ | 1,000,358 |
| Bank of America Corp., 0.588%, 4/30/12 (r) | | 1,000,000 | | 1,004,078 |
| Citibank: | | | | |
| 0.303%, 7/12/11 (r) | | 300,000 | | 299,959 |
| 0.341%, 5/7/12 (r) | | 200,000 | | 200,178 |
| Citigroup Funding, Inc., 0.634%, 4/30/12 (r) | | 1,000,000 | | 1,004,398 |
| Goldman Sachs Group, Inc., 0.562%, 11/9/11 (r) | | 1,000,000 | | 1,001,962 |
| JPMorgan Chase & Co.: | | | | |
| 0.433%, 4/1/11 (r) | | 300,000 | | 300,000 |
| 0.54%, 6/15/12 (r) | | 1,000,000 | | 1,003,564 |
| MetLife, Inc., 0.628%, 6/29/12 (r) | | 800,000 | | 802,707 |
| Morgan Stanley, 0.592%, 2/10/12 (r) | | 1,000,000 | | 1,002,510 |
| PNC Funding Corp., 0.503%, 4/1/12 (r) | | 500,000 | | 501,383 |
| State Street Bank and Trust Co., 0.51%, 9/15/11 (r) | | 600,000 | | 600,641 |
| Wells Fargo & Co., 0.53%, 6/15/12 (r) | | 810,000 | | 812,463 |
| |
| Total FDIC Guaranteed Corporate Bonds | | | | |
| (Cost $9,510,052) | | | | 9,534,201 |
| |
| U.S. GOVERNMENT AGENCIES | | | | |
| AND INSTRUMENTALITIES - 43.4% | | | | |
| COP I LLC: | | | | |
| 3.613%, 12/5/21 | | 183,527 | | 189,413 |
| 3.65%, 12/5/21 | | 273,325 | | 271,689 |
| Fannie Mae, 0.75%, 2/26/13 | | 400,000 | | 399,476 |
| Freddie Mac: | | | | |
| 1.125%, 7/27/12 | | 700,000 | | 705,577 |
| 0.875%, 10/28/13 | | 1,000,000 | | 992,013 |
| 5.25%, 4/18/16 | | 200,000 | | 226,465 |
| Overseas Private Investment Corp., 0.22%, 8/15/17 (b)(r) | | 500,000 | | 500,000 |
| Premier Aircraft Leasing EXIM 1 Ltd.: | | | | |
| 3.576%, 2/6/22 | | 837,850 | | 835,462 |
| 3.547%, 4/10/22 | | 188,893 | | 188,115 |
| Private Export Funding Corp.: | | | | |
| 4.90%, 12/15/11 | | 2,970,000 | | 3,052,484 |
| 3.05%, 10/15/14 | | 1,000,000 | | 1,036,157 |
| 4.55%, 5/15/15 | | 1,102,000 | | 1,194,584 |
| Tennessee Valley Authority, 4.375%, 6/15/15 | | 1,000,000 | | 1,090,383 |
| Vessel Management Services, Inc., 5.85%, 5/1/27 | | 472,000 | | 518,062 |
| |
| Total U.S. Government Agencies and Instrumentalities | | | | |
| (Cost $11,045,297) | | | | 11,199,880 |
www.calvert.com CALVERT SHORT-TERM GOVERNMENT FUND SEMI-ANNUAL REPORT (UNAUDITED) 9
| | | | | | | |
| U.S. GOVERNMENT AGENCY | | | | PRINCIPAL | | | |
| MORTGAGE-BACKED SECURITIES - 10.9% | | | AMOUNT | | VALUE | |
| Fannie Mae: | | | | | | | |
| 5.50%, 5/1/12 | | | $ | 20,142 | $ | 20,499 | |
| 7.00%, 12/1/29 | | | | 263,221 | | 299,645 | |
| 5.50%, 11/25/31 | | | | 331,067 | | 346,181 | |
| 2.527%, 8/1/32 (r) | | | | 86,589 | | 88,900 | |
| Freddie Mac: | | | | | | | |
| 4.00%, 10/15/16 | | | | 251,452 | | 254,433 | |
| 5.00%, 5/1/18 | | | | 115,913 | | 124,053 | |
| 5.00%, 11/15/28 | | | | 326,050 | | 332,389 | |
| 0.605%, 11/15/32 (r) | | | | 250,863 | | 249,706 | |
| 0.655%, 10/15/34 (r) | | | | 223,224 | | 222,392 | |
| 0.505%, 7/15/35 (r) | | | | 873,977 | | 871,825 | |
| |
| Total U.S. Government Agency Mortgage-Backed | | | | | | |
| Securities (Cost $2,750,599) | | | | | | 2,810,023 | |
| |
| |
| |
| U.S. TREASURY - 1.3% | | | | | | | |
| United States Treasury Bonds, 4.75%, 2/15/41 | | | 95,000 | | 98,741 | |
| United States Treasury Notes, 3.625%, 2/15/21 | | | 235,000 | | 238,378 | |
| |
| Total U.S. Treasury (Cost $332,625) | | | | | | 337,119 | |
| |
| |
| |
| TOTAL INVESTMENTS (Cost $23,638,573) - 92.5% | | | | 23,881,223 | |
| Other assets and liabilities, net - 7.5% | | | | | 1,947,959 | |
| NET ASSETS - 100% | | | | | $ | 25,829,182 | |
| |
| |
| | | | | UNDERLYING | | UNREALIZED | |
| | # OF | EXPIRATION | | FACEAMOUNT | | APPRECIATION | |
| FUTURES | CONTRACTS | DATE | | AT VALUE | | (DEPRECIATION) | |
| Purchased: | | | | | | | |
| 10 Year U.S. Treasury Notes | 17 | 6/11 | $ | 2,023,531 | | $ 3,434 | |
| 30 Year U.S. Treasury Bonds | 6 | 6/11 | | 721,125 | | 2,993 | |
| Total Purchased | | | | | | $ 6,427 | |
| Sold: | | | | | | | |
| 2 Year U.S. Treasury Notes | 70 | 6/11 | $ | 15,268,750 | | ($ 5,930 | ) |
| (b) | This security was valued by the Board of Trustees. See Note A. |
| (r) | The coupon rate shown on floating or adjustable rate securities represents the rate at period end. |
Abbreviations:
LLC: Limited Liability Corporation
See notes to financial statements.
www.calvert.com CALVERT SHORT-TERM GOVERNMENT FUND SEMI-ANNUAL REPORT (UNAUDITED) 10
STATEMENT OF ASSETS AND LIABILITIES
MARCH 31, 2011
| | |
| ASSETS | | |
| Investments in securities, at value (Cost $23,638,573) | | |
| see accompanying schedule | $ | 23,881,223 |
| Cash | | 1,755,078 |
| Receivable for securities sold | | 525,060 |
| Receivable for shares sold | | 37,390 |
| Interest and dividends receivable | | 133,132 |
| Other assets | | 51,806 |
| Total assets | | 26,383,689 |
| |
| |
| |
| LIABILITIES | | |
| Payable for securities purchased | | 519,634 |
| Payable for shares redeemed | | 2,591 |
| Payable for futures variation margin | | 5,969 |
| Payable to Calvert Asset Management Company, Inc. | | 12,300 |
| Payable to Calvert Administrative Services Company | | 2,196 |
| Payable to Calvert Shareholder Services, Inc. | | 120 |
| Payable to Calvert Distributors, Inc. | | 576 |
| Accrued expenses and other liabilities | | 11,121 |
| Total liabilities | | 554,507 |
| |
| NET ASSETS | $ | 25,829,182 |
| |
| |
| NET ASSETS CONSIST OF: | | |
| Paid-in capital applicable to the following shares of beneficial interest, | | |
| unlimited number of no par value shares authorized: | | |
| Class A: 51,847 shares outstanding | $ | 2,801,468 |
| Class I: 440,650 shares outstanding | | 22,562,105 |
| Undistributed net investment income | | 462 |
| Accumulated net realized gain (loss) on investments | | 222,000 |
| Net unrealized appreciation (depreciation) on investments | | 243,147 |
| |
| NET ASSETS | $ | 25,829,182 |
| |
| NET ASSET VALUE PER SHARE | | |
| Class A (based on net assets of $2,723,982) | $ | 52.54 |
| Class I (based on net assets of $23,105,200) | $ | 52.43 |
See notes to financial statements.
www.calvert.com CALVERT SHORT-TERM GOVERNMENT FUND SEMI-ANNUAL REPORT (UNAUDITED) 11
| | | |
| STATEMENT OF OPERATIONS |
| SIX MONTHS ENDED MARCH 31, 2011 |
| |
| |
| NET INVESTMENT INCOME | | | |
| Investment Income: | | | |
| Interest income | $ | 227,271 | |
| Total investment income | | 227,271 | |
| |
| Expenses: | | | |
| Investment advisory fee | | 62,649 | |
| Transfer agency fees and expenses | | 14,283 | |
| Administrative fees | | 13,922 | |
| Distribution Plan expenses: | | | |
| Class A | | 3,531 | |
| Trustees’ fees and expenses | | 201 | |
| Registration fees | | 12,686 | |
| Custodian fees | | 10,267 | |
| Reports to shareholders | | 8,017 | |
| Professional fees | | 21,722 | |
| Accounting fees | | 2,211 | |
| Miscellaneous | | 4,453 | |
| Total expenses | | 153,942 | |
| Reimbursement from Advisor: | | | |
| Class A | | (20,834 | ) |
| Class I | | (27,760 | ) |
| Fees paid indirectly | | (186 | ) |
| Net Expenses | | 105,162 | |
| |
| |
| NET INVESTMENT INCOME | | 122,109 | |
| |
| REALIZED AND UNREALIZED GAIN (LOSS) | | | |
| Net realized gain (loss) on: | | | |
| Investments | | 325,271 | |
| Futures | | 16,488 | |
| | | 341,759 | |
| |
| Change in unrealized appreciation (depreciation) on: | | | |
| Investments | | (451,561 | ) |
| Futures | | 6,203 | |
| | | (445,358 | ) |
| |
| NET REALIZED AND UNREALIZED GAIN | | | |
| (LOSS) | | (103,599 | ) |
| |
| INCREASE (DECREASE) IN NET ASSETS | | | |
| RESULTING FROM OPERATIONS | $ | 18,510 | |
See notes to financial statements.
www.calvert.com CALVERT SHORT-TERM GOVERNMENT FUND SEMI-ANNUAL REPORT (UNAUDITED) 12
STATEMENTS OF CHANGES IN NET ASSETS
| | | | | | |
| | | SIX MONTHS ENDED | | | YEAR ENDED | |
| | | MARCH
31, | | | SEPTEMBER 30, | |
| INCREASE (DECREASE) IN NET ASSETS | | 2011 | | | 2010 | |
| Operations: | | | | | | |
| Net investment income | $ | 122,109 | | $ | 443,370 | |
| Net realized gain (loss) | | 341,759 | | | 132,550 | |
| Change in unrealized appreciation (depreciation) | | (445,358 | ) | | 334,945 | |
| |
| INCREASE (DECREASE) IN NET ASSETS | | | | | | |
| RESULTING FROM OPERATIONS | | 18,510 | | | 910,865 | |
| |
| |
| Distributions to shareholders from: | | | | | | |
| Net investment income: | | | | | | |
| Class A shares | | (11,142 | ) | | (49,422 | ) |
| Class I shares | | (128,058 | ) | | (431,181 | ) |
| Net realized gain: | | | | | | |
| Class A shares | | (27,945 | ) | | (101,674 | ) |
| Class I shares | | (255,206 | ) | | (576,505 | ) |
| Total distributions | | (422,351 | ) | | (1,158,782 | ) |
| |
| |
| Capital share transactions: | | | | | | |
| Shares sold: | | | | | | |
| Class A shares | | 703,349 | | | 4,161,608 | |
| Class I shares | | 2,090,433 | | | 5,362,221 | |
| Reinvestment of distributions: | | | | | | |
| Class A shares | | 34,289 | | | 142,681 | |
| Class I shares | | 383,264 | | | 1,007,686 | |
| Redemption fees: | | | | | | |
| Class A shares | | 543 | | | 50 | |
| Shares redeemed: | | | | | | |
| Class A shares | | (1,784,650 | ) | | (4,627,450 | ) |
| Class I shares | | (6,752,911 | ) | | (10,921,734 | ) |
| Total capital share transactions | | (5,325,683 | ) | | (4,874,938 | ) |
| |
| |
| TOTAL INCREASE (DECREASE) IN NET ASSETS | | (5,729,524 | ) | | (5,122,855 | ) |
| |
| |
| NET ASSETS | | | | | | |
| Beginning of period | | 31,558,706 | | | 36,681,561 | |
| End of period (including undistributed net investment | | | | | | |
| income of $462 and $17,553, respectively) | $ | 25,829,182 | | $ | 31,558,706 | |
See notes to financial statements.
www.calvert.com CALVERT SHORT-TERM GOVERNMENT FUND SEMI-ANNUAL REPORT (UNAUDITED) 13
STATEMENTS OF CHANGES IN NET ASSETS
| | | | |
| | SIX MONTHS ENDED | | YEAR ENDED | |
| | MARCH
31, | | SEPTEMBER 30, | |
| CAPITAL SHARE ACTIVITY | 2011 | | 2010 | |
| Shares sold: | | | | |
| Class A shares | 13,341 | | 78,639 | |
| Class I shares | 39,722 | | 101,804 | |
| Reinvestment of distributions: | | | | |
| Class A shares | 652 | | 2,713 | |
| Class I shares | 7,297 | | 19,194 | |
| Shares redeemed: | | | | |
| Class A shares | (33,698 | ) | (88,301 | ) |
| Class I shares | (128,288 | ) | (207,795 | ) |
| Total capital share activity | (100,974 | ) | (93,746 | ) |
See notes to financial statements.
www.calvert.com CALVERT SHORT-TERM GOVERNMENT FUND SEMI-ANNUAL REPORT (UNAUDITED) 14
NOTES TO FINANCIAL STATEMENTS
NOTE A –– SIGNIFICANT ACCOUNTING POLICIES
General: The Calvert Short-Term Government Fund (the “Fund”), a series of The Calvert Fund, is registered under the Investment Company Act of 1940 as a diversified, open-end management investment company. The operations of each series are accounted for separately. Prior to September 18, 2009, the Fund was a series of Summit Mutual Funds, Inc. The Fund currently offers two classes of shares of capital stock. Class A shares are sold with a maximum front-end sales charge of 2.75%. Class I shares require a minimum account balance of $1,000,000. The $1 million minimum initial investment may be waived for certain institutional accounts, where it is believed to be in the best interest of the Fund and its shareholders. Class I shares have no front-end or deferred sales charge and have lower levels of expenses than Class A shares. Each class has different: (a) dividend rates due to differences in Distribution Plan expenses and other class specific expenses, (b) exchange privileges and (c) class specific voting rights.
Security Valuation: Net asset value per share is determined every business day as of the close of the regular session of the New York Stock Exchange (generally 4:00 p.m. Eastern time). The Fund uses independent pricing services approved by the Board of Trustees to value its investments wherever possible. Investments for which market quotations are not available or deemed not reliable are fair valued in good faith under the direction of the Board of Trustees. In determining fair value, the Board considers all relevant qualitative and quantitative information available. These factors are subject to change over time and are reviewed periodically. The values assigned to fair value investments are based on available information and do not necessarily represent amounts that might ultimately be realized. Further, because of the inherent uncertainty of valuation, those estimated values may differ significantly from the values that would have been used had a ready market for the investments existed, and the differences could be material.
At March 31, 2011, securities valued at $500,000 or 1.9% of net assets were fair valued in good faith under the direction of the Board of Trustees.
The Fund utilizes various methods to measure the fair value of its investments. Generally Accepted Accounting Principles (GAAP) establishes a disclosure hierarchy that categorizes the inputs to valuation techniques used to value assets and liabilities at measurement date. These inputs are summarized in the three broad levels listed below: Level 1 – quoted prices in active markets for identical securities Level 2 – other significant observable inputs (including quoted prices for similar securities, interest rates, prepayment speeds, credit risk, etc.) Level 3 – significant unobservable inputs (including the Fund’s own assumptions in determining the fair value of investments) The inputs or methodology used for valuing securities are not necessarily an indication of the risk associated with investing in those securities.
Changes in valuation techniques may result in transfers in or out of an investment’s assigned level within the hierarchy during the period. Valuation techniques used to value the Fund’s investments by major category are as follows.
www.calvert.com CALVERT SHORT-TERM GOVERNMENT FUND SEMI-ANNUAL REPORT (UNAUDITED) 15
Debt securities, including restricted securities, are valued based on evaluated prices received from independent pricing services or from dealers who make markets in such securities. For corporate bonds and U.S. government and government agency obligations, pricing services utilize matrix pricing which considers yield or price of bonds of comparable quality, coupon, maturity and type as well as dealer supplied prices and are generally categorized as Level 2 in the hierarchy. For U.S. government agency mortgage securities, pricing services utilize matrix pricing which considers prepayment speed assumptions, attributes of the collateral, yield or price of bonds of comparable quality, coupon, maturity and type as well as dealer supplied prices and, accordingly, such securities are generally categorized as Level 2 in the hierarchy. Short-term securities with remaining maturities of sixty days or less for which quotations are not readily available are valued at amortized cost, which approximates fair value, and are categorized as Level 2 in the hierarchy.
When independent prices are unavailable or unreliable, debt securities may be valued utilizing pricing matrices which consider similar factors that would be used by independent pricing services. These are generally categorized as Level 2 in the hierarchy but may be Level 3 depending on the circumstances.
The following is a summary of the inputs used to value the Fund’s net assets as of March 31, 2011:
| | | | | | | | | |
| | | VALUATION INPUTS |
| InvesTmenTs In securITIes | | level 1 | | level 2 | | level 3 | | | ToTal |
| Corporate debt | | - | $ | 9,534,201 | | - | | $ | 9,534,201 |
| U.S. government obligations | | - | | 13,847,022 | $ | 500,000 | | | 14,347,022 |
| TOTAL | | - | $ | 23,381,223 | $ | 500,000 | ** | $ | 23,881,223 |
| |
| Other financial instruments* | $ | 497 | | - | | - | | $ | 497 |
* Other financial instruments are derivative instruments not reflected in the Portfolio of Investments, such as futures, which are valued at the unrealized appreciation/depreciation on the instrument.
** Level 3 securities represent 1.9% of net assets.
Repurchase Agreements: The Fund may enter into repurchase agreements with recognized financial institutions or registered broker/dealers and, in all instances, holds underlying securities with a value exceeding the total repurchase price, including accrued interest. Although risk is mitigated by the collateral, the Fund could experience a delay in recovering its value and a possible loss of income or value if the counterparty fails to perform in accordance with the terms of the agreement.
Futures Contracts: The Fund may purchase and sell futures contracts, but only when, in the judgment of the Advisor, such a position acts as a hedge. The Fund may not enter into futures contracts for the purpose of speculation or leverage. These futures contracts may include, but are not limited to, futures contracts based on U.S. Government obligations. The Fund is subject to interest rate risk in the normal course of pursuing its investment objectives. The Fund may use futures contracts to hedge against changes in the value of interest rates. The Fund may enter into futures contracts agreeing to buy or sell a financial instrument for a set price at a future date. Initial margin deposits of either cash or securities as required by the broker are made upon entering into the contract.
www.calvert.com CALVERT SHORT-TERM GOVERNMENT FUND SEMI-ANNUAL REPORT (UNAUDITED) 16
While the contract is open, daily variation margin payments are made to or received from the broker reflecting the daily change in market value of the contract and are recorded for financial reporting purposes as unrealized gains or losses by the Fund. When a futures contract is closed, a realized gain or loss is recorded equal to the difference between the opening and closing value of the contract. The risks associated with entering into futures contracts may include the possible illiquidity of the secondary market which would limit the Fund’s ability to close out a futures contract prior to the settlement date, an imperfect correlation between the value of the contracts and the underlying financial instruments, or that the counterparty will fail to perform its obligations under the contracts’ terms. Futures contracts are designed by boards of trade which are designated “contracts markets” by the Commodities Futures Trading Commission. Futures contracts trade on the contracts markets in a manner that is similar to the way a stock trades on a stock exchange and the boards of trade, through their clearing corporations, guarantee the futures contracts against default. As a result, there is minimal counterparty credit risk to the Fund. During the period, the Fund used U.S. Treasury futures contracts to hedge against interest rate changes and to manage overall duration of the Fund.
Security Transactions and Net Investment Income: Security transactions are accounted for on trade date. Realized gains and losses are recorded on an identified cost basis and may include proceeds from litigation. Dividend income is recorded on the ex-dividend date or, in the case of dividends on certain foreign securities, as soon as the Fund is informed of the ex-dividend date. Distributions received on securities that represent a return of capital or capital gain are recorded as a reduction of cost of investments and/or as a realized gain. Interest income, which includes amortization of premium and accretion of discount on debt securities, is accrued as earned. Investment income and realized and unrealized gains and losses are allocated to separate classes of shares based upon the relative net assets of each class. Expenses arising in connection with a class are charged directly to that class. Expenses common to the classes are allocated to each class in proportion to their relative net assets.
Distributions to Shareholders: Distributions to shareholders are recorded by the Fund on ex-dividend date. Dividends from net investment income are paid monthly. Distributions from net realized capital gains, if any, are paid at least annually. Distributions are determined in accordance with income tax regulations which may differ from generally accepted accounting principles; accordingly, periodic reclassifications are made within the Fund’s capital accounts to reflect income and gains available for distribution under income tax regulations.
Estimates: The preparation of the financial statements in conformity with accounting principles generally accepted in the United States requires management to make estimates and assumptions that affect the reported amounts of assets and liabilities and disclosure of contingent assets and liabilities at the date of the financial statements and the reported amounts of income and expenses during the reported period. Actual results could differ from those estimates.
Redemption Fees: The Fund charges a 2% redemption fee on redemptions, including exchanges, made within 30 days of purchase in the same Fund (within seven days
www.calvert.com CALVERT SHORT-TERM GOVERNMENT FUND SEMI-ANNUAL REPORT (UNAUDITED) 17
for Class I shares). The redemption fee is paid to the Class of the Fund from which the redemption is made, and is accounted for as an addition to paid-in capital. The fee is intended to discourage market-timers by ensuring that short-term trading costs are borne by the investors making the transactions and not the shareholders already in the Fund.
Expense Offset Arrangements: The Fund has an arrangement with its custodian bank whereby the custodian’s fees may be paid indirectly by credits earned on the Fund’s cash on deposit with the bank. These credits are used to reduce the Fund’s expenses. Such a deposit arrangement may be an alternative to overnight investments.
Federal Income Taxes: No provision for federal income or excise tax is required since the Fund intends to continue to qualify as a regulated investment company under the Internal Revenue Code and to distribute substantially all of its taxable earnings.
Management has analyzed the Fund’s tax positions taken for all open federal income tax years and has concluded that no provision for federal income tax is required in the Fund’s financial statements. A Fund’s federal tax return is subject to examination by the Internal Revenue Service for a period of three years.
NOTE B — RELATED PARTY TRANSACTIONS
Calvert Asset Management Company, Inc. (the “Advisor”) is wholly-owned by Calvert Group, Ltd. (“Calvert”), which is indirectly wholly-owned by UNIFI Mutual Holding Company. The Advisor provides investment advisory services and pays the salaries and fees of officers and Trustees of the Fund who are employees of the Advisor or its affiliates. For its services, the Advisor receives an annual fee, payable monthly, based on annual rates of .45% of average daily net assets.
The Advisor has contractually agreed to limit net annual fund operating expenses through January 31, 2012. The contractual expense cap is .98% for Class A, and .73% for Class I. For the purposes of this expense limit, operating expenses do not include interest expense, brokerage commissions, taxes, and extraordinary expenses. To the extent that any expense offset credits are earned, the Advisor’s obligation under the contractual limitation may be reduced and the Advisor may benefit from the expense offset arrangement.
Calvert Administrative Services Company, an affiliate of the Advisor, provides administrative services to the Fund for an annual fee, payable monthly. Class A and Class I shares pay an annual rate of .10%.
Calvert Distributors, Inc., an affiliate of the Advisor, is the distributor and principal underwriter for the Fund. A Distribution Plan, adopted by Class A shares, allows the Fund to pay the Distributor for expenses and services associated with the distribution of shares. The expenses paid may not exceed .25% annually of the Fund’s average daily net assets of Class A. The amount actually paid by the Fund is an annualized fee, payable monthly of .25% of the Fund’s average daily net assets of Class A. Class I shares do not have Distribution Plan expenses.
The Distributor received $1,164 as its portion of the commissions charged on sales of the Fund’s Class A shares for the six months ended March 31, 2011.
www.calvert.com CALVERT SHORT-TERM GOVERNMENT FUND SEMI-ANNUAL REPORT (UNAUDITED) 18
Calvert Shareholder Services, Inc. (“CSSI”), an affiliate of the Advisor, is the shareholder servicing agent for the Fund. For its services, CSSI received a fee of $686 for the six months ended March 31, 2011. Boston Financial Data Services, Inc. is the transfer and dividend disbursing agent.
Each Trustee of the Fund who is not an employee of the Advisor or its affiliates receives an annual retainer of $45,000 plus up to $2,000 for each Board and Committee meeting attended. The Board chair and Committee chairs each receive an additional $5,000 annual retainer. Trustee’s fees are allocated to each funds served.
NOTE C — INVESTMENT ACTIVITY
During the period, the cost of purchases and proceeds from sales of investments, other than short-term and U.S. government securities, were $399,384 and $2,521,911, respectively. U.S. government security purchases and sales were $34,187,300 and $34,852,705, respectively.
The Fund intends to elect to defer net capital losses of $120,403 incurred from November 1, 2009 through September 30, 2010 and treat them as arising in the fiscal year ending September 30, 2011.
As of March 31, 2011, the tax basis components of unrealized appreciation/(depreciation) and the federal tax cost were as follows:
| Unrealized appreciation | $ | 263,747 | |
| Unrealized (depreciation) | | (21,097 | ) |
| Net unrealized appreciation/(depreciation) | $ | 242,650 | |
| Federal income tax cost of investments | $ | 23,638,573 | |
The Fund may sell or purchase securities to and from other Funds managed by the Advisor, typically short-term variable demand notes. Interportfolio transactions are primarily used for cash management purposes. Interportfolio transactions are made pursuant to Rule 17a-7 of the Investment Company Act of 1940. For the six months ended March 31, 2011, there were no such transactions.
www.calvert.com CALVERT SHORT-TERM GOVERNMENT FUND SEMI-ANNUAL REPORT (UNAUDITED) 19
NOTE D — LINE OF CREDIT
A financing agreement is in place with all Calvert Group Funds and State Street Corporation (“SSC”). Under the agreement, SSC provides an unsecured line of credit facility, in the aggregate amount of $50 million ($25 million committed and $25 million uncommitted), accessible by the Funds for temporary or emergency purposes only. Borrowings under the committed facility bear interest at the higher of the London Interbank Offered Rate, (LIBOR) or the overnight Federal Funds Rate plus 1.25% per annum. A commitment fee of .125% per annum is incurred on the unused portion of the committed facility, which is allocated to all participating funds. The Fund had no loans outstanding pursuant to this line of credit at March 31, 2011. For the six months ended March 31, 2011, borrowings by the Fund under the Agreement were as follows:
| | WEIGHTED | | MONTH OF |
| AVERAGE | AVERAGE | MAXIMUM | MAXIMUM |
| DAILY | INTEREST | AMOUNT | AMOUNT |
| BALANCE | RATE | BORROWED | BORROWED |
| $14,377 | 1.51% | $334,921 | January 2011 |
NOTE E – SUBSEQUENT EVENTSIn preparing the financial statements as of March 31, 2011, no subsequent events or transactions occurred that would have materially impacted the financial statements as presented.
Effective April 30, 2011, the Calvert operating companies will be renamed as follows: Calvert Group, Ltd. will be renamed Calvert Investments, Inc., Calvert Asset Management Company, Inc. will be renamed Calvert Investment Management, Inc., Calvert Distributors, Inc., will be renamed Calvert Investment Distributors, Inc., Calvert Administrative Services Company will be renamed Calvert Investment Administrative Services, Inc., and Calvert Shareholder Services, Inc. will be renamed Calvert Investment Services, Inc.
NOTE F – OTHER
On December 8, 2010, the Board of Trustees approved a resolution to reorganize the Calvert Short-Term Government Fund into the Calvert Government Fund. Shareholders of the Calvert Short-Term Government Fund approved the resolution to reorganize and the reorganization took place at the close of business on April 29, 2011.
www.calvert.com CALVERT SHORT-TERM GOVERNMENT FUND SEMI-ANNUAL REPORT (UNAUDITED) 20
| | | | | | | | | |
| FINANCIAL HIGHLIGHTS |
| |
| | | | | | Periods ended | | | | |
| | | MARCH
31, | | | SEPTEMBER 30, | | | SEPTEMBER 30, | |
| class A shares | | 2011 | | | 2010 | | | 2009 | (z) |
| Net asset value, beginning | $ | 53.27 | | $ | 53.53 | | $ | 51.87 | |
| Income from investment operations: | | | | | | | | | |
| Net investment income | | .19 | | | .65 | | | .60 | |
| Net realized and unrealized gain (loss) | | (.19 | ) | | .83 | | | 1.99 | |
| Total from investment operations | | — | | | 1.48 | | | 2.59 | |
| Distributions from: | | | | | | | | | |
| Net investment income | | (.21 | ) | | (.71 | ) | | (.93 | ) |
| Net realized gains | | (.52 | ) | | (1.03 | ) | | — | |
| Total distributions | | (.73 | ) | | (1.74 | ) | | (.93 | ) |
| Total increase (decrease) in net asset value | | (.73 | ) | | (.26 | ) | | 1.66 | |
| Net asset value, ending | $ | 52.54 | | $ | 53.27 | | $ | 53.53 | |
| |
| Total return* | | .01 | % | | 2.84 | % | | 5.03 | % |
| Ratios to average net assets: A | | | | | | | | | |
| Net investment income | | .66 | % (a) | | 1.19 | % | | 1.27 | % |
| Total expenses | | 2.46 | % (a) | | 2.10 | % | | 2.54 | % |
| Expenses before offsets | | .98 | % (a) | | .98 | % | | .98 | % |
| Net expenses | | .98 | % (a) | | .98 | % | | .98 | % |
| Portfolio turnover | | 134 | % | | 208 | % | | 197 | % |
| Net assets, ending (in thousands) | $ | 2,724 | | $ | 3,811 | | $ | 4,202 | |
| |
| | | | | | Periods ended | |
| | | | | | SEPTEMBER 30, | | | SEPTEMBER 30, | |
| class a shares | | | | | 2008 | (z) | | 2007 | # |
| Net asset value, beginning | | | | $ | 51.65 | | $ | 50.99 | |
| Income from investment operations: | | | | | | | | | |
| Net investment income | | | | | 1.74 | | | 1.37 | |
| Net realized and unrealized gain (loss) | | | | | .28 | | | .43 | |
| Total from investment operations | | | | | 2.02 | | | 1.80 | |
| Distributions from: | | | | | | | | | |
| Net investment income | | | | | (1.80 | ) | | (1.14 | ) |
| Total distributions | | | | | (1.80 | ) | | (1.14 | ) |
| Total increase (decrease) in net asset value | | | | | 0.22 | | | 0.66 | |
| Net asset value, ending | | | | $ | 51.87 | | $ | 51.65 | |
| |
| Total return* | | | | | 3.97 | % | | 3.57 | % |
| Ratios to average net assets: A | | | | | | | | | |
| Net investment income | | | | | 3.36 | % | | 4.73 | % (a) |
| Total expenses | | | | | 1.18 | % | | 1.25 | % (a) |
| Expenses before offsets | | | | | .98 | % | | .98 | % (a) |
| Net expenses | | | | | .98 | % | | .98 | % (a) |
| Portfolio turnover | | | | | 38 | % | | 32 | % |
| Net assets, ending (in thousands) | | | | $ | 301 | | $ | 10 | |
See notes to financial highlights.
www.calvert.com CALVERT SHORT-TERM GOVERNMENT FUND SEMI-ANNUAL REPORT (UNAUDITED) 21
| | | | | | | | | |
| FINANCIAL HIGHLIGHTS |
| |
| | | | | | Periods ended | | | | |
| | | MARCH
31, | | | SEPTEMBER 30, | | | SEPTEMBER 30, | |
| class I shares | | 2011 | | | 2010 | | | 2009 | (z) |
| Net asset value, beginning | $ | 53.16 | | $ | 53.40 | | $ | 51.72 | |
| Income from investment operations: | | | | | | | | | |
| Net investment income | | .24 | | | .75 | | | .81 | |
| Net realized and unrealized gain (loss) | | (.18 | ) | | .85 | | | 1.88 | |
| Total from investment operations | | .06 | | | 1.60 | | | 2.69 | |
| Distributions from: | | | | | | | | | |
| Net investment income | | (.27 | ) | | (.81 | ) | | (1.01 | ) |
| Net realized gain | | (.52 | ) | | (1.03 | ) | | — | |
| Total distributions | | (.79 | ) | | (1.84 | ) | | (1.01 | ) |
| Total increase (decrease) in net asset value | | (.73 | ) | | (.24 | ) | | 1.68 | |
| Net asset value, ending | $ | 52.43 | | $ | 53.16 | | $ | 53.40 | |
| |
| Total return* | | .13 | % | | 3.09 | % | | 5.25 | % |
| Ratios to average net assets: A | | | | | | | | | |
| Net investment income | | .90 | % (a) | | 1.42 | % | | 1.52 | % |
| Total expenses | | .95 | % (a) | | .82 | % | | .82 | % |
| Expenses before offsets | | .73 | % (a) | | .73 | % | | .73 | % |
| Net expenses | | .73 | % (a) | | .73 | % | | .73 | % |
| Portfolio turnover | | 134 | % | | 208 | % | | 197 | % |
| Net assets, ending (in thousands) | $ | 23,105 | | $ | 27,747 | | $ | 32,479 | |
| |
| |
| | | | | | Years ended | | | | |
| | | SEPTEMBER 30, | | | SEPTEMBER 30, | | | SEPTEMBER 30, | |
| class I shares | | 2008 | (z) | | 2007 | | | 2006 | |
| Net asset value, beginning | $ | 51.50 | | $ | 51.10 | | $ | 51.05 | |
| Income from investment operations: | | | | | | | | | |
| Net investment income | | 1.87 | | | 2.09 | | | 1.84 | |
| Net realized and unrealized gain (loss) | | .27 | | | .44 | | | (.05 | ) |
| Total from investment operations | | 2.14 | | | 2.53 | | | 1.79 | |
| Distributions from: | | | | | | | | | |
| Net investment income | | (1.92 | ) | | (2.13 | ) | | (1.74 | ) |
| Total distributions | | — | | | (2.13 | ) | | (1.74 | ) |
| Total increase (decrease) in net asset value | | (1.92 | ) | | 0.40 | | | 0.05 | |
| Net asset value, ending | $ | 51.72 | | $ | 51.50 | | $ | 51.10 | |
| |
| Total return* | | 4.22 | % | | 5.06 | % | | 3.58 | % |
| Ratios to average net assets: A | | | | | | | | | |
| Net investment income | | 3.61 | % | | 4.11 | % | | 3.55 | % |
| Total expenses | | .93 | % | | .96 | % | | .84 | % |
| Expenses before offsets | | .73 | % | | .73 | % | | .73 | % |
| Net expenses | | .73 | % | | .73 | % | | .73 | % |
| Portfolio turnover | | 38 | % | | 32 | % | | 42 | % |
| Net assets, ending (in thousands) | $ | 34,737 | | $ | 27,270 | | $ | 28,013 | |
See notes to financial highlights.
www.calvert.com CALVERT SHORT-TERM GOVERNMENT FUND SEMI-ANNUAL REPORT (UNAUDITED) 22
| A | Total expenses do not reflect amounts reimbursed and/or waived by the Advisor or reductions from expense offset arrangements. Expenses before offsets reflect expenses after reimbursement and/or waiver by the Advisor but prior to reductions from expense offset arrangements. Net expenses are net of all reductions and represent the net expenses paid by the Fund. |
| * | Total return is not annualized for periods less than one year and does not reflect deduction of any front-end or deferred sales charge. |
| # | From February 1, 2007 inception. |
| (a) | Annualized. |
| (z) | Per share figures are calculated using the Average Shares Method. |
See notes to financial statements.
www.calvert.com CALVERT SHORT-TERM GOVERNMENT FUND SEMI-ANNUAL REPORT (UNAUDITED) 23
EXPLANATION OF FINANCIAL TABLES
SCHEDULE OF INVESTMENTS
The Schedule of Investments is a snapshot of all securities held in the fund at their market value, on the last day of the reporting period. Securities are listed by asset type (e.g., common stock, corporate bonds, U.S. government obligations) and may be further broken down into sub-groups and by industry classification.
STATEMENT OF ASSETS AND LIABILITIES
The Statement of Assets and Liabilities is often referred to as the fund’s balance sheet. It lists the value of what the fund owns, is due and owes on the last day of the reporting period. The fund’s assets include the market value of securities owned, cash, receivables for securities sold and shareholder subscriptions, and receivables for dividends and interest payments that have been earned, but not yet received. The fund’s liabilities include payables for securities purchased and shareholder redemptions, and expenses owed but not yet paid. The statement also reports the fund’s net asset value (NAV) per share on the last day of the reporting period. The NAV is calculated by dividing the fund’s net assets (assets minus liabilities) by the number of shares outstanding. This statement is accompanied by a Schedule of Investments. Alternatively, if certain conditions are met, a Statement of Net Assets may be presented in lieu of this statement and the Schedule of Investments.
STATEMENT OF NET ASSETS
The Statement of Net Assets provides a detailed list of the fund’s holdings, including each security’s market value on the last day of the reporting period. The Statement of Net Assets includes a Schedule of Investments. Other assets are added and other liabilities subtracted from the investments total to calculate the fund’s net assets. Finally, net assets are divided by the outstanding shares of the fund to arrive at its share price, or Net Asset Value (NAV) per share.
At the end of the Statement of Net Assets is a table displaying the composition of the fund’s net assets. Paid in Capital is the money invested by shareholders and represents the bulk of net assets. Undistributed Net Investment Income and Accumulated Net Realized Gains usually approximate the amounts the fund had available to distribute to shareholders as of the statement date. Accumulated Realized Losses will appear as negative balances. Unrealized Appreciation (Depreciation) is the difference between the market value of the fund’s investments and their cost, and reflects the gains (losses) that would be realized if the fund were to sell all of its investments at their statement-date values.
www.calvert.com CALVERT SHORT-TERM GOVERNMENT FUND SEMI-ANNUAL REPORT (UNAUDITED) 24
STATEMENT OF OPERATIONS
The Statement of Operations summarizes the fund’s investment income earned and expenses incurred in operating the fund. Investment income includes dividends earned from stocks and interest earned from interest-bearing securities in the fund. Expenses incurred in operating the fund include the advisory fee paid to the investment advisor, administrative services fees, distribution plan expenses (if applicable), transfer agent fees, shareholder servicing expenses, custodial, legal, and audit fees, and the printing and postage expenses related to shareholder reports. Expense offsets (fees paid indirectly) are also shown. Credits earned from offset arrangements are used to reduce the fund’s expenses. This statement also shows net gains (losses) realized on the sale of investments and the increase or decrease in the unrealized appreciation (depreciation) on investments held during the period.
STATEMENT OF CHANGES IN NET ASSETS
The Statement of Changes in Net Assets shows how the fund’s total net assets changed during the two most recent reporting periods. Changes in the fund’s net assets are attributable to investment operations, distributions and capital share transactions.
The Operations section of the report summarizes information detailed in the Statement of Operations. The Distribution section shows the dividend and capital gain distributions made to shareholders. The amounts shown as distributions in this section may not match the net investment income and realized gains amounts shown in the Operations section because distributions are determined on a tax basis and certain investments or transactions may be treated differently for financial statement and tax purposes. The Capital Share Transactions section shows the amount shareholders invested in the fund, either by purchasing shares or by reinvesting distributions, and the amounts redeemed. The corresponding numbers of shares issued, reinvested and redeemed are shown at the end of the report.
FINANCIAL HIGHLIGHTS
The Financial Highlights table provides a per-share breakdown per class of the components that affect the fund’s net asset value for current and past reporting periods. The table provides total return, total distributions, expense ratios, portfolio turnover and net assets for the applicable period. Total return is a measure of a fund’s performance that encompasses all elements of return: dividends, capital gain distributions and changes in net asset value. Total return is the change in value of an investment over a given period, assuming reinvestment of any dividends and capital gain distributions, expressed as a percentage of the initial investment. Total distributions include distributions from net investment income and net realized gains. Long-term gains are earned on securities held in the fund more than one year. Short-term gains, on the sale of securities held less than one year, are treated as ordinary dividend income for tax purposes. The expense ratio is a fund’s cost of doing business, expressed as a percentage of net assets. These expenses directly reduce returns to shareholders. Portfolio turnover measures the trading activity in a fund’s investment portfolio – how often securities are bought and sold by a fund. Portfolio turnover is affected by market conditions, changes in the size of the fund, the nature of the fund’s investments and the investment style of the portfolio manager.
www.calvert.com CALVERT SHORT-TERM GOVERNMENT FUND SEMI-ANNUAL REPORT (UNAUDITED) 25
PROXY VOTING
The Proxy Voting Guidelines of the Calvert Funds that the Fund uses to determine how to vote proxies relating to portfolio securities are provided as an Appendix to the Fund’s Statement of Additional Information. The Statement of Additional Information can be obtained free of charge by calling the Fund at 1-800-368-2745, by visiting the Calvert website at www.calvert.com; or by visiting the SEC’s website at www.sec.gov.
Information regarding how the Fund voted proxies relating to portfolio securities during the most recent 12-month period ended June 30 will be available on the Fund’s website at www.calvert.com and on the SEC’s website at www.sec.gov.
AVAILABILITY OF QUARTERLY PORTFOLIO HOLDINGS
The Fund files its complete schedule of portfolio holdings with the SEC for the first and third quarters of each fiscal year on Form N-Q. The Fund’s Form N-Q is available on the SEC’s website at www.sec.gov. The Fund’s Form N-Q may be reviewed and copied at the SEC’s Public Reference Room in Washington, DC; information on the operation of the Public Reference Room may be obtained by calling 1-800-SEC-0330.
BASIS FOR BOARD’S APPROVAL OF INVESTMENT ADVISORY CONTRACT
At a meeting held on December 8, 2010, the Board of Trustees, and by a separate vote, the disinterested Trustees, approved the continuance of the Investment Advisory Agreement between The Calvert Fund and the Advisor with respect to the Fund.
In evaluating the Investment Advisory Agreement, the Board considered a variety of information relating to the Fund and the Advisor. The disinterested Trustees reviewed a report prepared by the Advisor regarding various services provided to the Fund by the Advisor and its affiliates. Such report included, among other data, information regarding the Advisor’s personnel and the Advisor’s revenue and cost of providing services to the Fund, and a separate report prepared by an independent third party, which provided a statistical analysis comparing the Fund’s investment performance, expenses, and fees to comparable mutual funds.
The disinterested Trustees were separately represented by independent legal counsel with respect to their consideration of the reapproval of the Investment Advisory Agreement. Prior to voting, the disinterested Trustees reviewed the proposed continuance of the Investment Advisory Agreement with management and also met in private sessions with their counsel at which no representatives of management were present.
In the course of its deliberations regarding the Investment Advisory Agreement, the Board considered the following factors, among others: the nature, extent and quality of the services provided by the Advisor, including the personnel providing such services; the Advisor’s financial condition; the level and method of computing the Fund’s advisory
www.calvert.com CALVERT SHORT-TERM GOVERNMENT FUND SEMI-ANNUAL REPORT (UNAUDITED) 26
fee; comparative performance, fee and expense information for the Fund; the profitability of the Calvert Group of Funds to the Advisor and its affiliates; the direct and indirect benefits, if any, derived by the Advisor and its affiliates from their relationship with the Fund; the effect of the Fund’s growth and size on the Fund’s performance and expenses; the affiliated distributor’s process for monitoring sales load breakpoints; the Advisor’s compliance programs and policies; the Advisor’s performance of substantially similar duties for other funds; and any possible conflicts of interest.
In considering the nature, extent and quality of the services provided by the Advisor under the Investment Advisory Agreement, the Board reviewed information provided by the Advisor relating to its operations and personnel, including, among other information, biographical information on the Advisor’s investment, supervisory and professional staff and descriptions of its organizational and management structure. The Board also took into account similar information provided periodically throughout the previous year by the Advisor as well as the Board’s familiarity with management through Board of Trustees’ meetings, discussions and other reports. The Board considered the Advisor’s management style and its performance in employing its investment strategies as well as its current level of staffing and overall resources. The Advisor’s administrative capabilities, including its ability to supervise the other service providers for the Fund, were also considered. The Board concluded that it was satisfied with the nature, extent and quality of services provided to the Fund by the Advisor under the Investment Advisory Agreement.
In considering the Fund’s performance, the Board noted that it reviewed on a quarterly basis detailed information about the Fund’s performance results, portfolio composition and investment strategies. In addition, the Board took into account overall financial market conditions. The Board also reviewed various comparative data provided to it in connection with its consideration of the renewal of the Investment Advisory Agreement, including, among other information, a comparison of the Fund’s total return with its Lipper index and with that of other mutual funds deemed to be in its peer group by an independent third party in its report. This comparison indicated that the Fund performed below the median of its peer group for the one- and three- year periods ended June 30, 2010. The data also indicated that the Fund underperformed its Lipper index for the one- and three-year periods ended June 30, 2010. The Board took into account management’s discussion of the Fund’s performance and its plans with respect to the Fund. Based upon its review, the Board concluded that appropriate action was being taken with respect to the Fund’s performance.
In considering the Fund’s fees and expenses, the Board compared the Fund’s fees and total expense ratio with various comparative data for the funds in its peer group. Among other findings, the data indicated that the Fund’s advisory fee (after taking into account waivers and/or reimbursements) was below the median of its peer group and that total expenses (net of waivers and/or reimbursements) were above the median of its peer group. The Board noted that the allocation of advisory and administrative fees may vary among the Fund’s peer group. The Board took into account the Advisor’s current undertaking to maintain expense limitations for the Fund’s shares. The Board also noted management’s discussion of the Fund’s expenses and certain factors that affected the level of such expenses. Based upon its review, the Board concluded that the advisory
www.calvert.com CALVERT SHORT-TERM GOVERNMENT FUND SEMI-ANNUAL REPORT (UNAUDITED) 27
fee was reasonable in view of the quality of services provided by the Advisor.
The Board reviewed the Advisor’s profitability on a fund-by-fund basis. In reviewing the overall profitability of the advisory fee to the Fund’s Advisor, the Board also considered the fact that affiliates of the Advisor provided shareholder servicing and administrative services to the Fund for which they received compensation. The information considered by the Board included Calvert’s operating profit margin information both before and after tax expenses with respect to the services that the Advisor and its affiliates provided to the Calvert Group of Funds complex. The Board reviewed the profitability of the Advisor’s relationship with the Fund in terms of the total amount of annual advisory fees it received with respect to the Fund and whether the Advisor had the financial wherewithal to continue to provide a high level of services to the Fund. The Board noted that the Advisor had reimbursed expenses of the Fund. The Board also noted the Advisor’s current undertaking to maintain expense limitations for the Fund’s shares. The Trustees also considered that the Advisor derived benefits to its reputation and other indirect benefits from its relationship with the Fund. Based upon its review, the Board concluded that the Advisor’s and its affiliates’ level of profitability from their relationship with the Fund was reasonable.
The Board considered the effect of the Fund’s current size and its potential growth on its performance and expenses. The Board concluded that adding breakpoints to the advisory fee at specified asset levels would not be appropriate at this time given the Fund’s current size. The Board noted that if the Fund’s assets increased over time, the Fund might realize other economies of scale if assets increased proportionally more than certain other expenses.
In reapproving the Investment Advisory Agreement, the Board, including the disinterested Trustees, did not identify any single factor as controlling, and each Trustee may have attributed different weight to various factors.
CONCLUSIONS
The Board reached the following conclusions regarding the Investment Advisory Agreement, among others: (a) the Advisor has demonstrated that it possesses the capability and resources to perform the duties required of it under the Investment Advisory Agreement; (b) the Advisor maintains appropriate compliance programs; (c) appropriate action is being taken with respect to the performance of the Fund; (d) the Advisor is likely to execute its investment strategies consistently over time; and (e) the Fund’s advisory fee is reasonable relative to those of similar funds and to the services to be provided by the Advisor. Based on its conclusions, the Board determined that reapproval of the Investment Advisory Agreement would be in the best interests of the Fund and its shareholders.
www.calvert.com CALVERT SHORT-TERM GOVERNMENT FUND SEMI-ANNUAL REPORT (UNAUDITED) 28
To Open an Account
800-368-2748
Yields and Prices
Calvert Information Network
(24 hours, 7 days a week)
800-368-2745
Service for Existing Account
Shareholders: 800-368-2745
Brokers: 800-368-2746
TDD for Hearing Impaired
800-541-1524
Branch Office
4550 Montgomery Avenue
Suite 1000 North
Bethesda, Maryland 20814
Registered, Certified or Overnight Mail
Calvert Investments
c/o BFDS,
330 West 9th Street
Kansas City, MO 64105
Web Site
www.calvert.com
Principal Underwriter
Calvert Investment Distributors, Inc.
4550 Montgomery Avenue
Suite 1000 North
Bethesda, Maryland 20814
| | |
| CALVERT | CALVERT’S | Equity Funds |
| SHORT-TERM | FAMILY OF FUNDS | Enhanced Equity Portfolio |
| GOVERNMENT | | Equity Portfolio |
| FUND | Tax-Exempt Money | Large Cap Growth Fund |
| | Market Funds | Large Cap Value Fund |
| | CTFR Money Market Portfolio | Social Index Fund |
| | | Capital Accumulation Fund |
| | Taxable Money Market | International Equity Fund |
| | Funds | Small Cap Fund |
| | First Government Money Market | Global Alternative Energy Fund |
| | Fund | Global Water Fund |
| | Money Market Portfolio | International Opportunities Fund |
| |
| | Municipal Funds | Balanced and Asset |
| | Tax-Free Bond Fund | Allocation Funds |
| | | Balanced Portfolio |
| | Taxable Bond Funds | Conservative Allocation Fund |
| | Bond Portfolio | Moderate Allocation Fund |
| | Income Fund | Aggressive Allocation Fund |
| | Short Duration Income Fund | |
| | Long-Term Income Fund | |
| | Ultra-Short Income Fund | |
| | Government Fund | |
| | Short-Term Government Fund | |
| | High-Yield Bond Fund | |
This report is intended to provide fund information to shareholders. It is not authorized for distribution to prospective investors unless preceded or accompanied by a prospectus.
Note: The information on our website is not incorporated by reference into this report; our website address is included as an inactive textual reference only.
Investors should carefully consider the investment objectives, risks, charges and expenses of the Calvert Funds. This and other important information is contained in the fund’s summary prospectus and prospectus, which can be obtained from your financial professional and should be read carefully before investing. You may also call Calvert at 800/368-2745 or visit www. calvert.com.
Item 2. Code of Ethics.
Not applicable.
Item 3. Audit Committee Financial Expert.
Not applicable.
Item 4. Principal Accountant Fees and Services.
Not applicable.
Item 5. Audit Committee of Listed Registrants.
Not applicable.
Item 6. Schedule of Investments.
(a) This Schedule is included as part of the report to shareholders filed under Item 1 of this Form.
(b) Not applicable.
Item 7. Disclosure of Proxy Voting Policies and Procedures for Closed-End Management Investment Companies.
Not applicable.
Item 8. Portfolio Managers of Closed-End Management Investment Companies.
Not applicable.
Item 9. Purchases of Equity Securities by Closed-End Management Investment Company and Affiliated Purchasers.
Not applicable.
Item 10. Submission of Matters to a Vote of Security Holders.
No material changes to the procedures by which shareholders may recommend nominees to the registrant’s Board of Trustees since registrant last provided disclosure in response to this Item.
Item 11. Controls and Procedures.
(a) The principal executive and financial officers concluded that the registrant's disclosure controls and procedures (as defined in Rule 30a-3(c) under the 1940 Act) are effective, based on the evaluation of these controls and procedures required by Rule 30a-3(b) under the 1940 Act and Rules 13a-15(b) or 15d-15(b) under the Exchange Act, as of a date within 90 days of the filing date of this report.
(b) There was no change in the registrant's internal control over financial reporting (as defined in Rule 30a-3(d) under the 1940 Act) that occurred during the registrant's second fiscal quarter of the period covered by this report that has materially affected, or is reasonably likely to materially affect, the registrant's internal control over financial reporting.
Item 12. Exhibits.
(a)(1) Not applicable.
(a)(2) A separate certification for each principal executive officer and principal financial officer of the registrant as required by Rule 30a-2 under the Act (17 CFR 270.30a-2).
Attached hereto.
(a)(3) Not applicable.
(b) A certification for the registrant's Principal Executive Officer and Principal Financial Officer, as required by Rule 30a-2(b) under the Investment Company Act of 1940, is attached hereto. The certification furnished pursuant to this paragraph is not deemed to be "filed" for purposes of Section 18 of the Securities Exchange Act of 1934, or otherwise subject to the liability of that section. Such certification is not deemed to be incorporated by reference into any filing under the Securities Act of 1933 or the Securities Exchange Act of 1934, except to the extent that the registrant specifically incorporates it by reference.
Pursuant to the requirements of the Securities Exchange Act of 1934 and the Investment Act of 1940, the registrant has duly caused this report to be signed on its behalf by the undersigned, thereunto duly authorized.
THE CALVERT FUND
By: /s/ Barbara J. Krumsiek
Barbara J. Krumsiek
President -- Principal Executive Officer
Date: June 2, 2011
Pursuant to the requirements of the Securities Exchange Act of 1934 and the Investment Act of 1940, this report has been signed below by the following persons on behalf of the registrant and in the capacities and on the dates indicated.
/s/ Barbara J. Krumsiek
Barbara J. Krumsiek
President -- Principal Executive Officer
Date: June 2, 2011
/s/ Ronald M. Wolfsheimer
Ronald M. Wolfsheimer
Treasurer -- Principal Financial Officer
Date: June 2, 2011