UNITED STATES
SECURITIES AND EXCHANGE COMMISSION
Washington, D.C. 20549
FORM N-CSR
CERTIFIED SHAREHOLDER REPORT OF REGISTERED
MANAGEMENT INVESTMENT COMPANIES
Investment Company Act file number: 811-03416
THE CALVERT FUND
(Exact name of registrant as specified in charter)
4550 Montgomery Avenue
Suite 1000N
Bethesda, Maryland 20814
(Address of Principal Executive Offices)
Ivy Wafford Duke, Esq.
4550 Montgomery Avenue
Suite 1000N
Bethesda, Maryland 20814
(Name and Address of Agent for Service)
Registrant's telephone number, including area code: (301) 951-4800
Date of fiscal year end: September 30
Date of reporting period: Six months ended March 31, 2015
Item 1. Report to Stockholders.
[Calvert Income Fund Semi-Annual Report to Shareholders]
[Calvert Short-Duration Income Fund Semi-Annual Report to Shareholders]
[Calvert Long-Term Income Fund Semi-Annual Report to Shareholders]
[Calvert Ultra-Short Income Fund Semi-Annual Report to Shareholders]
[Calvert Government Fund Semi-Annual Report to Shareholders]
[Calvert High-Yield Bond Fund Semi-Annual Report to Shareholders]
|
| |
Semi-Annual Report March 31, 2015
E-Delivery Sign-Up — Details Inside | |
Choose Planet-friendly E-delivery!
Sign up now for on-line statements, prospectuses, and fund reports. In less than five minutes you can help reduce paper mail and lower fund costs.
Just go to www.calvert.com. If you already have an online account at Calvert, click on Login, to access your Account, and select the documents you would like to receive via e-mail.
If you’re new to online account access, click on Login, then Register to create your user name and password. Once you’re in, click on the E-delivery sign-up on the Account Portfolio page and follow the quick, easy steps.
Note: if your shares are not held directly at Calvert but through a brokerage firm, you must contact your broker for electronic delivery options available through their firm.
|
| | | |
| TABLE OF CONTENTS |
| | | | |
| | | | President's Letter |
| | | | Portfolio Management Discussion |
| | | | Shareholder Advocacy Update |
| | | | Shareholder Expense Example |
| | | | Statement of Net Assets |
| | | | Statement of Operations |
| | | | Statements of Changes in Net Assets |
| | | | Notes to Financial Statements |
| | | | Financial Highlights |
| | | | Explanation of Financial Tables |
| | | | Proxy Voting |
| | | | Availability of Quarterly Portfolio Holdings |
| | | | Basis for Board’s Approval of Investment Advisory Contract |
|
| |
| John Streur President and Chief Executive Officer, Calvert Investments, Inc. |
Dear Calvert Shareowner,
The United States economy improved throughout 2014 and into the first quarter of 2015, while major economies in other regions of the world struggled to regain momentum or saw slowing growth. It is still too early to declare victory, but one may say that while the United States led the world into financial crisis nearly eight years ago, the innovative and aggressive responses to the crisis by our policymakers are allowing the United States to recover more quickly. Granted, the United States has the benefit of possessing the world’s reserve currency and our monetary maneuvers in our self-interest are not without cost to economies in other regions.
As 2014 drew to a close, the United States was winding down the quantitative easing portion of its post-crisis monetary policy while the European and Japanese central banks were finding it necessary to increase their own forms of quantitative easing in efforts to support asset prices and spur economic growth.
The impact of modestly improving economic activity in the U.S. and ongoing low global interest rates on financial assets in 2014 created positive returns for most stocks and bonds for the previous 12 months, a condition that gave benefit to most Calvert Funds. The exceptions are assets tied to the price of oil, which collapsed during the second half of the year. Energy industries and natural resource based companies, including renewable energy companies and water related companies, saw their stock valuations drop in reaction.
Across our fixed income and equity strategies, Calvert finds more utility in conducting fundamental research in order to find relative values in securities of individual companies than we do in attempting to anticipate or time changes in global economic indicators. Broadly, we are mindful of the fact that stocks and bonds have benefitted substantially from the easy monetary policies and ultra-low interest rates of the post-crisis era. We believe markets are more or less fairly valued and we have taken steps seeking to moderate the risk across our portfolios.
As I take the helm at Calvert and look back at the 39 years since the firm’s founding in 1976, I note the substantial growth in the world’s population, the massive increase in the industrialization of our global society, and the associated change in the role of corporations in societal and environmental outcomes for our future.
4 www.calvert.com CALVERT INCOME FUND SEMI-ANNUAL REPORT (UNAUDITED)
Public companies have created tremendous net benefits to society through advances in health care, food systems, energy efficiency, communications and technology, and access to finance and other products and services too vast to detail. Hundreds of millions of people throughout the world have seen their standard of living increased through benefits created by corporate activity.
Along with the obvious net benefits to society, we are aware of the substantial stresses placed upon society and the environment from corporate behaviors. At the same time, society has awarded corporations an increasingly prominent role in the day-to-day outcomes of our lives and in the societal and environmental outcomes that will determine the future direction of the world.
Calvert, as a global investment management firm and a steward of client assets, has a growing and evolving role as a leader in responsible investing. Calvert has a rich history as a socially responsible investor and has made many contributions to public policy and corporate governance. Today we are bringing Calvert’s deep expertise in socially responsible investing, public and private policy work, and investment management to a new level with a focus on developing principles and setting standards for use in our investment management processes, our active ownership and engagement discipline and within our investment risk management processes.
As a long-term investor with unique insights into environmental, social, and governance activities of companies throughout the world, Calvert is able to develop a holistic view of companies’ operations. Our ability to use our insights for the benefit of the stewardship of client assets, both to produce desirable investment outcomes for our clients and to assist companies in evolving their role in society along a responsible path has never been more important.
As fellow shareowners of Calvert Funds, you and I know that it is essential to pursue the type of enduring value that Calvert seeks to create, through excellence in financial results balanced with the evolving needs of society and the environment.
Thank you for your share ownership in Calvert Funds; all of us at Calvert Investments, Inc. appreciate the confidence and trust you have placed in us.
John Streur
April 2015
www.calvert.com CALVERT INCOME FUND SEMI-ANNUAL REPORT (UNAUDITED) 5
|
| |
| PORTFOLIO MANAGEMENT DISCUSSION |
|
| |
| Catherine Roy, CFA Senior Vice President and Chief Investment Officer, Fixed Income |
Investment Climate
A very divergent economic picture between the United States and much of the rest of the world prompted central bank actions that affected global currencies and drove financial-market returns over the six-month reporting period. The markets also reacted to new information on key geopolitical situations, notably in the Ukraine.
The economic divergence theme was apparent in Europe, which featured consumer price deflation in many countries. China and Japan also experienced slower growth. In the United States, economic growth pulled back from the strong pace set in mid-2014 to a rate more in line with the Fed’s projected long-run average of 2.2%. While modest, this growth rate was superior to that of many other countries. The U.S. headline Consumer Price Index, which measures inflation excluding volatile food and energy prices, became slightly negative towards the end of the reporting period.
In January, the European Central Bank (ECB) announced a long-awaited quantitative easing program, which had significant market impact. In anticipation of the January ECB decision, some other European central banks, as well as Japan and China, increased monetary accommodation through interest-rate cuts and/or expanded bond purchase programs. In stark contrast, the U.S. Federal Reserve prepared markets for a small and slow series of interest-rate increases, slated to start sometime in 2015. The Fed anticipates that extremely low domestic inflation will be transitory, driven by the drop in energy prices, and is not a problem brought on by lack of consumer demand. In addition, the U.S. labor market is relatively strong, which has long been one condition the Fed required to start a slow removal of monetary accommodation.
Big moves in the world’s major currencies were a byproduct of these central bank actions. In the middle of 2014, the U.S. dollar began a sharp climb against other currencies that drove it to multi-year highs. The Bloomberg DXY, an index that measures the dollar against major currencies, appreciated 14.5% over the six-month reporting period. Tightly correlated to the dollar’s rally was a sharp drop in the price of oil—a market set up for a price collapse due to a massive demand-supply imbalance.
Bonds Provided Positive Returns
The global fixed-income markets generally reacted positively to the ECB-led central bank easing. U.S. bond yields gyrated over the reporting period, but at the end tended to be lower and so bond returns were positive.
6 www.calvert.com CALVERT INCOME FUND SEMI-ANNUAL REPORT (UNAUDITED)
|
| | | | |
| | | | |
| | CALVERT
INCOME FUND | |
| | MARCH 31, 2015 | |
| | | | |
| | ECONOMIC SECTORS | % OF TOTAL INVESTMENTS | |
| | Corporate | 68.8 | % | |
| | Financial Institutions | 19.8 | % | |
| | Industrial | 48.3 | % | |
| | Utility | 0.7 | % | |
| | Government Related | 0.2 | % | |
| | Supranational | 0.2 | % | |
| | Municipal | 0.3 | % | |
| | Utility | 0.3 | % | |
| | Securitized | 21.6 | % | |
| | Asset-Backed Securities | 13.3 | % | |
| | Commercial Mortgage- Backed Securities | 6.9 | % | |
| | Mortgage-Backed Pass- Through | 1.4 | % | |
| | Short-Term Investments | 0.9 | % | |
| | Treasury | 8.2 | % | |
| | Total | 100 | % | |
| | | | |
The ten-year T-note yield fell 58 basis points1 (bps) to 1.94%, while the 30-year fixed-rate mortgage average fell 50 bps to 3.69%. The Barclays U.S. Credit Index average yield declined 18 bps to 2.83%.
In terms of total return, the Barclays Long Credit Index rose 7.24%, the broad intermediate Barclays U.S. Credit Index returned 3.96%, and the shorter-term Barclays 1-5 Year U.S. Credit Index was up 1.48%. The Barclays US Aggregate Index returned 3.43% and the Bank of America Merrill Lynch High Yield Master II Index was little changed, up 1.45%.
Outlook
The United States economy is expanding moderately and has weathered global weakness better than other most other major economies. The 5.5% headline unemployment rate is just above the Federal Open Market Commission’s (FOMC)
|
| | | | | | |
| | | | | |
| | CALVERT
INCOME FUND | |
| | MARCH 31, 2015 | |
| | | | | |
| | INVESTMENT PERFORMANCE | |
| | (TOTAL RETURN AT NAV*) | |
| | | 6 MONTHS ENDED 3/31/15 | 12 MONTHS ENDED 3/31/15
| |
| | Class A | 2.83 | % | 4.60 | % | |
| | Class B | 2.47 | % | 3.60 | % | |
| | Class C | 2.55 | % | 3.87 | % | |
| | Class I | 3.21 | % | 5.21 | % | |
| | Class R | 2.78 | % | 4.30 | % | |
| | Class Y | 3.07 | % | 4.96 | % | |
| | | | | |
| | Barclays U.S. Credit Index | 3.96 | % | 6.74 | % | |
| | | | | |
| | Lipper BBB-Rated Corporate Debt Funds Average | 3.78 | % | 6.75 | % | |
| | | | | |
| | | 30 DAYS ENDED | |
| | SEC YIELD | 3/31/15 | 9/30/14 | |
| | Class A | 2.10 | % | 2.35 | % | |
| | Class B | 1.34 | % | 1.10 | % | |
| | Class C | 1.33 | % | 1.96 | % | |
| | Class I | 2.81 | % | 3.28 | % | |
| | Class R | 2.00 | % | 2.33 | % | |
| | Class Y | 2.51 | % | 2.95 | % | |
| | | |
| | * Investment performance/return at NAV does not reflect the deduction of the Fund’s maximum 3.75% front-end sales charge or any deferred sales charge. | |
| | | | | |
long-term target range. Wage growth is modest but steady. The labor-force participation rate, however, remains low—influenced by demographics and the long-term loss of traditional middle-wage jobs to overseas competition and automation. Workers in general, however, are in improved bargaining positions. The Fed’s benchmark consumer inflation rate hovers around zero, sharply below the 2% target.
www.calvert.com CALVERT INCOME FUND SEMI-ANNUAL REPORT (UNAUDITED) 7
Despite another cold winter, U.S. economic growth in 2015 could approach 3% in the absence of a material systemic shock. We expect inflation to continue well below the Fed’s 2% target. Improvement in the labor market should continue, with unemployment below 5.5%. Discord on Capitol Hill promises to add some uncertainty to late-summer debt-ceiling negotiations. Household consumption remains the major engine of growth and should be supported by lower energy prices. Lower energy prices, however, are likely to depress earnings and investment from energy-industry companies and the much-stronger dollar may dampen overall U.S. corporate earnings. Housing-sector activity remains a disappointment, despite very low mortgage rates, and residential mortgage lending remains relatively restrained in the post-crisis market. The U.S. trade situation may deteriorate given continued strength of the dollar, which could drive up import costs.
If U.S. data trends hold, within the context of the global backdrop of disinflation and central bank easing, we expect the Fed to raise short-term interest rates by late 2015. If lift-off is in 2015, however, we expect no more than two quarter-point increases over the balance of the year. If the weaker global picture and price disinflation persist, there is a reasonable chance the Fed will delay any rate increases into 2016.
Over the longer term, we expect the benchmark 10-year T-note yield to fluctuate between 2% and 3%, influenced by the trend in economic data surprises, major central bank forward guidance, expected low global inflation rates, and flows in global fixed-income markets. We expect short-term money markets rates to remain close to zero percent for much of 2015.
Calvert Investment Management, Inc.
April 2015
1. A basis point is 0.01 percentage points.
|
| | | | |
| | | | |
| | CALVERT
INCOME FUND | |
| | MARCH 31, 2015 | |
| | | | |
| | AVERAGE ANNUAL TOTAL RETURNS | |
| | | | |
| | CLASS A SHARES | (WITH MAX. LOAD) | |
| | One year | 0.65 | % | |
| | Five year | 3.46 | % | |
| | Ten year | 3.52 | % | |
| | | | |
| | CLASS B SHARES | (WITH MAX. LOAD) | |
| | One year | -0.40 | % | |
| | Five year | 3.38 | % | |
| | Ten year | 3.05 | % | |
| | | | |
| | CLASS C SHARES | (WITH MAX. LOAD) | |
| | One year | 2.87 | % | |
| | Five year | 3.53 | % | |
| | Ten year | 3.19 | % | |
| | | | |
| | CLASS I SHARES | | |
| | One year | 5.21 | % | |
| | Five year | 4.93 | % | |
| | Ten year | 4.59 | % | |
| | | | |
| | CLASS R SHARES* | | |
| | One year | 4.30 | % | |
| | Five year | 4.05 | % | |
| | Ten year | 3.72 | % | |
| | | | |
| | CLASS Y SHARES** | | |
| | One year | 4.96 | % | |
| | Five year | 4.63 | % | |
| | Ten year | 4.19 | % | |
| | | | |
| | * Performance results for Class R shares prior to October 31, 2006 reflect the performance of Class A shares at net asset value (NAV). Actual Class R share performance would have been lower than Class A share performance because of higher Rule 12b-1 fees and other class-specific expenses that apply to the Class R shares. ** Performance for Class Y Shares prior to February 29, 2008 reflects the performance of Class A shares at net asset value (NAV). Actual Class Y share performance would have been different. | |
| | | | |
8 www.calvert.com CALVERT INCOME FUND SEMI-ANNUAL REPORT (UNAUDITED)
Growth of $10,000
The graph below shows the value of a hypothetical $10,000 investment in the Fund over the past 10 fiscal year periods. The results shown are for Class A shares and reflect the deduction of the maximum front-end Class A sales charge of 3.75%, and assume the reinvestment of dividends. The result is compared with benchmarks that include a broad based market index and a Lipper peer group average. Market indexes are unmanaged and their results do not reflect the effect of expenses or sales charges. The Lipper average reflects the deduction of the category’s average front-end sales charge. The value of an investment in a different share class would be different.
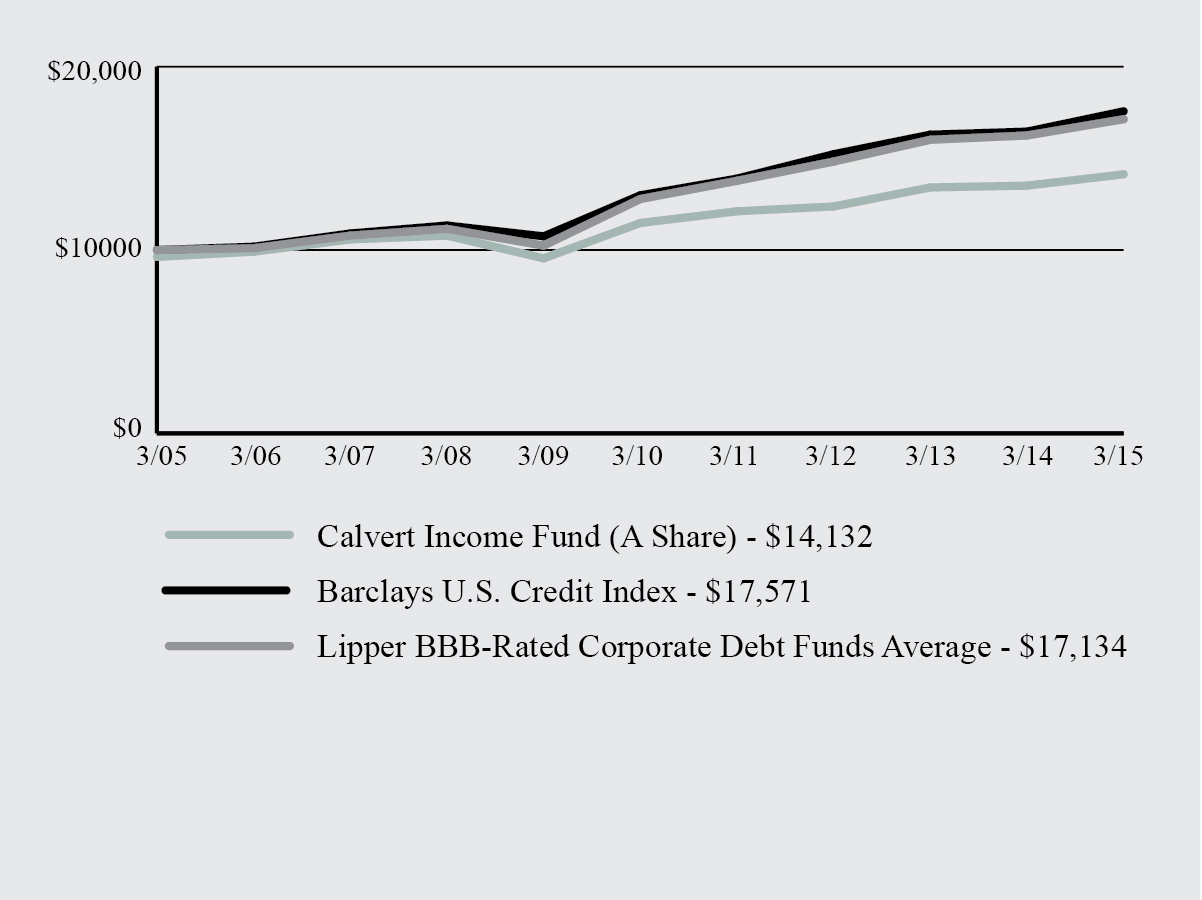
All performance data shown, including the graph above and the adjacent table, represents past performance, does not guarantee future results, assumes reinvestment of dividends and distributions and does not reflect the deduction of taxes that a shareholder would pay on the Fund’s distributions or the redemption of the Fund shares. All performance data reflects fee waivers and/or expense limitations, if any are in effect; in their absence performance would be lower. See Note B in Notes to Financial Statements. The investment return and principal value of an investment will fluctuate so that an investor’s shares, when redeemed, may be worth more or less than their original cost. Current performance may be lower or higher than the performance data quoted; for current performance data visit www.calvert.com. The gross expense ratio from the current prospectus for Class A shares is 1.25%. This number may differ from the expense ratio shown elsewhere in this report because it is based on a different time period and, if applicable, does not include fee or expense waivers. Performance data quoted already reflects the deduction of the Fund’s operating expenses.
www.calvert.com CALVERT INCOME FUND SEMI-ANNUAL REPORT (UNAUDITED) 9
SHAREHOLDER ADVOCACY UPDATE
2014 Corporate Diversity Report Findings Released
In March, Calvert published its 2014 survey findings on the corporate diversity practices of the largely multinational companies that make up the Standard & Poor’s 100 Index (S&P 100), in follow-up to reports published in 2012 and 2010. Calvert believes companies that fully commit to providing a fair and equitable working environment will recognize gains in both the workplace and marketplace.
Key findings from the 2014 survey include:
| |
| • | Milestone for women in the board room. In 2014, every company in the S&P 100 had at least one woman on its board of directors. In addition, there was a 17% increase in companies with three or more women and/or minorities on their boards. |
| |
| • | Diversity commitment on the rise. In the past two years, top scores related to overall corporate commitment have increased by 45%.This stems primarily from greater board oversight of diversity initiatives and increased CEO and/or chair involvement. |
| |
| • | LGBT policies have advanced overall. However, initiatives for persons with disabilities continue to fall behind other groups. |
Overall, in 2014, we saw growing commitment to women and minority employees, momentum around family-friendly work environments, and accelerated progress in support of LGBT employees. Looking ahead, we hope to see enhanced corporate diversity commitments, greater representation of women and minorities on boards, improved EEO1-disclosure, and expanded diversity initiatives for persons with disabilities.
To learn the highest- and lowest-rated companies in the report, A Survey of Corporate Diversity Practices of the S&P 100, and to find out more about the report’s methodology and findings, visit www.calvert.com.
2015 Shareholder Resolutions
Building on our initiatives from 2014, Calvert was the lead filer on 38 shareholder resolutions for the 2015 proxy season, and co-filer on another 18 proposals. Key topics include “big data” and civil rights issues, sustainability reporting, board of director oversight of environmental and social matters, water risk, climate change and greenhouse gas emissions reductions, supply chain labor issues, and board diversity.
Specifically, Calvert asked 14 companies to set a goal and a timeline for reducing their greenhouse gas emissions and filed seven proposals asking companies to issue a sustainability report describing their environmental, social and governance (ESG) performance and goals. To push for improved boardroom diversity, Calvert filed six proposals with companies requesting they report on their plans to increase minority and women Board representation and assess the effectiveness of these efforts. We also filed seven proposals requesting that companies assess and manage the civil rights’ risks related to their use of big data, which refers to data sets so large or complex that traditional data processing applications are inadequate. We also filed proposals on water risk in the agricultural supply chain and on developing a sustainable agriculture policy.
To keep abreast of the outcomes of these 2015 shareholder resolutions, as well as Calvert’s proxy voting and public policy initiatives, visit the “Resources” section on www.calvert.com.
10 www.calvert.com CALVERT INCOME FUND SEMI-ANNUAL REPORT (UNAUDITED)
SHAREHOLDER EXPENSE EXAMPLE
As a shareholder of the Fund, you incur two types of costs: (1) transaction costs, including sales charges (loads) and redemption fees; and (2) ongoing costs, including management fees; distribution (12b-1) fees; and other Fund expenses. This Example is intended to help you understand your ongoing costs (in dollars) of investing in the Fund and to compare these costs with the ongoing costs of investing in other mutual funds.
This Example is based on an investment of $1,000 invested at the beginning of the period and held for the entire period (October 1, 2014 to March 31, 2015).
Actual Expenses
The first line of the table below provides information about actual account values and actual expenses. You may use the information in this line, together with the amount you invested, to estimate the expenses that you paid over the period. Simply divide your account value by $1,000 (for example, an $8,600 account value divided by $1,000 = 8.6), then multiply the result by the number in the first line under the heading entitled “Expenses Paid During Period” to estimate the expenses you paid on your account during this period.
Hypothetical Example for Comparison Purposes
The second line of the table below provides information about hypothetical account values and hypothetical expenses based on the Fund’s actual expense ratio and an assumed rate of return of 5% per year before expenses, which is not the Fund’s actual return. The hypothetical account values and expenses may not be used to estimate the actual ending account balance or expenses you paid for the period. You may use this information to compare the ongoing costs of investing in the Fund and other funds. To do so, compare the 5% hypothetical example with the 5% hypothetical examples that appear in the shareholder reports of the other funds.
Please note that the expenses shown in the table are meant to highlight your ongoing costs only and do not reflect any transactional costs, such as sales charges (loads), or redemption fees. Therefore, the second line of the table is useful in comparing ongoing costs only, and will not help you determine the relative total costs of owning different funds. In addition, if these transactional costs were included, your costs would have been higher.
www.calvert.com CALVERT INCOME FUND SEMI-ANNUAL REPORT (UNAUDITED) 11
|
| | | |
| | BEGINNING ACCOUNT VALUE 10/1/14 | ENDING ACCOUNT VALUE 3/31/15 | EXPENSES PAID DURING PERIOD* 10/1/14 - 3/31/15 |
CLASS A | | | |
| Actual | $1,000.00 | $1,028.31 | $6.47 |
| Hypothetical | $1,000.00 | $1,018.55 | $6.44 |
| (5% return per year before expenses) | | | |
| | | | |
CLASS B | | | |
| Actual | $1,000.00 | $1,024.73 | $10.75 |
| Hypothetical | $1,000.00 | $1,014.31 | $10.70 |
| (5% return per year before expenses) | | | |
| | | | |
CLASS C | | | |
| Actual | $1,000.00 | $1,025.47 | $9.82 |
| Hypothetical | $1,000.00 | $1,015.23 | $9.77 |
| (5% return per year before expenses) | | | |
| | | | |
CLASS I | | | |
| Actual | $1,000.00 | $1,032.09 | $3.29 |
| Hypothetical | $1,000.00 | $1,021.70 | $3.27 |
| (5% return per year before expenses) | | | |
| | | | |
CLASS R | | | |
| Actual | $1,000.00 | $1,027.77 | $7.43 |
| Hypothetical | $1,000.00 | $1,017.60 | $7.39 |
| (5% return per year before expenses) | | | |
| | | | |
CLASS Y | | | |
| Actual | $1,000.00 | $1,030.75 | $4.46 |
| Hypothetical | $1,000.00 | $1,020.54 | $4.44 |
| (5% return per year before expenses) | | | |
| | | | |
* Expenses are equal to the Fund’s annualized expense ratio of 1.28%, 2.13%, 1.95%, 0.65%, 1.47% and 0.88% for Class A, Class B, Class C, Class I, Class R, and Class Y, respectively, multiplied by the average account value over the period, multiplied by 182/365 (to reflect the one-half year period).
|
12 www.calvert.com CALVERT INCOME FUND SEMI-ANNUAL REPORT (UNAUDITED)
STATEMENT OF NET ASSETS
MARCH 31, 2015
|
| | | | | | |
ASSET-BACKED SECURITIES - 14.7% | PRINCIPAL AMOUNT | VALUE |
| | | |
| ALM XII Ltd., 3.449%, 4/16/27 (e)(r) |
| $3,400,000 |
|
| $3,363,620 |
|
| American Homes 4 Rent: | | |
| 3.50%, 6/17/31 (e)(r) | 3,000,000 |
| 2,959,749 |
| 4.705%, 10/17/36 (e) | 2,400,000 |
| 2,560,390 |
| 4.596%, 12/17/36 (e) | 2,950,000 |
| 3,121,652 |
| Applebee’s Funding LLC / IHOP Funding LLC, 4.277%, 9/5/44 (e) | 3,050,000 |
| 3,156,890 |
| Avis Budget Rental Car Funding AESOP LLC, 3.04%, 3/20/19 (e) | 4,820,000 |
| 4,803,395 |
| CKE Restaurant Holdings, Inc., 4.474%, 3/20/43 (e) | 4,850,000 |
| 5,007,281 |
| Consumer Credit Origination Loan Trust, 2.82%, 3/15/21 (e) | 4,772,315 |
| 4,789,819 |
| DB Master Finance LLC, 3.98%, 2/20/45 (e) | 2,500,000 |
| 2,553,150 |
| Eagle I Ltd., 2.57%, 12/15/39 (e) | 3,750,000 |
| 3,744,750 |
| Element Rail Leasing I LLC: | | |
| 2.299%, 4/19/44 (e) | 1,208,457 |
| 1,203,464 |
| 3.668%, 4/19/44 (e) | 2,700,000 |
| 2,752,744 |
| 4.406%, 4/19/44 (e) | 2,783,000 |
| 2,850,911 |
| Element Rail Leasing II LLC, 3.585%, 2/19/45 (e) | 3,900,000 |
| 3,942,510 |
| FRS I LLC, 3.08%, 4/15/43 (e) | 5,976,435 |
| 6,020,182 |
| GLC II Trust, 4.00%, 12/18/20 (e) | 3,931,808 |
| 3,953,433 |
| GLC Trust, 3.00%, 7/15/21 (e) | 3,107,249 |
| 3,104,141 |
| Global SC Finance II SRL, 2.98%, 4/17/28 (e) | 2,748,333 |
| 2,757,713 |
| GMAT Trust, 3.721%, 2/25/44 (e)(r) | 2,189,192 |
| 2,185,919 |
| Hilton Grand Vacations Trust, 2.28%, 1/25/26 (e) | 1,246,624 |
| 1,257,416 |
| HOA Funding LLC, 4.846%, 8/20/44 (e) | 4,752,000 |
| 4,763,880 |
| Invitation Homes Trust: | | |
| 1.60%, 12/17/30 (e)(r) | 300,000 |
| 297,875 |
| 2.273%, 6/17/31 (e)(r) | 2,500,000 |
| 2,510,095 |
| 3.878%, 6/17/32 (e)(r) | 1,750,000 |
| 1,750,000 |
| JGWPT XXXI LLC, 4.94%, 3/16/65 (e) | 1,000,000 |
| 1,066,482 |
| JGWPT XXXII LLC, 4.48%, 1/15/75 (e) | 1,450,000 |
| 1,484,249 |
|
| Navient Student Loan Trust, 1.714%, 7/25/52 (r) | 1,200,000 |
| 1,112,720 |
|
| OneMain Financial Issuance Trust, 2.43%, 6/18/24 (e) | 7,400,000 |
| 7,411,174 |
|
| Oxford Finance Funding Trust, 3.475%, 12/15/22 (e) | 2,600,000 |
| 2,602,860 |
|
| Selene Non-Performing Loans LLC, 2.981%, 5/25/54 (e)(r) | 2,806,496 |
| 2,778,552 |
|
| SLM Private Education Loan Trust, 3.00%, 5/16/44 (e) | 2,700,000 |
| 2,661,355 |
|
| SoFi Professional Loan Program LLC, 2.55%, 8/27/29 (e) | 3,828,118 |
| 3,850,750 |
|
| STORE Master Funding LLC, 4.21%, 4/20/44 (e) | 2,887,917 |
| 2,984,662 |
|
| TAL Advantage V LLC: | | |
| 3.33%, 5/20/39 (e) | 3,123,394 |
| 3,171,422 |
|
| 3.97%, 5/20/39 (e) | 916,667 |
| 909,112 |
|
| 3.27%, 11/21/39 (e) | 2,513,333 |
| 2,559,099 |
|
| 4.15%, 11/21/39 (e) | 966,667 |
| 980,143 |
|
| Trinity Rail Leasing LP, 3.525%, 1/15/43 (e) | 3,000,000 |
| 3,029,400 |
|
| US Residential Opportunity Fund Trust, 3.721%, 1/27/35 (e) | 1,979,162 |
| 1,985,764 |
|
| VOLT XIX LLC, 3.875%, 4/25/55 (e)(r) | 5,788,728 |
| 5,810,529 |
|
www.calvert.com CALVERT INCOME FUND SEMI-ANNUAL REPORT (UNAUDITED) 13
|
| | | | | | |
ASSET-BACKED SECURITIES - CONT’D | PRINCIPAL AMOUNT | VALUE |
| | | |
| VOLT XXVII LLC: | | |
| 3.375%, 8/27/57 (e)(r) |
| $2,185,687 |
|
| $2,186,859 |
|
| 4.75%, 8/27/57 (e)(r) | 800,000 |
| 792,978 |
|
| | | |
| Total Asset-Backed Securities (Cost $121,578,878) | | 122,789,089 |
|
| | | |
| | | |
COLLATERALIZED MORTGAGE-BACKED OBLIGATIONS (PRIVATELY ORIGINATED) - 1.9% | | |
| Banc of America Mortgage Trust, 0.301%, 1/25/34 (r) | 18,717,132 |
| 76,459 |
|
| CAM Mortgage Trust: | | |
| 4.45%, 5/15/48 (e)(r) | 3,500,000 |
| 3,512,215 |
|
| 5.50%, 12/15/53 (e)(r) | 404,107 |
| 404,374 |
|
| Fannie Mae Connecticut Avenue Securities: | | |
| CAS 2014-C02 1M2, 2.774%, 5/25/24 (r) | 6,980,000 |
| 6,378,324 |
|
| CAS 2014-C03 1M2, 3.174%, 7/25/24 (r) | 2,000,000 |
| 1,881,648 |
|
| CAS 2014-C03 2M2, 3.074%, 7/25/24 (r) | 1,500,000 |
| 1,402,097 |
|
| CAS 2015-C01 1M2, 4.474%, 2/25/25 (r) | 1,950,000 |
| 1,986,876 |
|
| | | |
Total Collateralized Mortgage-Backed Obligations (Privately Originated) (Cost $16,232,170) | | 15,641,993 |
|
| | | |
| | | |
COMMERCIAL MORTGAGE-BACKED SECURITIES - 4.9% | | |
| Citigroup Commercial Mortgage Trust, 3.575%, 9/15/17 (e)(r) | 2,800,000 |
| 2,737,280 |
|
| CSMC Trust, 4.185%, 9/15/37 (e) | 1,800,000 |
| 1,941,214 |
|
| EQTY INNS Mortgage Trust, 3.625%, 5/8/31 (e)(r) | 4,700,000 |
| 4,688,433 |
|
| Extended Stay America Trust: | | |
| 3.604%, 12/5/31 (e) | 2,970,000 |
| 3,093,026 |
|
| 5.053%, 12/5/31 (e)(r) | 1,765,000 |
| 1,833,770 |
|
| Hilton USA Trust: | | |
| 3.714%, 11/5/30 (e) | 1,600,000 |
| 1,633,723 |
|
| 5.222%, 11/5/30 (e)(r) | 3,500,000 |
| 3,595,051 |
|
| JP Morgan Chase Commercial Mortgage Securities Trust: | | |
| 3.771%, 6/10/27 (e) | 2,200,000 |
| 2,282,313 |
|
| 3.805%, 6/10/27 (e)(r) | 1,500,000 |
| 1,517,436 |
|
| 3.775%, 6/15/29 (e)(r) | 3,500,000 |
| 3,495,782 |
|
| Morgan Stanley Capital I Trust, 3.446%, 7/13/29 (e)(r) | 1,700,000 |
| 1,661,670 |
|
| Motel 6 Trust, 5.279%, 2/5/30 (e) | 2,100,000 |
| 2,103,217 |
|
| ORES NPL LLC: | | |
| 6.00%, 3/27/24 (e) | 2,600,000 |
| 2,600,000 |
|
| 3.081%, 9/25/25 (e) | 846,510 |
| 844,393 |
|
| VFC LLC, 5.50%, 7/20/30 (e) | 3,000,000 |
| 2,999,445 |
|
14 www.calvert.com CALVERT INCOME FUND SEMI-ANNUAL REPORT (UNAUDITED)
|
| | | | | | |
COMMERCIAL MORTGAGE-BACKED SECURITIES - CONT'D | PRINCIPAL AMOUNT | VALUE |
| | | |
| WFRBS Commercial Mortgage Trust: | | |
| 3.497%, 8/15/47 (e) |
| $1,400,000 |
|
| $1,211,599 |
|
| 4.234%, 8/15/47 (r) | 2,200,000 |
| 2,275,167 |
|
| | | |
| Total Commercial Mortgage-Backed Securities (Cost $40,108,860) | | 40,513,519 |
|
| | | |
| | | |
CORPORATE BONDS - 68.9% | | |
| | | |
| 21st Century Fox America, Inc., 5.40%, 10/1/43 | 1,500,000 |
| 1,826,403 |
|
| Actavis Funding SCS: | | |
| 3.80%, 3/15/25 | 1,150,000 |
| 1,186,834 |
|
| 4.75%, 3/15/45 | 2,300,000 |
| 2,444,569 |
|
Albertsons Holdings LLC/Saturn Acquisition Merger Sub, Inc., 7.75%, 10/15/22 (e) | 1,979,000 |
| 2,117,530 |
|
| Alliance Mortgage Investments, Inc., 12.61%, 6/1/10 (b)(r)(x)* | 3,077,944 |
| — |
|
| Ally Financial, Inc., 3.25%, 2/13/18 | 3,000,000 |
| 2,970,000 |
|
| Amazon.com, Inc., 3.30%, 12/5/21 | 2,000,000 |
| 2,080,064 |
|
| America Movil SAB de CV: | | |
| 2.375%, 9/8/16 | 2,000,000 |
| 2,032,780 |
|
| 4.375%, 7/16/42 | 1,500,000 |
| 1,499,790 |
|
| American Airlines Group, Inc., 4.625%, 3/1/20 (e) | 600,000 |
| 587,625 |
|
| American Airlines Pass Through Trust: | | |
| 5.60%, 1/15/22 (e) | 2,726,425 |
| 2,872,834 |
|
| 3.375%, 11/1/28 | 2,800,000 |
| 2,810,640 |
|
| American International Group, Inc., 4.50%, 7/16/44 | 2,450,000 |
| 2,629,872 |
|
| American Tower Corp.: | | |
| 3.45%, 9/15/21 | 1,000,000 |
| 1,020,766 |
|
| 4.70%, 3/15/22 | 2,000,000 |
| 2,144,920 |
|
| Amgen, Inc.: | | |
| 3.625%, 5/22/24 | 1,000,000 |
| 1,051,647 |
|
| 5.375%, 5/15/43 | 1,500,000 |
| 1,789,594 |
|
| Anadarko Petroleum Corp., 4.50%, 7/15/44 | 1,000,000 |
| 1,023,044 |
|
| Anheuser-Busch InBev Finance, Inc.: | | |
| 2.625%, 1/17/23 | 1,900,000 |
| 1,873,030 |
|
| 4.00%, 1/17/43 | 1,900,000 |
| 1,932,507 |
|
| Anheuser-Busch InBev Worldwide, Inc.: | | |
| 2.50%, 7/15/22 | 1,500,000 |
| 1,479,861 |
|
| 3.75%, 7/15/42 | 1,000,000 |
| 975,180 |
|
| Antero Resources Corp., 6.00%, 12/1/20 | 1,000,000 |
| 1,000,500 |
|
| Anthem, Inc., 4.65%, 1/15/43 | 2,000,000 |
| 2,167,896 |
|
| Apache Corp., 4.75%, 4/15/43 | 1,000,000 |
| 1,045,158 |
|
| Apple, Inc., 3.45%, 2/9/45 | 4,045,000 |
| 3,839,672 |
|
| ArcelorMittal, 6.125%, 6/1/18 | 6,700,000 |
| 7,199,150 |
|
| Asian Development Bank, 2.125%, 3/19/25 | 1,700,000 |
| 1,714,630 |
|
www.calvert.com CALVERT INCOME FUND SEMI-ANNUAL REPORT (UNAUDITED) 15
|
| | | | | | |
CORPORATE BONDS - CONT’D | PRINCIPAL AMOUNT | VALUE |
| | | |
| AT&T, Inc.: | | |
| 2.375%, 11/27/18 |
| $3,500,000 |
|
| $3,545,052 |
|
| 2.30%, 3/11/19 | 1,450,000 |
| 1,461,103 |
|
| 4.35%, 6/15/45 | 2,750,000 |
| 2,630,317 |
|
Avis Budget Car Rental LLC / Avis Budget Finance, Inc., 9.75%, 3/15/20 | 1,400,000 |
| 1,525,160 |
|
| Bank of America Corp.: | | |
| 2.60%, 1/15/19 | 1,650,000 |
| 1,679,357 |
|
| 4.125%, 1/22/24 | 3,190,000 |
| 3,415,967 |
|
| 4.00%, 4/1/24 | 1,850,000 |
| 1,967,875 |
|
| 4.00%, 1/22/25 | 1,500,000 |
| 1,512,140 |
|
| 4.25%, 10/22/26 | 3,450,000 |
| 3,561,580 |
|
| Bank of America NA: | | |
| 5.30%, 3/15/17 | 9,000,000 |
| 9,611,928 |
|
| 6.10%, 6/15/17 | 5,000,000 |
| 5,477,620 |
|
| Berkshire Hathaway Finance Corp., 3.00%, 5/15/22 | 2,500,000 |
| 2,600,075 |
|
BNSF Funding Trust I, 6.613% to 1/15/26, floating rate thereafter to 12/15/55 (r) | 14,501,000 |
| 16,349,879 |
|
| BP Capital Markets plc: | | |
| 2.75%, 5/10/23 | 1,000,000 |
| 975,503 |
|
| 3.535%, 11/4/24 | 1,000,000 |
| 1,018,385 |
|
| Capital One Bank: | | |
| 2.25%, 2/13/19 | 2,400,000 |
| 2,412,706 |
|
| 3.375%, 2/15/23 | 4,600,000 |
| 4,658,866 |
|
| Celanese US Holdings LLC, 5.875%, 6/15/21 | 1,300,000 |
| 1,404,000 |
|
| Celgene Corp., 3.625%, 5/15/24 | 1,900,000 |
| 1,974,632 |
|
| Cemex SAB de CV: | | |
| 5.273%, 9/30/15 (e)(r) | 6,250,000 |
| 6,280,625 |
|
| 6.50%, 12/10/19 (e) | 1,000,000 |
| 1,062,500 |
|
| CenturyLink, Inc., 7.65%, 3/15/42 | 3,650,000 |
| 3,732,125 |
|
| Cisco Systems, Inc., 3.625%, 3/4/24 | 1,500,000 |
| 1,620,424 |
|
| CIT Group, Inc.: | | |
| 4.25%, 8/15/17 | 1,125,000 |
| 1,139,062 |
|
| 5.25%, 3/15/18 | 4,150,000 |
| 4,295,250 |
|
| Citigroup, Inc.: | | |
| 2.50%, 9/26/18 | 5,000,000 |
| 5,098,000 |
|
| 3.75%, 6/16/24 | 1,000,000 |
| 1,045,162 |
|
| 3.875%, 3/26/25 | 3,750,000 |
| 3,764,085 |
|
| ConAgra Foods, Inc., 4.65%, 1/25/43 | 1,000,000 |
| 1,003,276 |
|
| ConocoPhillips Co.: | | |
| 3.35%, 11/15/24 | 2,000,000 |
| 2,061,004 |
|
| 4.30%, 11/15/44 | 750,000 |
| 796,040 |
|
| Continental Airlines Pass Through Trust, 6.25%, 10/11/21 | 4,282,253 |
| 4,560,600 |
|
| Cott Beverages, Inc., 6.75%, 1/1/20 (e) | 1,000,000 |
| 1,035,000 |
|
| Coveris Holdings SA, 7.875%, 11/1/19 (e) | 1,500,000 |
| 1,533,750 |
|
| Crown Castle Towers LLC: | | |
| 4.174%, 8/15/37 (e) | 825,000 |
| 859,650 |
|
| 4.883%, 8/15/40 (e) | 3,000,000 |
| 3,294,045 |
|
16 www.calvert.com CALVERT INCOME FUND SEMI-ANNUAL REPORT (UNAUDITED)
|
| | | | | | |
CORPORATE BONDS - CONT’D | PRINCIPAL AMOUNT | VALUE |
| | | |
| Cummins, Inc., 4.875%, 10/1/43 |
| $1,100,000 |
|
| $1,305,139 |
|
| CVS Pass-Through Trust, 6.036%, 12/10/28 | 3,060,025 |
| 3,617,250 |
|
| DDR Corp., 4.75%, 4/15/18 | 6,700,000 |
| 7,212,858 |
|
| Deutsche Telekom International Finance BV, 4.875%, 3/6/42 (e) | 600,000 |
| 676,588 |
|
| DIRECTV Holdings LLC / DIRECTV Financing Co., Inc.: | | |
| 3.95%, 1/15/25 | 3,000,000 |
| 3,090,831 |
|
| 5.15%, 3/15/42 | 2,000,000 |
| 2,090,144 |
|
| Discover Bank, 7.00%, 4/15/20 | 2,500,000 |
| 2,967,815 |
|
| Dow Chemical Co., 4.625%, 10/1/44 | 1,700,000 |
| 1,777,066 |
|
| Dr Pepper Snapple Group, Inc., 3.20%, 11/15/21 | 2,555,000 |
| 2,657,151 |
|
| Enterprise Products Operating LLC, 7.034% to 1/15/18, floating rate thereafter to 1/15/68 (r) | 12,115,000 |
| 13,097,817 |
|
| ERP Operating LP, 4.625%, 12/15/21 | 1,000,000 |
| 1,117,020 |
|
| Express Scripts Holding Co.: | | |
| 4.75%, 11/15/21 | 1,500,000 |
| 1,687,660 |
|
| 3.90%, 2/15/22 | 1,000,000 |
| 1,061,811 |
|
| Ford Motor Credit Co. LLC: | | |
| 3.984%, 6/15/16 | 1,500,000 |
| 1,546,544 |
|
| 4.25%, 2/3/17 | 5,000,000 |
| 5,250,320 |
|
| 1.684%, 9/8/17 | 2,000,000 |
| 1,997,152 |
|
| 2.145%, 1/9/18 | 1,350,000 |
| 1,365,421 |
|
| 3.219%, 1/9/22 | 1,000,000 |
| 1,021,063 |
|
| General Electric Capital Corp., 4.625%, 1/7/21 | 2,250,000 |
| 2,533,306 |
|
General Electric Capital Corp. / LJ VP Holdings LLC, 3.80%, 6/18/19 (e) | 3,000,000 |
| 3,210,810 |
|
| General Electric Co.: | | |
| 3.375%, 3/11/24 | 4,000,000 |
| 4,231,112 |
|
| 4.50%, 3/11/44 | 4,200,000 |
| 4,714,529 |
|
| General Motors Co., 5.20%, 4/1/45 | 2,750,000 |
| 2,984,674 |
|
| General Motors Financial Co., Inc.: | | |
| 3.50%, 7/10/19 | 1,500,000 |
| 1,539,994 |
|
| 3.15%, 1/15/20 | 600,000 |
| 607,138 |
|
| 4.00%, 1/15/25 | 1,900,000 |
| 1,937,840 |
|
| Genworth Holdings, Inc., 4.80%, 2/15/24 | 3,800,000 |
| 3,196,750 |
|
| Gilead Sciences, Inc., 3.70%, 4/1/24 | 1,000,000 |
| 1,067,804 |
|
| Goldman Sachs Group, Inc.: | | |
| 6.15%, 4/1/18 | 10,975,000 |
| 12,338,545 |
|
| 2.625%, 1/31/19 | 4,000,000 |
| 4,086,664 |
|
| 3.50%, 1/23/25 | 4,150,000 |
| 4,222,849 |
|
| Grain Spectrum Funding II LLC, 3.29%, 10/10/19 (e) | 1,000,000 |
| 1,001,250 |
|
| Health Care REIT, Inc.: | | |
| 5.25%, 1/15/22 | 2,000,000 |
| 2,254,176 |
|
| 3.75%, 3/15/23 | 2,000,000 |
| 2,048,526 |
|
| Home Depot, Inc.: | | |
| 2.70%, 4/1/23 | 2,000,000 |
| 2,030,234 |
|
| 4.20%, 4/1/43 | 1,000,000 |
| 1,092,480 |
|
| 4.40%, 3/15/45 | 600,000 |
| 669,920 |
|
www.calvert.com CALVERT INCOME FUND SEMI-ANNUAL REPORT (UNAUDITED) 17
|
| | | | | | |
CORPORATE BONDS - CONT’D | PRINCIPAL AMOUNT | VALUE |
| | | |
| Host Hotels & Resorts LP, 3.75%, 10/15/23 |
| $2,000,000 |
|
| $2,027,188 |
|
| Hyundai Capital America, 4.00%, 6/8/17 (e) | 2,000,000 |
| 2,099,862 |
|
| Hyundai Capital Services, Inc., 3.50%, 9/13/17 (e) | 3,245,000 |
| 3,366,499 |
|
| Illinois Tool Works, Inc., 3.90%, 9/1/42 | 2,000,000 |
| 2,061,392 |
|
Innovation Ventures LLC / Innovation Ventures Finance Corp., 9.50%, 8/15/19 (e) | 3,000,000 |
| 3,030,000 |
|
| International Lease Finance Corp., 6.75%, 9/1/16 (e) | 2,000,000 |
| 2,125,000 |
|
| Jabil Circuit, Inc., 7.75%, 7/15/16 | 2,000,000 |
| 2,145,000 |
|
| JPMorgan Chase & Co.: | | |
| 2.35%, 1/28/19 | 3,000,000 |
| 3,049,173 |
|
| 3.625%, 5/13/24 | 7,000,000 |
| 7,278,530 |
|
| 3.875%, 9/10/24 | 3,000,000 |
| 3,077,670 |
|
| 3.125%, 1/23/25 | 4,900,000 |
| 4,914,372 |
|
| Kenan Advantage Group, Inc., 8.375%, 12/15/18 (e) | 1,500,000 |
| 1,560,000 |
|
| Kern River Funding Corp., 6.676%, 7/31/16 (e) | 47,598 |
| 50,217 |
|
| Kia Motors Corp., 3.625%, 6/14/16 (e) | 4,000,000 |
| 4,105,784 |
|
| Kinder Morgan Energy Partners LP: | | |
| 4.10%, 11/15/15 | 1,000,000 |
| 1,017,618 |
|
| 4.25%, 9/1/24 | 1,000,000 |
| 1,022,534 |
|
| 5.625%, 9/1/41 | 2,960,000 |
| 3,129,114 |
|
| Kinder Morgan, Inc.: | | |
| 5.55%, 6/1/45 | 1,500,000 |
| 1,581,544 |
|
| 5.05%, 2/15/46 | 4,400,000 |
| 4,394,144 |
|
| Kroger Co., 3.85%, 8/1/23 | 1,900,000 |
| 2,024,912 |
|
| Laboratory Corporation of America Holdings: | | |
| 3.60%, 2/1/25 | 700,000 |
| 702,857 |
|
| 4.70%, 2/1/45 | 700,000 |
| 720,507 |
|
| Land O’Lakes Capital Trust I, 7.45%, 3/15/28 (e) | 8,000,000 |
| 8,640,000 |
|
| Leucadia National Corp.: | | |
| 8.125%, 9/15/15 | 3,320,000 |
| 3,417,309 |
|
| 6.625%, 10/23/43 | 2,925,000 |
| 2,923,622 |
|
| Life Technologies Corp., 6.00%, 3/1/20 | 4,000,000 |
| 4,619,572 |
|
LL & P Wind Energy, Inc. Washington Revenue Bonds, 6.192%, 12/1/27 (e) | 2,675,000 |
| 2,730,613 |
|
| Lowe’s Co.’s, Inc., 4.65%, 4/15/42 | 1,050,000 |
| 1,203,432 |
|
| LYB International Finance BV, 5.25%, 7/15/43 | 1,000,000 |
| 1,114,364 |
|
| Macy’s Retail Holdings, Inc., 4.30%, 2/15/43 | 1,000,000 |
| 1,014,766 |
|
| Masco Corp., 4.45%, 4/1/25 | 850,000 |
| 877,625 |
|
| Massachusetts Institute of Technology, 3.959%, 7/1/38 | 500,000 |
| 537,416 |
|
| Medtronic, Inc., 3.50%, 3/15/25 (e) | 2,000,000 |
| 2,090,782 |
|
| Methanex Corp., 5.65%, 12/1/44 | 3,275,000 |
| 3,439,716 |
|
| MetLife, Inc.: | | |
| 4.875%, 11/13/43 | 2,400,000 |
| 2,770,037 |
|
| 4.05%, 3/1/45 | 900,000 |
| 932,056 |
|
Michaels FinCo Holdings LLC / Michaels FinCo, Inc., 7.50%, 8/1/18 (e) | 752,000 |
| 767,040 |
|
| Michaels Stores, Inc., 5.875%, 12/15/20 (e) | 2,650,000 |
| 2,722,875 |
|
18 www.calvert.com CALVERT INCOME FUND SEMI-ANNUAL REPORT (UNAUDITED)
|
| | | | | | |
CORPORATE BONDS - CONT’D | PRINCIPAL AMOUNT | VALUE |
| | | |
| Microsoft Corp., 2.70%, 2/12/25 |
| $2,000,000 |
|
| $2,007,712 |
|
| Morgan Stanley: | | |
| 6.25%, 8/28/17 | 2,900,000 |
| 3,203,665 |
|
| 5.50%, 1/26/20 | 2,000,000 |
| 2,272,986 |
|
| 1.396%, 1/27/20 (r) | 2,100,000 |
| 2,131,403 |
|
| 2.65%, 1/27/20 | 3,500,000 |
| 3,548,727 |
|
| 3.70%, 10/23/24 | 2,400,000 |
| 2,502,197 |
|
| 5.00%, 11/24/25 | 4,150,000 |
| 4,584,318 |
|
| NBCUniversal Media LLC: | | |
| 4.375%, 4/1/21 | 9,500,000 |
| 10,584,245 |
|
| 4.45%, 1/15/43 | 2,800,000 |
| 3,040,486 |
|
| NII Capital Corp., 7.625%, 4/1/21 (p)* | 10,600,000 |
| 3,233,000 |
|
| Northrop Grumman Corp., 3.85%, 4/15/45 | 1,000,000 |
| 984,385 |
|
| Numericable-SFR SAS, 6.00%, 5/15/22 (e) | 2,000,000 |
| 2,025,000 |
|
| Oracle Corp., 3.40%, 7/8/24 | 2,000,000 |
| 2,102,378 |
|
| PacifiCorp, 4.10%, 2/1/42 | 4,000,000 |
| 4,314,404 |
|
| Penske Truck Leasing Co. LP / PTL Finance Corp.: | | |
| 3.125%, 5/11/15 (e) | 2,200,000 |
| 2,204,651 |
|
| 3.05%, 1/9/20 (e) | 3,300,000 |
| 3,355,288 |
|
| PepsiCo, Inc., 2.75%, 3/5/22 | 2,000,000 |
| 2,041,222 |
|
| Pernod Ricard SA: | | |
| 4.45%, 1/15/22 (e) | 8,250,000 |
| 8,941,705 |
|
| 4.25%, 7/15/22 (e) | 2,000,000 |
| 2,155,556 |
|
| Pioneer Natural Resources Co., 5.875%, 7/15/16 | 3,340,000 |
| 3,525,554 |
|
| ProLogis LP, 6.875%, 3/15/20 | 1,407,000 |
| 1,659,305 |
|
| Prospect Medical Holdings, Inc., 8.375%, 5/1/19 (e) | 1,000,000 |
| 1,062,500 |
|
| Prudential Financial, Inc., 4.60%, 5/15/44 | 1,000,000 |
| 1,060,261 |
|
| Regions Bank, 7.50%, 5/15/18 | 514,000 |
| 597,439 |
|
| Reliance Steel & Aluminum Co., 4.50%, 4/15/23 | 2,300,000 |
| 2,323,501 |
|
| Rio Tinto Finance USA plc, 3.50%, 3/22/22 | 2,000,000 |
| 2,066,300 |
|
| SABMiller Holdings, Inc.: | | |
| 2.20%, 8/1/18 (e) | 1,300,000 |
| 1,315,040 |
|
| 3.75%, 1/15/22 (e) | 4,215,000 |
| 4,434,007 |
|
| 4.95%, 1/15/42 (e) | 1,500,000 |
| 1,685,379 |
|
| SBA Tower Trust, 3.722%, 4/15/48 (e) | 6,870,000 |
| 7,094,903 |
|
| Shell International Finance BV, 4.55%, 8/12/43 | 2,000,000 |
| 2,267,028 |
|
| Spencer Spirit Holdings, Inc., 9.00%, 5/1/18 (e) | 2,945,000 |
| 2,985,494 |
|
| Sprint Corp., 7.25%, 9/15/21 | 3,150,000 |
| 3,165,750 |
|
| Telefonica Emisiones SAU: | | |
| 3.992%, 2/16/16 | 2,670,000 |
| 2,737,962 |
|
| 3.192%, 4/27/18 | 2,000,000 |
| 2,085,884 |
|
| TerraForm Power Operating LLC, 5.875%, 2/1/23 (e) | 1,500,000 |
| 1,556,250 |
|
| The TJX Co.’s, Inc., 2.50%, 5/15/23 | 2,000,000 |
| 1,971,130 |
|
| Thermo Fisher Scientific, Inc., 4.15%, 2/1/24 | 1,200,000 |
| 1,295,648 |
|
| Time Warner Cable, Inc., 5.50%, 9/1/41 | 4,250,000 |
| 4,882,155 |
|
www.calvert.com CALVERT INCOME FUND SEMI-ANNUAL REPORT (UNAUDITED) 19
|
| | | | | | |
CORPORATE BONDS - CONT’D | PRINCIPAL AMOUNT | VALUE |
| | | |
| Time Warner, Inc.: | | |
| 4.05%, 12/15/23 |
| $1,500,000 |
|
| $1,605,522 |
|
| 5.375%, 10/15/41 | 4,000,000 |
| 4,684,628 |
|
| 4.90%, 6/15/42 | 1,500,000 |
| 1,664,402 |
|
| Total Capital International SA, 2.70%, 1/25/23 | 2,000,000 |
| 1,993,086 |
|
| Turkish Airlines Pass Through Trust, 4.20%, 9/15/28 (e) | 800,000 |
| 808,000 |
|
| United Airlines Pass Through Trust: | | |
| 4.75%, 10/11/23 | 2,904,000 |
| 2,944,075 |
|
| 4.625%, 3/3/24 | 1,600,000 |
| 1,604,480 |
|
| United Technologies Corp., 4.50%, 6/1/42 | 2,900,000 |
| 3,216,503 |
|
| Verizon Communications, Inc.: | | |
| 2.625%, 2/21/20 | 10,765,000 |
| 10,951,880 |
|
| 3.50%, 11/1/24 | 2,400,000 |
| 2,456,076 |
|
| 4.862%, 8/21/46 | 11,945,000 |
| 12,505,639 |
|
| Viacom, Inc.: | | |
| 3.875%, 4/1/24 | 2,000,000 |
| 2,057,724 |
|
| 5.25%, 4/1/44 | 1,950,000 |
| 2,092,325 |
|
| Virgin Australia Trust: | | |
| 6.00%, 4/23/22 (e) | 2,717,984 |
| 2,813,114 |
|
| 5.00%, 4/23/25 (e) | 773,147 |
| 813,737 |
|
| Wachovia Capital Trust III, 5.57%, 3/29/49 (r) | 2,050,000 |
| 2,024,170 |
|
| Walgreens Boots Alliance, Inc.: | | |
| 3.80%, 11/18/24 | 2,200,000 |
| 2,274,694 |
|
| 4.80%, 11/18/44 | 1,600,000 |
| 1,726,950 |
|
| Wal-Mart Stores, Inc., 4.00%, 4/11/43 | 4,150,000 |
| 4,402,067 |
|
| Wells Fargo & Co.: | | |
| 3.45%, 2/13/23 | 2,000,000 |
| 2,046,410 |
|
| 4.10%, 6/3/26 | 2,000,000 |
| 2,110,136 |
|
| Whirlpool Corp., 2.40%, 3/1/19 | 1,000,000 |
| 1,012,996 |
|
| Williams Co.’s, Inc., 5.75%, 6/24/44 | 8,000,000 |
| 7,476,952 |
|
| Williams Partners LP: | | |
| 3.60%, 3/15/22 | 3,400,000 |
| 3,389,382 |
|
| 3.90%, 1/15/25 | 2,000,000 |
| 1,955,462 |
|
| Williams Partners LP / ACMP Finance Corp.: | | |
| 6.125%, 7/15/22 | 2,600,000 |
| 2,754,700 |
|
| 4.875%, 3/15/24 | 4,650,000 |
| 4,673,250 |
|
| Zoetis, Inc., 1.875%, 2/1/18 | 1,500,000 |
| 1,500,855 |
|
| | | |
| Total Corporate Bonds (Cost $549,520,119) | | 575,436,665 |
|
| | | |
| | | |
U.S. GOVERNMENT AGENCIES AND INSTRUMENTALITIES - 0.0% | | |
| Premier Aircraft Leasing EXIM 1 Ltd., 3.547%, 4/10/22 | 95 |
| 101 |
|
| | | |
| Total U.S. Government Agencies and Instrumentalities (Cost $95) | | 101 |
|
| | | |
20 www.calvert.com CALVERT INCOME FUND SEMI-ANNUAL REPORT (UNAUDITED)
|
| | | | | | |
U.S. GOVERNMENT AGENCY MORTGAGE-BACKED SECURITIES - 0.0% | PRINCIPAL AMOUNT | VALUE |
| Ginnie Mae, 11.00%, 10/15/15 |
| $8 |
|
| $8 |
|
| | | |
| Total U.S. Government Agency Mortgage-Backed Securities (Cost $8) | | 8 |
|
| | | |
| | | |
U.S. TREASURY OBLIGATIONS - 8.1% | | |
| United States Treasury Bonds, 3.00%, 11/15/44 | 15,125,000 |
| 16,572,508 |
|
| United States Treasury Notes: | | |
| 0.50%, 3/31/17 | 9,980,000 |
| 9,968,303 |
|
| 1.00%, 3/15/18 | 7,950,000 |
| 7,979,192 |
|
| 1.375%, 3/31/20 | 10,235,000 |
| 10,236,597 |
|
| 1.75%, 3/31/22 | 7,910,000 |
| 7,930,392 |
|
| 2.00%, 2/15/25 | 14,945,000 |
| 15,039,572 |
|
| | | |
| Total U.S. Treasury Obligations (Cost $66,781,735) | | 67,726,564 |
|
| | | |
| | | |
TIME DEPOSIT - 0.9% | | |
| State Street Bank Time Deposit, 0.088%, 4/1/15 | 7,870,897 |
| 7,870,897 |
|
| | | |
| Total Time Deposit (Cost $7,870,897) | | 7,870,897 |
|
| | | |
| | | |
| | | |
| TOTAL INVESTMENTS (Cost $802,092,762) - 99.4% | | 829,978,836 |
|
| Other assets and liabilities, net - 0.6% | | 5,297,444 |
|
NET ASSETS - 100% | |
| $835,276,280 |
|
| | | |
| | | |
NET ASSETS CONSIST OF: | | |
| Paid-in capital applicable to the following shares of beneficial interest, unlimited number of no par value shares authorized: | | |
| Class A: 33,992,900 shares outstanding |
| $1,038,140,903 |
|
| Class B: 39,878 shares outstanding | 17,915,201 |
|
| Class C: 6,127,397 shares outstanding | 140,137,913 |
|
| Class I: 5,687,181 shares outstanding | 121,461,709 |
|
| Class R: 324,694 shares outstanding | 4,580,271 |
|
| Class Y: 4,157,540 shares outstanding | 64,943,218 |
|
| Undistributed net investment income | 220,440 |
|
| Accumulated net realized gain (loss) | (580,179,092 | ) |
| Net unrealized appreciation (depreciation) | 28,055,717 |
|
| | | |
NET ASSETS |
| $835,276,280 |
|
| | | |
| See notes to financial statements. |
www.calvert.com CALVERT INCOME FUND SEMI-ANNUAL REPORT (UNAUDITED) 21
|
| | | | | | |
NET ASSET VALUE PER SHARE | | |
| Class A (based on net assets of $563,587,469) | $16.58 |
| Class B (based on net assets of $652,616) | $16.37 |
| Class C (based on net assets of $101,583,095) | $16.58 |
| Class I (based on net assets of $94,345,999) | $16.59 |
| Class R (based on net assets of $5,425,117) | $16.71 |
| Class Y (based on net assets of $69,681,984) | $16.76 |
| | | |
| |
|
| | | | | | | | |
FUTURES | NUMBER OF CONTRACTS | EXPIRATION DATE | UNDERLYING FACE AMOUNT AT VALUE | UNREALIZED APPRECIATION (DEPRECIATION) |
| Purchased: | | | | |
| 2 Year U.S. Treasury Notes | 221 | 6/15 |
| $48,433,531 |
|
| $103,617 |
|
| Ultra U.S. Treasury Bonds | 223 | 6/15 | 37,882,125 |
| 764,118 |
|
| Total Purchased | | | |
| $867,735 |
|
| | | | | |
| Sold: | | | | |
| 5 Year U.S. Treasury Notes | 135 | 6/15 |
| $16,228,477 |
|
| ($196,388 | ) |
| 10 Year U.S. Treasury Notes | 385 | 6/15 | 49,628,906 |
| (501,704 | ) |
| Total Sold | | | |
| ($698,092 | ) |
(b) This security was valued under the direction of the Board of Trustees. See Note A. (e) Security is exempt from registration under Rule 144A of the Securities Act of 1933. These securities may be resold in transactions exempt from registration, normally to qualified institutional buyers. (p) Security is in default and is no longer accruing interest. (r) The coupon rate shown on floating or adjustable rate securities represents the rate at period end. (x) Alliance Bancorp and its affiliates filed for Chapter 7 bankruptcy on July 13, 2007. This security is no longer accruing interest. * Non-income producing security. Abbreviations: LLC: Limited Liability Corporation LP: Limited Partnership plc: Public Limited Company REIT: Real Estate Investment Trust See notes to financial statements. |
22 www.calvert.com CALVERT INCOME FUND SEMI-ANNUAL REPORT (UNAUDITED)
STATEMENT OF OPERATIONS
SIX MONTHS ENDED MARCH 31, 2015
|
| | | |
NET INVESTMENT INCOME | |
| Investment Income: | |
| Interest income |
| $17,443,856 |
|
| Dividend income | 21,960 |
|
| Total investment income | 17,465,816 |
|
| | |
| Expenses: | |
| Investment advisory fee | 1,720,803 |
|
| Administrative fees | 1,197,811 |
|
| Transfer agency fees and expenses | 916,209 |
|
| Distribution Plan expenses: | |
| Class A | 734,380 |
|
| Class B | 4,879 |
|
| Class C | 519,832 |
|
| Class R | 13,569 |
|
| Trustees' fees and expenses | 63,477 |
|
| Custodian fees | 55,415 |
|
| Registration fees | 42,345 |
|
| Reports to shareholders | 47,535 |
|
| Professional fees | 49,259 |
|
| Accounting fees | 61,102 |
|
| Miscellaneous | 20,696 |
|
| Total expenses | 5,447,312 |
|
| Reimbursement from Advisor: | |
| Class B | (8,766 | ) |
| Class R | (7,741 | ) |
| Net expenses | 5,430,805 |
|
| | |
NET INVESTMENT INCOME | 12,035,011 |
|
| | |
REALIZED AND UNREALIZED GAIN (LOSS) | |
| Net realized gain (loss) on: | |
| Investments | (2,531,538 | ) |
| Futures | 730,060 |
|
| | (1,801,478 | ) |
| Change in unrealized appreciation (depreciation) on: | |
| Investments | 13,973,082 |
|
| Futures | 85,064 |
|
| | 14,058,146 |
|
| | |
NET REALIZED AND UNREALIZED GAIN (LOSS) | 12,256,668 |
|
| | |
INCREASE (DECREASE) IN NET ASSETS RESULTING FROM OPERATIONS |
| $24,291,679 |
|
| | |
| See notes to financial statements. |
www.calvert.com CALVERT INCOME FUND SEMI-ANNUAL REPORT (UNAUDITED) 23
STATEMENTS OF CHANGES IN NET ASSETS
|
| | | | | | | |
INCREASE (DECREASE) IN NET ASSETS | SIX MONTHS ENDED MARCH 31, 2015 | | YEAR ENDED SEPTEMBER 30, 2014 |
| Operations: | | | |
| Net investment income |
| $12,035,011 |
| |
| $27,594,912 |
|
| Net realized gain (loss) | (1,801,478 | ) | | (16,719,592 | ) |
| Change in unrealized appreciation (depreciation) | 14,058,146 |
| | 36,475,100 |
|
| | | | |
INCREASE (DECREASE) IN NET ASSETS RESULTING FROM OPERATIONS | 24,291,679 |
| | 47,350,420 |
|
| | | | |
| Distributions to shareholders from: | | | |
| Net investment income: | | | |
| Class A shares | (8,154,205 | ) | | (19,738,154 | ) |
| Class B shares | (9,440 | ) | | (56,683 | ) |
| Class C shares | (1,097,607 | ) | | (2,557,698 | ) |
| Class I shares | (1,581,109 | ) | | (3,256,812 | ) |
| Class R shares | (70,203 | ) | | (135,730 | ) |
| Class Y shares | (1,107,265 | ) | | (1,844,471 | ) |
| Total distributions | (12,019,829 | ) | | (27,589,548 | ) |
| | | | |
| Capital share transactions: | | | |
| Shares sold: | | | |
| Class A shares | 29,279,386 |
| | 58,135,737 |
|
| Class B shares | 958 |
| | 33,570 |
|
| Class C shares | 2,067,047 |
| | 3,276,853 |
|
| Class I shares | 6,626,071 |
| | 13,628,419 |
|
| Class R shares | 534,623 |
| | 1,176,454 |
|
| Class Y shares | 7,411,511 |
| | 30,347,431 |
|
| Reinvestment of distributions: | | | |
| Class A shares | 7,356,425 |
| | 17,952,323 |
|
| Class B shares | 7,744 |
| | 47,077 |
|
| Class C shares | 735,650 |
| | 1,691,297 |
|
| Class I shares | 1,561,672 |
| | 3,200,584 |
|
| Class R shares | 63,702 |
| | 121,628 |
|
| Class Y shares | 721,224 |
| | 970,884 |
|
| Redemption fees: | | | |
| Class A shares | 720 |
| | 10,939 |
|
| Class C shares | 112 |
| | 41 |
|
| Class I shares | — |
| | 1,209 |
|
| Class R shares | — |
| | 53 |
|
| Class Y shares | 235 |
| | 230 |
|
| See notes to financial statements. |
24 www.calvert.com CALVERT INCOME FUND SEMI-ANNUAL REPORT (UNAUDITED)
STATEMENTS OF CHANGES IN NET ASSETS
|
| | | | | | | |
INCREASE (DECREASE) IN NET ASSETS - CONT'D | SIX MONTHS ENDED MARCH 31, 2015 | | YEAR ENDED SEPTEMBER 30, 2014 |
| Shares redeemed: | | | |
| Class A shares |
| ($97,248,712 | ) | |
| ($247,321,343 | ) |
| Class B shares | (645,436 | ) | | (2,962,693 | ) |
| Class C shares | (10,108,514 | ) | | (31,938,939 | ) |
| Class I shares | (8,163,232 | ) | | (21,901,425 | ) |
| Class R shares | (660,953 | ) | | (1,485,384 | ) |
| Class Y shares | (9,881,222 | ) | | (25,133,677 | ) |
| Total capital share transactions | (70,340,989 | ) | | (200,148,732 | ) |
| | | | |
TOTAL INCREASE (DECREASE) IN NET ASSETS | (58,069,139 | ) | | (180,387,860 | ) |
| | | | |
NET ASSETS | | | |
| Beginning of period | 893,345,419 |
| | 1,073,733,279 |
|
| End of period (including undistributed net investment income of $220,440 and $205,258, respectively) |
| $835,276,280 |
| |
| $893,345,419 |
|
| | | | |
CAPITAL SHARE ACTIVITY | | | |
| Shares sold: | | | |
| Class A shares | 1,777,939 |
| | 3,560,530 |
|
| Class B shares | 59 |
| | 2,075 |
|
| Class C shares | 125,623 |
| | 200,327 |
|
| Class I shares | 402,283 |
| | 831,692 |
|
| Class R shares | 32,203 |
| | 71,261 |
|
| Class Y shares | 445,524 |
| | 1,822,323 |
|
| Reinvestment of distributions: | | | |
| Class A shares | 447,197 |
| | 1,097,697 |
|
| Class B shares | 477 |
| | 2,905 |
|
| Class C shares | 44,729 |
| | 103,441 |
|
| Class I shares | 94,882 |
| | 195,595 |
|
| Class R shares | 3,843 |
| | 7,377 |
|
| Class Y shares | 43,367 |
| | 58,714 |
|
| Shares redeemed: | | | |
| Class A shares | (5,908,161 | ) | | (15,168,560 | ) |
| Class B shares | (39,800 | ) | | (182,955 | ) |
| Class C shares | (614,292 | ) | | (1,961,250 | ) |
| Class I shares | (495,573 | ) | | (1,344,465 | ) |
| Class R shares | (39,840 | ) | | (90,945 | ) |
| Class Y shares | (593,713 | ) | | (1,527,005 | ) |
| Total capital share activity | (4,273,253 | ) | | (12,321,243 | ) |
| | | | |
| See notes to financial statements. |
www.calvert.com CALVERT INCOME FUND SEMI-ANNUAL REPORT (UNAUDITED) 25
NOTES TO FINANCIAL STATEMENTS
NOTE A — SIGNIFICANT ACCOUNTING POLICIES
General: Calvert Income Fund (the “Fund”), a series of The Calvert Fund, is registered under the Investment Company Act of 1940 as a non-diversified, open-end management investment company. The Calvert Fund is comprised of six separate series. The operations of each series are accounted for separately. The Fund offers six classes of shares of beneficial interest - Classes A, B, C, I, R, and Y. Class A shares are sold with a maximum front-end sales charge of 3.75%. Class B shares are sold without a front-end sales charge and, with certain exceptions, will be charged a deferred sales charge at the time of redemption, depending on how long investors have owned the shares. Class B shares are no longer offered for purchase, except through reinvestment of dividends and/or distributions and through certain exchanges. Class B shares were closed effective April 20, 2015. Class C shares are sold without a front-end sales charge and, with certain exceptions, will be charged a deferred sales charge on shares sold within one year of purchase. Class B and Class C shares have higher levels of expenses than Class A shares. Class I shares require a minimum account balance of $1,000,000. The $1 million minimum initial investment is waived for retirement plans that trade through omnibus accounts and may be waived for certain other institutional accounts where it is believed to be in the best interest of the Fund and its shareholders. Class I shares have no front-end or deferred sales charge and have lower levels of expenses than Class A shares. Class R shares are generally only available to certain retirement plans where plan level or omnibus accounts are held on the books of the Fund. Class R shares have no front-end or deferred sales charge and have a higher level of expenses than Class A Shares. Class Y shares are generally only available to wrap or similar fee-based programs offered by financial intermediaries, foundations, and endowments that have entered into an agreement with the Fund’s Distributor to offer Class Y shares. Class Y shares have no front-end or deferred sales charge and have lower levels of expenses than Class A shares. Each class has different: (a) dividend rates due to differences in Distribution Plan expenses and other class specific expenses, (b) exchange privileges and (c) class specific voting rights.
Security Valuation: Net asset value per share is determined every business day as of the close of the regular session of the New York Stock Exchange (generally 4:00 p.m. Eastern time). The Fund uses independent pricing services approved by the Board of Trustees (“the Board”) to value its investments wherever possible. Investments for which market quotations are not available or deemed not reliable are fair valued in good faith under the direction of the Board.
The Board has adopted Valuation Procedures (the “Procedures”) to determine the fair value of securities and other financial instruments for which market prices are not readily available or which may not be reliably priced. The Board has delegated the day-to-day responsibility for determining the fair value of assets of the Fund to Calvert Investment Management, Inc. (the “Advisor” or “Calvert”) and has provided these Procedures to govern Calvert in its valuation duties.
Calvert has chartered an internal Valuation Committee to oversee the implementation of these Procedures and to assist it in carrying out the valuation responsibilities that the Board has delegated.
The Valuation Committee meets on a regular basis to review illiquid securities and other investments which may not have readily available market prices. The Valuation Committee’s fair valuation determinations are subject to review, approval and ratification by the Board at its next regularly scheduled meeting covering the calendar quarter in which the fair valuation was determined.
26 www.calvert.com CALVERT INCOME FUND SEMI-ANNUAL REPORT (UNAUDITED)
The Valuation Committee utilizes various methods to measure the fair value of the Fund’s investments. Generally Accepted Accounting Principles (GAAP) establishes a disclosure hierarchy that categorizes the inputs to valuation techniques used to value assets and liabilities at measurement date. These inputs are summarized in the three broad levels listed below:
Level 1 - quoted prices in active markets for identical securities
Level 2 - other significant observable inputs (including quoted prices for similar securities, interest rates, prepayment speeds, credit risk, etc.)
Level 3 - significant unobservable inputs (including the Fund’s own assumptions in determining the fair value of investments)
The inputs or methodologies used for valuing securities are not necessarily an indication of the risk associated with investing in those securities.
Changes in valuation techniques may result in transfers in or out of an investment’s assigned level within the hierarchy during the period. There were no such transfers during the period. Valuation techniques used to value the Fund’s investments by major category are as follows:
Debt securities, including restricted securities, are valued based on evaluated prices received from independent pricing services or from dealers who make markets in such securities. For corporate bonds, municipal securities, and U.S. government and government agency obligations, pricing services utilize matrix pricing which considers yield or price of bonds of comparable quality, coupon, maturity and type as well as dealer supplied prices and such securities are generally categorized as Level 2 in the hierarchy. For asset-backed securities, collateralized mortgage-backed obligations, commercial mortgage-backed securities and U.S. government agency mortgage-backed securities, pricing services utilize matrix pricing which considers prepayment speed assumptions, attributes of the collateral, yield or price of bonds of comparable quality, coupon, maturity and type as well as dealer supplied prices and, accordingly, such securities are generally categorized as Level 2 in the hierarchy. Short-term securities of sufficient credit quality with remaining maturities of sixty days or less for which quotations are not readily available are valued at amortized cost, which approximates fair value, and are categorized as Level 2 in the hierarchy.
When independent prices are unavailable or unreliable, debt securities may be valued utilizing pricing matrices which consider similar factors that would be used by independent pricing services. These are generally categorized as Level 2 in the hierarchy but may be Level 3 depending on the circumstances.
Futures contracts are valued at the settlement price established each day by the board of trade or exchange on which they are traded and are categorized as Level 1 in the hierarchy.
If a market value cannot be determined for a security using the methodologies described above, or if, in the good faith opinion of the Advisor, the market value does not constitute a readily available market quotation, or if a significant event has occurred that would materially affect the value of the security, the security will be fair valued as determined in good faith by the Valuation Committee.
The Valuation Committee considers a number of factors, including significant unobservable valuation inputs when arriving at fair value. It considers all significant facts that are reasonably available and relevant to the determination of fair value.
The Valuation Committee primarily employs a market-based approach which may use related or comparable assets or liabilities, recent transactions, market multiples, book values, and
www.calvert.com CALVERT INCOME FUND SEMI-ANNUAL REPORT (UNAUDITED) 27
other relevant information for the investment to determine the fair value of the investment. When more appropriate, the fund may employ an income-based or cost approach. An income-based valuation approach discounts anticipated future cash flows of the investment to calculate a present amount (discounted). The measurement is based on the value indicated by current market expectations about those future amounts. Discounts may also be applied due to the nature or duration of any restrictions on the disposition of the investments. A cost based approach is based on the amount that currently would be required to replace the service capacity of an asset (current replacement cost). From the seller’s perspective, the price that would be received for the asset is determined based on the cost to a buyer to acquire or construct a substitute asset of comparable utility, adjusted for obsolescence.
The values assigned to fair value investments are based on available information and do not necessarily represent amounts that might ultimately be realized. Further, due to the inherent uncertainty of valuations of such investments, the fair values may differ significantly from the values that would have been used had an active market existed, and the differences could be material. The Valuation Committee employs various methods for calibrating these valuation approaches including a regular review of key inputs and assumptions, transactional back-testing or disposition analysis and reviews of any related market activity.
At March 31, 2015, securities valued at $0, or 0.0% of net assets, were fair valued in good faith under the direction of the Board.
The following table summarizes the market value of the Fund’s holdings as of March 31, 2015, based on the inputs used to value them:
|
| | | | | | | | | | | | | | |
| | VALUATION INPUTS |
INVESTMENTS IN SECURITIES* | LEVEL 1 | | LEVEL 2 | | LEVEL 3 | | TOTAL |
| Asset backed securities | __ |
| |
| $122,789,089 |
| | __ |
| |
| $122,789,089 |
|
| Collateralized mortgage-backed obligations | — |
| | 15,641,993 |
| | — |
| | 15,641,993 |
|
| Commercial mortgage-backed securities | — |
| | 40,513,519 |
| | — |
| | 40,513,519 |
|
| Corporate debt | — |
| | 575,436,665 |
| | ** |
| | 575,436,665 |
|
| U.S. government obligations | — |
| | 67,726,673 |
| | — |
| | 61,726,673 |
|
| Other debt obligations | — |
| | 7,870,897 |
| | — |
| | 7,870,897 |
|
| TOTAL | — |
| |
| $829,978,836 |
| | ** |
| |
| $829,978,836 |
|
| Other financial instruments*** |
| $169,643 |
| | — |
| | — |
| |
| $169,643 |
|
| | | | | | | | |
* For a complete listing of investments, please refer to the Statement of Net Assets. ** Level 3 Securities are valued at $0 and represent 0.0% of net assets. *** Other financial instruments are derivative instruments not reflected in the Total Investments in the Statement of Net Assets, such as futures, which are valued at the unrealized appreciation/depreciation of the instrument. |
Loan Participations and Assignments: The Fund may invest in direct debt instruments which are interests in amounts owed to lenders or lending syndicates by corporate, governmental, or other borrowers. A Fund’s investments in loans may be in the form of participations in loans or assignments of all or a portion of loans from third parties. A loan is often administered by a bank or other financial institution (the “lender”) that acts as agent for all holders. The agent administers the terms of the loan, as specified in the loan agreement. A Fund may invest in multiple series or tranches of a loan, which may have varying terms and
28 www.calvert.com CALVERT INCOME FUND SEMI-ANNUAL REPORT (UNAUDITED)
carry different associated risks. A Fund generally has no right to enforce compliance with the terms of the loan agreement with the borrower. As a result, a Fund may be subject to the credit risk of both the borrower and the lender that is selling the loan agreement. When a Fund purchases assignments from lenders it acquires direct rights against the borrower of the loan. When investing in a loan participation, a Fund has the right to receive payments of principal, interest and any fees to which it is entitled only from the lender selling the loan agreement and only upon receipt of payments by the lender from the borrower.
Futures Contracts: The Fund may purchase and sell futures contracts, but only when, in the judgment of the Advisor, such a position acts as a hedge. The Fund may not enter into futures contracts for the purpose of speculation or leverage. These futures contracts may include, but are not limited to, futures contracts based on U.S. Government obligations. The Fund is subject to interest rate risk in the normal course of pursuing its investment objectives. The Fund may use futures contracts to hedge against changes in the value of interest rates. The Fund may enter into futures contracts agreeing to buy or sell a financial instrument for a set price at a future date. Initial margin deposits of either cash or securities as required by the broker are made upon entering into the contract. While the contract is open, daily variation margin payments are made to or received from the broker reflecting the daily change in market value of the contract and are recorded for financial reporting purposes as unrealized gains or losses by the Fund. When a futures contract is closed, a realized gain or loss is recorded equal to the difference between the opening and closing value of the contract. The risks associated with entering into futures contracts may include the possible illiquidity of the secondary market which would limit the Fund’s ability to close out a futures contract prior to the settlement date, an imperfect correlation between the value of the contracts and the underlying financial instruments, or that the counterparty will fail to perform its obligations under the contracts’ terms. Futures contracts are designed by boards of trade which are designated “contracts markets” by the Commodities Futures Trading Commission. Futures contracts trade on the contracts markets in a manner that is similar to the way a stock trades on a stock exchange and the boards of trade, through their clearing corporations, guarantee the futures contracts against default. As a result, there is minimal counterparty credit risk to the Fund. During the period, the Fund used U.S. Treasury Notes futures contracts to hedge against interest rate changes and to manage overall duration of the Fund. The Fund’s futures contracts at period end are presented in the Schedule of Investments.
During the period, the Fund invested in 2 year, 5 year, 10 year, 30 year and Ultra U.S. Treasury Notes and Bond futures. The volume of outstanding contracts has varied throughout the period with a weighted average of 148 contracts and $16,366,287 weighted average notional value.
Short Sales: The Fund may use a hedging technique that involves short sales of U.S. Treasury securities for the purpose of managing the duration of the Fund. Any short sales are covered with an equivalent amount of high-quality, liquid securities.
Security Transactions and Net Investment Income: Security transactions are accounted for on trade date. Realized gains and losses are recorded on an identified cost basis and may include proceeds from litigation. Dividend income is recorded on the ex-dividend date or, in the case of dividends on certain foreign securities, as soon as the Fund is informed of the ex-dividend date. Withholding taxes on foreign dividends have been provided for in accordance with the Fund’s understanding of the applicable country’s tax rules and rates. Distributions received on securities that represent a return of capital or capital gain are recorded as a reduction of cost of investments and/or as a realized gain. Interest income, which includes amortization of premium and accretion of discount on debt securities, is accrued as earned.
www.calvert.com CALVERT INCOME FUND SEMI-ANNUAL REPORT (UNAUDITED) 29
Debt obligations may be placed on non-accrual status and related interest income may be reduced by ceasing current accruals and writing off interest receivables when the collection of all or a portion of interest has become doubtful based on consistently applied procedures. (See the Statement of Net Assets footnotes on page 22.) A debt obligation may be removed from non-accrual status when the issuer resumes interest payments or when collectability of interest is reasonably assured. The Fund earns certain fees in connection with its floating rate loan purchasing activities. These fees are in addition to interest payments earned and may include amendment fees, consent fees and prepayment fees. Investment income and realized and unrealized gains and losses are allocated to separate classes of shares based upon the relative net assets of each class. Expenses arising in connection with a specific class are charged directly to that class. Expenses common to the classes are allocated to each class in proportion to their relative net assets.
Foreign Currency Transactions: The Fund’s accounting records are maintained in U.S. dollars. For valuation of assets and liabilities on each date of net asset value determination, foreign denominations are converted into U.S. dollars using the current exchange rate. Security transactions, income and expenses are translated at the prevailing rate of exchange on the date of the event. The effect of changes in foreign exchange rates on securities and foreign currencies is included in the net realized and unrealized gain or loss on securities and foreign currencies.
Distributions to Shareholders: Distributions to shareholders are recorded by the Fund on ex-dividend date. Dividends from net investment income are paid monthly. Distributions from net realized capital gains, if any, are paid at least annually. Distributions are determined in accordance with income tax regulations which may differ from generally accepted accounting principles; accordingly, periodic reclassifications are made within the Fund’s capital accounts to reflect income and gains available for distribution under income tax regulations.
Estimates: The preparation of the financial statements in conformity with accounting principles generally accepted in the United States requires management to make estimates and assumptions that affect the reported amounts of assets and liabilities and disclosure of contingent assets and liabilities at the date of the financial statements and the reported amounts of income and expenses during the reported period. Actual results could differ from those estimates.
Redemption Fees: The Fund charges a 2% redemption fee on redemptions, including exchanges, made within 30 days of purchase (within seven days for Class I and Class R shares). The redemption fee is accounted for as an addition to paid-in capital. The fee is intended to discourage market-timers by ensuring that short-term trading costs are borne by the investors making the transactions and not the shareholders already in the Fund. This fee was eliminated effective February 2, 2015.
Federal Income Taxes: No provision for federal income or excise tax is required since the Fund intends to continue to qualify as a regulated investment company under the Internal Revenue Code and to distribute substantially all of its taxable earnings.
Management has analyzed the Fund’s tax positions taken for all open federal income tax years and has concluded that no provision for federal income tax is required in the Fund’s financial statements. A Fund’s federal tax return is subject to examination by the Internal Revenue Service for a period of three years.
30 www.calvert.com CALVERT INCOME FUND SEMI-ANNUAL REPORT (UNAUDITED)
NOTE B — RELATED PARTY TRANSACTIONS
Calvert Investment Management, Inc. (the “Advisor”) is wholly-owned by Calvert Investments, Inc., which is indirectly wholly-owned by Ameritas Mutual Holding Company. The Advisor provides investment advisory services and pays the salaries and fees of officers and Trustees of the Fund who are employees of the Advisor or its affiliates. For its services, the Advisor receives an annual fee, payable monthly, based on the following annual rates of average daily net assets: .40% on the first $2 billion, .375% on the next $5.5 billion, .35% on the next $2.5 billion, and .325% over $10 billion. Under the terms of the agreement, $284,567 was payable.
The Advisor has contractually agreed to limit net annual fund operating expenses through January 31, 2016 for Class I, R and Y. The contractual expense caps are .84%, 1.47%, and 1.09%, respectively. For the purpose of this expense limit, operating expenses do not include interest expense, brokerage commissions, taxes and extraordinary expenses. This expense limitation does not limit acquired fund fees and expenses, if any. The Advisor voluntarily reimbursed Class B shares for expenses of $8,766 for the six months ended March 31, 2015. At period end $3,535 was receivable from the Advisor.
Calvert Investment Administrative Services, Inc., an affiliate of the Advisor, provides administrative services to the Fund for an annual fee, payable monthly. Classes A, B, C, R, and Y shares pay an annual rate of .30% on the first $3 billion, .25% on the next $2 billion, and .225% over $5 billion of the combined assets of all classes of the Fund. Class I shares pay an annual rate of .10%, based on their average daily net assets. Under the terms of the agreement, $197,490 was payable at period end.
Calvert Investment Distributors, Inc. (“CID”), an affiliate of the Advisor, is the distributor and principal underwriter for the Fund. Pursuant to Rule 12b-1 under the Investment Company Act of 1940, the Fund has adopted a Distribution Plan that permits the Fund to pay certain expenses associated with the distribution and servicing of its shares. The expenses paid may not exceed .50%, 1.00%, 1.00%, and .75% annually of the Fund’s average daily net assets of Class A, B, C, and R, respectively. The amount actually paid by the Fund is an annualized fee, payable monthly of .25%, 1.00%, 1.00%, and .50% of the Fund’s average daily net assets of Class A, B, C, and R, respectively. Class I and Y shares do not have Distribution Plan expenses. Under the terms of the agreement, $209,611 was payable at period end.
CID received $13,030 as its portion of commissions charged on sales of the Fund’s Class A shares for the six months ended March 31, 2015.
Calvert Investment Services, Inc. (“CIS”), an affiliate of the Advisor, is the shareholder servicing agent for the Fund. For its services, CIS received a fee of $68,439 for the six months ended March 31, 2015. Under the terms of the agreement, $10,962 was payable at period end. Boston Financial Data Services, Inc. is the transfer and dividend disbursing agent.
Each Trustee of the Fund who is not an employee of the Advisor or its affiliates receives an annual retainer of $45,000 plus up to $2,000 for each regular Board and Committee meeting attended. The Board chair and Committee chairs each receive an additional $5,000 annual retainer. Trustees’ fees are allocated to each of the funds served.
NOTE C — INVESTMENT ACTIVITY AND TAX INFORMATION
During the period, the cost of purchases and proceeds from sales of investments, other than short-term and U.S. government securities, were $433,899,986 and $540,060,628, respectively. U.S. government security purchases and sales were $696,811,625 and $661,707,301 respectively.
www.calvert.com CALVERT INCOME FUND SEMI-ANNUAL REPORT (UNAUDITED) 31
|
| | | |
CAPITAL LOSS CARRYFORWARD | |
| |
EXPIRATION DATE | |
| 30-Sep-16 |
| ($3,976,802 | ) |
| 30-Sep-18 | (254,299,863 | ) |
| 30-Sep-19 | (77,128,701 | ) |
| |
| No Expiration Date | |
| Long-term |
| ($239,654,973 | ) |
Under the Regulated Investment Company Modernization Act of 2010, capital losses incurred in taxable years beginning after December 22, 2010 can be carried forward to offset future capital gains for an unlimited period. These losses are required to be utilized prior to the losses incurred in pre-enactment taxable years and will retain their character as either long-term or short-term. Losses incurred in pre-enactment taxable years can be utilized until expiration. The Fund’s use of net capital losses acquired from reorganizations may be limited under certain tax provisions.
As of March 31, 2015, the tax basis components of unrealized appreciation/(depreciation) and the federal tax cost were as follows:
|
| | | |
| Unrealized appreciation |
| $31,263,909 |
|
| Unrealized (depreciation) | (6,521,803 | ) |
| Net unrealized appreciation/(depreciation) |
| $24,742,106 |
|
| | |
| Federal income tax cost of investments |
| $805,236,730 |
|
NOTE D — LINE OF CREDIT
A financing agreement is in place with the Calvert Funds and State Street Corporation (“SSC”). Under the agreement, SSC provides an unsecured line of credit facility, in the aggregate amount of $50 million ($25 million committed and $25 million uncommitted), accessible by the Funds for temporary or emergency purposes only. Borrowings bear interest at the higher of the London Interbank Offered Rate (LIBOR) or the overnight Federal Funds Rate plus 1.25% per annum. A commitment fee of .125% per annum is incurred on the unused portion of the committed facility, which is allocated to all participating funds. The Fund had no loans outstanding pursuant to this line of credit at March 31, 2015. For the six months ended March 31, 2015, borrowings by the Fund under the agreement were as follows:
|
| | | |
AVERAGE DAILY BALANCE | WEIGHTED AVERAGE INTEREST RATE | MAXIMUM AMOUNT BORROWED | MONTH OF MAXIMUM AMOUNT BORROWED |
| $191,444 | 1.35% | $7,020,933 | November 2014 |
NOTE E — REGULATORY MATTERS
In October 2011, the Advisor determined that it was necessary to change the price at which one of the Fund’s portfolio securities was then being fair valued. The Advisor and the Board of Trustees subsequently determined it was appropriate to change the fair value prices at which that security and certain related securities had been carried from March 2008 through September 30, 2011. These fair value revisions had the effect of changing the net asset value per share at which shareholder subscriptions and redemptions were executed during the affected period. Accordingly, in December 2011, pursuant to an agreement (“the Agreement”)
32 www.calvert.com CALVERT INCOME FUND SEMI-ANNUAL REPORT (UNAUDITED)
with the Board of Trustees, the Advisor contributed $12,614,421 to the Fund to adjust shareholder trades occurring during the respective period for the benefit of affected shareholders.
Subsequent to the Agreement, the Securities and Exchange Commission (“SEC”) conducted a compliance examination of the Advisor and the Calvert Funds (“the Funds”). In a letter dated November 1, 2013, the SEC communicated its examination findings that included various deficiencies and weaknesses and concerns regarding whether the contribution and shareholder disbursement, discussed above, was properly calculated and distributed to certain shareholders.
Management of the Advisor and the Funds responded to the SEC examination and believe a number of corrective actions have been taken since October 2011 to address the matters raised in the examination. Also, in management’s opinion, the contribution noted above was properly calculated and distributed by the Fund to benefit the affected shareholders and was in accordance with the Agreement. The SEC is continuing its examination of these matters. It is also management’s opinion that the resolution of the examination matters will not have a material adverse effect on the financial position or results of operations of the Fund.
NOTE F — SUBSEQUENT EVENTS
All existing Class B shares of the Fund were automatically converted to Class A shares of the Fund at the close of business on April 20, 2015, without the imposition of the applicable Class A sales load or the Class B contingent deferred sales charge. Class B shares were closed at that time and are no longer available.
In preparing the financial statements as of March 31, 2015, no other subsequent events or transactions occurred that would have required recognition or disclosure in these financial statements.
www.calvert.com CALVERT INCOME FUND SEMI-ANNUAL REPORT (UNAUDITED) 33
FINANCIAL HIGHLIGHTS
|
| | | | | | | | | | | |
| | | PERIODS ENDED | |
CLASS A SHARES | MARCH 31, 2015 (z) | | SEPTEMBER 30, 2014 (z) | | SEPTEMBER 30, 2013 |
| Net asset value, beginning |
| $16.35 |
| |
| $16.03 |
| |
| $16.56 |
|
| Income from investment operations: | | | | | |
| Net investment income | .23 |
| | .47 |
| | .45 |
|
| Net realized and unrealized gain (loss) | .23 |
| | .32 |
| | (.53 | ) |
| Total from investment operations | .46 |
| | .79 |
| | (.08 | ) |
| Distributions from: | | | | | |
| Net investment income | (.23 | ) | | (.47 | ) | | (.45 | ) |
| Net realized gain | — |
| | — |
| | — |
|
| Total distributions | (.23 | ) | | (.47 | ) | | (.45 | ) |
| Total increase (decrease) in net asset value | .23 |
| | .32 |
| | (.53 | ) |
| Net asset value, ending |
| $16.58 |
| |
| $16.35 |
| |
| $16.03 |
|
| | | | | | |
| Total return* | 2.83 | % | | 4.98 | % | | (.49 | %) |
Ratios to average net assets: A | | | | | |
| Net investment income | 2.78% (a) |
| | 2.86 | % | | 2.73 | % |
| Total expenses | 1.28% (a) |
| | 1.25 | % | | 1.23 | % |
| Expenses before offsets | 1.28% (a) |
| | 1.25 | % | | 1.23 | % |
| Net expenses | 1.28% (a) |
| | 1.25 | % | | 1.23 | % |
| Portfolio turnover | 134 | % | | 214 | % | | 236 | % |
| Net assets, ending (in thousands) |
| $563,587 |
| |
| $615,847 |
| |
| $772,608 |
|
| | | | | | |
|
| | | | | | | | | | | |
| | | | YEARS ENDED | | |
CLASS A SHARES | SEPTEMBER 30, 2012 | | SEPTEMBER 30, 2011 | | SEPTEMBER 30, 2010 |
| Net asset value, beginning |
| $15.77 |
| |
| $16.12 |
| |
| $15.39 |
|
| Income from investment operations: | | | | | |
| Net investment income | .54 |
| | .52 |
| | .53 |
|
| Net realized and unrealized gain (loss) | .79 |
| | (.35 | ) | | .72 |
|
| Total from investment operations | 1.33 |
| | .17 |
| | 1.25 |
|
| Distributions from: | | | | | |
| Net investment income | (.54 | ) | | (.52 | ) | | (.52 | ) |
| Net realized gain | — |
| | — |
| | — |
|
| Total distributions | (.54 | ) | | (.52 | ) | | (.52 | ) |
| Total increase (decrease) in net asset value | .79 |
| | (.35 | ) | | .73 |
|
| Net asset value, ending |
| $16.56 |
| |
| $15.77 |
| |
| $16.12 |
|
| | | | | | |
| Total return* | 8.63 | % | | 1.06 | % | | 8.27 | % |
Ratios to average net assets: A | | | | | |
| Net investment income | 3.33 | % | | 3.20 | % | | 3.33 | % |
| Total expenses | 1.30 | % | | 1.25 | % | | 1.23 | % |
| Expenses before offsets | 1.30 | % | | 1.25 | % | | 1.23 | % |
| Net expenses | 1.30 | % | | 1.25 | % | | 1.23 | % |
| Portfolio turnover | 210 | % | | 223 | % | | 259 | % |
| Net assets, ending (in thousands) |
| $1,077,077 |
| |
| $1,521,374 |
| |
| $2,321,499 |
|
| See notes to financial highlights. |
34 www.calvert.com CALVERT INCOME FUND SEMI-ANNUAL REPORT (UNAUDITED)
FINANCIAL HIGHLIGHTS
|
| | | | | | | | | | | |
| | | PERIODS ENDED | |
CLASS B SHARES | MARCH 31, 2015 (z) | | SEPTEMBER 30, 2014 (z) | | SEPTEMBER 30, 2013 |
| Net asset value, beginning |
| $16.14 |
| |
| $15.94 |
| |
| $16.46 |
|
| Income from investment operations: | | | | | |
| Net investment income | .16 |
| | .33 |
| | .31 |
|
| Net realized and unrealized gain (loss) | .24 |
| | .29 |
| | (.52 | ) |
| Total from investment operations | .40 |
| | .62 |
| | (.21 | ) |
| Distributions from: | | | | | |
| Net investment income | (.17 | ) | | (.42 | ) | | (.31 | ) |
| Net realized gain | — |
| | — |
| | — |
|
| Total distributions | (.17 | ) | | (.42 | ) | | (.31 | ) |
| Total increase (decrease) in net asset value | .23 |
| | .20 |
| | (.52 | ) |
| Net asset value, ending |
| $16.37 |
| |
| $16.14 |
| |
| $15.94 |
|
| | | | | | |
| Total return* | 2.47 | % | | 3.93 | % | | (1.29 | %) |
Ratios to average net assets: A | | | | | |
| Net investment income | 1.94% (a) |
| | 1.99 | % | | 1.83 | % |
| Total expenses | 3.93% (a) |
| | 2.17 | % | | 2.20 | % |
| Expenses before offsets | 2.13% (a) |
| | 2.13 | % | | 2.13 | % |
| Net expenses | 2.13% (a) |
| | 2.13 | % | | 2.13 | % |
| Portfolio turnover | 134 | % | | 214 | % | | 236 | % |
| Net assets, ending (in thousands) |
| $653 |
| |
| $1,278 |
| |
| $4,098 |
|
| | | | | | |
|
| | | | | | | | | | | |
| | | | YEARS ENDED | | |
CLASS B SHARES | SEPTEMBER 30, 2012 | | SEPTEMBER 30, 2011 | | SEPTEMBER 30, 2010 |
| Net asset value, beginning |
| $15.69 |
| |
| $16.05 |
| |
| $15.32 |
|
| Income from investment operations: | | | | | |
| Net investment income | .42 |
| | .37 |
| | .39 |
|
| Net realized and unrealized gain (loss) | .78 |
| | (.34 | ) | | .72 |
|
| Total from investment operations | 1.20 |
| | .03 |
| | 1.11 |
|
| Distributions from: | | | | | |
| Net investment income | (.43 | ) | | (.39 | ) | | (.38 | ) |
| Net realized gain | — |
| | — |
| | — |
|
| Total distributions | (.43 | ) | | (.39 | ) | | (.38 | ) |
| Total increase (decrease) in net asset value | .77 |
| | (.36 | ) | | .73 |
|
| Net asset value, ending |
| $16.46 |
| |
| $15.69 |
| |
| $16.05 |
|
| | | | | | |
| Total return* | 7.78 | % | | .16 | % | | 7.36 | % |
Ratios to average net assets: A | | | | | |
| Net investment income | 2.58 | % | | 2.35 | % | | 2.43 | % |
| Total expenses | 2.17 | % | | 2.11 | % | | 2.10 | % |
| Expenses before offsets | 2.08 | % | | 2.11 | % | | 2.10 | % |
| Net expenses | 2.08 | % | | 2.11 | % | | 2.10 | % |
| Portfolio turnover | 210 | % | | 223 | % | | 259 | % |
| Net assets, ending (in thousands) |
| $10,463 |
| |
| $21,239 |
| |
| $38,770 |
|
| See notes to financial highlights. |
www.calvert.com CALVERT INCOME FUND SEMI-ANNUAL REPORT (UNAUDITED) 35
FINANCIAL HIGHLIGHTS
|
| | | | | | | | | | | |
| | | PERIODS ENDED | |
CLASS C SHARES | MARCH 31, 2015 (z) | | SEPTEMBER 30, 2014 (z) | | SEPTEMBER 30, 2013 |
| Net asset value, beginning |
| $16.34 |
| |
| $16.03 |
| |
| $16.56 |
|
| Income from investment operations: | | | | | |
| Net investment income | .17 |
| | .36 |
| | .34 |
|
| Net realized and unrealized gain (loss) | .24 |
| | .31 |
| | (.53 | ) |
| Total from investment operations | .41 |
| | .67 |
| | (.19 | ) |
| Distributions from: | | | | | |
| Net investment income | (.17 | ) | | (.36 | ) | | (.34 | ) |
| Net realized gain | — |
| | — |
| | — |
|
| Total distributions | (.17 | ) | | (.36 | ) | | (.34 | ) |
| Total increase (decrease) in net asset value | .24 |
| | .31 |
| | (.53 | ) |
| Net asset value, ending |
| $16.58 |
| |
| $16.34 |
| |
| $16.03 |
|
| | | | | | |
| Total return* | 2.55 | % | | 4.19 | % | | (1.19 | %) |
Ratios to average net assets: A | | | | | |
| Net investment income | 2.11% (a) |
| | 2.17 | % | | 2.04 | % |
| Total expenses | 1.95% (a) |
| | 1.94 | % | | 1.92 | % |
| Expenses before offsets | 1.95% (a) |
| | 1.94 | % | | 1.92 | % |
| Net expenses | 1.95% (a) |
| | 1.94 | % | | 1.92 | % |
| Portfolio turnover | 134 | % | | 214 | % | | 236 | % |
| Net assets, ending (in thousands) |
| $101,583 |
| |
| $107,401 |
| |
| $131,920 |
|
| | | | | | |
|
| | | | | | | | | | | |
| | | | YEARS ENDED | | |
CLASS C SHARES | SEPTEMBER 31, 2012 | | SEPTEMBER 30, 2011 | | SEPTEMBER 30, 2010 |
| Net asset value, beginning |
| $15.77 |
| |
| $16.12 |
| |
| $15.38 |
|
| Income from investment operations: | | | | | |
| Net investment income | .42 |
| | .40 |
| | .42 |
|
| Net realized and unrealized gain (loss) | .79 |
| | (.34 | ) | | .73 |
|
| Total from investment operations | 1.21 |
| | .06 |
| | 1.15 |
|
| Distributions from: | | | | | |
| Net investment income | (.42 | ) | | (.41 | ) | | (.41 | ) |
| Net realized gain | — |
| | — |
| | — |
|
| Total distributions | (.42 | ) | | (.41 | ) | | (.41 | ) |
| Total increase (decrease) in net asset value | .79 |
| | (.35 | ) | | .74 |
|
| Net asset value, ending |
| $16.56 |
| |
| $15.77 |
| |
| $16.12 |
|
| | | | | | |
| Total return* | 7.83 | % | | .35 | % | | 7.56 | % |
Ratios to average net assets: A | | | | | |
| Net investment income | 2.61 | % | | 2.50 | % | | 2.62 | % |
| Total expenses | 2.01 | % | | 1.94 | % | | 1.93 | % |
| Expenses before offsets | 2.01 | % | | 1.94 | % | | 1.93 | % |
| Net expenses | 2.01 | % | | 1.94 | % | | 1.93 | % |
| Portfolio turnover | 210 | % | | 223 | % | | 259 | % |
| Net assets, ending (in thousands) |
| $176,600 |
| |
| $213,870 |
| |
| $303,615 |
|
| See notes to financial highlights. |
36 www.calvert.com CALVERT INCOME FUND SEMI-ANNUAL REPORT (UNAUDITED)
FINANCIAL HIGHLIGHTS
|
| | | | | | | | | | | |
| | | PERIODS ENDED | |
CLASS I SHARES | MARCH 31, 2015 (z) | | SEPTEMBER 30, 2014 (z) | | SEPTEMBER 30, 2013 |
| Net asset value, beginning |
| $16.35 |
| |
| $16.04 |
| |
| $16.58 |
|
| Income from investment operations: | | | | | |
| Net investment income | .28 |
| | .57 |
| | .56 |
|
| Net realized and unrealized gain (loss) | .24 |
| | .31 |
| | (.54 | ) |
| Total from investment operations | .52 |
| | .88 |
| | .02 |
|
| Distributions from: | | | | | |
| Net investment income | (.28 | ) | | (.57 | ) | | (.56 | ) |
| Net realized gain | — |
| | — |
| | — |
|
| Total distributions | (.28 | ) | | (.57 | ) | | (.56 | ) |
| Total increase (decrease) in net asset value | .24 |
| | .31 |
| | (.54 | ) |
| Net asset value, ending |
| $16.59 |
| |
| $16.35 |
| |
| $16.04 |
|
| | | | | | |
| Total return* | 3.21 | % | | 5.56 | % | | .09 | % |
Ratios to average net assets: A | | | | | |
| Net investment income | 3.41% (a) |
| | 3.49 | % | | 3.38 | % |
| Total expenses | .65% (a) |
| | .62 | % | | .58 | % |
| Expenses before offsets | .65% (a) |
| | .62 | % | | .58 | % |
| Net expenses | .65% (a) |
| | .62 | % | | .58 | % |
| Portfolio turnover | 134 | % | | 214 | % | | 236 | % |
| Net assets, ending (in thousands) |
| $94,346 |
| |
| $92,982 |
| |
| $96,281 |
|
| | | | | | |
|
| | | | | | | | | | | |
| | | | YEARS ENDED | | |
CLASS I SHARES | SEPTEMBER 30, 2012 | | SEPTEMBER 30, 2011 | | SEPTEMBER 30, 2010 |
| Net asset value, beginning |
| $15.79 |
| |
| $16.14 |
| |
| $15.40 |
|
| Income from investment operations: | | | | | |
| Net investment income | .64 |
| | .63 |
| | .63 |
|
| Net realized and unrealized gain (loss) | .79 |
| | (.34 | ) | | .73 |
|
| Total from investment operations | 1.43 |
| | .29 |
| | 1.36 |
|
| Distributions from: | | | | | |
| Net investment income | (.64 | ) | | (.64 | ) | | (.62 | ) |
| Net realized gain | — |
| | — |
| | — |
|
| Total distributions | (.64 | ) | | (.64 | ) | | (.62 | ) |
| Total increase (decrease) in net asset value | .79 |
| | (.35 | ) | | .74 |
|
| Net asset value, ending |
| $16.58 |
| |
| $15.79 |
| |
| $16.14 |
|
| | | | | | |
| Total return* | 9.29 | % | | 1.78 | % | | 9.05 | % |
Ratios to average net assets: A | | | | | |
| Net investment income | 3.96 | % | | 3.90 | % | | 4.01 | % |
| Total expenses | .66 | % | | .56 | % | | .55 | % |
| Expenses before offsets | .66 | % | | .56 | % | | .55 | % |
| Net expenses | .66 | % | | .56 | % | | .55 | % |
| Portfolio turnover | 210 | % | | 223 | % | | 259 | % |
| Net assets, ending (in thousands) |
| $109,866 |
| |
| $157,548 |
| |
| $261,542 |
|
| See notes to financial highlights. |
www.calvert.com CALVERT INCOME FUND SEMI-ANNUAL REPORT (UNAUDITED) 37
FINANCIAL HIGHLIGHTS
|
| | | | | | | | | | | |
| | | PERIODS ENDED | |
CLASS R SHARES | MARCH 31, 2015 (z) | | SEPTEMBER 30, 2014 (z) | | SEPTEMBER 30, 2013 |
| Net asset value, beginning |
| $16.47 |
| |
| $16.15 |
| |
| $16.67 |
|
| Income from investment operations: | | | | | |
| Net investment income | .21 |
| | .43 |
| | .42 |
|
| Net realized and unrealized gain (loss) | .24 |
| | .32 |
| | (.52 | ) |
| Total from investment operations | .45 |
| | .75 |
| | (.10 | ) |
| Distributions from: | | | | | |
| Net investment income | (.21 | ) | | (.43 | ) | | (.42 | ) |
| Net realized gain | — |
| | — |
| | — |
|
| Total distributions | (.21 | ) | | (.43 | ) | | (.42 | ) |
| Total increase (decrease) in net asset value | .24 |
| | .32 |
| | (.52 | ) |
| Net asset value, ending |
| $16.71 |
| |
| $16.47 |
| |
| $16.15 |
|
| | | | | | |
| Total return* | 2.78 | % | | 4.70 | % | | (.64 | %) |
Ratios to average net assets: A | | | | | |
| Net investment income | 2.59% (a) |
| | 2.63 | % | | 2.49 | % |
| Total expenses | 1.76% (a) |
| | 1.69 | % | | 1.67 | % |
| Expenses before offsets | 1.47% (a) |
| | 1.47 | % | | 1.47 | % |
| Net expenses | 1.47% (a) |
| | 1.47 | % | | 1.47 | % |
| Portfolio turnover | 134 | % | | 214 | % | | 236 | % |
| Net assets, ending (in thousands) |
| $5,425 |
| |
| $5,411 |
| |
| $5,505 |
|
| | | | | | |
|
| | | | | | | | | | | |
| | | | YEARS ENDED | | |
CLASS R SHARES | SEPTEMBER 31, 2012 | | SEPTEMBER 30, 2011 | | SEPTEMBER 30, 2010 |
| Net asset value, beginning |
| $15.88 |
| |
| $16.22 |
| |
| $15.48 |
|
| Income from investment operations: | | | | | |
| Net investment income | .51 |
| | .48 |
| | .49 |
|
| Net realized and unrealized gain (loss) | .79 |
| | (.34 | ) | | .73 |
|
| Total from investment operations | 1.30 |
| | .14 |
| | 1.22 |
|
| Distributions from: | | | | | |
| Net investment income | (.51 | ) | | (.48 | ) | | (.48 | ) |
| Net realized gain | — |
| | — |
| | — |
|
| Total distributions | (.51 | ) | | (.48 | ) | | (.48 | ) |
| Total increase (decrease) in net asset value | .79 |
| | (.34 | ) | | .74 |
|
| Net asset value, ending |
| $16.67 |
| |
| $15.88 |
| |
| $16.22 |
|
| | | | | | |
| Total return* | 8.37 | % | | .88 | % | | 8.01 | % |
Ratios to average net assets: A | | | | | |
| Net investment income | 3.14 | % | | 2.98 | % | | 3.11 | % |
| Total expenses | 1.61 | % | | 1.54 | % | | 1.45 | % |
| Expenses before offsets | 1.47 | % | | 1.47 | % | | 1.45 | % |
| Net expenses | 1.47 | % | | 1.47 | % | | 1.45 | % |
| Portfolio turnover | 210 | % | | 223 | % | | 259 | % |
| Net assets, ending (in thousands) |
| $8,283 |
| |
| $9,340 |
| |
| $12,306 |
|
| See notes to financial highlights. |
38 www.calvert.com CALVERT INCOME FUND SEMI-ANNUAL REPORT (UNAUDITED)
FINANCIAL HIGHLIGHTS
|
| | | | | | | | | | | |
| | | PERIODS ENDED | |
CLASS Y SHARES | MARCH 31, 2015 (z) | | SEPTEMBER 30, 2014 (z) | | SEPTEMBER 30, 2013 |
| Net asset value, beginning |
| $16.52 |
| |
| $16.20 |
| |
| $16.74 |
|
| Income from investment operations: | | | | | |
| Net investment income | .26 |
| | .52 |
| | .52 |
|
| Net realized and unrealized gain (loss) | .24 |
| | .33 |
| | (.54 | ) |
| Total from investment operations | .50 |
| | .85 |
| | (.02 | ) |
| Distributions from: | | | | | |
| Net investment income | (.26 | ) | | (.53 | ) | | (.52 | ) |
| Net realized gain | — |
| | — |
| | — |
|
| Total distributions | (.26 | ) | | (.53 | ) | | (.52 | ) |
| Total increase (decrease) in net asset value | .24 |
| | .32 |
| | (.54 | ) |
| Net asset value, ending |
| $16.76 |
| |
| $16.52 |
| |
| $16.20 |
|
| | | | | | |
| Total return* | 3.07 | % | | 5.28 | % | | (.14 | %) |
Ratios to average net assets: A | | | | | |
| Net investment income | 3.18% (a) |
| | 3.21 | % | | 3.10 | % |
| Total expenses | .88% (a) |
| | .89 | % | | .86 | % |
| Expenses before offsets | .88% (a) |
| | .89 | % | | .86 | % |
| Net expenses | .88% (a) |
| | .89 | % | | .86 | % |
| Portfolio turnover | 134 | % | | 214 | % | | 236 | % |
| Net assets, ending (in thousands) |
| $69,682 |
| |
| $70,426 |
| |
| $63,321 |
|
| | | | | | |
|
| | | | | | | | | | | |
| | | | YEARS ENDED | | |
CLASS Y SHARES | SEPTEMBER 30, 2012 | | SEPTEMBER 30, 2011 | | SEPTEMBER 30, 2010 |
| Net asset value, beginning |
| $15.95 |
| |
| $16.29 |
| |
| $15.53 |
|
| Income from investment operations: | | | | | |
| Net investment income | .61 |
| | .58 |
| | .56 |
|
| Net realized and unrealized gain (loss) | .79 |
| | (.34 | ) | | .76 |
|
| Total from investment operations | 1.40 |
| | .24 |
| | 1.32 |
|
| Distributions from: | | | | | |
| Net investment income | (.61 | ) | | (.58 | ) | | (.56 | ) |
| Net realized gain | — |
| | — |
| | — |
|
| Total distributions | (.61 | ) | | (.58 | ) | | (.56 | ) |
| Total increase (decrease) in net asset value | .79 |
| | (.34 | ) | | .76 |
|
| Net asset value, ending |
| $16.74 |
| |
| $15.95 |
| |
| $16.29 |
|
| | | | | | |
| Total return* | 8.97 | % | | 1.48 | % | | 8.65 | % |
Ratios to average net assets: A | | | | | |
| Net investment income | 3.70 | % | | 3.53 | % | | 3.76 | % |
| Total expenses | .95 | % | | .87 | % | | .83 | % |
| Expenses before offsets | .95 | % | | .87 | % | | .83 | % |
| Net expenses | .95 | % | | .87 | % | | .83 | % |
| Portfolio turnover | 210 | % | | 223 | % | | 259 | % |
| Net assets, ending (in thousands) |
| $85,521 |
| |
| $111,661 |
| |
| $104,674 |
|
| See notes to financial highlights. |
www.calvert.com CALVERT INCOME FUND SEMI-ANNUAL REPORT (UNAUDITED) 39
|
|
A Total expenses do not reflect amounts reimbursed and/or waived by the Advisor or reductions from expense offset arrangements. Expenses before offsets reflect expenses after reimbursement and/or waiver by the Advisor but prior to reductions from expense offset arrangements. Net expenses are net of all reductions and represent the net expenses paid by the Fund. (a) Annualized. (z) Per share figures are calculated using the Average Shares Method. * Total return is not annualized for periods of less than one year and does not reflect deduction of any front-end or deferred sales charge. See notes to financial statements. |
40 www.calvert.com CALVERT INCOME FUND SEMI-ANNUAL REPORT (UNAUDITED)
EXPLANATION OF FINANCIAL TABLES
SCHEDULE OF INVESTMENTS
The Schedule of Investments is a snapshot of all securities held in the fund at their market value, on the last day of the reporting period. Securities are listed by asset type (e.g., common stock, corporate bonds, U.S. government obligations) and may be further broken down into sub-groups and by industry classification.
STATEMENT OF ASSETS AND LIABILITIES
The Statement of Assets and Liabilities is often referred to as the fund’s balance sheet. It lists the value of what the fund owns, is due and owes on the last day of the reporting period. The fund’s assets include the market value of securities owned, cash, receivables for securities sold and shareholder subscriptions, and receivables for dividends and interest payments that have been earned, but not yet received. The fund’s liabilities include payables for securities purchased and shareholder redemptions, and expenses owed but not yet paid. The statement also reports the fund’s net asset value (NAV) per share on the last day of the reporting period. The NAV is calculated by dividing the fund’s net assets (assets minus liabilities) by the number of shares outstanding. This statement is accompanied by a Schedule of Investments. Alternatively, if certain conditions are met, a Statement of Net Assets may be presented in lieu of this statement and the Schedule of Investments.
STATEMENT OF NET ASSETS
The Statement of Net Assets provides a detailed list of the fund’s holdings, including each security’s market value on the last day of the reporting period. The Statement of Net Assets includes a Schedule of Investments. Other assets are added and other liabilities subtracted from the investments total to calculate the fund’s net assets. Finally, net assets are divided by the outstanding shares of the fund to arrive at its share price, or Net Asset Value (NAV) per share.
At the end of the Statement of Net Assets is a table displaying the composition of the fund’s net assets. Paid in Capital is the money invested by shareholders and represents the bulk of net assets. Undistributed Net Investment Income and Accumulated Net Realized Gains usually approximate the amounts the fund had available to distribute to shareholders as of the statement date. Accumulated Realized Losses will appear as negative balances. Unrealized Appreciation (Depreciation) is the difference between the market value of the fund’s investments and their cost, and reflects the gains (losses) that would be realized if the fund were to sell all of its investments at their statement-date -values.
STATEMENT OF OPERATIONS
The Statement of Operations summarizes the fund’s investment income earned and expenses incurred in operating the fund. Investment income includes dividends earned from stocks and interest earned from interest-bearing securities in the fund. Expenses incurred in operating the fund include the advisory fee paid to the investment advisor, administrative services fees, distribution plan expenses (if applicable), transfer agent fees, shareholder servicing expenses, custodial, legal, and audit fees, and the printing and postage expenses related to shareholder reports. Expense offsets (fees paid indirectly) may also be shown. Credits earned from offset arrangements are used to reduce the fund’s expenses. This statement also shows net gains (losses) realized on the sale of investments and the increase or decrease in the unrealized appreciation (depreciation) on investments held during the period.
www.calvert.com CALVERT INCOME FUND SEMI-ANNUAL REPORT (UNAUDITED) 41
STATEMENT OF CHANGES IN NET ASSETS
The Statement of Changes in Net Assets shows how the fund’s total net assets changed during the two most recent reporting periods. Changes in the fund’s net assets are attributable to investment operations, distributions and capital share transactions.
The Operations section of the report summarizes information detailed in the Statement of Operations. The Distribution section shows the dividend and capital gain distributions made to shareholders. The amounts shown as distributions in this section may not match the net investment income and realized gains amounts shown in the Operations section because distributions are determined on a tax basis and certain investments or transactions may be treated differently for financial statement and tax purposes. The Capital Share Transactions section shows the amount shareholders invested in the fund, either by purchasing shares or by reinvesting distributions, and the amounts redeemed. The corresponding numbers of shares issued, reinvested and redeemed are shown at the end of the report.
FINANCIAL HIGHLIGHTS
The Financial Highlights table provides a per-share breakdown per class of the components that affect the fund’s net asset value for current and past reporting periods. The table provides total return, total distributions, expense ratios, portfolio turnover and net assets for the applicable period. Total return is a measure of a fund’s performance that encompasses all elements of return: dividends, capital gain distributions and changes in net asset value. Total return is the change in value of an investment over a given period, assuming reinvestment of any dividends and capital gain distributions, expressed as a percentage of the initial investment. Total distributions include distributions from net investment income and net realized gains. Long-term gains are earned on securities held in the fund more than one year. Short-term gains, on the sale of securities held less than one year, are treated as ordinary dividend income for tax purposes. The expense ratio is a fund’s cost of doing business, expressed as a percentage of net assets. These expenses directly reduce returns to shareholders. Portfolio turnover measures the trading activity in a fund’s investment portfolio—how often securities are bought and sold by a fund. Portfolio turnover is affected by market conditions, changes in the size of the fund, the nature of the fund’s investments and the investment style of the portfolio manager.
PROXY VOTING
The Proxy Voting Guidelines of the Calvert Funds that the Fund uses to determine how to vote proxies relating to portfolio securities are provided as an Appendix to the Fund’s Statement of Additional Information. The Statement of Additional Information can be obtained free of charge by calling the Fund at 1-800-368-2745, by visiting the Calvert website at www.calvert.com; or by visiting the SEC’s website at www.sec.gov.
Information regarding how the Fund voted proxies relating to portfolio securities during the most recent 12-month period ended June 30 is available on the Fund’s website at www.calvert.com and on the SEC’s website at www.sec.gov.
AVAILABILITY OF QUARTERLY PORTFOLIO HOLDINGS
The Fund files its complete schedule of portfolio holdings with the SEC for the first and third quarters of each fiscal year on Form N-Q. The Fund’s Form N-Q is available on the SEC’s website at www.sec.gov. The Fund’s Form N-Q may be reviewed and copied at the SEC’s Public Reference Room in Washington, DC; information on the operation of the Public Reference Room may be obtained by calling 1-800-SEC-0330.
42 www.calvert.com CALVERT INCOME FUND SEMI-ANNUAL REPORT (UNAUDITED)
BASIS FOR BOARD’S APPROVAL OF INVESTMENT ADVISORY CONTRACT
At a meeting held on December 10, 2014, the Board of Trustees, and by a separate vote, the disinterested Trustees, approved the continuance of the Investment Advisory Agreement between The Calvert Fund and the Advisor with respect to the Fund.
In evaluating the Investment Advisory Agreement, the Board considered a variety of information relating to the Fund and the Advisor. The disinterested Trustees reviewed a report prepared by the Advisor regarding various services provided to the Fund by the Advisor and its affiliates. Such report included, among other data, information regarding the Advisor’s personnel and the Advisor’s revenue and cost of providing services to the Fund, and a separate report prepared by an independent third party, which provided a statistical analysis comparing the Fund's investment performance, expenses, and fees to comparable mutual funds.
The disinterested Trustees were separately represented by independent legal counsel with respect to their consideration of the reapproval of the Investment Advisory Agreement. Prior to voting, the disinterested Trustees reviewed the proposed continuance of the Investment Advisory Agreement with management and also met in private sessions with their counsel at which no representatives of management were present.
In the course of its deliberations regarding the Investment Advisory Agreement, the Board considered the following factors, among others: the nature, extent and quality of the services provided by the Advisor, including the personnel providing such services; the Advisor's financial condition; the level and method of computing the Fund's advisory fee; comparative performance, fee and expense information for the Fund; the profitability of the Calvert Family of Funds to the Advisor and its affiliates; the direct and indirect benefits, if any, derived by the Advisor and its affiliates from their relationship with the Fund; the effect of the Fund's growth and size on the Fund's performance and expenses; the affiliated distributor's process for monitoring sales load breakpoints; the Advisor's compliance programs and policies; the Advisor's performance of substantially similar duties for other funds; and any possible conflicts of interest.
In considering the nature, extent and quality of the services provided by the Advisor under the Investment Advisory Agreement, the Board reviewed information provided by the Advisor relating to its operations and personnel, including, among other information, biographical information on the Advisor's investment, supervisory and professional staff and descriptions of its organizational and management structure. The Board also took into account similar information provided periodically throughout the previous year by the Advisor, as well as the Board’s familiarity with management through Board of Trustees’ meetings, discussions and other reports. The Board considered the Advisor’s management style and its performance in employing its investment strategies, as well as its current level of staffing and overall resources. The Board also noted that it reviewed on a quarterly basis information regarding the Advisor’s compliance with applicable policies and procedures, including those related to personal investing. The Advisor's administrative capabilities, including its ability to supervise the other service providers for the Fund, were also considered. The Board also took into account the environmental, social, sustainability and governance research and analysis provided by the Advisor to the Fund. The Board observed that the scope of services provided by the Advisor generally had expanded over time as a result of regulatory, market and other changes. The Board took into consideration, among other factors, the effectiveness of the Fund’s and Advisor’s processes, policies and procedures and the Advisor’s personnel. The Board also took into account, among other items, periodic reports received from the Advisor over the past year concerning the Advisor’s ongoing review and enhancement of certain
www.calvert.com CALVERT INCOME FUND SEMI-ANNUAL REPORT (UNAUDITED) 43
processes, policies and procedures of the Fund and the Advisor. The Board concluded that it was satisfied with the nature, extent and quality of services provided to the Fund by the Advisor under the Investment Advisory Agreement.
In considering the Fund’s performance, the Board noted that it reviewed on a quarterly basis detailed information about the Fund’s performance results, portfolio composition and investment strategies. In addition, the Board took into account overall financial market conditions. The Board also reviewed various comparative data provided to it in connection with its consideration of the renewal of the Investment Advisory Agreement, including, among other information, a comparison of the Fund’s total return with its Lipper index and with that of other mutual funds deemed to be in its peer group by an independent third party in its report. This comparison indicated that the Fund performed below the median of its peer group for the one-, three- and five-year periods ended June 30, 2014. The data also indicated that the Fund underperformed its Lipper index for the one-, three- and five-year periods ended June 30, 2014. The Board took into account management’s discussion of the Fund’s performance and management’s continued monitoring of the Fund’s performance. Based upon its review, the Board concluded that appropriate action was being taken with respect to the Fund’s performance.
In considering the Fund’s fees and expenses, the Board compared the Fund’s fees and total expense ratio with various comparative data for the funds in its peer group. Among other findings, the data indicated that the Fund’s advisory fee (after taking into account waivers and/or reimbursements) was below the median of its peer group and that total expenses (net of waivers and/or reimbursements) were above the median of its peer group. The Board noted that the allocation of advisory and administrative fees may vary among the Fund’s peer group. The Board also took into account the Advisor’s current undertaking to maintain expense limitations for the Fund and that the Advisor was reimbursing a portion of the Fund’s expenses. The Board also noted management’s discussion of the Fund’s expenses and certain factors that affected the level of such expenses, including the cost of providing the environmental, social, sustainability and governance research and analysis provided by the Advisor. Based upon its review, the Board determined that the advisory fee was reasonable in view of the quality of services received by the Fund from the Advisor and the other factors considered.
The Board reviewed the Advisor’s profitability on a fund-by-fund basis. In reviewing the overall profitability of the advisory fee to the Fund’s Advisor, the Board also considered the fact that affiliates of the Advisor provided shareholder servicing, administrative and distribution services to the Fund for which they received compensation. The information considered by the Board included Calvert’s operating profit margin information both before and after tax expenses with respect to the services that the Advisor and its affiliates provided to the Calvert Family of Funds complex. The Board reviewed the profitability of the Advisor’s relationship with the Fund in terms of the total amount of annual advisory fees it received with respect to the Fund and whether the Advisor had the financial wherewithal to continue to provide services to the Fund. The Board noted that the Advisor was reimbursing a portion of the Fund’s expenses. The Board also noted the Advisor’s current undertaking to maintain expense limitations for the Fund. The Board also considered that the Advisor derived benefits to its reputation and other indirect benefits from its relationship with the Fund. Based upon its review, the Board concluded that the Advisor’s and its affiliates’ level of profitability from their relationship with the Fund was reasonable.
The Board considered the effect of the Fund’s current size and its potential growth on its performance and fees. The Board took into account that the Fund’s advisory fee schedule
44 www.calvert.com CALVERT INCOME FUND SEMI-ANNUAL REPORT (UNAUDITED)
contained breakpoints that would reduce the advisory fee rate on assets above specified levels as the Fund’s assets increased. The Board noted that the Fund’s assets were below the asset level at which a breakpoint in its advisory fee would be triggered. The Board also noted that if the Fund’s assets increased over time, the Fund might realize other economies of scale if assets increased proportionally more than certain other expenses.
In reapproving the Investment Advisory Agreement, the Board, including the disinterested Trustees, did not identify any single factor as controlling, and each Trustee may have attributed different weight to various factors.
Conclusions
The Board reached the following conclusions regarding the Investment Advisory Agreement, among others: (a) the Advisor has demonstrated that it possesses the capability and resources to perform the duties required of it under the Investment Advisory Agreement; (b) the Advisor maintains appropriate compliance programs; (c) appropriate action is being taken with respect to the Fund’s performance; (d) the Advisor is likely to execute its investment strategies consistently over time; and (e) the Fund's advisory fee is reasonable in view of the quality of services received by the Fund from the Advisor and the other factors considered. Based on its conclusions, the Board determined that reapproval of the Investment Advisory Agreement would be in the best interests of the Fund and its shareholders.
www.calvert.com CALVERT INCOME FUND SEMI-ANNUAL REPORT (UNAUDITED) 45
To Open an Account
800-368-2748
Service for Existing Account
Shareholders: 800-368-2745
Brokers: 800-368-2746
TDD for Hearing Impaired
800-541-1524
Registered Mail
Calvert Investments
c/o BFDS,
P.O. Box 219544
Kansas City, MO 64121-9544
Overnight Mail
Calvert Investments
c/o BFDS,
330 West 9th Street
Kansas City, MO 64105
Web Site
www.calvert.com
Principal Underwriter
Calvert Investment Distributors, Inc.
4550 Montgomery Avenue
Suite 1000 North
Bethesda, Maryland 20814
|
| | | |
CALVERT INCOME FUND | CALVERT’S FAMILY OF FUNDS | | |
| | Municipal Funds Tax-Free Bond Fund Taxable Bond Funds Bond Portfolio Income Fund Short Duration Income Fund Long-Term Income Fund Ultra-Short Income Fund High Yield Bond Fund Green Bond Fund Unconstrained Bond Fund Balanced and Asset Allocation Funds Balanced Portfolio Conservative Allocation Fund Moderate Allocation Fund Aggressive Allocation Fund | | Equity Funds Large Cap Core Portfolio Equity Portfolio Large Cap Value Fund Social Index Fund Capital Accumulation Fund International Equity Fund Small Cap Fund Global Energy Solutions Fund Global Water Fund International Opportunities Fund Equity Income Fund Emerging Markets Equity Fund |
| | |
This report is intended to provide fund information to shareholders. It is not authorized for distribution to prospective investors unless preceded or accompanied by a prospectus.
Note: The information on our website is not incorporated by reference into this report; our website address is included as an inactive textual reference only.
Investors should carefully consider the investment objectives, risks, charges and expenses of the Calvert Funds. This and other important information is contained in the fund’s summary prospectus and prospectus, which can be obtained from your financial professional and should be read carefully before investing. You may also call Calvert at 800/368-2748 or visit www. calvert.com.
Printed on recycled paper using soy inks.
|
| | |
| | |
| | | |
| Calvert Short Duration Income Fund | | |
| | | |
| | |
|
| |
Semi-Annual Report March 31, 2015
E-Delivery Sign-Up — Details Inside | |
Choose Planet-friendly E-delivery!
Sign up now for on-line statements, prospectuses, and fund reports. In less than five minutes you can help reduce paper mail and lower fund costs.
Just go to www.calvert.com. If you already have an online account at Calvert, click on Login, to access your Account, and select the documents you would like to receive via e-mail.
If you’re new to online account access, click on Login, then Register to create your user name and password. Once you’re in, click on the E-delivery sign-up on the Account Portfolio page and follow the quick, easy steps.
Note: if your shares are not held directly at Calvert but through a brokerage firm, you must contact your broker for electronic delivery options available through their firm.
|
| | | |
| TABLE OF CONTENTS |
| | | | |
| | | | President's Letter |
| | | | Portfolio Management Discussion |
| | | | Shareholder Advocacy Update |
| | | | Shareholder Expense Example |
| | | | Statement of Net Assets |
| | | | Statement of Operations |
| | | | Statements of Changes in Net Assets |
| | | | Notes to Financial Statements |
| | | | Financial Highlights |
| | | | Explanation of Financial Tables |
| | | | Proxy Voting |
| | | | Availability of Quarterly Portfolio Holdings |
| | | | Basis for Board’s Approval of Investment Advisory Contract |
|
| |
| John Streur President and Chief Executive Officer, Calvert Investments, Inc. |
Dear Calvert Shareowner,
The United States economy improved throughout 2014 and into the first quarter of 2015, while major economies in other regions of the world struggled to regain momentum or saw slowing growth. It is still too early to declare victory, but one may say that while the United States led the world into financial crisis nearly eight years ago, the innovative and aggressive responses to the crisis by our policymakers are allowing the United States to recover more quickly. Granted, the United States has the benefit of possessing the world’s reserve currency and our monetary maneuvers in our self-interest are not without cost to economies in other regions.
As 2014 drew to a close, the United States was winding down the quantitative easing portion of its post-crisis monetary policy while the European and Japanese central banks were finding it necessary to increase their own forms of quantitative easing in efforts to support asset prices and spur economic growth.
The impact of modestly improving economic activity in the U.S. and ongoing low global interest rates on financial assets in 2014 created positive returns for most stocks and bonds for the previous 12 months, a condition that gave benefit to most Calvert Funds. The exceptions are assets tied to the price of oil, which collapsed during the second half of the year. Energy industries and natural resource based companies, including renewable energy companies and water related companies, saw their stock valuations drop in reaction.
Across our fixed income and equity strategies, Calvert finds more utility in conducting fundamental research in order to find relative values in securities of individual companies than we do in attempting to anticipate or time changes in global economic indicators. Broadly, we are mindful of the fact that stocks and bonds have benefitted substantially from the easy monetary policies and ultra-low interest rates of the post-crisis era. We believe markets are more or less fairly valued and we have taken steps seeking to moderate the risk across our portfolios.
As I take the helm at Calvert and look back at the 39 years since the firm’s founding in 1976, I note the substantial growth in the world’s population, the massive increase in the industrialization of our global society, and the associated change in the role of corporations in societal and environmental outcomes for our future.
4 www.calvert.com CALVERT SHORT DURATION INCOME FUND SEMI-ANNUAL REPORT (UNAUDITED)
Public companies have created tremendous net benefits to society through advances in health care, food systems, energy efficiency, communications and technology, and access to finance and other products and services too vast to detail. Hundreds of millions of people throughout the world have seen their standard of living increased through benefits created by corporate activity.
Along with the obvious net benefits to society, we are aware of the substantial stresses placed upon society and the environment from corporate behaviors. At the same time, society has awarded corporations an increasingly prominent role in the day-to-day outcomes of our lives and in the societal and environmental outcomes that will determine the future direction of the world.
Calvert, as a global investment management firm and a steward of client assets, has a growing and evolving role as a leader in responsible investing. Calvert has a rich history as a socially responsible investor and has made many contributions to public policy and corporate governance. Today we are bringing Calvert’s deep expertise in socially responsible investing, public and private policy work, and investment management to a new level with a focus on developing principles and setting standards for use in our investment management processes, our active ownership and engagement discipline and within our investment risk management processes.
As a long-term investor with unique insights into environmental, social, and governance activities of companies throughout the world, Calvert is able to develop a holistic view of companies’ operations. Our ability to use our insights for the benefit of the stewardship of client assets, both to produce desirable investment outcomes for our clients and to assist companies in evolving their role in society along a responsible path has never been more important.
As fellow shareowners of Calvert Funds, you and I know that it is essential to pursue the type of enduring value that Calvert seeks to create, through excellence in financial results balanced with the evolving needs of society and the environment.
Thank you for your share ownership in Calvert Funds; all of us at Calvert Investments, Inc. appreciate the confidence and trust you have placed in us.
John Streur
April 2015
www.calvert.com CALVERT SHORT DURATION INCOME FUND SEMI-ANNUAL REPORT (UNAUDITED) 5
|
| |
| PORTFOLIO MANAGEMENT DISCUSSION |
|
| |
| Catherine Roy, CFA Senior Vice President and Chief Investment Officer, Fixed Income |
Investment Climate
A very divergent economic picture between the United States and much of the rest of the world prompted central bank actions that affected global currencies and drove financial-market returns over the six-month reporting period. The markets also reacted to new information on key geopolitical situations, notably in the Ukraine.
The economic divergence theme was apparent in Europe, which featured consumer price deflation in many countries. China and Japan also experienced slower growth. In the United States, economic growth pulled back from the strong pace set in mid-2014 to a rate more in line with the Fed’s projected long-run average of 2.2%. While modest, this growth rate was superior to that of many other countries. The U.S. headline Consumer Price Index, which measures inflation excluding volatile food and energy prices, became slightly negative towards the end of the reporting period.
In January, the European Central Bank (ECB) announced a long-awaited quantitative easing program, which had significant market impact. In anticipation of the January ECB decision, some other European central banks, as well as Japan and China, increased monetary accommodation through interest-rate cuts and/or expanded bond purchase programs. In stark contrast, the U.S. Federal Reserve prepared markets for a small and slow series of interest-rate increases, slated to start sometime in 2015. The Fed anticipates that extremely low domestic inflation will be transitory, driven by the drop in energy prices, and is not a problem brought on by lack of consumer demand. In addition, the U.S. labor market is relatively strong, which has long been one condition the Fed required to start a slow removal of monetary accommodation.
Big moves in the world’s major currencies were a byproduct of these central bank actions. In the middle of 2014, the U.S. dollar began a sharp climb against other currencies that drove it to multi-year highs. The Bloomberg DXY, an index that measures the dollar against major currencies, appreciated 14.5% over the six-month reporting period. Tightly correlated to the dollar’s rally was a sharp drop in the price of oil—a market set up for a price collapse due to a massive demand-supply imbalance.
Bonds Provided Positive Returns
The global fixed-income markets generally reacted positively to the ECB-led central bank easing. U.S. bond yields gyrated over the reporting period, but at the end tended to be lower and so bond returns were positive.
6 www.calvert.com CALVERT SHORT DURATION INCOME FUND SEMI-ANNUAL REPORT (UNAUDITED)
|
| | | | |
| | | | |
| | CALVERT SHORT DURATION INCOME FUND | |
| | MARCH 31, 2015 | |
| | | | |
| | ECONOMIC SECTORS | % OF TOTAL INVESTMENTS | |
| | Corporate | 57.0 | % | |
| | Financial Institutions | 23.1 | % | |
| | Industrial | 33.8 | % | |
| | Utility | 0.1 | % | |
| | Government Related | 0.2 | % | |
| | Agency | 0.2 | % | |
| | Securitized | 33.3 | % | |
| | Asset-Backed Securities | 19.5 | % | |
| | Commercial Mortgage-Backed Securities | 12.2 | % | |
| | Mortgage-Backed Pass-Through | 1.6 | % | |
| | Short-Term Investments | 2.8 | % | |
| | Treasury | 6.7 | % | |
| | Total | 100 | % | |
| | | | |
The ten-year T-note yield fell 58 basis points1 (bps) to 1.94%, while the 30-year fixed-rate mortgage average fell 50 bps to 3.69%. The Barclays U.S. Credit Index average yield declined 18 bps to 2.83%.
In terms of total return, the Barclays Long Credit Index rose 7.24%, the broad intermediate Barclays U.S. Credit Index returned 3.96%, and the shorter-term Barclays 1-5 Year U.S. Credit Index was up 1.48%. The Barclays US Aggregate Index returned 3.43% and the Bank of America Merrill Lynch High Yield Master II Index was little changed, up 1.45%.
Outlook
The United States economy is expanding moderately and has weathered global weakness better than other most other major economies. The 5.5% headline unemployment rate is just above the Federal Open Market Commission’s (FOMC) long-term target range. Wage growth is modest but steady.
|
| | | | | | |
| | | | | |
| | CALVERT SHORT DURATION INCOME FUND | |
| | MARCH 31, 2015 | |
| | | | | |
| | INVESTMENT PERFORMANCE | |
| | (TOTAL RETURN AT NAV*) | |
| | | 6 MONTHS ENDED 3/31/15 | 12 MONTHS ENDED 3/31/15
| |
| | Class A | 0.75 | % | 0.95 | % | |
| | Class C | 0.38 | % | 0.20 | % | |
| | Class I | 1.09 | % | 1.57 | % | |
| | Class Y | 0.91 | % | 1.23 | % | |
| | | | | |
| | Barclays 1-5 Year U.S. Credit Index | 1.48 | % | 2.35 | % | |
| | | | | |
| | Lipper Short Investment Grade Debt Funds Average | 0.55 | % | 0.93 | % | |
| | | | | |
| | | 30 DAYS ENDED | |
| | SEC YIELD | 3/31/15 | 9/30/14 | |
| | Class A | 1.37 | % | 1.36 | % | |
| | Class C | 0.48 | % | 0.66 | % | |
| | Class I | 1.97 | % | 2.04 | % | |
| | Class Y | 1.66 | % | 1.64 | % | |
| | | |
| | * Investment performance/return at NAV does not reflect the deduction of the Fund’s maximum 2.75% front-end sales charge or any deferred sales charge. | |
| | | | | |
The labor-force participation rate, however, remains low—influenced by demographics and the long-term loss of traditional middle-wage jobs to overseas competition and automation. Workers in general, however, are in improved bargaining positions. The Fed’s benchmark consumer inflation rate hovers around zero, sharply below the 2% target.
Despite another cold winter, U.S. economic growth in 2015 could approach 3% in the absence of a material systemic shock. We expect inflation to continue well below the Fed’s 2% target. Improvement in the labor market should continue, with unemployment below 5.5%. Discord on Capitol Hill
www.calvert.com CALVERT SHORT DURATION INCOME FUND SEMI-ANNUAL REPORT (UNAUDITED) 7
promises to add some uncertainty to late-summer debt-ceiling negotiations. Household consumption remains the major engine of growth and should be supported by lower energy prices. Lower energy prices, however, are likely to depress earnings and investment from energy-industry companies and the much-stronger dollar may dampen overall U.S. corporate earnings. Housing-sector activity remains a disappointment, despite very low mortgage rates, and residential mortgage lending remains relatively restrained in the post-crisis market. The U.S. trade situation may deteriorate given continued strength of the dollar, which could drive up import costs.
If U.S. data trends hold, within the context of the global backdrop of disinflation and central bank easing, we expect the Fed to raise short-term interest rates by late 2015. If lift-off is in 2015, however, we expect no more than two quarter-point increases over the balance of the year. If the weaker global picture and price disinflation persist, there is a reasonable chance the Fed will delay any rate increases into 2016.
Over the longer term, we expect the benchmark 10-year T-note yield to fluctuate between 2% and 3%, influenced by the trend in economic data surprises, major central bank forward guidance, expected low global inflation rates, and flows in global fixed-income markets. We expect short-term money markets rates to remain close to zero percent for much of 2015.
Calvert Investment Management, Inc.
April 2015
1. A basis point is 0.01 percentage points.
|
| | | | |
| | | | |
| | CALVERT SHORT DURATION INCOME FUND | |
| | MARCH 31, 2015 | |
| | | | |
| | AVERAGE ANNUAL TOTAL RETURNS | |
| | | | |
| | CLASS A SHARES | (WITH MAX. LOAD) | |
| | One year | -1.82 | % | |
| | Five year | 1.77 | % | |
| | Ten year | 3.47 | % | |
| | | | |
| | CLASS C SHARES | (WITH MAX. LOAD) | |
| | One year | -0.80 | % | |
| | Five year | 1.58 | % | |
| | Ten year | 2.96 | % | |
| | | | |
| | CLASS I SHARES* | | |
| | One year | 1.57 | % | |
| | Five year | 2.93 | % | |
| | Ten year | 4.24 | % | |
| | | | |
| | CLASS Y SHARES** | | |
| | One year | 1.23 | % | |
| | Five year | 2.66 | % | |
| | Ten year | 3.96 | % | |
| | | | |
| | * Note Regarding Class I Shares Total Returns: There were times during the reporting period when there were no shareholders in Class I. For purposes of reporting Average Annual Total Return, Class A performance at NAV (i.e. does not reflect deduction of the Class A front-end sales charge) is used during these periods in which there were no shareholders in Class I. For purposes of this Average Annual Total Return, the Class A performance at NAV was used during the period November 7, 2005 through April 21, 2006. ** Calvert Short Duration Income Fund first offered Class Y shares beginning on February 29, 2008. Performance prior to February 29, 2008 reflects the performance of Class A shares at net asset value (NAV). Actual Class Y share performance would have been different. | |
| | | | |
8 www.calvert.com CALVERT SHORT DURATION INCOME FUND SEMI-ANNUAL REPORT (UNAUDITED)
Growth of $10,000
The graph below shows the value of a hypothetical $10,000 investment in the Fund over the past 10 fiscal year periods. The results shown are for Class A shares and reflect the deduction of the maximum front-end Class A sales charge of 2.75%, and assume the reinvestment of dividends. The result is compared with benchmarks that include a broad based market index and a Lipper peer group average. Market indexes are unmanaged and their results do not reflect the effect of expenses or sales charges. The Lipper average reflects the deduction of the category’s average front-end sales charge. The value of an investment in a different share class would be different.
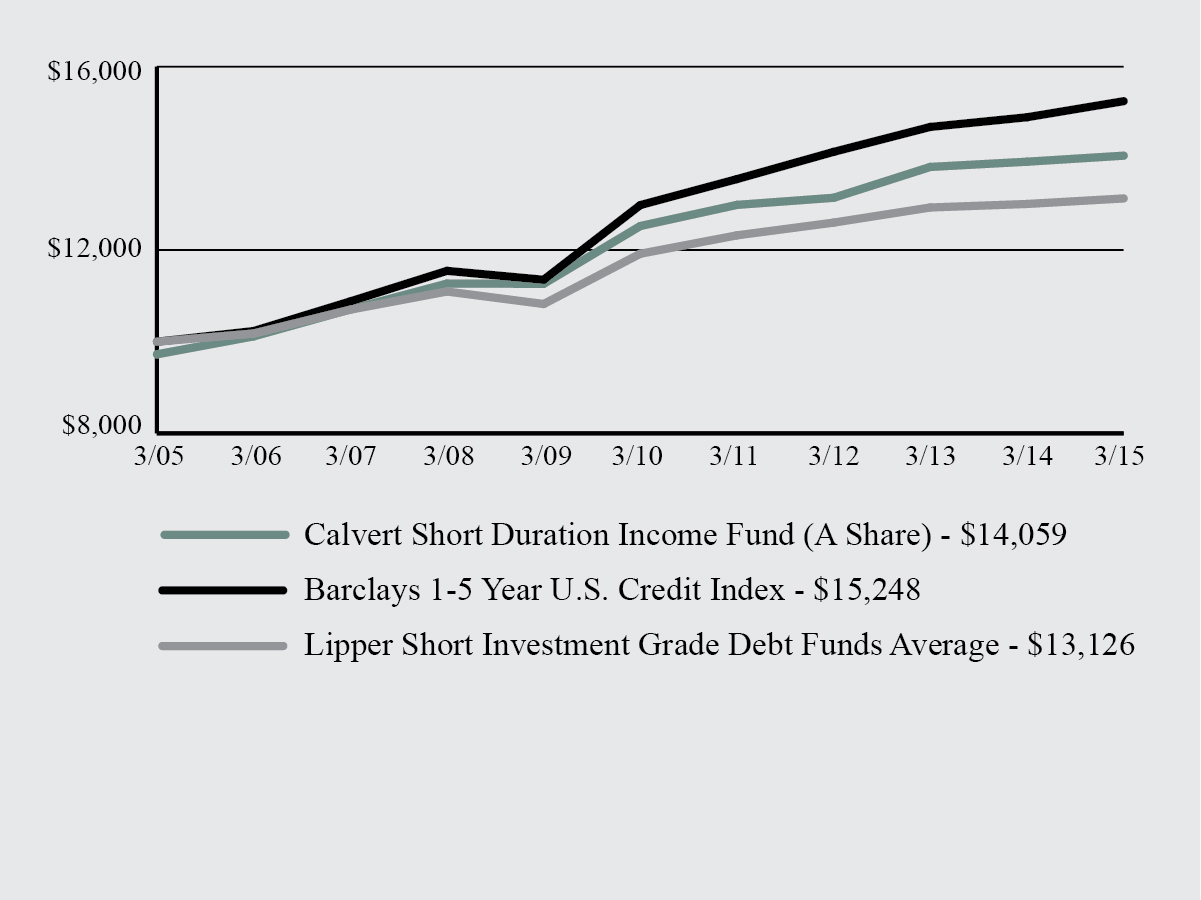
All performance data shown, including the graph above and the adjacent table, represents past performance, does not guarantee future results, assumes reinvestment of dividends and distributions and does not reflect the deduction of taxes that a shareholder would pay on the Fund’s distributions or the redemption of the Fund shares. All performance data reflects fee waivers and/or expense limitations, if any are in effect; in their absence performance would be lower. See Note B in Notes to Financial Statements. The investment return and principal value of an investment will fluctuate so that an investor’s shares, when redeemed, may be worth more or less than their original cost. Current performance may be lower or higher than the performance data quoted; for current performance data visit www.calvert.com. The gross expense ratio from the current prospectus for Class A shares is 1.14%. This number may differ from the expense ratio shown elsewhere in this report because it is based on a different time period and, if applicable, does not include fee or expense waivers. Performance data quoted already reflects the deduction of the Fund’s operating expenses.
www.calvert.com CALVERT SHORT DURATION INCOME FUND SEMI-ANNUAL REPORT (UNAUDITED) 9
SHAREHOLDER ADVOCACY UPDATE
2014 Corporate Diversity Report Findings Released
In March, Calvert published its 2014 survey findings on the corporate diversity practices of the largely multinational companies that make up the Standard & Poor’s 100 Index (S&P 100), in follow-up to reports published in 2012 and 2010. Calvert believes companies that fully commit to providing a fair and equitable working environment will recognize gains in both the workplace and marketplace.
Key findings from the 2014 survey include:
| |
| • | Milestone for women in the board room. In 2014, every company in the S&P 100 had at least one woman on its board of directors. In addition, there was a 17% increase in companies with three or more women and/or minorities on their boards. |
| |
| • | Diversity commitment on the rise. In the past two years, top scores related to overall corporate commitment have increased by 45%.This stems primarily from greater board oversight of diversity initiatives and increased CEO and/or chair involvement. |
| |
| • | LGBT policies have advanced overall. However, initiatives for persons with disabilities continue to fall behind other groups. |
Overall, in 2014, we saw growing commitment to women and minority employees, momentum around family-friendly work environments, and accelerated progress in support of LGBT employees. Looking ahead, we hope to see enhanced corporate diversity commitments, greater representation of women and minorities on boards, improved EEO1-disclosure, and expanded diversity initiatives for persons with disabilities.
To learn the highest- and lowest-rated companies in the report, A Survey of Corporate Diversity Practices of the S&P 100, and to find out more about the report’s methodology and findings, visit www.calvert.com.
2015 Shareholder Resolutions
Building on our initiatives from 2014, Calvert was the lead filer on 38 shareholder resolutions for the 2015 proxy season, and co-filer on another 18 proposals. Key topics include “big data” and civil rights issues, sustainability reporting, board of director oversight of environmental and social matters, water risk, climate change and greenhouse gas emissions reductions, supply chain labor issues, and board diversity.
Specifically, Calvert asked 14 companies to set a goal and a timeline for reducing their greenhouse gas emissions and filed seven proposals asking companies to issue a sustainability report describing their environmental, social and governance (ESG) performance and goals. To push for improved boardroom diversity, Calvert filed six proposals with companies requesting they report on their plans to increase minority and women Board representation and assess the effectiveness of these efforts. We also filed seven proposals requesting that companies assess and manage the civil rights’ risks related to their use of big data, which refers to data sets so large or complex that traditional data processing applications are inadequate. We also filed proposals on water risk in the agricultural supply chain and on developing a sustainable agriculture policy.
To keep abreast of the outcomes of these 2015 shareholder resolutions, as well as Calvert’s proxy voting and public policy initiatives, visit the “Resources” section on www.calvert.com.
10 www.calvert.com CALVERT SHORT DURATION INCOME FUND SEMI-ANNUAL REPORT (UNAUDITED)
SHAREHOLDER EXPENSE EXAMPLE
As a shareholder of the Fund, you incur two types of costs: (1) transaction costs, including sales charges (loads) and redemption fees; and (2) ongoing costs, including management fees; distribution (12b-1) fees; and other Fund expenses. This Example is intended to help you understand your ongoing costs (in dollars) of investing in the Fund and to compare these costs with the ongoing costs of investing in other mutual funds.
This Example is based on an investment of $1,000 invested at the beginning of the period and held for the entire period (October 1, 2014 to March 31, 2015).
Actual Expenses
The first line of the table below provides information about actual account values and actual expenses. You may use the information in this line, together with the amount you invested, to estimate the expenses that you paid over the period. Simply divide your account value by $1,000 (for example, an $8,600 account value divided by $1,000 = 8.6), then multiply the result by the number in the first line under the heading entitled “Expenses Paid During Period” to estimate the expenses you paid on your account during this period.
Hypothetical Example for Comparison Purposes
The second line of the table below provides information about hypothetical account values and hypothetical expenses based on the Fund’s actual expense ratio and an assumed rate of return of 5% per year before expenses, which is not the Fund’s actual return. The hypothetical account values and expenses may not be used to estimate the actual ending account balance or expenses you paid for the period. You may use this information to compare the ongoing costs of investing in the Fund and other funds. To do so, compare the 5% hypothetical example with the 5% hypothetical examples that appear in the shareholder reports of the other funds.
Please note that the expenses shown in the table are meant to highlight your ongoing costs only and do not reflect any transactional costs, such as sales charges (loads), or redemption fees. Therefore, the second line of the table is useful in comparing ongoing costs only, and will not help you determine the relative total costs of owning different funds. In addition, if these transactional costs were included, your costs would have been higher.
www.calvert.com CALVERT SHORT DURATION INCOME FUND SEMI-ANNUAL REPORT (UNAUDITED) 11
|
| | | |
| | BEGINNING ACCOUNT VALUE 10/1/14 | ENDING ACCOUNT VALUE 3/31/15 | EXPENSES PAID DURING PERIOD* 10/1/14 - 3/31/15 |
CLASS A | | | |
| Actual | $1,000.00 | $1,007.53 | $5.41 |
| Hypothetical | $1,000.00 | $1,019.55 | $5.44 |
| (5% return per year before expenses) | | | |
| | | | |
CLASS C | | | |
| Actual | $1,000.00 | $1,003.77 | $9.08 |
| Hypothetical | $1,000.00 | $1,015.87 | $9.13 |
| (5% return per year before expenses) | | | |
| | | | |
CLASS I | | | |
| Actual | $1,000.00 | $1,010.86 | $2.49 |
| Hypothetical | $1,000.00 | $1,022.46 | $2.50 |
| (5% return per year before expenses) | | | |
| | | | |
CLASS Y | | | |
| Actual | $1,000.00 | $1,009.10 | $3.80 |
| Hypothetical | $1,000.00 | $1,021.15 | $3.82 |
| (5% return per year before expenses) | | | |
| | | | |
* Expenses are equal to the Fund’s annualized expense ratio of 1.08%, 1.82%, 0.50%, and 0.76% for Class A, Class C, Class I, and Class Y, respectively, multiplied by the average account value over the period, multiplied by 182/365 (to reflect the one-half year period).
|
12 www.calvert.com CALVERT SHORT DURATION INCOME FUND SEMI-ANNUAL REPORT (UNAUDITED)
STATEMENT OF NET ASSETS
MARCH 31, 2015
|
| | | | | | |
ASSET-BACKED SECURITIES - 23.0% | PRINCIPAL AMOUNT | VALUE |
| | | |
| ALM XII Ltd., 1.749%, 4/16/27 (e)(r) |
| $8,200,000 |
|
| $8,195,900 |
|
| American Credit Acceptance Receivables Trust: | | |
| 1.45%, 4/16/18 (e) | 3,539,894 |
| 3,541,222 |
|
| 0.99%, 8/10/18 (e) | 1,776,338 |
| 1,775,597 |
|
| 5.91%, 7/15/19 (e) | 4,500,000 |
| 4,503,326 |
|
| 2.39%, 11/12/19 (e) | 3,820,000 |
| 3,834,016 |
|
| American Homes 4 Rent: | | |
| 1.60%, 6/17/31 (e)(r) | 2,000,000 |
| 1,981,680 |
|
| 2.00%, 6/17/31 (e)(r) | 2,000,000 |
| 1,985,024 |
|
| 2.35%, 6/17/31 (e)(r) | 2,920,000 |
| 2,925,925 |
|
Applebee’s Funding LLC / IHOP Funding LLC, 4.277%, 9/5/44 (e) | 5,250,000 |
| 5,433,992 |
|
Avis Budget Rental Car Funding AESOP LLC, 3.29%, 2/20/21 (e) | 6,000,000 |
| 5,833,086 |
|
| BCC Funding VIII LLC, 1.794%, 6/20/20 (e) | 2,772,346 |
| 2,759,316 |
|
| Blue Elephant Loan Trust, 3.12%, 12/15/22 (e) | 4,000,000 |
| 3,991,200 |
|
| BXG Receivables Note Trust, 2.88%, 5/2/30 (e) | 4,915,135 |
| 4,919,558 |
|
| Capital Automotive REIT, 5.73%, 12/15/38 (e) | 4,686,375 |
| 4,988,899 |
|
| Carfinance Capital Auto Trust, 3.15%, 8/15/19 (e) | 7,250,000 |
| 7,364,543 |
|
| CKE Restaurant Holdings, Inc., 4.474%, 3/20/43 (e) | 12,028,000 |
| 12,418,056 |
|
| CLI Funding V LLC, 3.38%, 10/18/29 (e) | 6,708,333 |
| 6,804,229 |
|
| Colony American Homes, 1.525%, 7/17/31 (e)(r) | 5,100,000 |
| 5,049,944 |
|
| Consumer Credit Origination Loan Trust, 2.82%, 3/15/21 (e) | 6,872,133 |
| 6,897,340 |
|
| CPS Auto Receivables Trust: | | |
| 2.78%, 6/17/19 (e) | 372,888 |
| 376,585 |
|
| 1.31%, 6/15/20 (e) | 1,023,886 |
| 1,016,686 |
|
| CPS Auto Trust, 1.82%, 9/15/20 (e) | 2,313,247 |
| 2,303,108 |
|
| Credit Acceptance Auto Loan Trust, 2.61%, 1/17/23 (e) | 2,500,000 |
| 2,510,515 |
|
| Cronos Containers Program I Ltd., 3.27%, 11/18/29 (e) | 5,777,778 |
| 5,860,024 |
|
| DB Master Finance LLC, 3.262%, 2/20/45 (e) | 8,000,000 |
| 8,077,360 |
|
| Diamond Resorts Owner Trust, 2.98%, 5/20/27 (e) | 3,275,650 |
| 3,286,423 |
|
| Domino’s Pizza Master Issuer LLC, 5.216%, 1/25/42 (e) | 4,831,250 |
| 5,023,456 |
|
| DT Auto Owner Trust: | | |
| 1.67%, 2/15/19 (e) | 216,312 |
| 216,384 |
|
| 1.88%, 4/15/19 (e) | 4,000,000 |
| 4,013,352 |
|
| Eagle I Ltd., 2.57%, 12/15/39 (e) | 7,500,000 |
| 7,489,500 |
|
| Element Rail Leasing I LLC, 2.299%, 4/19/44 (e) | 6,042,286 |
| 6,017,319 |
|
| Ellington Loan Acquisition Trust, 1.074%, 5/25/37 (e)(r) | 1,758,656 |
| 1,746,439 |
|
| Exeter Automobile Receivables Trust: | | |
| 3.18%, 3/15/17 (e) | 489,198 |
| 489,640 |
|
| 1.49%, 11/15/17 (e) | 1,362,498 |
| 1,364,976 |
|
| Flagship Credit Auto Trust, 1.32%, 4/16/18 (e) | 944,966 |
| 945,833 |
|
www.calvert.com CALVERT SHORT DURATION INCOME FUND SEMI-ANNUAL REPORT (UNAUDITED) 13
|
| | | | | | |
ASSET-BACKED SECURITIES - CONT’D | PRINCIPAL AMOUNT | VALUE |
| | | |
| FRS I LLC: | | |
| 1.80%, 4/15/43 (e) |
| $3,473,812 |
|
| $3,446,098 |
|
| 3.08%, 4/15/43 (e) | 6,788,529 |
| 6,838,221 |
|
| 3.96%, 4/15/43 (e) | 5,980,778 |
| 6,077,523 |
|
| GLC II Trust, 4.00%, 12/18/20 (e) | 7,595,539 |
| 7,637,314 |
|
| GLC Trust, 3.00%, 7/15/21 (e) | 10,417,365 |
| 10,406,948 |
|
| GMAT Trust, 3.721%, 2/25/44 (e)(r) | 1,256,634 |
| 1,254,755 |
|
| Invitation Homes Trust: | | |
| 1.60%, 12/17/30 (e)(r) | 1,200,000 |
| 1,191,499 |
|
| 1.177%, 6/17/31 (e)(r) | 5,000,000 |
| 4,943,350 |
|
| 2.273%, 6/17/31 (e)(r) | 15,000,000 |
| 15,060,570 |
|
| 1.777%, 9/17/31 (e)(r) | 4,000,000 |
| 4,001,872 |
|
| 2.178%, 6/17/32 (e)(r) | 2,500,000 |
| 2,500,000 |
|
| 2.478%, 6/17/32 (e)(r) | 2,000,000 |
| 2,000,000 |
|
| OneMain Financial Issuance Trust: | | |
| 2.43%, 6/18/24 (e) | 3,815,000 |
| 3,820,761 |
|
| 2.47%, 9/18/24 (e) | 10,650,000 |
| 10,638,285 |
|
| 3.19%, 3/18/26 (e) | 7,000,000 |
| 7,029,400 |
|
| SBA Tower Trust, 2.898%, 10/15/44 (e) | 7,000,000 |
| 7,085,078 |
|
| Selene Non-Performing Loans LLC, 2.981%, 5/25/54 (e)(r) | 5,519,442 |
| 5,464,485 |
|
| Sierra Timeshare Receivables Funding LLC: | | |
| 2.92%, 11/20/25 (e) | 1,142,886 |
| 1,151,282 |
|
| 4.36%, 7/20/28 (e) | 465,083 |
| 477,670 |
|
| 2.84%, 11/20/28 (e) | 1,745,095 |
| 1,772,415 |
|
| 3.58%, 11/20/28 (e) | 3,534,370 |
| 3,597,133 |
|
| 1.87%, 8/20/29 (e) | 2,671,175 |
| 2,677,433 |
|
| 1.59%, 11/20/29 (e) | 3,381,626 |
| 3,377,504 |
|
| 2.39%, 11/20/29 (e) | 820,177 |
| 822,175 |
|
| 2.07%, 3/20/30 (e) | 2,273,004 |
| 2,286,501 |
|
| 2.42%, 3/20/30 (e) | 2,273,004 |
| 2,276,512 |
|
| 2.70%, 10/20/30 (e) | 78,589 |
| 79,190 |
|
| 2.80%, 10/20/31 (e) | 3,263,369 |
| 3,285,772 |
|
| Silver Bay Realty Trust, 2.223%, 9/17/31 (e)(r) | 6,500,000 |
| 6,513,975 |
|
| Silverleaf Finance XVIII LLC, 2.81%, 1/15/27 (e) | 5,727,412 |
| 5,730,723 |
|
| SLM Private Credit Student Loan Trust, 0.671%, 6/15/39 (r) | 7,909,466 |
| 7,317,316 |
|
| SNAAC Auto Receivables Trust: | | |
| 1.14%, 7/16/18 (e) | 170,661 |
| 170,693 |
|
| 3.07%, 8/15/18 (e) | 3,000,000 |
| 3,041,919 |
|
| SoFi Professional Loan Program LLC: | | |
| 3.02%, 10/25/27 (e) | 1,193,788 |
| 1,215,834 |
|
| 2.55%, 8/27/29 (e) | 3,301,752 |
| 3,321,272 |
|
| 2.42%, 3/25/30 (e) | 3,238,566 |
| 3,237,896 |
|
| 1.421%, 8/25/32 (e)(r) | 5,248,975 |
| 5,252,009 |
|
| Spirit Master Funding LLC, 3.501%, 1/20/45 (e) | 3,000,000 |
| 2,996,100 |
|
| SpringCastle America Funding LLC, 2.70%, 5/25/23 (e) | 12,409,895 |
| 12,441,838 |
|
14 www.calvert.com CALVERT SHORT DURATION INCOME FUND SEMI-ANNUAL REPORT (UNAUDITED)
|
| | | | | | |
ASSET-BACKED SECURITIES - CONT’D | PRINCIPAL AMOUNT | VALUE |
| | | |
| Springleaf Funding Trust: | | |
| 2.41%, 12/15/22 (e) |
| $5,000,000 |
|
| $5,000,500 |
|
| 3.92%, 1/16/23 (e) | 1,600,000 |
| 1,602,880 |
|
| 3.92%, 1/16/23 (e) | 2,000,000 |
| 1,999,800 |
|
| 3.16%, 11/15/24 (e) | 10,000,000 |
| 10,094,790 |
|
| STORE Master Funding LLC, 4.16%, 3/20/43 (e) | 4,841,964 |
| 4,975,118 |
|
Structured Asset Securities Corp. Mortgage Loan Trust, 0.294%, 1/25/37 (e)(r) | 2,471,555 |
| 2,419,007 |
|
| SVO VOI Mortgage LLC, 2.00%, 9/20/29 (e) | 1,604,013 |
| 1,592,778 |
|
| SWAY Residential Trust, 1.477%, 1/17/32 (e)(r) | 1,982,599 |
| 1,979,968 |
|
| TAL Advantage V LLC: | | |
| 3.55%, 11/20/38 (e) | 4,462,467 |
| 4,563,274 |
|
| 3.51%, 2/22/39 (e) | 1,783,333 |
| 1,812,040 |
|
| 4.10%, 2/22/39 (e) | 1,783,333 |
| 1,813,554 |
|
| 1.70%, 5/20/39 (e) | 5,511,088 |
| 5,474,754 |
|
| Truman Capital Mortgage Loan Trust, 3.125%, 6/25/54 (e)(r) | 2,532,024 |
| 2,529,104 |
|
| US Residential Opportunity Fund Trust, 3.721%, 1/27/35 (e) | 3,760,408 |
| 3,772,952 |
|
Vericrest Opportunity Loan Transferee 2014-NPL4 LLC, 3.125%, 4/27/54 (e)(r) | 5,482,645 |
| 5,464,130 |
|
| | | |
| Total Asset-Backed Securities (Cost $372,571,924) | 373,474,423 |
|
| | | |
COLLATERALIZED MORTGAGE-BACKED OBLIGATIONS (PRIVATELY ORIGINATED) - 2.0% | | |
| CAM Mortgage Trust, 2.60%, 5/15/48 (e)(r) | 748,543 |
| 748,485 |
|
| Fannie Mae Connecticut Avenue Securities: | | |
| CAS 2014-C02 1M1, 1.124%, 5/25/24 (r) | 8,586,897 |
| 8,564,400 |
|
| CAS 2014-C02 1M2, 2.774%, 5/25/24 (r) | 5,300,000 |
| 4,843,140 |
|
| CAS 2014-C02 2M2, 2.774%, 5/25/24 (r) | 1,900,000 |
| 1,745,344 |
|
| CAS 2014-C03 1M2, 3.174%, 7/25/24 (r) | 5,350,000 |
| 5,033,408 |
|
| CAS 2014-C03 2M2, 3.074%, 7/25/24 (r) | 2,800,000 |
| 2,617,247 |
|
Freddie Mac Structured Agency Credit Risk Debt Notes, 1.624%, 11/25/23 (r) | 2,872,715 |
| 2,876,386 |
|
| Springleaf Mortgage Loan Trust: | | |
| 1.27%, 6/25/58 (e)(r) | 5,249,852 |
| 5,243,017 |
|
| 1.57%, 12/25/59 (e)(r) | 1,373,390 |
| 1,376,809 |
|
| | | |
Total Collateralized Mortgage-Backed Obligations (Privately Originated) (Cost $33,674,939) | | 33,048,236 |
|
| | | |
COMMERCIAL MORTGAGE-BACKED SECURITIES - 8.5% | | |
| BAMLL-DB Trust, 2.343%, 4/13/29 (e) | 108,229 |
| 109,140 |
|
| BLCP Hotel Trust, 2.675%, 8/15/29 (e)(r) | 3,600,000 |
| 3,606,930 |
|
| Boca Hotel Portfolio Trust, 1.925%, 8/15/26 (e)(r) | 5,200,000 |
| 5,200,000 |
|
| CDGJ Commercial Mortgage Trust, 2.025%, 12/15/27 (e)(r) | 6,000,000 |
| 6,010,314 |
|
| CGBAM Commercial Mortgage Trust: | | |
| 1.375%, 2/15/31 (e)(r) | 2,000,000 |
| 1,995,332 |
|
| 1.775%, 2/15/31 (e)(r) | 2,750,000 |
| 2,744,566 |
|
www.calvert.com CALVERT SHORT DURATION INCOME FUND SEMI-ANNUAL REPORT (UNAUDITED) 15
|
| | | | | | |
COMMERCIAL MORTGAGE-BACKED SECURITIES - CONT’D | PRINCIPAL AMOUNT | VALUE |
| | | |
| Colony Multifamily Mortgage Trust, 2.543%, 4/20/50 (e) |
| $6,064,944 |
|
| $6,078,153 |
|
| COMM SAVA Mortgage Trust, 3.275%, 6/15/34 (e)(r) | 4,200,000 |
| 4,203,583 |
|
| Commercial Mortgage Pass Through Certificates: | | |
| 2.177%, 6/11/27 (e)(r) | 5,000,000 |
| 4,990,080 |
|
| 1.775%, 6/8/30 (e)(r) | 15,000,000 |
| 14,993,130 |
|
| Credit Suisse Mortgage Capital Certificates, 1.425%, 3/15/17 (e)(r) | 3,000,000 |
| 2,989,800 |
|
| CSMC Trust: | | |
| 1.80%, 4/15/27 (e)(r) | 3,000,000 |
| 2,987,994 |
|
| 2.325%, 4/15/27 (e)(r) | 2,000,000 |
| 1,994,034 |
|
| EQTY INNS Mortgage Trust: | | |
| 1.775%, 5/8/31 (e)(r) | 4,500,000 |
| 4,457,187 |
|
| 2.525%, 5/8/31 (e)(r) | 7,269,000 |
| 7,247,905 |
|
| Extended Stay America Trust, 3.604%, 12/5/31 (e) | 7,760,000 |
| 8,081,442 |
|
| GE Business Loan Trust, 0.675%, 11/15/33 (e)(r) | 1,501,797 |
| 1,418,361 |
|
| GS Mortgage Securities Corp Trust, 3.79%, 1/10/31 (e) | 3,500,000 |
| 3,633,928 |
|
| Hilton USA Trust: | | |
| 1.673%, 11/5/30 (e)(r) | 6,898,255 |
| 6,898,428 |
|
| 3.714%, 11/5/30 (e) | 1,600,000 |
| 1,633,723 |
|
| JP Morgan Chase Commercial Mortgage Securities Trust: | | |
| 3.771%, 6/10/27 (e) | 4,200,000 |
| 4,357,143 |
|
| 3.805%, 6/10/27 (e)(r) | 3,000,000 |
| 3,034,872 |
|
| 3.775%, 6/15/29 (e)(r) | 7,300,000 |
| 7,291,204 |
|
| 1.325%, 4/15/30 (e)(r) | 11,000,000 |
| 10,998,251 |
|
| 1.428%, 1/15/32 (e)(r) | 3,000,000 |
| 2,997,156 |
|
| 1.978%, 1/15/32 (e)(r) | 5,000,000 |
| 5,006,550 |
|
| Morgan Stanley Capital I Trust, 3.446%, 7/13/29 (e)(r) | 1,500,000 |
| 1,511,675 |
|
| Motel 6 Trust, 5.279%, 2/5/30 (e) | 4,700,000 |
| 4,707,200 |
|
| ORES NPL LLC: | | |
| 3.00%, 3/27/24 (e) | 4,479,025 |
| 4,479,025 |
|
| 3.081%, 9/25/25 (e) | 1,388,276 |
| 1,384,805 |
|
| RREF 2013-RIAL4 LLC, 3.25%, 11/27/28 (e)(r) | 1,273,866 |
| 1,279,401 |
|
| | | |
Total Commercial Mortgage-Backed Securities (Cost $137,905,522) | | 138,321,312 |
|
| | | |
CORPORATE BONDS - 56.9% | | |
| 99 Cents Only Stores LLC, 11.00%, 12/15/19 | 1,500,000 |
| 1,575,000 |
|
| AbbVie, Inc., 1.75%, 11/6/17 | 2,000,000 |
| 2,007,094 |
|
| Actavis Funding SCS: | | |
| 3.00%, 3/12/20 | 2,000,000 |
| 2,046,170 |
|
| 3.45%, 3/15/22 | 2,000,000 |
| 2,048,554 |
|
| Aetna, Inc., 1.50%, 11/15/17 | 1,000,000 |
| 1,004,850 |
|
| Alliance Mortgage Investments, Inc., 12.61%, 6/1/10 (b)(r)(x)* | 385,345 |
| — |
|
| Ally Financial, Inc.: | | |
| 4.625%, 6/26/15 | 4,500,000 |
| 4,522,500 |
|
| 3.25%, 2/13/18 | 4,500,000 |
| 4,455,000 |
|
16 www.calvert.com CALVERT SHORT DURATION INCOME FUND SEMI-ANNUAL REPORT (UNAUDITED)
|
| | | | | | |
CORPORATE BONDS - CONT’D | PRINCIPAL AMOUNT | VALUE |
| | | |
| Amazon.com, Inc.: | | |
| 2.60%, 12/5/19 |
| $1,000,000 |
|
| $1,024,287 |
|
| 3.30%, 12/5/21 | 1,000,000 |
| 1,040,032 |
|
| America Movil SAB de CV: | | |
| 2.375%, 9/8/16 | 2,250,000 |
| 2,286,878 |
|
| 1.268%, 9/12/16 (r) | 2,000,000 |
| 2,007,812 |
|
| American Airlines B Pass Through Trust, 3.70%, 11/1/24 | 2,650,000 |
| 2,656,625 |
|
| American Airlines Group, Inc., 4.625%, 3/1/20 (e) | 1,100,000 |
| 1,077,312 |
|
| American Airlines Pass Through Trust: | | |
| 7.00%, 7/31/19 (e) | 4,164,204 |
| 4,511,498 |
|
| 5.60%, 1/15/22 (e) | 1,350,607 |
| 1,423,134 |
|
| 4.375%, 4/1/24 | 2,430,000 |
| 2,517,966 |
|
| American International Group, Inc., 3.375%, 8/15/20 | 2,700,000 |
| 2,848,913 |
|
| American Tower Corp., 4.70%, 3/15/22 | 3,500,000 |
| 3,753,610 |
|
| Amgen, Inc., 3.625%, 5/22/24 | 575,000 |
| 604,697 |
|
| Anheuser-Busch InBev Finance, Inc., 1.25%, 1/17/18 | 5,000,000 |
| 5,006,280 |
|
| Antero Resources Corp., 6.00%, 12/1/20 | 1,000,000 |
| 1,000,500 |
|
| Anthem, Inc., 1.875%, 1/15/18 | 2,000,000 |
| 2,011,120 |
|
| Apple, Inc.: | | |
| 2.15%, 2/9/22 | 1,000,000 |
| 987,056 |
|
| 2.50%, 2/9/25 | 2,000,000 |
| 1,957,240 |
|
| ArcelorMittal: | | |
| 4.50%, 8/5/15 | 1,900,000 |
| 1,914,250 |
|
| 6.125%, 6/1/18 | 2,300,000 |
| 2,471,350 |
|
| AT&T, Inc.: | | |
| 2.375%, 11/27/18 | 4,700,000 |
| 4,760,498 |
|
| 3.875%, 8/15/21 | 2,100,000 |
| 2,224,721 |
|
| Bank of America Corp.: | | |
| 5.25%, 12/1/15 | 500,000 |
| 513,437 |
|
| 5.70%, 5/2/17 | 5,000,000 |
| 5,386,990 |
|
| 6.40%, 8/28/17 | 5,000,000 |
| 5,541,635 |
|
| 2.60%, 1/15/19 | 5,000,000 |
| 5,088,960 |
|
| �� 4.00%, 4/1/24 | 4,600,000 |
| 4,893,094 |
|
| Bank of America NA: | | |
| 5.30%, 3/15/17 | 30,000,000 |
| 32,039,760 |
|
| 0.571%, 6/15/17 (r) | 19,537,000 |
| 19,371,912 |
|
| 6.10%, 6/15/17 | 1,155,000 |
| 1,265,330 |
|
| 1.65%, 3/26/18 | 3,000,000 |
| 3,007,479 |
|
| Bayer US Finance LLC: | | |
| 1.50%, 10/6/17 (e) | 1,000,000 |
| 1,006,426 |
|
| 2.375%, 10/8/19 (e) | 2,000,000 |
| 2,034,172 |
|
| 3.00%, 10/8/21 (e) | 1,000,000 |
| 1,034,611 |
|
| Becton Dickinson and Co., 1.75%, 11/8/16 | 2,000,000 |
| 2,021,866 |
|
| Berkshire Hathaway Finance Corp.: | | |
| 2.90%, 10/15/20 | 2,000,000 |
| 2,112,312 |
|
| 3.00%, 5/15/22 | 3,000,000 |
| 3,120,090 |
|
| Berkshire Hathaway, Inc., 1.90%, 1/31/17 | 3,000,000 |
| 3,059,559 |
|
www.calvert.com CALVERT SHORT DURATION INCOME FUND SEMI-ANNUAL REPORT (UNAUDITED) 17
|
| | | | | | |
CORPORATE BONDS - CONT’D | PRINCIPAL AMOUNT | VALUE |
| | | |
BNSF Funding Trust I, 6.613% to 1/15/26, floating rate thereafter to 12/15/55 (r) |
| $7,869,000 |
|
| $8,872,298 |
|
| Bon-Ton Department Stores, Inc., 8.00%, 6/15/21 | 1,500,000 |
| 1,237,500 |
|
| BP Capital Markets plc: | | |
| 1.846%, 5/5/17 | 5,000,000 |
| 5,060,200 |
|
| 1.375%, 5/10/18 | 2,000,000 |
| 1,991,032 |
|
| 2.237%, 5/10/19 | 1,000,000 |
| 1,010,770 |
|
| Capital One Bank: | | |
| 1.20%, 2/13/17 | 4,000,000 |
| 3,989,836 |
|
| 2.25%, 2/13/19 | 3,000,000 |
| 3,015,882 |
|
| Capital One Financial Corp.: | | |
| 3.15%, 7/15/16 | 2,500,000 |
| 2,563,910 |
|
| 6.15%, 9/1/16 | 3,800,000 |
| 4,048,721 |
|
| Carrols Restaurant Group, Inc., 11.25%, 5/15/18 | 1,500,000 |
| 1,595,625 |
|
| Celanese US Holdings LLC, 5.875%, 6/15/21 | 2,000,000 |
| 2,160,000 |
|
| Cemex SAB de CV: | | |
| 5.273%, 9/30/15 (e)(r) | 16,350,000 |
| 16,430,115 |
|
| 5.003%, 10/15/18 (e)(r) | 2,000,000 |
| 2,089,000 |
|
| 6.50%, 12/10/19 (e) | 750,000 |
| 796,875 |
|
| CenturyLink, Inc., 5.625%, 4/1/20 | 2,000,000 |
| 2,100,000 |
|
| Checkers Drive-In Restaurants, Inc., 11.00%, 12/1/17 (e) | 2,500,000 |
| 2,720,300 |
|
| Cisco Systems, Inc., 2.125%, 3/1/19 | 4,600,000 |
| 4,694,190 |
|
| CIT Group, Inc.: | | |
| 5.00%, 5/15/17 | 2,400,000 |
| 2,468,256 |
|
| 4.25%, 8/15/17 | 8,325,000 |
| 8,429,062 |
|
| 5.25%, 3/15/18 | 5,100,000 |
| 5,278,500 |
|
| Citigroup, Inc.: | | |
| 0.534%, 6/9/16 (r) | 18,000,000 |
| 17,891,064 |
|
| 2.50%, 9/26/18 | 19,000,000 |
| 19,372,400 |
|
| CNH Industrial Capital LLC, 3.875%, 11/1/15 | 1,000,000 |
| 1,007,500 |
|
| ConAgra Foods, Inc., 1.90%, 1/25/18 | 2,000,000 |
| 2,002,492 |
|
| ConocoPhillips Co., 2.875%, 11/15/21 | 2,000,000 |
| 2,050,874 |
|
| Continental Airlines Pass Through Trust, 6.25%, 10/11/21 | 10,260,448 |
| 10,927,377 |
|
| Cott Beverages, Inc., 6.75%, 1/1/20 (e) | 1,250,000 |
| 1,293,750 |
|
| Coveris Holdings SA, 7.875%, 11/1/19 (e) | 2,000,000 |
| 2,045,000 |
|
| Crown Castle Towers LLC: | | |
| 5.495%, 1/15/37 (e) | 4,000,000 |
| 4,195,224 |
|
| 4.174%, 8/15/37 (e) | 1,500,000 |
| 1,563,000 |
|
| Crown Media Holdings, Inc., 10.50%, 7/15/19 | 1,000,000 |
| 1,070,000 |
|
| CVS Pass-Through Trust, 6.036%, 12/10/28 | 1,759,514 |
| 2,079,919 |
|
| DDR Corp., 4.75%, 4/15/18 | 9,265,000 |
| 9,974,199 |
|
| Delta Air Lines Pass Through Trust, 6.75%, 5/23/17 | 2,750,000 |
| 2,811,050 |
|
| Deutsche Telekom International Finance BV, 2.25%, 3/6/17 (e) | 4,000,000 |
| 4,069,464 |
|
DIRECTV Holdings LLC / DIRECTV Financing Co., Inc., 5.875%, 10/1/19 | 10,000,000 |
| 11,519,320 |
|
| Discover Bank, 8.70%, 11/18/19 | 2,107,000 |
| 2,595,143 |
|
Doric Nimrod Air Finance Alpha Ltd. Pass Through Trust, 5.125%, 11/30/24 (e) | 1,241,201 |
| 1,316,635 |
|
18 www.calvert.com CALVERT SHORT DURATION INCOME FUND SEMI-ANNUAL REPORT (UNAUDITED)
|
| | | | | | |
CORPORATE BONDS - CONT’D | PRINCIPAL AMOUNT | VALUE |
| | | |
| Dr Pepper Snapple Group, Inc., 2.60%, 1/15/19 |
| $3,000,000 |
|
| $3,071,082 |
|
| Eaton Corp., 0.95%, 11/2/15 | 3,000,000 |
| 3,000,462 |
|
Enterprise Products Operating LLC, 7.034% to 1/15/18, floating rate thereafter to 1/15/68 (r) | 22,805,000 |
| 24,655,033 |
|
| ERP Operating LP, 2.375%, 7/1/19 | 2,000,000 |
| 2,026,072 |
|
| FedEx Corp., 2.30%, 2/1/20 | 2,000,000 |
| 2,020,790 |
|
| Fifth Third Bancorp, 0.69%, 12/20/16 (r) | 12,000,000 |
| 11,927,976 |
|
| Ford Motor Credit Co. LLC: | | |
| 4.207%, 4/15/16 | 16,550,000 |
| 17,023,065 |
|
| 3.984%, 6/15/16 | 4,000,000 |
| 4,124,116 |
|
| 4.25%, 2/3/17 | 4,500,000 |
| 4,725,288 |
|
| 2.145%, 1/9/18 | 2,550,000 |
| 2,579,129 |
|
| 1.182%, 11/4/19 (r) | 4,700,000 |
| 4,704,018 |
|
| General Electric Capital Corp.: | | |
| 2.90%, 1/9/17 | 6,000,000 |
| 6,217,884 |
|
| 2.30%, 4/27/17 | 3,000,000 |
| 3,078,066 |
|
| 2.20%, 1/9/20 | 3,000,000 |
| 3,033,102 |
|
| 4.625%, 1/7/21 | 1,300,000 |
| 1,463,688 |
|
General Electric Capital Corp. / LJ VP Holdings LLC, 3.80%, 6/18/19 (e) | 5,000,000 |
| 5,351,350 |
|
| General Motors Co., 4.00%, 4/1/25 | 900,000 |
| 914,147 |
|
| General Motors Financial Co., Inc.: | | |
| 3.00%, 9/25/17 | 5,000,000 |
| 5,093,750 |
|
| 3.50%, 7/10/19 | 4,000,000 |
| 4,106,652 |
|
| 3.15%, 1/15/20 | 1,400,000 |
| 1,416,654 |
|
| 4.00%, 1/15/25 | 900,000 |
| 917,924 |
|
| Goldman Sachs Group, Inc.: | | |
| 3.625%, 2/7/16 | 2,300,000 |
| 2,349,213 |
|
| 6.15%, 4/1/18 | 4,600,000 |
| 5,171,509 |
|
| 2.625%, 1/31/19 | 10,800,000 |
| 11,033,993 |
|
| 1.417%, 4/23/20 (r) | 4,000,000 |
| 4,050,844 |
|
| 2.60%, 4/23/20 | 3,000,000 |
| 3,031,917 |
|
| Harland Clarke Holdings Corp., 9.75%, 8/1/18 (e) | 2,000,000 |
| 2,115,000 |
|
| Hartford Financial Services Group, Inc., 6.30%, 3/15/18 | 4,250,000 |
| 4,777,442 |
|
| Hewlett-Packard Co., 0.93%, 8/3/15 (e) | 15,200,000 |
| 15,185,064 |
|
| Host Hotels & Resorts LP, 3.75%, 10/15/23 | 2,000,000 |
| 2,027,188 |
|
| Hyundai Capital America: | | |
| 1.875%, 8/9/16 (e) | 1,000,000 |
| 1,008,653 |
|
| 4.00%, 6/8/17 (e) | 3,615,000 |
| 3,795,501 |
|
| 2.875%, 8/9/18 (e) | 1,000,000 |
| 1,030,301 |
|
| Hyundai Capital Services, Inc.: | | |
| 3.50%, 9/13/17 (e) | 3,000,000 |
| 3,112,326 |
|
| 2.625%, 9/29/20 (e) | 2,000,000 |
| 2,008,400 |
|
Innovation Ventures LLC / Innovation Ventures Finance Corp., 9.50%, 8/15/19 (e) | 5,550,000 |
| 5,605,500 |
|
| International Lease Finance Corp.: | | |
| 4.875%, 4/1/15 | 7,750,000 |
| 7,750,000 |
|
| 6.75%, 9/1/16 (e) | 5,500,000 |
| 5,843,750 |
|
www.calvert.com CALVERT SHORT DURATION INCOME FUND SEMI-ANNUAL REPORT (UNAUDITED) 19
|
| | | | | | |
CORPORATE BONDS - CONT’D | PRINCIPAL AMOUNT | VALUE |
| | | |
| Jabil Circuit, Inc., 7.75%, 7/15/16 |
| $10,000,000 |
|
| $10,725,000 |
|
| John Deere Capital Corp., 1.95%, 3/4/19 | 1,500,000 |
| 1,514,876 |
|
| JPMorgan Chase & Co.: | | |
| 2.35%, 1/28/19 | 18,300,000 |
| 18,599,955 |
|
| 2.25%, 1/23/20 | 5,000,000 |
| 5,010,710 |
|
| 3.125%, 1/23/25 | 3,000,000 |
| 3,008,799 |
|
| JPMorgan Chase Bank NA, 5.875%, 6/13/16 | 8,000,000 |
| 8,446,032 |
|
| Kenan Advantage Group, Inc., 8.375%, 12/15/18 (e) | 3,000,000 |
| 3,120,000 |
|
| Kia Motors Corp., 3.625%, 6/14/16 (e) | 5,850,000 |
| 6,004,709 |
|
| Kinder Morgan Energy Partners LP: | | |
| 4.10%, 11/15/15 | 2,000,000 |
| 2,035,236 |
|
| 2.65%, 2/1/19 | 1,000,000 |
| 1,001,543 |
|
| Kinder Morgan, Inc.: | | |
| 2.00%, 12/1/17 | 1,000,000 |
| 998,443 |
|
| 5.00%, 2/15/21 (e) | 6,000,000 |
| 6,412,824 |
|
| Kraft Foods Group, Inc.: | | |
| 1.625%, 6/4/15 | 1,000,000 |
| 1,001,677 |
|
| 2.25%, 6/5/17 | 2,000,000 |
| 2,036,132 |
|
| Kroger Co., 2.95%, 11/1/21 | 3,000,000 |
| 3,058,383 |
|
| Laboratory Corporation of America Holdings: | | |
| 2.625%, 2/1/20 | 2,000,000 |
| 2,012,524 |
|
| 3.20%, 2/1/22 | 2,000,000 |
| 2,024,718 |
|
| Leucadia National Corp., 8.125%, 9/15/15 | 4,200,000 |
| 4,323,102 |
|
| Life Technologies Corp., 6.00%, 3/1/20 | 3,200,000 |
| 3,695,658 |
|
| Lockheed Martin Corp., 2.125%, 9/15/16 | 2,000,000 |
| 2,038,312 |
|
| LyondellBasell Industries NV, 5.00%, 4/15/19 | 2,500,000 |
| 2,756,912 |
|
| Masco Corp., 4.80%, 6/15/15 | 1,000,000 |
| 1,008,069 |
|
| Medtronic, Inc.: | | |
| 1.50%, 3/15/18 (e) | 1,000,000 |
| 1,004,344 |
|
| 2.50%, 3/15/20 (e) | 1,000,000 |
| 1,022,140 |
|
| 3.15%, 3/15/22 (e) | 3,000,000 |
| 3,115,092 |
|
| Merck & Co., Inc.: | | |
| 1.85%, 2/10/20 | 2,000,000 |
| 2,012,786 |
|
| 2.35%, 2/10/22 | 3,000,000 |
| 3,002,646 |
|
| Metropolitan Life Global Funding I, 1.50%, 1/10/18 (e) | 8,000,000 |
| 8,033,712 |
|
| Microsoft Corp.: | | |
| 1.85%, 2/12/20 | 4,000,000 |
| 4,038,028 |
|
| 2.375%, 2/12/22 | 3,000,000 |
| 3,021,663 |
|
| Morgan Stanley: | | |
| 6.25%, 8/28/17 | 8,200,000 |
| 9,058,638 |
|
| 0.997%, 7/23/19 (r) | 11,000,000 |
| 10,985,920 |
|
| 2.375%, 7/23/19 | 4,700,000 |
| 4,735,067 |
|
| 1.396%, 1/27/20 (r) | 5,000,000 |
| 5,074,770 |
|
| 2.65%, 1/27/20 | 5,000,000 |
| 5,069,610 |
|
| Mylan, Inc.: | | |
| 1.80%, 6/24/16 | 2,000,000 |
| 2,016,086 |
|
| 2.60%, 6/24/18 | 1,000,000 |
| 1,021,137 |
|
20 www.calvert.com CALVERT SHORT DURATION INCOME FUND SEMI-ANNUAL REPORT (UNAUDITED)
|
| | | | | | |
CORPORATE BONDS - CONT’D | PRINCIPAL AMOUNT | VALUE |
| | | |
| National City Corp., 6.875%, 5/15/19 |
| $1,500,000 |
|
| $1,769,879 |
|
| National Oilwell Varco, Inc., 1.35%, 12/1/17 | 1,000,000 |
| 991,241 |
|
| NBCUniversal Enterprise, Inc., 1.974%, 4/15/19 (e) | 2,000,000 |
| 2,012,538 |
|
| NBCUniversal Media LLC, 4.375%, 4/1/21 | 5,000,000 |
| 5,570,655 |
|
| NII Capital Corp., 7.625%, 4/1/21 (p)* | 17,270,000 |
| 5,267,350 |
|
| Nissan Motor Acceptance Corp.: | | |
| 2.65%, 9/26/18 (e) | 4,600,000 |
| 4,738,276 |
|
| 2.35%, 3/4/19 (e) | 3,800,000 |
| 3,869,080 |
|
Northern Tier Energy LLC / Northern Tier Finance Corp., 7.125%, 11/15/20 | 4,000,000 |
| 4,107,240 |
|
| Northrop Grumman Corp., 1.75%, 6/1/18 | 2,000,000 |
| 2,005,874 |
|
| Numericable-SFR SAS, 4.875%, 5/15/19 (e) | 2,000,000 |
| 1,990,000 |
|
| Oracle Corp.: | | |
| 2.25%, 10/8/19 | 2,000,000 |
| 2,039,500 |
|
| 2.80%, 7/8/21 | 2,000,000 |
| 2,071,568 |
|
| Penske Truck Leasing Co. LP / PTL Finance Corp.: | | |
| 3.125%, 5/11/15 (e) | 4,000,000 |
| 4,008,456 |
|
| 2.50%, 3/15/16 (e) | 5,000,000 |
| 5,072,400 |
|
| 3.05%, 1/9/20 (e) | 1,600,000 |
| 1,626,806 |
|
| Permian Holdings, Inc., 10.50%, 1/15/18 (e) | 2,406,000 |
| 1,323,300 |
|
| Pernod Ricard SA: | | |
| 2.95%, 1/15/17 (e) | 5,000,000 |
| 5,142,810 |
|
| 4.25%, 7/15/22 (e) | 2,000,000 |
| 2,155,556 |
|
| Perrigo Co. plc, 1.30%, 11/8/16 | 1,000,000 |
| 999,384 |
|
| Pioneer Natural Resources Co., 5.875%, 7/15/16 | 2,750,000 |
| 2,902,776 |
|
| Prospect Medical Holdings, Inc., 8.375%, 5/1/19 (e) | 2,129,000 |
| 2,262,062 |
|
| Prudential Covered Trust, 2.997%, 9/30/15 (e) | 280,000 |
| 282,775 |
|
| Regions Bank, 7.50%, 5/15/18 | 750,000 |
| 871,749 |
|
| Regions Financial Corp., 5.75%, 6/15/15 | 7,750,000 |
| 7,818,743 |
|
| Rio Tinto Finance USA plc, 2.00%, 3/22/17 | 3,500,000 |
| 3,551,548 |
|
| Rockwood Specialties Group, Inc., 4.625%, 10/15/20 | 3,000,000 |
| 3,123,750 |
|
| SABMiller Holdings, Inc., 2.20%, 8/1/18 (e) | 8,700,000 |
| 8,800,650 |
|
| SBA Communications Corp., 4.875%, 7/15/22 (e) | 1,398,000 |
| 1,369,426 |
|
| SBA Tower Trust, 2.24%, 4/15/43 (e) | 12,000,000 |
| 11,990,256 |
|
| Spencer Spirit Holdings, Inc., 9.00%, 5/1/18 (e) | 6,627,000 |
| 6,718,121 |
|
| Sprint Communications, Inc., 6.00%, 12/1/16 | 4,000,000 |
| 4,176,000 |
|
| SunTrust Bank, 0.553%, 8/24/15 (r) | 5,175,000 |
| 5,173,018 |
|
| SunTrust Banks, Inc., 3.50%, 1/20/17 | 2,500,000 |
| 2,602,565 |
|
| SUPERVALU, Inc., 6.75%, 6/1/21 | 4,000,000 |
| 4,120,000 |
|
| Symantec Corp., 2.75%, 9/15/15 | 2,710,000 |
| 2,731,198 |
|
| Sysco Corp.: | | |
| 1.45%, 10/2/17 | 1,000,000 |
| 1,007,952 |
|
| 2.35%, 10/2/19 | 1,000,000 |
| 1,023,125 |
|
| Telefonica Emisiones SAU: | | |
| 3.992%, 2/16/16 | 5,270,000 |
| 5,404,143 |
|
| 3.192%, 4/27/18 | 3,000,000 |
| 3,128,826 |
|
| TerraForm Power Operating LLC, 5.875%, 2/1/23 (e) | 1,500,000 |
| 1,556,250 |
|
www.calvert.com CALVERT SHORT DURATION INCOME FUND SEMI-ANNUAL REPORT (UNAUDITED) 21
|
| | | | | | |
CORPORATE BONDS - CONT’D | PRINCIPAL AMOUNT | VALUE |
| | | |
| Thermo Fisher Scientific, Inc.: | | |
| 1.30%, 2/1/17 |
| $2,000,000 |
|
| $2,001,100 |
|
| 2.40%, 2/1/19 | 1,000,000 |
| 1,014,044 |
|
| Time Warner Cable, Inc.: | | |
| 6.75%, 7/1/18 | 3,000,000 |
| 3,446,937 |
|
| 8.75%, 2/14/19 | 1,500,000 |
| 1,851,678 |
|
| Time Warner, Inc., 4.05%, 12/15/23 | 1,500,000 |
| 1,605,522 |
|
| Total Capital International SA, 1.55%, 6/28/17 | 3,000,000 |
| 3,033,654 |
|
| Turkish Airlines Pass Through Trust, 4.20%, 9/15/28 (e) | 1,200,000 |
| 1,212,000 |
|
| UDR, Inc., 3.70%, 10/1/20 | 2,000,000 |
| 2,112,576 |
|
| United Airlines Pass Through Trust: | | |
| 4.75%, 10/11/23 | 2,650,000 |
| 2,686,570 |
|
| 4.625%, 3/3/24 | 3,150,000 |
| 3,158,820 |
|
| UnitedHealth Group, Inc., 1.875%, 11/15/16 | 2,000,000 |
| 2,033,346 |
|
| Ventas Realty LP / Ventas Capital Corp.: | | |
| 4.00%, 4/30/19 | 2,000,000 |
| 2,136,822 |
|
| 2.70%, 4/1/20 | 3,000,000 |
| 3,032,610 |
|
| Verizon Communications, Inc.: | | |
| 2.625%, 2/21/20 | 16,700,000 |
| 16,989,912 |
|
| 3.50%, 11/1/24 | 1,000,000 |
| 1,023,365 |
|
| Viacom, Inc.: | | |
| 2.20%, 4/1/19 | 3,000,000 |
| 3,000,366 |
|
| 2.75%, 12/15/19 | 2,000,000 |
| 2,031,504 |
|
| Virgin Australia Trust: | | |
| 6.00%, 4/23/22 (e) | 2,241,102 |
| 2,319,540 |
|
| 5.00%, 4/23/25 (e) | 7,242,666 |
| 7,622,906 |
|
| Virgin Media Finance plc, 4.875%, 2/15/22 | 1,000,000 |
| 955,000 |
|
| Volkswagen International Finance NV: | | |
| 1.125%, 11/18/16 (e) | 2,000,000 |
| 2,006,910 |
|
| 2.125%, 11/20/18 (e) | 1,000,000 |
| 1,012,437 |
|
| Vornado Realty LP, 2.50%, 6/30/19 | 4,425,000 |
| 4,460,524 |
|
| Wachovia Capital Trust III, 5.57%, 3/29/49 (r) | 2,300,000 |
| 2,271,020 |
|
| Walgreens Boots Alliance, Inc.: | | |
| 1.75%, 11/17/17 | 1,000,000 |
| 1,009,084 |
|
| 2.70%, 11/18/19 | 2,000,000 |
| 2,043,196 |
|
| 3.30%, 11/18/21 | 2,000,000 |
| 2,059,026 |
|
| Whirlpool Corp., 1.65%, 11/1/17 | 2,000,000 |
| 2,012,776 |
|
| Williams Co.’s, Inc., 4.55%, 6/24/24 | 3,000,000 |
| 2,905,539 |
|
| Williams Partners LP, 3.60%, 3/15/22 | 6,500,000 |
| 6,479,701 |
|
| Williams Partners LP / ACMP Finance Corp., 6.125%, 7/15/22 | 7,000,000 |
| 7,416,500 |
|
| Xerox Corp., 2.80%, 5/15/20 | 2,000,000 |
| 2,017,948 |
|
| Zoetis, Inc., 1.875%, 2/1/18 | 6,250,000 |
| 6,253,563 |
|
| | | |
| Total Corporate Bonds (Cost $907,204,260) | | 923,564,507 |
|
| | | |
22 www.calvert.com CALVERT SHORT DURATION INCOME FUND SEMI-ANNUAL REPORT (UNAUDITED)
|
| | | | | | |
FLOATING RATE LOANS (d) - 0.4% | PRINCIPAL AMOUNT | VALUE |
| Albertson’s Holdings LLC: | | |
| 1.00%, 8/25/19 (r) |
| $1,200,000 |
|
| $1,206,937 |
|
| 1.00%, 8/25/21 (r) | 950,000 |
| 957,257 |
|
| BJ’s Wholesale Club, Inc., 1.00%, 9/26/19 (r) | 2,296,220 |
| 2,295,143 |
|
| SUPERVALU, Inc., 1.00%, 3/21/19 (r) | 1,468,471 |
| 1,471,734 |
|
| | | |
| Total Floating Rate Loans (Cost $5,876,720) | | 5,931,071 |
|
| | | |
MUNICIPAL OBLIGATIONS - 0.9% | | |
City of Old Town Maine Solid Waste Disposal Revenue VRDN, 0.25%, 12/1/24 (r)† | 5,000,000 |
| 5,000,000 |
|
New York State MMC Corp. Revenue VRDN, 0.38%, 11/1/35 (r)† | 7,010,000 |
| 7,010,000 |
|
Prentiss County Mississippi Industrial Development Revenue VRDN, 0.40%, 10/1/17 (r)† | 2,450,000 |
| 2,450,000 |
|
| | | |
| Total Municipal Obligations (Cost $14,460,000) | | 14,460,000 |
|
| | | |
SOVEREIGN GOVERNMENT BONDS - 0.1% | | |
| Kommunalbanken AS, 0.75%, 11/21/16 (e) | 1,000,000 |
| 1,001,714 |
|
| | | |
| Total Sovereign Government Bonds (Cost $998,490) | | 1,001,714 |
|
| | | |
TIME DEPOSIT - 1.0% | | |
| State Street Bank Time Deposit, 0.088%, 4/1/15 | 15,766,876 |
| 15,766,876 |
|
| | | |
| Total Time Deposit (Cost $15,766,876) | | 15,766,876 |
|
| | | |
U.S. GOVERNMENT AGENCIES AND INSTRUMENTALITIES - 0.1% | | |
| COP I LLC, 3.613%, 12/5/21 | 1,848,545 |
| 1,966,877 |
|
| | | |
Total U.S. Government Agencies and Instrumentalities (Cost $1,848,545) | | 1,966,877 |
|
| | | |
U.S. TREASURY OBLIGATIONS - 6.6% | | |
| United States Treasury Notes: | | |
| 1.00%, 3/15/18 | 44,690,000 |
| 44,854,102 |
|
| 1.375%, 3/31/20 | 20,465,000 |
| 20,468,192 |
|
| 1.75%, 3/31/22 | 12,065,000 |
| 12,096,104 |
|
| 2.00%, 2/15/25 | 30,315,000 |
| 30,506,833 |
|
| | | |
| Total U.S. Treasury Obligations (Cost $107,023,150) | | 107,925,231 |
|
| | | |
| | | |
| TOTAL INVESTMENTS (Cost $1,597,330,426) - 99.5% | | 1,615,460,247 |
|
| Other assets and liabilities, net - 0.5% | | 7,949,645 |
|
NET ASSETS - 100% | |
| $1,623,409,892 |
|
| | | |
| See notes to financial statements. |
www.calvert.com CALVERT SHORT DURATION INCOME FUND SEMI-ANNUAL REPORT (UNAUDITED) 23
|
| | | |
NET ASSETS CONSIST OF: | |
| Paid-in capital applicable to the following shares of beneficial interest, unlimited number of no par value shares authorized: | |
| Class A: 49,636,370 shares outstanding |
| $786,582,745 |
|
| Class C: 10,621,772 shares outstanding | 169,189,624 |
|
| Class I: 16,146,663 shares outstanding | 263,423,435 |
|
| Class Y: 23,817,141 shares outstanding | 396,528,045 |
|
| Undistributed net investment income | 162,963 |
|
| Accumulated net realized gain (loss) | (10,416,744 | ) |
| Net unrealized appreciation (depreciation) | 17,939,824 |
|
| | |
NET ASSETS |
| $1,623,409,892 |
|
| | |
|
NET ASSET VALUE PER SHARE | |
| Class A (based on net assets of $802,062,669) | $16.16 |
| Class C (based on net assets of $171,010,500) | $16.10 |
| Class I (based on net assets of $262,330,444) | $16.25 |
| Class Y (based on net assets of $388,006,279) | $16.29 |
| | |
| |
|
| | | | | | | | |
FUTURES | NUMBER OF CONTRACTS | EXPIRATION DATE | UNDERLYING FACE AMOUNT AT VALUE | UNREALIZED APPRECIATION (DEPRECIATION) |
| Purchased: | | | | |
| 2 Year U.S. Treasury Notes | 956 | 6/15 |
| $209,513,375 |
|
| $432,484 |
|
| 5 Year U.S. Treasury Notes | 9 | 6/15 | 1,081,898 |
| 618 |
|
| Total Purchased | | | |
| $433,102 |
|
| | | | | |
| Sold: | | | | |
| 10 Year U.S. Treasury Notes | 432 | 6/15 |
| $55,687,500 |
|
| ($623,099 | ) |
(b) This security was valued under the direction of the Board of Trustees. See Note A. (d) Remaining maturities of floating rate loans may be less than the stated maturities shown as a result of contractual or optional prepayments by the borrower. Such prepayments cannot be predicted with certainty. Floating rate loans generally pay interest at rates which are periodically re-determined at a margin above the London InterBank Offered Rate (“LIBOR”) or other short-term rates. The rate shown is the rate in effect at period end. Floating rate loans are generally considered restrictive in that the Fund is ordinarily contractually obligated to receive consent from the Agent Bank and/or Borrower prior to disposition of a floating rate loan. (e) Security is exempt from registration under Rule 144A of the Securities Act of 1933. These securities may be resold in transactions exempt from registration, normally to qualified institutional buyers. (p) Security is in default and is no longer accruing interest. (r) The coupon rate shown on floating or adjustable rate securities represents the rate at period end. (x) Alliance Bancorp and its affiliates filed for Chapter 7 bankruptcy on July 13, 2007. This security is no longer accruing interest. * Non-income producing security. † The date shown for securities represents the date when principal payments must be paid. Most securities have maturity shortening features that function as put options. Abbreviations: LLC: Limited Liability Corporation LP: Limited Partnership plc: Public Limited Company REIT: Real Estate Investment Trust VRDN: Variable Rate Demand Notes See notes to financial statements. |
24 www.calvert.com CALVERT SHORT DURATION INCOME FUND SEMI-ANNUAL REPORT (UNAUDITED)
STATEMENT OF OPERATIONS
SIX MONTHS ENDED MARCH 31, 2015
|
| | | |
NET INVESTMENT INCOME | |
| Investment Income: | |
| Interest income (net of foreign taxes withheld of $160) |
| $24,463,800 |
|
| Total investment income | 24,463,800 |
|
| | |
| Expenses: | |
| Investment advisory fee | 2,818,649 |
|
| Administrative fees | 2,258,459 |
|
| Transfer agency fees and expenses | 1,352,123 |
|
| Distribution Plan expenses: | |
| Class A | 1,067,364 |
|
| Class C | 917,136 |
|
| Trustees' fees and expenses | 114,723 |
|
| Custodian fees | 70,350 |
|
| Registration fees | 41,638 |
|
| Reports to shareholders | 56,831 |
|
| Professional fees | 81,239 |
|
| Accounting fees | 103,931 |
|
| Miscellaneous | 31,048 |
|
| Total expenses | 8,913,491 |
|
| Reimbursement from Advisor: | |
| Class A | (492,891 | ) |
| Net expenses | 8,420,600 |
|
| | |
NET INVESTMENT INCOME | 16,043,200 |
|
| | |
REALIZED AND UNREALIZED GAIN (LOSS) | |
| Net realized gain (loss) on: | |
| Investments | (7,960,580 | ) |
| Futures | (1,888,029 | ) |
| | (9,848,609 | ) |
| | |
| Change in unrealized appreciation (depreciation) on: | |
| Investments | 7,645,529 |
|
| Futures | (427,566 | ) |
| | 7,217,963 |
|
| | |
NET REALIZED AND UNREALIZED GAIN (LOSS) | (2,630,646 | ) |
| | |
INCREASE (DECREASE) IN NET ASSETS RESULTING FROM OPERATIONS |
| $13,412,554 |
|
| | |
| See notes to financial statements. |
www.calvert.com CALVERT SHORT DURATION INCOME FUND SEMI-ANNUAL REPORT (UNAUDITED) 25
STATEMENTS OF CHANGES IN NET ASSETS
|
| | | | | | | |
| INCREASE (DECREASE) IN NET ASSETS | SIX MONTHS ENDED MARCH 31, 2015 | | YEAR ENDED SEPTEMBER 30, 2014 |
| Operations: | | | |
| Net investment income |
| $16,043,200 |
| |
| $34,591,594 |
|
| Net realized gain (loss) | (9,848,609 | ) | | 4,243,090 |
|
| Change in unrealized appreciation (depreciation) | 7,217,963 |
| | (13,407,468 | ) |
| | | | |
INCREASE (DECREASE) IN NET ASSETS RESULTING FROM OPERATIONS | 13,412,554 |
| | 25,427,216 |
|
| | | | |
| Distributions to shareholders from: | | | |
| Net investment income: | | | |
| Class A shares | (7,688,786 | ) | | (20,185,154 | ) |
| Class C shares | (976,470 | ) | | (2,461,905 | ) |
| Class I shares | (3,091,623 | ) | | (4,892,987 | ) |
| Class Y shares | (4,205,423 | ) | | (7,226,530 | ) |
| Net realized gain: | | | |
| Class A shares | (227,124 | ) | | — |
|
| Class C shares | (49,202 | ) | | — |
|
| Class I shares | (66,491 | ) | | — |
|
| Class Y shares | (104,070 | ) | | — |
|
| Total distributions | (16,409,189 | ) | | (34,766,576 | ) |
| | | | |
| Capital share transactions: | | | |
| Shares sold: | | | |
| Class A shares | 70,498,789 |
| | 215,050,083 |
|
| Class C shares | 9,390,295 |
| | 24,025,330 |
|
| Class I shares | 89,077,370 |
| | 113,773,938 |
|
| Class Y shares | 75,521,891 |
| | 217,732,943 |
|
| Reinvestment of distributions: | | | |
| Class A shares | 6,998,656 |
| | 17,773,508 |
|
| Class C shares | 675,041 |
| | 1,597,502 |
|
| Class I shares | 2,645,485 |
| | 3,982,761 |
|
| Class Y shares | 3,198,375 |
| | 4,736,024 |
|
| Redemption fees: | | | |
| Class A shares | 1,813 |
| | 17,939 |
|
| Class C shares | 693 |
| | 2,591 |
|
| Class I shares | 80 |
| | — |
|
| Class Y shares | 2,320 |
| | 10,681 |
|
| See notes to financial statements. |
26 www.calvert.com CALVERT SHORT DURATION INCOME FUND SEMI-ANNUAL REPORT (UNAUDITED)
STATEMENTS OF CHANGES IN NET ASSETS
|
| | | | | | | |
| INCREASE (DECREASE) IN NET ASSETS | SIX MONTHS ENDED MARCH 31, 2015 | | YEAR ENDED SEPTEMBER 30, 2014 |
| Capital share transactions - Cont’d: | | | |
| Shares redeemed: | | | |
| Class A shares |
| ($207,396,538 | ) | |
| ($440,035,258 | ) |
| Class C shares | (32,841,669 | ) | | (58,879,155 | ) |
| Class I shares | (60,437,219 | ) | | (42,467,319 | ) |
| Class Y shares | (90,948,346 | ) | | (148,953,532 | ) |
| Total capital share transactions | (133,612,964 | ) | | (91,631,964 | ) |
| | | | |
TOTAL INCREASE (DECREASE) IN NET ASSETS | (136,609,599 | ) | | (100,971,324 | ) |
| | | | |
NET ASSETS | | | |
| Beginning of period | 1,760,019,491 |
| | 1,860,990,815 |
|
| End of period (undistributed net investment income of $162,963 and $82,065, respectively) |
| $1,623,409,892 |
| |
| $1,760,019,491 |
|
| | | | |
CAPITAL SHARE ACTIVITY | | | |
| Shares sold: | | | |
| Class A shares | 4,368,168 |
| | 13,172,075 |
|
| Class C shares | 584,193 |
| | 1,477,002 |
|
| Class I shares | 5,483,803 |
| | 6,931,225 |
|
| Class Y shares | 4,637,973 |
| | 13,242,207 |
|
| Reinvestment of distributions: | | | |
| Class A shares | 434,120 |
| | 1,089,324 |
|
| Class C shares | 42,027 |
| | 98,264 |
|
| Class I shares | 163,209 |
| | 242,944 |
|
| Class Y shares | 196,791 |
| | 288,086 |
|
| Shares redeemed: | | | |
| Class A shares | (12,841,553 | ) | | (26,964,235 | ) |
| Class C shares | (2,042,909 | ) | | (3,621,354 | ) |
| Class I shares | (3,723,716 | ) | | (2,586,063 | ) |
| Class Y shares | (5,588,835 | ) | | (9,054,602 | ) |
| Total capital share activity | (8,286,729 | ) | | (5,685,127 | ) |
| | | | |
| See notes to financial statements. |
www.calvert.com CALVERT SHORT DURATION INCOME FUND SEMI-ANNUAL REPORT (UNAUDITED) 27
NOTES TO FINANCIAL STATEMENTS
NOTE A — SIGNIFICANT ACCOUNTING POLICIES
General: Calvert Short Duration Income Fund (the “Fund”), a series of The Calvert Fund, is registered under the Investment Company Act of 1940 as a non-diversified, open-end management investment company. The Calvert Fund is comprised of six separate series. The operations of each series are accounted for separately. The Fund currently offers four classes of shares of beneficial interest - Classes A, C, I, and Y. Class A shares are sold with a maximum front-end sales charge of 2.75%. Class C shares are sold without a front-end sales charge and, with certain exceptions, will be charged a deferred sales charge on shares sold within one year of purchase. Class C shares have a higher expense ratio than Class A shares. Class I shares require a minimum account balance of $1,000,000. The $1 million minimum initial investment is waived for retirement plans that trade through omnibus accounts and may be waived for certain other institutional accounts where it is believed to be in the best interest of the Fund and its shareholders. Class I shares have no front-end or deferred sales charge and have lower levels of expenses than Class A shares. Class Y shares are generally only available to wrap or similar fee-based programs offered by financial intermediaries, foundations, and endowments that have entered into an agreement with the Fund’s Distributor to offer Class Y shares. Class Y shares have no front-end or deferred sales charge and have lower levels of expenses than Class A shares. Each class has different: (a) dividend rates due to differences in Distribution Plan expenses and other class specific expenses, (b) exchange privileges and (c) class specific voting rights.
Security Valuation: Net asset value per share is determined every business day as of the close of the regular session of the New York Stock Exchange (generally 4:00 p.m. Eastern time). The Fund uses independent pricing services approved by the Board of Trustees (“the Board”) to value its investments wherever possible. Investments for which market quotations are not available or deemed not reliable are fair valued in good faith under the direction of the Board.
The Board has adopted Valuation Procedures (the “Procedures”) to determine the fair value of securities and other financial instruments for which market prices are not readily available or which may not be reliably priced. The Board has delegated the day-to-day responsibility for determining the fair value of assets of the Fund to Calvert Investment Management, Inc. (the “Advisor” or “Calvert”) and has provided these Procedures to govern Calvert in its valuation duties.
Calvert has chartered an internal Valuation Committee to oversee the implementation of these Procedures and to assist it in carrying out the valuation responsibilities that the Board has delegated.
The Valuation Committee meets on a regular basis to review illiquid securities and other investments which may not have readily available market prices. The Valuation Committee’s fair valuation determinations are subject to review, approval and ratification by the Board at its next regularly scheduled meeting covering the calendar quarter in which the fair valuation was determined.
The Valuation Committee utilizes various methods to measure the fair value of the Fund’s investments. Generally Accepted Accounting Principles (GAAP) establishes a disclosure hierarchy that categorizes the inputs to valuation techniques used to value assets and liabilities at measurement date. These inputs are summarized in the three broad levels listed below:
Level 1 - quoted prices in active markets for identical securities
28 www.calvert.com CALVERT SHORT DURATION INCOME FUND SEMI-ANNUAL REPORT (UNAUDITED)
Level 2 - other significant observable inputs (including quoted prices for similar securities, interest rates, prepayment speeds, credit risk, etc.)
Level 3 - significant unobservable inputs (including the Fund’s own assumptions in determining the fair value of investments)
The inputs or methodologies used for valuing securities are not necessarily an indication of the risk associated with investing in those securities.
Changes in valuation techniques may result in transfers in or out of an investment’s assigned level within the hierarchy during the period. There were no such transfers during the period. Valuation techniques used to value the Fund’s investments by major category are as follows:
Debt securities, including restricted securities, are valued based on evaluated prices received from independent pricing services or from dealers who make markets in such securities. For corporate bonds, sovereign government bonds, floating rate loans, municipal securities, and U.S. government and government agency obligations, pricing services utilize matrix pricing which considers yield or price of bonds of comparable quality, coupon, maturity and type as well as dealer supplied prices and such securities are generally categorized as Level 2 in the hierarchy. For asset-backed securities, collateralized mortgage-backed obligations and commercial mortgage-backed securities pricing services utilize matrix pricing which considers prepayment speed assumptions, attributes of the collateral, yield or price of bonds of comparable quality, coupon, maturity and type as well as dealer supplied prices and, accordingly, such securities are generally categorized as Level 2 in the hierarchy. Short-term securities of sufficient credit quality with remaining maturities of sixty days or less for which quotations are not readily available are valued at amortized cost, which approximates fair value, and are categorized as Level 2 in the hierarchy.
When independent prices are unavailable or unreliable, debt securities may be valued utilizing pricing matrices which consider similar factors that would be used by independent pricing services. These are generally categorized as Level 2 in the hierarchy but may be Level 3 depending on the circumstances.
Futures contracts are valued at the settlement price established each day by the board of trade or exchange on which they are traded and are categorized as Level 1 in the hierarchy.
If a market value cannot be determined for a security using the methodologies described above, or if, in the good faith opinion of the Advisor, the market value does not constitute a readily available market quotation, or if a significant event has occurred that would materially affect the value of the security, the security will be fair valued as determined in good faith by the Valuation Committee.
The Valuation Committee considers a number of factors, including significant unobservable valuation inputs when arriving at fair value. It considers all significant facts that are reasonably available and relevant to the determination of fair value.
The Valuation Committee primarily employs a market-based approach which may use related or comparable assets or liabilities, recent transactions, market multiples, book values, and other relevant information for the investment to determine the fair value of the investment. When more appropriate, the fund may employ an income-based or cost approach. An income-based valuation approach discounts anticipated future cash flows of the investment to calculate a present amount (discounted). The measurement is based on the value indicated by current market expectations about those future amounts. Discounts may also be applied due to the nature or duration of any restrictions on the disposition of the investments. A cost based
www.calvert.com CALVERT SHORT DURATION INCOME FUND SEMI-ANNUAL REPORT (UNAUDITED) 29
approach is based on the amount that currently would be required to replace the service capacity of an asset (current replacement cost). From the seller’s perspective, the price that would be received for the asset is determined based on the cost to a buyer to acquire or construct a substitute asset of comparable utility, adjusted for obsolescence.
The values assigned to fair value investments are based on available information and do not necessarily represent amounts that might ultimately be realized. Further, due to the inherent uncertainty of valuations of such investments, the fair values may differ significantly from the values that would have been used had an active market existed, and the differences could be material. The Valuation Committee employs various methods for calibrating these valuation approaches including a regular review of key inputs and assumptions, transactional back-testing or disposition analysis and reviews of any related market activity.
At March 31, 2015, securities valued at $0, or 0.0% of net assets, were fair valued in good faith under the direction of the Board.
The following table summarizes the market value of the Fund’s holdings as of March 31, 2015, based on the inputs used to value them:
|
| | | | | | | | | | | | | | |
| | VALUATION INPUTS |
INVESTMENTS IN SECURITIES* | LEVEL 1 | | LEVEL 2 | | LEVEL 3 | | TOTAL |
| Asset-backed securities | — |
| |
| $373,474,423 |
| | — |
| |
| $373,474,423 |
|
| Collateralized mortgage-backed obligations | — |
| | 33,048,236 |
| | — |
| | 33,048,236 |
|
| Commercial mortgage-backed securities | — |
| | 138,321,312 |
| | — |
| | 138,321,312 |
|
| Corporate bonds | — |
| | 923,564,507 |
| | ** |
| | 923,564,507 |
|
| Municipal obligations | — |
| | 14,460,000 |
| | — |
| | 14,460,000 |
|
| U.S. government obligations | — |
| | 109,892,108 |
| | — |
| | 109,892,108 |
|
| Other debt obligations | — |
| | 22,699,661 |
| | — |
| | 22,699,661 |
|
| TOTAL | — |
| |
| $1,615,460,247 |
| | ** |
| |
| $1,615,460,247 |
|
| Other financial instruments*** |
| $189,997 |
| | — |
| | — |
| |
| $189,997 |
|
| | | | | | | | |
* For a complete listing of investments, please refer to the Statement of Net Assets. ** Level 3 securities were valued at $0 and represent 0.0% of net assets. *** Other financial instruments are derivative instruments not reflected in the Total Investments in the Statement of Net Assets, such as futures, which are valued at the unrealized appreciation/depreciation on the instrument. |
Loan Participations and Assignments: The Fund may invest in direct debt instruments which are interests in amounts owed to lenders or lending syndicates by corporate, governmental, or other borrowers. A Fund’s investments in loans may be in the form of participations in loans or assignments of all or a portion of loans from third parties. A loan is often administered by a bank or other financial institution (the “lender”) that acts as agent for all holders. The agent administers the terms of the loan, as specified in the loan agreement. A Fund may invest in multiple series or tranches of a loan, which may have varying terms and carry different associated risks. A Fund generally has no right to enforce compliance with the terms of the loan agreement with the borrower. As a result, a Fund may be subject to the credit risk of both the borrower and the lender that is selling the loan agreement. When a Fund purchases assignments from lenders it acquires direct rights against the borrower of the loan.
30 www.calvert.com CALVERT SHORT DURATION INCOME FUND SEMI-ANNUAL REPORT (UNAUDITED)
When investing in a loan participation, a Fund has the right to receive payments of principal, interest and any fees to which it is entitled only from the lender selling the loan agreement and only upon receipt of payments by the lender from the borrower.
Futures Contracts: The Fund may purchase and sell futures contracts, but only when, in the judgment of the Advisor, such a position acts as a hedge. The Fund may not enter into futures contracts for the purpose of speculation or leverage. These futures contracts may include, but are not limited to, futures contracts based on U.S. Government obligations. The Fund is subject to interest rate risk in the normal course of pursuing its investment objectives and may use futures contracts to hedge against changes in the value of interest rates. The Fund may enter into futures contracts agreeing to buy or sell a financial instrument for a set price at a future date. Initial margin deposits of either cash or securities as required by the broker are made upon entering into the contract. While the contract is open, daily variation margin payments are made to or received from the broker reflecting the daily change in market value of the contract and are recorded for financial reporting purposes as unrealized gains or losses by the Fund. When a futures contract is closed, a realized gain or loss is recorded equal to the difference between the opening and closing value of the contract. The risks associated with entering into futures contracts may include the possible illiquidity of the secondary market which would limit the Fund’s ability to close out a futures contract prior to the settlement date, an imperfect correlation between the value of the contracts and the underlying financial instruments, or that the counterparty will fail to perform its obligations under the contracts’ terms. Futures contracts are designed by boards of trade which are designated “contracts markets” by the Commodities Futures Trading Commission. Futures contracts trade on the contracts markets in a manner that is similar to the way a stock trades on a stock exchange and the boards of trade, through their clearing corporations, guarantee the futures contracts against default. As a result, there is minimal counterparty credit risk to the Fund. During the period, the Fund used U.S. Treasury Notes futures contracts to hedge against interest rate changes and to manage overall duration of the Fund. The Fund’s futures contracts at period end are presented in the Statement of Net Assets.
During the period, the Fund invested in 2 year, 5 year and 10 year U.S. Treasury Notes futures. The volume of outstanding contracts has varied throughout the period with a weighted average of 635 contracts and $7,730,417 weighted average notional value.
Short Sales: The Fund may use a hedging technique that involves short sales of U.S. Treasury securities for the purpose of managing the duration of the Fund. Any short sales are “covered” with an equivalent amount of high quality, liquid securities.
Security Transactions and Net Investment Income: Security transactions are accounted for on trade date. Realized gains and losses are recorded on an identified cost basis and may include proceeds from litigation. Dividend income is recorded on the ex-dividend date. Distributions received on securities that represent a return of capital or capital gains are recorded as a reduction of cost of investments and/or as a realized gain. Interest income, which includes amortization of premium and accretion of discount on debt securities, is accrued as earned. Debt obligations may be placed on non-accrual status and related interest income may be reduced by ceasing current accruals and writing off interest receivables when the collection of all or a portion of interest has become doubtful based on consistently applied procedures. (See the Statement of Net Assets footnotes on page 24.) A debt obligation may be removed from non-accrual status when the issuer resumes interest payments or when collectability of interest is reasonably assured. The Fund earns certain fees in connection with its floating rate loan purchasing activities. These fees are in addition to interest payments earned and may include amendment fees, consent fees and prepayment fees. Investment income and realized
www.calvert.com CALVERT SHORT DURATION INCOME FUND SEMI-ANNUAL REPORT (UNAUDITED) 31
and unrealized gains and losses are allocated to separate classes of shares based upon the relative net assets of each class. Expenses arising in connection with a specific class are charged directly to that class. Expenses common to the classes are allocated to each class in proportion to their relative net assets.
Distributions to Shareholders: Distributions to shareholders are recorded by the Fund on ex-dividend date. Dividends from net investment income are paid monthly. Distributions from net realized capital gains, if any, are paid at least annually. Distributions are determined in accordance with income tax regulations which may differ from generally accepted accounting principles; accordingly, periodic reclassifications are made within the Fund’s capital accounts to reflect income and gains available for distribution under income tax regulations.
Estimates: The preparation of the financial statements in conformity with accounting principles generally accepted in the United States requires management to make estimates and assumptions that affect the reported amounts of assets and liabilities and disclosure of contingent assets and liabilities at the date of the financial statements and the reported amounts of income and expenses during the reported period. Actual results could differ from those estimates.
Redemption Fees: The Fund charges a 2% redemption fee on redemptions, including exchanges, made within 30 days of purchase in the same Fund (within seven days for Class I shares). The redemption fee is accounted for as an addition to paid-in capital and is intended to discourage market-timers by ensuring that short-term trading costs are borne by the investors making the transactions and not the shareholders already in the Fund. This fee was eliminated effective February 2, 2015.
Federal Income Taxes: No provision for federal income or excise tax is required since the Fund intends to continue to qualify as a regulated investment company under the Internal Revenue Code and to distribute substantially all of its taxable earnings.
Management has analyzed the Fund’s tax positions taken for all open federal income tax years and has concluded that no provision for federal income tax is required in the Fund’s financial statements. A Fund’s federal tax return is subject to examination by the Internal Revenue Service for a period of three years.
NOTE B — RELATED PARTY TRANSACTIONS
Calvert Investment Management, Inc. (the “Advisor”) is wholly-owned by Calvert Investments, Inc., which is indirectly wholly-owned by Ameritas Mutual Holding Company. The Advisor provides investment advisory services and pays the salaries and fees of officers and Trustees of the Fund who are employees of the Advisor or its affiliates. For its services, the Advisor receives an annual fee, payable monthly, based on the following annual rates of average net assets: .35% on the first $750 million, .325% next $750 million, .30% next $2 billion, and .275% over $3.5 billion. Under the terms of the agreement, $465,565 was payable at period end.
The Advisor has contractually agreed to limit net annual fund operating expenses through January 31, 2016. The contractual expense caps are 1.08%, .75%, and .95% for Class A, I, and Y, respectively. For the purpose of this expense limit, operating expenses do not include interest expense, brokerage commissions, taxes, and extraordinary expenses. This expense limitation does not limit acquired fund fees and expenses, if any. At period end, $41,115 was receivable from the Advisor.
Calvert Investment Administrative Services, Inc., an affiliate of the Advisor, provides administrative services to the Fund for an annual fee, payable monthly. Class A, C, and Y
32 www.calvert.com CALVERT SHORT DURATION INCOME FUND SEMI-ANNUAL REPORT (UNAUDITED)
shares pay an annual rate of .30% on the first $1.5 billion and .275% over $1.5 billion of the combined assets of all classes of the Fund. Class I shares pay an annual rate of .10%, based on their average daily net assets. Under the terms of the agreement, $368,768 was payable at period end.
Calvert Investment Distributors, Inc. (“CID”), an affiliate of the Advisor, is the distributor and principal underwriter for the Fund. Pursuant to Rule 12b-1 under the Investment Company Act of 1940, the Fund has adopted a Distribution Plan that permits the Fund to pay certain expenses associated with the distribution and servicing of its shares. The expenses paid may not exceed .50% and 1.00% annually of the Fund’s average daily net assets of Class A and C, respectively. The amount actually paid by the Fund is an annualized fee, payable monthly, of .25% and 1.00% of the Fund’s average daily net assets of Class A and C, respectively. Class I and Y shares do not have Distribution Plan expenses. Under the terms of the agreement, $318,267 was payable at period end.
CID received $15,703 as its portion of the commissions charged on sales of the Fund’s Class A shares for the six months ended March 31, 2015.
Calvert Investment Services, Inc. (“CIS”), an affiliate of the Advisor, is the shareholder servicing agent for the Fund. For its services, CIS received a fee of $54,211 for the six months ended March 31, 2015. Under the terms of the agreement, $8,257 was payable at period end. Boston Financial Data Services, Inc. is the transfer and dividend disbursing agent.
Each Trustee of the Fund who is not an employee of the Advisor or its affiliates receives an annual fee of $45,000 plus up to $2,000 for each regular Board and Committee meeting attended. The Board chair and Committee chairs each receive an additional $5,000 annual retainer. Trustees’ fees are allocated to each of the funds served.
NOTE C — INVESTMENT ACTIVITY AND TAX INFORMATION
During the period, the cost of purchases and proceeds from sales of investments, other than short-term and U.S. government securities, were $666,103,868 and $836,317,038, respectively. U.S. government security purchases and sales were $1,392,619,768 and $1,357,243,576, respectively.
The Fund may purchase securities, typically short-term variable rate demand notes, from or sell to other funds managed by the Advisor. These interportfolio transactions are primarily used for cash management purposes and are made pursuant to Rule 17a-7 of the Investment Company Act of 1940. For the six months ended March 31, 2015, such purchase and sales transactions were $16,460,000 and $7,700,000, respectively. There were no gains or losses on these sale transactions.
As of March 31, 2015, the tax basis components of unrealized appreciation/(depreciation) and the federal tax cost were as follows:
|
| | | |
| Unrealized appreciation |
| $21,989,375 |
|
| Unrealized (depreciation) | (4,006,085 | ) |
| Net unrealized appreciation/(depreciation) |
| $17,983,290 |
|
| | |
| Federal income tax cost of investments |
| $1,597,476,957 |
|
www.calvert.com CALVERT SHORT DURATION INCOME FUND SEMI-ANNUAL REPORT (UNAUDITED) 33
NOTE D — LINE OF CREDIT
A financing agreement is in place with the Calvert Funds and State Street Corporation (“SSC”). Under the agreement, SSC provides an unsecured line of credit facility, in the aggregate amount of $50 million ($25 million committed and $25 million uncommitted), accessible by the Funds for temporary or emergency purposes only. Borrowings bear interest at the higher of the London Interbank Offered Rate (LIBOR) or the overnight Federal Funds Rate plus 1.25% per annum. A commitment fee of .125% per annum is incurred on the unused portion of the committed facility, which is allocated to all participating funds. The Fund had no loans outstanding pursuant to this line of credit at March 31, 2015. For the six months ended March 31, 2015, borrowings by the Fund under the agreement were as follows:
|
| | | |
AVERAGE DAILY BALANCE | WEIGHTED AVERAGE INTEREST RATE | MAXIMUM AMOUNT BORROWED | MONTH OF MAXIMUM AMOUNT BORROWED |
| $6,911 | 1.38% | $1,257,796 | March 2015 |
NOTE E — REGULATORY MATTERS
In October 2011, the Advisor determined that it was necessary to change the price at which one of the Fund’s portfolio securities was then being fair valued. The Advisor and the Board of Trustees subsequently determined it was appropriate to change the fair value prices at which that security and certain related securities had been carried from March 2008 through September 30, 2011. These fair value revisions had the effect of changing the net asset value per share at which shareholder subscriptions and redemptions were executed during the affected period. Accordingly, in December 2011, pursuant to an agreement (“the Agreement”) with the Board of Trustees, the Advisor contributed $10,161,859 to the Fund to adjust shareholder trades occurring during the respective period for the benefit of affected shareholders.
Subsequent to the Agreement, the Securities and Exchange Commission (“SEC”) conducted a compliance examination of the Advisor and the Calvert Funds (“the Funds”). In a letter dated November 1, 2013, the SEC communicated its examination findings that included various deficiencies and weaknesses and concerns regarding whether the contribution and shareholder disbursement, discussed above, was properly calculated and distributed to certain shareholders.
Management of the Advisor and the Funds responded to the SEC examination and believe a number of corrective actions have been taken since October 2011 to address the matters raised in the examination. Also, in management’s opinion, the contribution noted above was properly calculated and distributed by the Fund to benefit the affected shareholders and was in accordance with the Agreement. The SEC is continuing its examination of these matters. It is also management’s opinion that the resolution of the examination matters will not have a material adverse effect on the financial position or results of operations of the Fund.
NOTE F — SUBSEQUENT EVENTS
On December 10, 2014, the Board of Trustees approved the reorganization of the Calvert Government Fund into the Fund. Shareholders approved the reorganization at a meeting on April 17, 2015 and the reorganization took place on April 30, 2015.
In preparing the financial statements as of March 31, 2015, no other subsequent events or transactions occurred that would have required recognition or disclosure in these financial statements.
34 www.calvert.com CALVERT SHORT DURATION INCOME FUND SEMI-ANNUAL REPORT (UNAUDITED)
FINANCIAL HIGHLIGHTS
|
| | | | | | | | | | | |
| | | PERIODS ENDED | |
CLASS A SHARES | MARCH 31, 2015 | | SEPTEMBER 30, 2014 (z) | | SEPTEMBER 30, 2013 (z) |
| Net asset value, beginning |
| $16.19 |
| |
| $16.28 |
| |
| $16.43 |
|
| Income from investment operations: | | | | | |
| Net investment income | .15 |
| | .31 |
| | .30 |
|
| Net realized and unrealized gain (loss) | (.03 | ) | | (.09 | ) | | (.12 | ) |
| Total from investment operations | .12 |
| | .22 |
| | .18 |
|
| Distributions from: | | | | | |
| Net investment income | (.15 | ) | | (.31 | ) | | (.32 | ) |
| Net realized gain | ** |
| | — |
| | (.01 | ) |
| Total distributions | (.15 | ) | | (.31 | ) | | (.33 | ) |
| Total increase (decrease) in net asset value | (.03 | ) | | (.09 | ) | | (.15 | ) |
| Net asset value, ending |
| $16.16 |
| |
| $16.19 |
| |
| $16.28 |
|
| | | | | | |
| Total return* | .75 | % | | 1.34 | % | | 1.12 | % |
Ratios to average net assets: A | | | | | |
| Net investment income | 1.81% (a) |
| | 1.87 | % | | 1.84 | % |
| Total expenses | 1.20% (a) |
| | 1.14 | % | | 1.12 | % |
| Expenses before offsets | 1.08% (a) |
| | 1.08 | % | | 1.08 | % |
| Net expenses | 1.08% (a) |
| | 1.08 | % | | 1.08 | % |
| Portfolio turnover | 126 | % | | 168 | % | | 166 | % |
| Net assets, ending (in thousands) |
| $802,063 |
| |
| $933,534 |
| |
| $1,145,473 |
|
| | | | | | |
|
| | | | | | | | | | | |
| | | | YEARS ENDED | | |
CLASS A SHARES | SEPTEMBER 30, 2012 | | SEPTEMBER 30, 2011 (z) | | SEPTEMBER 30, 2010 |
| Net asset value, beginning |
| $16.06 |
| |
| $16.64 |
| |
| $16.48 |
|
| Income from investment operations: | | | | | |
| Net investment income | .35 |
| | .33 |
| | .42 |
|
| Net realized and unrealized gain (loss) | .65 |
| | (.40 | ) | | .37 |
|
| Total from investment operations | 1.00 |
| | (.07 | ) | | .79 |
|
| Distributions from: | | | | | |
| Net investment income | (.38 | ) | | (.39 | ) | | (.40 | ) |
| Net realized gain | (.25 | ) | | (.12 | ) | | (.23 | ) |
| Total distributions | (.63 | ) | | (.51 | ) | | (.63 | ) |
| Total increase (decrease) in net asset value | .37 |
| | (.58 | ) | | .16 |
|
| Net asset value, ending |
| $16.43 |
| |
| $16.06 |
| |
| $16.64 |
|
| | | | | | |
| Total return* | 6.41 | % | | (.46 | %) | | 4.90 | % |
Ratios to average net assets: A | | | | | |
| Net investment income | 2.18 | % | | 2.02 | % | | 2.53 | % |
| Total expenses | 1.22 | % | | 1.15 | % | | 1.14 | % |
| Expenses before offsets | 1.08 | % | | 1.08 | % | | 1.08 | % |
| Net expenses | 1.08 | % | | 1.08 | % | | 1.08 | % |
| Portfolio turnover | 187 | % | | 263 | % | | 226 | % |
| Net assets, ending (in thousands) |
| $1,279,265 |
| |
| $1,686,575 |
| |
| $2,002,449 |
|
| See notes to financial highlights. |
www.calvert.com CALVERT SHORT DURATION INCOME FUND SEMI-ANNUAL REPORT (UNAUDITED) 35
FINANCIAL HIGHLIGHTS
|
| | | | | | | | | | | |
| | | PERIODS ENDED | |
CLASS C SHARES | MARCH 31, 2015 | | SEPTEMBER 30, 2014 (z) | | SEPTEMBER 30, 2013 (z) |
| Net asset value, beginning |
| $16.13 |
| |
| $16.21 |
| |
| $16.37 |
|
| Income from investment operations: | | | | | |
| Net investment income | .09 |
| | .19 |
| | .19 |
|
| Net realized and unrealized gain (loss) | (.03 | ) | | (.08 | ) | | (.14 | ) |
| Total from investment operations | .06 |
| | .11 |
| | .05 |
|
| Distributions from: | | | | | |
| Net investment income | (.09 | ) | | (.19 | ) | | (.20 | ) |
| Net realized gain | ** |
| | — |
| | (.01 | ) |
| Total distributions | (.09 | ) | | (.19 | ) | | (.21 | ) |
| Total increase (decrease) in net asset value | (.03 | ) | | (.08 | ) | | (.16 | ) |
| Net asset value, ending |
| $16.10 |
| |
| $16.13 |
| |
| $16.21 |
|
| | | | | | |
| Total return* | .38 | % | | .67 | % | | .34 | % |
Ratios to average net assets: A | | | | | |
| Net investment income | 1.07% (a) |
| | 1.15 | % | | 1.14 | % |
| Total expenses | 1.82% (a) |
| | 1.80 | % | | 1.78 | % |
| Expenses before offsets | 1.82% (a) |
| | 1.80 | % | | 1.78 | % |
| Net expenses | 1.82% (a) |
| | 1.80 | % | | 1.78 | % |
| Portfolio turnover | 126 | % | | 168 | % | | 166 | % |
| Net assets, ending (in thousands) |
| $171,011 |
| |
| $194,133 |
| |
| $228,366 |
|
| | | | | | |
|
| | | | | | | | | | | |
| | | | YEARS ENDED | | |
CLASS C SHARES | SEPTEMBER 30, 2012 | | SEPTEMBER 30, 2011 (z) | | SEPTEMBER 30, 2010 |
| Net asset value, beginning |
| $15.99 |
| |
| $16.58 |
| |
| $16.41 |
|
| Income from investment operations: | | | | | |
| Net investment income | .22 |
| | .21 |
| | .29 |
|
| Net realized and unrealized gain (loss) | .66 |
| | (.41 | ) | | .38 |
|
| Total from investment operations | .88 |
| | (.20 | ) | | .67 |
|
| Distributions from: | | | | | |
| Net investment income | (.25 | ) | | (.27 | ) | | (.27 | ) |
| Net realized gain | (.25 | ) | | (.12 | ) | | (.23 | ) |
| Total distributions | (.50 | ) | | (.39 | ) | | (.50 | ) |
| Total increase (decrease) in net asset value | .38 |
| | (.59 | ) | | .17 |
|
| Net asset value, ending |
| $16.37 |
| |
| $15.99 |
| |
| $16.58 |
|
| | | | | | |
| Total return* | 5.65 | % | | (1.25 | %) | | 4.18 | % |
Ratios to average net assets: A | | | | | |
| Net investment income | 1.40 | % | | 1.30 | % | | 1.79 | % |
| Total expenses | 1.86 | % | | 1.79 | % | | 1.80 | % |
| Expenses before offsets | 1.86 | % | | 1.79 | % | | 1.80 | % |
| Net expenses | 1.86 | % | | 1.79 | % | | 1.80 | % |
| Portfolio turnover | 187 | % | | 263 | % | | 226 | % |
| Net assets, ending (in thousands) |
| $258,843 |
| |
| $311,299 |
| |
| $337,866 |
|
| See notes to financial highlights. |
36 www.calvert.com CALVERT SHORT DURATION INCOME FUND SEMI-ANNUAL REPORT (UNAUDITED)
FINANCIAL HIGHLIGHTS
|
| | | | | | | | | | | |
| | | PERIODS ENDED | |
CLASS I SHARES | MARCH 31, 2015 | | SEPTEMBER 30, 2014 (z) | | SEPTEMBER 30, 2013 (z) |
| Net asset value, beginning |
| $16.27 |
| |
| $16.35 |
| |
| $16.51 |
|
| Income from investment operations: | | | | | |
| Net investment income | .19 |
| | .40 |
| | .39 |
|
| Net realized and unrealized gain (loss) | (.02 | ) | | (.08 | ) | | (.13 | ) |
| Total from investment operations | .17 |
| | .32 |
| | .26 |
|
| Distributions from: | | | | | |
| Net investment income | (.19 | ) | | (.40 | ) | | (.41 | ) |
| Net realized gain | ** |
| | — |
| | (.01 | ) |
| Total distributions | (.19 | ) | | (.40 | ) | | (.42 | ) |
| Total increase (decrease) in net asset value | (.02 | ) | | (.08 | ) | | (.16 | ) |
| Net asset value, ending |
| $16.25 |
| |
| $16.27 |
| |
| $16.35 |
|
| | | | | | |
| Total return* | 1.09 | % | | 1.97 | % | | 1.64 | % |
Ratios to average net assets: A | | | | | |
| Net investment income | 2.40% (a) |
| | 2.46 | % | | 2.44 | % |
| Total expenses | .50% (a) |
| | .48 | % | | .49 | % |
| Expenses before offsets | .50% (a) |
| | .48 | % | | .49 | % |
| Net expenses | .50% (a) |
| | .48 | % | | .49 | % |
| Portfolio turnover | 126 | % | | 168 | % | | 166 | % |
| Net assets, ending (in thousands) |
| $262,330 |
| |
| $231,420 |
| |
| $157,557 |
|
| | | | | | |
|
| | | | | | | | | | | |
| | | | YEARS ENDED | | |
CLASS I SHARES | SEPTEMBER 30, 2012 | | SEPTEMBER 30, 2011 (z) | | SEPTEMBER 30, 2010 |
| Net asset value, beginning |
| $16.12 |
| |
| $16.71 |
| |
| $16.53 |
|
| Income from investment operations: | | | | | |
| Net investment income | .44 |
| | .43 |
| | .50 |
|
| Net realized and unrealized gain (loss) | .66 |
| | (.42 | ) | | .39 |
|
| Total from investment operations | 1.10 |
| | .01 |
| | .89 |
|
| Distributions from: | | | | | |
| Net investment income | (.46 | ) | | (.48 | ) | | (.48 | ) |
| Net realized gain | (.25 | ) | | (.12 | ) | | (.23 | ) |
| Total distributions | (.71 | ) | | (.60 | ) | | (.71 | ) |
| Total increase (decrease) in net asset value | .39 |
| | (.59 | ) | | .18 |
|
| Net asset value, ending |
| $16.51 |
| |
| $16.12 |
| |
| $16.71 |
|
| | | | | | |
| Total return* | 7.05 | % | | .05 | % | | 5.53 | % |
Ratios to average net assets: A | | | | | |
| Net investment income | 2.72 | % | | 2.57 | % | | 3.07 | % |
| Total expenses | .55 | % | | .49 | % | | .51 | % |
| Expenses before offsets | .55 | % | | .49 | % | | .51 | % |
| Net expenses | .55 | % | | .49 | % | | .51 | % |
| Portfolio turnover | 187 | % | | 263 | % | | 226 | % |
| Net assets, ending (in thousands) |
| $100,874 |
| |
| $85,310 |
| |
| $59,348 |
|
| See notes to financial highlights. |
www.calvert.com CALVERT SHORT DURATION INCOME FUND SEMI-ANNUAL REPORT (UNAUDITED) 37
FINANCIAL HIGHLIGHTS
|
| | | | | | | | | | | |
| | | PERIODS ENDED | |
CLASS Y SHARES | MARCH 31, 2015 | | SEPTEMBER 30, 2014 (z) | | SEPTEMBER 30, 2013 (z) |
| Net asset value, beginning |
| $16.32 |
| |
| $16.40 |
| |
| $16.56 |
|
| Income from investment operations: | | | | | |
| Net investment income | .17 |
| | .36 |
| | .36 |
|
| Net realized and unrealized gain (loss) | (.03 | ) | | (.08 | ) | | (.13 | ) |
| Total from investment operations | .14 |
| | .28 |
| | .23 |
|
| Distributions from: | | | | | |
| Net investment income | (.17 | ) | | (.36 | ) | | (.38 | ) |
| Net realized gain | ** |
| | — |
| | (.01 | ) |
| Total distributions | (.17 | ) | | (.36 | ) | | (.39 | ) |
| Total increase (decrease) in net asset value | (.03 | ) | | (.08 | ) | | (.16 | ) |
| Net asset value, ending |
| $16.29 |
| |
| $16.32 |
| |
| $16.40 |
|
| | | | | | |
| Total return* | .91 | % | | 1.70 | % | | 1.41 | % |
Ratios to average net assets: A | | | | | |
| Net investment income | 2.13% (a) |
| | 2.17 | % | | 2.19 | % |
| Total expenses | .76% (a) |
| | .76 | % | | .73 | % |
| Expenses before offsets | .76% (a) |
| | .76 | % | | .73 | % |
| Net expenses | .76% (a) |
| | .76 | % | | .73 | % |
| Portfolio turnover | 126 | % | | 168 | % | | 166 | % |
| Net assets, ending (in thousands) |
| $388,006 |
| |
| $400,932 |
| |
| $329,595 |
|
| | | | | | |
|
| | | | | | | | | | | |
| | | | YEARS ENDED | | |
CLASS Y SHARES | SEPTEMBER 30, 2012 | | SEPTEMBER 30, 2011 (z) | | SEPTEMBER 30, 2010 |
| Net asset value, beginning |
| $16.18 |
| |
| $16.79 |
| |
| $16.59 |
|
| Income from investment operations: | | | | | |
| Net investment income | .40 |
| | .40 |
| | .43 |
|
| Net realized and unrealized gain (loss) | .66 |
| | (.43 | ) | | .42 |
|
| Total from investment operations | 1.06 |
| | (.03 | ) | | .85 |
|
| Distributions from: | | | | | |
| Net investment income | (.43 | ) | | (.46 | ) | | (.42 | ) |
| Net realized gain | (.25 | ) | | (.12 | ) | | (.23 | ) |
| Total distributions | (.68 | ) | | (.58 | ) | | (.65 | ) |
| Total increase (decrease) in net asset value | .38 |
| | (.61 | ) | | .20 |
|
| Net asset value, ending |
| $16.56 |
| |
| $16.18 |
| |
| $16.79 |
|
| | | | | | |
| Total return* | 6.77 | % | | (.20 | %) | | 5.24 | % |
Ratios to average net assets: A | | | | | |
| Net investment income | 2.48 | % | | 2.38 | % | | 2.72 | % |
| Total expenses | .81 | % | | .79 | % | | .80 | % |
| Expenses before offsets | .81 | % | | .79 | % | | .80 | % |
| Net expenses | .81 | % | | .79 | % | | .80 | % |
| Portfolio turnover | 187 | % | | 263 | % | | 226 | % |
| Net assets, ending (in thousands) |
| $304,223 |
| |
| $455,764 |
| |
| $1,062,397 |
|
| See notes to financial highlights. |
38 www.calvert.com CALVERT SHORT DURATION INCOME FUND SEMI-ANNUAL REPORT (UNAUDITED)
|
|
A Total expenses do not reflect amounts reimbursed and/or waived by the Advisor or reductions from expense offset arrangements. Expenses before offsets reflect expenses after reimbursement and/or waiver by the Advisor but prior to reductions from expense offset arrangements. Net expenses are net of all reductions and represent the net expenses paid by the Fund. (a) Annualized. (z) Per share figures are calculated using the Average Shares Method. * Total return is not annualized for periods of less than one year and does not reflect deduction of any front-end or deferred sales charge. ** Less than $.01 per share. See notes to financial statements. |
www.calvert.com CALVERT SHORT DURATION INCOME FUND SEMI-ANNUAL REPORT (UNAUDITED) 39
EXPLANATION OF FINANCIAL TABLES
SCHEDULE OF INVESTMENTS
The Schedule of Investments is a snapshot of all securities held in the fund at their market value, on the last day of the reporting period. Securities are listed by asset type (e.g., common stock, corporate bonds, U.S. government obligations) and may be further broken down into sub-groups and by industry classification.
STATEMENT OF ASSETS AND LIABILITIES
The Statement of Assets and Liabilities is often referred to as the fund’s balance sheet. It lists the value of what the fund owns, is due and owes on the last day of the reporting period. The fund’s assets include the market value of securities owned, cash, receivables for securities sold and shareholder subscriptions, and receivables for dividends and interest payments that have been earned, but not yet received. The fund’s liabilities include payables for securities purchased and shareholder redemptions, and expenses owed but not yet paid. The statement also reports the fund’s net asset value (NAV) per share on the last day of the reporting period. The NAV is calculated by dividing the fund’s net assets (assets minus liabilities) by the number of shares outstanding. This statement is accompanied by a Schedule of Investments. Alternatively, if certain conditions are met, a Statement of Net Assets may be presented in lieu of this statement and the Schedule of Investments.
STATEMENT OF NET ASSETS
The Statement of Net Assets provides a detailed list of the fund’s holdings, including each security’s market value on the last day of the reporting period. The Statement of Net Assets includes a Schedule of Investments. Other assets are added and other liabilities subtracted from the investments total to calculate the fund’s net assets. Finally, net assets are divided by the outstanding shares of the fund to arrive at its share price, or Net Asset Value (NAV) per share.
At the end of the Statement of Net Assets is a table displaying the composition of the fund’s net assets. Paid in Capital is the money invested by shareholders and represents the bulk of net assets. Undistributed Net Investment Income and Accumulated Net Realized Gains usually approximate the amounts the fund had available to distribute to shareholders as of the statement date. Accumulated Realized Losses will appear as negative balances. Unrealized Appreciation (Depreciation) is the difference between the market value of the fund’s investments and their cost, and reflects the gains (losses) that would be realized if the fund were to sell all of its investments at their statement-date -values.
STATEMENT OF OPERATIONS
The Statement of Operations summarizes the fund’s investment income earned and expenses incurred in operating the fund. Investment income includes dividends earned from stocks and interest earned from interest-bearing securities in the fund. Expenses incurred in operating the fund include the advisory fee paid to the investment advisor, administrative services fees, distribution plan expenses (if applicable), transfer agent fees, shareholder servicing expenses, custodial, legal, and audit fees, and the printing and postage expenses related to shareholder reports. Expense offsets (fees paid indirectly) may also be shown. Credits earned from offset arrangements are used to reduce the fund’s expenses. This statement also shows net gains (losses) realized on the sale of investments and the increase or decrease in the unrealized appreciation (depreciation) on investments held during the period.
40 www.calvert.com CALVERT SHORT DURATION INCOME FUND SEMI-ANNUAL REPORT (UNAUDITED)
STATEMENT OF CHANGES IN NET ASSETS
The Statement of Changes in Net Assets shows how the fund’s total net assets changed during the two most recent reporting periods. Changes in the fund’s net assets are attributable to investment operations, distributions and capital share transactions.
The Operations section of the report summarizes information detailed in the Statement of Operations. The Distribution section shows the dividend and capital gain distributions made to shareholders. The amounts shown as distributions in this section may not match the net investment income and realized gains amounts shown in the Operations section because distributions are determined on a tax basis and certain investments or transactions may be treated differently for financial statement and tax purposes. The Capital Share Transactions section shows the amount shareholders invested in the fund, either by purchasing shares or by reinvesting distributions, and the amounts redeemed. The corresponding numbers of shares issued, reinvested and redeemed are shown at the end of the report.
FINANCIAL HIGHLIGHTS
The Financial Highlights table provides a per-share breakdown per class of the components that affect the fund’s net asset value for current and past reporting periods. The table provides total return, total distributions, expense ratios, portfolio turnover and net assets for the applicable period. Total return is a measure of a fund’s performance that encompasses all elements of return: dividends, capital gain distributions and changes in net asset value. Total return is the change in value of an investment over a given period, assuming reinvestment of any dividends and capital gain distributions, expressed as a percentage of the initial investment. Total distributions include distributions from net investment income and net realized gains. Long-term gains are earned on securities held in the fund more than one year. Short-term gains, on the sale of securities held less than one year, are treated as ordinary dividend income for tax purposes. The expense ratio is a fund’s cost of doing business, expressed as a percentage of net assets. These expenses directly reduce returns to shareholders. Portfolio turnover measures the trading activity in a fund’s investment portfolio—how often securities are bought and sold by a fund. Portfolio turnover is affected by market conditions, changes in the size of the fund, the nature of the fund’s investments and the investment style of the portfolio manager.
PROXY VOTING
The Proxy Voting Guidelines of the Calvert Funds that the Fund uses to determine how to vote proxies relating to portfolio securities are provided as an Appendix to the Fund’s Statement of Additional Information. The Statement of Additional Information can be obtained free of charge by calling the Fund at 1-800-368-2745, by visiting the Calvert website at www.calvert.com; or by visiting the SEC’s website at www.sec.gov.
Information regarding how the Fund voted proxies relating to portfolio securities during the most recent 12-month period ended June 30 is available on the Fund’s website at www.calvert.com and on the SEC’s website at www.sec.gov.
AVAILABILITY OF QUARTERLY PORTFOLIO HOLDINGS
The Fund files its complete schedule of portfolio holdings with the SEC for the first and third quarters of each fiscal year on Form N-Q. The Fund’s Form N-Q is available on the SEC’s website at www.sec.gov. The Fund’s Form N-Q may be reviewed and copied at the SEC’s Public Reference Room in Washington, DC; information on the operation of the Public Reference Room may be obtained by calling 1-800-SEC-0330.
www.calvert.com CALVERT SHORT DURATION INCOME FUND SEMI-ANNUAL REPORT (UNAUDITED) 41
BASIS FOR BOARD’S APPROVAL OF INVESTMENT ADVISORY CONTRACT
At a meeting held on December 10, 2014, the Board of Trustees, and by a separate vote, the disinterested Trustees, approved the continuance of the Investment Advisory Agreement between The Calvert Fund and the Advisor with respect to the Fund.
In evaluating the Investment Advisory Agreement, the Board considered a variety of information relating to the Fund and the Advisor. The disinterested Trustees reviewed a report prepared by the Advisor regarding various services provided to the Fund by the Advisor and its affiliates. Such report included, among other data, information regarding the Advisor’s personnel and the Advisor’s revenue and cost of providing services to the Fund, and a separate report prepared by an independent third party, which provided a statistical analysis comparing the Fund's investment performance, expenses, and fees to comparable mutual funds.
The disinterested Trustees were separately represented by independent legal counsel with respect to their consideration of the reapproval of the Investment Advisory Agreement. Prior to voting, the disinterested Trustees reviewed the proposed continuance of the Investment Advisory Agreement with management and also met in private sessions with their counsel at which no representatives of management were present.
In the course of its deliberations regarding the Investment Advisory Agreement, the Board considered the following factors, among others: the nature, extent and quality of the services provided by the Advisor, including the personnel providing such services; the Advisor's financial condition; the level and method of computing the Fund's advisory fee; comparative performance, fee and expense information for the Fund; the profitability of the Calvert Family of Funds to the Advisor and its affiliates; the direct and indirect benefits, if any, derived by the Advisor and its affiliates from their relationship with the Fund; the effect of the Fund's growth and size on the Fund's performance and expenses; the affiliated distributor's process for monitoring sales load breakpoints; the Advisor's compliance programs and policies; the Advisor's performance of substantially similar duties for other funds; and any possible conflicts of interest.
In considering the nature, extent and quality of the services provided by the Advisor under the Investment Advisory Agreement, the Board reviewed information provided by the Advisor relating to its operations and personnel, including, among other information, biographical information on the Advisor's investment, supervisory and professional staff and descriptions of its organizational and management structure. The Board also took into account similar information provided periodically throughout the previous year by the Advisor, as well as the Board’s familiarity with management through Board of Trustees’ meetings, discussions and other reports. The Board considered the Advisor’s management style and its performance in employing its investment strategies, as well as its current level of staffing and overall resources. The Board also noted that it reviewed on a quarterly basis information regarding the Advisor’s compliance with applicable policies and procedures, including those related to personal investing. The Advisor's administrative capabilities, including its ability to supervise the other service providers for the Fund, were also considered. The Board also took into account the environmental, social, sustainability and governance research and analysis provided by the Advisor to the Fund. The Board observed that the scope of services provided by the Advisor generally had expanded over time as a result of regulatory, market and other changes. The Board took into consideration, among other factors, the effectiveness of the Fund’s and Advisor’s processes, policies and procedures and the Advisor’s personnel. The Board also took into account, among other items, periodic reports received from the Advisor over the past year concerning the Advisor’s ongoing review and enhancement of certain
42 www.calvert.com CALVERT SHORT DURATION INCOME FUND SEMI-ANNUAL REPORT (UNAUDITED)
processes, policies and procedures of the Fund and the Advisor. The Board concluded that it was satisfied with the nature, extent and quality of services provided to the Fund by the Advisor under the Investment Advisory Agreement.
In considering the Fund’s performance, the Board noted that it reviewed on a quarterly basis detailed information about the Fund’s performance results, portfolio composition and investment strategies. In addition, the Board took into account overall financial market conditions. The Board also reviewed various comparative data provided to it in connection with its consideration of the renewal of the Investment Advisory Agreement, including, among other information, a comparison of the Fund’s total return with its Lipper index and with that of other mutual funds deemed to be in its peer group by an independent third party in its report. This comparison indicated that the Fund performed above the median of its peer group for the one-, three- and five-year periods ended June 30, 2014. The data also indicated that the Fund outperformed its Lipper index for the one-, three- and five-year periods ended June 30, 2014. Based upon its review, the Board concluded that the Fund’s performance was satisfactory relative to the performance of funds with similar investment objectives and to relevant indices.
In considering the Fund’s fees and expenses, the Board compared the Fund’s fees and total expense ratio with various comparative data for the funds in its peer group. Among other findings, the data indicated that the Fund’s advisory fee (after taking into account waivers and/or reimbursements) was below the median of its peer group and that total expenses (net of waivers and/or reimbursements) were above the median of its peer group. The Board noted that the allocation of advisory and administrative fees may vary among the Fund’s peer group. The Board took into account the Advisor’s current undertaking to maintain expense limitations for the Fund and that the Advisor was reimbursing a portion of the Fund’s expenses. The Board also noted management’s discussion of the Fund’s expenses and certain factors that affected the level of such expenses, including the cost of providing the environmental, social, sustainability and governance research and analysis provided by the Advisor. Based upon its review, the Board determined that the advisory fee was reasonable in view of the quality of services received by the Fund from the Advisor and the other factors considered.
The Board reviewed the Advisor’s profitability on a fund-by-fund basis. In reviewing the overall profitability of the advisory fee to the Fund’s Advisor, the Board also considered the fact that affiliates of the Advisor provided shareholder servicing, administrative and distribution services to the Fund for which they received compensation. The information considered by the Board included Calvert’s operating profit margin information both before and after tax expenses with respect to the services that the Advisor and its affiliates provided to the Calvert Family of Funds complex. The Board reviewed the profitability of the Advisor’s relationship with the Fund in terms of the total amount of annual advisory fees it received with respect to the Fund and whether the Advisor had the financial wherewithal to continue to provide services to the Fund. The Board noted that the Advisor was reimbursing a portion of the Fund’s expenses. The Board also noted the Advisor’s current undertaking to maintain expense limitations for the Fund. The Board also considered that the Advisor derived benefits to its reputation and other indirect benefits from its relationship with the Fund. Based upon its review, the Board concluded that the Advisor’s and its affiliates’ level of profitability from their relationship with the Fund was reasonable.
The Board considered the effect of the Fund’s current size and its potential growth on its performance and fees. The Board took into account that the Fund’s advisory fee schedule contained breakpoints that would reduce the advisory fee rate on assets above specified levels as the Fund’s assets increased. The Board noted that the Fund was currently realizing
www.calvert.com CALVERT SHORT DURATION INCOME FUND SEMI-ANNUAL REPORT (UNAUDITED) 43
economies of scale in its advisory fee. The Board also noted that if the Fund’s assets increased over time, the Fund might realize other economies of scale if assets increased proportionally more than certain other expenses.
In reapproving the Investment Advisory Agreement, the Board, including the disinterested Trustees, did not identify any single factor as controlling, and each Trustee may have attributed different weight to various factors.
Conclusions
The Board reached the following conclusions regarding the Investment Advisory Agreement, among others: (a) the Advisor has demonstrated that it possesses the capability and resources to perform the duties required of it under the Investment Advisory Agreement; (b) the Advisor maintains appropriate compliance programs; (c) the performance of the Fund is satisfactory relative to the performance of funds with similar investment objectives and to relevant indices; (d) the Advisor is likely to execute its investment strategies consistently over time; and (e) the Fund's advisory fee is reasonable in view of the quality of services received by the Fund from the Advisor and the other factors considered. Based on its conclusions, the Board determined that reapproval of the Investment Advisory Agreement would be in the best interests of the Fund and its shareholders.
44 www.calvert.com CALVERT SHORT DURATION INCOME FUND SEMI-ANNUAL REPORT (UNAUDITED)
This page intentionally left blank.
This page intentionally left blank.
To Open an Account
800-368-2748
Service for Existing Account
Shareholders: 800-368-2745
Brokers: 800-368-2746
TDD for Hearing Impaired
800-541-1524
Registered Mail
Calvert Investments
c/o BFDS,
P.O. Box 219544
Kansas City, MO 64121-9544
Overnight Mail
Calvert Investments
c/o BFDS,
330 West 9th Street
Kansas City, MO 64105
Web Site
www.calvert.com
Principal Underwriter
Calvert Investment Distributors, Inc.
4550 Montgomery Avenue
Suite 1000 North
Bethesda, Maryland 20814
|
| | | |
CALVERT SHORT DURATION INCOME FUND | CALVERT’S FAMILY OF FUNDS | | |
| | Municipal Funds Tax-Free Bond Fund Taxable Bond Funds Bond Portfolio Income Fund Short Duration Income Fund Long-Term Income Fund Ultra-Short Income Fund High Yield Bond Fund Green Bond Fund Unconstrained Bond Fund Balanced and Asset Allocation Funds Balanced Portfolio Conservative Allocation Fund Moderate Allocation Fund Aggressive Allocation Fund | | Equity Funds Large Cap Core Portfolio Equity Portfolio Large Cap Value Fund Social Index Fund Capital Accumulation Fund International Equity Fund Small Cap Fund Global Energy Solutions Fund Global Water Fund International Opportunities Fund Equity Income Fund Emerging Markets Equity Fund |
| | |
This report is intended to provide fund information to shareholders. It is not authorized for distribution to prospective investors unless preceded or accompanied by a prospectus.
Note: The information on our website is not incorporated by reference into this report; our website address is included as an inactive textual reference only.
Investors should carefully consider the investment objectives, risks, charges and expenses of the Calvert Funds. This and other important information is contained in the fund’s summary prospectus and prospectus, which can be obtained from your financial professional and should be read carefully before investing. You may also call Calvert at 800/368-2748 or visit www. calvert.com.
Printed on recycled paper using soy inks.
|
| | |
| | |
| | | |
| Calvert Long-Term Income Fund | | |
| | | |
| | |
|
| |
Semi-Annual Report March 31, 2015
E-Delivery Sign-Up — Details Inside | |
Choose Planet-friendly E-delivery!
Sign up now for on-line statements, prospectuses, and fund reports. In less than five minutes you can help reduce paper mail and lower fund costs.
Just go to www.calvert.com. If you already have an online account at Calvert, click on Login, to access your Account, and select the documents you would like to receive via e-mail.
If you’re new to online account access, click on Login, then Register to create your user name and password. Once you’re in, click on the E-delivery sign-up on the Account Portfolio page and follow the quick, easy steps.
Note: if your shares are not held directly at Calvert but through a brokerage firm, you must contact your broker for electronic delivery options available through their firm.
|
| | | |
| TABLE OF CONTENTS |
| | | | |
| | | | President's Letter |
| | | | Portfolio Management Discussion |
| | | | Shareholder Advocacy Update |
| | | | Shareholder Expense Example |
| | | | Schedule of Investments |
| | | | Statement of Assets and Liabilities |
| | | | Statement of Operations |
| | | | Statements of Changes in Net Assets |
| | | | Notes to Financial Statements |
| | | | Financial Highlights |
| | | | Explanation of Financial Tables |
| | | | Proxy Voting |
| | | | Availability of Quarterly Portfolio Holdings |
| | | | Basis for Board’s Approval of Investment Advisory Contract |
|
| |
| John Streur President and Chief Executive Officer, Calvert Investments, Inc. |
Dear Calvert Shareowner,
The United States economy improved throughout 2014 and into the first quarter of 2015, while major economies in other regions of the world struggled to regain momentum or saw slowing growth. It is still too early to declare victory, but one may say that while the United States led the world into financial crisis nearly eight years ago, the innovative and aggressive responses to the crisis by our policymakers are allowing the United States to recover more quickly. Granted, the United States has the benefit of possessing the world’s reserve currency and our monetary maneuvers in our self-interest are not without cost to economies in other regions.
As 2014 drew to a close, the United States was winding down the quantitative easing portion of its post-crisis monetary policy while the European and Japanese central banks were finding it necessary to increase their own forms of quantitative easing in efforts to support asset prices and spur economic growth.
The impact of modestly improving economic activity in the U.S. and ongoing low global interest rates on financial assets in 2014 created positive returns for most stocks and bonds for the previous 12 months, a condition that gave benefit to most Calvert Funds. The exceptions are assets tied to the price of oil, which collapsed during the second half of the year. Energy industries and natural resource based companies, including renewable energy companies and water related companies, saw their stock valuations drop in reaction.
Across our fixed income and equity strategies, Calvert finds more utility in conducting fundamental research in order to find relative values in securities of individual companies than we do in attempting to anticipate or time changes in global economic indicators. Broadly, we are mindful of the fact that stocks and bonds have benefitted substantially from the easy monetary policies and ultra-low interest rates of the post-crisis era. We believe markets are more or less fairly valued and we have taken steps seeking to moderate the risk across our portfolios.
As I take the helm at Calvert and look back at the 39 years since the firm’s founding in 1976, I note the substantial growth in the world’s population, the massive increase in the industrialization of our global society, and the associated change in the role of corporations in societal and environmental outcomes for our future.
4 www.calvert.com CALVERT LONG-TERM INCOME FUND SEMI-ANNUAL REPORT (UNAUDITED)
Public companies have created tremendous net benefits to society through advances in health care, food systems, energy efficiency, communications and technology, and access to finance and other products and services too vast to detail. Hundreds of millions of people throughout the world have seen their standard of living increased through benefits created by corporate activity.
Along with the obvious net benefits to society, we are aware of the substantial stresses placed upon society and the environment from corporate behaviors. At the same time, society has awarded corporations an increasingly prominent role in the day-to-day outcomes of our lives and in the societal and environmental outcomes that will determine the future direction of the world.
Calvert, as a global investment management firm and a steward of client assets, has a growing and evolving role as a leader in responsible investing. Calvert has a rich history as a socially responsible investor and has made many contributions to public policy and corporate governance. Today we are bringing Calvert’s deep expertise in socially responsible investing, public and private policy work, and investment management to a new level with a focus on developing principles and setting standards for use in our investment management processes, our active ownership and engagement discipline and within our investment risk management processes.
As a long-term investor with unique insights into environmental, social, and governance activities of companies throughout the world, Calvert is able to develop a holistic view of companies’ operations. Our ability to use our insights for the benefit of the stewardship of client assets, both to produce desirable investment outcomes for our clients and to assist companies in evolving their role in society along a responsible path has never been more important.
As fellow shareowners of Calvert Funds, you and I know that it is essential to pursue the type of enduring value that Calvert seeks to create, through excellence in financial results balanced with the evolving needs of society and the environment.
Thank you for your share ownership in Calvert Funds; all of us at Calvert Investments, Inc. appreciate the confidence and trust you have placed in us.
John Streur
April 2015
www.calvert.com CALVERT LONG-TERM INCOME FUND SEMI-ANNUAL REPORT (UNAUDITED) 5
|
| |
| PORTFOLIO MANAGEMENT DISCUSSION |
|
| |
| Catherine Roy, CFA Senior Vice President and Chief Investment Officer, Fixed Income |
Investment Climate
A very divergent economic picture between the United States and much of the rest of the world prompted central bank actions that affected global currencies and drove financial-market returns over the six-month reporting period. The markets also reacted to new information on key geopolitical situations, notably in the Ukraine.
The economic divergence theme was apparent in Europe, which featured consumer price deflation in many countries. China and Japan also experienced slower growth. In the United States, economic growth pulled back from the strong pace set in mid-2014 to a rate more in line with the Fed’s projected long-run average of 2.2%. While modest, this growth rate was superior to that of many other countries. The U.S. headline Consumer Price Index, which measures inflation excluding volatile food and energy prices, became slightly negative towards the end of the reporting period.
In January, the European Central Bank (ECB) announced a long-awaited quantitative easing program, which had significant market impact. In anticipation of the January ECB decision, some other European central banks, as well as Japan and China, increased monetary accommodation through interest-rate cuts and/or expanded bond purchase programs. In stark contrast, the U.S. Federal Reserve prepared markets for a small and slow series of interest-rate increases, slated to start sometime in 2015. The Fed anticipates that extremely low domestic inflation will be transitory, driven by the drop in energy prices, and is not a problem brought on by lack of consumer demand. In addition, the U.S. labor market is relatively strong, which has long been one condition the Fed required to start a slow removal of monetary accommodation.
Big moves in the world’s major currencies were a byproduct of these central bank actions. In the middle of 2014, the U.S. dollar began a sharp climb against other currencies that drove it to multi-year highs. The Bloomberg DXY, an index that measures the dollar against major currencies, appreciated 14.5% over the six-month reporting period. Tightly correlated to the dollar’s rally was a sharp drop in the price of oil—a market set up for a price collapse due to a massive demand-supply imbalance.
Bonds Provided Positive Returns
The global fixed-income markets generally reacted positively to the ECB-led central bank easing. U.S. bond yields gyrated over the reporting period, but at the end tended to be lower and so bond returns were positive.
6 www.calvert.com CALVERT LONG-TERM INCOME FUND SEMI-ANNUAL REPORT (UNAUDITED)
|
| | | | |
| | | | |
| | CALVERT LONG-TERM INCOME FUND | |
| | MARCH 31, 2015 | |
| | | | |
| | ECONOMIC SECTORS | % OF TOTAL INVESTMENTS | |
| | Corporate | 64.9 | % | |
| | Financial Institutions | 15.1 | % | |
| | Industrial | 48.7 | % | |
| | Utility | 1.1 | % | |
| | Government Related | 1.2 | % | |
| | Local Authority | 1.2 | % | |
| | Municipal | 0.2 | % | |
| | Government Public Service | 0.1 | % | |
| | Utility | 0.1 | % | |
| | Securitized | 3.8 | % | |
| | Asset-Backed Securities | 1.3 | % | |
| | Commercial Mortgage-Backed Securities | 2.5 | % | |
| | Short-Term Investments | 7.8 | % | |
| | Treasury | 22.1 | % | |
| | Total | 100 | % | |
| | | | |
The ten-year T-note yield fell 58 basis points1 (bps) to 1.94%, while the 30-year fixed-rate mortgage average fell 50 bps to 3.69%. The Barclays U.S. Credit Index average yield declined 18 bps to 2.83%.
In terms of total return, the Barclays Long Credit Index rose 7.24%, the broad intermediate Barclays U.S. Credit Index returned 3.96%, and the shorter-term Barclays 1-5 Year U.S. Credit Index was up 1.48%. The Barclays US Aggregate Index returned 3.43% and the Bank of America Merrill Lynch High Yield Master II Index was little changed, up 1.45%.
Outlook
The United States economy is expanding moderately and has weathered global weakness better than other most other major economies. The 5.5% headline unemployment rate is just above the Federal Open Market Commission’s (FOMC) long-term target range.
|
| | | | | | |
| | | | | |
| | CALVERT LONG-TERM INCOME FUND | |
| | MARCH 31, 2015 | |
| | | | | |
| | INVESTMENT PERFORMANCE | |
| | (TOTAL RETURN AT NAV*) | |
| | | 6 MONTHS ENDED 3/31/15 | 12 MONTHS ENDED 3/31/15
| |
| | Class A | 7.73 | % | 12.25 | % | |
| | Class I** | 7.88 | % | 12.16 | % | |
| | | | | |
| | Barclays Long U.S. Credit Index | 7.24 | % | 12.84 | % | |
| | | | | |
| | Lipper BBB-Rated Corporate Debt Funds Average | 3.78 | % | 6.75 | % | |
| | | | | |
| | | 30 DAYS ENDED | |
| | SEC YIELD | 3/31/15 | 9/30/14 | |
| | Class A | 2.17 | % | 2.68 | % | |
| | Class I | 0.75 | % | — |
| |
| | | |
| | * Investment performance/return at NAV does not reflect the deduction of the Fund’s maximum 3.75% front-end sales charge or any deferred sales charge.** Calvert Long-Term Income Fund first offered Class I shares on January 30, 2015. Performance prior to that date reflects the performance of Class A shares at net asset value (NAV). Actual Class I share performance would have been different. | |
| | | | | |
Wage growth is modest but steady. The labor-force participation rate, however, remains low—influenced by demographics and the long-term loss of traditional middle-wage jobs to overseas competition and automation. Workers in general, however, are in improved bargaining positions. The Fed’s benchmark consumer inflation rate hovers around zero, sharply below the 2% target.
Despite another cold winter, U.S. economic growth in 2015 could approach 3% in the absence of a material systemic shock. We expect inflation to continue well below the Fed’s 2% target. Improvement in the labor market should continue, with unemployment
www.calvert.com CALVERT LONG-TERM INCOME FUND SEMI-ANNUAL REPORT (UNAUDITED) 7
below 5.5%. Discord on Capitol Hill promises to add some uncertainty to late-summer debt-ceiling negotiations. Household consumption remains the major engine of growth and should be supported by lower energy prices. Lower energy prices, however, are likely to depress earnings and investment from energy-industry companies and the much-stronger dollar may dampen overall U.S. corporate earnings. Housing-sector activity remains a disappointment, despite very low mortgage rates, and residential mortgage lending remains relatively restrained in the post-crisis market. The U.S. trade situation may deteriorate given continued strength of the dollar, which could drive up import costs.
If U.S. data trends hold, within the context of the global backdrop of disinflation and central bank easing, we expect the Fed to raise short-term interest rates by late 2015. If lift-off is in 2015, however, we expect no more than two quarter-point increases over the balance of the year. If the weaker global picture and price disinflation persist, there is a reasonable chance the Fed will delay any rate increases into 2016.
Over the longer term, we expect the benchmark 10-year T-note yield to fluctuate between 2% and 3%, influenced by the trend in economic data surprises, major central bank forward guidance, expected low global inflation rates, and flows in global fixed-income markets. We expect short-term money markets rates to remain close to zero percent for much of 2015.
Calvert Investment Management, Inc.
April 2015
1. A basis point is 0.01 percentage points.
|
| | | | |
| | | | |
| | CALVERT LONG-TERM INCOME FUND | |
| | MARCH 31, 2015 | |
| | | | |
| | AVERAGE ANNUAL TOTAL RETURNS | |
| | | | |
| | CLASS A SHARES | (WITH MAX. LOAD) | |
| | One year | 8.06 | % | |
| | Five year | 7.25 | % | |
| | Since inception (12/31/2004) | 7.92 | % | |
| | | | |
| | CLASS I SHARES* | | |
| | One year | 12.16 | % | |
| | Five year | 8.05 | % | |
| | Since inception (1/30/2015) | 8.33 | % | |
| | | | |
* Calvert Long-Term Income Fund first offered Class I shares on January 30, 2015. Performance prior to that date reflects the performance of Class A shares at net asset value (NAV). Actual Class I share performance would have been different |
| | | | |
8 www.calvert.com CALVERT LONG-TERM INCOME FUND SEMI-ANNUAL REPORT (UNAUDITED)
Growth of $10,000
The graph below shows the value of a hypothetical $10,000 investment in the Fund over the past 10 fiscal year periods or since inception (for funds without 10-year records). The results shown are for Class A shares and reflect the deduction of the maximum front-end Class A sales charge of 3.75%, and assume the reinvestment of dividends. The result is compared with benchmarks that include a broad based market index and a Lipper peer group average. Market indexes are unmanaged and their results do not reflect the effect of expenses or sales charges. The Lipper average reflects the deduction of the category’s average front-end sales charge. The value of an investment in a different share class would be different.
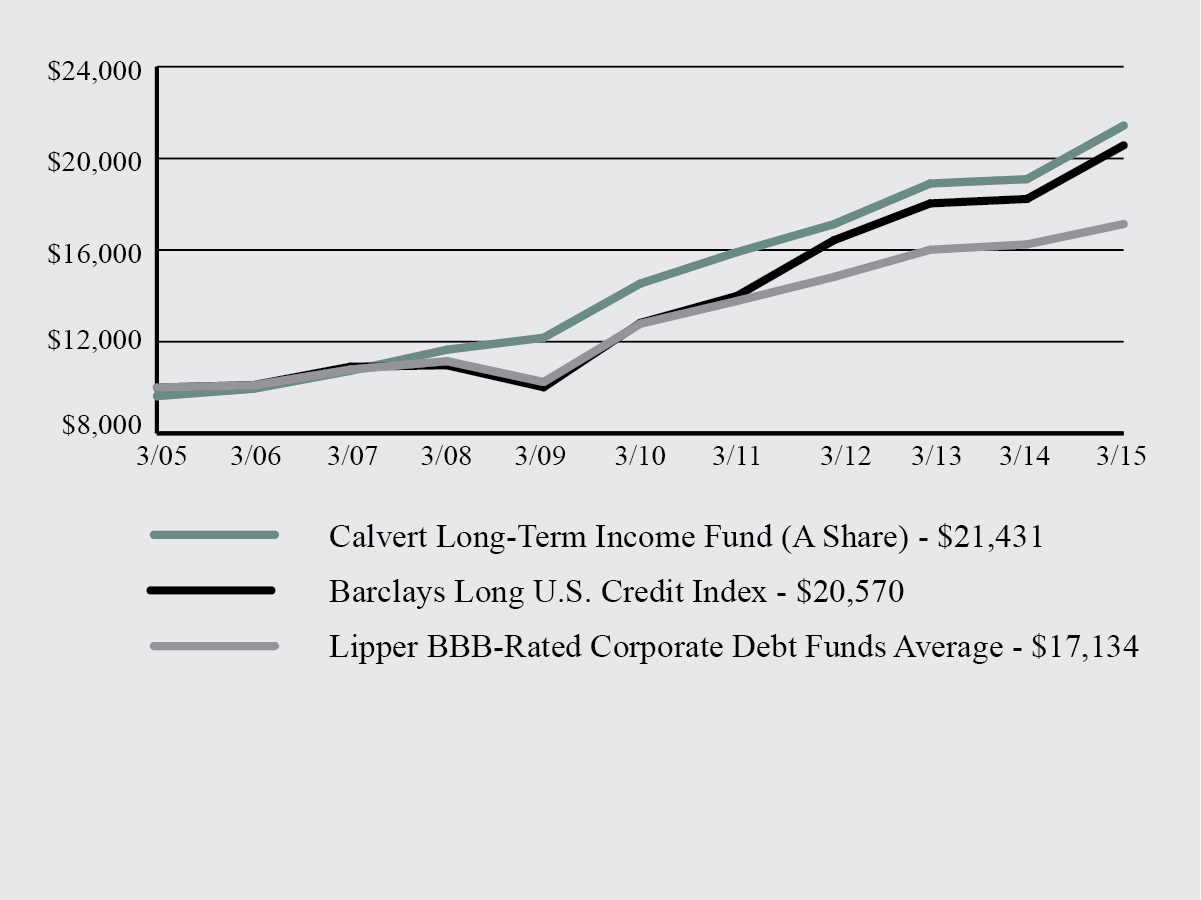
All performance data shown, including the graph above and the adjacent table, represents past performance, does not guarantee future results, assumes reinvestment of dividends and distributions and does not reflect the deduction of taxes that a shareholder would pay on the Fund’s distributions or the redemption of the Fund shares. All performance data reflects fee waivers and/or expense limitations, if any are in effect; in their absence performance would be lower. See Note B in Notes to Financial Statements. The investment return and principal value of an investment will fluctuate so that an investor’s shares, when redeemed, may be worth more or less than their original cost. Current performance may be lower or higher than the performance data quoted; for current performance data visit www.calvert.com. The gross expense ratio from the current prospectus for Class A shares is 1.27%. This number may differ from the expense ratio shown elsewhere in this report because it is based on a different time period and, if applicable, does not include fee or expense waivers. Performance data quoted already reflects the deduction of the Fund’s operating expenses.
www.calvert.com CALVERT LONG-TERM INCOME FUND SEMI-ANNUAL REPORT (UNAUDITED) 9
SHAREHOLDER ADVOCACY UPDATE
2014 Corporate Diversity Report Findings Released
In March, Calvert published its 2014 survey findings on the corporate diversity practices of the largely multinational companies that make up the Standard & Poor’s 100 Index (S&P 100), in follow-up to reports published in 2012 and 2010. Calvert believes companies that fully commit to providing a fair and equitable working environment will recognize gains in both the workplace and marketplace.
Key findings from the 2014 survey include:
| |
| • | Milestone for women in the board room. In 2014, every company in the S&P 100 had at least one woman on its board of directors. In addition, there was a 17% increase in companies with three or more women and/or minorities on their boards. |
| |
| • | Diversity commitment on the rise. In the past two years, top scores related to overall corporate commitment have increased by 45%.This stems primarily from greater board oversight of diversity initiatives and increased CEO and/or chair involvement. |
| |
| • | LGBT policies have advanced overall. However, initiatives for persons with disabilities continue to fall behind other groups. |
Overall, in 2014, we saw growing commitment to women and minority employees, momentum around family-friendly work environments, and accelerated progress in support of LGBT employees. Looking ahead, we hope to see enhanced corporate diversity commitments, greater representation of women and minorities on boards, improved EEO1-disclosure, and expanded diversity initiatives for persons with disabilities.
To learn the highest- and lowest-rated companies in the report, A Survey of Corporate Diversity Practices of the S&P 100, and to find out more about the report’s methodology and findings, visit www.calvert.com.
2015 Shareholder Resolutions
Building on our initiatives from 2014, Calvert was the lead filer on 38 shareholder resolutions for the 2015 proxy season, and co-filer on another 18 proposals. Key topics include “big data” and civil rights issues, sustainability reporting, board of director oversight of environmental and social matters, water risk, climate change and greenhouse gas emissions reductions, supply chain labor issues, and board diversity.
Specifically, Calvert asked 14 companies to set a goal and a timeline for reducing their greenhouse gas emissions and filed seven proposals asking companies to issue a sustainability report describing their environmental, social and governance (ESG) performance and goals. To push for improved boardroom diversity, Calvert filed six proposals with companies requesting they report on their plans to increase minority and women Board representation and assess the effectiveness of these efforts. We also filed seven proposals requesting that companies assess and manage the civil rights’ risks related to their use of big data, which refers to data sets so large or complex that traditional data processing applications are inadequate. We also filed proposals on water risk in the agricultural supply chain and on developing a sustainable agriculture policy.
To keep abreast of the outcomes of these 2015 shareholder resolutions, as well as Calvert’s proxy voting and public policy initiatives, visit the “Resources” section on www.calvert.com.
10 www.calvert.com CALVERT LONG-TERM INCOME FUND SEMI-ANNUAL REPORT (UNAUDITED)
SHAREHOLDER EXPENSE EXAMPLE
As a shareholder of the Fund, you incur two types of costs: (1) transaction costs, including sales charges (loads) and redemption fees; and (2) ongoing costs, including management fees; distribution (12b-1) fees; and other Fund expenses. This Example is intended to help you understand your ongoing costs (in dollars) of investing in the Fund and to compare these costs with the ongoing costs of investing in other mutual funds.
This Example is based on an investment of $1,000 invested at the beginning of the period and held for the entire period (October 1, 2014 to March 31, 2015).
Actual Expenses
The first line of the table below provides information about actual account values and actual expenses. You may use the information in this line, together with the amount you invested, to estimate the expenses that you paid over the period. Simply divide your account value by $1,000 (for example, an $8,600 account value divided by $1,000 = 8.6), then multiply the result by the number in the first line under the heading entitled "Expenses Paid During Period" to estimate the expenses you paid on your account during this period.
Hypothetical Example for Comparison Purposes
The second line of the table below provides information about hypothetical account values and hypothetical expenses based on the Fund’s actual expense ratio and an assumed rate of return of 5% per year before expenses, which is not the Fund’s actual return. The hypothetical account values and expenses may not be used to estimate the actual ending account balance or expenses you paid for the period. You may use this information to compare the ongoing costs of investing in the Fund and other funds. To do so, compare the 5% hypothetical example with the 5% hypothetical examples that appear in the shareholder reports of the other funds.
Please note that the expenses shown in the table are meant to highlight your ongoing costs only and do not reflect any transactional costs, such as sales charges (loads), or redemption fees. Therefore, the second line of the table is useful in comparing ongoing costs only, and will not help you determine the relative total costs of owning different funds. In addition, if these transactional costs were included, your costs would have been higher.
|
| | | |
| | BEGINNING ACCOUNT VALUE 10/1/14 | ENDING ACCOUNT VALUE 3/31/15 | EXPENSES PAID DURING PERIOD* 10/1/14 - 3/31/15 |
CLASS A | | | |
| Actual | $1,000.00 | $1,077.26 | $6.47 |
| Hypothetical | $1,000.00 | $1,018.70 | $6.29 |
| (5% return per year before expenses) | | | |
| | | | |
CLASS I | | | |
| Actual | $1,000.00 | $1,076.40 | $2.85 |
| Hypothetical | $1,000.00 | $1,022.19 | $2.78 |
| (5% return per year before expenses) | | | |
| | | | |
* Expenses are equal to the Fund’s annualized expense ratio of 1.25% and 0.55% for Class A and Class I, respectively, multiplied by the average account value over the period, multiplied by 182/365 (to reflect the one-half year period).
|
www.calvert.com CALVERT LONG-TERM INCOME FUND SEMI-ANNUAL REPORT (UNAUDITED) 11
SCHEDULE OF INVESTMENTS
MARCH 31, 2015
|
| | | | | | |
ASSET-BACKED SECURITIES - 3.6% | PRINCIPAL AMOUNT | VALUE |
| | | |
| ALM XII Ltd., 3.449%, 4/16/27 (e)(r) |
| $300,000 |
|
| $296,790 |
|
| American Homes 4 Rent: | | |
| 3.786%, 10/17/36 (e) | 446,935 |
| 465,409 |
| 4.705%, 10/17/36 (e) | 401,000 |
| 427,798 |
| 4.596%, 12/17/36 (e) | 300,000 |
| 317,456 |
| Colony American Homes, 2.027%, 5/17/31 (e)(r) | 400,000 |
| 398,790 |
| JGWPT XXXII LLC, 4.48%, 1/15/75 (e) | 150,000 |
| 153,543 |
| Navient Student Loan Trust, 1.714%, 7/25/52 (r) | 400,000 |
| 370,907 |
| SBA Tower Trust, 3.869%, 10/15/49 (e) | 500,000 |
| 520,416 |
| VOLT XIX LLC, 3.875%, 4/25/55 (e)(r) | 413,481 |
| 415,038 |
| | | |
| Total Asset-Backed Securities (Cost $3,283,292) | | 3,366,147 |
| | | |
COMMERCIAL MORTGAGE-BACKED SECURITIES - 0.9% | | |
| CSMC Trust, 4.185%, 9/15/37 (e) | 200,000 |
| 215,690 |
JP Morgan Chase Commercial Mortgage Securities Trust, 4.159%, 12/15/47 (r) | 300,000 |
| 290,936 |
| WFRBS Commercial Mortgage Trust: | | |
| 3.497%, 8/15/47 (e) | 100,000 |
| 86,543 |
| 4.234%, 8/15/47 (r) | 200,000 |
| 206,833 |
| | | |
| Total Commercial Mortgage-Backed Securities (Cost $777,918) | | 800,002 |
| | | |
CORPORATE BONDS - 67.4% | | |
| 21st Century Fox America, Inc., 5.40%, 10/1/43 | 500,000 |
| 608,801 |
| Actavis Funding SCS: | | |
| 3.80%, 3/15/25 | 100,000 |
| 103,203 |
| 4.75%, 3/15/45 | 600,000 |
| 637,714 |
AerCap Ireland Capital Ltd. / AerCap Global Aviation Trust, 2.75%, 5/15/17 (e) | 500,000 |
| 495,000 |
| Aetna, Inc., 4.50%, 5/15/42 | 500,000 |
| 554,831 |
| Alliance Mortgage Investments, Inc., 12.61%, 6/1/10 (b)(r)(x)* | 4,817 |
| 0 |
| Ally Financial, Inc., 4.625%, 6/26/15 | 500,000 |
| 502,500 |
| America Movil SAB de CV, 4.375%, 7/16/42 | 500,000 |
| 499,930 |
| American Airlines Group, Inc., 4.625%, 3/1/20 (e) | 200,000 |
| 195,875 |
| American Airlines Pass Through Trust: | | |
| 5.60%, 1/15/22 (e) | 270,121 |
| 284,627 |
| 3.375%, 11/1/28 | 200,000 |
| 200,760 |
| American International Group, Inc., 4.50%, 7/16/44 | 400,000 |
| 429,367 |
| American Tower Corp., 4.70%, 3/15/22 | 500,000 |
| 536,230 |
| Amgen, Inc., 5.15%, 11/15/41 | 500,000 |
| 575,880 |
| Anadarko Petroleum Corp., 4.50%, 7/15/44 | 500,000 |
| 511,522 |
| Anheuser-Busch InBev Worldwide, Inc., 3.75%, 7/15/42 | 750,000 |
| 731,385 |
| Apache Corp., 4.75%, 4/15/43 | 300,000 |
| 313,547 |
| Apple, Inc., 3.45%, 2/9/45 | 450,000 |
| 427,158 |
| AT&T, Inc., 4.35%, 6/15/45 | 1,300,000 |
| 1,243,423 |
12 www.calvert.com CALVERT LONG-TERM INCOME FUND SEMI-ANNUAL REPORT (UNAUDITED)
|
| | | | | | |
CORPORATE BONDS - CONT'D | PRINCIPAL AMOUNT | VALUE |
| | | |
| Bank of America Corp.: | | |
| 4.125%, 1/22/24 |
| $460,000 |
|
| $492,585 |
|
| 4.20%, 8/26/24 | 250,000 |
| 258,642 |
| 4.00%, 1/22/25 | 250,000 |
| 252,023 |
| 4.25%, 10/22/26 | 600,000 |
| 619,405 |
| Bed Bath & Beyond, Inc., 5.165%, 8/1/44 | 500,000 |
| 551,352 |
| Berkshire Hathaway Finance Corp., 4.40%, 5/15/42 | 1,000,000 |
| 1,101,249 |
BNSF Funding Trust I, 6.613% to 1/15/26, floating rate thereafter to 12/15/55 (r) | 1,000,000 |
| 1,127,500 |
| Celanese US Holdings LLC, 5.875%, 6/15/21 | 100,000 |
| 108,000 |
| Cemex SAB de CV: | | |
| 5.273%, 9/30/15 (e)(r) | 1,000,000 |
| 1,004,900 |
| 6.50%, 12/10/19 (e) | 250,000 |
| 265,625 |
| CenturyLink, Inc., 7.65%, 3/15/42 | 400,000 |
| 409,000 |
| CIT Group, Inc., 5.00%, 5/15/17 | 500,000 |
| 514,220 |
| Citigroup, Inc., 3.875%, 3/26/25 | 1,300,000 |
| 1,304,883 |
| CNH Industrial Capital LLC, 3.875%, 11/1/15 | 500,000 |
| 503,750 |
| ConAgra Foods, Inc., 4.65%, 1/25/43 | 400,000 |
| 401,310 |
| ConocoPhillips Co., 4.30%, 11/15/44 | 250,000 |
| 265,347 |
| Continental Airlines Pass Through Trust, 6.25%, 10/11/21 | 169,594 |
| 180,618 |
| Crown Castle Towers LLC, 4.883%, 8/15/40 (e) | 900,000 |
| 988,213 |
| Cummins, Inc., 4.875%, 10/1/43 | 300,000 |
| 355,947 |
| CVS Health Corp., 5.30%, 12/5/43 | 250,000 |
| 305,411 |
| CVS Pass-Through Trust, 6.036%, 12/10/28 | 283,052 |
| 334,596 |
| Deutsche Telekom International Finance BV, 4.875%, 3/6/42 (e) | 400,000 |
| 451,059 |
DIRECTV Holdings LLC / DIRECTV Financing Co., Inc., 5.15%, 3/15/42 | 650,000 |
| 679,297 |
| Discover Bank, 7.00%, 4/15/20 | 500,000 |
| 593,563 |
| Dow Chemical Co., 4.625%, 10/1/44 | 300,000 |
| 313,600 |
| Dr Pepper Snapple Group, Inc., 3.20%, 11/15/21 | 1,000,000 |
| 1,039,981 |
| Duke Energy Progress, Inc., 4.10%, 5/15/42 | 500,000 |
| 544,094 |
| Eaton Corp., 4.15%, 11/2/42 | 500,000 |
| 515,130 |
| Enterprise Products Operating LLC: | | |
| 4.85%, 8/15/42 | 500,000 |
| 534,538 |
| 4.85%, 3/15/44 | 500,000 |
| 538,988 |
| 7.034% to 1/15/18, floating rate thereafter to 1/15/68 (r) | 200,000 |
| 216,225 |
| Ford Motor Co., 4.75%, 1/15/43 | 200,000 |
| 218,675 |
| Ford Motor Credit Co. LLC, 3.219%, 1/9/22 | 300,000 |
| 306,319 |
General Electric Capital Corp. / LJ VP Holdings LLC, 3.80%, 6/18/19 (e) | 600,000 |
| 642,162 |
| General Electric Co.: | | |
| 3.375%, 3/11/24 | 1,000,000 |
| 1,057,778 |
| 4.50%, 3/11/44 | 1,000,000 |
| 1,122,507 |
| General Motors Co., 5.20%, 4/1/45 | 250,000 |
| 271,334 |
| General Motors Financial Co., Inc., 4.00%, 1/15/25 | 200,000 |
| 203,983 |
| Genworth Holdings, Inc., 4.80%, 2/15/24 | 350,000 |
| 294,438 |
| Goldman Sachs Group, Inc., 3.50%, 1/23/25 | 1,325,000 |
| 1,348,259 |
| Heineken NV, 4.00%, 10/1/42 (e) | 1,000,000 |
| 992,023 |
| Hewlett-Packard Co., 0.93%, 8/3/15 (e) | 1,000,000 |
| 999,017 |
| Home Depot, Inc., 4.40%, 3/15/45 | 400,000 |
| 446,614 |
| Host Hotels & Resorts LP, 3.75%, 10/15/23 | 200,000 |
| 202,719 |
www.calvert.com CALVERT LONG-TERM INCOME FUND SEMI-ANNUAL REPORT (UNAUDITED) 13
|
| | | | | | |
CORPORATE BONDS - CONT'D | PRINCIPAL AMOUNT | VALUE |
| | | |
| Illinois Tool Works, Inc., 3.90%, 9/1/42 |
| $500,000 |
| $515,348 |
Innovation Ventures LLC / Innovation Ventures Finance Corp., 9.50%, 8/15/19 (e) | 250,000 |
| 252,500 |
| Intel Corp., 4.80%, 10/1/41 | 250,000 |
| 281,676 |
| Jabil Circuit, Inc., 7.75%, 7/15/16 | 500,000 |
| 536,250 |
| JPMorgan Chase & Co.: | | |
| 3.625%, 5/13/24 | 400,000 |
| 415,916 |
| 3.875%, 9/10/24 | 900,000 |
| 923,301 |
| 3.125%, 1/23/25 | 300,000 |
| 300,880 |
| Kinder Morgan Energy Partners LP, 5.40%, 9/1/44 | 300,000 |
| 310,814 |
| Kinder Morgan, Inc.: | | |
| 5.55%, 6/1/45 | 500,000 |
| 527,182 |
| 5.05%, 2/15/46 | 480,000 |
| 479,361 |
| Kroger Co., 5.15%, 8/1/43 | 100,000 |
| 118,096 |
| Laboratory Corporation of America Holdings: | | |
| 3.60%, 2/1/25 | 100,000 |
| 100,408 |
| 4.70%, 2/1/45 | 100,000 |
| 102,930 |
| Land O'Lakes Capital Trust I, 7.45%, 3/15/28 (e) | 750,000 |
| 810,000 |
| Leucadia National Corp., 6.625%, 10/23/43 | 325,000 |
| 324,847 |
| Liberty Mutual Group, Inc., 4.25%, 6/15/23 (e) | 750,000 |
| 798,850 |
LL & P Wind Energy, Inc. Washington Revenue Bonds, 6.192%, 12/1/27 (e) | 100,000 |
| 102,079 |
| Lowe's Co.'s, Inc., 4.65%, 4/15/42 | 250,000 |
| 286,532 |
| LYB International Finance BV, 5.25%, 7/15/43 | 250,000 |
| 278,591 |
| Macy's Retail Holdings, Inc., 5.125%, 1/15/42 | 750,000 |
| 840,647 |
| Masco Corp., 4.45%, 4/1/25 | 150,000 |
| 154,875 |
| Massachusetts Institute of Technology, 3.959%, 7/1/38 | 250,000 |
| 268,708 |
| Medtronic, Inc., 4.625%, 3/15/45 (e) | 250,000 |
| 283,368 |
| Merck & Co., Inc., 3.70%, 2/10/45 | 400,000 |
| 401,892 |
| Methanex Corp., 5.65%, 12/1/44 | 250,000 |
| 262,574 |
| MetLife, Inc.: | | |
| 4.875%, 11/13/43 | 500,000 |
| 577,091 |
| 4.05%, 3/1/45 | 100,000 |
| 103,562 |
| Microsoft Corp., 2.70%, 2/12/25 | 200,000 |
| 200,771 |
| Morgan Stanley, 5.00%, 11/24/25 | 1,100,000 |
| 1,215,119 |
| National Oilwell Varco, Inc., 3.95%, 12/1/42 | 500,000 |
| 473,508 |
| NBC Universal Media LLC, 4.45%, 1/15/43 | 1,000,000 |
| 1,085,888 |
| NII Capital Corp., 7.625%, 4/1/21 (p)* | 1,000,000 |
| 305,000 |
| Northrop Grumman Corp., 3.85%, 4/15/45 | 200,000 |
| 196,877 |
| Oracle Corp.: | | |
| 4.30%, 7/8/34 | 200,000 |
| 217,013 |
| 4.50%, 7/8/44 | 200,000 |
| 222,912 |
| PacifiCorp, 4.10%, 2/1/42 | 400,000 |
| 431,440 |
| Pernod Ricard SA, 5.50%, 1/15/42 (e) | 500,000 |
| 604,938 |
| Perrigo Co. plc, 5.30%, 11/15/43 | 500,000 |
| 566,397 |
| Prudential Financial, Inc., 4.60%, 5/15/44 | 200,000 |
| 212,052 |
| Rogers Communications, Inc., 5.00%, 3/15/44 | 250,000 |
| 275,567 |
| SABMiller Holdings, Inc.: | | |
| 3.75%, 1/15/22 (e) | 780,000 |
| 820,528 |
| 4.95%, 1/15/42 (e) | 250,000 |
| 280,896 |
| SBA Communications Corp., 4.875%, 7/15/22 (e) | 400,000 |
| 391,824 |
14 www.calvert.com CALVERT LONG-TERM INCOME FUND SEMI-ANNUAL REPORT (UNAUDITED)
|
| | | | | | |
CORPORATE BONDS - CONT'D | PRINCIPAL AMOUNT | VALUE |
| | | |
| Shell International Finance BV, 4.55%, 8/12/43 |
| $300,000 |
| $340,054 |
| Spencer Spirit Holdings, Inc., 9.00%, 5/1/18 (e) | 205,000 |
| 207,819 |
| Sprint Corp., 7.25%, 9/15/21 | 200,000 |
| 201,000 |
| Sysco Corp., 4.50%, 10/2/44 | 500,000 |
| 533,002 |
| Target Corp., 4.00%, 7/1/42 | 250,000 |
| 264,862 |
| TerraForm Power Operating LLC, 5.875%, 2/1/23 (e) | 150,000 |
| 155,625 |
| Time Warner Cable, Inc., 5.50%, 9/1/41 | 800,000 |
| 918,994 |
| Time Warner, Inc.: | | |
| 5.375%, 10/15/41 | 250,000 |
| 292,789 |
| 4.90%, 6/15/42 | 500,000 |
| 554,799 |
| TransContinental Gas Pipe Line Co. LLC, 4.45%, 8/1/42 | 200,000 |
| 182,631 |
| United Airlines Pass Through Trust, 4.75%, 10/11/23 | 300,000 |
| 304,140 |
| United Technologies Corp., 4.50%, 6/1/42 | 500,000 |
| 554,569 |
| Verizon Communications, Inc.: | | |
| 3.50%, 11/1/24 | 150,000 |
| 153,505 |
| 4.862%, 8/21/46 | 1,245,000 |
| 1,303,434 |
| 4.522%, 9/15/48 (e) | 1,000,000 |
| 995,466 |
| Viacom, Inc.: | | |
| 4.50%, 2/27/42 | 500,000 |
| 476,125 |
| 5.25%, 4/1/44 | 250,000 |
| 268,247 |
| Virgin Australia Trust, 6.00%, 4/23/22 (e) | 329,453 |
| 340,983 |
| Vodafone Group plc, 4.375%, 2/19/43 | 100,000 |
| 98,360 |
| Wachovia Capital Trust III, 5.57%, 3/29/49 (r) | 300,000 |
| 296,220 |
| Walgreens Boots Alliance, Inc., 4.80%, 11/18/44 | 400,000 |
| 431,738 |
| Wal-Mart Stores, Inc., 4.00%, 4/11/43 | 1,200,000 |
| 1,272,887 |
| Williams Co.'s, Inc., 5.75%, 6/24/44 | 1,000,000 |
| 934,619 |
| Williams Partners LP / ACMP Finance Corp.: | | |
| 6.125%, 7/15/22 | 400,000 |
| 423,800 |
| 4.875%, 3/15/24 | 200,000 |
| 201,000 |
| | | |
| Total Corporate Bonds (Cost $60,561,918) | | 63,294,308 |
| | | |
MUNICIPAL OBLIGATIONS - 1.4% | | |
Connecticut Special Tax Obligation Revenue Bonds, 5.459%, 11/1/30 | 1,000,000 |
| 1,202,160 |
| Oakland California PO Revenue Bonds, Zero Coupon, 12/15/20 | 120,000 |
| 100,984 |
| | | |
| Total Municipal Obligations (Cost $1,086,000) | | 1,303,144 |
| | | |
U.S. TREASURY OBLIGATIONS - 22.7% | | |
| United States Treasury Bonds, 3.00%, 11/15/44 | 12,795,000 |
| 14,019,520 |
| United States Treasury Notes, 2.00%, 2/15/25 | 7,245,000 |
| 7,290,846 |
| | | |
| Total U.S. Treasury Obligations (Cost $20,954,261) | | 21,310,366 |
| | | |
| |
www.calvert.com CALVERT LONG-TERM INCOME FUND SEMI-ANNUAL REPORT (UNAUDITED) 15
|
| | | | | | |
TIME DEPOSIT - 6.9% | PRINCIPAL AMOUNT | VALUE |
| State Street Bank Time Deposit, 0.088%, 4/1/15 |
| $6,517,379 |
| $6,517,379 |
| | | |
| Total Time Deposit (Cost $6,517,379) | | 6,517,379 |
| | | |
| | | |
| TOTAL INVESTMENTS (Cost $93,180,768) - 102.9% | | 96,591,346 |
| Other assets and liabilities, net - (2.9%) | | (2,717,839) |
NET ASSETS - 100% | | $93,873,507 |
| | | |
| |
|
| | | | | | | | |
FUTURES | NUMBER OF CONTRACTS | EXPIRATION DATE | UNDERLYING FACE AMOUNT AT VALUE | UNREALIZED APPRECIATION (DEPRECIATION) |
| Purchased: | | | | |
| Ultra U.S. Treasury Bonds | 60 | 6/15 |
| $10,192,500 |
|
| $87,204 |
|
| | | | | |
| Sold: | | | | |
| 10 Year U.S. Treasury Notes | 119 | 6/15 |
| $15,339,844 |
|
| ($159,088 | ) |
(b) This security was valued under the direction of the Board of Trustees. See Note A. (e) Security is exempt from registration under Rule 144A of the Securities Act of 1933. These securities may be resold in transactions exempt from registration, normally to qualified institutional buyers. (p) Security is in default and is no longer accruing interest. (r) The coupon rate shown on floating or adjustable rate securities represents the rate at period end. (x) Alliance Bancorp and its affiliates filed for Chapter 7 bankruptcy on July 13, 2007. This security is no longer accruing interest. * Non-income producing security. Abbreviations: LLC: Limited Liability Corporation LP: Limited Partnership plc: Public Limited Company PO: Pension Obligation See notes to financial statements. |
16 www.calvert.com CALVERT LONG-TERM INCOME FUND SEMI-ANNUAL REPORT (UNAUDITED)
STATEMENT OF ASSETS AND LIABILITIES
MARCH 31, 2015
|
| | | |
ASSETS | |
| Investments in securities, at value (Cost $93,180,768, respectively) - see accompanying schedules | $96,591,346 |
|
| Collateral at broker (cash) | 270,813 |
|
| Receivable for securities sold | 4,232,248 |
|
| Receivable for shares sold | 318,815 |
|
| Interest and dividends receivable | 830,483 |
|
| Other assets | 10,404 |
|
| Total Assets | 102,254,109 |
|
| | |
LIABILITIES | |
| Payable for securities purchased | 8,213,759 |
|
| Payable for shares redeemed | 42,048 |
|
| Payable for futures margin | 15,495 |
|
| Payable to Calvert Investment Management, Inc. | 31,725 |
|
| Payable to Calvert Investment Administrative Services, Inc. | 21,589 |
|
| Payable to Calvert Investment Services, Inc. | 1,472 |
|
| Payable to Calvert Distributors, Inc. | 19,626 |
|
| Accrued expenses and other liabilities | 34,888 |
|
| Total Liabilities | 8,380,602 |
|
| | |
NET ASSETS | $93,873,507 |
|
| | |
NET ASSETS CONSIST OF: | |
| Paid-in capital applicable to the following shares of beneficial interest, unlimited number of no par value shares authorized: | |
| Class A: 5,243,199 shares outstanding |
| $88,668,950 |
|
| Class I: 109 shares outstanding | 2,007 |
|
| Undistributed net investment income | 7,767 |
|
| Accumulated net realized gain (loss) | 1,856,089 |
|
| Net unrealized appreciation (depreciation) | 3,338,694 |
|
| | |
NET ASSETS |
| $93,873,507 |
|
| | |
|
NET ASSET VALUE PER SHARE | |
| Class A (based on net assets of $93,871,546) | $17.90 |
| Class I (based on net assets of $1,961) | $17.94 |
| | |
| See notes to financial statements. |
www.calvert.com CALVERT LONG-TERM INCOME FUND SEMI-ANNUAL REPORT (UNAUDITED) 17
STATEMENT OF OPERATIONS
SIX MONTHS ENDED MARCH 31, 2015
|
| | | |
NET INVESTMENT INCOME | |
| Investment Income: | |
| Interest income |
| $1,709,082 |
|
| Total investment income | 1,709,082 |
|
| | |
| Expenses: | |
| Investment advisory fee | 171,062 |
|
| Administrative fees | 117,605 |
|
| Transfer agency fees | 108,369 |
|
| Distribution Plan expenses: | |
| Class A | 106,913 |
|
| Trustees' fees and expenses | 6,475 |
|
| Custodian fees | 14,745 |
|
| Accounting fees | 6,472 |
|
| Registration fees | 9,263 |
|
| Reports to shareholders | 6,445 |
|
| Professional fees | 14,269 |
|
| Miscellaneous | 4,044 |
|
| Total expenses | 565,662 |
|
| Reimbursement from Advisor: | |
| Class A | (29,198 | ) |
| Class I | (1,898 | ) |
| Net expenses | 534,566 |
|
| | |
NET INVESTMENT INCOME | 1,174,516 |
|
| | |
REALIZED AND UNREALIZED GAIN (LOSS) | |
| Net realized gain (loss) on: | |
| Investments | 1,311,928 |
|
| Futures | 742,455 |
|
| | 2,054,383 |
|
| Change in unrealized appreciation (depreciation) on: | |
| Investments | 2,795,482 |
|
| Futures | (66,337 | ) |
| | 2,729,145 |
|
| | |
NET REALIZED AND UNREALIZED GAIN (LOSS) | 4,783,528 |
|
| | |
INCREASE (DECREASE) IN NET ASSETS RESULTING FROM OPERATIONS |
| $5,958,044 |
|
| | |
| See notes to financial statements. |
18 www.calvert.com CALVERT LONG-TERM INCOME FUND SEMI-ANNUAL REPORT (UNAUDITED)
STATEMENTS OF CHANGES IN NET ASSETS
|
| | | | | | | |
INCREASE (DECREASE) IN NET ASSETS | SIX MONTHS ENDED MARCH 31, 2015 | | YEAR ENDED SEPTEMBER 30, 2014 |
| Operations: | | | |
| Net investment income |
| $1,174,516 |
| |
| $2,816,455 |
|
| Net realized gain (loss) | 2,054,383 |
| | 2,744,288 |
|
| Change in unrealized appreciation (depreciation) | 2,729,145 |
| | 3,336,984 |
|
| | | | |
INCREASE (DECREASE) IN NET ASSETS RESULTING FROM OPERATIONS | 5,958,044 |
| | 8,897,727 |
|
| | | | |
| Distributions to shareholders from: | | | |
| Net investment income: | | | |
| Class A shares | (1,172,432 | ) | | (2,817,761 | ) |
| Class I shares | (7 | ) | | — |
|
| Net realized gain: | | | |
| Class A shares | (1,730,237 | ) | | (1,845,766 | ) |
| Total distributions | (2,902,676 | ) | | (4,663,527 | ) |
| | | | |
| Capital share transactions: | | �� | |
| Shares sold: | | | |
| Class A shares | 32,627,848 |
| | 24,271,035 |
|
| Class I shares | 2,000 |
| | — |
|
| Reinvestment of distributions: | | | |
| Class A shares | 2,731,272 |
| | 4,430,330 |
|
| Class I shares | 7 |
| | — |
|
| Redemption fees: | | | |
| Class A shares | 18,132 |
| | 1,504 |
|
| Shares redeemed: | | | |
| Class A shares | (27,049,749 | ) | | (63,427,732 | ) |
| Total capital share transactions | 8,329,510 |
| | (34,724,863 | ) |
| | | | |
TOTAL INCREASE (DECREASE) IN NET ASSETS | 11,384,878 |
| | (30,490,663 | ) |
| | | | |
NET ASSETS | | | |
| Beginning of period | 82,488,629 |
| | 112,979,292 |
|
| End of period (including undistributed net investment income of $7,767 and $5,690, respectively) |
| $93,873,507 |
| |
| $82,488,629 |
|
| | | | |
CAPITAL SHARE ACTIVITY | | | |
| Shares sold: | | | |
| Class A shares | 1,835,026 |
| | 1,428,298 |
|
| Class I shares | 109 |
| | — |
|
| Reinvestment of distributions: | | | |
| Class A shares | 156,427 |
| | 270,128 |
|
| Shares redeemed: | | | |
| Class A shares | (1,541,263 | ) | | (3,830,310 | ) |
| Total capital share activity | 450,299 |
| | (2,131,884 | ) |
| | | | |
| See notes to financial statements. |
www.calvert.com CALVERT LONG-TERM INCOME FUND SEMI-ANNUAL REPORT (UNAUDITED) 19
NOTES TO FINANCIAL STATEMENTS
NOTE A — SIGNIFICANT ACCOUNTING POLICIES
General: Calvert Long-Term Income Fund (the “Fund”), a series of The Calvert Fund, is registered under the Investment Company Act of 1940 as a non-diversified, open-end management investment company. The Calvert Fund is comprised of six separate series. The operations of each series are accounted for separately. The Fund currently offers two classes of shares - Classes A and I (which commenced operations on January 30, 2015). Class A shares are sold with a maximum front-end sales charge of 3.75%. Class I shares require a minimum account balance of $1,000,000. The $1 million minimum initial investment is waived for retirement plans that trade through omnibus accounts and may be waived for certain other institutional accounts where it is believed to be in the best interest of the Fund and its shareholders. Class I shares have no front-end or deferred sales charge and have lower levels of expenses than Class A shares.
Security Valuation: Net asset value per share is determined every business day as of the close of the regular session of the New York Stock Exchange (generally 4:00 p.m. Eastern time). The Fund uses independent pricing services approved by the Board of Trustees (“the Board”) to value its investments wherever possible. Investments for which market quotations are not available or deemed not reliable are fair valued in good faith under the direction of the Board.
The Board has adopted Valuation Procedures (the “Procedures”) to determine the fair value of securities and other financial instruments for which market prices are not readily available or which may not be reliably priced. The Board has delegated the day-to-day responsibility for determining the fair value of assets of the Fund to Calvert Investment Management, Inc. (the “Advisor” or “Calvert”) and has provided these Procedures to govern Calvert in its valuation duties.
Calvert has chartered an internal Valuation Committee to oversee the implementation of these Procedures and to assist it in carrying out the valuation responsibilities that the Board has delegated.
The Valuation Committee meets on a regular basis to review illiquid securities and other investments which may not have readily available market prices. The Valuation Committee’s fair valuation determinations are subject to review, approval and ratification by the Board at its next regularly scheduled meeting covering the calendar quarter in which the fair valuation was determined.
The Valuation Committee utilizes various methods to measure the fair value of the Fund’s investments. Generally Accepted Accounting Principles (GAAP) establishes a disclosure hierarchy that categorizes the inputs to valuation techniques used to value assets and liabilities at measurement date. These inputs are summarized in the three broad levels listed below:
Level 1 - quoted prices in active markets for identical securities
Level 2 - other significant observable inputs (including quoted prices for similar securities, interest rates, prepayment speeds, credit risk, etc.)
Level 3 - significant unobservable inputs (including the Fund’s own assumptions in determining the fair value of investments)
The inputs or methodologies used for valuing securities are not necessarily an indication of the risk associated with investing in those securities.
20 www.calvert.com CALVERT LONG-TERM INCOME FUND SEMI-ANNUAL REPORT (UNAUDITED)
Changes in valuation techniques may result in transfers in or out of an investment’s assigned level within the hierarchy during the period. There were no such transfers during the period. Valuation techniques used to value the Fund’s investments by major category are as follows:
Debt securities, including restricted securities, are valued based on evaluated prices received from independent pricing services or from dealers who make markets in such securities. For corporate bonds, municipal securities, and U.S. government and government agency obligations, pricing services utilize matrix pricing which considers yield or price of bonds of comparable quality, coupon, maturity and type as well as dealer supplied prices, and such securities are generally categorized as Level 2 in the hierarchy. For asset-backed securities and commercial mortgage-backed securities, pricing services utilize matrix pricing which considers prepayment speed assumptions, attributes of the collateral, yield or price of bonds of comparable quality, coupon, maturity and type as well as dealer supplied prices and, accordingly, such securities are generally categorized as Level 2 in the hierarchy. Short-term securities of sufficient credit quality with remaining maturities of sixty days or less for which quotations are not readily available are valued at amortized cost, which approximates fair value, and are categorized as Level 2 in the hierarchy.
When independent prices are unavailable or unreliable, debt securities may be valued utilizing pricing matrices which consider similar factors that would be used by independent pricing services. These are generally categorized as Level 2 in the hierarchy but may be Level 3 depending on the circumstances.
Futures contracts are valued at the settlement price established each day by the board of trade or exchange on which they are traded and are categorized as Level 1 in the hierarchy.
If a market value cannot be determined for a security using the methodologies described above, or if, in the good faith opinion of the Advisor, the market value does not constitute a readily available market quotation, or if a significant event has occurred that would materially affect the value of the security, the security will be fair valued as determined in good faith by the Valuation Committee.
The Valuation Committee considers a number of factors, including significant unobservable valuation inputs when arriving at fair value. It considers all significant facts that are reasonably available and relevant to the determination of fair value.
The Valuation Committee primarily employs a market-based approach which may use related or comparable assets or liabilities, recent transactions, market multiples, book values, and other relevant information for the investment to determine the fair value of the investment. When more appropriate, the fund may employ an income-based or cost approach. An income-based valuation approach discounts anticipated future cash flows of the investment to calculate a present amount (discounted). The measurement is based on the value indicated by current market expectations about those future amounts. Discounts may also be applied due to the nature or duration of any restrictions on the disposition of the investments. A cost based approach is based on the amount that currently would be required to replace the service capacity of an asset (current replacement cost). From the seller’s perspective, the price that would be received for the asset is determined based on the cost to a buyer to acquire or construct a substitute asset of comparable utility, adjusted for obsolescence.
The values assigned to fair value investments are based on available information and do not necessarily represent amounts that might ultimately be realized. Further, due to the inherent uncertainty of valuations of such investments, the fair values may differ significantly from the values that would have been used had an active market existed, and the differences could be
www.calvert.com CALVERT LONG-TERM INCOME FUND SEMI-ANNUAL REPORT (UNAUDITED) 21
material. The Valuation Committee employs various methods for calibrating these valuation approaches including a regular review of key inputs and assumptions, transactional back-testing or disposition analysis and reviews of any related market activity.
At March 31, 2015, securities valued at $0, or 0% of net assets, were fair valued in good faith under the direction of the Board.
The following table summarizes the market value of the Fund’s holdings as of March 31, 2015, based on the inputs used to value them:
|
| | | | | | | | | | | | | | |
| | VALUATION INPUTS |
INVESTMENTS IN SECURITIES* | LEVEL 1 | | LEVEL 2 | | LEVEL 3 | | TOTAL |
| Asset-backed securities | — |
| |
| $3,366,147 |
| | — |
| |
| $3,366,147 |
|
| Commercial mortgage-backed securities | — |
| | 800,002 |
| | — |
| | 800,002 |
|
| Corporate debt | — |
| | 63,294,308 |
| | ** |
| | 63,294,308 |
|
| Municipal obligations | — |
| | 1,303,144 |
| | — |
| | 1,303,144 |
|
| U.S. government obligations | — |
| | 21,310,366 |
| | — |
| | 21,310,366 |
|
| Other debt obligations | — |
| | 6,517,379 |
| | — |
| | 5,517,379 |
|
| TOTAL | — |
| |
| $96,591,346 |
| | ** |
| |
| $96,591,346 |
|
| Other financial instruments*** |
| ($71,884 | ) | | — |
| | — |
| |
| ($71,884 | ) |
| | | | | | | | |
* For a complete listing of investments, please refer to the Schedule of Investments. ** Level 3 securities were valued at $0 and represent 0.0% of net assets. *** Other financial instruments are derivative instruments not reflected in the Total Investments in the Schedule of Investments, such as futures, which are valued at the unrealized appreciation/depreciation of the instrument. |
Loan Participations and Assignments: The Fund may invest in direct debt instruments which are interests in amounts owed to lenders or lending syndicates by corporate, governmental, or other borrowers. A Fund’s investments in loans may be in the form of participations in loans or assignments of all or a portion of loans from third parties. A loan is often administered by a bank or other financial institution (the “lender”) that acts as agent for all holders. The agent administers the terms of the loan, as specified in the loan agreement. The Fund may invest in multiple series or tranches of a loan, which may have varying terms and carry different associated risks. The Fund generally has no right to enforce compliance with the terms of the loan agreement with the borrower. As a result, the Fund may be subject to the credit risk of both the borrower and the lender that is selling the loan agreement. When the Fund purchases assignments from lenders it acquires direct rights against the borrower of the loan. When investing in a loan participation, the Fund has the right to receive payments of principal, interest and any fees to which it is entitled only from the lender selling the loan agreement and only upon receipt of payments by the lender from the borrower.
Futures Contracts: The Fund may purchase and sell futures contracts, but only when, in the judgment of the Advisor, such a position acts as a hedge. The Fund may not enter into futures contracts for the purpose of speculation or leverage. These futures contracts may include, but are not limited to, futures contracts based on U.S. Government obligations. The Fund is subject to interest rate risk in the normal course of pursuing its investment objectives and may use futures contracts to hedge against changes in interest rates. The Fund may enter into futures contracts agreeing to buy or sell a financial instrument for a set price at a future date. Initial margin deposits of either cash or securities as required by the broker are made upon
22 www.calvert.com CALVERT LONG-TERM INCOME FUND SEMI-ANNUAL REPORT (UNAUDITED)
entering into the contract. While the contract is open, daily variation margin payments are made to or received from the broker reflecting the daily change in market value of the contract and are recorded for financial reporting purposes as unrealized gains or losses by the Fund. When a futures contract is closed, a realized gain or loss is recorded equal to the difference between the opening and closing value of the contract. The risks associated with entering into futures contracts may include the possible illiquidity of the secondary market which would limit the Fund’s ability to close out a futures contract prior to the settlement date, an imperfect correlation between the value of the contracts and the underlying financial instruments, or that the counterparty will fail to perform its obligations under the contracts’ terms. Futures contracts are designed by boards of trade which are designated “contracts markets” by the Commodities Futures Trading Commission. Futures contracts trade on the contracts markets in a manner that is similar to the way a stock trades on a stock exchange and the boards of trade, through their clearing corporations, guarantee the futures contracts against default. As a result, there is minimal counterparty credit risk to the Fund. During the period, the Fund used U.S. Treasury Bond and Notes futures contracts to hedge against interest rate changes and to manage overall duration of the Fund. The Fund’s futures contracts at period end are presented in the Schedule of Investments.
During the period, the Fund invested in 2 year, 5 year, 10 year, and Ultra U.S. Treasury Bond and Notes futures. The volume of outstanding contracts has varied throughout the period with a weighted average of 48 contracts and $1,790,921 weighted average notional value.
Short Sales: The Fund may use a hedging technique that involves short sales of U.S. Treasury securities for the purpose of managing the duration of the Fund. Any short sales are “covered” with an equivalent amount of high-quality, liquid securities.
Security Transactions and Net Investment Income: Security transactions are accounted for on trade date. Realized gains and losses are recorded on an identified cost basis and may include proceeds from litigation. Interest income, which includes amortization of premium and accretion of discount on debt securities, is accrued as earned. Debt obligations may be placed on non-accrual status and related interest income may be reduced by ceasing current accruals and writing off interest receivables when the collection of all or a portion of interest has become doubtful based on consistently applied procedures. (See Schedule of Investments footnotes on page 16.) A debt obligation may be removed from non-accrual status when the issuer resumes interest payments or when collectability of interest is reasonably assured. The Fund earns certain fees in connection with its floating rate loan purchasing activities. These fees are in addition to interest payments earned and may include amendment fees, consent fees and prepayment fees. Investment income and realized and unrealized gains and losses are allocated to separate classes of shares based upon the relative net assets of each class. Expenses arising in connection with a specific class are charged directly to that class. Expenses common to the classes are allocated to each class in proportion to their relative net assets.
Distributions to Shareholders: Distributions to shareholders are recorded by the Fund on ex-dividend date. Dividends from net investment income are paid monthly. Distributions from net realized capital gains, if any, are paid at least annually. Distributions are determined in accordance with income tax regulations which may differ from generally accepted accounting principles; accordingly, periodic reclassifications are made within the Fund’s capital accounts to reflect income and gains available for distribution under income tax regulations.
Estimates: The preparation of the financial statements in conformity with accounting principles generally accepted in the United States requires management to make estimates and assumptions that affect the reported amounts of assets and liabilities and disclosure of
www.calvert.com CALVERT LONG-TERM INCOME FUND SEMI-ANNUAL REPORT (UNAUDITED) 23
contingent assets and liabilities at the date of the financial statements and the reported amounts of income and expenses during the reported period. Actual results could differ from those estimates.
Redemption Fees: The Fund charges a 2% redemption fee on redemptions, including exchanges, made within 30 days of purchase in the same Fund. The redemption fee is accounted for as an addition to paid-in capital and is intended to discourage market-timers by ensuring that short-term trading costs are borne by the investors making the transactions and not the shareholders already in the Fund. This fee was eliminated effective February 2, 2015.
Federal Income Taxes: No provision for federal income or excise tax is required since the Fund intends to continue to qualify as a regulated investment company under the Internal Revenue Code and to distribute substantially all of its taxable earnings.
Management has analyzed the Fund’s tax positions taken for all open federal income tax years and has concluded that no provision for federal income tax is required in the Fund’s financial statements. A Fund’s federal tax return is subject to examination by the Internal Revenue Service for a period of three years.
NOTE B — RELATED PARTY TRANSACTIONS
Calvert Investment Management, Inc. (the “Advisor”) is wholly-owned by Calvert Investments, Inc., which is indirectly wholly-owned by Ameritas Mutual Holding Company. The Advisor provides investment advisory services and pays the salaries and fees of officers and Trustees of the Fund who are employees of the Advisor or its affiliates. For its services, the Advisor receives an annual fee, payable monthly, of .40% of the Fund’s average daily net assets.
The Advisor has contractually agreed to limit net annual fund operating expenses through January 31, 2016. The contractual expense cap are 1.25% and .55% for Class A and I, respectively. For the purpose of this expense limit, operating expenses do not include interest expense, brokerage commissions, taxes, and extraordinary expenses. This expense limitation does not limit acquired fund fees and expenses, if any.
Calvert Investment Administrative Services, Inc., an affiliate of the Advisor, provides administrative services to the Fund for an annual fee, payable monthly, of .275% and .10% of the average daily net assets of Class A and Class I, respectively.
Calvert Investment Distributors, Inc. (“CID”), an affiliate of the Advisor, is the distributor and principal underwriter for the Fund. Pursuant to Rule 12b-1 under the Investment Company Act of 1940, the Fund has adopted a Distribution Plan that permits the Fund to pay certain expenses associated with the distribution and servicing of its shares. The expenses paid may not exceed .50% annually of the Fund’s average daily net assets of Class A. The amount actually paid by the Fund is an annualized fee, payable monthly, of .25% of the Fund’s average daily net assets of Class A. Class I shares do not have Distribution Plan expenses.
CID received $8,395 as its portion of the commissions charged on sales of the Fund’s Class A shares for the six months ended March 31, 2015.
Calvert Investment Services, Inc. (“CIS”), an affiliate of the Advisor, is the shareholder servicing agent for the Fund. For its services, CIS received a fee of $5,665 for the six months ended March 31, 2015. Boston Financial Data Services, Inc. is the transfer and dividend disbursing agent.
24 www.calvert.com CALVERT LONG-TERM INCOME FUND SEMI-ANNUAL REPORT (UNAUDITED)
Each Trustee of the Fund who is not an employee of the Advisor or its affiliates receives an annual retainer of $45,000 plus up to $2,000 for each regular Board and Committee meeting attended. The Board chair and Committee chairs each receive an additional $5,000 annual retainer. Trustees’ fees are allocated to each of the funds served.
NOTE C — INVESTMENT ACTIVITY AND TAX INFORMATION
During the period, the cost of purchases and proceeds from sales of investments, other than short-term and U.S. government securities, were $47,330,254 and $50,980,342, respectively. U.S. government security purchases and sales were $84,801,946 and $74,180,522, respectively.
The Fund may purchase securities, typically short-term variable rate demand notes, from or sell to other funds managed by the Advisor. These interportfolio transactions are primarily used for cash management purposes and are made pursuant to Rule 17a-7 of the Investment Company Act of 1940. For the six months ended March 31, 2015, there were no such sales transactions.
As of March 31, 2015, the tax basis components of unrealized appreciation/(depreciation) and the federal tax cost were as follows:
|
| | | |
| Unrealized appreciation |
| $4,003,172 |
|
| Unrealized (depreciation) | (657,819 | ) |
| Net unrealized appreciation/(depreciation) |
| $3,345,353 |
|
| | |
| Federal income tax cost of investments |
| $93,245,993 |
|
NOTE D — LINE OF CREDIT
A financing agreement is in place with the Calvert Funds and State Street Corporation (“SSC”). Under the agreement, SSC provides an unsecured line of credit facility, in the aggregate amount of $50 million ($25 million committed and $25 million uncommitted), accessible by the Funds for temporary or emergency purposes only. Borrowings bear interest at the higher of the London Interbank Offered Rate (LIBOR) or the overnight Federal Funds Rate plus 1.25% per annum. A commitment fee of .125% per annum is incurred on the unused portion of the committed facility, which is allocated to all participating funds. The Fund had no loans outstanding pursuant to this line of credit at March 31, 2015. For the six months ended March 31, 2015, borrowings by the Fund under the agreement were as follows:
|
| | | |
AVERAGE DAILY BALANCE | WEIGHTED AVERAGE INTEREST RATE | MAXIMUM AMOUNT BORROWED | MONTH OF MAXIMUM AMOUNT BORROWED |
| $25,817 | 1.37% | $1,566,219 | January 2015 |
NOTE E — REGULATORY MATTERS
In October 2011, the Advisor determined that it was necessary to change the price at which one of the Fund’s portfolio securities was then being fair valued. The Advisor and the Board of Trustees subsequently determined it was appropriate to change the fair value prices at which that security and certain related securities had been carried from March 2008 through September 30, 2011. These fair value revisions had the effect of changing the net asset value per share at which shareholder subscriptions and redemptions were executed during the affected period. Accordingly, in December 2011, pursuant to an agreement (“the Agreement”) with the Board of Trustees, the Advisor contributed $381,095 to the Fund to adjust shareholder trades occurring during the respective period for the benefit of affected shareholders.
www.calvert.com CALVERT LONG-TERM INCOME FUND SEMI-ANNUAL REPORT (UNAUDITED) 25
Subsequent to the Agreement, the Securities and Exchange Commission (“SEC”) conducted a compliance examination of the Advisor and the Calvert Funds (“the Funds”). In a letter dated November 1, 2013, the SEC communicated its examination findings that included various deficiencies and weaknesses and concerns regarding whether the contribution and shareholder disbursement, discussed above, was properly calculated and distributed to certain shareholders.
Management of the Advisor and the Funds responded to the SEC examination and believe a number of corrective actions have been taken since October 2011 to address the matters raised in the examination. Also, in management’s opinion, the contribution noted above was properly calculated and distributed by the Fund to benefit the affected shareholders and was in accordance with the Agreement. The SEC is continuing its examination of these matters. It is also management’s opinion that the resolution of the examination matters will not have a material adverse effect on the financial position or results of operations of the Fund.
NOTE F — SUBSEQUENT EVENTS
In preparing the financial statements as of March 31, 2015, no subsequent events or transactions occurred that would have required recognition or disclosure in these financial statements.
26 www.calvert.com CALVERT LONG-TERM INCOME FUND SEMI-ANNUAL REPORT (UNAUDITED)
FINANCIAL HIGHLIGHTS
|
| | | | | | | | | | | |
| | | PERIODS ENDED | |
CLASS A SHARES | MARCH 31, 2015 (z) | | SEPTEMBER 30, 2014 (z) | | SEPTEMBER 30, 2013 (z) |
| Net asset value, beginning |
| $17.21 |
| |
| $16.31 |
| |
| $18.89 |
|
| Income from investment operations: | | | | | |
| Net investment income | .24 |
| | .54 |
| | .54 |
|
| Net realized and unrealized gain (loss) | 1.07 |
| | 1.25 |
| | (1.47 | ) |
| Total from investment operations | 1.31 |
| | 1.79 |
| | (.93 | ) |
| Distributions from: | | | | | |
| Net investment income | (.24 | ) | | (.55 | ) | | (.55 | ) |
| Net realized gain | (.38 | ) | | (.34 | ) | | (1.10 | ) |
| Total distributions | (.62 | ) | | (.89 | ) | | (1.65 | ) |
| Total increase (decrease) in net asset value | .69 |
| | .90 |
| | (2.58 | ) |
| Net asset value, ending |
| $17.90 |
| |
| $17.21 |
| |
| $16.31 |
|
| | | | | | |
| Total return* | 7.73 | % | | 11.36 | % | | (5.42 | %) |
Ratios to average net assets: A | | | | | |
| Net investment income | 2.75% (a) |
| | 3.26 | % | | 3.03 | % |
| Total expenses | 1.32% (a) |
| | 1.27 | % | | 1.28 | % |
| Expenses before offsets | 1.25% (a) |
| | 1.25 | % | | 1.25 | % |
| Net expenses | 1.25% (a) |
| | 1.25 | % | | 1.25 | % |
| Portfolio turnover | 156 | % | | 289 | % | | 272 | % |
| Net assets, ending (in thousands) |
| $93,872 |
| |
| $82,489 |
| |
| $112,979 |
|
| | | | | | |
|
| | | | | | | | | | |
| | | | YEARS ENDED | | |
CLASS A SHARES | SEPTEMBER 30, 2012 | | SEPTEMBER 30, 2011 | | SEPTEMBER 30, 2010 ^ |
| Net asset value, beginning |
| $17.77 |
| | $17.95^ |
| | $17.32^ |
|
| Income from investment operations: | | | | | |
| Net investment income | .48 |
| | .58 |
| | .58 |
|
| Net realized and unrealized gain (loss) | 1.77 |
| | .51^ |
| | 1.50^ |
|
| Total from investment operations | 2.25 |
| | 1.09 |
| | 2.08 |
|
| Distributions from: | | | | | |
| Net investment income | (.50 | ) | | (.59 | ) | | (.57 | ) |
| Net realized gain | (.63 | ) | | (.68 | ) | | (.88 | ) |
| Total distributions | (1.13 | ) | | (1.27 | ) | | (1.45 | ) |
| Total increase (decrease) in net asset value | 1.12 |
| | (.18 | ) | | .63 |
|
| Net asset value, ending |
| $18.89 |
| |
| $17.77 |
| | $17.95^ |
|
| | | | | | |
| Total return* | 13.28 | % | | 6.45%^,^^ |
| | 12.78%^ |
|
Ratios to average net assets: A | | | | | |
| Net investment income | 2.70 | % | | 3.26 | % | | 3.47 | % |
| Total expenses | 1.28 | % | | 1.32 | % | | 1.42 | % |
| Expenses before offsets | 1.25 | % | | 1.25 | % | | 1.25 | % |
| Net expenses | 1.25 | % | | 1.25 | % | | 1.25 | % |
| Portfolio turnover | 406 | % | | 498 | % | | 596 | % |
| Net assets, ending (in thousands) |
| $217,482 |
| |
| $173,700 |
| | $139,775^ |
|
| See notes to financial highlights. |
www.calvert.com CALVERT LONG-TERM INCOME FUND SEMI-ANNUAL REPORT (UNAUDITED) 27
FINANCIAL HIGHLIGHTS
|
| | | | | | | |
| | PERIOD ENDED | | | | |
CLASS I SHARES | MARCH 31, 2015 (z) # | | | | |
| Net asset value, beginning |
| $18.35 |
| | | | |
| Income from investment operations: | | | | | |
| Net investment income | .09 |
| | | | |
| Net realized and unrealized gain (loss) | (.44 | ) | | | | |
| Total from investment operations | (.35 | ) | | | | |
| Distributions from: | | | | | |
| Net investment income | (.06 | ) | | | | |
| Net realized gain | — |
| | | | |
| Total distributions | (.06 | ) | | | | |
| Total increase (decrease) in net asset value | (.41 | ) | | | | |
| Net asset value, ending |
| $17.94 |
| | | | |
| | | | | | |
| Total return* | (1.91 | %) | | | | |
Ratios to average net assets: A | | | | | |
| Net investment income | 3.25% (a) |
| | | | |
| Total expenses | 604.55% (a) |
| | | | |
| Expenses before offsets | 0.55% (a) |
| | | | |
| Net expenses | 0.55% (a) |
| | | | |
| Portfolio turnover | 156 | % | | | | |
| Net assets, ending (in thousands) |
| $2 |
| | | | |
| | | | | | |
| See notes to financial highlights. |
28 www.calvert.com CALVERT LONG-TERM INCOME FUND SEMI-ANNUAL REPORT (UNAUDITED)
|
|
A Total expenses do not reflect amounts reimbursed and/or waived by the Advisor or reductions from expense offset arrangements. Expenses before offsets reflect expenses after reimbursement and/or waiver by the Advisor but prior to reductions from expense offset arrangements. Net expenses are net of all reductions and represent the net expenses paid by the Fund. (a) Annualized. (z) Per share figures are calculated using the Average Shares Method. * Total return is not annualized for periods of less than one year and does not reflect deduction of any front-end or deferred sales charge. ^ The Financial Highlights for the year ended 2010 have been restated to reflect an immaterial pricing adjustment made in 2011. ^^ The total return was revised from the previously reported amount of 6.63%. # From January 30, 2015 inception. See notes to financial statements. |
www.calvert.com CALVERT LONG-TERM INCOME FUND SEMI-ANNUAL REPORT (UNAUDITED) 29
EXPLANATION OF FINANCIAL TABLES
SCHEDULE OF INVESTMENTS
The Schedule of Investments is a snapshot of all securities held in the fund at their market value, on the last day of the reporting period. Securities are listed by asset type (e.g., common stock, corporate bonds, U.S. government obligations) and may be further broken down into sub-groups and by industry classification.
STATEMENT OF ASSETS AND LIABILITIES
The Statement of Assets and Liabilities is often referred to as the fund’s balance sheet. It lists the value of what the fund owns, is due and owes on the last day of the reporting period. The fund’s assets include the market value of securities owned, cash, receivables for securities sold and shareholder subscriptions, and receivables for dividends and interest payments that have been earned, but not yet received. The fund’s liabilities include payables for securities purchased and shareholder redemptions, and expenses owed but not yet paid. The statement also reports the fund’s net asset value (NAV) per share on the last day of the reporting period. The NAV is calculated by dividing the fund’s net assets (assets minus liabilities) by the number of shares outstanding. This statement is accompanied by a Schedule of Investments. Alternatively, if certain conditions are met, a Statement of Net Assets may be presented in lieu of this statement and the Schedule of Investments.
STATEMENT OF NET ASSETS
The Statement of Net Assets provides a detailed list of the fund’s holdings, including each security’s market value on the last day of the reporting period. The Statement of Net Assets includes a Schedule of Investments. Other assets are added and other liabilities subtracted from the investments total to calculate the fund’s net assets. Finally, net assets are divided by the outstanding shares of the fund to arrive at its share price, or Net Asset Value (NAV) per share.
At the end of the Statement of Net Assets is a table displaying the composition of the fund’s net assets. Paid in Capital is the money invested by shareholders and represents the bulk of net assets. Undistributed Net Investment Income and Accumulated Net Realized Gains usually approximate the amounts the fund had available to distribute to shareholders as of the statement date. Accumulated Realized Losses will appear as negative balances. Unrealized Appreciation (Depreciation) is the difference between the market value of the fund’s investments and their cost, and reflects the gains (losses) that would be realized if the fund were to sell all of its investments at their statement-date -values.
STATEMENT OF OPERATIONS
The Statement of Operations summarizes the fund’s investment income earned and expenses incurred in operating the fund. Investment income includes dividends earned from stocks and interest earned from interest-bearing securities in the fund. Expenses incurred in operating the fund include the advisory fee paid to the investment advisor, administrative services fees, distribution plan expenses (if applicable), transfer agent fees, shareholder servicing expenses, custodial, legal, and audit fees, and the printing and postage expenses related to shareholder reports. Expense offsets (fees paid indirectly) may also be shown. Credits earned from offset arrangements are used to reduce the fund’s expenses. This statement also shows net gains (losses) realized on the sale of investments and the increase or decrease in the unrealized appreciation (depreciation) on investments held during the period.
30 www.calvert.com CALVERT LONG-TERM INCOME FUND SEMI-ANNUAL REPORT (UNAUDITED)
STATEMENT OF CHANGES IN NET ASSETS
The Statement of Changes in Net Assets shows how the fund’s total net assets changed during the two most recent reporting periods. Changes in the fund’s net assets are attributable to investment operations, distributions and capital share transactions.
The Operations section of the report summarizes information detailed in the Statement of Operations. The Distribution section shows the dividend and capital gain distributions made to shareholders. The amounts shown as distributions in this section may not match the net investment income and realized gains amounts shown in the Operations section because distributions are determined on a tax basis and certain investments or transactions may be treated differently for financial statement and tax purposes. The Capital Share Transactions section shows the amount shareholders invested in the fund, either by purchasing shares or by reinvesting distributions, and the amounts redeemed. The corresponding numbers of shares issued, reinvested and redeemed are shown at the end of the report.
FINANCIAL HIGHLIGHTS
The Financial Highlights table provides a per-share breakdown per class of the components that affect the fund’s net asset value for current and past reporting periods. The table provides total return, total distributions, expense ratios, portfolio turnover and net assets for the applicable period. Total return is a measure of a fund’s performance that encompasses all elements of return: dividends, capital gain distributions and changes in net asset value. Total return is the change in value of an investment over a given period, assuming reinvestment of any dividends and capital gain distributions, expressed as a percentage of the initial investment. Total distributions include distributions from net investment income and net realized gains. Long-term gains are earned on securities held in the fund more than one year. Short-term gains, on the sale of securities held less than one year, are treated as ordinary dividend income for tax purposes. The expense ratio is a fund’s cost of doing business, expressed as a percentage of net assets. These expenses directly reduce returns to shareholders. Portfolio turnover measures the trading activity in a fund’s investment portfolio—how often securities are bought and sold by a fund. Portfolio turnover is affected by market conditions, changes in the size of the fund, the nature of the fund’s investments and the investment style of the portfolio manager.
PROXY VOTING
The Proxy Voting Guidelines of the Calvert Funds that the Fund uses to determine how to vote proxies relating to portfolio securities are provided as an Appendix to the Fund’s Statement of Additional Information. The Statement of Additional Information can be obtained free of charge by calling the Fund at 1-800-368-2745, by visiting the Calvert website at www.calvert.com; or by visiting the SEC’s website at www.sec.gov.
Information regarding how the Fund voted proxies relating to portfolio securities during the most recent 12-month period ended June 30 is available on the Fund’s website at www.calvert.com and on the SEC’s website at www.sec.gov.
AVAILABILITY OF QUARTERLY PORTFOLIO HOLDINGS
The Fund files its complete schedule of portfolio holdings with the SEC for the first and third quarters of each fiscal year on Form N-Q. The Fund’s Form N-Q is available on the SEC’s website at www.sec.gov. The Fund’s Form N-Q may be reviewed and copied at the SEC’s Public Reference Room in Washington, DC; information on the operation of the Public Reference Room may be obtained by calling 1-800-SEC-0330.
www.calvert.com CALVERT LONG-TERM INCOME FUND SEMI-ANNUAL REPORT (UNAUDITED) 31
BASIS FOR BOARD'S APPROVAL OF INVESTMENT ADVISORY CONTRACT
At a meeting held on December 10, 2014, the Board of Trustees, and by a separate vote, the disinterested Trustees, approved the continuance of the Investment Advisory Agreement between The Calvert Fund and the Advisor with respect to the Fund.
In evaluating the Investment Advisory Agreement, the Board considered a variety of information relating to the Fund and the Advisor. The disinterested Trustees reviewed a report prepared by the Advisor regarding various services provided to the Fund by the Advisor and its affiliates. Such report included, among other data, information regarding the Advisor’s personnel and the Advisor’s revenue and cost of providing services to the Fund, and a separate report prepared by an independent third party, which provided a statistical analysis comparing the Fund’s investment performance, expenses and fees to comparable mutual funds.
The disinterested Trustees were separately represented by independent legal counsel with respect to their consideration of the reapproval of the Investment Advisory Agreement. Prior to voting, the disinterested Trustees reviewed the proposed continuance of the Investment Advisory Agreement with management and also met in private sessions with their counsel at which no representatives of management were present.
In the course of its deliberations regarding the Investment Advisory Agreement, the Board considered the following factors, among others: the nature, extent and quality of the services provided by the Advisor, including the personnel providing such services; the Advisor's financial condition; the level and method of computing the Fund's advisory fee; comparative performance, fee and expense information for the Fund; the profitability of the Calvert Family of Funds to the Advisor and its affiliates; the direct and indirect benefits, if any, derived by the Advisor and its affiliates from their relationship with the Fund; the effect of the Fund's growth and size on the Fund's performance and expenses; the affiliated distributor's process for monitoring sales load breakpoints; the Advisor's compliance programs and policies; the Advisor's performance of substantially similar duties for other funds; and any possible conflicts of interest.
In considering the nature, extent and quality of the services provided by the Advisor under the Investment Advisory Agreement, the Board reviewed information provided by the Advisor relating to its operations and personnel, including, among other information, biographical information on the Advisor's investment, supervisory and professional staff and descriptions of its organizational and management structure. The Board also took into account similar information provided periodically throughout the previous year by the Advisor, as well as the Board’s familiarity with management through Board of Trustees’ meetings, discussions and other reports. The Board considered the Advisor’s management style and its performance in employing its investment strategies, as well as its current level of staffing and overall resources. The Board also noted that it reviewed on a quarterly basis information regarding the Advisor’s compliance with applicable policies and procedures, including those related to personal investing. The Advisor's administrative capabilities, including its ability to supervise the other service providers for the Fund, were also considered. The Board also took into account the environmental, social, sustainability and governance research and analysis provided by the Advisor to the Fund. The Board observed that the scope of services provided by the Advisor generally had expanded over time as a result of regulatory, market and other changes. The Board took into consideration, among other factors, the effectiveness of the Fund’s and Advisor’s processes, policies and procedures and the Advisor’s personnel. The Board also took into account, among other items, periodic reports received from the Advisor over the past year concerning the Advisor’s ongoing review and enhancement of certain
32 www.calvert.com CALVERT LONG-TERM INCOME FUND SEMI-ANNUAL REPORT (UNAUDITED)
processes, policies and procedures of the Fund and the Advisor. The Board concluded that it was satisfied with the nature, extent and quality of services provided to the Fund by the Advisor under the Investment Advisory Agreement.
In considering the Fund’s performance, the Board noted that it reviewed on a quarterly basis detailed information about the Fund’s performance results, portfolio composition and investment strategies. In addition, the Board took into account overall financial market conditions. The Board also reviewed various comparative data provided to it in connection with its consideration of the renewal of the Investment Advisory Agreement, including, among other information, a comparison of the Fund’s total return with its Lipper index and with that of other mutual funds deemed to be in its peer group by an independent third party in its report. This comparison indicated that the Fund performed above the median of its peer group for the one-, three- and five-year periods ended June 30, 2014. The data also indicated that the Fund outperformed its Lipper index for the one-, three- and five-year periods ended June 30, 2014. Based upon its review, the Board concluded that the Fund’s overall performance was satisfactory relative to the performance of funds with similar investment objectives and to relevant indices.
In considering the Fund’s fees and expenses, the Board compared the Fund’s fees and total expense ratio with various comparative data for the funds in its peer group. Among other findings, the data indicated that the Fund’s advisory fee (after taking into account waivers and/or reimbursements) was below the median of its peer group and that total expenses (net of waivers and/or reimbursements) were above the median of its peer group. The Board noted that the allocation of advisory and administrative fees may vary among the Fund’s peer group. The Board took into account the Advisor’s current undertaking to maintain expense limitations for the Fund and that the Advisor was reimbursing a portion of the Fund’s expenses. The Board also noted management’s discussion of the Fund’s expenses and certain factors that affected the level of such expenses, including the cost of providing the environmental, social, sustainability and governance research and analysis provided by the Advisor. Based upon its review, the Board concluded that the advisory fee was reasonable in view of the quality of services received by the Fund from the Advisor and the other factors considered.
The Board reviewed the Advisor’s profitability on a fund-by-fund basis. In reviewing the overall profitability of the advisory fee to the Fund’s Advisor, the Board also considered the fact that affiliates of the Advisor provided shareholder servicing, administrative and distribution services to the Fund for which they received compensation. The information considered by the Board included Calvert’s operating profit margin information both before and after tax expenses with respect to the services that the Advisor and its affiliates provided to the Calvert Family of Funds complex. The Board reviewed the profitability of the Advisor’s relationship with the Fund in terms of the total amount of annual advisory fees it received with respect to the Fund and whether the Advisor had the financial wherewithal to continue to provide services to the Fund. The Board noted that the Advisor was reimbursing a portion of the Fund’s expenses. The Board also noted the Advisor’s current undertaking to maintain expense limitations for the Fund. The Board also considered that the Advisor derived benefits to its reputation and other indirect benefits from its relationship with the Fund. Based upon its review, the Board concluded that the Advisor’s and its affiliates’ level of profitability from their relationship with the Fund was reasonable.
The Board considered the effect of the Fund’s current size and its potential growth on its performance and expenses. The Board concluded that adding breakpoints to the advisory fee at specified asset levels would not be appropriate at this time given the Fund's current size.
www.calvert.com CALVERT LONG-TERM INCOME FUND SEMI-ANNUAL REPORT (UNAUDITED) 33
The Board noted that if the Fund’s assets increased over time, the Fund might realize other economies of scale if assets increased proportionally more than certain other expenses.
In reapproving the Investment Advisory Agreement, the Board, including the disinterested Trustees, did not identify any single factor as controlling, and each Trustee may have attributed different weight to various factors.
Conclusions
The Board reached the following conclusions regarding the Investment Advisory Agreement, among others: (a) the Advisor has demonstrated that it possesses the capability and resources to perform the duties required of it under the Investment Advisory Agreement; (b) the Advisor maintains appropriate compliance programs; (c) the Fund’s overall performance is satisfactory relative to the performance of funds with similar investment objectives and to relevant indices; (d) the Advisor is likely to execute its investment strategies consistently over time; and (e) the Fund's advisory fee is reasonable in view of the quality of services received by the Fund from the Advisor and the other factors considered. Based on its conclusions, the Board determined that reapproval of the Investment Advisory Agreement would be in the best interests of the Fund and its shareholders.
34 www.calvert.com CALVERT LONG-TERM INCOME FUND SEMI-ANNUAL REPORT (UNAUDITED)
To Open an Account
800-368-2748
Service for Existing Account
Shareholders: 800-368-2745
Brokers: 800-368-2746
TDD for Hearing Impaired
800-541-1524
Registered Mail
Calvert Investments
c/o BFDS,
P.O. Box 219544
Kansas City, MO 64121-9544
Overnight Mail
Calvert Investments
c/o BFDS,
330 West 9th Street
Kansas City, MO 64105
Web Site
www.calvert.com
Principal Underwriter
Calvert Investment Distributors, Inc.
4550 Montgomery Avenue
Suite 1000 North
Bethesda, Maryland 20814
|
| | | |
CALVERT LONG-TERM INCOME FUND | CALVERT'S FAMILY OF FUNDS | | |
| | Municipal Funds Tax-Free Bond Fund Taxable Bond Funds Bond Portfolio Income Fund Short Duration Income Fund Long-Term Income Fund Ultra-Short Income Fund High Yield Bond Fund Green Bond Fund Unconstrained Bond Fund Balanced and Asset Allocation Funds Balanced Portfolio Conservative Allocation Fund Moderate Allocation Fund Aggressive Allocation Fund | | Equity Funds Large Cap Core Portfolio Equity Portfolio Large Cap Value Fund Social Index Fund Capital Accumulation Fund International Equity Fund Small Cap Fund Global Energy Solutions Fund Global Water Fund International Opportunities Fund Equity Income Fund Emerging Markets Equity Fund |
| | |
This report is intended to provide fund information to shareholders. It is not authorized for distribution to prospective investors unless preceded or accompanied by a prospectus.
Note: The information on our website is not incorporated by reference into this report; our website address is included as an inactive textual reference only.
Investors should carefully consider the investment objectives, risks, charges and expenses of the Calvert Funds. This and other important information is contained in the fund’s summary prospectus and prospectus, which can be obtained from your financial professional and should be read carefully before investing. You may also call Calvert at 800/368-2748 or visit www. calvert.com.
Printed on recycled paper using soy inks.
|
| | |
| | |
| | | |
| Calvert Ultra-Short Income Fund | | |
| | | |
| | |
|
| |
Semi-Annual Report March 31, 2015
E-Delivery Sign-Up — Details Inside | |
Choose Planet-friendly E-delivery!
Sign up now for on-line statements, prospectuses, and fund reports. In less than five minutes you can help reduce paper mail and lower fund costs.
Just go to www.calvert.com. If you already have an online account at Calvert, click on Login, to access your Account, and select the documents you would like to receive via e-mail.
If you’re new to online account access, click on Login, then Register to create your user name and password. Once you’re in, click on the E-delivery sign-up on the Account Portfolio page and follow the quick, easy steps.
Note: if your shares are not held directly at Calvert but through a brokerage firm, you must contact your broker for electronic delivery options available through their firm.
|
| | | |
| TABLE OF CONTENTS |
| | | | |
| | | | President's Letter |
| | | | Portfolio Management Discussion |
| | | | Shareholder Advocacy Update |
| | | | Shareholder Expense Example |
| | | | Statement of Net Assets |
| | | | Statement of Operations |
| | | | Statements of Changes in Net Assets |
| | | | Notes to Financial Statements |
| | | | Financial Highlights |
| | | | Explanation of Financial Tables |
| | | | Proxy Voting |
| | | | Availability of Quarterly Portfolio Holdings |
| | | | Basis for Board’s Approval of Investment Advisory Contract |
|
| |
| John Streur President and Chief Executive Officer, Calvert Investments, Inc. |
Dear Calvert Shareowner,
The United States economy improved throughout 2014 and into the first quarter of 2015, while major economies in other regions of the world struggled to regain momentum or saw slowing growth. It is still too early to declare victory, but one may say that while the United States led the world into financial crisis nearly eight years ago, the innovative and aggressive responses to the crisis by our policymakers are allowing the United States to recover more quickly. Granted, the United States has the benefit of possessing the world’s reserve currency and our monetary maneuvers in our self-interest are not without cost to economies in other regions.
As 2014 drew to a close, the United States was winding down the quantitative easing portion of its post-crisis monetary policy while the European and Japanese central banks were finding it necessary to increase their own forms of quantitative easing in efforts to support asset prices and spur economic growth.
The impact of modestly improving economic activity in the U.S. and ongoing low global interest rates on financial assets in 2014 created positive returns for most stocks and bonds for the previous 12 months, a condition that gave benefit to most Calvert Funds. The exceptions are assets tied to the price of oil, which collapsed during the second half of the year. Energy industries and natural resource based companies, including renewable energy companies and water related companies, saw their stock valuations drop in reaction.
Across our fixed income and equity strategies, Calvert finds more utility in conducting fundamental research in order to find relative values in securities of individual companies than we do in attempting to anticipate or time changes in global economic indicators. Broadly, we are mindful of the fact that stocks and bonds have benefitted substantially from the easy monetary policies and ultra-low interest rates of the post-crisis era. We believe markets are more or less fairly valued and we have taken steps seeking to moderate the risk across our portfolios.
As I take the helm at Calvert and look back at the 39 years since the firm’s founding in 1976, I note the substantial growth in the world’s population, the massive increase in the industrialization of our global society, and the associated change in the role of corporations in societal and environmental outcomes for our future.
4 www.calvert.com CALVERT ULTRA-SHORT INCOME FUND SEMI-ANNUAL REPORT (UNAUDITED)
Public companies have created tremendous net benefits to society through advances in health care, food systems, energy efficiency, communications and technology, and access to finance and other products and services too vast to detail. Hundreds of millions of people throughout the world have seen their standard of living increased through benefits created by corporate activity.
Along with the obvious net benefits to society, we are aware of the substantial stresses placed upon society and the environment from corporate behaviors. At the same time, society has awarded corporations an increasingly prominent role in the day-to-day outcomes of our lives and in the societal and environmental outcomes that will determine the future direction of the world.
Calvert, as a global investment management firm and a steward of client assets, has a growing and evolving role as a leader in responsible investing. Calvert has a rich history as a socially responsible investor and has made many contributions to public policy and corporate governance. Today we are bringing Calvert’s deep expertise in socially responsible investing, public and private policy work, and investment management to a new level with a focus on developing principles and setting standards for use in our investment management processes, our active ownership and engagement discipline and within our investment risk management processes.
As a long-term investor with unique insights into environmental, social, and governance activities of companies throughout the world, Calvert is able to develop a holistic view of companies’ operations. Our ability to use our insights for the benefit of the stewardship of client assets, both to produce desirable investment outcomes for our clients and to assist companies in evolving their role in society along a responsible path has never been more important.
As fellow shareowners of Calvert Funds, you and I know that it is essential to pursue the type of enduring value that Calvert seeks to create, through excellence in financial results balanced with the evolving needs of society and the environment.
Thank you for your share ownership in Calvert Funds; all of us at Calvert Investments, Inc. appreciate the confidence and trust you have placed in us.
John Streur
April 2015
www.calvert.com CALVERT ULTRA-SHORT INCOME FUND SEMI-ANNUAL REPORT (UNAUDITED) 5
|
| |
| PORTFOLIO MANAGEMENT DISCUSSION |
|
| |
| Catherine Roy, CFA Senior Vice President and Chief Investment Officer, Fixed Income |
Investment Climate
A very divergent economic picture between the United States and much of the rest of the world prompted central bank actions that affected global currencies and drove financial-market returns over the six-month reporting period. The markets also reacted to new information on key geopolitical situations, notably in the Ukraine.
The economic divergence theme was apparent in Europe, which featured consumer price deflation in many countries. China and Japan also experienced slower growth. In the United States, economic growth pulled back from the strong pace set in mid-2014 to a rate more in line with the Fed’s projected long-run average of 2.2%. While modest, this growth rate was superior to that of many other countries. The U.S. headline Consumer Price Index, which measures inflation excluding volatile food and energy prices, became slightly negative towards the end of the reporting period.
In January, the European Central Bank (ECB) announced a long-awaited quantitative easing program, which had significant market impact. In anticipation of the January ECB decision, some other European central banks, as well as Japan and China, increased monetary accommodation through interest-rate cuts and/or expanded bond purchase programs. In stark contrast, the U.S. Federal Reserve prepared markets for a small and slow series of interest-rate increases, slated to start sometime in 2015. The Fed anticipates that extremely low domestic inflation will be transitory, driven by the drop in energy prices, and is not a problem brought on by lack of consumer demand. In addition, the U.S. labor market is relatively strong, which has long been one condition the Fed required to start a slow removal of monetary accommodation.
Big moves in the world’s major currencies were a byproduct of these central bank actions. In the middle of 2014, the U.S. dollar began a sharp climb against other currencies that drove it to multi-year highs. The Bloomberg DXY, an index that measures the dollar against major currencies, appreciated 14.5% over the six-month reporting period. Tightly correlated to the dollar’s rally was a sharp drop in the price of oil—a market set up for a price collapse due to a massive demand-supply imbalance.
Bonds Provided Positive Returns
The global fixed-income markets generally reacted positively to the ECB-led central bank easing. U.S. bond yields gyrated over the reporting period, but at the end tended to be lower and so bond returns were positive.
6 www.calvert.com CALVERT ULTRA-SHORT INCOME FUND SEMI-ANNUAL REPORT (UNAUDITED)
|
| | | | |
| | | | |
| | CALVERT ULTRA-SHORT INCOME FUND | |
| | MARCH 31, 2015 | |
| | | | |
| | ECONOMIC SECTORS | % OF TOTAL INVESTMENTS | |
| | Corporate | 44.0 | % | |
| | Financial Institutions | 22.1 | % | |
| | Industrial | 21.4 | % | |
| | Utility | 0.5 | % | |
| | Securitized | 52.8 | % | |
| | Asset-Backed Securities | 30.3 | % | |
| | Collateral Mortgage-Backed Securities | 19.9 | % | |
| | Mortgage-Backed Passthrough | 2.6 | % | |
| | Short-Term Investments | 3.2 | % | |
| | Total | 100 | % | |
| | | | |
The ten-year T-note yield fell 58 basis points1 (bps) to 1.94%, while the 30-year fixed-rate mortgage average fell 50 bps to 3.69%. The Barclays U.S. Credit Index average yield declined 18 bps to 2.83%.
In terms of total return, the Barclays Long Credit Index rose 7.24%, the broad intermediate Barclays U.S. Credit Index returned 3.96%, and the shorter-term Barclays 1-5 Year U.S. Credit Index was up 1.48%. The Barclays US Aggregate Index returned 3.43% and the Bank of America Merrill Lynch High Yield Master II Index was little changed, up 1.45%.
Outlook
The United States economy is expanding moderately and has weathered global weakness better than other most other major economies. The 5.5% headline unemployment rate is just above the Federal Open Market Commission’s (FOMC) long-term target range. Wage growth is modest but steady. The labor-force participation rate, however, remains low—influenced by demographics and the long-term loss of traditional middle-wage jobs to overseas
|
| | | | | | |
| | | | | |
| | CALVERT ULTRA-SHORT INCOME FUND | |
| | MARCH 31, 2015 | |
| | | | | |
| | INVESTMENT PERFORMANCE | |
| | (TOTAL RETURN AT NAV*) | |
| | | 6 MONTHS ENDED 3/31/15 | 12 MONTHS ENDED 3/31/15 | |
| | Class A | 0.18 | % | 0.49 | % | |
| | Class I | 0.34 | % | 0.75 | % | |
| | Class Y | 0.30 | % | 0.64 | % | |
| | | | | |
| | Barclays 9-12 Months Short Treasury Index | 0.06 | % | 0.19 | % | |
| | | | | |
| | Lipper Ultra-Short Obligations Funds Average | 0.12 | % | 0.40 | % | |
| | | | | |
| | | 30 DAYS ENDED | |
| | SEC YIELD | 9/30/14 | 3/31/15 | |
| | Class A | 0.60 | % | 0.58 | % | |
| | Class I | 0.85 | % | 0.97 | % | |
| | Class Y | 0.62 | % | 0.73 | % | |
| | | |
| | * Investment performance/return at NAV does not reflect the deduction of the Fund’s maximum 1.25% front-end sales charge or any deferred sales charge. | |
| | | | | |
competition and automation. Workers in general, however, are in improved bargaining positions. The Fed’s benchmark consumer inflation rate hovers around zero, sharply below the 2% target.
Despite another cold winter, U.S. economic growth in 2015 could approach 3% in the absence of a material systemic shock. We expect inflation to continue well below the Fed’s 2% target. Improvement in the labor market should continue, with unemployment below 5.5%. Discord on Capitol Hill promises to add some uncertainty to late-summer debt-ceiling negotiations. Household consumption remains the major engine of growth and should be supported by lower energy prices. Lower energy prices, however,
www.calvert.com CALVERT ULTRA-SHORT INCOME FUND SEMI-ANNUAL REPORT (UNAUDITED) 7
are likely to depress earnings and investment from energy-industry companies and the much-stronger dollar may dampen overall U.S. corporate earnings. Housing-sector activity remains a disappointment, despite very low mortgage rates, and residential mortgage lending remains relatively restrained in the post-crisis market. The U.S. trade situation may deteriorate given continued strength of the dollar, which could drive up import costs.
If U.S. data trends hold, within the context of the global backdrop of disinflation and central bank easing, we expect the Fed to raise short-term interest rates by late 2015. If lift-off is in 2015, however, we expect no more than two quarter-point increases over the balance of the year. If the weaker global picture and price disinflation persist, there is a reasonable chance the Fed will delay any rate increases into 2016.
Over the longer term, we expect the benchmark 10-year T-note yield to fluctuate between 2% and 3%, influenced by the trend in economic data surprises, major central bank forward guidance, expected low global inflation rates, and flows in global fixed-income markets. We expect short-term money markets rates to remain close to zero percent for much of 2015.
Calvert Investment Management, Inc.
April 2015
1. A basis point is 0.01 percentage points
|
| | | | |
| | | | |
| | CALVERT ULTRA-SHORT INCOME FUND | |
| | MARCH 31, 2015 | |
| | | | |
| | AVERAGE ANNUAL TOTAL RETURNS | |
| | | | |
| | CLASS A SHARES | (WITH MAX. LOAD) | |
| | One year | -0.78 | % | |
| | Five year | 0.94 | % | |
| | Since inception (10/31/2006) | 2.55 | % | |
| | | | |
| | CLASS I SHARES* | | |
| | One year | 0.75 | % | |
| | Five year | 1.27 | % | |
| | Since inception (10/31/2006) | 0.92 | % | |
| | | | |
| | CLASS Y SHARES** | | |
| | One year | 0.64 | % | |
| | Five year | 1.41 | % | |
| | Since inception (10/31/2006) | 1.45 | % | |
| | | | |
| | * Calvert Ultra-Short Income Fund first offered Class I shares on January 31, 2014. Performance prior to that date reflects the performance of Class A shares at net asset value (NAV). Actual Class I share performance would have been different. ** Calvert Ultra-Short Income Fund first offered Class Y shares on May 28, 2010. Performance prior to that date reflects the performance of Class A shares at net asset value (NAV). Actual Class Y share performance would have been different. | |
| | | | |
8 www.calvert.com CALVERT ULTRA-SHORT INCOME FUND SEMI-ANNUAL REPORT (UNAUDITED)
Growth of $10,000
The graph below shows the value of a hypothetical $10,000 investment in the Fund over the past 10 fiscal year periods or since inception (for funds without 10-year records). The results shown are for Class A shares and reflect the deduction of the maximum front-end Class A sales charge of 1.25%, and assume the reinvestment of dividends. The result is compared with benchmarks that include a broad based market index and a Lipper peer group average. Market indexes are unmanaged and their results do not reflect the effect of expenses or sales charges. The Lipper average reflects the deduction of the category’s average front-end sales charge. The value of an investment in a different share class would be different.
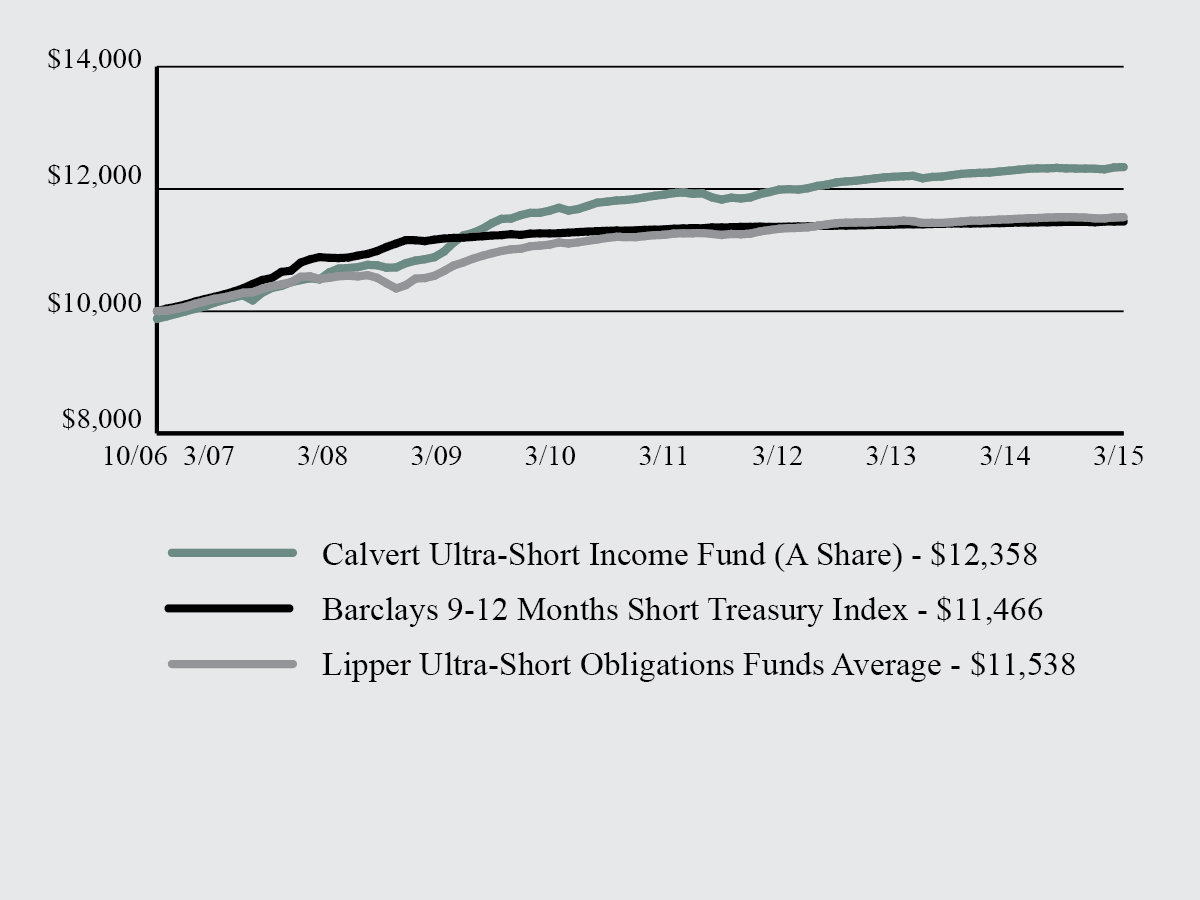
All performance data shown, including the graph above and the adjacent table, represents past performance, does not guarantee future results, assumes reinvestment of dividends and distributions and does not reflect the deduction of taxes that a shareholder would pay on the Fund’s distributions or the redemption of the Fund shares. All performance data reflects fee waivers and/or expense limitations, if any are in effect; in their absence performance would be lower. See Note B in Notes to Financial Statements. The investment return and principal value of an investment will fluctuate so that an investor’s shares, when redeemed, may be worth more or less than their original cost. Current performance may be lower or higher than the performance data quoted; for current performance data visit www.calvert.com. The gross expense ratio from the current prospectus for Class A shares is 1.04%. This number may differ from the expense ratio shown elsewhere in this report because it is based on a different time period and, if applicable, does not include fee or expense waivers. Performance data quoted already reflects the deduction of the Fund’s operating expenses.
www.calvert.com CALVERT ULTRA-SHORT INCOME FUND SEMI-ANNUAL REPORT (UNAUDITED) 9
SHAREHOLDER ADVOCACY UPDATE
2014 Corporate Diversity Report Findings Released
In March, Calvert published its 2014 survey findings on the corporate diversity practices of the largely multinational companies that make up the Standard & Poor’s 100 Index (S&P 100), in follow-up to reports published in 2012 and 2010. Calvert believes companies that fully commit to providing a fair and equitable working environment will recognize gains in both the workplace and marketplace.
Key findings from the 2014 survey include:
| |
| • | Milestone for women in the board room. In 2014, every company in the S&P 100 had at least one woman on its board of directors. In addition, there was a 17% increase in companies with three or more women and/or minorities on their boards. |
| |
| • | Diversity commitment on the rise. In the past two years, top scores related to overall corporate commitment have increased by 45%.This stems primarily from greater board oversight of diversity initiatives and increased CEO and/or chair involvement. |
| |
| • | LGBT policies have advanced overall. However, initiatives for persons with disabilities continue to fall behind other groups. |
Overall, in 2014, we saw growing commitment to women and minority employees, momentum around family-friendly work environments, and accelerated progress in support of LGBT employees. Looking ahead, we hope to see enhanced corporate diversity commitments, greater representation of women and minorities on boards, improved EEO1-disclosure, and expanded diversity initiatives for persons with disabilities.
To learn the highest- and lowest-rated companies in the report, A Survey of Corporate Diversity Practices of the S&P 100, and to find out more about the report’s methodology and findings, visit www.calvert.com.
2015 Shareholder Resolutions
Building on our initiatives from 2014, Calvert was the lead filer on 38 shareholder resolutions for the 2015 proxy season, and co-filer on another 18 proposals. Key topics include “big data” and civil rights issues, sustainability reporting, board of director oversight of environmental and social matters, water risk, climate change and greenhouse gas emissions reductions, supply chain labor issues, and board diversity.
Specifically, Calvert asked 14 companies to set a goal and a timeline for reducing their greenhouse gas emissions and filed seven proposals asking companies to issue a sustainability report describing their environmental, social and governance (ESG) performance and goals. To push for improved boardroom diversity, Calvert filed six proposals with companies requesting they report on their plans to increase minority and women Board representation and assess the effectiveness of these efforts. We also filed seven proposals requesting that companies assess and manage the civil rights’ risks related to their use of big data, which refers to data sets so large or complex that traditional data processing applications are inadequate. We also filed proposals on water risk in the agricultural supply chain and on developing a sustainable agriculture policy.
To keep abreast of the outcomes of these 2015 shareholder resolutions, as well as Calvert’s proxy voting and public policy initiatives, visit the “Resources” section on www.calvert.com.
10 www.calvert.com CALVERT ULTRA-SHORT INCOME FUND SEMI-ANNUAL REPORT (UNAUDITED)
SHAREHOLDER EXPENSE EXAMPLE
As a shareholder of the Fund, you incur two types of costs: (1) transaction costs, including sales charges (loads) and redemption fees; and (2) ongoing costs, including management fees; distribution (12b-1) fees; and other Fund expenses. This Example is intended to help you understand your ongoing costs (in dollars) of investing in the Fund and to compare these costs with the ongoing costs of investing in other mutual funds.
This Example is based on an investment of $1,000 invested at the beginning of the period and held for the entire period (October 1, 2014 to March 31, 2015).
Actual Expenses
The first line of the table below provides information about actual account values and actual expenses. You may use the information in this line, together with the amount you invested, to estimate the expenses that you paid over the period. Simply divide your account value by $1,000 (for example, an $8,600 account value divided by $1,000 = 8.6), then multiply the result by the number in the first line under the heading entitled “Expenses Paid During Period” to estimate the expenses you paid on your account during this period.
Hypothetical Example for Comparison Purposes
The second line of the table below provides information about hypothetical account values and hypothetical expenses based on the Fund’s actual expense ratio and an assumed rate of return of 5% per year before expenses, which is not the Fund’s actual return. The hypothetical account values and expenses may not be used to estimate the actual ending account balance or expenses you paid for the period. You may use this information to compare the ongoing costs of investing in the Fund and other funds. To do so, compare the 5% hypothetical example with the 5% hypothetical examples that appear in the shareholder reports of the other funds.
Please note that the expenses shown in the table are meant to highlight your ongoing costs only and do not reflect any transactional costs, such as sales charges (loads), or redemption fees. Therefore, the second line of the table is useful in comparing ongoing costs only, and will not help you determine the relative total costs of owning different funds. In addition, if these transactional costs were included, your costs would have been higher.
www.calvert.com CALVERT ULTRA-SHORT INCOME FUND SEMI-ANNUAL REPORT (UNAUDITED) 11
|
| | | |
| | BEGINNING ACCOUNT VALUE 10/1/14 | ENDING ACCOUNT VALUE 3/31/15 | EXPENSES PAID DURING PERIOD* 10/1/14 - 3/31/15 |
CLASS A | | | |
| Actual | $1,000.00 | $1,001.79 | $4.44 |
| Hypothetical | $1,000.00 | $1,020.49 | $4.48 |
| (5% return per year before expenses) | | | |
| | | | |
CLASS I | | | |
| Actual | $1,000.00 | $1,004.00 | $2.50 |
| Hypothetical | $1,000.00 | $1,022.44 | $2.52 |
| (5% return per year before expenses) | | | |
| | | | |
CLASS Y | | | |
| Actual | $1,000.00 | $1,002.96 | $3.28 |
| Hypothetical | $1,000.00 | $1,021.66 | $3.31 |
| (5% return per year before expenses) | | | |
| | | | |
* Expenses are equal to the Fund’s annualized expense ratio of 0.89%, 0.50% and 0.66% for Class A, Class I, and Class Y, respectively, multiplied by the average account value over the period, multiplied by 182/365 (to reflect the one-half year period).
|
12 www.calvert.com CALVERT ULTRA-SHORT INCOME FUND SEMI-ANNUAL REPORT (UNAUDITED)
STATEMENT OF NET ASSETS
MARCH 31, 2015
|
| | | | | | |
ASSET-BACKED SECURITIES - 34.8% | PRINCIPAL AMOUNT | VALUE |
| | | |
| American Credit Acceptance Receivables Trust: | | |
| 1.64%, 11/15/16 (e) |
| $86,173 |
|
| $86,181 |
|
| 1.32%, 2/15/17 (e) | 1,028,211 |
| 1,028,566 |
| 1.14%, 3/12/18 (e) | 2,247,199 |
| 2,247,957 |
| 1.45%, 4/16/18 (e) | 2,295,723 |
| 2,296,584 |
| 1.33%, 7/10/18 (e) | 4,160,993 |
| 4,165,149 |
| 0.99%, 8/10/18 (e) | 6,057,311 |
| 6,054,785 |
| 2.28%, 9/17/18 (e) | 1,800,000 |
| 1,801,566 |
| 2.78%, 9/17/18 (e) | 4,100,000 |
| 4,098,635 |
| 2.84%, 5/15/19 (e) | 3,080,000 |
| 3,100,581 |
| American Homes 4 Rent: | | |
| 1.25%, 6/17/31 (e)(r) | 6,906,277 |
| 6,831,496 |
| 1.60%, 6/17/31 (e)(r) | 3,550,000 |
| 3,517,482 |
| BCC Funding VIII LLC, 1.794%, 6/20/20 (e) | 1,108,938 |
| 1,103,726 |
| Blue Elephant Loan Trust, 3.12%, 12/15/22 (e) | 4,230,000 |
| 4,220,694 |
| California Republic Auto Receivables Trust, 1.18%, 8/15/17 (e) | 341,393 |
| 341,951 |
| CarFinance Capital Auto Trust: | | |
| 1.65%, 7/17/17 (e) | 697,090 |
| 697,473 |
| 1.75%, 11/15/17 (e) | 2,007,525 |
| 2,010,954 |
| 1.46%, 12/17/18 (e) | 7,876,682 |
| 7,864,315 |
| 1.44%, 11/16/20 (e) | 7,757,891 |
| 7,743,516 |
| 1.75%, 6/15/21 (e) | 11,711,131 |
| 11,726,496 |
| Carnow Auto Receivables Trust, 0.96%, 1/17/17 (e) | 5,295,427 |
| 5,288,898 |
| Chesapeake Funding LLC: | | |
| 1.775%, 11/7/23 (e)(r) | 200,000 |
| 200,680 |
| 1.425%, 4/7/24 (e)(r) | 850,373 |
| 853,563 |
| 1.175%, 1/7/25 (e)(r) | 2,680,000 |
| 2,688,292 |
| College Loan Corp Trust I, 0.376%, 10/25/25 (r) | 580,000 |
| 573,437 |
| Colony American Homes, 1.60%, 5/17/31 (e)(r) | 1,000,000 |
| 991,013 |
| Consumer Credit Origination Loan Trust, 2.82%, 3/15/21 (e) | 7,635,703 |
| 7,663,711 |
| CPS Auto Receivables Trust: | | |
| 2.82%, 4/16/18 (e) | 143,271 |
| 143,353 |
| 1.54%, 7/16/18 (e) | 1,851,630 |
| 1,850,939 |
| 1.21%, 8/15/18 (e) | 3,073,890 |
| 3,062,428 |
| 1.11%, 11/15/18 (e) | 3,751,040 |
| 3,727,975 |
| 1.31%, 2/15/19 (e) | 2,904,357 |
| 2,893,352 |
| 1.31%, 6/15/20 (e) | 240,171 |
| 238,482 |
| CPS Auto Trust, 1.64%, 4/16/18 (e) | 3,205,765 |
| 3,208,926 |
| Credit Acceptance Auto Loan Trust, 1.52%, 3/16/20 (e) | 335,470 |
| 336,220 |
| Exeter Automobile Receivables Trust: | | |
| 3.18%, 3/15/17 (e) | 120,677 |
| 120,786 |
| 1.30%, 6/15/17 (e) | 94,352 |
| 94,377 |
| 1.49%, 11/15/17 (e) | 2,796,526 |
| 2,801,613 |
www.calvert.com CALVERT ULTRA-SHORT INCOME FUND SEMI-ANNUAL REPORT (UNAUDITED) 13
|
| | | | | | |
ASSET-BACKED SECURITIES - CONT’D | PRINCIPAL AMOUNT | VALUE |
| | | |
| Exeter Automobile Receivables Trust - Cont’d: | | |
| 2.22%, 12/15/17 (e) |
| $6,250,000 |
|
| $6,263,300 |
|
| 1.29%, 5/15/18 (e) | 2,415,842 |
| 2,418,058 |
|
| 2.41%, 5/15/18 (e) | 1,000,000 |
| 1,004,042 |
| 1.06%, 8/15/18 (e) | 1,701,704 |
| 1,697,424 |
| 1.32%, 1/15/19 (e) | 12,565,840 |
| 12,558,388 |
| 1.60%, 6/17/19 (e) | 9,000,000 |
| 9,004,914 |
| Flagship Credit Auto Trust: | | |
| 3.32%, 10/16/17 (e) | 851,496 |
| 859,093 |
| 1.32%, 4/16/18 (e) | 2,104,945 |
| 2,106,878 |
| 1.21%, 4/15/19 (e) | 3,542,617 |
| 3,536,251 |
| 1.43%, 12/16/19 (e) | 7,575,704 |
| 7,569,250 |
| GLC II Trust, 4.00%, 12/18/20 (e) | 4,021,168 |
| 4,043,284 |
| GLC Trust, 3.00%, 7/15/21 (e) | 3,592,195 |
| 3,588,603 |
| GMAT Trust, 3.721%, 2/25/44 (e)(r) | 733,037 |
| 731,941 |
| Invitation Homes Trust: | | |
| 1.305%, 12/17/30 (e)(r) | 4,892,551 |
| 4,875,911 |
| 2.10%, 12/17/30 (e)(r) | 7,000,000 |
| 6,988,198 |
| 1.277%, 9/17/31 (e)(r) | 3,500,000 |
| 3,464,197 |
| Nations Equipment Finance Funding II LLC, 1.558%, 7/20/18 (e) | 6,601,133 |
| 6,599,839 |
| Navistar Financial Dealer Note Master Owner Trust II, 1.171%, 10/25/19 (e)(r) | 1,300,000 |
| 1,300,883 |
| Navistar Financial Dealer Note Master Trust, 0.851%, 9/25/18 (e)(r) | 700,000 |
| 700,552 |
| Navitas Equipment Receivables LLC, 1.95%, 11/15/16 (e) | 880,183 |
| 880,153 |
| Selene Non-Performing Loans LLC, 2.981%, 5/25/54 (e)(r) | 3,741,995 |
| 3,704,736 |
| Sierra Timeshare Receivables Funding LLC: | | |
| 4.23%, 4/20/26 (e) | 1,142,724 |
| 1,173,180 |
| 2.84%, 11/20/28 (e) | 3,976,166 |
| 4,038,413 |
| 3.58%, 11/20/28 (e) | 1,214,940 |
| 1,236,515 |
| 2.66%, 8/20/29 (e) | 2,646,183 |
| 2,661,864 |
| 1.59%, 11/20/29 (e) | 1,633,945 |
| 1,631,953 |
| 2.39%, 11/20/29 (e) | 182,618 |
| 183,063 |
| 2.07%, 3/20/30 (e) | 1,946,260 |
| 1,957,817 |
| 2.42%, 3/20/30 (e) | 1,136,502 |
| 1,138,256 |
| 2.70%, 10/20/30 (e) | 1,428,888 |
| 1,439,812 |
| Silver Bay Realty Trust, 1.627%, 9/17/31 (e)(r) | 2,000,000 |
| 1,984,778 |
| Silverleaf Finance VIII LLC, 8.475%, 5/16/22 (e) | 354,515 |
| 354,108 |
| SLM Private Credit Student Loan Trust, 0.471%, 6/15/23 (r) | 4,551,758 |
| 4,427,500 |
| SLM Private Education Loan Trust, 1.325%, 1/15/26 (e)(r) | 2,000,000 |
| 2,008,726 |
| SNAAC Auto Receivables Trust, 1.14%, 7/16/18 (e) | 58,699 |
| 58,710 |
| SoFi Professional Loan Program LLC: | | |
| 1.774%, 6/25/25 (e)(r) | 7,546,201 |
| 7,645,553 |
| 1.421%, 8/25/32 (e)(r) | 2,729,467 |
| 2,731,045 |
| 1.419%, 3/25/33 (e)(r) | 3,408,210 |
| 3,408,714 |
| SpringCastle America Funding LLC, 2.70%, 5/25/23 (e) | 9,927,916 |
| 9,953,471 |
14 www.calvert.com CALVERT ULTRA-SHORT INCOME FUND SEMI-ANNUAL REPORT (UNAUDITED)
|
| | | | | | |
ASSET-BACKED SECURITIES - CONT’D | PRINCIPAL AMOUNT | VALUE |
| | | |
| Springleaf Funding Trust: | | |
| 2.58%, 9/15/21 (e) |
| $6,851,065 |
|
| $6,881,525 |
|
| 3.92%, 1/16/23 (e) | 2,900,000 |
| 2,899,710 |
| SWAY Residential Trust, 1.477%, 1/17/32 (e)(r) | 2,973,898 |
| 2,969,952 |
| Synchrony Credit Card Master Note Trust, 1.175%, 5/15/19 (r) | 1,530,000 |
| 1,535,179 |
| United Auto Credit Securitization Trust: | | |
| 2.22%, 12/15/17 (e) | 1,118,758 |
| 1,119,914 |
| 2.90%, 12/15/17 (e) | 2,600,000 |
| 2,610,608 |
| VOLT XIX LLC, 3.875%, 4/25/55 (e)(r) | 2,728,972 |
| 2,739,249 |
| Westlake Automobile Receivables Trust, 0.70%, 5/15/17 (e) | 259,776 |
| 259,614 |
| | | |
| Total Asset-Backed Securities (Cost $260,845,090) | | 260,621,275 |
| | | |
COLLATERALIZED MORTGAGE-BACKED OBLIGATIONS (PRIVATELY ORIGINATED) - 2.7% | | |
| CAM Mortgage Trust, 2.60%, 5/15/48 (e)(r) | 724,397 |
| 724,340 |
| Fannie Mae Connecticut Avenue Securities: | | |
| 1.124%, 5/25/24 (r) | 8,586,897 |
| 8,564,400 |
| 1.674%, 2/25/25 (r) | 7,109,956 |
| 7,158,659 |
| Freddie Mac Structured Agency Credit Risk Debt Notes, 1.624%, 11/25/23 (r) | 3,721,133 |
| 3,725,889 |
| | | |
| Total Collateralized Mortgage-Backed Obligations (Privately Originated) (Cost $20,164,584) | | 20,173,288 |
| | | |
COMMERCIAL MORTGAGE-BACKED SECURITIES - 16.0% | | |
| BAMLL Commercial Mortgage Securities Trust, 1.676%, 9/15/26 (e)(r) | 2,000,000 |
| 1,997,734 |
| BAMLL-DB Trust, 2.343%, 4/13/29 (e) | 1,980,589 |
| 1,997,262 |
| Bear Stearns Commercial Mortgage Securities Trust, 5.656%, 6/11/40 (r) | 739,640 |
| 747,629 |
| BLCP Hotel Trust, 1.525%, 8/15/29 (e)(r) | 7,500,000 |
| 7,479,277 |
| Boca Hotel Portfolio Trust, 1.325%, 8/15/26 (e)(r) | 2,132,233 |
| 2,132,233 |
| CDGJ Commercial Mortgage Trust, 1.575%, 12/15/27 (e)(r) | 7,000,000 |
| 7,006,314 |
| CGBAM Commercial Mortgage Trust, 1.375%, 2/15/31 (e)(r) | 5,000,000 |
| 4,988,330 |
| COMM Mortgage Trust, 1.225%, 6/8/30 (e)(r) | 2,000,000 |
| 1,998,740 |
| Commercial Mortgage Pass Through Certificates: | | |
| 1.827%, 6/11/27 (e)(r) | 6,500,000 |
| 6,486,240 |
| 1.775%, 6/8/30 (e)(r) | 5,000,000 |
| 4,997,710 |
| Credit Suisse Mortgage Capital Certificates, 1.425%, 3/15/17 (e)(r) | 7,000,000 |
| 6,976,200 |
| CSMC Trust: | | |
| 1.476%, 2/15/29 (e)(r) | 4,500,000 |
| 4,486,514 |
| 1.976%, 2/15/29 (e)(r) | 1,000,000 |
| 997,003 |
| 1.53%, 9/15/38 (e)(r) | 3,900,000 |
| 3,854,760 |
| Del Coronado Trust, 0.975%, 3/15/26 (e)(r) | 4,286,000 |
| 4,286,189 |
www.calvert.com CALVERT ULTRA-SHORT INCOME FUND SEMI-ANNUAL REPORT (UNAUDITED) 15
|
| | | | | | |
COMMERCIAL MORTGAGE-BACKED SECURITIES - CONT’D | PRINCIPAL AMOUNT | VALUE |
| | | |
| Extended Stay America Trust: | | |
| 0.873%, 12/5/31 (e)(r) |
| $5,000,000 |
|
| $4,979,435 |
|
| 0.973%, 12/5/31 (e)(r) | 5,295,606 |
| 5,287,922 |
| 1.273%, 12/5/31 (e)(r) | 5,000,000 |
| 4,987,480 |
| GP Portfolio Trust, 2.126%, 2/15/27 (e)(r) | 5,000,000 |
| 5,006,705 |
| Hilton USA Trust: | | |
| 1.173%, 11/5/30 (e)(r) | 6,996,802 |
| 6,996,970 |
| 1.673%, 11/5/30 (e)(r) | 2,956,395 |
| 2,956,469 |
| JP Morgan Chase Commercial Mortgage Securities Trust: | | |
| 1.075%, 4/15/27 (e)(r) | 6,320,000 |
| 6,319,431 |
| 1.875%, 6/15/29 (e)(r) | 5,700,000 |
| 5,672,127 |
| 0.955%, 4/15/30 (e)(r) | 2,870,000 |
| 2,869,389 |
| 1.325%, 4/15/30 (e)(r) | 1,150,000 |
| 1,149,817 |
| 1.428%, 1/15/32 (e)(r) | 7,000,000 |
| 6,993,364 |
| LB-UBS Commercial Mortgage Trust, 5.341%, 9/15/39 | 791,145 |
| 790,778 |
| ORES NPL LLC, 3.00%, 3/27/24 (e) | 2,156,567 |
| 2,156,567 |
| Wells Fargo Commercial Mortgage Trust, 1.522%, 2/15/27 (e)(r) | 3,000,000 |
| 2,983,386 |
| | | |
Total Commercial Mortgage-Backed Securities (Cost $119,740,464) | | 119,581,975 |
| | | |
CORPORATE BONDS - 44.6% | | |
| Actavis Funding SCS, 1.523%, 3/12/20 (r) | 1,000,000 |
| 1,013,581 |
| Air Lease Corp., 4.50%, 1/15/16 | 6,000,000 |
| 6,127,500 |
| Ally Financial, Inc., 4.625%, 6/26/15 | 6,309,000 |
| 6,340,545 |
| America Movil SAB de CV, 1.268%, 9/12/16 (r) | 7,500,000 |
| 7,529,295 |
| American Express Co., 0.852%, 5/22/18 (r) | 4,000,000 |
| 4,002,404 |
| ArcelorMittal, 4.50%, 8/5/15 | 1,200,000 |
| 1,209,000 |
| AT&T, Inc.: | | |
| 1.171%, 11/27/18 (r) | 4,000,000 |
| 4,052,800 |
| 0.937%, 3/11/19 (r) | 10,000,000 |
| 9,903,540 |
| Avis Budget Car Rental LLC / Avis Budget Finance, Inc., 3.012%, 12/1/17 (r) | 2,700,000 |
| 2,693,250 |
| Bank of America Corp., 1.125%, 4/1/19 (r) | 3,500,000 |
| 3,520,492 |
| Bank of America NA, 0.571%, 6/15/17 (r) | 16,000,000 |
| 15,864,800 |
| BB&T Corp., 1.131%, 6/15/18 (r) | 2,000,000 |
| 2,018,862 |
| Branch Banking & Trust Co., 0.59%, 9/13/16 (r) | 4,700,000 |
| 4,682,883 |
| Capital One NA, 0.935%, 2/5/18 (r) | 10,000,000 |
| 10,019,350 |
| Cemex SAB de CV, 5.273%, 9/30/15 (e)(r) | 12,200,000 |
| 12,259,780 |
| Cisco Systems, Inc., 0.762%, 3/1/19 (r) | 1,000,000 |
| 1,007,691 |
| Citigroup, Inc., 0.534%, 6/9/16 (r) | 14,102,000 |
| 14,016,655 |
| CNH Industrial Capital LLC, 3.875%, 11/1/15 | 2,250,000 |
| 2,266,875 |
| ConAgra Foods, Inc., 1.30%, 1/25/16 | 1,000,000 |
| 1,002,622 |
| Digital Realty Trust LP, 4.50%, 7/15/15 | 2,510,000 |
| 2,516,237 |
| Fifth Third Bancorp, 0.69%, 12/20/16 (r) | 4,000,000 |
| 3,975,992 |
16 www.calvert.com CALVERT ULTRA-SHORT INCOME FUND SEMI-ANNUAL REPORT (UNAUDITED)
|
| | | | | | |
CORPORATE BONDS - CONT’D | PRINCIPAL AMOUNT | VALUE |
| | | |
| Ford Motor Credit Co. LLC: | | |
| 4.207%, 4/15/16 |
| $750,000 |
|
| $771,438 |
|
| 3.984%, 6/15/16 | 1,500,000 |
| 1,546,544 |
| 1.098%, 3/12/19 (r) | 5,000,000 |
| 4,984,335 |
| 1.182%, 11/4/19 (r) | 11,000,000 |
| 11,009,405 |
| General Electric Capital Corp., 0.965%, 4/2/18 (r) | 12,000,000 |
| 12,127,824 |
| General Motors Financial Co., Inc., 1.812%, 1/15/20 (r) | 2,500,000 |
| 2,504,555 |
| Goldman Sachs Group, Inc., 1.417%, 4/23/20 (r) | 16,000,000 |
| 16,203,376 |
| Harley-Davidson Financial Services, Inc., 1.15%, 9/15/15 (e) | 2,000,000 |
| 2,004,206 |
| Hewlett-Packard Co., 0.93%, 8/3/15 (e) | 10,000,000 |
| 9,990,174 |
| HSBC Bank plc, 0.897%, 5/15/18 (e)(r) | 2,000,000 |
| 2,009,196 |
| International Lease Finance Corp.: | | |
| 4.875%, 4/1/15 | 2,000,000 |
| 2,000,000 |
| 8.625%, 9/15/15 | 11,062,000 |
| 11,380,032 |
| Jabil Circuit, Inc., 7.75%, 7/15/16 | 7,200,000 |
| 7,722,000 |
| JPMorgan Chase & Co., 1.212%, 1/23/20 (r) | 11,900,000 |
| 12,081,201 |
| JPMorgan Chase Bank, 0.60%, 6/13/16 (r) | 4,000,000 |
| 3,989,196 |
| Kansas City Southern de Mexico SA de CV, 0.956%, 10/28/16 (r) | 7,000,000 |
| 6,984,684 |
| Lockheed Martin Corp., 2.125%, 9/15/16 | 1,000,000 |
| 1,019,156 |
| Masco Corp., 4.80%, 6/15/15 | 4,750,000 |
| 4,788,328 |
| McKesson Corp., 0.665%, 9/10/15 (r) | 3,000,000 |
| 3,000,972 |
| Medtronic, Inc., 1.071%, 3/15/20 (e)(r) | 2,000,000 |
| 2,022,096 |
| Metropolitan Life Global Funding I, 0.783%, 7/15/16 (e)(r) | 6,000,000 |
| 6,029,736 |
| Morgan Stanley: | | |
| 0.997%, 7/23/19 (r) | 13,500,000 |
| 13,482,720 |
| 1.396%, 1/27/20 (r) | 5,000,000 |
| 5,074,770 |
| NBCUniversal Enterprise, Inc., 0.938%, 4/15/18 (e)(r) | 2,000,000 |
| 2,014,694 |
| Nissan Motor Acceptance Corp.: | | |
| 0.969%, 9/26/16 (e)(r) | 7,500,000 |
| 7,543,215 |
| 0.812%, 3/3/17 (e)(r) | 3,000,000 |
| 3,008,481 |
| Oracle Corp., 0.833%, 1/15/19 (r) | 10,000,000 |
| 10,078,240 |
| PAETEC Holding Corp., 9.875%, 12/1/18 | 2,000,000 |
| 2,110,000 |
| Penske Truck Leasing Co. LP / PTL Finance Corp., 3.125%, 5/11/15 (e) | 4,530,000 |
| 4,539,576 |
| PNM Resources, Inc., 9.25%, 5/15/15 | 3,500,000 |
| 3,530,776 |
| Prudential Financial, Inc., 1.037%, 8/15/18 (r) | 1,000,000 |
| 1,005,935 |
| QVC, Inc., 7.375%, 10/15/20 (e) | 750,000 |
| 778,125 |
| Regions Financial Corp., 5.75%, 6/15/15 | 5,425,000 |
| 5,473,120 |
| Santander Holdings USA, Inc., 3.00%, 9/24/15 | 1,000,000 |
| 1,007,795 |
| SunTrust Bank, 0.553%, 8/24/15 (r) | 2,177,000 |
| 2,176,166 |
| SunTrust Banks, Inc., 3.50%, 1/20/17 | 500,000 |
| 520,513 |
| Total Capital International SA, 0.826%, 8/10/18 (r) | 2,000,000 |
| 2,010,562 |
| TransCanada PipeLines Ltd., 0.953%, 6/30/16 (r) | 3,000,000 |
| 3,009,201 |
| Verizon Communications, Inc.: | | |
| 2.50%, 9/15/16 | 686,000 |
| 700,599 |
| 0.664%, 6/9/17 (r) | 2,000,000 |
| 1,996,824 |
www.calvert.com CALVERT ULTRA-SHORT INCOME FUND SEMI-ANNUAL REPORT (UNAUDITED) 17
|
| | | | | | |
CORPORATE BONDS - CONT’D | PRINCIPAL AMOUNT | VALUE |
| | | |
| Verizon Communications, Inc. - Cont’d: | | |
| 2.021%, 9/14/18 (r) |
| $6,000,000 |
|
| $6,258,168 |
|
| 1.041%, 6/17/19 (r) | 2,000,000 |
| 2,015,476 |
| Volkswagen International Finance NV, 0.696%, 11/18/16 (e)(r) | 3,000,000 |
| 3,005,661 |
| Walgreens Boots Alliance, Inc., 0.706%, 5/18/16 (r) | 7,000,000 |
| 7,010,542 |
| Western Union Co., 1.262%, 8/21/15 (r) | 5,000,000 |
| 5,010,385 |
| Zoetis, Inc., 1.15%, 2/1/16 | 1,000,000 |
| 1,000,275 |
| | | |
| Total Corporate Bonds (Cost $332,984,107) | | 334,554,427 |
| | | |
FLOATING RATE LOANS (d) - 1.1% | | |
| | | |
| Albertson’s Holdings LLC, 5.00%, 8/25/19 (r) | 3,500,000 |
| 3,520,234 |
| Delta Air Lines, Inc., 3.25%, 4/20/17 (r) | 4,089,378 |
| 4,085,547 |
| SUPERVALU, Inc., 4.50%, 3/21/19 (r) | 952,764 |
| 954,881 |
| | | |
| Total Floating Rate Loans (Cost $8,509,093) | | 8,560,662 |
| | | |
MUNICIPAL OBLIGATIONS - 0.6% | | |
| Albany New York IDA Civic Facilities Revenue VRDN, 1.00%, 5/1/27 (r)† | 405,000 |
| 405,000 |
| Caddo Parish Industrial Development Board, Inc. Revenue VRDN, 0.70%, 2/1/33 (r)† | 1,985,000 |
| 1,985,000 |
| CIDC-Hudson House LLC New York Revenue VRDN, 0.50%, 12/1/34 (r)† | 1,810,000 |
| 1,810,000 |
| | | |
| Total Municipal Obligations (Cost $4,200,000) | | 4,200,000 |
| | | |
TIME DEPOSIT - 1.3% | | |
| State Street Bank Time Deposit, 0.088%, 4/1/15 | 10,024,583 |
| 10,024,583 |
| | | |
| Total Time Deposit (Cost $10,024,583) | | 10,024,583 |
| | | |
| | | |
| TOTAL INVESTMENTS (Cost $756,467,921) - 101.1% | | 757,716,210 |
| Other assets and liabilities, net - (1.1%) | | (8,270,882 | ) |
NET ASSETS - 100% | | $749,445,328 |
| | | |
| See notes to financial statements. |
18 www.calvert.com CALVERT ULTRA-SHORT INCOME FUND SEMI-ANNUAL REPORT (UNAUDITED)
|
| | | |
NET ASSETS CONSIST OF: | |
| Paid-in capital applicable to the following shares of beneficial interest, unlimited number of no par value shares authorized: | |
| Class A: 35,315,662 shares outstanding |
| $549,190,735 |
|
| Class I: 92,861 shares outstanding | 1,444,984 |
|
| Class Y: 12,689,256 shares outstanding | 198,952,958 |
|
| Undistributed net investment income (loss) | (2,531 | ) |
| Accumulated net realized gain (loss) | (1,207,712 | ) |
| Net unrealized appreciation (depreciation) | 1,066,894 |
|
| | |
NET ASSETS |
| $749,445,328 |
|
| | |
NET ASSET VALUE PER SHARE | |
| Class A (based on net assets of $549,840,138) | $15.57 |
| Class I (based on net assets of $1,446,607) | $15.58 |
| Class Y (based on net assets of $198,158,583) | $15.62 |
| | |
|
| | | | | | | | |
FUTURES | NUMBER OF CONTRACTS | EXPIRATION DATE | UNDERLYING FACE AMOUNT AT VALUE | UNREALIZED APPRECIATION (DEPRECIATION) |
| Sold: | | | | |
| 2 Year U.S. Treasury Notes | 270 | 6/15 |
| $59,172,188 |
|
| ($181,395 | ) |
| | | | | |
(d) Remaining maturities of floating rate loans may be less than the stated maturities shown as a result of contractual or optional prepayments by the borrower. Such prepayments cannot be predicted with certainty. Floating rate loans generally pay interest at rates which are periodically re-determined at a margin above the London InterBank Offered Rate (“LIBOR”) or other short-term rates. The rate shown is the rate in effect at period end. Floating rate loans are generally considered restrictive in that the Fund is ordinarily contractually obligated to receive consent from the Agent Bank and/or Borrower prior to disposition of a floating rate loan. (e) Security is exempt from registration under Rule 144A of the Securities Act of 1933. These securities may be resold in transactions exempt from registration, normally to qualified institutional buyers. (r) The coupon rate shown on floating or adjustable rate securities represents the rate at period end. † The date shown for securities represents the date when principal payments must be paid. Most securities have maturity shortening features that function as put options. Abbreviations: IDA: Industrial Development Agency/Authority LLC: Limited Liability Corporation LP: Limited Partnership plc: Public Limited Company VRDN: Variable Rate Demand Notes See notes to financial statements. |
www.calvert.com CALVERT ULTRA-SHORT INCOME FUND SEMI-ANNUAL REPORT (UNAUDITED) 19
STATEMENT OF OPERATIONS
SIX MONTHS ENDED MARCH 31, 2015
|
| | | |
NET INVESTMENT INCOME | |
| Investment Income: | |
| Interest income |
| $5,966,081 |
|
| Total investment income | 5,966,081 |
|
| | |
| Expenses: | |
| Investment advisory fee | 1,204,819 |
|
| Administrative fees | 1,003,533 |
|
| Transfer agency fees and expenses | 535,855 |
|
| Distribution Plan expenses: | |
| Class A | 737,297 |
|
| Trustees’ fees and expenses | 50,206 |
|
| Custodian fees | 38,418 |
|
| Accounting fees | 57,508 |
|
| Registration fees | 26,409 |
|
| Reports to shareholders | 39,532 |
|
| Professional fees | 41,001 |
|
| Miscellaneous | 14,564 |
|
| Total expenses | 3,749,142 |
|
| Reimbursement from Advisor: | |
| Class A | (419,937 | ) |
| Class I | (4,174 | ) |
| Net expenses | 3,325,031 |
|
| | |
NET INVESTMENT INCOME | 2,641,050 |
|
| | |
REALIZED AND UNREALIZED GAIN (LOSS) | |
| Net realized gain (loss) on: | |
| Investments | 606,768 |
|
| Futures | (559,495 | ) |
| | 47,273 |
|
| Change in unrealized appreciation (depreciation) on: | |
| Investments | (1,076,606 | ) |
| Futures | (172,752 | ) |
| | (1,249,358 | ) |
| | |
NET REALIZED AND UNREALIZED GAIN (LOSS) | (1,202,085 | ) |
| | |
INCREASE (DECREASE) IN NET ASSETS RESULTING FROM OPERATIONS |
| $1,438,965 |
|
| | |
| See notes to financial statements. |
20 www.calvert.com CALVERT ULTRA-SHORT INCOME FUND SEMI-ANNUAL REPORT (UNAUDITED)
STATEMENTS OF CHANGES IN NET ASSETS
|
| | | | | | | |
INCREASE (DECREASE) IN NET ASSETS | SIX MONTHS ENDED MARCH 31, 2015 | | YEAR ENDED SEPTEMBER 30, 2014 |
| Operations: | | | |
| Net investment income |
| $2,641,050 |
| |
| $5,523,318 |
|
| Net realized gain (loss) | 47,273 |
| | 1,738,840 |
|
| Change in unrealized appreciation (depreciation) | (1,249,358 | ) | | 668,990 |
|
| | | | |
INCREASE (DECREASE) IN NET ASSETS RESULTING FROM OPERATIONS | 1,438,965 |
| | 7,931,148 |
|
| | | | |
| Distributions to shareholders from: | | | |
| Net investment income: | | | |
| Class A shares | (1,792,361 | ) | | (4,455,629 | ) |
| Class I shares | (3,357 | ) | | (12 | ) |
| Class Y shares | (894,988 | ) | | (1,377,850 | ) |
| Total distributions | (2,690,706 | ) | | (5,833,491 | ) |
| | | | |
| Capital share transactions: | | | |
| Shares sold: | | | |
| Class A shares | 78,481,011 |
| | 219,047,027 |
|
| Class I shares | 1,439,615 |
| | 2,000 |
|
| Class Y shares | 48,422,767 |
| | 215,845,655 |
|
| Shares issued from merger (See Note E): | | | |
| Class A shares | — |
| | 245,814,207 |
|
| Reinvestment of distributions: | | | |
| Class A shares | 1,560,545 |
| | 3,915,550 |
|
| Class I shares | 3,357 |
| | 12 |
|
| Class Y shares | 634,764 |
| | 973,476 |
|
| Redemption fees: | | | |
| Class A shares | 1,160 |
| | 7,399 |
|
| Class Y shares | 1,284 |
| | 11,146 |
|
| Shares redeemed: | | | |
| Class A shares | (154,246,655 | ) | | (380,581,607 | ) |
| Class Y shares | (70,814,227 | ) | | (151,552,632 | ) |
| Total capital share transactions | (94,516,379 | ) | | 153,482,233 |
|
| | | | |
TOTAL INCREASE (DECREASE) IN NET ASSETS | (95,768,120 | ) | | 155,579,890 |
|
| | | | |
NET ASSETS | | | |
| Beginning of period | 845,213,448 |
| | 689,633,558 |
|
| End of period (including distributions in excess of net investment income and undistributed net investment income of $2,531 and $47,125, respectively) |
| $749,445,328 |
| |
| $845,213,448 |
|
| | | | |
| See notes to financial statements. |
www.calvert.com CALVERT ULTRA-SHORT INCOME FUND SEMI-ANNUAL REPORT (UNAUDITED) 21
STATEMENTS OF CHANGES IN NET ASSETS
|
| | | | | |
CAPITAL SHARE ACTIVITY | SIX MONTHS ENDED MARCH 31, 2015 | | YEAR ENDED SEPTEMBER 30, 2014 |
| Shares sold: | | | |
| Class A shares | 5,040,507 |
| | 14,046,473 |
|
| Class I shares | 92,516 |
| | 128 |
|
| Class Y shares | 3,100,427 |
| | 13,797,519 |
|
| Reinvestment of distributions: | | | |
| Class A shares | 100,260 |
| | 251,039 |
|
| Class I shares | 216 |
| | 1 |
|
| Class Y shares | 40,665 |
| | 62,245 |
|
| Shares issued from merger (See Note E): | | | |
| Class A shares | — |
| | 15,781,029 |
|
| Shares redeemed: | | | |
| Class A shares | (9,909,489 | ) | | (24,402,100 | ) |
| Class Y shares | (4,535,423 | ) | | (9,689,637 | ) |
| Total capital share activity | (6,070,321 | ) | | 9,846,697 |
|
| | | | |
| See notes to financial statements. |
22 www.calvert.com CALVERT ULTRA-SHORT INCOME FUND SEMI-ANNUAL REPORT (UNAUDITED)
NOTES TO FINANCIAL STATEMENTS
NOTE A — SIGNIFICANT ACCOUNTING POLICIES
General: Calvert Ultra-Short Income Fund (the “Fund”), a series of The Calvert Fund, is registered under the Investment Company Act of 1940 as a non-diversified, open-end management investment company. The Calvert Fund is comprised of six separate series. The operations of each series are accounted for separately. The Fund offers three classes of shares of beneficial interest - Classes A, I (which commenced operations on January 31, 2014), and Y. Class A shares are sold with a maximum front-end sales charge of 1.25%. Class I shares require a minimum account balance of $1,000,000. The $1 million minimum initial investment is waived for retirement plans that trade through omnibus accounts and may be waived for certain other institutional accounts where it is believed to be in the best interest of the Fund and its shareholders. Class I shares have no front-end or deferred sales charge and have lower levels of expenses than Class A shares. Class Y shares are generally only available to wrap or similar fee-based programs offered by financial intermediaries, foundations, and endowments that have entered into an agreement with the Fund’s Distributor to offer Class Y shares. Class Y shares have no front-end or deferred sales charge and have lower levels of expenses than Class A shares. Each class has different: (a) dividend rates due to differences in Distribution Plan expenses and other class specific expenses, (b) exchange privileges and (c) class specific voting rights.
Security Valuation: Net asset value per share is determined every business day as of the close of the regular session of the New York Stock Exchange (generally 4:00 p.m. Eastern time). The Fund uses independent pricing services approved by the Board of Trustees (“the Board”) to value its investments wherever possible. Investments for which market quotations are not available or deemed not reliable are fair valued in good faith under the direction of the Board.
The Board has adopted Valuation Procedures (the “Procedures”) to determine the fair value of securities and other financial instruments for which market prices are not readily available or which may not be reliably priced. The Board has delegated the day-to-day responsibility for determining the fair value of assets of the Fund to Calvert Investment Management, Inc. (the “Advisor” or “Calvert”) and has provided these Procedures to govern Calvert in its valuation duties.
Calvert has chartered an internal Valuation Committee to oversee the implementation of these Procedures and to assist it in carrying out the valuation responsibilities that the Board has delegated.
The Valuation Committee meets on a regular basis to review illiquid securities and other investments which may not have readily available market prices. The Valuation Committee’s fair valuation determinations are subject to review, approval and ratification by the Board at its next regularly scheduled meeting covering the calendar quarter in which the fair valuation was determined.
The Valuation Committee utilizes various methods to measure the fair value of the Fund’s investments. Generally Accepted Accounting Principles (GAAP) establishes a disclosure hierarchy that categorizes the inputs to valuation techniques used to value assets and liabilities at measurement date. These inputs are summarized in the three broad levels listed below:
Level 1 - quoted prices in active markets for identical securities
Level 2 - other significant observable inputs (including quoted prices for similar securities, interest rates, prepayment speeds, credit risk, etc.)
www.calvert.com CALVERT ULTRA-SHORT INCOME FUND SEMI-ANNUAL REPORT (UNAUDITED) 23
Level 3 - significant unobservable inputs (including the Fund’s own assumptions in determining the fair value of investments)
The inputs or methodologies used for valuing securities are not necessarily an indication of the risk associated with investing in those securities.
Changes in valuation techniques may result in transfers in or out of an investment’s assigned level within the hierarchy during the period. There were no such transfers during the period. Valuation techniques used to value the Fund’s investments by major category are as follows:
Debt securities, including restricted securities, are valued based on evaluated prices received from independent pricing services or from dealers who make markets in such securities. For corporate bonds, floating rate loans, municipal securities, and U.S. government and government agency obligations, pricing services utilize matrix pricing which considers yield or price of bonds of comparable quality, coupon, maturity and type as well as dealer supplied prices and such securities are generally categorized as Level 2 in the hierarchy. For asset-backed securities, collateralized mortgage-backed obligations, and commercial mortgage-backed securities, pricing services utilize matrix pricing which considers prepayment speed assumptions, attributes of the collateral, yield or price of bonds of comparable quality, coupon, maturity and type as well as dealer supplied prices and, accordingly, such securities are generally categorized as Level 2 in the hierarchy. Short-term securities of sufficient credit quality with remaining maturities of sixty days or less for which quotations are not readily available are valued at amortized cost, which approximates fair value, and are categorized as Level 2 in the hierarchy.
When independent prices are unavailable or unreliable, debt securities may be valued utilizing pricing matrices which consider similar factors that would be used by independent pricing services. These are generally categorized as Level 2 in the hierarchy but may be Level 3 depending on the circumstances.
Futures contracts are valued at the settlement price established each day by the board of trade or exchange on which they are traded and are categorized as Level 1 in the hierarchy.
If a market value cannot be determined for a security using the methodologies described above, or if, in the good faith opinion of the Advisor, the market value does not constitute a readily available market quotation, or if a significant event has occurred that would materially affect the value of the security, the security will be fair valued as determined in good faith by the Valuation Committee.
The Valuation Committee considers a number of factors, including significant unobservable valuation inputs when arriving at fair value. It considers all significant facts that are reasonably available and relevant to the determination of fair value.
The Valuation Committee primarily employs a market-based approach which may use related or comparable assets or liabilities, recent transactions, market multiples, book values, and other relevant information for the investment to determine the fair value of the investment. When more appropriate, the fund may employ an income-based or cost approach. An income-based valuation approach discounts anticipated future cash flows of the investment to calculate a present amount (discounted). The measurement is based on the value indicated by current market expectations about those future amounts. Discounts may also be applied due to the nature or duration of any restrictions on the disposition of the investments. A cost based approach is based on the amount that currently would be required to replace the service capacity of an asset (current replacement cost). From the seller’s perspective, the price that
24 www.calvert.com CALVERT ULTRA-SHORT INCOME FUND SEMI-ANNUAL REPORT (UNAUDITED)
would be received for the asset is determined based on the cost to a buyer to acquire or construct a substitute asset of comparable utility, adjusted for obsolescence.
The values assigned to fair value investments are based on available information and do not necessarily represent amounts that might ultimately be realized. Further, due to the inherent uncertainty of valuations of such investments, the fair values may differ significantly from the values that would have been used had an active market existed, and the differences could be material. The Valuation Committee employs various methods for calibrating these valuation approaches including a regular review of key inputs and assumptions, transactional back-testing or disposition analysis and reviews of any related market activity.
At March 31, 2015, no securities were fair valued in good faith under the direction of the Board.
The following table summarizes the market value of the Fund’s holdings as of March 31, 2015, based on the inputs used to value them:
|
| | | | | | | | | | | | | | |
| | VALUATION INPUTS |
INVESTMENTS IN SECURITIES* | LEVEL 1 | | LEVEL 2 | | LEVEL 3 | | TOTAL |
| Asset-backed securities | — |
| |
| $260,621,275 |
| | — |
| |
| $260,621,275 |
|
| Collateralized mortgage-backed obligations | — |
| | 20,173,288 |
| | — |
| | 20,173,288 |
|
| Commercial mortgage-backed securities | — |
| | 119,581,975 |
| | — |
| | 119,581,975 |
|
| Corporate debt | — |
| | 334,554,427 |
| | — |
| | 334,554,427 |
|
| Municipal obligations | — |
| | 4,200,000 |
| | — |
| | 4,200,000 |
|
| Other debt obligations | — |
| | 18,585,245 |
| | — |
| | 18,585,245 |
|
| TOTAL | — |
| |
| $757,716,210 |
| | — |
| |
| $757,716,210 |
|
| Other financial instruments** |
| ($181,395 | ) | | — |
| | — |
| |
| ($181,395 | ) |
| | | | | | | | |
* For a complete listing of investments, please refer to the Statement of Net Assets. ** Other financial instruments are derivative instruments not reflected in the Total Investments in the Statement of Net Assets, such as futures, which are valued at the unrealized appreciation/depreciation of the instrument. |
Loan Participations and Assignments: The Fund may invest in direct debt instruments which are interests in amounts owed to lenders or lending syndicates by corporate, governmental, or other borrowers. A Fund’s investments in loans may be in the form of participations in loans or assignments of all or a portion of loans from third parties. A loan is often administered by a bank or other financial institution (the “lender”) that acts as agent for all holders. The agent administers the terms of the loan, as specified in the loan agreement. A Fund may invest in multiple series or tranches of a loan, which may have varying terms and carry different associated risks. A Fund generally has no right to enforce compliance with the terms of the loan agreement with the borrower. As a result, a Fund may be subject to the credit risk of both the borrower and the lender that is selling the loan agreement. When a Fund purchases assignments from lenders it acquires direct rights against the borrower of the loan. When investing in a loan participation, a Fund has the right to receive payments of principal, interest and any fees to which it is entitled only from the lender selling the loan agreement and only upon receipt of payments by the lender from the borrower.
www.calvert.com CALVERT ULTRA-SHORT INCOME FUND SEMI-ANNUAL REPORT (UNAUDITED) 25
Futures Contracts: The Fund may purchase and sell futures contracts, but only when, in the judgment of the Advisor, such a position acts as a hedge. The Fund may not enter into futures contracts for the purpose of speculation or leverage. These futures contracts may include, but are not limited to, futures contracts based on U.S. Government obligations. The Fund is subject to interest rate risk in the normal course of pursuing its investment objectives and may use futures contracts to hedge against changes in interest rates. The Fund may enter into futures contracts agreeing to buy or sell a financial instrument for a set price at a future date. Initial margin deposits of either cash or securities as required by the broker are made upon entering into the contract. While the contract is open, daily variation margin payments are made to or received from the broker reflecting the daily change in market value of the contract and are recorded for financial reporting purposes as unrealized gains or losses by the Fund. When a futures contract is closed, a realized gain or loss is recorded equal to the difference between the opening and closing value of the contract. The risks associated with entering into futures contracts may include the possible illiquidity of the secondary market which would limit the Fund’s ability to close out a futures contract prior to the settlement date, an imperfect correlation between the value of the contracts and the underlying financial instruments, or that the counterparty will fail to perform its obligations under the contracts’ terms. Futures contracts are designed by boards of trade which are designated “contracts markets” by the Commodities Futures Trading Commission. Futures contracts trade on the contracts markets in a manner that is similar to the way a stock trades on a stock exchange and the boards of trade, through their clearing corporations, guarantee the futures contracts against default. As a result, there is minimal counterparty credit risk to the Fund. During the period, the Fund used U.S. Treasury Notes futures contracts to hedge against interest rate changes and to manage overall duration of the Fund. The Fund’s futures contracts at period end are presented in the Statement of Net Assets.
During the period, the Fund invested in 2 year and 5 year U.S. Treasury Notes futures. The volume of outstanding contracts has varied throughout the period with a weighted average of 80 contracts and $18,203,700 weighted average notional value.
Short Sales: The Fund may use a hedging technique that involves short sales of U.S. Treasury securities for the purposes of managing the duration of the Fund. Any short sales are “covered” with an equivalent amount of high-quality, liquid securities.
Security Transactions and Net Investment Income: Security transactions are accounted for on trade date. Realized gains and losses are recorded on an identified cost basis and may include proceeds from litigation. Interest income, which includes amortization of premium and accretion of discount on debt securities, is accrued as earned. Debt obligations may be placed on non-accrual status and related interest income may be reduced by ceasing current accruals and writing off interest receivables when the collection of all or a portion of interest has become doubtful based on consistently applied procedures. A debt obligation may be removed from non-accrual status when the issuer resumes interest payments or when collectability of interest is reasonably assured. The Fund earns certain fees in connection with its floating rate loan purchasing activities. These fees are in addition to interest payments earned and may include amendment fees, consent fees and prepayment fees. Investment income and realized and unrealized gains and losses are allocated to separate classes of shares based upon the relative net assets of each class. Expenses arising in connection with a specific class are charged directly to that class. Expenses common to the classes are allocated to each class in proportion to their relative net assets.
26 www.calvert.com CALVERT ULTRA-SHORT INCOME FUND SEMI-ANNUAL REPORT (UNAUDITED)
Distributions to Shareholders: Distributions to shareholders are recorded by the Fund on ex-dividend date. Dividends from net investment income are paid monthly. Distributions from net realized capital gains, if any, are paid at least annually. Distributions are determined in accordance with income tax regulations which may differ from generally accepted accounting principles; accordingly, periodic reclassifications are made within the Fund’s capital accounts to reflect income and gains available for distribution under income tax regulations.
Estimates: The preparation of financial statements in conformity with accounting principles generally accepted in the United States requires management to make estimates and assumptions that affect the reported amounts of assets and liabilities and disclosure of contingent assets and liabilities at the date of the financial statements and the reported amounts of income and expenses during the reported period. Actual results could differ from those estimates.
Redemption Fees: The Fund charges a 2% redemption fee on redemptions, including exchanges, made within 7 days of purchase in the same Fund. The redemption fee is accounted for as an addition to paid-in capital and is intended to discourage market-timers by ensuring that short-term trading costs are borne by the investors making the transactions and not the shareholders already in the Fund. This Fee was eliminated effective February 2, 2015.
Federal Income Taxes: No provision for federal income or excise tax is required since the Fund intends to continue to qualify as a regulated investment company under the Internal Revenue Code and to distribute substantially all of its taxable earnings.
Management has analyzed the Fund’s tax positions taken for all open federal income tax years and has concluded that no provision for federal income tax is required in the Fund’s financial statements. A Fund’s federal tax return is subject to examination by the Internal Revenue Service for a period of three years.
NOTE B — RELATED PARTY TRANSACTIONS
Calvert Investment Management, Inc. (the “Advisor”) is wholly-owned by Calvert Investments, Inc., which is indirectly wholly-owned by Ameritas Mutual Holding Company. The Advisor provides investment advisory services and pays the salaries and fees of officers and Trustees of the Fund who are employees of the Advisor or its affiliates. For its services, the Advisor receives a monthly fee based on an annual rate of .30% of the first $1 billion of the Fund’s average daily net assets and .29% of all assets above $1 billion. Under the terms of the agreement, $192,397 was payable at period end.
The Advisor has contractually agreed to limit net annual fund operating expenses through January 31, 2016. The contractual expense caps are .89%, .50%, and .84% for Class A, I, and Y, respectively. For the purpose of this expense limit, operating expenses do not include interest expense, brokerage commissions, taxes, and extraordinary expenses. This expense limitation does not limit acquired fund fees and expenses, if any. At period end, $80,337 was receivable from the Advisor.
Calvert Investment Administrative Services, Inc., an affiliate of the Advisor, provides administrative services to the Fund for an annual fee, payable monthly, of .25% of the average daily net assets of Classes A and Y. Class I shares pay an annual rate of .10%, based on their average daily net assets. Under the terms of the agreement, $160,146 was payable at period end.
Calvert Investment Distributors, Inc. (“CID”), an affiliate of the Advisor, is the distributor and principal underwriter for the Fund. Pursuant to Rule 12b-1 under the Investment Company Act of 1940, the Fund has adopted a Distribution Plan that permits the Fund to pay certain
www.calvert.com CALVERT ULTRA-SHORT INCOME FUND SEMI-ANNUAL REPORT (UNAUDITED) 27
expenses associated with the distribution and servicing of its shares. The expenses paid may not exceed .50% annually of the Fund’s average daily net assets of Class A. The amount actually paid by the Fund is an annualized fee, payable monthly, of .25% of the average daily net assets of Class A. Class I and Y shares do not have Distribution Plan expenses. Under the terms of the agreement, $117,713 was payable at period end.
CID received $8,730 as its portion of the commissions charged on sales of the Fund’s Class A shares for the six months ended March 31, 2015.
Calvert Investment Services, Inc. (“CIS”), an affiliate of the Advisor, is the shareholder servicing agent for the Fund. For its services, CIS received a fee of $50,567 for the six months ended March 31, 2015. Under the terms of the agreement, $7,757 was payable at period end. Boston Financial Data Services, Inc. is the transfer and dividend disbursing agent.
Each Trustee of the Fund who is not an employee of the Advisor or its affiliates receives an annual retainer of $45,000 plus up to $2,000 for each regular Board and Committee meeting attended. The Board chair and Committee chairs each receive an additional $5,000 annual retainer. Trustees’ fees are allocated to each of the funds served.
NOTE C — INVESTMENT ACTIVITY AND TAX INFORMATION
During the period, the cost of purchases and proceeds from sales of investments, other than short-term and U.S. government securities, were $341,951,388 and $398,911,705, respectively. U.S. government security purchases and sales were $5,405,238 and $5,429,864, respectively.
The Fund may purchase securities, typically short-term variable rate demand notes, from or sell to other funds managed by the Advisor. These interportfolio transactions are primarily used for cash management purposes and are made pursuant to Rule 17a-7 of the Investment Company Act of 1940. For the six months ended March 31, 2015, such purchase and sales transactions were $37,551,406 and $43,860,000, respectively. There were no gains or losses on these sale transactions.
|
| | | |
CAPITAL LOSS CARRYFORWARD | |
| |
EXPIRATION DATE | |
| 30-Sep-17 |
| ($4,366 | ) |
| 30-Sep-18 | (348 | ) |
| |
| No Expiration Date | |
| Short-term |
| ($1,258,914 | ) |
Under the Regulated Investment Company Modernization Act of 2010, capital losses incurred in taxable years beginning after December 22, 2010 can be carried forward to offset future capital gains for an unlimited period. These losses are required to be utilized prior to the losses incurred in pre-enactment taxable years and will retain their character as either long-term or short-term. Losses incurred in pre-enactment taxable years can be utilized until expiration. The Fund’s use of net capital losses acquired from reorganizations may be limited under certain tax provisions.
28 www.calvert.com CALVERT ULTRA-SHORT INCOME FUND SEMI-ANNUAL REPORT (UNAUDITED)
As of March 31, 2015, the tax basis components of unrealized appreciation/(depreciation) and the federal tax cost were as follows:
|
| | | |
| Unrealized appreciation |
| $2,228,018 |
|
| Unrealized (depreciation) | (979,729 | ) |
| Net unrealized appreciation/(depreciation) |
| $1,248,289 |
|
| | |
| Federal income tax cost of investments |
| $756,467,921 |
|
NOTE D — LINE OF CREDIT
A financing agreement is in place with the Calvert Funds and State Street Corporation (“SSC”). Under the agreement, SSC provides an unsecured line of credit facility, in the aggregate amount of $50 million ($25 million committed and $25 million uncommitted), accessible by the Funds for temporary or emergency purposes only. Borrowings bear interest at the higher of the London Interbank Offered Rate (LIBOR) or the overnight Federal Funds Rate plus 1.25% per annum. A commitment fee of .125% per annum is incurred on the unused portion of the committed facility, which is allocated to all participating funds. The Fund had no borrowings under the agreement during the six months ended March 31, 2015.
NOTE E — REORGANIZATIONS
On June 4, 2013, the Board of Trustees approved an Agreement and Plan of Reorganization (the “Plan”), providing for the transfer of all of the assets of Calvert First Government Money Market Fund (“First Government”) and Calvert Tax-Free Reserves Money Market Portfolio (“Tax-Free”) in exchange for Class A shares of the acquiring portfolio, Calvert Ultra-Short Income Fund (“Ultra-Short”), and the assumption of the liabilities of First Government and Tax-Free. Shareholders approved the Plan at a meeting on September 20, 2013.
The reorganization of First Government took place on October 25, 2013.
The acquisition was accomplished by a tax-free exchange of the following shares:
|
| | | | | |
MERGED PORTFOLIO | SHARES | ACQUIRING PORTFOLIO | SHARES | VALUE |
| First Government, Class O | 52,046,075 |
| Ultra-Short, Class A | 3,342,715 | $52,057,073 |
| First Government, Class B | 680,349 |
| Ultra-Short, Class A | 43,696 | $680,520 |
| First Government, Class C | 1,752,620 |
| Ultra-Short, Class A | 112,564 | $1,752,866 |
For financial reporting purposes, assets received and shares issued by Ultra-Short were recorded at fair value; however, the cost basis of the investments received from First Government was carried forward to align ongoing reporting of Ultra-Short’s realized and unrealized gains and losses with amounts distributable to shareholders for tax purposes.
The net assets and net unrealized appreciation (depreciation) immediately before the acquisitions were as follows:
|
| | | | |
MERGED PORTFOLIO | NET ASSETS | UNREALIZED APPRECIATION (DEPRECIATION) | ACQUIRING PORTFOLIO | NET ASSETS |
| First Government | $54,490,459 | $— | Ultra-Short | $671,008,816 |
www.calvert.com CALVERT ULTRA-SHORT INCOME FUND SEMI-ANNUAL REPORT (UNAUDITED) 29
Assuming the acquisition had been completed on October 1, 2013, Ultra-Short’s results of operations for the year ended September 30, 2014 would have been as follows:
|
| | | |
| Net investment income | $5,529,124 (a) |
|
| Net realized and change in unrealized gain (loss) on investments | $2,407,990 (b) |
|
| Net increase (decrease) in assets from operations |
| $7,937,114 |
|
| | |
| (a) $5,523,318 as reported, plus $5,806 from pre-merger First Government. |
| (b) $2,407,830 as reported, plus $160 from pre-merger First Government. |
Because Ultra-Short and First Government sold and redeemed shares throughout the period, it is not practicable to provide pro-forma information on a per-share basis.
Because the combined investment portfolios have been managed as a single integrated portfolio since the acquisition was completed, it is also not practicable to separate the amounts of revenue and earnings of First Government that have been included in Ultra-Short’s Statement of Operations since October 25, 2013.
The reorganization of Tax-Free took place on November 15, 2013.
The acquisition was accomplished by a tax-free exchange of the following shares:
|
| | | | |
MERGED PORTFOLIO | SHARES | ACQUIRING PORTFOLIO | SHARES | VALUE |
| Tax-Free | $191,354,400 | Ultra-Short, Class A | 12,282,054 | $191,323,748 |
For financial reporting purposes, assets received and shares issued by Ultra-Short were recorded at fair value; however, the cost basis of the investments received from Tax-Free was carried forward to align ongoing reporting of Ultra-Short’s realized and unrealized gains and losses with amounts distributable to shareholders for tax purposes.
The net assets and net unrealized appreciation (depreciation) immediately before the acquisitions were as follows:
|
| | | | |
MERGED PORTFOLIO | NET ASSETS | UNREALIZED APPRECIATION (DEPRECIATION) | ACQUIRING PORTFOLIO | NET ASSETS |
| Tax-Free | $191,323,748 | $— | Ultra-Short | $742,407,242 |
Assuming the acquisition had been completed on October 1, 2013, Ultra-Short’s results of operations for the year ended September 30, 2014 would have been as follows:
|
| | | |
| Net investment income | $5,547,407 (a) |
|
| Net realized and change in unrealized gain (loss) on investments | $2,408,449 (b) |
|
| Net increase (decrease) in assets from operations |
| $7,955,856 |
|
| | |
| (a) $5,523,318 as reported, plus $24,089 from pre-merger Tax-Free. |
| (b) $2,407,830 as reported, plus $619 from pre-merger Tax-Free. |
30 www.calvert.com CALVERT ULTRA-SHORT INCOME FUND SEMI-ANNUAL REPORT (UNAUDITED)
Because Ultra-Short and Tax-Free sold and redeemed shares throughout the period, it is not practicable to provide pro-forma information on a per-share basis.
Because the combined investment portfolios have been managed as a single integrated portfolio since the acquisition was completed, it is also not practicable to separate the amounts of revenue and earnings of Tax-Free that have been included in Ultra-Short’s Statement of Operations since November 15, 2013.
NOTE F — SUBSEQUENT EVENTS
In preparing the financial statements as of March 31, 2015, no subsequent events or transactions occurred that would have required recognition or disclosure in these financial statements.
www.calvert.com CALVERT ULTRA-SHORT INCOME FUND SEMI-ANNUAL REPORT (UNAUDITED) 31
FINANCIAL HIGHLIGHTS
|
| | | | | | | | | | | |
| | | PERIODS ENDED | |
CLASS A SHARES | MARCH 31, 2015 (z) | | SEPTEMBER 30, 2014 (z) | | SEPTEMBER 30, 2013 (z) |
| Net asset value, beginning |
| $15.59 |
| |
| $15.55 |
| |
| $15.54 |
|
| Income from investment operations: | | | | | |
| Net investment income | .05 |
| | .10 |
| | .10 |
|
| Net realized and unrealized gain (loss) | (.02 | ) | | .04 |
| | .05 |
|
| Total from investment operations | .03 |
| | .14 |
| | .15 |
|
| Distributions from: | | | | | |
| Net investment income | (.05 | ) | | (.10 | ) | | (.14 | ) |
| Net realized gain | — |
| | — |
| | — |
|
| Total distributions | (.05 | ) | | (.10 | ) | | (.14 | ) |
| Total increase (decrease) in net asset value | (.02 | ) | | .04 |
| | .01 |
|
| Net asset value, ending |
| $15.57 |
| |
| $15.59 |
| |
| $15.55 |
|
| | | | | | |
| Total return* | .18 | % | | .92 | % | | .96 | % |
Ratios to average net assets: A | | | | | |
| Net investment income | .60% (a) |
| | .62 | % | | .67 | % |
| Total expenses | 1.03% (a) |
| | 1.04 | % | | 1.02 | % |
| Expenses before offsets | .89% (a) |
| | .79 | % | | .89 | % |
| Net expenses | .89% (a) |
| | .79 | % | | .89 | % |
| Portfolio turnover | 46 | % | | 154 | % | | 223 | % |
| Net assets, ending (in thousands) |
| $549,840 |
| |
| $624,968 |
| |
| $535,029 |
|
| | | | | | |
|
| | | | | | | | | | | |
| | | | YEARS ENDED | | |
CLASS A SHARES | SEPTEMBER 30, 2012 | | SEPTEMBER 30, 2011 | | SEPTEMBER 30, 2010 |
| Net asset value, beginning |
| $15.41 |
| |
| $15.77 |
| |
| $15.58 |
|
| Income from investment operations: | | | | | |
| Net investment income | .15 |
| | .22 |
| | .21 |
|
| Net realized and unrealized gain (loss) | .22 |
| | (.19 | ) | | .27 |
|
| Total from investment operations | .37 |
| | .03 |
| | .48 |
|
| Distributions from: | | | | | |
| Net investment income | (.24 | ) | | (.31 | ) | | (.20 | ) |
| Net realized gain | — |
| | (.08 | ) | | (.09 | ) |
| Total distributions | (.24 | ) | | (.39 | ) | | (.29 | ) |
| Total increase (decrease) in net asset value | .13 |
| | (.35 | ) | | .19 |
|
| Net asset value, ending |
| $15.54 |
| |
| $15.41 |
| |
| $15.77 |
|
| | | | | | |
| Total return* | 2.45 | % | | .23 | % | | 3.07 | % |
Ratios to average net assets: A | | | | | |
| Net investment income | 1.03 | % | | 1.31 | % | | 1.46 | % |
| Total expenses | 1.05 | % | | 1.06 | % | | 1.08 | % |
| Expenses before offsets | .89 | % | | .89 | % | | .89 | % |
| Net expenses | .89 | % | | .89 | % | | .89 | % |
| Portfolio turnover | 210 | % | | 208 | % | | 268 | % |
| Net assets, ending (in thousands) |
| $329,197 |
| |
| $383,102 |
| |
| $241,254 |
|
| See notes to financial highlights. |
32 www.calvert.com CALVERT ULTRA-SHORT INCOME FUND SEMI-ANNUAL REPORT (UNAUDITED)
FINANCIAL HIGHLIGHTS
|
| | | | | | | | | |
| | PERIODS ENDED | |
CLASS I SHARES | MARCH 31, 2015 (z) | | SEPTEMBER 30, 2014 (z) ^^ | | |
| Net asset value, beginning |
| $15.60 |
| |
| $15.58 |
| | |
| Income from investment operations: | | | | | |
| Net investment income | .09 |
| | .09 |
| | |
| Net realized and unrealized gain (loss) | (.04 | ) | | .02 |
| | |
| Total from investment operations | .05 |
| | .11 |
| | |
| Distributions from: | | | | | |
| Net investment income | (.07 | ) | | (.09 | ) | | |
| Net realized gain | — |
| | — |
| | |
| Total distributions | (.07 | ) | | (.09 | ) | | |
| Total increase (decrease) in net asset value | (.02 | ) | | .02 |
| | |
| Net asset value, ending |
| $15.58 |
| |
| $15.60 |
| | |
| | | | | | |
| Total return* | .34 | % | | .73 | % | | |
Ratios to average net assets: A | | | | | |
| Net investment income | 1.04% (a) |
| | .90% (a) |
| | |
| Total expenses | 1.80% (a) |
| | 1,629.57% (a) |
| | |
| Expenses before offsets | .50% (a) |
| | .50% (a) |
| | |
| Net expenses | .50% (a) |
| | .50% (a) |
| | |
| Portfolio turnover | 46 | % | | 154 | % | | |
| Net assets, ending (in thousands) |
| $1,447 |
| |
| $2 |
| | |
| | | | | | |
|
| | | | | |
| | | | | | |
| | | | | | |
| | | | | | |
| | | | | | |
| | | | | | |
| | | | | | |
| | | | | | |
| | | | | | |
| | | | | | |
| | | | | | |
| | | | | | |
| | | | | | |
| | | | | | |
| | | | | | |
| | | | | | |
| | | | | | |
| | | | | | |
| | | | | | |
| | | | | | |
| | | | | | |
| | | | | | |
| | | | | | |
| See notes to financial highlights. |
www.calvert.com CALVERT ULTRA-SHORT INCOME FUND SEMI-ANNUAL REPORT (UNAUDITED) 33
FINANCIAL HIGHLIGHTS
|
| | | | | | | | | | | |
| | | PERIODS ENDED | |
CLASS Y SHARES | MARCH 31, 2015 (z) | | SEPTEMBER 30, 2014 (z) | | SEPTEMBER 30, 2013 (z) |
| Net asset value, beginning |
| $15.64 |
| |
| $15.60 |
| |
| $15.58 |
|
| Income from investment operations: | | | | | |
| Net investment income | .07 |
| | .12 |
| | .14 |
|
| Net realized and unrealized gain (loss) | (.02 | ) | | .04 |
| | .05 |
|
| Total from investment operations | .05 |
| | .16 |
| | .19 |
|
| Distributions from: | | | | | |
| Net investment income | (.07 | ) | | (.12 | ) | | (.17 | ) |
| Net realized gain | — |
| | — |
| | — |
|
| Total distributions | (.07 | ) | | (.12 | ) | | (.17 | ) |
| Total increase (decrease) in net asset value | (.02 | ) | | .04 |
| | .02 |
|
| Net asset value, ending |
| $15.62 |
| |
| $15.64 |
| |
| $15.60 |
|
| | | | | | |
| Total return* | .30 | % | | 1.04 | % | | 1.26 | % |
Ratios to average net assets: A | | | | | |
| Net investment income | .83% (a) |
| | .75 | % | | .88 | % |
| Total expenses | .66% (a) |
| | .67 | % | | .66 | % |
| Expenses before offsets | .66% (a) |
| | .67 | % | | .66 | % |
| Net expenses | .66% (a) |
| | .67 | % | | .66 | % |
| Portfolio turnover | 46 | % | | 154 | % | | 223 | % |
| Net assets, ending (in thousands) |
| $198,159 |
| |
| $220,243 |
| |
| $154,605 |
|
| | | | | | |
|
| | | | | | | | | | | |
| | | PERIODS ENDED
| |
CLASS Y SHARES | SEPTEMBER 30, 2012 | | SEPTEMBER 30, 2011 | | SEPTEMBER 30, 2010 ^ |
| Net asset value, beginning |
| $15.46 |
| |
| $15.81 |
| |
| $15.67 |
|
| Income from investment operations: | | | | | |
| Net investment income | .20 |
| | .26 |
| | .07 |
|
| Net realized and unrealized gain (loss) | .20 |
| | (.19 | ) | | .14 |
|
| Total from investment operations | .40 |
| | .07 |
| | .21 |
|
| Distributions from: | | | | | |
| Net investment income | (.28 | ) | | (.34 | ) | | (.07 | ) |
| Net realized gain | — |
| | (.08 | ) | | — |
|
| Total distributions | (.28 | ) | | (.42 | ) | | (.07 | ) |
| Total increase (decrease) in net asset value | .12 |
| | (.35 | ) | | .14 |
|
| Net asset value, ending |
| $15.58 |
| |
| $15.46 |
| |
| $15.81 |
|
| | | | | | |
| Total return* | 2.61 | % | | .47 | % | | 1.35 | % |
Ratios to average net assets: A | | | | | |
| Net investment income | 1.26 | % | | 1.47 | % | | 1.69% (a) |
|
| Total expenses | .67 | % | | .67 | % | | .75% (a) |
|
| Expenses before offsets | .67 | % | | .67 | % | | .75% (a) |
|
| Net expenses | .67 | % | | .67 | % | | .75% (a) |
|
| Portfolio turnover | 210 | % | | 208 | % | | 62 | % |
| Net assets, ending (in thousands) |
| $81,789 |
| |
| $85,987 |
| |
| $37,270 |
|
| See notes to financial highlights. |
34 www.calvert.com CALVERT ULTRA-SHORT INCOME FUND SEMI-ANNUAL REPORT (UNAUDITED)
|
|
A Total expenses do not reflect amounts reimbursed and/or waived by the Advisor or reductions from expense offset arrangements. Expenses before offsets reflect expenses after reimbursement and/or waiver by the Advisor but prior to reductions from expense offset arrangements. Net expenses are net of all reductions and represent the net expenses paid by the Fund. (a) Annualized. (z) Per share figures are calculated using the Average Shares Method. * Total return is not annualized for periods of less than one year and does not reflect deduction of any front-end or deferred sales charge. ^ From May 28, 2010 inception. ^^ From January 31, 2014 inception. See notes to financial statements. |
www.calvert.com CALVERT ULTRA-SHORT INCOME FUND SEMI-ANNUAL REPORT (UNAUDITED) 35
EXPLANATION OF FINANCIAL TABLES
SCHEDULE OF INVESTMENTS
The Schedule of Investments is a snapshot of all securities held in the fund at their market value, on the last day of the reporting period. Securities are listed by asset type (e.g., common stock, corporate bonds, U.S. government obligations) and may be further broken down into sub-groups and by industry classification.
STATEMENT OF ASSETS AND LIABILITIES
The Statement of Assets and Liabilities is often referred to as the fund’s balance sheet. It lists the value of what the fund owns, is due and owes on the last day of the reporting period. The fund’s assets include the market value of securities owned, cash, receivables for securities sold and shareholder subscriptions, and receivables for dividends and interest payments that have been earned, but not yet received. The fund’s liabilities include payables for securities purchased and shareholder redemptions, and expenses owed but not yet paid. The statement also reports the fund’s net asset value (NAV) per share on the last day of the reporting period. The NAV is calculated by dividing the fund’s net assets (assets minus liabilities) by the number of shares outstanding. This statement is accompanied by a Schedule of Investments. Alternatively, if certain conditions are met, a Statement of Net Assets may be presented in lieu of this statement and the Schedule of Investments.
STATEMENT OF NET ASSETS
The Statement of Net Assets provides a detailed list of the fund’s holdings, including each security’s market value on the last day of the reporting period. The Statement of Net Assets includes a Schedule of Investments. Other assets are added and other liabilities subtracted from the investments total to calculate the fund’s net assets. Finally, net assets are divided by the outstanding shares of the fund to arrive at its share price, or Net Asset Value (NAV) per share.
At the end of the Statement of Net Assets is a table displaying the composition of the fund’s net assets. Paid in Capital is the money invested by shareholders and represents the bulk of net assets. Undistributed Net Investment Income and Accumulated Net Realized Gains usually approximate the amounts the fund had available to distribute to shareholders as of the statement date. Accumulated Realized Losses will appear as negative balances. Unrealized Appreciation (Depreciation) is the difference between the market value of the fund’s investments and their cost, and reflects the gains (losses) that would be realized if the fund were to sell all of its investments at their statement-date -values.
STATEMENT OF OPERATIONS
The Statement of Operations summarizes the fund’s investment income earned and expenses incurred in operating the fund. Investment income includes dividends earned from stocks and interest earned from interest-bearing securities in the fund. Expenses incurred in operating the fund include the advisory fee paid to the investment advisor, administrative services fees, distribution plan expenses (if applicable), transfer agent fees, shareholder servicing expenses, custodial, legal, and audit fees, and the printing and postage expenses related to shareholder reports. Expense offsets (fees paid indirectly) may also be shown. Credits earned from offset arrangements are used to reduce the fund’s expenses. This statement also shows net gains (losses) realized on the sale of investments and the increase or decrease in the unrealized appreciation (depreciation) on investments held during the period.
36 www.calvert.com CALVERT ULTRA-SHORT INCOME FUND SEMI-ANNUAL REPORT (UNAUDITED)
STATEMENT OF CHANGES IN NET ASSETS
The Statement of Changes in Net Assets shows how the fund’s total net assets changed during the two most recent reporting periods. Changes in the fund’s net assets are attributable to investment operations, distributions and capital share transactions.
The Operations section of the report summarizes information detailed in the Statement of Operations. The Distribution section shows the dividend and capital gain distributions made to shareholders. The amounts shown as distributions in this section may not match the net investment income and realized gains amounts shown in the Operations section because distributions are determined on a tax basis and certain investments or transactions may be treated differently for financial statement and tax purposes. The Capital Share Transactions section shows the amount shareholders invested in the fund, either by purchasing shares or by reinvesting distributions, and the amounts redeemed. The corresponding numbers of shares issued, reinvested and redeemed are shown at the end of the report.
FINANCIAL HIGHLIGHTS
The Financial Highlights table provides a per-share breakdown per class of the components that affect the fund’s net asset value for current and past reporting periods. The table provides total return, total distributions, expense ratios, portfolio turnover and net assets for the applicable period. Total return is a measure of a fund’s performance that encompasses all elements of return: dividends, capital gain distributions and changes in net asset value. Total return is the change in value of an investment over a given period, assuming reinvestment of any dividends and capital gain distributions, expressed as a percentage of the initial investment. Total distributions include distributions from net investment income and net realized gains. Long-term gains are earned on securities held in the fund more than one year. Short-term gains, on the sale of securities held less than one year, are treated as ordinary dividend income for tax purposes. The expense ratio is a fund’s cost of doing business, expressed as a percentage of net assets. These expenses directly reduce returns to shareholders. Portfolio turnover measures the trading activity in a fund’s investment portfolio—how often securities are bought and sold by a fund. Portfolio turnover is affected by market conditions, changes in the size of the fund, the nature of the fund’s investments and the investment style of the portfolio manager.
PROXY VOTING
The Proxy Voting Guidelines of the Calvert Funds that the Fund uses to determine how to vote proxies relating to portfolio securities are provided as an Appendix to the Fund’s Statement of Additional Information. The Statement of Additional Information can be obtained free of charge by calling the Fund at 1-800-368-2745, by visiting the Calvert website at www.calvert.com; or by visiting the SEC’s website at www.sec.gov.
Information regarding how the Fund voted proxies relating to portfolio securities during the most recent 12-month period ended June 30 is available on the Fund’s website at www.calvert.com and on the SEC’s website at www.sec.gov.
AVAILABILITY OF QUARTERLY PORTFOLIO HOLDINGS
The Fund files its complete schedule of portfolio holdings with the SEC for the first and third quarters of each fiscal year on Form N-Q. The Fund’s Form N-Q is available on the SEC’s website at www.sec.gov. The Fund’s Form N-Q may be reviewed and copied at the SEC’s Public Reference Room in Washington, DC; information on the operation of the Public Reference Room may be obtained by calling 1-800-SEC-0330.
www.calvert.com CALVERT ULTRA-SHORT INCOME FUND SEMI-ANNUAL REPORT (UNAUDITED) 37
BASIS FOR BOARD’S APPROVAL OF INVESTMENT ADVISORY CONTRACT
At a meeting held on December 10, 2014, the Board of Trustees, and by a separate vote, the disinterested Trustees, approved the continuance of the Investment Advisory Agreement between The Calvert Fund and the Advisor with respect to the Fund.
In evaluating the Investment Advisory Agreement, the Board considered a variety of information relating to the Fund and the Advisor. The disinterested Trustees reviewed a report prepared by the Advisor regarding various services provided to the Fund by the Advisor and its affiliates. Such report included, among other data, information regarding the Advisor’s personnel and the Advisor’s revenue and cost of providing services to the Fund, and a separate report prepared by an independent third party, which provided a statistical analysis comparing the Fund’s investment performance, expenses, and fees to comparable mutual funds.
The disinterested Trustees were separately represented by independent legal counsel with respect to their consideration of the reapproval of the Investment Advisory Agreement. Prior to voting, the disinterested Trustees reviewed the proposed continuance of the Investment Advisory Agreement with management and also met in private sessions with their counsel at which no representatives of management were present.
In the course of its deliberations regarding the Investment Advisory Agreement, the Board considered the following factors, among others: the nature, extent and quality of the services provided by the Advisor, including the personnel providing such services; the Advisor’s financial condition; the level and method of computing the Fund’s advisory fee; comparative performance, fee and expense information for the Fund; the profitability of the Calvert Family of Funds to the Advisor and its affiliates; the direct and indirect benefits, if any, derived by the Advisor and its affiliates from their relationship with the Fund; the effect of the Fund’s growth and size on the Fund’s performance and expenses; the affiliated distributor’s process for monitoring sales load breakpoints; the Advisor’s compliance programs and policies; the Advisor’s performance of substantially similar duties for other funds; and any possible conflicts of interest.
In considering the nature, extent and quality of the services provided by the Advisor under the Investment Advisory Agreement, the Board reviewed information provided by the Advisor relating to its operations and personnel, including, among other information, biographical information on the Advisor’s investment, supervisory and professional staff and descriptions of its organizational and management structure. The Board also took into account similar information provided periodically throughout the previous year by the Advisor, as well as the Board’s familiarity with management through Board of Trustees’ meetings, discussions and other reports. The Board considered the Advisor’s management style and its performance in employing its investment strategies, as well as its current level of staffing and overall resources. The Board also noted that it reviewed on a quarterly basis information regarding the Advisor’s compliance with applicable policies and procedures, including those related to personal investing. The Advisor’s administrative capabilities, including its ability to supervise the other service providers for the Fund, were also considered. The Board also took into account the environmental, social, sustainability and governance research and analysis provided by the Advisor to the Fund. The Board observed that the scope of services provided by the Advisor generally had expanded over time as a result of regulatory, market and other changes. The Board took into consideration, among other factors, the effectiveness of the Fund’s and Advisor’s processes, policies and procedures and the Advisor’s personnel. The Board also took into account, among other items, periodic reports received from the Advisor over the past year concerning the Advisor’s ongoing review and enhancement of certain
38 www.calvert.com CALVERT ULTRA-SHORT INCOME FUND SEMI-ANNUAL REPORT (UNAUDITED)
processes, policies and procedures of the Fund and the Advisor. The Board concluded that it was satisfied with the nature, extent and quality of services provided to the Fund by the Advisor under the Investment Advisory Agreement.
In considering the Fund’s performance, the Board noted that it reviewed on a quarterly basis detailed information about the Fund’s performance results, portfolio composition and investment strategies. In addition, the Board took into account overall financial market conditions. The Board also reviewed various comparative data provided to it in connection with its consideration of the renewal of the Investment Advisory Agreement, including, among other information, a comparison of the Fund’s total return with its Lipper index and with that of other mutual funds deemed to be in its peer universe by an independent third party in its report. This comparison indicated that the Fund performed above the median of its peer universe for the one-, three- and five-year periods ended June 30, 2014. The data also indicated that the Fund outperformed its Lipper index for the same one-, three- and five-year periods. Based upon its review, the Board concluded that the Fund’s performance was satisfactory relative to the performance of funds with similar investment objectives and to relevant indices.
In considering the Fund’s fees and expenses, the Board compared the Fund’s fees and total expense ratio with various comparative data for the funds in its peer group. Among other findings, the data indicated that the Fund’s advisory fee (after taking into account waivers and/or reimbursements) was below the median of its peer group and that total expenses (net of waivers and/or reimbursements) were above the median of its peer group. The Board noted that the allocation of advisory and administrative fees may vary among the Fund’s peer group. The Board took into account the Advisor’s current undertaking to maintain expense limitations for the Fund and that the Advisor was reimbursing a portion of the Fund’s expenses. The Board also noted management’s discussion of the Fund’s expenses and certain factors that affected the level of such expenses, including the cost of providing the environmental, social, sustainability and governance research and analysis provided by the Advisor. Based upon its review, the Board concluded that the advisory fee was reasonable in view of the quality of services received by the Fund from the Advisor and the other factors considered.
The Board reviewed the Advisor’s profitability on a fund-by-fund basis. In reviewing the overall profitability of the advisory fee to the Fund’s Advisor, the Board also considered the fact that affiliates of the Advisor provided shareholder servicing, administrative and distribution services to the Fund for which they received compensation. The information considered by the Board included Calvert’s operating profit margin information both before and after tax expenses with respect to the services that the Advisor and its affiliates provided to the Calvert Family of Funds complex. The Board reviewed the profitability of the Advisor’s relationship with the Fund in terms of the total amount of annual advisory fees it received with respect to the Fund and whether the Advisor had the financial wherewithal to continue to provide services to the Fund. The Board noted that the Advisor was reimbursing a portion of the Fund’s expenses. The Board also noted the Advisor’s current undertaking to maintain expense limitations for the Fund. The Trustees also considered that the Advisor derived benefits to its reputation and other indirect benefits from its relationship with the Fund. Based upon its review, the Board concluded that the Advisor’s and its affiliates’ level of profitability from its relationship with the Fund was reasonable.
The Board considered the effect of the Fund’s current size and its potential growth on its performance and fees. The Board took into account that the Fund’s advisory fee schedule contained breakpoints that would reduce the advisory fee rate on assets above specified levels as the Fund’s assets increased. The Board noted that the Fund had not yet reached the
www.calvert.com CALVERT ULTRA-SHORT INCOME FUND SEMI-ANNUAL REPORT (UNAUDITED) 39
specified asset level at which a breakpoint to its advisory fee would be triggered. The Board also noted that if the Fund’s assets increased over time, the Fund might realize other economies of scale if assets increased proportionally more than certain other expenses.
In reapproving the Investment Advisory Agreement, the Board, including the disinterested Trustees, did not identify any single factor as controlling, and each Trustee may have attributed different weight to various factors.
Conclusions
The Board reached the following conclusions regarding the Investment Advisory Agreement, among others: (a) the Advisor has demonstrated that it possesses the capability and resources to perform the duties required of it under the Investment Advisory Agreement; (b) the Advisor maintains appropriate compliance programs; (c) the performance of the Fund is satisfactory relative to the performance of funds with similar investment objectives and to relevant indices; (d) the Advisor is likely to execute its investment strategies consistently over time; and (e) the Fund’s advisory fee is reasonable in view of the quality of services received by the Fund from the Advisor and the other factors considered. Based on its conclusions, the Board determined that reapproval of the Investment Advisory Agreement would be in the best interests of the Fund and its shareholders.
40 www.calvert.com CALVERT ULTRA-SHORT INCOME FUND SEMI-ANNUAL REPORT (UNAUDITED)
This page intentionally left blank.
To Open an Account
800-368-2748
Service for Existing Account
Shareholders: 800-368-2745
Brokers: 800-368-2746
TDD for Hearing Impaired
800-541-1524
Registered Mail
Calvert Investments
c/o BFDS,
P.O. Box 219544
Kansas City, MO 64121-9544
Overnight Mail
Calvert Investments
c/o BFDS,
330 West 9th Street
Kansas City, MO 64105
Web Site
www.calvert.com
Principal Underwriter
Calvert Investment Distributors, Inc.
4550 Montgomery Avenue
Suite 1000 North
Bethesda, Maryland 20814
|
| | | |
CALVERT ULTRA-SHORT INCOME FUND | CALVERT’S FAMILY OF FUNDS | | |
| | Municipal Funds Tax-Free Bond Fund Taxable Bond Funds Bond Portfolio Income Fund Short Duration Income Fund Long-Term Income Fund Ultra-Short Income Fund High Yield Bond Fund Green Bond Fund Unconstrained Bond Fund Balanced and Asset Allocation Funds Balanced Portfolio Conservative Allocation Fund Moderate Allocation Fund Aggressive Allocation Fund | | Equity Funds Large Cap Core Portfolio Equity Portfolio Large Cap Value Fund Social Index Fund Capital Accumulation Fund International Equity Fund Small Cap Fund Global Energy Solutions Fund Global Water Fund International Opportunities Fund Equity Income Fund Emerging Markets Equity Fund |
| | |
This report is intended to provide fund information to shareholders. It is not authorized for distribution to prospective investors unless preceded or accompanied by a prospectus.
Note: The information on our website is not incorporated by reference into this report; our website address is included as an inactive textual reference only.
Investors should carefully consider the investment objectives, risks, charges and expenses of the Calvert Funds. This and other important information is contained in the fund’s summary prospectus and prospectus, which can be obtained from your financial professional and should be read carefully before investing. You may also call Calvert at 800/368-2748 or visit www. calvert.com.
Printed on recycled paper using soy inks.
|
| |
Semi-Annual Report March 31, 2015
E-Delivery Sign-Up — Details Inside | |
Choose Planet-friendly E-delivery!
Sign up now for on-line statements, prospectuses, and fund reports. In less than five minutes you can help reduce paper mail and lower fund costs.
Just go to www.calvert.com. If you already have an online account at Calvert, click on Login, to access your Account, and select the documents you would like to receive via e-mail.
If you’re new to online account access, click on Login, then Register to create your user name and password. Once you’re in, click on the E-delivery sign-up on the Account Portfolio page and follow the quick, easy steps.
Note: if your shares are not held directly at Calvert but through a brokerage firm, you must contact your broker for electronic delivery options available through their firm.
|
| | | |
| TABLE OF CONTENTS |
| | | | |
| | | | President’s Letter |
| | | | Portfolio Management Discussion |
| | | | Shareholder Advocacy Update |
| | | | Shareholder Expense Example |
| | | | Statement of Net Assets |
| | | | Statement of Operations |
| | | | Statements of Changes in Net Assets |
| | | | Notes to Financial Statements |
| | | | Financial Highlights |
| | | | Explanation of Financial Tables |
| | | | Proxy Voting |
| | | | Availability of Quarterly Portfolio Holdings |
| | | | Basis for Board’s Approval of Investment Advisory Contract |
|
| |
| John Streur President and Chief Executive Officer, Calvert Investments, Inc. |
Dear Calvert Shareowner,
The United States economy improved throughout 2014 and into the first quarter of 2015, while major economies in other regions of the world struggled to regain momentum or saw slowing growth. It is still too early to declare victory, but one may say that while the United States led the world into financial crisis nearly eight years ago, the innovative and aggressive responses to the crisis by our policymakers are allowing the United States to recover more quickly. Granted, the United States has the benefit of possessing the world’s reserve currency and our monetary maneuvers in our self-interest are not without cost to economies in other regions.
As 2014 drew to a close, the United States was winding down the quantitative easing portion of its post-crisis monetary policy while the European and Japanese central banks were finding it necessary to increase their own forms of quantitative easing in efforts to support asset prices and spur economic growth.
The impact of modestly improving economic activity in the U.S. and ongoing low global interest rates on financial assets in 2014 created positive returns for most stocks and bonds for the previous 12 months, a condition that gave benefit to most Calvert Funds. The exceptions are assets tied to the price of oil, which collapsed during the second half of the year. Energy industries and natural resource based companies, including renewable energy companies and water related companies, saw their stock valuations drop in reaction.
Across our fixed income and equity strategies, Calvert finds more utility in conducting fundamental research in order to find relative values in securities of individual companies than we do in attempting to anticipate or time changes in global economic indicators. Broadly, we are mindful of the fact that stocks and bonds have benefitted substantially from the easy monetary policies and ultra-low interest rates of the post-crisis era. We believe markets are more or less fairly valued and we have taken steps seeking to moderate the risk across our portfolios.
As I take the helm at Calvert and look back at the 39 years since the firm’s founding in 1976, I note the substantial growth in the world’s population, the massive increase in the industrialization of our global society, and the associated change in the role of corporations in societal and environmental outcomes for our future.
4 www.calvert.com CALVERT GOVERNMENT FUND SEMI-ANNUAL REPORT (UNAUDITED)
Public companies have created tremendous net benefits to society through advances in health care, food systems, energy efficiency, communications and technology, and access to finance and other products and services too vast to detail. Hundreds of millions of people throughout the world have seen their standard of living increased through benefits created by corporate activity.
Along with the obvious net benefits to society, we are aware of the substantial stresses placed upon society and the environment from corporate behaviors. At the same time, society has awarded corporations an increasingly prominent role in the day-to-day outcomes of our lives and in the societal and environmental outcomes that will determine the future direction of the world.
Calvert, as a global investment management firm and a steward of client assets, has a growing and evolving role as a leader in responsible investing. Calvert has a rich history as a socially responsible investor and has made many contributions to public policy and corporate governance. Today we are bringing Calvert’s deep expertise in socially responsible investing, public and private policy work, and investment management to a new level with a focus on developing principles and setting standards for use in our investment management processes, our active ownership and engagement discipline and within our investment risk management processes.
As a long-term investor with unique insights into environmental, social, and governance activities of companies throughout the world, Calvert is able to develop a holistic view of companies’ operations. Our ability to use our insights for the benefit of the stewardship of client assets, both to produce desirable investment outcomes for our clients and to assist companies in evolving their role in society along a responsible path has never been more important.
As fellow shareowners of Calvert Funds, you and I know that it is essential to pursue the type of enduring value that Calvert seeks to create, through excellence in financial results balanced with the evolving needs of society and the environment.
Thank you for your share ownership in Calvert Funds; all of us at Calvert Investments, Inc. appreciate the confidence and trust you have placed in us.
John Streur
April 2015
www.calvert.com CALVERT GOVERNMENT FUND SEMI-ANNUAL REPORT (UNAUDITED) 5
|
| |
| PORTFOLIO MANAGEMENT DISCUSSION |
|
| |
| Catherine Roy, CFA Senior Vice President and Chief Investment Officer, Fixed Income |
Investment Climate
A very divergent economic picture between the United States and much of the rest of the world prompted central bank actions that affected global currencies and drove financial-market returns over the six-month reporting period. The markets also reacted to new information on key geopolitical situations, notably in the Ukraine.
The economic divergence theme was apparent in Europe, which featured consumer price deflation in many countries. China and Japan also experienced slower growth. In the United States, economic growth pulled back from the strong pace set in mid-2014 to a rate more in line with the Fed’s projected long-run average of 2.2%. While modest, this growth rate was superior to that of many other countries. The U.S. headline Consumer Price Index, which measures inflation excluding volatile food and energy prices, became slightly negative towards the end of the reporting period.
In January, the European Central Bank (ECB) announced a long-awaited quantitative easing program, which had significant market impact. In anticipation of the January ECB decision, some other European central banks, as well as Japan and China, increased monetary accommodation through interest-rate cuts and/or expanded bond purchase programs. In stark contrast, the U.S. Federal Reserve prepared markets for a small and slow series of interest-rate increases, slated to start sometime in 2015. The Fed anticipates that extremely low domestic inflation will be transitory, driven by the drop in energy prices, and is not a problem brought on by lack of consumer demand. In addition, the U.S. labor market is relatively strong, which has long been one condition the Fed required to start a slow removal of monetary accommodation.
Big moves in the world’s major currencies were a byproduct of these central bank actions. In the middle of 2014, the U.S. dollar began a sharp climb against other currencies that drove it to multi-year highs. The Bloomberg DXY, an index that measures the dollar against major currencies, appreciated 14.5% over the six-month reporting period. Tightly correlated to the dollar’s rally was a sharp drop in the price of oil—a market set up for a price collapse due to a massive demand-supply imbalance.
Bonds Provided Positive Returns
The global fixed-income markets generally reacted positively to the ECB-led central bank easing. U.S. bond yields gyrated over the reporting period, but at the end tended to be lower and so bond returns were positive.
6 www.calvert.com CALVERT GOVERNMENT FUND SEMI-ANNUAL REPORT (UNAUDITED)
|
| | | | |
| | | | |
| | CALVERT
GOVERNMENT FUND | |
| | MARCH 31, 2015 | |
| | | | |
| | ECONOMIC SECTORS | % OF TOTAL INVESTMENTS | |
| | Corporate | 3.1 | % | |
| | Financial Institutions | 1.2 | % | |
| | Industrial | 1.9 | % | |
| | Government Related | 15.0 | % | |
| | Agency | 13.6 | % | |
| | Supranational | 1.4 | % | |
| | Securitized | 2.8 | % | |
| | Asset-Backed Securities | 0.7 | % | |
| | Collateralized Mortgage Obligations | 0.2 | % | |
| | Commercial Mortgage-Backed Securities | 1.3 | % | |
| | Mortgage-Backed Passthrough | 0.6 | % | |
| | Short-Term Investments | 4.3 | % | |
| | Treasury | 74.8 | % | |
| | Total | 100 | % | |
| | | | |
The ten-year T-note yield fell 58 basis points1 (bps) to 1.94%, while the 30-year fixed-rate mortgage average fell 50 bps to 3.69%. The Barclays U.S. Credit Index average yield declined 18 bps to 2.83%.
In terms of total return, the Barclays Long Credit Index rose 2.24%, the broad intermediate Barclays U.S. Credit Index returned 3.96%, and the shorter-term Barclays 1-5 Year U.S. Credit Index was up 1.48%. The Barclays US Aggregate Index returned 3.43% and the Bank of America Merrill Lynch High Yield Master II Index was little changed, up 1.50%.
Outlook
The United States economy is expanding moderately and has weathered global weakness better than other most other major economies.
|
| | | | | | |
| | | | | |
| | CALVERT
GOVERNMENT FUND | |
| | MARCH 31, 2015 | |
| | | | | |
| | INVESTMENT PERFORMANCE | |
| | (TOTAL RETURN AT NAV*) | |
| | | 6 MONTHS ENDED 3/31/15 | 12 MONTHS ENDED 3/31/15
| |
| | Class A | 2.07 | % | 3.06 | % | |
| | Class C | 1.51 | % | 2.04 | % | |
| | Class I | 2.19 | % | 3.40 | % | |
| | | | | |
| | Barclays U.S. Government Index | 3.49 | % | 5.22 | % | |
| | | | | |
| | Lipper General U.S. Government Funds Average | 3.06 | % | 5.12 | % | |
| | | | | |
| | | 30 DAYS ENDED | |
| | SEC YIELD | 9/30/14 | 3/31/15 | |
| | Class A | 1.07 | % | 0.36 | % | |
| | Class C | 0.13 | % | -0.25 | % | |
| | Class I | 1.42 | % | 0.92 | % | |
| | | |
| | * Investment performance/return at NAV does not reflect the deduction of the Fund’s maximum 3.75% front-end sales charge or any deferred sales charge. | |
| | | | | |
The 5.5% headline unemployment rate is just above the Federal Open Market Commission’s (FOMC) long-term target range. Wage growth is modest but steady. The labor-force participation rate, however, remains low—influenced by demographics and the long-term loss of traditional middle-wage jobs to overseas competition and automation. Workers in general, however, are in improved bargaining positions. The Fed’s benchmark consumer inflation rate hovers around zero, sharply below the 2% target.
Despite another cold winter, U.S. economic growth in 2015 could approach 3% in the absence of a material systemic shock. We expect inflation to continue well below the Fed’s 2% target. Improvement in the labor market should continue, with unemployment
www.calvert.com CALVERT GOVERNMENT FUND SEMI-ANNUAL REPORT (UNAUDITED) 7
below 5.5%. Discord on Capitol Hill promises to add some uncertainty to late-summer debt-ceiling negotiations. Household consumption remains the major engine of growth and should be supported by lower energy prices. Lower energy prices, however, are likely to depress earnings and investment from energy-industry companies and the much-stronger dollar may dampen overall U.S. corporate earnings. Housing-sector activity remains a disappointment, despite very low mortgage rates, and residential mortgage lending remains relatively restrained in the post-crisis market. The U.S. trade situation may deteriorate given continued strength of the dollar, which could drive up import costs.
If U.S. data trends hold, within the context of the global backdrop of disinflation and central bank easing, we expect the Fed to raise short-term interest rates by late 2015. If lift-off is in 2015, however, we expect no more than two quarter-point increases over the balance of the year. If the weaker global picture and price disinflation persist, there is a reasonable chance the Fed will delay any rate increases into 2016.
Over the longer term, we expect the benchmark 10-year T-note yield to fluctuate between 2% and 3%, influenced by the trend in economic data surprises, major central bank forward guidance, expected low global inflation rates, and flows in global fixed-income markets. We expect short-term money markets rates to remain close to zero percent for much of 2015.
Calvert Investment Management, Inc.
April 2015
1. A basis point is 0.01 percentage points.
|
| | | | |
| | | | |
| | CALVERT
GOVERNMENT FUND | |
| | MARCH 31, 2015 | |
| | | | |
| | AVERAGE ANNUAL TOTAL RETURNS | |
| | | | |
| | CLASS A SHARES | (WITH MAX. LOAD) | |
| | One year | -0.81 | % | |
| | Five year | 2.28 | % | |
| | Since inception (12/31/2008) | 3.40 | % | |
| | | | |
| | CLASS C SHARES | (WITH MAX. LOAD) | |
| | One year | 1.04 | % | |
| | Five year | 2.02 | % | |
| | Since inception (12/31/2008) | 3.01 | % | |
| | | | |
| | CLASS I SHARES* | | |
| | One year | 3.40 | % | |
| | Five year | 3.30 | % | |
| | Since inception (12/31/2008) | 2.16 | % | |
| | | | |
| | * Calvert Government Fund first offered Class I shares on April 29, 2011. Performance prior to that date reflects the performance of Class A shares at net asset value (NAV). Actual Class I share performance would have been different. | |
| | | | |
8 www.calvert.com CALVERT GOVERNMENT FUND SEMI-ANNUAL REPORT (UNAUDITED)
Growth of $10,000
The graph below shows the value of a hypothetical $10,000 investment in the Fund over the past 10 fiscal year periods or since inception (for funds without 10-year records). The results shown are for Class A and C shares and reflect the deduction of the maximum front-end Class A sales charge of 3.75%, or deferred sales charge, as applicable and assume the reinvestment of dividends. The result is compared with benchmarks that include a broad based market index and a Lipper peer group average. Market indexes are unmanaged and their results do not reflect the effect of expenses or sales charges. The Lipper average reflects the deduction of the category’s average front-end sales charge. The value of an investment in a different share class would be different.

All performance data shown, including the graph above and the adjacent table, represents past performance, does not guarantee future results, assumes reinvestment of dividends and distributions and does not reflect the deduction of taxes that a shareholder would pay on the Fund’s distributions or the redemption of the Fund shares. All performance data reflects fee waivers and/or expense limitations, if any are in effect; in their absence performance would be lower. See Note B in Notes to Financial Statements. The investment return and principal value of an investment will fluctuate so that an investor’s shares, when redeemed, may be worth more or less than their original cost. Current performance may be lower or higher than the performance data quoted; for current performance data visit www.calvert.com. The gross expense ratio from the current prospectus for Class A shares is 1.35%. This number may differ from the expense ratio shown elsewhere in this report because it is based on a different time period and, if applicable, does not include fee or expense waivers. Performance data quoted already reflects the deduction of the Fund’s operating expenses.
www.calvert.com CALVERT GOVERNMENT FUND SEMI-ANNUAL REPORT (UNAUDITED) 9
SHAREHOLDER ADVOCACY UPDATE
2014 Corporate Diversity Report Findings Released
In March, Calvert published its 2014 survey findings on the corporate diversity practices of the largely multinational companies that make up the Standard & Poor’s 100 Index (S&P 100), in follow-up to reports published in 2012 and 2010. Calvert believes companies that fully commit to providing a fair and equitable working environment will recognize gains in both the workplace and marketplace.
Key findings from the 2014 survey include:
| |
| • | Milestone for women in the board room. In 2014, every company in the S&P 100 had at least one woman on its board of directors. In addition, there was a 17% increase in companies with three or more women and/or minorities on their boards. |
| |
| • | Diversity commitment on the rise. In the past two years, top scores related to overall corporate commitment have increased by 45%.This stems primarily from greater board oversight of diversity initiatives and increased CEO and/or chair involvement. |
| |
| • | LGBT policies have advanced overall. However, initiatives for persons with disabilities continue to fall behind other groups. |
Overall, in 2014, we saw growing commitment to women and minority employees, momentum around family-friendly work environments, and accelerated progress in support of LGBT employees. Looking ahead, we hope to see enhanced corporate diversity commitments, greater representation of women and minorities on boards, improved EEO1-disclosure, and expanded diversity initiatives for persons with disabilities.
To learn the highest- and lowest-rated companies in the report, A Survey of Corporate Diversity Practices of the S&P 100, and to find out more about the report’s methodology and findings, visit www.calvert.com.
2015 Shareholder Resolutions
Building on our initiatives from 2014, Calvert was the lead filer on 38 shareholder resolutions for the 2015 proxy season, and co-filer on another 18 proposals. Key topics include “big data” and civil rights issues, sustainability reporting, board of director oversight of environmental and social matters, water risk, climate change and greenhouse gas emissions reductions, supply chain labor issues, and board diversity.
Specifically, Calvert asked 14 companies to set a goal and a timeline for reducing their greenhouse gas emissions and filed seven proposals asking companies to issue a sustainability report describing their environmental, social and governance (ESG) performance and goals. To push for improved boardroom diversity, Calvert filed six proposals with companies requesting they report on their plans to increase minority and women Board representation and assess the effectiveness of these efforts. We also filed seven proposals requesting that companies assess and manage the civil rights’ risks related to their use of big data, which refers to data sets so large or complex that traditional data processing applications are inadequate. We also filed proposals on water risk in the agricultural supply chain and on developing a sustainable agriculture policy.
To keep abreast of the outcomes of these 2015 shareholder resolutions, as well as Calvert’s proxy voting and public policy initiatives, visit the “Resources” section on www.calvert.com.
10 www.calvert.com CALVERT GOVERNMENT FUND SEMI-ANNUAL REPORT (UNAUDITED)
SHAREHOLDER EXPENSE EXAMPLE
As a shareholder of the Fund, you incur two types of costs: (1) transaction costs, including sales charges (loads) and redemption fees; and (2) ongoing costs, including management fees; distribution (12b-1) fees; and other Fund expenses. This Example is intended to help you understand your ongoing costs (in dollars) of investing in the Fund and to compare these costs with the ongoing costs of investing in other mutual funds.
This Example is based on an investment of $1,000 invested at the beginning of the period and held for the entire period (October 1, 2014 to March 31, 2015).
Actual Expenses
The first line of the table below provides information about actual account values and actual expenses. You may use the information in this line, together with the amount you invested, to estimate the expenses that you paid over the period. Simply divide your account value by $1,000 (for example, an $8,600 account value divided by $1,000 = 8.6), then multiply the result by the number in the first line under the heading entitled “Expenses Paid During Period” to estimate the expenses you paid on your account during this period.
Hypothetical Example for Comparison Purposes
The second line of the table below provides information about hypothetical account values and hypothetical expenses based on the Fund’s actual expense ratio and an assumed rate of return of 5% per year before expenses, which is not the Fund’s actual return. The hypothetical account values and expenses may not be used to estimate the actual ending account balance or expenses you paid for the period. You may use this information to compare the ongoing costs of investing in the Fund and other funds. To do so, compare the 5% hypothetical example with the 5% hypothetical examples that appear in the shareholder reports of the other funds.
Please note that the expenses shown in the table are meant to highlight your ongoing costs only and do not reflect any transactional costs, such as sales charges (loads), or redemption fees. Therefore, the second line of the table is useful in comparing ongoing costs only, and will not help you determine the relative total costs of owning different funds. In addition, if these transactional costs were included, your costs would have been higher.
www.calvert.com CALVERT GOVERNMENT FUND SEMI-ANNUAL REPORT (UNAUDITED) 11
|
| | | |
| | BEGINNING ACCOUNT VALUE 10/1/14 | ENDING ACCOUNT VALUE 3/31/15 | EXPENSES PAID DURING PERIOD* 10/1/14 - 3/31/15 |
CLASS A | | | |
| Actual | $1,000.00 | $1,020.67 | $5.34 |
| Hypothetical | $1,000.00 | $1,019.65 | $5.34 |
| (5% return per year before expenses) | | | |
| | | | |
CLASS C | | | |
| Actual | $1,000.00 | $1,015.07 | $10.25 |
| Hypothetical | $1,000.00 | $1,014.76 | $10.25 |
| (5% return per year before expenses) | | | |
| | | | |
CLASS I | | | |
| Actual | $1,000.00 | $1,021.90 | $3.71 |
| Hypothetical | $1,000.00 | $1,021.26 | $3.71 |
| (5% return per year before expenses) | | | |
| | | | |
* Expenses are equal to the Fund’s annualized expense ratio of 1.06%, 2.04%, and 0.74% for Class A, Class C, and Class I, respectively, multiplied by the average account value over the period, multiplied by 182/365 (to reflect the one-half year period).
|
12 www.calvert.com CALVERT GOVERNMENT FUND SEMI-ANNUAL REPORT (UNAUDITED)
STATEMENT OF NET ASSETS
MARCH 31, 2015
|
| | | | | | |
ASSET-BACKED SECURITIES - 1.4% | PRINCIPAL AMOUNT | VALUE |
| | | |
| American Homes 4 Rent, 3.786%, 10/17/36 (e) |
| $148,978 |
|
| $155,136 |
|
| Sierra Timeshare Receivables Funding LLC, 2.92%, 11/20/25 (e) | 38,096 |
| 38,376 |
|
| TAL Advantage V LLC, 3.33%, 5/20/39 (e) | 94,648 |
| 96,104 |
| | | |
| Total Asset-Backed Securities (Cost $281,924) | | 289,616 |
| | | |
COMMERCIAL MORTGAGE-BACKED SECURITIES - 0.5% | | |
| Extended Stay America Trust, 3.902%, 12/5/31 (e) | 100,000 |
| 102,902 |
| | | |
| Total Commercial Mortgage-Backed Securities (Cost $101,180) | | 102,902 |
| | | |
CORPORATE BONDS - 4.4% | | |
| Amgen, Inc., 5.15%, 11/15/41 | 100,000 |
| 115,176 |
| Bank of America NA, 0.571%, 6/15/17 (r) | 250,000 |
| 247,888 |
| North American Development Bank, 2.40%, 10/26/22 | 290,000 |
| 286,641 |
| SBA Tower Trust, 3.722%, 4/15/48 (e) | 220,000 |
| 227,202 |
| Williams Co.’s, Inc., 5.75%, 6/24/44 | 60,000 |
| 56,077 |
| | | |
| Total Corporate Bonds (Cost $899,287) | | 932,984 |
| | | |
U.S. GOVERNMENT AGENCIES AND INSTRUMENTALITIES - 13.3% | | |
| Portmarnock Leasing LLC, 1.741%, 10/22/24 | 703,512 |
| 695,446 |
| Private Export Funding Corp.: | | |
| 4.55%, 5/15/15 | 1,132,000 |
| 1,137,795 |
| 2.05%, 11/15/22 | 1,000,000 |
| 981,650 |
| | | |
Total U.S. Government Agencies and Instrumentalities (Cost $2,835,728) | | 2,814,891 |
| | | |
U.S. GOVERNMENT AGENCY MORTGAGE-BACKED SECURITIES - 0.8% | | |
| Fannie Mae: | | |
| 3.50%, 3/1/22 | 122,310 |
| 129,796 |
| 5.00%, 4/25/34 | 43,655 |
| 45,303 |
| | | |
| Total U.S. Government Agency Mortgage-Backed Securities (Cost $173,213) | | 175,099 |
| | | |
U.S. TREASURY OBLIGATIONS - 73.0% | | |
| United States Treasury Bonds: | | |
| 3.00%, 11/15/44 | 2,105,000 |
| 2,306,455 |
| 2.50%, 2/15/45 | 585,000 |
| 579,607 |
| United States Treasury Notes: | | |
| 0.50%, 3/31/17 | 450,000 |
| 449,473 |
| 1.00%, 3/15/18 | 1,065,000 |
| 1,068,911 |
| 1.375%, 3/31/20 | 5,030,000 |
| 5,030,785 |
www.calvert.com CALVERT GOVERNMENT FUND SEMI-ANNUAL REPORT (UNAUDITED) 13
|
| | | | | | |
U.S. TREASURY OBLIGATIONS - CONT’D | PRINCIPAL AMOUNT | VALUE |
| | | |
| 1.75%, 3/31/22 |
| $5,015,000 |
| $5,027,929 |
| 2.00%, 2/15/25 | 1,015,000 |
| 1,021,423 |
| | | |
| Total U.S. Treasury Obligations (Cost $15,334,096) | | 15,484,583 |
| | | |
TIME DEPOSIT - 4.2% | | |
| State Street Bank Time Deposit, 0.088%, 4/1/15 | 896,781 |
| 896,781 |
| | | |
| Total Time Deposit (Cost $896,781) | | 896,781 |
| | | |
| | | |
| TOTAL INVESTMENTS (Cost $20,522,209) - 97.6% | | 20,696,856 |
| Other assets and liabilities, net - 2.4% | | 508,005 |
NET ASSETS - 100% | | $21,204,861 |
| | | |
NET ASSETS CONSIST OF: | | |
| Paid-in capital applicable to the following shares of beneficial interest, unlimited number of no par value shares authorized: | | |
| Class A: 520,870 shares outstanding |
| $9,209,207 |
|
| Class C: 143,518 shares outstanding | 2,538,760 |
|
| Class I: 625,309 shares outstanding | 10,261,321 |
|
| Undistributed net investment income | 2,199 |
|
| Accumulated net realized gain (loss) | (919,158 | ) |
| Net unrealized appreciation (depreciation) | 112,532 |
|
| | | |
NET ASSETS | $21,204,861 |
|
| | | |
NET ASSET VALUE PER SHARE | | |
| Class A (based on net assets of $8,578,446) | $16.47 |
| Class C (based on net assets of $2,339,639) | $16.30 |
| Class I (based on net assets of $10,286,776) | $16.45 |
| | | |
|
| | | | | | | | | |
FUTURES | NUMBER OF CONTRACTS | EXPIRATION DATE | UNDERLYING FACE AMOUNT AT VALUE | UNREALIZED APPRECIATION (DEPRECIATION) |
| Purchased: | | | | |
| 5 Year U.S. Treasury Notes | 20 |
| 6/15 |
| $2,404,219 |
|
| $14,810 |
|
| | | | | |
| Sold: | | | | |
| ��2 Year U.S. Treasury Notes | 2 |
| 6/15 |
| $438,313 |
|
| ($1,347 | ) |
| 10 Year U.S. Treasury Notes | 50 |
| 6/15 | 6,445,313 |
| (63,334 | ) |
| Ultra U.S. Treasury Bonds | 6 |
| 6/15 | 1,019,250 |
| (12,244 | ) |
| Total Sold | | | |
| ($76,925 | ) |
| See notes to financial statements. |
14 www.calvert.com CALVERT GOVERNMENT FUND SEMI-ANNUAL REPORT (UNAUDITED)
|
| | | | |
| | | | | |
| | | | | |
| | | | | |
| | | | | |
| | | | | |
| | | | | |
| | | | | |
| | | | | |
| | | | | |
(e) Security is exempt from registration under Rule 144A of the Securities Act of 1933. These securities may be resold in transactions exempt from registration, normally to qualified institutional buyers. (r) The coupon rate shown on floating or adjustable rate securities represents the rate at period end. Abbreviations: LLC: Limited Liability Corporation See notes to financial statements. |
www.calvert.com CALVERT GOVERNMENT FUND SEMI-ANNUAL REPORT (UNAUDITED) 15
STATEMENT OF OPERATIONS
SIX MONTHS ENDED MARCH 31, 2015
|
| | | |
NET INVESTMENT INCOME | |
| Investment Income: | |
| Interest income |
| $214,921 |
|
| Total investment income | 214,921 |
|
| | |
| Expenses: | |
| Investment advisory fee | 37,353 |
|
| Administrative fees | 10,672 |
|
| Transfer agency fees and expenses | 19,326 |
|
| Distribution Plan expenses: | |
| Class A | 10,558 |
|
| Class C | 12,405 |
|
| Trustees' fees and expenses | 813 |
|
| Custodian fees | 13,178 |
|
| Registration fees | 21,735 |
|
| Professional fees | 11,825 |
|
| Accounting fees | 1,786 |
|
| Miscellaneous | 6,385 |
|
| Total expenses | 146,036 |
|
| Reimbursement from Advisor: | |
| Class A | (21,584 | ) |
| Class C | (6,891 | ) |
| Class I | (9,160 | ) |
| Net expenses | 108,401 |
|
| | |
NET INVESTMENT INCOME | 106,520 |
|
| | |
REALIZED AND UNREALIZED GAIN (LOSS) | |
| Net realized gain (loss) on: | |
| Investments | 417,412 |
|
| Futures | (303,173 | ) |
| | 114,239 |
|
| Change in unrealized appreciation (depreciation) on: | |
| Investments | 327,548 |
|
| Futures | (110,681 | ) |
| | 216,867 |
|
| | |
NET REALIZED AND UNREALIZED GAIN (LOSS) | 331,106 |
|
| | |
INCREASE (DECREASE) IN NET ASSETS RESULTING FROM OPERATIONS |
| $437,626 |
|
| | |
| See notes to financial statements. |
16 www.calvert.com CALVERT GOVERNMENT FUND SEMI-ANNUAL REPORT (UNAUDITED)
STATEMENTS OF CHANGES IN NET ASSETS
|
| | | | | | | |
INCREASE (DECREASE) IN NET ASSETS | SIX MONTHS ENDED MARCH 31, 2015 | | YEAR ENDED SEPTEMBER 30, 2014 |
| Operations: | | | |
| Net investment income |
| $106,520 |
| |
| $294,814 |
|
| Net realized gain (loss) | 114,239 |
| | (363,917 | ) |
| Change in unrealized appreciation (depreciation) | 216,867 |
| | 456,553 |
|
| | | | |
INCREASE (DECREASE) IN NET ASSETS RESULTING FROM OPERATIONS | 437,626 |
| | 387,450 |
|
| | | | |
| Distributions to shareholders from: | | | |
| Net investment income: | | | |
| Class A shares | (38,596 | ) | | (115,358 | ) |
| Class C shares | (309) |
| | (4,703) |
|
| Class I shares | (66,062 | ) | | (179,210 | ) |
| Total distributions | (104,967 | ) | | (299,271 | ) |
| | | | |
| Capital share transactions: | | | |
| Shares sold: | | | |
| Class A shares | 1,550,597 |
| | 1,400,924 |
|
| Class C shares | 121,294 |
| | 271,829 |
|
| Class I shares | 2,421,732 |
| | 3,293,180 |
|
| Reinvestment of distributions: | | | |
| Class A shares | 36,517 |
| | 109,093 |
|
| Class C shares | 292 |
| | 4,451 |
|
| Class I shares | 66,062 |
| | 179,210 |
|
| Redemption fees: | | | |
| Class A shares | 52 |
| | 401 |
|
| Class I shares | — |
| | 99 |
|
| Shares redeemed: | | | |
| Class A shares | (1,480,302 | ) | | (5,910,354 | ) |
| Class C shares | (451,245 | ) | | (1,250,864 | ) |
| Class I shares | (3,080,851 | ) | | (5,669,906 | ) |
| Total capital share transactions | (815,852 | ) | | (7,571,937 | ) |
| | | | |
TOTAL INCREASE (DECREASE) IN NET ASSETS | (483,193 | ) | | (7,483,758 | ) |
| | | | |
NET ASSETS | | | |
| Beginning of period | 21,688,054 |
| | 29,171,812 |
|
| End of period (including undistributed net investment income of $2,199 and $646, respectively) |
| $21,204,861 |
| |
| $21,688,054 |
|
| | | | |
| See notes to financial statements. |
www.calvert.com CALVERT GOVERNMENT FUND SEMI-ANNUAL REPORT (UNAUDITED) 17
STATEMENTS OF CHANGES IN NET ASSETS
|
| | | | | |
CAPITAL SHARE ACTIVITY | SIX MONTHS ENDED MARCH 31, 2015 | | YEAR ENDED SEPTEMBER 30, 2014 |
| Shares sold: | | | |
| Class A shares | 94,703 |
| | 86,588 |
|
| Class C shares | 7,485 |
| | 16,974 |
|
| Class I shares | 148,037 |
| | 203,485 |
|
| Reinvestment of distributions: | | | |
| Class A shares | 2,230 |
| | 6,737 |
|
| Class C shares | 18 |
| | 278 |
|
| Class I shares | 4,038 |
| | 11,076 |
|
| Shares redeemed: | | | |
| Class A shares | (90,437 | ) | | (365,424 | ) |
| Class C shares | (27,708 | ) | | (78,017 | ) |
| Class I shares | (188,534 | ) | | (350,353 | ) |
| Total capital share activity | (50,168 | ) | | (468,656 | ) |
| | | | |
| See notes to financial statements. |
18 www.calvert.com CALVERT GOVERNMENT FUND SEMI-ANNUAL REPORT (UNAUDITED)
NOTES TO FINANCIAL STATEMENTS
NOTE A — SIGNIFICANT ACCOUNTING POLICIES
General: Calvert Government Fund (the “Fund”), a series of The Calvert Fund, is registered under the Investment Company Act of 1940 as a diversified, open-end management investment company. The Calvert Fund is comprised of six separate series. The operations of each series are accounted for separately. The Fund offers three classes of shares of beneficial interest - Classes A, C, and I. Class A shares are sold with a maximum front-end sales charge of 3.75%. Class C shares are sold without a front-end sales charge and, with certain exceptions, will be charged a deferred sales charge on shares sold within one year of purchase. Class C shares have higher levels of expenses than Class A shares. Class I shares require a minimum account balance of $1,000,000. The $1 million minimum initial investment is waived for retirement plans that trade through omnibus accounts and may be waived for certain other institutional accounts where it is believed to be in the best interest of the Fund and its shareholders. Class I shares have no front-end or deferred sales charge and have lower levels of expenses than Class A Shares. Each class has different: (a) dividend rates due to differences in Distribution Plan expenses and other class specific expenses, (b) exchange privileges and (c) class specific voting rights.
Security Valuation: Net asset value per share is determined every business day as of the close of the regular session of the New York Stock Exchange (generally 4:00 p.m. Eastern time). The Fund uses independent pricing services approved by the Board of Trustees (“the Board”) to value its investments wherever possible. Investments for which market quotations are not available or deemed not reliable are fair valued in good faith under the direction of the Board.
The Board has adopted Valuation Procedures (the “Procedures”) to determine the fair value of securities and other financial instruments for which market prices are not readily available or which may not be reliably priced. The Board has delegated the day-to-day responsibility for determining the fair value of assets of the Fund to Calvert Investment Management, Inc. (the “Advisor” or “Calvert”) and has provided these Procedures to govern Calvert in its valuation duties.
Calvert has chartered an internal Valuation Committee to oversee the implementation of these Procedures and to assist it in carrying out the valuation responsibilities that the Board has delegated.
The Valuation Committee meets on a regular basis to review illiquid securities and other investments which may not have readily available market prices. The Valuation Committee’s fair valuation determinations are subject to review, approval and ratification by the Board at its next regularly scheduled meeting covering the calendar quarter in which the fair valuation was determined.
The Valuation Committee utilizes various methods to measure the fair value of the Fund’s investments. Generally Accepted Accounting Principles (GAAP) establishes a disclosure hierarchy that categorizes the inputs to valuation techniques used to value assets and liabilities at measurement date. These inputs are summarized in the three broad levels listed below:
Level 1 - quoted prices in active markets for identical securities
Level 2 - other significant observable inputs (including quoted prices for similar securities, interest rates, prepayment speeds, credit risk, etc.)
Level 3 - significant unobservable inputs (including the Fund’s own assumptions in determining the fair value of investments)
www.calvert.com CALVERT GOVERNMENT FUND SEMI-ANNUAL REPORT (UNAUDITED) 19
The inputs or methodologies used for valuing securities are not necessarily an indication of the risk associated with investing in those securities.
Changes in valuation techniques may result in transfers in or out of an investment’s assigned level within the hierarchy during the period. There were no such transfers during the period. Valuation techniques used to value the Fund’s investments by major category are as follows:
Debt securities, including restricted securities, are valued based on evaluated prices received from independent pricing services or from dealers who make markets in such securities. For corporate bonds and U.S. government and government agency obligations, pricing services utilize matrix pricing which considers yield or price of bonds of comparable quality, coupon, maturity and type, as well as dealer supplied prices, and such securities are generally categorized as Level 2 in the hierarchy. For asset-backed securities, commercial mortgage-backed securities, and U.S. government agency mortgage-backed securities, pricing services utilize matrix pricing which considers prepayment speed assumptions, attributes of the collateral, yield or price of bonds of comparable quality, coupon, maturity and type as well as dealer supplied prices and, accordingly, such securities are generally categorized as Level 2 in the hierarchy. Short-term securities of sufficient credit quality with remaining maturities of sixty days or less for which quotations are not readily available are valued at amortized cost, which approximates fair value, and are categorized as Level 2 in the hierarchy.
When independent prices are unavailable or unreliable, debt securities may be valued utilizing pricing matrices which consider similar factors that would be used by independent pricing services. These are generally categorized as Level 2 in the hierarchy but may be Level 3 depending on the circumstances.
Futures contracts are valued at the settlement price established each day by the board of trade or exchange on which they are traded and are categorized as Level 1 in the hierarchy.
If a market value cannot be determined for a security using the methodologies described above, or if, in the good faith opinion of the Advisor, the market value does not constitute a readily available market quotation, or if a significant event has occurred that would materially affect the value of the security, the security will be fair valued as determined in good faith by the Valuation Committee.
The Valuation Committee considers a number of factors, including significant unobservable valuation inputs when arriving at fair value. It considers all significant facts that are reasonably available and relevant to the determination of fair value.
The Valuation Committee primarily employs a market-based approach which may use related or comparable assets or liabilities, recent transactions, market multiples, book values, and other relevant information for the investment to determine the fair value of the investment. When more appropriate, the fund may employ an income-based or cost approach. An income-based valuation approach discounts anticipated future cash flows of the investment to calculate a present amount (discounted). The measurement is based on the value indicated by current market expectations about those future amounts. Discounts may also be applied due to the nature or duration of any restrictions on the disposition of the investments. A cost based approach is based on the amount that currently would be required to replace the service capacity of an asset (current replacement cost). From the seller’s perspective, the price that would be received for the asset is determined based on the cost to a buyer to acquire or construct a substitute asset of comparable utility, adjusted for obsolescence.
20 www.calvert.com CALVERT GOVERNMENT FUND SEMI-ANNUAL REPORT (UNAUDITED)
The values assigned to fair value investments are based on available information and do not necessarily represent amounts that might ultimately be realized. Further, due to the inherent uncertainty of valuations of such investments, the fair values may differ significantly from the values that would have been used had an active market existed, and the differences could be material. The Valuation Committee employs various methods for calibrating these valuation approaches including a regular review of key inputs and assumptions, transactional back-testing or disposition analysis and reviews of any related market activity.
At March 31, 2015, no securities were fair valued in good faith under the direction of the Board.
The following table summarizes the market value of the Fund’s holdings as of March 31, 2015, based on the inputs used to value them:
|
| | | | | | | | | | | | | | |
| | VALUATION INPUTS |
INVESTMENTS IN SECURITIES* | LEVEL 1 | | LEVEL 2 | | LEVEL 3 | | TOTAL |
| Asset-backed securities | — |
| |
| $289,616 |
| | — |
| |
| $289,616 |
|
| Commercial mortgage-backed securities | — |
| | 102,902 |
| | — |
| | 102,902 |
|
| Corporate debt | — |
| | 932,984 |
| | — |
| | 932,984 |
|
| U.S. government obligations | — |
| | 18,474,573 |
| | — |
| | 18,474,573 |
|
| Other debt obligations | — |
| | 896,781 |
| | — |
| | 896,781 |
|
| TOTAL | — |
| |
| $20,696,856 |
| | — |
| |
| $20,696,856 |
|
| Other financial instruments** |
| ($62,115 | ) | | — |
| | — |
| |
| ($62,115 | ) |
| | | | | | | | |
* For a complete listing of investments, please refer to the Statement of Net Assets. ** Other financial instruments are derivative instruments not reflected in the Total Investments in the Statement of Net Assets, such as futures, which are valued at the unrealized appreciation/depreciation of the instrument. |
Futures Contracts: The Fund may purchase and sell futures contracts, but only when, in the judgment of the Advisor, such a position acts as a hedge. The Fund may not enter into futures contracts for the purpose of speculation or leverage. These futures contracts may include, but are not limited to, futures contracts based on U.S. Government obligations. The Fund is subject to interest rate risk in the normal course of pursuing its investment objectives and may use futures contracts to hedge against changes in interest rates. The Fund may enter into futures contracts agreeing to buy or sell a financial instrument for a set price at a future date. Initial margin deposits of either cash or securities as required by the broker are made upon entering into the contract. While the contract is open, daily variation margin payments are made to or received from the broker reflecting the daily change in market value of the contract and are recorded for financial reporting purposes as unrealized gains or losses by the Fund. When a futures contract is closed, a realized gain or loss is recorded equal to the difference between the opening and closing value of the contract. The risks associated with entering into futures contracts may include the possible illiquidity of the secondary market which would limit the Fund’s ability to close out a futures contract prior to the settlement date, an imperfect correlation between the value of the contracts and the underlying financial instruments, or that the counterparty will fail to perform its obligations under the contracts’ terms. Futures contracts are designed by boards of trade which are designated “contracts markets” by the Commodities Futures Trading Commission. Futures contracts trade on the contracts markets in a manner that is similar to the way a stock trades on a stock exchange and the boards of trade, through their clearing corporations, guarantee the futures contracts against default. As a
www.calvert.com CALVERT GOVERNMENT FUND SEMI-ANNUAL REPORT (UNAUDITED) 21
result, there is minimal counterparty credit risk to the Fund. During the period, the Fund used U.S. Treasury Notes and Bond futures contracts to hedge against interest rate changes and to manage overall duration of the Fund. The Fund’s futures contracts at period end are presented in the Statement of Net Assets.
During the period, the Fund invested in 2 year, 5 year, and 10 year U.S. Treasury Notes futures and 30 year and Ultra U.S. Treasury Bond futures. The volume of outstanding contracts has varied throughout the period with a weighted average of 10 contracts and $787,058 weighted average notional value.
Short Sales: The Fund may use a hedging technique that involves short sales of U.S. Treasury securities for the purpose of managing the duration of the Fund. Any short sales are “covered” with an equivalent amount of high-quality, liquid securities.
Security Transactions and Net Investment Income: Security transactions are accounted for on trade date. Realized gains and losses are recorded on an identified cost basis and may include proceeds from litigation. Interest income, which includes amortization of premium and accretion of discount on debt securities, is accrued as earned. Investment income and realized and unrealized gains and losses are allocated to separate classes of shares based upon the relative net assets of each class. Expenses arising in connection with a specific class are charged directly to that class. Expenses common to the classes are allocated to each class in proportion to their relative net assets.
Distributions to Shareholders: Distributions to shareholders are recorded by the Fund on ex-dividend date. Dividends from net investment income are paid monthly. Distributions from net realized capital gains, if any, are paid at least annually. Distributions are determined in accordance with income tax regulations which may differ from generally accepted accounting principles; accordingly, periodic reclassifications are made within the Fund’s capital accounts to reflect income and gains available for distribution under income tax regulations.
Estimates: The preparation of financial statements in conformity with accounting principles generally accepted in the United States requires management to make estimates and assumptions that affect the reported amounts of assets and liabilities and disclosure of contingent assets and liabilities at the date of the financial statements and the reported amounts of income and expenses during the reported period. Actual results could differ from those estimates.
Redemption Fees: The Fund charges a 2% redemption fee on redemptions, including exchanges, made within 30 days of purchase in the same Fund (within seven days for Class I shares). The redemption fee is accounted for as an addition to paid-in capital and is intended to discourage market-timers by ensuring that short-term trading costs are borne by the investors making the transactions and not the shareholders already in the Fund. This fee was eliminated effective February 2, 2015.
Federal Income Taxes: No provision for federal income or excise tax is required since the Fund intends to continue to qualify as a regulated investment company under the Internal Revenue Code and to distribute substantially all of its taxable earnings.
Management has analyzed the Fund’s tax positions taken for all open federal income tax years and has concluded that no provision for federal income tax is required in the Fund’s financial statements. A Fund’s federal tax return is subject to examination by the Internal Revenue Service for a period of three years.
22 www.calvert.com CALVERT GOVERNMENT FUND SEMI-ANNUAL REPORT (UNAUDITED)
NOTE B — RELATED PARTY TRANSACTIONS
Calvert Investment Management, Inc. (the “Advisor”) is wholly-owned by Calvert Investments, Inc., which is indirectly wholly-owned by Ameritas Mutual Holding Company. The Advisor provides investment advisory services and pays the salaries and fees of officers and Trustees of the Fund who are employees of the Advisor or its affiliates. For its services, the Advisor receives an annual fee, payable monthly, of .35% of the Fund’s average daily net assets. Under the terms of agreement, $6,175 was payable at period end.
The Advisor has contractually agreed to limit net annual fund operating expenses through January 31, 2016. The contractual expense caps are 1.10%, 2.04%, and .75% for Class A, C, and I, respectively. Prior to January 31, 2015, the contractual expense caps were 1.04%, 2.04%, and .73% for Class A, C, and I, respectively. For the purpose of this expense limit, operating expenses do not include interest expense, brokerage commissions, taxes, and extraordinary expenses. This expense limitation does not limit acquired fund fees and expenses, if any. At period end, $9,080, was receivable from the Advisor.
Calvert Investment Administrative Services, Inc., an affiliate of the Advisor, provides administrative services to the Fund for an annual fee, payable monthly, of .10% for Classes A, C, and I, based on their average daily net assets. Under the terms of the agreement, $1,764 was payable at period end.
Calvert Investment Distributors, Inc. (“CID”), an affiliate of the Advisor, is the distributor and principal underwriter for the Fund. Pursuant to Rule 12b-1 under the Investment Company Act of 1940, the Fund has adopted a Distribution Plan that permits the Fund to pay certain expenses associated with the distribution and servicing of its shares. The expenses paid may not exceed .25% and 1.00% annually of the Fund’s average daily net assets of Class A and C, respectively. The amount actually paid by the Fund is an annualized fee, payable monthly, of .25% and 1.00% of the Fund’s average daily net assets of Class A and C, respectively. Class I shares do not have Distribution Plan expenses. Under the terms of the agreement, $3,792 was payable at period end.
CID received $1,252 as its portion of the commissions charged on sales of the Fund’s Class A shares for the six months ended March 31, 2015.
Calvert Investment Services, Inc. (“CIS”), an affiliate of the Advisor, is the shareholder servicing agent for the Fund. For its services, CIS received a fee of $1,195 for the six months ended March 31, 2015. Under the terms of the agreement, $205 was payable at period end. Boston Financial Data Services, Inc. is the transfer and dividend disbursing agent.
Each Trustee of the Fund who is not an employee of the Advisor or its affiliates receives an annual retainer of $45,000 plus up to $2,000 for each Board and Committee meeting attended. The Board chair and Committee chairs each receive an additional $5,000 annual retainer. Trustees’ fees are allocated to each of the funds served.
NOTE C — INVESTMENT ACTIVITY AND TAX INFORMATION
During the period, the cost of purchases and proceeds from sales of investments, other than short-term and U.S. government securities, were $355,501 and $1,397,052, respectively. U.S. government security purchases and sales were $89,504,158 and $90,784,691, respectively.
www.calvert.com CALVERT GOVERNMENT FUND SEMI-ANNUAL REPORT (UNAUDITED) 23
|
| | | |
CAPITAL LOSS CARRYFORWARD | |
| |
NO EXPIRATION DATE | |
| Short-term |
| ($653,753 | ) |
| Long-term | (319,841 | ) |
Capital losses can be carried forward to offset future capital gains for an unlimited period. They will also retain their character as either long-term or short-term.
As of March 31, 2015, the tax basis components of unrealized appreciation/(depreciation) and the federal tax cost were as follows:
|
| | | |
| Unrealized appreciation |
| $200,510 |
|
| Unrealized (depreciation) | (25,863 | ) |
| Net unrealized appreciation/(depreciation) |
| $174,647 |
|
| | |
| Federal income tax cost of investments |
| $20,522,209 |
|
NOTE D — LINE OF CREDIT
A financing agreement is in place with the Calvert Funds and State Street Corporation (“SSC”). Under the agreement, SSC provides an unsecured line of credit facility, in the aggregate amount of $50 million ($25 million committed and $25 million uncommitted), accessible by the Funds for temporary or emergency purposes only. Borrowings bear interest at the higher of the London Interbank Offered Rate (LIBOR) or the overnight Federal Funds Rate plus 1.25% per annum. A commitment fee of .125% per annum is incurred on the unused portion of the committed facility, which is allocated to all participating funds. The Fund had no loans outstanding pursuant to this line of credit at March 31, 2015. For the six months ended March 31, 2015, borrowings by the Fund under the agreement were as follows:
|
| | | |
AVERAGE DAILY BALANCE | WEIGHTED AVERAGE INTEREST RATE | MAXIMUM AMOUNT BORROWED | MONTH OF MAXIMUM AMOUNT BORROWED |
| $1,289 | 1.38% | $219,484 | March 2015 |
NOTE E — SUBSEQUENT EVENTS
On December 10, 2014, the Board of Trustees approved the reorganization of the Fund into Calvert Short Duration Income Fund. Shareholders approved the reorganization at a meeting on April 17, 2015 and the reorganization took place after the close of business on April 30, 2015.
In preparing the financial statements as of March 31, 2015, no other subsequent events or transactions occurred that would have required recognition or disclosure in these financial statements.
24 www.calvert.com CALVERT GOVERNMENT FUND SEMI-ANNUAL REPORT (UNAUDITED)
FINANCIAL HIGHLIGHTS
|
| | | | | | | | | | | |
| | | PERIODS ENDED | |
CLASS A SHARES | MARCH 31, 2015 | | SEPTEMBER 30, 2014 (z) | | SEPTEMBER 30, 2013 (z) |
| Net asset value, beginning |
| $16.21 |
| |
| $16.16 |
| |
| $17.32 |
|
| Income from investment operations: | | | | | |
| Net investment income | .08 |
| | .18 |
| | .12 |
|
| Net realized and unrealized gain (loss) | .25 |
| | .06 |
| | (.63 | ) |
| Total from investment operations | .33 |
| | .24 |
| | (.51 | ) |
| Distributions from: | | | | | |
| Net investment income | (.07 | ) | | (.19 | ) | | (.15 | ) |
| Net realized gain | — |
| | — |
| | (.50 | ) |
| Total distributions | (.07 | ) | | (.19 | ) | | (.65 | ) |
| Total increase (decrease) in net asset value | .26 |
| | .05 |
| | (1.16 | ) |
| Net asset value, ending |
| $16.47 |
| |
| $16.21 |
| |
| $16.16 |
|
| | | | | | |
| Total return* | 2.07 | % | | 1.49 | % | | (3.08 | %) |
Ratios to average net assets: A | | | | | |
| Net investment income | .95% (a) |
| | 1.13 | % | | .70 | % |
| Total expenses | 1.57% (a) |
| | 1.35 | % | | 1.45 | % |
| Expenses before offsets | 1.06% (a) |
| | 1.04 | % | | 1.04 | % |
| Net expenses | 1.06% (a) |
| | 1.04 | % | | 1.04 | % |
| Portfolio turnover | 433 | % | | 835 | % | | 497 | % |
| Net assets, ending (in thousands) |
| $8,578 |
| |
| $8,340 |
| |
| $12,707 |
|
| | | | | | |
|
| | | | | | | | | | | |
| | | | YEARS ENDED | | |
CLASS A SHARES | SEPTEMBER 30, 2012 | | SEPTEMBER 30, 2011 | | SEPTEMBER 30, 2010 |
| Net asset value, beginning |
| $17.31 |
| |
| $16.63 |
| |
| $16.14 |
|
| Income from investment operations: | | | | | |
| Net investment income | .09 |
| | .15 |
| | .26 |
|
| Net realized and unrealized gain (loss) | .45 |
| | .92 |
| | .88 |
|
| Total from investment operations | .54 |
| | 1.07 |
| | 1.14 |
|
| Distributions from: | | | | | |
| Net investment income | (.10 | ) | | (.16 | ) | | (.24 | ) |
| Net realized gain | (.43 | ) | | (.23 | ) | | (.41 | ) |
| Total distributions | (.53 | ) | | (.39 | ) | | (.65 | ) |
| Total increase (decrease) in net asset value | .01 |
| | .68 |
| | .49 |
|
| Net asset value, ending |
| $17.32 |
| |
| $17.31 |
| |
| $16.63 |
|
| | | | | | |
| Total return* | 3.21 | % | | 6.58 | % | | 7.31 | % |
Ratios to average net assets: A | | | | | |
| Net investment income | .55 | % | | .95 | % | | 1.60 | % |
| Total expenses | 1.37 | % | | 1.89 | % | | 3.81 | % |
| Expenses before offsets | 1.04 | % | | 1.04 | % | | 1.05 | % |
| Net expenses | 1.04 | % | | 1.04 | % | | 1.04 | % |
| Portfolio turnover | 311 | % | | 668 | % | | 401 | % |
| Net assets, ending (in thousands) |
| $20,753 |
| |
| $13,387 |
| |
| $3,951 |
|
| See notes to financial highlights. |
www.calvert.com CALVERT GOVERNMENT FUND SEMI-ANNUAL REPORT (UNAUDITED) 25
FINANCIAL HIGHLIGHTS
|
| | | | | | | | | | | |
| | | PERIODS ENDED | |
CLASS C SHARES | MARCH 31, 2015 | | SEPTEMBER 30, 2014 (z) | | SEPTEMBER 30, 2013 (z) |
| Net asset value, beginning |
| $16.06 |
| |
| $16.00 |
| |
| $17.18 |
|
| Income from investment operations: | | | | | |
| Net investment income (loss) | (.02 | ) | | .02 |
| | (.05 | ) |
| Net realized and unrealized gain (loss) | .26 |
| | .06 |
| | (.63 | ) |
| Total from investment operations | .24 |
| | .08 |
| | (.68 | ) |
| Distributions from: | | | | | |
| Net investment income | ** |
| | (.02 | ) | | — |
|
| Net realized gain | — |
| | — |
| | (.50 | ) |
| Total distributions | — |
| | (.02 | ) | | (.50 | ) |
| Total increase (decrease) in net asset value | .24 |
| | .06 |
| | (1.18 | ) |
| Net asset value, ending |
| $16.30 |
| |
| $16.06 |
| |
| $16.00 |
|
| | | | | | |
| Total return* | 1.51 | % | | .53 | % | | (4.10 | %) |
Ratios to average net assets: A | | | | | |
| Net investment income (loss) | (.03%) (a) |
| | .13 | % | | (.29 | %) |
| Total expenses | 2.60% (a) |
| | 2.09 | % | | 2.19 | % |
| Expenses before offsets | 2.04% (a) |
| | 2.04 | % | | 2.04 | % |
| Net expenses | 2.04% (a) |
| | 2.04 | % | | 2.04 | % |
| Portfolio turnover | 433 | % | | 835 | % | | 497 | % |
| Net assets, ending (in thousands) |
| $2,340 |
| |
| $2,629 |
| |
| $3,592 |
|
| | | | | | |
|
| | | | | | | | | | | |
| | | | YEARS ENDED | | |
CLASS C SHARES | SEPTEMBER 30, 2012 | | SEPTEMBER 30, 2011 | | SEPTEMBER 30, 2010 |
| Net asset value, beginning |
| $17.25 |
| |
| $16.58 |
| |
| $16.10 |
|
| Income from investment operations: | | | | | |
| Net investment income (loss) | (.05 | ) | | ** |
| | .09 |
|
| Net realized and unrealized gain (loss) | .41 |
| | .90 |
| | .89 |
|
| Total from investment operations | .36 |
| | .90 |
| | .98 |
|
| Distributions from: | | | | | |
| Net investment income | — |
| | ** |
| | (.09 | ) |
| Net realized gain | (.43 | ) | | (.23 | ) | | (.41 | ) |
| Total distributions | (.43 | ) | | (.23 | ) | | (.50 | ) |
| Total increase (decrease) in net asset value | (.07 | ) | | .67 |
| | .48 |
|
| Net asset value, ending |
| $17.18 |
| |
| $17.25 |
| |
| $16.58 |
|
| | | | | | |
| Total return* | 2.15 | % | | 5.55 | % | | 6.25 | % |
Ratios to average net assets: A | | | | | |
| Net investment income (loss) | (.47 | %) | | (.03 | %) | | .37 | % |
| Total expenses | 2.20 | % | | 2.76 | % | | 7.13 | % |
| Expenses before offsets | 2.04 | % | | 2.04 | % | | 2.05 | % |
| Net expenses | 2.04 | % | | 2.04 | % | | 2.04 | % |
| Portfolio turnover | 311 | % | | 668 | % | | 401 | % |
| Net assets, ending (in thousands) |
| $4,511 |
| |
| $2,119 |
| |
| $1,154 |
|
| See notes to financial highlights. |
26 www.calvert.com CALVERT GOVERNMENT FUND SEMI-ANNUAL REPORT (UNAUDITED)
FINANCIAL HIGHLIGHTS
|
| | | | | | | | | | | |
| | | PERIODS ENDED | |
CLASS I SHARES | MARCH 31, 2015 | | SEPTEMBER 30, 2014 (z) | | SEPTEMBER 30, 2013 (z) |
| Net asset value, beginning |
| $16.20 |
| |
| $16.14 |
| |
| $17.31 |
|
| Income from investment operations: | | | | | |
| Net investment income | .11 |
| | .23 |
| | .17 |
|
| Net realized and unrealized gain (loss) | .24 |
| | .07 |
| | (.64 | ) |
| Total from investment operations | .35 |
| | .30 |
| | (.47 | ) |
| Distributions from: | | | | | |
| Net investment income | (.10 | ) | | (.24 | ) | | (.20 | ) |
| Net realized gain | — |
| | — |
| | (.50 | ) |
| Total distributions | (.10 | ) | | (.24 | ) | | (.70 | ) |
| Total increase (decrease) in net asset value | .25 |
| | .06 |
| | (1.17 | ) |
| Net asset value, ending |
| $16.45 |
| |
| $16.20 |
| |
| $16.14 |
|
| | | | | | |
| Total return* | 2.19 | % | | 1.86 | % | | (2.85 | %) |
Ratios to average net assets: A | | | | | |
| Net investment income | 1.28% (a) |
| | 1.45 | % | | 1.01 | % |
| Total expenses | .91% (a) |
| | .77 | % | | .88 | % |
| Expenses before offsets | .74% (a) |
| | .73 | % | | .73 | % |
| Net expenses | .74% (a) |
| | .73 | % | | .73 | % |
| Portfolio turnover | 433 | % | | 835 | % | | 497 | % |
| Net assets, ending (in thousands) |
| $10,287 |
| |
| $10,719 |
| |
| $12,873 |
|
| | | | | | |
|
| | | | | | | | | |
| | PERIODS ENDED | | |
CLASS I SHARES | SEPTEMBER 30, 2012 | | SEPTEMBER 30, 2011 # | | |
| Net asset value, beginning |
| $17.30 |
| |
| $16.74 |
| | |
| Income from investment operations: | | | | | |
| Net investment income | .15 |
| | .08 |
| | |
| Net realized and unrealized gain (loss) | .44 |
| | .56 |
| | |
| Total from investment operations | .59 |
| | .64 |
| | |
| Distributions from: | | | | | |
| Net investment income | (.15 | ) | | (.08 | ) | | |
| Net realized gain | (.43 | ) | | — |
| | |
| Total distributions | (.58 | ) | | (.08 | ) | | |
| Total increase (decrease) in net asset value | .01 |
| | .56 |
| | |
| Net asset value, ending |
| $17.31 |
| |
| $17.30 |
| | |
| | | | | | |
| Total return* | 3.55 | % | | 3.86 | % | | |
Ratios to average net assets: A | | | | | |
| Net investment income | .86 | % | | 1.19% (a) |
| | |
| Total expenses | .79 | % | | 1.06% (a) |
| | |
| Expenses before offsets | .73 | % | | .73% (a) |
| | |
| Net expenses | .73 | % | | .73% (a) |
| | |
| Portfolio turnover | 311 | % | | 668%*** |
| | |
| Net assets, ending (in thousands) |
| $19,720 |
| |
| $22,292 |
| | |
| See notes to financial highlights. |
www.calvert.com CALVERT GOVERNMENT FUND SEMI-ANNUAL REPORT (UNAUDITED) 27
|
|
A Total expenses do not reflect amounts reimbursed and/or waived by the Advisor or reductions from expense offset arrangements. Expenses before offsets reflect expenses after reimbursement and/or waiver by the Advisor but prior to reductions from expense offset arrangements. Net expenses are net of all reductions and represent the net expenses paid by the Fund. (a) Annualized. (z) Per share figures are calculated using the Average Shares Method. * Total return is not annualized for periods of less than one year and does not reflect deduction of any front-end or deferred sales charge. ** Less than $.01 per share. *** Portfolio turnover is not annualized for periods of less than one year. # From April 29, 2011 inception. See notes to financial statements. |
28 www.calvert.com CALVERT GOVERNMENT FUND SEMI-ANNUAL REPORT (UNAUDITED)
EXPLANATION OF FINANCIAL TABLES
SCHEDULE OF INVESTMENTS
The Schedule of Investments is a snapshot of all securities held in the fund at their market value, on the last day of the reporting period. Securities are listed by asset type (e.g., common stock, corporate bonds, U.S. government obligations) and may be further broken down into sub-groups and by industry classification.
STATEMENT OF ASSETS AND LIABILITIES
The Statement of Assets and Liabilities is often referred to as the fund’s balance sheet. It lists the value of what the fund owns, is due and owes on the last day of the reporting period. The fund’s assets include the market value of securities owned, cash, receivables for securities sold and shareholder subscriptions, and receivables for dividends and interest payments that have been earned, but not yet received. The fund’s liabilities include payables for securities purchased and shareholder redemptions, and expenses owed but not yet paid. The statement also reports the fund’s net asset value (NAV) per share on the last day of the reporting period. The NAV is calculated by dividing the fund’s net assets (assets minus liabilities) by the number of shares outstanding. This statement is accompanied by a Schedule of Investments. Alternatively, if certain conditions are met, a Statement of Net Assets may be presented in lieu of this statement and the Schedule of Investments.
STATEMENT OF NET ASSETS
The Statement of Net Assets provides a detailed list of the fund’s holdings, including each security’s market value on the last day of the reporting period. The Statement of Net Assets includes a Schedule of Investments. Other assets are added and other liabilities subtracted from the investments total to calculate the fund’s net assets. Finally, net assets are divided by the outstanding shares of the fund to arrive at its share price, or Net Asset Value (NAV) per share.
At the end of the Statement of Net Assets is a table displaying the composition of the fund’s net assets. Paid in Capital is the money invested by shareholders and represents the bulk of net assets. Undistributed Net Investment Income and Accumulated Net Realized Gains usually approximate the amounts the fund had available to distribute to shareholders as of the statement date. Accumulated Realized Losses will appear as negative balances. Unrealized Appreciation (Depreciation) is the difference between the market value of the fund’s investments and their cost, and reflects the gains (losses) that would be realized if the fund were to sell all of its investments at their statement-date -values.
STATEMENT OF OPERATIONS
The Statement of Operations summarizes the fund’s investment income earned and expenses incurred in operating the fund. Investment income includes dividends earned from stocks and interest earned from interest-bearing securities in the fund. Expenses incurred in operating the fund include the advisory fee paid to the investment advisor, administrative services fees, distribution plan expenses (if applicable), transfer agent fees, shareholder servicing expenses, custodial, legal, and audit fees, and the printing and postage expenses related to shareholder reports. Expense offsets (fees paid indirectly) may also be shown. Credits earned from offset arrangements may be used to reduce the fund’s expenses. This statement also shows net gains (losses) realized on the sale of investments and the increase or decrease in the unrealized appreciation (depreciation) on investments held during the period.
www.calvert.com CALVERT GOVERNMENT FUND SEMI-ANNUAL REPORT (UNAUDITED) 29
STATEMENT OF CHANGES IN NET ASSETS
The Statement of Changes in Net Assets shows how the fund’s total net assets changed during the two most recent reporting periods. Changes in the fund’s net assets are attributable to investment operations, distributions and capital share transactions.
The Operations section of the report summarizes information detailed in the Statement of Operations. The Distribution section shows the dividend and capital gain distributions made to shareholders. The amounts shown as distributions in this section may not match the net investment income and realized gains amounts shown in the Operations section because distributions are determined on a tax basis and certain investments or transactions may be treated differently for financial statement and tax purposes. The Capital Share Transactions section shows the amount shareholders invested in the fund, either by purchasing shares or by reinvesting distributions, and the amounts redeemed. The corresponding numbers of shares issued, reinvested and redeemed are shown at the end of the report.
FINANCIAL HIGHLIGHTS
The Financial Highlights table provides a per-share breakdown per class of the components that affect the fund’s net asset value for current and past reporting periods. The table provides total return, total distributions, expense ratios, portfolio turnover and net assets for the applicable period. Total return is a measure of a fund’s performance that encompasses all elements of return: dividends, capital gain distributions and changes in net asset value. Total return is the change in value of an investment over a given period, assuming reinvestment of any dividends and capital gain distributions, expressed as a percentage of the initial investment. Total distributions include distributions from net investment income and net realized gains. Long-term gains are earned on securities held in the fund more than one year. Short-term gains, on the sale of securities held less than one year, are treated as ordinary dividend income for tax purposes. The expense ratio is a fund’s cost of doing business, expressed as a percentage of net assets. These expenses directly reduce returns to shareholders. Portfolio turnover measures the trading activity in a fund’s investment portfolio—how often securities are bought and sold by a fund. Portfolio turnover is affected by market conditions, changes in the size of the fund, the nature of the fund’s investments and the investment style of the portfolio manager.
PROXY VOTING
The Proxy Voting Guidelines of the Calvert Funds that the Fund uses to determine how to vote proxies relating to portfolio securities are provided as an Appendix to the Fund’s Statement of Additional Information. The Statement of Additional Information can be obtained free of charge by calling the Fund at 1-800-368-2745, by visiting the Calvert website at www.calvert.com; or by visiting the SEC’s website at www.sec.gov.
Information regarding how the Fund voted proxies relating to portfolio securities during the most recent 12-month period ended June 30 is available on the Fund’s website at www.calvert.com and on the SEC’s website at www.sec.gov.
AVAILABILITY OF QUARTERLY PORTFOLIO HOLDINGS
The Fund files its complete schedule of portfolio holdings with the SEC for the first and third quarters of each fiscal year on Form N-Q. The Fund’s Form N-Q is available on the SEC’s website at www.sec.gov. The Fund’s Form N-Q may be reviewed and copied at the SEC’s Public Reference Room in Washington, DC; information on the operation of the Public Reference Room may be obtained by calling 1-800-SEC-0330.
30 www.calvert.com CALVERT GOVERNMENT FUND SEMI-ANNUAL REPORT (UNAUDITED)
BASIS FOR BOARD’S APPROVAL OF INVESTMENT ADVISORY CONTRACT
At a meeting held on December 10, 2014, the Board of Trustees, and by a separate vote, the disinterested Trustees, approved the continuance of the Investment Advisory Agreement between The Calvert Fund and the Advisor with respect to the Fund.
In evaluating the Investment Advisory Agreement, the Board considered a variety of information relating to the Fund and the Advisor. The disinterested Trustees reviewed a report prepared by the Advisor regarding various services provided to the Fund by the Advisor and its affiliates. Such report included, among other data, information regarding the Advisor's personnel and the Advisor's revenue and cost of providing services to the Fund, and a separate report prepared by an independent third party, which provided a statistical analysis comparing the Fund's investment performance, expenses, and fees to comparable mutual funds.
The disinterested Trustees were separately represented by independent legal counsel with respect to their consideration of the reapproval of the Investment Advisory Agreement. Prior to voting, the disinterested Trustees reviewed the proposed continuance of the Investment Advisory Agreement with management and also met in private sessions with their counsel at which no representatives of management were present.
In the course of its deliberations regarding the Investment Advisory Agreement, the Board considered the following factors, among others: the nature, extent and quality of the services provided by the Advisor, including the personnel providing such services; the Advisor's financial condition; the level and method of computing the Fund’s advisory fee; comparative performance, fee and expense information for the Fund; the profitability of the Calvert Family of Funds to the Advisor and its affiliates; the direct and indirect benefits, if any, derived by the Advisor and its affiliates from their relationship with the Fund; the effect of the Fund's growth and size on the Fund's performance and expenses; the affiliated distributor’s process for monitoring sales load breakpoints; the Advisor's compliance programs and policies; the Advisor's performance of substantially similar duties for other funds; and any possible conflicts of interest.
In considering the nature, extent and quality of the services provided by the Advisor under the Investment Advisory Agreement, the Board reviewed information provided by the Advisor relating to its operations and personnel, including, among other information, biographical information on the Advisor's investment, supervisory and professional staff and descriptions of its organizational and management structure. The Board also took into account similar information provided periodically throughout the previous year by the Advisor, as well as the Board’s familiarity with management through Board of Trustees' meetings, discussions and other reports. The Board considered the Advisor’s management style and its performance in employing its investment strategies, as well as its current level of staffing and overall resources. The Board also noted that it reviewed on a quarterly basis information regarding the Advisor’s compliance with applicable policies and procedures, including those related to personal investing. The Advisor's administrative capabilities, including its ability to supervise the other service providers for the Fund, were also considered. The Board also took into account the environmental, social, sustainability and governance research and analysis provided by the Advisor to the Fund. The Board observed that the scope of services provided by the Advisor generally had expanded over time as a result of regulatory, market and other changes. The Board took into consideration, among other factors, the effectiveness of the Fund’s and Advisor’s processes, policies and procedures and the Advisor’s personnel. The Board also took into account, among other items, periodic reports received from the Advisor over the past year concerning the Advisor’s ongoing review and enhancement of certain
www.calvert.com CALVERT GOVERNMENT FUND SEMI-ANNUAL REPORT (UNAUDITED) 31
processes, policies and procedures of the Funds and the Advisor. The Board concluded that it was satisfied with the nature, extent and quality of services provided to the Fund by the Advisor under the Investment Advisory Agreement.
In considering the Fund's performance, the Board noted that it reviewed on a quarterly basis detailed information about the Fund's performance results, portfolio composition and investment strategies. In addition, the Board took into account overall financial market conditions. The Board also reviewed various comparative data provided to it in connection with its consideration of the renewal of the Investment Advisory Agreement, including, among other information, a comparison of the Fund's total return with its Lipper index and with that of other mutual funds deemed to be in its peer group by an independent third party in its report. This comparison indicated that the Fund performed below the median of its peer group for the one- and three-year periods ended June 30, 2014, and performed above the median of its peer group for the five-year period ended June 30, 2014. The data also indicated that the Fund underperformed its Lipper index for the one-, three- and five-year periods ended June 30, 2014. The Board took into account management’s discussion of the Fund’s performance and management’s plans with respect to the Fund. Based upon its review, the Board concluded that appropriate action was being taken with respect to the Fund’s performance.
In considering the Fund’s fees and expenses, the Board compared the Fund’s fees and total expense ratio with various comparative data for the funds in its peer group. The Board noted that the Fund’s entire advisory fee was being waived. Among other findings, the data indicated that the Fund’s total expenses (net of waivers and/or reimbursements) were above the median of its peer group. The Board noted that the allocation of advisory and administrative fees may vary among the Fund’s peer group. The Board also noted that the Advisor had agreed to reduce the advisory fee it charged to the Fund effective January 1, 2014. The Board took into account the Advisor’s current undertaking to maintain expense limitations for the Fund and that the Advisor was reimbursing a portion of the Fund’s expenses. The Board also noted management’s discussion of the Fund’s expenses and certain factors that affected the level of such expenses, including the cost of providing the environmental, social, sustainability and governance research and analysis provided by the Advisor. Based upon its review, the Board concluded that the advisory fee was reasonable in view of the quality of services received by the Fund from the Advisor and the other factors considered.
The Board reviewed the Advisor’s profitability on a fund-by-fund basis. In reviewing the overall profitability of the advisory fee to the Fund's Advisor, the Board also considered the fact that affiliates of the Advisor provided shareholder servicing, administrative and distribution services to the Fund for which they received compensation. The information considered by the Board included Calvert's operating profit margin information both before and after tax expenses with respect to the services that the Advisor and its affiliates provided to the Calvert Family of Funds complex. The Board reviewed the profitability of the Advisor's relationship with the Fund in terms of the total amount of annual advisory fees it received with respect to the Fund and whether the Advisor had the financial wherewithal to continue to provide services to the Fund. The Board noted that the Advisor was reimbursing a portion of the Fund’s expenses. The Board also noted the Advisor’s current undertaking to maintain expense limitations for all of the Fund’s share classes and that the Advisor and one of its affiliates had agreed to reduce the advisory and administrative fees they charged to the Fund, respectively. The Board also considered that the Advisor derived benefits to its reputation and other indirect benefits from its relationship with the Fund. Based upon its review, the Board concluded that the Advisor's and its affiliates’ level of profitability from their relationship with the Fund was reasonable.
32 www.calvert.com CALVERT GOVERNMENT FUND SEMI-ANNUAL REPORT (UNAUDITED)
The Board considered the effect of the Fund’s current size and its potential growth on its performance and expenses. The Board concluded that adding breakpoints to the advisory fee at specified asset levels would not be appropriate at this time given the Fund’s current size. The Board noted that if the Fund's assets increased over time, the Fund might realize other economies of scale if assets increased proportionally more than certain other expenses.
In reapproving the Investment Advisory Agreement, the Board, including the disinterested Trustees, did not identify any single factor as controlling, and each Trustee may have attributed different weight to various factors.
Conclusions
The Board reached the following conclusions regarding the Investment Advisory Agreement, among others: (a) the Advisor has demonstrated that it possesses the capability and resources to perform the duties required of it under the Investment Advisory Agreement; (b) the Advisor maintains appropriate compliance programs; (c) appropriate action is being taken with respect to the Fund’s performance; (d) the Advisor is likely to execute its investment strategies consistently over time; and (e) the Fund's advisory fee is reasonable in view of the quality of services received by the Fund from the Advisor and the other factors considered. Based on its conclusions, the Board determined that reapproval of the Investment Advisory Agreement would be in the best interests of the Fund and its shareholders.
www.calvert.com CALVERT GOVERNMENT FUND SEMI-ANNUAL REPORT (UNAUDITED) 33
To Open an Account
800-368-2748
Service for Existing Account
Shareholders: 800-368-2745
Brokers: 800-368-2746
TDD for Hearing Impaired
800-541-1524
Registered Mail
Calvert Investments
c/o BFDS,
P.O. Box 219544
Kansas City, MO 64121-9544
Overnight Mail
Calvert Investments
c/o BFDS,
330 West 9th Street
Kansas City, MO 64105
Web Site
www.calvert.com
Principal Underwriter
Calvert Investment Distributors, Inc.
4550 Montgomery Avenue
Suite 1000 North
Bethesda, Maryland 20814
|
| | | |
CALVERT GOVERNMENT FUND | CALVERT’S FAMILY OF FUNDS | | |
| | Municipal Funds Tax-Free Bond Fund Taxable Bond Funds Bond Portfolio Income Fund Short Duration Income Fund Long-Term Income Fund Ultra-Short Income Fund High Yield Bond Fund Green Bond Fund Unconstrained Bond Fund Balanced and Asset Allocation Funds Balanced Portfolio Conservative Allocation Fund Moderate Allocation Fund Aggressive Allocation Fund | | Equity Funds Large Cap Core Portfolio Equity Portfolio Large Cap Value Fund Social Index Fund Capital Accumulation Fund International Equity Fund Small Cap Fund Global Energy Solutions Fund Global Water Fund International Opportunities Fund Equity Income Fund Emerging Markets Equity Fund |
| | |
This report is intended to provide fund information to shareholders. It is not authorized for distribution to prospective investors unless preceded or accompanied by a prospectus.
Note: The information on our website is not incorporated by reference into this report; our website address is included as an inactive textual reference only.
Investors should carefully consider the investment objectives, risks, charges and expenses of the Calvert Funds. This and other important information is contained in the fund’s summary prospectus and prospectus, which can be obtained from your financial professional and should be read carefully before investing. You may also call Calvert at 800/368-2748 or visit www. calvert.com.
Printed on recycled paper using soy inks.
|
| | |
| | |
| | | |
| Calvert High Yield Bond Fund | | |
| | | |
| | |
|
| |
Semi-Annual Report March 31, 2015
E-Delivery Sign-Up — Details Inside | |
Choose Planet-friendly E-delivery!
Sign up now for on-line statements, prospectuses, and fund reports. In less than five minutes you can help reduce paper mail and lower fund costs.
Just go to www.calvert.com. If you already have an online account at Calvert, click on Login, to access your Account, and select the documents you would like to receive via e-mail.
If you’re new to online account access, click on Login, then Register to create your user name and password. Once you’re in, click on the E-delivery sign-up on the Account Portfolio page and follow the quick, easy steps.
Note: if your shares are not held directly at Calvert but through a brokerage firm, you must contact your broker for electronic delivery options available through their firm.
|
| | | |
| TABLE OF CONTENTS |
| | | | |
| | | | President's Letter |
| | | | Portfolio Management Discussion |
| | | | Shareholder Advocacy Update |
| | | | Shareholder Expense Example |
| | | | Schedule of Investments |
| | | | Statement of Assets and Liabilities |
| | | | Statement of Operations |
| | | | Statements of Changes in Net Assets |
| | | | Notes to Financial Statements |
| | | | Financial Highlights |
| | | | Explanation of Financial Tables |
| | | | Proxy Voting |
| | | | Availability of Quarterly Portfolio Holdings |
| | | | Basis for Board’s Approval of Investment Advisory Contract |
|
| |
| John Streur President and Chief Executive Officer, Calvert Investments, Inc. |
Dear Calvert Shareowner,
The United States economy improved throughout 2014 and into the first quarter of 2015, while major economies in other regions of the world struggled to regain momentum or saw slowing growth. It is still too early to declare victory, but one may say that while the United States led the world into financial crisis nearly eight years ago, the innovative and aggressive responses to the crisis by our policymakers are allowing the United States to recover more quickly. Granted, the United States has the benefit of possessing the world’s reserve currency and our monetary maneuvers in our self-interest are not without cost to economies in other regions.
As 2014 drew to a close, the United States was winding down the quantitative easing portion of its post-crisis monetary policy while the European and Japanese central banks were finding it necessary to increase their own forms of quantitative easing in efforts to support asset prices and spur economic growth.
The impact of modestly improving economic activity in the U.S. and ongoing low global interest rates on financial assets in 2014 created positive returns for most stocks and bonds for the previous 12 months, a condition that gave benefit to most Calvert Funds. The exceptions are assets tied to the price of oil, which collapsed during the second half of the year. Energy industries and natural resource based companies, including renewable energy companies and water related companies, saw their stock valuations drop in reaction.
Across our fixed income and equity strategies, Calvert finds more utility in conducting fundamental research in order to find relative values in securities of individual companies than we do in attempting to anticipate or time changes in global economic indicators. Broadly, we are mindful of the fact that stocks and bonds have benefitted substantially from the easy monetary policies and ultra-low interest rates of the post-crisis era. We believe markets are more or less fairly valued and we have taken steps seeking to moderate the risk across our portfolios.
As I take the helm at Calvert and look back at the 39 years since the firm’s founding in 1976, I note the substantial growth in the world’s population, the massive increase in the industrialization of our global society, and the associated change in the role of corporations in societal and environmental outcomes for our future.
4 www.calvert.com CALVERT HIGH YIELD BOND FUND SEMI-ANNUAL REPORT (UNAUDITED)
Public companies have created tremendous net benefits to society through advances in health care, food systems, energy efficiency, communications and technology, and access to finance and other products and services too vast to detail. Hundreds of millions of people throughout the world have seen their standard of living increased through benefits created by corporate activity.
Along with the obvious net benefits to society, we are aware of the substantial stresses placed upon society and the environment from corporate behaviors. At the same time, society has awarded corporations an increasingly prominent role in the day-to-day outcomes of our lives and in the societal and environmental outcomes that will determine the future direction of the world.
Calvert, as a global investment management firm and a steward of client assets, has a growing and evolving role as a leader in responsible investing. Calvert has a rich history as a socially responsible investor and has made many contributions to public policy and corporate governance. Today we are bringing Calvert’s deep expertise in socially responsible investing, public and private policy work, and investment management to a new level with a focus on developing principles and setting standards for use in our investment management processes, our active ownership and engagement discipline and within our investment risk management processes.
As a long-term investor with unique insights into environmental, social, and governance activities of companies throughout the world, Calvert is able to develop a holistic view of companies’ operations. Our ability to use our insights for the benefit of the stewardship of client assets, both to produce desirable investment outcomes for our clients and to assist companies in evolving their role in society along a responsible path has never been more important.
As fellow shareowners of Calvert Funds, you and I know that it is essential to pursue the type of enduring value that Calvert seeks to create, through excellence in financial results balanced with the evolving needs of society and the environment.
Thank you for your share ownership in Calvert Funds; all of us at Calvert Investments, Inc. appreciate the confidence and trust you have placed in us.
John Streur
April 2015
www.calvert.com CALVERT HIGH YIELD BOND FUND SEMI-ANNUAL REPORT (UNAUDITED) 5
|
| |
| PORTFOLIO MANAGEMENT DISCUSSION |
|
| |
| Catherine Roy, CFA Senior Vice President and Chief Investment Officer, Fixed Income |
Investment Climate
A very divergent economic picture between the United States and much of the rest of the world prompted central bank actions that affected global currencies and drove financial-market returns over the six-month reporting period. The markets also reacted to new information on key geopolitical situations, notably in the Ukraine.
The economic divergence theme was apparent in Europe, which featured consumer price deflation in many countries. China and Japan also experienced slower growth. In the United States, economic growth pulled back from the strong pace set in mid-2014 to a rate more in line with the Fed’s projected long-run average of 2.2%. While modest, this growth rate was superior to that of many other countries. The U.S. headline Consumer Price Index, which measures inflation excluding volatile food and energy prices, became slightly negative towards the end of the reporting period.
In January, the European Central Bank (ECB) announced a long-awaited quantitative easing program, which had significant market impact. In anticipation of the January ECB decision, some other European central banks, as well as Japan and China, increased monetary accommodation through interest-rate cuts and/or expanded bond purchase programs. In stark contrast, the U.S. Federal Reserve prepared markets for a small and slow series of interest-rate increases, slated to start sometime in 2015. The Fed anticipates that extremely low domestic inflation will be transitory, driven by the drop in energy prices, and is not a problem brought on by lack of consumer demand. In addition, the U.S. labor market is relatively strong, which has long been one condition the Fed required to start a slow removal of monetary accommodation.
Big moves in the world’s major currencies were a byproduct of these central bank actions. In the middle of 2014, the U.S. dollar began a sharp climb against other currencies that drove it to multi-year highs. The Bloomberg DXY, an index that measures the dollar against major currencies, appreciated 14.5% over the six-month reporting period. Tightly correlated to the dollar’s rally was a sharp drop in the price of oil—a market set up for a price collapse due to a massive demand-supply imbalance.
Bonds Provided Positive Returns
The global fixed-income markets generally reacted positively to the ECB-led central bank easing. U.S. bond yields gyrated over the reporting period, but at the end tended to be lower and so bond returns were positive.
6 www.calvert.com CALVERT HIGH YIELD BOND FUND SEMI-ANNUAL REPORT (UNAUDITED)
|
| | | | |
| | | | |
| | CALVERT HIGH YIELD BOND FUND | |
| | MARCH 31, 2015 | |
| | | | |
| | ECONOMIC SECTORS | % OF TOTAL INVESTMENTS | |
| | Corporate | 89.3 | % | |
| | Financial Institutions | 7.1 | % | |
| | Industrial | 79.8 | % | |
| | Utility | 2.4 | % | |
| | Municipal | 0.3 | % | |
| | Government Public Service | 0.3 | % | |
| | Securitized | 2.9 | % | |
| | Asset-Backed Securities | 1.3 | % | |
| | Commercial Mortgage-Backed Securities | 1.6 | % | |
| | Short-Term Investments | 7.5 | % | |
| | Total | 100 | % | |
| | | | |
The ten-year T-note yield fell 58 basis points1 (bps) to 1.94%, while the 30-year fixed-rate mortgage average fell 50 bps to 3.69%. The Barclays U.S. Credit Index average yield declined 18 bps to 2.83%.
In terms of total return, the Barclays Long Credit Index rose 7.24%, the broad intermediate Barclays U.S. Credit Index returned 3.96%, and the shorter-term Barclays 1-5 Year U.S. Credit Index was up 1.48%. The Barclays US Aggregate Index returned 3.43% and the Bank of America Merrill Lynch High Yield Master II Index was little changed, up 1.45%.
Outlook
The United States economy is expanding moderately and has weathered global weakness better than other most other major economies. The 5.5% headline unemployment rate is just above the Federal Open Market Commission’s (FOMC) long-term target range. Wage growth is modest but steady. The labor-force participation rate, however, remains low—influenced by demographics and the long-term loss of traditional middle-wage jobs to overseas
|
| | | | | | |
| | | | | |
| | CALVERT HIGH YIELD BOND FUND | |
| | MARCH 31, 2015 | |
| | | | | |
| | INVESTMENT PERFORMANCE | |
| | (TOTAL RETURN AT NAV*) | |
| | | 6 MONTHS ENDED 3/31/15 | 12 MONTHS ENDED 3/31/15
| |
| | Class A | -1.02 | % | -1.65 | % | |
| | Class C | -1.50 | % | -2.61 | % | |
| | Class I | -0.84 | % | -1.30 | % | |
| | Class Y | -0.89 | % | -1.41 | % | |
| | | | | |
| | BofA Merrill Lynch High Yield Master II Index | 1.45 | % | 2.05 | % | |
| | | | | |
| | Lipper High Yield Funds Average | 0.56 | % | 0.59 | % | |
| | | | | |
| | | 30 DAYS ENDED | |
| | SEC YIELD | 9/30/14 | 3/31/15 | |
| | Class A | 5.14 | % | 4.25 | % | |
| | Class C | 4.31 | % | 3.41 | % | |
| | Class I | 5.68 | % | 4.75 | % | |
| | Class Y | 5.60 | % | 4.67 | % | |
| | | |
| | * Investment performance/return at NAV does not reflect the deduction of the Fund’s maximum 3.75% front-end sales charge or any deferred sales charge. | |
| | | | | |
competition and automation. Workers in general, however, are in improved bargaining positions. The Fed’s benchmark consumer inflation rate hovers around zero, sharply below the 2% target.
Despite another cold winter, U.S. economic growth in 2015 could approach 3% in the absence of a material systemic shock. We expect inflation to continue well below the Fed’s 2% target. Improvement in the labor market should continue, with unemployment below 5.5%. Discord on Capitol Hill promises to add some uncertainty to late-summer debt-ceiling negotiations. Household consumption remains the major engine of growth and should be supported by lower
www.calvert.com CALVERT HIGH YIELD BOND FUND SEMI-ANNUAL REPORT (UNAUDITED) 7
energy prices. Lower energy prices, however, are likely to depress earnings and investment from energy-industry companies and the much-stronger dollar may dampen overall U.S. corporate earnings. Housing-sector activity remains a disappointment, despite very low mortgage rates, and residential mortgage lending remains relatively restrained in the post-crisis market. The U.S. trade situation may deteriorate given continued strength of the dollar, which could drive up import costs.
If U.S. data trends hold, within the context of the global backdrop of disinflation and central bank easing, we expect the Fed to raise short-term interest rates by late 2015. If lift-off is in 2015, however, we expect no more than two quarter-point increases over the balance of the year. If the weaker global picture and price disinflation persist, there is a reasonable chance the Fed will delay any rate increases into 2016.
Over the longer term, we expect the benchmark 10-year T-note yield to fluctuate between 2% and 3%, influenced by the trend in economic data surprises, major central bank forward guidance, expected low global inflation rates, and flows in global fixed-income markets. We expect short-term money markets rates to remain close to zero percent for much of 2015.
Calvert Investment Management, Inc.
April 2015
1. A basis point is 0.01 percentage points.
|
| | | | |
| | | | |
| | CALVERT HIGH YIELD BOND FUND | |
| | MARCH 31, 2015 | |
| | | | |
| | AVERAGE ANNUAL TOTAL RETURNS | |
| | | | |
| | CLASS A SHARES | (WITH MAX. LOAD) | |
| | One year | -5.34 | % | |
| | Five year | 7.10 | % | |
| | Ten year | 6.60 | % | |
| | | | |
| | CLASS C SHARES* | (WITH MAX. LOAD) | |
| | One year | -3.58 | % | |
| | Five year | 7.18 | % | |
| | Ten year | 6.64 | % | |
| | | | |
| | CLASS I SHARES* | | |
| | One year | -1.30 | % | |
| | Five year | 8.47 | % | |
| | Ten year | 7.44 | % | |
| | | | |
| | CLASS Y SHARES* | | |
| | One year | -1.41 | % | |
| | Five year | 8.13 | % | |
| | Ten year | 7.11 | % | |
| | | | |
| | * Pursuant to an Agreement and Plan of Reorganization, Class A and Class I shares of Calvert High Yield Bond Fund, a series of Summit Mutual Funds, Inc. (“SMF High Yield”), were reorganized into the Class A and Class I shares, respectively, of an identical and newly created series of The Calvert Fund, Calvert High Yield Bond Fund, which commenced operations on September 18, 2009. The performance results prior to September 18, 2009, reflect the performance of SMF High Yield. In addition, performance results for Class A shares prior to February 1, 2007, the inception date for Class A shares of SMF High Yield, reflect the performance of Class I shares of SMF High Yield, adjusted for the 12b-1 distribution fees applicable to Class A. Performance results for Class C shares prior to October 31, 2011 (the Class C shares’ inception date) reflect the performance of Class A shares at net asset value. Actual Class C performance would have been different. Performance results for Class Y shares prior to July 29, 2011 (the Class Y shares’ inception date) reflect the performance of Class A shares at net asset value. Actual Class Y share performance would have been higher than Class A share performance because Class Y, unlike Class A, has no Rule 12b-1 fees. | |
8 www.calvert.com CALVERT HIGH YIELD BOND FUND SEMI-ANNUAL REPORT (UNAUDITED)
Growth of $10,000
The graph below shows the value of a hypothetical $10,000 investment in the Fund over the past 10 fiscal year periods. The results shown are for Class A and I shares and reflect the deduction of the maximum front-end Class A sales charge of 3.75%, and assume the reinvestment of dividends. The result is compared with benchmarks that include a broad based market index and a Lipper peer group average. Market indexes are unmanaged and their results do not reflect the effect of expenses or sales charges. The Lipper average reflects the deduction of the category’s average front-end sales charge. The value of an investment in a different share class would be different.
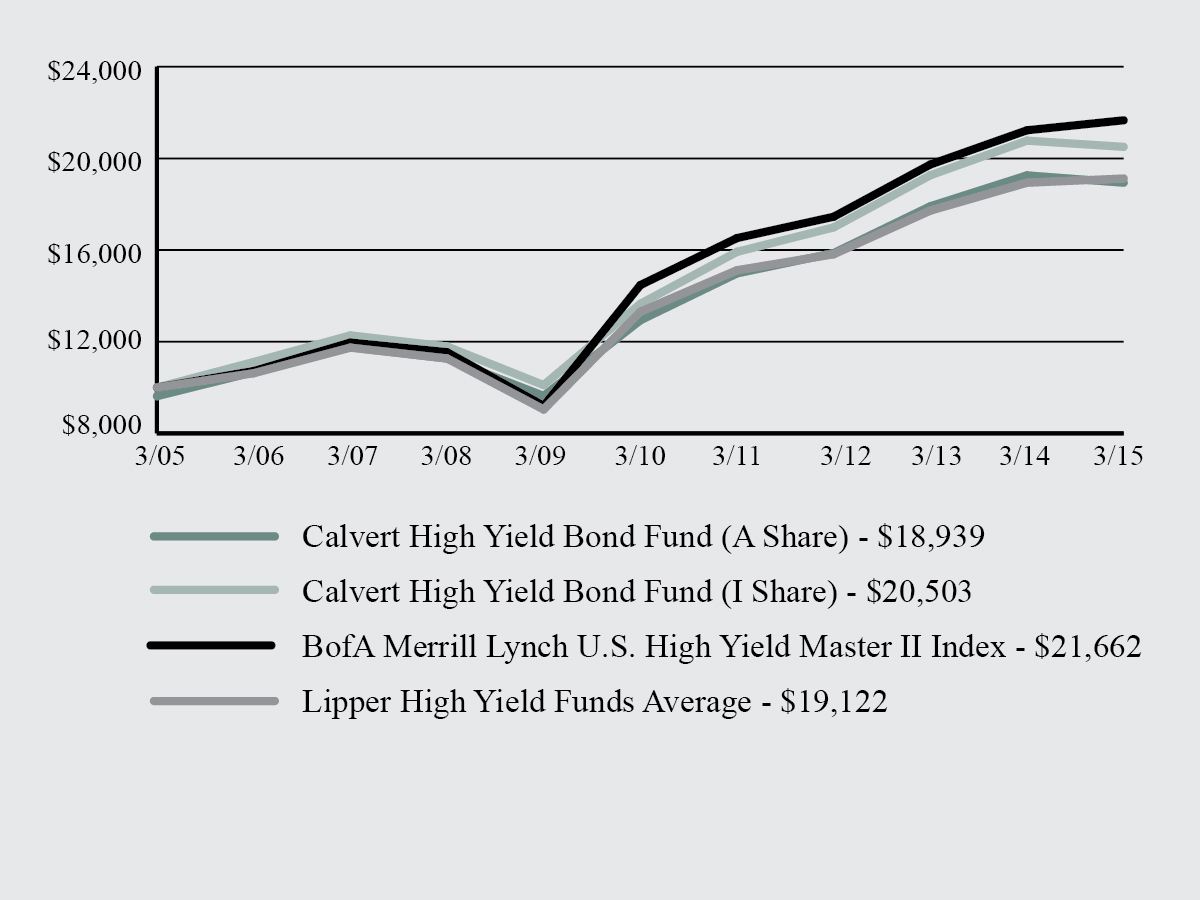
All performance data shown, including the graph above and the adjacent table, represents past performance, does not guarantee future results, assumes reinvestment of dividends and distributions and does not reflect the deduction of taxes that a shareholder would pay on the Fund’s distributions or the redemption of the Fund shares. All performance data reflects fee waivers and/or expense limitations, if any are in effect; in their absence performance would be lower. See Note B in Notes to Financial Statements. The investment return and principal value of an investment will fluctuate so that an investor’s shares, when redeemed, may be worth more or less than their original cost. Current performance may be lower or higher than the performance data quoted; for current performance data visit www.calvert.com. The gross expense ratio from the current prospectus for Class A shares is 1.37%. This number may differ from the expense ratio shown elsewhere in this report because it is based on a different time period and, if applicable, does not include fee or expense waivers. Performance data quoted already reflects the deduction of the Fund’s operating expenses.
www.calvert.com CALVERT HIGH YIELD BOND FUND SEMI-ANNUAL REPORT (UNAUDITED) 9
SHAREHOLDER ADVOCACY UPDATE
2014 Corporate Diversity Report Findings Released
In March, Calvert published its 2014 survey findings on the corporate diversity practices of the largely multinational companies that make up the Standard & Poor’s 100 Index (S&P 100), in follow-up to reports published in 2012 and 2010. Calvert believes companies that fully commit to providing a fair and equitable working environment will recognize gains in both the workplace and marketplace.
Key findings from the 2014 survey include:
| |
| • | Milestone for women in the board room. In 2014, every company in the S&P 100 had at least one woman on its board of directors. In addition, there was a 17% increase in companies with three or more women and/or minorities on their boards. |
| |
| • | Diversity commitment on the rise. In the past two years, top scores related to overall corporate commitment have increased by 45%.This stems primarily from greater board oversight of diversity initiatives and increased CEO and/or chair involvement. |
| |
| • | LGBT policies have advanced overall. However, initiatives for persons with disabilities continue to fall behind other groups. |
Overall, in 2014, we saw growing commitment to women and minority employees, momentum around family-friendly work environments, and accelerated progress in support of LGBT employees. Looking ahead, we hope to see enhanced corporate diversity commitments, greater representation of women and minorities on boards, improved EEO1-disclosure, and expanded diversity initiatives for persons with disabilities.
To learn the highest- and lowest-rated companies in the report, A Survey of Corporate Diversity Practices of the S&P 100, and to find out more about the report’s methodology and findings, visit www.calvert.com.
2015 Shareholder Resolutions
Building on our initiatives from 2014, Calvert was the lead filer on 38 shareholder resolutions for the 2015 proxy season, and co-filer on another 18 proposals. Key topics include “big data” and civil rights issues, sustainability reporting, board of director oversight of environmental and social matters, water risk, climate change and greenhouse gas emissions reductions, supply chain labor issues, and board diversity.
Specifically, Calvert asked 14 companies to set a goal and a timeline for reducing their greenhouse gas emissions and filed seven proposals asking companies to issue a sustainability report describing their environmental, social and governance (ESG) performance and goals. To push for improved boardroom diversity, Calvert filed six proposals with companies requesting they report on their plans to increase minority and women Board representation and assess the effectiveness of these efforts. We also filed seven proposals requesting that companies assess and manage the civil rights’ risks related to their use of big data, which refers to data sets so large or complex that traditional data processing applications are inadequate. We also filed proposals on water risk in the agricultural supply chain and on developing a sustainable agriculture policy.
To keep abreast of the outcomes of these 2015 shareholder resolutions, as well as Calvert’s proxy voting and public policy initiatives, visit the “Resources” section on www.calvert.com.
10 www.calvert.com CALVERT HIGH YIELD BOND FUND SEMI-ANNUAL REPORT (UNAUDITED)
SHAREHOLDER EXPENSE EXAMPLE
As a shareholder of the Fund, you incur two types of costs: (1) transaction costs, including sales charges (loads) and redemption fees; and (2) ongoing costs, including management fees; distribution (12b-1) fees; and other Fund expenses. This Example is intended to help you understand your ongoing costs (in dollars) of investing in the Fund and to compare these costs with the ongoing costs of investing in other mutual funds.
This Example is based on an investment of $1,000 invested at the beginning of the period and held for the entire period (October 1, 2014 to March 31, 2015).
Actual Expenses
The first line of the table below provides information about actual account values and actual expenses. You may use the information in this line, together with the amount you invested, to estimate the expenses that you paid over the period. Simply divide your account value by $1,000 (for example, an $8,600 account value divided by $1,000 = 8.6), then multiply the result by the number in the first line under the heading entitled "Expenses Paid During Period" to estimate the expenses you paid on your account during this period.
Hypothetical Example for Comparison Purposes
The second line of the table below provides information about hypothetical account values and hypothetical expenses based on the Fund’s actual expense ratio and an assumed rate of return of 5% per year before expenses, which is not the Fund’s actual return. The hypothetical account values and expenses may not be used to estimate the actual ending account balance or expenses you paid for the period. You may use this information to compare the ongoing costs of investing in the Fund and other funds. To do so, compare the 5% hypothetical example with the 5% hypothetical examples that appear in the shareholder reports of the other funds.
Please note that the expenses shown in the table are meant to highlight your ongoing costs only and do not reflect any transactional costs, such as sales charges (loads), or redemption fees. Therefore, the second line of the table is useful in comparing ongoing costs only, and will not help you determine the relative total costs of owning different funds. In addition, if these transactional costs were included, your costs would have been higher.
www.calvert.com CALVERT HIGH YIELD BOND FUND SEMI-ANNUAL REPORT (UNAUDITED) 11
|
| | | |
| | BEGINNING ACCOUNT VALUE 10/1/14 | ENDING ACCOUNT VALUE 3/31/15 | EXPENSES PAID DURING PERIOD* 10/1/14 - 3/31/15 |
CLASS A | | | |
| Actual | $1,000.00 | $989.81 | $5.31 |
| Hypothetical | $1,000.00 | $1,019.60 | $5.39 |
| (5% return per year before expenses) | | | |
| | | | |
CLASS C | | | |
| Actual | $1,000.00 | $984.95 | $10.24 |
| Hypothetical | $1,000.00 | $1,014.61 | $10.40 |
| (5% return per year before expenses) | | | |
| | | | |
CLASS I | | | |
| Actual | $1,000.00 | $991.62 | $3.67 |
| Hypothetical | $1,000.00 | $1,021.24 | $3.73 |
| (5% return per year before expenses) | | | |
| | | | |
CLASS Y | | | |
| Actual | $1,000.00 | $991.11 | $4.07 |
| Hypothetical | $1,000.00 | $1,020.84 | $4.13 |
| (5% return per year before expenses) | | | |
| | | | |
* Expenses are equal to the Fund’s annualized expense ratio of 1.07%, 2.07%, 0.74%, and 0.82% for Class A, Class C, Class I, and Class Y, respectively, multiplied by the average account value over the period, multiplied by 182/365 (to reflect the one-half year period).
|
12 www.calvert.com CALVERT HIGH YIELD BOND FUND SEMI-ANNUAL REPORT (UNAUDITED)
SCHEDULE OF INVESTMENTS
MARCH 31, 2015
|
| | | | | | |
COLLATERALIZED MORTGAGE-BACKED OBLIGATIONS (PRIVATELY ORIGINATED) - 1.3%
| PRINCIPAL AMOUNT | VALUE |
| | | |
| CAM Mortgage Trust: | | |
| 4.45%, 5/15/48 (e)(r) |
| $1,500,000 |
|
| $1,505,235 |
|
| 5.50%, 12/15/53 (e)(r) | 202,053 |
| 202,187 |
| | | |
Total Collateralized Mortgage-Backed Obligations (Privately Originated) (Cost $1,700,978) | | 1,707,422 |
| | | |
COMMERCIAL MORTGAGE-BACKED SECURITIES - 1.6% | | |
| Hilton USA Trust, 5.222%, 11/5/30 (e)(r) | 1,500,000 |
| 1,540,736 |
| ORES NPL LLC, 6.00%, 3/27/24 (e) | 500,000 |
| 500,000 |
| | | |
| Total Commercial Mortgage-Backed Securities (Cost $2,028,018) | | 2,040,736 |
|
| | | |
CORPORATE BONDS - 88.7% | | |
| 99 Cents Only Stores LLC, 11.00%, 12/15/19 | 500,000 |
| 525,000 |
| ADS Waste Holdings, Inc., 8.25%, 10/1/20 | 755,000 |
| 788,975 |
| ADT Corp., 5.25%, 3/15/20 | 1,000,000 |
| 1,035,000 |
Albertsons Holdings LLC/Saturn Acquisition Merger Sub, Inc., 7.75%, 10/15/22 (e) | 1,032,000 |
| 1,104,240 |
| Ally Financial, Inc.: | | |
| 3.25%, 9/29/17 | 1,000,000 |
| 993,130 |
| 3.25%, 2/13/18 | 1,500,000 |
| 1,485,000 |
| Altice Financing SA, 6.625%, 2/15/23 (e) | 1,000,000 |
| 1,030,000 |
| Altice SA: | | |
| 7.75%, 5/15/22 (e) | 1,000,000 |
| 1,016,875 |
| 7.625%, 2/15/25 (e) | 500,000 |
| 500,938 |
| American Airlines Group, Inc., 4.625%, 3/1/20 (e) | 1,000,000 |
| 979,375 |
| American Airlines Pass Through Trust, 5.60%, 1/15/22 (e) | 450,202 |
| 474,378 |
| Antero Resources Corp., 6.00%, 12/1/20 | 2,200,000 |
| 2,201,100 |
| ArcelorMittal, 6.125%, 6/1/18 | 1,250,000 |
| 1,343,125 |
Avis Budget Car Rental LLC / Avis Budget Finance, Inc., 4.875%, 11/15/17 | 750,000 |
| 768,750 |
| Best Buy Co., Inc., 5.00%, 8/1/18 | 1,000,000 |
| 1,052,500 |
Beverage Packaging Holdings Luxembourg II SA / Beverage Packaging Holdings II Is, 6.00%, 6/15/17 (e) | 250,000 |
| 250,625 |
| Beverages & More, Inc., 10.00%, 11/15/18 (e) | 1,500,000 |
| 1,425,000 |
| Bon-Ton Department Stores, Inc., 8.00%, 6/15/21 | 2,250,000 |
| 1,856,250 |
| Calpine Corp., 5.50%, 2/1/24 | 1,500,000 |
| 1,513,125 |
| Carrols Restaurant Group, Inc., 11.25%, 5/15/18 | 500,000 |
| 531,875 |
| CCOH Safari LLC, 5.50%, 12/1/22 | 1,500,000 |
| 1,533,750 |
| Celanese US Holdings LLC: | | |
| 5.875%, 6/15/21 | 500,000 |
| 540,000 |
| 4.625%, 11/15/22 | 500,000 |
| 503,750 |
| Cemex SAB de CV, 6.50%, 12/10/19 (e) | 1,500,000 |
| 1,593,750 |
www.calvert.com CALVERT HIGH YIELD BOND FUND SEMI-ANNUAL REPORT (UNAUDITED) 13
|
| | | | | | |
CORPORATE BONDS - CONT'D | PRINCIPAL AMOUNT | VALUE |
| | | |
| CenturyLink, Inc.: | | |
| 5.625%, 4/1/20 |
| $1,000,000 |
|
| $1,050,000 |
|
| 7.65%, 3/15/42 | 750,000 |
| 766,875 |
| Checkers Drive-In Restaurants, Inc., 11.00%, 12/1/17 (e) | 1,060,000 |
| 1,153,407 |
| Chesapeake Energy Corp., 4.875%, 4/15/22 | 850,000 |
| 796,875 |
| CIT Group, Inc.: | | |
| 4.25%, 8/15/17 | 550,000 |
| 556,875 |
| 5.25%, 3/15/18 | 1,750,000 |
| 1,811,250 |
| Cott Beverages, Inc., 6.75%, 1/1/20 (e) | 1,250,000 |
| 1,293,750 |
| Coveris Holding Corp., 10.00%, 6/1/18 (e) | 500,000 |
| 528,750 |
| Coveris Holdings SA, 7.875%, 11/1/19 (e) | 1,000,000 |
| 1,022,500 |
| Credit Acceptance Corp., 7.375%, 3/15/23 (e) | 1,500,000 |
| 1,479,375 |
| Digicel Group Ltd.: | | |
| 8.25%, 9/30/20 (e) | 500,000 |
| 500,750 |
| 7.125%, 4/1/22 (e) | 500,000 |
| 457,500 |
| DigitalGlobe, Inc., 5.25%, 2/1/21 (e) | 750,000 |
| 750,000 |
| DISH DBS Corp., 5.875%, 11/15/24 | 500,000 |
| 500,625 |
| Dynegy Finance I, Inc. / Dynegy Finance II, Inc., 6.75%, 11/1/19 (e) | 1,000,000 |
| 1,035,000 |
| Enterprise Products Operating LLC, 7.034% to 1/15/18, floating rate thereafter to 1/15/68 (r) | 750,000 |
| 810,843 |
| EP Energy LLC / Everest Acquisition Finance, Inc., 6.875%, 5/1/19 | 500,000 |
| 512,500 |
| Family Tree Escrow LLC, 5.25%, 3/1/20 (e) | 1,000,000 |
| 1,047,500 |
| FCA US LLC / CG Co-Issuer, Inc.: | | |
| 8.00%, 6/15/19 | 1,700,000 |
| 1,782,875 |
| 8.25%, 6/15/21 | 500,000 |
| 554,555 |
| First Data Corp., 11.75%, 8/15/21 | 2,530,000 |
| 2,925,312 |
| Frontier Communications Corp., 6.25%, 9/15/21 | 1,000,000 |
| 1,002,500 |
| General Motors Financial Co., Inc.: | | |
| 3.50%, 7/10/19 | 500,000 |
| 513,332 |
| 4.00%, 1/15/25 | 1,000,000 |
| 1,019,916 |
| Genworth Holdings, Inc., 4.80%, 2/15/24 | 550,000 |
| 462,688 |
| Global Brass & Copper, Inc., 9.50%, 6/1/19 | 500,000 |
| 537,500 |
| Halcon Resources Corp., 9.75%, 7/15/20 | 1,000,000 |
| 705,000 |
| Harland Clarke Holdings Corp., 9.75%, 8/1/18 (e) | 1,000,000 |
| 1,057,500 |
| HCA, Inc.: | | |
| 3.75%, 3/15/19 | 2,000,000 |
| 2,026,880 |
| 5.25%, 4/15/25 | 500,000 |
| 540,000 |
| HJ Heinz Co., 4.875%, 2/15/25 (e) | 1,750,000 |
| 1,896,562 |
| Hologic, Inc., 6.25%, 8/1/20 | 571,000 |
| 592,412 |
| iHeartCommunications, Inc., 10.00%, 1/15/18 | 1,250,000 |
| 1,062,500 |
| Ineos Finance plc, 8.375%, 2/15/19 (e) | 2,000,000 |
| 2,126,400 |
Infor Software Parent LLC / Infor Software Parent, Inc., 7.125%, 5/1/21 (e) | 750,000 |
| 742,732 |
| Infor US, Inc., 9.375%, 4/1/19 | 500,000 |
| 536,150 |
Innovation Ventures LLC / Innovation Ventures Finance Corp., 9.50%, 8/15/19 (e) | 2,250,000 |
| 2,272,500 |
14 www.calvert.com CALVERT HIGH YIELD BOND FUND SEMI-ANNUAL REPORT (UNAUDITED)
|
| | | | | | |
CORPORATE BONDS - CONT'D | PRINCIPAL AMOUNT | VALUE |
| | | |
| Intelsat Luxembourg SA: | | |
| 6.75%, 6/1/18 |
| $1,150,000 |
|
| $1,127,000 |
|
| 7.75%, 6/1/21 | 500,000 |
| 461,250 |
| Interactive Data Corp., 5.875%, 4/15/19 (e) | 1,000,000 |
| 1,010,000 |
| International Lease Finance Corp., 3.875%, 4/15/18 | 1,250,000 |
| 1,268,750 |
| JLL/Delta Dutch Newco BV, 7.50%, 2/1/22 (e) | 750,000 |
| 780,000 |
| KB Home, 4.75%, 5/15/19 | 500,000 |
| 488,750 |
| Kenan Advantage Group, Inc., 8.375%, 12/15/18 (e) | 1,425,000 |
| 1,482,000 |
| Kinetic Concepts, Inc., 10.50%, 11/1/18 | 1,000,000 |
| 1,082,500 |
| Land O'Lakes Capital Trust I, 7.45%, 3/15/28 (e) | 1,304,000 |
| 1,408,320 |
| Level 3 Communications, Inc., 8.875%, 6/1/19 | 250,000 |
| 263,125 |
| Level 3 Financing, Inc., 3.826%, 1/15/18 (r) | 1,000,000 |
| 1,007,500 |
| Masco Corp., 4.45%, 4/1/25 | 750,000 |
| 774,375 |
| Memorial Resource Development Corp., 5.875%, 7/1/22 (e) | 1,000,000 |
| 940,000 |
Michaels FinCo Holdings LLC / Michaels FinCo, Inc., 7.50%, 8/1/18 (e) | 737,000 |
| 751,740 |
| Michaels Stores, Inc., 5.875%, 12/15/20 (e) | 750,000 |
| 770,625 |
| Micron Technology, Inc.: | | |
| 5.25%, 8/1/23 (e) | 500,000 |
| 508,750 |
| 5.50%, 2/1/25 (e) | 1,000,000 |
| 1,007,500 |
| MSCI, Inc., 5.25%, 11/15/24 (e) | 1,000,000 |
| 1,033,750 |
| Navient Corp., 5.875%, 3/25/21 | 1,000,000 |
| 996,250 |
| Nielsen Finance LLC / Nielsen Finance Co., 5.00%, 4/15/22 (e) | 2,000,000 |
| 2,012,500 |
| NII Capital Corp., 7.625%, 4/1/21 (p)* | 1,000,000 |
| 305,000 |
Northern Tier Energy LLC / Northern Tier Finance Corp., 7.125%, 11/15/20 | 850,000 |
| 872,788 |
| Novelis, Inc., 8.375%, 12/15/17 | 500,000 |
| 522,500 |
| Numericable-SFR SAS: | | |
| 4.875%, 5/15/19 (e) | 1,000,000 |
| 995,000 |
| 6.00%, 5/15/22 (e) | 1,000,000 |
| 1,012,500 |
| Permian Holdings, Inc., 10.50%, 1/15/18 (e) | 750,000 |
| 412,500 |
| Petco Animal Supplies, Inc., 9.25%, 12/1/18 (e) | 1,100,000 |
| 1,155,000 |
| Plastipak Holdings, Inc., 6.50%, 10/1/21 (e) | 1,000,000 |
| 1,017,500 |
| Prospect Medical Holdings, Inc., 8.375%, 5/1/19 (e) | 1,000,000 |
| 1,062,500 |
| QEP Resources, Inc., 5.25%, 5/1/23 | 500,000 |
| 490,000 |
| Rite Aid Corp., 6.125%, 4/1/23 (e) | 1,900,000 |
| 1,947,500 |
| Rosetta Resources, Inc.: | | |
| 5.625%, 5/1/21 | 500,000 |
| 470,000 |
| 5.875%, 6/1/24 | 500,000 |
| 465,000 |
| Sabine Pass Liquefaction LLC, 5.625%, 2/1/21 | 1,500,000 |
| 1,509,840 |
| Serta Simmons Holdings LLC, 8.125%, 10/1/20 (e) | 1,000,000 |
| 1,052,500 |
| Shea Homes LP / Shea Homes Funding Corp., 5.875%, 4/1/23 (e) | 1,000,000 |
| 1,017,500 |
| Sophia LP / Sophia Finance, Inc., 9.75%, 1/15/19 (e) | 250,000 |
| 268,125 |
| Spencer Spirit Holdings, Inc., 9.00%, 5/1/18 (e) | 2,050,000 |
| 2,078,188 |
| Sprint Capital Corp., 6.90%, 5/1/19 | 1,750,000 |
| 1,809,063 |
| Sprint Corp., 7.25%, 9/15/21 | 1,750,000 |
| 1,758,750 |
| Standard Pacific Corp., 8.375%, 5/15/18 | 500,000 |
| 571,250 |
www.calvert.com CALVERT HIGH YIELD BOND FUND SEMI-ANNUAL REPORT (UNAUDITED) 15
|
| | | | | | |
CORPORATE BONDS - CONT'D | PRINCIPAL AMOUNT | VALUE |
| | | |
| SUPERVALU, Inc., 6.75%, 6/1/21 |
| $1,000,000 |
|
| $1,030,000 |
|
| Telecom Italia SpA, 5.303%, 5/30/24 (e) | 1,000,000 |
| 1,047,500 |
| TerraForm Power Operating LLC, 5.875%, 2/1/23 (e) | 500,000 |
| 518,750 |
| T-Mobile USA, Inc.: | | |
| 6.542%, 4/28/20 | 750,000 |
| 789,375 |
| 6.125%, 1/15/22 | 500,000 |
| 515,625 |
| 6.50%, 1/15/24 | 500,000 |
| 522,500 |
| TransDigm, Inc., 5.50%, 10/15/20 | 750,000 |
| 740,625 |
| Transocean, Inc., 3.80%, 10/15/22 | 500,000 |
| 364,844 |
| United Rentals North America, Inc.: | | |
| 7.375%, 5/15/20 | 500,000 |
| 540,313 |
| 7.625%, 4/15/22 | 500,000 |
| 547,000 |
| US Shale Solutions, Inc., 12.50%, 9/1/17 (e) | 500,000 |
| 288,745 |
| Virgin Australia Trust: | | |
| 6.00%, 4/23/22 (e) | 411,816 |
| 426,229 |
| 5.00%, 4/23/25 (e) | 859,052 |
| 904,152 |
| VWR Funding, Inc., 7.25%, 9/15/17 | 500,000 |
| 521,875 |
| West Corp., 5.375%, 7/15/22 (e) | 750,000 |
| 733,125 |
| Williams Partners LP / ACMP Finance Corp.: | | |
| 6.125%, 7/15/22 | 1,000,000 |
| 1,059,500 |
| 4.875%, 3/15/24 | 500,000 |
| 502,500 |
| | | |
| Total Corporate Bonds (Cost $114,052,337) | | 114,498,547 |
| | | |
MUNICIPAL OBLIGATIONS - 0.3% | | |
Government Development Bank for Puerto Rico Revenue Bonds, 4.704%, 5/1/16 | 500,000 |
| 390,105 |
| | | |
| Total Municipal Obligations (Cost $438,566) | | 390,105 |
| | | |
TIME DEPOSIT - 7.5% | | |
| State Street Bank Time Deposit, 0.088%, 4/1/15 | 9,632,570 |
| 9,632,570 |
| | | |
| Total Time Deposit (Cost $9,632,570) | | 9,632,570 |
| | | |
EQUITY SECURITIES - 0.0% | SHARES | |
| US Shale Solutions, Inc., Warrants (b)(e)* | 500 |
| — |
|
| | | |
| Total Equity Securities (Cost $0) | | — |
|
| | | |
| | | |
| TOTAL INVESTMENTS (Cost $127,852,469) - 99.4% | | 128,269,380 |
| Other assets and liabilities, net - 0.6% | | 735,063 |
NET ASSETS - 100% | | $129,004,443 |
| | | |
| See notes to financial statements. |
16 www.calvert.com CALVERT HIGH YIELD BOND FUND SEMI-ANNUAL REPORT (UNAUDITED)
|
| | | | |
(b) This security was valued under the direction of the Board of Trustees. See Note A. (e) Security is exempt from registration under Rule 144A of the Securities Act of 1933. These securities may be resold in transactions exempt from registration, normally to qualified institutional buyers. (p) Security is in default and is no longer accruing interest. (r) The coupon rate shown on floating or adjustable rate securities represents the rate at period end. * Non-income producing security. Abbreviations: LLC: Limited Liability Corporation LP: Limited Partnership plc: Public Limited Company See notes to financial statements. |
www.calvert.com CALVERT HIGH YIELD BOND FUND SEMI-ANNUAL REPORT (UNAUDITED) 17
STATEMENT OF ASSETS AND LIABILITIES
MARCH 31, 2015
|
| | | |
ASSETS | |
| Investments in securities, at value (Cost $127,852,469) - see accompanying schedule | $128,269,380 |
|
| Receivable for securities sold | 5,272,133 |
|
| Receivable for shares sold | 362,773 |
|
| Interest receivable | 1,949,281 |
|
| Other assets | 31,733 |
|
| Total assets | 135,885,300 |
|
| | |
LIABILITIES | |
| Payable for securities purchased | 6,569,173 |
|
| Payable for shares redeemed | 205,627 |
|
| Payable to Calvert Investment Management, Inc. | 43,351 |
|
| Payable to Calvert Investment Administrative Services, Inc. | 10,907 |
|
| Payable to Calvert Investment Services, Inc. | 1,558 |
|
| Payable to Calvert Investment Distributors, Inc. | 19,027 |
|
| Accrued expenses and other liabilities | 31,214 |
|
| Total liabilities | 6,880,857 |
|
| | |
NET ASSETS | $129,004,443 |
|
| | |
NET ASSETS CONSIST OF: | |
| Paid-in capital applicable to the following shares of beneficial interest, unlimited number of no par value shares authorized: | |
| Class A: 2,383,556 shares outstanding |
| $64,972,899 |
|
| Class C: 211,087 shares outstanding | 6,378,245 |
|
| Class I: 1,333,366 shares outstanding | 43,814,046 |
|
| Class Y: 692,947 shares outstanding | 21,583,441 |
|
| Undistributed net investment income | 21,486 |
|
| Accumulated net realized gain (loss) | (8,182,585 | ) |
| Net unrealized appreciation (depreciation) | 416,911 |
|
| | |
NET ASSETS |
| $129,004,443 |
|
| | |
NET ASSET VALUE PER SHARE | |
| Class A (based on net assets of $66,321,640) | $27.82 |
| Class C (based on net assets of $5,948,750) | $28.18 |
| Class I (based on net assets of $36,628,892) | $27.47 |
| Class Y (based on net assets of $20,105,161) | $29.01 |
| | |
| See notes to financial statements. |
18 www.calvert.com CALVERT HIGH YIELD BOND FUND SEMI-ANNUAL REPORT (UNAUDITED)
STATEMENT OF OPERATIONS
SIX MONTHS ENDED MARCH 31, 2015
|
| | | |
NET INVESTMENT INCOME | |
| Investment Income: | |
| Interest income |
| $4,090,506 |
|
| Dividend income | 23,424 |
|
| Total investment income | 4,113,930 |
|
| | |
| Expenses: | |
| Investment advisory fee | 420,041 |
|
| Administrative fees | 64,622 |
|
| Transfer agency fees and expenses | 102,235 |
|
| Distribution Plan expenses: | |
| Class A | 82,441 |
|
| Class C | 30,326 |
|
| Trustees' fees and expenses | 7,591 |
|
| Custodian fees | 21,716 |
|
| Registration fees | 24,365 |
|
| Reports to shareholders | 7,735 |
|
| Professional fees | 15,378 |
|
| Accounting fees | 13,309 |
|
| Miscellaneous | 6,375 |
|
| Total expenses | 796,134 |
|
| Reimbursement from Advisor: | |
| Class A | (108,941 | ) |
| Class C | (5,147 | ) |
| Class I | (32,972 | ) |
| Class Y | (14,344 | ) |
| Net expenses | 634,730 |
|
| | |
NET INVESTMENT INCOME | 3,479,200 |
|
| | |
REALIZED AND UNREALIZED GAIN (LOSS) ON INVESTMENTS | |
| Net realized gain (loss) | (7,914,166 | ) |
| Change in unrealized appreciation (depreciation) | 3,015,276 |
|
| | |
| | |
NET REALIZED AND UNREALIZED GAIN (LOSS) ON INVESTMENTS | (4,898,890 | ) |
| | |
INCREASE (DECREASE) IN NET ASSETS RESULTING FROM OPERATIONS |
| ($1,419,690 | ) |
| | |
| See notes to financial statements. |
www.calvert.com CALVERT HIGH YIELD BOND FUND SEMI-ANNUAL REPORT (UNAUDITED) 19
STATEMENTS OF CHANGES IN NET ASSETS
|
| | | | | | | |
INCREASE (DECREASE) IN NET ASSETS | SIX MONTHS ENDED MARCH 31, 2015 | | YEAR ENDED SEPTEMBER 30, 2014 |
| Operations: | | | |
| Net investment income |
| $3,479,200 |
| |
| $6,543,429 |
|
| Net realized gain (loss) | (7,914,166 | ) | | 3,231,516 |
|
| Change in unrealized appreciation (depreciation) | 3,015,276 |
| | (4,430,646 | ) |
| | | | |
INCREASE (DECREASE) IN NET ASSETS RESULTING FROM OPERATIONS | (1,419,690 | ) | | 5,344,299 |
|
| | | | |
| Distributions to shareholders from: | | | |
| Net investment income: | | | |
| Class A shares | (1,744,704 | ) | | (3,518,578 | ) |
| Class C shares | (130,124 | ) | | (205,969 | ) |
| Class I shares | (1,090,334 | ) | | (2,336,728 | ) |
| Class Y shares | (510,888 | ) | | (479,089 | ) |
| Net realized gain: | | | |
| Class A shares | (1,678,455 | ) | | (836,008 | ) |
| Class C shares | (152,299 | ) | | (56,823 | ) |
| Class I shares | (1,002,578 | ) | | (582,356 | ) |
| Class Y shares | (474,713 | ) | | (84,095 | ) |
| Total distributions | (6,784,095 | ) | | (8,099,646 | ) |
| | | | |
| Capital share transactions: | | | |
| Shares sold: | | | |
| Class A shares | 12,712,005 |
| | 39,165,330 |
|
| Class C shares | 841,727 |
| | 2,878,615 |
|
| Class I shares | 2,268,066 |
| | 16,417,167 |
|
| Class Y shares | 9,688,797 |
| | 13,132,629 |
|
| Reinvestment of distributions: | | | |
| Class A shares | 3,256,561 |
| | 4,135,716 |
|
| Class C shares | 267,218 |
| | 245,760 |
|
| Class I shares | 2,092,912 |
| | 2,848,791 |
|
| Class Y shares | 958,210 |
| | 551,318 |
|
| Redemption fees: | | | |
| Class A shares | 1,195 |
| | 4,883 |
|
| Class C shares | — |
| | 10 |
|
| Class I shares | 26 |
| | 512 |
|
| Class Y shares | 79 |
| | 4 |
|
| Shares redeemed: | | | |
| Class A shares | (13,771,617 | ) | | (28,277,945 | ) |
| Class C shares | (922,394 | ) | | (704,744 | ) |
| Class I shares | (7,779,669 | ) | | (15,666,365 | ) |
| Class Y shares | (4,770,963 | ) | | (2,905,267 | ) |
| Total capital share transactions | 4,842,153 |
| | 31,826,414 |
|
| | | | |
TOTAL INCREASE (DECREASE) IN NET ASSETS | (3,361,632 | ) | | 29,071,067 |
|
| See notes to financial statements. |
20 www.calvert.com CALVERT HIGH YIELD BOND FUND SEMI-ANNUAL REPORT (UNAUDITED)
STATEMENTS OF CHANGES IN NET ASSETS
|
| | | | | | | |
NET ASSETS | SIX MONTHS ENDED MARCH 31, 2015 | | YEAR ENDED SEPTEMBER 30, 2014 |
| Beginning of period |
| $132,366,075 |
| |
| $103,295,008 |
|
| End of period (including undistributed net investment income of $21,486 and $18,336, respectively) |
| $129,004,443 |
| |
| $132,366,075 |
|
| | | | |
CAPITAL SHARE ACTIVITY | | | |
| Shares sold: | | | |
| Class A shares | 448,462 |
| | 1,283,425 |
|
| Class C shares | 29,098 |
| | 93,045 |
|
| Class I shares | 81,804 |
| | 543,179 |
|
| Class Y shares | 324,139 |
| | 412,474 |
|
| Reinvestment of distributions: | | | |
| Class A shares | 116,553 |
| | 135,926 |
|
| Class C shares | 9,456 |
| | 7,985 |
|
| Class I shares | 75,814 |
| | 94,827 |
|
| Class Y shares | 32,930 |
| | 17,440 |
|
| Shares redeemed: | | | |
| Class A shares | (488,367 | ) | | (925,641 | ) |
| Class C shares | (32,348 | ) | | (22,833 | ) |
| Class I shares | (278,947 | ) | | (521,655 | ) |
| Class Y shares | (162,130 | ) | | (91,866 | ) |
| Total capital share activity | 156,464 |
| | 1,026,306 |
|
| | | | |
| See notes to financial statements. |
www.calvert.com CALVERT HIGH YIELD BOND FUND SEMI-ANNUAL REPORT (UNAUDITED) 21
NOTES TO FINANCIAL STATEMENTS
NOTE A — SIGNIFICANT ACCOUNTING POLICIES
General: Calvert High Yield Bond Fund (the “Fund”), a series of The Calvert Fund, is registered under the Investment Company Act of 1940 as a non-diversified, open-end management investment company. The Calvert Fund is comprised of six separate series. The operations of each series are accounted for separately. The Fund offers four classes of shares - Classes A, C, I, and Y. Class A shares are sold with a maximum front-end sales charge of 3.75%. Class C shares are sold without a front-end sales charge and, with certain exceptions, will be charged a deferred sales charge on shares sold within one year of purchase. Class C shares have higher levels of expenses than Class A shares. Class I shares require a minimum account balance of $1,000,000. The $1 million minimum initial investment is waived for retirement plans that trade through omnibus accounts and may be waived for certain other institutional accounts where it is believed to be in the best interest of the Fund and its shareholders. Class I shares have no front-end or deferred sales charge and have lower levels of expenses than Class A shares. Class Y shares are generally only available to wrap or similar fee-based programs offered by financial intermediaries, foundations, and endowments that have entered into an agreement with the Fund’s Distributor to offer Class Y shares. Class Y shares have no front-end or deferred sales charge and have lower levels of expenses than Class A shares. Each class has different: (a) dividend rates due to differences in Distribution Plan expenses and other class specific expenses, (b) exchange privileges and (c) class specific voting rights.
Security Valuation: Net asset value per share is determined every business day as of the close of the regular session of the New York Stock Exchange (generally 4:00 p.m. Eastern time). The Fund uses independent pricing services approved by the Board of Trustees (“the Board”) to value its investments wherever possible. Investments for which market quotations are not available or deemed not reliable are fair valued in good faith under the direction of the Board.
The Board has adopted Valuation Procedures (the “Procedures”) to determine the fair value of securities and other financial instruments for which market prices are not readily available or which may not be reliably priced. The Board has delegated the day-to-day responsibility for determining the fair value of the assets of the Fund to Calvert Investment Management, Inc. (the “Advisor” or “Calvert”) and has provided these Procedures to govern Calvert in its valuation duties.
Calvert has chartered an internal Valuation Committee to oversee the implementation of these Procedures and to assist it in carrying out the valuation responsibilities that the Board has delegated.
The Valuation Committee meets on a regular basis to review illiquid securities and other investments which may not have readily available market prices. The Valuation Committee’s fair valuation determinations are subject to review, approval and ratification by the Board at its next regularly scheduled meeting covering the calendar quarter in which the fair valuation was determined.
The Valuation Committee utilizes various methods to measure the fair value of the Fund’s investments. Generally Accepted Accounting Principles (GAAP) establishes a disclosure hierarchy that categorizes the inputs to valuation techniques used to value assets and liabilities at measurement date. These inputs are summarized in the three broad levels listed below:
Level 1 - quoted prices in active markets for identical securities
22 www.calvert.com CALVERT HIGH YIELD BOND FUND SEMI-ANNUAL REPORT (UNAUDITED)
Level 2 - other significant observable inputs (including quoted prices for similar securities, interest rates, prepayment speeds, credit risk, etc.)
Level 3 - significant unobservable inputs (including the Fund’s own assumptions in determining the fair value of investments)
The inputs or methodologies used for valuing securities are not necessarily an indication of the risk associated with investing in those securities.
Changes in valuation techniques may result in transfers in or out of an investment’s assigned level within the hierarchy during the period. There were no such transfers during the period. Valuation techniques used to value the Fund’s investments by major category are as follows:
Debt securities, including restricted securities, are valued based on evaluated prices received from independent pricing services or from dealers who make markets in such securities. For corporate bonds and municipal securities, pricing services utilize matrix pricing which considers yield or price of bonds of comparable quality, coupon, maturity and type, as well as dealer supplied prices, and such securities are generally categorized as Level 2 in the hierarchy. For collateralized mortgage-backed obligations and commercial mortgage-backed securities, pricing services utilize matrix pricing which considers prepayment speed assumptions, attributes of the collateral, yield or price of bonds of comparable quality, coupon, maturity and type as well as dealer supplied prices and, accordingly, such securities are generally categorized as Level 2 in the hierarchy. Short-term securities of sufficient credit quality with remaining maturities of sixty days or less for which quotations are not readily available are valued at amortized cost, which approximates fair value, and are categorized as Level 2 in the hierarchy.
When independent prices are unavailable or unreliable, debt securities may be valued utilizing pricing matrices which consider similar factors that would be used by independent pricing services. These are generally categorized as Level 2 in the hierarchy but may be Level 3 depending on the circumstances.
Equity securities, including restricted securities, for which market quotations are readily available, are valued at the last reported sale price or official closing price as reported by an independent pricing service on the primary market or exchange on which they are traded and are categorized as Level 1 in the hierarchy. In the event there were no sales during the day or closing prices are not available, securities are valued at the last quoted bid price or using the last available price and are categorized as Level 2 in the hierarchy.
If a market value cannot be determined for a security using the methodologies described above, or if, in the good faith opinion of the Advisor, the market value does not constitute a readily available market quotation, or if a significant event has occurred that would materially affect the value of the security, the security will be fair valued as determined in good faith by the Valuation Committee.
The Valuation Committee considers a number of factors, including significant unobservable valuation inputs when arriving at fair value. It considers all significant facts that are reasonably available and relevant to the determination of fair value.
The Valuation Committee primarily employs a market-based approach which may use related or comparable assets or liabilities, recent transactions, market multiples, book values, and other relevant information for the investment to determine the fair value of the investment. When more appropriate, the fund may employ an income-based or cost approach. An income-based valuation approach discounts anticipated future cash flows of the investment to calculate a present amount (discounted). The measurement is based on the value indicated by current
www.calvert.com CALVERT HIGH YIELD BOND FUND SEMI-ANNUAL REPORT (UNAUDITED) 23
market expectations about those future amounts. Discounts may also be applied due to the nature or duration of any restrictions on the disposition of the investments. A cost based approach is based on the amount that currently would be required to replace the service capacity of an asset (current replacement cost). From the seller’s perspective, the price that would be received for the asset is determined based on the cost to a buyer to acquire or construct a substitute asset of comparable utility, adjusted for obsolescence.
The values assigned to fair value investments are based on available information and do not necessarily represent amounts that might ultimately be realized. Further, due to the inherent uncertainty of valuations of such investments, the fair values may differ significantly from the values that would have been used had an active market existed, and the differences could be material. The Valuation Committee employs various methods for calibrating these valuation approaches including a regular review of key inputs and assumptions, transactional back-testing or disposition analysis and reviews of any related market activity.
At March 31, 2015, securities valued at $0, or 0.0% of net assets, were fair valued in good faith under the direction of the Board.
The following table summarizes the market value of the Fund’s holdings as of March 31, 2015, based on the inputs used to value them:
|
| | | | | | | | | | | | | |
| | VALUATION INPUTS |
INVESTMENTS IN SECURITIES* | LEVEL 1 | | LEVEL 2 | | LEVEL 3 | | TOTAL |
| Collateralized mortgage-backed obligations | — |
| |
| $1,707,422 |
| | — |
| |
| $1,707,422 |
|
| Commercial mortgage-backed securities | — |
| | 2,040,736 |
| | — |
| | 2,040,736 |
|
| Corporate debt | — |
| | 114,498,547 |
| | — |
| | 114,498,547 |
|
| Equity securities | — |
| | — |
| | $0** |
| | — |
|
| Municipal obligations | — |
| | 390,105 |
| | — |
| | 390,105 |
|
| Other debt obligations | — |
| | 9,632,570 |
| | — |
| | 9,632,570 |
|
| TOTAL | — |
| |
| $128,269,380 |
| | $0** |
| |
| $128,269,380 |
|
| | | | | | | | |
* For a complete listing of investments, please refer to the Schedule of Investments. **Level 3 securities were valued at $0 and represent 0.0% of net assets. |
Loan Participations and Assignments: The Fund may invest in direct debt instruments which are interests in amounts owed to lenders or lending syndicates by corporate, governmental, or other borrowers. A Fund’s investments in loans may be in the form of participations in loans or assignments of all or a portion of loans from third parties. A loan is often administered by a bank or other financial institution (the “lender”) that acts as agent for all holders. The agent administers the terms of the loan, as specified in the loan agreement. The Fund may invest in multiple series or tranches of a loan, which may have varying terms and carry different associated risks. The Fund generally has no right to enforce compliance with the terms of the loan agreement with the borrower. As a result, the Fund may be subject to the credit risk of both the borrower and the lender that is selling the loan agreement. When the Fund purchases assignments from lenders it acquires direct rights against the borrower of the loan. When investing in a loan participation, the Fund has the right to receive payments of principal, interest and any fees to which it is entitled only from the lender selling the loan agreement and only upon receipt of payments by the lender from the borrower.
24 www.calvert.com CALVERT HIGH YIELD BOND FUND SEMI-ANNUAL REPORT (UNAUDITED)
Security Transactions and Net Investment Income: Security transactions are accounted for on trade date. Realized gains and losses are recorded on an identified cost basis and may include proceeds from litigation. Dividend income is recorded on the ex-dividend date. Distributions received on securities that represent a return of capital or capital gain are recorded as a reduction of cost of investment and/or as a realized gain. Interest income, which includes amortization of premium and accretion of discount on debt securities, is accrued as earned. Debt obligations may be placed on non-accrual status and related interest income may be reduced by ceasing current accruals and writing off interest receivables when the collection of all or a portion of interest has become doubtful based on consistently applied procedures. (See the Schedule of Investments footnotes on page 17.) A debt obligation may be removed from non-accrual status when the issuer resumes interest payments or when collectability of interest is reasonably assured. The Fund earns certain fees in connection with its floating rate loan purchasing activities. These fees are in addition to interest payments earned and may include amendment fees, consent fees and prepayment fees. Investment income and realized and unrealized gains and losses are allocated to separate classes of shares based upon the relative net assets of each class. Expenses arising in connection with a specific class are charged directly to that class. Expenses common to the classes are allocated to each class in proportion to their relative net assets.
Distributions to Shareholders: Distributions to shareholders are recorded by the Fund on ex-dividend date. Dividends from net investment income are paid monthly. Distributions from net realized capital gains, if any, are paid at least annually. Distributions are determined in accordance with income tax regulations which may differ from generally accepted accounting principles; accordingly, periodic reclassifications are made within the Fund’s capital accounts to reflect income and gains available for distribution under income tax regulations.
Estimates: The preparation of the financial statements in conformity with accounting principles generally accepted in the United States requires management to make estimates and assumptions that affect the reported amounts of assets and liabilities and disclosure of contingent assets and liabilities at the date of the financial statements and the reported amounts of income and expenses during the reported period. Actual results could differ from those estimates.
Redemption Fees: The Fund charges a 2% redemption fee on redemptions, including exchanges, made within 30 days of purchase (within seven days for Class I shares). The redemption fee is accounted for as an addition to paid-in capital and is intended to discourage market-timers by ensuring that short-term trading costs are borne by the investors making the transactions and not the shareholders already in the Fund. This fee was eliminated effective February 2, 2015.
Federal Income Taxes: No provision for federal income or excise tax is required since the Fund intends to continue to qualify as a regulated investment company under the Internal Revenue Code and to distribute substantially all of its taxable earnings.
Management has analyzed the Fund’s tax positions taken for all open federal income tax years and has concluded that no provision for federal income tax is required in the Fund’s financial statements. A Fund’s federal tax return is subject to examination by the Internal Revenue Service for a period of three years.
NOTE B — RELATED PARTY TRANSACTIONS
Calvert Investment Management, Inc. (the “Advisor”) is wholly-owned by Calvert Investments, Inc., which is indirectly wholly-owned by Ameritas Mutual Holding Company. The Advisor provides investment advisory services and pays the salaries and fees of officers
www.calvert.com CALVERT HIGH YIELD BOND FUND SEMI-ANNUAL REPORT (UNAUDITED) 25
and Trustees of the Fund who are employees of the Advisor or its affiliates. For its services, the Advisor receives an annual fee, payable monthly, of .65% of the Fund’s average daily net assets.
The Advisor has contractually agreed to limit net annual fund operating expenses through January 31, 2016. The contractual expense caps are 1.07%, 2.07%, .74%, and .82% for Class A, C, I, and Y, respectively. For the purpose of this expense limit, operating expenses do not include interest expense, brokerage commissions, taxes, and extraordinary expenses. This expense limitation does not limit acquired fund fees and expenses, if any.
Calvert Investment Administrative Services, Inc., an affiliate of the Advisor, provides administrative services to the Fund for an annual fee, payable monthly, of .10% for Classes A, C, I, and Y based on their average daily net assets.
Calvert Investment Distributors, Inc. (“CID”), an affiliate of the Advisor, is the distributor and principal underwriter for the Fund. Pursuant to Rule 12b-1 under the Investment Company Act of 1940, the Fund has adopted a Distribution Plan that permits the Fund to pay certain expenses associated with the distribution and servicing of its shares. The expenses paid may not exceed .25% and 1.00% annually of the average daily net assets of Class A and C, respectively. The amount actually paid by the Fund is an annualized fee, payable monthly, of .25% and 1.00% of the average daily net assets of Class A and C, respectively. Class I and Class Y shares do not have Distribution Plan expenses.
CID received $13,234 as its portion of the commissions charged on sales of the Fund’s Class A shares for the six months ended March 31, 2015.
Calvert Investment Services, Inc. (“CIS”), an affiliate of the Advisor, is the shareholder servicing agent for the Fund. For its services, CIS received a fee of $9,311 for the six months ended March 31, 2015. Boston Financial Data Services, Inc. is the transfer and dividend disbursing agent.
Each Trustee of the Fund who is not an employee of the Advisor or its affiliates receives an annual retainer of $45,000 plus up to $2,000 for each Board and Committee meeting attended. The Board chair and Committee chairs each receive an additional $5,000 annual retainer. Trustees’ fees are allocated to each of the funds served.
NOTE C — INVESTMENT ACTIVITY AND TAX INFORMATION
During the period, the cost of purchases and proceeds from sales of investments, other than short-term securities and U.S. Government securities, were $120,975,437 and $121,594,809, respectively. U.S. Government security purchases and sales were $1,825,256 and $1,826,565, respectively.
The Fund may purchase securities, typically short-term variable rate demand notes, from or sell to other funds managed by the Advisor. These interportfolio transactions are primarily used for cash management purposes and are made pursuant to Rule 17a-7 of the Investment Company Act of 1940. For the period ended March 31, 2015, there were no such transactions.
As of March 31, 2015, the tax basis components of unrealized appreciation/(depreciation) and the federal tax cost were as follows:
|
| | | |
| Unrealized appreciation |
| $1,906,080 |
|
| Unrealized (depreciation) | (1,721,313 | ) |
| Net unrealized appreciation/(depreciation) |
| $184,767 |
|
| | |
| Federal income tax cost of investments |
| $128,084,613 |
|
26 www.calvert.com CALVERT HIGH YIELD BOND FUND SEMI-ANNUAL REPORT (UNAUDITED)
NOTE D — LINE OF CREDIT
A financing agreement is in place with the Calvert Funds and State Street Corporation (“SSC”). Under the agreement, SSC provides an unsecured line of credit facility, in the aggregate amount of $50 million ($25 million committed and $25 million uncommitted), accessible by the Funds for temporary or emergency purposes only. Borrowings bear interest at the higher of the London Interbank Offered Rate (LIBOR) or the overnight Federal Funds Rate plus 1.25% per annum. A commitment fee of .125% per annum is incurred on the unused portion of the committed facility, which is allocated to all participating funds. The Fund had no borrowings under the agreement during the six months ended March 31, 2015.
NOTE E — SUBSEQUENT EVENTS
In preparing the financial statements as of March 31, 2015, no subsequent events or transactions occurred that would have required recognition or disclosure in these financial statements.
www.calvert.com CALVERT HIGH YIELD BOND FUND SEMI-ANNUAL REPORT (UNAUDITED) 27
FINANCIAL HIGHLIGHTS
|
| | | | | | | | | | | |
| | | PERIODS ENDED | |
CLASS A SHARES | MARCH 31, 2015 (z) | | SEPTEMBER 30, 2014 (z) | | SEPTEMBER 30, 2013 (z) |
| Net asset value, beginning |
| $29.61 |
| |
| $30.12 |
| |
| $29.38 |
|
| Income from investment operations: | | | | | |
| Net investment income | .75 |
| | 1.55 |
| | 1.63 |
|
| Net realized and unrealized gain (loss) | (1.07 | ) | | (.11 | ) | | .75 |
|
| Total from investment operations | (.32 | ) | | 1.44 |
| | 2.38 |
|
| Distributions from: | | | | | |
| Net investment income | (.75 | ) | | (1.53 | ) | | (1.64 | ) |
| Net realized gain | (.72 | ) | | (.42 | ) | | — |
|
| Total distributions | (1.47 | ) | | (1.95 | ) | | (1.64 | ) |
| Total increase (decrease) in net asset value | (1.79 | ) | | (.51 | ) | | .74 |
|
| Net asset value, ending |
| $27.82 |
| |
| $29.61 |
| |
| $30.12 |
|
| | | | | | |
| Total return* | (1.02 | %) | | 4.80 | % | | 8.27 | % |
Ratios to average net assets: A | | | | | |
| Net investment income | 5.30% (a) |
| | 5.06 | % | | 5.45 | % |
| Total expenses | 1.40% (a) |
| | 1.37 | % | | 1.43 | % |
| Expenses before offsets | 1.07% (a) |
| | 1.07 | % | | 1.11 | % |
| Net expenses | 1.07% (a) |
| | 1.07 | % | | 1.11 | % |
| Portfolio turnover | 102 | % | | 228 | % | | 293 | % |
| Net assets, ending (in thousands) |
| $66,322 |
| |
| $68,313 |
| |
| $54,608 |
|
| | | | | | |
|
| | | | | | | | | | | |
| | | | YEARS ENDED | | |
CLASS A SHARES | SEPTEMBER 30, 2012 (z) | | SEPTEMBER 30, 2011 (z) | | SEPTEMBER 30, 2010 |
| Net asset value, beginning |
| $26.75 |
| |
| $27.36 |
| |
| $24.92 |
|
| Income from investment operations: | | | | | |
| Net investment income | 1.69 |
| | 1.81 |
| | 1.80 |
|
| Net realized and unrealized gain (loss) | 2.62 |
| | (.63 | ) | | 2.39 |
|
| Total from investment operations | 4.31 |
| | 1.18 |
| | 4.19 |
|
| Distributions from: | | | | | |
| Net investment income | (1.68 | ) | | (1.79 | ) | | (1.75 | ) |
| Net realized gain | — |
| | — |
| | — |
|
| Total distributions | (1.68 | ) | | (1.79 | ) | | (1.75 | ) |
| Total increase (decrease) in net asset value | 2.63 |
| | (.61 | ) | | 2.44 |
|
| Net asset value, ending |
| $29.38 |
| |
| $26.75 |
| |
| $27.36 |
|
| | | | | | |
| Total return* | 16.53 | % | | 4.17 | % | | 17.35 | % |
Ratios to average net assets: A | | | | | |
| Net investment income | 6.00 | % | | 6.32 | % | | 6.98 | % |
| Total expenses | 1.58 | % | | 1.56 | % | | 1.91 | % |
| Expenses before offsets | 1.58 | % | | 1.56 | % | | 1.65 | % |
| Net expenses | 1.58 | % | | 1.56 | % | | 1.65 | % |
| Portfolio turnover | 273 | % | | 286 | % | | 233 | % |
| Net assets, ending (in thousands) |
| $37,623 |
| |
| $17,206 |
| |
| $9,427 |
|
| See notes to financial highlights. |
28 www.calvert.com CALVERT HIGH YIELD BOND FUND SEMI-ANNUAL REPORT (UNAUDITED)
FINANCIAL HIGHLIGHTS
|
| | | | | | | | | | | |
| | | PERIODS ENDED | |
CLASS C SHARES | MARCH 31, 2015 (z) | | SEPTEMBER 30, 2014 (z) | | SEPTEMBER 30, 2013 (z) |
| Net asset value, beginning |
| $29.98 |
| |
| $30.48 |
| |
| $29.72 |
|
| Income from investment operations: | | | | | |
| Net investment income | .61 |
| | 1.25 |
| | 1.35 |
|
| Net realized and unrealized gain (loss) | (1.08 | ) | | (.10 | ) | | .75 |
|
| Total from investment operations | (.47 | ) | | 1.15 |
| | 2.10 |
|
| Distributions from: | | | | | |
| Net investment income | (.61 | ) | | (1.23 | ) | | (1.34 | ) |
| Net realized gain | (.72 | ) | | (.42 | ) | | — |
|
| Total distributions | (1.33 | ) | | (1.65 | ) | | (1.34 | ) |
| Total increase (decrease) in net asset value | (1.80 | ) | | (.50 | ) | | .76 |
|
| Net asset value, ending |
| $28.18 |
| |
| $29.98 |
| |
| $30.48 |
|
| | | | | | |
| Total return* | (1.50 | %) | | 3.76 | % | | 7.16 | % |
Ratios to average net assets: A | | | | | |
| Net investment income | 4.30% (a) |
| | 4.05 | % | | 4.45 | % |
| Total expenses | 2.24% (a) |
| | 2.15 | % | | 2.56 | % |
| Expenses before offsets | 2.07% (a) |
| | 2.07 | % | | 2.10 | % |
| Net expenses | 2.07% (a) |
| | 2.07 | % | | 2.10 | % |
| Portfolio turnover | 102 | % | | 228 | % | | 293 | % |
| Net assets, ending (in thousands) |
| $5,949 |
| |
| $6,143 |
| |
| $3,861 |
|
| | | | | | |
|
| | | | | | | |
| | PERIOD ENDED | | | | |
CLASS C SHARES | SEPTEMBER 30, 2012 (z) ^^ | | | | |
| Net asset value, beginning |
| $27.75 |
| | | | |
| Income from investment operations: | | | | | |
| Net investment income | 1.11 |
| | | | |
| Net realized and unrealized gain (loss) | 1.81 |
| | | | |
| Total from investment operations | 2.92 |
| | | | |
| Distributions from: | | | | | |
| Net investment income | (.95 | ) | | | | |
| Net realized gain | — |
| | | | |
| Total distributions | (.95 | ) | | | | |
| Total increase (decrease) in net asset value | 1.97 |
| | | | |
| Net asset value, ending |
| $29.72 |
| | | | |
| | | | | | |
| Total return* | 10.67 | % | | | | |
Ratios to average net assets: A | | | | | |
| Net investment income | 4.66% (a) |
| | | | |
| Total expenses | 4.62% (a) |
| | | | |
| Expenses before offsets | 2.65% (a) |
| | | | |
| Net expenses | 2.65% (a) |
| | | | |
| Portfolio turnover | 273%** |
| | | | |
| Net assets, ending (in thousands) |
| $1,732 |
| | | | |
| See notes to financial highlights. |
www.calvert.com CALVERT HIGH YIELD BOND FUND SEMI-ANNUAL REPORT (UNAUDITED) 29
FINANCIAL HIGHLIGHTS
|
| | | | | | | | | | | |
| | | PERIODS ENDED | |
CLASS I SHARES | MARCH 31, 2015 (z) | | SEPTEMBER 30, 2014 (z) | | SEPTEMBER 30, 2013 (z) |
| Net asset value, beginning |
| $29.25 |
| |
| $29.75 |
| |
| $29.03 |
|
| Income from investment operations: | | | | | |
| Net investment income | .79 |
| | 1.62 |
| | 1.71 |
|
| Net realized and unrealized gain (loss) | (1.06 | ) | | (.09 | ) | | .73 |
|
| Total from investment operations | (.27 | ) | | 1.53 |
| | 2.44 |
|
| Distributions from: | | | | | |
| Net investment income | (.79 | ) | | (1.61 | ) | | (1.72 | ) |
| Net realized gain | (.72 | ) | | (.42 | ) | | — |
|
| Total distributions | (1.51 | ) | | (2.03 | ) | | (1.72 | ) |
| Total increase (decrease) in net asset value | (1.78 | ) | | (.50 | ) | | .72 |
|
| Net asset value, ending |
| $27.47 |
| |
| $29.25 |
| |
| $29.75 |
|
| | | | | | |
| Total return* | (.84 | %) | | 5.16 | % | | 8.58 | % |
Ratios to average net assets: A | | | | | |
| Net investment income | 5.63% (a) |
| | 5.38 | % | | 5.77 | % |
| Total expenses | .91% (a) |
| | .89 | % | | .95 | % |
| Expenses before offsets | .74% (a) |
| | .74 | % | | .79 | % |
| Net expenses | .74% (a) |
| | .74 | % | | .79 | % |
| Portfolio turnover | 102 | % | | 228 | % | | 293 | % |
| Net assets, ending (in thousands) |
| $36,629 |
| |
| $42,556 |
| |
| $39,821 |
|
| | | | | | |
|
| | | | | | | | | | | |
| | | | YEARS ENDED | | |
CLASS I SHARES | SEPTEMBER 30, 2012 (z) | | SEPTEMBER 30, 2011 (z) | | SEPTEMBER 30, 2010 |
| Net asset value, beginning |
| $26.48 |
| |
| $27.08 |
| |
| $24.69 |
|
| Income from investment operations: | | | | | |
| Net investment income | 1.86 |
| | 1.97 |
| | 1.99 |
|
| Net realized and unrealized gain (loss) | 2.56 |
| | (.58 | ) | | 2.33 |
|
| Total from investment operations | 4.42 |
| | 1.39 |
| | 4.32 |
|
| Distributions from: | | | | | |
| Net investment income | (1.87 | ) | | (1.99 | ) | | (1.93 | ) |
| Net realized gain | — |
| | — |
| | — |
|
| Total distributions | (1.87 | ) | | (1.99 | ) | | (1.93 | ) |
| Total increase (decrease) in net asset value | 2.55 |
| | (.60 | ) | | 2.39 |
|
| Net asset value, ending |
| $29.03 |
| |
| $26.48 |
| |
| $27.08 |
|
| | | | | | |
| Total return* | 17.19 | % | | 5.02 | % | | 18.14 | % |
Ratios to average net assets: A | | | | | |
| Net investment income | 6.68 | % | | 7.00 | % | | 7.68 | % |
| Total expenses | 1.00 | % | | .97 | % | | .97 | % |
| Expenses before offsets | 1.00 | % | | .97 | % | | .97 | % |
| Net expenses | 1.00 | % | | .97 | % | | .97 | % |
| Portfolio turnover | 273 | % | | 286 | % | | 233 | % |
| Net assets, ending (in thousands) |
| $32,952 |
| |
| $29,735 |
| |
| $36,418 |
|
| See notes to financial highlights. |
30 www.calvert.com CALVERT HIGH YIELD BOND FUND SEMI-ANNUAL REPORT (UNAUDITED)
FINANCIAL HIGHLIGHTS
|
| | | | | | | | | | | |
| | | PERIODS ENDED | |
CLASS Y SHARES | MARCH 31, 2015 (z) | | SEPTEMBER 30, 2014 (z) | | SEPTEMBER 30, 2013 (z) |
| Net asset value, beginning |
| $30.83 |
| |
| $31.29 |
| |
| $30.49 |
|
| Income from investment operations: | | | | | |
| Net investment income | .82 |
| | 1.65 |
| | 1.79 |
|
| Net realized and unrealized gain (loss) | (1.12 | ) | | (.07 | ) | | .75 |
|
| Total from investment operations | (.30 | ) | | 1.58 |
| | 2.54 |
|
| Distributions from: | | | | | |
| Net investment income | (.80 | ) | | (1.62 | ) | | (1.74 | ) |
| Net realized gain | (.72 | ) | | (.42 | ) | | — |
|
| Total distributions | (1.52 | ) | | (2.04 | ) | | (1.74 | ) |
| Total increase (decrease) in net asset value | (1.82 | ) | | (.46 | ) | | .80 |
|
| Net asset value, ending |
| $29.01 |
| |
| $30.83 |
| |
| $31.29 |
|
| | | | | | |
| Total return* | (.89 | %) | | 5.07 | % | | 8.48 | % |
Ratios to average net assets: A | | | | | |
| Net investment income | 5.55% (a) |
| | 5.29 | % | | 5.69 | % |
| Total expenses | .98% (a) |
| | 1.04 | % | | 1.28 | % |
| Expenses before offsets | .82% (a) |
| | .82 | % | | .84 | % |
| Net expenses | .82% (a) |
| | .82 | % | | .84 | % |
| Portfolio turnover | 102 | % | | 228 | % | | 293 | % |
| Net assets, ending (in thousands) |
| $20,105 |
| |
| $15,355 |
| |
| $5,005 |
|
| | | | | | |
|
| | | | | | | | | |
| | PERIODS ENDED | | |
CLASS Y SHARES | SEPTEMBER 30, 2012 (z) | | SEPTEMBER 30, 2011 (z) ^ | | |
| Net asset value, beginning |
| $27.08 |
| |
| $28.74 |
| | |
| Income from investment operations: | | | | | |
| Net investment income | 1.72 |
| | .33 |
| | |
| Net realized and unrealized gain (loss) | 2.79 |
| | (1.99 | ) | | |
| Total from investment operations | 4.51 |
| | (1.66 | ) | | |
| Distributions from: | | | | | |
| Net investment income | (1.10 | ) | | — |
| | |
| Net realized gain | — |
| | — |
| | |
| Total distributions | (1.10 | ) | | — |
| | |
| Total increase (decrease) in net asset value | 3.41 |
| | (1.66 | ) | | |
| Net asset value, ending |
| $30.49 |
| |
| $27.08 |
| | |
| | | | | | |
| Total return* | 16.88 | % | | (5.78 | %) | | |
Ratios to average net assets: A | | | | | |
| Net investment income | 5.92 | % | | 7.13% (a) |
| | |
| Total expenses | 5.19 | % | | 2,723.84% (a) |
| | |
| Expenses before offsets | 1.40 | % | | 1.40% (a) |
| | |
| Net expenses | 1.40 | % | | 1.40% (a) |
| | |
| Portfolio turnover | 273 | % | | 286%** |
| | |
| Net assets, ending (in thousands) |
| $1,338 |
| |
| $1 |
| | |
| See notes to financial highlights. |
www.calvert.com CALVERT HIGH YIELD BOND FUND SEMI-ANNUAL REPORT (UNAUDITED) 31
|
|
A Total expenses do not reflect amounts reimbursed and/or waived by the Advisor or reductions from expense offset arrangements. Expenses before offsets reflect expenses after reimbursement and/or waiver by the Advisor but prior to reductions from expense offset arrangements. Net expenses are net of all reductions and represent the net expenses paid by the Fund. (a) Annualized. (z) Per share figures are calculated using the Average Shares Method. * Total return is not annualized for periods of less than one year and does not reflect deduction of any front-end or deferred sales charge. ** Portfolio turnover is not annualized for periods of less than one year. ^ From inception July 29, 2011. ^^ From inception October 31, 2011. See notes to financial statements. |
32 www.calvert.com CALVERT HIGH YIELD BOND FUND SEMI-ANNUAL REPORT (UNAUDITED)
EXPLANATION OF FINANCIAL TABLES
SCHEDULE OF INVESTMENTS
The Schedule of Investments is a snapshot of all securities held in the fund at their market value, on the last day of the reporting period. Securities are listed by asset type (e.g., common stock, corporate bonds, U.S. government obligations) and may be further broken down into sub-groups and by industry classification.
STATEMENT OF ASSETS AND LIABILITIES
The Statement of Assets and Liabilities is often referred to as the fund’s balance sheet. It lists the value of what the fund owns, is due and owes on the last day of the reporting period. The fund’s assets include the market value of securities owned, cash, receivables for securities sold and shareholder subscriptions, and receivables for dividends and interest payments that have been earned, but not yet received. The fund’s liabilities include payables for securities purchased and shareholder redemptions, and expenses owed but not yet paid. The statement also reports the fund’s net asset value (NAV) per share on the last day of the reporting period. The NAV is calculated by dividing the fund’s net assets (assets minus liabilities) by the number of shares outstanding. This statement is accompanied by a Schedule of Investments. Alternatively, if certain conditions are met, a Statement of Net Assets may be presented in lieu of this statement and the Schedule of Investments.
STATEMENT OF NET ASSETS
The Statement of Net Assets provides a detailed list of the fund’s holdings, including each security’s market value on the last day of the reporting period. The Statement of Net Assets includes a Schedule of Investments. Other assets are added and other liabilities subtracted from the investments total to calculate the fund’s net assets. Finally, net assets are divided by the outstanding shares of the fund to arrive at its share price, or Net Asset Value (NAV) per share.
At the end of the Statement of Net Assets is a table displaying the composition of the fund’s net assets. Paid in Capital is the money invested by shareholders and represents the bulk of net assets. Undistributed Net Investment Income and Accumulated Net Realized Gains usually approximate the amounts the fund had available to distribute to shareholders as of the statement date. Accumulated Realized Losses will appear as negative balances. Unrealized Appreciation (Depreciation) is the difference between the market value of the fund’s investments and their cost, and reflects the gains (losses) that would be realized if the fund were to sell all of its investments at their statement-date -values.
STATEMENT OF OPERATIONS
The Statement of Operations summarizes the fund’s investment income earned and expenses incurred in operating the fund. Investment income includes dividends earned from stocks and interest earned from interest-bearing securities in the fund. Expenses incurred in operating the fund include the advisory fee paid to the investment advisor, administrative services fees, distribution plan expenses (if applicable), transfer agent fees, shareholder servicing expenses, custodial, legal, and audit fees, and the printing and postage expenses related to shareholder reports. Expense offsets (fees paid indirectly) may also be shown. Credits earned from offset arrangements may be used to reduce the fund’s expenses. This statement also shows net gains (losses) realized on the sale of investments and the increase or decrease in the unrealized appreciation (depreciation) on investments held during the period.
www.calvert.com CALVERT HIGH YIELD BOND FUND SEMI-ANNUAL REPORT (UNAUDITED) 33
STATEMENT OF CHANGES IN NET ASSETS
The Statement of Changes in Net Assets shows how the fund’s total net assets changed during the two most recent reporting periods. Changes in the fund’s net assets are attributable to investment operations, distributions and capital share transactions.
The Operations section of the report summarizes information detailed in the Statement of Operations. The Distribution section shows the dividend and capital gain distributions made to shareholders. The amounts shown as distributions in this section may not match the net investment income and realized gains amounts shown in the Operations section because distributions are determined on a tax basis and certain investments or transactions may be treated differently for financial statement and tax purposes. The Capital Share Transactions section shows the amount shareholders invested in the fund, either by purchasing shares or by reinvesting distributions, and the amounts redeemed. The corresponding numbers of shares issued, reinvested and redeemed are shown at the end of the report.
FINANCIAL HIGHLIGHTS
The Financial Highlights table provides a per-share breakdown per class of the components that affect the fund’s net asset value for current and past reporting periods. The table provides total return, total distributions, expense ratios, portfolio turnover and net assets for the applicable period. Total return is a measure of a fund’s performance that encompasses all elements of return: dividends, capital gain distributions and changes in net asset value. Total return is the change in value of an investment over a given period, assuming reinvestment of any dividends and capital gain distributions, expressed as a percentage of the initial investment. Total distributions include distributions from net investment income and net realized gains. Long-term gains are earned on securities held in the fund more than one year. Short-term gains, on the sale of securities held less than one year, are treated as ordinary dividend income for tax purposes. The expense ratio is a fund’s cost of doing business, expressed as a percentage of net assets. These expenses directly reduce returns to shareholders. Portfolio turnover measures the trading activity in a fund’s investment portfolio—how often securities are bought and sold by a fund. Portfolio turnover is affected by market conditions, changes in the size of the fund, the nature of the fund’s investments and the investment style of the portfolio manager.
PROXY VOTING
The Proxy Voting Guidelines of the Calvert Funds that the Fund uses to determine how to vote proxies relating to portfolio securities are provided as an Appendix to the Fund’s Statement of Additional Information. The Statement of Additional Information can be obtained free of charge by calling the Fund at 1-800-368-2745, by visiting the Calvert website at www.calvert.com; or by visiting the SEC’s website at www.sec.gov.
Information regarding how the Fund voted proxies relating to portfolio securities during the most recent 12-month period ended June 30 is available on the Fund’s website at www.calvert.com and on the SEC’s website at www.sec.gov.
AVAILABILITY OF QUARTERLY PORTFOLIO HOLDINGS
The Fund files its complete schedule of portfolio holdings with the SEC for the first and third quarters of each fiscal year on Form N-Q. The Fund’s Form N-Q is available on the SEC’s website at www.sec.gov. The Fund’s Form N-Q may be reviewed and copied at the SEC’s Public Reference Room in Washington, DC; information on the operation of the Public Reference Room may be obtained by calling 1-800-SEC-0330.
34 www.calvert.com CALVERT HIGH YIELD BOND FUND SEMI-ANNUAL REPORT (UNAUDITED)
BASIS FOR BOARD'S APPROVAL OF INVESTMENT ADVISORY CONTRACT
At a meeting held on December 10, 2014, the Board of Trustees, and by a separate vote, the disinterested Trustees, approved the continuance of the Investment Advisory Agreement between The Calvert Fund and the Advisor with respect to the Fund.
In evaluating the Investment Advisory Agreement, the Board considered a variety of information relating to the Fund and the Advisor. The disinterested Trustees reviewed a report prepared by the Advisor regarding various services provided to the Fund by the Advisor and its affiliates. Such report included, among other data, information regarding the Advisor's personnel and the Advisor's revenue and cost of providing services to the Fund, and a separate report prepared by an independent third party, which provided a statistical analysis comparing the Fund's investment performance, expenses, and fees to comparable mutual funds.
The disinterested Trustees were separately represented by independent legal counsel with respect to their consideration of the reapproval of the Investment Advisory Agreement. Prior to voting, the disinterested Trustees reviewed the proposed continuance of the Investment Advisory Agreement with management and also met in private sessions with their counsel at which no representatives of management were present.
In the course of its deliberations regarding the Investment Advisory Agreement, the Board considered the following factors, among others: the nature, extent and quality of the services provided by the Advisor, including the personnel providing such services; the Advisor's financial condition; the level and method of computing the Fund's advisory fee; comparative performance, fee and expense information for the Fund; the profitability of the Calvert Family of Funds to the Advisor and its affiliates; the direct and indirect benefits, if any, derived by the Advisor and its affiliates from their relationship with the Fund; the effect of the Fund's growth and size on the Fund's performance and expenses; the affiliated distributor’s process for monitoring sales load breakpoints; the Advisor's compliance programs and policies; the Advisor's performance of substantially similar duties for other funds; and any possible conflicts of interest.
In considering the nature, extent and quality of the services provided by the Advisor under the Investment Advisory Agreement, the Board reviewed information provided by the Advisor relating to its operations and personnel, including, among other information, biographical information on the Advisor's investment, supervisory and professional staff and descriptions of its organizational and management structure. The Board also took into account similar information provided periodically throughout the previous year by the Advisor, as well as the Board’s familiarity with management through Board of Trustees' meetings, discussions and other reports. The Board considered the Advisor's management style and its performance in employing its investment strategies, as well as its current level of staffing and overall resources. The Board also noted that it reviewed on a quarterly basis information regarding the Advisor’s compliance with applicable policies and procedures, including those related to personal investing. The Advisor's administrative capabilities, including its ability to supervise the other service providers for the Fund, were also considered. The Board also took into account the environmental, social, sustainability and governance research and analysis provided by the Advisor to the Fund. The Board observed that the scope of services provided by the Advisor generally had expanded over time as a result of regulatory, market and other changes. The Board took into consideration, among other factors, the effectiveness of the Fund’s and Advisor’s processes, policies and procedures and the Advisor’s personnel. The Board also took into account, among other items, periodic reports received from the Advisor over the past year concerning the Advisor’s ongoing review and enhancement of certain
www.calvert.com CALVERT HIGH YIELD BOND FUND SEMI-ANNUAL REPORT (UNAUDITED) 35
processes, policies and procedures of the Fund and the Advisor. The Board concluded that it was satisfied with the nature, extent and quality of services provided to the Fund by the Advisor under the Investment Advisory Agreement.
In considering the Fund's performance, the Board noted that it reviewed on a quarterly basis detailed information about the Fund's performance results, portfolio composition and investment strategies. In addition, the Board took into account overall financial market conditions. The Board also reviewed various comparative data provided to it in connection with its consideration of the renewal of the Investment Advisory Agreement, including, among other information, a comparison of the Fund's total return with its Lipper index and with that of other mutual funds deemed to be in its peer group by an independent third party in its report. This comparison indicated that the Fund performed above the median of its peer group for the one-, three- and five-year periods ended June 30, 2014. The data also indicated that the Fund underperformed its Lipper index for the one- and five-year periods ended June 30, 2014, and outperformed its Lipper index for the same three-year period. Based upon its review, the Board concluded that the Fund's overall performance was satisfactory relative to the performance of funds with similar investment objectives and to relevant indices.
In considering the Fund's fees and expenses, the Board compared the Fund's fees and total expense ratio with various comparative data for the funds in its peer group. Among other findings, the data indicated that the Fund's advisory fee (after taking into account waivers and/or reimbursements) and total expenses (net of waivers and/or reimbursements) were below the median of its peer group. The Board noted that the allocation of advisory and administrative fees may vary among the Fund’s peer group. The Board took into account the Advisor’s current undertaking to maintain expense limitations for the Fund and that the Advisor was reimbursing a portion of the Fund’s expenses. The Board also noted management’s discussion of the Fund’s expenses and certain factors that affected the level of such expenses, including the cost of providing the environmental, social, sustainability and governance research and analysis provided by the Advisor. Based upon its review, the Board concluded that the advisory fee was reasonable in view of the quality of services received by the Fund from the Advisor and the other factors considered.
The Board reviewed the Advisor’s profitability on a fund-by-fund basis. In reviewing the overall profitability of the advisory fee to the Fund's Advisor, the Board also considered the fact that affiliates of the Advisor provided shareholder servicing, administrative and distribution services to the Fund for which they received compensation. The information considered by the Board included Calvert's operating profit margin information both before and after tax expenses with respect to the services that the Advisor and its affiliates provided to the Calvert Family of Funds complex. The Board reviewed the profitability of the Advisor's relationship with the Fund in terms of the total amount of annual advisory fees it received with respect to the Fund and whether the Advisor had the financial wherewithal to continue to provide services to the Fund. The Board noted that the Advisor was reimbursing a portion of the Fund’s expenses. The Board also noted the Advisor’s current undertaking to maintain expense limitations for the Fund. The Trustees also considered that the Advisor derived benefits to its reputation and other indirect benefits from its relationship with the Fund. Based upon its review, the Board concluded that the Advisor's and its affiliates’ level of profitability from their relationship with the Fund was reasonable.
The Board considered the effect of the Fund's current size and its potential growth on its performance and expenses. The Board concluded that adding breakpoints to the advisory fee at specified asset levels would not be appropriate at this time given the Fund's current size.
36 www.calvert.com CALVERT HIGH YIELD BOND FUND SEMI-ANNUAL REPORT (UNAUDITED)
The Board noted that if the Fund's assets increased over time, the Fund might realize other economies of scale if assets increased proportionally more than certain other expenses.
In reapproving the Investment Advisory Agreement, the Board, including the disinterested Trustees, did not identify any single factor as controlling, and each Trustee may have attributed different weight to various factors.
Conclusions
The Board reached the following conclusions regarding the Investment Advisory Agreement, among others: (a) the Advisor has demonstrated that it possesses the capability and resources to perform the duties required of it under the Investment Advisory Agreement; (b) the Advisor maintains appropriate compliance programs; (c) the overall performance of the Fund is satisfactory relative to the performance of funds with similar investment objectives and to relevant indices; (d) the Advisor is likely to execute its investment strategies consistently over time; and (e) the Fund's advisory fee is reasonable in view of the quality of services received by the Fund from the Advisor and the other factors considered. Based on its conclusions, the Board determined that reapproval of the Investment Advisory Agreement would be in the best interests of the Fund and its shareholders.
www.calvert.com CALVERT HIGH YIELD BOND FUND SEMI-ANNUAL REPORT (UNAUDITED) 37
This page intentionally left blank.
To Open an Account
800-368-2748
Service for Existing Account
Shareholders: 800-368-2745
Brokers: 800-368-2746
TDD for Hearing Impaired
800-541-1524
Registered Mail
Calvert Investments
c/o BFDS,
P.O. Box 219544
Kansas City, MO 64121-9544
Overnight Mail
Calvert Investments
c/o BFDS,
330 West 9th Street
Kansas City, MO 64105
Web Site
www.calvert.com
Principal Underwriter
Calvert Investment Distributors, Inc.
4550 Montgomery Avenue
Suite 1000 North
Bethesda, Maryland 20814
|
| | | |
CALVERT HIGH YIELD BOND FUND | CALVERT'S FAMILY OF FUNDS | | |
| | Municipal Funds Tax-Free Bond Fund Taxable Bond Funds Bond Portfolio Income Fund Short Duration Income Fund Long-Term Income Fund Ultra-Short Income Fund High Yield Bond Fund Green Bond Fund Unconstrained Bond Fund Balanced and Asset Allocation Funds Balanced Portfolio Conservative Allocation Fund Moderate Allocation Fund Aggressive Allocation Fund | | Equity Funds Large Cap Core Portfolio Equity Portfolio Large Cap Value Fund Social Index Fund Capital Accumulation Fund International Equity Fund Small Cap Fund Global Energy Solutions Fund Global Water Fund International Opportunities Fund Equity Income Fund Emerging Markets Equity Fund |
| | |
This report is intended to provide fund information to shareholders. It is not authorized for distribution to prospective investors unless preceded or accompanied by a prospectus.
Note: The information on our website is not incorporated by reference into this report; our website address is included as an inactive textual reference only.
Investors should carefully consider the investment objectives, risks, charges and expenses of the Calvert Funds. This and other important information is contained in the fund’s summary prospectus and prospectus, which can be obtained from your financial professional and should be read carefully before investing. You may also call Calvert at 800/368-2748 or visit www. calvert.com.
Printed on recycled paper using soy inks.
Item 2. Code of Ethics.
Not applicable.
Item 3. Audit Committee Financial Expert.
Not applicable.
Item 4. Principal Accountant Fees and Services.
Not applicable.
Item 5. Audit Committee of Listed Registrants.
Not applicable.
Item 6. Schedule of Investments.
(a) This Schedule is included as part of the report to shareholders filed under Item 1 of this Form.
(b) Not applicable.
Item 7. Disclosure of Proxy Voting Policies and Procedures for Closed-End Management Investment Companies.
Not applicable.
Item 8. Portfolio Managers of Closed-End Management Investment Companies.
Not applicable.
Item 9. Purchases of Equity Securities by Closed-End Management Investment Company and Affiliated Purchasers.
Not applicable.
Item 10. Submission of Matters to a Vote of Security Holders.
No material changes have been made to the procedures by which shareholders may recommend nominees to the registrant’s Board of Trustees since registrant last provided disclosure in response to this Item.
Item 11. Controls and Procedures.
(a) The principal executive and financial officers concluded that the registrant's disclosure controls and procedures (as defined in Rule 30a-3(c) under the 1940 Act) are effective, based on the evaluation of these controls and procedures required by Rule 30a-3(b) under the 1940 Act and Rules 13a-15(b) or 15d-15(b) under the Exchange Act, as of a date within 90 days of the filing date of this report.
(b) There was no change in the registrant's internal control over financial reporting (as defined in Rule 30a-3(d) under the 1940 Act) that occurred during the registrant's second fiscal quarter of the period covered by this report that has materially affected, or is reasonably likely to materially affect, the registrant's internal control over financial reporting.
Item 12. Exhibits.
(a)(1) Not applicable.
(a)(2) A separate certification for each principal executive officer and principal financial officer of the registrant as required by Rule 30a-2 under the Act (17 CFR 270.30a-2).
Attached hereto.
(a)(3) Not applicable.
(b) A certification for the registrant's Principal Executive Officer and Principal Financial Officer, as required by Rule 30a-2(b) under the Investment Company Act of 1940, is attached hereto. The certification furnished pursuant to this paragraph is not deemed to be "filed" for purposes of Section 18 of the Securities Exchange Act of 1934, or otherwise subject to the liability of that section. Such certification is not deemed to be incorporated by reference into any filing under the Securities Act of 1933 or the Securities Exchange Act of 1934, except to the extent that the registrant specifically incorporates it by reference.
Pursuant to the requirements of the Securities Exchange Act of 1934 and the Investment Act of 1940, the registrant has duly caused this report to be signed on its behalf by the undersigned, thereunto duly authorized.
THE CALVERT FUND
By: /s/ John H. Streur
John H. Streur
President -- Principal Executive Officer
Date: May 28, 2015
Pursuant to the requirements of the Securities Exchange Act of 1934 and the Investment Act of 1940, this report has been signed below by the following persons on behalf of the registrant and in the capacities and on the dates indicated.
/s/ John H. Streur
John H. Streur
President -- Principal Executive Officer
Date: May 28, 2015
/s/ Vicki L. Benjamin
Vicki L. Benjamin
Treasurer -- Principal Financial Officer
Date: May 28, 2015