UNITED STATES
SECURITIES AND EXCHANGE COMMISSION
Washington, D.C. 20549
Form N-CSR
CERTIFIED SHAREHOLDER REPORT OF REGISTERED
MANAGEMENT INVESTMENT COMPANIES
Investment Company Act File Number: 811-03416
THE CALVERT FUND
(Exact Name of Registrant as Specified in Charter)
1825 Connecticut Avenue NW, Suite 400, Washington, DC 20009
(Address of Principal Executive Offices)
Deidre E. Walsh
Two International Place, Boston, Massachusetts 02110
(Name and Address of Agent for Services)
(202) 238-2200
(Registrant’s Telephone Number)
September 30
Date of Fiscal Year End
September 30, 2021
Date of Reporting Period
| Item 1. | Reports to Stockholders |
Calvert
Core Bond Fund
Annual Report
September 30, 2021
Commodity Futures Trading Commission Registration. The Commodity Futures Trading Commission (“CFTC”) has adopted regulations that subject registered investment companies and advisers to regulation by the CFTC if a fund invests more than a prescribed level of its assets in certain CFTC-regulated instruments (including futures, certain options and swap agreements) or markets itself as providing investment exposure to such instruments. The adviser has claimed an exclusion from the definition of “commodity pool operator” under the Commodity Exchange Act with respect to its management of the Fund and the other funds it manages. Accordingly, neither the Fund nor the adviser is subject to CFTC regulation.
Fund shares are not insured by the FDIC and are not deposits or other obligations of, or guaranteed by, any depository institution. Shares are subject to investment risks, including possible loss of principal invested.
This report must be preceded or accompanied by a current summary prospectus or prospectus. Before investing, investors should consider carefully the investment objective, risks, and charges and expenses of a mutual fund. This and other important information is contained in the summary prospectus and prospectus, which can be obtained from a financial intermediary. Prospective investors should read the prospectus carefully before investing. For further information, please call 1-800-368-2745.
Choose Planet-friendly E-delivery!
Sign up now for on-line statements, prospectuses, and fund reports. In less than five minutes you can help reduce paper mail and lower fund costs.
Just go to www.calvert.com. If you already have an online account with the Calvert funds, click on Login to access your Account and select the documents you would like to receive via e-mail.
If you’re new to online account access, click on Login, then Register to create your user name and password. Once you’re in, click on the E-delivery sign-up on the Account Portfolio page and follow the quick, easy steps.
Note: If your shares are not held directly with the Calvert funds but through a brokerage firm, you must contact your broker for electronic delivery options available through their firm.
Annual Report September 30, 2021
Calvert
Core Bond Fund
Calvert
Core Bond Fund
September 30, 2021
Management's Discussion of Fund Performance†
Economic and Market Conditions
After the U.S. Federal Reserve (the Fed) met in late September 2021, Fed Chair Jerome Powell noted that “The path of the economy continues to depend on the course of the [COVID-19] virus, and risks to the economic outlook remain.” For fixed-income investors, this reflected the dominant investment theme for the 12-month period ended September 30, 2021.
Throughout the period, performance of fixed-income asset classes ebbed and flowed as the virus advanced and retreated, with a second wave of COVID-19 washing over the U.S. and global economies in the winter of 2020-2021 and a third wave known as the Delta variant spreading around the world in the summer of 2021.
For the period as a whole, however, U.S. fixed-income investors appeared to focus on the reopening of the economy and its recovery from a near-shutdown in the early days of the pandemic. The asset classes that fared best during the period were those that stood to benefit from a U.S. and global economic revival. So-called “safe-haven” assets, in contrast, fared poorly as investors appeared to become more comfortable taking on increased risk during the period.
As a result, U.S. Treasurys were one of the worst-performing fixed-income asset classes during the period, with the Bloomberg U.S. Treasury Index returning (3.30)% for the period. The Bloomberg U.S. Aggregate Bond Index, a broad measure of the U.S. fixed-income market, was also dragged down by its Treasury component, and returned (0.90)% for the period.
Investment-grade corporate bonds fared better. The Bloomberg U.S. Corporate Bond Index returned 1.74% for the period, as factories and businesses reopened and consumers — a key driver of the U.S. economy — rushed to spend the money they had saved while confined at home earlier in the pandemic.
High yield bonds were a standout asset class during the period. Several industries prominent within the high yield space — including airlines, restaurants, retail, and travel & leisure — were among the hardest-hit businesses early in the pandemic and the biggest beneficiaries of the subsequent economic recovery. Reflecting investors’ increasing confidence in the recovery, as well as their search for yield in a historically low-yield environment, the Bloomberg U.S. Corporate High Yield Index returned 11.28% for the one-year period.
Fund Performance
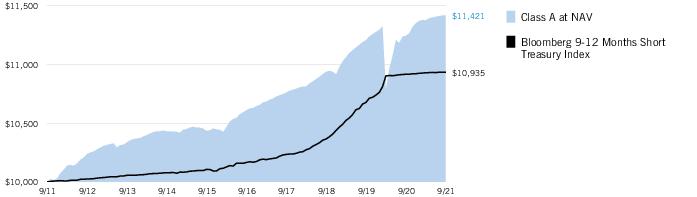
For the 12-month period ended September 30, 2021, Calvert Core Bond Fund (the Fund) returned 1.79% for Class A shares at net asset value (NAV), outperforming its primary benchmark, the Bloomberg U.S. Aggregate Bond Index (the Index), which returned (0.90)%.
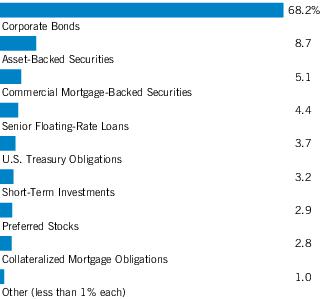
Sector allocation in the Fund contributed to returns relative to the Index during the period. An overweight exposure to investment-grade corporate securities, an underweight exposure to U.S. Treasurys, and an out-of-Index allocation to high yield corporate securities were particularly beneficial. An allocation to U.S. Treasury Inflation-Protected Securities and an underweight exposure to mortgage-backed securities further enhanced relative performance during the period. Security selections in investment-grade corporate securities and asset-backed securities also contributed to performance relative to the Index.
The Fund’s duration and use of derivatives detracted from performance relative to the Index during the period.
See Endnotes and Additional Disclosures in this report.
Past performance is no guarantee of future results. Returns are historical and are calculated by determining the percentage change in net asset value (NAV) or offering price (as applicable) with all distributions reinvested. Investment return and principal value will fluctuate so that shares, when redeemed, may be worth more or less than their original cost. Performance for periods less than or equal to one year is cumulative. Performance is for the stated time period only; due to market volatility, current Fund performance may be lower or higher than the quoted return. For performance as of the most recent month-end, please refer to www.calvert.com.
Calvert
Core Bond Fund
September 30, 2021
Performance
Portfolio Managers Vishal Khanduja, CFA and Brian S. Ellis, CFA, each of Calvert Research and Management
| % Average Annual Total Returns1,2 | Class
Inception Date | Performance
Inception Date | One Year | Five Years | Ten Years |
| Class A at NAV | 12/31/2004 | 12/31/2004 | 1.79% | 5.62% | 5.94% |
| Class A with 3.75% Maximum Sales Charge | — | — | (2.04) | 4.82 | 5.53 |
| Class I at NAV | 01/30/2015 | 12/31/2004 | 1.99 | 5.96 | 6.20 |
|
| Bloomberg U.S. Aggregate Bond Index | — | — | (0.90)% | 2.94% | 3.01% |
| Bloomberg Long U.S. Credit Index | — | — | 2.13 | 6.13 | 6.59 |
| % Total Annual Operating Expense Ratios3 | Class A | Class I |
| Gross | 0.95% | 0.70% |
| Net | 0.74 | 0.49 |
Growth of $10,000
This graph shows the change in value of a hypothetical investment of $10,000 in Class A of the Fund for the period indicated. For comparison, the same investment is shown in the indicated index.
| Growth of Investment2 | Amount Invested | Period Beginning | At NAV | With Maximum Sales Charge |
| Class I | $250,000 | 09/30/2011 | $456,558 | N.A. |
See Endnotes and Additional Disclosures in this report.
Past performance is no guarantee of future results. Returns are historical and are calculated by determining the percentage change in net asset value (NAV) or offering price (as applicable) with all distributions reinvested. Investment return and principal value will fluctuate so that shares, when redeemed, may be worth more or less than their original cost. Performance for periods less than or equal to one year is cumulative. Performance is for the stated time period only; due to market volatility, current Fund performance may be lower or higher than the quoted return. For performance as of the most recent month-end, please refer to www.calvert.com.
Calvert
Core Bond Fund
September 30, 2021
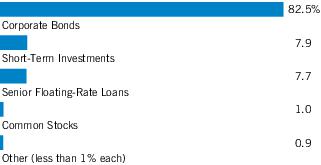
Asset Allocation (% of total investments)
Credit Quality (% of bond holdings)*
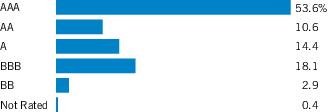
* For purposes of the Fund’s rating restrictions, ratings are based on Moody’s Investors Service, Inc. (“Moody’s”), S&P Global Ratings (“S&P”) or Fitch Ratings (“Fitch”), or Kroll Bond Rating Agency, LLC (“Kroll”) for securitized debt instruments only (such as asset-backed securities (“ABS”) and mortgage-backed securities (“MBS”)), as applicable. If securities are rated differently by the ratings agencies, the highest rating is applied. Ratings, which are subject to change, apply to the creditworthiness of the issuers of the underlying securities and not to the Fund or its shares. Credit ratings measure the quality of an issuance based on the issuer’s creditworthiness, with ratings ranging from AAA, being the highest, to D, being the lowest based on S&P’s measures. Ratings of BBB or higher by S&P, Fitch or Kroll (Baa or higher by Moody’s) are considered to be investment-grade quality. Credit ratings are based largely on the ratings agency’s analysis at the time of rating. The rating assigned to any particular security is not necessarily a reflection of the issuer’s current financial condition and does not necessarily reflect its assessment of the volatility of a security’s market value or of the liquidity of an investment in the security. Holdings designated as “Not Rated” (if any) are not rated by the national ratings agencies stated above.
See Endnotes and Additional Disclosures in this report.
Calvert
Core Bond Fund
September 30, 2021
Endnotes and Additional Disclosures
| † | The views expressed in this report are those of the portfolio manager(s) and are current only through the date stated at the top of this page. These views are subject to change at any time based upon market or other conditions, and Calvert and the Fund(s) disclaim any responsibility to update such views. These views may not be relied upon as investment advice and, because investment decisions are based on many factors, may not be relied upon as an indication of trading intent on behalf of any Calvert fund. This commentary may contain statements that are not historical facts, referred to as “forward-looking statements.” The Fund’s actual future results may differ significantly from those stated in any forward-looking statement, depending on factors such as changes in securities or financial markets or general economic conditions, the volume of sales and purchases of Fund shares, the continuation of investment advisory, administrative and service contracts, and other risks discussed from time to time in the Fund’s filings with the Securities and Exchange Commission. |
| | |
| 1 | Bloomberg Long U.S. Credit Index measures the performance of investment-grade U.S. corporate securities and government-related bonds with a maturity greater than ten years. Bloomberg U.S. Aggregate Bond Index is an unmanaged index of domestic investment-grade bonds, including corporate, government and mortgage-backed securities. Unless otherwise stated, index returns do not reflect the effect of any applicable sales charges, commissions, expenses, taxes or leverage, as applicable. It is not possible to invest directly in an index.Effective February 1, 2021, the Fund changed its primary benchmark to the Bloomberg U.S. Aggregate Bond Index because the investment adviser believes it is a more appropriate benchmark for the Fund. |
| 2 | Total Returns at NAV do not include applicable sales charges. If sales charges were deducted, the returns would be lower. Total Returns shown with maximum sales charge reflect the stated maximum sales charge. Unless otherwise stated, performance does not reflect the deduction of taxes on Fund distributions or redemptions of Fund shares.Performance prior to the inception date of a class may be linked to the performance of an older class of the Fund. This linked performance is adjusted for any applicable sales charge, but is not adjusted for class expense differences. If adjusted for such differences, the performance would be different. The performance of Class I is linked to Class A. Performance presented in the Financial Highlights included in the financial statements is not linked. Effective February 1, 2021, the Fund revised its name, objective and principal investment strategies and adopted a policy of investing at least 80% of its net assets in investment grade, U.S. dollar-denominated debt securities. |
| | Calvert Research and Management became the investment adviser to the Fund on December 31, 2016. Performance reflected prior to such date is that of the Fund’s former investment adviser. |
| 3 | Source: Fund prospectus. Net expense ratios reflect a contractual expense reimbursement that continues through 1/31/22. Without the reimbursement, performance would have been lower. The expense ratios for the current reporting period can be found in the Financial Highlights section of this report. |
| Fund profile subject to change due to active management. |
| | Additional Information |
| | Bloomberg U.S. Treasury Index measures the performance of U.S. Treasuries with a maturity of one year or more. Bloomberg U.S. Corporate Bond Index measures the performance of investment-grade U.S. corporate securities with a maturity of one year or more. Bloomberg U.S. Corporate High Yield Index measures USD-denominated, non-investment grade corporate securities. |
| | Duration is a measure of the expected change in price of a bond — in percentage terms — given a one percent change in interest rates, all else being constant. Securities with lower durations tend to be less sensitive to interest rate changes. |
| | Important Notice to Shareholders |
| | Effective August 24, 2021, the Bloomberg Barclays fixed income indices were rebranded as Bloomberg indices. |
Calvert
Core Bond Fund
September 30, 2021
Example
As a Fund shareholder, you incur two types of costs: (1) transaction costs, including sales charges (loads) on purchases and redemption fees (if applicable); and (2) ongoing costs, including management fees; distribution and/or service fees; and other Fund expenses. This Example is intended to help you understand your ongoing costs (in dollars) of Fund investing and to compare these costs with the ongoing costs of investing in other mutual funds. The Example is based on an investment of $1,000 invested at the beginning of the period and held for the entire period (April 1, 2021 to September 30, 2021).
Actual Expenses
The first section of the table below provides information about actual account values and actual expenses. You may use the information in this section, together with the amount you invested, to estimate the expenses that you paid over the period. Simply divide your account value by $1,000 (for example, an $8,600 account value divided by $1,000 = 8.6), then multiply the result by the number in the first section under the heading entitled “Expenses Paid During Period” to estimate the expenses you paid on your account during this period.
Hypothetical Example for Comparison Purposes
The second section of the table below provides information about hypothetical account values and hypothetical expenses based on the actual Fund expense ratio and an assumed rate of return of 5% per year (before expenses), which is not the actual Fund return. The hypothetical account values and expenses may not be used to estimate the actual ending account balance or expenses you paid for the period. You may use this information to compare the ongoing costs of investing in the Fund and other funds. To do so, compare this 5% hypothetical example with the 5% hypothetical examples that appear in the shareholder reports of the other funds.
Please note that the expenses shown in the table are meant to highlight your ongoing costs only and do not reflect any transactional costs, such as sales charges (loads) or redemption fees (if applicable). Therefore, the second section of the table is useful in comparing ongoing costs only, and will not help you determine the relative total costs of owning different funds. In addition, if these transactional costs were included, your costs would be higher.
| | Beginning
Account Value
(4/1/21) | Ending
Account Value
(9/30/21) | Expenses Paid
During Period*
(4/1/21 – 9/30/21) | Annualized
Expense
Ratio |
| Actual | | | | |
| Class A | $1,000.00 | $1,019.40 | $3.75 ** | 0.74% |
| Class I | $1,000.00 | $1,020.70 | $2.48 ** | 0.49% |
| Hypothetical | | | | |
| (5% return per year before expenses) | | | | |
| Class A | $1,000.00 | $1,021.36 | $3.75 ** | 0.74% |
| Class I | $1,000.00 | $1,022.61 | $2.48 ** | 0.49% |
| * | Expenses are equal to the Fund's annualized expense ratio for the indicated Class, multiplied by the average account value over the period, multiplied by 183/365 (to reflect the one-half year period). The Example assumes that the $1,000 was invested at the net asset value per share determined at the close of business on March 31, 2021. |
| ** | Absent a waiver and/or reimbursement of expenses by an affiliate, expenses would be higher. |
Calvert
Core Bond Fund
September 30, 2021
| Asset-Backed Securities — 7.4% |
| Security | Principal
Amount
(000's omitted) | Value |
| Aligned Data Centers Issuer, LLC, Series 2021-1A, Class A2, 1.937%, 8/15/46(1) | $ | 378 | $ 380,416 |
| Coinstar Funding, LLC, Series 2017-1A, Class A2, 5.216%, 4/25/47(1) | | 299 | 299,576 |
| DB Master Finance, LLC, Series 2017-1A, Class A2II, 4.03%, 11/20/47(1) | | 410 | 433,981 |
| Diamond Infrastructure Funding, LLC, Series 2021-1A, Class A, 1.76%, 4/15/49(1) | | 255 | 251,850 |
| FOCUS Brands Funding, LLC, Series 2017-1A, Class A2II, 5.093%, 4/30/47(1) | | 431 | 457,766 |
| JPMorgan Chase Bank, NA: | | | |
| Series 2021-2, Class B, 0.889%, 12/26/28(1) | | 335 | 335,038 |
| Series 2021-3, Class B, 0.76%, 2/26/29(1) | | 261 | 260,940 |
| Mosaic Solar Loan Trust, Series 2021-1A, Class A, 1.51%, 12/20/46(1) | | 197 | 195,930 |
| Oportun Funding XIV, LLC, Series 2021-A, Class B, 1.76%, 3/8/28(1) | | 100 | 100,309 |
| Oportun Issuance Trust, Series 2021-B, Class A, 1.47%, 5/8/31(1) | | 278 | 278,417 |
| Pagaya AI Debt Selection Trust: | | | |
| Series 2021-3, Class A, 1.15%, 5/15/29(1) | | 813 | 813,493 |
| Series 2021-HG1, Class A, 1.22%, 1/16/29(1) | | 184 | 183,824 |
| Planet Fitness Master Issuer, LLC, Series 2019-1A, Class A2, 3.858%, 12/5/49(1) | | 614 | 625,586 |
| SBA Tower Trust, Series 2014-2A, Class C, 3.869%, 10/15/49(1) | | 500 | 522,989 |
| ServiceMaster Funding, LLC, Series 2020-1, Class A2II, 3.337%, 1/30/51(1) | | 340 | 354,078 |
| Sunnova Helios II Issuer, LLC, Series 2021-A, Class A, 1.80%, 2/20/48(1) | | 386 | 385,996 |
| Sunrun Demeter Issuer, LLC, Series 2021-2A, Class A, 2.27%, 1/30/57(1) | | 170 | 170,308 |
| TES, LLC, Series 2017-1A, Class A, 4.33%, 10/20/47(1) | | 271 | 288,284 |
| Theorem Funding Trust, Series 2021-1A, Class A, 1.21%, 12/15/27(1) | | 589 | 589,502 |
Total Asset-Backed Securities
(identified cost $6,808,688) | | | $ 6,928,283 |
| Collateralized Mortgage Obligations — 0.9% |
| Security | Principal
Amount
(000's omitted) | Value |
| Bellemeade Re, Ltd.: | | | |
| Series 2021-1A, Class M1A, 1.80%, (30-day average SOFR + 1.75%), 3/25/31(1)(2) | $ | 150 | $ 152,175 |
| Series 2021-2A, Class M1A, 1.25%, (30-day average SOFR + 1.20%), 6/25/31(1)(2) | | 152 | 153,156 |
| Security | Principal
Amount
(000's omitted) | Value |
| Bellemeade Re, Ltd.: (continued) | | | |
| Series 2021-3A, Class A2, 1.05%, (30-day average SOFR + 1.00%), 9/25/31(1)(2) | $ | 150 | $ 150,920 |
| Eagle Re, Ltd., Series 2021-1, Class M1A, 1.75%, (30-day average SOFR + 1.70%), 10/25/33(1)(2) | | 244 | 246,157 |
| Federal Home Loan Mortgage Corp. Structured Agency Credit Risk Debt Notes, Series 2021-DNA3, Class M1, 0.80%, (30-day average SOFR + 0.75%), 10/25/33(1)(2) | | 185 | 185,462 |
Total Collateralized Mortgage Obligations
(identified cost $882,703) | | | $ 887,870 |
| Commercial Mortgage-Backed Securities — 4.0% |
| Security | Principal
Amount
(000's omitted) | Value |
| BX Commercial Mortgage Trust: | | | |
| Series 2021-VOLT, Class B, 1.034%, (1 mo. USD LIBOR + 0.95%), 9/15/36(1)(2) | $ | 522 | $ 523,473 |
| Series 2021-VOLT, Class C, 1.184%, (1 mo. USD LIBOR + 1.10%), 9/15/36(1)(2) | | 246 | 246,735 |
| Series 2021-VOLT, Class D, 1.734%, (1 mo. USD LIBOR + 1.65%), 9/15/36(1)(2) | | 180 | 180,541 |
| Extended Stay America Trust: | | | |
| Series 2021-ESH, Class A, 1.164%, (1 mo. USD LIBOR + 1.08%), 7/15/38(1)(2) | | 102 | 101,937 |
| Series 2021-ESH, Class C, 1.784%, (1 mo. USD LIBOR + 1.70%), 7/15/38(1)(2) | | 306 | 309,135 |
| Federal National Mortgage Association, Series 2018-M13, Class A2, 3.818%, 9/25/30(3) | | 900 | 1,044,324 |
| Hawaii Hotel Trust, Series 2019-MAUI, Class A, 1.234%, (1 mo. USD LIBOR + 1.15%), 5/15/38(1)(2) | | 428 | 429,291 |
| Morgan Stanley Capital I Trust, Series 2017-CLS, Class A, 0.784%, (1 mo. USD LIBOR + 0.70%), 11/15/34(1)(2)(4) | | 191 | 191,061 |
| Motel Trust: | | | |
| Series 2021-MTL6, Class A, 0.984%, (1 mo. USD LIBOR + 0.90%), 9/15/38(1)(2) | | 138 | 138,245 |
| Series 2021-MTL6, Class B, 1.284%, (1 mo. USD LIBOR + 1.20%), 9/15/38(1)(2) | | 100 | 100,263 |
| SLG Office Trust, Series 2021-OVA, Class A, 2.585%, 7/15/41(1) | | 410 | 424,792 |
Total Commercial Mortgage-Backed Securities
(identified cost $3,702,686) | | | $ 3,689,797 |
7
See Notes to Financial Statements.
Calvert
Core Bond Fund
September 30, 2021
Schedule of Investments — continued
| Security | Principal
Amount
(000's omitted) | Value |
| Communications — 3.8% | |
| AT&T, Inc.: | | | |
| 3.50%, 9/15/53 | $ | 300 | $ 297,505 |
| 3.80%, 12/1/57 | | 427 | 437,120 |
| 4.90%, 6/15/42 | | 435 | 524,054 |
| Charter Communications Operating, LLC/Charter Communications Operating Capital, 4.80%, 3/1/50 | | 395 | 444,065 |
| Comcast Corp.: | | | |
| 2.45%, 8/15/52(5) | | 621 | 549,099 |
| 4.25%, 1/15/33 | | 305 | 356,880 |
| SES Global Americas Holdings GP, 5.30%, 3/25/44(1) | | 219 | 250,934 |
| SES S.A., 5.30%, 4/4/43(1) | | 130 | 148,913 |
| T-Mobile USA, Inc.: | | | |
| 2.25%, 11/15/31 | | 227 | 222,779 |
| 2.55%, 2/15/31 | | 126 | 126,531 |
| 2.625%, 4/15/26 | | 197 | 201,679 |
| | | | $ 3,559,559 |
| Consumer, Cyclical — 1.9% | |
| Aptiv PLC, 5.40%, 3/15/49 | $ | 665 | $ 909,000 |
| Delta Air Lines, Inc./SkyMiles IP, Ltd., 4.75%, 10/20/28(1) | | 138 | 153,955 |
| Home Depot, Inc. (The), 4.40%, 3/15/45 | | 203 | 253,608 |
| Hyatt Hotels Corp.: | | | |
| 1.30%, 10/1/23(6) | | 94 | 94,138 |
| 1.80%, 10/1/24(6) | | 39 | 39,088 |
| Nordstrom, Inc.: | | | |
| 4.25%, 8/1/31(5) | | 76 | 77,061 |
| 5.00%, 1/15/44(5) | | 223 | 219,031 |
| | | | $ 1,745,881 |
| Consumer, Non-cyclical — 3.2% | |
| Ashtead Capital, Inc., 4.25%, 11/1/29(1) | $ | 304 | $ 334,017 |
| Block Financial, LLC, 3.875%, 8/15/30 | | 247 | 268,793 |
| Centene Corp., 4.625%, 12/15/29 | | 279 | 304,403 |
| Coca-Cola Femsa SAB de CV, 1.85%, 9/1/32 | | 220 | 208,588 |
| Conservation Fund (The), Green Bonds, 3.474%, 12/15/29 | | 190 | 200,760 |
| CVS Health Corp., 4.30%, 3/25/28 | | 136 | 155,260 |
| CVS Pass-Through Trust, 6.036%, 12/10/28 | | 176 | 205,967 |
| Ford Foundation (The), 2.415%, 6/1/50(5) | | 270 | 257,757 |
| Kaiser Foundation Hospitals, 3.15%, 5/1/27 | | 224 | 243,505 |
| Merck & Co., Inc., 2.45%, 6/24/50 | | 222 | 207,097 |
| Pfizer, Inc., 2.625%, 4/1/30 | | 160 | 169,046 |
| Royalty Pharma PLC, 3.35%, 9/2/51 | | 275 | 261,053 |
| Security | Principal
Amount
(000's omitted) | Value |
| Consumer, Non-cyclical (continued) | |
| Smithfield Foods, Inc., 2.625%, 9/13/31(1) | $ | 183 | $ 178,095 |
| | | | $ 2,994,341 |
| Energy — 0.8% | |
| TerraForm Power Operating, LLC, 4.75%, 1/15/30(1) | $ | 717 | $ 751,057 |
| | | | $ 751,057 |
| Financial — 19.0% | |
| AerCap Ireland Capital DAC/AerCap Global Aviation Trust, 6.50%, 7/15/25 | $ | 302 | $ 350,299 |
| Affiliated Managers Group, Inc., 3.30%, 6/15/30 | | 393 | 420,830 |
| Agree, L.P., 2.00%, 6/15/28 | | 94 | 93,281 |
| Air Lease Corp., 2.875%, 1/15/26 | | 349 | 364,839 |
| Andrew W. Mellon Foundation (The), 0.947%, 8/1/27 | | 300 | 295,088 |
| Aon Corp., 2.80%, 5/15/30 | | 209 | 218,514 |
| Australia & New Zealand Banking Group, Ltd., 2.95% to 7/22/25, 7/22/30(1)(7) | | 316 | 328,609 |
| Banco Santander S.A., 1.722% to 9/14/26, 9/14/27(7) | | 200 | 199,178 |
| Bank of America Corp.: | | | |
| 1.734% to 7/22/26, 7/22/27(7) | | 214 | 215,023 |
| 2.087% to 6/14/28, 6/14/29(7) | | 215 | 214,787 |
| 2.299% to 7/21/31, 7/21/32(7) | | 350 | 345,242 |
| 3.824% to 1/20/27, 1/20/28(7) | | 2,025 | 2,236,054 |
| BankUnited, Inc., 5.125%, 6/11/30 | | 118 | 136,457 |
| Boston Properties, L.P., 2.45%, 10/1/33 | | 483 | 470,426 |
| Brookfield Finance, Inc., 4.70%, 9/20/47 | | 385 | 466,981 |
| Capital One Financial Corp., 4.20%, 10/29/25 | | 300 | 332,656 |
| CI Financial Corp.: | | | |
| 3.20%, 12/17/30 | | 239 | 248,292 |
| 4.10%, 6/15/51 | | 122 | 131,394 |
| Citigroup, Inc.: | | | |
| 3.668% to 7/24/27, 7/24/28(7) | | 211 | 232,080 |
| 4.00% to 12/10/25(7)(8) | | 415 | 431,060 |
| 4.125%, 7/25/28 | | 270 | 301,614 |
| 4.65%, 7/23/48 | | 210 | 271,191 |
| 5.316% to 3/26/40, 3/26/41(7) | | 400 | 531,516 |
| Commonwealth Bank of Australia, 3.61% to 9/12/29, 9/12/34(1)(7) | | 288 | 305,604 |
| Discover Bank, 4.682% to 8/9/23, 8/9/28(7) | | 446 | 474,599 |
| Extra Space Storage, L.P., 2.55%, 6/1/31 | | 180 | 180,602 |
| HAT Holdings I, LLC/HAT Holdings II, LLC, 3.375%, 6/15/26(1) | | 254 | 258,128 |
| Iron Mountain, Inc., 4.50%, 2/15/31(1) | | 310 | 314,820 |
| JPMorgan Chase & Co.: | | | |
| 0.63%, (SOFR + 0.58%), 3/16/24(2) | | 127 | 127,489 |
| 1.47% to 9/22/26, 9/22/27(7) | | 328 | 326,035 |
8
See Notes to Financial Statements.
Calvert
Core Bond Fund
September 30, 2021
Schedule of Investments — continued
| Security | Principal
Amount
(000's omitted) | Value |
| Financial (continued) | |
| JPMorgan Chase & Co.: (continued) | | | |
| 2.522% to 4/22/30, 4/22/31(7) | $ | 450 | $ 459,352 |
| 2.739% to 10/15/29, 10/15/30(7) | | 219 | 226,911 |
| 2.956% to 5/13/30, 5/13/31(7) | | 225 | 234,211 |
| 4.493% to 3/24/30, 3/24/31(7) | | 300 | 350,231 |
| KKR Group Finance Co. VII, LLC, 3.625%, 2/25/50(1) | | 450 | 484,529 |
| Macquarie Bank, Ltd.: | | | |
| 3.052% to 3/3/31, 3/3/36(1)(7) | | 263 | 260,622 |
| 3.624%, 6/3/30(1) | | 334 | 350,857 |
| Nationwide Building Society, 4.125% to 10/18/27, 10/18/32(1)(7) | | 600 | 656,059 |
| PNC Financial Services Group, Inc. (The), 2.20%, 11/1/24 | | 757 | 793,458 |
| Principal Financial Group, Inc., 4.625%, 9/15/42 | | 296 | 370,135 |
| Radian Group, Inc., 4.875%, 3/15/27 | | 295 | 322,088 |
| Standard Chartered PLC: | | | |
| 1.214% to 3/23/24, 3/23/25(1)(7) | | 200 | 200,393 |
| 1.456% to 1/14/26, 1/14/27(1)(7) | | 243 | 239,361 |
| Stifel Financial Corp., 4.00%, 5/15/30 | | 235 | 262,208 |
| Synovus Bank/Columbus, GA, 4.00% to 10/29/25, 10/29/30(7) | | 373 | 390,939 |
| Truist Financial Corp.: | | | |
| 1.267% to 3/2/26, 3/2/27(7) | | 230 | 229,289 |
| 5.10% to 3/1/30(7)(8) | | 232 | 267,264 |
| UBS AG, 1.25%, 6/1/26(1) | | 236 | 234,923 |
| UBS Group AG, 2.095% to 2/11/31, 2/11/32(1)(7) | | 295 | 287,197 |
| Westpac Banking Corp., 2.668% to 11/15/30, 11/15/35(7) | | 265 | 259,672 |
| | | | $ 17,702,387 |
| Government - Multinational — 5.8% | |
| Asian Development Bank, 3.125%, 9/26/28 | $ | 291 | $ 326,888 |
| European Bank for Reconstruction & Development, 1.50%, 2/13/25 | | 305 | 313,421 |
| European Investment Bank: | | | |
| 1.625%, 5/13/31 | | 585 | 589,325 |
| 2.375%, 5/24/27 | | 860 | 919,276 |
| 2.875%, 6/13/25(1) | | 1,942 | 2,094,591 |
| Inter-American Development Bank, 0.875%, 4/3/25 | | 241 | 242,370 |
| International Bank for Reconstruction & Development, 3.125%, 11/20/25 | | 861 | 942,933 |
| | | | $ 5,428,804 |
| Government - Regional — 0.7% | |
| Kommuninvest I Sverige AB, 0.375%, 6/19/24(1) | $ | 600 | $ 597,636 |
| | | | $ 597,636 |
| Security | Principal
Amount
(000's omitted) | Value |
| Industrial — 3.2% | |
| AP Moller - Maersk A/S, 4.50%, 6/20/29(1) | $ | 285 | $ 330,866 |
| FedEx Corp., 4.55%, 4/1/46 | | 425 | 503,303 |
| Jabil, Inc., 3.60%, 1/15/30 | | 254 | 275,630 |
| nVent Finance S.a.r.l., 4.55%, 4/15/28 | | 825 | 906,136 |
| Owens Corning, 3.95%, 8/15/29 | | 525 | 586,679 |
| Valmont Industries, Inc., 5.00%, 10/1/44 | | 319 | 393,809 |
| | | | $ 2,996,423 |
| Technology — 1.9% | |
| Apple, Inc., 3.45%, 2/9/45 | $ | 350 | $ 388,091 |
| DXC Technology Co., 2.375%, 9/15/28 | | 192 | 189,841 |
| Microsoft Corp., 2.525%, 6/1/50 | | 266 | 256,406 |
| Oracle Corp., 4.125%, 5/15/45 | | 220 | 237,329 |
| Seagate HDD Cayman, 5.75%, 12/1/34(5) | | 316 | 370,115 |
| Western Digital Corp., 4.75%, 2/15/26 | | 248 | 274,975 |
| | | | $ 1,716,757 |
| Utilities — 5.3% | |
| AES Corp. (The), 2.45%, 1/15/31 | $ | 386 | $ 381,200 |
| American Water Capital Corp.: | | | |
| 2.30%, 6/1/31 | | 495 | 500,631 |
| 3.75%, 9/1/47 | | 475 | 533,240 |
| Avangrid, Inc., 3.80%, 6/1/29 | | 422 | 470,214 |
| Consolidated Edison Co. of New York, Inc.: | | | |
| 3.35%, 4/1/30 | | 257 | 281,516 |
| 4.00%, 11/15/57 | | 420 | 471,527 |
| Enel Finance International NV, 1.375%, 7/12/26(1) | | 201 | 199,952 |
| MidAmerican Energy Co., 4.25%, 7/15/49 | | 539 | 666,874 |
| NextEra Energy Capital Holdings, Inc., 1.90%, 6/15/28 | | 219 | 219,276 |
| NextEra Energy Operating Partners, L.P., 4.50%, 9/15/27(1) | | 620 | 667,731 |
| Northern States Power Co., 2.60%, 6/1/51 | | 317 | 301,037 |
| Terraform Global Operating, LLC, 6.125%, 3/1/26(1) | | 225 | 232,240 |
| | | | $ 4,925,438 |
Total Corporate Bonds
(identified cost $40,093,007) | | | $ 42,418,283 |
9
See Notes to Financial Statements.
Calvert
Core Bond Fund
September 30, 2021
Schedule of Investments — continued
| High Social Impact Investments — 0.3% |
| Security | Principal
Amount
(000's omitted) | Value |
| Calvert Impact Capital, Inc., Community Investment Notes, 1.50%, 12/15/23(9)(10) | $ | 250 | $ 245,707 |
Total High Social Impact Investments
(identified cost $250,000) | | | $ 245,707 |
| Security | Shares | Value |
| Wireless Telecommunication Services — 0.5% | |
| United States Cellular Corp., 5.50% | | 18,400 | $ 486,496 |
Total Preferred Stocks
(identified cost $460,000) | | | $ 486,496 |
| Sovereign Government Bonds — 0.7% |
| Security | Principal
Amount
(000's omitted) | Value |
| Kreditanstalt fuer Wiederaufbau, 1.75%, 9/14/29 | $ | 635 | $ 650,410 |
Total Sovereign Government Bonds
(identified cost $639,853) | | | $ 650,410 |
| Taxable Municipal Obligations — 4.7% |
| Security | Principal
Amount
(000's omitted) | Value |
| General Obligations — 1.6% | |
| Massachusetts, Green Bonds, 3.277%, 6/1/46 | $ | 1,300 | $ 1,439,087 |
| | | | $ 1,439,087 |
| Special Tax Revenue — 0.3% | |
| California Health Facilities Financing Authority, (No Place Like Home Program): | | | |
| 2.984%, 6/1/33 | $ | 155 | $ 165,096 |
| 3.034%, 6/1/34 | | 110 | 117,103 |
| | | | $ 282,199 |
| Water and Sewer — 2.8% | |
| District of Columbia Water & Sewer Authority, Green Bonds, 4.814%, 10/1/2114 | $ | 555 | $ 793,445 |
| San Diego County Water Authority, CA, Green Bonds, 1.951%, 5/1/34 | | 185 | 182,956 |
| Security | Principal
Amount
(000's omitted) | Value |
| Water and Sewer (continued) | |
| San Francisco City and County Public Utilities Commission, CA, Water Revenue, Green Bonds, 3.303%, 11/1/39 | $ | 1,530 | $ 1,636,365 |
| | | | $ 2,612,766 |
Total Taxable Municipal Obligations
(identified cost $3,929,258) | | | $ 4,334,052 |
| U.S. Government Agencies and Instrumentalities — 0.5% |
| Security | Principal
Amount
(000's omitted) | Value |
| U.S. Department of Housing and Urban Development: | | | |
| 3.435%, 8/1/34 | $ | 145 | $ 160,276 |
| 3.485%, 8/1/35 | | 85 | 95,604 |
| 3.585%, 8/1/37 | | 150 | 169,662 |
Total U.S. Government Agencies and Instrumentalities
(identified cost $415,370) | | | $ 425,542 |
| U.S. Government Agency Mortgage-Backed Securities — 16.2% |
| Security | Principal
Amount
(000's omitted) | Value |
| Federal Home Loan Mortgage Corp., 3.00%, 4/1/51 | $ | 344 | $ 360,736 |
| Federal National Mortgage Association: | | | |
| 2.00%, 30-Year, TBA(11) | | 1,064 | 1,066,893 |
| 2.50%, 30-Year, TBA(11) | | 5,577 | 5,751,499 |
| 3.00%, 30-Year, TBA(11) | | 6,400 | 6,698,744 |
| Pool #FM6803, 2.00%, 4/1/51 | | 206 | 208,987 |
| Pool #FM7023, 3.00%, 7/1/49 | | 259 | 270,877 |
| Government National Mortgage Association II: | | | |
| Pool #CB2653, 2.50%, 3/20/51 | | 286 | 297,449 |
| Pool #CB8629, 2.50%, 4/20/51 | | 384 | 400,267 |
Total U.S. Government Agency Mortgage-Backed Securities
(identified cost $15,097,305) | | $ 15,055,452 |
| U.S. Treasury Obligations — 32.7% |
| Security | Principal
Amount
(000's omitted) | Value |
| U.S. Treasury Bonds: | | | |
| 1.875%, 2/15/41 | $ | 780 | $ 763,242 |
| 2.00%, 2/15/50 | | 355 | 348,871 |
| 2.00%, 8/15/51 | | 150 | 147,375 |
| U.S. Treasury Inflation-Protected Note, 0.75%, 7/15/28(12) | | 444 | 508,310 |
10
See Notes to Financial Statements.
Calvert
Core Bond Fund
September 30, 2021
Schedule of Investments — continued
| Security | Principal
Amount
(000's omitted) | Value |
| U.S. Treasury Notes: | | | |
| 0.125%, 4/30/22 | $ | 3,000 | $ 3,001,025 |
| 0.125%, 11/30/22 | | 5,285 | 5,284,706 |
| 0.125%, 12/31/22 | | 5,037 | 5,036,710 |
| 0.125%, 1/31/23 | | 2,948 | 2,947,279 |
| 0.375%, 3/31/22 | | 3,000 | 3,004,762 |
| 0.375%, 11/30/25 | | 4,484 | 4,399,694 |
| 0.375%, 12/31/25 | | 2,440 | 2,391,391 |
| 0.75%, 8/31/26 | | 196 | 193,933 |
| 1.125%, 2/29/28 | | 1,068 | 1,061,533 |
| 1.25%, 3/31/28 | | 476 | 476,130 |
| 1.25%, 4/30/28 | | 531 | 530,751 |
| 1.25%, 6/30/28 | | 375 | 374,253 |
Total U.S. Treasury Obligations
(identified cost $30,600,723) | | | $ 30,469,965 |
| Short-Term Investments — 1.7% | | | |
| Affiliated Fund — 0.7% |
| Description | Units | Value |
| Calvert Cash Reserves Fund, LLC, 0.04%(13) | | 661,665 | $ 661,732 |
Total Affiliated Fund
(identified cost $661,666) | | | $ 661,732 |
| Securities Lending Collateral — 1.0% |
| Security | Shares | Value |
| State Street Navigator Securities Lending Government Money Market Portfolio, 0.03%(14) | | 941,908 | $ 941,908 |
Total Securities Lending Collateral
(identified cost $941,908) | | | $ 941,908 |
Total Short-Term Investments
(identified cost $1,603,574) | | | $ 1,603,640 |
Total Investments — 115.2%
(identified cost $104,483,167) | | | $107,195,497 |
| Other Assets, Less Liabilities — (15.2)% | | | $ (14,149,498) |
| Net Assets — 100.0% | | | $ 93,045,999 |
| The percentage shown for each investment category in the Schedule of Investments is based on net assets. |
| (1) | Security exempt from registration under Rule 144A of the Securities Act of 1933, as amended. These securities may be sold in certain transactions in reliance on an exemption from registration (normally to qualified institutional buyers). At September 30, 2021, the aggregate value of these securities is $20,322,715 or 21.8% of the Fund's net assets. |
| (2) | Variable rate security. The stated interest rate represents the rate in effect at September 30, 2021. |
| (3) | Weighted average fixed-rate coupon that changes/updates monthly. Rate shown is the rate at September 30, 2021. |
| (4) | Represents an investment in an issuer that may be deemed to be an affiliate effective March 1, 2021 (see Note 8). |
| (5) | All or a portion of this security was on loan at September 30, 2021. The aggregate market value of securities on loan at September 30, 2021 was $1,455,363. |
| (6) | When-issued security. |
| (7) | Security converts to variable rate after the indicated fixed-rate coupon period. |
| (8) | Perpetual security with no stated maturity date but may be subject to calls by the issuer. |
| (9) | May be deemed to be an affiliated company (see Note 8). |
| (10) | Restricted security. Total market value of restricted securities amounts to $245,707, which represents 0.3% of the net assets of the Fund as of September 30, 2021. |
| (11) | TBA (To Be Announced) securities are purchased on a forward commitment basis with an approximate principal amount and maturity date. The actual principal amount and maturity date are determined upon settlement. |
| (12) | Inflation-linked security whose principal is adjusted for inflation based on changes in the U.S. Consumer Price Index. Interest is calculated based on the inflation-adjusted principal. |
| (13) | Affiliated investment company, available to Calvert portfolios and funds, which invests in high quality, U.S. dollar denominated money market instruments. The rate shown is the annualized seven-day yield as of September 30, 2021. |
| (14) | Represents investment of cash collateral received in connection with securities lending. |
11
See Notes to Financial Statements.
Calvert
Core Bond Fund
September 30, 2021
Schedule of Investments — continued
Futures Contracts
| Description | Number of
Contracts | Position | Expiration
Date | Notional
Amount | Value/
Unrealized
Appreciation
(Depreciation) |
| Interest Rate Futures | | | | | |
| U.S. 2-Year Treasury Note | 26 | Long | 12/31/21 | $ 5,721,422 | $ (1,153) |
| U.S. 5-Year Treasury Note | (4) | Short | 12/31/21 | (490,969) | 2,868 |
| U.S. Long Treasury Bond | (6) | Short | 12/21/21 | (955,312) | 18,973 |
| U.S. Ultra 10-Year Treasury Note | (56) | Short | 12/21/21 | (8,134,000) | 121,142 |
| | | | | | $141,830 |
Restricted Securities
| Description | Acquisition Date | Cost |
| Calvert Impact Capital, Inc., Community Investment Notes, 1.50%, 12/15/23 | 12/14/20 | $250,000 |
| Abbreviations: |
| LIBOR | – London Interbank Offered Rate |
| SOFR | – Secured Overnight Financing Rate |
| TBA | – To Be Announced |
12
See Notes to Financial Statements.
Calvert
Core Bond Fund
September 30, 2021
Statement of Assets and Liabilities
| | September 30, 2021 |
| Assets | |
Investments in securities of unaffiliated issuers, at value (identified cost $103,380,353) - including
$1,455,363 of securities on loan | $ 106,096,997 |
| Investments in securities of affiliated issuers, at value (identified cost $1,102,814) | 1,098,500 |
| Deposits at broker for futures contracts | 249,241 |
| Receivable for capital shares sold | 63,426 |
| Interest receivable | 432,206 |
| Dividends and interest receivable - affiliated | 3,108 |
| Securities lending income receivable | 123 |
| Receivable from affiliate | 10,912 |
| Trustees' deferred compensation plan | 63,064 |
| Total assets | $108,017,577 |
| Liabilities | |
| Payable for variation margin on open futures contracts | $ 9,728 |
| Due to custodian | 4 |
| Payable for when-issued/forward commitment securities | 13,704,285 |
| Payable for capital shares redeemed | 135,554 |
| Distributions payable | 2,251 |
| Deposits for securities loaned | 941,908 |
| Payable to affiliates: | |
| Investment advisory fee | 23,533 |
| Administrative fee | 9,413 |
| Distribution and service fees | 10,374 |
| Sub-transfer agency fee | 3,400 |
| Trustees' deferred compensation plan | 63,064 |
| Accrued expenses | 68,064 |
| Total liabilities | $ 14,971,578 |
| Net Assets | $ 93,045,999 |
| Sources of Net Assets | |
| Paid-in capital | $ 86,232,063 |
| Distributable earnings | 6,813,936 |
| Total | $ 93,045,999 |
| Class A Shares | |
| Net Assets | $ 50,646,732 |
| Shares Outstanding | 2,599,129 |
Net Asset Value and Redemption Price Per Share
(net assets ÷ shares of beneficial interest outstanding) | $ 19.49 |
Maximum Offering Price Per Share
(100 ÷ 96.25 of net asset value per share) | $ 20.25 |
| Class I Shares | |
| Net Assets | $ 42,399,267 |
| Shares Outstanding | 2,173,041 |
Net Asset Value, Offering Price and Redemption Price Per Share
(net assets ÷ shares of beneficial interest outstanding) | $ 19.51 |
| On sales of $50,000 or more, the offering price of Class A shares is reduced. |
13
See Notes to Financial Statements.
Calvert
Core Bond Fund
September 30, 2021
| | Year Ended |
| | September 30, 2021 |
| Investment Income | |
| Dividend income | $ 47,700 |
| Dividend income - affiliated issuers | 6,979 |
| Interest income | 2,337,608 |
| Interest income - affiliated issuers | 3,198 |
| Securities lending income, net | 1,556 |
| Total investment income | $ 2,397,041 |
| Expenses | |
| Investment advisory fee | $ 343,798 |
| Administrative fee | 122,977 |
| Distribution and service fees: | |
| Class A | 131,476 |
| Trustees' fees and expenses | 5,551 |
| Custodian fees | 8,497 |
| Transfer agency fees and expenses | 123,704 |
| Accounting fees | 23,043 |
| Professional fees | 30,966 |
| Registration fees | 45,842 |
| Reports to shareholders | 13,761 |
| Miscellaneous | 18,728 |
| Total expenses | $ 868,343 |
| Waiver and/or reimbursement of expenses by affiliate | $ (169,547) |
| Net expenses | $ 698,796 |
| Net investment income | $ 1,698,245 |
| Realized and Unrealized Gain (Loss) | |
| Net realized gain (loss): | |
| Investment securities | $ 5,390,791 |
| Investment securities - affiliated issuers | (1,143) |
| Futures contracts | (632,869) |
| Net realized gain | $ 4,756,779 |
| Change in unrealized appreciation (depreciation): | |
| Investment securities | $ (4,728,467) |
| Investment securities - affiliated issuers | (4,296) |
| Futures contracts | 248,641 |
| Net change in unrealized appreciation (depreciation) | $(4,484,122) |
| Net realized and unrealized gain | $ 272,657 |
| Net increase in net assets from operations | $ 1,970,902 |
14
See Notes to Financial Statements.
Calvert
Core Bond Fund
September 30, 2021
Statements of Changes in Net Assets
| | Year Ended September 30, |
| | 2021 | 2020 |
| Increase (Decrease) in Net Assets | | |
| From operations: | | |
| Net investment income | $ 1,698,245 | $ 2,611,902 |
| Net realized gain | 4,756,779 | 4,250,273 |
| Net change in unrealized appreciation (depreciation) | (4,484,122) | 2,474,488 |
| Net increase in net assets from operations | $ 1,970,902 | $ 9,336,663 |
| Distributions to shareholders: | | |
| Class A | $ (2,248,977) | $ (1,324,353) |
| Class I | (2,354,165) | (1,302,557) |
| Total distributions to shareholders | $ (4,603,142) | $ (2,626,910) |
| Capital share transactions: | | |
| Class A | $ (1,041,947) | $ (2,325,222) |
| Class I | (10,254,139) | 17,578,964 |
| Net increase (decrease) in net assets from capital share transactions | $ (11,296,086) | $ 15,253,742 |
| Net increase (decrease) in net assets | $ (13,928,326) | $ 21,963,495 |
| Net Assets | | |
| At beginning of year | $106,974,325 | $ 85,010,830 |
| At end of year | $ 93,045,999 | $106,974,325 |
15
See Notes to Financial Statements.
Calvert
Core Bond Fund
September 30, 2021
| | Class A |
| | Year Ended September 30, |
| | 2021 | 2020 | 2019 | 2018 | 2017 |
| Net asset value — Beginning of year | $ 19.97 | $ 18.45 | $ 16.07 | $ 17.10 | $ 18.22 |
| Income (Loss) From Operations | | | | | |
| Net investment income(1) | $ 0.30 | $ 0.51 | $ 0.56 | $ 0.55 | $ 0.53 |
| Net realized and unrealized gain (loss) | 0.06 | 1.53 | 2.39 | (1.03) | (0.49) |
| Total income (loss) from operations | $ 0.36 | $ 2.04 | $ 2.95 | $ (0.48) | $ 0.04 |
| Less Distributions | | | | | |
| From net investment income | $ (0.30) | $ (0.52) | $ (0.57) | $ (0.55) | $ (0.53) |
| From net realized gain | (0.54) | — | — | — | (0.63) |
| Total distributions | $ (0.84) | $ (0.52) | $ (0.57) | $ (0.55) | $ (1.16) |
| Net asset value — End of year | $ 19.49 | $ 19.97 | $ 18.45 | $ 16.07 | $ 17.10 |
| Total Return(2) | 1.79% | 11.21% | 18.81% | (2.83)% | 0.63% |
| Ratios/Supplemental Data | | | | | |
| Net assets, end of year (000’s omitted) | $50,647 | $52,965 | $51,709 | $47,010 | $80,060 |
| Ratios (as a percentage of average daily net assets):(3) | | | | | |
| Total expenses | 0.97% | 1.05% | 1.14% | 1.13% | 1.12% |
| Net expenses | 0.80% | 0.92% | 0.92% | 0.92% | 1.02% |
| Net investment income | 1.52% | 2.70% | 3.33% | 3.31% | 3.14% |
| Portfolio Turnover | 195% (4) | 52% | 43% | 51% | 86% |
| (1) | Computed using average shares outstanding. |
| (2) | Returns are historical and are calculated by determining the percentage change in net asset value with all distributions reinvested and do not reflect the effect of sales charges, if any. |
| (3) | Total expenses do not reflect amounts reimbursed and/or waived by the adviser and certain of its affiliates, if applicable. Net expenses are net of all reductions and represent the net expenses paid by the Fund. |
| (4) | Includes the effect of To Be Announced (TBA) transactions. |
16
See Notes to Financial Statements.
Calvert
Core Bond Fund
September 30, 2021
Financial Highlights — continued
| | Class I |
| | Year Ended September 30, |
| | 2021 | 2020 | 2019 | 2018 | 2017 |
| Net asset value — Beginning of year | $ 20.00 | $ 18.47 | $ 16.08 | $ 17.11 | $ 18.22 |
| Income (Loss) From Operations | | | | | |
| Net investment income(1) | $ 0.36 | $ 0.56 | $ 0.60 | $ 0.62 | $ 0.61 |
| Net realized and unrealized gain (loss) | 0.04 | 1.54 | 2.41 | (1.05) | (0.48) |
| Total income (loss) from operations | $ 0.40 | $ 2.10 | $ 3.01 | $ (0.43) | $ 0.13 |
| Less Distributions | | | | | |
| From net investment income | $ (0.35) | $ (0.57) | $ (0.62) | $ (0.60) | $ (0.61) |
| From net realized gain | (0.54) | — | — | — | (0.63) |
| Total distributions | $ (0.89) | $ (0.57) | $ (0.62) | $ (0.60) | $ (1.24) |
| Net asset value — End of year | $ 19.51 | $ 20.00 | $ 18.47 | $ 16.08 | $ 17.11 |
| Total Return(2) | 1.99% | 11.53% | 19.14% | (2.57)% | 1.17% |
| Ratios/Supplemental Data | | | | | |
| Net assets, end of year (000’s omitted) | $42,399 | $54,009 | $33,302 | $19,212 | $13,124 |
| Ratios (as a percentage of average daily net assets):(3) | | | | | |
| Total expenses | 0.72% | 0.80% | 0.87% | 0.89% | 0.93% |
| Net expenses | 0.55% | 0.67% | 0.63% | 0.55% | 0.55% |
| Net investment income | 1.81% | 2.93% | 3.53% | 3.72% | 3.60% |
| Portfolio Turnover | 195% (4) | 52% | 43% | 51% | 86% |
| (1) | Computed using average shares outstanding. |
| (2) | Returns are historical and are calculated by determining the percentage change in net asset value with all distributions reinvested and do not reflect the effect of sales charges, if any. |
| (3) | Total expenses do not reflect amounts reimbursed and/or waived by the adviser and certain of its affiliates, if applicable. Net expenses are net of all reductions and represent the net expenses paid by the Fund. |
| (4) | Includes the effect of To Be Announced (TBA) transactions. |
17
See Notes to Financial Statements.
Calvert
Core Bond Fund
September 30, 2021
Notes to Financial Statements
1 Significant Accounting Policies
Calvert Core Bond Fund (formerly, Calvert Long-Term Income Fund) (the Fund) is a diversified series of The Calvert Fund (the Trust). The Trust is a Massachusetts business trust registered under the Investment Company Act of 1940, as amended (the 1940 Act), as an open-end management investment company. The investment objective of the Fund is to seek total return with an emphasis on income. Prior to February 1, 2021, the Fund's investment objective was to seek to maximize income, to the extent consistent with preservation of capital, through investments in longer-dated securities. The Fund invests primarily in investment grade, U.S. dollar denominated securities.
The Fund offers two classes of shares. Class A shares are generally sold subject to a sales charge imposed at time of purchase. A contingent deferred sales charge of 0.80% may apply to certain redemptions of Class A shares for accounts for which no sales charge was paid, if redeemed within 12 months of purchase. Class I shares are sold at net asset value, are not subject to a sales charge and are sold only to certain eligible investors. Each class represents a pro rata interest in the Fund, but votes separately on class-specific matters and is subject to different expenses.
The Fund applies the accounting and reporting guidance in the Financial Accounting Standards Board (FASB) Accounting Standards Codification Topic 946, Financial Services – Investment Companies (ASC 946). Subsequent events, if any, through the date that the financial statements were issued have been evaluated in the preparation of the financial statements.
A Investment Valuation— Net asset value per share is determined every business day as of the close of the regular session of the New York Stock Exchange (generally 4:00 p.m. Eastern time). The Fund uses independent pricing services approved by the Board of Trustees (the Board) to value its investments wherever possible. Investments for which market quotations are not available or deemed not reliable are fair valued in good faith under the direction of the Board.
U.S. generally accepted accounting principles (U.S. GAAP) establishes a disclosure hierarchy that categorizes the inputs to valuation techniques used to value assets and liabilities at measurement date. These inputs are summarized in the three broad levels listed below:
Level 1 - quoted prices in active markets for identical securities
Level 2 - other significant observable inputs (including quoted prices for similar securities, interest rates, prepayment speeds, credit risk, etc.)
Level 3 - significant unobservable inputs (including the Fund’s own assumptions in determining the fair value of investments)
The inputs or methodologies used for valuing securities are not necessarily an indication of the risk associated with investing in those securities.
Valuation techniques used to value the Fund’s investments by major category are as follows:
Equity Securities. Equity securities (including warrants and rights) listed on a U.S. securities exchange generally are valued at the last sale or closing price as reported by an independent pricing service on the primary market or exchange on which they are traded and are categorized as Level 1 in the hierarchy. Equity securities listed on the NASDAQ National Market System are valued at the NASDAQ official closing price and are categorized as Level 1 in the hierarchy. Unlisted or listed securities for which closing sales prices or closing quotations are not available are valued at the mean between the latest available bid and ask prices and are categorized as Level 2 in the hierarchy.
Debt Securities. Debt securities are generally valued based on valuations provided by third party pricing services, as derived from such services’ pricing models. Inputs to the models may include, but are not limited to, reported trades, executable bid and ask prices, broker/dealer quotations, prices or yields of securities with similar characteristics, interest rates, anticipated prepayments, benchmark curves or information pertaining to the issuer, as well as industry and economic events. Accordingly, debt securities are generally categorized as Level 2 in the hierarchy. Short-term debt securities with a remaining maturity at time of purchase of more than sixty days are valued based on valuations provided by a third party pricing service. Such securities are generally categorized as Level 2 in the hierarchy. Short-term debt securities of sufficient credit quality purchased with remaining maturities of sixty days or less for which a valuation from a third party pricing service is not readily available may be valued at amortized cost, which approximates fair value, and are categorized as Level 2 in the hierarchy.
Affiliated Fund. The Fund may invest in Calvert Cash Reserves Fund, LLC (Cash Reserves Fund), an affiliated investment company managed by Calvert Research and Management (CRM). While Cash Reserves Fund is not a registered money market mutual fund, it conducts all of its investment activities in accordance with the requirements of Rule 2a-7 under the 1940 Act. Investments in Cash Reserves Fund are valued at the closing net asset value per unit on the valuation day and are categorized as Level 2 in the hierarchy. Cash Reserves Fund generally values its investment securities based on available market quotations provided by a third party pricing service.
Other Securities. Investments in registered investment companies (including money market funds) that do not trade on an exchange are valued at the net asset value per share on the valuation day and are categorized as Level 1 in the hierarchy.
Derivatives. Futures contracts are valued at unrealized appreciation (depreciation) based on the settlement price established each day by the board of trade or exchange on which they are traded and are categorized as Level 1 in the hierarchy.
Calvert
Core Bond Fund
September 30, 2021
Notes to Financial Statements — continued
Fair Valuation. If a market value cannot be determined for a security using the methodologies described above, or if, in the good faith opinion of the Fund's adviser, the market value does not constitute a readily available market quotation, or if a significant event has occurred that would materially affect the value of the security, the security will be fair valued as determined in good faith by or at the direction of the Board in a manner that most fairly reflects the security’s “fair value”, which is the amount that the Fund might reasonably expect to receive for the security upon its current sale in the ordinary course. Each such determination is based on a consideration of relevant factors, which are likely to vary from one pricing context to another. These factors may include, but are not limited to, the type of security, the existence of any contractual restrictions on the security’s disposition, the price and extent of public trading in similar securities of the issuer or of comparable companies or entities, quotations or relevant information obtained from broker/dealers or other market participants, information obtained from the issuer, analysts, and/or the appropriate stock exchange (for exchange-traded securities), an analysis of the company’s or entity’s financial statements, and an evaluation of the forces that influence the issuer and the market(s) in which the security is purchased and sold.
The values assigned to fair value investments are based on available information and do not necessarily represent amounts that might ultimately be realized. Further, due to the inherent uncertainty of valuations of such investments, the fair values may differ significantly from the values that would have been used had an active market existed, and the differences could be material.
The following table summarizes the market value of the Fund's holdings as of September 30, 2021, based on the inputs used to value them:
| Asset Description | Level 1 | Level 2 | Level 3 | Total |
| Asset-Backed Securities | $ — | $ 6,928,283 | $ — | $ 6,928,283 |
| Collateralized Mortgage Obligations | — | 887,870 | — | 887,870 |
| Commercial Mortgage-Backed Securities | — | 3,689,797 | — | 3,689,797 |
| Corporate Bonds | — | 42,418,283 | — | 42,418,283 |
| High Social Impact Investments | — | 245,707 | — | 245,707 |
| Preferred Stocks | 486,496 | — | — | 486,496 |
| Sovereign Government Bonds | — | 650,410 | — | 650,410 |
| Taxable Municipal Obligations | — | 4,334,052 | — | 4,334,052 |
| U.S. Government Agencies and Instrumentalities | — | 425,542 | — | 425,542 |
| U.S. Government Agency Mortgage-Backed Securities | — | 15,055,452 | — | 15,055,452 |
| U.S. Treasury Obligations | — | 30,469,965 | — | 30,469,965 |
| Short-Term Investments: | | | | |
| Affiliated Fund | — | 661,732 | — | 661,732 |
| Securities Lending Collateral | 941,908 | — | — | 941,908 |
| Total Investments | $1,428,404 | $105,767,093 | $ — | $107,195,497 |
| Futures Contracts | $ 142,983 | $ — | $ — | $ 142,983 |
| Total | $1,571,387 | $105,767,093 | $ — | $107,338,480 |
| Liability Description | | | | |
| Futures Contracts | $ (1,153) | $ — | $ — | $ (1,153) |
| Total | $ (1,153) | $ — | $ — | $ (1,153) |
B Investment Transactions and Income— Investment transactions for financial statement purposes are accounted for on trade date. Realized gains and losses are recorded on an identified cost basis and may include proceeds from litigation. Dividend income is recorded on the ex-dividend date for dividends received in cash and/or securities. Non-cash dividends are recorded at the fair value of the securities received. Distributions received that represent a return of capital are recorded as a reduction of cost of investments. Distributions received that represent a capital gain are recorded as a realized gain. Interest income, which includes amortization of premium and accretion of discount on debt securities, is accrued as earned. Inflation adjustments to the principal amount of inflation-adjusted bonds and notes are reflected as interest income. Deflation adjustments to the principal amount of an inflation-adjusted bond or note are reflected as reductions to interest income to the extent of interest income previously recorded on such bond or note.
C Share Class Accounting— Realized and unrealized gains and losses are allocated daily to each class of shares based upon the relative net assets of each class to the total net assets of the Fund. Net investment income, other than class-specific expenses, is allocated daily to each class of shares based upon the ratio of the value of each class's paid shares to the total value of all paid shares. Expenses arising in connection with a specific class are charged directly to that class.
Calvert
Core Bond Fund
September 30, 2021
Notes to Financial Statements — continued
D Futures Contracts— The Fund may enter into futures contracts to buy or sell a financial instrument for a set price at a future date. Initial margin deposits of either cash or securities as required by the broker are made upon entering into the contract. While the contract is open, daily variation margin payments are made to or received from the broker reflecting the daily change in market value of the contract and are recorded for financial reporting purposes as unrealized gains or losses by the Fund. When a futures contract is closed, a realized gain or loss is recorded equal to the difference between the opening and closing value of the contract. The risks associated with entering into futures contracts may include the possible illiquidity of the secondary market which would limit the Fund’s ability to close out a futures contract prior to the settlement date, an imperfect correlation between the value of the contracts and the underlying financial instruments, or that the counterparty will fail to perform its obligations under the contracts’ terms. Futures contracts are designed by boards of trade, which are designated “contracts markets” by the Commodities Futures Trading Commission. Futures contracts trade on the contracts markets in a manner that is similar to the way a stock trades on a stock exchange, and the boards of trade, through their clearing corporations, guarantee the futures contracts against default. As a result, there is minimal counterparty credit risk to the Fund.
E Restricted Securities— The Fund may invest in securities that are subject to legal or contractual restrictions on resale. Generally, these securities may only be sold publicly upon registration under the Securities Act of 1933 or in transactions exempt from such registration. Information regarding restricted securities (excluding Rule 144A securities) is included at the end of the Schedule of Investments.
F Distributions to Shareholders— Distributions to shareholders are recorded by the Fund on ex-dividend date. The Fund declares income distributions daily to shareholders of record at the time of declaration and generally pays them monthly. The Fund makes distributions of net realized capital gains, if any, at least annually. Distributions are declared separately for each class of shares. Distributions are determined in accordance with income tax regulations, which may differ from U.S. GAAP; accordingly, periodic reclassifications are made within the Fund’s capital accounts to reflect income and gains available for distribution under income tax regulations.
G Estimates— The preparation of financial statements in conformity with U.S. GAAP requires management to make estimates and assumptions that affect the reported amounts of assets and liabilities and disclosure of contingent assets and liabilities at the date of the financial statements and the reported amounts of increases and decreases in net assets from operations during the reporting period. Actual results could differ from those estimates.
H Indemnifications— Under the Trust’s organizational document, its officers and Trustees may be indemnified against certain liabilities and expenses arising out of the performance of their duties to the Fund. Under Massachusetts law, if certain conditions prevail, shareholders of a Massachusetts business trust (such as the Trust) could be deemed to have personal liability for the obligations of the Trust. However, the Trust’s Declaration of Trust contains an express disclaimer of liability on the part of Fund shareholders and provides that the Trust shall assume, upon request by the shareholder, the defense on behalf of any Fund shareholders or former shareholders. Additionally, in the normal course of business, the Fund enters into agreements with service providers that may contain indemnification clauses. The Fund’s maximum exposure under these arrangements is unknown as this would involve future claims that may be made against the Fund that have not yet occurred.
I Federal Income Taxes— No provision for federal income or excise tax is required since the Fund intends to continue to qualify as a regulated investment company under the Internal Revenue Code and to distribute substantially all of its taxable earnings.
Management has analyzed the Fund's tax positions taken for all open federal income tax years and has concluded that no provision for federal income tax is required in the Fund's financial statements. A Fund's federal tax return is subject to examination by the Internal Revenue Service for a period of three years from the date of filing.
J When-Issued Securities and Delayed Delivery Transactions— The Fund may purchase securities on a delayed delivery, when-issued or forward commitment basis, including TBA (To Be Announced) securities. Payment and delivery may take place after the customary settlement period for that security. At the time the transaction is negotiated, the price of the security that will be delivered is fixed. The Fund maintains cash and/or security positions for these commitments such that sufficient liquid assets will be available to make payments upon settlement. Securities purchased on a delayed delivery, when-issued or forward commitment basis are marked-to-market daily and begin earning interest on settlement date. Such security purchases are subject to the risk that when delivered they will be worth less than the agreed upon payment price. Losses may also arise if the counterparty does not perform under the contract. A forward purchase commitment may be closed by entering into an offsetting commitment. The Fund will realize a gain or loss on investments based on the price established when the Fund entered into the commitment.
2 Related Party Transactions
The investment advisory fee is earned by CRM as compensation for investment advisory services rendered to the Fund. On March 1, 2021, Morgan Stanley acquired Eaton Vance Corp. (the “Transaction”) and CRM became an indirect, wholly-owned subsidiary of Morgan Stanley. In connection with the Transaction, the Fund entered into a new investment advisory agreement (the “New Agreement”) with CRM, which took effect on March 1, 2021. Pursuant to the New Agreement (and the investment advisory agreement and amended Schedule A thereof in effect from February 1, 2021 to March 1, 2021), CRM receives a fee, payable monthly, at the annual rate of 0.30% of the Fund’s average daily net assets. Prior to February 1, 2021, CRM received a fee, payable monthly, at the annual rate of 0.40% of the Fund’s average daily net assets. For the year ended September 30, 2021, the investment advisory fee amounted to $343,798 or 0.34% of the Fund's average daily net assets. The Fund may invest its cash in Cash Reserves Fund. CRM does not currently receive a fee for advisory services provided to Cash Reserves Fund.
Calvert
Core Bond Fund
September 30, 2021
Notes to Financial Statements — continued
CRM has agreed to reimburse the Fund’s operating expenses to the extent that total annual operating expenses (relating to ordinary operating expenses only and excluding expenses such as brokerage commissions, acquired fund fees and expenses of unaffiliated funds, borrowing costs, taxes or litigation expenses) exceed 0.74% and 0.49% (0.92% and 0.67% prior to February 1, 2021) for Class A and Class I, respectively, of such class's average daily net assets. The expense reimbursement agreement with CRM may be changed or terminated after January 31, 2022. For the year ended September 30, 2021, CRM waived or reimbursed expenses of $169,547.
The administrative fee is earned by CRM as compensation for administrative services rendered to the Fund. The fee is computed at an annual rate of 0.12% of the Fund’s average daily net assets attributable to Class A and Class I and is payable monthly. For the year ended September 30, 2021, CRM was paid administrative fees of $122,977.
The Fund has in effect a distribution plan for Class A shares (Class A Plan) pursuant to Rule 12b-1 under the 1940 Act. Pursuant to the Class A Plan, the Fund pays Eaton Vance Distributors, Inc. (EVD), an affiliate of CRM and the Fund’s principal underwriter, a distribution and service fee of 0.25% per annum of its average daily net assets attributable to Class A shares for distribution services and facilities provided to the Fund by EVD, as well as for personal services and/or the maintenance of shareholder accounts. Distribution and service fees paid or accrued for the year ended September 30, 2021 amounted to $131,476 for Class A shares.
The Fund was informed that EVD received $8,028 as its portion of the sales charge on sales of Class A shares and less than $100 of contingent deferred sales charges paid by Fund shareholders for the year ended September 30, 2021.
Eaton Vance Management (EVM), an affiliate of CRM, provides sub-transfer agency and related services to the Fund pursuant to a Sub-Transfer Agency Support Services Agreement. For the year ended September 30, 2021, sub-transfer agency fees and expenses incurred to EVM amounted to $18,066 and are included in transfer agency fees and expenses on the Statement of Operations.
Each Trustee of the Fund who is not an employee of CRM or its affiliates receives an annual fee of $154,000, plus an annual Committee fee ranging from $8,500 to $16,500 depending on the Committee. The Board chair receives an additional $30,000 ($20,000 prior to January 1, 2021) annual fee and Committee chairs receive an additional $6,000 annual fee. Eligible Trustees may participate in a Deferred Compensation Plan (the Plan). Amounts deferred under the Plan are treated as though equal dollar amounts had been invested in shares of the Fund or other Calvert funds selected by the Trustees. The Fund purchases shares of the funds selected equal to the dollar amounts deferred under the Plan, resulting in an asset equal to the deferred compensation liability. Obligations of the Plan are paid solely from the Fund's assets. Trustees’ fees are allocated to each of the Calvert funds served. Salaries and fees of officers and Trustees of the Fund who are employees of CRM or its affiliates are paid by CRM. Prior to December 31, 2020, an Advisory Council aided the Board and CRM in advancing the cause of responsible investing through original scholarship and thought leadership. The Advisory Council consisted of CRM’s Chief Executive Officer and three additional members. For the year ended December 31, 2020, each member (other than CRM’s Chief Executive Officer) was compensated $20,000 for their service on the Advisory Council. Such compensation, and any other compensation and/or expenses incurred by the Advisory Council as may be approved by the Board, was borne by the Calvert funds. For the year ended September 30, 2021, the Fund’s allocated portion of the Advisory Council compensation and fees was $114, which is included in miscellaneous expense on the Statement of Operations.
3 Investment Activity
During the year ended September 30, 2021, the cost of purchases and proceeds from sales of investments, other than U.S. government and agency securities and short-term securities and including paydowns, were $31,663,814 and $71,912,814, respectively. Purchases and sales of U.S. government and agency securities, including paydowns and TBA transactions, were $167,475,242 and $133,946,753, respectively.
4 Distributions to Shareholders and Income Tax Information
The tax character of distributions declared for the years ended September 30, 2021 and September 30, 2020 was as follows:
| | Year Ended September 30, |
| | 2021 | 2020 |
| Ordinary income | $2,798,169 | $2,626,910 |
| Long-term capital gains | $1,804,973 | $ — |
During the year ended September 30, 2021, distributable earnings was decreased by $949,452 and paid-in capital was increased by $949,452 due to the Fund's use of equalization accounting. Tax equalization accounting allows the Fund to treat as a distribution that portion of redemption proceeds representing a redeeming shareholder’s portion of undistributed taxable income and net capital gains. These reclassifications had no effect on the net assets or net asset value per share of the Fund.
As of September 30, 2021, the components of distributable earnings (accumulated loss) on a tax basis were as follows:
Calvert
Core Bond Fund
September 30, 2021
Notes to Financial Statements — continued
| Undistributed ordinary income | $ 426,821 |
| Undistributed long-term capital gains | 3,720,266 |
| Net unrealized appreciation | 2,669,100 |
| Distributions payable | (2,251) |
| Distributable earnings | $6,813,936 |
The cost and unrealized appreciation (depreciation) of investments, including open derivative contracts, of the Fund at September 30, 2021, as determined on a federal income tax basis, were as follows:
| Aggregate cost | $104,526,397 |
| Gross unrealized appreciation | $ 3,145,836 |
| Gross unrealized depreciation | (476,736) |
| Net unrealized appreciation | $ 2,669,100 |
5 Financial Instruments
A summary of futures contracts outstanding at September 30, 2021 is included in the Schedule of Investments.
During the year ended September 30, 2021, the Fund used futures contracts to hedge interest rate risk and to manage duration.
At September 30, 2021, the fair value of open derivative instruments (not considered to be hedging instruments for accounting disclosure purposes) and whose primary underlying risk exposure is interest rate risk was as follows:
| Derivative | Statement of Assets and Liabilities Caption | Assets | Liabilities |
| Futures contracts | Distributable earnings | | $142,983 (1) | $(1,153) (1) |
| (1) | Only the current day's variation margin is reported within the Statement of Assets and Liabilities as Receivable or Payable for variation margin on open futures contracts, as applicable. |
The effect of derivative instruments (not considered to be hedging instruments for accounting disclosure purposes) on the Statement of Operations and whose primary underlying risk exposure is interest rate risk for the year ended September 30, 2021 was as follows:
| | Statement of Operations Caption | |
| Derivative | Net realized gain (loss): Futures
contracts | Change in unrealized appreciation
(depreciation): Futures contracts |
| Futures contracts | $ (632,869) | $ 248,641 |
The average notional cost of futures contracts (long) and futures contracts (short) outstanding during the year ended September 30, 2021 was approximately $7,075,000 and $11,687,000, respectively.
Calvert
Core Bond Fund
September 30, 2021
Notes to Financial Statements — continued
6 Securities Lending
To generate additional income, the Fund may lend its securities pursuant to a securities lending agency agreement with State Street Bank and Trust Company (SSBT), the securities lending agent. Security loans are subject to termination by the Fund at any time and, therefore, are not considered illiquid investments. The Fund requires that the loan be continuously collateralized by either cash or securities in an amount at least equal to the market value of the securities on loan. The market value of securities loaned is determined daily and any additional required collateral is delivered to the Fund on the next business day. Cash collateral is generally invested in a money market fund registered under the 1940 Act that is managed by an affiliate of SSBT. Any gain or loss in the market price of the loaned securities that might occur and any interest earned or dividends declared during the term of the loan would accrue to the account of the Fund. Income earned on the investment of collateral, net of broker rebates and other expenses incurred by the securities lending agent, is split between the Fund and the securities lending agent based on agreed upon contractual terms. Non-cash collateral, if any, is held by the lending agent on behalf of the Fund and cannot be sold or re-pledged by the Fund; accordingly, such collateral is not reflected in the Statement of Assets and Liabilities.
The risks associated with lending portfolio securities include, but are not limited to, possible delays in receiving additional collateral or in the recovery of the loaned securities, possible loss of rights to the collateral should the borrower fail financially, as well as risk of loss in the value of the collateral or the value of the investments made with the collateral. The securities lending agent shall indemnify the Fund in the case of default of any securities borrower.
At September 30, 2021, the total value of securities on loan, including accrued interest, was $1,468,268 and the total value of collateral received was $1,499,672, comprised of cash of $941,908 and U.S. government and/or agencies securities of $557,764.
The following table provides a breakdown of securities lending transactions accounted for as secured borrowings, the obligations by class of collateral pledged, and the remaining contractual maturity of those transactions as of September 30, 2021.
| | Remaining Contractual Maturity of the Transactions |
| | Overnight and
Continuous | <30 days | 30 to 90 days | >90 days | Total |
| Corporate Bonds | $941,908 | $ — | $ — | $ — | $941,908 |
The carrying amount of the liability for deposits for securities loaned at September 30, 2021 approximated its fair value. If measured at fair value, such liability would have been considered as Level 2 in the fair value hierarchy (see Note 1A) at September 30, 2021.
7 Line of Credit
The Fund participates with other portfolios and funds managed by EVM and its affiliates, including CRM, in an $800 million unsecured line of credit with a group of banks, which is in effect through October 26, 2021. Borrowings are made by the Fund solely for temporary purposes related to redemptions and other short-term cash needs. Interest is charged to the Fund based on its borrowings at an amount above either the Eurodollar rate or Federal Funds rate. In addition, a fee computed at an annual rate of 0.15% on the daily unused portion of the line of credit is allocated among the participating portfolios and funds at the end of each quarter. In connection with the renewal of the agreement in October 2020, an upfront fee and arrangement fee totaling $950,000 was incurred that was allocated to the participating portfolios and funds. Because the line of credit is not available exclusively to the Fund, it may be unable to borrow some or all of its requested amounts at any particular time.
The Fund had no borrowings outstanding pursuant to its line of credit at September 30, 2021. The Fund did not have any significant borrowings or allocated fees during the year ended September 30, 2021. Effective October 26, 2021, the Fund renewed its line of credit agreement, which expires October 25, 2022, at substantially the same terms.
8 Affiliated Issuers and Funds
The Fund has invested a portion of its assets in notes (the Notes) issued by Calvert Impact Capital, Inc. (CIC) pursuant to exemptive relief granted by the U.S. Securities and Exchange Commission (the SEC). There are certain potential points of affiliation between the Fund and CIC. CRM has licensed use of the Calvert name to CIC and provides other types of support. CRM’s President and Chief Executive Officer (and the only director/trustee on the Fund Board that is an “interested person” of the Fund) serves on the CIC Board. In addition, another director/trustee on the Fund Board serves as a director emeritus on the CIC Board.
Calvert
Core Bond Fund
September 30, 2021
Notes to Financial Statements — continued
In addition to the Notes, the Fund invested in issuers that may be deemed to be affiliated with Morgan Stanley. At September 30, 2021, the value of the Fund's investment in the Notes and affiliated issuers and funds was $1,098,500, which represents 1.2% of the Fund's net assets. Transactions in the Notes and affiliated issuers and funds by the Fund for the year ended September 30, 2021 were as follows:
| Name | Value,
beginning
of period | Purchases | Sales
proceeds | Net
realized
gain
(loss) | Change in
unrealized
appreciation
(depreciation) | Value,
end of
period | Interest/
Dividend
income | Principal
amount/Units,
end of period |
| Commercial Mortgage-Backed Securities | | | | | | |
| Morgan Stanley Capital I Trust, Series 2017-CLS, Class A, 0.784%, (1 mo. USD LIBOR + 0.70%), 11/15/34(1) | $ — | $ 191,148 | $ — | $ — | $ (87) | $ 191,061 | $ 219 | $191,000 |
| High Social Impact Investments | | | | | | |
| Calvert Impact Capital, Inc., Community Investment Notes, 1.50%, 12/15/23(2) | — | 250,000 | — | — | (4,293) | 245,707 | 2,979 | 250,000 |
| Short-Term Investments | | | | | | |
| Calvert Cash Reserves Fund, LLC | 257,967 | 68,186,195 | (67,781,371) | (1,143) | 84 | 661,732 | 6,979 | 661,665 |
| Totals | | | | $(1,143) | $ (4,296) | $1,098,500 | $10,177 | |
| (1) | May be deemed to be an affiliated issuer as of March 1, 2021 (see Note 2). |
| (2) | Restricted security. |
9 Capital Shares
The Fund’s Declaration of Trust permits the Trustees to issue an unlimited number of full and fractional shares of beneficial interest (without par value). Such shares may be issued in a number of different series (such as the Fund) and classes.
Transactions in capital shares for the years ended September 30, 2021 and September 30, 2020 were as follows:
| | Year Ended
September 30, 2021 | | Year Ended
September 30, 2020 |
| | Shares | Amount | | Shares | Amount |
| Class A | | | | | |
| Shares sold | 709,747 | $ 13,929,352 | | 817,701 | $ 15,748,610 |
| Reinvestment of distributions | 107,095 | 2,120,595 | | 64,699 | 1,240,602 |
| Shares redeemed | (869,726) | (17,091,894) | | (1,033,015) | (19,314,434) |
| Net decrease | (52,884) | $ (1,041,947) | | (150,615) | $ (2,325,222) |
| Class I | | | | | |
| Shares sold | 1,263,678 | $ 24,786,148 | | 1,858,784 | $ 35,557,397 |
| Reinvestment of distributions | 118,720 | 2,353,751 | | 67,645 | 1,302,325 |
| Shares redeemed | (1,910,344) | (37,394,038) | | (1,028,243) | (19,280,758) |
| Net increase (decrease) | (527,946) | $(10,254,139) | | 898,186 | $ 17,578,964 |
10 Risks and Uncertainties
Pandemic Risk
An outbreak of respiratory disease caused by a novel coronavirus was first detected in China in late 2019 and subsequently spread internationally. This coronavirus has resulted in closing borders, enhanced health screenings, changes to healthcare service preparation and delivery, quarantines, cancellations, disruptions to supply chains and customer activity, as well as general concern and uncertainty. Health crises caused by outbreaks, such as the coronavirus outbreak, may exacerbate other pre-existing political, social and economic risks and disrupt normal market conditions and operations. The impact of this outbreak has negatively affected the worldwide economy, the economies of individual countries, individual companies, and the market in general, and may continue to do so in significant and unforeseen ways, as may other epidemics and pandemics that may arise in the future. Any such impact could adversely affect the Fund's performance, or the performance of the securities in which the Fund invests.
Calvert
Core Bond Fund
September 30, 2021
Notes to Financial Statements — continued
11 Name Change
Effective February 1, 2021, the name of Calvert Core Bond Fund was changed from Calvert Long-Term Income Fund and its investment objective was changed as described in Note 1.
12 Change in Independent Registered Public Accounting Firm
On July 30, 2021, KPMG LLP (“KPMG”) informed the Audit Committee and Board of the Trust that it was resigning as the independent registered public accounting firm to the Trust, as upon Morgan Stanley’s acquisition of Eaton Vance Corp., the parent company of CRM (the investment adviser to each series of the Trust), KPMG would no longer be independent of the Trust. The Audit Committee of the Board and the Board approved the selection of Deloitte & Touche LLP (“Deloitte”) as the independent registered public accounting firm for the funds that are series of the Trust (the “Funds”) for the fiscal year ending September 30, 2021 to be effective upon KPMG’s resignation and Deloitte’s acceptance of the engagement which became effective July 30, 2021.
KPMG’s reports on the financial statements for the Funds for the fiscal periods ended September 30, 2019 and September 30, 2020 contained no adverse opinion or disclaimer of opinion nor were they qualified or modified as to uncertainty, audit scope or accounting principles. During the fiscal periods ended September 30, 2019 and September 30, 2020, and during the subsequent interim period through July 30, 2021: (i) there were no disagreements with KPMG on any matter of accounting principles or practices, financial statement disclosure or auditing scope or procedure, which disagreements, if not resolved to the satisfaction of KPMG, would have caused KPMG to make reference to the subject matter of the disagreements in connection with its reports on the Funds’ financial statements for such periods; and (ii) there were no “reportable events” of the kind described in Item 304(a)(1)(v) of Regulation S-K under the Securities Exchange Act of 1934, as amended.
During the fiscal periods ended September 30, 2019 and September 30, 2020, and during the subsequent interim period through July 30, 2021: neither the Funds, nor anyone on their behalf, consulted with Deloitte on items which: (i) concerned the application of accounting principles to a specified transaction, either completed or proposed, or the type of audit opinion that might be rendered on the Funds’ financial statements; or (ii) concerned the subject of a disagreement (as defined in paragraph (a)(1)(iv) of Item 304 of Regulation S-K) or reportable events (as described in paragraph (a)(1)(v) of Item 304).
Calvert
Core Bond Fund
September 30, 2021
Report of Independent Registered Public Accounting Firm
To the Board of Trustees of The Calvert Fund and Shareholders of Calvert Core Bond Fund:
Opinion on the Financial Statements and Financial Highlights
We have audited the accompanying statement of assets and liabilities of Calvert Core Bond Fund (formerly, Calvert Long-Term Income Fund) (the "Fund") (one of the funds constituting The Calvert Fund), including the schedule of investments, as of September 30, 2021, the related statements of operations, changes in net assets and the financial highlights for the year then ended, and the related notes. In our opinion, the financial statements and financial highlights present fairly, in all material respects, the financial position of the Fund as of September 30, 2021, and the results of its operations and changes in its net assets for the year then ended, and the financial highlights for the year then ended in conformity with accounting principles generally accepted in the United States of America. The statement of changes in net assets for the year ended September 30, 2020, and the financial highlights for the years ended September 30, 2020, 2019, 2018, and 2017 were audited by other auditors whose report, dated November 20, 2020, expressed an unqualified opinion on that financial statement and those financial highlights.
Basis for Opinion
These financial statements and financial highlights are the responsibility of the Fund's management. Our responsibility is to express an opinion on the Fund's financial statements and financial highlights based on our audit. We are a public accounting firm registered with the Public Company Accounting Oversight Board (United States) (PCAOB) and are required to be independent with respect to the Fund in accordance with the U.S. federal securities laws and the applicable rules and regulations of the Securities and Exchange Commission and the PCAOB.
We conducted our audit in accordance with the standards of the PCAOB. Those standards require that we plan and perform the audit to obtain reasonable assurance about whether the financial statements and financial highlights are free of material misstatement, whether due to error or fraud. The Fund is not required to have, nor were we engaged to perform, an audit of its internal control over financial reporting. As part of our audit we are required to obtain an understanding of internal control over financial reporting but not for the purpose of expressing an opinion on the effectiveness of the Fund’s internal control over financial reporting. Accordingly, we express no such opinion.
Our audit included performing procedures to assess the risks of material misstatement of the financial statements and financial highlights, whether due to error or fraud, and performing procedures that respond to those risks. Such procedures included examining, on a test basis, evidence regarding the amounts and disclosures in the financial statements and financial highlights. Our audit also included evaluating the accounting principles used and significant estimates made by management, as well as evaluating the overall presentation of the financial statements and financial highlights. Our procedures included confirmation of securities owned as of September 30, 2021, by correspondence with the custodian and brokers; when replies were not received from brokers, we performed other auditing procedures. We believe that our audit provides a reasonable basis for our opinion.
/s/ Deloitte & Touche LLP
Boston, Massachusetts
November 22, 2021
We have served as the auditor of one or more Calvert investment companies since 2021.
Calvert
Core Bond Fund
September 30, 2021
Federal Tax Information (Unaudited)
The Form 1099-DIV you receive in February 2022 will show the tax status of all distributions paid to your account in calendar year 2021. Shareholders are advised to consult their own tax adviser with respect to the tax consequences of their investment in the Fund. As required by the Internal Revenue Code and/or regulations, shareholders must be notified regarding the status of 163(j) interest dividends and capital gains dividends.
163(j) Interest Dividends. For the fiscal year ended September 30, 2021, the Fund designates 60.61% of distributions from net investment income as a 163(j) interest dividend.
Capital Gains Dividends. The Fund hereby designates as a capital gain dividend with respect to the taxable year ended September 30, 2021, $4,579,491 or, if subsequently determined to be different, the net capital gain of such year.
Calvert
Core Bond Fund
September 30, 2021
Liquidity Risk Management Program
The Fund has implemented a written liquidity risk management program (Program) and related procedures to manage its liquidity in accordance with Rule 22e-4 under the Investment Company Act of 1940, as amended (Liquidity Rule). The Liquidity Rule defines “liquidity risk” as the risk that a fund could not meet requests to redeem shares issued by the fund without significant dilution of the remaining investors’ interests in the fund. The Fund’s Board of Trustees/Directors has designated the investment adviser to serve as the administrator of the Program and the related procedures. The administrator has established a Liquidity Risk Management Oversight Committee (Committee) to perform the functions necessary to administer the Program. As part of the Program, the administrator is responsible for identifying illiquid investments and categorizing the relative liquidity of the Fund’s investments in accordance with the Liquidity Rule. Under the Program, the administrator assesses, manages, and periodically reviews the Fund’s liquidity risk, and is responsible for making certain reports to the Fund’s Board of Trustees/Directors and the Securities and Exchange Commission (SEC) regarding the liquidity of the Fund’s investments, and to notify the Board of Trustees/Directors and the SEC of certain liquidity events specified in the Liquidity Rule. The liquidity of the Fund’s portfolio investments is determined based on a number of factors including, but not limited to, relevant market, trading and investment-specific considerations under the Program.
At a meeting of the Fund’s Board of Trustees/Directors on June 16, 2021, the Committee provided a written report to the Fund’s Board of Trustees/ Directors pertaining to the operation, adequacy, and effectiveness of implementation of the Program, as well as the operation of the highly liquid investment minimum (if applicable) for the period January 1, 2020 through December 31, 2020 (Review Period). The Program operated effectively during the Review Period, supporting the administrator’s ability to assess, manage and monitor Fund liquidity risk, including during periods of market volatility and net redemptions. During the Review Period, the Fund met redemption requests on a timely basis.
There can be no assurance that the Program will achieve its objectives in the future. Please refer to the Fund’s prospectus for more information regarding the Fund’s exposure to liquidity risk and other principal risks to which an investment in the Fund may be subject.
Calvert
Core Bond Fund
September 30, 2021
Management and Organization
Fund Management. The Trustees of The Calvert Fund (the Trust) are responsible for the overall management and supervision of the Trust’s affairs. The Trustees and officers of the Trust are listed below. Except as indicated, each individual has held the office shown or other offices in the same company for the last five years. Each Board member holds office until his or her successor is elected and qualified, or until his or her earlier death, resignation, retirement, removal or disqualification. Under the terms of the Fund's current Board member retirement policy, an Independent Board member must retire at the end of the calendar year in which he or she turns 75. However, if such retirement would cause the Fund to be out of compliance with Section 16 of the 1940 Act or any other regulations or guidance of the SEC, then such retirement and resignation will not become effective until such time as action has been taken for the Fund to be in compliance upon a Board member's retirement. The “Independent Trustees” consist of those Trustees who are not “interested persons” of the Trust, as that term is defined under the 1940 Act. The business address of each Trustee and officer, with the exception of Ms. Walsh and Mr. Kirchner, is 1825 Connecticut Avenue NW, Suite 400, Washington, DC 20009. As used below, “CRM” refers to Calvert Research and Management. Each Trustee oversees 39 funds in the Calvert fund complex. Each officer serves as an officer of certain other Calvert funds.
| Name and Year of Birth | Trust
Position(s) | Position
Start Date | Principal Occupation(s) and Other Directorships
During Past Five Years and Other Relevant Experience |
| Interested Trustee |
John H. Streur(1)
1960 | Trustee and
President | 2015 | President and Chief Executive Officer of Calvert Research and
Management (since December 31, 2016). President and Chief Executive
Officer of Calvert Investments, Inc. (January 2015 - December 2016);
Chief Executive Officer of Calvert Investment Distributors, Inc. (August
2015 - December 2016); Chief Compliance Officer of Calvert Investment
Management, Inc. (August 2015 - April 2016); President and Director,
Portfolio 21 Investments, Inc. (through October 2014); President,
Chief Executive Officer and Director, Managers Investment Group LLC
(through January 2012); President and Director, The Managers Funds
and Managers AMG Funds (through January 2012).
Other Directorships in the Last Five Years. Portfolio 21 Investments,
Inc. (asset management) (through October 2014); Managers Investment
Group LLC (asset management) (through January 2012); The Managers
Funds (asset management) (through January 2012); Managers AMG Funds
(asset management) (through January 2012); Calvert Impact Capital, Inc. |
| Independent Trustees |
Richard L. Baird, Jr.
1948 | Trustee | 1982 | Regional Disaster Recovery Lead, American Red Cross of Greater
Pennsylvania (since 2017). Volunteer, American Red Cross (since 2015).
Former President and CEO of Adagio Health Inc. (retired in 2014) in
Pittsburgh, PA.
Other Directorships in the Last Five Years. None. |
Alice Gresham Bullock
1950 | Chair and
Trustee | 2016 | Professor Emerita at Howard University School of Law. Dean Emerita of
Howard University School of Law and Deputy Director of the Association
of American Law Schools (1992-1994).
Other Directorships in the Last Five Years. None. |
Cari M. Dominguez
1949 | Trustee | 2016 | Former Chair of the U.S. Equal Employment Opportunity Commission.
Other Directorships in the Last Five Years. Manpower, Inc. (employment
agency); Triple S Management Corporation (managed care); National
Association of Corporate Directors. |
John G. Guffey, Jr.
1948 | Trustee | 1982 | President of Aurora Press Inc., a privately held publisher of trade
paperbacks (since January 1997).
Other Directorships in the Last Five Years. Calvert Impact Capital, Inc.
(through December 31, 2018); Calvert Ventures, LLC. |
Miles D. Harper, III
1962 | Trustee | 2016 | Partner, Carr Riggs & Ingram (public accounting firm) since October 2014.
Partner, Gainer Donnelly & Desroches (public accounting firm) (now Carr
Riggs & Ingram) (November 1999 - September 2014).
Other Directorships in the Last Five Years. Bridgeway Funds (9) (asset
management). |
Joy V. Jones
1950 | Trustee | 2016 | Attorney.
Other Directorships in the Last Five Years. Conduit Street Restaurants
SUD 2 Limited; Palm Management Restaurant Corporation. |
Calvert
Core Bond Fund
September 30, 2021
Management and Organization — continued
| Name and Year of Birth | Trust
Position(s) | Position
Start Date | Principal Occupation(s) and Other Directorships
During Past Five Years and Other Relevant Experience |
| Independent Trustees (continued) |
Anthony A. Williams
1951 | Trustee | 2010 | CEO and Executive Director of the Federal City Council (July 2012 to
present); Senior Adviser and Independent Consultant for King and
Spalding LLP (September 2015 to present); Executive Director of Global
Government Practice at the Corporate Executive Board (January 2010 to
January 2012).
Other Directorships in the Last Five Years. Freddie Mac; Evoq
Properties/Meruelo Maddux Properties, Inc. (real estate management);
Weston Solutions, Inc. (environmental services); Bipartisan Policy Center’s
Debt Reduction Task Force; Chesapeake Bay Foundation; Catholic
University of America; Urban Institute (research organization); The Howard Hughes Corporation (real estate development). |
| Name and Year of Birth | Trust
Position(s) | Position
Start Date | Principal Occupation(s)
During Past Five Years |
| Principal Officers who are not Trustees |
Hope L. Brown
1973 | Chief
Compliance
Officer | 2014 | Chief Compliance Officer of 39 registered investment companies advised
by CRM (since 2014). Vice President and Chief Compliance Officer,
Wilmington Funds (2012-2014). |
Deidre E. Walsh(2)
1971 | Secretary,
Vice President
and Chief
Legal Officer | 2021 | Vice President of CRM and officer of 39 registered investment companies
advised by CRM (since 2021). Also Vice President of Eaton Vance and
certain of its affiliates and officer of 138 registered investment companies
advised or administered by Eaton Vance. |
James F. Kirchner(2)
1967 | Treasurer | 2016 | Vice President of CRM and officer of 39 registered investment companies
advised by CRM (since 2016). Also Vice President of Eaton Vance and
certain of its affiliates and officer of 138 registered investment companies
advised or administered by Eaton Vance. |
| (1) Mr. Streur is an interested person of the Fund because of his positions with the Fund’s adviser and certain affiliates. |
| (2) The business address for Ms. Walsh and Mr. Kirchner is Two International Place, Boston, MA 02110. |
The SAI for the Fund includes additional information about the Trustees and officers of the Fund and can be obtained without charge on Calvert’s website at www.calvert.com or by calling 1-800-368-2745.
| FACTS | WHAT DOES EATON VANCE DO WITH YOUR
PERSONAL INFORMATION? |
| Why? | Financial companies choose how they share your personal information. Federal law gives consumers the right to limit some but not all sharing. Federal law also requires us to tell you how we collect, share, and protect your personal information. Please read this notice carefully to understand what we do. |
| |
| What? | The types of personal information we collect and share depend on the product or service you have with us. This information can include:■ Social Security number and income
■
investment experience and risk tolerance
■
checking account number and wire transfer instructions |
| |
| How? | All financial companies need to share customers’ personal information to run their everyday business. In the section below, we list the reasons financial companies can share their customers’ personal information; the reasons Eaton Vance chooses to share; and whether you can limit this sharing. |
Reasons we can share your
personal information | Does Eaton Vance
share? | Can you limit
this sharing? |
| For our everyday business purposes — such as to process your transactions, maintain your account(s), respond to court orders and legal investigations, or report to credit bureaus | Yes | No |
| For our marketing purposes — to offer our products and services to you | Yes | No |
| For joint marketing with other financial companies | No | We don’t share |
| For our investment management affiliates’ everyday business purposes — information about your transactions, experiences, and creditworthiness | Yes | Yes |
| For our affiliates’ everyday business purposes — information about your transactions and experiences | Yes | No |
| For our affiliates’ everyday business purposes — information about your creditworthiness | No | We don’t share |
| For our investment management affiliates to market to you | Yes | Yes |
| For our affiliates to market to you | No | We don’t share |
| For nonaffiliates to market to you | No | We don’t share |
To limit our
sharing | Call toll-free 1-800-368-2745 or email: CRMPrivacy@calvert.comPlease note:If you are a new customer, we can begin sharing your information 30 days from the date we sent this notice. When you are no longer our customer, we continue to share your information as described in this notice. However, you can contact us at any time to limit our sharing. |
| Questions? | Call toll-free 1-800-368-2745 or email: CRMPrivacy@calvert.com |
| Privacy Notice — continued | April 2021 |
| Who we are |
| Who is providing this notice? | Eaton Vance Management, Eaton Vance Distributors, Inc., Eaton Vance Trust Company, Eaton Vance Management (International) Limited, Eaton Vance Advisers International Ltd., Eaton Vance Global Advisors Limited, Eaton Vance Management’s Real Estate Investment Group, Boston Management and Research, Calvert Research and Management, Eaton Vance and Calvert Fund Families and our investment advisory affiliates (“Eaton Vance”) (see Investment Management Affiliates definition below) |
| What we do |
How does Eaton Vance
protect my personal
information? | To protect your personal information from unauthorized access and use, we use security measures that comply with federal law. These measures include computer safeguards and secured files and buildings. We have policies governing the proper handling of customer information by personnel and requiring third parties that provide support to adhere to appropriate security standards with respect to such information. |
How does Eaton Vance
collect my personal
information? | We collect your personal information, for example, when you■ open an account or make deposits or withdrawals from your account
■
buy securities from us or make a wire transfer
■
give us your contact informationWe also collect your personal information from others, such as credit bureaus, affiliates, or other companies. |
| Why can’t I limit all sharing? | Federal law gives you the right to limit only■ sharing for affiliates’ everyday business purposes — information about your creditworthiness
■
affiliates from using your information to market to you
■
sharing for nonaffiliates to market to youState laws and individual companies may give you additional rights to limit sharing. See below for more on your rights under state law. |
| Definitions |
Investment Management
Affiliates | Eaton Vance Investment Management Affiliates include registered investment advisers, registered broker- dealers, and registered and unregistered funds. Investment Management Affiliates does not include entities associated with Morgan Stanley Wealth Management, such as Morgan Stanley Smith Barney LLC and Morgan Stanley & Co. |
| Affiliates | Companies related by common ownership or control. They can be financial and nonfinancial companies.■ Our affiliates include companies with a Morgan Stanley name and financial companies such as Morgan Stanley Smith Barney LLC and Morgan Stanley & Co. |
| Nonaffiliates | Companies not related by common ownership or control. They can be financial and nonfinancial companies.■ Eaton Vance does not share with nonaffiliates so they can market to you. |
| Joint marketing | A formal agreement between nonaffiliated financial companies that together market financial products or services to you.■ Eaton Vance doesn’t jointly market. |
| Other important information |
| Vermont: Except as permitted by law, we will not share personal information we collect about Vermont residents with Nonaffiliates unless you provide us with your written consent to share such information.California: Except as permitted by law, we will not share personal information we collect about California residents with Nonaffiliates and we will limit sharing such personal information with our Affiliates to comply with California privacy laws that apply to us. |
Delivery of Shareholder Documents. The Securities and Exchange Commission (SEC) permits funds to deliver only one copy of shareholder documents, including prospectuses, proxy statements and shareholder reports, to fund investors with multiple accounts at the same residential or post office box address. This practice is often called “householding” and it helps eliminate duplicate mailings to shareholders. Calvert funds, or your financial intermediary, may household the mailing of your documents indefinitely unless you instruct Calvert funds, or your financial intermediary, otherwise. If you would prefer that your Calvert fund documents not be householded, please contact Calvert funds at 1-800-368-2745, or contact your financial intermediary. Your instructions that householding not apply to delivery of your Calvert fund documents will typically be effective within 30 days of receipt by Calvert funds or your financial intermediary. Separate statements will be generated for each separate account and will be householded as described above.
Portfolio Holdings. Each Calvert fund files a schedule of portfolio holdings on Part F to Form N-PORT with the SEC. Certain information filed on Form N-PORT may be viewed on the Calvert website at www.calvert.com, by calling Calvert at 1-800-368-2745 or in the EDGAR database on the SEC’s website at www.sec.gov.
Proxy Voting. The Proxy Voting Guidelines that each Calvert fund uses to determine how to vote proxies relating to portfolio securities is provided as an Appendix to the fund’s Statement of Additional Information. The Statement of Additional Information can be obtained free of charge by calling the Calvert funds at 1-800-368-2745, by visiting the Calvert funds’ website at www.calvert.com or visiting the SEC’s website at www.sec.gov. Information regarding how a Calvert fund voted proxies relating to portfolio securities during the most recent 12-month period ended June 30 is available by calling Calvert funds, by visiting the Calvert funds’ website at www.calvert.com or by visiting the SEC’s website at www.sec.gov.
This Page Intentionally Left Blank
This Page Intentionally Left Blank
This Page Intentionally Left Blank
Investment Adviser and Administrator
Calvert Research and Management
1825 Connecticut Avenue NW, Suite 400
Washington, DC 20009
Principal Underwriter*
Eaton Vance Distributors, Inc.
Two International Place
Boston, MA 02110
(617) 482-8260
Custodian
State Street Bank and Trust Company
State Street Financial Center, One Lincoln Street
Boston, MA 02111
Transfer Agent
DST Asset Manager Solutions, Inc.
2000 Crown Colony Drive
Quincy, MA 02169
Independent Registered Public Accounting Firm
Deloitte & Touche LLP
200 Berkeley Street
Boston, MA 02116-5022
Fund Offices
1825 Connecticut Avenue NW, Suite 400
Washington, DC 20009
* FINRA BrokerCheck. Investors may check the background of their Investment Professional by contacting the Financial Industry Regulatory Authority (FINRA). FINRA BrokerCheck is a free tool to help investors check the professional background of current and former FINRA-registered securities firms and brokers. FINRA BrokerCheck is available by calling 1-800-289-9999 and at www.FINRA.org. The FINRA BrokerCheck brochure describing this program is available to investors at www.FINRA.org.
Printed on recycled paper.
Calvert
Income Fund
Annual Report
September 30, 2021
Commodity Futures Trading Commission Registration. The Commodity Futures Trading Commission (“CFTC”) has adopted regulations that subject registered investment companies and advisers to regulation by the CFTC if a fund invests more than a prescribed level of its assets in certain CFTC-regulated instruments (including futures, certain options and swap agreements) or markets itself as providing investment exposure to such instruments. The adviser has claimed an exclusion from the definition of “commodity pool operator” under the Commodity Exchange Act with respect to its management of the Fund and the other funds it manages. Accordingly, neither the Fund nor the adviser is subject to CFTC regulation.
Fund shares are not insured by the FDIC and are not deposits or other obligations of, or guaranteed by, any depository institution. Shares are subject to investment risks, including possible loss of principal invested.
This report must be preceded or accompanied by a current summary prospectus or prospectus. Before investing, investors should consider carefully the investment objective, risks, and charges and expenses of a mutual fund. This and other important information is contained in the summary prospectus and prospectus, which can be obtained from a financial intermediary. Prospective investors should read the prospectus carefully before investing. For further information, please call 1-800-368-2745.
Choose Planet-friendly E-delivery!
Sign up now for on-line statements, prospectuses, and fund reports. In less than five minutes you can help reduce paper mail and lower fund costs.
Just go to www.calvert.com. If you already have an online account with the Calvert funds, click on Login to access your Account and select the documents you would like to receive via e-mail.
If you’re new to online account access, click on Login, then Register to create your user name and password. Once you’re in, click on the E-delivery sign-up on the Account Portfolio page and follow the quick, easy steps.
Note: If your shares are not held directly with the Calvert funds but through a brokerage firm, you must contact your broker for electronic delivery options available through their firm.
Annual Report September 30, 2021
Calvert
Income Fund
Calvert
Income Fund
September 30, 2021
Management's Discussion of Fund Performance†
Economic and Market Conditions
After the U.S. Federal Reserve (the Fed) met in late September 2021, Fed Chair Jerome Powell noted that “The path of the economy continues to depend on the course of the [COVID-19] virus, and risks to the economic outlook remain.” For fixed-income investors, this reflected the dominant investment theme for the 12-month period ended September 30, 2021.
Throughout the period, performance of fixed-income asset classes ebbed and flowed as the virus advanced and retreated, with a second wave of COVID-19 washing over the U.S. and global economies in the winter of 2020-2021 and a third wave known as the Delta variant spreading around the world in the summer of 2021.
For the period as a whole, however, U.S. fixed-income investors appeared to focus on the reopening of the economy and its recovery from a near-shutdown in the early days of the pandemic. The asset classes that fared best during the period were those that stood to benefit from a U.S. and global economic revival. So-called “safe-haven” assets, in contrast, fared poorly as investors appeared to become more comfortable taking on increased risk during the period.
As a result, U.S. Treasurys were one of the worst-performing fixed-income asset classes during the period, with the Bloomberg U.S. Treasury Index returning (3.30)% for the period. The Bloomberg U.S. Aggregate Bond Index, a broad measure of the U.S. fixed-income market, was also dragged down by its Treasury component, and returned (0.90)% for the period.
Investment-grade corporate bonds fared better. The Bloomberg U.S. Corporate Bond Index returned 1.74% for the period, as factories and businesses reopened and consumers — a key driver of the U.S. economy — rushed to spend the money they had saved while confined at home earlier in the pandemic.
High yield bonds were a standout asset class during the period. Several industries prominent within the high yield space — including airlines, restaurants, retail, and travel & leisure — were among the hardest-hit businesses early in the pandemic and the biggest beneficiaries of the subsequent economic recovery. Reflecting investors’ increasing confidence in the recovery, as well as their search for yield in a historically low-yield environment, the Bloomberg U.S. Corporate High Yield Index returned 11.28% for the one-year period.
Fund Performance
For the 12-month period ended September 30, 2021, Calvert Income Fund (the Fund) returned 6.41% for Class A shares at net asset value (NAV), outperforming its benchmark, the Bloomberg U.S. Credit Index (the Index), which returned 1.45%.
Sector allocation in the Fund contributed to outperformance relative to the Index during the period. An overweight allocation to high yield corporate securities, an out-of-Index allocation to commercial mortgage-backed securities, and an underweight allocation to government-related securities were beneficial during the period.
Security selections in investment-grade corporate securities also contributed to performance relative to the Index during the period. The Fund’s shorter-than-Index duration further enhanced relative returns.
The Fund’s yield-curve positioning detracted from returns relative to the Index during the period. An underweight exposure to investment-grade corporate securities and an out-of-Index allocation to U.S. Treasurys also weighed on relative performance. The Fund’s use of derivatives detracted from returns relative to the Index during the period.
Toward period-end, the U.S. Federal Reserve indicated it was poised to begin a monetary tightening cycle that the Fund believed was likely to spark market volatility and push interest rates higher, particularly at the front end of the yield curve. Under these circumstances, the Fund maintained an underweight interest rate duration at period-end.
See Endnotes and Additional Disclosures in this report.
Past performance is no guarantee of future results. Returns are historical and are calculated by determining the percentage change in net asset value (NAV) or offering price (as applicable) with all distributions reinvested. Investment return and principal value will fluctuate so that shares, when redeemed, may be worth more or less than their original cost. Performance for periods less than or equal to one year is cumulative. Performance is for the stated time period only; due to market volatility, current Fund performance may be lower or higher than the quoted return. For performance as of the most recent month-end, please refer to www.calvert.com.
Calvert
Income Fund
September 30, 2021
Performance
Portfolio Managers Vishal Khanduja, CFA and Brian S. Ellis, CFA, each of Calvert Research and Management
| % Average Annual Total Returns1,2 | Class
Inception Date | Performance
Inception Date | One Year | Five Years | Ten Years |
| Class A at NAV | 10/12/1982 | 10/12/1982 | 6.41% | 4.77% | 4.23% |
| Class A with 3.75% Maximum Sales Charge | — | — | 2.40 | 3.97 | 3.83 |
| Class C at NAV | 07/31/2000 | 10/12/1982 | 5.55 | 3.97 | 3.46 |
| Class C with 1% Maximum Sales Charge | — | — | 4.55 | 3.97 | 3.46 |
| Class I at NAV | 02/26/1999 | 10/12/1982 | 6.66 | 5.07 | 4.68 |
|
| Bloomberg U.S. Credit Index | — | — | 1.45% | 4.37% | 4.60% |
| % Total Annual Operating Expense Ratios3 | Class A | Class C | Class I |
| | 0.94% | 1.69% | 0.69% |
Growth of $10,000
This graph shows the change in value of a hypothetical investment of $10,000 in Class A of the Fund for the period indicated. For comparison, the same investment is shown in the indicated index.
| Growth of Investment | Amount Invested | Period Beginning | At NAV | With Maximum Sales Charge |
| Class C | $10,000 | 09/30/2011 | $14,052 | N.A. |
| Class I | $250,000 | 09/30/2011 | $395,228 | N.A. |
See Endnotes and Additional Disclosures in this report.
Past performance is no guarantee of future results. Returns are historical and are calculated by determining the percentage change in net asset value (NAV) or offering price (as applicable) with all distributions reinvested. Investment return and principal value will fluctuate so that shares, when redeemed, may be worth more or less than their original cost. Performance for periods less than or equal to one year is cumulative. Performance is for the stated time period only; due to market volatility, current Fund performance may be lower or higher than the quoted return. For performance as of the most recent month-end, please refer to www.calvert.com.
Calvert
Income Fund
September 30, 2021
Asset Allocation (% of total investments)
Credit Quality (% of bond and loan holdings)*
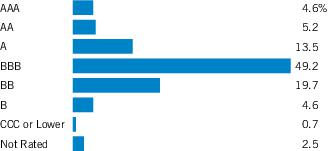
* For purposes of the Fund’s rating restrictions, ratings are based on Moody’s Investors Service, Inc. (“Moody’s”), S&P Global Ratings (“S&P”) or Fitch Ratings (“Fitch”), or Kroll Bond Rating Agency, LLC (“Kroll”) for securitized debt instruments only (such as asset-backed securities (“ABS”) and mortgage-backed securities (“MBS”)), as applicable. If securities are rated differently by the ratings agencies, the highest rating is applied. Ratings, which are subject to change, apply to the creditworthiness of the issuers of the underlying securities and not to the Fund or its shares. Credit ratings measure the quality of an issuance based on the issuer’s creditworthiness, with ratings ranging from AAA, being the highest, to D, being the lowest based on S&P’s measures. Ratings of BBB or higher by S&P, Fitch or Kroll (Baa or higher by Moody’s) are considered to be investment-grade quality. Credit ratings are based largely on the ratings agency’s analysis at the time of rating. The rating assigned to any particular security is not necessarily a reflection of the issuer’s current financial condition and does not necessarily reflect its assessment of the volatility of a security’s market value or of the liquidity of an investment in the security. Holdings designated as “Not Rated” (if any) are not rated by the national ratings agencies stated above.
See Endnotes and Additional Disclosures in this report.
Calvert
Income Fund
September 30, 2021
Endnotes and Additional Disclosures
| † | The views expressed in this report are those of the portfolio manager(s) and are current only through the date stated at the top of this page. These views are subject to change at any time based upon market or other conditions, and Calvert and the Fund(s) disclaim any responsibility to update such views. These views may not be relied upon as investment advice and, because investment decisions are based on many factors, may not be relied upon as an indication of trading intent on behalf of any Calvert fund. This commentary may contain statements that are not historical facts, referred to as “forward-looking statements.” The Fund’s actual future results may differ significantly from those stated in any forward-looking statement, depending on factors such as changes in securities or financial markets or general economic conditions, the volume of sales and purchases of Fund shares, the continuation of investment advisory, administrative and service contracts, and other risks discussed from time to time in the Fund’s filings with the Securities and Exchange Commission. |
| | |
| 1 | Bloomberg U.S. Credit Index measures the performance of investment-grade U.S. corporate securities and government-related bonds with a maturity of one year or more. Unless otherwise stated, index returns do not reflect the effect of any applicable sales charges, commissions, expenses, taxes or leverage, as applicable. It is not possible to invest directly in an index. |
| 2 | Total Returns at NAV do not include applicable sales charges. If sales charges were deducted, the returns would be lower. Total Returns shown with maximum sales charge reflect the stated maximum sales charge. Unless otherwise stated, performance does not reflect the deduction of taxes on Fund distributions or redemptions of Fund shares.Calvert Research and Management became the investment adviser to the Fund on December 31, 2016. Performance reflected prior to such date is that of the Fund’s former investment adviser. |
| 3 | Source: Fund prospectus. The expense ratios for the current reporting period can be found in the Financial Highlights section of this report.Fund profile subject to change due to active management. |
| | Additional Information |
| | Bloomberg U.S. Treasury Index measures the performance of U.S. Treasuries with a maturity of one year or more. Bloomberg U.S. Aggregate Bond Index is an unmanaged index of domestic investment-grade bonds, including corporate, government and mortgage-backed securities. Bloomberg U.S. Corporate Bond Index measures the performance of investment-grade U.S. corporate securities with a maturity of one year or more. Bloomberg U.S. Corporate High Yield Index measures USD-denominated, non-investment grade corporate securities. |
| | Duration is a measure of the expected change in price of a bond — in percentage terms — given a one percent change in interest rates, all else being constant. Securities with lower durations tend to be less sensitive to interest rate changes. |
| | Yield curve is a graphical representation of the yields offered by bonds of various maturities. The yield curve flattens when long-term interest rates fall and/or short-term interest rates increase, and the yield curve steepens when long-term interest rates increase and/or short-term interest rates fall. |
| | Important Notice to Shareholders |
| | Effective August 24, 2021, the Bloomberg Barclays fixed income indices were rebranded as Bloomberg indices. |
Calvert
Income Fund
September 30, 2021
Example
As a Fund shareholder, you incur two types of costs: (1) transaction costs, including sales charges (loads) on purchases and redemption fees (if applicable); and (2) ongoing costs, including management fees; distribution and/or service fees; and other Fund expenses. This Example is intended to help you understand your ongoing costs (in dollars) of Fund investing and to compare these costs with the ongoing costs of investing in other mutual funds. The Example is based on an investment of $1,000 invested at the beginning of the period and held for the entire period (April 1, 2021 to September 30, 2021).
Actual Expenses
The first section of the table below provides information about actual account values and actual expenses. You may use the information in this section, together with the amount you invested, to estimate the expenses that you paid over the period. Simply divide your account value by $1,000 (for example, an $8,600 account value divided by $1,000 = 8.6), then multiply the result by the number in the first section under the heading entitled “Expenses Paid During Period” to estimate the expenses you paid on your account during this period.
Hypothetical Example for Comparison Purposes
The second section of the table below provides information about hypothetical account values and hypothetical expenses based on the actual Fund expense ratio and an assumed rate of return of 5% per year (before expenses), which is not the actual Fund return. The hypothetical account values and expenses may not be used to estimate the actual ending account balance or expenses you paid for the period. You may use this information to compare the ongoing costs of investing in the Fund and other funds. To do so, compare this 5% hypothetical example with the 5% hypothetical examples that appear in the shareholder reports of the other funds.
Please note that the expenses shown in the table are meant to highlight your ongoing costs only and do not reflect any transactional costs, such as sales charges (loads) or redemption fees (if applicable). Therefore, the second section of the table is useful in comparing ongoing costs only, and will not help you determine the relative total costs of owning different funds. In addition, if these transactional costs were included, your costs would be higher.
| | Beginning
Account Value
(4/1/21) | Ending
Account Value
(9/30/21) | Expenses Paid
During Period*
(4/1/21 – 9/30/21) | Annualized
Expense
Ratio |
| Actual | | | | |
| Class A | $1,000.00 | $1,040.10 | $4.65 | 0.91% |
| Class C | $1,000.00 | $1,035.60 | $8.47 | 1.66% |
| Class I | $1,000.00 | $1,041.30 | $3.38 | 0.66% |
| Hypothetical | | | | |
| (5% return per year before expenses) | | | | |
| Class A | $1,000.00 | $1,020.51 | $4.61 | 0.91% |
| Class C | $1,000.00 | $1,016.75 | $8.39 | 1.66% |
| Class I | $1,000.00 | $1,021.76 | $3.35 | 0.66% |
| * | Expenses are equal to the Fund's annualized expense ratio for the indicated Class, multiplied by the average account value over the period, multiplied by 183/365 (to reflect the one-half year period). The Example assumes that the $1,000 was invested at the net asset value per share determined at the close of business on March 31, 2021. |
Calvert
Income Fund
September 30, 2021
| Asset-Backed Securities — 8.8% |
| Security | Principal
Amount
(000's omitted) | Value |
| AASET US, Ltd., Series 2018-1A, Class C, 6.413%, 1/16/38(1) | $ | 448 | $ 362,571 |
| Aligned Data Centers Issuer, LLC, Series 2021-1A, Class A2, 1.937%, 8/15/46(1) | | 1,938 | 1,950,690 |
| Business Jet Securities, LLC, Series 2020-1A, Class A, 2.981%, 11/15/35(1) | | 1,645 | 1,668,767 |
| Coinstar Funding, LLC, Series 2017-1A, Class A2, 5.216%, 4/25/47(1) | | 4,704 | 4,717,361 |
| Conn's Receivables Funding, LLC: | | | |
| Series 2020-A, Class B, 4.27%, 6/16/25(1) | | 1,531 | 1,540,792 |
| Series 2020-A, Class C, 4.20%, 6/16/25(1) | | 1,929 | 1,935,956 |
| Diamond Infrastructure Funding, LLC, Series 2021-1A, Class C, 3.475%, 4/15/49(1) | | 757 | 759,066 |
| Driven Brands Funding, LLC, Series 2018-1A, Class A2, 4.739%, 4/20/48(1) | | 1,209 | 1,285,637 |
| ExteNet, LLC: | | | |
| Series 2019-1A, Class B, 4.14%, 7/26/49(1) | | 1,195 | 1,235,132 |
| Series 2019-1A, Class C, 5.219%, 7/26/49(1) | | 2,160 | 2,247,612 |
| FOCUS Brands Funding, LLC: | | | |
| Series 2017-1A, Class A2IB, 3.857%, 4/30/47(1) | | 656 | 674,818 |
| Series 2017-1A, Class A2II, 5.093%, 4/30/47(1) | | 1,374 | 1,459,764 |
| Hardee's Funding, LLC, Series 2020-1A, Class A2, 3.981%, 12/20/50(1) | | 1,796 | 1,911,663 |
| Jack in the Box Funding, LLC, Series 2019-1A, Class A2I, 3.982%, 8/25/49(1) | | 2,620 | 2,683,734 |
| Jersey Mike's Funding, Series 2019-1A, Class A2, 4.433%, 2/15/50(1) | | 1,144 | 1,219,886 |
| Lunar Aircraft, Ltd.: | | | |
| Series 2020-1A, Class B, 4.335%, 2/15/45(1) | | 407 | 379,543 |
| Series 2020-1A, Class C, 6.413%, 2/15/45(1) | | 212 | 177,666 |
| Marlette Funding Trust, Series 2020-2A, Class C, 2.83%, 9/16/30(1) | | 1,685 | 1,720,532 |
| Mosaic Solar Loan Trust: | | | |
| Series 2020-1A, Class B, 3.10%, 4/20/46(1) | | 144 | 150,087 |
| Series 2020-1A, Class D, 6.91%, 4/20/46(1) | | 496 | 510,915 |
| Neighborly Issuer, LLC, Series 2021-1A, Class A2, 3.584%, 4/30/51(1) | | 2,638 | 2,732,617 |
| NRZ Excess Spread-Collateralized Notes, Series 2021-FHT1, Class A, 3.104%, 7/25/26(1) | | 649 | 652,704 |
| Pagaya AI Debt Selection Trust, Series 2021-3, Class C, 3.27%, 5/15/29(1) | | 5,900 | 5,920,246 |
| Planet Fitness Master Issuer, LLC: | | | |
| Series 2018-1A, Class A2II, 4.666%, 9/5/48(1) | | 2,304 | 2,374,123 |
| Series 2019-1A, Class A2, 3.858%, 12/5/49(1) | | 2,530 | 2,577,415 |
| ServiceMaster Funding, LLC: | | | |
| Series 2020-1, Class A2I, 2.841%, 1/30/51(1) | | 650 | 664,643 |
| Series 2020-1, Class A2II, 3.337%, 1/30/51(1) | | 1,390 | 1,446,337 |
| Security | Principal
Amount
(000's omitted) | Value |
| SERVPRO Master Issuer, LLC, Series 2019-1A, Class A2, 3.882%, 10/25/49(1) | $ | 4,824 | $ 5,056,773 |
| SolarCity LMC Series I, LLC, Series 2013-1, Class A, 4.80%, 11/20/38(1) | | 492 | 514,239 |
| SolarCity LMC Series II, LLC, Series 2014-1, Class A, 4.59%, 4/20/44(1) | | 264 | 264,021 |
| SolarCity LMC Series III, LLC, Series 2014-2, Class A, 4.02%, 7/20/44(1) | | 981 | 998,494 |
| Sonic Capital, LLC, Series 2020-1A, Class A2I, 3.845%, 1/20/50(1) | | 2,957 | 3,123,222 |
| Stack Infrastructure Issuer, LLC: | | | |
| Series 2019-1A, Class A2, 4.54%, 2/25/44(1) | | 2,694 | 2,835,650 |
| Series 2019-2A, Class A2, 3.08%, 10/25/44(1) | | 720 | 740,050 |
| Sunnova Helios II Issuer, LLC, Series 2021-A, Class B, 3.15%, 2/20/48(1) | | 1,121 | 1,115,612 |
| Sunnova Sol II Issuer, LLC, Series 2020-2A, Class B, 5.47%, 11/1/55(1) | | 970 | 1,006,728 |
| Sunrun Xanadu Issuer, LLC, Series 2019-1A, Class A, 3.98%, 6/30/54(1) | | 464 | 496,734 |
| TES, LLC, Series 2017-1A, Class A, 4.33%, 10/20/47(1) | | 1,619 | 1,719,592 |
| Tesla Auto Lease Trust, Series 2020-A, Class D, 2.33%, 2/20/24(1) | | 1,055 | 1,079,659 |
| Theorem Funding Trust, Series 2021-1A, Class B, 1.84%, 12/15/27(1) | | 928 | 926,039 |
| Vantage Data Centers Issuer, LLC: | | | |
| Series 2019-1A, Class A2, 3.188%, 7/15/44(1) | | 365 | 377,594 |
| Series 2020-2A, Class A2, 1.992%, 9/15/45(1) | | 2,545 | 2,534,849 |
| Willis Engine Structured Trust V: | | | |
| Series 2020-A, Class B, 4.212%, 3/15/45(1) | | 722 | 686,602 |
| Series 2020-A, Class C, 6.657%, 3/15/45(1) | | 442 | 324,131 |
Total Asset-Backed Securities
(identified cost $67,426,216) | | | $ 68,760,266 |
| Collateralized Mortgage Obligations — 2.8% |
| Security | Principal
Amount
(000's omitted) | Value |
| Bellemeade Re, Ltd.: | | | |
| Series 2020-4A, Class M2A, 2.686%, (1 mo. USD LIBOR + 2.60%), 6/25/30(1)(2) | $ | 1,676 | $ 1,688,260 |
| Series 2021-1A, Class M1C, 3.00%, (30-day average SOFR + 2.95%), 3/25/31(1)(2) | | 1,130 | 1,179,966 |
| Series 2021-3A, Class M1B, 1.45%, (30-day average SOFR + 1.40%), 9/25/31(1)(2) | | 4,195 | 4,215,743 |
| Federal Home Loan Mortgage Corp. Structured Agency Credit Risk Debt Notes: | | | |
| Series 2019-DNA2, Class M2, 2.536%, (1 mo. USD LIBOR + 2.45%), 3/25/49(1)(2) | | 2,104 | 2,137,619 |
7
See Notes to Financial Statements.
Calvert
Income Fund
September 30, 2021
Schedule of Investments — continued
| Security | Principal
Amount
(000's omitted) | Value |
| Federal Home Loan Mortgage Corp. Structured Agency Credit Risk Debt Notes: (continued) | | | |
| Series 2019-DNA3, Class M2, 2.136%, (1 mo. USD LIBOR + 2.05%), 7/25/49(1)(2) | $ | 1,251 | $ 1,267,260 |
| Series 2020-DNA4, Class M2, 3.836%, (1 mo. USD LIBOR + 3.75%), 8/25/50(1)(2) | | 564 | 570,159 |
| Series 2020-DNA5, Class M2, 2.85%, (30-day average SOFR + 2.80%), 10/25/50(1)(2) | | 984 | 997,777 |
| Series 2020-DNA6, Class B1, 3.05%, (30-day average SOFR + 3.00%), 12/25/50(1)(2) | | 900 | 913,197 |
| Federal National Mortgage Association Connecticut Avenue Securities: | | | |
| Series 2017-C06, Class 1M2, 2.736%, (1 mo. USD LIBOR + 2.65%), 2/25/30(2) | | 608 | 619,529 |
| Series 2018-C06, Class 1M2, 2.086%, (1 mo. USD LIBOR + 2.00%), 3/25/31(2) | | 825 | 833,162 |
| Series 2018-R07, Class 1M2, 2.486%, (1 mo. USD LIBOR + 2.40%), 4/25/31(1)(2) | | 200 | 201,508 |
| Series 2019-R02, Class 1M2, 2.386%, (1 mo. USD LIBOR + 2.30%), 8/25/31(1)(2) | | 494 | 498,463 |
| Series 2019-R05, Class 1M2, 2.086%, (1 mo. USD LIBOR + 2.00%), 7/25/39(1)(2) | | 239 | 240,410 |
| Home Re, Ltd.: | | | |
| Series 2021-1, Class M1C, 2.386%, (1 mo. USD LIBOR + 2.30%), 7/25/33(1)(2) | | 1,030 | 1,028,706 |
| Series 2021-1, Class M2, 2.936%, (1 mo. USD LIBOR + 2.85%), 7/25/33(1)(2) | | 4,340 | 4,361,696 |
| Toorak Mortgage Corp., Ltd., Series 2020-1, Class A1, 2.734% to 1/25/23, 3/25/23(1)(3) | | 1,210 | 1,216,772 |
Total Collateralized Mortgage Obligations
(identified cost $21,671,958) | | | $ 21,970,227 |
| Commercial Mortgage-Backed Securities — 5.1% |
| Security | Principal
Amount
(000's omitted) | Value |
| BAMLL Commercial Mortgage Securities Trust: | | | |
| Series 2019-BPR, Class ENM, 3.843%, 11/5/32(1)(4) | $ | 11,165 | $ 10,762,254 |
| Series 2019-BPR, Class FNM, 3.843%, 11/5/32(1)(4) | | 4,545 | 3,895,411 |
| BX Commercial Mortgage Trust, Series 2021-VOLT, Class D, 1.734%, (1 mo. USD LIBOR + 1.65%), 9/15/36(1)(2) | | 5,509 | 5,523,767 |
| Extended Stay America Trust, Series 2021-ESH, Class D, 2.334%, (1 mo. USD LIBOR + 2.25%), 7/15/38(1)(2) | | 5,515 | 5,573,337 |
| Federal National Mortgage Association Multifamily Connecticut Avenue Securities Trust: | | | |
| Series 2019-01, Class M10, 3.336%, (1 mo. USD LIBOR + 3.25%), 10/15/49(1)(2) | | 480 | 485,534 |
| Series 2020-01, Class M10, 3.836%, (1 mo. USD LIBOR + 3.75%), 3/25/50(1)(2) | | 2,170 | 2,256,730 |
| JPMorgan Chase Commercial Mortgage Securities Trust: | | | |
| Series 2014-DSTY, Class B, 3.771%, 6/10/27(1) | | 2,485 | 756,682 |
| Series 2014-DSTY, Class C, 3.931%, 6/10/27(1)(4) | | 1,120 | 199,920 |
| Security | Principal
Amount
(000's omitted) | Value |
| Morgan Stanley Capital I Trust: | | | |
| Series 2019-BPR, Class B, 2.184%, (1 mo. USD LIBOR + 2.10%), 5/15/36(1)(2)(5) | $ | 6,576 | $ 6,245,300 |
| Series 2019-BPR, Class C, 3.134%, (1 mo. USD LIBOR + 3.05%), 5/15/36(1)(2)(5) | | 3,045 | 2,745,804 |
| Motel Trust: | | | |
| Series 2021-MTL6, Class C, 1.584%, (1 mo. USD LIBOR + 1.50%), 9/15/38(1)(2) | | 1,354 | 1,358,274 |
| Series 2021-MTL6, Class D, 2.18%, (1 mo. USD LIBOR + 2.10%), 9/15/38(1)(2) | | 360 | 361,107 |
Total Commercial Mortgage-Backed Securities
(identified cost $42,959,506) | | | $ 40,164,120 |
| Security | Shares | Value |
| Independent Power and Renewable Electricity Producers — 0.2% | |
| NextEra Energy Partners, L.P. | | 24,212 | $ 1,824,616 |
Total Common Stocks
(identified cost $1,549,488) | | | $ 1,824,616 |
| Security | Principal
Amount
(000's omitted) | Value |
| Technology — 0.2% | |
| ams AG, 0.875%, 9/28/22(6) | $ | 2,000 | $ 1,963,340 |
Total Convertible Bonds
(identified cost $1,938,800) | | | $ 1,963,340 |
| Security | Principal
Amount
(000's omitted) | Value |
| Communications — 7.2% | |
| AT&T, Inc.: | | | |
| 3.10%, 2/1/43 | $ | 1,650 | $ 1,584,814 |
| 3.50%, 9/15/53 | | 1,750 | 1,735,450 |
| 3.55%, 9/15/55 | | 9,042 | 8,934,936 |
| Charter Communications Operating, LLC/Charter Communications Operating Capital, 4.80%, 3/1/50 | | 7,960 | 8,948,747 |
| Comcast Corp.: | | | |
| 2.45%, 8/15/52(7) | | 3,663 | 3,238,891 |
| 2.937%, 11/1/56(1) | | 1,399 | 1,324,007 |
| Discovery Communications, LLC, 5.20%, 9/20/47(7) | | 3,295 | 4,112,693 |
8
See Notes to Financial Statements.
Calvert
Income Fund
September 30, 2021
Schedule of Investments — continued
| Security | Principal
Amount
(000's omitted) | Value |
| Communications (continued) | |
| Level 3 Financing, Inc., 3.75%, 7/15/29(1) | $ | 1,000 | $ 967,730 |
| NBCUniversal Media, LLC, 4.45%, 1/15/43 | | 1,710 | 2,064,890 |
| Nokia Oyj: | | | |
| 4.375%, 6/12/27 | | 1,500 | 1,648,125 |
| 6.625%, 5/15/39 | | 2,700 | 3,690,549 |
| SES Global Americas Holdings GP, 5.30%, 3/25/44(1) | | 1,378 | 1,578,935 |
| SES S.A., 5.30%, 4/4/43(1) | | 820 | 939,300 |
| T-Mobile USA, Inc.: | | | |
| 2.25%, 2/15/26(7) | | 458 | 463,725 |
| 2.25%, 11/15/31 | | 516 | 506,404 |
| 2.55%, 2/15/31 | | 2,240 | 2,249,447 |
| 2.875%, 2/15/31(7) | | 1,000 | 1,009,750 |
| 4.50%, 4/15/50 | | 2,560 | 2,989,465 |
| Verizon Communications, Inc.: | | | |
| 3.40%, 3/22/41 | | 3,000 | 3,135,909 |
| 3.55%, 3/22/51 | | 3,000 | 3,167,825 |
| Ziggo B.V., 5.50%, 1/15/27(1) | | 2,350 | 2,432,250 |
| | | | $ 56,723,842 |
| Consumer, Cyclical — 6.1% | |
| 7-Eleven, Inc., 0.80%, 2/10/24(1) | $ | 1,814 | $ 1,813,743 |
| American Airlines Pass-Through Trust: | | | |
| 4.40%, 9/22/23 | | 364 | 358,711 |
| 5.25%, 1/15/24 | | 844 | 834,320 |
| American Airlines, Inc./AAdvantage Loyalty IP, Ltd.: | | | |
| 5.50%, 4/20/26(1) | | 2,087 | 2,196,567 |
| 5.75%, 4/20/29(1) | | 856 | 923,410 |
| Aptiv PLC, 5.40%, 3/15/49 | | 4,153 | 5,676,806 |
| Delta Air Lines, Inc., 3.625%, 3/15/22 | | 4,585 | 4,625,904 |
| Delta Air Lines, Inc./SkyMiles IP, Ltd., 4.75%, 10/20/28(1) | | 2,475 | 2,761,154 |
| Ford Motor Co., 4.75%, 1/15/43 | | 2,483 | 2,605,611 |
| Ford Motor Credit Co., LLC: | | | |
| 1.198%, (3 mo. USD LIBOR + 1.08%), 8/3/22(2) | | 1,850 | 1,844,640 |
| 3.087%, 1/9/23 | | 833 | 846,286 |
| 4.14%, 2/15/23 | | 1,850 | 1,898,932 |
| General Motors Co., 5.15%, 4/1/38 | | 3,000 | 3,584,182 |
| General Motors Financial Co., Inc., 2.70%, 6/10/31 | | 726 | 724,327 |
| Hyatt Hotels Corp., 1.80%, 10/1/24(8) | | 824 | 825,865 |
| Macy's Retail Holdings, LLC: | | | |
| 3.625%, 6/1/24 | | 1,503 | 1,554,440 |
| 4.30%, 2/15/43 | | 1,500 | 1,307,843 |
| MDC Holdings, Inc., 2.50%, 1/15/31 | | 5,894 | 5,751,483 |
| Nordstrom, Inc.: | | | |
| 4.25%, 8/1/31(7) | | 1,966 | 1,993,436 |
| Security | Principal
Amount
(000's omitted) | Value |
| Consumer, Cyclical (continued) | |
| Nordstrom, Inc.: (continued) | | | |
| 4.375%, 4/1/30(7) | $ | 2,402 | $ 2,458,666 |
| 5.00%, 1/15/44(7) | | 3,161 | 3,104,736 |
| | | | $ 47,691,062 |
| Consumer, Non-cyclical — 6.7% | |
| Ashtead Capital, Inc.: | | | |
| 4.00%, 5/1/28(1) | $ | 732 | $ 778,176 |
| 4.25%, 11/1/29(1) | | 4,166 | 4,577,354 |
| Avon Products, Inc., 8.45%, 3/15/43 | | 1,458 | 1,851,974 |
| Block Financial, LLC, 3.875%, 8/15/30 | | 3,362 | 3,658,637 |
| Centene Corp.: | | | |
| 2.50%, 3/1/31 | | 3,889 | 3,840,388 |
| 3.375%, 2/15/30 | | 1,171 | 1,213,800 |
| 4.25%, 12/15/27 | | 1,068 | 1,119,157 |
| 4.625%, 12/15/29 | | 1,226 | 1,337,627 |
| CVS Health Corp., 5.05%, 3/25/48 | | 3,611 | 4,656,242 |
| CVS Pass-Through Trust, 6.036%, 12/10/28 | | 1,907 | 2,226,674 |
| Ford Foundation (The), 2.415%, 6/1/50(7) | | 1,695 | 1,618,139 |
| Gilead Sciences, Inc., 2.60%, 10/1/40 | | 3,500 | 3,336,170 |
| Hikma Finance USA, LLC, 3.25%, 7/9/25(6) | | 2,038 | 2,129,031 |
| Kraft Heinz Foods Co., 4.375%, 6/1/46 | | 7,301 | 8,322,099 |
| Natura Cosmeticos S.A., 4.125%, 5/3/28(1) | | 2,644 | 2,679,694 |
| Royalty Pharma PLC: | | | |
| 3.30%, 9/2/40 | | 1,841 | 1,838,187 |
| 3.55%, 9/2/50 | | 2,772 | 2,728,549 |
| Smithfield Foods, Inc.: | | | |
| 2.625%, 9/13/31(1) | | 2,227 | 2,167,310 |
| 3.00%, 10/15/30(1) | | 238 | 239,840 |
| 5.20%, 4/1/29(1) | | 1,625 | 1,867,681 |
| | | | $ 52,186,729 |
| Energy — 1.9% | |
| NuStar Logistics, L.P.: | | | |
| 4.75%, 2/1/22 | $ | 2,929 | $ 2,944,963 |
| 5.625%, 4/28/27 | | 1,077 | 1,149,127 |
| 6.375%, 10/1/30 | | 1,510 | 1,662,888 |
| TerraForm Power Operating, LLC: | | | |
| 4.75%, 1/15/30(1) | | 4,083 | 4,276,942 |
| 5.00%, 1/31/28(1) | | 4,269 | 4,589,175 |
| | | | $ 14,623,095 |
| Financial — 33.2% | |
| AerCap Holdings N.V., 5.875% to 10/10/24, 10/10/79(9) | $ | 504 | $ 526,655 |
9
See Notes to Financial Statements.
Calvert
Income Fund
September 30, 2021
Schedule of Investments — continued
| Security | Principal
Amount
(000's omitted) | Value |
| Financial (continued) | |
| AerCap Ireland Capital DAC/AerCap Global Aviation Trust: | | | |
| 4.625%, 10/15/27(7) | $ | 3,236 | $ 3,610,930 |
| 6.50%, 7/15/25 | | 2,656 | 3,080,771 |
| Affiliated Managers Group, Inc., 3.30%, 6/15/30 | | 4,003 | 4,286,466 |
| Agree, L.P., 2.00%, 6/15/28 | | 1,393 | 1,382,341 |
| Air Lease Corp., 2.875%, 1/15/26 | | 2,221 | 2,321,796 |
| Alliance Data Systems Corp., 4.75%, 12/15/24(1) | | 2,689 | 2,757,591 |
| American Assets Trust, L.P., 3.375%, 2/1/31 | | 4,214 | 4,370,523 |
| Aon Corp., 2.80%, 5/15/30 | | 1,313 | 1,372,770 |
| Australia & New Zealand Banking Group, Ltd., 2.95% to 7/22/25, 7/22/30(1)(9) | | 2,114 | 2,198,355 |
| Banco BTG Pactual S.A., 4.50%, 1/10/25(1) | | 2,800 | 2,880,528 |
| Banco do Brasil S.A., 3.25%, 9/30/26(1) | | 5,874 | 5,878,405 |
| Banco Mercantil del Norte S.A.: | | | |
| 7.625% to 1/10/28(1)(9)(10) | | 495 | 552,729 |
| 8.375% to 10/14/30(1)(9)(10) | | 1,195 | 1,413,076 |
| Banco Santander S.A.: | | | |
| 1.722% to 9/14/26, 9/14/27(9) | | 1,800 | 1,792,599 |
| 3.80%, 2/23/28 | | 2,460 | 2,698,260 |
| Bank of America Corp.: | | | |
| 1.898% to 7/23/30, 7/23/31(9) | | 3,250 | 3,135,966 |
| 2.456% to 10/22/24, 10/22/25(9) | | 8,000 | 8,358,763 |
| 2.676% to 6/19/40, 6/19/41(9) | | 2,642 | 2,553,307 |
| 3.311% to 4/22/41, 4/22/42(9) | | 5,500 | 5,777,953 |
| Series Z, 6.50% to 10/23/24(9)(10) | | 2,430 | 2,725,245 |
| Bank of Montreal, 3.803% to 12/15/27, 12/15/32(9) | | 2,123 | 2,327,737 |
| BankUnited, Inc., 5.125%, 6/11/30 | | 2,176 | 2,516,351 |
| BBVA Bancomer S.A./Texas, 5.125% to 1/18/28, 1/18/33(1)(9) | | 3,947 | 4,120,254 |
| BNP Paribas S.A.: | | | |
| 1.904% to 9/30/27, 9/30/28(1)(9) | | 4,770 | 4,750,825 |
| 4.625% to 2/25/31(1)(7)(9)(10) | | 967 | 989,966 |
| Broadstone Net Lease, LLC, 2.60%, 9/15/31 | | 2,073 | 2,049,985 |
| Brookfield Finance, Inc., 4.70%, 9/20/47 | | 3,500 | 4,245,277 |
| Capital One Financial Corp., 3.75%, 7/28/26 | | 8,500 | 9,336,251 |
| Charles Schwab Corp. (The): | | | |
| 4.00% to 6/1/26(9)(10) | | 1,726 | 1,803,670 |
| Series G, 5.375% to 6/1/25(9)(10) | | 1,524 | 1,697,355 |
| CI Financial Corp.: | | | |
| 3.20%, 12/17/30 | | 4,088 | 4,246,941 |
| 4.10%, 6/15/51 | | 1,257 | 1,353,793 |
| Citigroup, Inc.: | | | |
| 4.00% to 12/10/25(9)(10) | | 2,510 | 2,607,137 |
| 4.075% to 4/23/28, 4/23/29(9) | | 2,425 | 2,719,479 |
| 4.125%, 7/25/28 | | 1,530 | 1,709,145 |
| 4.60%, 3/9/26 | | 2,150 | 2,429,537 |
| Security | Principal
Amount
(000's omitted) | Value |
| Financial (continued) | |
| Citizens Financial Group, Inc., 2.638%, 9/30/32 | $ | 1,996 | $ 2,006,913 |
| Commonwealth Bank of Australia, 3.61% to 9/12/29, 9/12/34(1)(9) | | 1,952 | 2,071,313 |
| Credit Agricole S.A., 1.247% to 1/26/26, 1/26/27(1)(9) | | 1,632 | 1,609,575 |
| Danske Bank A/S, 1.621% to 9/11/25, 9/11/26(1)(9) | | 3,504 | 3,505,853 |
| Discover Bank: | | | |
| 3.45%, 7/27/26 | | 2,745 | 2,977,611 |
| 4.682% to 8/9/23, 8/9/28(9) | | 2,672 | 2,843,339 |
| Enact Holdings, Inc., 6.50%, 8/15/25(1) | | 5,320 | 5,814,866 |
| EPR Properties, 3.75%, 8/15/29 | | 3,842 | 3,963,680 |
| Extra Space Storage, L.P., 2.55%, 6/1/31 | | 2,585 | 2,593,648 |
| Goldman Sachs Group, Inc. (The), 2.383% to 7/21/31, 7/21/32(9) | | 4,000 | 3,962,936 |
| HAT Holdings I, LLC/HAT Holdings II, LLC: | | | |
| 3.375%, 6/15/26(1) | | 2,750 | 2,794,687 |
| 3.75%, 9/15/30(1) | | 1,438 | 1,454,940 |
| 6.00%, 4/15/25(1) | | 193 | 201,926 |
| Iron Mountain, Inc.: | | | |
| 4.50%, 2/15/31(1) | | 4,752 | 4,825,894 |
| 5.00%, 7/15/28(1) | | 1,498 | 1,563,238 |
| Itau Unibanco Holding S.A., 3.875% to 1/15/26, 4/15/31(1)(9) | | 2,339 | 2,270,643 |
| JPMorgan Chase & Co.: | | | |
| 2.739% to 10/15/29, 10/15/30(9) | | 1,530 | 1,585,271 |
| 2.956% to 5/13/30, 5/13/31(9) | | 1,386 | 1,442,741 |
| 4.203% to 7/23/28, 7/23/29(9) | | 2,600 | 2,959,380 |
| Series S, 6.75% to 2/1/24(9)(10) | | 4,327 | 4,751,587 |
| KKR Group Finance Co. VII, LLC, 3.625%, 2/25/50(1) | | 2,450 | 2,637,992 |
| Liberty Mutual Group, Inc., 4.125% to 12/15/26, 12/15/51(1)(9) | | 3,866 | 3,975,262 |
| Lloyds Banking Group PLC, 2.438% to 2/5/25, 2/5/26(9) | | 1,642 | 1,704,191 |
| Macquarie Bank, Ltd.: | | | |
| 3.052% to 3/3/31, 3/3/36(1)(9) | | 5,184 | 5,137,124 |
| 3.624%, 6/3/30(1) | | 1,776 | 1,865,633 |
| MetLife, Inc., 4.05%, 3/1/45 | | 1,850 | 2,201,485 |
| Nationwide Building Society: | | | |
| 4.00%, 9/14/26(1) | | 2,435 | 2,677,990 |
| 4.125% to 10/18/27, 10/18/32(1)(9) | | 1,400 | 1,530,803 |
| Newmark Group, Inc., 6.125%, 11/15/23 | | 3,997 | 4,329,750 |
| OneMain Finance Corp., 3.50%, 1/15/27 | | 1,325 | 1,327,253 |
| Radian Group, Inc.: | | | |
| 4.875%, 3/15/27 | | 6,565 | 7,167,831 |
| 6.625%, 3/15/25 | | 1,344 | 1,501,920 |
| Regions Financial Corp., 5.75% to 6/15/25(7)(9)(10) | | 1,630 | 1,822,014 |
| Sabra Health Care, L.P., 3.20%, 12/1/31 | | 2,507 | 2,458,400 |
| Santander UK Group Holdings PLC, 1.532% to 8/21/25, 8/21/26(9) | | 4,317 | 4,310,092 |
| SITE Centers Corp., 3.625%, 2/1/25 | | 3,000 | 3,180,723 |
10
See Notes to Financial Statements.
Calvert
Income Fund
September 30, 2021
Schedule of Investments — continued
| Security | Principal
Amount
(000's omitted) | Value |
| Financial (continued) | |
| Societe Generale S.A.: | | | |
| 1.488% to 12/14/25, 12/14/26(1)(9) | $ | 3,400 | $ 3,363,464 |
| 4.75% to 5/26/26(1)(7)(9)(10) | | 1,229 | 1,258,963 |
| 5.375% to 11/18/30(1)(7)(9)(10) | | 1,859 | 1,994,949 |
| Standard Chartered PLC, 4.75%, 1/14/31(1)(7) | | 651 | 657,103 |
| Stifel Financial Corp., 4.00%, 5/15/30 | | 3,254 | 3,630,742 |
| Sun Communities Operating, L.P., 2.70%, 7/15/31(7) | | 839 | 848,689 |
| Synchrony Financial, 4.50%, 7/23/25 | | 1,263 | 1,395,289 |
| Synovus Bank/Columbus, GA: | | | |
| 2.289% to 2/10/22, 2/10/23(9) | | 2,150 | 2,159,668 |
| 4.00% to 10/29/25, 10/29/30(9) | | 2,376 | 2,490,271 |
| Synovus Financial Corp.: | | | |
| 3.125%, 11/1/22 | | 2,262 | 2,313,721 |
| 5.90% to 2/7/24, 2/7/29(9) | | 1,589 | 1,713,379 |
| Texas Capital Bancshares, Inc., 4.00% to 5/6/26, 5/6/31(9) | | 3,542 | 3,687,114 |
| Truist Financial Corp., 5.10% to 3/1/30(9)(10) | | 3,231 | 3,722,112 |
| UBS Group AG, 4.375% to 2/10/31(1)(9)(10) | | 3,883 | 3,932,314 |
| UniCredit SpA: | | | |
| 5.459% to 6/30/30, 6/30/35(1)(9) | | 995 | 1,098,631 |
| 5.861% to 6/19/27, 6/19/32(1)(9) | | 2,100 | 2,337,191 |
| Visa, Inc., 2.00%, 8/15/50 | | 2,390 | 2,063,779 |
| Vornado Realty L.P., 3.40%, 6/1/31 | | 1,079 | 1,117,880 |
| Welltower, Inc., 2.75%, 1/15/31 | | 1,245 | 1,284,611 |
| Westpac Banking Corp., 2.668% to 11/15/30, 11/15/35(9) | | 4,016 | 3,935,253 |
| | | | $260,612,359 |
| Industrial — 5.8% | |
| AP Moller - Maersk A/S, 4.50%, 6/20/29(1) | $ | 3,005 | $ 3,488,607 |
| Avnet, Inc., 3.00%, 5/15/31 | | 7,000 | 7,030,172 |
| FedEx Corp., 4.55%, 4/1/46 | | 3,625 | 4,292,874 |
| Flowserve Corp., 3.50%, 10/1/30 | | 1,561 | 1,631,849 |
| Hexcel Corp.: | | | |
| 4.20%, 2/15/27 | | 1,698 | 1,856,410 |
| 4.95%, 8/15/25 | | 807 | 894,481 |
| Imola Merger Corp., 4.75%, 5/15/29(1) | | 1,969 | 2,039,428 |
| Jabil, Inc., 3.00%, 1/15/31 | | 6,070 | 6,232,662 |
| Johnson Controls International PLC, 4.625%, 7/2/44 | | 1,275 | 1,552,430 |
| nVent Finance S.a.r.l.: | | | |
| 3.95%, 4/15/23 | | 1,094 | 1,138,771 |
| 4.55%, 4/15/28 | | 4,750 | 5,217,149 |
| Owens Corning: | | | |
| 3.95%, 8/15/29 | | 1,607 | 1,795,796 |
| 4.30%, 7/15/47 | | 1,391 | 1,606,138 |
| 4.40%, 1/30/48 | | 1,540 | 1,805,544 |
| Security | Principal
Amount
(000's omitted) | Value |
| Industrial (continued) | |
| Valmont Industries, Inc., 5.00%, 10/1/44 | $ | 4,100 | $ 5,061,497 |
| | | | $ 45,643,808 |
| Technology — 2.5% | |
| DXC Technology Co.: | | | |
| 1.80%, 9/15/26 | $ | 2,500 | $ 2,497,834 |
| 2.375%, 9/15/28 | | 1,575 | 1,557,293 |
| Microsoft Corp., 2.525%, 6/1/50 | | 1,965 | 1,894,127 |
| Oracle Corp., 3.60%, 4/1/40 | | 2,800 | 2,908,125 |
| Seagate HDD Cayman, 5.75%, 12/1/34(7) | | 6,113 | 7,159,851 |
| Western Digital Corp., 4.75%, 2/15/26 | | 3,187 | 3,533,650 |
| | | | $ 19,550,880 |
| Utilities — 5.6% | |
| AES Corp. (The), 2.45%, 1/15/31 | $ | 4,947 | $ 4,885,485 |
| American Water Capital Corp., Class C, 3.25%, 6/1/51 | | 3,600 | 3,733,141 |
| Clearway Energy Operating, LLC: | | | |
| 3.75%, 1/15/32(1)(8) | | 1,129 | 1,130,411 |
| 4.75%, 3/15/28(1) | | 1,953 | 2,069,887 |
| Consolidated Edison Co. of New York, Inc., 3.35%, 4/1/30 | | 2,882 | 3,156,926 |
| Enel Finance International NV, 3.625%, 5/25/27(1) | | 2,669 | 2,956,398 |
| Engie Energia Chile S.A., 3.40%, 1/28/30(1) | | 3,460 | 3,559,475 |
| MidAmerican Energy Co., 3.15%, 4/15/50 | | 1,650 | 1,731,639 |
| NextEra Energy Capital Holdings, Inc., 1.90%, 6/15/28 | | 920 | 921,158 |
| NextEra Energy Operating Partners, L.P.: | | | |
| 4.25%, 9/15/24(1) | | 136 | 143,977 |
| 4.50%, 9/15/27(1) | | 7,928 | 8,538,337 |
| Niagara Mohawk Power Corp., 1.96%, 6/27/30(1) | | 1,162 | 1,129,865 |
| Northern States Power Co., 2.60%, 6/1/51 | | 3,800 | 3,608,644 |
| Pattern Energy Operations, L.P./Pattern Energy Operations, Inc., 4.50%, 8/15/28(1) | | 3,374 | 3,521,613 |
| Terraform Global Operating, LLC, 6.125%, 3/1/26(1) | | 2,795 | 2,884,943 |
| | | | $ 43,971,899 |
Total Corporate Bonds
(identified cost $518,957,090) | | | $541,003,674 |
| High Social Impact Investments — 0.2% |
| Security | Principal
Amount
(000's omitted) | Value |
| Calvert Impact Capital, Inc., Community Investment Notes, 1.50%, 12/15/23(11)(12) | $ | 1,500 | $ 1,474,245 |
Total High Social Impact Investments
(identified cost $1,500,000) | | | $ 1,474,245 |
11
See Notes to Financial Statements.
Calvert
Income Fund
September 30, 2021
Schedule of Investments — continued
| Security | Shares | Value |
| Banks — 0.3% | |
| Wells Fargo & Co., 4.25%(7) | | 91,000 | $ 2,278,640 |
| | | | $ 2,278,640 |
| Capital Markets — 0.3% | |
| Stifel Financial Corp., 4.50%(7) | | 103,500 | $ 2,619,585 |
| | | | $ 2,619,585 |
| Mortgage Real Estate Investment Trusts (REITs) — 0.3% | |
| AGNC Investment Corp.: | | | |
| Series C, 7.00% to 10/15/22(9) | | 24,000 | $ 629,040 |
| Series F, 6.125% to 4/15/25(9) | | 75,710 | 1,910,920 |
| | | | $ 2,539,960 |
| Oil, Gas & Consumable Fuels — 0.5% | |
| NuStar Energy, L.P., Series B, 7.625% to 6/15/22(9) | | 169,688 | $ 3,609,264 |
| | | | $ 3,609,264 |
| Real Estate Management & Development — 0.9% | |
| Brookfield Property Partners, L.P.: | | | |
| Series A, 5.75% | | 73,000 | $ 1,713,310 |
| Series A2, 6.375%(7) | | 212,000 | 5,350,880 |
| | | | $ 7,064,190 |
| Wireless Telecommunication Services — 0.7% | |
| United States Cellular Corp.: | | | |
| 5.50% | | 109,600 | $ 2,897,824 |
| 6.25% | | 87,200 | 2,363,120 |
| | | | $ 5,260,944 |
Total Preferred Stocks
(identified cost $23,147,398) | | | $ 23,372,583 |
| Senior Floating-Rate Loans — 4.5%(13) |
| Borrower/Description | Principal
Amount
(000's omitted) | Value |
| Air Transport — 0.5% | |
| SkyMiles IP, Ltd., Term Loan, 4.75%, (3 mo. USD LIBOR + 3.75%, Floor 1.00%), 10/20/27 | $ | 3,900 | $ 4,151,792 |
| | | | $ 4,151,792 |
| Building and Development — 0.2% | |
| Cushman & Wakefield U.S. Borrower, LLC, Term Loan, 2.834%, (1 mo. USD LIBOR + 2.75%), 8/21/25 | $ | 1,240 | $ 1,231,340 |
| | | | $ 1,231,340 |
| Borrower/Description | Principal
Amount
(000's omitted) | Value |
| Cable and Satellite Television — 0.1% | |
| UPC Financing Partnership, Term Loan, 3.084%, (1 mo. USD LIBOR + 3.00%), 1/31/29 | $ | 600 | $ 599,375 |
| | | | $ 599,375 |
| Drugs — 0.2% | |
| PPD, Inc., Term Loan, 2.50%, (1 mo. USD LIBOR + 2.00%, Floor 0.50%), 1/13/28 | $ | 1,791 | $ 1,790,215 |
| | | | $ 1,790,215 |
| Electronics/Electrical — 1.4% | |
| Banff Merger Sub, Inc., Term Loan, 3.882%, (3 mo. USD LIBOR + 3.75%), 10/2/25 | $ | 2,664 | $ 2,652,328 |
| Hyland Software, Inc., Term Loan, 4.25%, (1 mo. USD LIBOR + 3.50%, Floor 0.75%), 7/1/24 | | 1,440 | 1,444,054 |
| MA FinanceCo., LLC, Term Loan, 2.834%, (1 mo. USD LIBOR + 2.75%), 6/21/24 | | 198 | 196,836 |
| Seattle Spinco, Inc., Term Loan, 2.834%, (1 mo. USD LIBOR + 2.75%), 6/21/24 | | 1,339 | 1,329,286 |
| SS&C European Holdings S.a.r.l., Term Loan, 1.834%, (1 mo. USD LIBOR + 1.75%), 4/16/25 | | 401 | 396,832 |
| SS&C Technologies, Inc., Term Loan, 1.834%, (1 mo. USD LIBOR + 1.75%), 4/16/25 | | 538 | 532,574 |
| Ultimate Software Group, Inc. (The), Term Loan, 3.834%, (1 mo. USD LIBOR + 3.75%), 5/4/26 | | 1,647 | 1,652,957 |
| VS Buyer, LLC, Term Loan, 3.084%, (1 mo. USD LIBOR + 3.00%), 2/28/27 | | 2,688 | 2,684,107 |
| | | | $ 10,888,974 |
| Equipment Leasing — 0.1% | |
| Avolon TLB Borrower 1 (US), LLC, Term Loan, 2.50%, (1 mo. USD LIBOR + 1.75%, Floor 0.75%), 1/15/25 | $ | 645 | $ 643,297 |
| | | | $ 643,297 |
| Health Care — 0.9% | |
| Change Healthcare Holdings, LLC, Term Loan, 3.50%, (USD LIBOR + 2.50%, Floor 1.00%), 3/1/24(14) | $ | 1,589 | $ 1,588,855 |
| ICON Luxembourg S.a.r.l.: | | | |
| Term Loan, 3.00%, (3 mo. USD LIBOR + 2.50%, Floor 0.50%), 7/3/28 | | 2,076 | 2,085,726 |
| Term Loan, 3.00%, (3 mo. USD LIBOR + 2.50%, Floor 0.50%), 7/3/28 | | 518 | 519,660 |
| Ortho-Clinical Diagnostics S.A., Term Loan, 3.083%, (1 mo. USD LIBOR + 3.00%), 6/30/25 | | 2,500 | 2,500,468 |
| | | | $ 6,694,709 |
12
See Notes to Financial Statements.
Calvert
Income Fund
September 30, 2021
Schedule of Investments — continued
| Borrower/Description | Principal
Amount
(000's omitted) | Value |
| Insurance — 0.5% | |
| Asurion, LLC: | | | |
| Term Loan, 3.209%, (1 mo. USD LIBOR + 3.13%), 11/3/23 | $ | 1,599 | $ 1,592,509 |
| Term Loan, 3.334%, (1 mo. USD LIBOR + 3.25%), 12/23/26 | | 883 | 871,271 |
| USI, Inc., Term Loan, 3.132%, (3 mo. USD LIBOR + 3.00%), 5/16/24 | | 1,647 | 1,638,023 |
| | | | $ 4,101,803 |
| Leisure Goods/Activities/Movies — 0.1% | |
| Bombardier Recreational Products, Inc., Term Loan, 2.084%, (1 mo. USD LIBOR + 2.00%), 5/24/27 | $ | 1,144 | $ 1,136,445 |
| | | | $ 1,136,445 |
| Telecommunications — 0.5% | |
| CenturyLink, Inc., Term Loan, 2.334%, (1 mo. USD LIBOR + 2.25%), 3/15/27 | $ | 1,662 | $ 1,646,292 |
| Level 3 Financing, Inc., Term Loan, 1.834%, (1 mo. USD LIBOR + 1.75%), 3/1/27 | | 412 | 407,094 |
| Ziggo Financing Partnership, Term Loan, 2.584%, (1 mo. USD LIBOR + 2.50%), 4/30/28 | | 1,680 | 1,668,450 |
| | | | $ 3,721,836 |
Total Senior Floating-Rate Loans
(identified cost $34,940,199) | | | $ 34,959,786 |
| Taxable Municipal Obligations — 0.4% |
| Security | Principal
Amount
(000's omitted) | Value |
| Special Tax Revenue — 0.2% | |
| California Health Facilities Financing Authority, (No Place Like Home Program): | | | |
| 2.984%, 6/1/33 | $ | 1,000 | $ 1,065,140 |
| 3.034%, 6/1/34 | | 720 | 766,491 |
| | | | $ 1,831,631 |
| Water and Sewer — 0.2% | |
| San Diego County Water Authority, CA, Green Bonds, 1.951%, 5/1/34 | $ | 1,120 | $ 1,107,624 |
| | | | $ 1,107,624 |
Total Taxable Municipal Obligations
(identified cost $2,840,000) | | | $ 2,939,255 |
| U.S. Treasury Obligations — 3.8% |
| Security | Principal
Amount
(000's omitted) | Value |
| U.S. Treasury Bonds: | | | |
| 1.125%, 8/15/40 | $ | 3,166 | $ 2,725,481 |
| 1.375%, 11/15/40 | | 647 | 581,390 |
| 1.75%, 8/15/41 | | 5,353 | 5,118,806 |
| 2.00%, 8/15/51 | | 5,391 | 5,296,658 |
| 2.25%, 5/15/41 | | 5,166 | 5,373,447 |
| 2.375%, 5/15/51 | | 4,770 | 5,091,975 |
| U.S. Treasury Notes: | | | |
| 0.25%, 5/15/24 | | 4,758 | 4,735,511 |
| 0.625%, 7/31/26 | | 650 | 639,641 |
Total U.S. Treasury Obligations
(identified cost $30,225,026) | | | $ 29,562,909 |
| Short-Term Investments — 3.2% | | | |
| Affiliated Fund — 1.1% |
| Description | Units | Value |
| Calvert Cash Reserves Fund, LLC, 0.04%(15) | | 8,597,689 | $ 8,598,549 |
Total Affiliated Fund
(identified cost $8,597,689) | | | $ 8,598,549 |
| Securities Lending Collateral — 2.1% |
| Security | Shares | Value |
| State Street Navigator Securities Lending Government Money Market Portfolio, 0.03%(16) | | 16,976,103 | $ 16,976,103 |
Total Securities Lending Collateral
(identified cost $16,976,103) | | | $ 16,976,103 |
Total Short-Term Investments
(identified cost $25,573,792) | | | $ 25,574,652 |
Total Investments — 101.2%
(identified cost $772,729,473) | | | $793,569,673 |
| Other Assets, Less Liabilities — (1.2)% | | | $ (9,755,229) |
| Net Assets — 100.0% | | | $ 783,814,444 |
13
See Notes to Financial Statements.
Calvert
Income Fund
September 30, 2021
Schedule of Investments — continued
| The percentage shown for each investment category in the Schedule of Investments is based on net assets. |
| (1) | Security exempt from registration under Rule 144A of the Securities Act of 1933, as amended. These securities may be sold in certain transactions in reliance on an exemption from registration (normally to qualified institutional buyers). At September 30, 2021, the aggregate value of these securities is $281,140,214 or 35.9% of the Fund's net assets. |
| (2) | Variable rate security. The stated interest rate represents the rate in effect at September 30, 2021. |
| (3) | Step coupon security. Interest rate represents the rate in effect at
September 30, 2021. |
| (4) | Weighted average fixed-rate coupon that changes/updates monthly. Rate shown is the rate at September 30, 2021. |
| (5) | Represents an investment in an issuer that may be deemed to be an affiliate effective March 1, 2021 (see Note 8). |
| (6) | Security exempt from registration under Regulation S of the Securities Act of 1933, as amended, which exempts from registration securities offered and sold outside the United States. Security may not be offered or sold in the United States except pursuant to an exemption from, or in a transaction not subject to, the registration requirements of the Securities Act of 1933, as amended. At September 30, 2021, the aggregate value of these securities is $4,092,371 or 0.5% of the Fund's net assets. |
| (7) | All or a portion of this security was on loan at September 30, 2021. The aggregate market value of securities on loan at September 30, 2021 was $26,764,871. |
| (8) | When-issued security. |
| (9) | Security converts to variable rate after the indicated fixed-rate coupon period. |
| (10) | Perpetual security with no stated maturity date but may be subject to calls by the issuer. |
| (11) | May be deemed to be an affiliated company (see Note 8). |
| (12) | Restricted security. Total market value of restricted securities amounts to $1,474,245, which represents 0.2% of the net assets of the Fund as of September 30, 2021. |
| (13) | Senior floating-rate loans (Senior Loans) often require prepayments from excess cash flows or permit the borrowers to repay at their election. The degree to which borrowers repay, whether as a contractual requirement or at their election, cannot be predicted with accuracy. As a result, the actual remaining maturity may be substantially less than the stated maturities shown. However, Senior Loans will typically have an expected average life of approximately two to four years. Senior Loans typically have rates of interest which are redetermined periodically by reference to a base lending rate, plus a spread. These base lending rates are primarily the London Interbank Offered Rate ("LIBOR") and secondarily, the prime rate offered by one or more major United States banks (the "Prime Rate"). Base lending rates may be subject to a floor, or minimum rate. Senior Loans are generally subject to contractual restrictions that must be satisfied before they can be bought or sold. |
| (14) | The stated interest rate represents the weighted average interest rate at September 30, 2021 of contracts within the senior loan facility. Interest rates on contracts are primarily redetermined either weekly, monthly or quarterly by reference to the indicated base lending rate and spread and the reset period. |
| (15) | Affiliated investment company, available to Calvert portfolios and funds, which invests in high quality, U.S. dollar denominated money market instruments. The rate shown is the annualized seven-day yield as of September 30, 2021. |
| (16) | Represents investment of cash collateral received in connection with securities lending. |
Futures Contracts
| Description | Number of
Contracts | Position | Expiration
Date | Notional
Amount | Value/
Unrealized
Appreciation
(Depreciation) |
| Interest Rate Futures | | | | | |
| U.S. 2-Year Treasury Note | 168 | Long | 12/31/21 | $ 36,969,188 | $ (33,897) |
| U.S. 10-Year Treasury Note | 76 | Long | 12/21/21 | 10,002,312 | (108,795) |
| U.S. Ultra-Long Treasury Bond | 74 | Long | 12/21/21 | 14,138,625 | (679,030) |
| U.S. Ultra 10-Year Treasury Note | (193) | Short | 12/21/21 | (28,033,250) | 433,176 |
| | | | | | $(388,546) |
Restricted Securities
| Description | Acquisition Date | Cost |
| Calvert Impact Capital, Inc., Community Investment Notes, 1.50%, 12/15/23 | 12/14/20 | $1,500,000 |
14
See Notes to Financial Statements.
Calvert
Income Fund
September 30, 2021
Schedule of Investments — continued
| Abbreviations: |
| LIBOR | – London Interbank Offered Rate |
| SOFR | – Secured Overnight Financing Rate |
| Currency Abbreviations: |
| USD | – United States Dollar |
15
See Notes to Financial Statements.
Calvert
Income Fund
September 30, 2021
Statement of Assets and Liabilities
| | September 30, 2021 |
| Assets | |
Investments in securities of unaffiliated issuers, at value (identified cost $753,129,476) - including
$26,764,871 of securities on loan | $ 774,505,775 |
| Investments in securities of affiliated issuers, at value (identified cost $19,599,997) | 19,063,898 |
| Cash | 2,740,886 |
| Deposits at broker for futures contracts | 1,220,004 |
| Receivable for investments sold | 12,233,372 |
| Receivable for capital shares sold | 2,507,276 |
| Dividends and interest receivable | 4,987,696 |
| Dividends and interest receivable - affiliated | 29,121 |
| Securities lending income receivable | 5,871 |
| Trustees' deferred compensation plan | 438,755 |
| Total assets | $ 817,732,654 |
| Liabilities | |
| Payable for variation margin on open futures contracts | $ 27,521 |
| Payable for investments purchased | 13,040,174 |
| Payable for when-issued securities | 1,952,951 |
| Payable for capital shares redeemed | 763,735 |
| Distributions payable | 87,571 |
| Deposits for securities loaned | 16,976,103 |
| Payable to affiliates: | |
| Investment advisory fee | 257,212 |
| Administrative fee | 77,164 |
| Distribution and service fees | 63,557 |
| Sub-transfer agency fee | 13,622 |
| Trustees' deferred compensation plan | 438,755 |
| Accrued expenses | 219,845 |
| Total liabilities | $ 33,918,210 |
| Net Assets | $ 783,814,444 |
| Sources of Net Assets | |
| Paid-in capital | $ 960,551,135 |
| Accumulated loss | (176,736,691) |
| Total | $ 783,814,444 |
| Class A Shares | |
| Net Assets | $ 272,840,266 |
| Shares Outstanding | 15,175,828 |
Net Asset Value and Redemption Price Per Share
(net assets ÷ shares of beneficial interest outstanding) | $ 17.98 |
Maximum Offering Price Per Share
(100 ÷ 96.25 of net asset value per share) | $ 18.68 |
| Class C Shares | |
| Net Assets | $ 8,217,878 |
| Shares Outstanding | 457,492 |
Net Asset Value and Offering Price Per Share*
(net assets ÷ shares of beneficial interest outstanding) | $ 17.96 |
16
See Notes to Financial Statements.
Calvert
Income Fund
September 30, 2021
Statement of Assets and Liabilities — continued
| | September 30, 2021 |
| Class I Shares | |
| Net Assets | $502,756,300 |
| Shares Outstanding | 27,899,293 |
Net Asset Value, Offering Price and Redemption Price Per Share
(net assets ÷ shares of beneficial interest outstanding) | $ 18.02 |
| On sales of $50,000 or more, the offering price of Class A shares is reduced. |
| * | Redemption price per share is equal to the net asset value less any applicable contingent deferred sales charge. |
17
See Notes to Financial Statements.
Calvert
Income Fund
September 30, 2021
| | Year Ended |
| | September 30, 2021 |
| Investment Income | |
| Dividend income (net of foreign taxes withheld of $1,649) | $ 1,387,713 |
| Dividend income - affiliated issuers | 14,966 |
| Interest and other income (net of foreign taxes withheld of $80) | 24,284,006 |
| Interest income - affiliated issuers | 161,157 |
| Securities lending income, net | 40,863 |
| Total investment income | $25,888,705 |
| Expenses | |
| Investment advisory fee | $ 2,832,154 |
| Administrative fee | 849,646 |
| Distribution and service fees: | |
| Class A | 690,400 |
| Class C | 85,954 |
| Trustees' fees and expenses | 37,161 |
| Custodian fees | 21,455 |
| Transfer agency fees and expenses | 622,601 |
| Accounting fees | 159,428 |
| Professional fees | 45,776 |
| Registration fees | 83,908 |
| Reports to shareholders | 45,273 |
| Miscellaneous | 34,644 |
| Total expenses | $ 5,508,400 |
| Net investment income | $20,380,305 |
| Realized and Unrealized Gain (Loss) | |
| Net realized gain (loss): | |
| Investment securities | $ 10,438,223 |
| Investment securities - affiliated issuers | (1,192) |
| Futures contracts | (2,393,184) |
| Foreign currency transactions | 3,300 |
| Forward foreign currency exchange contracts | (28,019) |
| Net realized gain | $ 8,019,128 |
| Change in unrealized appreciation (depreciation): | |
| Investment securities | $ 14,368,546 |
| Investment securities - affiliated issuers | 394,635 |
| Futures contracts | (116,860) |
| Foreign currency | (709) |
| Forward foreign currency exchange contracts | (9,573) |
| Net change in unrealized appreciation (depreciation) | $14,636,039 |
| Net realized and unrealized gain | $22,655,167 |
| Net increase in net assets from operations | $43,035,472 |
18
See Notes to Financial Statements.
Calvert
Income Fund
September 30, 2021
Statements of Changes in Net Assets
| | Year Ended September 30, |
| | 2021 | 2020 |
| Increase (Decrease) in Net Assets | | |
| From operations: | | |
| Net investment income | $ 20,380,305 | $ 19,672,254 |
| Net realized gain | 8,019,128 | 19,874,297 |
| Net change in unrealized appreciation (depreciation) | 14,636,039 | (12,093,165) |
| Net increase in net assets from operations | $ 43,035,472 | $ 27,453,386 |
| Distributions to shareholders: | | |
| Class A | $ (7,628,488) | $ (8,649,907) |
| Class C | (172,704) | (265,133) |
| Class I | (12,707,902) | (10,263,439) |
| Total distributions to shareholders | $ (20,509,094) | $ (19,178,479) |
| Tax return of capital to shareholders: | | |
| Class A | $ — | $ (239,578) |
| Class C | — | (7,201) |
| Class I | — | (296,518) |
| Total tax return of capital to shareholders | $ — | $ (543,297) |
| Capital share transactions: | | |
| Class A | $ (14,278,394) | $ (6,010,294) |
| Class C | (1,755,697) | (2,039,859) |
| Class I | 138,705,160 | 80,199,795 |
| Net increase in net assets from capital share transactions | $122,671,069 | $ 72,149,642 |
| Net increase in net assets | $145,197,447 | $ 79,881,252 |
| Net Assets | | |
| At beginning of year | $ 638,616,997 | $ 558,735,745 |
| At end of year | $783,814,444 | $638,616,997 |
19
See Notes to Financial Statements.
Calvert
Income Fund
September 30, 2021
| | Class A |
| | Year Ended September 30, |
| | 2021 | 2020 | 2019 | 2018 | 2017 |
| Net asset value — Beginning of year | $ 17.37 | $ 17.11 | $ 15.91 | $ 16.55 | $ 16.68 |
| Income (Loss) From Operations | | | | | |
| Net investment income(1) | $ 0.49 | $ 0.55 | $ 0.56 | $ 0.51 | $ 0.51 |
| Net realized and unrealized gain (loss) | 0.61 | 0.26 | 1.22 | (0.64) | (0.13) |
| Total income (loss) from operations | $ 1.10 | $ 0.81 | $ 1.78 | $ (0.13) | $ 0.38 |
| Less Distributions | | | | | |
| From net investment income | $ (0.49) | $ (0.54) | $ (0.58) | $ (0.51) | $ (0.51) |
| Tax return of capital | — | (0.01) | — | — | — |
| Total distributions | $ (0.49) | $ (0.55) | $ (0.58) | $ (0.51) | $ (0.51) |
| Net asset value — End of year | $ 17.98 | $ 17.37 | $ 17.11 | $ 15.91 | $ 16.55 |
| Total Return(2) | 6.41% | 4.83% | 11.45% | (0.79)% | 2.35% |
| Ratios/Supplemental Data | | | | | |
| Net assets, end of year (000’s omitted) | $272,840 | $277,617 | $279,886 | $264,987 | $312,318 |
| Ratios (as a percentage of average daily net assets):(3) | | | | | |
| Total expenses | 0.92% | 0.94% | 0.97% | 0.98% | 1.04% |
| Net expenses | 0.92% | 0.94% | 0.96% | 0.98% | 1.01% |
| Net investment income | 2.75% | 3.21% | 3.47% | 3.17% | 3.11% |
| Portfolio Turnover | 48% | 74% | 57% | 66% | 76% |
| (1) | Computed using average shares outstanding. |
| (2) | Returns are historical and are calculated by determining the percentage change in net asset value with all distributions reinvested and do not reflect the effect of sales charges, if any. |
| (3) | Total expenses do not reflect amounts reimbursed and/or waived by the adviser and certain of its affiliates, if applicable. Net expenses are net of all reductions and represent the net expenses paid by the Fund. |
20
See Notes to Financial Statements.
Calvert
Income Fund
September 30, 2021
Financial Highlights — continued
| | Class C |
| | Year Ended September 30, |
| | 2021 | 2020 | 2019 | 2018 | 2017 |
| Net asset value — Beginning of year | $ 17.36 | $ 17.10 | $ 15.91 | $ 16.55 | $ 16.68 |
| Income (Loss) From Operations | | | | | |
| Net investment income(1) | $ 0.35 | $ 0.42 | $ 0.44 | $ 0.39 | $ 0.38 |
| Net realized and unrealized gain (loss) | 0.61 | 0.26 | 1.22 | (0.64) | (0.13) |
| Total income (loss) from operations | $ 0.96 | $ 0.68 | $ 1.66 | $ (0.25) | $ 0.25 |
| Less Distributions | | | | | |
| From net investment income | $ (0.36) | $ (0.41) | $ (0.47) | $ (0.39) | $ (0.38) |
| Tax return of capital | — | (0.01) | — | — | — |
| Total distributions | $ (0.36) | $ (0.42) | $ (0.47) | $ (0.39) | $ (0.38) |
| Net asset value — End of year | $17.96 | $17.36 | $ 17.10 | $ 15.91 | $ 16.55 |
| Total Return(2) | 5.55% | 4.06% | 10.65% | (1.54)% | 1.54% |
| Ratios/Supplemental Data | | | | | |
| Net assets, end of year (000’s omitted) | $ 8,218 | $ 9,655 | $11,623 | $37,072 | $53,549 |
| Ratios (as a percentage of average daily net assets):(3) | | | | | |
| Total expenses | 1.67% | 1.69% | 1.73% | 1.74% | 1.80% |
| Net expenses | 1.67% | 1.69% | 1.72% | 1.74% | 1.80% |
| Net investment income | 1.99% | 2.46% | 2.78% | 2.40% | 2.34% |
| Portfolio Turnover | 48% | 74% | 57% | 66% | 76% |
| (1) | Computed using average shares outstanding. |
| (2) | Returns are historical and are calculated by determining the percentage change in net asset value with all distributions reinvested and do not reflect the effect of sales charges, if any. |
| (3) | Total expenses do not reflect amounts reimbursed and/or waived by the adviser and certain of its affiliates, if applicable. Net expenses are net of all reductions and represent the net expenses paid by the Fund. |
21
See Notes to Financial Statements.
Calvert
Income Fund
September 30, 2021
Financial Highlights — continued
| | Class I |
| | Year Ended September 30, |
| | 2021 | 2020 | 2019 | 2018 | 2017 |
| Net asset value — Beginning of year | $ 17.41 | $ 17.16 | $ 15.94 | $ 16.57 | $ 16.70 |
| Income (Loss) From Operations | | | | | |
| Net investment income(1) | $ 0.53 | $ 0.59 | $ 0.61 | $ 0.58 | $ 0.57 |
| Net realized and unrealized gain (loss) | 0.62 | 0.25 | 1.23 | (0.66) | (0.13) |
| Total income (loss) from operations | $ 1.15 | $ 0.84 | $ 1.84 | $ (0.08) | $ 0.44 |
| Less Distributions | | | | | |
| From net investment income | $ (0.54) | $ (0.57) | $ (0.62) | $ (0.55) | $ (0.57) |
| Tax return of capital | — | (0.02) | — | — | — |
| Total distributions | $ (0.54) | $ (0.59) | $ (0.62) | $ (0.55) | $ (0.57) |
| Net asset value — End of year | $ 18.02 | $ 17.41 | $ 17.16 | $ 15.94 | $ 16.57 |
| Total Return(2) | 6.66% | 5.03% | 11.81% | (0.48)% | 2.76% |
| Ratios/Supplemental Data | | | | | |
| Net assets, end of year (000’s omitted) | $502,756 | $351,345 | $267,226 | $199,288 | $48,504 |
| Ratios (as a percentage of average daily net assets):(3) | | | | | |
| Total expenses | 0.67% | 0.69% | 0.72% | 0.72% | 0.64% |
| Net expenses | 0.67% | 0.69% | 0.68% | 0.64% | 0.62% |
| Net investment income | 2.98% | 3.45% | 3.74% | 3.58% | 3.49% |
| Portfolio Turnover | 48% | 74% | 57% | 66% | 76% |
| (1) | Computed using average shares outstanding. |
| (2) | Returns are historical and are calculated by determining the percentage change in net asset value with all distributions reinvested and do not reflect the effect of sales charges, if any. |
| (3) | Total expenses do not reflect amounts reimbursed and/or waived by the adviser and certain of its affiliates, if applicable. Net expenses are net of all reductions and represent the net expenses paid by the Fund. |
22
See Notes to Financial Statements.
Calvert
Income Fund
September 30, 2021
Notes to Financial Statements
1 Significant Accounting Policies
Calvert Income Fund (the Fund) is a diversified series of The Calvert Fund (the Trust). The Trust is a Massachusetts business trust registered under the Investment Company Act of 1940, as amended (the 1940 Act), as an open-end management investment company. The investment objective of the Fund is to seek to maximize income, to the extent consistent with preservation of capital, through investment in bonds and income-producing securities. The Fund invests primarily in investment grade, U.S. dollar-denominated debt securities.
The Fund offers three classes of shares. Class A shares are generally sold subject to a sales charge imposed at time of purchase. A contingent deferred sales charge of 0.80% may apply to certain redemptions of Class A shares for accounts for which no sales charge was paid, if redeemed within 12 months of purchase. Class C shares are sold without a front-end sales charge, and with certain exceptions, are charged a contingent deferred sales charge of 1% on shares redeemed within 12 months of purchase. Class C shares are only available for purchase through a financial intermediary. Effective January 25, 2019, Class C shares generally automatically convert to Class A shares ten years after their purchase and, effective November 5, 2020, automatically convert to Class A shares eight years after their purchase as described in the Fund's prospectus. Class I shares are sold at net asset value, are not subject to a sales charge and are sold only to certain eligible investors. Each class represents a pro rata interest in the Fund, but votes separately on class-specific matters and is subject to different expenses.
The Fund applies the accounting and reporting guidance in the Financial Accounting Standards Board (FASB) Accounting Standards Codification Topic 946, Financial Services – Investment Companies (ASC 946). Subsequent events, if any, through the date that the financial statements were issued have been evaluated in the preparation of the financial statements.
A Investment Valuation— Net asset value per share is determined every business day as of the close of the regular session of the New York Stock Exchange (generally 4:00 p.m. Eastern time). The Fund uses independent pricing services approved by the Board of Trustees (the Board) to value its investments wherever possible. Investments for which market quotations are not available or deemed not reliable are fair valued in good faith under the direction of the Board.
U.S. generally accepted accounting principles (U.S. GAAP) establishes a disclosure hierarchy that categorizes the inputs to valuation techniques used to value assets and liabilities at measurement date. These inputs are summarized in the three broad levels listed below:
Level 1 - quoted prices in active markets for identical securities
Level 2 - other significant observable inputs (including quoted prices for similar securities, interest rates, prepayment speeds, credit risk, etc.)
Level 3 - significant unobservable inputs (including the Fund’s own assumptions in determining the fair value of investments)
The inputs or methodologies used for valuing securities are not necessarily an indication of the risk associated with investing in those securities.
Valuation techniques used to value the Fund’s investments by major category are as follows:
Equity Securities. Equity securities (including warrants and rights) listed on a U.S. securities exchange generally are valued at the last sale or closing price as reported by an independent pricing service on the primary market or exchange on which they are traded and are categorized as Level 1 in the hierarchy. Equity securities listed on the NASDAQ National Market System are valued at the NASDAQ official closing price and are categorized as Level 1 in the hierarchy. Unlisted or listed securities for which closing sales prices or closing quotations are not available are valued at the mean between the latest available bid and ask prices and are categorized as Level 2 in the hierarchy.
Debt Securities. Debt securities are generally valued based on valuations provided by third party pricing services, as derived from such services’ pricing models. Inputs to the models may include, but are not limited to, reported trades, executable bid and ask prices, broker/dealer quotations, prices or yields of securities with similar characteristics, interest rates, anticipated prepayments, benchmark curves or information pertaining to the issuer, as well as industry and economic events. Accordingly, debt securities are generally categorized as Level 2 in the hierarchy. Short-term debt securities with a remaining maturity at time of purchase of more than sixty days are valued based on valuations provided by a third party pricing service. Such securities are generally categorized as Level 2 in the hierarchy. Short-term debt securities of sufficient credit quality purchased with remaining maturities of sixty days or less for which a valuation from a third party pricing service is not readily available may be valued at amortized cost, which approximates fair value, and are categorized as Level 2 in the hierarchy.
Senior Floating-Rate Loans. Interests in senior floating-rate loans for which reliable market quotations are readily available are valued generally at the average mean of bid and ask quotations obtained from a third party pricing service, and are categorized as Level 2 in the hierarchy.
Affiliated Fund. The Fund may invest in Calvert Cash Reserves Fund, LLC (Cash Reserves Fund), an affiliated investment company managed by Calvert Research and Management (CRM). While Cash Reserves Fund is not a registered money market mutual fund, it conducts all of its investment activities in accordance with the requirements of Rule 2a-7 under the 1940 Act. Investments in Cash Reserves Fund are valued at the closing net asset value per unit on the valuation day and are categorized as Level 2 in the hierarchy. Cash Reserves Fund generally values its investment securities based on available market quotations provided by a third party pricing service.
Other Securities. Investments in registered investment companies (including money market funds) that do not trade on an exchange are valued at the net asset value per share on the valuation day and are categorized as Level 1 in the hierarchy.
Calvert
Income Fund
September 30, 2021
Notes to Financial Statements — continued
Derivatives. Futures contracts are valued at unrealized appreciation (depreciation) based on the settlement price established each day by the board of trade or exchange on which they are traded and are categorized as Level 1 in the hierarchy. Forward foreign currency exchange contracts are generally valued at the mean of the average bid and average ask prices that are reported by currency dealers to a third party pricing service at the valuation time. Such third party pricing service valuations are supplied for specific settlement periods and the Fund's forward foreign currency exchange contracts are valued at an interpolated rate between the closest preceding and subsequent settlement period reported by the third party pricing service and are categorized as Level 2 in the hierarchy.
Fair Valuation. If a market value cannot be determined for a security using the methodologies described above, or if, in the good faith opinion of the Fund's adviser, the market value does not constitute a readily available market quotation, or if a significant event has occurred that would materially affect the value of the security, the security will be fair valued as determined in good faith by or at the direction of the Board in a manner that most fairly reflects the security’s “fair value”, which is the amount that the Fund might reasonably expect to receive for the security upon its current sale in the ordinary course. Each such determination is based on a consideration of relevant factors, which are likely to vary from one pricing context to another. These factors may include, but are not limited to, the type of security, the existence of any contractual restrictions on the security’s disposition, the price and extent of public trading in similar securities of the issuer or of comparable companies or entities, quotations or relevant information obtained from broker/dealers or other market participants, information obtained from the issuer, analysts, and/or the appropriate stock exchange (for exchange-traded securities), an analysis of the company’s or entity’s financial statements, and an evaluation of the forces that influence the issuer and the market(s) in which the security is purchased and sold.
The values assigned to fair value investments are based on available information and do not necessarily represent amounts that might ultimately be realized. Further, due to the inherent uncertainty of valuations of such investments, the fair values may differ significantly from the values that would have been used had an active market existed, and the differences could be material.
The following table summarizes the market value of the Fund's holdings as of September 30, 2021, based on the inputs used to value them:
| Asset Description | Level 1 | Level 2 | Level 3 | Total |
| Asset-Backed Securities | $ — | $ 68,760,266 | $ — | $ 68,760,266 |
| Collateralized Mortgage Obligations | — | 21,970,227 | — | 21,970,227 |
| Commercial Mortgage-Backed Securities | — | 40,164,120 | — | 40,164,120 |
| Common Stocks | 1,824,616 | — | — | 1,824,616 |
| Convertible Bonds | — | 1,963,340 | — | 1,963,340 |
| Corporate Bonds | — | 541,003,674 | — | 541,003,674 |
| High Social Impact Investments | — | 1,474,245 | — | 1,474,245 |
| Preferred Stocks | 23,372,583 | — | — | 23,372,583 |
| Senior Floating-Rate Loans | — | 34,959,786 | — | 34,959,786 |
| Taxable Municipal Obligations | — | 2,939,255 | — | 2,939,255 |
| U.S. Treasury Obligations | — | 29,562,909 | — | 29,562,909 |
| Short-Term Investments: | | | | |
| Affiliated Fund | — | 8,598,549 | — | 8,598,549 |
| Securities Lending Collateral | 16,976,103 | — | — | 16,976,103 |
| Total Investments | $42,173,302 | $751,396,371 | $ — | $793,569,673 |
| Futures Contracts | $ 433,176 | $ — | $ — | $ 433,176 |
| Total | $42,606,478 | $751,396,371 | $ — | $794,002,849 |
| Liability Description | | | | |
| Futures Contracts | $ (821,722) | $ — | $ — | $ (821,722) |
| Total | $ (821,722) | $ — | $ — | $ (821,722) |
B Investment Transactions and Income— Investment transactions for financial statement purposes are accounted for on trade date. Realized gains and losses are recorded on an identified cost basis and may include proceeds from litigation. Dividend income is recorded on the ex-dividend date for dividends received in cash and/or securities. Non-cash dividends are recorded at the fair value of the securities received. Withholding taxes on foreign dividends and interest, if any, have been provided for in accordance with the Fund's understanding of the applicable country’s tax rules and rates. Distributions received that represent a return of capital are recorded as a reduction of cost of investments. Distributions received that represent a capital gain are recorded as a
Calvert
Income Fund
September 30, 2021
Notes to Financial Statements — continued
realized gain. Interest income, which includes amortization of premium and accretion of discount on debt securities, is accrued as earned. The Fund may earn certain fees in connection with its investments in senior floating-rate loans. These fees are in addition to interest payments earned and may include amendment fees, consent fees and prepayment fees, which are recorded to income as earned. Inflation adjustments to the principal amount of inflation-adjusted bonds and notes are reflected as interest income.
C Share Class Accounting— Realized and unrealized gains and losses are allocated daily to each class of shares based upon the relative net assets of each class to the total net assets of the Fund. Net investment income, other than class-specific expenses, is allocated daily to each class of shares based upon the ratio of the value of each class's paid shares to the total value of all paid shares. Expenses arising in connection with a specific class are charged directly to that class.
D Foreign Currency Transactions— The Fund’s accounting records are maintained in U.S. dollars. For valuation of assets and liabilities on each date of net asset value determination, foreign denominations are converted into U.S. dollars using the current exchange rate. Security transactions, income and expenses are translated at the prevailing rate of exchange on the date of the event. Recognized gains or losses on investment transactions attributable to changes in foreign currency exchange rates are recorded for financial statement purposes as net realized gains and losses on investments. That portion of unrealized gains and losses on investments that results from fluctuations in foreign currency exchange rates is not separately disclosed.
E Restricted Securities— The Fund may invest in securities that are subject to legal or contractual restrictions on resale. Generally, these securities may only be sold publicly upon registration under the Securities Act of 1933 or in transactions exempt from such registration. Information regarding restricted securities (excluding Rule 144A securities) is included at the end of the Schedule of Investments.
F Senior Floating-Rate Loans— The Fund may invest in direct debt instruments, which are interests in amounts owed to lenders or lending syndicates by corporate, governmental, or other borrowers. The Fund’s investment in loans may be in the form of participations in loans or assignments of all or a portion of loans from third parties. A loan is often administered by a bank or other financial institution (the lender) that acts as agent for all holders. The agent administers the terms of the loan, as specified in the loan agreement. The Fund may invest in multiple series or tranches of a loan, which may have varying terms and carry different associated risks. When the Fund purchases assignments from lenders, it acquires direct rights against the borrower of the loan. When investing in a loan participation, the Fund has the right to receive payments of principal, interest and any fees to which it is entitled only from the lender selling the loan agreement and only upon receipt of such payments by the lender from the borrower. The Fund generally has no right to enforce compliance by the borrower with the terms of the loan agreement. As a result, the Fund may be subject to the credit risk of both the borrower and the lender that is issuing the participation interest.
G Futures Contracts— The Fund may enter into futures contracts to buy or sell a financial instrument for a set price at a future date. Initial margin deposits of either cash or securities as required by the broker are made upon entering into the contract. While the contract is open, daily variation margin payments are made to or received from the broker reflecting the daily change in market value of the contract and are recorded for financial reporting purposes as unrealized gains or losses by the Fund. When a futures contract is closed, a realized gain or loss is recorded equal to the difference between the opening and closing value of the contract. The risks associated with entering into futures contracts may include the possible illiquidity of the secondary market which would limit the Fund’s ability to close out a futures contract prior to the settlement date, an imperfect correlation between the value of the contracts and the underlying financial instruments, or that the counterparty will fail to perform its obligations under the contracts’ terms. Futures contracts are designed by boards of trade, which are designated “contracts markets” by the Commodities Futures Trading Commission. Futures contracts trade on the contracts markets in a manner that is similar to the way a stock trades on a stock exchange, and the boards of trade, through their clearing corporations, guarantee the futures contracts against default. As a result, there is minimal counterparty credit risk to the Fund.
H Forward Foreign Currency Exchange Contracts— The Fund may enter into forward foreign currency exchange contracts for the purchase or sale of a specific foreign currency at a fixed price on a future date. The forward foreign currency exchange contracts are adjusted by the daily exchange rate of the underlying currency and any gains or losses are recorded as unrealized until such time as the contracts have been closed. Risks may arise upon entering these contracts from the potential inability of counterparties to meet the terms of their contracts and from movements in the value of a foreign currency relative to the U.S. dollar.
I Distributions to Shareholders— Distributions to shareholders are recorded by the Fund on ex-dividend date. The Fund declares income distributions daily to shareholders of record at the time of declaration and generally pays them monthly. The Fund makes distributions of net realized capital gains, if any, at least annually. Distributions are declared separately for each class of shares. Distributions are determined in accordance with income tax regulations, which may differ from U.S. GAAP; accordingly, periodic reclassifications are made within the Fund’s capital accounts to reflect income and gains available for distribution under income tax regulations.
J Estimates— The preparation of financial statements in conformity with U.S. GAAP requires management to make estimates and assumptions that affect the reported amounts of assets and liabilities and disclosure of contingent assets and liabilities at the date of the financial statements and the reported amounts of increases and decreases in net assets from operations during the reporting period. Actual results could differ from those estimates.
K Indemnifications— Under the Trust’s organizational document, its officers and Trustees may be indemnified against certain liabilities and expenses arising out of the performance of their duties to the Fund. Under Massachusetts law, if certain conditions prevail, shareholders of a Massachusetts business
Calvert
Income Fund
September 30, 2021
Notes to Financial Statements — continued
trust (such as the Trust) could be deemed to have personal liability for the obligations of the Trust. However, the Trust’s Declaration of Trust contains an express disclaimer of liability on the part of Fund shareholders and provides that the Trust shall assume, upon request by the shareholder, the defense on behalf of any Fund shareholders or former shareholders. Additionally, in the normal course of business, the Fund enters into agreements with service providers that may contain indemnification clauses. The Fund’s maximum exposure under these arrangements is unknown as this would involve future claims that may be made against the Fund that have not yet occurred.
L Federal Income Taxes— No provision for federal income or excise tax is required since the Fund intends to continue to qualify as a regulated investment company under the Internal Revenue Code and to distribute substantially all of its taxable earnings.
Management has analyzed the Fund's tax positions taken for all open federal income tax years and has concluded that no provision for federal income tax is required in the Fund's financial statements. A Fund's federal tax return is subject to examination by the Internal Revenue Service for a period of three years from the date of filing.
M When-Issued Securities and Delayed Delivery Transactions— The Fund may purchase securities on a delayed delivery or when-issued basis. Payment and delivery may take place after the customary settlement period for that security. At the time the transaction is negotiated, the price of the security that will be delivered is fixed. The Fund maintains cash and/or security positions for these commitments such that sufficient liquid assets will be available to make payments upon settlement. Securities purchased on a delayed delivery or when-issued basis are marked-to-market daily and begin earning interest on settlement date. Such security purchases are subject to the risk that when delivered they will be worth less than the agreed upon payment price. Losses may also arise if the counterparty does not perform under the contract.
2 Related Party Transactions
The investment advisory fee is earned by CRM as compensation for investment advisory services rendered to the Fund. On March 1, 2021, Morgan Stanley acquired Eaton Vance Corp. (the “Transaction”) and CRM became an indirect, wholly-owned subsidiary of Morgan Stanley. In connection with the Transaction, the Fund entered into a new investment advisory agreement (the “New Agreement”) with CRM, which took effect on March 1, 2021. Pursuant to the New Agreement (and the Fund's investment advisory agreement with CRM in effect prior to March 1, 2021), the fee is computed at the following annual rates of the Fund’s average daily net assets, and is payable monthly:
| Average Daily Net Assets | Annual Fee
Rate |
| Up to and including $2 billion | 0.40% |
| Over $2 billion up to and including $7.5 billion | 0.375% |
| Over $7.5 billion up to and including $10 billion | 0.35% |
| Over $10 billion | 0.325% |
For the year ended September 30, 2021, the investment advisory fee amounted to $2,832,154 or 0.40% (annualized) of the Fund's average daily net assets. The Fund may invest its cash in Cash Reserves Fund. CRM does not currently receive a fee for advisory services provided to Cash Reserves Fund.
CRM has agreed to reimburse the Fund’s operating expenses to the extent that total annual operating expenses (relating to ordinary operating expenses only and excluding expenses such as brokerage commissions, acquired fund fees and expenses of unaffiliated funds, borrowing costs, taxes or litigation expenses) exceed 0.95%, 1.70% and 0.70% for Class A, Class C and Class I, respectively, of such class’s average daily net assets. The expense reimbursement agreement with CRM may be changed or terminated after January 31, 2022. For the year ended September 30, 2021, no expenses were waived or reimbursed by CRM.
The administrative fee is earned by CRM as compensation for administrative services rendered to the Fund. The fee is computed at an annual rate of 0.12% of the Fund’s average daily net assets attributable to Class A, Class C and Class I and is payable monthly. For the year ended September 30, 2021, CRM was paid administrative fees of $849,646.
The Fund has in effect a distribution plan for Class A shares (Class A Plan) pursuant to Rule 12b-1 under the 1940 Act. Pursuant to the Class A Plan, the Fund pays Eaton Vance Distributors, Inc. (EVD), an affiliate of CRM and the Fund’s principal underwriter, a distribution and service fee of 0.25% per annum of its average daily net assets attributable to Class A shares for distribution services and facilities provided to the Fund by EVD, as well as for personal services and/or the maintenance of shareholder accounts. The Fund also has in effect a distribution plan for Class C shares (Class C Plan) pursuant to Rule 12b-1 under the 1940 Act. Pursuant to the Class C Plan, the Fund pays EVD amounts equal to 0.75% per annum of its average daily net assets attributable to Class C shares for providing ongoing distribution services and facilities to the Fund. In addition, pursuant to the Class C Plan, the
Calvert
Income Fund
September 30, 2021
Notes to Financial Statements — continued
Fund also makes payments of service fees to EVD, financial intermediaries and other persons in amounts equal to 0.25% per annum of its average daily net assets attributable to that class. Service fees paid or accrued are for personal services and/or the maintenance of shareholder accounts. Distribution and service fees paid or accrued for the year ended September 30, 2021 amounted to $690,400 and $85,954 for Class A shares and Class C shares, respectively.
The Fund was informed that EVD received $26,937 as its portion of the sales charge on sales of Class A shares for the year ended September 30, 2021. The Fund was also informed that EVD received $30,406 and $713 of contingent deferred sales charges paid by Class A and Class C shareholders, respectively, for the same period.
Eaton Vance Management (EVM), an affiliate of CRM, provides sub-transfer agency and related services to the Fund pursuant to a Sub-Transfer Agency Support Services Agreement. For the year ended September 30, 2021, sub-transfer agency fees and expenses incurred to EVM amounted to $83,776 and are included in transfer agency fees and expenses on the Statement of Operations.
Each Trustee of the Fund who is not an employee of CRM or its affiliates receives an annual fee of $154,000, plus an annual Committee fee ranging from $8,500 to $16,500 depending on the Committee. The Board chair receives an additional $30,000 ($20,000 prior to January 1, 2021) annual fee and Committee chairs receive an additional $6,000 annual fee. Eligible Trustees may participate in a Deferred Compensation Plan (the Plan). Amounts deferred under the Plan are treated as though equal dollar amounts had been invested in shares of the Fund or other Calvert funds selected by the Trustees. The Fund purchases shares of the funds selected equal to the dollar amounts deferred under the Plan, resulting in an asset equal to the deferred compensation liability. Obligations of the Plan are paid solely from the Fund's assets. Trustees’ fees are allocated to each of the Calvert funds served. Salaries and fees of officers and Trustees of the Fund who are employees of CRM or its affiliates are paid by CRM. Prior to December 31, 2020, an Advisory Council aided the Board and CRM in advancing the cause of responsible investing through original scholarship and thought leadership. The Advisory Council consisted of CRM’s Chief Executive Officer and three additional members. For the year ended December 31, 2020, each member (other than CRM’s Chief Executive Officer) was compensated $20,000 for their service on the Advisory Council. Such compensation, and any other compensation and/or expenses incurred by the Advisory Council as may be approved by the Board, was borne by the Calvert funds. For the year ended September 30, 2021, the Fund’s allocated portion of the Advisory Council compensation and fees was $571, which is included in miscellaneous expense on the Statement of Operations.
3 Investment Activity
During the year ended September 30, 2021, the cost of purchases and proceeds from sales of investments, other than U.S. government and agency securities and short-term securities and including maturities, paydowns and principal repayments on senior floating-rate loans, were $365,320,355 and $251,863,933, respectively. Purchases and sales of U.S. government and agency securities were $96,720,096 and $82,439,233, respectively.
4 Distributions to Shareholders and Income Tax Information
The tax character of distributions declared for the years ended September 30, 2021 and September 30, 2020 was as follows:
| | Year Ended September 30, |
| | 2021 | 2020 |
| Ordinary income | $20,509,094 | $19,178,479 |
| Tax return of capital | $ — | $ 543,297 |
During the year ended September 30, 2021, accumulated loss was decreased by $73,791 and paid-in capital was decreased by $73,791 due to differences between book and tax accounting. These reclassifications had no effect on the net assets or net asset value per share of the Fund.
As of September 30, 2021, the components of distributable earnings (accumulated loss) on a tax basis were as follows:
| Deferred capital losses | $ (197,761,281) |
| Net unrealized appreciation | 21,112,161 |
| Distributions payable | (87,571) |
| Accumulated loss | $(176,736,691) |
Calvert
Income Fund
September 30, 2021
Notes to Financial Statements — continued
At September 30, 2021, the Fund, for federal income tax purposes, had deferred capital losses of $197,761,281 which would reduce the Fund's taxable income arising from future net realized gains on investment transactions, if any, to the extent permitted by the Internal Revenue Code, and thus would reduce the amount of distributions to shareholders, which would otherwise be necessary to relieve the Fund of any liability for federal income or excise tax. The deferred capital losses are treated as arising on the first day of the Fund's next taxable year, can be carried forward for an unlimited period, and retain the same short-term or long-term character as when originally deferred. Of the deferred capital losses at September 30, 2021, $197,761,281 are long-term.
The cost and unrealized appreciation (depreciation) of investments, including open derivative contracts, of the Fund at September 30, 2021, as determined on a federal income tax basis, were as follows:
| Aggregate cost | $772,457,512 |
| Gross unrealized appreciation | $ 28,938,473 |
| Gross unrealized depreciation | (7,826,312) |
| Net unrealized appreciation | $ 21,112,161 |
5 Financial Instruments
The Fund may trade in financial instruments with off-balance sheet risk in the normal course of its investing activities. These financial instruments may include forward foreign currency exchange contracts and futures contracts and may involve, to a varying degree, elements of risk in excess of the amounts recognized for financial statement purposes. The notional or contractual amounts of these instruments represent the investment the Fund has in particular classes of financial instruments and do not necessarily represent the amounts potentially subject to risk. The measurement of the risks associated with these instruments is meaningful only when all related and offsetting transactions are considered. A summary of obligations under these financial instruments at September 30, 2021 is included in the Schedule of Investments. At September 30, 2021, the Fund had sufficient cash and/or securities to cover commitments under these contracts.
In the normal course of pursuing its investment objective, the Fund is subject to the following risks:
Foreign Exchange Risk: During the year ended September 30, 2021, the Fund entered into forward foreign currency exchange contracts to seek to hedge against the decline in the value of currencies in which its portfolio holdings are denominated against the U.S. dollar.
Interest Rate Risk: During the year ended September 30, 2021, the Fund used futures contracts to hedge interest rate risk and to manage duration.
The Fund enters into forward foreign currency exchange contracts that may contain provisions whereby the counterparty may terminate the contract under certain conditions, including but not limited to a decline in the Fund’s net assets below a certain level over a certain period of time, which would trigger a payment by the Fund for those derivatives in a liability position. At September 30, 2021, the Fund had no open derivatives with credit-related contingent features in a net liability position.
The over-the-counter (OTC) derivatives in which the Fund invests are subject to the risk that the counterparty to the contract fails to perform its obligations under the contract. To mitigate this risk, the Fund has entered into an International Swaps and Derivatives Association, Inc. Master Agreement (“ISDA Master Agreement”) with its derivative counterparty. The ISDA Master Agreement is a bilateral agreement between the Fund and the counterparty that governs certain OTC derivatives and typically contains, among other things, set-off provisions in the event of a default and/or termination event as defined under the ISDA Master Agreement. Under the ISDA Master Agreement, the Fund may, under certain circumstances, offset with the counterparty certain derivative financial instruments’ payables and/or receivables with collateral held and/or posted and create one single net payment. The provisions of the ISDA Master Agreement typically permit a single net payment in the event of default including the bankruptcy or insolvency of the counterparty. However, bankruptcy or insolvency laws of a particular jurisdiction may impose restrictions on or prohibitions against the right of offset in bankruptcy or insolvency. The ISDA Master Agreement allows the counterparty to OTC derivatives to terminate derivative contracts prior to maturity in the event the Fund’s net assets decline by a stated percentage or the Fund fails to meet the terms of its ISDA Master Agreement, which would cause the counterparty to accelerate payment by the Fund of any net liability owed to it.
The collateral requirements for derivatives traded under the ISDA Master Agreement are governed by a Credit Support Annex to the ISDA Master Agreement. Collateral requirements are determined at the close of business each day and are typically based on changes in market values for each transaction under the ISDA Master Agreement and netted into one amount for such agreement. Generally, the amount of collateral due from or to a counterparty is subject to a minimum transfer threshold amount before a transfer is required. Collateral pledged for the benefit of the Fund and/or counterparty is held in segregated accounts by the Fund’s custodian and cannot be sold, re-pledged, assigned or otherwise used while pledged. The portion of such collateral representing cash, if any, is reflected as deposits for derivatives collateral and, in the case of cash pledged by a counterparty for the benefit of the Fund, a corresponding liability on the Statement of Assets and Liabilities. Securities pledged by the Fund as collateral, if any, are identified as such in the Schedule of Investments.
Calvert
Income Fund
September 30, 2021
Notes to Financial Statements — continued
At September 30, 2021, the fair value of open derivative instruments (not considered to be hedging instruments for accounting disclosure purposes) and whose primary underlying risk exposure is interest rate risk was as follows:
| Derivative | Statement of Assets and Liabilities Caption | Assets | Liabilities |
| Futures contracts | Accumulated loss | | $433,176 (1) | $(821,722) (1) |
| (1) | Only the current day's variation margin is reported within the Statement of Assets and Liabilities as Receivable or Payable for variation margin on open futures contracts, as applicable. |
The effect of derivative instruments (not considered to be hedging instruments for accounting disclosure purposes) on the Statement of Operations by risk exposure for the year ended September 30, 2021 was as follows:
| Statement of Operations Caption | Foreign exchange | Interest rate | Total |
| Net realized gain (loss): | | | |
| Forward foreign currency exchange contracts | $ (28,019) | $ — | $ (28,019) |
| Futures contracts | — | (2,393,184) | (2,393,184) |
| Total | $(28,019) | $(2,393,184) | $(2,421,203) |
| Change in unrealized appreciation (depreciation): | | | |
| Forward foreign currency exchange contracts | $ (9,573) | $ — | $ (9,573) |
| Futures contracts | — | (116,860) | (116,860) |
| Total | $ (9,573) | $ (116,860) | $ (126,433) |
The average notional cost of futures contracts and average notional amounts of other derivative contracts outstanding during the year ended September 30, 2021, which are indicative of the volume of these derivative types, were approximately as follows:
Futures
Contracts — Long | Futures
Contracts — Short | Forward
Foreign Currency
Exchange Contracts* |
| $77,493,000 | $28,321,000 | $1,421,000 |
| * | The average notional amount for forward foreign currency exchange contracts is based on the absolute value of notional amounts of currency purchased and currency sold. |
6 Securities Lending
To generate additional income, the Fund may lend its securities pursuant to a securities lending agency agreement with State Street Bank and Trust Company (SSBT), the securities lending agent. Security loans are subject to termination by the Fund at any time and, therefore, are not considered illiquid investments. The Fund requires that the loan be continuously collateralized by either cash or securities in an amount at least equal to the market value of the securities on loan. The market value of securities loaned is determined daily and any additional required collateral is delivered to the Fund on the next business day. Cash collateral is generally invested in a money market fund registered under the 1940 Act that is managed by an affiliate of SSBT. Any gain or loss in the market price of the loaned securities that might occur and any interest earned or dividends declared during the term of the loan would accrue to the account of the Fund. Income earned on the investment of collateral, net of broker rebates and other expenses incurred by the securities lending agent, is split between the Fund and the securities lending agent based on agreed upon contractual terms. Non-cash collateral, if any, is held by the lending agent on behalf of the Fund and cannot be sold or re-pledged by the Fund; accordingly, such collateral is not reflected in the Statement of Assets and Liabilities.
Calvert
Income Fund
September 30, 2021
Notes to Financial Statements — continued
The risks associated with lending portfolio securities include, but are not limited to, possible delays in receiving additional collateral or in the recovery of the loaned securities, possible loss of rights to the collateral should the borrower fail financially, as well as risk of loss in the value of the collateral or the value of the investments made with the collateral. The securities lending agent shall indemnify the Fund in the case of default of any securities borrower.
At September 30, 2021, the total value of securities on loan, including accrued interest, was $26,965,026 and the total value of collateral received was $27,552,203, comprised of cash of $16,976,103 and U.S. government and/or agencies securities of $10,576,100.
The following table provides a breakdown of securities lending transactions accounted for as secured borrowings, the obligations by class of collateral pledged, and the remaining contractual maturity of those transactions as of September 30, 2021.
| | Remaining Contractual Maturity of the Transactions |
| | Overnight and
Continuous | <30 days | 30 to 90 days | >90 days | Total |
| Corporate Bonds | $ 16,397,753 | $ — | $ — | $ — | $ 16,397,753 |
| Preferred Stocks | 578,350 | — | — | — | 578,350 |
| Total | $16,976,103 | $ — | $ — | $ — | $16,976,103 |
The carrying amount of the liability for deposits for securities loaned at September 30, 2021 approximated its fair value. If measured at fair value, such liability would have been considered as Level 2 in the fair value hierarchy (see Note 1A) at September 30, 2021.
7 Line of Credit
The Fund participates with other portfolios and funds managed by EVM and its affiliates, including CRM, in an $800 million unsecured line of credit with a group of banks, which is in effect through October 26, 2021. Borrowings are made by the Fund solely for temporary purposes related to redemptions and other short-term cash needs. Interest is charged to the Fund based on its borrowings at an amount above either the Eurodollar rate or Federal Funds rate. In addition, a fee computed at an annual rate of 0.15% on the daily unused portion of the line of credit is allocated among the participating portfolios and funds at the end of each quarter. In connection with the renewal of the agreement in October 2020, an upfront fee and arrangement fee totaling $950,000 was incurred that was allocated to the participating portfolios and funds. Because the line of credit is not available exclusively to the Fund, it may be unable to borrow some or all of its requested amounts at any particular time.
The Fund had no borrowings outstanding pursuant to its line of credit at September 30, 2021. The Fund did not have any significant borrowings or allocated fees during the year ended September 30, 2021. Effective October 26, 2021, the Fund renewed its line of credit agreement, which expires October 25, 2022, at substantially the same terms.
8 Affiliated Issuers and Funds
The Fund has invested a portion of its assets in notes (the Notes) issued by Calvert Impact Capital, Inc. (CIC) pursuant to exemptive relief granted by the U.S. Securities and Exchange Commission (the SEC). There are certain potential points of affiliation between the Fund and CIC. CRM has licensed use of the Calvert name to CIC and provides other types of support. CRM’s President and Chief Executive Officer (and the only director/trustee on the Fund Board that is an “interested person” of the Fund) serves on the CIC Board. In addition, another director/trustee on the Fund Board serves as a director emeritus on the CIC Board.
In addition to the Notes, the Fund invested in issuers that may be deemed to be affiliated with Morgan Stanley. At September 30, 2021, the value of the Fund's investment in the Notes and affiliated issuers and funds was $19,063,898, which represents 2.4% of the Fund's net assets. Transactions in the Notes and affiliated issuers and funds by the Fund for the year ended September 30, 2021 were as follows:
| Name | Value,
beginning
of period | Purchases | Sales
proceeds | Net
realized
gain
(loss) | Change in
unrealized
appreciation
(depreciation) | Value,
end of
period | Interest/
Dividend
income | Principal
amount/Units,
end of period |
| Commercial Mortgage-Backed Securities | | | | | | |
| Morgan Stanley Capital I Trust: | | | | | | | | |
| Series 2019-BPR, Class B, 2.184%, (1 mo. USD LIBOR + 2.10%), 5/15/36(1) | $ — | $ — | $ — | $ — | $ 282,051 | $ 6,245,300 | $ 86,160 | $6,576,000 |
Calvert
Income Fund
September 30, 2021
Notes to Financial Statements — continued
| Name | Value,
beginning
of period | Purchases | Sales
proceeds | Net
realized
gain
(loss) | Change in
unrealized
appreciation
(depreciation) | Value,
end of
period | Interest/
Dividend
income | Principal
amount/Units,
end of period |
| Series 2019-BPR, Class C, 3.134%, (1 mo. USD LIBOR + 3.05%), 5/15/36(1) | $ — | $ — | $ — | $ — | $ 136,323 | $ 2,745,804 | $ 57,122 | $3,045,000 |
| High Social Impact Investments | | | | | | |
| Calvert Impact Capital, Inc., Community Investment Notes, 1.50%, 12/15/23(2) | — | 1,500,000 | — | — | (25,755) | 1,474,245 | 17,875 | 1,500,000 |
| Short-Term Investments | | | | | | |
| Calvert Cash Reserves Fund, LLC | 19,594,365 | 267,561,065 | (278,557,705) | (1,192) | 2,016 | 8,598,549 | 14,966 | 8,597,689 |
| Totals | | | | $(1,192) | $394,635 | $19,063,898 | $176,123 | |
| (1) | May be deemed to be an affiliated issuer as of March 1, 2021 (see Note 2). |
| (2) | Restricted security. |
9 Capital Shares
The Fund’s Declaration of Trust permits the Trustees to issue an unlimited number of full and fractional shares of beneficial interest (without par value). Such shares may be issued in a number of different series (such as the Fund) and classes.
Transactions in capital shares for the years ended September 30, 2021 and September 30, 2020 were as follows:
| | Year Ended
September 30, 2021 | | Year Ended
September 30, 2020 |
| | Shares | Amount | | Shares | Amount |
| Class A | | | | | |
| Shares sold | 1,293,874 | $ 23,065,325 | | 1,710,842 | $ 29,200,927 |
| Reinvestment of distributions | 377,935 | 6,744,739 | | 459,014 | 7,826,610 |
| Shares redeemed | (2,578,627) | (45,883,837) | | (2,624,873) | (44,412,137) |
| Converted from Class C | 100,623 | 1,795,379 | | 82,458 | 1,374,306 |
| Net decrease | (806,195) | $ (14,278,394) | | (372,559) | $ (6,010,294) |
| Class C | | | | | |
| Shares sold | 98,804 | $ 1,765,740 | | 155,026 | $ 2,653,709 |
| Reinvestment of distributions | 8,845 | 157,627 | | 13,712 | 233,571 |
| Shares redeemed | (105,749) | (1,883,685) | | (209,684) | (3,552,833) |
| Converted to Class A | (100,690) | (1,795,379) | | (82,514) | (1,374,306) |
| Net decrease | (98,790) | $ (1,755,697) | | (123,460) | $ (2,039,859) |
| Class I | | | | | |
| Shares sold | 12,900,408 | $ 231,108,497 | | 9,893,065 | $169,303,485 |
| Reinvestment of distributions | 689,292 | 12,339,189 | | 593,838 | 10,149,786 |
| Shares redeemed | (5,870,372) | (104,742,526) | | (5,883,019) | (99,253,476) |
| Net increase | 7,719,328 | $ 138,705,160 | | 4,603,884 | $ 80,199,795 |
Calvert
Income Fund
September 30, 2021
Notes to Financial Statements — continued
10 Risks and Uncertainties
Pandemic Risk
An outbreak of respiratory disease caused by a novel coronavirus was first detected in China in late 2019 and subsequently spread internationally. This coronavirus has resulted in closing borders, enhanced health screenings, changes to healthcare service preparation and delivery, quarantines, cancellations, disruptions to supply chains and customer activity, as well as general concern and uncertainty. Health crises caused by outbreaks, such as the coronavirus outbreak, may exacerbate other pre-existing political, social and economic risks and disrupt normal market conditions and operations. The impact of this outbreak has negatively affected the worldwide economy, the economies of individual countries, individual companies, and the market in general, and may continue to do so in significant and unforeseen ways, as may other epidemics and pandemics that may arise in the future. Any such impact could adversely affect the Fund's performance, or the performance of the securities in which the Fund invests.
11 Change in Independent Registered Public Accounting Firm
On July 30, 2021, KPMG LLP (“KPMG”) informed the Audit Committee and Board of the Trust that it was resigning as the independent registered public accounting firm to the Trust, as upon Morgan Stanley’s acquisition of Eaton Vance Corp., the parent company of CRM (the investment adviser to each series of the Trust), KPMG would no longer be independent of the Trust. The Audit Committee of the Board and the Board approved the selection of Deloitte & Touche LLP (“Deloitte”) as the independent registered public accounting firm for the funds that are series of the Trust (the “Funds”) for the fiscal year ending September 30, 2021 to be effective upon KPMG’s resignation and Deloitte’s acceptance of the engagement which became effective July 30, 2021.
KPMG’s reports on the financial statements for the Funds for the fiscal periods ended September 30, 2019 and September 30, 2020 contained no adverse opinion or disclaimer of opinion nor were they qualified or modified as to uncertainty, audit scope or accounting principles. During the fiscal periods ended September 30, 2019 and September 30, 2020, and during the subsequent interim period through July 30, 2021: (i) there were no disagreements with KPMG on any matter of accounting principles or practices, financial statement disclosure or auditing scope or procedure, which disagreements, if not resolved to the satisfaction of KPMG, would have caused KPMG to make reference to the subject matter of the disagreements in connection with its reports on the Funds’ financial statements for such periods; and (ii) there were no “reportable events” of the kind described in Item 304(a)(1)(v) of Regulation S-K under the Securities Exchange Act of 1934, as amended.
During the fiscal periods ended September 30, 2019 and September 30, 2020, and during the subsequent interim period through July 30, 2021: neither the Funds, nor anyone on their behalf, consulted with Deloitte on items which: (i) concerned the application of accounting principles to a specified transaction, either completed or proposed, or the type of audit opinion that might be rendered on the Funds’ financial statements; or (ii) concerned the subject of a disagreement (as defined in paragraph (a)(1)(iv) of Item 304 of Regulation S-K) or reportable events (as described in paragraph (a)(1)(v) of Item 304).
Calvert
Income Fund
September 30, 2021
Report of Independent Registered Public Accounting Firm
To the Board of Trustees of The Calvert Fund and Shareholders of Calvert Income Fund:
Opinion on the Financial Statements and Financial Highlights
We have audited the accompanying statement of assets and liabilities of Calvert Income Fund (the "Fund") (one of the funds constituting The Calvert Fund), including the schedule of investments, as of September 30, 2021, the related statements of operations, changes in net assets and the financial highlights for the year then ended, and the related notes. In our opinion, the financial statements and financial highlights present fairly, in all material respects, the financial position of the Fund as of September 30, 2021, and the results of its operations and changes in its net assets for the year then ended, and the financial highlights for the year then ended in conformity with accounting principles generally accepted in the United States of America. The statement of changes in net assets for the year ended September 30, 2020, and the financial highlights for the years ended September 30, 2020, 2019, 2018, and 2017 were audited by other auditors whose report, dated November 20, 2020, expressed an unqualified opinion on that financial statement and those financial highlights.
Basis for Opinion
These financial statements and financial highlights are the responsibility of the Fund's management. Our responsibility is to express an opinion on the Fund's financial statements and financial highlights based on our audit. We are a public accounting firm registered with the Public Company Accounting Oversight Board (United States) (PCAOB) and are required to be independent with respect to the Fund in accordance with the U.S. federal securities laws and the applicable rules and regulations of the Securities and Exchange Commission and the PCAOB.
We conducted our audit in accordance with the standards of the PCAOB. Those standards require that we plan and perform the audit to obtain reasonable assurance about whether the financial statements and financial highlights are free of material misstatement, whether due to error or fraud. The Fund is not required to have, nor were we engaged to perform, an audit of its internal control over financial reporting. As part of our audit we are required to obtain an understanding of internal control over financial reporting but not for the purpose of expressing an opinion on the effectiveness of the Fund’s internal control over financial reporting. Accordingly, we express no such opinion.
Our audit included performing procedures to assess the risks of material misstatement of the financial statements and financial highlights, whether due to error or fraud, and performing procedures that respond to those risks. Such procedures included examining, on a test basis, evidence regarding the amounts and disclosures in the financial statements and financial highlights. Our audit also included evaluating the accounting principles used and significant estimates made by management, as well as evaluating the overall presentation of the financial statements and financial highlights. Our procedures included confirmation of securities owned as of September 30, 2021, by correspondence with the custodian, brokers and selling or agent banks; when replies were not received from brokers and selling or agent banks, we performed other auditing procedures. We believe that our audit provides a reasonable basis for our opinion.
/s/ Deloitte & Touche LLP
Boston, Massachusetts
November 22, 2021
We have served as the auditor of one or more Calvert investment companies since 2021.
Calvert
Income Fund
September 30, 2021
Federal Tax Information (Unaudited)
The Form 1099-DIV you receive in February 2022 will show the tax status of all distributions paid to your account in calendar year 2021. Shareholders are advised to consult their own tax adviser with respect to the tax consequences of their investment in the Fund. As required by the Internal Revenue Code and/or regulations, shareholders must be notified regarding the status of qualified business income, qualified dividend income for individuals, the dividends received deduction for corporations and 163(j) interest dividends.
Qualified Business Income. For the fiscal year ended September 30, 2021, the Fund designates $13,921, or up to the maximum amount of such dividends allowable pursuant to the Internal Revenue Code, as qualified business income.
Qualified Dividend Income. For the fiscal year ended September 30, 2021, the Fund designates approximately $340,431, or up to the maximum amount of such dividends allowable pursuant to the Internal Revenue Code, as qualified dividend income eligible for the reduced tax rate of 15%.
Dividends Received Deduction. Corporate shareholders are generally entitled to take the dividends received deduction on the portion of the Fund's dividend distribution that qualifies under tax law. For the Fund's fiscal 2021 ordinary income dividends, 1.66% qualifies for the corporate dividends received deduction.
163(j) Interest Dividends. For the fiscal year ended September 30, 2021, the Fund designates 94.46% of distributions from net investment income as a 163(j) interest dividend.
Calvert
Income Fund
September 30, 2021
Liquidity Risk Management Program
The Fund has implemented a written liquidity risk management program (Program) and related procedures to manage its liquidity in accordance with Rule 22e-4 under the Investment Company Act of 1940, as amended (Liquidity Rule). The Liquidity Rule defines “liquidity risk” as the risk that a fund could not meet requests to redeem shares issued by the fund without significant dilution of the remaining investors’ interests in the fund. The Fund’s Board of Trustees/Directors has designated the investment adviser to serve as the administrator of the Program and the related procedures. The administrator has established a Liquidity Risk Management Oversight Committee (Committee) to perform the functions necessary to administer the Program. As part of the Program, the administrator is responsible for identifying illiquid investments and categorizing the relative liquidity of the Fund’s investments in accordance with the Liquidity Rule. Under the Program, the administrator assesses, manages, and periodically reviews the Fund’s liquidity risk, and is responsible for making certain reports to the Fund’s Board of Trustees/Directors and the Securities and Exchange Commission (SEC) regarding the liquidity of the Fund’s investments, and to notify the Board of Trustees/Directors and the SEC of certain liquidity events specified in the Liquidity Rule. The liquidity of the Fund’s portfolio investments is determined based on a number of factors including, but not limited to, relevant market, trading and investment-specific considerations under the Program.
At a meeting of the Fund’s Board of Trustees/Directors on June 16, 2021, the Committee provided a written report to the Fund’s Board of Trustees/ Directors pertaining to the operation, adequacy, and effectiveness of implementation of the Program, as well as the operation of the highly liquid investment minimum (if applicable) for the period January 1, 2020 through December 31, 2020 (Review Period). The Program operated effectively during the Review Period, supporting the administrator’s ability to assess, manage and monitor Fund liquidity risk, including during periods of market volatility and net redemptions. During the Review Period, the Fund met redemption requests on a timely basis.
There can be no assurance that the Program will achieve its objectives in the future. Please refer to the Fund’s prospectus for more information regarding the Fund’s exposure to liquidity risk and other principal risks to which an investment in the Fund may be subject.
Calvert
Income Fund
September 30, 2021
Management and Organization
Fund Management. The Trustees of The Calvert Fund (the Trust) are responsible for the overall management and supervision of the Trust’s affairs. The Trustees and officers of the Trust are listed below. Except as indicated, each individual has held the office shown or other offices in the same company for the last five years. Each Board member holds office until his or her successor is elected and qualified, or until his or her earlier death, resignation, retirement, removal or disqualification. Under the terms of the Fund's current Board member retirement policy, an Independent Board member must retire at the end of the calendar year in which he or she turns 75. However, if such retirement would cause the Fund to be out of compliance with Section 16 of the 1940 Act or any other regulations or guidance of the SEC, then such retirement and resignation will not become effective until such time as action has been taken for the Fund to be in compliance upon a Board member's retirement. The “Independent Trustees” consist of those Trustees who are not “interested persons” of the Trust, as that term is defined under the 1940 Act. The business address of each Trustee and officer, with the exception of Ms. Walsh and Mr. Kirchner, is 1825 Connecticut Avenue NW, Suite 400, Washington, DC 20009. As used below, “CRM” refers to Calvert Research and Management. Each Trustee oversees 39 funds in the Calvert fund complex. Each officer serves as an officer of certain other Calvert funds.
| Name and Year of Birth | Trust
Position(s) | Position
Start Date | Principal Occupation(s) and Other Directorships
During Past Five Years and Other Relevant Experience |
| Interested Trustee |
John H. Streur(1)
1960 | Trustee and
President | 2015 | President and Chief Executive Officer of Calvert Research and
Management (since December 31, 2016). President and Chief Executive
Officer of Calvert Investments, Inc. (January 2015 - December 2016);
Chief Executive Officer of Calvert Investment Distributors, Inc. (August
2015 - December 2016); Chief Compliance Officer of Calvert Investment
Management, Inc. (August 2015 - April 2016); President and Director,
Portfolio 21 Investments, Inc. (through October 2014); President,
Chief Executive Officer and Director, Managers Investment Group LLC
(through January 2012); President and Director, The Managers Funds
and Managers AMG Funds (through January 2012).
Other Directorships in the Last Five Years. Portfolio 21 Investments,
Inc. (asset management) (through October 2014); Managers Investment
Group LLC (asset management) (through January 2012); The Managers
Funds (asset management) (through January 2012); Managers AMG Funds
(asset management) (through January 2012); Calvert Impact Capital, Inc. |
| Independent Trustees |
Richard L. Baird, Jr.
1948 | Trustee | 2005 | Regional Disaster Recovery Lead, American Red Cross of Greater
Pennsylvania (since 2017). Volunteer, American Red Cross (since 2015).
Former President and CEO of Adagio Health Inc. (retired in 2014) in
Pittsburgh, PA.
Other Directorships in the Last Five Years. None. |
Alice Gresham Bullock
1950 | Chair and
Trustee | 2016 | Professor Emerita at Howard University School of Law. Dean Emerita of
Howard University School of Law and Deputy Director of the Association
of American Law Schools (1992-1994).
Other Directorships in the Last Five Years. None. |
Cari M. Dominguez
1949 | Trustee | 2016 | Former Chair of the U.S. Equal Employment Opportunity Commission.
Other Directorships in the Last Five Years. Manpower, Inc. (employment
agency); Triple S Management Corporation (managed care); National
Association of Corporate Directors. |
John G. Guffey, Jr.
1948 | Trustee | 1992 | President of Aurora Press Inc., a privately held publisher of trade
paperbacks (since January 1997).
Other Directorships in the Last Five Years. Calvert Impact Capital, Inc.
(through December 31, 2018); Calvert Ventures, LLC. |
Miles D. Harper, III
1962 | Trustee | 2005 | Partner, Carr Riggs & Ingram (public accounting firm) since October 2014.
Partner, Gainer Donnelly & Desroches (public accounting firm) (now Carr
Riggs & Ingram) (November 1999 - September 2014).
Other Directorships in the Last Five Years. Bridgeway Funds (9) (asset
management). |
Joy V. Jones
1950 | Trustee | 2005 | Attorney.
Other Directorships in the Last Five Years. Conduit Street Restaurants
SUD 2 Limited; Palm Management Restaurant Corporation. |
Calvert
Income Fund
September 30, 2021
Management and Organization — continued
| Name and Year of Birth | Trust
Position(s) | Position
Start Date | Principal Occupation(s) and Other Directorships
During Past Five Years and Other Relevant Experience |
| Independent Trustees (continued) |
Anthony A. Williams
1951 | Trustee | 2016 | CEO and Executive Director of the Federal City Council (July 2012 to
present); Senior Adviser and Independent Consultant for King and
Spalding LLP (September 2015 to present); Executive Director of Global
Government Practice at the Corporate Executive Board (January 2010 to
January 2012).
Other Directorships in the Last Five Years. Freddie Mac; Evoq
Properties/Meruelo Maddux Properties, Inc. (real estate management);
Weston Solutions, Inc. (environmental services); Bipartisan Policy Center’s
Debt Reduction Task Force; Chesapeake Bay Foundation; Catholic
University of America; Urban Institute (research organization); The Howard Hughes Corporation (real estate development). |
| Name and Year of Birth | Trust
Position(s) | Position
Start Date | Principal Occupation(s)
During Past Five Years |
| Principal Officers who are not Trustees |
Hope L. Brown
1973 | Chief
Compliance
Officer | 2014 | Chief Compliance Officer of 39 registered investment companies advised
by CRM (since 2014). Vice President and Chief Compliance Officer,
Wilmington Funds (2012-2014). |
Deidre E. Walsh(2)
1971 | Secretary,
Vice President
and Chief
Legal Officer | 2021 | Vice President of CRM and officer of 39 registered investment companies
advised by CRM (since 2021). Also Vice President of Eaton Vance and
certain of its affiliates and officer of 138 registered investment companies
advised or administered by Eaton Vance. |
James F. Kirchner(2)
1967 | Treasurer | 2016 | Vice President of CRM and officer of 39 registered investment companies
advised by CRM (since 2016). Also Vice President of Eaton Vance and
certain of its affiliates and officer of 138 registered investment companies
advised or administered by Eaton Vance. |
| (1) Mr. Streur is an interested person of the Fund because of his positions with the Fund’s adviser and certain affiliates. |
| (2) The business address for Ms. Walsh and Mr. Kirchner is Two International Place, Boston, MA 02110. |
The SAI for the Fund includes additional information about the Trustees and officers of the Fund and can be obtained without charge on Calvert’s website at www.calvert.com or by calling 1-800-368-2745.
| FACTS | WHAT DOES EATON VANCE DO WITH YOUR
PERSONAL INFORMATION? |
| Why? | Financial companies choose how they share your personal information. Federal law gives consumers the right to limit some but not all sharing. Federal law also requires us to tell you how we collect, share, and protect your personal information. Please read this notice carefully to understand what we do. |
| |
| What? | The types of personal information we collect and share depend on the product or service you have with us. This information can include:■ Social Security number and income
■
investment experience and risk tolerance
■
checking account number and wire transfer instructions |
| |
| How? | All financial companies need to share customers’ personal information to run their everyday business. In the section below, we list the reasons financial companies can share their customers’ personal information; the reasons Eaton Vance chooses to share; and whether you can limit this sharing. |
Reasons we can share your
personal information | Does Eaton Vance
share? | Can you limit
this sharing? |
| For our everyday business purposes — such as to process your transactions, maintain your account(s), respond to court orders and legal investigations, or report to credit bureaus | Yes | No |
| For our marketing purposes — to offer our products and services to you | Yes | No |
| For joint marketing with other financial companies | No | We don’t share |
| For our investment management affiliates’ everyday business purposes — information about your transactions, experiences, and creditworthiness | Yes | Yes |
| For our affiliates’ everyday business purposes — information about your transactions and experiences | Yes | No |
| For our affiliates’ everyday business purposes — information about your creditworthiness | No | We don’t share |
| For our investment management affiliates to market to you | Yes | Yes |
| For our affiliates to market to you | No | We don’t share |
| For nonaffiliates to market to you | No | We don’t share |
To limit our
sharing | Call toll-free 1-800-368-2745 or email: CRMPrivacy@calvert.comPlease note:If you are a new customer, we can begin sharing your information 30 days from the date we sent this notice. When you are no longer our customer, we continue to share your information as described in this notice. However, you can contact us at any time to limit our sharing. |
| Questions? | Call toll-free 1-800-368-2745 or email: CRMPrivacy@calvert.com |
| Privacy Notice — continued | April 2021 |
| Who we are |
| Who is providing this notice? | Eaton Vance Management, Eaton Vance Distributors, Inc., Eaton Vance Trust Company, Eaton Vance Management (International) Limited, Eaton Vance Advisers International Ltd., Eaton Vance Global Advisors Limited, Eaton Vance Management’s Real Estate Investment Group, Boston Management and Research, Calvert Research and Management, Eaton Vance and Calvert Fund Families and our investment advisory affiliates (“Eaton Vance”) (see Investment Management Affiliates definition below) |
| What we do |
How does Eaton Vance
protect my personal
information? | To protect your personal information from unauthorized access and use, we use security measures that comply with federal law. These measures include computer safeguards and secured files and buildings. We have policies governing the proper handling of customer information by personnel and requiring third parties that provide support to adhere to appropriate security standards with respect to such information. |
How does Eaton Vance
collect my personal
information? | We collect your personal information, for example, when you■ open an account or make deposits or withdrawals from your account
■
buy securities from us or make a wire transfer
■
give us your contact informationWe also collect your personal information from others, such as credit bureaus, affiliates, or other companies. |
| Why can’t I limit all sharing? | Federal law gives you the right to limit only■ sharing for affiliates’ everyday business purposes — information about your creditworthiness
■
affiliates from using your information to market to you
■
sharing for nonaffiliates to market to youState laws and individual companies may give you additional rights to limit sharing. See below for more on your rights under state law. |
| Definitions |
Investment Management
Affiliates | Eaton Vance Investment Management Affiliates include registered investment advisers, registered broker- dealers, and registered and unregistered funds. Investment Management Affiliates does not include entities associated with Morgan Stanley Wealth Management, such as Morgan Stanley Smith Barney LLC and Morgan Stanley & Co. |
| Affiliates | Companies related by common ownership or control. They can be financial and nonfinancial companies.■ Our affiliates include companies with a Morgan Stanley name and financial companies such as Morgan Stanley Smith Barney LLC and Morgan Stanley & Co. |
| Nonaffiliates | Companies not related by common ownership or control. They can be financial and nonfinancial companies.■ Eaton Vance does not share with nonaffiliates so they can market to you. |
| Joint marketing | A formal agreement between nonaffiliated financial companies that together market financial products or services to you.■ Eaton Vance doesn’t jointly market. |
| Other important information |
| Vermont: Except as permitted by law, we will not share personal information we collect about Vermont residents with Nonaffiliates unless you provide us with your written consent to share such information.California: Except as permitted by law, we will not share personal information we collect about California residents with Nonaffiliates and we will limit sharing such personal information with our Affiliates to comply with California privacy laws that apply to us. |
Delivery of Shareholder Documents. The Securities and Exchange Commission (SEC) permits funds to deliver only one copy of shareholder documents, including prospectuses, proxy statements and shareholder reports, to fund investors with multiple accounts at the same residential or post office box address. This practice is often called “householding” and it helps eliminate duplicate mailings to shareholders. Calvert funds, or your financial intermediary, may household the mailing of your documents indefinitely unless you instruct Calvert funds, or your financial intermediary, otherwise. If you would prefer that your Calvert fund documents not be householded, please contact Calvert funds at 1-800-368-2745, or contact your financial intermediary. Your instructions that householding not apply to delivery of your Calvert fund documents will typically be effective within 30 days of receipt by Calvert funds or your financial intermediary. Separate statements will be generated for each separate account and will be householded as described above.
Portfolio Holdings. Each Calvert fund files a schedule of portfolio holdings on Part F to Form N-PORT with the SEC. Certain information filed on Form N-PORT may be viewed on the Calvert website at www.calvert.com, by calling Calvert at 1-800-368-2745 or in the EDGAR database on the SEC’s website at www.sec.gov.
Proxy Voting. The Proxy Voting Guidelines that each Calvert fund uses to determine how to vote proxies relating to portfolio securities is provided as an Appendix to the fund’s Statement of Additional Information. The Statement of Additional Information can be obtained free of charge by calling the Calvert funds at 1-800-368-2745, by visiting the Calvert funds’ website at www.calvert.com or visiting the SEC’s website at www.sec.gov. Information regarding how a Calvert fund voted proxies relating to portfolio securities during the most recent 12-month period ended June 30 is available by calling Calvert funds, by visiting the Calvert funds’ website at www.calvert.com or by visiting the SEC’s website at www.sec.gov.
Investment Adviser and Administrator
Calvert Research and Management
1825 Connecticut Avenue NW, Suite 400
Washington, DC 20009
Principal Underwriter*
Eaton Vance Distributors, Inc.
Two International Place
Boston, MA 02110
(617) 482-8260
Custodian
State Street Bank and Trust Company
State Street Financial Center, One Lincoln Street
Boston, MA 02111
Transfer Agent
DST Asset Manager Solutions, Inc.
2000 Crown Colony Drive
Quincy, MA 02169
Independent Registered Public Accounting Firm
Deloitte & Touche LLP
200 Berkeley Street
Boston, MA 02116-5022
Fund Offices
1825 Connecticut Avenue NW, Suite 400
Washington, DC 20009
* FINRA BrokerCheck. Investors may check the background of their Investment Professional by contacting the Financial Industry Regulatory Authority (FINRA). FINRA BrokerCheck is a free tool to help investors check the professional background of current and former FINRA-registered securities firms and brokers. FINRA BrokerCheck is available by calling 1-800-289-9999 and at www.FINRA.org. The FINRA BrokerCheck brochure describing this program is available to investors at www.FINRA.org.
Printed on recycled paper.
Calvert
High Yield Bond Fund
Annual Report
September 30, 2021
Commodity Futures Trading Commission Registration. The Commodity Futures Trading Commission (“CFTC”) has adopted regulations that subject registered investment companies and advisers to regulation by the CFTC if a fund invests more than a prescribed level of its assets in certain CFTC-regulated instruments (including futures, certain options and swap agreements) or markets itself as providing investment exposure to such instruments. The adviser has claimed an exclusion from the definition of “commodity pool operator” under the Commodity Exchange Act with respect to its management of the Fund and the other funds it manages. Accordingly, neither the Fund nor the adviser is subject to CFTC regulation.
Fund shares are not insured by the FDIC and are not deposits or other obligations of, or guaranteed by, any depository institution. Shares are subject to investment risks, including possible loss of principal invested.
This report must be preceded or accompanied by a current summary prospectus or prospectus. Before investing, investors should consider carefully the investment objective, risks, and charges and expenses of a mutual fund. This and other important information is contained in the summary prospectus and prospectus, which can be obtained from a financial intermediary. Prospective investors should read the prospectus carefully before investing. For further information, please call 1-800-368-2745.
Choose Planet-friendly E-delivery!
Sign up now for on-line statements, prospectuses, and fund reports. In less than five minutes you can help reduce paper mail and lower fund costs.
Just go to www.calvert.com. If you already have an online account with the Calvert funds, click on Login to access your Account and select the documents you would like to receive via e-mail.
If you’re new to online account access, click on Login, then Register to create your user name and password. Once you’re in, click on the E-delivery sign-up on the Account Portfolio page and follow the quick, easy steps.
Note: If your shares are not held directly with the Calvert funds but through a brokerage firm, you must contact your broker for electronic delivery options available through their firm.
Annual Report September 30, 2021
Calvert
High Yield Bond Fund
Calvert
High Yield Bond Fund
September 30, 2021
Management's Discussion of Fund Performance†
Economic and Market Conditions
For the 12-month period ended September 30, 2021, the U.S. high yield market rebounded from the prior COVID-19 pandemic-hampered year on the strength of the recovering economy and widespread vaccinations.
In the fourth quarter of calendar 2020, the outcome of the U.S. election and the development of vaccines were bullish for the high yield market and risk markets more broadly. The surge in performance materialized despite the continued aggressive spread of the pandemic and a record number of virus-related hospitalizations in the U.S.
Performance across the global high yield landscape was further buoyed in late 2020 by the passage of a new fiscal stimulus package in the U.S. Meanwhile, global central banks reaffirmed that monetary policy would remain accommodative for the foreseeable future. Corporate earnings released in the fourth quarter continued to underscore that the economic rebound remained intact.
In the first quarter of calendar 2021, the rollout of several vaccines, record government stimulus, and accommodative policy from global central banks were supportive for risk markets. However, as the quarter progressed, concerns that increased fiscal spending and surging growth might hasten increases in short-term interest rates moderated returns.
In the second quarter of calendar 2021, U.S. and global high yield markets posted strong returns amid successful rollouts in vaccination programs across much of the developed world, accommodative central bank policy, and a robust economic rebound. The good news was tempered by elevated inflation readings in the U.S., resulting from a combination of weak year-over-year comparisons, constrained supply chains, pent-up demand, and a lack of participation in the U.S. labor market.
U.S. and global high yield markets were modest in the third quarter of calendar 2021. Global growth remained above trend, and the fundamentals of high yield issuers continued to improve. However, the spread of the COVID-19 Delta variant elevated inflation readings. During the period, concerns over a potential economic slowdown in China as well as increased private sector intervention on the part of the Chinese Communist Party unsettled investors. Meanwhile, global investors took announcements from the U.S. Federal Reserve and the Bank of England regarding near-term plans for tapering asset purchases largely in stride.
The ICE BofA U.S. High Yield Index (the Index) returned 11.46% for the one-year period ended September 30, 2021. During the same period, the Bloomberg U.S. Aggregate Bond Index returned (0.90)%.
High yield issuance during the 12-month period totaled $509 billion, up from $428 billion in the prior one-year period. By period-end, the trailing 12-month par-weighted default rate decreased to 0.92%, from 5.80% at the end of the prior one-year period.
Fund Performance
For the 12-month period ended September 30, 2021, Calvert High Yield Bond Fund (the Fund) returned 7.74% for Class A shares at net asset value (NAV), underperforming its benchmark, the Index, which returned 11.46%.
The Fund’s sector allocation detracted most from returns relative to the Index during the period. The Fund’s underweight exposure to energy alone accounted for most of the underperformance by allocation as energy was the best-performing sector within the Index. Security selections by sector also had an overall negative impact.
Security selections by credit-rating designations also detracted from performance relative to the Index. In particular, selections in the BB and CCC rated segments had the largest negative impact. Selections in the non-rated segment contributed to returns relative to the Index during the period.
Security selections by duration were a further impediment to performance relative to the Index. In particular, selections in bonds with durations between 2-5 years hurt relative returns during the period. An underweight exposure to bonds with durations of more than 10 years, and an overweight exposure to bonds with durations of between 0-2 years further detracted from returns relative to the Index. Selections in short duration securities aided returns relative to the Index during the period.
The Fund increased its allocation to leveraged loans modestly during the period and maintained that allocation at period-end. The Fund also maintained a significant underweight exposure to most commodity-related sectors and held a modestly shorter duration than the Index at period-end.
See Endnotes and Additional Disclosures in this report.
Past performance is no guarantee of future results. Returns are historical and are calculated by determining the percentage change in net asset value (NAV) or offering price (as applicable) with all distributions reinvested. Investment return and principal value will fluctuate so that shares, when redeemed, may be worth more or less than their original cost. Performance for periods less than or equal to one year is cumulative. Performance is for the stated time period only; due to market volatility, current Fund performance may be lower or higher than the quoted return. For performance as of the most recent month-end, please refer to www.calvert.com.
Calvert
High Yield Bond Fund
September 30, 2021
Performance
Portfolio Managers Stephen C. Concannon, CFA and Raphael A. Leeman, each of Calvert Research and Management
| % Average Annual Total Returns1,2 | Class
Inception Date | Performance
Inception Date | One Year | Five Years | Ten Years |
| Class A at NAV | 07/09/2001 | 07/09/2001 | 7.74% | 4.76% | 5.76% |
| Class A with 3.75% Maximum Sales Charge | — | — | 3.72 | 3.96 | 5.36 |
| Class C at NAV | 10/31/2011 | 07/09/2001 | 6.88 | 3.97 | 4.86 |
| Class C with 1% Maximum Sales Charge | — | — | 5.88 | 3.97 | 4.86 |
| Class I at NAV | 07/09/2001 | 07/09/2001 | 7.98 | 5.05 | 6.11 |
| Class R6 at NAV | 02/01/2019 | 07/09/2001 | 8.07 | 5.10 | 6.14 |
|
| ICE BofA U.S. High Yield Index | — | — | 11.46% | 6.35% | 7.29% |
| % Total Annual Operating Expense Ratios3 | Class A | Class C | Class I | Class R6 |
| Gross | 1.04% | 1.79% | 0.79% | 0.73% |
| Net | 1.02 | 1.77 | 0.77 | 0.71 |
Growth of $10,000
This graph shows the change in value of a hypothetical investment of $10,000 in Class A of the Fund for the period indicated. For comparison, the same investment is shown in the indicated index.
| Growth of Investment2 | Amount Invested | Period Beginning | At NAV | With Maximum Sales Charge |
| Class C | $10,000 | 09/30/2011 | $16,083 | N.A. |
| Class I | $250,000 | 09/30/2011 | $452,635 | N.A. |
| Class R6 | $1,000,000 | 09/30/2011 | $1,814,686 | N.A. |
See Endnotes and Additional Disclosures in this report.
Past performance is no guarantee of future results. Returns are historical and are calculated by determining the percentage change in net asset value (NAV) or offering price (as applicable) with all distributions reinvested. Investment return and principal value will fluctuate so that shares, when redeemed, may be worth more or less than their original cost. Performance for periods less than or equal to one year is cumulative. Performance is for the stated time period only; due to market volatility, current Fund performance may be lower or higher than the quoted return. For performance as of the most recent month-end, please refer to www.calvert.com.
Calvert
High Yield Bond Fund
September 30, 2021
Asset Allocation (% of total investments)
Credit Quality (% of bond and loan holdings)*
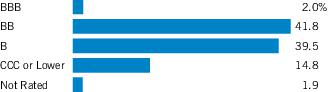
* For purposes of the Fund’s rating restrictions, ratings are based on the average of Moody’s Investor Service, Inc. (“Moody’s”), S&P Global Ratings (“S&P”) or Fitch Ratings (“Fitch”), as applicable. Ratings, which are subject to change, apply to the creditworthiness of the issuers of the underlying securities and not to the Fund or its shares. Credit ratings measure the quality of a bond based on the issuer’s creditworthiness, with ratings ranging from AAA, being the highest, to D, being the lowest based on S&P’s measures. Ratings of BBB or higher by S&P or Fitch (Baa or higher by Moody’s) are considered to be investment-grade quality. Credit ratings are based largely on the ratings agency’s analysis at the time of rating. The rating assigned to any particular security is not necessarily a reflection of the issuer’s current financial condition and does not necessarily reflect its assessment of the volatility of a security’s market value or of the liquidity of an investment in the security. Holdings designated as “Not Rated” (if any) are not rated by the national ratings agencies stated above.
See Endnotes and Additional Disclosures in this report.
Calvert
High Yield Bond Fund
September 30, 2021
Endnotes and Additional Disclosures
| † | The views expressed in this report are those of the portfolio manager(s) and are current only through the date stated at the top of this page. These views are subject to change at any time based upon market or other conditions, and Calvert and the Fund(s) disclaim any responsibility to update such views. These views may not be relied upon as investment advice and, because investment decisions are based on many factors, may not be relied upon as an indication of trading intent on behalf of any Calvert fund. This commentary may contain statements that are not historical facts, referred to as “forward-looking statements.” The Fund’s actual future results may differ significantly from those stated in any forward-looking statement, depending on factors such as changes in securities or financial markets or general economic conditions, the volume of sales and purchases of Fund shares, the continuation of investment advisory, administrative and service contracts, and other risks discussed from time to time in the Fund’s filings with the Securities and Exchange Commission. |
| | |
| 1 | ICE BofA U.S. High Yield Index is an unmanaged index of below-investment grade U.S. corporate bonds. ICE® BofA® indices are not for redistribution or other uses; provided “as is”, without warranties, and with no liability. Eaton Vance has prepared this report and ICE Data Indices, LLC does not endorse it, or guarantee, review, or endorse Eaton Vance’s products. BofA® is a licensed registered trademark of Bank of America Corporation in the United States and other countries. Unless otherwise stated, index returns do not reflect the effect of any applicable sales charges, commissions, expenses, taxes or leverage, as applicable. It is not possible to invest directly in an index. |
| 2 | Total Returns at NAV do not include applicable sales charges. If sales charges were deducted, the returns would be lower. Total Returns shown with maximum sales charge reflect the stated maximum sales charge. Unless otherwise stated, performance does not reflect the deduction of taxes on Fund distributions or redemptions of Fund shares.Performance prior to the inception date of a class may be linked to the performance of an older class of the Fund. This linked performance is adjusted for any applicable sales charge, but is not adjusted for class expense differences. If adjusted for such differences, the performance would be different. The performance of Class C is linked to Class A and the performance of Class R6 is linked to Class I. Performance presented in the Financial Highlights included in the financial statements is not linked.Calvert Research and Management became the investment adviser to the Fund on December 31, 2016. Performance reflected prior to such date is that of the Fund’s former investment adviser. |
| 3 | Source: Fund prospectus. Net expense ratios reflect a contractual expense reimbursement that continues through 1/31/22. Without the reimbursement, if applicable, performance would have been lower. The expense ratios for the current reporting period can be found in the Financial Highlights section of this report. |
| Fund profile subject to change due to active management. |
| | Additional Information |
| | Duration is a measure of the expected change in price of a bond — in percentage terms — given a one percent change in interest rates, all else being constant. Securities with lower durations tend to be less sensitive to interest rate changes. |
| | Risk asset is a term broadly used to describe any asset that is not a high-quality government bond. A risk market refers to markets in these assets. |
| | Bloomberg U.S. Aggregate Bond Index is an unmanaged index of domestic investment-grade bonds, including corporate, government and mortgage-backed securities. |
| | Important Notice to Shareholders |
| | Effective August 24, 2021, the Bloomberg Barclays fixed income indices were rebranded as Bloomberg indices. |
Calvert
High Yield Bond Fund
September 30, 2021
Example
As a Fund shareholder, you incur two types of costs: (1) transaction costs, including sales charges (loads) on purchases and redemption fees (if applicable); and (2) ongoing costs, including management fees; distribution and/or service fees; and other Fund expenses. This Example is intended to help you understand your ongoing costs (in dollars) of Fund investing and to compare these costs with the ongoing costs of investing in other mutual funds. The Example is based on an investment of $1,000 invested at the beginning of the period and held for the entire period (April 1, 2021 to September 30, 2021).
Actual Expenses
The first section of the table below provides information about actual account values and actual expenses. You may use the information in this section, together with the amount you invested, to estimate the expenses that you paid over the period. Simply divide your account value by $1,000 (for example, an $8,600 account value divided by $1,000 = 8.6), then multiply the result by the number in the first section under the heading entitled “Expenses Paid During Period” to estimate the expenses you paid on your account during this period.
Hypothetical Example for Comparison Purposes
The second section of the table below provides information about hypothetical account values and hypothetical expenses based on the actual Fund expense ratio and an assumed rate of return of 5% per year (before expenses), which is not the actual Fund return. The hypothetical account values and expenses may not be used to estimate the actual ending account balance or expenses you paid for the period. You may use this information to compare the ongoing costs of investing in the Fund and other funds. To do so, compare this 5% hypothetical example with the 5% hypothetical examples that appear in the shareholder reports of the other funds.
Please note that the expenses shown in the table are meant to highlight your ongoing costs only and do not reflect any transactional costs, such as sales charges (loads) or redemption fees (if applicable). Therefore, the second section of the table is useful in comparing ongoing costs only, and will not help you determine the relative total costs of owning different funds. In addition, if these transactional costs were included, your costs would be higher.
| | Beginning
Account Value
(4/1/21) | Ending
Account Value
(9/30/21) | Expenses Paid
During Period*
(4/1/21 – 9/30/21) | Annualized
Expense
Ratio |
| Actual | | | | |
| Class A | $1,000.00 | $1,025.30 | $5.13 | 1.01% |
| Class C | $1,000.00 | $1,021.00 | $8.92 | 1.76% |
| Class I | $1,000.00 | $1,026.30 | $3.86 | 0.76% |
| Class R6 | $1,000.00 | $1,026.70 | $3.45 | 0.68% |
| Hypothetical | | | | |
| (5% return per year before expenses) | | | | |
| Class A | $1,000.00 | $1,020.00 | $5.11 | 1.01% |
| Class C | $1,000.00 | $1,016.24 | $8.90 | 1.76% |
| Class I | $1,000.00 | $1,021.26 | $3.85 | 0.76% |
| Class R6 | $1,000.00 | $1,021.66 | $3.45 | 0.68% |
| * | Expenses are equal to the Fund's annualized expense ratio for the indicated Class, multiplied by the average account value over the period, multiplied by 183/365 (to reflect the one-half year period). The Example assumes that the $1,000 was invested at the net asset value per share determined at the close of business on March 31, 2021. |
Calvert
High Yield Bond Fund
September 30, 2021
| Security | Shares | Value |
| Broadcasting — 0.1% |
| iHeartMedia, Inc., Class A(1) | | 15,000 | $ 375,300 |
| | | | $ 375,300 |
| Building Materials — 0.2% |
| AZEK Co., Inc. (The)(1) | | 30,122 | $ 1,100,356 |
| | | | $ 1,100,356 |
| Cable/Satellite TV — 0.2% |
| Liberty Global PLC, Class A(1) | | 40,700 | $ 1,212,860 |
| | | | $ 1,212,860 |
| Containers — 0.1% |
| Ardagh Metal Packaging S.A.(1) | | 49,383 | $ 491,855 |
| | | | $ 491,855 |
| Utilities — 0.4% |
| NextEra Energy Partners, L.P. | | 24,500 | $ 1,846,320 |
| | | | $ 1,846,320 |
Total Common Stocks
(identified cost $3,961,536) | | | $ 5,026,691 |
| Convertible Bonds — 0.0%(2) |
| Security | Principal
Amount
(000's omitted) | Value |
| Leisure — 0.0%(2) |
| Royal Caribbean Cruises, Ltd., 4.25%, 6/15/23 | $ | 75 | $ 105,750 |
Total Convertible Bonds
(identified cost $75,000) | | | $ 105,750 |
| Convertible Preferred Stocks — 0.7% |
| Security | Shares | Value |
| Environmental — 0.4% |
| GFL Environmental, Inc., 6.00%, 3/15/23 | | 21,650 | $ 1,841,116 |
| | | | $ 1,841,116 |
| Security | Shares | Value |
| Healthcare — 0.3% |
| Becton Dickinson and Co., 6.00%, 6/1/23(3) | | 25,930 | $ 1,399,702 |
| | | | $ 1,399,702 |
Total Convertible Preferred Stocks
(identified cost $2,496,899) | | | $ 3,240,818 |
| Security | Principal
Amount
(000's omitted)* | Value |
| Aerospace — 0.6% |
| Moog, Inc., 4.25%, 12/15/27(4) | | 1,329 | $ 1,367,209 |
| Science Applications International Corp., 4.875%, 4/1/28(4) | | 1,571 | 1,625,513 |
| | | | $ 2,992,722 |
| Air Transportation — 1.3% |
| Air Canada: | | | |
| 3.875%, 8/15/26(4) | | 1,068 | $ 1,079,000 |
| 4.625%, 8/15/29(4) | CAD | 1,020 | 807,319 |
| American Airlines, Inc./AAdvantage Loyalty IP, Ltd.: | | | |
| 5.50%, 4/20/26(4) | | 2,652 | 2,791,230 |
| 5.75%, 4/20/29(4) | | 1,652 | 1,782,095 |
| | | | $ 6,459,644 |
| Automotive & Auto Parts — 4.9% |
| Clarios Global, L.P.: | | | |
| 4.375%, 5/15/26(3)(5) | EUR | 772 | $ 926,528 |
| 6.25%, 5/15/26(4) | | 420 | 441,798 |
| 6.75%, 5/15/25(4) | | 182 | 192,238 |
| 8.50%, 5/15/27(4) | | 2,491 | 2,652,915 |
| Ford Motor Co.: | | | |
| 4.75%, 1/15/43 | | 2,109 | 2,213,142 |
| 7.45%, 7/16/31 | | 1,716 | 2,241,268 |
| 8.50%, 4/21/23 | | 976 | 1,074,761 |
| 9.00%, 4/22/25 | | 1,171 | 1,409,626 |
| 9.625%, 4/22/30 | | 490 | 694,195 |
| Ford Motor Credit Co., LLC: | | | |
| 0.999%, (3 mo. USD LIBOR + 0.88%), 10/12/21(6) | | 1,000 | 1,000,007 |
| 2.90%, 2/16/28 | | 241 | 241,000 |
| 3.096%, 5/4/23 | | 374 | 380,545 |
| 3.37%, 11/17/23 | | 200 | 205,230 |
| 3.625%, 6/17/31 | | 352 | 354,640 |
| 3.813%, 10/12/21 | | 200 | 200,350 |
| 3.815%, 11/2/27 | | 242 | 251,378 |
| 4.00%, 11/13/30 | | 1,519 | 1,581,659 |
| 4.125%, 8/17/27 | | 3,341 | 3,547,306 |
7
See Notes to Financial Statements.
Calvert
High Yield Bond Fund
September 30, 2021
Schedule of Investments — continued
| Security | Principal
Amount
(000's omitted)* | Value |
| Automotive & Auto Parts (continued) |
| Ford Motor Credit Co., LLC: (continued) | | | |
| 4.25%, 9/20/22 | | 200 | $ 204,800 |
| 4.271%, 1/9/27 | | 236 | 251,441 |
| 5.125%, 6/16/25 | | 405 | 440,438 |
| 5.596%, 1/7/22 | | 200 | 202,640 |
| Real Hero Merger Sub 2, Inc., 6.25%, 2/1/29(4) | | 1,582 | 1,643,437 |
| Wheel Pros, Inc., 6.50%, 5/15/29(4) | | 1,592 | 1,542,258 |
| | | | $ 23,893,600 |
| Banks & Thrifts — 1.3% |
| CIT Bank NA, 2.969% to 9/27/24, 9/27/25(7) | | 1,000 | $ 1,052,350 |
| CIT Group, Inc., 6.125%, 3/9/28 | | 670 | 810,780 |
| Citigroup, Inc., 6.25% to 8/15/26(7)(8) | | 1,000 | 1,160,210 |
| JPMorgan Chase & Co., Series HH, 4.60% to 2/1/25(7)(8) | | 3,066 | 3,138,818 |
| | | | $ 6,162,158 |
| Broadcasting — 5.0% |
| Audacy Capital Corp., 6.75%, 3/31/29(3)(4) | | 2,210 | $ 2,230,332 |
| Beasley Mezzanine Holdings, LLC, 8.625%, 2/1/26(4) | | 1,606 | 1,640,698 |
| Diamond Sports Group, LLC/Diamond Sports Finance Co., 5.375%, 8/15/26(4) | | 1,423 | 940,959 |
| iHeartCommunications, Inc.: | | | |
| 5.25%, 8/15/27(4) | | 500 | 520,155 |
| 6.375%, 5/1/26 | | 26 | 26,905 |
| 8.375%, 5/1/27 | | 2,217 | 2,372,471 |
| Netflix, Inc.: | | | |
| 4.375%, 11/15/26 | | 500 | 559,375 |
| 4.875%, 6/15/30(4) | | 2,917 | 3,438,414 |
| 5.375%, 11/15/29(4) | | 707 | 857,237 |
| Scripps Escrow II, Inc., 5.375%, 1/15/31(4) | | 1,397 | 1,375,521 |
| Scripps Escrow, Inc., 5.875%, 7/15/27(4) | | 1,794 | 1,843,667 |
| Sirius XM Radio, Inc.: | | | |
| 3.125%, 9/1/26(4) | | 699 | 709,485 |
| 3.875%, 9/1/31(4) | | 1,702 | 1,664,769 |
| 4.125%, 7/1/30(4) | | 1,967 | 1,978,581 |
| 5.00%, 8/1/27(4) | | 802 | 839,093 |
| TEGNA, Inc.: | | | |
| 4.625%, 3/15/28 | | 438 | 448,337 |
| 4.75%, 3/15/26(4) | | 220 | 229,763 |
| 5.00%, 9/15/29 | | 1,001 | 1,032,331 |
| Univision Communications, Inc., 4.50%, 5/1/29(4) | | 1,829 | 1,861,007 |
| | | | $ 24,569,100 |
| Building Materials — 1.7% |
| Boise Cascade Co., 4.875%, 7/1/30(4) | | 1,000 | $ 1,069,325 |
| Security | Principal
Amount
(000's omitted)* | Value |
| Building Materials (continued) |
| SRM Escrow Issuer, LLC, 6.00%, 11/1/28(4) | | 3,559 | $ 3,772,700 |
| Standard Industries, Inc.: | | | |
| 2.25%, 11/21/26(5) | EUR | 500 | 572,628 |
| 4.375%, 7/15/30(4) | | 495 | 505,519 |
| 4.75%, 1/15/28(4) | | 2,000 | 2,077,500 |
| 5.00%, 2/15/27(4) | | 195 | 201,337 |
| | | | $ 8,199,009 |
| Cable/Satellite TV — 4.0% |
| CCO Holdings, LLC/CCO Holdings Capital Corp.: | | | |
| 4.00%, 3/1/23(4) | | 1,000 | $ 1,005,930 |
| 4.25%, 2/1/31(4) | | 763 | 777,192 |
| 4.50%, 8/15/30(4) | | 1,318 | 1,361,454 |
| 4.50%, 5/1/32 | | 273 | 281,531 |
| 4.75%, 3/1/30(4) | | 2,313 | 2,421,075 |
| 5.375%, 6/1/29(4) | | 1,000 | 1,081,250 |
| CSC Holdings, LLC: | | | |
| 3.375%, 2/15/31(4) | | 442 | 411,613 |
| 4.125%, 12/1/30(4) | | 927 | 910,777 |
| 4.625%, 12/1/30(4) | | 1,224 | 1,161,919 |
| 5.75%, 1/15/30(4) | | 1,052 | 1,071,099 |
| 5.875%, 9/15/22 | | 2,000 | 2,071,250 |
| 6.50%, 2/1/29(4) | | 200 | 216,840 |
| 6.75%, 11/15/21 | | 1,000 | 1,003,750 |
| 7.50%, 4/1/28(4) | | 1,200 | 1,298,433 |
| Radiate Holdco, LLC/Radiate Finance, Inc., 4.50%, 9/15/26(4) | | 1,000 | 1,033,750 |
| UPC Holding B.V., 5.50%, 1/15/28(3)(4) | | 766 | 802,749 |
| Ziggo B.V.: | | | |
| 4.875%, 1/15/30(4) | | 721 | 744,432 |
| 5.50%, 1/15/27(4) | | 797 | 824,895 |
| Ziggo Bond Co. B.V., 6.00%, 1/15/27(4) | | 1,420 | 1,470,332 |
| | | | $ 19,950,271 |
| Capital Goods — 1.0% |
| Colfax Corp., 6.375%, 2/15/26(4) | | 750 | $ 790,140 |
| Frigoglass Finance B.V., 6.875%, 2/12/25(5) | EUR | 1,000 | 1,031,975 |
| Madison IAQ, LLC: | | | |
| 4.125%, 6/30/28(4) | | 1,146 | 1,147,450 |
| 5.875%, 6/30/29(4) | | 1,860 | 1,876,377 |
| Roller Bearing Co. of America, Inc., 4.375%, 10/15/29(4)(9) | | 220 | 225,775 |
| | | | $ 5,071,717 |
| Chemicals — 1.8% |
| Compass Minerals International, Inc., 6.75%, 12/1/27(4) | | 2,840 | $ 3,018,565 |
| Herens Holdco S.a.r.l., 4.75%, 5/15/28(4) | | 1,787 | 1,798,169 |
8
See Notes to Financial Statements.
Calvert
High Yield Bond Fund
September 30, 2021
Schedule of Investments — continued
| Security | Principal
Amount
(000's omitted)* | Value |
| Chemicals (continued) |
| SCIH Salt Holdings, Inc.: | | | |
| 4.875%, 5/1/28(4) | | 500 | $ 503,125 |
| 6.625%, 5/1/29(3)(4) | | 592 | 569,072 |
| Unifrax Escrow Issuer Corp., 5.25%, 9/30/28(4) | | 426 | 431,857 |
| WR Grace Holdings, LLC: | | | |
| 4.875%, 6/15/27(4) | | 1,723 | 1,774,690 |
| 5.625%, 8/15/29(4) | | 665 | 686,619 |
| | | | $ 8,782,097 |
| Consumer Products — 0.9% |
| Central Garden & Pet Co., 5.125%, 2/1/28 | | 1,075 | $ 1,136,098 |
| Edgewell Personal Care Co., 5.50%, 6/1/28(4) | | 954 | 1,008,741 |
| Energizer Holdings, Inc., 4.75%, 6/15/28(4) | | 700 | 712,978 |
| Spectrum Brands, Inc.: | | | |
| 5.00%, 10/1/29(4) | | 629 | 677,562 |
| 5.50%, 7/15/30(4) | | 302 | 334,842 |
| 5.75%, 7/15/25 | | 60 | 61,575 |
| Tempur Sealy International, Inc., 3.875%, 10/15/31(4) | | 484 | 485,210 |
| | | | $ 4,417,006 |
| Containers — 1.3% |
| ARD Finance S.A.: | | | |
| 5.00%, (5.00% cash or 5.75% PIK), 6/30/27(5)(10) | EUR | 1,080 | $ 1,301,957 |
| 6.50%, (6.50% cash or 7.25% PIK), 6/30/27(4)(10) | | 593 | 630,715 |
| Ardagh Packaging Finance PLC/Ardagh Holdings USA, Inc.: | | | |
| 4.125%, 8/15/26(4) | | 1,000 | 1,039,250 |
| 5.25%, 8/15/27(4) | | 845 | 861,372 |
| 5.25%, 8/15/27(4) | | 928 | 945,980 |
| Crown Americas, LLC/Crown Americas Capital Corp. V, 4.25%, 9/30/26 | | 1,165 | 1,250,651 |
| Crown Americas, LLC/Crown Americas Capital Corp. VI, 4.75%, 2/1/26 | | 190 | 196,051 |
| | | | $ 6,225,976 |
| Diversified Financial Services — 1.8% |
| Ally Financial, Inc., 4.70% to 5/15/26(7)(8) | | 1,926 | $ 2,010,696 |
| Cargo Aircraft Management, Inc., 4.75%, 2/1/28(4) | | 2,378 | 2,461,824 |
| Coinbase Global, Inc.: | | | |
| 3.375%, 10/1/28(3)(4) | | 1,000 | 962,080 |
| 3.625%, 10/1/31(4) | | 850 | 809,094 |
| MoneyGram International, Inc., 5.375%, 8/1/26(4) | | 937 | 952,226 |
| MSCI, Inc.: | | | |
| 3.625%, 9/1/30(4) | | 1,178 | 1,219,230 |
| 3.875%, 2/15/31(3)(4) | | 552 | 579,600 |
| | | | $ 8,994,750 |
| Security | Principal
Amount
(000's omitted)* | Value |
| Diversified Media — 2.4% |
| Alliance Data Systems Corp., 4.75%, 12/15/24(4) | | 866 | $ 888,090 |
| Cars.com, Inc., 6.375%, 11/1/28(4) | | 1,608 | 1,698,482 |
| Clear Channel Outdoor Holdings, Inc.: | | | |
| 7.50%, 6/1/29(4) | | 2,267 | 2,360,514 |
| 7.75%, 4/15/28(4) | | 1,350 | 1,422,684 |
| Clear Channel Worldwide Holdings, Inc., 5.125%, 8/15/27(4) | | 509 | 527,390 |
| National CineMedia, LLC: | | | |
| 5.75%, 8/15/26 | | 679 | 544,388 |
| 5.875%, 4/15/28(3)(4) | | 1,318 | 1,208,329 |
| Terrier Media Buyer, Inc., 8.875%, 12/15/27(4) | | 2,019 | 2,137,495 |
| TripAdvisor, Inc., 7.00%, 7/15/25(4) | | 1,103 | 1,170,559 |
| | | | $ 11,957,931 |
| Energy — 1.1% |
| Crestwood Midstream Partners, L.P./Crestwood Midstream Finance Corp.: | | | |
| 5.625%, 5/1/27(4) | | 2,038 | $ 2,100,057 |
| 6.00%, 2/1/29(4) | | 1,000 | 1,047,723 |
| New Fortress Energy, Inc., 6.50%, 9/30/26(4) | | 2,501 | 2,394,708 |
| | | | $ 5,542,488 |
| Entertainment/Film — 0.8% |
| AMC Entertainment Holdings, Inc.: | | | |
| 10.50%, 4/15/25(3)(4) | | 363 | $ 388,864 |
| 12.00%, (10.00% cash or 12.00% PIK), 6/15/26(4)(10) | | 854 | 827,313 |
| Cinemark USA, Inc.: | | | |
| 5.25%, 7/15/28(4) | | 833 | 821,704 |
| 5.875%, 3/15/26(4) | | 244 | 246,766 |
| 8.75%, 5/1/25(4) | | 673 | 722,886 |
| Live Nation Entertainment, Inc., 4.75%, 10/15/27(4) | | 1,045 | 1,063,287 |
| | | | $ 4,070,820 |
| Environmental — 1.9% |
| Clean Harbors, Inc., 5.125%, 7/15/29(4) | | 1,000 | $ 1,098,305 |
| Covanta Holding Corp., 5.875%, 7/1/25 | | 1,165 | 1,204,319 |
| GFL Environmental, Inc.: | | | |
| 3.50%, 9/1/28(4) | | 1,538 | 1,549,535 |
| 3.75%, 8/1/25(4) | | 387 | 398,610 |
| 4.00%, 8/1/28(4) | | 1,500 | 1,490,625 |
| 4.75%, 6/15/29(4) | | 1,389 | 1,428,934 |
| Tervita Corp., 11.00%, 12/1/25(4) | | 1,012 | 1,146,854 |
| Waste Pro USA, Inc., 5.50%, 2/15/26(4) | | 845 | 854,624 |
| | | | $ 9,171,806 |
9
See Notes to Financial Statements.
Calvert
High Yield Bond Fund
September 30, 2021
Schedule of Investments — continued
| Security | Principal
Amount
(000's omitted)* | Value |
| Food & Drug Retail — 0.8% |
| Albertsons Cos., LLC/Safeway, Inc./New Albertsons, L.P./Albertsons, LLC: | | | |
| 4.875%, 2/15/30(4) | | 1,360 | $ 1,467,100 |
| 5.875%, 2/15/28(4) | | 1,295 | 1,380,794 |
| Ingles Markets, Inc., 4.00%, 6/15/31(4) | | 1,077 | 1,092,234 |
| | | | $ 3,940,128 |
| Food, Beverage & Tobacco — 4.0% |
| Chobani LLC / Chobani Finance Corp., Inc., 4.625%, 11/15/28(4) | | 500 | $ 516,875 |
| Kraft Heinz Foods Co.: | | | |
| 3.875%, 5/15/27 | | 495 | 540,784 |
| 4.25%, 3/1/31 | | 2,672 | 3,022,506 |
| 4.375%, 6/1/46 | | 2,564 | 2,922,595 |
| 4.625%, 1/30/29 | | 1,000 | 1,142,396 |
| 4.625%, 10/1/39 | | 223 | 260,439 |
| 4.875%, 10/1/49 | | 350 | 426,793 |
| 5.50%, 6/1/50 | | 495 | 654,292 |
| Performance Food Group, Inc.: | | | |
| 4.25%, 8/1/29(4) | | 2,496 | 2,505,385 |
| 5.50%, 10/15/27(4) | | 1,727 | 1,810,431 |
| 6.875%, 5/1/25(4) | | 231 | 245,149 |
| Post Holdings, Inc.: | | | |
| 4.50%, 9/15/31(4) | | 1,824 | 1,804,629 |
| 4.625%, 4/15/30(4) | | 276 | 278,478 |
| 5.50%, 12/15/29(4) | | 500 | 530,670 |
| Simmons Foods, Inc./Simmons Prepared Foods, Inc./Simmons Pet Food, Inc./Simmons Feed, 4.625%, 3/1/29(4) | | 983 | 991,645 |
| US Foods, Inc., 4.75%, 2/15/29(4) | | 1,795 | 1,844,551 |
| | | | $ 19,497,618 |
| Healthcare — 11.0% |
| AdaptHealth, LLC: | | | |
| 4.625%, 8/1/29(4) | | 988 | $ 988,494 |
| 5.125%, 3/1/30(4) | | 383 | 383,724 |
| 6.125%, 8/1/28(4) | | 815 | 867,352 |
| AMN Healthcare, Inc.: | | | |
| 4.00%, 4/15/29(4) | | 528 | 544,812 |
| 4.625%, 10/1/27(4) | | 977 | 1,014,859 |
| Avantor Funding, Inc., 4.625%, 7/15/28(4) | | 1,001 | 1,054,804 |
| Catalent Pharma Solutions, Inc., 2.375%, 3/1/28(5) | EUR | 893 | 1,049,370 |
| Centene Corp.: | | | |
| 2.50%, 3/1/31 | | 2,993 | 2,955,587 |
| 3.00%, 10/15/30 | | 938 | 962,622 |
| 3.375%, 2/15/30 | | 2,026 | 2,100,050 |
| 4.25%, 12/15/27 | | 339 | 355,238 |
| Security | Principal
Amount
(000's omitted)* | Value |
| Healthcare (continued) |
| Centene Corp.: (continued) | | | |
| 4.625%, 12/15/29 | | 2,093 | $ 2,283,568 |
| Charles River Laboratories International, Inc., 4.25%, 5/1/28(4) | | 410 | 426,216 |
| DaVita, Inc.: | | | |
| 3.75%, 2/15/31(4) | | 1,455 | 1,418,625 |
| 4.625%, 6/1/30(4) | | 403 | 415,034 |
| Emergent BioSolutions, Inc., 3.875%, 8/15/28(3)(4) | | 1,823 | 1,775,146 |
| Encompass Health Corp.: | | | |
| 4.50%, 2/1/28 | | 362 | 374,234 |
| 4.625%, 4/1/31 | | 405 | 426,182 |
| 4.75%, 2/1/30 | | 2,142 | 2,255,526 |
| Grifols Escrow Issuer S.A., 4.75%, 10/15/28(4)(9) | | 811 | 829,653 |
| Grifols S.A.: | | | |
| 1.625%, 2/15/25(3)(5) | EUR | 500 | 580,802 |
| 2.25%, 11/15/27(3)(5) | EUR | 465 | 541,541 |
| HCA, Inc.: | | | |
| 3.50%, 9/1/30 | | 1,033 | 1,095,383 |
| 5.00%, 3/15/24 | | 1,000 | 1,097,855 |
| 5.375%, 9/1/26 | | 1,405 | 1,609,287 |
| 5.625%, 9/1/28 | | 495 | 589,520 |
| 5.875%, 2/15/26 | | 1,000 | 1,147,500 |
| 5.875%, 2/1/29 | | 286 | 344,040 |
| HealthEquity, Inc., 4.50%, 10/1/29(4)(9) | | 624 | 634,140 |
| Jaguar Holding Co. II/PPD Development, L.P.: | | | |
| 4.625%, 6/15/25(4) | | 493 | 512,720 |
| 5.00%, 6/15/28(4) | | 435 | 468,786 |
| Jazz Securities DAC, 4.375%, 1/15/29(4) | | 1,876 | 1,946,444 |
| LifePoint Health, Inc.: | | | |
| 4.375%, 2/15/27(4) | | 1,488 | 1,486,140 |
| 5.375%, 1/15/29(4) | | 1,340 | 1,305,542 |
| 6.75%, 4/15/25(4) | | 301 | 316,682 |
| ModivCare Escrow Issuer, Inc., 5.00%, 10/1/29(4) | | 1,048 | 1,087,614 |
| ModivCare, Inc., 5.875%, 11/15/25(4) | | 1,088 | 1,151,920 |
| Molina Healthcare, Inc.: | | | |
| 3.875%, 11/15/30(4) | | 2,506 | 2,621,902 |
| 4.375%, 6/15/28(4) | | 1,731 | 1,803,062 |
| Owens & Minor, Inc., 4.50%, 3/31/29(3)(4) | | 1,309 | 1,323,726 |
| Prestige Brands, Inc., 5.125%, 1/15/28(4) | | 1,116 | 1,165,941 |
| Prime Healthcare Services, Inc., 7.25%, 11/1/25(4) | | 652 | 700,085 |
| RegionalCare Hospital Partners Holdings, Inc./LifePoint Health, Inc., 9.75%, 12/1/26(4) | | 1,238 | 1,309,185 |
| Team Health Holdings, Inc., 6.375%, 2/1/25(4) | | 1,630 | 1,578,150 |
| Teleflex, Inc., 4.625%, 11/15/27 | | 1,245 | 1,299,469 |
| US Acute Care Solutions, LLC, 6.375%, 3/1/26(4) | | 2,247 | 2,373,394 |
10
See Notes to Financial Statements.
Calvert
High Yield Bond Fund
September 30, 2021
Schedule of Investments — continued
| Security | Principal
Amount
(000's omitted)* | Value |
| Healthcare (continued) |
| Varex Imaging Corp., 7.875%, 10/15/27(4) | | 1,243 | $ 1,400,177 |
| | | | $ 53,972,103 |
| Homebuilders/Real Estate — 4.5% |
| Brookfield Property REIT, Inc./BPR Cumulus, LLC/BPR Nimbus, LLC/GGSI Sellco, LLC: | | | |
| 4.50%, 4/1/27(4) | | 1,444 | $ 1,431,365 |
| 5.75%, 5/15/26(3)(4) | | 1,190 | 1,237,600 |
| Brundage-Bone Concrete Pumping Holdings, Inc., 6.00%, 2/1/26(4) | | 1,140 | 1,189,875 |
| Dycom Industries, Inc., 4.50%, 4/15/29(3)(4) | | 1,630 | 1,638,924 |
| Empire Communities Corp., 7.00%, 12/15/25(4) | | 1,646 | 1,722,127 |
| Greystar Real Estate Partners, LLC, 5.75%, 12/1/25(4) | | 2,219 | 2,256,934 |
| HAT Holdings I, LLC/HAT Holdings II, LLC: | | | |
| 3.75%, 9/15/30(4) | | 1,199 | 1,213,124 |
| 6.00%, 4/15/25(4) | | 1,294 | 1,353,848 |
| Iron Mountain, Inc., 5.25%, 7/15/30(4) | | 805 | 855,296 |
| M/I Homes, Inc.: | | | |
| 3.95%, 2/15/30(4) | | 500 | 502,068 |
| 4.95%, 2/1/28 | | 1,000 | 1,047,500 |
| Outfront Media Capital, LLC/Outfront Media Capital Corp.: | | | |
| 4.625%, 3/15/30(4) | | 1,067 | 1,070,598 |
| 6.25%, 6/15/25(4) | | 341 | 360,608 |
| Shea Homes, L.P./Shea Homes Funding Corp.: | | | |
| 4.75%, 2/15/28(4) | | 994 | 1,024,312 |
| 4.75%, 4/1/29(4) | | 722 | 743,411 |
| Taylor Morrison Communities, Inc.: | | | |
| 5.125%, 8/1/30(4) | | 1,309 | 1,410,474 |
| 5.75%, 1/15/28(4) | | 306 | 341,267 |
| 5.875%, 6/15/27(4) | | 224 | 255,640 |
| TopBuild Corp., 4.125%, 2/15/32(4)(9) | | 886 | 897,075 |
| Vivion Investments S.a.r.l.: | | | |
| 3.00%, 8/8/24(3)(5) | EUR | 1,500 | 1,699,212 |
| 3.50%, 11/1/25(5) | EUR | 100 | 115,120 |
| | | | $ 22,366,378 |
| Hotels — 0.1% |
| Hilton Domestic Operating Co., Inc.: | | | |
| 5.375%, 5/1/25(4) | | 199 | $ 208,204 |
| 5.75%, 5/1/28(4) | | 300 | 323,475 |
| | | | $ 531,679 |
| Insurance — 2.0% |
| Alliant Holdings Intermediate, LLC/Alliant Holdings Co-Issuer, 6.75%, 10/15/27(4) | | 2,256 | $ 2,337,961 |
| AmWINS Group, Inc., 4.875%, 6/30/29(4) | | 1,173 | 1,190,947 |
| Security | Principal
Amount
(000's omitted)* | Value |
| Insurance (continued) |
| AssuredPartners, Inc., 5.625%, 1/15/29(4) | | 238 | $ 239,824 |
| BroadStreet Partners, Inc., 5.875%, 4/15/29(4) | | 1,349 | 1,345,769 |
| GTCR AP Finance, Inc., 8.00%, 5/15/27(4) | | 1,543 | 1,630,280 |
| HUB International, Ltd., 7.00%, 5/1/26(4) | | 1,467 | 1,518,345 |
| USI, Inc., 6.875%, 5/1/25(4) | | 1,500 | 1,528,455 |
| | | | $ 9,791,581 |
| Leisure — 2.4% |
| Life Time, Inc.: | | | |
| 5.75%, 1/15/26(4) | | 1,360 | $ 1,409,300 |
| 8.00%, 4/15/26(4) | | 1,423 | 1,510,159 |
| Powdr Corp., 6.00%, 8/1/25(4) | | 1,566 | 1,646,814 |
| Royal Caribbean Cruises, Ltd.: | | | |
| 3.70%, 3/15/28 | | 491 | 471,051 |
| 5.50%, 4/1/28(4) | | 1,567 | 1,605,045 |
| Viking Cruises, Ltd.: | | | |
| 5.875%, 9/15/27(4) | | 1,946 | 1,886,316 |
| 6.25%, 5/15/25(4) | | 1,000 | 1,005,590 |
| 7.00%, 2/15/29(4) | | 360 | 364,631 |
| Viking Ocean Cruises Ship VII, Ltd., 5.625%, 2/15/29(4) | | 1,731 | 1,734,055 |
| | | | $ 11,632,961 |
| Metals/Mining — 1.5% |
| Arconic Rolled Products Corp., 6.125%, 2/15/28(4) | | 1,000 | $ 1,061,270 |
| Constellium SE, 5.875%, 2/15/26(4) | | 1,070 | 1,087,799 |
| Hudbay Minerals, Inc.: | | | |
| 4.50%, 4/1/26(4) | | 1,221 | 1,210,316 |
| 6.125%, 4/1/29(4) | | 1,620 | 1,699,056 |
| Novelis Corp.: | | | |
| 3.25%, 11/15/26(4) | | 500 | 507,740 |
| 3.875%, 8/15/31(4) | | 1,000 | 990,300 |
| 4.75%, 1/30/30(4) | | 927 | 977,012 |
| | | | $ 7,533,493 |
| Paper — 0.5% |
| Enviva Partners, L.P./Enviva Partners Finance Corp., 6.50%, 1/15/26(4) | | 2,218 | $ 2,297,016 |
| | | | $ 2,297,016 |
| Railroad — 0.3% |
| Watco Cos., LLC/Watco Finance Corp., 6.50%, 6/15/27(4) | | 1,450 | $ 1,553,921 |
| | | | $ 1,553,921 |
| Restaurants — 1.6% |
| Carrols Restaurant Group, Inc., 5.875%, 7/1/29(3)(4) | | 1,494 | $ 1,408,237 |
11
See Notes to Financial Statements.
Calvert
High Yield Bond Fund
September 30, 2021
Schedule of Investments — continued
| Security | Principal
Amount
(000's omitted)* | Value |
| Restaurants (continued) |
| Dave & Buster's, Inc., 7.625%, 11/1/25(4) | | 2,291 | $ 2,454,142 |
| IRB Holding Corp.: | | | |
| 6.75%, 2/15/26(4) | | 1,233 | 1,268,449 |
| 7.00%, 6/15/25(4) | | 1,691 | 1,797,491 |
| Yum! Brands, Inc., 3.625%, 3/15/31 | | 1,062 | 1,068,998 |
| | | | $ 7,997,317 |
| Services — 6.2% |
| Avis Budget Car Rental, LLC/Avis Budget Finance, Inc.: | | | |
| 5.375%, 3/1/29(3)(4) | | 961 | $ 1,016,964 |
| 5.75%, 7/15/27(4) | | 247 | 257,861 |
| 5.75%, 7/15/27(4) | | 325 | 339,358 |
| BCPE Empire Holdings, Inc., 7.625%, 5/1/27(4) | | 3,299 | 3,286,629 |
| Beacon Roofing Supply, Inc., 4.125%, 5/15/29(3)(4) | | 2,000 | 1,990,000 |
| Gartner, Inc.: | | | |
| 3.625%, 6/15/29(4) | | 788 | 794,974 |
| 3.75%, 10/1/30(4) | | 333 | 343,140 |
| 4.50%, 7/1/28(4) | | 893 | 938,766 |
| GEMS MENASA Cayman, Ltd./GEMS Education Delaware, LLC, 7.125%, 7/31/26(4) | | 2,720 | 2,792,447 |
| Korn Ferry, 4.625%, 12/15/27(4) | | 1,375 | 1,428,281 |
| LBM Acquisition, LLC, 6.25%, 1/15/29(4) | | 1,277 | 1,278,168 |
| Mav Acquisition Corp.: | | | |
| 5.75%, 8/1/28(4) | | 500 | 491,962 |
| 8.00%, 8/1/29(4) | | 1,576 | 1,507,988 |
| NESCO Holdings II, Inc., 5.50%, 4/15/29(4) | | 1,314 | 1,364,523 |
| Nielsen Co. Luxembourg S.a.r.l. (The), 5.00%, 2/1/25(3)(4) | | 500 | 512,500 |
| Nielsen Finance, LLC/Nielsen Finance Co.: | | | |
| 5.625%, 10/1/28(4) | | 224 | 232,680 |
| 5.875%, 10/1/30(4) | | 224 | 236,123 |
| SRS Distribution, Inc., 6.125%, 7/1/29(3)(4) | | 1,438 | 1,482,952 |
| Summer BC Bidco B, LLC, 5.50%, 10/31/26(4) | | 1,117 | 1,146,210 |
| Terminix Co., LLC (The), 7.45%, 8/15/27 | | 1,619 | 1,965,846 |
| United Rentals North America, Inc., 3.875%, 11/15/27 | | 2,000 | 2,097,500 |
| Univar Solutions USA, Inc., 5.125%, 12/1/27(4) | | 1,118 | 1,175,242 |
| WASH Multifamily Acquisition, Inc., 5.75%, 4/15/26(4) | | 1,537 | 1,606,895 |
| WESCO Distribution, Inc.: | | | |
| 7.125%, 6/15/25(4) | | 434 | 463,677 |
| 7.25%, 6/15/28(4) | | 1,637 | 1,815,024 |
| | | | $ 30,565,710 |
| Steel — 0.5% |
| Infrabuild Australia Pty, Ltd., 12.00%, 10/1/24(3)(4) | | 1,654 | $ 1,757,251 |
| TMS International Corp., 6.25%, 4/15/29(4) | | 893 | 934,301 |
| | | | $ 2,691,552 |
| Security | Principal
Amount
(000's omitted)* | Value |
| Super Retail — 4.3% |
| Asbury Automotive Group, Inc.: | | | |
| 4.50%, 3/1/28 | | 691 | $ 710,003 |
| 4.75%, 3/1/30 | | 177 | 184,965 |
| Bath & Body Works, Inc.: | | | |
| 6.625%, 10/1/30(4) | | 446 | 506,768 |
| 6.75%, 7/1/36 | | 196 | 243,285 |
| 6.875%, 11/1/35 | | 1,502 | 1,886,887 |
| 6.95%, 3/1/33 | | 1,244 | 1,469,494 |
| 7.60%, 7/15/37 | | 88 | 111,203 |
| 9.375%, 7/1/25(4) | | 78 | 99,059 |
| Gap, Inc. (The): | | | |
| 3.625%, 10/1/29(4) | | 1,021 | 1,024,829 |
| 3.875%, 10/1/31(4) | | 354 | 354,443 |
| Group 1 Automotive, Inc., 4.00%, 8/15/28(4) | | 935 | 952,531 |
| Ken Garff Automotive, LLC, 4.875%, 9/15/28(4) | | 1,490 | 1,533,568 |
| LCM Investments Holdings II, LLC: | | | |
| 4.875%, 5/1/29(4) | | 1,282 | 1,317,024 |
| Series SEP, 4.875%, 5/1/29(4) | | 313 | 321,551 |
| Lithia Motors, Inc.: | | | |
| 3.875%, 6/1/29(4) | | 428 | 444,782 |
| 4.375%, 1/15/31(3)(4) | | 651 | 695,756 |
| 4.625%, 12/15/27(4) | | 1,173 | 1,236,706 |
| Penske Automotive Group, Inc., 3.50%, 9/1/25 | | 540 | 556,200 |
| PetSmart, Inc./PetSmart Finance Corp.: | | | |
| 4.75%, 2/15/28(4) | | 1,102 | 1,133,682 |
| 7.75%, 2/15/29(4) | | 2,232 | 2,438,583 |
| Sonic Automotive, Inc., 6.125%, 3/15/27(3) | | 2,000 | 2,081,790 |
| Victoria's Secret & Co., 4.625%, 7/15/29(4) | | 1,506 | 1,536,835 |
| William Carter Co. (The): | | | |
| 5.50%, 5/15/25(3)(4) | | 137 | 144,117 |
| 5.625%, 3/15/27(4) | | 229 | 237,679 |
| | | | $ 21,221,740 |
| Technology — 4.3% |
| Black Knight InfoServ, LLC, 3.625%, 9/1/28(4) | | 1,538 | $ 1,547,612 |
| Booz Allen Hamilton, Inc.: | | | |
| 3.875%, 9/1/28(4) | | 1,913 | 1,963,446 |
| 4.00%, 7/1/29(4) | | 477 | 489,521 |
| CDK Global, Inc., 5.25%, 5/15/29(4) | | 897 | 969,998 |
| Dell International, LLC/EMC Corp., 7.125%, 6/15/24(4) | | 755 | 773,018 |
| Entegris, Inc., 4.375%, 4/15/28(4) | | 893 | 936,694 |
| Imola Merger Corp., 4.75%, 5/15/29(4) | | 2,538 | 2,628,781 |
| LogMeIn, Inc., 5.50%, 9/1/27(4) | | 1,829 | 1,863,294 |
| ON Semiconductor Corp., 3.875%, 9/1/28(4) | | 1,517 | 1,568,199 |
| Open Text Corp., 3.875%, 2/15/28(4) | | 345 | 352,331 |
12
See Notes to Financial Statements.
Calvert
High Yield Bond Fund
September 30, 2021
Schedule of Investments — continued
| Security | Principal
Amount
(000's omitted)* | Value |
| Technology (continued) |
| Open Text Holdings, Inc., 4.125%, 2/15/30(4) | | 1,352 | $ 1,390,870 |
| Presidio Holdings, Inc.: | | | |
| 4.875%, 2/1/27(4) | | 782 | 808,393 |
| 8.25%, 2/1/28(4) | | 1,925 | 2,074,803 |
| Seagate HDD Cayman, 3.125%, 7/15/29(4) | | 456 | 441,568 |
| Sensata Technologies, Inc.: | | | |
| 3.75%, 2/15/31(3)(4) | | 325 | 327,629 |
| 4.375%, 2/15/30(4) | | 199 | 214,479 |
| SS&C Technologies, Inc., 5.50%, 9/30/27(4) | | 648 | 685,058 |
| Viavi Solutions, Inc., 3.75%, 10/1/29(4) | | 655 | 657,260 |
| VM Consolidated, Inc., 5.50%, 4/15/29(4) | | 1,562 | 1,590,889 |
| | | | $ 21,283,843 |
| Telecommunications — 6.0% |
| Connect Finco S.a.r.l./Connect US Finco, LLC, 6.75%, 10/1/26(4) | | 2,500 | $ 2,618,900 |
| DKT Finance ApS, 9.375%, 6/17/23(4) | | 500 | 510,000 |
| LCPR Senior Secured Financing DAC: | | | |
| 5.125%, 7/15/29(4) | | 531 | 547,567 |
| 6.75%, 10/15/27(4) | | 1,252 | 1,328,685 |
| Level 3 Financing, Inc., 4.25%, 7/1/28(4) | | 3,013 | 3,040,057 |
| Lumen Technologies, Inc.: | | | |
| 4.50%, 1/15/29(4) | | 1,087 | 1,054,640 |
| 5.125%, 12/15/26(4) | | 1,000 | 1,038,750 |
| Series W, 6.75%, 12/1/23 | | 123 | 134,993 |
| Sprint Capital Corp., 6.875%, 11/15/28 | | 2,731 | 3,499,094 |
| Sprint Corp.: | | | |
| 7.125%, 6/15/24 | | 1,000 | 1,139,450 |
| 7.625%, 3/1/26 | | 1,000 | 1,212,975 |
| 7.875%, 9/15/23 | | 1,125 | 1,258,425 |
| Telecom Italia Capital S.A., 6.00%, 9/30/34 | | 1,319 | 1,482,226 |
| Telecom Italia SpA, 5.303%, 5/30/24(4) | | 366 | 394,768 |
| T-Mobile USA, Inc.: | | | |
| 2.25%, 2/15/26 | | 451 | 456,637 |
| 2.625%, 2/15/29 | | 563 | 569,648 |
| 2.875%, 2/15/31 | | 1,088 | 1,098,608 |
| 4.75%, 2/1/28 | | 275 | 292,531 |
| 5.375%, 4/15/27 | | 455 | 478,546 |
| Uniti Group, L.P./Uniti Group Finance, Inc./CSL Capital, LLC, 7.125%, 12/15/24(4) | | 1,250 | 1,278,125 |
| ViaSat, Inc.: | | | |
| 5.625%, 4/15/27(4) | | 225 | 234,844 |
| 6.50%, 7/15/28(4) | | 1,250 | 1,318,087 |
| Virgin Media Finance PLC, 5.00%, 7/15/30(4) | | 1,152 | 1,182,874 |
| Virgin Media Vendor Financing Notes III DAC, 4.875%, 7/15/28(5) | GBP | 283 | 389,568 |
| Security | Principal
Amount
(000's omitted)* | Value |
| Telecommunications (continued) |
| Virgin Media Vendor Financing Notes IV DAC, 5.00%, 7/15/28(4) | | 1,005 | $ 1,039,391 |
| Vmed O2 UK Financing I PLC, 4.75%, 7/15/31(4) | | 1,000 | 1,022,930 |
| Zayo Group Holdings, Inc., 6.125%, 3/1/28(4) | | 684 | 694,383 |
| | | | $ 29,316,702 |
| Transport Excluding Air & Rail — 0.7% |
| Seaspan Corp., 5.50%, 8/1/29(4) | | 1,835 | $ 1,874,397 |
| XPO Logistics, Inc., 6.25%, 5/1/25(4) | | 1,500 | 1,585,088 |
| | | | $ 3,459,485 |
| Utilities — 2.9% |
| Calpine Corp.: | | | |
| 4.625%, 2/1/29(4) | | 825 | $ 813,656 |
| 5.00%, 2/1/31(4) | | 935 | 936,169 |
| 5.125%, 3/15/28(4) | | 3,256 | 3,301,532 |
| Clearway Energy Operating, LLC, 4.75%, 3/15/28(4) | | 1,196 | 1,267,581 |
| Drax Finco PLC, 6.625%, 11/1/25(4) | | 1,323 | 1,367,651 |
| Leeward Renewable Energy Operations, LLC, 4.25%, 7/1/29(4) | | 870 | 885,382 |
| NextEra Energy Operating Partners, L.P.: | | | |
| 4.25%, 9/15/24(4) | | 14 | 14,821 |
| 4.50%, 9/15/27(4) | | 904 | 973,594 |
| Pattern Energy Operations, L.P./Pattern Energy Operations, Inc., 4.50%, 8/15/28(4) | | 1,602 | 1,672,088 |
| TerraForm Power Operating, LLC: | | | |
| 4.25%, 1/31/23(4) | | 650 | 669,032 |
| 4.75%, 1/15/30(4) | | 1,000 | 1,047,500 |
| 5.00%, 1/31/28(4) | | 1,402 | 1,507,150 |
| | | | $ 14,456,156 |
Total Corporate Bonds
(identified cost $409,416,920) | | | $420,570,478 |
| Security | Shares | Value |
| Services — 0.3% |
| WESCO International, Inc., Series A, 10.625% to 6/22/25(7) | | 45,970 | $ 1,442,539 |
Total Preferred Stocks
(identified cost $1,291,567) | | | $ 1,442,539 |
13
See Notes to Financial Statements.
Calvert
High Yield Bond Fund
September 30, 2021
Schedule of Investments — continued
| Senior Floating-Rate Loans — 8.0%(11) |
| Borrower/Description | Principal
Amount
(000's omitted) | Value |
| Air Transportation — 0.6% |
| Air Canada, Term Loan, 4.25%, (6 mo. USD LIBOR + 3.50%, Floor 0.75%), 8/11/28 | $ | 1,386 | $ 1,393,796 |
| SkyMiles IP, Ltd., Term Loan, 4.75%, (3 mo. USD LIBOR + 3.75%, Floor 1.00%), 10/20/27 | | 1,387 | 1,476,548 |
| | | | $ 2,870,344 |
| Automotive & Auto Parts — 0.8% |
| Clarios Global, L.P., Term Loan, 3.334%, (1 mo. USD LIBOR + 3.25%), 4/30/26 | $ | 848 | $ 844,413 |
| Truck Hero, Inc., Term Loan, 4.00%, (1 mo. USD LIBOR + 3.25%, Floor 0.75%), 1/31/28 | | 1,809 | 1,807,465 |
| Wheel Pros, Inc., Term Loan, 5.25%, (1 mo. USD LIBOR + 4.50%, Floor 0.75%), 5/11/28 | | 1,278 | 1,279,307 |
| | | | $ 3,931,185 |
| Cable/Satellite TV — 0.1% |
| Directv Financing, LLC, Term Loan, 5.75%, (3 mo. USD LIBOR + 5.00%, Floor 0.75%), 7/22/27 | $ | 712 | $ 713,409 |
| | | | $ 713,409 |
| Capital Goods — 0.3% |
| Welbilt, Inc., Term Loan, 2.584%, (1 mo. USD LIBOR + 2.50%), 10/23/25 | $ | 1,434 | $ 1,432,655 |
| | | | $ 1,432,655 |
| Diversified Media — 0.2% |
| Terrier Media Buyer, Inc., Term Loan, 3.584%, (1 mo. USD LIBOR + 3.50%), 12/17/26 | $ | 983 | $ 981,688 |
| | | | $ 981,688 |
| Food, Beverage & Tobacco — 0.2% |
| Post Holdings, Inc., Term Loan, 4.75%, (1 mo. USD LIBOR + 4.00%, Floor 0.75%), 10/21/24 | $ | 1,047 | $ 1,053,685 |
| | | | $ 1,053,685 |
| Healthcare — 1.0% |
| Envision Healthcare Corporation, Term Loan, 3.834%, (1 mo. USD LIBOR + 3.75%), 10/10/25 | $ | 854 | $ 761,818 |
| Jazz Financing Lux S.a.r.l., Term Loan, 4.00%, (1 mo. USD LIBOR + 3.50%, Floor 0.50%), 5/5/28 | | 2,214 | 2,219,986 |
| RegionalCare Hospital Partners Holdings, Inc., Term Loan, 3.835%, (1 mo. USD LIBOR + 3.75%), 11/16/25 | | 371 | 371,156 |
| Verscend Holding Corp., Term Loan, 4.084%, (1 mo. USD LIBOR + 4.00%), 8/27/25 | | 1,669 | 1,673,407 |
| | | | $ 5,026,367 |
| Borrower/Description | Principal
Amount
(000's omitted) | Value |
| Hotels — 0.4% |
| Playa Resorts Holding B.V., Term Loan, 3.75%, (1 mo. USD LIBOR + 2.75%, Floor 1.00%), 4/29/24 | $ | 2,174 | $ 2,131,837 |
| | | | $ 2,131,837 |
| Insurance — 0.8% |
| Asurion, LLC: | | | |
| Term Loan, 1/20/29(12) | $ | 1,399 | $ 1,395,793 |
| Term Loan - Second Lien, 5.334%, (1 mo. USD LIBOR + 5.25%), 1/31/28 | | 2,240 | 2,236,266 |
| Sedgwick Claims Management Services, Inc., Term Loan, 3.334%, (1 mo. USD LIBOR + 3.25%), 12/31/25 | | 433 | 429,821 |
| | | | $ 4,061,880 |
| Metals/Mining — 0.3% |
| American Rock Salt Company, LLC, Term Loan, 4.75%, (1 mo. USD LIBOR + 4.00%, Floor 0.75%), 6/4/28 | $ | 1,331 | $ 1,339,537 |
| | | | $ 1,339,537 |
| Restaurants — 0.2% |
| IRB Holding Corp., Term Loan, 4.25%, (3 mo. USD LIBOR + 3.25%, Floor 1.00%), 12/15/27 | $ | 782 | $ 784,534 |
| | | | $ 784,534 |
| Services — 1.4% |
| AlixPartners, LLP, Term Loan, 3.25%, (1 mo. USD LIBOR + 2.75%, Floor 0.50%), 2/4/28 | $ | 1,448 | $ 1,445,887 |
| KAR Auction Services, Inc., Term Loan, 2.375%, (1 mo. USD LIBOR + 2.25%), 9/19/26 | | 980 | 965,300 |
| Spin Holdco, Inc., Term Loan, 3/4/28(12) | | 560 | 562,071 |
| SRS Distribution, Inc., Term Loan, 4.25%, (6 mo. USD LIBOR + 3.75%, Floor 0.50%), 6/2/28 | | 1,792 | 1,793,568 |
| Travelport Finance (Luxembourg) S.a.r.l., Term Loan, 2/28/25(12) | | 1,870 | 1,940,374 |
| | | | $ 6,707,200 |
| Super Retail — 0.3% |
| Petsmart, Inc., Term Loan, 4.50%, (6 mo. USD LIBOR + 3.75%, Floor 0.75%), 2/11/28 | $ | 1,358 | $ 1,363,093 |
| | | | $ 1,363,093 |
| Technology — 1.4% |
| Endure Digital, Inc., Term Loan, 4.25%, (6 mo. USD LIBOR + 3.50%, Floor 0.75%), 2/10/28 | $ | 549 | $ 547,080 |
| LogMeIn, Inc., Term Loan, 4.833%, (1 mo. USD LIBOR + 4.75%), 8/31/27 | | 2,491 | 2,493,185 |
| Realpage, Inc., Term Loan, 3.75%, (1 mo. USD LIBOR + 3.25%, Floor 0.50%), 4/24/28 | | 1,812 | 1,808,088 |
14
See Notes to Financial Statements.
Calvert
High Yield Bond Fund
September 30, 2021
Schedule of Investments — continued
| Borrower/Description | Principal
Amount
(000's omitted) | Value |
| Technology (continued) |
| Riverbed Technology, Inc.: | | | |
| Term Loan, 7.00%, (3 mo. USD LIBOR + 6.00%, Floor 1.00%), 12/31/25 | | 1,220 | $ 1,093,803 |
| Term Loan - Second Lien, 12.00%, (3 mo. LIBOR + 11.00%, Floor 1.00%), 7.50% cash, 4.50% PIK, 12/31/26 | | 508 | 348,323 |
| SS&C European Holdings S.a.r.l., Term Loan, 1.834%, (1 mo. USD LIBOR + 1.75%), 4/16/25 | | 63 | 62,276 |
| SS&C Technologies, Inc.: | | | |
| Term Loan, 1.834%, (1 mo. USD LIBOR + 1.75%), 4/16/25 | | 85 | 83,822 |
| Term Loan, 1.834%, (1 mo. USD LIBOR + 1.75%), 4/16/25 | | 438 | 434,028 |
| | | | $ 6,870,605 |
Total Senior Floating-Rate Loans
(identified cost $39,205,928) | | | $ 39,268,019 |
| Security | Principal
Amount | Value |
| Surface Transport — 0.0%(2) | | | |
| Hertz Corp., Escrow Certificates(1) | $ | 400,000 | $ 10,000 |
| Hertz Corp., Escrow Certificates(1) | | 223,000 | 14,495 |
| Hertz Corp., Escrow Certificates(1) | | 636,000 | 15,900 |
Total Miscellaneous
(identified cost $0) | | | $ 40,395 |
| Short-Term Investments — 8.1% |
| Affiliated Fund — 4.8% | | | |
| Description | Units | Value |
| Calvert Cash Reserves Fund, LLC, 0.04%(13) | | 23,501,867 | $ 23,504,217 |
Total Affiliated Fund
(identified cost $23,502,056) | | | $ 23,504,217 |
| Securities Lending Collateral — 3.3% | | | |
| Security | Shares | Value |
| State Street Navigator Securities Lending Government Money Market Portfolio, 0.03%(14) | | 16,592,147 | $ 16,592,147 |
Total Securities Lending Collateral
(identified cost $16,592,147) | | | $ 16,592,147 |
Total Short-Term Investments
(identified cost $40,094,203) | | | $ 40,096,364 |
Total Investments — 103.5%
(identified cost $496,542,053) | | | $509,791,054 |
| Other Assets, Less Liabilities — (3.5)% | | $ (17,157,870) |
| Net Assets — 100.0% | | $492,633,184 |
| The percentage shown for each investment category in the Schedule of Investments is based on net assets. |
| * | In U.S. dollars unless otherwise indicated. |
| (1) | Non-income producing security. |
| (2) | Amount is less than 0.05%. |
| (3) | All or a portion of this security was on loan at September 30, 2021. The aggregate market value of securities on loan at September 30, 2021 was $19,790,709. |
| (4) | Security exempt from registration under Rule 144A of the Securities Act of 1933, as amended. These securities may be sold in certain transactions in reliance on an exemption from registration (normally to qualified institutional buyers). At September 30, 2021, the aggregate value of these securities is $322,121,744 or 65.4% of the Fund's net assets. |
| (5) | Security exempt from registration under Regulation S of the Securities Act of 1933, as amended, which exempts from registration securities offered and sold outside the United States. Security may not be offered or sold in the United States except pursuant to an exemption from, or in a transaction not subject to, the registration requirements of the Securities Act of 1933, as amended. At September 30, 2021, the aggregate value of these securities is $8,208,701 or 1.6% of the Fund's net assets. |
| (6) | Variable rate security. The stated interest rate represents the rate in effect at September 30, 2021. |
| (7) | Security converts to variable rate after the indicated fixed-rate coupon period. |
| (8) | Perpetual security with no stated maturity date but may be subject to calls by the issuer. |
| (9) | When-issued security. |
15
See Notes to Financial Statements.
Calvert
High Yield Bond Fund
September 30, 2021
Schedule of Investments — continued
| (10) | Represents a payment-in-kind security which may pay interest in additional principal at the issuer's discretion. |
| (11) | Senior floating-rate loans (Senior Loans) often require prepayments from excess cash flows or permit the borrowers to repay at their election. The degree to which borrowers repay, whether as a contractual requirement or at their election, cannot be predicted with accuracy. As a result, the actual remaining maturity may be substantially less than the stated maturities shown. However, Senior Loans will typically have an expected average life of approximately two to four years. Senior Loans typically have rates of interest which are redetermined periodically by reference to a base lending rate, plus a spread. These base lending rates are primarily the London Interbank Offered Rate ("LIBOR") and secondarily, the prime rate offered by one or more major United States banks (the "Prime Rate"). Base lending rates may be subject to a floor, or minimum rate. Senior Loans are generally subject to contractual restrictions that must be satisfied before they can be bought or sold. |
| (12) | This Senior Loan will settle after September 30, 2021, at which time the interest rate will be determined. |
| (13) | Affiliated investment company, available to Calvert portfolios and funds, which invests in high quality, U.S. dollar denominated money market instruments. The rate shown is the annualized seven-day yield as of September 30, 2021. |
| (14) | Represents investment of cash collateral received in connection with securities lending. |
Forward Foreign Currency Exchange Contracts
| Currency Purchased | Currency Sold | Counterparty | Settlement
Date | Unrealized
Appreciation | Unrealized
(Depreciation) |
| EUR | 116,587 | USD | 135,207 | State Street Bank and Trust Company | 10/29/21 | $ — | $ (95) |
| USD | 413,947 | CAD | 520,000 | State Street Bank and Trust Company | 10/29/21 | 3,415 | — |
| USD | 403,702 | CAD | 512,021 | State Street Bank and Trust Company | 10/29/21 | — | (530) |
| USD | 7,516,419 | EUR | 6,350,714 | State Street Bank and Trust Company | 10/29/21 | 156,633 | — |
| USD | 606,362 | EUR | 512,815 | State Street Bank and Trust Company | 10/29/21 | 12,065 | — |
| USD | 40,862 | EUR | 34,814 | State Street Bank and Trust Company | 10/29/21 | 517 | — |
| USD | 399,537 | GBP | 287,705 | State Street Bank and Trust Company | 10/29/21 | 11,872 | — |
| USD | 5,647 | GBP | 4,208 | State Street Bank and Trust Company | 10/29/21 | — | (23) |
| | | | | | | $184,502 | $(648) |
| Abbreviations: |
| LIBOR | – London Interbank Offered Rate |
| PIK | – Payment In Kind |
| Currency Abbreviations: |
| CAD | – Canadian Dollar |
| EUR | – Euro |
| GBP | – British Pound Sterling |
| USD | – United States Dollar |
16
See Notes to Financial Statements.
Calvert
High Yield Bond Fund
September 30, 2021
Statement of Assets and Liabilities
| | September 30, 2021 |
| Assets | |
Investments in securities of unaffiliated issuers, at value (identified cost $473,039,997) - including
$19,790,709 of securities on loan | $ 486,286,837 |
| Investments in securities of affiliated issuers, at value (identified cost $23,502,056) | 23,504,217 |
| Receivable for open forward foreign currency exchange contracts | 184,502 |
| Cash | 659,710 |
| Cash denominated in foreign currency, at value (cost $2,513) | 2,470 |
| Receivable for investments sold | 1,743,972 |
| Receivable for capital shares sold | 1,836,552 |
| Interest receivable | 5,661,040 |
| Dividends receivable - affiliated | 1,198 |
| Securities lending income receivable | 4,095 |
| Trustees' deferred compensation plan | 157,675 |
| Total assets | $520,042,268 |
| Liabilities | |
| Payable for open forward foreign currency exchange contracts | $ 648 |
| Payable for investments purchased | 6,887,972 |
| Payable for when-issued securities | 2,558,893 |
| Payable for capital shares redeemed | 637,897 |
| Distributions payable | 161,967 |
| Deposits for securities loaned | 16,592,147 |
| Payable to affiliates: | |
| Investment advisory fee | 192,946 |
| Administrative fee | 48,236 |
| Distribution and service fees | 15,709 |
| Sub-transfer agency fee | 3,247 |
| Trustees' deferred compensation plan | 157,675 |
| Other | 369 |
| Accrued expenses | 151,378 |
| Total liabilities | $ 27,409,084 |
| Net Assets | $492,633,184 |
| Sources of Net Assets | |
| Paid-in capital | $ 490,646,494 |
| Distributable earnings | 1,986,690 |
| Total | $492,633,184 |
| Class A Shares | |
| Net Assets | $ 55,739,645 |
| Shares Outstanding | 2,029,477 |
Net Asset Value and Redemption Price Per Share
(net assets ÷ shares of beneficial interest outstanding) | $ 27.47 |
Maximum Offering Price Per Share
(100 ÷ 96.25 of net asset value per share) | $ 28.54 |
| Class C Shares | |
| Net Assets | $ 5,199,477 |
| Shares Outstanding | 186,397 |
Net Asset Value and Offering Price Per Share*
(net assets ÷ shares of beneficial interest outstanding) | $ 27.89 |
17
See Notes to Financial Statements.
Calvert
High Yield Bond Fund
September 30, 2021
Statement of Assets and Liabilities — continued
| | September 30, 2021 |
| Class I Shares | |
| Net Assets | $380,658,723 |
| Shares Outstanding | 14,060,709 |
Net Asset Value, Offering Price and Redemption Price Per Share
(net assets ÷ shares of beneficial interest outstanding) | $ 27.07 |
| Class R6 Shares | |
| Net Assets | $ 51,035,339 |
| Shares Outstanding | 1,884,434 |
Net Asset Value, Offering Price and Redemption Price Per Share
(net assets ÷ shares of beneficial interest outstanding) | $ 27.08 |
| On sales of $50,000 or more, the offering price of Class A shares is reduced. |
| * | Redemption price per share is equal to the net asset value less any applicable contingent deferred sales charge. |
18
See Notes to Financial Statements.
Calvert
High Yield Bond Fund
September 30, 2021
| | Year Ended |
| | September 30, 2021 |
| Investment Income | |
| Dividend income | $ 277,156 |
| Dividend income - affiliated issuers | 14,078 |
| Interest and other income | 19,925,191 |
| Securities lending income, net | 44,028 |
| Total investment income | $20,260,453 |
| Expenses | |
| Investment advisory fee | $ 1,964,447 |
| Administrative fee | 491,112 |
| Distribution and service fees: | |
| Class A | 131,464 |
| Class C | 53,080 |
| Trustees' fees and expenses | 19,314 |
| Custodian fees | 13,062 |
| Transfer agency fees and expenses | 336,864 |
| Accounting fees | 92,339 |
| Professional fees | 40,414 |
| Registration fees | 88,721 |
| Reports to shareholders | 25,339 |
| Miscellaneous | 30,759 |
| Total expenses | $ 3,286,915 |
| Net investment income | $16,973,538 |
| Realized and Unrealized Gain (Loss) | |
| Net realized gain (loss): | |
| Investment securities | $ 5,723,787 |
| Investment securities - affiliated issuers | (2,039) |
| Foreign currency transactions | 8,736 |
| Forward foreign currency exchange contracts | (92,877) |
| Net realized gain | $ 5,637,607 |
| Change in unrealized appreciation (depreciation): | |
| Investment securities | $ 6,166,401 |
| Investment securities - affiliated issuers | 2,603 |
| Foreign currency | (4,280) |
| Forward foreign currency exchange contracts | 124,496 |
| Net change in unrealized appreciation (depreciation) | $ 6,289,220 |
| Net realized and unrealized gain | $11,926,827 |
| Net increase in net assets from operations | $28,900,365 |
19
See Notes to Financial Statements.
Calvert
High Yield Bond Fund
September 30, 2021
Statements of Changes in Net Assets
| | Year Ended September 30, |
| | 2021 | 2020 |
| Increase (Decrease) in Net Assets | | |
| From operations: | | |
| Net investment income | $ 16,973,538 | $ 11,136,701 |
| Net realized gain (loss) | 5,637,607 | (2,598,215) |
| Net change in unrealized appreciation (depreciation) | 6,289,220 | 3,001,998 |
| Net increase in net assets from operations | $ 28,900,365 | $ 11,540,484 |
| Distributions to shareholders: | | |
| Class A | $ (2,150,197) | $ (2,299,606) |
| Class C | (177,159) | (158,948) |
| Class I | (13,706,643) | (9,437,095) |
| Class R6 | (1,466,108) | (6,439) |
| Total distributions to shareholders | $ (17,500,107) | $ (11,902,088) |
| Capital share transactions: | | |
| Class A | $ 4,383,484 | $ (360,409) |
| Class C | (79,886) | 1,225,417 |
| Class I | 98,023,196 | 123,339,654 |
| Class R6 | 49,844,561 | 178,331 |
| Net increase in net assets from capital share transactions | $152,171,355 | $124,382,993 |
| Net increase in net assets | $163,571,613 | $124,021,389 |
| Net Assets | | |
| At beginning of year | $ 329,061,571 | $ 205,040,182 |
| At end of year | $492,633,184 | $329,061,571 |
20
See Notes to Financial Statements.
Calvert
High Yield Bond Fund
September 30, 2021
| | Class A |
| | Year Ended September 30, |
| | 2021 | 2020 | 2019 | 2018 | 2017 |
| Net asset value — Beginning of year | $ 26.56 | $ 27.20 | $ 26.73 | $ 27.67 | $ 27.30 |
| Income (Loss) From Operations | | | | | |
| Net investment income(1) | $ 1.08 | $ 1.15 | $ 1.24 | $ 1.23 | $ 1.30 |
| Net realized and unrealized gain (loss) | 0.95 | (0.56) | 0.49 | (0.96) | 0.36 |
| Total income from operations | $ 2.03 | $ 0.59 | $ 1.73 | $ 0.27 | $ 1.66 |
| Less Distributions | | | | | |
| From net investment income | $ (1.12) | $ (1.23) | $ (1.26) | $ (1.21) | $ (1.29) |
| Total distributions | $ (1.12) | $ (1.23) | $ (1.26) | $ (1.21) | $ (1.29) |
| Net asset value — End of year | $ 27.47 | $ 26.56 | $ 27.20 | $ 26.73 | $ 27.67 |
| Total Return(2) | 7.74% | 2.30% | 6.70% | 1.00% | 6.23% |
| Ratios/Supplemental Data | | | | | |
| Net assets, end of year (000’s omitted) | $55,740 | $49,682 | $51,273 | $51,118 | $61,471 |
| Ratios (as a percentage of average daily net assets):(3) | | | | | |
| Total expenses | 1.01% | 1.04% | 1.07% | 1.10% | 1.21% |
| Net expenses | 1.01% | 1.02% | 1.04% | 1.07% | 1.07% |
| Net investment income | 3.95% | 4.36% | 4.65% | 4.53% | 4.74% |
| Portfolio Turnover | 43% | 49% | 39% | 49% | 67% |
| (1) | Computed using average shares outstanding. |
| (2) | Returns are historical and are calculated by determining the percentage change in net asset value with all distributions reinvested and do not reflect the effect of sales charges, if any. |
| (3) | Total expenses do not reflect amounts reimbursed and/or waived by the adviser and certain of its affiliates, if applicable. Net expenses are net of all reductions and represent the net expenses paid by the Fund. |
21
See Notes to Financial Statements.
Calvert
High Yield Bond Fund
September 30, 2021
Financial Highlights — continued
| | Class C |
| | Year Ended September 30, |
| | 2021 | 2020 | 2019 | 2018 | 2017 |
| Net asset value — Beginning of year | $ 26.98 | $ 27.62 | $ 27.14 | $ 28.07 | $ 27.68 |
| Income (Loss) From Operations | | | | | |
| Net investment income(1) | $ 0.89 | $ 0.96 | $ 1.05 | $ 1.04 | $ 1.11 |
| Net realized and unrealized gain (loss) | 0.95 | (0.55) | 0.50 | (0.97) | 0.36 |
| Total income from operations | $ 1.84 | $ 0.41 | $ 1.55 | $ 0.07 | $ 1.47 |
| Less Distributions | | | | | |
| From net investment income | $ (0.93) | $ (1.05) | $ (1.07) | $ (1.00) | $ (1.08) |
| Total distributions | $ (0.93) | $ (1.05) | $ (1.07) | $ (1.00) | $ (1.08) |
| Net asset value — End of year | $27.89 | $26.98 | $27.62 | $27.14 | $28.07 |
| Total Return(2) | 6.88% | 1.58% | 5.89% | 0.27% | 5.43% |
| Ratios/Supplemental Data | | | | | |
| Net assets, end of year (000’s omitted) | $ 5,199 | $ 5,106 | $ 3,977 | $ 4,476 | $ 5,507 |
| Ratios (as a percentage of average daily net assets):(3) | | | | | |
| Total expenses | 1.76% | 1.79% | 1.82% | 1.85% | 2.38% |
| Net expenses | 1.76% | 1.77% | 1.79% | 1.82% | 1.82% |
| Net investment income | 3.21% | 3.58% | 3.91% | 3.77% | 3.98% |
| Portfolio Turnover | 43% | 49% | 39% | 49% | 67% |
| (1) | Computed using average shares outstanding. |
| (2) | Returns are historical and are calculated by determining the percentage change in net asset value with all distributions reinvested and do not reflect the effect of sales charges, if any. |
| (3) | Total expenses do not reflect amounts reimbursed and/or waived by the adviser and certain of its affiliates, if applicable. Net expenses are net of all reductions and represent the net expenses paid by the Fund. |
22
See Notes to Financial Statements.
Calvert
High Yield Bond Fund
September 30, 2021
Financial Highlights — continued
| | Class I |
| | Year Ended September 30, |
| | 2021 | 2020 | 2019 | 2018 | 2017 |
| Net asset value — Beginning of year | $ 26.18 | $ 26.80 | $ 26.35 | $ 27.27 | $ 26.93 |
| Income (Loss) From Operations | | | | | |
| Net investment income(1) | $ 1.13 | $ 1.18 | $ 1.29 | $ 1.30 | $ 1.37 |
| Net realized and unrealized gain (loss) | 0.93 | (0.52) | 0.47 | (0.94) | 0.35 |
| Total income from operations | $ 2.06 | $ 0.66 | $ 1.76 | $ 0.36 | $ 1.72 |
| Less Distributions | | | | | |
| From net investment income | $ (1.17) | $ (1.28) | $ (1.31) | $ (1.28) | $ (1.38) |
| Total distributions | $ (1.17) | $ (1.28) | $ (1.31) | $ (1.28) | $ (1.38) |
| Net asset value — End of year | $ 27.07 | $ 26.18 | $ 26.80 | $ 26.35 | $ 27.27 |
| Total Return(2) | 7.98% | 2.59% | 6.93% | 1.35% | 6.57% |
| Ratios/Supplemental Data | | | | | |
| Net assets, end of year (000’s omitted) | $380,659 | $274,030 | $149,733 | $125,471 | $76,980 |
| Ratios (as a percentage of average daily net assets):(3) | | | | | |
| Total expenses | 0.76% | 0.79% | 0.82% | 0.85% | 0.79% |
| Net expenses | 0.76% | 0.77% | 0.76% | 0.74% | 0.74% |
| Net investment income | 4.18% | 4.53% | 4.92% | 4.87% | 5.06% |
| Portfolio Turnover | 43% | 49% | 39% | 49% | 67% |
| (1) | Computed using average shares outstanding. |
| (2) | Returns are historical and are calculated by determining the percentage change in net asset value with all distributions reinvested and do not reflect the effect of sales charges, if any. |
| (3) | Total expenses do not reflect amounts reimbursed and/or waived by the adviser and certain of its affiliates, if applicable. Net expenses are net of all reductions and represent the net expenses paid by the Fund. |
23
See Notes to Financial Statements.
Calvert
High Yield Bond Fund
September 30, 2021
Financial Highlights — continued
| | Class R6 |
| | Year Ended September 30, | Period Ended
September 30, |
| | 2021 | 2020 | 2019 (1) |
| Net asset value — Beginning of period | $ 26.19 | $ 26.81 | $ 25.96 |
| Income (Loss) From Operations | | | |
| Net investment income(2) | $ 1.14 | $ 1.17 | $ 0.85 |
| Net realized and unrealized gain (loss) | 0.95 | (0.49) | 0.86 |
| Total income from operations | $ 2.09 | $ 0.68 | $ 1.71 |
| Less Distributions | | | |
| From net investment income | $ (1.20) | $ (1.30) | $ (0.86) |
| Total distributions | $ (1.20) | $ (1.30) | $ (0.86) |
| Net asset value — End of period | $ 27.08 | $26.19 | $26.81 |
| Total Return(3) | 8.07% | 2.66% | 6.67% (4) |
| Ratios/Supplemental Data | | | |
| Net assets, end of period (000’s omitted) | $51,035 | $ 244 | $ 57 |
| Ratios (as a percentage of average daily net assets):(5) | | | |
| Total expenses | 0.69% | 0.73% | 0.74% (6) |
| Net expenses | 0.69% | 0.71% | 0.71% (6) |
| Net investment income | 4.22% | 4.51% | 4.85% (6) |
| Portfolio Turnover | 43% | 49% | 39% (7) |
| (1) | For the period from the commencement of operations, February 1, 2019, to September 30, 2019. |
| (2) | Computed using average shares outstanding. |
| (3) | Returns are historical and are calculated by determining the percentage change in net asset value with all distributions reinvested and do not reflect the effect of sales charges, if any. |
| (4) | Not annualized. |
| (5) | Total expenses do not reflect amounts reimbursed and/or waived by the adviser and certain of its affiliates, if applicable. Net expenses are net of all reductions and represent the net expenses paid by the Fund. |
| (6) | Annualized. |
| (7) | For the year ended September 30, 2019. |
24
See Notes to Financial Statements.
Calvert
High Yield Bond Fund
September 30, 2021
Notes to Financial Statements
1 Significant Accounting Policies
Calvert High Yield Bond Fund (the Fund) is a diversified series of The Calvert Fund (the Trust). The Trust is a Massachusetts business trust registered under the Investment Company Act of 1940, as amended (the 1940 Act), as an open-end management investment company. The investment objective of the Fund is to seek high current income and capital appreciation, secondarily. The Fund invests primarily in high-yield, high-risk bonds, with varying maturities.
The Fund offers four classes of shares. Class A shares are generally sold subject to a sales charge imposed at time of purchase. A contingent deferred sales charge of 0.80% may apply to certain redemptions of Class A shares for accounts for which no sales charge was paid, if redeemed within 12 months of purchase. Class C shares are sold without a front-end sales charge, and with certain exceptions, are charged a contingent deferred sales charge of 1% on shares redeemed within 12 months of purchase. Class C shares are only available for purchase through a financial intermediary. Effective January 25, 2019, Class C shares generally automatically convert to Class A shares ten years after their purchase and, effective November 5, 2020, automatically convert to Class A shares eight years after their purchase as described in the Fund's prospectus. Class I and Class R6 shares are sold at net asset value, are not subject to a sales charge and are sold only to certain eligible investors. Each class represents a pro rata interest in the Fund, but votes separately on class-specific matters and is subject to different expenses.
The Fund applies the accounting and reporting guidance in the Financial Accounting Standards Board (FASB) Accounting Standards Codification Topic 946, Financial Services – Investment Companies (ASC 946). Subsequent events, if any, through the date that the financial statements were issued have been evaluated in the preparation of the financial statements.
A Investment Valuation— Net asset value per share is determined every business day as of the close of the regular session of the New York Stock Exchange (generally 4:00 p.m. Eastern time). The Fund uses independent pricing services approved by the Board of Trustees (the Board) to value its investments wherever possible. Investments for which market quotations are not available or deemed not reliable are fair valued in good faith under the direction of the Board.
U.S. generally accepted accounting principles (U.S. GAAP) establishes a disclosure hierarchy that categorizes the inputs to valuation techniques used to value assets and liabilities at measurement date. These inputs are summarized in the three broad levels listed below:
Level 1 - quoted prices in active markets for identical securities
Level 2 - other significant observable inputs (including quoted prices for similar securities, interest rates, prepayment speeds, credit risk, etc.)
Level 3 - significant unobservable inputs (including the Fund’s own assumptions in determining the fair value of investments)
The inputs or methodologies used for valuing securities are not necessarily an indication of the risk associated with investing in those securities.
Valuation techniques used to value the Fund’s investments by major category are as follows:
Equity Securities. Equity securities (including warrants and rights) listed on a U.S. securities exchange generally are valued at the last sale or closing price as reported by an independent pricing service on the primary market or exchange on which they are traded and are categorized as Level 1 in the hierarchy. Equity securities listed on the NASDAQ National Market System are valued at the NASDAQ official closing price and are categorized as Level 1 in the hierarchy. Unlisted or listed securities for which closing sales prices or closing quotations are not available are valued at the mean between the latest available bid and ask prices and are categorized as Level 2 in the hierarchy.
Debt Securities. Debt securities are generally valued based on valuations provided by third party pricing services, as derived from such services’ pricing models. Inputs to the models may include, but are not limited to, reported trades, executable bid and ask prices, broker/dealer quotations, prices or yields of securities with similar characteristics, interest rates, anticipated prepayments, benchmark curves or information pertaining to the issuer, as well as industry and economic events. Accordingly, debt securities are generally categorized as Level 2 in the hierarchy. Short-term debt securities with a remaining maturity at time of purchase of more than sixty days are valued based on valuations provided by a third party pricing service. Such securities are generally categorized as Level 2 in the hierarchy. Short-term debt securities of sufficient credit quality purchased with remaining maturities of sixty days or less for which a valuation from a third party pricing service is not readily available may be valued at amortized cost, which approximates fair value, and are categorized as Level 2 in the hierarchy.
Senior Floating-Rate Loans. Interests in senior floating-rate loans for which reliable market quotations are readily available are valued generally at the average mean of bid and ask quotations obtained from a third party pricing service, and are categorized as Level 2 in the hierarchy.
Affiliated Fund. The Fund may invest in Calvert Cash Reserves Fund, LLC (Cash Reserves Fund), an affiliated investment company managed by Calvert Research and Management (CRM). While Cash Reserves Fund is not a registered money market mutual fund, it conducts all of its investment activities in accordance with the requirements of Rule 2a-7 under the 1940 Act. Investments in Cash Reserves Fund are valued at the closing net asset value per unit on the valuation day and are categorized as Level 2 in the hierarchy. Cash Reserves Fund generally values its investment securities based on available market quotations provided by a third party pricing service.
Other Securities. Investments in registered investment companies (including money market funds) that do not trade on an exchange are valued at the net asset value per share on the valuation day and are categorized as Level 1 in the hierarchy.
Calvert
High Yield Bond Fund
September 30, 2021
Notes to Financial Statements — continued
Derivatives. Forward foreign currency exchange contracts are generally valued at the mean of the average bid and average ask prices that are reported by currency dealers to a third party pricing service at the valuation time. Such third party pricing service valuations are supplied for specific settlement periods and the Fund's forward foreign currency exchange contracts are valued at an interpolated rate between the closest preceding and subsequent settlement period reported by the third party pricing service and are categorized as Level 2 in the hierarchy.
Fair Valuation. If a market value cannot be determined for a security using the methodologies described above, or if, in the good faith opinion of the Fund's adviser, the market value does not constitute a readily available market quotation, or if a significant event has occurred that would materially affect the value of the security, the security will be fair valued as determined in good faith by or at the direction of the Board in a manner that most fairly reflects the security’s “fair value”, which is the amount that the Fund might reasonably expect to receive for the security upon its current sale in the ordinary course. Each such determination is based on a consideration of relevant factors, which are likely to vary from one pricing context to another. These factors may include, but are not limited to, the type of security, the existence of any contractual restrictions on the security’s disposition, the price and extent of public trading in similar securities of the issuer or of comparable companies or entities, quotations or relevant information obtained from broker/dealers or other market participants, information obtained from the issuer, analysts, and/or the appropriate stock exchange (for exchange-traded securities), an analysis of the company’s or entity’s financial statements, and an evaluation of the forces that influence the issuer and the market(s) in which the security is purchased and sold.
The values assigned to fair value investments are based on available information and do not necessarily represent amounts that might ultimately be realized. Further, due to the inherent uncertainty of valuations of such investments, the fair values may differ significantly from the values that would have been used had an active market existed, and the differences could be material.
The following table summarizes the market value of the Fund's holdings as of September 30, 2021, based on the inputs used to value them:
| Asset Description | Level 1(1) | Level 2 | Level 3 | Total |
| Common Stocks | $ 5,026,691(1) | $ — | $ — | $ 5,026,691 |
| Convertible Bonds | — | 105,750 | — | 105,750 |
| Convertible Preferred Stocks | 3,240,818 | — | — | 3,240,818 |
| Corporate Bonds | — | 420,570,478 | — | 420,570,478 |
| Preferred Stocks | 1,442,539 | — | — | 1,442,539 |
| Senior Floating-Rate Loans | — | 39,268,019 | — | 39,268,019 |
| Miscellaneous | — | 40,395 | — | 40,395 |
| Short-Term Investments: | | | | |
| Affiliated Fund | — | 23,504,217 | — | 23,504,217 |
| Securities Lending Collateral | 16,592,147 | — | — | 16,592,147 |
| Total Investments | $26,302,195 | $483,488,859 | $ — | $509,791,054 |
| Forward Foreign Currency Exchange Contracts | $ — | $ 184,502 | $ — | $ 184,502 |
| Total | $26,302,195 | $483,673,361 | $ — | $509,975,556 |
| Liability Description | | | | |
| Forward Foreign Currency Exchange Contracts | $ — | $ (648) | $ — | $ (648) |
| Total | $ — | $ (648) | $ — | $ (648) |
| (1) | The level classification by major category of investments is the same as the category presentation in the Schedule of Investments. |
B Investment Transactions and Income— Investment transactions for financial statement purposes are accounted for on trade date. Realized gains and losses are recorded on an identified cost basis and may include proceeds from litigation. Dividend income is recorded on the ex-dividend date for dividends received in cash and/or securities. Non-cash dividends are recorded at the fair value of the securities received. Withholding taxes on foreign interest, if any, have been provided for in accordance with the Fund’s understanding of the applicable country’s tax rules and rates. Interest income, which includes amortization of premium and accretion of discount on debt securities, is accrued as earned. The Fund may earn certain fees in connection with its investments in senior floating-rate loans. These fees are in addition to interest payments earned and may include amendment fees, consent fees and prepayment fees, which are recorded to income as earned.
C Share Class Accounting— Realized and unrealized gains and losses are allocated daily to each class of shares based upon the relative net assets of each class to the total net assets of the Fund. Net investment income, other than class-specific expenses, is allocated daily to each class of shares based upon the ratio of the value of each class's paid shares to the total value of all paid shares. Expenses arising in connection with a specific class are charged
Calvert
High Yield Bond Fund
September 30, 2021
Notes to Financial Statements — continued
directly to that class. Sub-accounting, recordkeeping and similar administrative fees payable to financial intermediaries, which are a component of transfer agency fees and expenses on the Statement of Operations, are not allocated to Class R6 shares.
D Foreign Currency Transactions— The Fund’s accounting records are maintained in U.S. dollars. For valuation of assets and liabilities on each date of net asset value determination, foreign denominations are converted into U.S. dollars using the current exchange rate. Security transactions, income and expenses are translated at the prevailing rate of exchange on the date of the event. Recognized gains or losses on investment transactions attributable to changes in foreign currency exchange rates are recorded for financial statement purposes as net realized gains and losses on investments. That portion of unrealized gains and losses on investments that results from fluctuations in foreign currency exchange rates is not separately disclosed.
E Senior Floating-Rate Loans— The Fund may invest in direct debt instruments, which are interests in amounts owed to lenders or lending syndicates by corporate, governmental, or other borrowers. The Fund’s investment in loans may be in the form of participations in loans or assignments of all or a portion of loans from third parties. A loan is often administered by a bank or other financial institution (the lender) that acts as agent for all holders. The agent administers the terms of the loan, as specified in the loan agreement. The Fund may invest in multiple series or tranches of a loan, which may have varying terms and carry different associated risks. When the Fund purchases assignments from lenders, it acquires direct rights against the borrower of the loan. When investing in a loan participation, the Fund has the right to receive payments of principal, interest and any fees to which it is entitled only from the lender selling the loan agreement and only upon receipt of such payments by the lender from the borrower. The Fund generally has no right to enforce compliance by the borrower with the terms of the loan agreement. As a result, the Fund may be subject to the credit risk of both the borrower and the lender that is issuing the participation interest.
F Forward Foreign Currency Exchange Contracts— The Fund may enter into forward foreign currency exchange contracts for the purchase or sale of a specific foreign currency at a fixed price on a future date. The forward foreign currency exchange contracts are adjusted by the daily exchange rate of the underlying currency and any gains or losses are recorded as unrealized until such time as the contracts have been closed. Risks may arise upon entering these contracts from the potential inability of counterparties to meet the terms of their contracts and from movements in the value of a foreign currency relative to the U.S. dollar.
G Distributions to Shareholders— Distributions to shareholders are recorded by the Fund on ex-dividend date. The Fund declares income distributions daily to shareholders of record at the time of declaration and generally pays them monthly. The Fund makes distributions of net realized capital gains, if any, at least annually. Distributions are declared separately for each class of shares. Distributions are determined in accordance with income tax regulations, which may differ from U.S. GAAP; accordingly, periodic reclassifications are made within the Fund’s capital accounts to reflect income and gains available for distribution under income tax regulations.
H Estimates— The preparation of financial statements in conformity with U.S. GAAP requires management to make estimates and assumptions that affect the reported amounts of assets and liabilities and disclosure of contingent assets and liabilities at the date of the financial statements and the reported amounts of increases and decreases in net assets from operations during the reporting period. Actual results could differ from those estimates.
I Indemnifications— Under the Trust’s organizational document, its officers and Trustees may be indemnified against certain liabilities and expenses arising out of the performance of their duties to the Fund. Under Massachusetts law, if certain conditions prevail, shareholders of a Massachusetts business trust (such as the Trust) could be deemed to have personal liability for the obligations of the Trust. However, the Trust’s Declaration of Trust contains an express disclaimer of liability on the part of Fund shareholders and provides that the Trust shall assume, upon request by the shareholder, the defense on behalf of any Fund shareholders or former shareholders. Additionally, in the normal course of business, the Fund enters into agreements with service providers that may contain indemnification clauses. The Fund’s maximum exposure under these arrangements is unknown as this would involve future claims that may be made against the Fund that have not yet occurred.
J Federal Income Taxes— No provision for federal income or excise tax is required since the Fund intends to continue to qualify as a regulated investment company under the Internal Revenue Code and to distribute substantially all of its taxable earnings.
Management has analyzed the Fund's tax positions taken for all open federal income tax years and has concluded that no provision for federal income tax is required in the Fund's financial statements. A Fund's federal tax return is subject to examination by the Internal Revenue Service for a period of three years from the date of filing.
K When-Issued Securities and Delayed Delivery Transactions— The Fund may purchase securities on a delayed delivery or when-issued basis. Payment and delivery may take place after the customary settlement period for that security. At the time the transaction is negotiated, the price of the security that will be delivered is fixed. The Fund maintains cash and/or security positions for these commitments such that sufficient liquid assets will be available to make payments upon settlement. Securities purchased on a delayed delivery or when-issued basis are marked-to-market daily and begin earning interest on settlement date. Such security purchases are subject to the risk that when delivered they will be worth less than the agreed upon payment price. Losses may also arise if the counterparty does not perform under the contract.
Calvert
High Yield Bond Fund
September 30, 2021
Notes to Financial Statements — continued
2 Related Party Transactions
The investment advisory fee is earned by CRM as compensation for investment advisory services rendered to the Fund. On March 1, 2021, Morgan Stanley acquired Eaton Vance Corp. (the “Transaction”) and CRM became an indirect, wholly-owned subsidiary of Morgan Stanley. In connection with the Transaction, the Fund entered into a new investment advisory agreement (the “New Agreement”) with CRM, which took effect on March 1, 2021. Pursuant to the New Agreement (and the Fund’s investment advisory agreement with CRM in effect prior to March 1, 2021), the fee is computed at the annual rate of 0.48% of the Fund’s average daily net assets and is payable monthly. For the year ended September 30, 2021, the investment advisory fee amounted to $1,964,447. The Fund may invest its cash in Cash Reserves Fund. CRM does not currently receive a fee for advisory services provided to Cash Reserves Fund.
CRM has agreed to reimburse the Fund's operating expenses to the extent that total annual operating expenses (relating to ordinary operating expenses only and excluding expenses such as brokerage commissions, acquired fund fees and expenses of unaffiliated funds, borrowing costs, taxes or litigation expenses) exceed 1.02%, 1.77%, 0.77% and 0.71% for Class A, Class C, Class I and Class R6, respectively, of such class’s average daily net assets. The expense reimbursement agreement with CRM may be changed or terminated after January 31, 2022. For the year ended September 30, 2021, no expenses were waived or reimbursed by CRM.
The administrative fee is earned by CRM as compensation for administrative services rendered to the Fund. The fee is computed at an annual rate of 0.12% of the Fund’s average daily net assets attributable to Class A, Class C, Class I and Class R6 and is payable monthly. For the year ended September 30, 2021, CRM was paid administrative fees of $491,112.
The Fund has in effect a distribution plan for Class A shares (Class A Plan) pursuant to Rule 12b-1 under the 1940 Act. Pursuant to the Class A Plan, the Fund pays Eaton Vance Distributors, Inc. (EVD), an affiliate of CRM and the Fund’s principal underwriter, a distribution and service fee of 0.25% per annum of its average daily net assets attributable to Class A shares for distribution services and facilities provided to the Fund by EVD, as well as for personal services and/or the maintenance of shareholder accounts. The Fund also has in effect a distribution plan for Class C shares (Class C Plan) pursuant to Rule 12b-1 under the 1940 Act. Pursuant to the Class C Plan, the Fund pays EVD amounts equal to 0.75% per annum of its average daily net assets attributable to Class C shares for providing ongoing distribution services and facilities to the Fund. In addition, pursuant to the Class C Plan, the Fund also makes payments of service fees to EVD, financial intermediaries and other persons in amounts equal to 0.25% per annum of its average daily net assets attributable to that class. Service fees paid or accrued are for personal services and/or the maintenance of shareholder accounts. Distribution and service fees paid or accrued for the year ended September 30, 2021 amounted to $131,464 and $53,080 for Class A shares and Class C shares, respectively.
The Fund was informed that EVD received $14,218 as its portion of the sales charge on sales of Class A shares for the year ended September 30, 2021. The Fund was also informed that EVD received less than $100 and $1,668 of contingent deferred sales charges paid by Class A and Class C shareholders, respectively, for the same period.
Eaton Vance Management (EVM), an affiliate of CRM, provides sub-transfer agency and related services to the Fund pursuant to a Sub-Transfer Agency Support Services Agreement. For the year ended September 30, 2021, sub-transfer agency fees and expenses incurred to EVM amounted to $23,265 and are included in transfer agency fees and expenses on the Statement of Operations.
Each Trustee of the Fund who is not an employee of CRM or its affiliates receives an annual fee of $154,000, plus an annual Committee fee ranging from $8,500 to $16,500 depending on the Committee. The Board chair receives an additional $30,000 ($20,000 prior to January 1, 2021) annual fee and Committee chairs receive an additional $6,000 annual fee. Eligible Trustees may participate in a Deferred Compensation Plan (the Plan). Amounts deferred under the Plan are treated as though equal dollar amounts had been invested in shares of the Fund or other Calvert funds selected by the Trustees. The Fund purchases shares of the funds selected equal to the dollar amounts deferred under the Plan, resulting in an asset equal to the deferred compensation liability. Obligations of the Plan are paid solely from the Fund's assets. Trustees’ fees are allocated to each of the Calvert funds served. Salaries and fees of officers and Trustees of the Fund who are employees of CRM or its affiliates are paid by CRM. Prior to December 31, 2020, an Advisory Council aided the Board and CRM in advancing the cause of responsible investing through original scholarship and thought leadership. The Advisory Council consisted of CRM’s Chief Executive Officer and three additional members. For the year ended December 31, 2020, each member (other than CRM’s Chief Executive Officer) was compensated $20,000 for their service on the Advisory Council. Such compensation, and any other compensation and/or expenses incurred by the Advisory Council as may be approved by the Board, was borne by the Calvert funds. For the year ended September 30, 2021, the Fund’s allocated portion of the Advisory Council compensation and fees was $425, which is included in miscellaneous expense on the Statement of Operations.
3 Investment Activity
During the year ended September 30, 2021, the cost of purchases and proceeds from sales of investments, other than short-term securities and including paydowns and principal repayments on senior floating-rate loans, were $307,385,858 and $168,753,119, respectively.
Calvert
High Yield Bond Fund
September 30, 2021
Notes to Financial Statements — continued
4 Distributions to Shareholders and Income Tax Information
The tax character of distributions declared for the years ended September 30, 2021 and September 30, 2020 was as follows:
| | Year Ended September 30, |
| | 2021 | 2020 |
| Ordinary income | $17,500,107 | $11,902,088 |
As of September 30, 2021, the components of distributable earnings (accumulated loss) on a tax basis were as follows:
| Undistributed ordinary income | $ 272,034 |
| Deferred capital losses | (10,580,622) |
| Net unrealized appreciation | 12,457,245 |
| Distributions payable | (161,967) |
| Distributable earnings | $ 1,986,690 |
At September 30, 2021, the Fund, for federal income tax purposes, had deferred capital losses of $10,580,622 which would reduce the Fund's taxable income arising from future net realized gains on investment transactions, if any, to the extent permitted by the Internal Revenue Code, and thus would reduce the amount of distributions to shareholders, which would otherwise be necessary to relieve the Fund of any liability for federal income or excise tax. The deferred capital losses are treated as arising on the first day of the Fund's next taxable year, can be carried forward for an unlimited period, and retain the same short-term or long-term character as when originally deferred. Of the deferred capital losses at September 30, 2021, $4,195,772 are short-term and $6,384,850 are long-term.
The cost and unrealized appreciation (depreciation) of investments, including open derivative contracts, of the Fund at September 30, 2021, as determined on a federal income tax basis, were as follows:
| Aggregate cost | $497,332,111 |
| Gross unrealized appreciation | $ 14,649,126 |
| Gross unrealized depreciation | (2,190,183) |
| Net unrealized appreciation | $ 12,458,943 |
5 Financial Instruments
The Fund may trade in financial instruments with off-balance sheet risk in the normal course of its investing activities. These financial instruments may include forward foreign currency exchange contracts and may involve, to a varying degree, elements of risk in excess of the amounts recognized for financial statement purposes. The notional or contractual amounts of these instruments represent the investment the Fund has in particular classes of financial instruments and do not necessarily represent the amounts potentially subject to risk. The measurement of the risks associated with these instruments is meaningful only when all related and offsetting transactions are considered. A summary of obligations under these financial instruments at September 30, 2021 is included in the Schedule of Investments. At September 30, 2021, the Fund had sufficient cash and/or securities to cover commitments under these contracts.
The Fund is subject to foreign exchange risk in the normal course of pursuing its investment objectives. During the year ended September 30, 2021, the Fund entered into forward foreign currency exchange contracts to seek to hedge against the decline in the value of currencies in which its portfolio holdings are denominated against the U.S. dollar.
The Fund enters into forward foreign currency exchange contracts that may contain provisions whereby the counterparty may terminate the contract under certain conditions, including but not limited to a decline in the Fund’s net assets below a certain level over a certain period of time, which would trigger a payment by the Fund for those derivatives in a liability position. At September 30, 2021, the fair value of derivatives with credit-related contingent features in a net liability position was $648. At September 30, 2021, there were no assets pledged by the Fund for such liability.
Calvert
High Yield Bond Fund
September 30, 2021
Notes to Financial Statements — continued
The over-the-counter (OTC) derivatives in which the Fund invests are subject to the risk that the counterparty to the contract fails to perform its obligations under the contract. To mitigate this risk, the Fund has entered into an International Swaps and Derivatives Association, Inc. Master Agreement (“ISDA Master Agreement”) with its derivative counterparty. The ISDA Master Agreement is a bilateral agreement between the Fund and the counterparty that governs certain OTC derivatives and typically contains, among other things, set-off provisions in the event of a default and/or termination event as defined under the ISDA Master Agreement. Under the ISDA Master Agreement, the Fund may, under certain circumstances, offset with the counterparty certain derivative financial instruments’ payables and/or receivables with collateral held and/or posted and create one single net payment. The provisions of the ISDA Master Agreement typically permit a single net payment in the event of default including the bankruptcy or insolvency of the counterparty. However, bankruptcy or insolvency laws of a particular jurisdiction may impose restrictions on or prohibitions against the right of offset in bankruptcy or insolvency. The ISDA Master Agreement allows the counterparty to OTC derivatives to terminate derivative contracts prior to maturity in the event the Fund’s net assets decline by a stated percentage or the Fund fails to meet the terms of its ISDA Master Agreement, which would cause the counterparty to accelerate payment by the Fund of any net liability owed to it.
The collateral requirements for derivatives traded under the ISDA Master Agreement are governed by a Credit Support Annex to the ISDA Master Agreement. Collateral requirements are determined at the close of business each day and are typically based on changes in market values for each transaction under the ISDA Master Agreement and netted into one amount for such agreement. Generally, the amount of collateral due from or to a counterparty is subject to a minimum transfer threshold amount before a transfer is required. Collateral pledged for the benefit of the Fund and/or counterparty is held in segregated accounts by the Fund’s custodian and cannot be sold, re-pledged, assigned or otherwise used while pledged. The portion of such collateral representing cash, if any, is reflected as deposits for derivatives collateral and, in the case of cash pledged by a counterparty for the benefit of the Fund, a corresponding liability on the Statement of Assets and Liabilities. Securities pledged by the Fund as collateral, if any, are identified as such in the Schedule of Investments.
At September 30, 2021, the fair value of open derivative instruments (not considered to be hedging instruments for accounting disclosure purposes) and whose primary underlying risk exposure is foreign exchange risk was as follows:
| Derivative | Statement of Assets and Liabilities Caption | Assets | Liabilities |
| Forward foreign currency exchange contracts | Receivable/Payable for open forward foreign currency
exchange contracts | $184,502 | $(648) |
The Fund’s derivative assets and liabilities at fair value by type, which are reported gross in the Statement of Assets and Liabilities, are presented in the table above. The following tables present the Fund’s derivative assets and liabilities by counterparty, net of amounts available for offset under a master netting agreement and net of the related collateral received by the Fund for such assets and pledged by the Fund for such liabilities as of September 30, 2021.
| Counterparty | Derivative
Assets Subject to
Master Netting
Agreement | Derivatives
Available
for Offset | Non-cash
Collateral
Received(a) | Cash
Collateral
Received(a) | Net Amount
of Derivative
Assets(b) |
| State Street Bank and Trust Company | $184,502 | $(648) | $ — | $ — | $183,854 |
| Counterparty | Derivative
Liabilities Subject to
Master Netting
Agreement | Derivatives
Available
for Offset | Non-cash
Collateral
Pledged(a) | Cash
Collateral
Pledged(a) | Net Amount
of Derivative
Liabilities(c) |
| State Street Bank and Trust Company | $(648) | $648 | $ — | $ — | $ — |
| (a) | In some instances, the total collateral received and/or pledged may be more than the amount shown due to overcollateralization. |
| (b) | Net amount represents the net amount due from the counterparty in the event of default. |
| (c) | Net amount represents the net amount payable to the counterparty in the event of default. |
The effect of derivative instruments (not considered to be hedging instruments for accounting disclosure purposes) on the Statement of Operations and whose primary underlying risk exposure is foreign exchange risk for the year ended September 30, 2021 was as follows:
Calvert
High Yield Bond Fund
September 30, 2021
Notes to Financial Statements — continued
| | Statement of Operations Caption | |
| Derivative | Net realized gain (loss):
Forward foreign currency exchange contracts | Change in unrealized appreciation
(depreciation): Forward foreign currency exchange contracts |
| Forward foreign currency exchange contracts | $ (92,877) | $ 124,496 |
The average notional amount of forward foreign currency exchange contracts (based on the absolute value of notional amounts of currency purchased and currency sold) outstanding during the year ended September 30, 2021, which is indicative of the volume of this derivative type, was approximately $10,540,000.
6 Securities Lending
To generate additional income, the Fund may lend its securities pursuant to a securities lending agency agreement with State Street Bank and Trust Company (SSBT), the securities lending agent. Security loans are subject to termination by the Fund at any time and, therefore, are not considered illiquid investments. The Fund requires that the loan be continuously collateralized by either cash or securities in an amount at least equal to the market value of the securities on loan. The market value of securities loaned is determined daily and any additional required collateral is delivered to the Fund on the next business day. Cash collateral is generally invested in a money market fund registered under the 1940 Act that is managed by an affiliate of SSBT. Any gain or loss in the market price of the loaned securities that might occur and any interest earned or dividends declared during the term of the loan would accrue to the account of the Fund. Income earned on the investment of collateral, net of broker rebates and other expenses incurred by the securities lending agent, is split between the Fund and the securities lending agent based on agreed upon contractual terms. Non-cash collateral, if any, is held by the lending agent on behalf of the Fund and cannot be sold or re-pledged by the Fund; accordingly, such collateral is not reflected in the Statement of Assets and Liabilities.
The risks associated with lending portfolio securities include, but are not limited to, possible delays in receiving additional collateral or in the recovery of the loaned securities, possible loss of rights to the collateral should the borrower fail financially, as well as risk of loss in the value of the collateral or the value of the investments made with the collateral. The securities lending agent shall indemnify the Fund in the case of default of any securities borrower.
At September 30, 2021, the total value of securities on loan, including accrued interest, was $20,099,325 and the total value of collateral received was $20,669,782, comprised of cash of $16,592,147 and U.S. government and/or agencies securities of $4,077,635.
The following table provides a breakdown of securities lending transactions accounted for as secured borrowings, the obligations by class of collateral pledged, and the remaining contractual maturity of those transactions as of September 30, 2021.
| | Remaining Contractual Maturity of the Transactions |
| | Overnight and
Continuous | <30 days | 30 to 90 days | >90 days | Total |
| Convertible Preferred Stocks | $ 604,181 | $ — | $ — | $ — | $ 604,181 |
| Corporate Bonds | 15,987,966 | — | — | — | 15,987,966 |
| Total | $16,592,147 | $ — | $ — | $ — | $16,592,147 |
The carrying amount of the liability for deposits for securities loaned at September 30, 2021 approximated its fair value. If measured at fair value, such liability would have been considered as Level 2 in the fair value hierarchy (see Note 1A) at September 30, 2021.
7 Line of Credit
The Fund participates with other portfolios and funds managed by EVM and its affiliates, including CRM, in an $800 million unsecured line of credit with a group of banks, which is in effect through October 26, 2021. Borrowings are made by the Fund solely for temporary purposes related to redemptions and other short-term cash needs. Interest is charged to the Fund based on its borrowings at an amount above either the Eurodollar rate or Federal Funds rate. In addition, a fee computed at an annual rate of 0.15% on the daily unused portion of the line of credit is allocated among the participating portfolios and funds at the end of each quarter. In connection with the renewal of the agreement in October 2020, an upfront fee and arrangement fee totaling $950,000 was incurred that was allocated to the participating portfolios and funds. Because the line of credit is not available exclusively to the Fund, it may be unable to borrow some or all of its requested amounts at any particular time.
Calvert
High Yield Bond Fund
September 30, 2021
Notes to Financial Statements — continued
The Fund had no borrowings pursuant to its line of credit during the year ended September 30, 2021. Effective October 26, 2021, the Fund renewed its line of credit agreement, which expires October 25, 2022, at substantially the same terms.
8 Affiliated Funds
At September 30, 2021, the value of the Fund’s investment in affiliated funds was $23,504,217, which represents 4.8% of the Fund’s net assets. Transactions in affiliated funds by the Fund for the year ended September 30, 2021 were as follows:
| Name | Value,
beginning
of period | Purchases | Sales
proceeds | Net
realized
gain
(loss) | Change in
unrealized
appreciation
(depreciation) | Value,
end of
period | Dividend
income | Units,
end of
period |
| Short-Term Investments | | | | | | |
| Calvert Cash Reserves Fund, LLC | $6,470,308 | $210,567,003 | $(193,533,658) | $(2,039) | $2,603 | $23,504,217 | $14,078 | 23,501,867 |
9 Capital Shares
The Fund’s Declaration of Trust permits the Trustees to issue an unlimited number of full and fractional shares of beneficial interest (without par value). Such shares may be issued in a number of different series (such as the Fund) and classes.
Transactions in capital shares for the years ended September 30, 2021 and September 30, 2020 were as follows:
| | Year Ended
September 30, 2021 | | Year Ended
September 30, 2020 |
| | Shares | Amount | | Shares | Amount |
| Class A | | | | | |
| Shares sold | 391,240 | $ 10,740,171 | | 480,274 | $ 12,658,263 |
| Reinvestment of distributions | 75,556 | 2,070,618 | | 81,620 | 2,157,865 |
| Shares redeemed | (331,141) | (9,064,872) | | (580,159) | (15,269,118) |
| Converted from Class C | 23,338 | 637,567 | | 3,502 | 92,581 |
| Net increase (decrease) | 158,993 | $ 4,383,484 | | (14,763) | $ (360,409) |
| Class C | | | | | |
| Shares sold | 46,832 | $ 1,300,116 | | 82,879 | $ 2,223,112 |
| Reinvestment of distributions | 6,065 | 168,798 | | 5,663 | 152,205 |
| Shares redeemed | (32,802) | (911,233) | | (39,801) | (1,057,319) |
| Converted to Class A | (22,980) | (637,567) | | (3,449) | (92,581) |
| Net increase (decrease) | (2,885) | $ (79,886) | | 45,292 | $ 1,225,417 |
| Class I | | | | | |
| Shares sold | 7,511,111 | $ 202,970,729 | | 6,871,791 | $ 174,126,248 |
| Reinvestment of distributions | 458,183 | 12,380,313 | | 334,795 | 8,715,777 |
| Shares redeemed | (4,375,419) | (117,327,846) | | (2,326,183) | (59,502,371) |
| Net increase | 3,593,875 | $ 98,023,196 | | 4,880,403 | $123,339,654 |
| Class R6 | | | | | |
| Shares sold | 2,662,381 | $ 71,009,204 | | 7,011 | $ 173,922 |
| Reinvestment of distributions | 52,019 | 1,410,110 | | 248 | 6,440 |
| Shares redeemed | (839,277) | (22,574,753) | | (78) | (2,031) |
| Net increase | 1,875,123 | $ 49,844,561 | | 7,181 | $ 178,331 |
Calvert
High Yield Bond Fund
September 30, 2021
Notes to Financial Statements — continued
10 Risks and Uncertainties
Credit Risk
The Fund primarily invests in securities rated below investment grade and comparable unrated investments. These investments can involve a substantial risk of loss and are considered speculative with respect to the issuer’s ability to pay interest and principal. These investments also have a higher risk of issuer default, are subject to greater price volatility than investment grade securities and may be illiquid.
Pandemic Risk
An outbreak of respiratory disease caused by a novel coronavirus was first detected in China in late 2019 and subsequently spread internationally. This coronavirus has resulted in closing borders, enhanced health screenings, changes to healthcare service preparation and delivery, quarantines, cancellations, disruptions to supply chains and customer activity, as well as general concern and uncertainty. Health crises caused by outbreaks, such as the coronavirus outbreak, may exacerbate other pre-existing political, social and economic risks and disrupt normal market conditions and operations. The impact of this outbreak has negatively affected the worldwide economy, the economies of individual countries, individual companies, and the market in general, and may continue to do so in significant and unforeseen ways, as may other epidemics and pandemics that may arise in the future. Any such impact could adversely affect the Fund's performance, or the performance of the securities in which the Fund invests.
11 Change in Independent Registered Public Accounting Firm
On July 30, 2021, KPMG LLP (“KPMG”) informed the Audit Committee and Board of the Trust that it was resigning as the independent registered public accounting firm to the Trust, as upon Morgan Stanley’s acquisition of Eaton Vance Corp., the parent company of CRM (the investment adviser to each series of the Trust), KPMG would no longer be independent of the Trust. The Audit Committee of the Board and the Board approved the selection of Deloitte & Touche LLP (“Deloitte”) as the independent registered public accounting firm for the funds that are series of the Trust (the “Funds”) for the fiscal year ending September 30, 2021 to be effective upon KPMG’s resignation and Deloitte’s acceptance of the engagement which became effective July 30, 2021.
KPMG’s reports on the financial statements for the Funds for the fiscal periods ended September 30, 2019 and September 30, 2020 contained no adverse opinion or disclaimer of opinion nor were they qualified or modified as to uncertainty, audit scope or accounting principles. During the fiscal periods ended September 30, 2019 and September 30, 2020, and during the subsequent interim period through July 30, 2021: (i) there were no disagreements with KPMG on any matter of accounting principles or practices, financial statement disclosure or auditing scope or procedure, which disagreements, if not resolved to the satisfaction of KPMG, would have caused KPMG to make reference to the subject matter of the disagreements in connection with its reports on the Funds’ financial statements for such periods; and (ii) there were no “reportable events” of the kind described in Item 304(a)(1)(v) of Regulation S-K under the Securities Exchange Act of 1934, as amended.
During the fiscal periods ended September 30, 2019 and September 30, 2020, and during the subsequent interim period through July 30, 2021: neither the Funds, nor anyone on their behalf, consulted with Deloitte on items which: (i) concerned the application of accounting principles to a specified transaction, either completed or proposed, or the type of audit opinion that might be rendered on the Funds’ financial statements; or (ii) concerned the subject of a disagreement (as defined in paragraph (a)(1)(iv) of Item 304 of Regulation S-K) or reportable events (as described in paragraph (a)(1)(v) of Item 304).
Calvert
High Yield Bond Fund
September 30, 2021
Report of Independent Registered Public Accounting Firm
To the Board of Trustees of The Calvert Fund and Shareholders of Calvert High Yield Bond Fund:
Opinion on the Financial Statements and Financial Highlights
We have audited the accompanying statement of assets and liabilities of Calvert High Yield Bond Fund (the "Fund") (one of the funds constituting The Calvert Fund), including the schedule of investments, as of September 30, 2021, the related statements of operations, changes in net assets and the financial highlights for the year then ended, and the related notes. In our opinion, the financial statements and financial highlights present fairly, in all material respects, the financial position of the Fund as of September 30, 2021, and the results of its operations and changes in its net assets for the year then ended, and the financial highlights for the year then ended in conformity with accounting principles generally accepted in the United States of America. The statement of changes in net assets for the year ended September 30, 2020, and the financial highlights for the years or periods ended September 30, 2020, 2019, 2018, and 2017 were audited by other auditors whose report, dated November 20, 2020, expressed an unqualified opinion on that financial statement and those financial highlights.
Basis for Opinion
These financial statements and financial highlights are the responsibility of the Fund's management. Our responsibility is to express an opinion on the Fund's financial statements and financial highlights based on our audit. We are a public accounting firm registered with the Public Company Accounting Oversight Board (United States) (PCAOB) and are required to be independent with respect to the Fund in accordance with the U.S. federal securities laws and the applicable rules and regulations of the Securities and Exchange Commission and the PCAOB.
We conducted our audit in accordance with the standards of the PCAOB. Those standards require that we plan and perform the audit to obtain reasonable assurance about whether the financial statements and financial highlights are free of material misstatement, whether due to error or fraud. The Fund is not required to have, nor were we engaged to perform, an audit of its internal control over financial reporting. As part of our audit we are required to obtain an understanding of internal control over financial reporting but not for the purpose of expressing an opinion on the effectiveness of the Fund’s internal control over financial reporting. Accordingly, we express no such opinion.
Our audit included performing procedures to assess the risks of material misstatement of the financial statements and financial highlights, whether due to error or fraud, and performing procedures that respond to those risks. Such procedures included examining, on a test basis, evidence regarding the amounts and disclosures in the financial statements and financial highlights. Our audit also included evaluating the accounting principles used and significant estimates made by management, as well as evaluating the overall presentation of the financial statements and financial highlights. Our procedures included confirmation of securities owned as of September 30, 2021, by correspondence with the custodian, brokers and selling or agent banks; when replies were not received from brokers and selling or agent banks, we performed other auditing procedures. We believe that our audit provides a reasonable basis for our opinion.
/s/ Deloitte & Touche LLP
Boston, Massachusetts
November 22, 2021
We have served as the auditor of one or more Calvert investment companies since 2021.
Calvert
High Yield Bond Fund
September 30, 2021
Federal Tax Information (Unaudited)
The Form 1099-DIV you receive in February 2022 will show the tax status of all distributions paid to your account in calendar year 2021. Shareholders are advised to consult their own tax adviser with respect to the tax consequences of their investment in the Fund. As required by the Internal Revenue Code and/or regulations, shareholders must be notified regarding the status of qualified dividend income for individuals and 163(j) interest dividends.
Qualified Dividend Income. For the fiscal year ended September 30, 2021, the Fund designates approximately $251,327, or up to the maximum amount of such dividends allowable pursuant to the Internal Revenue Code, as qualified dividend income eligible for the reduced tax rate of 15%.
163(j) Interest Dividends. For the fiscal year ended September 30, 2021, the Fund designates 97.58% of distributions from net investment income as a 163(j) interest dividend.
Calvert
High Yield Bond Fund
September 30, 2021
Liquidity Risk Management Program
The Fund has implemented a written liquidity risk management program (Program) and related procedures to manage its liquidity in accordance with Rule 22e-4 under the Investment Company Act of 1940, as amended (Liquidity Rule). The Liquidity Rule defines “liquidity risk” as the risk that a fund could not meet requests to redeem shares issued by the fund without significant dilution of the remaining investors’ interests in the fund. The Fund’s Board of Trustees/Directors has designated the investment adviser to serve as the administrator of the Program and the related procedures. The administrator has established a Liquidity Risk Management Oversight Committee (Committee) to perform the functions necessary to administer the Program. As part of the Program, the administrator is responsible for identifying illiquid investments and categorizing the relative liquidity of the Fund’s investments in accordance with the Liquidity Rule. Under the Program, the administrator assesses, manages, and periodically reviews the Fund’s liquidity risk, and is responsible for making certain reports to the Fund’s Board of Trustees/Directors and the Securities and Exchange Commission (SEC) regarding the liquidity of the Fund’s investments, and to notify the Board of Trustees/Directors and the SEC of certain liquidity events specified in the Liquidity Rule. The liquidity of the Fund’s portfolio investments is determined based on a number of factors including, but not limited to, relevant market, trading and investment-specific considerations under the Program.
At a meeting of the Fund’s Board of Trustees/Directors on June 16, 2021, the Committee provided a written report to the Fund’s Board of Trustees/ Directors pertaining to the operation, adequacy, and effectiveness of implementation of the Program, as well as the operation of the highly liquid investment minimum (if applicable) for the period January 1, 2020 through December 31, 2020 (Review Period). The Program operated effectively during the Review Period, supporting the administrator’s ability to assess, manage and monitor Fund liquidity risk, including during periods of market volatility and net redemptions. During the Review Period, the Fund met redemption requests on a timely basis.
There can be no assurance that the Program will achieve its objectives in the future. Please refer to the Fund’s prospectus for more information regarding the Fund’s exposure to liquidity risk and other principal risks to which an investment in the Fund may be subject.
Calvert
High Yield Bond Fund
September 30, 2021
Management and Organization
Fund Management. The Trustees of The Calvert Fund (the Trust) are responsible for the overall management and supervision of the Trust’s affairs. The Trustees and officers of the Trust are listed below. Except as indicated, each individual has held the office shown or other offices in the same company for the last five years. Each Board member holds office until his or her successor is elected and qualified, or until his or her earlier death, resignation, retirement, removal or disqualification. Under the terms of the Fund's current Board member retirement policy, an Independent Board member must retire at the end of the calendar year in which he or she turns 75. However, if such retirement would cause the Fund to be out of compliance with Section 16 of the 1940 Act or any other regulations or guidance of the SEC, then such retirement and resignation will not become effective until such time as action has been taken for the Fund to be in compliance upon a Board member's retirement. The “Independent Trustees” consist of those Trustees who are not “interested persons” of the Trust, as that term is defined under the 1940 Act. The business address of each Trustee and officer, with the exception of Ms. Walsh and Mr. Kirchner, is 1825 Connecticut Avenue NW, Suite 400, Washington, DC 20009. As used below, “CRM” refers to Calvert Research and Management. Each Trustee oversees 39 funds in the Calvert fund complex. Each officer serves as an officer of certain other Calvert funds.
| Name and Year of Birth | Trust
Position(s) | Position
Start Date | Principal Occupation(s) and Other Directorships
During Past Five Years and Other Relevant Experience |
| Interested Trustee |
John H. Streur(1)
1960 | Trustee and
President | 2015 | President and Chief Executive Officer of Calvert Research and
Management (since December 31, 2016). President and Chief Executive
Officer of Calvert Investments, Inc. (January 2015 - December 2016);
Chief Executive Officer of Calvert Investment Distributors, Inc. (August
2015 - December 2016); Chief Compliance Officer of Calvert Investment
Management, Inc. (August 2015 - April 2016); President and Director,
Portfolio 21 Investments, Inc. (through October 2014); President,
Chief Executive Officer and Director, Managers Investment Group LLC
(through January 2012); President and Director, The Managers Funds
and Managers AMG Funds (through January 2012).
Other Directorships in the Last Five Years. Portfolio 21 Investments,
Inc. (asset management) (through October 2014); Managers Investment
Group LLC (asset management) (through January 2012); The Managers
Funds (asset management) (through January 2012); Managers AMG Funds
(asset management) (through January 2012); Calvert Impact Capital, Inc. |
| Independent Trustees |
Richard L. Baird, Jr.
1948 | Trustee | 1982 | Regional Disaster Recovery Lead, American Red Cross of Greater
Pennsylvania (since 2017). Volunteer, American Red Cross (since 2015).
Former President and CEO of Adagio Health Inc. (retired in 2014) in
Pittsburgh, PA.
Other Directorships in the Last Five Years. None. |
Alice Gresham Bullock
1950 | Chair and
Trustee | 2016 | Professor Emerita at Howard University School of Law. Dean Emerita of
Howard University School of Law and Deputy Director of the Association
of American Law Schools (1992-1994).
Other Directorships in the Last Five Years. None. |
Cari M. Dominguez
1949 | Trustee | 2016 | Former Chair of the U.S. Equal Employment Opportunity Commission.
Other Directorships in the Last Five Years. Manpower, Inc. (employment
agency); Triple S Management Corporation (managed care); National
Association of Corporate Directors. |
John G. Guffey, Jr.
1948 | Trustee | 1982 | President of Aurora Press Inc., a privately held publisher of trade
paperbacks (since January 1997).
Other Directorships in the Last Five Years. Calvert Impact Capital, Inc.
(through December 31, 2018); Calvert Ventures, LLC. |
Miles D. Harper, III
1962 | Trustee | 2016 | Partner, Carr Riggs & Ingram (public accounting firm) since October 2014.
Partner, Gainer Donnelly & Desroches (public accounting firm) (now Carr
Riggs & Ingram) (November 1999 - September 2014).
Other Directorships in the Last Five Years. Bridgeway Funds (9) (asset
management). |
Joy V. Jones
1950 | Trustee | 2016 | Attorney.
Other Directorships in the Last Five Years. Conduit Street Restaurants
SUD 2 Limited; Palm Management Restaurant Corporation. |
Calvert
High Yield Bond Fund
September 30, 2021
Management and Organization — continued
| Name and Year of Birth | Trust
Position(s) | Position
Start Date | Principal Occupation(s) and Other Directorships
During Past Five Years and Other Relevant Experience |
| Independent Trustees (continued) |
Anthony A. Williams
1951 | Trustee | 2010 | CEO and Executive Director of the Federal City Council (July 2012 to
present); Senior Adviser and Independent Consultant for King and
Spalding LLP (September 2015 to present); Executive Director of Global
Government Practice at the Corporate Executive Board (January 2010 to
January 2012).
Other Directorships in the Last Five Years. Freddie Mac; Evoq
Properties/Meruelo Maddux Properties, Inc. (real estate management);
Weston Solutions, Inc. (environmental services); Bipartisan Policy Center’s
Debt Reduction Task Force; Chesapeake Bay Foundation; Catholic
University of America; Urban Institute (research organization); The Howard Hughes Corporation (real estate development). |
| Name and Year of Birth | Trust
Position(s) | Position
Start Date | Principal Occupation(s)
During Past Five Years |
| Principal Officers who are not Trustees |
Hope L. Brown
1973 | Chief
Compliance
Officer | 2014 | Chief Compliance Officer of 39 registered investment companies advised
by CRM (since 2014). Vice President and Chief Compliance Officer,
Wilmington Funds (2012-2014). |
Deidre E. Walsh(2)
1971 | Secretary,
Vice President
and Chief
Legal Officer | 2021 | Vice President of CRM and officer of 39 registered investment companies
advised by CRM (since 2021). Also Vice President of Eaton Vance and
certain of its affiliates and officer of 138 registered investment companies
advised or administered by Eaton Vance. |
James F. Kirchner(2)
1967 | Treasurer | 2016 | Vice President of CRM and officer of 39 registered investment companies
advised by CRM (since 2016). Also Vice President of Eaton Vance and
certain of its affiliates and officer of 138 registered investment companies
advised or administered by Eaton Vance. |
| (1) Mr. Streur is an interested person of the Fund because of his positions with the Fund’s adviser and certain affiliates. |
| (2) The business address for Ms. Walsh and Mr. Kirchner is Two International Place, Boston, MA 02110. |
The SAI for the Fund includes additional information about the Trustees and officers of the Fund and can be obtained without charge on Calvert’s website at www.calvert.com or by calling 1-800-368-2745.
| FACTS | WHAT DOES EATON VANCE DO WITH YOUR
PERSONAL INFORMATION? |
| Why? | Financial companies choose how they share your personal information. Federal law gives consumers the right to limit some but not all sharing. Federal law also requires us to tell you how we collect, share, and protect your personal information. Please read this notice carefully to understand what we do. |
| |
| What? | The types of personal information we collect and share depend on the product or service you have with us. This information can include:■ Social Security number and income
■
investment experience and risk tolerance
■
checking account number and wire transfer instructions |
| |
| How? | All financial companies need to share customers’ personal information to run their everyday business. In the section below, we list the reasons financial companies can share their customers’ personal information; the reasons Eaton Vance chooses to share; and whether you can limit this sharing. |
Reasons we can share your
personal information | Does Eaton Vance
share? | Can you limit
this sharing? |
| For our everyday business purposes — such as to process your transactions, maintain your account(s), respond to court orders and legal investigations, or report to credit bureaus | Yes | No |
| For our marketing purposes — to offer our products and services to you | Yes | No |
| For joint marketing with other financial companies | No | We don’t share |
| For our investment management affiliates’ everyday business purposes — information about your transactions, experiences, and creditworthiness | Yes | Yes |
| For our affiliates’ everyday business purposes — information about your transactions and experiences | Yes | No |
| For our affiliates’ everyday business purposes — information about your creditworthiness | No | We don’t share |
| For our investment management affiliates to market to you | Yes | Yes |
| For our affiliates to market to you | No | We don’t share |
| For nonaffiliates to market to you | No | We don’t share |
To limit our
sharing | Call toll-free 1-800-368-2745 or email: CRMPrivacy@calvert.comPlease note:If you are a new customer, we can begin sharing your information 30 days from the date we sent this notice. When you are no longer our customer, we continue to share your information as described in this notice. However, you can contact us at any time to limit our sharing. |
| Questions? | Call toll-free 1-800-368-2745 or email: CRMPrivacy@calvert.com |
| Privacy Notice — continued | April 2021 |
| Who we are |
| Who is providing this notice? | Eaton Vance Management, Eaton Vance Distributors, Inc., Eaton Vance Trust Company, Eaton Vance Management (International) Limited, Eaton Vance Advisers International Ltd., Eaton Vance Global Advisors Limited, Eaton Vance Management’s Real Estate Investment Group, Boston Management and Research, Calvert Research and Management, Eaton Vance and Calvert Fund Families and our investment advisory affiliates (“Eaton Vance”) (see Investment Management Affiliates definition below) |
| What we do |
How does Eaton Vance
protect my personal
information? | To protect your personal information from unauthorized access and use, we use security measures that comply with federal law. These measures include computer safeguards and secured files and buildings. We have policies governing the proper handling of customer information by personnel and requiring third parties that provide support to adhere to appropriate security standards with respect to such information. |
How does Eaton Vance
collect my personal
information? | We collect your personal information, for example, when you■ open an account or make deposits or withdrawals from your account
■
buy securities from us or make a wire transfer
■
give us your contact informationWe also collect your personal information from others, such as credit bureaus, affiliates, or other companies. |
| Why can’t I limit all sharing? | Federal law gives you the right to limit only■ sharing for affiliates’ everyday business purposes — information about your creditworthiness
■
affiliates from using your information to market to you
■
sharing for nonaffiliates to market to youState laws and individual companies may give you additional rights to limit sharing. See below for more on your rights under state law. |
| Definitions |
Investment Management
Affiliates | Eaton Vance Investment Management Affiliates include registered investment advisers, registered broker- dealers, and registered and unregistered funds. Investment Management Affiliates does not include entities associated with Morgan Stanley Wealth Management, such as Morgan Stanley Smith Barney LLC and Morgan Stanley & Co. |
| Affiliates | Companies related by common ownership or control. They can be financial and nonfinancial companies.■ Our affiliates include companies with a Morgan Stanley name and financial companies such as Morgan Stanley Smith Barney LLC and Morgan Stanley & Co. |
| Nonaffiliates | Companies not related by common ownership or control. They can be financial and nonfinancial companies.■ Eaton Vance does not share with nonaffiliates so they can market to you. |
| Joint marketing | A formal agreement between nonaffiliated financial companies that together market financial products or services to you.■ Eaton Vance doesn’t jointly market. |
| Other important information |
| Vermont: Except as permitted by law, we will not share personal information we collect about Vermont residents with Nonaffiliates unless you provide us with your written consent to share such information.California: Except as permitted by law, we will not share personal information we collect about California residents with Nonaffiliates and we will limit sharing such personal information with our Affiliates to comply with California privacy laws that apply to us. |
Delivery of Shareholder Documents. The Securities and Exchange Commission (SEC) permits funds to deliver only one copy of shareholder documents, including prospectuses, proxy statements and shareholder reports, to fund investors with multiple accounts at the same residential or post office box address. This practice is often called “householding” and it helps eliminate duplicate mailings to shareholders. Calvert funds, or your financial intermediary, may household the mailing of your documents indefinitely unless you instruct Calvert funds, or your financial intermediary, otherwise. If you would prefer that your Calvert fund documents not be householded, please contact Calvert funds at 1-800-368-2745, or contact your financial intermediary. Your instructions that householding not apply to delivery of your Calvert fund documents will typically be effective within 30 days of receipt by Calvert funds or your financial intermediary. Separate statements will be generated for each separate account and will be householded as described above.
Portfolio Holdings. Each Calvert fund files a schedule of portfolio holdings on Part F to Form N-PORT with the SEC. Certain information filed on Form N-PORT may be viewed on the Calvert website at www.calvert.com, by calling Calvert at 1-800-368-2745 or in the EDGAR database on the SEC’s website at www.sec.gov.
Proxy Voting. The Proxy Voting Guidelines that each Calvert fund uses to determine how to vote proxies relating to portfolio securities is provided as an Appendix to the fund’s Statement of Additional Information. The Statement of Additional Information can be obtained free of charge by calling the Calvert funds at 1-800-368-2745, by visiting the Calvert funds’ website at www.calvert.com or visiting the SEC’s website at www.sec.gov. Information regarding how a Calvert fund voted proxies relating to portfolio securities during the most recent 12-month period ended June 30 is available by calling Calvert funds, by visiting the Calvert funds’ website at www.calvert.com or by visiting the SEC’s website at www.sec.gov.
This Page Intentionally Left Blank
This Page Intentionally Left Blank
This Page Intentionally Left Blank
Investment Adviser and Administrator
Calvert Research and Management
1825 Connecticut Avenue NW, Suite 400
Washington, DC 20009
Principal Underwriter*
Eaton Vance Distributors, Inc.
Two International Place
Boston, MA 02110
(617) 482-8260
Custodian
State Street Bank and Trust Company
State Street Financial Center, One Lincoln Street
Boston, MA 02111
Transfer Agent
DST Asset Manager Solutions, Inc.
2000 Crown Colony Drive
Quincy, MA 02169
Independent Registered Public Accounting Firm
Deloitte & Touche LLP
200 Berkeley Street
Boston, MA 02116-5022
Fund Offices
1825 Connecticut Avenue NW, Suite 400
Washington, DC 20009
* FINRA BrokerCheck. Investors may check the background of their Investment Professional by contacting the Financial Industry Regulatory Authority (FINRA). FINRA BrokerCheck is a free tool to help investors check the professional background of current and former FINRA-registered securities firms and brokers. FINRA BrokerCheck is available by calling 1-800-289-9999 and at www.FINRA.org. The FINRA BrokerCheck brochure describing this program is available to investors at www.FINRA.org.
Printed on recycled paper.
Calvert
Short Duration Income Fund
Annual Report
September 30, 2021
Commodity Futures Trading Commission Registration. The Commodity Futures Trading Commission (“CFTC”) has adopted regulations that subject registered investment companies and advisers to regulation by the CFTC if a fund invests more than a prescribed level of its assets in certain CFTC-regulated instruments (including futures, certain options and swap agreements) or markets itself as providing investment exposure to such instruments. The adviser has claimed an exclusion from the definition of “commodity pool operator” under the Commodity Exchange Act with respect to its management of the Fund and the other funds it manages. Accordingly, neither the Fund nor the adviser is subject to CFTC regulation.
Fund shares are not insured by the FDIC and are not deposits or other obligations of, or guaranteed by, any depository institution. Shares are subject to investment risks, including possible loss of principal invested.
This report must be preceded or accompanied by a current summary prospectus or prospectus. Before investing, investors should consider carefully the investment objective, risks, and charges and expenses of a mutual fund. This and other important information is contained in the summary prospectus and prospectus, which can be obtained from a financial intermediary. Prospective investors should read the prospectus carefully before investing. For further information, please call 1-800-368-2745.
Choose Planet-friendly E-delivery!
Sign up now for on-line statements, prospectuses, and fund reports. In less than five minutes you can help reduce paper mail and lower fund costs.
Just go to www.calvert.com. If you already have an online account with the Calvert funds, click on Login to access your Account and select the documents you would like to receive via e-mail.
If you’re new to online account access, click on Login, then Register to create your user name and password. Once you’re in, click on the E-delivery sign-up on the Account Portfolio page and follow the quick, easy steps.
Note: If your shares are not held directly with the Calvert funds but through a brokerage firm, you must contact your broker for electronic delivery options available through their firm.
Annual Report September 30, 2021
Calvert
Short Duration Income Fund
Calvert
Short Duration Income Fund
September 30, 2021
Management's Discussion of Fund Performance†
Economic and Market Conditions
After the U.S. Federal Reserve (the Fed) met in late September 2021, Fed Chair Jerome Powell noted that “The path of the economy continues to depend on the course of the [COVID-19] virus, and risks to the economic outlook remain.” For fixed-income investors, this reflected the dominant investment theme for the 12-month period ended September 30, 2021.
Throughout the period, performance of fixed-income asset classes ebbed and flowed as the virus advanced and retreated, with a second wave of COVID-19 washing over the U.S. and global economies in the winter of 2020-2021 and a third wave known as the Delta variant spreading around the world in the summer of 2021.
For the period as a whole, however, U.S. fixed-income investors appeared to focus on the reopening of the economy and its recovery from a near-shutdown in the early days of the pandemic. The asset classes that fared best during the period were those that stood to benefit from a U.S. and global economic revival. So-called “safe-haven” assets, in contrast, fared poorly as investors appeared to become more comfortable taking on increased risk during the period.
As a result, U.S. Treasurys were one of the worst-performing fixed-income asset classes during the period, with the Bloomberg U.S. Treasury Index returning (3.30)% for the period. The Bloomberg U.S. Aggregate Bond Index, a broad measure of the U.S. fixed-income market, was also dragged down by its Treasury component, and returned (0.90)% for the period.
Investment-grade corporate bonds fared better. The Bloomberg U.S. Corporate Bond Index returned 1.74% for the period, as factories and businesses reopened and consumers — a key driver of the U.S. economy — rushed to spend the money they had saved while confined at home earlier in the pandemic.
High yield bonds were a standout asset class during the period. Several industries prominent within the high yield space — including airlines, restaurants, retail, and travel & leisure — were among the hardest-hit businesses early in the pandemic and the biggest beneficiaries of the subsequent economic recovery. Reflecting investors’ increasing confidence in the recovery, as well as their search for yield in a historically low-yield environment, the Bloomberg U.S. Corporate High Yield Index returned 11.28% for the one-year period.
Fund Performance
For the 12-month period ended September 30, 2021, Calvert Short Duration Income Fund (the Fund) returned 3.87% for Class A shares at net asset value (NAV), outperforming its benchmark, the Bloomberg 1-5 Year U.S. Credit Index (the Index), which returned 1.08%.
The Fund’s sector allocation, especially an overweight exposure to high yield corporate securities and an out-of-Index allocation to asset-backed securities (ABS), contributed to performance relative to the Index. Out-of-Index allocations to commercial mortgage-backed securities (CMBS) and mortgage-backed securities were also beneficial to Fund returns during the period.
Security selections further contributed to outperformance relative to the Index, most notably in investment-grade corporate securities. The Fund’s shorter-than-Index duration also enhanced performance. The Fund’s derivative holdings were a positive contributor to returns relative to the Index during the period.
In contrast, the Fund’s yield-curve positioning detracted from performance relative to the Index. An underweight exposure to investment-grade corporate securities also had a slight negative impact on relative returns during the period.
Toward period-end, the U.S. Federal Reserve indicated it was poised to begin a monetary tightening cycle that the Fund believed was likely to spark market volatility and push interest rates higher, particularly at the front end of the yield curve. Under these circumstances, the Fund maintained an underweight interest rate duration at period-end.
See Endnotes and Additional Disclosures in this report.
Past performance is no guarantee of future results. Returns are historical and are calculated by determining the percentage change in net asset value (NAV) or offering price (as applicable) with all distributions reinvested. Investment return and principal value will fluctuate so that shares, when redeemed, may be worth more or less than their original cost. Performance for periods less than or equal to one year is cumulative. Performance is for the stated time period only; due to market volatility, current Fund performance may be lower or higher than the quoted return. For performance as of the most recent month-end, please refer to www.calvert.com.
Calvert
Short Duration Income Fund
September 30, 2021
Performance
Portfolio Managers Vishal Khanduja, CFA and Brian S. Ellis, CFA, each of Calvert Research and Management
| % Average Annual Total Returns1,2 | Class
Inception Date | Performance
Inception Date | One Year | Five Years | Ten Years |
| Class A at NAV | 01/31/2002 | 01/31/2002 | 3.87% | 2.71% | 2.50% |
| Class A with 2.75% Maximum Sales Charge | — | — | 1.00 | 2.14 | 2.21 |
| Class C at NAV | 10/01/2002 | 01/31/2002 | 3.04 | 1.93 | 1.74 |
| Class C with 1% Maximum Sales Charge | — | — | 2.04 | 1.93 | 1.74 |
| Class I at NAV | 04/21/2006 | 01/31/2002 | 4.11 | 3.01 | 2.93 |
| Class R6 at NAV | 02/01/2019 | 01/31/2002 | 4.17 | 3.04 | 2.94 |
|
| Bloomberg 1-5 Year U.S. Credit Index | — | — | 1.08% | 2.85% | 2.79% |
| % Total Annual Operating Expense Ratios3 | Class A | Class C | Class I | Class R6 |
| Gross | 0.77% | 1.52% | 0.52% | 0.46% |
| Net | 0.76 | 1.51 | 0.51 | 0.46 |
Growth of $10,000
This graph shows the change in value of a hypothetical investment of $10,000 in Class A of the Fund for the period indicated. For comparison, the same investment is shown in the indicated index.
| Growth of Investment2 | Amount Invested | Period Beginning | At NAV | With Maximum Sales Charge |
| Class C | $10,000 | 09/30/2011 | $11,881 | N.A. |
| Class I | $250,000 | 09/30/2011 | $333,768 | N.A. |
| Class R6 | $1,000,000 | 09/30/2011 | $1,336,700 | N.A. |
See Endnotes and Additional Disclosures in this report.
Past performance is no guarantee of future results. Returns are historical and are calculated by determining the percentage change in net asset value (NAV) or offering price (as applicable) with all distributions reinvested. Investment return and principal value will fluctuate so that shares, when redeemed, may be worth more or less than their original cost. Performance for periods less than or equal to one year is cumulative. Performance is for the stated time period only; due to market volatility, current Fund performance may be lower or higher than the quoted return. For performance as of the most recent month-end, please refer to www.calvert.com.
Calvert
Short Duration Income Fund
September 30, 2021
Asset Allocation (% of total investments)
Credit Quality (% of bond and loan holdings)*
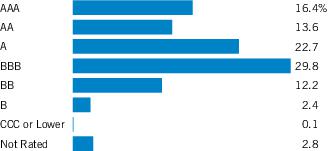
* For purposes of the Fund's rating restrictions, ratings are based on Moody's Investors Service, Inc. (“Moody's”), S&P Global Ratings (“S&P”) or Fitch Ratings (“Fitch”), or Kroll Bond Rating Agency, LLC (“Kroll”) for securitized debt instruments only (such as asset-backed securities (“ABS”) and mortgage-backed securities (“MBS”)), as applicable. If securities are rated differently by the ratings agencies, the highest rating is applied. Ratings, which are subject to change, apply to the creditworthiness of the issuers of the underlying securities and not to the Fund or its shares. Credit ratings measure the quality of an issuance based on the issuer's creditworthiness, with ratings ranging from AAA, being the highest, to D, being the lowest based on S&P's measures. Ratings of BBB or higher by S&P, Fitch or Kroll (Baa or higher by Moody's) are considered to be investment-grade quality. Credit ratings are based largely on the ratings agency's analysis at the time of rating. The rating assigned to any particular security is not necessarily a reflection of the issuer's current financial condition and does not necessarily reflect its assessment of the volatility of a security's market value or of the liquidity of an investment in the security. Holdings designated as “Not Rated” (if any) are not rated by the national ratings agencies stated above.
See Endnotes and Additional Disclosures in this report.
Calvert
Short Duration Income Fund
September 30, 2021
Endnotes and Additional Disclosures
| † | The views expressed in this report are those of the portfolio manager(s) and are current only through the date stated at the top of this page. These views are subject to change at any time based upon market or other conditions, and Calvert and the Fund(s) disclaim any responsibility to update such views. These views may not be relied upon as investment advice and, because investment decisions are based on many factors, may not be relied upon as an indication of trading intent on behalf of any Calvert fund. This commentary may contain statements that are not historical facts, referred to as “forward-looking statements.” The Fund’s actual future results may differ significantly from those stated in any forward-looking statement, depending on factors such as changes in securities or financial markets or general economic conditions, the volume of sales and purchases of Fund shares, the continuation of investment advisory, administrative and service contracts, and other risks discussed from time to time in the Fund’s filings with the Securities and Exchange Commission. |
| | |
| 1 | Bloomberg 1-5 Year U.S. Credit Index measures the performance of investment-grade U.S. corporate securities and government-related bonds with a maturity between one and five years. Unless otherwise stated, index returns do not reflect the effect of any applicable sales charge, commissions, expenses, taxes and leverage, as applicable. It is not possible to invest directly in an index. |
| 2 | Total Returns at NAV do not include applicable sales charges. If sales charges were deducted, the returns would be lower. Total Returns shown with maximum sales charge reflect the stated maximum sales charge. Unless otherwise stated, performance does not reflect the deduction of taxes on Fund distributions or redemptions of Fund shares.Performance prior to the inception date of a class may be linked to the performance of an older class of the Fund. This linked performance is adjusted for any applicable sales charge, but is not adjusted for class expense differences. If adjusted for such differences, the performance would be different. The performance of Class R6 is linked to Class I. Performance presented in the Financial Highlights included in the financial statements is not linked.Calvert Research and Management became the investment adviser to the Fund on December 31, 2016. Performance reflected prior to such date is that of the Fund’s former investment adviser. |
| 3 | Source: Fund prospectus. Net expense ratios reflect a contractual expense reimbursement that continues through 1/31/22. Without the reimbursement, if applicable, performance would have been lower. The expense ratios for the current reporting period can be found in the Financial Highlights section of this report. |
| | Fund profile subject to change due to active management. |
| | Additional Information |
| | Bloomberg U.S. Treasury Index measures the performance of U.S. Treasuries with a maturity of one year or more. Bloomberg U.S. Aggregate Bond Index is an unmanaged index of domestic investment-grade bonds, including corporate, government and mortgage-backed securities. Bloomberg U.S. Corporate Bond Index measures the performance of investment-grade U.S. corporate securities with a maturity of one year or more. Bloomberg U.S. Corporate High Yield Index measures USD-denominated, non-investment grade corporate securities. |
| | Duration is a measure of the expected change in price of a bond — in percentage terms — given a one percent change in interest rates, all else being constant. Securities with lower durations tend to be less sensitive to interest rate changes. |
| | Yield curve is a graphical representation of the yields offered by bonds of various maturities. The yield curve flattens when long-term interest rates fall and/or short-term interest rates increase, and the yield curve steepens when long-term interest rates increase and/or short-term interest rates fall. |
| | Important Notice to Shareholders |
| | Effective August 24, 2021, the Bloomberg Barclays fixed income indices were rebranded as Bloomberg indices. |
Calvert
Short Duration Income Fund
September 30, 2021
Example
As a Fund shareholder, you incur two types of costs: (1) transaction costs, including sales charges (loads) on purchases and redemption fees (if applicable); and (2) ongoing costs, including management fees; distribution and/or service fees; and other Fund expenses. This Example is intended to help you understand your ongoing costs (in dollars) of Fund investing and to compare these costs with the ongoing costs of investing in other mutual funds. The Example is based on an investment of $1,000 invested at the beginning of the period and held for the entire period (April 1, 2021 to September 30, 2021).
Actual Expenses
The first section of the table below provides information about actual account values and actual expenses. You may use the information in this section, together with the amount you invested, to estimate the expenses that you paid over the period. Simply divide your account value by $1,000 (for example, an $8,600 account value divided by $1,000 = 8.6), then multiply the result by the number in the first section under the heading entitled “Expenses Paid During Period” to estimate the expenses you paid on your account during this period.
Hypothetical Example for Comparison Purposes
The second section of the table below provides information about hypothetical account values and hypothetical expenses based on the actual Fund expense ratio and an assumed rate of return of 5% per year (before expenses), which is not the actual Fund return. The hypothetical account values and expenses may not be used to estimate the actual ending account balance or expenses you paid for the period. You may use this information to compare the ongoing costs of investing in the Fund and other funds. To do so, compare this 5% hypothetical example with the 5% hypothetical examples that appear in the shareholder reports of the other funds.
Please note that the expenses shown in the table are meant to highlight your ongoing costs only and do not reflect any transactional costs, such as sales charges (loads) or redemption fees (if applicable). Therefore, the second section of the table is useful in comparing ongoing costs only, and will not help you determine the relative total costs of owning different funds. In addition, if these transactional costs were included, your costs would be higher.
| | Beginning
Account Value
(4/1/21) | Ending
Account Value
(9/30/21) | Expenses Paid
During Period*
(4/1/21 – 9/30/21) | Annualized
Expense
Ratio |
| Actual | | | | |
| Class A | $1,000.00 | $1,010.70 | $3.83 | 0.76% |
| Class C | $1,000.00 | $1,006.30 | $7.59 | 1.51% |
| Class I | $1,000.00 | $1,011.90 | $2.57 | 0.51% |
| Class R6 | $1,000.00 | $1,012.20 | $2.27 | 0.45% |
| Hypothetical | | | | |
| (5% return per year before expenses) | | | | |
| Class A | $1,000.00 | $1,021.26 | $3.85 | 0.76% |
| Class C | $1,000.00 | $1,017.50 | $7.64 | 1.51% |
| Class I | $1,000.00 | $1,022.51 | $2.59 | 0.51% |
| Class R6 | $1,000.00 | $1,022.81 | $2.28 | 0.45% |
| * | Expenses are equal to the Fund's annualized expense ratio for the indicated Class, multiplied by the average account value over the period, multiplied by 183/365 (to reflect the one-half year period). The Example assumes that the $1,000 was invested at the net asset value per share determined at the close of business on March 31, 2021. |
Calvert
Short Duration Income Fund
September 30, 2021
| Asset-Backed Securities — 20.8% |
| Security | Principal
Amount
(000's omitted) | Value |
| Adams Outdoor Advertising, L.P., Series 2018-1, Class A, 4.81%, 11/15/48(1) | $ | 3,003 | $ 3,157,150 |
| Affirm Asset Securitization Trust, Series 2021-A, Class A, 0.88%, 8/15/25(1) | | 5,045 | 5,056,894 |
| Aligned Data Centers Issuer, LLC, Series 2021-1A, Class A2, 1.937%, 8/15/46(1) | | 11,228 | 11,299,774 |
| Amur Equipment Finance Receivables IX, LLC, Series 2021-1A, Class A2, 0.75%, 11/20/26(1) | | 3,815 | 3,818,231 |
| Avant Credit Card Master Trust, 1A, Class A, 1.37%, 4/15/27(1) | | 5,800 | 5,793,323 |
| Avant Loans Funding Trust, Series 2020-REV1, Class C, 4.17%, 5/15/29(1) | | 2,000 | 2,011,217 |
| BHG Securitization Trust: | | | |
| Series 2021-B, Class A, 0.90%, 10/17/34(1) | | 5,230 | 5,243,948 |
| Series 2021-B, Class B, 1.67%, 10/17/34(1) | | 4,500 | 4,507,830 |
| Business Jet Securities, LLC, Series 2020-1A, Class A, 2.981%, 11/15/35(1) | | 4,331 | 4,395,204 |
| Chase Auto Credit Linked Notes, Series 2021-1, Class B, 0.875%, 9/25/28(1) | | 11,613 | 11,626,191 |
| Coinstar Funding, LLC, Series 2017-1A, Class A2, 5.216%, 4/25/47(1) | | 19,176 | 19,229,510 |
| Conn's Receivables Funding, LLC: | | | |
| Series 2020-A, Class A, 1.71%, 6/16/25(1) | | 413 | 413,102 |
| Series 2020-A, Class C, 4.20%, 6/16/25(1) | | 4,008 | 4,022,773 |
| Consumer Loan Underlying Bond Credit Trust, Series 2020-P1, Class A, 2.26%, 3/15/28(1) | | 299 | 299,544 |
| DB Master Finance, LLC, Series 2017-1A, Class A2I, 3.629%, 11/20/47(1) | | 6,987 | 7,047,889 |
| Diamond Infrastructure Funding, LLC: | | | |
| Series 2021-1A, Class A, 1.76%, 4/15/49(1) | | 5,250 | 5,185,143 |
| Series 2021-1A, Class B, 2.355%, 4/15/49(1) | | 3,000 | 2,972,047 |
| Series 2021-1A, Class C, 3.475%, 4/15/49(1) | | 1,499 | 1,503,091 |
| Donlen Fleet Lease Funding 2, LLC, Series 2021-A2, Class A2, 0.56%, 12/11/34(1) | | 6,500 | 6,509,684 |
| Driven Brands Funding, LLC, Series 2018-1A, Class A2, 4.739%, 4/20/48(1) | | 5,587 | 5,939,645 |
| ExteNet, LLC: | | | |
| Series 2019-1A, Class A2, 3.204%, 7/26/49(1) | | 5,465 | 5,613,646 |
| Series 2019-1A, Class B, 4.14%, 7/26/49(1) | | 3,225 | 3,333,307 |
| FOCUS Brands Funding, LLC, Series 2017-1A, Class A2IB, 3.857%, 4/30/47(1) | | 13,970 | 14,373,135 |
| Hardee's Funding, LLC, Series 2020-1A, Class A2, 3.981%, 12/20/50(1) | | 4,833 | 5,143,537 |
| Helios Issuer, LLC, Series 2020-AA, Class A, 2.98%, 6/20/47(1) | | 3,368 | 3,501,988 |
| Horizon Aircraft Finance II, Ltd., Series 2019-1, Class A, 3.721%, 7/15/39(1) | | 4,100 | 4,118,915 |
| Security | Principal
Amount
(000's omitted) | Value |
| Horizon Aircraft Finance III, Ltd., Series 2019-2, Class A, 3.425%, 11/15/39(1) | $ | 4,048 | $ 4,058,760 |
| Jack in the Box Funding, LLC, Series 2019-1A, Class A2I, 3.982%, 8/25/49(1) | | 5,841 | 5,982,489 |
| JPMorgan Chase Bank, NA: | | | |
| Series 2021-2, Class B, 0.889%, 12/26/28(1) | | 7,200 | 7,200,813 |
| Series 2021-3, Class B, 0.76%, 2/26/29(1) | | 5,886 | 5,885,637 |
| Series 2021-3, Class C, 0.86%, 2/26/29(1) | | 2,702 | 2,701,221 |
| Series 2021-3, Class D, 1.009%, 2/26/29(1) | | 2,619 | 2,619,076 |
| Series 2021-3, Class E, 2.102%, 2/26/29(1) | | 1,672 | 1,672,006 |
| LL ABS Trust, Series 2021-1A, Class A, 1.07%, 5/15/29(1) | | 3,339 | 3,337,910 |
| Lunar Aircraft, Ltd.: | | | |
| Series 2020-1A, Class B, 4.335%, 2/15/45(1) | | 867 | 808,494 |
| Series 2020-1A, Class C, 6.413%, 2/15/45(1) | | 473 | 395,602 |
| Marlette Funding Trust: | | | |
| Series 2018-2A, Class C, 4.37%, 7/17/28(1) | | 2,718 | 2,727,309 |
| Series 2019-2A, Class A, 3.13%, 7/16/29(1) | | 163 | 163,247 |
| Series 2020-1A, Class B, 2.38%, 3/15/30(1) | | 2,864 | 2,880,629 |
| Series 2020-2A, Class A, 1.02%, 9/16/30(1) | | 51 | 50,694 |
| Series 2020-2A, Class B, 1.83%, 9/16/30(1) | | 9,160 | 9,206,383 |
| Series 2021-1A, Class A, 0.60%, 6/16/31(1) | | 2,109 | 2,110,333 |
| Marlette Funding Trust, Series 2021-1A, Class B, 1.00%, 6/16/31(1) | | 5,100 | 5,112,009 |
| Mosaic Solar Loan Trust: | | | |
| Series 2018-1A, Class B, 2.00%, 6/22/43(1) | | 5,354 | 5,292,796 |
| Series 2019-2A, Class B, 3.28%, 9/20/40(1) | | 3,142 | 3,259,376 |
| Series 2020-1A, Class B, 3.10%, 4/20/46(1) | | 1,061 | 1,107,786 |
| Series 2020-2A, Class A, 1.44%, 8/20/46(1) | | 5,345 | 5,280,487 |
| Series 2020-2A, Class B, 2.21%, 8/20/46(1) | | 4,083 | 4,071,067 |
| Series 2021-1A, Class A, 1.51%, 12/20/46(1) | | 2,573 | 2,555,607 |
| Series 2021-1A, Class B, 2.05%, 12/20/46(1) | | 5,283 | 5,299,134 |
| Series 2021-3A, Class A, 1.44%, 6/20/52(1) | | 7,250 | 7,111,797 |
| MVW, LLC, Series 2020-1A, Class A, 1.74%, 10/20/37(1) | | 876 | 887,114 |
| Neighborly Issuer, LLC, Series 2021-1A, Class A2, 3.584%, 4/30/51(1) | | 6,783 | 7,025,253 |
| NRZ Excess Spread-Collateralized Notes, Series 2021-FHT1, Class A, 3.104%, 7/25/26(1) | | 1,844 | 1,854,057 |
| OneMain Financial Issuance Trust, Series 2018-1A, Class A, 3.30%, 3/14/29(1) | | 3,521 | 3,531,074 |
| Oportun Issuance Trust: | | | |
| Series 2021-B, Class A, 1.47%, 5/8/31(1) | | 2,279 | 2,282,416 |
| Series 2021-B, Class B, 1.96%, 5/8/31(1) | | 2,687 | 2,696,709 |
| Pagaya AI Debt Selection Trust: | | | |
| Series 2021-1, Class A, 1.18%, 11/15/27(1) | | 4,499 | 4,511,021 |
| Series 2021-2, 3.00%, 1/25/29(1) | | 8,892 | 8,964,481 |
| Series 2021-3, Class A, 1.15%, 5/15/29(1) | | 13,645 | 13,653,266 |
| Series 2021-3, Class B, 1.74%, 5/15/29(1) | | 14,250 | 14,248,300 |
7
See Notes to Financial Statements.
Calvert
Short Duration Income Fund
September 30, 2021
Schedule of Investments — continued
| Security | Principal
Amount
(000's omitted) | Value |
| Pagaya AI Debt Selection Trust: (continued) | | | |
| Series 2021-HG1, Class A, 1.22%, 1/16/29(1) | $ | 7,909 | $ 7,919,357 |
| Planet Fitness Master Issuer, LLC: | | | |
| Series 2018-1A, Class A2I, 4.262%, 9/5/48(1) | | 7,561 | 7,594,538 |
| Series 2018-1A, Class A2II, 4.666%, 9/5/48(1) | | 3,456 | 3,561,685 |
| Prodigy Finance CM DAC, Series 2021-1A, Class A, 1.336%, (1 mo. USD LIBOR + 1.25%), 7/25/51(1)(2) | | 3,424 | 3,438,708 |
| Purchasing Power Funding, LLC, Series 2021-A, Class A, 1.57%, 10/15/25(1) | | 7,760 | 7,783,738 |
| ServiceMaster Funding, LLC, Series 2020-1, Class A2I, 2.841%, 1/30/51(1) | | 3,153 | 3,225,501 |
| SERVPRO Master Issuer, LLC, Series 2019-1A, Class A2, 3.882%, 10/25/49(1) | | 14,000 | 14,674,941 |
| Small Business Lending Trust, Series 2020-A, Class A, 2.62%, 12/15/26(1) | | 722 | 723,192 |
| SoFi Consumer Loan Program, LLC, Series 2017-6, Class B, 3.52%, 11/25/26(1) | | 1,953 | 1,966,450 |
| SolarCity LMC Series III, LLC, Series 2014-2, Class A, 4.02%, 7/20/44(1) | | 2,772 | 2,820,920 |
| SpringCastle America Funding, LLC, Series 2020-AA, Class A, 1.97%, 9/25/37(1) | | 22,495 | 22,717,358 |
| Stack Infrastructure Issuer, LLC: | | | |
| Series 2019-1A, Class A2, 4.54%, 2/25/44(1) | | 33,312 | 35,068,730 |
| Series 2019-2A, Class A2, 3.08%, 10/25/44(1) | | 2,720 | 2,795,743 |
| Sunnova Helios II Issuer, LLC: | | | |
| Series 2021-A, Class A, 1.80%, 2/20/48(1) | | 1,204 | 1,205,060 |
| Series 2021-A, Class B, 3.15%, 2/20/48(1) | | 1,180 | 1,174,329 |
| Series 2021-B, Class B, 2.01%, 7/20/48(1) | | 8,937 | 8,856,629 |
| Sunnova Sol II Issuer, LLC, Series 2020-2A, Class B, 5.47%, 11/1/55(1) | | 8,889 | 9,223,402 |
| Tesla Auto Lease Trust: | | | |
| Series 2019-A, Class A4, 2.20%, 11/21/22(1) | | 2,260 | 2,295,548 |
| Series 2020-A, Class A3, 0.68%, 12/20/23(1) | | 1,660 | 1,667,319 |
| Series 2020-A, Class A4, 0.78%, 12/20/23(1) | | 1,078 | 1,084,546 |
| Theorem Funding Trust: | | | |
| Series 2020-1A, Class A, 2.48%, 10/15/26(1) | | 981 | 985,487 |
| Series 2021-1A, Class A, 1.21%, 12/15/27(1) | | 17,612 | 17,630,765 |
| Series 2021-1A, Class B, 1.84%, 12/15/27(1) | | 5,446 | 5,434,489 |
| Upstart Securitization Trust, Series 2021-3, Class A, 0.83%, 7/20/31(1) | | 5,567 | 5,569,923 |
| Vantage Data Centers Issuer, LLC: | | | |
| Series 2019-1A, Class A2, 3.188%, 7/15/44(1) | | 5,699 | 5,891,687 |
| Series 2020-2A, Class A2, 1.992%, 9/15/45(1) | | 10,045 | 10,004,935 |
| VB-S1 Issuer, LLC, Series 2020-1A, Class C2, 3.031%, 6/15/50(1) | | 1,600 | 1,669,996 |
| Vivint Solar Financing VII, LLC, Series 2020-1A, Class A, 2.21%, 7/31/51(1) | | 7,034 | 6,975,869 |
| Security | Principal
Amount
(000's omitted) | Value |
| Willis Engine Structured Trust V: | | | |
| Series 2020-A, Class B, 4.212%, 3/15/45(1) | $ | 708 | $ 673,565 |
| Series 2020-A, Class C, 6.657%, 3/15/45(1) | | 1,331 | 975,424 |
Total Asset-Backed Securities
(identified cost $489,103,353) | | | $ 492,270,905 |
| Collateralized Mortgage Obligations — 5.2% |
| Security | Principal
Amount
(000's omitted) | Value |
| Bellemeade Re, Ltd.: | | | |
| Series 2021-1A, Class M1A, 1.80%, (30-day average SOFR + 1.75%), 3/25/31(1)(2) | $ | 2,395 | $ 2,429,729 |
| Series 2021-1A, Class M1B, 2.25%, (30-day average SOFR + 2.20%), 3/25/31(1)(2) | | 2,360 | 2,426,580 |
| Series 2021-1A, Class M1C, 3.00%, (30-day average SOFR + 2.95%), 3/25/31(1)(2) | | 670 | 699,626 |
| Series 2021-2A, Class M1A, 1.25%, (30-day average SOFR + 1.20%), 6/25/31(1)(2) | | 3,041 | 3,064,127 |
| Series 2021-2A, Class M1B, 1.55%, (SOFR + 1.50%), 6/25/31(1)(2) | | 4,750 | 4,782,058 |
| Series 2021-3A, Class A2, 1.05%, (30-day average SOFR + 1.00%), 9/25/31(1)(2) | | 5,245 | 5,277,156 |
| Series 2021-3A, Class M1A, 1.05%, (30-day average SOFR + 1.00%), 9/25/31(1)(2) | | 4,000 | 4,013,308 |
| Federal Home Loan Mortgage Corp. Structured Agency Credit Risk Debt Notes: | | | |
| Series 2017-DNA3, Class M2, 2.586%, (1 mo. USD LIBOR + 2.50%), 3/25/30(2) | | 2,144 | 2,198,780 |
| Series 2018-DNA1, Class M2, 1.886%, (1 mo. USD LIBOR + 1.80%), 7/25/30(2) | | 7,798 | 7,869,787 |
| Series 2018-DNA1, Class M2AT, 1.136%, (1 mo. USD LIBOR + 1.05%), 7/25/30(2) | | 5,031 | 5,017,800 |
| Series 2019-DNA2, Class M2, 2.536%, (1 mo. USD LIBOR + 2.45%), 3/25/49(1)(2) | | 6,256 | 6,356,232 |
| Series 2019-DNA3, Class M2, 2.136%, (1 mo. USD LIBOR + 2.05%), 7/25/49(1)(2) | | 6,052 | 6,132,560 |
| Series 2019-DNA4, Class M2, 2.036%, (1 mo. USD LIBOR + 1.95%), 10/25/49(1)(2) | | 1,778 | 1,787,002 |
| Series 2019-HQA1, Class M2, 2.436%, (1 mo. USD LIBOR +2.35%), 2/25/49(1)(2) | | 7,239 | 7,304,723 |
| Series 2020-DNA4, Class M2, 3.836%, (1 mo. USD LIBOR + 3.75%), 8/25/50(1)(2) | | 1,555 | 1,572,768 |
| Series 2020-DNA5, Class M2, 2.85%, (30-day average SOFR + 2.80%), 10/25/50(1)(2) | | 1,353 | 1,371,352 |
| Series 2020-DNA6, Class M2, 2.05%, (30-day average SOFR + 2.00%), 12/25/50(1)(2) | | 3,810 | 3,846,364 |
| Series 2021-DNA3, Class M1, 0.80%, (30-day average SOFR + 0.75%), 10/25/33(1)(2) | | 3,625 | 3,634,062 |
| Federal National Mortgage Association Connecticut Avenue Securities: | | | |
| Series 2014-C04, Class 1M2, 4.986%, (1 mo. USD LIBOR + 4.90%), 11/25/24(2) | | 4,936 | 5,144,495 |
8
See Notes to Financial Statements.
Calvert
Short Duration Income Fund
September 30, 2021
Schedule of Investments — continued
| Security | Principal
Amount
(000's omitted) | Value |
| Federal National Mortgage Association Connecticut Avenue Securities: (continued) | | | |
| Series 2017-C06, Class 1M2, 2.736%, (1 mo. USD LIBOR + 2.65%), 2/25/30(2) | $ | 1,013 | $ 1,032,548 |
| Series 2018-R07, Class 1M2, 2.486%, (1 mo. USD LIBOR + 2.40%), 4/25/31(1)(2) | | 2,558 | 2,571,981 |
| Series 2019-R02, Class 1M2, 2.386%, (1 mo. USD LIBOR + 2.30%), 8/25/31(1)(2) | | 1,326 | 1,337,421 |
| Series 2019-R05, Class 1M2, 2.086%, (1 mo. USD LIBOR + 2.00%), 7/25/39(1)(2) | | 183 | 183,823 |
| FMC GMSR Issuer Trust, Series 2021-GT1, Class A, 3.62%, 7/25/26(1) | | 6,835 | 6,835,394 |
| Home Re, Ltd.: | | | |
| Series 2021-1, Class M1C, 2.386%, (1 mo. USD LIBOR + 2.30%), 7/25/33(1)(2) | | 3,645 | 3,640,422 |
| Series 2021-1, Class M2, 2.936%, (1 mo. USD LIBOR + 2.85%), 7/25/33(1)(2) | | 3,500 | 3,517,496 |
| Oaktown Re VI, Ltd., Series 2021-1A, Class M1A, 1.70%, (30-day average SOFR + 1.65%), 10/25/33(1)(2) | �� | 4,000 | 4,037,421 |
| PRPM, Series 2021-RPL1, Class A1, 1.319%, 7/25/51(1) | | 4,310 | 4,310,572 |
| RESIMAC Bastille Trust, Series 2018-1NCA, Class A1, 0.933%, (1 mo. USD LIBOR + 0.85%), 12/5/59(1)(2) | | 510 | 510,887 |
| RESIMAC Premier Trust, Series 2020-1A, Class A1A, 1.133%, (1 mo. USD LIBOR + 1.05%), 2/7/52(1)(2) | | 3,359 | 3,380,559 |
| Toorak Mortgage Corp., Ltd., Series 2020-1, Class A1, 2.734% to 1/25/23, 3/25/23(1)(3) | | 5,310 | 5,339,720 |
| ZH Trust: | | | |
| Series 2021-1, Class A, 2.253%, 2/18/27(1) | | 4,635 | 4,651,705 |
| Series 2021-2, Class A, 2.349%, 10/17/27(1)(4) | | 7,006 | 7,040,624 |
Total Collateralized Mortgage Obligations
(identified cost $122,651,375) | | | $ 123,319,082 |
| Commercial Mortgage-Backed Securities — 7.7% |
| Security | Principal
Amount
(000's omitted) | Value |
| BAMLL Commercial Mortgage Securities Trust: | | | |
| Series 2019-BPR, Class DNM, 3.843%, 11/5/32(1)(5) | $ | 10,820 | $ 10,695,244 |
| Series 2019-BPR, Class ENM, 3.843%, 11/5/32(1)(5) | | 6,285 | 6,058,286 |
| BBCMS Mortgage Trust, Series 2017-DELC, Class A, 0.934%, (1 mo. USD LIBOR + 0.85%), 8/15/36(1)(2) | | 14,116 | 14,151,546 |
| BX Commercial Mortgage Trust: | | | |
| Series 2019-XL, Class A, 1.004%, (1 mo. USD LIBOR + 0.92%), 10/15/36(1)(2) | | 4,254 | 4,266,331 |
| Series 2019-XL, Class B, 1.164%, (1 mo. USD LIBOR + 1.08%), 10/15/36(1)(2) | | 11,015 | 11,033,719 |
| Series 2020-BXLP, Class A, 0.884%, (1 mo. USD LIBOR + 0.80%), 12/15/36(1)(2) | | 4,495 | 4,508,095 |
| Series 2020-BXLP, Class B, 1.084%, (1 mo. USD LIBOR + 1.00%), 12/15/36(1)(2) | | 4,608 | 4,611,645 |
| Security | Principal
Amount
(000's omitted) | Value |
| BX Commercial Mortgage Trust: (continued) | | | |
| Series 2021-VOLT, Class B, 1.034%, (1 mo. USD LIBOR + 0.95%), 9/15/36(1)(2) | $ | 10,284 | $ 10,305,997 |
| Series 2021-VOLT, Class C, 1.184%, (1 mo. USD LIBOR + 1.10%), 9/15/36(1)(2) | | 3,122 | 3,129,529 |
| Series 2021-VOLT, Class D, 1.734%, (1 mo. USD LIBOR + 1.65%), 9/15/36(1)(2) | | 9,323 | 9,347,913 |
| CGMS Commercial Mortgage Trust, Series 2017-MDRB, Class A, 1.184%, (1 mo. USD LIBOR + 1.10%), 7/15/30(1)(2) | | 1,117 | 1,112,971 |
| CIM Retail Portfolio Trust, Series 2021-RETL, Class A, 1.484%, (1 mo. USD LIBOR + 1.40%), 8/15/36(1)(2) | | 6,865 | 6,892,945 |
| CSMC, Series 2018-SITE, Class C, 4.941%, 4/15/36(1)(5) | | 5,000 | 5,180,299 |
| Extended Stay America Trust: | | | |
| Series 2021-ESH, Class B, 1.464%, (1 mo. USD LIBOR + 1.38%), 7/15/38(1)(2) | | 3,380 | 3,400,221 |
| Series 2021-ESH, Class C, 1.784%, (1 mo. USD LIBOR + 1.70%), 7/15/38(1)(2) | | 6,117 | 6,171,667 |
| Series 2021-ESH, Class D, 2.334%, (1 mo. USD LIBOR + 2.25%), 7/15/38(1)(2) | | 11,570 | 11,691,543 |
| Federal National Mortgage Association, Series 2018-M4, Class A2, 3.161%, 3/25/28(5) | | 6,143 | 6,720,560 |
| Federal National Mortgage Association Multifamily Connecticut Avenue Securities Trust: | | | |
| Series 2019-01, Class M7, 1.786%, (1 mo. USD LIBOR + 1.70%), 10/15/49(1)(2) | | 221 | 221,463 |
| Series 2019-01, Class M10, 3.336%, (1 mo. USD LIBOR + 3.25%), 10/15/49(1)(2) | | 1,975 | 1,997,771 |
| Series 2020-01, Class M10, 3.836%, (1 mo. USD LIBOR + 3.75%), 3/25/50(1)(2) | | 3,545 | 3,686,686 |
| Hawaii Hotel Trust, Series 2019-MAUI, Class A, 1.234%, (1 mo. USD LIBOR + 1.15%), 5/15/38(1)(2) | | 17,000 | 17,051,264 |
| JPMorgan Chase Commercial Mortgage Securities Trust: | | | |
| Series 2014-DSTY, Class B, 3.771%, 6/10/27(1) | | 4,200 | 1,278,900 |
| Series 2014-DSTY, Class C, 3.931%, 6/10/27(1)(5) | | 1,920 | 342,720 |
| Morgan Stanley Capital I Trust: | | | |
| Series 2017-CLS, Class A, 0.784%, (1 mo. USD LIBOR + 0.70%), 11/15/34(1)(2)(6) | | 2,126 | 2,126,674 |
| Series 2017-CLS, Class B, 0.934%, (1 mo. USD LIBOR + 0.85%), 11/15/34(1)(2)(6) | | 5,940 | 5,942,149 |
| Series 2017-CLS, Class C, 1.084%, (1 mo. USD LIBOR + 1.00%), 11/15/34(1)(2)(6) | | 5,755 | 5,759,059 |
| Series 2019-BPR, Class A, 1.484%, (1 mo. USD LIBOR + 1.40%), 5/15/36(1)(2)(6) | | 14,831 | 14,709,964 |
| Motel Trust: | | | |
| Series 2021-MTL6, Class A, 0.984%, (1 mo. USD LIBOR + 0.90%), 9/15/38(1)(2) | | 5,098 | 5,113,456 |
| Series 2021-MTL6, Class B, 1.284%, (1 mo. USD LIBOR + 1.20%), 9/15/38(1)(2) | | 3,119 | 3,127,201 |
| Series 2021-MTL6, Class C, 1.584%, (1 mo. USD LIBOR + 1.50%), 9/15/38(1)(2) | | 831 | 833,299 |
9
See Notes to Financial Statements.
Calvert
Short Duration Income Fund
September 30, 2021
Schedule of Investments — continued
| Security | Principal
Amount
(000's omitted) | Value |
| Motel Trust: (continued) | | | |
| Series 2021-MTL6, Class D, 2.19%, (1 mo. USD LIBOR + 2.10%), 9/15/38(1)(2) | $ | 1,012 | $ 1,015,372 |
Total Commercial Mortgage-Backed Securities
(identified cost $186,703,684) | | | $ 182,484,489 |
| Security | Principal
Amount
(000's omitted) | Value |
| Communications — 4.1% | |
| AT&T, Inc.: | | | |
| 2.25%, 2/1/32 | $ | 8,300 | $ 8,088,132 |
| 2.30%, 6/1/27 | | 15,948 | 16,518,351 |
| 2.75%, 6/1/31 | | 6,307 | 6,481,116 |
| CCO Holdings, LLC/CCO Holdings Capital Corp.: | | | |
| 5.00%, 2/1/28(1) | | 1,683 | 1,758,987 |
| 5.125%, 5/1/27(1) | | 10,390 | 10,832,198 |
| Nokia Oyj, 4.375%, 6/12/27 | | 11,289 | 12,403,789 |
| T-Mobile USA, Inc.: | | | |
| 2.05%, 2/15/28 | | 3,100 | 3,126,703 |
| 2.25%, 2/15/26 | | 4,389 | 4,443,863 |
| 2.25%, 2/15/26(1) | | 3,808 | 3,855,600 |
| 2.55%, 2/15/31 | | 5,000 | 5,021,087 |
| 2.625%, 4/15/26 | | 3,554 | 3,638,408 |
| Verizon Communication, Inc., 2.10%, 3/22/28 | | 14,400 | 14,628,823 |
| Ziggo B.V., 5.50%, 1/15/27(1) | | 5,970 | 6,178,950 |
| | | | $ 96,976,007 |
| Consumer, Cyclical — 4.3% | |
| 7-Eleven, Inc., 0.80%, 2/10/24(1) | $ | 4,703 | $ 4,702,333 |
| American Airlines Pass-Through Trust: | | | |
| 4.40%, 9/22/23 | | 463 | 456,879 |
| 5.25%, 1/15/24 | | 1,917 | 1,895,284 |
| American Airlines, Inc./AAdvantage Loyalty IP, Ltd., 5.50%, 4/20/26(1) | | 6,637 | 6,985,442 |
| Brunswick Corp., 0.85%, 8/18/24 | | 4,878 | 4,879,028 |
| Delta Air Lines, Inc., 3.625%, 3/15/22 | | 3,300 | 3,329,440 |
| Delta Air Lines, Inc./SkyMiles IP, Ltd.: | | | |
| 4.50%, 10/20/25(1) | | 8,526 | 9,125,334 |
| 4.75%, 10/20/28(1) | | 10,953 | 12,219,363 |
| Ford Motor Credit Co., LLC: | | | |
| 0.999%, (3 mo. USD LIBOR + 0.88%), 10/12/21(2) | | 4,509 | 4,509,032 |
| 1.198%, (3 mo. USD LIBOR + 1.08%), 8/3/22(2) | | 9,356 | 9,328,892 |
| 2.979%, 8/3/22 | | 11,297 | 11,434,372 |
| 3.087%, 1/9/23 | | 2,516 | 2,556,130 |
| Security | Principal
Amount
(000's omitted) | Value |
| Consumer, Cyclical (continued) | |
| Ford Motor Credit Co., LLC: (continued) | | | |
| 3.278%, (3 mo. USD LIBOR + 3.14%), 1/7/22(2) | $ | 8,000 | $ 8,035,359 |
| 4.14%, 2/15/23 | | 1,530 | 1,570,469 |
| Hyatt Hotels Corp.: | | | |
| (SOFR + 1.05%), 10/1/23(2)(4) | | 3,755 | 3,760,444 |
| 1.80%, 10/1/24(4) | | 1,919 | 1,923,343 |
| Macy's Retail Holdings, LLC: | | | |
| 2.875%, 2/15/23 | | 3,476 | 3,532,485 |
| 3.625%, 6/1/24 | | 3,140 | 3,247,467 |
| Nordstrom, Inc.: | | | |
| 2.30%, 4/8/24 | | 3,428 | 3,428,523 |
| 4.00%, 3/15/27(7) | | 3,500 | 3,619,458 |
| | | | $ 100,539,077 |
| Consumer, Non-cyclical — 4.8% | |
| Ashtead Capital, Inc.: | | | |
| 4.00%, 5/1/28(1) | $ | 8,545 | $ 9,084,030 |
| 4.25%, 11/1/29(1) | | 3,000 | 3,296,222 |
| Block Financial, LLC: | | | |
| 2.50%, 7/15/28 | | 8,500 | 8,627,692 |
| 3.875%, 8/15/30 | | 3,743 | 4,073,254 |
| Centene Corp.: | | | |
| 2.50%, 3/1/31 | | 5,111 | 5,047,112 |
| 4.25%, 12/15/27 | | 15,882 | 16,642,748 |
| Coca-Cola Europacific Partners PLC: | | | |
| 0.50%, 5/5/23(1) | | 8,833 | 8,826,058 |
| 0.80%, 5/3/24(1) | | 5,000 | 4,985,698 |
| 1.50%, 1/15/27(1) | | 3,742 | 3,716,971 |
| CVS Health Corp., 1.30%, 8/21/27 | | 12,499 | 12,312,029 |
| CVS Pass-Through Trust, 6.036%, 12/10/28 | | 1,096 | 1,280,337 |
| Hikma Finance USA, LLC, 3.25%, 7/9/25(8) | | 7,304 | 7,630,248 |
| Keurig Dr Pepper, Inc., 0.75%, 3/15/24 | | 6,166 | 6,171,241 |
| Kraft Heinz Foods Co., 3.875%, 5/15/27 | | 15,000 | 16,387,386 |
| Smithfield Foods, Inc., 2.625%, 9/13/31(1) | | 4,498 | 4,377,440 |
| | | | $ 112,458,466 |
| Energy — 0.8% | |
| NuStar Logistics, L.P.: | | | |
| 4.75%, 2/1/22(7) | $ | 3,500 | $ 3,519,075 |
| 5.75%, 10/1/25 | | 4,828 | 5,208,205 |
| TerraForm Power Operating, LLC, 4.25%, 1/31/23(1) | | 10,500 | 10,807,440 |
| | | | $ 19,534,720 |
| Financial — 27.4% | |
| AerCap Ireland Capital DAC/AerCap Global Aviation Trust: | | | |
| 1.75%, 1/30/26(7) | $ | 3,000 | $ 2,970,798 |
10
See Notes to Financial Statements.
Calvert
Short Duration Income Fund
September 30, 2021
Schedule of Investments — continued
| Security | Principal
Amount
(000's omitted) | Value |
| Financial (continued) | |
| AerCap Ireland Capital DAC/AerCap Global Aviation Trust: (continued) | | | |
| 4.125%, 7/3/23 | $ | 6,055 | $ 6,371,500 |
| 4.50%, 9/15/23 | | 5,591 | 5,958,601 |
| 4.625%, 10/15/27(7) | | 3,019 | 3,368,788 |
| 6.50%, 7/15/25 | | 2,768 | 3,210,683 |
| Aflac, Inc., 1.125%, 3/15/26(7) | | 7,000 | 7,001,048 |
| Air Lease Corp., 2.875%, 1/15/26 | | 6,823 | 7,132,651 |
| Alliance Data Systems Corp., 4.75%, 12/15/24(1) | | 8,614 | 8,833,727 |
| American Assets Trust, L.P., 3.375%, 2/1/31 | | 4,301 | 4,460,754 |
| Ameriprise Financial, Inc., 3.00%, 4/2/25 | | 4,382 | 4,657,184 |
| Australia & New Zealand Banking Group, Ltd., 2.95% to 7/22/25, 7/22/30(1)(9) | | 6,350 | 6,603,383 |
| Banco do Brasil S.A., 3.25%, 9/30/26(1) | | 17,550 | 17,563,162 |
| Banco Santander S.A.: | | | |
| 1.722% to 9/14/26, 9/14/27(9) | | 5,000 | 4,979,442 |
| 2.746%, 5/28/25 | | 5,000 | 5,246,772 |
| 3.848%, 4/12/23 | | 5,200 | 5,462,142 |
| Bank of America Corp.: | | | |
| 0.981% to 9/25/24, 9/25/25(9) | | 3,787 | 3,793,088 |
| 1.197% to 10/24/25, 10/24/26(9) | | 6,362 | 6,316,635 |
| 1.319% to 6/19/25, 6/19/26(9) | | 24,600 | 24,603,088 |
| 1.658% to 3/11/26, 3/11/27(9) | | 7,000 | 7,042,852 |
| 1.734% to 7/22/26, 7/22/27(9) | | 13,829 | 13,895,085 |
| 2.456% to 10/22/24, 10/22/25(9) | | 18,878 | 19,724,592 |
| Bank of Nova Scotia (The): | | | |
| 0.70%, 4/15/24 | | 10,000 | 10,002,925 |
| 2.375%, 1/18/23 | | 12,241 | 12,573,002 |
| BBVA Bancomer S.A./Texas, 1.875%, 9/18/25(1) | | 6,660 | 6,704,622 |
| BNP Paribas S.A.: | | | |
| 1.904% to 9/30/27, 9/30/28(1)(9) | | 8,425 | 8,391,133 |
| 4.375%, 9/28/25(1) | | 3,000 | 3,292,705 |
| Capital One Financial Corp., 3.75%, 7/28/26 | | 10,522 | 11,557,181 |
| Charles Schwab Corp. (The), 0.75%, 3/18/24 | | 7,000 | 7,034,823 |
| CI Financial Corp., 3.20%, 12/17/30 | | 3,788 | 3,935,277 |
| Citigroup, Inc.: | | | |
| 0.72%, (SOFR + 0.67%), 5/1/25(2) | | 10,382 | 10,481,502 |
| 0.776% to 10/30/23, 10/30/24(9) | | 17,150 | 17,219,016 |
| 1.678% to 5/15/23, 5/15/24(9) | | 13,582 | 13,850,440 |
| 4.00% to 12/10/25(9)(10) | | 5,060 | 5,255,822 |
| Credit Agricole S.A., 1.247% to 1/26/26, 1/26/27(1)(9) | | 10,700 | 10,552,970 |
| Danske Bank A/S: | | | |
| 1.171% to 12/8/22, 12/8/23(1)(9) | | 8,500 | 8,542,292 |
| 1.226%, 6/22/24(1) | | 5,573 | 5,629,769 |
| 1.621% to 9/11/25, 9/11/26(1)(9) | | 4,647 | 4,649,458 |
| Discover Bank, 4.682% to 8/9/23, 8/9/28(9) | | 13,250 | 14,099,641 |
| Security | Principal
Amount
(000's omitted) | Value |
| Financial (continued) | |
| DNB Bank ASA, 1.535% to 5/25/26, 5/25/27(1)(9) | $ | 5,000 | $ 5,004,526 |
| Enact Holdings, Inc., 6.50%, 8/15/25(1) | | 15,850 | 17,324,367 |
| EPR Properties, 4.50%, 6/1/27 | | 10,800 | 11,733,117 |
| Goldman Sachs Group, Inc. (The): | | | |
| 0.63%, (SOFR + 0.58%), 3/8/24(2) | | 14,197 | 14,231,131 |
| 2.905% to 7/24/22, 7/24/23(9) | | 5,484 | 5,590,390 |
| HAT Holdings I, LLC/HAT Holdings II, LLC: | | | |
| 3.375%, 6/15/26(1) | | 5,114 | 5,197,102 |
| 6.00%, 4/15/25(1) | | 5,066 | 5,300,302 |
| HSBC Holdings PLC, 0.732% to 8/17/23, 8/17/24(9) | | 7,824 | 7,831,557 |
| ING Groep NV, 1.726% to 4/1/26, 4/1/27(9) | | 5,000 | 5,030,596 |
| Iron Mountain, Inc.: | | | |
| 4.50%, 2/15/31(1) | | 4,394 | 4,462,327 |
| 5.00%, 7/15/28(1) | | 6,011 | 6,272,779 |
| JPMorgan Chase & Co.: | | | |
| 0.63%, (SOFR + 0.58%), 3/16/24(2) | | 6,597 | 6,622,402 |
| 1.04% to 2/4/26, 2/4/27(9) | | 25,000 | 24,536,895 |
| 1.47% to 9/22/26, 9/22/27(9) | | 11,468 | 11,399,293 |
| 1.578% to 4/22/26, 4/22/27(9) | | 9,000 | 9,023,719 |
| 2.956% to 5/13/30, 5/13/31(9) | | 8,939 | 9,304,951 |
| Lloyds Banking Group PLC: | | | |
| 0.695% to 5/11/23, 5/11/24(9) | | 4,000 | 4,011,361 |
| 2.438% to 2/5/25, 2/5/26(9) | | 4,905 | 5,090,776 |
| Macquarie Bank, Ltd.: | | | |
| 3.052% to 3/3/31, 3/3/36(1)(9) | | 3,327 | 3,296,916 |
| 3.624%, 6/3/30(1) | | 3,984 | 4,185,069 |
| National Bank of Canada, 0.55% to 11/15/23, 11/15/24(9) | | 8,148 | 8,133,766 |
| Nationwide Building Society, 0.55%, 1/22/24(1) | | 8,809 | 8,780,449 |
| Newmark Group, Inc., 6.125%, 11/15/23 | | 10,113 | 10,954,907 |
| OneMain Finance Corp., 3.50%, 1/15/27 | | 3,724 | 3,730,331 |
| PNC Financial Services Group, Inc. (The), 2.20%, 11/1/24 | | 12,479 | 13,080,009 |
| Radian Group, Inc.: | | | |
| 4.875%, 3/15/27 | | 4,214 | 4,600,951 |
| 6.625%, 3/15/25 | | 5,610 | 6,269,175 |
| Santander UK Group Holdings PLC, 1.532% to 8/21/25, 8/21/26(9) | | 5,400 | 5,391,359 |
| Societe Generale S.A., 1.488% to 12/14/25, 12/14/26(1)(9) | | 13,600 | 13,453,857 |
| Standard Chartered PLC: | | | |
| 1.214% to 3/23/24, 3/23/25(1)(9) | | 1,970 | 1,973,868 |
| 1.319% to 10/14/22, 10/14/23(1)(9) | | 7,275 | 7,322,057 |
| 1.456% to 1/14/26, 1/14/27(1)(9) | | 3,503 | 3,450,544 |
| State Street Corp., 2.901% to 3/30/25, 3/30/26(9) | | 3,000 | 3,184,271 |
| Sun Communities Operating, L.P., 2.30%, 11/1/28(4) | | 2,227 | 2,232,509 |
| Synovus Bank/Columbus, GA: | | | |
| 2.289% to 2/10/22, 2/10/23(9) | | 16,130 | 16,202,536 |
11
See Notes to Financial Statements.
Calvert
Short Duration Income Fund
September 30, 2021
Schedule of Investments — continued
| Security | Principal
Amount
(000's omitted) | Value |
| Financial (continued) | |
| Synovus Bank/Columbus, GA: (continued) | | | |
| 4.00% to 10/29/25, 10/29/30(9) | $ | 2,946 | $ 3,087,684 |
| Synovus Financial Corp., 3.125%, 11/1/22 | | 5,545 | 5,671,787 |
| Texas Capital Bancshares, Inc., 4.00% to 5/6/26, 5/6/31(9) | | 3,909 | 4,069,149 |
| Truist Financial Corp.: | | | |
| 1.125%, 8/3/27(7) | | 8,238 | 8,057,771 |
| 1.267% to 3/2/26, 3/2/27(9) | | 7,843 | 7,818,760 |
| UBS AG, 1.25%, 6/1/26(1) | | 5,143 | 5,119,533 |
| UBS Group AG, 1.494%, 8/10/27(1) | | 10,000 | 9,890,330 |
| UniCredit SpA, 2.569% to 9/22/25, 9/22/26(1)(7)(9) | | 8,524 | 8,670,515 |
| | | | $ 649,564,247 |
| Government - Multinational — 3.7% | |
| European Bank for Reconstruction & Development, 1.50%, 2/13/25 | $ | 11,400 | $ 11,714,741 |
| European Investment Bank: | | | |
| 2.125%, 4/13/26(7) | | 15,000 | 15,819,906 |
| 2.375%, 5/24/27 | | 19,314 | 20,645,237 |
| Inter-American Development Bank, 0.875%, 4/3/25 | | 11,616 | 11,682,037 |
| International Bank for Reconstruction & Development: | | | |
| 0.18%, (SOFR + 0.13%), 1/13/23(2) | | 8,579 | 8,585,693 |
| 0.875%, 7/15/26 | | 20,000 | 19,873,196 |
| | | | $ 88,320,810 |
| Government - Regional — 0.4% | |
| Kommuninvest I Sverige AB, 0.375%, 6/19/24(1) | $ | 10,395 | $ 10,354,047 |
| | | | $ 10,354,047 |
| Industrial — 3.5% | |
| Flowserve Corp.: | | | |
| 3.50%, 10/1/30 | $ | 2,073 | $ 2,167,087 |
| 4.00%, 11/15/23 | | 3,003 | 3,186,193 |
| Hexcel Corp.: | | | |
| 4.20%, 2/15/27(7) | | 3,205 | 3,504,000 |
| 4.95%, 8/15/25 | | 2,641 | 2,927,292 |
| Jabil, Inc.: | | | |
| 3.00%, 1/15/31 | | 13,955 | 14,328,961 |
| 4.70%, 9/15/22 | | 7,391 | 7,686,610 |
| nVent Finance S.a.r.l.: | | | |
| 3.95%, 4/15/23 | | 7,836 | 8,156,682 |
| 4.55%, 4/15/28 | | 2,000 | 2,196,694 |
| SMBC Aviation Capital Finance DAC, 3.55%, 4/15/24(1) | | 3,800 | 4,025,428 |
| SYNNEX Corp.: | | | |
| 1.25%, 8/9/24(1) | | 12,222 | 12,227,318 |
| 1.75%, 8/9/26(1) | | 8,000 | 7,919,101 |
| Security | Principal
Amount
(000's omitted) | Value |
| Industrial (continued) | |
| Teledyne Technologics, Inc., 0.95%, 4/1/24 | $ | 14,000 | $ 14,025,531 |
| | | | $ 82,350,897 |
| Technology — 2.0% | |
| Apple, Inc., 0.55%, 8/20/25 | $ | 8,300 | $ 8,178,097 |
| DXC Technology Co.: | | | |
| 1.80%, 9/15/26 | | 7,500 | 7,493,501 |
| 2.375%, 9/15/28 | | 4,763 | 4,709,452 |
| Seagate HDD Cayman: | | | |
| 3.375%, 7/15/31(1) | | 5,000 | 4,881,250 |
| 4.091%, 6/1/29(1) | | 3,000 | 3,157,500 |
| 4.091%, 6/1/29 | | 3,210 | 3,376,005 |
| 4.875%, 3/1/24 | | 2,851 | 3,075,516 |
| VMware, Inc., 1.40%, 8/15/26 | | 3,000 | 2,987,871 |
| Western Digital Corp., 4.75%, 2/15/26(7) | | 8,878 | 9,843,660 |
| | | | $ 47,702,852 |
| Utilities — 2.3% | |
| AES Corp. (The): | | | |
| 1.375%, 1/15/26 | $ | 7,000 | $ 6,912,691 |
| 2.45%, 1/15/31 | | 4,889 | 4,828,207 |
| Avangrid, Inc., 3.15%, 12/1/24 | | 7,692 | 8,202,950 |
| Clearway Energy Operating, LLC, 5.00%, 9/15/26 | | 4,000 | 4,107,700 |
| Consolidated Edison, Inc., 0.65%, 12/1/23 | | 7,150 | 7,143,711 |
| Enel Finance International NV: | | | |
| 1.375%, 7/12/26(1) | | 3,238 | 3,221,116 |
| 2.65%, 9/10/24(1) | | 10,529 | 11,035,771 |
| NextEra Energy Operating Partners, L.P.: | | | |
| 4.25%, 7/15/24(1) | | 2,281 | 2,417,860 |
| 4.25%, 9/15/24(1) | | 779 | 824,688 |
| 4.50%, 9/15/27(1) | | 3,068 | 3,304,190 |
| Pattern Energy Operations, L.P./Pattern Energy Operations, Inc., 4.50%, 8/15/28(1) | | 3,163 | 3,301,381 |
| | | | $ 55,300,265 |
Total Corporate Bonds
(identified cost $1,248,799,087) | | | $1,263,101,388 |
12
See Notes to Financial Statements.
Calvert
Short Duration Income Fund
September 30, 2021
Schedule of Investments — continued
| High Social Impact Investments — 0.2% |
| Security | Principal
Amount
(000's omitted) | Value |
| Calvert Impact Capital, Inc., Community Investment Notes, 1.50%, 12/15/23(11)(12) | $ | 4,000 | $ 3,931,320 |
Total High Social Impact Investments
(identified cost $4,000,000) | | | $ 3,931,320 |
| Security | Shares | Value |
| Mortgage Real Estate Investment Trusts (REITs) — 0.2% | |
| AGNC Investment Corp., Series C, 7.00% to 10/15/22(9) | | 150,000 | $ 3,931,500 |
| | | | $ 3,931,500 |
| Wireless Telecommunication Services — 0.2% | |
| United States Cellular Corp., 5.50% | | 186,400 | $ 4,928,416 |
| | | | $ 4,928,416 |
Total Preferred Stocks
(identified cost $8,455,603) | | | $ 8,859,916 |
| Senior Floating-Rate Loans — 4.5%(13) |
| Borrower/Description | Principal
Amount
(000's omitted) | Value |
| Automotive — 0.2% | |
| Clarios Global, L.P., Term Loan, 3.334%, (1 mo. USD LIBOR + 3.25%), 4/30/26 | $ | 5,086 | $ 5,068,904 |
| | | | $ 5,068,904 |
| Building and Development — 0.3% | |
| Cushman & Wakefield U.S. Borrower, LLC, Term Loan, 2.834%, (1 mo. USD LIBOR + 2.75%), 8/21/25 | $ | 6,745 | $ 6,696,630 |
| | | | $ 6,696,630 |
| Cable and Satellite Television — 0.8% | |
| CSC Holdings, LLC, Term Loan, 2.334%, (1 mo. USD LIBOR + 2.25%), 7/17/25 | $ | 4,987 | $ 4,929,320 |
| UPC Financing Partnership, Term Loan, 3.084%, (1 mo. USD LIBOR + 3.00%), 1/31/29 | | 6,775 | 6,767,940 |
| Virgin Media Bristol, LLC, Term Loan, 3.334%, (1 mo. USD LIBOR + 3.25%), 1/31/29 | | 6,800 | 6,811,336 |
| | | | $ 18,508,596 |
| Borrower/Description | Principal
Amount
(000's omitted) | Value |
| Drugs — 0.2% | |
| PPD, Inc., Term Loan, 2.50%, (1 mo. USD LIBOR + 2.00%, Floor 0.50%), 1/13/28 | $ | 5,154 | $ 5,151,843 |
| | | | $ 5,151,843 |
| Electronics/Electrical — 1.1% | |
| Banff Merger Sub, Inc., Term Loan, 3.882%, (3 mo. USD LIBOR + 3.75%), 10/2/25 | $ | 5,760 | $ 5,734,413 |
| Hyland Software, Inc., Term Loan, 4.25%, (1 mo. USD LIBOR + 3.50%, Floor 0.75%), 7/1/24 | | 3,527 | 3,536,458 |
| Informatica, LLC, Term Loan, 3.334%, (1 mo. USD LIBOR + 3.25%), 2/25/27 | | 3,474 | 3,466,170 |
| MA FinanceCo., LLC, Term Loan, 2.834%, (1 mo. USD LIBOR + 2.75%), 6/21/24 | | 269 | 267,376 |
| Seattle Spinco, Inc., Term Loan, 2.834%, (1 mo. USD LIBOR + 2.75%), 6/21/24 | | 1,819 | 1,805,654 |
| SS&C European Holdings S.a.r.l., Term Loan, 1.834%, (1 mo. USD LIBOR + 1.75%), 4/16/25 | | 406 | 402,537 |
| SS&C Technologies, Inc., Term Loan, 1.834%, (1 mo. USD LIBOR + 1.75%), 4/16/25 | | 536 | 531,580 |
| Ultimate Software Group, Inc. (The), Term Loan, 3.834%, (1 mo. USD LIBOR + 3.75%), 5/4/26 | | 5,694 | 5,713,505 |
| VS Buyer, LLC, Term Loan, 3.084%, (1 mo. USD LIBOR + 3.00%), 2/28/27 | | 5,762 | 5,753,292 |
| | | | $ 27,210,985 |
| Equipment Leasing — 0.1% | |
| Avolon TLB Borrower 1 (US), LLC, Term Loan, 2.50%, (1 mo. USD LIBOR + 1.75%, Floor 0.75%), 1/15/25 | $ | 1,778 | $ 1,772,564 |
| | | | $ 1,772,564 |
| Health Care — 0.8% | |
| Change Healthcare Holdings, LLC, Term Loan, 3.50%, (USD LIBOR + 2.50%, Floor 1.00%), 3/1/24(14) | $ | 4,242 | $ 4,242,194 |
| ICON Luxembourg S.a.r.l.: | | | |
| Term Loan, 3.00%, (3 mo. USD LIBOR + 2.50%, Floor 0.50%), 7/3/28 | | 6,149 | 6,176,958 |
| Term Loan, 3.00%, (3 mo. USD LIBOR + 2.50%, Floor 0.50%), 7/3/28 | | 1,532 | 1,538,993 |
| Ortho-Clinical Diagnostics S.A., Term Loan, 3.083%, (1 mo. USD LIBOR + 3.00%), 6/30/25 | | 6,700 | 6,701,253 |
| | | | $ 18,659,398 |
| Insurance — 0.3% | |
| Asurion, LLC: | | | |
| Term Loan, 3.209%, (1 mo. USD LIBOR + 3.125%), 11/3/23 | $ | 3,179 | $ 3,166,525 |
| Term Loan, 3.334%, (1 mo. USD LIBOR + 3.25%), 12/23/26 | | 1,747 | 1,722,963 |
13
See Notes to Financial Statements.
Calvert
Short Duration Income Fund
September 30, 2021
Schedule of Investments — continued
| Borrower/Description | Principal
Amount
(000's omitted) | Value |
| Insurance (continued) | |
| USI, Inc., Term Loan, 3.132%, (3 mo. USD LIBOR + 3.00%), 5/16/24 | $ | 1,549 | $ 1,540,569 |
| | | | $ 6,430,057 |
| Leisure Goods/Activities/Movies — 0.2% | |
| Bombardier Recreational Products, Inc., Term Loan, 2.084%, (1 mo. USD LIBOR + 2.00%), 5/24/27 | $ | 739 | $ 734,137 |
| Delta 2 (LUX) S.a.r.l., Term Loan, 3.50%, (1 mo. USD LIBOR + 2.50%, Floor 1.00%), 2/1/24 | | 4,500 | 4,495,779 |
| | | | $ 5,229,916 |
| Telecommunications — 0.5% | |
| CenturyLink, Inc., Term Loan, 2.334%, (1 mo. USD LIBOR + 2.25%), 3/15/27 | $ | 6,671 | $ 6,605,946 |
| Level 3 Financing, Inc., Term Loan, 1.834%, (1 mo. USD LIBOR + 1.75%), 3/1/27 | | 776 | 767,472 |
| Ziggo Financing Partnership, Term Loan, 2.584%, (1 mo. USD LIBOR + 2.50%), 4/30/28 | | 4,872 | 4,838,505 |
| | | | $ 12,211,923 |
Total Senior Floating-Rate Loans
(identified cost $106,992,226) | | | $ 106,940,816 |
| Sovereign Government Bonds — 0.7% |
| Security | Principal
Amount
(000's omitted) | Value |
| Kommunalbanken AS, 2.125%, 2/11/25(1) | $ | 5,000 | $ 5,234,725 |
| Kreditanstalt fuer Wiederaufbau, 2.00%, 9/29/22 | | 5,000 | 5,092,486 |
| Nederlandse Waterschapsbank NV, 2.375%, 3/24/26(1) | | 7,000 | 7,428,954 |
Total Sovereign Government Bonds
(identified cost $17,845,091) | | | $ 17,756,165 |
| Taxable Municipal Obligations — 0.8% |
| Security | Principal
Amount
(000's omitted) | Value |
| Special Tax Revenue — 0.4% | |
| California Health Facilities Financing Authority, (No Place Like Home Program): | | | |
| 1.97%, 6/1/23 | $ | 2,000 | $ 2,052,980 |
| 2.02%, 6/1/24 | | 2,500 | 2,590,125 |
| 2.211%, 6/1/25 | | 4,450 | 4,657,103 |
| | | | $ 9,300,208 |
| Security | Principal
Amount
(000's omitted) | Value |
| Water and Sewer — 0.4% | |
| Narragansett Bay Commission, RI, Wastewater System Revenue, Green Bonds, 1.597%, 9/1/25 | $ | 2,350 | $ 2,397,822 |
| San Diego County Water Authority, CA, Green Bonds, Series A, 0.743%, 5/1/25 | | 1,500 | 1,495,185 |
| San Francisco City and County Public Utilities Commission, CA, Water Revenue, Green Bonds: | | | |
| 1.864%, 11/1/21 | | 3,740 | 3,744,825 |
| 1.949%, 11/1/22 | | 675 | 687,535 |
| 1.982%, 11/1/23 | | 700 | 721,161 |
| 2.082%, 11/1/24 | | 500 | 519,530 |
| | | | $ 9,566,058 |
Total Taxable Municipal Obligations
(identified cost $18,415,000) | | | $ 18,866,266 |
| U.S. Treasury Obligations — 5.2% |
| Security | Principal
Amount
(000's omitted) | Value |
| U.S. Treasury Notes: | | | |
| 0.125%, 9/30/22 | $ | 15,526 | $ 15,531,626 |
| 0.125%, 11/30/22 | | 15,196 | 15,196,594 |
| 0.125%, 5/31/23 | | 8,600 | 8,586,898 |
| 0.125%, 6/30/23 | | 14,311 | 14,287,521 |
| 0.125%, 7/31/23 | | 14,844 | 14,813,558 |
| 0.125%, 8/31/23 | | 14,419 | 14,381,826 |
| 0.25%, 4/15/23 | | 14,854 | 14,867,635 |
| 0.25%, 9/30/23 | | 14,462 | 14,451,549 |
| 0.25%, 5/15/24 | | 11,479 | 11,424,744 |
Total U.S. Treasury Obligations
(identified cost $123,581,341) | | | $ 123,541,951 |
14
See Notes to Financial Statements.
Calvert
Short Duration Income Fund
September 30, 2021
Schedule of Investments — continued
| Short-Term Investments — 2.0% | | | |
| Affiliated Fund — 1.2% |
| Description | Units | Value |
| Calvert Cash Reserves Fund, LLC, 0.04%(15) | | 29,668,096 | $ 29,671,063 |
Total Affiliated Fund
(identified cost $29,668,096) | | | $ 29,671,063 |
| Securities Lending Collateral — 0.8% |
| Security | Shares | Value |
| State Street Navigator Securities Lending Government Money Market Portfolio, 0.03%(16) | | 18,162,513 | $ 18,162,513 |
Total Securities Lending Collateral
(identified cost $18,162,513) | | | $ 18,162,513 |
Total Short-Term Investments
(identified cost $47,830,609) | | | $ 47,833,576 |
Total Investments — 100.8%
(identified cost $2,374,377,369) | | | $2,388,905,874 |
| Other Assets, Less Liabilities — (0.8)% | | | $ (19,192,178) |
| Net Assets — 100.0% | | | $ 2,369,713,696 |
| The percentage shown for each investment category in the Schedule of Investments is based on net assets. |
| (1) | Security exempt from registration under Rule 144A of the Securities Act of 1933, as amended. These securities may be sold in certain transactions in reliance on an exemption from registration (normally to qualified institutional buyers). At September 30, 2021, the aggregate value of these securities is $1,140,643,663 or 48.1% of the Fund's net assets. |
| (2) | Variable rate security. The stated interest rate represents the rate in effect at September 30, 2021. |
| (3) | Step coupon security. Interest rate represents the rate in effect at
September 30, 2021. |
| (4) | When-issued security. |
| (5) | Weighted average fixed-rate coupon that changes/updates monthly. Rate shown is the rate at September 30, 2021. |
| (6) | Represents an investment in an issuer that may be deemed to be an affiliate effective March 1, 2021 (see Note 8). |
| (7) | All or a portion of this security was on loan at September 30, 2021. The aggregate market value of securities on loan at September 30, 2021 was $24,556,231. |
| (8) | Security exempt from registration under Regulation S of the Securities Act of 1933, as amended, which exempts from registration securities offered and sold outside the United States. Security may not be offered or sold in the United States except pursuant to an exemption from, or in a transaction not subject to, the registration requirements of the Securities Act of 1933, as amended. At September 30, 2021, the aggregate value of these securities is $7,630,248 or 0.3% of the Fund's net assets. |
| (9) | Security converts to variable rate after the indicated fixed-rate coupon period. |
| (10) | Perpetual security with no stated maturity date but may be subject to calls by the issuer. |
| (11) | May be deemed to be an affiliated company (see Note 8). |
| (12) | Restricted security. Total market value of restricted securities amounts to $3,931,320, which represents 0.2% of the net assets of the Fund as of September 30, 2021. |
| (13) | Senior floating-rate loans (Senior Loans) often require prepayments from excess cash flows or permit the borrowers to repay at their election. The degree to which borrowers repay, whether as a contractual requirement or at their election, cannot be predicted with accuracy. As a result, the actual remaining maturity may be substantially less than the stated maturities shown. However, Senior Loans will typically have an expected average life of approximately two to four years. Senior Loans typically have rates of interest which are redetermined periodically by reference to a base lending rate, plus a spread. These base lending rates are primarily the London Interbank Offered Rate ("LIBOR") and secondarily, the prime rate offered by one or more major United States banks (the "Prime Rate"). Base lending rates may be subject to a floor, or minimum rate. Senior Loans are generally subject to contractual restrictions that must be satisfied before they can be bought or sold. |
| (14) | The stated interest rate represents the weighted average interest rate at September 30, 2021 of contracts within the senior loan facility. Interest rates on contracts are primarily redetermined either weekly, monthly or quarterly by reference to the indicated base lending rate and spread and the reset period. |
| (15) | Affiliated investment company, available to Calvert portfolios and funds, which invests in high quality, U.S. dollar denominated money market instruments. The rate shown is the annualized seven-day yield as of September 30, 2021. |
| (16) | Represents investment of cash collateral received in connection with securities lending. |
15
See Notes to Financial Statements.
Calvert
Short Duration Income Fund
September 30, 2021
Schedule of Investments — continued
Futures Contracts
| Description | Number of
Contracts | Position | Expiration
Date | Notional
Amount | Value/
Unrealized
Appreciation
(Depreciation) |
| Interest Rate Futures | | | | | |
| U.S. 2-Year Treasury Note | 103 | Long | 12/31/21 | $ 22,665,633 | $ (13,047) |
| U.S. 5-Year Treasury Note | (428) | Short | 12/31/21 | (52,533,657) | 313,373 |
| U.S. 10-Year Treasury Note | (483) | Short | 12/21/21 | (63,567,328) | 685,886 |
| U.S. Ultra 10-Year Treasury Note | (1,010) | Short | 12/21/21 | (146,702,500) | 2,219,940 |
| | | | | | $3,206,152 |
Restricted Securities
| Description | Acquisition Date | Cost |
| Calvert Impact Capital, Inc., Community Investment Notes, 1.50%, 12/15/23 | 12/14/20 | $4,000,000 |
| Abbreviations: |
| LIBOR | – London Interbank Offered Rate |
| SOFR | – Secured Overnight Financing Rate |
| Currency Abbreviations: |
| USD | – United States Dollar |
16
See Notes to Financial Statements.
Calvert
Short Duration Income Fund
September 30, 2021
Statement of Assets and Liabilities
| | September 30, 2021 |
| Assets | |
Investments in securities of unaffiliated issuers, at value (identified cost $2,312,051,848) - including
$24,556,231 of securities on loan | $ 2,326,765,645 |
| Investments in securities of affiliated issuers, at value (identified cost $62,325,521) | 62,140,229 |
| Cash | 5,585,051 |
| Deposits at broker for futures contracts | 3,509,000 |
| Receivable for investments sold | 65,105,422 |
| Receivable for capital shares sold | 9,198,702 |
| Dividends and interest receivable | 8,750,173 |
| Dividends and interest receivable - affiliated | 66,341 |
| Securities lending income receivable | 2,373 |
| Tax reclaims receivable | 1,423 |
| Trustees' deferred compensation plan | 1,210,894 |
| Total assets | $2,482,335,253 |
| Liabilities | |
| Payable for variation margin on open futures contracts | $ 274,299 |
| Payable for investments purchased | 72,926,971 |
| Payable for when-issued securities | 14,902,695 |
| Payable for capital shares redeemed | 3,327,347 |
| Distributions payable | 485,022 |
| Deposits for securities loaned | 18,162,513 |
| Payable to affiliates: | |
| Investment advisory fee | 532,299 |
| Administrative fee | 230,931 |
| Distribution and service fees | 81,008 |
| Sub-transfer agency fee | 10,587 |
| Trustees' deferred compensation plan | 1,210,894 |
| Other | 11,811 |
| Accrued expenses | 465,180 |
| Total liabilities | $ 112,621,557 |
| Net Assets | $2,369,713,696 |
| Sources of Net Assets | |
| Paid-in capital | $ 2,340,993,212 |
| Distributable earnings | 28,720,484 |
| Total | $2,369,713,696 |
| Class A Shares | |
| Net Assets | $ 301,928,841 |
| Shares Outstanding | 18,336,498 |
Net Asset Value and Redemption Price Per Share
(net assets ÷ shares of beneficial interest outstanding) | $ 16.47 |
Maximum Offering Price Per Share
(100 ÷ 97.25 of net asset value per share) | $ 16.94 |
| Class C Shares | |
| Net Assets | $ 22,934,745 |
| Shares Outstanding | 1,398,213 |
Net Asset Value and Offering Price Per Share*
(net assets ÷ shares of beneficial interest outstanding) | $ 16.40 |
17
See Notes to Financial Statements.
Calvert
Short Duration Income Fund
September 30, 2021
Statement of Assets and Liabilities — continued
| | September 30, 2021 |
| Class I Shares | |
| Net Assets | $1,928,346,921 |
| Shares Outstanding | 116,324,309 |
Net Asset Value, Offering Price and Redemption Price Per Share
(net assets ÷ shares of beneficial interest outstanding) | $ 16.58 |
| Class R6 Shares | |
| Net Assets | $ 116,503,189 |
| Shares Outstanding | 7,028,671 |
Net Asset Value, Offering Price and Redemption Price Per Share
(net assets ÷ shares of beneficial interest outstanding) | $ 16.58 |
| On sales of $50,000 or more, the offering price of Class A shares is reduced. |
| * | Redemption price per share is equal to the net asset value less any applicable contingent deferred sales charge. |
18
See Notes to Financial Statements.
Calvert
Short Duration Income Fund
September 30, 2021
| | Year Ended |
| | September 30, 2021 |
| Investment Income | |
| Dividend income | $ 410,131 |
| Dividend income - affiliated issuers | 59,748 |
| Interest and other income (net of foreign taxes withheld of $237) | 44,551,966 |
| Interest income - affiliated issuers | 248,382 |
| Securities lending income, net | 26,943 |
| Total investment income | $45,297,170 |
| Expenses | |
| Investment advisory fee | $ 5,404,850 |
| Administrative fee | 2,342,116 |
| Distribution and service fees: | |
| Class A | 717,071 |
| Class C | 261,940 |
| Trustees' fees and expenses | 104,236 |
| Custodian fees | 46,501 |
| Transfer agency fees and expenses | 1,249,149 |
| Accounting fees | 388,656 |
| Professional fees | 68,187 |
| Registration fees | 162,245 |
| Reports to shareholders | 76,510 |
| Miscellaneous | 64,990 |
| Total expenses | $10,886,451 |
| Net investment income | $34,410,719 |
| Realized and Unrealized Gain (Loss) | |
| Net realized gain (loss): | |
| Investment securities | $ 13,998,364 |
| Investment securities - affiliated issuers | (5,580) |
| Futures contracts | 3,863,221 |
| Net realized gain | $17,856,005 |
| Change in unrealized appreciation (depreciation): | |
| Investment securities | $ 16,721,889 |
| Investment securities - affiliated issuers | 209,190 |
| Futures contracts | 3,552,328 |
| Net change in unrealized appreciation (depreciation) | $20,483,407 |
| Net realized and unrealized gain | $38,339,412 |
| Net increase in net assets from operations | $72,750,131 |
19
See Notes to Financial Statements.
Calvert
Short Duration Income Fund
September 30, 2021
Statements of Changes in Net Assets
| | Year Ended September 30, |
| | 2021 | 2020 |
| Increase (Decrease) in Net Assets | | |
| From operations: | | |
| Net investment income | $ 34,410,719 | $ 39,618,813 |
| Net realized gain | 17,856,005 | 18,911,051 |
| Net change in unrealized appreciation (depreciation) | 20,483,407 | (18,627,156) |
| Net increase in net assets from operations | $ 72,750,131 | $ 39,902,708 |
| Distributions to shareholders: | | |
| Class A | $ (6,246,566) | $ (5,795,454) |
| Class C | (396,137) | (632,771) |
| Class I | (37,460,923) | (33,765,920) |
| Class R6 | (1,483,505) | (823,433) |
| Total distributions to shareholders | $ (45,587,131) | $ (41,017,578) |
| Capital share transactions: | | |
| Class A | $ 30,938,192 | $ 14,929,167 |
| Class C | (9,646,089) | (16,172,341) |
| Class I | 556,748,981 | 53,070,141 |
| Class R6 | 75,735,297 | 15,500,381 |
| Net increase in net assets from capital share transactions | $ 653,776,381 | $ 67,327,348 |
| Net increase in net assets | $ 680,939,381 | $ 66,212,478 |
| Net Assets | | |
| At beginning of year | $ 1,688,774,315 | $ 1,622,561,837 |
| At end of year | $2,369,713,696 | $1,688,774,315 |
20
See Notes to Financial Statements.
Calvert
Short Duration Income Fund
September 30, 2021
| | Class A |
| | Year Ended September 30, |
| | 2021 | 2020 | 2019 | 2018 | 2017 |
| Net asset value — Beginning of year | $ 16.21 | $ 16.13 | $ 15.83 | $ 16.11 | $ 16.18 |
| Income (Loss) From Operations | | | | | |
| Net investment income(1) | $ 0.26 | $ 0.35 | $ 0.45 | $ 0.37 | $ 0.30 |
| Net realized and unrealized gain (loss) | 0.36 | 0.09 | 0.32 | (0.28) | (0.07) |
| Total income from operations | $ 0.62 | $ 0.44 | $ 0.77 | $ 0.09 | $ 0.23 |
| Less Distributions | | | | | |
| From net investment income | $ (0.27) | $ (0.36) | $ (0.47) | $ (0.37) | $ (0.30) |
| From net realized gain | (0.09) | — | — | — | — |
| Total distributions | $ (0.36) | $ (0.36) | $ (0.47) | $ (0.37) | $ (0.30) |
| Net asset value — End of year | $ 16.47 | $ 16.21 | $ 16.13 | $ 15.83 | $ 16.11 |
| Total Return(2) | 3.87% | 2.80% | 4.94% | 0.59% | 1.43% |
| Ratios/Supplemental Data | | | | | |
| Net assets, end of year (000’s omitted) | $301,929 | $266,758 | $251,080 | $258,528 | $337,692 |
| Ratios (as a percentage of average daily net assets):(3) | | | | | |
| Total expenses | 0.76% | 0.77% | 0.81% | 0.84% | 0.94% |
| Net expenses | 0.76% | 0.76% | 0.79% | 0.84% | 0.89% |
| Net investment income | 1.57% | 2.18% | 2.80% | 2.29% | 1.87% |
| Portfolio Turnover | 89% (4) | 91% (4) | 68% | 80% | 94% |
| (1) | Computed using average shares outstanding. |
| (2) | Returns are historical and are calculated by determining the percentage change in net asset value with all distributions reinvested and do not reflect the effect of sales charges, if any. |
| (3) | Total expenses do not reflect amounts reimbursed and/or waived by the adviser and certain of its affiliates, if applicable. Net expenses are net of all reductions and represent the net expenses paid by the Fund. |
| (4) | Includes the effect of To-Be-Announced (TBA) transactions. |
21
See Notes to Financial Statements.
Calvert
Short Duration Income Fund
September 30, 2021
Financial Highlights — continued
| | Class C |
| | Year Ended September 30, |
| | 2021 | 2020 | 2019 | 2018 | 2017 |
| Net asset value — Beginning of year | $ 16.15 | $ 16.07 | $ 15.77 | $ 16.05 | $ 16.12 |
| Income (Loss) From Operations | | | | | |
| Net investment income(1) | $ 0.14 | $ 0.23 | $ 0.33 | $ 0.25 | $ 0.18 |
| Net realized and unrealized gain (loss) | 0.35 | 0.09 | 0.32 | (0.28) | (0.08) |
| Total income (loss) from operations | $ 0.49 | $ 0.32 | $ 0.65 | $ (0.03) | $ 0.10 |
| Less Distributions | | | | | |
| From net investment income | $ (0.15) | $ (0.24) | $ (0.35) | $ (0.25) | $ (0.17) |
| From net realized gain | (0.09) | — | — | — | — |
| Total distributions | $ (0.24) | $ (0.24) | $ (0.35) | $ (0.25) | $ (0.17) |
| Net asset value — End of year | $ 16.40 | $ 16.15 | $ 16.07 | $ 15.77 | $ 16.05 |
| Total Return(2) | 3.04% | 2.03% | 4.16% | (0.16)% | 0.66% |
| Ratios/Supplemental Data | | | | | |
| Net assets, end of year (000’s omitted) | $22,935 | $32,087 | $48,326 | $78,228 | $100,333 |
| Ratios (as a percentage of average daily net assets):(3) | | | | | |
| Total expenses | 1.51% | 1.52% | 1.57% | 1.59% | 1.65% |
| Net expenses | 1.51% | 1.51% | 1.55% | 1.59% | 1.65% |
| Net investment income | 0.85% | 1.46% | 2.06% | 1.55% | 1.11% |
| Portfolio Turnover | 89% (4) | 91% (4) | 68% | 80% | 94% |
| (1) | Computed using average shares outstanding. |
| (2) | Returns are historical and are calculated by determining the percentage change in net asset value with all distributions reinvested and do not reflect the effect of sales charges, if any. |
| (3) | Total expenses do not reflect amounts reimbursed and/or waived by the adviser and certain of its affiliates, if applicable. Net expenses are net of all reductions and represent the net expenses paid by the Fund. |
| (4) | Includes the effect of To-Be-Announced (TBA) transactions. |
22
See Notes to Financial Statements.
Calvert
Short Duration Income Fund
September 30, 2021
Financial Highlights — continued
| | Class I |
| | Year Ended September 30, |
| | 2021 | 2020 | 2019 | 2018 | 2017 |
| Net asset value — Beginning of year | $ 16.32 | $ 16.24 | $ 15.93 | $ 16.20 | $ 16.27 |
| Income (Loss) From Operations | | | | | |
| Net investment income(1) | $ 0.30 | $ 0.39 | $ 0.49 | $ 0.43 | $ 0.36 |
| Net realized and unrealized gain (loss) | 0.37 | 0.10 | 0.33 | (0.29) | (0.07) |
| Total income from operations | $ 0.67 | $ 0.49 | $ 0.82 | $ 0.14 | $ 0.29 |
| Less Distributions | | | | | |
| From net investment income | $ (0.32) | $ (0.41) | $ (0.51) | $ (0.41) | $ (0.36) |
| From net realized gain | (0.09) | — | — | — | — |
| Total distributions | $ (0.41) | $ (0.41) | $ (0.51) | $ (0.41) | $ (0.36) |
| Net asset value — End of year | $ 16.58 | $ 16.32 | $ 16.24 | $ 15.93 | $ 16.20 |
| Total Return(2) | 4.11% | 3.05% | 5.24% | 0.91% | 1.82% |
| Ratios/Supplemental Data | | | | | |
| Net assets, end of year (000’s omitted) | $1,928,347 | $1,349,828 | $1,298,581 | $1,043,989 | $359,176 |
| Ratios (as a percentage of average daily net assets):(3) | | | | | |
| Total expenses | 0.51% | 0.52% | 0.56% | 0.59% | 0.53% |
| Net expenses | 0.51% | 0.51% | 0.51% | 0.52% | 0.51% |
| Net investment income | 1.81% | 2.43% | 3.06% | 2.69% | 2.23% |
| Portfolio Turnover | 89% (4) | 91% (4) | 68% | 80% | 94% |
| (1) | Computed using average shares outstanding. |
| (2) | Returns are historical and are calculated by determining the percentage change in net asset value with all distributions reinvested and do not reflect the effect of sales charges, if any. |
| (3) | Total expenses do not reflect amounts reimbursed and/or waived by the adviser and certain of its affiliates, if applicable. Net expenses are net of all reductions and represent the net expenses paid by the Fund. |
| (4) | Includes the effect of To-Be-Announced (TBA) transactions. |
23
See Notes to Financial Statements.
Calvert
Short Duration Income Fund
September 30, 2021
Financial Highlights — continued
| | Class R6 |
| | Year Ended September 30, | Period Ended
September 30, |
| | 2021 | 2020 | 2019 (1) |
| Net asset value — Beginning of period | $ 16.32 | $ 16.24 | $ 15.90 |
| Income (Loss) From Operations | | | |
| Net investment income(2) | $ 0.30 | $ 0.40 | $ 0.33 |
| Net realized and unrealized gain | 0.37 | 0.09 | 0.34 |
| Total income from operations | $ 0.67 | $ 0.49 | $ 0.67 |
| Less Distributions | | | |
| From net investment income | $ (0.32) | $ (0.41) | $ (0.33) |
| From net realized gain | (0.09) | — | — |
| Total distributions | $ (0.41) | $ (0.41) | $ (0.33) |
| Net asset value — End of period | $ 16.58 | $ 16.32 | $ 16.24 |
| Total Return(3) | 4.17% | 3.10% | 4.25% (4) |
| Ratios/Supplemental Data | | | |
| Net assets, end of period (000’s omitted) | $116,503 | $40,102 | $24,575 |
| Ratios (as a percentage of average daily net assets):(5) | | | |
| Total expenses | 0.45% | 0.46% | 0.49% (6) |
| Net expenses | 0.45% | 0.46% | 0.46% (6) |
| Net investment income | 1.84% | 2.46% | 3.11% (6) |
| Portfolio Turnover | 89% (7) | 91% (7) | 68% (8) |
| (1) | For the period from the commencement of operations, February 1, 2019, to September 30, 2019. |
| (2) | Computed using average shares outstanding. |
| (3) | Returns are historical and are calculated by determining the percentage change in net asset value with all distributions reinvested and do not reflect the effect of sales charges, if any. |
| (4) | Not annualized. |
| (5) | Total expenses do not reflect amounts reimbursed and/or waived by the adviser and certain of its affiliates, if applicable. Net expenses are net of all reductions and represent the net expenses paid by the Fund. |
| (6) | Annualized. |
| (7) | Includes the effect of To-Be-Announced (TBA) transactions. |
| (8) | For the year ended September 30, 2019. |
24
See Notes to Financial Statements.
Calvert
Short Duration Income Fund
September 30, 2021
Notes to Financial Statements
1 Significant Accounting Policies
Calvert Short Duration Income Fund (the Fund) is a diversified series of The Calvert Fund (the Trust). The Trust is a Massachusetts business trust registered under the Investment Company Act of 1940, as amended (the 1940 Act), as an open-end management investment company. The investment objective of the Fund is to seek to maximize income, to the extent consistent with preservation of capital, through investment in short-term bonds and income- producing securities. The Fund invests primarily in investment grade, U.S. dollar denominated debt securities.
The Fund offers four classes of shares. Class A shares are generally sold subject to a sales charge imposed at time of purchase. A contingent deferred sales charge of 0.50% may apply to certain redemptions of Class A shares for accounts for which no sales charge was paid, if redeemed within 12 months of purchase. Class C shares are sold without a front-end sales charge, and with certain exceptions, are charged a contingent deferred sales charge of 1% on shares redeemed within 12 months of purchase. Class C shares are only available for purchase through a financial intermediary. Effective January 25, 2019, Class C shares generally automatically convert to Class A shares ten years after their purchase and, effective November 5, 2020, automatically convert to Class A shares eight years after their purchase as described in the Fund's prospectus. Class I and Class R6 shares are sold at net asset value, are not subject to a sales charge and are sold only to certain eligible investors. Each class represents a pro rata interest in the Fund, but votes separately on class-specific matters and is subject to different expenses.
The Fund applies the accounting and reporting guidance in the Financial Accounting Standards Board (FASB) Accounting Standards Codification Topic 946, Financial Services – Investment Companies (ASC 946). Subsequent events, if any, through the date that the financial statements were issued have been evaluated in the preparation of the financial statements.
A Investment Valuation— Net asset value per share is determined every business day as of the close of the regular session of the New York Stock Exchange (generally 4:00 p.m. Eastern time). The Fund uses independent pricing services approved by the Board of Trustees (the Board) to value its investments wherever possible. Investments for which market quotations are not available or deemed not reliable are fair valued in good faith under the direction of the Board.
U.S. generally accepted accounting principles (U.S. GAAP) establishes a disclosure hierarchy that categorizes the inputs to valuation techniques used to value assets and liabilities at measurement date. These inputs are summarized in the three broad levels listed below:
Level 1 - quoted prices in active markets for identical securities
Level 2 - other significant observable inputs (including quoted prices for similar securities, interest rates, prepayment speeds, credit risk, etc.)
Level 3 - significant unobservable inputs (including the Fund’s own assumptions in determining the fair value of investments)
The inputs or methodologies used for valuing securities are not necessarily an indication of the risk associated with investing in those securities.
Valuation techniques used to value the Fund’s investments by major category are as follows:
Equity Securities. Equity securities (including warrants and rights) listed on a U.S. securities exchange generally are valued at the last sale or closing price as reported by an independent pricing service on the primary market or exchange on which they are traded and are categorized as Level 1 in the hierarchy. Equity securities listed on the NASDAQ National Market System are valued at the NASDAQ official closing price and are categorized as Level 1 in the hierarchy. Unlisted or listed securities for which closing sales prices or closing quotations are not available are valued at the mean between the latest available bid and ask prices and are categorized as Level 2 in the hierarchy.
Debt Securities. Debt securities are generally valued based on valuations provided by third party pricing services, as derived from such services’ pricing models. Inputs to the models may include, but are not limited to, reported trades, executable bid and ask prices, broker/dealer quotations, prices or yields of securities with similar characteristics, interest rates, anticipated prepayments, benchmark curves or information pertaining to the issuer, as well as industry and economic events. Accordingly, debt securities are generally categorized as Level 2 in the hierarchy. Short-term debt securities with a remaining maturity at time of purchase of more than sixty days are valued based on valuations provided by a third party pricing service. Such securities are generally categorized as Level 2 in the hierarchy. Short-term debt securities of sufficient credit quality purchased with remaining maturities of sixty days or less for which a valuation from a third party pricing service is not readily available may be valued at amortized cost, which approximates fair value, and are categorized as Level 2 in the hierarchy.
Senior Floating-Rate Loans. Interests in senior floating-rate loans for which reliable market quotations are readily available are valued generally at the average mean of bid and ask quotations obtained from a third party pricing service, and are categorized as Level 2 in the hierarchy.
Affiliated Fund. The Fund may invest in Calvert Cash Reserves Fund, LLC (Cash Reserves Fund), an affiliated investment company managed by Calvert Research and Management (CRM). While Cash Reserves Fund is not a registered money market mutual fund, it conducts all of its investment activities in accordance with the requirements of Rule 2a-7 under the 1940 Act. Investments in Cash Reserves Fund are valued at the closing net asset value per unit on the valuation day and are categorized as Level 2 in the hierarchy. Cash Reserves Fund generally values its investment securities based on available market quotations provided by a third party pricing service.
Other Securities. Investments in registered investment companies (including money market funds) that do not trade on an exchange are valued at the net asset value per share on the valuation day and are categorized as Level 1 in the hierarchy.
Calvert
Short Duration Income Fund
September 30, 2021
Notes to Financial Statements — continued
Derivatives. Futures contracts are valued at unrealized appreciation (depreciation) based on the settlement price established each day by the board of trade or exchange on which they are traded and are categorized as Level 1 in the hierarchy.
Fair Valuation. If a market value cannot be determined for a security using the methodologies described above, or if, in the good faith opinion of the Fund's adviser, the market value does not constitute a readily available market quotation, or if a significant event has occurred that would materially affect the value of the security, the security will be fair valued as determined in good faith by or at the direction of the Board in a manner that most fairly reflects the security’s “fair value”, which is the amount that the Fund might reasonably expect to receive for the security upon its current sale in the ordinary course. Each such determination is based on a consideration of relevant factors, which are likely to vary from one pricing context to another. These factors may include, but are not limited to, the type of security, the existence of any contractual restrictions on the security’s disposition, the price and extent of public trading in similar securities of the issuer or of comparable companies or entities, quotations or relevant information obtained from broker/dealers or other market participants, information obtained from the issuer, analysts, and/or the appropriate stock exchange (for exchange-traded securities), an analysis of the company’s or entity’s financial statements, and an evaluation of the forces that influence the issuer and the market(s) in which the security is purchased and sold.
The values assigned to fair value investments are based on available information and do not necessarily represent amounts that might ultimately be realized. Further, due to the inherent uncertainty of valuations of such investments, the fair values may differ significantly from the values that would have been used had an active market existed, and the differences could be material.
The following table summarizes the market value of the Fund's holdings as of September 30, 2021, based on the inputs used to value them:
| Asset Description | Level 1 | Level 2 | Level 3 | Total |
| Asset-Backed Securities | $ — | $ 492,270,905 | $ — | $ 492,270,905 |
| Collateralized Mortgage Obligations | — | 123,319,082 | — | 123,319,082 |
| Commercial Mortgage-Backed Securities | — | 182,484,489 | — | 182,484,489 |
| Corporate Bonds | — | 1,263,101,388 | — | 1,263,101,388 |
| High Social Impact Investments | — | 3,931,320 | — | 3,931,320 |
| Preferred Stocks | 8,859,916 | — | — | 8,859,916 |
| Senior Floating-Rate Loans | — | 106,940,816 | — | 106,940,816 |
| Sovereign Government Bonds | — | 17,756,165 | — | 17,756,165 |
| Taxable Municipal Obligations | — | 18,866,266 | — | 18,866,266 |
| U.S. Treasury Obligations | — | 123,541,951 | — | 123,541,951 |
| Short-Term Investments: | | | | |
| Affiliated Fund | — | 29,671,063 | — | 29,671,063 |
| Securities Lending Collateral | 18,162,513 | — | — | 18,162,513 |
| Total Investments | $27,022,429 | $2,361,883,445 | $ — | $2,388,905,874 |
| Futures Contracts | $ 3,219,199 | $ — | $ — | $ 3,219,199 |
| Total | $30,241,628 | $2,361,883,445 | $ — | $2,392,125,073 |
| Liability Description | | | | |
| Futures Contracts | $ (13,047) | $ — | $ — | $ (13,047) |
| Total | $ (13,047) | $ — | $ — | $ (13,047) |
B Investment Transactions and Income— Investment transactions for financial statement purposes are accounted for on trade date. Realized gains and losses are recorded on an identified cost basis and may include proceeds from litigation. Dividend income is recorded on the ex-dividend date for dividends received in cash and/or securities. Non-cash dividends are recorded at the fair value of the securities received. Withholding taxes on foreign interest, if any, have been provided for in accordance with the Fund’s understanding of the applicable country’s tax rules and rates. Distributions received that represent a return of capital are recorded as a reduction of cost of investments. Distributions received that represent a capital gain are recorded as a realized gain.
Interest income, which includes amortization of premium and accretion of discount on debt securities, is accrued as earned. The Fund may earn certain fees in connection with its investments in senior floating-rate loans. These fees are in addition to interest payments earned and may include amendment fees, consent fees and prepayment fees, which are recorded to income as earned. Inflation adjustments to the principal amount of inflation-adjusted bonds and notes are reflected as interest income. Deflation adjustments to the principal amount of an inflation-adjusted bond or note are reflected as reductions to interest income to the extent of interest income previously recorded on such bond or note.
Calvert
Short Duration Income Fund
September 30, 2021
Notes to Financial Statements — continued
C Share Class Accounting— Realized and unrealized gains and losses are allocated daily to each class of shares based upon the relative net assets of each class to the total net assets of the Fund. Net investment income, other than class-specific expenses, is allocated daily to each class of shares based upon the ratio of the value of each class’s paid shares to the total value of all paid shares. Expenses arising in connection with a specific class are charged directly to that class. Sub-accounting, recordkeeping and similar administrative fees payable to financial intermediaries, which are a component of transfer agency fees and expenses on the Statement of Operations, are not allocated to Class R6 shares.
D Senior Floating-Rate Loans— The Fund may invest in direct debt instruments, which are interests in amounts owed to lenders or lending syndicates by corporate, governmental, or other borrowers. The Fund’s investment in loans may be in the form of participations in loans or assignments of all or a portion of loans from third parties. A loan is often administered by a bank or other financial institution (the lender) that acts as agent for all holders. The agent administers the terms of the loan, as specified in the loan agreement. The Fund may invest in multiple series or tranches of a loan, which may have varying terms and carry different associated risks. When the Fund purchases assignments from lenders, it acquires direct rights against the borrower of the loan. When investing in a loan participation, the Fund has the right to receive payments of principal, interest and any fees to which it is entitled only from the lender selling the loan agreement and only upon receipt of such payments by the lender from the borrower. The Fund generally has no right to enforce compliance by the borrower with the terms of the loan agreement. As a result, the Fund may be subject to the credit risk of both the borrower and the lender that is issuing the participation interest.
E Futures Contracts— The Fund may enter into futures contracts to buy or sell a financial instrument for a set price at a future date. Initial margin deposits of either cash or securities as required by the broker are made upon entering into the contract. While the contract is open, daily variation margin payments are made to or received from the broker reflecting the daily change in market value of the contract and are recorded for financial reporting purposes as unrealized gains or losses by the Fund. When a futures contract is closed, a realized gain or loss is recorded equal to the difference between the opening and closing value of the contract. The risks associated with entering into futures contracts may include the possible illiquidity of the secondary market which would limit the Fund’s ability to close out a futures contract prior to the settlement date, an imperfect correlation between the value of the contracts and the underlying financial instruments, or that the counterparty will fail to perform its obligations under the contracts’ terms. Futures contracts are designed by boards of trade, which are designated “contracts markets” by the Commodities Futures Trading Commission. Futures contracts trade on the contracts markets in a manner that is similar to the way a stock trades on a stock exchange, and the boards of trade, through their clearing corporations, guarantee the futures contracts against default. As a result, there is minimal counterparty credit risk to the Fund.
F Restricted Securities— The Fund may invest in securities that are subject to legal or contractual restrictions on resale. Generally, these securities may only be sold publicly upon registration under the Securities Act of 1933 or in transactions exempt from such registration. Information regarding restricted securities (excluding Rule 144A securities) is included at the end of the Schedule of Investments.
G Distributions to Shareholders— Distributions to shareholders are recorded by the Fund on ex-dividend date. The Fund declares income distributions daily to shareholders of record at the time of declaration and generally pays them monthly. The Fund makes distributions of net realized capital gains, if any, at least annually. Distributions are declared separately for each class of shares. Distributions are determined in accordance with income tax regulations, which may differ from U.S. GAAP; accordingly, periodic reclassifications are made within the Fund’s capital accounts to reflect income and gains available for distribution under income tax regulations.
H Estimates— The preparation of financial statements in conformity with U.S. GAAP requires management to make estimates and assumptions that affect the reported amounts of assets and liabilities and disclosure of contingent assets and liabilities at the date of the financial statements and the reported amounts of increases and decreases in net assets from operations during the reporting period. Actual results could differ from those estimates.
I Indemnifications— Under the Trust’s organizational document, its officers and Trustees may be indemnified against certain liabilities and expenses arising out of the performance of their duties to the Fund. Under Massachusetts law, if certain conditions prevail, shareholders of a Massachusetts business trust (such as the Trust) could be deemed to have personal liability for the obligations of the Trust. However, the Trust’s Declaration of Trust contains an express disclaimer of liability on the part of Fund shareholders and provides that the Trust shall assume, upon request by the shareholder, the defense on behalf of any Fund shareholders or former shareholders. Additionally, in the normal course of business, the Fund enters into agreements with service providers that may contain indemnification clauses. The Fund’s maximum exposure under these arrangements is unknown as this would involve future claims that may be made against the Fund that have not yet occurred.
J Federal Income Taxes— No provision for federal income or excise tax is required since the Fund intends to continue to qualify as a regulated investment company under the Internal Revenue Code and to distribute substantially all of its taxable earnings.
Management has analyzed the Fund's tax positions taken for all open federal income tax years and has concluded that no provision for federal income tax is required in the Fund's financial statements. A Fund's federal tax return is subject to examination by the Internal Revenue Service for a period of three years from the date of filing.
K When-Issued Securities and Delayed Delivery Transactions— The Fund may purchase securities on a delayed delivery, when-issued or forward commitment basis, including TBA (To Be Announced) securities. Payment and delivery may take place after the customary settlement period for that security. At the time the transaction is negotiated, the price of the security that will be delivered is fixed. The Fund maintains cash and/or security positions for these commitments such that sufficient liquid assets will be available to make payments upon settlement. Securities purchased on a delayed delivery,
Calvert
Short Duration Income Fund
September 30, 2021
Notes to Financial Statements — continued
when-issued or forward commitment basis are marked-to-market daily and begin earning interest on settlement date. Such security purchases are subject to the risk that when delivered they will be worth less than the agreed upon payment price. Losses may also arise if the counterparty does not perform under the contract. A forward purchase commitment may be closed by entering into an offsetting commitment. The Fund will realize a gain or loss on investments based on the price established when the Fund entered into the commitment.
2 Related Party Transactions
The investment advisory fee is earned by CRM as compensation for investment advisory services rendered to the Fund. On March 1, 2021, Morgan Stanley acquired Eaton Vance Corp. (the “Transaction”) and CRM became an indirect, wholly-owned subsidiary of Morgan Stanley. In connection with the Transaction, the Fund entered into a new investment advisory agreement (the “New Agreement”) with CRM, which took effect on March 1, 2021. Pursuant to the New Agreement (and the Fund’s investment advisory agreement with CRM in effect prior to March 1, 2021), the fee is computed at an annual rate as a percentage of the Fund's average daily net assets as follows and is payable monthly:
| Average Daily Net Assets | Annual Fee
Rate |
| Up to and including $750 million | 0.28% |
| Over $750 million | 0.275% |
For the year ended September 30, 2021, the investment advisory fee amounted to $5,404,850 or 0.28% of the Fund's average daily net assets. The Fund may invest its cash in Cash Reserves Fund. CRM does not currently receive a fee for advisory services provided to Cash Reserves Fund.
CRM has agreed to reimburse the Fund's expenses to the extent that total annual operating expenses (relating to ordinary operating expenses only and excluding expenses such as brokerage commissions, acquired fund fees and expenses of unaffiliated funds, borrowing costs, taxes or litigation expenses) exceed 0.76%, 1.51%, 0.51% and 0.46% of the Fund’s average daily net assets for Class A, Class C, Class I and Class R6, respectively. The expense reimbursement agreement with CRM may be changed or terminated after January 31, 2022. For the year ended September 30, 2021, no expenses were waived or reimbursed by CRM.
The administrative fee is earned by CRM as compensation for administrative services rendered to the Fund. The fee is computed at an annual rate of 0.12% of the Fund’s average daily net assets attributable to Class A, Class C, Class I and Class R6 and is payable monthly. For the year ended September 30, 2021, CRM was paid administrative fees of $2,342,116.
The Fund has in effect a distribution plan for Class A shares (Class A Plan) pursuant to Rule 12b-1 under the 1940 Act. Pursuant to the Class A Plan, the Fund pays Eaton Vance Distributors, Inc. (EVD), an affiliate of CRM and the Fund’s principal underwriter, a distribution and service fee of 0.25% per annum of its average daily net assets attributable to Class A shares for distribution services and facilities provided to the Fund by EVD, as well as for personal services and/or the maintenance of shareholder accounts. The Fund also has in effect a distribution plan for Class C shares (Class C Plan) pursuant to Rule 12b-1 under the 1940 Act. Pursuant to the Class C Plan, the Fund pays EVD amounts equal to 0.75% per annum of its average daily net assets attributable to Class C shares for providing ongoing distribution services and facilities to the Fund. In addition, pursuant to the Class C Plan, the Fund also makes payments of service fees to EVD, financial intermediaries and other persons in amounts equal to 0.25% per annum of its average daily net assets attributable to that class. Service fees paid or accrued are for personal services and/or the maintenance of shareholder accounts. Distribution and service fees paid or accrued for the year ended September 30, 2021 amounted to $717,071 and $261,940 for Class A shares and Class C shares, respectively.
The Fund was informed that EVD received $40,151 as its portion of the sales charge on sales of Class A shares for the year ended September 30, 2021. The Fund was also informed that EVD received $39,538 and $7,534 of contingent deferred sales charges paid by Class A and Class C shareholders, respectively, for the same period. The Fund was informed that Morgan Stanley affiliated broker-dealers, which may be deemed to be affiliates of CRM and EVD, also received a portion of the sales charge on sales of Class A shares from March 1, 2021 through September 30, 2021 in the amount of $450.
Eaton Vance Management (EVM), an affiliate of CRM, provides sub-transfer agency and related services to the Fund pursuant to a Sub-Transfer Agency Support Services Agreement. For the year ended September 30, 2021, sub-transfer agency fees and expenses incurred to EVM amounted to $66,365 and are included in transfer agency fees and expenses on the Statement of Operations.
Each Trustee of the Fund who is not an employee of CRM or its affiliates receives an annual fee of $154,000, plus an annual Committee fee ranging from $8,500 to $16,500 depending on the Committee. The Board chair receives an additional $30,000 ($20,000 prior to January 1, 2021) annual fee and Committee chairs receive an additional $6,000 annual fee. Eligible Trustees may participate in a Deferred Compensation Plan (the Plan). Amounts deferred under the Plan are treated as though equal dollar amounts had been invested in shares of the Fund or other Calvert funds selected by the Trustees. The Fund purchases shares of the funds selected equal to the dollar amounts deferred under the Plan, resulting in an asset equal to the deferred compensation liability. Obligations of the Plan are paid solely from the Fund's assets. Trustees’ fees are allocated to each of the Calvert funds served. Salaries and fees of officers and Trustees of the Fund who are employees of CRM or its affiliates are paid by CRM. Prior to December 31, 2020, an Advisory Council aided the
Calvert
Short Duration Income Fund
September 30, 2021
Notes to Financial Statements — continued
Board and CRM in advancing the cause of responsible investing through original scholarship and thought leadership. The Advisory Council consisted of CRM’s Chief Executive Officer and three additional members. For the year ended December 31, 2020, each member (other than CRM’s Chief Executive Officer) was compensated $20,000 for their service on the Advisory Council. Such compensation, and any other compensation and/or expenses incurred by the Advisory Council as may be approved by the Board, was borne by the Calvert funds. For the year ended September 30, 2021, the Fund’s allocated portion of the Advisory Council compensation and fees was $1,365, which is included in miscellaneous expense on the Statement of Operations.
3 Investment Activity
During the year ended September 30, 2021, the cost of purchases and proceeds from sales of investments, other than U.S. government and agency securities and short-term securities and including maturities, paydowns and principal repayments on senior floating-rate loans, were $1,654,563,964 and $1,052,074,582, respectively. Purchases and sales of U.S. government and agency securities, including paydowns, were $690,475,275 and $636,461,754, respectively.
4 Distributions to Shareholders and Income Tax Information
The tax character of distributions declared for the years ended September 30, 2021 and September 30, 2020 was as follows:
| | Year Ended September 30, |
| | 2021 | 2020 |
| Ordinary income | $38,014,211 | $41,017,578 |
| Long-term capital gains | $ 7,572,920 | $ — |
During the year ended September 30, 2021, distributable earnings was decreased by $1,695,213 and paid-in capital was increased by $1,695,213 due to the Fund's use of equalization accounting. Tax equalization accounting allows the Fund to treat as a distribution that portion of redemption proceeds representing a redeeming shareholder’s portion of undistributed taxable income and net capital gains. These reclassifications had no effect on the net assets or net asset value per share of the Fund.
As of September 30, 2021, the components of distributable earnings (accumulated loss) on a tax basis were as follows:
| Undistributed ordinary income | $ 7,629,037 |
| Undistributed long-term capital gains | 7,655,060 |
| Net unrealized appreciation | 13,921,409 |
| Distributions payable | (485,022) |
| Distributable earnings | $28,720,484 |
The cost and unrealized appreciation (depreciation) of investments, including open derivative contracts, of the Fund at September 30, 2021, as determined on a federal income tax basis, were as follows:
| Aggregate cost | $2,374,984,465 |
| Gross unrealized appreciation | $ 24,401,017 |
| Gross unrealized depreciation | (10,479,608) |
| Net unrealized appreciation | $ 13,921,409 |
5 Financial Instruments
A summary of futures contracts outstanding at September 30, 2021 is included in the Schedule of Investments. During the year ended September 30, 2021, the Fund used futures contracts to hedge interest rate risk and to manage duration.
Calvert
Short Duration Income Fund
September 30, 2021
Notes to Financial Statements — continued
At September 30, 2021, the fair value of open derivative instruments (not considered to be hedging instruments for accounting disclosure purposes) and whose primary underlying risk exposure is interest rate risk was as follows:
| Derivative | Statement of Assets and Liabilities Caption | Assets | Liabilities |
| Futures contracts | Distributable earnings | | $3,219,199 (1) | $(13,047) (1) |
| (1) | Only the current day's variation margin is reported within the Statement of Assets and Liabilities as Receivable or Payable for variation margin on open futures contracts, as applicable. |
The effect of derivative instruments (not considered to be hedging instruments for accounting disclosure purposes) on the Statement of Operations and whose primary underlying risk exposure is interest rate risk for the year ended September 30, 2021 was as follows:
| | Statement of Operations Caption | |
| Derivative | Net realized gain (loss): Futures
contracts | Change in unrealized appreciation
(depreciation): Futures contracts |
| Futures contracts | $ 3,863,221 | $ 3,552,328 |
The average notional cost of futures contracts (long) and futures contracts (short) outstanding during the year ended September 30, 2021 was approximately $55,438,000 and $204,659,000, respectively.
6 Securities Lending
To generate additional income, the Fund may lend its securities pursuant to a securities lending agency agreement with State Street Bank and Trust Company (SSBT), the securities lending agent. Security loans are subject to termination by the Fund at any time and, therefore, are not considered illiquid investments. The Fund requires that the loan be continuously collateralized by either cash or securities in an amount at least equal to the market value of the securities on loan. The market value of securities loaned is determined daily and any additional required collateral is delivered to the Fund on the next business day. Cash collateral is generally invested in a money market fund registered under the 1940 Act that is managed by an affiliate of SSBT. Any gain or loss in the market price of the loaned securities that might occur and any interest earned or dividends declared during the term of the loan would accrue to the account of the Fund. Income earned on the investment of collateral, net of broker rebates and other expenses incurred by the securities lending agent, is split between the Fund and the securities lending agent based on agreed upon contractual terms. Non-cash collateral, if any, is held by the lending agent on behalf of the Fund and cannot be sold or re-pledged by the Fund; accordingly, such collateral is not reflected in the Statement of Assets and Liabilities.
The risks associated with lending portfolio securities include, but are not limited to, possible delays in receiving additional collateral or in the recovery of the loaned securities, possible loss of rights to the collateral should the borrower fail financially, as well as risk of loss in the value of the collateral or the value of the investments made with the collateral. The securities lending agent shall indemnify the Fund in the case of default of any securities borrower.
At September 30, 2021, the total value of securities on loan, including accrued interest, was $24,695,486 and the total value of collateral received was $25,208,472, comprised of cash of $18,162,513 and U.S. government and/or agencies securities of $7,045,959.
The following table provides a breakdown of securities lending transactions accounted for as secured borrowings, the obligations by class of collateral pledged, and the remaining contractual maturity of those transactions as of September 30, 2021.
| | Remaining Contractual Maturity of the Transactions |
| | Overnight and
Continuous | <30 days | 30 to 90 days | >90 days | Total |
| Corporate Bonds | $18,162,513 | $ — | $ — | $ — | $18,162,513 |
The carrying amount of the liability for deposits for securities loaned at September 30, 2021 approximated its fair value. If measured at fair value, such liability would have been considered as Level 2 in the fair value hierarchy (see Note 1A) at September 30, 2021.
Calvert
Short Duration Income Fund
September 30, 2021
Notes to Financial Statements — continued
7 Line of Credit
The Fund participates with other portfolios and funds managed by EVM and its affiliates, including CRM, in an $800 million unsecured line of credit with a group of banks, which is in effect through October 26, 2021. Borrowings are made by the Fund solely for temporary purposes related to redemptions and other short-term cash needs. Interest is charged to the Fund based on its borrowings at an amount above either the Eurodollar rate or Federal Funds rate. In addition, a fee computed at an annual rate of 0.15% on the daily unused portion of the line of credit is allocated among the participating portfolios and funds at the end of each quarter. In connection with the renewal of the agreement in October 2020, an upfront fee and arrangement fee totaling $950,000 was incurred that was allocated to the participating portfolios and funds. Because the line of credit is not available exclusively to the Fund, it may be unable to borrow some or all of its requested amounts at any particular time.
The Fund had no borrowings pursuant to its line of credit during the year ended September 30, 2021. Effective October 26, 2021, the Fund renewed its line of credit agreement, which expires October 25, 2022, at substantially the same terms.
8 Affiliated Issuers and Funds
The Fund has invested a portion of its assets in notes (the Notes) issued by Calvert Impact Capital, Inc. (CIC) pursuant to exemptive relief granted by the U.S. Securities and Exchange Commission (the SEC). There are certain potential points of affiliation between the Fund and CIC. CRM has licensed use of the Calvert name to CIC and provides other types of support. CRM’s President and Chief Executive Officer (and the only director/trustee on the Fund Board that is an “interested person” of the Fund) serves on the CIC Board. In addition, another director/trustee on the Fund Board serves as a director emeritus on the CIC Board.
In addition to the Notes, the Fund invested in issuers that may be deemed to be affiliated with Morgan Stanley. At September 30, 2021, the value of the Fund's investment in the Notes and affiliated issuers and funds was $62,140,229, which represents 2.6% of the Fund's net assets. Transactions in the Notes and affiliated issuers and funds by the Fund for the year ended September 30, 2021 were as follows:
| Name | Value,
beginning
of period | Purchases | Sales
proceeds | Net
realized
gain
(loss) | Change in
unrealized
appreciation
(depreciation) | Value,
end of
period | Interest/
Dividend
income | Principal
amount/Units,
end of period |
| Commercial Mortgage-Backed Securities | | | | | | | | |
| Morgan Stanley Capital I Trust: | | | | | | | | |
| Series 2017-CLS, Class A, 0.784%, (1 mo. USD LIBOR + 0.70%), 11/15/34(1) | $ — | $ 2,127,661 | $ — | $ — | $ (938) | $ 2,126,674 | $ 5,712 | $ 2,126,000 |
| Series 2017-CLS, Class B, 0.934%, (1 mo. USD LIBOR + 0.85%), 11/15/34(1) | — | 2,342,925 | — | — | (4,627) | 5,942,149 | 24,989 | 5,940,000 |
| Series 2017-CLS, Class C, 1.084%, (1 mo. USD LIBOR + 1.00%), 11/15/34(1) | — | 200,187 | — | — | (2,168) | 5,759,059 | 37,263 | 5,755,000 |
| Series 2019-BPR, Class A, 1.484%, (1 mo. USD LIBOR + 1.40%), 5/15/36(1) | — | — | — | — | 282,609 | 14,709,964 | 132,751 | 14,831,000 |
| High Social Impact Investments | | | | | | | | |
| Calvert Impact Capital, Inc., Community Investment Notes, 1.50%, 12/15/23(2) | — | 4,000,000 | — | — | (68,680) | 3,931,320 | 47,667 | 4,000,000 |
| Short-Term Investments | | | | | | |
| Calvert Cash Reserves Fund, LLC | 18,183,677 | 1,226,685,668 | (1,215,195,696) | (5,580) | 2,994 | 29,671,063 | 59,748 | 29,668,096 |
| Totals | | | | $(5,580) | $209,190 | $62,140,229 | $308,130 | |
| (1) | May be deemed to be an affiliated issuer as of March 1, 2021 (see Note 2). |
| (2) | Restricted security. |
9 Capital Shares
The Fund’s Declaration of Trust permits the Trustees to issue an unlimited number of full and fractional shares of beneficial interest (without par value). Such shares may be issued in a number of different series (such as the Fund) and classes.
Calvert
Short Duration Income Fund
September 30, 2021
Notes to Financial Statements — continued
Transactions in capital shares for the years ended September 30, 2021 and September 30, 2020 were as follows:
| | Year Ended
September 30, 2021 | | Year Ended
September 30, 2020 |
| | Shares | Amount | | Shares | Amount |
| Class A | | | | | |
| Shares sold | 6,890,272 | $ 113,271,632 | | 5,761,832 | $ 92,418,372 |
| Reinvestment of distributions | 334,255 | 5,487,972 | | 322,971 | 5,171,284 |
| Shares redeemed | (5,790,681) | (95,158,988) | | (5,816,113) | (92,570,103) |
| Converted from Class C | 447,333 | 7,337,576 | | 624,490 | 9,909,614 |
| Net increase | 1,881,179 | $ 30,938,192 | | 893,180 | $ 14,929,167 |
| Class C | | | | | |
| Shares sold | 462,020 | $ 7,539,019 | | 571,703 | $ 9,105,538 |
| Reinvestment of distributions | 22,571 | 368,733 | | 31,001 | 494,496 |
| Shares redeemed | (624,264) | (10,216,265) | | (995,684) | (15,862,761) |
| Converted to Class A | (448,978) | (7,337,576) | | (626,896) | (9,909,614) |
| Net decrease | (588,651) | $ (9,646,089) | | (1,019,876) | $ (16,172,341) |
| Class I | | | | | |
| Shares sold | 66,429,707 | $1,099,772,696 | | 38,858,238 | $ 627,700,552 |
| Reinvestment of distributions | 1,892,978 | 31,297,927 | | 1,762,988 | 28,418,075 |
| Shares redeemed | (34,707,931) | (574,321,642) | | (37,857,916) | (603,048,486) |
| Net increase | 33,614,754 | $ 556,748,981 | | 2,763,310 | $ 53,070,141 |
| Class R6 | | | | | |
| Shares sold | 4,849,780 | $ 80,340,334 | | 1,794,251 | $ 29,125,054 |
| Reinvestment of distributions | 77,373 | 1,280,308 | | 49,428 | 795,909 |
| Shares redeemed | (355,837) | (5,885,345) | | (899,338) | (14,420,582) |
| Net increase | 4,571,316 | $ 75,735,297 | | 944,341 | $ 15,500,381 |
10 Risks and Uncertainties
Pandemic Risk
An outbreak of respiratory disease caused by a novel coronavirus was first detected in China in late 2019 and subsequently spread internationally. This coronavirus has resulted in closing borders, enhanced health screenings, changes to healthcare service preparation and delivery, quarantines, cancellations, disruptions to supply chains and customer activity, as well as general concern and uncertainty. Health crises caused by outbreaks, such as the coronavirus outbreak, may exacerbate other pre-existing political, social and economic risks and disrupt normal market conditions and operations. The impact of this outbreak has negatively affected the worldwide economy, the economies of individual countries, individual companies, and the market in general, and may continue to do so in significant and unforeseen ways, as may other epidemics and pandemics that may arise in the future. Any such impact could adversely affect the Fund's performance, or the performance of the securities in which the Fund invests.
11 Change in Independent Registered Public Accounting Firm
On July 30, 2021, KPMG LLP (“KPMG”) informed the Audit Committee and Board of the Trust that it was resigning as the independent registered public accounting firm to the Trust, as upon Morgan Stanley’s acquisition of Eaton Vance Corp., the parent company of CRM (the investment adviser to each series of the Trust), KPMG would no longer be independent of the Trust. The Audit Committee of the Board and the Board approved the selection of Deloitte & Touche LLP (“Deloitte”) as the independent registered public accounting firm for the funds that are series of the Trust (the “Funds”) for the fiscal year ending September 30, 2021 to be effective upon KPMG’s resignation and Deloitte’s acceptance of the engagement which became effective July 30, 2021.
Calvert
Short Duration Income Fund
September 30, 2021
Notes to Financial Statements — continued
KPMG’s reports on the financial statements for the Funds for the fiscal periods ended September 30, 2019 and September 30, 2020 contained no adverse opinion or disclaimer of opinion nor were they qualified or modified as to uncertainty, audit scope or accounting principles. During the fiscal periods ended September 30, 2019 and September 30, 2020, and during the subsequent interim period through July 30, 2021: (i) there were no disagreements with KPMG on any matter of accounting principles or practices, financial statement disclosure or auditing scope or procedure, which disagreements, if not resolved to the satisfaction of KPMG, would have caused KPMG to make reference to the subject matter of the disagreements in connection with its reports on the Funds’ financial statements for such periods; and (ii) there were no “reportable events” of the kind described in Item 304(a)(1)(v) of Regulation S-K under the Securities Exchange Act of 1934, as amended.
During the fiscal periods ended September 30, 2019 and September 30, 2020, and during the subsequent interim period through July 30, 2021: neither the Funds, nor anyone on their behalf, consulted with Deloitte on items which: (i) concerned the application of accounting principles to a specified transaction, either completed or proposed, or the type of audit opinion that might be rendered on the Funds’ financial statements; or (ii) concerned the subject of a disagreement (as defined in paragraph (a)(1)(iv) of Item 304 of Regulation S-K) or reportable events (as described in paragraph (a)(1)(v) of Item 304).
Calvert
Short Duration Income Fund
September 30, 2021
Report of Independent Registered Public Accounting Firm
To the Board of Trustees of The Calvert Fund and Shareholders of Calvert Short Duration Income Fund:
Opinion on the Financial Statements and Financial Highlights
We have audited the accompanying statement of assets and liabilities of Calvert Short Duration Income Fund (the "Fund") (one of the funds constituting The Calvert Fund), including the schedule of investments, as of September 30, 2021, the related statements of operations, changes in net assets and the financial highlights for the year then ended, and the related notes. In our opinion, the financial statements and financial highlights present fairly, in all material respects, the financial position of the Fund as of September 30, 2021, and the results of its operations and changes in its net assets for the year then ended, and the financial highlights for the year then ended in conformity with accounting principles generally accepted in the United States of America. The statement of changes in net assets for the year ended September 30, 2020, and the financial highlights for the years or periods ended September 30, 2020, 2019, 2018, and 2017 were audited by other auditors whose report, dated November 20, 2020, expressed an unqualified opinion on that financial statement and those financial highlights.
Basis for Opinion
These financial statements and financial highlights are the responsibility of the Fund's management. Our responsibility is to express an opinion on the Fund's financial statements and financial highlights based on our audit. We are a public accounting firm registered with the Public Company Accounting Oversight Board (United States) (PCAOB) and are required to be independent with respect to the Fund in accordance with the U.S. federal securities laws and the applicable rules and regulations of the Securities and Exchange Commission and the PCAOB.
We conducted our audit in accordance with the standards of the PCAOB. Those standards require that we plan and perform the audit to obtain reasonable assurance about whether the financial statements and financial highlights are free of material misstatement, whether due to error or fraud. The Fund is not required to have, nor were we engaged to perform, an audit of its internal control over financial reporting. As part of our audit we are required to obtain an understanding of internal control over financial reporting but not for the purpose of expressing an opinion on the effectiveness of the Fund’s internal control over financial reporting. Accordingly, we express no such opinion.
Our audit included performing procedures to assess the risks of material misstatement of the financial statements and financial highlights, whether due to error or fraud, and performing procedures that respond to those risks. Such procedures included examining, on a test basis, evidence regarding the amounts and disclosures in the financial statements and financial highlights. Our audit also included evaluating the accounting principles used and significant estimates made by management, as well as evaluating the overall presentation of the financial statements and financial highlights. Our procedures included confirmation of securities owned as of September 30, 2021, by correspondence with the custodian, brokers and selling or agent banks; when replies were not received from brokers and selling or agent banks, we performed other auditing procedures. We believe that our audit provides a reasonable basis for our opinion.
/s/ Deloitte & Touche LLP
Boston, Massachusetts
November 22, 2021
We have served as the auditor of one or more Calvert investment companies since 2021.
Calvert
Short Duration Income Fund
September 30, 2021
Federal Tax Information (Unaudited)
The Form 1099-DIV you receive in February 2022 will show the tax status of all distributions paid to your account in calendar year 2021. Shareholders are advised to consult their own tax adviser with respect to the tax consequences of their investment in the Fund. As required by the Internal Revenue Code and/or regulations, shareholders must be notified regarding the status of qualified dividend income for individuals, 163(j) interest dividends and capital gains dividends.
Qualified Dividend Income. For the fiscal year ended September 30, 2021, the Fund designates approximately $191,513, or up to the maximum amount of such dividends allowable pursuant to the Internal Revenue Code, as qualified dividend income eligible for the reduced tax rate of 15%.
163(j) Interest Dividends. For the fiscal year ended September 30, 2021, the Fund designates 93.46% of distributions from net investment income as a 163(j) interest dividend.
Capital Gains Dividends. The Fund hereby designates as a capital gain dividend with respect to the taxable year ended September 30, 2021, $11,289,758 or, if subsequently determined to be different, the net capital gain of such year.
Calvert
Short Duration Income Fund
September 30, 2021
Liquidity Risk Management Program
The Fund has implemented a written liquidity risk management program (Program) and related procedures to manage its liquidity in accordance with Rule 22e-4 under the Investment Company Act of 1940, as amended (Liquidity Rule). The Liquidity Rule defines “liquidity risk” as the risk that a fund could not meet requests to redeem shares issued by the fund without significant dilution of the remaining investors’ interests in the fund. The Fund’s Board of Trustees/Directors has designated the investment adviser to serve as the administrator of the Program and the related procedures. The administrator has established a Liquidity Risk Management Oversight Committee (Committee) to perform the functions necessary to administer the Program. As part of the Program, the administrator is responsible for identifying illiquid investments and categorizing the relative liquidity of the Fund’s investments in accordance with the Liquidity Rule. Under the Program, the administrator assesses, manages, and periodically reviews the Fund’s liquidity risk, and is responsible for making certain reports to the Fund’s Board of Trustees/Directors and the Securities and Exchange Commission (SEC) regarding the liquidity of the Fund’s investments, and to notify the Board of Trustees/Directors and the SEC of certain liquidity events specified in the Liquidity Rule. The liquidity of the Fund’s portfolio investments is determined based on a number of factors including, but not limited to, relevant market, trading and investment-specific considerations under the Program.
At a meeting of the Fund’s Board of Trustees/Directors on June 16, 2021, the Committee provided a written report to the Fund’s Board of Trustees/ Directors pertaining to the operation, adequacy, and effectiveness of implementation of the Program, as well as the operation of the highly liquid investment minimum (if applicable) for the period January 1, 2020 through December 31, 2020 (Review Period). The Program operated effectively during the Review Period, supporting the administrator’s ability to assess, manage and monitor Fund liquidity risk, including during periods of market volatility and net redemptions. During the Review Period, the Fund met redemption requests on a timely basis.
There can be no assurance that the Program will achieve its objectives in the future. Please refer to the Fund’s prospectus for more information regarding the Fund’s exposure to liquidity risk and other principal risks to which an investment in the Fund may be subject.
Calvert
Short Duration Income Fund
September 30, 2021
Management and Organization
Fund Management. The Trustees of The Calvert Fund (the Trust) are responsible for the overall management and supervision of the Trust’s affairs. The Trustees and officers of the Trust are listed below. Except as indicated, each individual has held the office shown or other offices in the same company for the last five years. Each Board member holds office until his or her successor is elected and qualified, or until his or her earlier death, resignation, retirement, removal or disqualification. Under the terms of the Fund's current Board member retirement policy, an Independent Board member must retire at the end of the calendar year in which he or she turns 75. However, if such retirement would cause the Fund to be out of compliance with Section 16 of the 1940 Act or any other regulations or guidance of the SEC, then such retirement and resignation will not become effective until such time as action has been taken for the Fund to be in compliance upon a Board member's retirement. The “Independent Trustees” consist of those Trustees who are not “interested persons” of the Trust, as that term is defined under the 1940 Act. The business address of each Trustee and officer, with the exception of Ms. Walsh and Mr. Kirchner, is 1825 Connecticut Avenue NW, Suite 400, Washington, DC 20009. As used below, “CRM” refers to Calvert Research and Management. Each Trustee oversees 39 funds in the Calvert fund complex. Each officer serves as an officer of certain other Calvert funds.
| Name and Year of Birth | Trust
Position(s) | Position
Start Date | Principal Occupation(s) and Other Directorships
During Past Five Years and Other Relevant Experience |
| Interested Trustee |
John H. Streur(1)
1960 | Trustee and
President | 2015 | President and Chief Executive Officer of Calvert Research and
Management (since December 31, 2016). President and Chief Executive
Officer of Calvert Investments, Inc. (January 2015 - December 2016);
Chief Executive Officer of Calvert Investment Distributors, Inc. (August
2015 - December 2016); Chief Compliance Officer of Calvert Investment
Management, Inc. (August 2015 - April 2016); President and Director,
Portfolio 21 Investments, Inc. (through October 2014); President,
Chief Executive Officer and Director, Managers Investment Group LLC
(through January 2012); President and Director, The Managers Funds
and Managers AMG Funds (through January 2012).
Other Directorships in the Last Five Years. Portfolio 21 Investments,
Inc. (asset management) (through October 2014); Managers Investment
Group LLC (asset management) (through January 2012); The Managers
Funds (asset management) (through January 2012); Managers AMG Funds
(asset management) (through January 2012); Calvert Impact Capital, Inc. |
| Independent Trustees |
Richard L. Baird, Jr.
1948 | Trustee | 1982 | Regional Disaster Recovery Lead, American Red Cross of Greater
Pennsylvania (since 2017). Volunteer, American Red Cross (since 2015).
Former President and CEO of Adagio Health Inc. (retired in 2014) in
Pittsburgh, PA.
Other Directorships in the Last Five Years. None. |
Alice Gresham Bullock
1950 | Chair and
Trustee | 2016 | Professor Emerita at Howard University School of Law. Dean Emerita of
Howard University School of Law and Deputy Director of the Association
of American Law Schools (1992-1994).
Other Directorships in the Last Five Years. None. |
Cari M. Dominguez
1949 | Trustee | 2016 | Former Chair of the U.S. Equal Employment Opportunity Commission.
Other Directorships in the Last Five Years. Manpower, Inc. (employment
agency); Triple S Management Corporation (managed care); National
Association of Corporate Directors. |
John G. Guffey, Jr.
1948 | Trustee | 1982 | President of Aurora Press Inc., a privately held publisher of trade
paperbacks (since January 1997).
Other Directorships in the Last Five Years. Calvert Impact Capital, Inc.
(through December 31, 2018); Calvert Ventures, LLC. |
Miles D. Harper, III
1962 | Trustee | 2016 | Partner, Carr Riggs & Ingram (public accounting firm) since October 2014.
Partner, Gainer Donnelly & Desroches (public accounting firm) (now Carr
Riggs & Ingram) (November 1999 - September 2014).
Other Directorships in the Last Five Years. Bridgeway Funds (9) (asset
management). |
Joy V. Jones
1950 | Trustee | 2016 | Attorney.
Other Directorships in the Last Five Years. Conduit Street Restaurants
SUD 2 Limited; Palm Management Restaurant Corporation. |
Calvert
Short Duration Income Fund
September 30, 2021
Management and Organization — continued
| Name and Year of Birth | Trust
Position(s) | Position
Start Date | Principal Occupation(s) and Other Directorships
During Past Five Years and Other Relevant Experience |
| Independent Trustees (continued) |
Anthony A. Williams
1951 | Trustee | 2010 | CEO and Executive Director of the Federal City Council (July 2012 to
present); Senior Adviser and Independent Consultant for King and
Spalding LLP (September 2015 to present); Executive Director of Global
Government Practice at the Corporate Executive Board (January 2010 to
January 2012).
Other Directorships in the Last Five Years. Freddie Mac; Evoq
Properties/Meruelo Maddux Properties, Inc. (real estate management);
Weston Solutions, Inc. (environmental services); Bipartisan Policy Center’s
Debt Reduction Task Force; Chesapeake Bay Foundation; Catholic
University of America; Urban Institute (research organization); The Howard Hughes Corporation (real estate development). |
| Name and Year of Birth | Trust
Position(s) | Position
Start Date | Principal Occupation(s)
During Past Five Years |
| Principal Officers who are not Trustees |
Hope L. Brown
1973 | Chief
Compliance
Officer | 2014 | Chief Compliance Officer of 39 registered investment companies advised
by CRM (since 2014). Vice President and Chief Compliance Officer,
Wilmington Funds (2012-2014). |
Deidre E. Walsh(2)
1971 | Secretary,
Vice President
and Chief
Legal Officer | 2021 | Vice President of CRM and officer of 39 registered investment companies
advised by CRM (since 2021). Also Vice President of Eaton Vance and
certain of its affiliates and officer of 138 registered investment companies
advised or administered by Eaton Vance. |
James F. Kirchner(2)
1967 | Treasurer | 2016 | Vice President of CRM and officer of 39 registered investment companies
advised by CRM (since 2016). Also Vice President of Eaton Vance and
certain of its affiliates and officer of 138 registered investment companies
advised or administered by Eaton Vance. |
| (1) Mr. Streur is an interested person of the Fund because of his positions with the Fund’s adviser and certain affiliates. |
| (2) The business address for Ms. Walsh and Mr. Kirchner is Two International Place, Boston, MA 02110. |
The SAI for the Fund includes additional information about the Trustees and officers of the Fund and can be obtained without charge on Calvert’s website at www.calvert.com or by calling 1-800-368-2745.
| FACTS | WHAT DOES EATON VANCE DO WITH YOUR
PERSONAL INFORMATION? |
| Why? | Financial companies choose how they share your personal information. Federal law gives consumers the right to limit some but not all sharing. Federal law also requires us to tell you how we collect, share, and protect your personal information. Please read this notice carefully to understand what we do. |
| |
| What? | The types of personal information we collect and share depend on the product or service you have with us. This information can include:■ Social Security number and income
■
investment experience and risk tolerance
■
checking account number and wire transfer instructions |
| |
| How? | All financial companies need to share customers’ personal information to run their everyday business. In the section below, we list the reasons financial companies can share their customers’ personal information; the reasons Eaton Vance chooses to share; and whether you can limit this sharing. |
Reasons we can share your
personal information | Does Eaton Vance
share? | Can you limit
this sharing? |
| For our everyday business purposes — such as to process your transactions, maintain your account(s), respond to court orders and legal investigations, or report to credit bureaus | Yes | No |
| For our marketing purposes — to offer our products and services to you | Yes | No |
| For joint marketing with other financial companies | No | We don’t share |
| For our investment management affiliates’ everyday business purposes — information about your transactions, experiences, and creditworthiness | Yes | Yes |
| For our affiliates’ everyday business purposes — information about your transactions and experiences | Yes | No |
| For our affiliates’ everyday business purposes — information about your creditworthiness | No | We don’t share |
| For our investment management affiliates to market to you | Yes | Yes |
| For our affiliates to market to you | No | We don’t share |
| For nonaffiliates to market to you | No | We don’t share |
To limit our
sharing | Call toll-free 1-800-368-2745 or email: CRMPrivacy@calvert.comPlease note:If you are a new customer, we can begin sharing your information 30 days from the date we sent this notice. When you are no longer our customer, we continue to share your information as described in this notice. However, you can contact us at any time to limit our sharing. |
| Questions? | Call toll-free 1-800-368-2745 or email: CRMPrivacy@calvert.com |
| Privacy Notice — continued | April 2021 |
| Who we are |
| Who is providing this notice? | Eaton Vance Management, Eaton Vance Distributors, Inc., Eaton Vance Trust Company, Eaton Vance Management (International) Limited, Eaton Vance Advisers International Ltd., Eaton Vance Global Advisors Limited, Eaton Vance Management’s Real Estate Investment Group, Boston Management and Research, Calvert Research and Management, Eaton Vance and Calvert Fund Families and our investment advisory affiliates (“Eaton Vance”) (see Investment Management Affiliates definition below) |
| What we do |
How does Eaton Vance
protect my personal
information? | To protect your personal information from unauthorized access and use, we use security measures that comply with federal law. These measures include computer safeguards and secured files and buildings. We have policies governing the proper handling of customer information by personnel and requiring third parties that provide support to adhere to appropriate security standards with respect to such information. |
How does Eaton Vance
collect my personal
information? | We collect your personal information, for example, when you■ open an account or make deposits or withdrawals from your account
■
buy securities from us or make a wire transfer
■
give us your contact informationWe also collect your personal information from others, such as credit bureaus, affiliates, or other companies. |
| Why can’t I limit all sharing? | Federal law gives you the right to limit only■ sharing for affiliates’ everyday business purposes — information about your creditworthiness
■
affiliates from using your information to market to you
■
sharing for nonaffiliates to market to youState laws and individual companies may give you additional rights to limit sharing. See below for more on your rights under state law. |
| Definitions |
Investment Management
Affiliates | Eaton Vance Investment Management Affiliates include registered investment advisers, registered broker- dealers, and registered and unregistered funds. Investment Management Affiliates does not include entities associated with Morgan Stanley Wealth Management, such as Morgan Stanley Smith Barney LLC and Morgan Stanley & Co. |
| Affiliates | Companies related by common ownership or control. They can be financial and nonfinancial companies.■ Our affiliates include companies with a Morgan Stanley name and financial companies such as Morgan Stanley Smith Barney LLC and Morgan Stanley & Co. |
| Nonaffiliates | Companies not related by common ownership or control. They can be financial and nonfinancial companies.■ Eaton Vance does not share with nonaffiliates so they can market to you. |
| Joint marketing | A formal agreement between nonaffiliated financial companies that together market financial products or services to you.■ Eaton Vance doesn’t jointly market. |
| Other important information |
| Vermont: Except as permitted by law, we will not share personal information we collect about Vermont residents with Nonaffiliates unless you provide us with your written consent to share such information.California: Except as permitted by law, we will not share personal information we collect about California residents with Nonaffiliates and we will limit sharing such personal information with our Affiliates to comply with California privacy laws that apply to us. |
Delivery of Shareholder Documents. The Securities and Exchange Commission (SEC) permits funds to deliver only one copy of shareholder documents, including prospectuses, proxy statements and shareholder reports, to fund investors with multiple accounts at the same residential or post office box address. This practice is often called “householding” and it helps eliminate duplicate mailings to shareholders. Calvert funds, or your financial intermediary, may household the mailing of your documents indefinitely unless you instruct Calvert funds, or your financial intermediary, otherwise. If you would prefer that your Calvert fund documents not be householded, please contact Calvert funds at 1-800-368-2745, or contact your financial intermediary. Your instructions that householding not apply to delivery of your Calvert fund documents will typically be effective within 30 days of receipt by Calvert funds or your financial intermediary. Separate statements will be generated for each separate account and will be householded as described above.
Portfolio Holdings. Each Calvert fund files a schedule of portfolio holdings on Part F to Form N-PORT with the SEC. Certain information filed on Form N-PORT may be viewed on the Calvert website at www.calvert.com, by calling Calvert at 1-800-368-2745 or in the EDGAR database on the SEC’s website at www.sec.gov.
Proxy Voting. The Proxy Voting Guidelines that each Calvert fund uses to determine how to vote proxies relating to portfolio securities is provided as an Appendix to the fund’s Statement of Additional Information. The Statement of Additional Information can be obtained free of charge by calling the Calvert funds at 1-800-368-2745, by visiting the Calvert funds’ website at www.calvert.com or visiting the SEC’s website at www.sec.gov. Information regarding how a Calvert fund voted proxies relating to portfolio securities during the most recent 12-month period ended June 30 is available by calling Calvert funds, by visiting the Calvert funds’ website at www.calvert.com or by visiting the SEC’s website at www.sec.gov.
This Page Intentionally Left Blank
This Page Intentionally Left Blank
This Page Intentionally Left Blank
Investment Adviser and Administrator
Calvert Research and Management
1825 Connecticut Avenue NW, Suite 400
Washington, DC 20009
Principal Underwriter*
Eaton Vance Distributors, Inc.
Two International Place
Boston, MA 02110
(617) 482-8260
Custodian
State Street Bank and Trust Company
State Street Financial Center, One Lincoln Street
Boston, MA 02111
Transfer Agent
DST Asset Manager Solutions, Inc.
2000 Crown Colony Drive
Quincy, MA 02169
Independent Registered Public Accounting Firm
Deloitte & Touche LLP
200 Berkeley Street
Boston, MA 02116-5022
Fund Offices
1825 Connecticut Avenue NW, Suite 400
Washington, DC 20009
* FINRA BrokerCheck. Investors may check the background of their Investment Professional by contacting the Financial Industry Regulatory Authority (FINRA). FINRA BrokerCheck is a free tool to help investors check the professional background of current and former FINRA-registered securities firms and brokers. FINRA BrokerCheck is available by calling 1-800-289-9999 and at www.FINRA.org. The FINRA BrokerCheck brochure describing this program is available to investors at www.FINRA.org.
Printed on recycled paper.
Calvert
Ultra-Short Duration Income Fund
Annual Report
September 30, 2021
Commodity Futures Trading Commission Registration. The Commodity Futures Trading Commission (“CFTC”) has adopted regulations that subject registered investment companies and advisers to regulation by the CFTC if a fund invests more than a prescribed level of its assets in certain CFTC-regulated instruments (including futures, certain options and swap agreements) or markets itself as providing investment exposure to such instruments. The adviser has claimed an exclusion from the definition of “commodity pool operator” under the Commodity Exchange Act with respect to its management of the Fund and the other funds it manages. Accordingly, neither the Fund nor the adviser is subject to CFTC regulation.
Fund shares are not insured by the FDIC and are not deposits or other obligations of, or guaranteed by, any depository institution. Shares are subject to investment risks, including possible loss of principal invested.
This report must be preceded or accompanied by a current summary prospectus or prospectus. Before investing, investors should consider carefully the investment objective, risks, and charges and expenses of a mutual fund. This and other important information is contained in the summary prospectus and prospectus, which can be obtained from a financial intermediary. Prospective investors should read the prospectus carefully before investing. For further information, please call 1-800-368-2745.
Choose Planet-friendly E-delivery!
Sign up now for on-line statements, prospectuses, and fund reports. In less than five minutes you can help reduce paper mail and lower fund costs.
Just go to www.calvert.com. If you already have an online account with the Calvert funds, click on Login to access your Account and select the documents you would like to receive via e-mail.
If you’re new to online account access, click on Login, then Register to create your user name and password. Once you’re in, click on the E-delivery sign-up on the Account Portfolio page and follow the quick, easy steps.
Note: If your shares are not held directly with the Calvert funds but through a brokerage firm, you must contact your broker for electronic delivery options available through their firm.
Annual Report September 30, 2021
Calvert
Ultra-Short Duration Income Fund
Calvert
Ultra-Short Duration Income Fund
September 30, 2021
Management's Discussion of Fund Performance†
Economic and Market Conditions
After the U.S. Federal Reserve (the Fed) met in late September 2021, Fed Chair Jerome Powell noted that “The path of the economy continues to depend on the course of the [COVID-19] virus, and risks to the economic outlook remain.” For fixed-income investors, this reflected the dominant investment theme for the 12-month period ended September 30, 2021.
Throughout the period, performance of fixed-income asset classes ebbed and flowed as the virus advanced and retreated, with a second wave of COVID-19 washing over the U.S. and global economies in the winter of 2020-2021 and a third wave known as the Delta variant spreading around the world in the summer of 2021.
For the period as a whole, however, U.S. fixed-income investors appeared to focus on the reopening of the economy and its recovery from a near-shutdown in the early days of the pandemic. The asset classes that fared best during the period were those that stood to benefit from a U.S. and global economic revival. So-called “safe-haven” assets, in contrast, fared poorly as investors appeared to become more comfortable taking on increased risk during the period.
As a result, U.S. Treasurys were one of the worst-performing fixed-income asset classes during the period, with the Bloomberg U.S. Treasury Index returning (3.30)% for the period. The Bloomberg U.S. Aggregate Bond Index, a broad measure of the U.S. fixed-income market, was also dragged down by its Treasury component, and returned (0.90)% for the period.
Investment-grade corporate bonds fared better. The Bloomberg U.S. Corporate Bond Index returned 1.74% for the period, as factories and businesses reopened and consumers — a key driver of the U.S. economy — rushed to spend the money they had saved while confined at home earlier in the pandemic.
High yield bonds were a standout asset class during the period. Several industries prominent within the high yield space — including airlines, restaurants, retail, and travel & leisure — were among the hardest-hit businesses early in the pandemic and the biggest beneficiaries of the subsequent economic recovery. Reflecting investors’ increasing confidence in the recovery, as well as their search for yield in a historically low-yield environment, the Bloomberg U.S. Corporate High Yield Index returned 11.28% for the one-year period.
Fund Performance
For the 12-month period ended September 30, 2021, Calvert Ultra-Short Duration Income Fund (the Fund) returned 1.55% for Class A shares at net asset value (NAV), outperforming its benchmark, the Bloomberg 9-12 Months Short Treasury Index (the Index), which returned 0.17%.
The Fund’s sector allocations contributed to performance relative to the Index during the period. Allocations to investment-grade corporate securities, asset-backed securities (ABS), and mortgage-backed securities were particularly beneficial. Allocations to high yield corporate securities and commercial mortgage-backed securities (CMBS) further enhanced relative performance during the period. The Fund’s short duration also contributed to returns relative to the Index. The Fund’s derivative exposure was a positive contributor to performance relative to the Index during the period.
The Fund’s yield-curve positioning detracted from returns relative to the Index during the period.
Toward period-end, the Fed indicated it was poised to begin a monetary tightening cycle that the Fund believed was likely to spark volatility and push interest rates higher, particularly at the front end of the yield curve. Under these circumstances, the Fund remained short interest rate duration at period end.
See Endnotes and Additional Disclosures in this report.
Past performance is no guarantee of future results. Returns are historical and are calculated by determining the percentage change in net asset value (NAV) or offering price (as applicable) with all distributions reinvested. Investment return and principal value will fluctuate so that shares, when redeemed, may be worth more or less than their original cost. Performance for periods less than or equal to one year is cumulative. Performance is for the stated time period only; due to market volatility, current Fund performance may be lower or higher than the quoted return. For performance as of the most recent month-end, please refer to www.calvert.com.
Calvert
Ultra-Short Duration Income Fund
September 30, 2021
Performance
Portfolio Managers Vishal Khanduja, CFA and Brian S. Ellis, CFA, each of Calvert Research and Management
| % Average Annual Total Returns1,2 | Class
Inception Date | Performance
Inception Date | One Year | Five Years | Ten Years |
| Class A at NAV | 10/31/2006 | 10/31/2006 | 1.55% | 1.48% | 1.34% |
| Class I at NAV | 01/31/2014 | 10/31/2006 | 1.80 | 1.75 | 1.56 |
| Class R6 at NAV | 10/03/2017 | 10/31/2006 | 1.75 | 1.77 | 1.57 |
|
| Bloomberg 9-12 Months Short Treasury Index | — | — | 0.17% | 1.47% | 0.90% |
| % Total Annual Operating Expense Ratios3 | Class A | Class I | Class R6 |
| Gross | 0.76% | 0.51% | 0.47% |
| Net | 0.72 | 0.47 | 0.43 |
Growth of $10,000
This graph shows the change in value of a hypothetical investment of $10,000 in Class A of the Fund for the period indicated. For comparison, the same investment is shown in the indicated index.
| Growth of Investment2 | Amount Invested | Period Beginning | At NAV | With Maximum Sales Charge |
| Class I | $250,000 | 09/30/2011 | $291,991 | N.A. |
| Class R6 | $1,000,000 | 09/30/2011 | $1,168,742 | N.A. |
See Endnotes and Additional Disclosures in this report.
Past performance is no guarantee of future results. Returns are historical and are calculated by determining the percentage change in net asset value (NAV) or offering price (as applicable) with all distributions reinvested. Investment return and principal value will fluctuate so that shares, when redeemed, may be worth more or less than their original cost. Performance for periods less than or equal to one year is cumulative. Performance is for the stated time period only; due to market volatility, current Fund performance may be lower or higher than the quoted return. For performance as of the most recent month-end, please refer to www.calvert.com.
Calvert
Ultra-Short Duration Income Fund
September 30, 2021
Asset Allocation (% of total investments)
Credit Quality (% of bond holdings)*
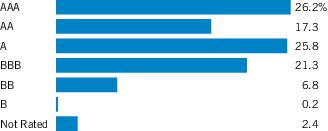
* For purposes of the Fund’s rating restrictions, ratings are based on Moody’s Investors Service, Inc. (“Moody’s”), S&P Global Ratings (“S&P”) or Fitch Ratings (“Fitch”), or Kroll Bond Rating Agency, LLC (“Kroll”) for securitized debt instruments only (such as asset-backed securities (“ABS”) and mortgage-backed securities (“MBS”)), as applicable. If securities are rated differently by the ratings agencies, the highest rating is applied. Ratings, which are subject to change, apply to the creditworthiness of the issuers of the underlying securities and not to the Fund or its shares. Credit ratings measure the quality of an issuance based on the issuer’s creditworthiness, with ratings ranging from AAA, being the highest, to D, being the lowest based on S&P’s measures. Ratings of BBB or higher by S&P, Fitch or Kroll (Baa or higher by Moody’s) are considered to be investment-grade quality. Credit ratings are based largely on the ratings agency’s analysis at the time of rating. The rating assigned to any particular security is not necessarily a reflection of the issuer’s current financial condition and does not necessarily reflect its assessment of the volatility of a security’s market value or of the liquidity of an investment in the security. Holdings designated as “Not Rated” (if any) are not rated by the national ratings agencies stated above.
See Endnotes and Additional Disclosures in this report.
Calvert
Ultra-Short Duration Income Fund
September 30, 2021
Endnotes and Additional Disclosures
| † | The views expressed in this report are those of the portfolio manager(s) and are current only through the date stated at the top of this page. These views are subject to change at any time based upon market or other conditions, and Calvert and the Fund(s) disclaim any responsibility to update such views. These views may not be relied upon as investment advice and, because investment decisions are based on many factors, may not be relied upon as an indication of trading intent on behalf of any Calvert fund. This commentary may contain statements that are not historical facts, referred to as “forward-looking statements.” The Fund’s actual future results may differ significantly from those stated in any forward-looking statement, depending on factors such as changes in securities or financial markets or general economic conditions, the volume of sales and purchases of Fund shares, the continuation of investment advisory, administrative and service contracts, and other risks discussed from time to time in the Fund’s filings with the Securities and Exchange Commission. |
| | |
| 1 | Bloomberg 9-12 Months Short Treasury Index measures the performance of U.S. Treasury bills, notes, and bonds with a maturity between nine and twelve months. Unless otherwise stated, index returns do not reflect the effect of any applicable sales charges, commissions, expenses, taxes or leverage, as applicable. It is not possible to invest directly in an index. |
| 2 | Class A, Class I and Class R6 shares are offered at net asset value (NAV). Returns are historical and are calculated by determining the percentage change in NAV with all distributions reinvested. Unless otherwise stated, performance does not reflect the deduction of taxes on Fund distributions or redemptions of Fund shares.Performance prior to the inception date of a class may be linked to the performance of an older class of the Fund. This linked performance is adjusted for any applicable sales charge, but is not adjusted for class expense differences. If adjusted for such differences, the performance would be different. The performance of Class I is linked to Class A and the performance of Class R6 is linked to Class I. Performance presented in the Financial Highlights included in the financial statements is not linked.Calvert Research and Management became the investment adviser to the Fund on December 31, 2016. Performance reflected prior to such date is that of the Fund’s former investment adviser. |
| 3 | Source: Fund prospectus. Net expense ratios reflect a contractual expense reimbursement that continues through 1/31/22. Without the reimbursement, performance would have been lower. The expense ratios for the current reporting period can be found in the Financial Highlights section of this report.Fund profile subject to change due to active management. |
| Additional Information |
| | Bloomberg U.S. Treasury Index measures the performance of U.S. Treasuries with a maturity of one year or more. Bloomberg U.S. Aggregate Bond Index is an unmanaged index of domestic investment-grade bonds, including corporate, government and mortgage-backed securities. Bloomberg U.S. Corporate Bond Index measures the performance of investment-grade U.S. corporate securities with a maturity of one year or more. Bloomberg U.S. Corporate High Yield Index measures USD-denominated, non-investment grade corporate securities. |
| | Duration is a measure of the expected change in price of a bond — in percentage terms — given a one percent change in interest rates, all else being constant. Securities with lower durations tend to be less sensitive to interest rate changes. |
| | Yield curve is a graphical representation of the yields offered by bonds of various maturities. The yield curve flattens when long-term interest rates fall and/or short-term interest rates increase, and the yield curve steepens when long-term interest rates increase and/or short-term interest rates fall. |
| | Important Notice to Shareholders |
| | Effective August 24, 2021, the Bloomberg Barclays fixed income indices were rebranded as Bloomberg indices. |
Calvert
Ultra-Short Duration Income Fund
September 30, 2021
Example
As a Fund shareholder, you incur two types of costs: (1) transaction costs, including sales charges (loads) on purchases and redemption fees (if applicable); and (2) ongoing costs, including management fees; distribution and/or service fees; and other Fund expenses. This Example is intended to help you understand your ongoing costs (in dollars) of Fund investing and to compare these costs with the ongoing costs of investing in other mutual funds. The Example is based on an investment of $1,000 invested at the beginning of the period and held for the entire period (April 1, 2021 to September 30, 2021).
Actual Expenses
The first section of the table below provides information about actual account values and actual expenses. You may use the information in this section, together with the amount you invested, to estimate the expenses that you paid over the period. Simply divide your account value by $1,000 (for example, an $8,600 account value divided by $1,000 = 8.6), then multiply the result by the number in the first section under the heading entitled “Expenses Paid During Period” to estimate the expenses you paid on your account during this period.
Hypothetical Example for Comparison Purposes
The second section of the table below provides information about hypothetical account values and hypothetical expenses based on the actual Fund expense ratio and an assumed rate of return of 5% per year (before expenses), which is not the actual Fund return. The hypothetical account values and expenses may not be used to estimate the actual ending account balance or expenses you paid for the period. You may use this information to compare the ongoing costs of investing in the Fund and other funds. To do so, compare this 5% hypothetical example with the 5% hypothetical examples that appear in the shareholder reports of the other funds.
Please note that the expenses shown in the table are meant to highlight your ongoing costs only and do not reflect any transactional costs, such as sales charges (loads) or redemption fees (if applicable). Therefore, the second section of the table is useful in comparing ongoing costs only, and will not help you determine the relative total costs of owning different funds. In addition, if these transactional costs were included, your costs would be higher.
| | Beginning
Account Value
(4/1/21) | Ending
Account Value
(9/30/21) | Expenses Paid
During Period*
(4/1/21 – 9/30/21) | Annualized
Expense
Ratio |
| Actual | | | | |
| Class A | $1,000.00 | $1,003.90 | $3.62 ** | 0.72% |
| Class I | $1,000.00 | $1,005.20 | $2.36 ** | 0.47% |
| Class R6 | $1,000.00 | $1,004.40 | $2.16 ** | 0.43% |
| Hypothetical | | | | |
| (5% return per year before expenses) | | | | |
| Class A | $1,000.00 | $1,021.46 | $3.65 ** | 0.72% |
| Class I | $1,000.00 | $1,022.71 | $2.38 ** | 0.47% |
| Class R6 | $1,000.00 | $1,022.91 | $2.18 ** | 0.43% |
| * | Expenses are equal to the Fund’s annualized expense ratio for the indicated Class, multiplied by the average account value over the period, multiplied by 183/365 (to reflect the one-half year period). The Example assumes that the $1,000 was invested at the net asset value per share determined at the close of business on March 31, 2021. |
| ** | Absent a waiver and/or reimbursement of expenses by an affiliate, expenses would be higher. |
Calvert
Ultra-Short Duration Income Fund
September 30, 2021
| Asset-Backed Securities — 19.6% |
| Security | Principal
Amount
(000's omitted) | Value |
| Affirm Asset Securitization Trust, Series 2021-A, Class A, 0.88%, 8/15/25(1) | $ | 5,890 | $ 5,903,886 |
| Amur Equipment Finance Receivables IX, LLC, Series 2021-1A, Class A2, 0.75%, 11/20/26(1) | | 4,355 | 4,358,689 |
| Avant Loans Funding Trust: | | | |
| Series 2019-B, Class B, 3.15%, 10/15/26(1) | | 2,393 | 2,399,498 |
| Series 2019-B, Class C, 4.54%, 10/15/26(1) | | 2,500 | 2,529,059 |
| Series 2020-REV1, Class C, 4.17%, 5/15/29(1) | | 2,500 | 2,514,022 |
| BHG Securitization Trust, Series 2021-B, Class A, 0.90%, 10/17/34(1) | | 2,270 | 2,276,054 |
| Chesapeake Funding II, LLC: | | | |
| Series 2018-2A, Class A1, 3.23%, 8/15/30(1) | | 3,278 | 3,288,526 |
| Series 2020-1A, Class A2, 0.734%, (1 mo. USD LIBOR + 0.65%), 8/16/32(1)(2) | | 852 | 856,191 |
| Coinstar Funding, LLC, Series 2017-1A, Class A2, 5.216%, 4/25/47(1) | | 6,487 | 6,505,215 |
| Conn's Receivables Funding, LLC: | | | |
| Series 2020-A, Class A, 1.71%, 6/16/25(1) | | 710 | 710,290 |
| Series 2020-A, Class B, 4.27%, 6/16/25(1) | | 1,554 | 1,564,454 |
| Series 2020-A, Class C, 4.20%, 6/16/25(1) | | 2,296 | 2,304,056 |
| Consumer Loan Underlying Bond Credit Trust, Series 2020-P1, Class A, 2.26%, 3/15/28(1) | | 334 | 334,945 |
| Crossroads Asset Trust, Series 2021-A, Class A2, 0.82%, 3/20/24(1) | | 2,415 | 2,418,283 |
| DB Master Finance, LLC, Series 2017-1A, Class A2I, 3.629%, 11/20/47(1) | | 10,615 | 10,708,119 |
| Dell Equipment Finance Trust: | | | |
| Series 2020-2, Class A2, 0.47%, 10/24/22(1) | | 858 | 858,883 |
| Series 2021-2, Class A1, 0.182%, 9/22/22(1) | | 8,500 | 8,499,668 |
| Donlen Fleet Lease Funding 2, LLC, Series 2021-2, Class A1, 0.415%, (1 mo. USD LIBOR + 0.33%), 12/11/34(1)(2) | | 4,000 | 4,005,752 |
| FOCUS Brands Funding, LLC, Series 2017-1A, Class A2IB, 3.857%, 4/30/47(1) | | 4,213 | 4,334,599 |
| Ford Credit Auto Lease Trust: | | | |
| Series 2020-B, Class A2A, 0.50%, 12/15/22 | | 504 | 504,410 |
| Series 2020-B, Class A2B, 0.344%, (1 mo. USD LIBOR + 0.26%), 12/15/22(2) | | 722 | 721,771 |
| Hilton Grand Vacations Trust, Series 2020-AA, Class A, 2.74%, 2/25/39(1) | | 1,162 | 1,210,464 |
| JPMorgan Chase Bank, NA: | | | |
| Series 2021-2, Class B, 0.889%, 12/26/28(1) | | 2,245 | 2,245,254 |
| Series 2021-3, Class B, 0.76%, 2/26/29(1) | | 2,556 | 2,556,241 |
| Series 2021-3, Class C, 0.86%, 2/26/29(1) | | 2,856 | 2,855,853 |
| Series 2021-3, Class D, 1.009%, 2/26/29(1) | | 1,140 | 1,140,410 |
| LL ABS Trust, Series 2021-1A, Class A, 1.07%, 5/15/29(1) | | 1,492 | 1,491,242 |
| Marlette Funding Trust: | | | |
| Series 2018-2A, Class C, 4.37%, 7/17/28(1) | | 2,958 | 2,968,500 |
| Security | Principal
Amount
(000's omitted) | Value |
| Marlette Funding Trust: (continued) | | | |
| Series 2019-2A, Class A, 3.13%, 7/16/29(1) | $ | 264 | $ 263,896 |
| Series 2020-2A, Class A, 1.02%, 9/16/30(1) | | 76 | 76,118 |
| Series 2020-2A, Class B, 1.83%, 9/16/30(1) | | 1,500 | 1,507,595 |
| Series 2021-1A, Class A, 0.60%, 6/16/31(1) | | 947 | 947,834 |
| MVW, LLC, Series 2020-1A, Class A, 1.74%, 10/20/37(1) | | 306 | 309,395 |
| OneMain Financial Issuance Trust: | | | |
| Series 2015-3A, Class A, 3.63%, 11/20/28(1) | | 114 | 114,182 |
| Series 2015-3A, Class B, 4.16%, 11/20/28(1) | | 1,310 | 1,311,990 |
| Series 2018-1A, Class A, 3.30%, 3/14/29(1) | | 5,315 | 5,329,017 |
| Series 2019-1A, Class A, 3.48%, 2/14/31(1) | | 351 | 351,548 |
| Oportun Funding, LLC, Series 2020-1, Class B, 3.45%, 5/15/24(1) | | 3,000 | 3,048,447 |
| Oscar US Funding XII, LLC, Series 2021-1A, Class A2, 0.40%, 3/11/24(1) | | 2,298 | 2,302,996 |
| Pagaya AI Debt Selection Trust: | | | |
| Series 2021-1, Class A, 1.18%, 11/15/27(1) | | 6,298 | 6,315,430 |
| Series 2021-2, 3.00%, 1/25/29(1) | | 3,908 | 3,940,169 |
| Series 2021-3, Class A, 1.15%, 5/15/29(1) | | 8,710 | 8,715,276 |
| Series 2021-HG1, Class A, 1.22%, 1/16/29(1) | | 3,478 | 3,482,728 |
| Prodigy Finance CM DAC, Series 2021-1A, Class A, 1.336%, (1 mo. USD LIBOR + 1.25%), 7/25/51(1)(2) | | 4,947 | 4,967,819 |
| Purchasing Power Funding, LLC, Series 2021-A, Class A, 1.57%, 10/15/25(1) | | 5,740 | 5,757,559 |
| Small Business Lending Trust, Series 2020-A, Class A, 2.62%, 12/15/26(1) | | 694 | 695,967 |
| SoFi Professional Loan Program, LLC, Series 2016-B, Class A1, 1.286%, (1 mo. USD LIBOR + 1.20%), 6/25/33(1)(2) | | 84 | 84,121 |
| SpringCastle America Funding, LLC, Series 2020-AA, Class A, 1.97%, 9/25/37(1) | | 3,690 | 3,726,239 |
| Springleaf Funding Trust: | | | |
| Series 2017-AA, Class A, 2.68%, 7/15/30(1) | | 1,694 | 1,696,654 |
| Series 2017-AA, Class C, 3.86%, 7/15/30(1) | | 3,500 | 3,507,045 |
| Stack Infrastructure Issuer, LLC: | | | |
| Series 2019-1A, Class A2, 4.54%, 2/25/44(1) | | 26 | 27,690 |
| Series 2020-1A, Class A2, 1.893%, 8/25/45(1) | | 1,525 | 1,535,084 |
| Tesla Auto Lease Trust: | | | |
| Series 2019-A, Class A2, 2.13%, 4/20/22(1) | | 2,257 | 2,261,977 |
| Series 2020-A, Class A2, 0.55%, 5/22/23(1) | | 1,043 | 1,043,787 |
| Theorem Funding Trust: | | | |
| Series 2020-1A, Class A, 2.48%, 10/15/26(1) | | 2,088 | 2,097,317 |
| Series 2021-1A, Class A, 1.21%, 12/15/27(1) | | 17,977 | 17,995,324 |
| Toyota Auto Receivables Owner Trust, Series 2020-C, Class A2, 0.36%, 2/15/23 | | 723 | 723,074 |
| Upstart Securitization Trust: | | | |
| Series 2021-3, Class A, 0.83%, 7/20/31(1) | | 2,027 | 2,027,585 |
| Series 2021-4, Class A, 0.84%, 9/20/31(1) | | 7,000 | 7,000,820 |
7
See Notes to Financial Statements.
Calvert
Ultra-Short Duration Income Fund
September 30, 2021
Schedule of Investments — continued
| Security | Principal
Amount
(000's omitted) | Value |
| Vantage Data Centers Issuer, LLC, Series 2020-2A, Class A2, 1.992%, 9/15/45(1) | $ | 4,955 | $ 4,935,237 |
| Verizon Owner Trust: | | | |
| Series 2019-A, Class A1B, 0.417%, (1 mo. USD LIBOR + 0.33%), 9/20/23(2) | | 406 | 406,791 |
| Series 2020-2A, Class A1B, 0.357%, (1 mo. USD LIBOR + 0.27%), 7/22/24(2) | | 13,500 | 13,525,291 |
| Series 2020-B, Class A, 0.47%, 2/20/25 | | 5,515 | 5,529,306 |
Total Asset-Backed Securities
(identified cost $199,654,838) | | | $ 199,625,642 |
| Collateralized Mortgage Obligations — 5.1% |
| Security | Principal
Amount
(000's omitted) | Value |
| Bellemeade Re, Ltd.: | | | |
| Series 2020-3A, Class M1A, 2.086%, (1 mo. USD LIBOR + 2.00%), 10/25/30(1)(2) | $ | 2,867 | $ 2,893,467 |
| Series 2021-1A, Class M1A, 1.80%, (30-day average SOFR + 1.75%), 3/25/31(1)(2) | | 4,784 | 4,853,371 |
| Series 2021-1A, Class M1B, 2.25%, (30-day average SOFR + 2.20%), 3/25/31(1)(2) | | 1,500 | 1,542,318 |
| Series 2021-2A, Class M1A, 1.25%, (30-day average SOFR + 1.20%), 6/25/31(1)(2) | | 2,696 | 2,716,503 |
| Series 2021-3A, Class M1A, 1.05%, (30-day average SOFR + 1.00%), 9/25/31(1)(2) | | 4,000 | 4,013,308 |
| Eagle Re, Ltd., Series 2021-1, Class M1A, 1.75%, (30-day average SOFR + 1.70%), 10/25/33(1)(2) | | 3,000 | 3,026,517 |
| Federal Home Loan Mortgage Corp. Structured Agency Credit Risk Debt Notes: | | | |
| Series 2017-DNA3, Class M2, 2.586%, (1 mo. USD LIBOR + 2.50%), 3/25/30(2) | | 1,940 | 1,988,659 |
| Series 2018-DNA1, Class M2, 1.886%, (1 mo. USD LIBOR + 1.80%), 7/25/30(2) | | 3,665 | 3,698,672 |
| Series 2018-DNA1, Class M2AT, 1.136%, (1 mo. USD LIBOR + 1.05%), 7/25/30(2) | | 3,885 | 3,875,132 |
| Series 2018-HQA2, Class M1, 0.836%, (1 mo. USD LIBOR + 0.75%), 10/25/48(1)(2) | | 571 | 571,796 |
| Series 2019-DNA3, Class M2, 2.136%, (1 mo. USD LIBOR + 2.05%), 7/25/49(1)(2) | | 856 | 867,038 |
| Series 2019-DNA4, Class M2, 2.036%, (1 mo. USD LIBOR + 1.95%), 10/25/49(1)(2) | | 898 | 903,191 |
| Series 2020-DNA6, Class M1, 0.95%, (30-day average SOFR + 0.90%), 12/25/50(1)(2) | | 923 | 923,825 |
| Series 2021-DNA3, Class M1, 0.80%, (30-day average SOFR + 0.75%), 10/25/33(1)(2) | | 1,685 | 1,689,212 |
| Federal National Mortgage Association Connecticut Avenue Securities: | | | |
| Series 2014-C03, Class 2M2, 2.986%, (1 mo. USD LIBOR + 2.90%), 7/25/24(2) | | 43 | 43,785 |
| Series 2014-C04, Class 1M2, 4.986%, (1 mo. USD LIBOR + 4.90%), 11/25/24(2) | | 6,481 | 6,755,415 |
| Security | Principal
Amount
(000's omitted) | Value |
| Federal National Mortgage Association Connecticut Avenue Securities: (continued) | | | |
| Series 2019-R02, Class 1M2, 2.386%, (1 mo. USD LIBOR + 2.30%), 8/25/31(1)(2) | $ | 961 | $ 969,004 |
| Home RE, Ltd., Series 2021-1, Class M1A, 1.136%, (1 mo. USD LIBOR + 1.05%), 7/25/33(1)(2) | | 6,800 | 6,827,926 |
| Oaktown Re V, Ltd., Series 2020-2A, Class M1A, 2.486%, (1 mo. USD LIBOR + 2.40%), 10/25/30(1)(2) | | 411 | 413,093 |
| RESIMAC Bastille Trust, Series 2018-1NCA, Class A1, 0.933%, (1 mo. USD LIBOR + 0.85%), 12/5/59(1)(2) | | 1,020 | 1,021,912 |
| RESIMAC Premier Trust, Series 2020-1A, Class A1A, 1.133%, (1 mo. USD LIBOR + 1.05%), 2/7/52(1)(2) | | 2,239 | 2,253,706 |
Total Collateralized Mortgage Obligations
(identified cost $51,807,591) | | | $ 51,847,850 |
| Commercial Mortgage-Backed Securities — 6.1% |
| Security | Principal
Amount
(000's omitted) | Value |
| BBCMS Mortgage Trust, Series 2017-DELC, Class A, 0.934%, (1 mo. USD LIBOR + 0.85%), 8/15/36(1)(2) | $ | 3,486 | $ 3,494,716 |
| BX Commercial Mortgage Trust: | | | |
| Series 2019-XL, Class A, 1.004%, (1 mo. USD LIBOR + 0.92%), 10/15/36(1)(2) | | 4,035 | 4,046,545 |
| Series 2020-BXLP, Class A, 0.884%, (1 mo. USD LIBOR + 0.80%), 12/15/36(1)(2) | | 5,394 | 5,409,714 |
| Series 2021-VOLT, Class B, 1.034%, (1 mo. USD LIBOR + 0.95%), 9/15/36(1)(2) | | 4,129 | 4,138,031 |
| Series 2021-VOLT, Class C, 1.184%, (1 mo. USD LIBOR + 1.10%), 9/15/36(1)(2) | | 1,908 | 1,911,910 |
| Series 2021-VOLT, Class D, 1.734%, (1 mo. USD LIBOR + 1.65%), 9/15/36(1)(2) | | 1,427 | 1,431,291 |
| Extended Stay America Trust: | | | |
| Series 2021-ESH, Class A, 1.164%, (1 mo. USD LIBOR + 1.08%), 7/15/38(1)(2) | | 5,877 | 5,903,360 |
| Series 2021-ESH, Class B, 1.464%, (1 mo. USD LIBOR + 1.38%), 7/15/38(1)(2) | | 1,495 | 1,504,425 |
| Hawaii Hotel Trust, Series 2019-MAUI, Class A, 1.234%, (1 mo. USD LIBOR + 1.15%), 5/15/38(1)(2) | | 3,000 | 3,009,047 |
| Morgan Stanley Capital I Trust: | | | |
| Series 2017-CLS, Class A, 0.784%, (1 mo. USD LIBOR + 0.70%), 11/15/34(1)(2)(3) | | 10,065 | 10,068,189 |
| Series 2017-CLS, Class B, 0.934%, (1 mo. USD LIBOR + 0.85%), 11/15/34(1)(2)(3) | | 11,690 | 11,694,229 |
| Series 2019-BPR, Class A, 1.484%, (1 mo. USD LIBOR + 1.40%), 5/15/36(1)(2)(3) | | 6,420 | 6,367,606 |
| Motel Trust: | | | |
| Series 2021-MTL6, Class A, 0.984%, (1 mo. USD LIBOR + 0.90%), 9/15/38(1)(2) | | 2,227 | 2,233,694 |
8
See Notes to Financial Statements.
Calvert
Ultra-Short Duration Income Fund
September 30, 2021
Schedule of Investments — continued
| Security | Principal
Amount
(000's omitted) | Value |
| Motel Trust: (continued) | | | |
| Series 2021-MTL6, Class B, 1.284%, (1 mo. USD LIBOR + 1.20%), 9/15/38(1)(2) | $ | 1,137 | $ 1,139,467 |
Total Commercial Mortgage-Backed Securities
(identified cost $62,338,781) | | | $ 62,352,224 |
| Security | Principal
Amount
(000's omitted) | Value |
| Communications — 4.5% | |
| AT&T, Inc., 0.69%, (SOFR + 0.64%), 3/25/24(2) | $ | 6,471 | $ 6,483,258 |
| CCO Holdings, LLC/CCO Holdings Capital Corp.: | | | |
| 5.00%, 2/1/28(1) | | 1,936 | 2,023,410 |
| 5.125%, 5/1/27(1) | | 7,010 | 7,308,346 |
| Nokia Oyj, 3.375%, 6/12/22 | | 11,309 | 11,567,184 |
| Sprint Communications, Inc., 6.00%, 11/15/22 | | 2,500 | 2,631,800 |
| T-Mobile USA, Inc.: | | | |
| 2.25%, 2/15/26(4) | | 1,084 | 1,097,550 |
| 2.25%, 2/15/26(1) | | 1,192 | 1,206,900 |
| Verizon Communications, Inc.: | | | |
| 0.55%, (SOFR + 0.50%), 3/22/24(2) | | 5,000 | 5,047,432 |
| 1.118%, (3 mo. USD LIBOR + 1.00%), 3/16/22(2) | | 8,411 | 8,448,562 |
| | | | $ 45,814,442 |
| Consumer, Cyclical — 5.9% | |
| 7-Eleven, Inc.: | | | |
| 0.578%, (3 mo. USD LIBOR + 0.45%), 8/10/22(1)(2) | $ | 1,500 | $ 1,500,381 |
| 0.625%, 2/10/23(1) | | 1,280 | 1,280,533 |
| American Honda Finance Corp., 0.399%, (3 mo. USD LIBOR + 0.28%), 1/12/24(2) | | 5,000 | 5,016,643 |
| BMW US Capital, LLC, 0.58%, (SOFR + 0.53%), 4/1/24(1)(2) | | 2,000 | 2,022,467 |
| Brunswick Corp., 0.85%, 8/18/24 | | 1,575 | 1,575,332 |
| Delta Air Lines, Inc., 3.625%, 3/15/22 | | 10,500 | 10,593,673 |
| Delta Air Lines, Inc./SkyMiles IP, Ltd., 4.50%, 10/20/25(1) | | 4,213 | 4,509,152 |
| Ford Motor Credit Co., LLC: | | | |
| 0.999%, (3 mo. USD LIBOR + 0.88%), 10/12/21(2) | | 3,140 | 3,140,022 |
| 1.198%, (3 mo. USD LIBOR + 1.08%), 8/3/22(2) | | 2,000 | 1,994,205 |
| 3.278%, (3 mo. USD LIBOR + 3.14%), 1/7/22(2) | | 2,000 | 2,008,840 |
| 3.339%, 3/28/22 | | 5,000 | 5,034,400 |
| Hyatt Hotels Corp.: | | | |
| (SOFR + 1.05%), 10/1/23(5) | | 3,245 | 3,249,705 |
| 1.30%, 10/1/23(6) | | 1,087 | 1,088,595 |
| Nordstrom, Inc., 2.30%, 4/8/24 | | 1,572 | 1,572,240 |
| Toll Brothers Finance Corp., 5.875%, 2/15/22 | | 1,400 | 1,407,763 |
| Security | Principal
Amount
(000's omitted) | Value |
| Consumer, Cyclical (continued) | |
| Toyota Motor Credit Corp.: | | | |
| 0.275%, (3 mo. USD LIBOR + 0.15%), 2/14/22(2) | $ | 8,150 | $ 8,155,077 |
| 0.45%, 7/22/22 | | 5,500 | 5,511,578 |
| | | | $ 59,660,606 |
| Consumer, Non-cyclical — 3.8% | |
| Becton Dickinson and Co., 1.148%, (3 mo. USD LIBOR + 1.03%), 6/6/22(2) | $ | 390 | $ 392,490 |
| Centene Corp., 4.25%, 12/15/27 | | 5,500 | 5,763,450 |
| Coca-Cola Europacific Partners PLC, 0.50%, 5/5/23(1) | | 6,167 | 6,162,153 |
| JDE Peet's NV, 0.80%, 9/24/24(1) | | 5,000 | 4,987,291 |
| Kraft Heinz Foods Co., 3.875%, 5/15/27 | | 3,200 | 3,495,976 |
| PerkinElmer, Inc.: | | | |
| 0.55%, 9/15/23 | | 5,000 | 5,004,818 |
| 0.85%, 9/15/24 | | 5,017 | 5,018,215 |
| Royalty Pharma PLC, 0.75%, 9/2/23 | | 8,250 | 8,278,428 |
| | | | $ 39,102,821 |
| Energy — 1.4% | |
| NuStar Logistics, L.P.: | | | |
| 4.75%, 2/1/22 | $ | 4,800 | $ 4,826,160 |
| 5.75%, 10/1/25 | | 1,660 | 1,790,725 |
| TerraForm Power Operating, LLC, 4.25%, 1/31/23(1) | | 7,800 | 8,028,384 |
| | | | $ 14,645,269 |
| Financial — 24.1% | |
| AerCap Ireland Capital DAC/AerCap Global Aviation Trust: | | | |
| 3.50%, 5/26/22 | $ | 1,300 | $ 1,321,882 |
| 3.95%, 2/1/22 | | 11,470 | 11,566,603 |
| 4.625%, 7/1/22 | | 1,000 | 1,029,945 |
| Air Lease Corp., 3.50%, 1/15/22 | | 3,638 | 3,669,568 |
| Banco Santander S.A., 1.221%, (3 mo. USD LIBOR + 1.09%), 2/23/23(2) | | 3,330 | 3,372,300 |
| Bank of America Corp.: | | | |
| 0.78%, (SOFR + 0.73%), 10/24/24(2)(4) | | 13,800 | 13,932,217 |
| 1.314%, (3 mo. USD LIBOR + 1.18%), 10/21/22(2) | | 4,000 | 4,002,369 |
| Bank of Montreal: | | | |
| 0.40%, (SOFR + 0.35%), 12/8/23(2) | | 4,200 | 4,216,667 |
| 0.73%, (SOFR + 0.68%), 3/10/23(2) | | 10,000 | 10,076,511 |
| Bank of Nova Scotia (The): | | | |
| 0.49%, (SOFR + 0.44%), 4/15/24(2) | | 5,000 | 5,031,767 |
| 0.60%, (SOFR + 0.55%), 9/15/23(2) | | 8,500 | 8,561,559 |
| BBVA Bancomer S.A./Texas, 1.875%, 9/18/25(1) | | 1,718 | 1,729,511 |
| Canadian Imperial Bank of Commerce: | | | |
| 0.39%, (SOFR + 0.34%), 6/22/23(2)(4) | | 5,000 | 5,010,664 |
| 0.85%, (SOFR + 0.80%), 3/17/23(2) | | 12,310 | 12,423,776 |
9
See Notes to Financial Statements.
Calvert
Ultra-Short Duration Income Fund
September 30, 2021
Schedule of Investments — continued
| Security | Principal
Amount
(000's omitted) | Value |
| Financial (continued) | |
| Capital One Financial Corp., 0.849%, (3 mo. USD LIBOR + 0.72%), 1/30/23(2) | $ | 2,084 | $ 2,101,038 |
| Citigroup, Inc.: | | | |
| 0.72%, (SOFR + 0.67%), 5/1/25(2) | | 4,618 | 4,662,259 |
| 0.776% to 10/30/23, 10/30/24(7) | | 4,080 | 4,096,419 |
| 0.92%, (SOFR + 0.87%), 11/4/22(2) | | 10,000 | 10,014,023 |
| 1.185%, (3 mo. USD LIBOR + 1.07%), 12/8/21(2) | | 4,500 | 4,504,736 |
| 1.678% to 5/15/23, 5/15/24(7) | | 3,723 | 3,796,583 |
| Credit Agricole S.A., 1.247% to 1/26/26, 1/26/27(1)(7) | | 1,968 | 1,940,958 |
| Danske Bank A/S, 1.171% to 12/8/22, 12/8/23(1)(7) | | 4,200 | 4,220,897 |
| Goldman Sachs Group, Inc. (The): | | | |
| 0.46%, (SOFR + 0.41%), 1/27/23(2) | | 8,000 | 8,004,867 |
| 0.63%, (SOFR + 0.58%), 3/8/24(2) | | 7,903 | 7,922,000 |
| HSBC Holdings PLC, 0.732% to 8/17/23, 8/17/24(7) | | 1,776 | 1,777,716 |
| JPMorgan Chase & Co., 0.63%, (SOFR + 0.58%), 3/16/24(2) | | 18,440 | 18,511,004 |
| Lloyds Banking Group PLC, 1.326% to 6/15/22, 6/15/23(7) | | 2,380 | 2,395,568 |
| National Bank of Canada: | | | |
| 0.55% to 11/15/23, 11/15/24(7) | | 3,752 | 3,745,445 |
| 0.90% to 8/15/22, 8/15/23(7) | | 2,031 | 2,039,811 |
| Nationwide Building Society, 0.55%, 1/22/24(1) | | 3,191 | 3,180,658 |
| Newmark Group, Inc., 6.125%, 11/15/23 | | 3,250 | 3,520,562 |
| PNC Bank NA, 0.546%, (3 mo. USD LIBOR + 0.43%), 12/9/22(2) | | 10,600 | 10,609,128 |
| Public Storage, 0.52%, (SOFR + 0.47%), 4/23/24(2) | | 3,114 | 3,119,017 |
| Radian Group, Inc.: | | | |
| 4.50%, 10/1/24 | | 2,000 | 2,136,330 |
| 6.625%, 3/15/25 | | 1,000 | 1,117,500 |
| Royal Bank of Canada, 0.50%, (SOFR + 0.45%), 10/26/23(2) | | 7,000 | 7,043,194 |
| Santander UK Group Holdings PLC, 1.532% to 8/21/25, 8/21/26(7) | | 2,283 | 2,279,347 |
| Standard Chartered PLC, 1.30%, (SOFR + 1.25%), 10/14/23(1)(2) | | 5,950 | 6,007,164 |
| Synovus Bank/Columbus, GA, 2.289% to 2/10/22, 2/10/23(7) | | 4,078 | 4,096,339 |
| Toronto-Dominion Bank (The), 0.50%, (SOFR + 0.45%), 9/28/23(2) | | 8,200 | 8,250,639 |
| Truist Financial Corp., 0.45%, (SOFR + 0.40%), 6/9/25(2) | | 9,000 | 9,035,665 |
| UBS AG: | | | |
| 0.37%, (SOFR + 0.32%), 6/1/23(1)(2) | | 9,000 | 9,028,712 |
| 0.50%, (SOFR + 0.45%), 8/9/24(1)(2) | | 9,000 | 9,070,503 |
| UniCredit SpA, 2.569% to 9/22/25, 9/22/26(1)(7) | | 1,976 | 2,009,964 |
| | | | $ 246,183,385 |
| Security | Principal
Amount
(000's omitted) | Value |
| Government - Multinational — 1.2% | |
| International Bank for Reconstruction & Development, 0.18%, (SOFR + 0.13%), 1/13/23(2) | $ | 9,900 | $ 9,907,723 |
| International Finance Corp., 2.00%, 10/24/22 | | 2,429 | 2,476,314 |
| | | | $ 12,384,037 |
| Industrial — 2.3% | |
| Caterpillar Financial Services Corp., 0.358%, (3 mo. USD LIBOR + 0.22%), 1/6/22(2) | $ | 7,000 | $ 7,004,562 |
| Jabil, Inc.: | | | |
| 1.70%, 4/15/26 | | 940 | 945,486 |
| 4.70%, 9/15/22 | | 5,889 | 6,124,536 |
| Otis Worldwide Corp., 0.595%, (3 mo. USD LIBOR + 0.45%), 4/5/23(2) | | 3,500 | 3,500,373 |
| SYNNEX Corp., 1.25%, 8/9/24(1) | | 2,778 | 2,779,209 |
| Teledyne Technologics, Inc., 0.95%, 4/1/24 | | 3,000 | 3,005,471 |
| | | | $ 23,359,637 |
| Technology — 0.9% | |
| Seagate HDD Cayman: | | | |
| 4.25%, 3/1/22 | $ | 100 | $ 101,133 |
| 4.875%, 3/1/24 | | 1,555 | 1,677,456 |
| SK Hynix, Inc., 1.50%, 1/19/26(1) | | 7,000 | 6,912,732 |
| | | | $ 8,691,321 |
| Utilities — 2.7% | |
| Clearway Energy Operating, LLC, 5.00%, 9/15/26 | $ | 2,500 | $ 2,567,312 |
| Consolidated Edison, Inc., 0.65%, 12/1/23 | | 2,850 | 2,847,493 |
| NextEra Energy Capital Holdings, Inc.: | | | |
| 0.401%, (3 mo. USD LIBOR + 0.27%), 2/22/23(2) | | 6,500 | 6,500,685 |
| 0.59%, (SOFR + 0.54%), 3/1/23(2)(4) | | 4,014 | 4,032,310 |
| Southern California Gas Co., 0.466%, (3 mo. USD LIBOR + 0.35%), 9/14/23(2) | | 11,599 | 11,603,307 |
| | | | $ 27,551,107 |
Total Corporate Bonds
(identified cost $474,827,987) | | | $ 477,392,625 |
| High Social Impact Investments — 0.1% |
| Security | Principal
Amount
(000's omitted) | Value |
| Calvert Impact Capital, Inc., Community Investment Notes, 1.50%, 12/15/23(8)(9) | $ | 1,000 | $ 982,830 |
Total High Social Impact Investments
(identified cost $1,000,000) | | | $ 982,830 |
10
See Notes to Financial Statements.
Calvert
Ultra-Short Duration Income Fund
September 30, 2021
Schedule of Investments — continued
| Senior Floating-Rate Loans — 1.9%(10) |
| Borrower/Description | Principal
Amount
(000's omitted) | Value |
| Building and Development — 0.1% | |
| Cushman & Wakefield U.S. Borrower, LLC, Term Loan, 2.834%, (1 mo. USD LIBOR + 2.75%), 8/21/25 | $ | 1,496 | $ 1,485,542 |
| | | | $ 1,485,542 |
| Cable and Satellite Television — 0.5% | |
| CSC Holdings, LLC, Term Loan, 2.334%, (1 mo. USD LIBOR + 2.25%), 7/17/25 | $ | 2,189 | $ 2,163,267 |
| UPC Financing Partnership, Term Loan, 3.084%, (1 mo. USD LIBOR + 3.00%), 1/31/29 | | 1,500 | 1,498,437 |
| Virgin Media Bristol, LLC, Term Loan, 3.334%, (1 mo. USD LIBOR + 3.25%), 1/31/29 | | 1,500 | 1,502,501 |
| | | | $ 5,164,205 |
| Electronics/Electrical — 0.2% | |
| SS&C European Holdings S.a.r.l., Term Loan, 1.834%, (1 mo. USD LIBOR + 1.75%), 4/16/25 | $ | 731 | $ 724,566 |
| SS&C Technologies, Inc., Term Loan, 1.834%, (1 mo. USD LIBOR + 1.75%), 4/16/25 | | 965 | 956,844 |
| | | | $ 1,681,410 |
| Equipment Leasing — 0.1% | |
| Avolon TLB Borrower 1 (US), LLC, Term Loan, 2.50%, (1 mo. USD LIBOR + 1.75%, Floor 0.75%), 1/15/25 | $ | 1,301 | $ 1,297,083 |
| | | | $ 1,297,083 |
| Health Care — 0.4% | |
| Ortho-Clinical Diagnostics S.A., Term Loan, 3.083%, (1 mo. USD LIBOR + 3.00%), 6/30/25 | $ | 1,500 | $ 1,500,280 |
| Select Medical Corporation, Term Loan, 2.34%, (1 mo. USD LIBOR + 2.25%), 3/6/25 | | 2,200 | 2,190,375 |
| | | | $ 3,690,655 |
| Insurance — 0.2% | |
| Asurion, LLC, Term Loan, 3.209%, (1 mo. USD LIBOR + 3.13%), 11/3/23 | $ | 1,738 | $ 1,731,110 |
| | | | $ 1,731,110 |
| Leisure Goods/Activities/Movies — 0.2% | |
| Bombardier Recreational Products, Inc., Term Loan, 2.084%, (1 mo. USD LIBOR + 2.00%), 5/24/27 | $ | 1,985 | $ 1,971,240 |
| | | | $ 1,971,240 |
| Telecommunications — 0.2% | |
| CenturyLink, Inc., Term Loan, 2.334%, (1 mo. USD LIBOR + 2.25%), 3/15/27 | $ | 2,005 | $ 1,985,108 |
| Borrower/Description | Principal
Amount
(000's omitted) | Value |
| Telecommunications (continued) | |
| Level 3 Financing, Inc., Term Loan, 1.834%, (1 mo. USD LIBOR + 1.75%), 3/1/27 | $ | 400 | $ 395,679 |
| | | | $ 2,380,787 |
Total Senior Floating-Rate Loans
(identified cost $19,394,568) | | | $ 19,402,032 |
| Sovereign Government Bonds — 3.5% |
| Security | Principal
Amount
(000's omitted) | Value |
| Kreditanstalt fuer Wiederaufbau: | | | |
| 2.00%, 11/30/21 | $ | 20,644 | $ 20,706,550 |
| 2.00%, 9/29/22 | | 12,674 | 12,908,434 |
| Nederlandse Waterschapsbank NV, 2.125%, 11/15/21(1) | | 2,500 | 2,505,772 |
Total Sovereign Government Bonds
(identified cost $36,125,918) | | | $ 36,120,756 |
| U.S. Treasury Obligations — 9.7% |
| Security | Principal
Amount
(000's omitted) | Value |
| U.S. Treasury Notes: | | | |
| 0.125%, 7/31/22 | $ | 4,525 | $ 4,526,249 |
| 0.375%, 3/31/22 | | 10,000 | 10,015,874 |
| 1.125%, 2/28/22 | | 10,000 | 10,043,958 |
| 1.50%, 1/31/22 | | 10,000 | 10,048,292 |
| 1.625%, 12/31/21 | | 18,295 | 18,366,555 |
| 1.75%, 5/31/22 | | 4,636 | 4,687,948 |
| 1.75%, 6/15/22 | | 5,016 | 5,074,960 |
| 1.875%, 2/28/22 | | 10,000 | 10,075,209 |
| 1.875%, 3/31/22 | | 6,500 | 6,558,561 |
| 2.00%, 12/31/21 | | 10,000 | 10,048,383 |
| 2.50%, 1/15/22 | | 10,000 | 10,070,757 |
Total U.S. Treasury Obligations
(identified cost $99,512,861) | | | $ 99,516,746 |
11
See Notes to Financial Statements.
Calvert
Ultra-Short Duration Income Fund
September 30, 2021
Schedule of Investments — continued
| Short-Term Investments — 8.5% | | | |
| Affiliated Fund — 6.5% |
| Description | Units | Value |
| Calvert Cash Reserves Fund, LLC, 0.04%(11) | | 66,861,849 | $ 66,868,535 |
Total Affiliated Fund
(identified cost $66,862,044) | | | $ 66,868,535 |
| Commercial Paper — 2.0% |
| Security | Principal
Amount
(000's omitted) | Value |
| General Motors Financial Co., Inc.: | | | |
| 0.304%, 10/12/21(1)(12)(13) | $ | 10,000 | $ 9,999,067 |
| 0.325%, 10/18/21(1)(12)(13) | | 10,000 | 9,998,505 |
Total Commercial Paper
(identified cost $19,997,572) | | | $ 19,997,572 |
| Securities Lending Collateral — 0.0%(14) |
| Security | Shares | Value |
| State Street Navigator Securities Lending Government Money Market Portfolio, 0.03%(15) | | 424,325 | $ 424,325 |
Total Securities Lending Collateral
(identified cost $424,325) | | | $ 424,325 |
Total Short-Term Investments
(identified cost $87,283,941) | | | $ 87,290,432 |
Total Investments — 101.3%
(identified cost $1,031,946,485) | | | $1,034,531,137 |
| Other Assets, Less Liabilities — (1.3)% | | | $ (13,378,012) |
| Net Assets — 100.0% | | | $ 1,021,153,125 |
| The percentage shown for each investment category in the Schedule of Investments is based on net assets. |
| (1) | Security exempt from registration under Rule 144A of the Securities Act of 1933, as amended. These securities may be sold in certain transactions in reliance on an exemption from registration (normally to qualified institutional buyers). At September 30, 2021, the aggregate value of these securities is $384,466,079 or 37.7% of the Fund's net assets. |
| (2) | Variable rate security. The stated interest rate represents the rate in effect at September 30, 2021. |
| (3) | Represents an investment in an issuer that may be deemed to be an affiliate effective March 1, 2021 (see Note 8). |
| (4) | All or a portion of this security was on loan at September 30, 2021. The aggregate market value of securities on loan at September 30, 2021 was $1,502,309. |
| (5) | When-issued, variable rate security whose interest rate will be determined after September 30, 2021. |
| (6) | When-issued security. |
| (7) | Security converts to variable rate after the indicated fixed-rate coupon period. |
| (8) | May be deemed to be an affiliated company (see Note 8). |
| (9) | Restricted security. Total market value of restricted securities amounts to $982,830, which represents 0.1% of the net assets of the Fund as of September 30, 2021. |
| (10) | Senior floating-rate loans (Senior Loans) often require prepayments from excess cash flows or permit the borrowers to repay at their election. The degree to which borrowers repay, whether as a contractual requirement or at their election, cannot be predicted with accuracy. As a result, the actual remaining maturity may be substantially less than the stated maturities shown. However, Senior Loans will typically have an expected average life of approximately two to four years. Senior Loans typically have rates of interest which are redetermined periodically by reference to a base lending rate, plus a spread. These base lending rates are primarily the London Interbank Offered Rate ("LIBOR") and secondarily, the prime rate offered by one or more major United States banks (the "Prime Rate"). Base lending rates may be subject to a floor, or minimum rate. Senior Loans are generally subject to contractual restrictions that must be satisfied before they can be bought or sold. |
| (11) | Affiliated investment company, available to Calvert portfolios and funds, which invests in high quality, U.S. dollar denominated money market instruments. The rate shown is the annualized seven-day yield as of September 30, 2021. |
| (12) | Security exempt from registration under Section 4(2) of the Securities Act of 1933, as amended. Such securities may be sold in transactions exempt from registration only to dealers in that program or other “accredited investors”. At September 30, 2021, the aggregate value of these securities is $19,997,572 representing 2.0% of the Fund’s net assets. |
| (13) | Rate shown is the discount rate at date of purchase. |
| (14) | Amount is less than 0.05%. |
| (15) | Represents investment of cash collateral received in connection with securities lending. |
12
See Notes to Financial Statements.
Calvert
Ultra-Short Duration Income Fund
September 30, 2021
Schedule of Investments — continued
Futures Contracts
| Description | Number of
Contracts | Position | Expiration
Date | Notional
Amount | Value/
Unrealized
Appreciation
(Depreciation) |
| Interest Rate Futures | | | | | |
| U.S. 2-Year Treasury Note | (172) | Short | 12/31/21 | $(37,849,406) | $ 19,869 |
| U.S. 5-Year Treasury Note | (94) | Short | 12/31/21 | (11,537,766) | 60,057 |
| U.S. Ultra 10-Year Treasury Note | (45) | Short | 12/21/21 | (6,536,250) | 98,645 |
| | | | | | $178,571 |
Restricted Securities
| Description | Acquisition Date | Cost |
| Calvert Impact Capital, Inc., Community Investment Notes, 1.50%, 12/15/23 | 12/14/20 | $1,000,000 |
| Abbreviations: |
| LIBOR | – London Interbank Offered Rate |
| SOFR | – Secured Overnight Financing Rate |
| Currency Abbreviations: |
| USD | – United States Dollar |
13
See Notes to Financial Statements.
Calvert
Ultra-Short Duration Income Fund
September 30, 2021
Statement of Assets and Liabilities
| | September 30, 2021 |
| Assets | |
Investments in securities of unaffiliated issuers, at value (identified cost $935,902,087) - including
$1,502,309 of securities on loan | $ 938,549,748 |
| Investments in securities of affiliated issuers, at value (identified cost $96,044,398) | 95,981,389 |
| Cash | 44,552 |
| Deposits at broker for futures contracts | 271,500 |
| Receivable for investments sold | 7,568,648 |
| Receivable for capital shares sold | 5,083,702 |
| Dividends and interest receivable | 2,102,585 |
| Dividends and interest receivable - affiliated | 27,314 |
| Securities lending income receivable | 298 |
| Receivable from affiliate | 29,961 |
| Trustees' deferred compensation plan | 830,742 |
| Total assets | $1,050,490,439 |
| Liabilities | |
| Payable for variation margin on open futures contracts | $ 22,527 |
| Payable for investments purchased | 21,439,039 |
| Payable for when-issued securities | 4,331,359 |
| Payable for capital shares redeemed | 1,580,885 |
| Distributions payable | 50,130 |
| Deposits for securities loaned | 424,325 |
| Payable to affiliates: | |
| Investment advisory fee | 216,905 |
| Administrative fee | 100,169 |
| Distribution and service fees | 68,214 |
| Sub-transfer agency fee | 14,828 |
| Trustees' deferred compensation plan | 830,742 |
| Accrued expenses | 258,191 |
| Total liabilities | $ 29,337,314 |
| Net Assets | $1,021,153,125 |
| Sources of Net Assets | |
| Paid-in capital | $ 1,034,291,313 |
| Accumulated loss | (13,138,188) |
| Total | $1,021,153,125 |
| Class A Shares | |
| Net Assets | $ 331,647,871 |
| Shares Outstanding | 33,373,274 |
Net Asset Value, Offering Price and Redemption Price Per Share
(net assets ÷ shares of beneficial interest outstanding) | $ 9.94 |
| Class I Shares | |
| Net Assets | $ 605,830,608 |
| Shares Outstanding | 60,953,327 |
Net Asset Value, Offering Price and Redemption Price Per Share
(net assets ÷ shares of beneficial interest outstanding) | $ 9.94 |
14
See Notes to Financial Statements.
Calvert
Ultra-Short Duration Income Fund
September 30, 2021
Statement of Assets and Liabilities — continued
| | September 30, 2021 |
| Class R6 Shares | |
| Net Assets | $83,674,646 |
| Shares Outstanding | 8,426,062 |
Net Asset Value, Offering Price and Redemption Price Per Share
(net assets ÷ shares of beneficial interest outstanding) | $ 9.93 |
15
See Notes to Financial Statements.
Calvert
Ultra-Short Duration Income Fund
September 30, 2021
| | Year Ended |
| | September 30, 2021 |
| Investment Income | |
| Dividend income - affiliated issuers | $ 35,744 |
| Interest and other income | 11,164,680 |
| Interest income - affiliated issuers | 177,621 |
| Securities lending income, net | 4,467 |
| Total investment income | $11,382,512 |
| Expenses | |
| Investment advisory fee | $ 2,292,202 |
| Administrative fee | 1,058,039 |
| Distribution and service fees: | |
| Class A | 777,130 |
| Trustees' fees and expenses | 50,313 |
| Custodian fees | 22,684 |
| Transfer agency fees and expenses | 601,685 |
| Accounting fees | 198,296 |
| Professional fees | 55,648 |
| Registration fees | 93,978 |
| Reports to shareholders | 34,519 |
| Miscellaneous | 47,018 |
| Total expenses | $ 5,231,512 |
| Waiver and/or reimbursement of expenses by affiliate | $ (326,621) |
| Net expenses | $ 4,904,891 |
| Net investment income | $ 6,477,621 |
| Realized and Unrealized Gain (Loss) | |
| Net realized gain (loss): | |
| Investment securities | $ (1,130,793) |
| Investment securities - affiliated issuers | 28,821 |
| Futures contracts | 604,429 |
| Net realized loss | $ (497,543) |
| Change in unrealized appreciation (depreciation): | |
| Investment securities | $ 7,673,902 |
| Investment securities - affiliated issuers | 50,919 |
| Futures contracts | 190,156 |
| Net change in unrealized appreciation (depreciation) | $ 7,914,977 |
| Net realized and unrealized gain | $ 7,417,434 |
| Net increase in net assets from operations | $13,895,055 |
16
See Notes to Financial Statements.
Calvert
Ultra-Short Duration Income Fund
September 30, 2021
Statements of Changes in Net Assets
| | Year Ended September 30, |
| | 2021 | 2020 |
| Increase (Decrease) in Net Assets | | |
| From operations: | | |
| Net investment income | $ 6,477,621 | $ 15,200,069 |
| Net realized loss | (497,543) | (11,212,784) |
| Net change in unrealized appreciation (depreciation) | 7,914,977 | (6,159,293) |
| Net increase (decrease) in net assets from operations | $ 13,895,055 | $ (2,172,008) |
| Distributions to shareholders: | | |
| Class A | $ (2,250,040) | $ (4,884,021) |
| Class I | (5,048,977) | (10,226,978) |
| Class R6 | (454,567) | (937,447) |
| Total distributions to shareholders | $ (7,753,584) | $ (16,048,446) |
| Capital share transactions: | | |
| Class A | $ 32,604,228 | $ (10,354,612) |
| Class I | 111,407,610 | (73,594,016) |
| Class R6 | 48,472,166 | (13,997,987) |
| Net increase (decrease) in net assets from capital share transactions | $ 192,484,004 | $ (97,946,615) |
| Net increase (decrease) in net assets | $ 198,625,475 | $(116,167,069) |
| Net Assets | | |
| At beginning of year | $ 822,527,650 | $ 938,694,719 |
| At end of year | $1,021,153,125 | $ 822,527,650 |
17
See Notes to Financial Statements.
Calvert
Ultra-Short Duration Income Fund
September 30, 2021
| | Class A |
| | Year Ended September 30, |
| | 2021 | 2020 | 2019 | 2018 (1) | 2017 (1) |
| Net asset value — Beginning of year | $ 9.86 | $ 9.98 | $ 9.99 | $ 10.01 | $ 9.99 |
| Income (Loss) From Operations | | | | | |
| Net investment income(2) | $ 0.06 | $ 0.15 | $ 0.24 | $ 0.17 | $ 0.12 |
| Net realized and unrealized gain (loss) | 0.09 | (0.12) | — (3) | (0.01) | 0.02 |
| Total income from operations | $ 0.15 | $ 0.03 | $ 0.24 | $ 0.16 | $ 0.14 |
| Less Distributions | | | | | |
| From net investment income | $ (0.07) | $ (0.15) | $ (0.25) | $ (0.18) | $ (0.12) |
| From net realized gain | — | — | — | — (4) | — |
| Total distributions | $ (0.07) | $ (0.15) | $ (0.25) | $ (0.18) | $ (0.12) |
| Net asset value — End of year | $ 9.94 | $ 9.86 | $ 9.98 | $ 9.99 | $ 10.01 |
| Total Return(5) | 1.55% | 0.35% | 2.46% | 1.65% | 1.42% |
| Ratios/Supplemental Data | | | | | |
| Net assets, end of year (000’s omitted) | $331,648 | $296,786 | $311,980 | $378,257 | $440,440 |
| Ratios (as a percentage of average daily net assets):(6) | | | | | |
| Total expenses | 0.76% | 0.76% | 0.79% | 0.77% | 0.82% |
| Net expenses | 0.72% | 0.72% | 0.74% | 0.77% | 0.79% |
| Net investment income | 0.58% | 1.48% | 2.44% | 1.73% | 1.18% |
| Portfolio Turnover | 92% (7) | 128% (7) | 85% | 105% | 107% |
| (1) | Per share data reflects a 1.5615-for-1 share split effective June 15, 2018. |
| (2) | Computed using average shares outstanding. |
| (3) | Amount is less than $0.005. |
| (4) | Amount is less than $(0.005). |
| (5) | Returns are historical and are calculated by determining the percentage change in net asset value with all distributions reinvested and do not reflect the effect of sales charges, if any. |
| (6) | Total expenses do not reflect amounts reimbursed and/or waived by the adviser and certain of its affiliates, if applicable. Net expenses are net of all reductions and represent the net expenses paid by the Fund. |
| (7) | Includes the effect of To Be Announced (TBA) transactions. |
18
See Notes to Financial Statements.
Calvert
Ultra-Short Duration Income Fund
September 30, 2021
Financial Highlights — continued
| | Class I |
| | Year Ended September 30, |
| | 2021 | 2020 | 2019 | 2018 (1) | 2017 (1) |
| Net asset value — Beginning of year | $ 9.86 | $ 9.98 | $ 9.99 | $ 10.01 | $ 9.98 |
| Income (Loss) From Operations | | | | | |
| Net investment income(2) | $ 0.08 | $ 0.17 | $ 0.27 | $ 0.21 | $ 0.15 |
| Net realized and unrealized gain (loss) | 0.10 | (0.11) | — (3) | (0.03) | 0.03 |
| Total income from operations | $ 0.18 | $ 0.06 | $ 0.27 | $ 0.18 | $ 0.18 |
| Less Distributions | | | | | |
| From net investment income | $ (0.10) | $ (0.18) | $ (0.28) | $ (0.20) | $ (0.15) |
| From net realized gain | — | — | — | — (4) | — |
| Total distributions | $ (0.10) | $ (0.18) | $ (0.28) | $ (0.20) | $ (0.15) |
| Net asset value — End of year | $ 9.94 | $ 9.86 | $ 9.98 | $ 9.99 | $ 10.01 |
| Total Return(5) | 1.80% | 0.60% | 2.75% | 1.89% | 1.75% |
| Ratios/Supplemental Data | | | | | |
| Net assets, end of year (000’s omitted) | $605,831 | $490,798 | $576,065 | $540,507 | $96,906 |
| Ratios (as a percentage of average daily net assets):(6) | | | | | |
| Total expenses | 0.51% | 0.51% | 0.54% | 0.53% | 0.48% |
| Net expenses | 0.47% | 0.47% | 0.48% | 0.50% | 0.46% |
| Net investment income | 0.82% | 1.75% | 2.70% | 2.10% | 1.51% |
| Portfolio Turnover | 92% (7) | 128% (7) | 85% | 105% | 107% |
| (1) | Per share data reflects a 1.5625-for-1 share split effective June 15, 2018. |
| (2) | Computed using average shares outstanding. |
| (3) | Amount is less than $0.005. |
| (4) | Amount is less than $(0.005). |
| (5) | Returns are historical and are calculated by determining the percentage change in net asset value with all distributions reinvested and do not reflect the effect of sales charges, if any. |
| (6) | Total expenses do not reflect amounts reimbursed and/or waived by the adviser and certain of its affiliates, if applicable. Net expenses are net of all reductions and represent the net expenses paid by the Fund. |
| (7) | Includes the effect of To Be Announced (TBA) transactions. |
19
See Notes to Financial Statements.
Calvert
Ultra-Short Duration Income Fund
September 30, 2021
Financial Highlights — continued
| | Class R6 |
| | Year Ended September 30, | Period Ended
September 30, |
| | 2021 | 2020 | 2019 | 2018 (1)(2) |
| Net asset value — Beginning of period | $ 9.86 | $ 9.98 | $ 9.99 | $ 10.01 |
| Income (Loss) From Operations | | | | |
| Net investment income(3) | $ 0.08 | $ 0.18 | $ 0.27 | $ 0.21 |
| Net realized and unrealized gain (loss) | 0.09 | (0.12) | — (4) | (0.02) |
| Total income from operations | $ 0.17 | $ 0.06 | $ 0.27 | $ 0.19 |
| Less Distributions | | | | |
| From net investment income | $ (0.10) | $ (0.18) | $ (0.28) | $ (0.21) |
| From net realized gain | — | — | — | — (5) |
| Total distributions | $ (0.10) | $ (0.18) | $ (0.28) | $ (0.21) |
| Net asset value — End of period | $ 9.93 | $ 9.86 | $ 9.98 | $ 9.99 |
| Total Return(6) | 1.75% | 0.64% | 2.76% | 1.90% (7) |
| Ratios/Supplemental Data | | | | |
| Net assets, end of period (000’s omitted) | $83,675 | $34,944 | $50,650 | $17,570 |
| Ratios (as a percentage of average daily net assets):(8) | | | | |
| Total expenses | 0.46% | 0.47% | 0.50% | 0.48% (9) |
| Net expenses | 0.43% | 0.43% | 0.44% | 0.48% (9) |
| Net investment income | 0.82% | 1.85% | 2.72% | 2.07% (9) |
| Portfolio Turnover | 92% (10) | 128% (10) | 85% | 105% (11) |
| (1) | Per share data reflects a 1.5629-for-1 share split on June 15, 2018. |
| (2) | For the period from the commencement of operations, October 3, 2017, to September 30, 2018. |
| (3) | Computed using average shares outstanding. |
| (4) | Amount is less than $0.005. |
| (5) | Amount is less than $(0.005). |
| (6) | Returns are historical and are calculated by determining the percentage change in net asset value with all distributions reinvested and do not reflect the effect of sales charges, if any. |
| (7) | Not annualized. |
| (8) | Total expenses do not reflect amounts reimbursed and/or waived by the adviser and certain of its affiliates, if applicable. Net expenses are net of all reductions and represent the net expenses paid by the Fund. |
| (9) | Annualized. |
| (10) | Includes the effect of To Be Announced (TBA) transactions. |
| (11) | For the year ended September 30, 2018. |
20
See Notes to Financial Statements.
Calvert
Ultra-Short Duration Income Fund
September 30, 2021
Notes to Financial Statements
1 Significant Accounting Policies
Calvert Ultra-Short Duration Income Fund (the Fund) is a diversified series of The Calvert Fund (the Trust). The Trust is a Massachusetts business trust registered under the Investment Company Act of 1940, as amended (the 1940 Act), as an open-end management investment company. The investment objective of the Fund is to seek to maximize income, to the extent consistent with preservation of capital, through investment in short-term bonds and income-producing securities. The Fund invests primarily in investment grade, U.S. dollar denominated debt securities.
The Fund offers three classes of shares. Class A shares are sold at net asset value and are not subject to a sales charge. Class I and Class R6 shares are sold at net asset value, are not subject to a sales charge and are sold only to certain eligible investors. Each class represents a pro rata interest in the Fund, but votes separately on class-specific matters and is subject to different expenses.
The Fund applies the accounting and reporting guidance in the Financial Accounting Standards Board (FASB) Accounting Standards Codification Topic 946, Financial Services – Investment Companies (ASC 946). Subsequent events, if any, through the date that the financial statements were issued have been evaluated in the preparation of the financial statements.
A Investment Valuation— Net asset value per share is determined every business day as of the close of the regular session of the New York Stock Exchange (generally 4:00 p.m. Eastern time). The Fund uses independent pricing services approved by the Board of Trustees (the Board) to value its investments wherever possible. Investments for which market quotations are not available or deemed not reliable are fair valued in good faith under the direction of the Board.
U.S. generally accepted accounting principles (U.S. GAAP) establishes a disclosure hierarchy that categorizes the inputs to valuation techniques used to value assets and liabilities at measurement date. These inputs are summarized in the three broad levels listed below:
Level 1 - quoted prices in active markets for identical securities
Level 2 - other significant observable inputs (including quoted prices for similar securities, interest rates, prepayment speeds, credit risk, etc.)
Level 3 - significant unobservable inputs (including the Fund’s own assumptions in determining the fair value of investments)
The inputs or methodologies used for valuing securities are not necessarily an indication of the risk associated with investing in those securities.
Valuation techniques used to value the Fund’s investments by major category are as follows:
Debt Securities. Debt securities are generally valued based on valuations provided by third party pricing services, as derived from such services’ pricing models. Inputs to the models may include, but are not limited to, reported trades, executable bid and ask prices, broker/dealer quotations, prices or yields of securities with similar characteristics, interest rates, anticipated prepayments, benchmark curves or information pertaining to the issuer, as well as industry and economic events. Accordingly, debt securities are generally categorized as Level 2 in the hierarchy. Short-term debt securities with a remaining maturity at time of purchase of more than sixty days are valued based on valuations provided by a third party pricing service. Such securities are generally categorized as Level 2 in the hierarchy. Short-term debt securities of sufficient credit quality purchased with remaining maturities of sixty days or less for which a valuation from a third party pricing service is not readily available may be valued at amortized cost, which approximates fair value, and are categorized as Level 2 in the hierarchy.
Senior Floating-Rate Loans. Interests in senior floating-rate loans for which reliable market quotations are readily available are valued generally at the average mean of bid and ask quotations obtained from a third party pricing service, and are categorized as Level 2 in the hierarchy.
Affiliated Fund. The Fund may invest in Calvert Cash Reserves Fund, LLC (Cash Reserves Fund), an affiliated investment company managed by Calvert Research and Management (CRM). While Cash Reserves Fund is not a registered money market mutual fund, it conducts all of its investment activities in accordance with the requirements of Rule 2a-7 under the 1940 Act. Investments in Cash Reserves Fund are valued at the closing net asset value per unit on the valuation day and are categorized as Level 2 in the hierarchy. Cash Reserves Fund generally values its investment securities based on available market quotations provided by a third party pricing service.
Other Securities. Investments in registered investment companies (including money market funds) that do not trade on an exchange are valued at the net asset value per share on the valuation day and are categorized as Level 1 in the hierarchy.
Derivatives. Futures contracts are valued at unrealized appreciation (depreciation) based on the settlement price established each day by the board of trade or exchange on which they are traded and are categorized as Level 1 in the hierarchy.
Fair Valuation. If a market value cannot be determined for a security using the methodologies described above, or if, in the good faith opinion of the Fund's adviser, the market value does not constitute a readily available market quotation, or if a significant event has occurred that would materially affect the value of the security, the security will be fair valued as determined in good faith by or at the direction of the Board in a manner that most fairly reflects the security’s “fair value”, which is the amount that the Fund might reasonably expect to receive for the security upon its current sale in the ordinary course. Each such determination is based on a consideration of relevant factors, which are likely to vary from one pricing context to another. These factors may include, but are not limited to, the type of security, the existence of any contractual restrictions on the security’s disposition, the price and extent of public
Calvert
Ultra-Short Duration Income Fund
September 30, 2021
Notes to Financial Statements — continued
trading in similar securities of the issuer or of comparable companies or entities, quotations or relevant information obtained from broker/dealers or other market participants, information obtained from the issuer, analysts, and/or the appropriate stock exchange (for exchange-traded securities), an analysis of the company’s or entity’s financial statements, and an evaluation of the forces that influence the issuer and the market(s) in which the security is purchased and sold.
The values assigned to fair value investments are based on available information and do not necessarily represent amounts that might ultimately be realized. Further, due to the inherent uncertainty of valuations of such investments, the fair values may differ significantly from the values that would have been used had an active market existed, and the differences could be material.
The following table summarizes the market value of the Fund's holdings as of September 30, 2021, based on the inputs used to value them:
| Asset Description | Level 1 | Level 2 | Level 3 | Total |
| Asset-Backed Securities | $ — | $ 199,625,642 | $ — | $ 199,625,642 |
| Collateralized Mortgage Obligations | — | 51,847,850 | — | 51,847,850 |
| Commercial Mortgage-Backed Securities | — | 62,352,224 | — | 62,352,224 |
| Corporate Bonds | — | 477,392,625 | — | 477,392,625 |
| High Social Impact Investments | — | 982,830 | — | 982,830 |
| Senior Floating-Rate Loans | — | 19,402,032 | — | 19,402,032 |
| Sovereign Government Bonds | — | 36,120,756 | — | 36,120,756 |
| U.S. Treasury Obligations | — | 99,516,746 | — | 99,516,746 |
| Short-Term Investments: | | | | |
| Affiliated Fund | — | 66,868,535 | — | 66,868,535 |
| Commercial Paper | — | 19,997,572 | — | 19,997,572 |
| Securities Lending Collateral | 424,325 | — | — | 424,325 |
| Total Investments | $424,325 | $1,034,106,812 | $ — | $1,034,531,137 |
| Futures Contracts | $ 178,571 | $ — | $ — | $ 178,571 |
| Total | $602,896 | $1,034,106,812 | $ — | $1,034,709,708 |
B Investment Transactions and Income— Investment transactions for financial statement purposes are accounted for on trade date. Realized gains and losses are recorded on an identified cost basis and may include proceeds from litigation. Dividend income is recorded on the ex-dividend date for dividends received in cash and/or securities. Non-cash dividends are recorded at the fair value of the securities received. Distributions received that represent a return of capital are recorded as a reduction of cost of investments. Distributions received that represent a capital gain are recorded as a realized gain. Interest income, which includes amortization of premium and accretion of discount on debt securities, is accrued as earned. The Fund may earn certain fees in connection with its investments in senior floating-rate loans. These fees are in addition to interest payments earned and may include amendment fees, consent fees and prepayment fees, which are recorded to income as earned.
C Share Class Accounting— Realized and unrealized gains and losses are allocated daily to each class of shares based upon the relative net assets of each class to the total net assets of the Fund. Net investment income, other than class-specific expenses, is allocated daily to each class of shares based upon the ratio of the value of each class’s paid shares to the total value of all paid shares. Expenses arising in connection with a specific class are charged directly to that class. Sub-accounting, recordkeeping and similar administrative fees payable to financial intermediaries, which are a component of transfer agency fees and expenses on the Statement of Operations, are not allocated to Class R6 shares.
D Senior Floating-Rate Loans— The Fund may invest in direct debt instruments, which are interests in amounts owed to lenders or lending syndicates by corporate, governmental, or other borrowers. The Fund’s investment in loans may be in the form of participations in loans or assignments of all or a portion of loans from third parties. A loan is often administered by a bank or other financial institution (the lender) that acts as agent for all holders. The agent administers the terms of the loan, as specified in the loan agreement. The Fund may invest in multiple series or tranches of a loan, which may have varying terms and carry different associated risks. When the Fund purchases assignments from lenders, it acquires direct rights against the borrower of the loan. When investing in a loan participation, the Fund has the right to receive payments of principal, interest and any fees to which it is entitled only from the lender selling the loan agreement and only upon receipt of such payments by the lender from the borrower. The Fund generally has no right to enforce compliance by the borrower with the terms of the loan agreement. As a result, the Fund may be subject to the credit risk of both the borrower and the lender that is issuing the participation interest.
E Futures Contracts— The Fund may enter into futures contracts to buy or sell a financial instrument for a set price at a future date. Initial margin deposits of either cash or securities as required by the broker are made upon entering into the contract. While the contract is open, daily variation margin payments
Calvert
Ultra-Short Duration Income Fund
September 30, 2021
Notes to Financial Statements — continued
are made to or received from the broker reflecting the daily change in market value of the contract and are recorded for financial reporting purposes as unrealized gains or losses by the Fund. When a futures contract is closed, a realized gain or loss is recorded equal to the difference between the opening and closing value of the contract. The risks associated with entering into futures contracts may include the possible illiquidity of the secondary market which would limit the Fund’s ability to close out a futures contract prior to the settlement date, an imperfect correlation between the value of the contracts and the underlying financial instruments, or that the counterparty will fail to perform its obligations under the contracts’ terms. Futures contracts are designed by boards of trade, which are designated “contracts markets” by the Commodities Futures Trading Commission. Futures contracts trade on the contracts markets in a manner that is similar to the way a stock trades on a stock exchange, and the boards of trade, through their clearing corporations, guarantee the futures contracts against default. As a result, there is minimal counterparty credit risk to the Fund.
F Restricted Securities— The Fund may invest in securities that are subject to legal or contractual restrictions on resale. Generally, these securities may only be sold publicly upon registration under the Securities Act of 1933 or in transactions exempt from such registration. Information regarding restricted securities (excluding Rule 144A securities) is included at the end of the Schedule of Investments.
G Distributions to Shareholders— Distributions to shareholders are recorded by the Fund on ex-dividend date. The Fund declares income distributions daily to shareholders of record at the time of declaration and generally pays them monthly. The Fund makes distributions of net realized capital gains, if any, at least annually. Distributions are declared separately for each class of shares. Distributions are determined in accordance with income tax regulations, which may differ from U.S. GAAP; accordingly, periodic reclassifications are made within the Fund’s capital accounts to reflect income and gains available for distribution under income tax regulations.
H Estimates— The preparation of financial statements in conformity with U.S. GAAP requires management to make estimates and assumptions that affect the reported amounts of assets and liabilities and disclosure of contingent assets and liabilities at the date of the financial statements and the reported amounts of increases and decreases in net assets from operations during the reporting period. Actual results could differ from those estimates.
I Indemnifications— Under the Trust’s organizational document, its officers and Trustees may be indemnified against certain liabilities and expenses arising out of the performance of their duties to the Fund. Under Massachusetts law, if certain conditions prevail, shareholders of a Massachusetts business trust (such as the Trust) could be deemed to have personal liability for the obligations of the Trust. However, the Trust’s Declaration of Trust contains an express disclaimer of liability on the part of Fund shareholders and provides that the Trust shall assume, upon request by the shareholder, the defense on behalf of any Fund shareholders or former shareholders. Additionally, in the normal course of business, the Fund enters into agreements with service providers that may contain indemnification clauses. The Fund’s maximum exposure under these arrangements is unknown as this would involve future claims that may be made against the Fund that have not yet occurred.
J Federal Income Taxes— No provision for federal income or excise tax is required since the Fund intends to continue to qualify as a regulated investment company under the Internal Revenue Code and to distribute substantially all of its taxable earnings.
Management has analyzed the Fund's tax positions taken for all open federal income tax years and has concluded that no provision for federal income tax is required in the Fund's financial statements. A Fund's federal tax return is subject to examination by the Internal Revenue Service for a period of three years from the date of filing.
K When-Issued Securities and Delayed Delivery Transactions— The Fund may purchase securities on a delayed delivery, when-issued or forward commitment basis, including TBA (To Be Announced) securities. Payment and delivery may take place after the customary settlement period for that security. At the time the transaction is negotiated, the price of the security that will be delivered is fixed. The Fund maintains cash and/or security positions for these commitments such that sufficient liquid assets will be available to make payments upon settlement. Securities purchased on a delayed delivery, when-issued or forward commitment basis are marked-to-market daily and begin earning interest on settlement date. Such security purchases are subject to the risk that when delivered they will be worth less than the agreed upon payment price. Losses may also arise if the counterparty does not perform under the contract. A forward purchase commitment may be closed by entering into an offsetting commitment. The Fund will realize a gain or loss on investments based on the price established when the Fund entered into the commitment.
Calvert
Ultra-Short Duration Income Fund
September 30, 2021
Notes to Financial Statements — continued
2 Related Party Transactions
The investment advisory fee is earned by CRM as compensation for investment advisory services rendered to the Fund. On March 1, 2021, Morgan Stanley acquired Eaton Vance Corp. (the “Transaction”) and CRM became an indirect, wholly-owned subsidiary of Morgan Stanley. In connection with the Transaction, the Fund entered into a new investment advisory agreement (the “New Agreement") with CRM, which took effect on March 1, 2021. Pursuant to the New Agreement (and the Fund's investment advisory agreement with CRM in effect prior to March 1, 2021), the fee is computed at an annual rate as a percentage of the Fund’s average daily net assets as follows and is payable monthly:
| Average Daily Net Assets | Annual Fee
Rate |
| Up to and including $1 billion | 0.26% |
| Over $1 billion | 0.25% |
For the year ended September 30, 2021, the investment advisory fee amounted to $2,292,202 or 0.26% of the Fund’s average daily net assets. The Fund may invest its cash in Cash Reserves Fund. CRM does not currently receive a fee for advisory services provided to Cash Reserves Fund.
CRM has agreed to reimburse the Fund’s operating expenses to the extent that total annual operating expenses (relating to ordinary operating expenses only and excluding expenses such as brokerage commissions, acquired fund fees and expenses of unaffiliated funds, borrowing costs, taxes or litigation expenses) exceed 0.72%, 0.47% and 0.43% for Class A, Class I and Class R6, respectively, of such class's average daily net assets. The expense reimbursement agreement with CRM may be changed or terminated after January 31, 2022. For the year ended September 30, 2021, CRM waived or reimbursed expenses of $326,621.
The administrative fee is earned by CRM as compensation for administrative services rendered to the Fund. The fee is computed at an annual rate of 0.12% of the Fund’s average daily net assets attributable to Class A, Class I and Class R6 and is payable monthly. For the year ended September 30, 2021, CRM was paid administrative fees of $1,058,039.
The Fund has in effect a distribution plan for Class A shares (Class A Plan) pursuant to Rule 12b-1 under the 1940 Act. Pursuant to the Class A Plan, the Fund pays Eaton Vance Distributors, Inc. (EVD), an affiliate of CRM and the Fund’s principal underwriter, a distribution and service fee of 0.25% per annum of its average daily net assets attributable to Class A shares for distribution services and facilities provided to the Fund by EVD, as well as for personal services and/or the maintenance of shareholder accounts. Distribution and service fees paid or accrued for the year ended September 30, 2021 amounted to $777,130 for Class A shares.
Eaton Vance Management (EVM), an affiliate of CRM, provides sub-transfer agency and related services to the Fund pursuant to a Sub-Transfer Agency Support Services Agreement. For the year ended September 30, 2021, sub-transfer agency fees and expenses incurred to EVM amounted to $98,068 and are included in transfer agency fees and expenses on the Statement of Operations.
Each Trustee of the Fund who is not an employee of CRM or its affiliates receives an annual fee of $154,000, plus an annual Committee fee ranging from $8,500 to $16,500 depending on the Committee. The Board chair receives an additional $30,000 ($20,000 prior to January 1, 2021) annual fee and Committee chairs receive an additional $6,000 annual fee. Eligible Trustees may participate in a Deferred Compensation Plan (the Plan). Amounts deferred under the Plan are treated as though equal dollar amounts had been invested in shares of the Fund or other Calvert funds selected by the Trustees. The Fund purchases shares of the funds selected equal to the dollar amounts deferred under the Plan, resulting in an asset equal to the deferred compensation liability. Obligations of the Plan are paid solely from the Fund's assets. Trustees’ fees are allocated to each of the Calvert funds served. Salaries and fees of officers and Trustees of the Fund who are employees of CRM or its affiliates are paid by CRM. Prior to December 31, 2020, an Advisory Council aided the Board and CRM in advancing the cause of responsible investing through original scholarship and thought leadership. The Advisory Council consisted of CRM’s Chief Executive Officer and three additional members. For the year ended December 31, 2020, each member (other than CRM’s Chief Executive Officer) was compensated $20,000 for their service on the Advisory Council. Such compensation, and any other compensation and/or expenses incurred by the Advisory Council as may be approved by the Board, was borne by the Calvert funds. For the year ended September 30, 2021, the Fund’s allocated portion of the Advisory Council compensation and fees was $561, which is included in miscellaneous expense on the Statement of Operations.
3 Investment Activity
During the year ended September 30, 2021, the cost of purchases and proceeds from sales of investments, other than U.S. government and agency securities and short-term securities and including maturities, paydowns principal repayments on senior floating-rate loans, were $643,269,030 and $562,258,953, respectively. Purchases and sales of U.S. government and agency securities, including paydowns and TBA transactions, were $93,503,124 and $138,591,094, respectively.
Calvert
Ultra-Short Duration Income Fund
September 30, 2021
Notes to Financial Statements — continued
4 Distributions to Shareholders and Income Tax Information
The tax character of distributions declared for the years ended September 30, 2021 and September 30, 2020 was as follows:
| | Year Ended September 30, |
| | 2021 | 2020 |
| Ordinary income | $7,753,584 | $16,048,446 |
During the year ended September 30, 2021, accumulated loss was decreased by $44,725 and paid-in capital was decreased by $44,725 due to differences between book and tax accounting. These reclassifications had no effect on the net assets or net asset value per share of the Fund.
As of September 30, 2021, the components of distributable earnings (accumulated loss) on a tax basis were as follows:
| Deferred capital losses | $ (15,503,947) |
| Net unrealized appreciation | 2,415,889 |
| Distributions payable | (50,130) |
| Accumulated loss | $(13,138,188) |
At September 30, 2021, the Fund, for federal income tax purposes, had deferred capital losses of $15,503,947 which would reduce the Fund's taxable income arising from future net realized gains on investment transactions, if any, to the extent permitted by the Internal Revenue Code, and thus would reduce the amount of distributions to shareholders, which would otherwise be necessary to relieve the Fund of any liability for federal income or excise tax. The deferred capital losses are treated as arising on the first day of the Fund's next taxable year, can be carried forward for an unlimited period, and retain the same short-term or long-term character as when originally deferred. Of the deferred capital losses at September 30, 2021, $8,227,085 are short-term and $7,276,862 are long-term.
The cost and unrealized appreciation (depreciation) of investments, including open derivative contracts, of the Fund at September 30, 2021, as determined on a federal income tax basis, were as follows:
| Aggregate cost | $1,032,115,248 |
| Gross unrealized appreciation | $ 3,388,032 |
| Gross unrealized depreciation | (972,143) |
| Net unrealized appreciation | $ 2,415,889 |
5 Financial Instruments
A summary of futures contracts outstanding at September 30, 2021 is included in the Schedule of Investments. During the year ended September 30, 2021, the Fund used futures contracts to hedge interest rate risk and to manage duration.
At September 30, 2021, the fair value of open derivative instruments (not considered to be hedging instruments for accounting disclosure purposes) and whose primary underlying risk exposure is interest rate risk was as follows:
| Derivative | Statement of Assets and Liabilities Caption | Assets | Liabilities |
| Futures contracts | Accumulated loss | | $178,571 (1) | $ — |
| (1) | Only the current day's variation margin is reported within the Statement of Assets and Liabilities as Receivable or Payable for variation margin on open futures contracts, as applicable. |
Calvert
Ultra-Short Duration Income Fund
September 30, 2021
Notes to Financial Statements — continued
The effect of derivative instruments (not considered to be hedging instruments for accounting disclosure purposes) on the Statement of Operations and whose primary underlying risk exposure is interest rate risk for the year ended September 30, 2021 was as follows:
| | Statement of Operations Caption | |
| Derivative | Net realized gain (loss): Futures
contracts | Change in unrealized appreciation
(depreciation): Futures contracts |
| Futures contracts | $ 604,429 | $ 190,156 |
The average notional cost of futures contracts (short) outstanding during the year ended September 30, 2021 was approximately $44,479,000.
6 Securities Lending
To generate additional income, the Fund may lend its securities pursuant to a securities lending agency agreement with State Street Bank and Trust Company (SSBT), the securities lending agent. Security loans are subject to termination by the Fund at any time and, therefore, are not considered illiquid investments. The Fund requires that the loan be continuously collateralized by either cash or securities in an amount at least equal to the market value of the securities on loan. The market value of securities loaned is determined daily and any additional required collateral is delivered to the Fund on the next business day. Cash collateral is generally invested in a money market fund registered under the 1940 Act that is managed by an affiliate of SSBT. Any gain or loss in the market price of the loaned securities that might occur and any interest earned or dividends declared during the term of the loan would accrue to the account of the Fund. Income earned on the investment of collateral, net of broker rebates and other expenses incurred by the securities lending agent, is split between the Fund and the securities lending agent based on agreed upon contractual terms. Non-cash collateral, if any, is held by the lending agent on behalf of the Fund and cannot be sold or re-pledged by the Fund; accordingly, such collateral is not reflected in the Statement of Assets and Liabilities.
The risks associated with lending portfolio securities include, but are not limited to, possible delays in receiving additional collateral or in the recovery of the loaned securities, possible loss of rights to the collateral should the borrower fail financially, as well as risk of loss in the value of the collateral or the value of the investments made with the collateral. The securities lending agent shall indemnify the Fund in the case of default of any securities borrower.
At September 30, 2021, the total value of securities on loan, including accrued interest, was $1,505,786 and the total value of collateral received was $1,537,732, comprised of cash of $424,325 and U.S. government and/or agencies securities of $1,113,407.
The following table provides a breakdown of securities lending transactions accounted for as secured borrowings, the obligations by class of collateral pledged, and the remaining contractual maturity of those transactions as of September 30, 2021.
| | Remaining Contractual Maturity of the Transactions |
| | Overnight and
Continuous | <30 days | 30 to 90 days | >90 days | Total |
| Corporate Bonds | $424,325 | $ — | $ — | $ — | $424,325 |
The carrying amount of the liability for deposits for securities loaned at September 30, 2021 approximated its fair value. If measured at fair value, such liability would have been considered as Level 2 in the fair value hierarchy (see Note 1A) at September 30, 2021.
7 Line of Credit
The Fund participates with other portfolios and funds managed by EVM and its affiliates, including CRM, in an $800 million unsecured line of credit with a group of banks, which is in effect through October 26, 2021. Borrowings are made by the Fund solely for temporary purposes related to redemptions and other short-term cash needs. Interest is charged to the Fund based on its borrowings at an amount above either the Eurodollar rate or Federal Funds rate. In addition, a fee computed at an annual rate of 0.15% on the daily unused portion of the line of credit is allocated among the participating portfolios and funds at the end of each quarter. In connection with the renewal of the agreement in October 2020, an upfront fee and arrangement fee totaling $950,000 was incurred that was allocated to the participating portfolios and funds. Because the line of credit is not available exclusively to the Fund, it may be unable to borrow some or all of its requested amounts at any particular time.
The Fund had no borrowings outstanding pursuant to its line of credit at September 30, 2021. The Fund did not have any significant borrowings or allocated fees during the year ended September 30, 2021. Effective October 26, 2021, the Fund renewed its line of credit agreement, which expires October 25, 2022, at substantially the same terms.
Calvert
Ultra-Short Duration Income Fund
September 30, 2021
Notes to Financial Statements — continued
8 Affiliated Issuers and Funds
The Fund has invested a portion of its assets in notes (the Notes) issued by Calvert Impact Capital, Inc. (CIC) pursuant to exemptive relief granted by the U.S. Securities and Exchange Commission (the SEC). There are certain potential points of affiliation between the Fund and CIC. CRM has licensed use of the Calvert name to CIC and provides other types of support. CRM’s President and Chief Executive Officer (and the only director/trustee on the Fund Board that is an “interested person” of the Fund) serves on the CIC Board. In addition, another director/trustee on the Fund Board serves as a director emeritus on the CIC Board.
In addition to the Notes, the Fund invested in issuers that may be deemed to be affiliated with Morgan Stanley. At September 30, 2021, the value of the Fund's investment in the Notes and affiliated issuers and funds was $95,981,389, which represents 9.4% of the Fund's net assets. Transactions in the Notes and affiliated issuers and funds by the Fund for the year ended September 30, 2021 were as follows:
| Name | Value,
beginning
of period | Purchases | Sales
proceeds | Net
realized
gain
(loss) | Change in
unrealized
appreciation
(depreciation) | Value,
end of
period | Interest/
Dividend
income | Principal
amount/Units,
end of period |
| Commercial Mortgage-Backed Securities | | | | | | | | |
| Morgan Stanley Capital I Trust: | | | | | | | | |
| Series 2017-CLS, Class A, 0.784%, (1 mo. USD LIBOR + 0.70%), 11/15/34(1) | $ — | $ 5,118,648 | $ — | $ — | $ (5,843) | $ 10,068,189 | $ 40,996 | $ 10,065,000 |
| Series 2017-CLS, Class B, 0.934%, (1 mo. USD LIBOR + 0.85%), 11/15/34(1) | — | 1,666,041 | — | — | (7,796) | 11,694,229 | 64,579 | 11,690,000 |
| Series 2019-BPR, Class A, 1.484%, (1 mo. USD LIBOR + 1.40%), 5/15/36(1) | — | 108,780 | — | — | 122,692 | 6,367,606 | 56,269 | 6,420,000 |
| Corporate Bonds | | | | | | | | |
| Morgan Stanley, 0.71%, (SOFR + 0.70%), 1/20/23(1) | — | — | (10,043,145) | 31,145 | (47,455) | — | 3,860 | — |
| High Social Impact Investments | | | | | | | | |
| Calvert Impact Capital, Inc., Community Investment Notes, 1.50%, 12/15/23(2) | — | 1,000,000 | — | — | (17,170) | 982,830 | 11,917 | 1,000,000 |
| Short-Term Investments | | | | | | |
| Calvert Cash Reserves Fund, LLC | 17,839,076 | 750,752,128 | (701,726,836) | (2,324) | 6,491 | 66,868,535 | 35,744 | 66,861,849 |
| Totals | | | | $28,821 | $ 50,919 | $95,981,389 | $213,365 | |
| (1) | May be deemed to be an affiliated issuer as of March 1, 2021 (see Note 2). |
| (2) | Restricted security. |
9 Capital Shares
The Fund’s Declaration of Trust permits the Trustees to issue an unlimited number of full and fractional shares of beneficial interest (without par value). Such shares may be issued in a number of different series (such as the Fund) and classes.
Transactions in capital shares for the years ended September 30, 2021 and September 30, 2020 were as follows:
| | Year Ended
September 30, 2021 | | Year Ended
September 30, 2020 |
| | Shares | Amount | | Shares | Amount |
| Class A | | | | | |
| Shares sold | 12,160,121 | $ 120,763,022 | | 10,714,225 | $ 106,180,895 |
| Reinvestment of distributions | 214,067 | 2,125,323 | | 460,481 | 4,544,741 |
| Shares redeemed | (9,094,134) | (90,284,117) | | (12,335,555) | (121,080,248) |
| Net increase (decrease) | 3,280,054 | $ 32,604,228 | | (1,160,849) | $ (10,354,612) |
Calvert
Ultra-Short Duration Income Fund
September 30, 2021
Notes to Financial Statements — continued
| | Year Ended
September 30, 2021 | | Year Ended
September 30, 2020 |
| | Shares | Amount | | Shares | Amount |
| Class I | | | | | |
| Shares sold | 43,389,045 | $ 431,093,359 | | 32,649,370 | $ 322,908,702 |
| Reinvestment of distributions | 417,763 | 4,148,423 | | 865,184 | 8,541,722 |
| Shares redeemed | (32,609,188) | (323,834,172) | | (41,457,091) | (405,044,440) |
| Net increase (decrease) | 11,197,620 | $ 111,407,610 | | (7,942,537) | $ (73,594,016) |
| Class R6 | | | | | |
| Shares sold | 5,412,732 | $ 53,744,357 | | 7,606,337 | $ 75,092,593 |
| Reinvestment of distributions | 45,787 | 454,384 | | 94,994 | 937,128 |
| Shares redeemed | (577,640) | (5,726,575) | | (9,232,586) | (90,027,708) |
| Net increase (decrease) | 4,880,879 | $ 48,472,166 | | (1,531,255) | $ (13,997,987) |
10 Risks and Uncertainties
Pandemic Risk
An outbreak of respiratory disease caused by a novel coronavirus was first detected in China in late 2019 and subsequently spread internationally. This coronavirus has resulted in closing borders, enhanced health screenings, changes to healthcare service preparation and delivery, quarantines, cancellations, disruptions to supply chains and customer activity, as well as general concern and uncertainty. Health crises caused by outbreaks, such as the coronavirus outbreak, may exacerbate other pre-existing political, social and economic risks and disrupt normal market conditions and operations. The impact of this outbreak has negatively affected the worldwide economy, the economies of individual countries, individual companies, and the market in general, and may continue to do so in significant and unforeseen ways, as may other epidemics and pandemics that may arise in the future. Any such impact could adversely affect the Fund's performance, or the performance of the securities in which the Fund invests.
11 Change in Independent Registered Public Accounting Firm
On July 30, 2021, KPMG LLP (“KPMG”) informed the Audit Committee and Board of the Trust that it was resigning as the independent registered public accounting firm to the Trust, as upon Morgan Stanley’s acquisition of Eaton Vance Corp., the parent company of CRM (the investment adviser to each series of the Trust), KPMG would no longer be independent of the Trust. The Audit Committee of the Board and the Board approved the selection of Deloitte & Touche LLP (“Deloitte”) as the independent registered public accounting firm for the funds that are series of the Trust (the “Funds”) for the fiscal year ending September 30, 2021 to be effective upon KPMG’s resignation and Deloitte’s acceptance of the engagement which became effective July 30, 2021.
KPMG’s reports on the financial statements for the Funds for the fiscal periods ended September 30, 2019 and September 30, 2020 contained no adverse opinion or disclaimer of opinion nor were they qualified or modified as to uncertainty, audit scope or accounting principles. During the fiscal periods ended September 30, 2019 and September 30, 2020, and during the subsequent interim period through July 30, 2021: (i) there were no disagreements with KPMG on any matter of accounting principles or practices, financial statement disclosure or auditing scope or procedure, which disagreements, if not resolved to the satisfaction of KPMG, would have caused KPMG to make reference to the subject matter of the disagreements in connection with its reports on the Funds’ financial statements for such periods; and (ii) there were no “reportable events” of the kind described in Item 304(a)(1)(v) of Regulation S-K under the Securities Exchange Act of 1934, as amended.
During the fiscal periods ended September 30, 2019 and September 30, 2020, and during the subsequent interim period through July 30, 2021: neither the Funds, nor anyone on their behalf, consulted with Deloitte on items which: (i) concerned the application of accounting principles to a specified transaction, either completed or proposed, or the type of audit opinion that might be rendered on the Funds’ financial statements; or (ii) concerned the subject of a disagreement (as defined in paragraph (a)(1)(iv) of Item 304 of Regulation S-K) or reportable events (as described in paragraph (a)(1)(v) of Item 304).
Calvert
Ultra-Short Duration Income Fund
September 30, 2021
Report of Independent Registered Public Accounting Firm
To the Board of Trustees of The Calvert Fund and Shareholders of Calvert Ultra-Short Duration Income Fund:
Opinion on the Financial Statements and Financial Highlights
We have audited the accompanying statement of assets and liabilities of Calvert Ultra-Short Duration Income Fund (the "Fund") (one of the funds constituting The Calvert Fund), including the schedule of investments, as of September 30, 2021, the related statements of operations, changes in net assets and the financial highlights for the year then ended, and the related notes. In our opinion, the financial statements and financial highlights present fairly, in all material respects, the financial position of the Fund as of September 30, 2021, and the results of its operations and changes in its net assets for the year then ended, and the financial highlights for the year then ended in conformity with accounting principles generally accepted in the United States of America. The statement of changes in net assets for the year ended September 30, 2020, and the financial highlights for the years or periods ended September 30, 2020, 2019, 2018, and 2017 were audited by other auditors whose report, dated November 20, 2020, expressed an unqualified opinion on that financial statement and those financial highlights.
Basis for Opinion
These financial statements and financial highlights are the responsibility of the Fund's management. Our responsibility is to express an opinion on the Fund's financial statements and financial highlights based on our audit. We are a public accounting firm registered with the Public Company Accounting Oversight Board (United States) (PCAOB) and are required to be independent with respect to the Fund in accordance with the U.S. federal securities laws and the applicable rules and regulations of the Securities and Exchange Commission and the PCAOB.
We conducted our audit in accordance with the standards of the PCAOB. Those standards require that we plan and perform the audit to obtain reasonable assurance about whether the financial statements and financial highlights are free of material misstatement, whether due to error or fraud. The Fund is not required to have, nor were we engaged to perform, an audit of its internal control over financial reporting. As part of our audit we are required to obtain an understanding of internal control over financial reporting but not for the purpose of expressing an opinion on the effectiveness of the Fund’s internal control over financial reporting. Accordingly, we express no such opinion.
Our audit included performing procedures to assess the risks of material misstatement of the financial statements and financial highlights, whether due to error or fraud, and performing procedures that respond to those risks. Such procedures included examining, on a test basis, evidence regarding the amounts and disclosures in the financial statements and financial highlights. Our audit also included evaluating the accounting principles used and significant estimates made by management, as well as evaluating the overall presentation of the financial statements and financial highlights. Our procedures included confirmation of securities owned as of September 30, 2021, by correspondence with the custodian, brokers and selling or agent banks; when replies were not received from brokers and selling or agent banks, we performed other auditing procedures. We believe that our audit provides a reasonable basis for our opinion.
/s/ Deloitte & Touche LLP
Boston, Massachusetts
November 22, 2021
We have served as the auditor of one or more Calvert investment companies since 2021.
Calvert
Ultra-Short Duration Income Fund
September 30, 2021
Federal Tax Information (Unaudited)
The Form 1099-DIV you receive in February 2022 will show the tax status of all distributions paid to your account in calendar year 2021. Shareholders are advised to consult their own tax adviser with respect to the tax consequences of their investment in the Fund. As required by the Internal Revenue Code and/or regulations, shareholders must be notified regarding the status of 163(j) interest dividends.
163(j) Interest Dividends. For the fiscal year ended September 30, 2021, the Fund designates 100.00% of distributions from net investment income as a 163(j) interest dividend.
Calvert
Ultra-Short Duration Income Fund
September 30, 2021
Liquidity Risk Management Program
The Fund has implemented a written liquidity risk management program (Program) and related procedures to manage its liquidity in accordance with Rule 22e-4 under the Investment Company Act of 1940, as amended (Liquidity Rule). The Liquidity Rule defines “liquidity risk” as the risk that a fund could not meet requests to redeem shares issued by the fund without significant dilution of the remaining investors’ interests in the fund. The Fund’s Board of Trustees/Directors has designated the investment adviser to serve as the administrator of the Program and the related procedures. The administrator has established a Liquidity Risk Management Oversight Committee (Committee) to perform the functions necessary to administer the Program. As part of the Program, the administrator is responsible for identifying illiquid investments and categorizing the relative liquidity of the Fund’s investments in accordance with the Liquidity Rule. Under the Program, the administrator assesses, manages, and periodically reviews the Fund’s liquidity risk, and is responsible for making certain reports to the Fund’s Board of Trustees/Directors and the Securities and Exchange Commission (SEC) regarding the liquidity of the Fund’s investments, and to notify the Board of Trustees/Directors and the SEC of certain liquidity events specified in the Liquidity Rule. The liquidity of the Fund’s portfolio investments is determined based on a number of factors including, but not limited to, relevant market, trading and investment-specific considerations under the Program.
At a meeting of the Fund’s Board of Trustees/Directors on June 16, 2021, the Committee provided a written report to the Fund’s Board of Trustees/ Directors pertaining to the operation, adequacy, and effectiveness of implementation of the Program, as well as the operation of the highly liquid investment minimum (if applicable) for the period January 1, 2020 through December 31, 2020 (Review Period). The Program operated effectively during the Review Period, supporting the administrator’s ability to assess, manage and monitor Fund liquidity risk, including during periods of market volatility and net redemptions. During the Review Period, the Fund met redemption requests on a timely basis.
There can be no assurance that the Program will achieve its objectives in the future. Please refer to the Fund’s prospectus for more information regarding the Fund’s exposure to liquidity risk and other principal risks to which an investment in the Fund may be subject.
Calvert
Ultra-Short Duration Income Fund
September 30, 2021
Management and Organization
Fund Management. The Trustees of The Calvert Fund (the Trust) are responsible for the overall management and supervision of the Trust’s affairs. The Trustees and officers of the Trust are listed below. Except as indicated, each individual has held the office shown or other offices in the same company for the last five years. Each Board member holds office until his or her successor is elected and qualified, or until his or her earlier death, resignation, retirement, removal or disqualification. Under the terms of the Fund's current Board member retirement policy, an Independent Board member must retire at the end of the calendar year in which he or she turns 75. However, if such retirement would cause the Fund to be out of compliance with Section 16 of the 1940 Act or any other regulations or guidance of the SEC, then such retirement and resignation will not become effective until such time as action has been taken for the Fund to be in compliance upon a Board member's retirement. The “Independent Trustees” consist of those Trustees who are not “interested persons” of the Trust, as that term is defined under the 1940 Act. The business address of each Trustee and officer, with the exception of Ms. Walsh and Mr. Kirchner, is 1825 Connecticut Avenue NW, Suite 400, Washington, DC 20009. As used below, “CRM” refers to Calvert Research and Management. Each Trustee oversees 39 funds in the Calvert fund complex. Each officer serves as an officer of certain other Calvert funds.
| Name and Year of Birth | Trust
Position(s) | Position
Start Date | Principal Occupation(s) and Other Directorships
During Past Five Years and Other Relevant Experience |
| Interested Trustee |
John H. Streur(1)
1960 | Trustee and
President | 2015 | President and Chief Executive Officer of Calvert Research and
Management (since December 31, 2016). President and Chief Executive
Officer of Calvert Investments, Inc. (January 2015 - December 2016);
Chief Executive Officer of Calvert Investment Distributors, Inc. (August
2015 - December 2016); Chief Compliance Officer of Calvert Investment
Management, Inc. (August 2015 - April 2016); President and Director,
Portfolio 21 Investments, Inc. (through October 2014); President,
Chief Executive Officer and Director, Managers Investment Group LLC
(through January 2012); President and Director, The Managers Funds
and Managers AMG Funds (through January 2012).
Other Directorships in the Last Five Years. Portfolio 21 Investments,
Inc. (asset management) (through October 2014); Managers Investment
Group LLC (asset management) (through January 2012); The Managers
Funds (asset management) (through January 2012); Managers AMG Funds
(asset management) (through January 2012); Calvert Impact Capital, Inc. |
| Independent Trustees |
Richard L. Baird, Jr.
1948 | Trustee | 1982 | Regional Disaster Recovery Lead, American Red Cross of Greater
Pennsylvania (since 2017). Volunteer, American Red Cross (since 2015).
Former President and CEO of Adagio Health Inc. (retired in 2014) in
Pittsburgh, PA.
Other Directorships in the Last Five Years. None. |
Alice Gresham Bullock
1950 | Chair and
Trustee | 2016 | Professor Emerita at Howard University School of Law. Dean Emerita of
Howard University School of Law and Deputy Director of the Association
of American Law Schools (1992-1994).
Other Directorships in the Last Five Years. None. |
Cari M. Dominguez
1949 | Trustee | 2016 | Former Chair of the U.S. Equal Employment Opportunity Commission.
Other Directorships in the Last Five Years. Manpower, Inc. (employment
agency); Triple S Management Corporation (managed care); National
Association of Corporate Directors. |
John G. Guffey, Jr.
1948 | Trustee | 1982 | President of Aurora Press Inc., a privately held publisher of trade
paperbacks (since January 1997).
Other Directorships in the Last Five Years. Calvert Impact Capital, Inc.
(through December 31, 2018); Calvert Ventures, LLC. |
Miles D. Harper, III
1962 | Trustee | 2016 | Partner, Carr Riggs & Ingram (public accounting firm) since October 2014.
Partner, Gainer Donnelly & Desroches (public accounting firm) (now Carr
Riggs & Ingram) (November 1999 - September 2014).
Other Directorships in the Last Five Years. Bridgeway Funds (9) (asset
management). |
Joy V. Jones
1950 | Trustee | 2016 | Attorney.
Other Directorships in the Last Five Years. Conduit Street Restaurants
SUD 2 Limited; Palm Management Restaurant Corporation. |
Calvert
Ultra-Short Duration Income Fund
September 30, 2021
Management and Organization — continued
| Name and Year of Birth | Trust
Position(s) | Position
Start Date | Principal Occupation(s) and Other Directorships
During Past Five Years and Other Relevant Experience |
| Independent Trustees (continued) |
Anthony A. Williams
1951 | Trustee | 2010 | CEO and Executive Director of the Federal City Council (July 2012 to
present); Senior Adviser and Independent Consultant for King and
Spalding LLP (September 2015 to present); Executive Director of Global
Government Practice at the Corporate Executive Board (January 2010 to
January 2012).
Other Directorships in the Last Five Years. Freddie Mac; Evoq
Properties/Meruelo Maddux Properties, Inc. (real estate management);
Weston Solutions, Inc. (environmental services); Bipartisan Policy Center’s
Debt Reduction Task Force; Chesapeake Bay Foundation; Catholic
University of America; Urban Institute (research organization); The Howard Hughes Corporation (real estate development). |
| Name and Year of Birth | Trust
Position(s) | Position
Start Date | Principal Occupation(s)
During Past Five Years |
| Principal Officers who are not Trustees |
Hope L. Brown
1973 | Chief
Compliance
Officer | 2014 | Chief Compliance Officer of 39 registered investment companies advised
by CRM (since 2014). Vice President and Chief Compliance Officer,
Wilmington Funds (2012-2014). |
Deidre E. Walsh(2)
1971 | Secretary,
Vice President
and Chief
Legal Officer | 2021 | Vice President of CRM and officer of 39 registered investment companies
advised by CRM (since 2021). Also Vice President of Eaton Vance and
certain of its affiliates and officer of 138 registered investment companies
advised or administered by Eaton Vance. |
James F. Kirchner(2)
1967 | Treasurer | 2016 | Vice President of CRM and officer of 39 registered investment companies
advised by CRM (since 2016). Also Vice President of Eaton Vance and
certain of its affiliates and officer of 138 registered investment companies
advised or administered by Eaton Vance. |
| (1) Mr. Streur is an interested person of the Fund because of his positions with the Fund’s adviser and certain affiliates. |
| (2) The business address for Ms. Walsh and Mr. Kirchner is Two International Place, Boston, MA 02110. |
The SAI for the Fund includes additional information about the Trustees and officers of the Fund and can be obtained without charge on Calvert’s website at www.calvert.com or by calling 1-800-368-2745.
| FACTS | WHAT DOES EATON VANCE DO WITH YOUR
PERSONAL INFORMATION? |
| Why? | Financial companies choose how they share your personal information. Federal law gives consumers the right to limit some but not all sharing. Federal law also requires us to tell you how we collect, share, and protect your personal information. Please read this notice carefully to understand what we do. |
| |
| What? | The types of personal information we collect and share depend on the product or service you have with us. This information can include:■ Social Security number and income
■
investment experience and risk tolerance
■
checking account number and wire transfer instructions |
| |
| How? | All financial companies need to share customers’ personal information to run their everyday business. In the section below, we list the reasons financial companies can share their customers’ personal information; the reasons Eaton Vance chooses to share; and whether you can limit this sharing. |
Reasons we can share your
personal information | Does Eaton Vance
share? | Can you limit
this sharing? |
| For our everyday business purposes — such as to process your transactions, maintain your account(s), respond to court orders and legal investigations, or report to credit bureaus | Yes | No |
| For our marketing purposes — to offer our products and services to you | Yes | No |
| For joint marketing with other financial companies | No | We don’t share |
| For our investment management affiliates’ everyday business purposes — information about your transactions, experiences, and creditworthiness | Yes | Yes |
| For our affiliates’ everyday business purposes — information about your transactions and experiences | Yes | No |
| For our affiliates’ everyday business purposes — information about your creditworthiness | No | We don’t share |
| For our investment management affiliates to market to you | Yes | Yes |
| For our affiliates to market to you | No | We don’t share |
| For nonaffiliates to market to you | No | We don’t share |
To limit our
sharing | Call toll-free 1-800-368-2745 or email: CRMPrivacy@calvert.comPlease note:If you are a new customer, we can begin sharing your information 30 days from the date we sent this notice. When you are no longer our customer, we continue to share your information as described in this notice. However, you can contact us at any time to limit our sharing. |
| Questions? | Call toll-free 1-800-368-2745 or email: CRMPrivacy@calvert.com |
| Privacy Notice — continued | April 2021 |
| Who we are |
| Who is providing this notice? | Eaton Vance Management, Eaton Vance Distributors, Inc., Eaton Vance Trust Company, Eaton Vance Management (International) Limited, Eaton Vance Advisers International Ltd., Eaton Vance Global Advisors Limited, Eaton Vance Management’s Real Estate Investment Group, Boston Management and Research, Calvert Research and Management, Eaton Vance and Calvert Fund Families and our investment advisory affiliates (“Eaton Vance”) (see Investment Management Affiliates definition below) |
| What we do |
How does Eaton Vance
protect my personal
information? | To protect your personal information from unauthorized access and use, we use security measures that comply with federal law. These measures include computer safeguards and secured files and buildings. We have policies governing the proper handling of customer information by personnel and requiring third parties that provide support to adhere to appropriate security standards with respect to such information. |
How does Eaton Vance
collect my personal
information? | We collect your personal information, for example, when you■ open an account or make deposits or withdrawals from your account
■
buy securities from us or make a wire transfer
■
give us your contact informationWe also collect your personal information from others, such as credit bureaus, affiliates, or other companies. |
| Why can’t I limit all sharing? | Federal law gives you the right to limit only■ sharing for affiliates’ everyday business purposes — information about your creditworthiness
■
affiliates from using your information to market to you
■
sharing for nonaffiliates to market to youState laws and individual companies may give you additional rights to limit sharing. See below for more on your rights under state law. |
| Definitions |
Investment Management
Affiliates | Eaton Vance Investment Management Affiliates include registered investment advisers, registered broker- dealers, and registered and unregistered funds. Investment Management Affiliates does not include entities associated with Morgan Stanley Wealth Management, such as Morgan Stanley Smith Barney LLC and Morgan Stanley & Co. |
| Affiliates | Companies related by common ownership or control. They can be financial and nonfinancial companies.■ Our affiliates include companies with a Morgan Stanley name and financial companies such as Morgan Stanley Smith Barney LLC and Morgan Stanley & Co. |
| Nonaffiliates | Companies not related by common ownership or control. They can be financial and nonfinancial companies.■ Eaton Vance does not share with nonaffiliates so they can market to you. |
| Joint marketing | A formal agreement between nonaffiliated financial companies that together market financial products or services to you.■ Eaton Vance doesn’t jointly market. |
| Other important information |
| Vermont: Except as permitted by law, we will not share personal information we collect about Vermont residents with Nonaffiliates unless you provide us with your written consent to share such information.California: Except as permitted by law, we will not share personal information we collect about California residents with Nonaffiliates and we will limit sharing such personal information with our Affiliates to comply with California privacy laws that apply to us. |
Delivery of Shareholder Documents. The Securities and Exchange Commission (SEC) permits funds to deliver only one copy of shareholder documents, including prospectuses, proxy statements and shareholder reports, to fund investors with multiple accounts at the same residential or post office box address. This practice is often called “householding” and it helps eliminate duplicate mailings to shareholders. Calvert funds, or your financial intermediary, may household the mailing of your documents indefinitely unless you instruct Calvert funds, or your financial intermediary, otherwise. If you would prefer that your Calvert fund documents not be householded, please contact Calvert funds at 1-800-368-2745, or contact your financial intermediary. Your instructions that householding not apply to delivery of your Calvert fund documents will typically be effective within 30 days of receipt by Calvert funds or your financial intermediary. Separate statements will be generated for each separate account and will be householded as described above.
Portfolio Holdings. Each Calvert fund files a schedule of portfolio holdings on Part F to Form N-PORT with the SEC. Certain information filed on Form N-PORT may be viewed on the Calvert website at www.calvert.com, by calling Calvert at 1-800-368-2745 or in the EDGAR database on the SEC’s website at www.sec.gov.
Proxy Voting. The Proxy Voting Guidelines that each Calvert fund uses to determine how to vote proxies relating to portfolio securities is provided as an Appendix to the fund’s Statement of Additional Information. The Statement of Additional Information can be obtained free of charge by calling the Calvert funds at 1-800-368-2745, by visiting the Calvert funds’ website at www.calvert.com or visiting the SEC’s website at www.sec.gov. Information regarding how a Calvert fund voted proxies relating to portfolio securities during the most recent 12-month period ended June 30 is available by calling Calvert funds, by visiting the Calvert funds’ website at www.calvert.com or by visiting the SEC’s website at www.sec.gov.
Investment Adviser and Administrator
Calvert Research and Management
1825 Connecticut Avenue NW, Suite 400
Washington, DC 20009
Principal Underwriter*
Eaton Vance Distributors, Inc.
Two International Place
Boston, MA 02110
(617) 482-8260
Custodian
State Street Bank and Trust Company
State Street Financial Center, One Lincoln Street
Boston, MA 02111
Transfer Agent
DST Asset Manager Solutions, Inc.
2000 Crown Colony Drive
Quincy, MA 02169
Independent Registered Public Accounting Firm
Deloitte & Touche LLP
200 Berkeley Street
Boston, MA 02116-5022
Fund Offices
1825 Connecticut Avenue NW, Suite 400
Washington, DC 20009
* FINRA BrokerCheck. Investors may check the background of their Investment Professional by contacting the Financial Industry Regulatory Authority (FINRA). FINRA BrokerCheck is a free tool to help investors check the professional background of current and former FINRA-registered securities firms and brokers. FINRA BrokerCheck is available by calling 1-800-289-9999 and at www.FINRA.org. The FINRA BrokerCheck brochure describing this program is available to investors at www.FINRA.org.
Printed on recycled paper.
The registrant has adopted a code of ethics applicable to its Principal Executive Officer, Principal Financial Officer and Principal Accounting Officer. The registrant undertakes to provide a copy of such code of ethics to any person upon request, without charge, by calling 1-800-368-2745. The registrant has not amended the code of ethics as described in Form N-CSR during the period covered by this report. The registrant has not granted any waiver, including an implicit waiver, from a provision of the code of ethics as described in Form N-CSR during the period covered by this report.
| Item 3. | Audit Committee Financial Expert |
The registrant’s Board of Trustees has determined that Miles D. Harper III, an “independent” Trustee serving on the registrant’s audit committee, is an “audit committee financial expert,” as defined in Item 3 of Form N-CSR. Under applicable securities laws, a person who is determined to be an audit committee financial expert will not be deemed an “expert” for any purpose, including without limitation for the purposes of Section 11 of the
Securities Act of 1933, as a result of being designated or identified as an audit committee financial expert. The designation or identification of a person as an audit committee financial expert does not impose on such person any duties, obligations, or liabilities that are greater than the duties, obligations, and liabilities imposed on such person as a member of the audit committee and Board of Trustees in the absence of such designation or identification.
| Item 4. | Principal Accountant Fees and Services |
(a) –(d)
The following table presents the aggregate fees billed to the registrant for the registrant’s fiscal years ended September 30, 2020 and September 30, 2021 by its principal accountant for professional services rendered for the audit of the registrant’s annual financial statements and fees billed for other services rendered by its principal accountant during such periods.
| | | | | | | | | | | | | | | | |
Fiscal Years Ended | | 9/30/20 | | | %* | | | 9/30/21 | | | %* | |
Audit Fees | | $ | 137,431 | | | | 0 | % | | $ | 135,000 | | | | 0 | % |
Audit-Related Fees(1) | | $ | 0 | | | | 0 | % | | $ | 0 | | | | 0 | % |
Tax Fees(2) | | $ | 24,750 | | | | 0 | % | | $ | 24,750 | | | | 0 | % |
All Other Fees(3) | | $ | 0 | | | | 0 | % | | $ | 0 | | | | 0 | % |
| | | | | | | | | | | | | | | | |
Total | | $ | 162,181 | | | | 0 | % | | $ | 159,750 | | | | 0 | % |
| | | | | | | | | | | | | | | | |
| * | Percentage of fees approved by the Audit Committee pursuant to (c)(7)(i)(C) of Rule 2-01 of Reg. S-X (statutory de minimis waiver of Committee’s requirement to pre-approve). |
| (1) | Audit-related fees consist of the aggregate fees billed for assurance and related services that are reasonably related to the performance of the audit of the registrant’s financial statements and are not reported under the category of audit fees. |
| (2) | Tax fees consist of the aggregate fees billed for professional services rendered by the principal accountant relating to tax compliance, tax advice, and tax planning and specifically include fees for tax return preparation and other related tax compliance/planning matters. |
| (3) | All other fees consist of the aggregate fees billed for products and services provided by the principal accountant other than audit, audit-related, and tax services. |
(e) The Audit Committee is required to pre-approve all audit and non-audit services provided to the registrant by the auditors, and to the registrant’s investment adviser, and any entity controlling, controlled by, or under common control with the adviser that provides ongoing services to the registrant. In determining whether to pre-approve non-audit services, the Audit Committee considers whether the services are consistent with maintaining the independence of the auditors. The Committee may delegate its authority to pre-approve certain matters to one or more of its members. In this regard, the Committee has delegated authority jointly to the Audit Committee Chair together with another Committee member with respect to non-audit services not exceeding $25,000 in each instance. In addition, the Committee has pre-approved the retention of the auditors to provide tax-related services related to the tax treatment and tax accounting of newly acquired securities, upon request by the investment adviser in each instance.
(f) Not applicable.
(g) Aggregate non-audit fees billed by the registrant’s accountant for services rendered to the registrant, and rendered to the registrant’s investment adviser, and any entity controlling, controlled by, or under common
control with the adviser that provides ongoing services to the registrant for each of the last two fiscal years of the registrant:
| | | | | | | | | | | | | | |
| Fiscal Year ended 9/30/20 | | | Fiscal Year ended 9/30/21 | |
| $ | | | %* | | | $ | | | %* | |
| $ | 24,750 | | | | 0 | % | | $ | 24,750 | | | | 0 | % |
| * | Percentage of fees approved by the Audit Committee pursuant to (c)(7)(i)(C) of Rule 2-01 of Reg. S-X (statutory de minimis waiver of Committee’s requirement to pre-approve). |
(h) The registrant’s audit committee has considered whether the provision by the registrant’s principal accountant of non-audit services to the registrant’s investment adviser and any entity controlling, controlled by, or under common control with the adviser that provides ongoing services to the registrant that were not pre-approved pursuant to Rule 2-01(c)(7)(ii) of Regulation S-X is compatible with maintaining the principal accountant’s independence.
| Item 5. | Audit Committee of Listed Registrants |
Not applicable.
| Item 6. | Schedule of Investments |
Please see schedule of investments contained in the Report to Stockholders included under Item 1 of this Form N-CSR.
| Item 7. | Disclosure of Proxy Voting Policies and Procedures for Closed-End Management Investment Companies |
Not applicable.
| Item 8. | Portfolio Managers of Closed-End Management Investment Companies |
Not applicable.
| Item 9. | Purchases of Equity Securities by Closed-End Management Investment Company and Affiliated Purchasers |
Not applicable.
| Item 10. | Submission of Matters to a Vote of Security Holders |
No material changes.
| Item 11. | Controls and Procedures |
(a) The registrant’s principal executive and principal financial officers have concluded that the registrant’s disclosure controls and procedures (as defined in Rule 30a-3(c) under the Investment Company Act of 1940 Act, as amended (the “1940 Act”) are effective, based on the evaluation of these controls and procedures required by Rule 30a-3(b) under the 1940 Act and Rules 13a-15(b) or 15d-15(b) under the Securities Exchange Act of 1934 (“Exchange Act”), as of a date within 90 days of the filing date of this report.
(b) There was no change in the registrant’s internal control over financial reporting (as defined in Rule 30a-3(d) under the 1940 Act) that occurred during the period covered by this report that has materially affected, or is reasonably likely to materially affect, the registrant’s internal control over financial reporting.
| Item 12. | Disclosure of Securities Lending Activities for Closed-End Management Investment Companies |
Not applicable.
Signatures
Pursuant to the requirements of the Securities Exchange Act of 1934 and the Investment Company Act of 1940, the registrant has duly caused this report to be signed on its behalf by the undersigned, thereunto duly authorized.
| | |
| THE CALVERT FUND |
| |
| By: | | /s/ John H. Streur |
| | John H. Streur |
| | President |
| |
| Date: | | November 22, 2021 |
Pursuant to the requirements of the Securities Exchange Act of 1934 and the Investment Company Act of 1940, this report has been signed below by the following persons on behalf of the registrant and in the capacities and on the dates indicated.
| | |
| By: | | /s/ James F. Kirchner |
| | James F. Kirchner |
| | Treasurer |
| |
| Date: | | November 22, 2021 |
| |
| By: | | /s/ John H. Streur |
| | John H. Streur |
| | President |
| |
| Date: | | November 22, 2021 |